UNITED STATES
SECURITIES AND EXCHANGE COMMISSION
Washington, D.C. 20549
FORM N-CSR
CERTIFIED SHAREHOLDER REPORT OF
REGISTERED MANAGEMENT INVESTMENT COMPANIES
Investment Company Act file number 811-3732
MFS VARIABLE INSURANCE TRUST II
(Exact name of registrant as specified in charter)
111 Huntington Avenue, Boston, Massachusetts 02199
(Address of principal executive offices) (Zip code)
Susan S. Newton
Massachusetts Financial Services Company
111 Huntington Avenue
Boston, Massachusetts 02199
(Name and address of agents for service)
Registrant’s telephone number, including area code: (617) 954-5000
Date of fiscal year end: December 31
Date of reporting period: June 30, 2013
| ITEM 1. | REPORTS TO STOCKHOLDERS. |
SEMIANNUAL REPORT
June 30, 2013

MFS® TECHNOLOGY PORTFOLIO
MFS® Variable Insurance Trust II

TKS-SEM
MFS® TECHNOLOGY PORTFOLIO
CONTENTS
The report is prepared for the general information of contract owners. It is authorized for distribution to prospective investors only when preceded or accompanied by a current prospectus.
NOT FDIC INSURED Ÿ MAY LOSE VALUE Ÿ NO BANK OR CREDIT UNION GUARANTEE Ÿ NOT A DEPOSIT Ÿ NOT INSURED BY ANY FEDERAL GOVERNMENT AGENCY OR NCUA/NCUSIF
MFS Technology Portfolio
LETTER FROM THE CHAIRMAN AND CEO

Dear Contract Owners:
As the year progresses, the global economy continues to grind ahead slowly, held back by broad austerity measures. The U.S. economy remains a steadying force, driven by resilient consumers, who have taken the payroll tax increase and the sequestration’s early impact in stride. With U.S. housing and jobs showing steady expansion, domestic consumer-driven growth has offset weaker exports and the U.S. government’s spending constraints. In response to these developments, the U.S. Federal Reserve has begun to brace investors for an eventual shift in its monetary policy, causing global market tremors.
Japan has been another bright spot, with government and central bank stimulus policies leading to increased exports, a resurgent stock market and improved economic sentiment. After a six-month rally, Japan’s stocks slipped late in the second quarter, then picked up momentum on fresh signs that the country could soon break free of its chronic deflation. The major deterrent to global growth remains the eurozone, still in the grip of persistent recession. China has seen its pace of economic growth decelerate, a troubling turn for the country’s trading partners, who have come to rely on it as an engine for global growth.
As always, managing risk in the face of uncertainty remains a top priority for investors. At MFS®, our uniquely collaborative investment process employs integrated, global research and active risk management. Our global team of investment professionals shares ideas and evaluates opportunities across continents, investment disciplines and asset classes — all with a goal of building better insights, and ultimately better results, for our clients.
We are mindful of the many economic challenges investors face, and believe it is more important than ever to maintain a long-term view and employ time-tested principles, such as asset allocation and diversification. We remain confident that our unique approach can serve investors well as they work with their financial advisors to identify and pursue the most suitable opportunities.
Respectfully,

Robert J. Manning
Chairman and Chief Executive Officer
MFS Investment Management®
August 16, 2013
The opinions expressed in this letter are subject to change, may not be relied upon for investment advice, and no forecasts can be guaranteed.
1
MFS Technology Portfolio
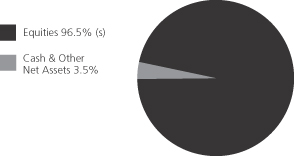
PORTFOLIO COMPOSITION
Portfolio structure (i)
| | | | |
| Top ten holdings (i) | | | | |
| Google, Inc., “A” | | | 10.1% | |
| Apple, Inc. | | | 6.5% | |
| Hewlett-Packard Co. | | | 6.0% | |
| Qualcomm, Inc. | | | 4.9% | |
| Amazon.com, Inc. | | | 4.5% | |
| Visa, Inc., “A” | | | 4.5% | |
| Oracle Corp. | | | 4.5% | |
| eBay, Inc. | | | 3.4% | |
| Microchip Technology, Inc. | | | 3.4% | |
| EMC Corp. | | | 3.4% | |
| | | | |
| Top five industries (i) | | | | |
Computer Software - Systems (s) | | | 20.6% | |
Internet | | | 18.1% | |
Computer Software | | | 12.5% | |
Electronics (s) | | | 12.0% | |
Other Banks & Diversified Financials | | | 7.9% | |
| (i) | For purposes of this presentation, the components include the market value of securities, less any securities sold short, and reflect the impact of the equivalent exposure of derivative positions. These amounts may be negative from time to time. Equivalent exposure is a calculated amount that translates the derivative position into a reasonable approximation of the amount of the underlying asset that the portfolio would have to hold at a given point in time to have the same price sensitivity that results from the portfolio’s ownership of the derivative contract. When dealing with derivatives, equivalent exposure is a more representative measure of the potential impact of a position on portfolio performance than market value. |
| (s) | Includes securities sold short. |
Percentages are based on net assets as of 6/30/13.
The portfolio is actively managed and current holdings may be different.
2
MFS Technology Portfolio
EXPENSE TABLE
Fund Expenses Borne by the Contract Holders During the Period,
January 1, 2013 through June 30, 2013
As a contract holder of the fund, you incur ongoing costs, including management fees; distribution and/or service (12b-1) fees; and other fund expenses. This example is intended to help you understand your ongoing costs (in dollars) of investing in the fund and to compare these costs with the ongoing costs of investing in other mutual funds.
The example is based on an investment of $1,000 invested at the beginning of the period and held for the entire period January 1, 2013 through June 30, 2013.
Actual Expenses
The first line for each share class in the following table provides information about actual account values and actual expenses. You may use the information in this line, together with the amount you invested, to estimate the expenses that you paid over the period. Simply divide your account value by $1,000 (for example, an $8,600 account value divided by $1,000 = 8.6), then multiply the result by the number in the first line under the heading entitled “Expenses Paid During Period” to estimate the expenses you paid on your account during this period.
Hypothetical Example for Comparison Purposes
The second line for each share class in the following table provides information about hypothetical account values and hypothetical expenses based on the fund’s actual expense ratio and an assumed rate of return of 5% per year before expenses, which is not the fund’s actual return. The hypothetical account values and expenses may not be used to estimate the actual ending account balance or expenses you paid for the period. You may use this information to compare the ongoing costs of investing in the fund and other funds. To do so, compare this 5% hypothetical example with the 5% hypothetical examples that appear in the shareholder reports of the other funds.
Please note that the expenses shown in the table are meant to highlight the fund’s ongoing costs only and do not take into account the fees and expenses imposed under the variable contracts through which your investment in the fund is made. Therefore, the second line for each share class in the table is useful in comparing ongoing costs associated with an investment in vehicles (such as the fund) which fund benefits under variable annuity and variable life insurance contracts and to qualified pension and retirement plans only, and will not help you determine the relative total costs of investing in the fund through variable annuity and variable life insurance contracts. If the fees and expenses imposed under the variable contracts were included, your costs would have been higher.
| | | | | | | | | | | | | | | | | | |
| Share Class | | | | Annualized
Expense Ratio | | | Beginning
Account Value
1/01/13 | | | Ending
Account Value
6/30/13 | | | Expenses Paid
During Period (p)
1/01/13-6/30/13 | |
| Initial Class | | Actual | | | 1.08% | | | | $1,000.00 | | | | $1,085.75 | | | | $5.59 | |
| | Hypothetical (h) | | | 1.08% | | | | $1,000.00 | | | | $1,019.44 | | | | $5.41 | |
| Service Class | | Actual | | | 1.33% | | | | $1,000.00 | | | | $1,084.53 | | | | $6.87 | |
| | Hypothetical (h) | | | 1.33% | | | | $1,000.00 | | | | $1,018.20 | | | | $6.66 | |
| (h) | 5% class return per year before expenses. |
| (p) | Expenses paid are equal to each class’s annualized expense ratio, as shown above, multiplied by the average account value over the period, multiplied by the number of days in the period, divided by the number of days in the year. |
Expenses Impacting Table
Expense ratios include 0.11% of investment related expenses from short sale dividend and interest expenses that are outside of the expense limitation arrangement (See Note 3 of the Notes to Financial Statements).
3
MFS Technology Portfolio
PORTFOLIO OF INVESTMENTS – 6/30/13 (unaudited)
The Portfolio of Investments is a complete list of all securities owned by your fund. It is categorized by broad-based asset classes.
| | | | | | | | |
| Issuer | | Shares/Par | | | Value ($) | |
| | | | | | | | |
| COMMON STOCKS – 99.3% | | | | | | | | |
| Broadcasting – 4.3% | | | | | | | | |
| Discovery Communications, Inc., “C” (a) | | | 3,540 | | | $ | 246,596 | |
| News Corp., “A” | | | 30,820 | | | | 1,004,732 | |
| Time Warner, Inc. | | | 7,140 | | | | 412,835 | |
| Viacom, Inc., “B” | | | 3,030 | | | | 206,191 | |
| Walt Disney Co. | | | 7,000 | | | | 442,050 | |
| | | | | | | | |
| | | | | | $ | 2,312,404 | |
| | | | | | | | |
| Brokerage & Asset Managers – 0.3% | | | | | | | | |
| IntercontinentalExchange, Inc. (a) | | | 1,050 | | | $ | 186,648 | |
| | | | | | | | |
| Business Services – 5.0% | | | | | | | | |
| Accenture PLC, “A” | | | 14,000 | | | $ | 1,007,440 | |
| Cognizant Technology Solutions Corp., “A” (a) | | | 7,510 | | | | 470,201 | |
| Fidelity National Information Services, Inc. | | | 14,870 | | | | 637,031 | |
| FleetCor Technologies, Inc. (a) | | | 4,370 | | | | 355,281 | |
| QIWI PLC, ADR | | | 7,740 | | | | 179,568 | |
| | | | | | | | |
| | | | | | $ | 2,649,521 | |
| | | | | | | | |
| Computer Software – 12.5% | | | | | | | | |
| Autodesk, Inc. (a) | | | 13,160 | | | $ | 446,650 | |
| CDW Corp. (a) | | | 23,260 | | | | 433,101 | |
| Citrix Systems, Inc. (a) | | | 9,100 | | | | 549,003 | |
| Microsoft Corp. | | | 13,830 | | | | 477,550 | |
| Oracle Corp. (s) | | | 77,950 | | | | 2,394,624 | |
| Qlik Technologies, Inc. (a) | | | 14,750 | | | | 416,983 | |
| Salesforce.com, Inc. (a) | | | 29,000 | | | | 1,107,220 | |
| Symantec Corp. | | | 22,150 | | | | 497,710 | |
| TIBCO Software, Inc. (a) | | | 16,400 | | | | 350,960 | |
| | | | | | | | |
| | | | | | $ | 6,673,801 | |
| | | | | | | | |
| Computer Software – Systems – 20.9% | | | | | |
| Apple, Inc. (s) | | | 8,815 | | | $ | 3,491,445 | |
| EMC Corp. | | | 76,770 | | | | 1,813,307 | |
| FleetMatics Group PLC (a) | | | 9,700 | | | | 322,331 | |
| Guidewire Software, Inc. (a) | | | 12,510 | | | | 526,046 | |
| Hewlett-Packard Co. | | | 129,710 | | | | 3,216,808 | |
| International Business Machines Corp. | | | 2,519 | | | | 481,406 | |
| Model N, Inc. (a) | | | 10,180 | | | | 237,805 | |
| Qualys, Inc. (a) | | | 10,010 | | | | 161,361 | |
| Splunk, Inc. (a) | | | 5,990 | | | | 277,696 | |
| SS&C Technologies Holdings, Inc. (a) | | | 9,740 | | | | 320,446 | |
| Vantiv, Inc., “A” (a) | | | 11,900 | | | | 328,440 | |
| | | | | | | | |
| | | | | | $ | 11,177,091 | |
| | | | | | | | |
| Consumer Services – 3.5% | | | | | | | | |
| Grand Canyon Education, Inc. (a) | | | 2,870 | | | $ | 92,500 | |
| Priceline.com, Inc. (a) | | | 2,172 | | | | 1,796,526 | |
| | | | | | | | |
| | | | | | $ | 1,889,026 | |
| | | | | | | | |
| Electrical Equipment – 1.6% | | | | | | | | |
| Amphenol Corp., “A” | | | 9,450 | | | $ | 736,533 | |
| W.W. Grainger, Inc. | | | 510 | | | | 128,612 | |
| | | | | | | | |
| | | | | | $ | 865,145 | |
| | | | | | | | |
| | | | | | | | |
| Issuer | | Shares/Par | | | Value ($) | |
| | | | | | | | |
| COMMON STOCKS – continued | |
| Electronics – 12.8% | | | | | | | | |
| Aeroflex Holding Corp. (a) | | | 51,220 | | | $ | 404,126 | |
| Altera Corp. | | | 33,640 | | | | 1,109,784 | |
| Freescale Semiconductor Ltd. (a) | | | 29,690 | | | | 402,300 | |
| JDS Uniphase Corp. (a) | | | 100,320 | | | | 1,442,602 | |
| Linear Technology Corp. | | | 9,800 | | | | 361,032 | |
| Mellanox Technologies Ltd. (a) | | | 7,020 | | | | 347,490 | |
| Microchip Technology, Inc. | | | 49,350 | | | | 1,838,287 | |
| NXP Semiconductors N.V. (a) | | | 20,860 | | | | 646,243 | |
| Ultratech, Inc. (a) | | | 4,090 | | | | 150,185 | |
| Veeco Instruments, Inc. (a) | | | 4,330 | | | | 153,369 | |
| | | | | | | | |
| | | | | | $ | 6,855,418 | |
| | | | | | | | |
| Entertainment – 0.7% | | | | | | | | |
| AMC Networks, Inc., “A” (a) | | | 5,410 | | | $ | 353,868 | |
| | | | | | | | |
| Internet – 18.1% | | | | | | | | |
| ChannelAdvisor Corp. (a) | | | 11,220 | | | $ | 176,491 | |
| eBay, Inc. (a) | | | 35,620 | | | | 1,842,266 | |
| Facebook, Inc., “A “ (a) | | | 31,460 | | | | 782,096 | |
| Google, Inc., “A” (a)(s) | | | 6,132 | | | | 5,398,429 | |
| LinkedIn Corp., “A” (a) | | | 1,801 | | | | 321,118 | |
| Rackspace Hosting, Inc. (a) | | | 2,300 | | | | 87,147 | |
| Yahoo!, Inc. (a) | | | 42,490 | | | | 1,066,924 | |
| | | | | | | | |
| | | | | | $ | 9,674,471 | |
| | | | | | | | |
| Network & Telecom – 7.2% | | | | | | | | |
| Finisar Corp. (a) | | | 49,900 | | | $ | 845,805 | |
| Juniper Networks, Inc. (a) | | | 18,640 | | | | 359,938 | |
| Qualcomm, Inc. | | | 43,000 | | | | 2,626,440 | |
| | | | | | | | |
| | | | | | $ | 3,832,183 | |
| | | | | | | | |
| Other Banks & Diversified Financials – 7.9% | | | | | |
| MasterCard, Inc., “A” | | | 3,135 | | | $ | 1,801,058 | |
| Visa, Inc., “A” | | | 13,203 | | | | 2,412,848 | |
| | | | | | | | |
| | | | | | $ | 4,213,906 | |
| | | | | | | | |
| Specialty Stores – 4.5% | | | | | | | | |
| Amazon.com, Inc. (a) | | | 8,701 | | | $ | 2,416,181 | |
| | | | | | | | |
Total Common Stocks
(Identified Cost, $47,495,227) | | | | | | $ | 53,099,663 | |
| | | | | | | | |
|
| MONEY MARKET FUNDS – 1.7% | |
| MFS Institutional Money Market Portfolio, 0.11%, at Cost and Net Asset Value (v) | | | 892,779 | | | $ | 892,779 | |
| | | | | | | | |
Total Investments
(Identified Cost, $48,388,006) | | | | | | $ | 53,992,442 | |
| | | | | | | | |
| Issuer/Expiration Date/Strike Price | | Number of
Contracts | | | | |
|
| CALL OPTIONS WRITTEN – 0.0% | |
| Business Services – 0.0% | | | | | | | | |
| Accenture PLC – July 2013 @ $72.5 | | | (19 | ) | | $ | (2,565 | ) |
| Accenture PLC – July 2013 @ $75 | | | (39 | ) | | | (1,755 | ) |
| | | | | | | | |
| | | | | | $ | (4,320 | ) |
| | | | | | | | |
4
MFS Technology Portfolio
Portfolio of Investments (unaudited) – continued
| | | | | | | | |
| Issuer/Expiration Date/Strike Price | | Number of
Contracts | | | Value ($) | |
| | | | | | | | |
| CALL OPTIONS WRITTEN – continued | | | | | |
| Computer Software – Systems – 0.0% | |
| Apple Inc. – July 2013 @ 470 | | | (12 | ) | | $ | (204 | ) |
| | | | | | | | |
Total Call Options Written
(Premium Received, $6,216) | | | | | | $ | (4,524 | ) |
| | | | | | | | |
| |
| PUT OPTIONS WRITTEN – (0.1)% | | | | | |
| Computer Software – Systems – 0.0% | |
| Synaptics Inc. – July 2013 @ $37 (a) | | | (54 | ) | | $ | (4,050 | ) |
| | | | | | | | |
| Network & Telecom – (0.1)% | | | | | | | | |
| Research In Motion Ltd. – July 2013 @ $13 (a) | | | (141 | ) | | $ | (37,083 | ) |
| | | | | | | | |
Total Put Options Written
(Premium Received, $11,725) | | | | | | $ | (41,133 | ) |
| | | | | | | | |
| Issuer | | Shares/Par | | | | |
|
| SECURITIES SOLD SHORT – (3.0)% | |
| Business Services – (1.2)% | | | | | | | | |
| FactSet Research Systems, Inc. | | | (6,600 | ) | | $ | (672,804 | ) |
| | | | | | | | |
| Computer Software – Systems – (0.4)% | | | | | |
| Synaptics Inc. | | | (5,400 | ) | | $ | (208,224 | ) |
| | | | | | | | |
| Electronics – (0.9)% | | | | | | | | |
| Texas Instruments, Inc. | | | (10,300 | ) | | $ | (359,161 | ) |
| Xilinx, Inc. | | | (2,700 | ) | | | (106,947 | ) |
| | | | | | | | |
| | | | | | $ | (466,108 | ) |
| | | | | | | | |
| | | | | | | | |
| Issuer | |
Shares/Par | | | Value ($) | |
| | | | | | | | |
| SECURITIES SOLD SHORT – continued | |
| Network & Telecom – (0.5)% | | | | | | | | |
| Research In Motion Ltd. | | | (25,600 | ) | | $ | (268,032 | ) |
| | | | | | | | |
Total Securities Sold Short
(Proceeds Received, $1,645,577) | | | | | | $ | (1,615,168 | ) |
| | | | | | | | |
OTHER ASSETS, LESS
LIABILITIES – 2.1% | | | | | | | 1,126,384 | |
| | | | | | | | |
| Net Assets – 100.0% | | | | | | $ | 53,458,001 | |
| | | | | | | | |
| (a) | | Non-income producing security. |
| (s) | | Security or a portion of the security was pledged to cover collateral requirements for securities sold short and certain derivative transactions. |
| (v) | | Underlying affiliated fund that is available only to investment companies managed by MFS. The rate quoted for the MFS Institutional Money Market Portfolio is the annualized seven-day yield of the fund at period end. |
At June 30, 2013, the fund had cash collateral of $1,274,118 and other liquid securities with an aggregate value of $1,090,732 to cover any commitments for securities sold short and certain derivative contracts. Cash collateral is comprised of “Deposits with brokers” in the Statement of Assets and Liabilities.
The following abbreviations are used in this report and are defined:
| ADR | | American Depositary Receipt |
| PLC | | Public Limited Company |
See Notes to Financial Statements
5
MFS Technology Portfolio
FINANCIAL STATEMENTS | STATEMENT OF ASSETS AND LIABILITIES (unaudited)
This statement represents your fund’s balance sheet, which details the assets and liabilities comprising the total value of the fund.
| | | | | | | | |
At 6/30/13 | | | | | | | | |
Assets | | | | | | | | |
Investments – | | | | | | | | |
Non-affiliated issuers, at value (identified cost, $47,495,227) | | | $53,099,663 | | | | | |
Underlying affiliated funds, at cost and value | | | 892,779 | | | | | |
Total investments, at value (identified cost, $48,388,006) | | | $53,992,442 | | | | | |
Deposits with brokers | | | 1,274,118 | | | | | |
Receivables for | | | | | | | | |
Investments sold | | | 459,907 | | | | | |
Fund shares sold | | | 158,507 | | | | | |
Dividends | | | 28,607 | | | | | |
Other assets | | | 387 | | | | | |
Total assets | | | | | | | $55,913,968 | |
Liabilities | | | | | | | | |
Payables for | | | | | | | | |
Securities sold short, at value (proceeds received, $1,645,577) | | | $1,615,168 | | | | | |
Investments purchased | | | 747,316 | | | | | |
Fund shares reacquired | | | 6,245 | | | | | |
Written options outstanding, at value (premiums received, $17,941) | | | 45,657 | | | | | |
Payable to affiliates | | | | | | | | |
Investment adviser | | | 4,548 | | | | | |
Shareholder servicing costs | | | 81 | | | | | |
Distribution and/or service fees | | | 1,106 | | | | | |
Payable for independent Trustees’ compensation | | | 243 | | | | | |
Accrued expenses and other liabilities | | | 35,603 | | | | | |
Total liabilities | | | | | | | $2,455,967 | |
Net assets | | | | | | | $53,458,001 | |
Net assets consist of | | | | | | | | |
Paid-in capital | | | $46,988,875 | | | | | |
Unrealized appreciation (depreciation) on investments | | | 5,607,129 | | | | | |
Accumulated net realized gain (loss) on investments and foreign currency | | | 952,972 | | | | | |
Accumulated net investment loss | | | (90,975 | ) | | | | |
Net assets | | | | | | | $53,458,001 | |
Shares of beneficial interest outstanding | | | | | | | 6,363,030 | |
| | | | | | | | | | | | |
| | | Net assets | | | Shares
outstanding | | | Net asset value
per share | |
Initial Class | | | $12,925,285 | | | | 1,500,490 | | | | $8.61 | |
Service Class | | | 40,532,716 | | | | 4,862,540 | | | | 8.34 | |
See Notes to Financial Statements
6
MFS Technology Portfolio
FINANCIAL STATEMENTS | STATEMENT OF OPERATIONS (unaudited)
This statement describes how much your fund earned in investment income and accrued in expenses. It also describes any gains and/or losses generated by fund operations.
| | | | | | | | |
Six months ended 6/30/13 | | | | | | | | |
Net Investment loss | | | | | | | | |
Income | | | | | | | | |
Dividends | | | $213,722 | | | | | |
Interest | | | 4,708 | | | | | |
Dividends from underlying affiliated funds | | | 195 | | | | | |
Total investment income | | | | | | | $218,625 | |
Expenses | | | | | | | | |
Management fee | | | $183,788 | | | | | |
Distribution and/or service fees | | | 45,067 | | | | | |
Shareholder servicing costs | | | 2,550 | | | | | |
Administrative services fee | | | 8,726 | | | | | |
Independent Trustees’ compensation | | | 663 | | | | | |
Custodian fee | | | 7,111 | | | | | |
Shareholder communications | | | 2,532 | | | | | |
Audit and tax fees | | | 26,127 | | | | | |
Legal fees | | | 378 | | | | | |
Dividend and interest expense on securities sold short | | | 27,351 | | | | | |
Miscellaneous | | | 5,470 | | | | | |
Total expenses | | | | | | | $309,763 | |
Fees paid indirectly | | | (2 | ) | | | | |
Reduction of expenses by investment adviser | | | (161 | ) | | | | |
Net expenses | | | | | | | $309,600 | |
Net investment loss | | | | | | | $(90,975 | ) |
Realized and unrealized gain (loss) on investments and foreign currency | | | | | | | | |
Realized gain (loss) (identified cost basis) | | | | | | | | |
Investments | | | $1,050,575 | | | | | |
Written options | | | 198,388 | | | | | |
Securities sold short | | | (202,996 | ) | | | | |
Foreign currency | | | 98 | | | | | |
Net realized gain (loss) on investments and foreign currency | | | | | | | $1,046,065 | |
Change in unrealized appreciation (depreciation) | | | | | | | | |
Investments | | | $2,853,307 | | | | | |
Written options | | | (27,716 | ) | | | | |
Securities sold short | | | 142,980 | | | | | |
Net unrealized gain (loss) on investments | | | | | | | $2,968,571 | |
Net realized and unrealized gain (loss) on investments | | | | | | | $4,014,636 | |
Change in net assets from operations | | | | | | | $3,923,661 | |
See Notes to Financial Statements
7
MFS Technology Portfolio
FINANCIAL STATEMENTS | STATEMENTS OF CHANGES IN NET ASSETS
These statements describe the increases and/or decreases in net assets resulting from operations, any distributions, and any shareholder transactions.
| | | | | | | | |
| |
| Six months ended
6/30/13
(unaudited |
) | |
| Year ended
12/31/12 |
|
Change in net assets | | | | | | | | |
| From operations | | | | | | | | |
Net investment loss | | | $(90,975 | ) | | | $(251,579 | ) |
Net realized gain (loss) on investments and foreign currency | | | 1,046,065 | | | | 2,152,568 | |
Net unrealized gain (loss) on investments | | | 2,968,571 | | | | 2,434,213 | |
Change in net assets from operations | | | $3,923,661 | | | | $4,335,202 | |
Change in net assets from fund share transactions | | | $4,504,921 | | | | $11,415,026 | |
Total change in net assets | | | $8,428,582 | | | | $15,750,228 | |
Net assets | | | | | | | | |
At beginning of period | | | 45,029,419 | | | | 29,279,191 | |
At end of period (including accumulated net investment loss of $90,975 and
$0, respectively) | | | $53,458,001 | | | | $45,029,419 | |
See Notes to Financial Statements
8
MFS Technology Portfolio
FINANCIAL STATEMENTS | FINANCIAL HIGHLIGHTS
The financial highlights table is intended to help you understand the fund’s financial performance for the semiannual period and the past 5 fiscal years. Certain information reflects financial results for a single fund share. The total returns in the table represent the rate by which an investor would have earned (or lost) on an investment in the fund share class (assuming reinvestment of all distributions) held for the entire period.
| | | | | | | | | | | | | | | | | | | | | | | | |
| Initial Class | | Six months
ended
6/30/13 | | | Years ended 12/31 | |
| | | | 2012 | | | 2011 | | | 2010 | | | 2009 | | | 2008 | |
| | | (unaudited) | | | | | | | | | | | | | | | | |
Net asset value, beginning of period | | | $7.93 | | | | $6.92 | | | | $6.84 | | | | $5.67 | | | | $3.21 | | | | $6.54 | |
| Income (loss) from investment operations | | | | | | | | | | | | | | | | | | | | | | | | |
Net investment income (loss) (d) | | | $(0.01 | ) | | | $(0.04 | ) | | | $(0.05 | ) | | | $ (0.00 | )(w) | | | $ (0.00 | )(w) | | | $(0.00 | )(w) |
Net realized and unrealized gain (loss) on investments and foreign currency | | | 0.69 | | | | 1.05 | | | | 0.13 | | | | 1.17 | | | | 2.46 | | | | (3.33 | ) |
Total from investment operations | | | $0.68 | | | | $1.01 | | | | $0.08 | | | | $1.17 | | | | $2.46 | | | | $(3.33 | ) |
Net asset value, end of period (x) | | | $8.61 | | | | $7.93 | | | | $6.92 | | | | $6.84 | | | | $5.67 | | | | $3.21 | |
Total return (%) (k)(r)(s)(x) | | | 8.58 | (n) | | | 14.60 | | | | 1.17 | | | | 20.63 | | | | 76.64 | | | | (50.92 | ) |
Ratios (%) (to average net assets) and Supplemental data: | | | | | | | | | | | | | | | | | | | | | | | | |
Expenses before expense reductions (f) | | | 1.08 | (a) | | | 1.18 | | | | 1.28 | | | | 1.38 | | | | 1.60 | | | | 1.39 | |
Expenses after expense reductions (f) | | | 1.08 | (a) | | | 1.13 | | | | 1.08 | | | | 1.07 | | | | 1.04 | | | | 1.02 | |
Net investment loss | | | (0.20 | )(a) | | | (0.51 | ) | | | (0.77 | ) | | | (0.07 | ) | | | (0.05 | ) | | | (0.00 | )(w) |
Portfolio turnover | | | 31 | (n) | | | 62 | | | | 90 | | | | 140 | | | | 227 | | | | 244 | |
Net assets at end of period (000 omitted) | | | $12,925 | | | | $13,019 | | | | $14,598 | | | | $15,844 | | | | $14,542 | | | | $8,051 | |
| Supplemental Ratios (%): | | | | | | | | | | | | | | | | | | | | | | | | |
Ratio of expenses to average net assets after expense
reductions excluding short sale dividend and
interest expense (f) | | | 0.97 | (a) | | | 1.00 | | | | 1.00 | | | | 1.00 | | | | 1.00 | | | | 1.00 | |
| | |
| Service Class | | Six months
ended 6/30/13 | | | Years ended 12/31 | |
| | | | 2012 | | | 2011 | | | 2010 | | | 2009 | | | 2008 | |
| | | (unaudited) | | | | | | | | | | | | | | | | |
Net asset value, beginning of period | | | $7.69 | | | | $6.73 | | | | $6.66 | | | | $5.54 | | | | $3.14 | | | | $6.42 | |
| Income (loss) from investment operations | | | | | | | | | | | | | | | | | | | | | | | | |
Net investment income (loss) (d) | | | $(0.02 | ) | | | $(0.06 | ) | | | $(0.08 | ) | | | $ (0.00 | )(w) | | | $(0.01 | ) | | | $(0.02 | ) |
Net realized and unrealized gain (loss) on investments and foreign currency | | | 0.67 | | | | 1.02 | | | | 0.15 | | | | 1.12 | | | | 2.41 | | | | (3.26 | ) |
Total from investment operations | | | $0.65 | | | | $0.96 | | | | $0.07 | | | | $1.12 | | | �� | $2.40 | | | | $(3.28 | ) |
Net asset value, end of period (x) | | | $8.34 | | | | $7.69 | | | | $6.73 | | | | $6.66 | | | | $5.54 | | | | $3.14 | |
Total return (%) (k)(r)(s)(x) | | | 8.45 | (n) | | | 14.26 | | | | 1.05 | | | | 20.22 | | | | 76.43 | | | | (51.09 | ) |
Ratios (%) (to average net assets)
and Supplemental data: | | | | | | | | | | | | | | | | | | | | | | | | |
Expenses before expense reductions (f) | | | 1.33 | (a) | | | 1.48 | | | | 1.53 | | | | 1.63 | | | | 1.85 | | | | 1.62 | |
Expenses after expense reductions (f) | | | 1.33 | (a) | | | 1.42 | | | | 1.33 | | | | 1.32 | | | | 1.29 | | | | 1.27 | |
Net investment loss | | | (0.43 | )(a) | | | (0.74 | ) | | | (1.13 | ) | | | (0.04 | ) | | | (0.32 | ) | | | (0.29 | ) |
Portfolio turnover | | | 31 | (n) | | | 62 | | | | 90 | | | | 140 | | | | 227 | | | | 244 | |
Net assets at end of period (000 omitted) | | | $40,533 | | | | $32,010 | | | | $14,681 | | | | $5,652 | | | | $1,776 | | | | $990 | |
| Supplemental Ratios (%): | | | | | | | | | | | | | | | | | | | | | | | | |
Ratio of expenses to average net assets after expense
reductions excluding short sale dividend and
interest expense (f) | | | 1.22 | (a) | | | 1.25 | | | | 1.25 | | | | 1.25 | | | | 1.25 | | | | 1.25 | |
See Notes to Financial Statements
9
MFS Technology Portfolio
Financial Highlights – continued
| (d) | | Per share data is based on average shares outstanding. |
| (f) | | Ratios do not reflect reductions from fees paid indirectly, if applicable. |
| (k) | | The total return does not reflect expenses that apply to separate accounts. Inclusion of these charges would reduce the total return figures for all periods shown. |
| (r) | | Certain expenses have been reduced without which performance would have been lower. |
| (s) | | From time to time the fund may receive proceeds from litigation settlements, without which performance would be lower. Excluding the effect of the proceeds received from a non-recurring litigation settlement against Nortel Networks Corp., the total returns for the year ended December 31, 2008 would have been lower by approximately 0.58%. |
| (w) | | Per share amount was less than $0.01 and total return or ratio was less than 0.01%, as applicable. |
| (x) | | The net asset values per share and total returns have been calculated on net assets which include adjustments made in accordance with U.S. generally accepted accounting principles required at period end for financial reporting purposes. |
See Notes to Financial Statements
10
MFS Technology Portfolio
NOTES TO FINANCIAL STATEMENTS (unaudited)
| (1) | | Business and Organization |
MFS Technology Portfolio (the fund) is a series of MFS Variable Insurance Trust II (the trust). The trust is organized as a Massachusetts business trust and is registered under the Investment Company Act of 1940, as amended, as an open-end management investment company. The shareholders of each series of the trust are separate accounts of insurance companies, which offer variable annuity and/or life insurance products, and qualified retirement and pension plans.
| (2) | | Significant Accounting Policies |
General – The preparation of financial statements in conformity with U.S. generally accepted accounting principles requires management to make estimates and assumptions that affect the reported amounts of assets and liabilities, and disclosure of contingent assets and liabilities at the date of the financial statements and the reported amounts of revenues and expenses during the reporting period. Actual results could differ from those estimates. In the preparation of these financial statements, management has evaluated subsequent events occurring after the date of the fund’s Statement of Assets and Liabilities through the date that the financial statements were issued. The fund invests primarily in securities of issuers in the technology industry. Issuers in a single industry can react similarly to market, economic, political and regulatory conditions and developments.
In this reporting period, the fund adopted the disclosure provisions of the Financial Accounting Standards Board (FASB) Accounting Standards Update 2011-11 (“ASU 2011-11”), Balance Sheet (Topic 210) – Disclosures about Offsetting Assets and Liabilities along with the related scope clarification provisions of FASB Accounting Standards Update 2013-01 (“ASU 2013-01”) entitled Balance Sheet (Topic 210) – Clarifying the Scope of Disclosures about Offsetting Assets and Liabilities. ASU 2011-11 is intended to enhance disclosures on the offsetting of financial assets and liabilities by requiring entities to disclose both gross and net information about financial instruments and transactions that are either offset in the statement of financial position or subject to a Master Netting Agreement or similar arrangement. ASU 2013-01 limits the scope of ASU 2011-11’s disclosure requirements on offsetting to financial assets and financial liabilities related to derivatives, repurchase and reverse repurchase agreements, and securities lending and securities borrowing transactions. The disclosures required by ASU 2011-11, to the extent applicable to the fund, have been included in the fund’s Significant Accounting Policies note under the captions for each of the fund’s in-scope financial instruments and transactions.
In June 2013, FASB issued Accounting Standards Update 2013-08 Financial Services – Investment Companies (Topic 946) – Amendments to the Scope, Measurement, and Disclosure Requirements (“ASU 2013-08”) which is effective for interim and annual reporting periods in fiscal years that begin after December 15, 2013. ASU 2013-08 sets forth a methodology for determining whether an entity should be characterized as an investment company and prescribes fair value accounting for an investment company’s non-controlling ownership interest in another investment company. FASB has determined that a fund registered under the Investment Company Act of 1940 automatically meets ASU 2013-08’s criteria for an investment company. Although still evaluating the potential impacts of ASU 2013-08 to the fund, management expects that the impact of the fund’s adoption will be limited to additional financial statement disclosures.
Investment Valuations – Equity securities, including restricted equity securities, are generally valued at the last sale or official closing price as provided by a third-party pricing service on the market or exchange on which they are primarily traded. Equity securities, for which there were no sales reported that day, are generally valued at the last quoted daily bid quotation as provided by a third-party pricing service on the market or exchange on which such securities are primarily traded. Equity securities held short, for which there were no sales reported for that day, are generally valued at the last quoted daily ask quotation as provided by a third-party pricing service on the market or exchange on which such securities are primarily traded. Short-term instruments with a maturity at issuance of 60 days or less generally are valued at amortized cost, which approximates market value. Exchange-traded options are generally valued at the last sale or official closing price as provided by a third-party pricing service on the exchange on which such options are primarily traded. Exchange-traded options for which there were no sales reported that day are generally valued at the last daily bid quotation as provided by a third-party pricing service on the exchange on which such options are primarily traded. Options not traded on an exchange are generally valued at a broker/dealer bid quotation. Foreign currency options are generally valued at valuations provided by a third-party pricing service. Open-end investment companies are generally valued at net asset value per share. Securities and other assets generally valued on the basis of information from a third-party pricing service may also be valued at a broker/dealer bid quotation. Values obtained from third-party pricing services can utilize both transaction data and market information such as yield, quality, coupon rate, maturity, type of issue, trading characteristics, and other market data. The values of foreign securities and other assets and liabilities expressed in foreign currencies are converted to U.S. dollars using the mean of bid and asked prices for rates provided by a third-party pricing service.
The Board of Trustees has delegated primary responsibility for determining or causing to be determined the value of the fund’s investments (including any fair valuation) to the adviser pursuant to valuation policies and procedures approved by the Board. If the adviser determines that reliable market quotations are not readily available, investments are valued at fair value as determined in good faith by the adviser in accordance with such procedures under the oversight of the Board of Trustees. Under the fund’s valuation policies and procedures, market quotations are not considered to be readily available for most types of debt instruments and floating rate loans and many types of derivatives. These investments are generally valued at fair value based on information from
11
MFS Technology Portfolio
Notes to Financial Statements (unaudited) – continued
third-party pricing services. In addition, investments may be valued at fair value if the adviser determines that an investment’s value has been materially affected by events occurring after the close of the exchange or market on which the investment is principally traded (such as foreign exchange or market) and prior to the determination of the fund’s net asset value, or after the halting of trading of a specific security where trading does not resume prior to the close of the exchange or market on which the security is principally traded. Events that occur on a frequent basis after foreign markets close (such as developments in foreign markets and significant movements in the U.S. markets) and prior to the determination of the fund’s net asset value may be deemed to have a material effect on the value of securities traded in foreign markets. Accordingly, the fund’s foreign equity securities may often be valued at fair value. The adviser generally relies on third-party pricing services or other information (such as the correlation with price movements of similar securities in the same or other markets; the type, cost and investment characteristics of the security; the business and financial condition of the issuer; and trading and other market data) to assist in determining whether to fair value and at what value to fair value an investment. The value of an investment for purposes of calculating the fund’s net asset value can differ depending on the source and method used to determine value. When fair valuation is used, the value of an investment used to determine the fund’s net asset value may differ from quoted or published prices for the same investment. There can be no assurance that the fund could obtain the fair value assigned to an investment if it were to sell the investment at the same time at which the fund determines its net asset value per share.
Various inputs are used in determining the value of the fund’s assets or liabilities. These inputs are categorized into three broad levels. In certain cases, the inputs used to measure fair value may fall into different levels of the fair value hierarchy. In such cases, an investment’s level within the fair value hierarchy is based on the lowest level of input that is significant to the fair value measurement. The fund’s assessment of the significance of a particular input to the fair value measurement in its entirety requires judgment, and considers factors specific to the investment. Level 1 includes unadjusted quoted prices in active markets for identical assets or liabilities. Level 2 includes other significant observable market-based inputs (including quoted prices for similar securities, interest rates, prepayment speed, and credit risk). Level 3 includes unobservable inputs, which may include the adviser’s own assumptions in determining the fair value of investments. Other financial instruments are derivative instruments not reflected in total investments, such as written options. The following is a summary of the levels used as of June 30, 2013 in valuing the fund’s assets or liabilities:
| | | | | | | | | | | | | | | | |
| Investments at Value | | Level 1 | | | Level 2 | | | Level 3 | | | Total | |
| Equity Securities | | | $53,099,663 | | | | $— | | | | $— | | | | $53,099,663 | |
| Mutual Funds | | | 892,779 | | | | — | | | | — | | | | 892,779 | |
| Total Investments | | | $53,992,442 | | | | $— | | | | $— | | | | $53,992,442 | |
| Short Sales | | | $(1,615,168 | ) | | | $— | | | | $— | | | | $(1,615,168 | ) |
| | | | |
| Other Financial Instruments | | | | | | | | | | | | |
| Written Options | | | $(45,657 | ) | | | $— | | | | $— | | | | $(45,657 | ) |
For further information regarding security characteristics, see the Portfolio of Investments.
Foreign Currency Translation – Purchases and sales of foreign investments, income, and expenses are converted into U.S. dollars based upon currency exchange rates prevailing on the respective dates of such transactions or on the reporting date for foreign denominated receivables and payables. Gains and losses attributable to foreign currency exchange rates on sales of securities are recorded for financial statement purposes as net realized gains and losses on investments. Gains and losses attributable to foreign exchange rate movements on receivables, payables, income and expenses are recorded for financial statement purposes as foreign currency transaction gains and losses. That portion of both realized and unrealized gains and losses on investments that results from fluctuations in foreign currency exchange rates is not separately disclosed.
Derivatives – The fund uses derivatives for different purposes, primarily to increase or decrease exposure to a particular market or segment of the market, or security, to increase or decrease interest rate or currency exposure, or as alternatives to direct investments. Derivatives are used for hedging or non-hedging purposes. While hedging can reduce or eliminate losses, it can also reduce or eliminate gains. When the fund uses derivatives as an investment to increase market exposure, or for hedging purposes, gains and losses from derivative instruments may be substantially greater than the derivative’s original cost.
The derivative instruments used by the fund were written options and purchased options. The fund’s period end derivatives, as presented in the Portfolio of Investments, generally are indicative of the volume of its derivative activity during the period.
The following table presents, by major type of derivative contract, the fair value, on a gross basis, of the asset and liability components of derivatives held by the fund at June 30, 2013 as reported in the Statement of Assets and Liabilities:
| | | | | | | | | | |
| | | | | Fair Value | |
| Risk | | Derivative Contracts | | Asset Derivatives | | | Liability Derivatives | |
| Equity | | Written Equity Options | | | $— | | | | $(45,657 | ) |
12
MFS Technology Portfolio
Notes to Financial Statements (unaudited) – continued
The following table presents, by major type of derivative contract, the realized gain (loss) on derivatives held by the fund for the six months ended June 30, 2013 as reported in the Statement of Operations:
| | | | | | | | |
| Risk | | Investments (Purchased Options) | | | Written Options | |
| Equity | | | $(338,842 | ) | | | $198,388 | |
The following table presents, by major type of derivative contract, the change in unrealized appreciation (depreciation) on derivatives held by the fund for the six months ended June 30, 2013 as reported in the Statement of Operations:
| | | | | | | | |
| Risk | | Investments (Purchased Options) | | | Written Options | |
| Equity | | | $72,084 | | | | $(27,716 | ) |
Derivative counterparty credit risk is managed through formal evaluation of the creditworthiness of all potential counterparties. On certain, but not all, over-the-counter derivatives, the fund attempts to reduce its exposure to counterparty credit risk whenever possible by entering into an International Swaps and Derivatives Association (ISDA) Master Agreement on a bilateral basis with each of the counterparties with whom it undertakes a significant volume of transactions. The ISDA Master Agreement gives each party to the agreement the right to terminate all transactions traded under such agreement if there is a certain deterioration in the credit quality of the other party. Upon an event of default or a termination of the ISDA Master Agreement, the non-defaulting party has the right to close out all transactions traded under such agreement and to net amounts owed under each transaction to one net amount payable by one party to the other. This right to close out and net payments across all transactions traded under the ISDA Master Agreement could result in a reduction of the fund’s credit risk to such counterparty equal to any amounts payable by the fund under the applicable transactions, if any.
Collateral and margin requirements differ by type of derivative. Margin requirements are set by the broker or clearing house for cleared derivatives (i.e., futures contracts, cleared swaps, and exchange-traded options) while collateral terms are contract specific for over-the-counter traded derivatives (i.e., forward foreign currency exchange contracts, uncleared swap agreements, and over-the-counter options). For derivatives traded under an ISDA Master Agreement, the collateral requirements are netted across all transactions traded under such agreement and one amount is posted from one party to the other to collateralize such obligations. Cash that has been segregated to cover the fund’s collateral or margin obligations under derivative contracts, if any, will be reported separately in the Statement of Assets and Liabilities as “Deposits with brokers.” Securities pledged as collateral or margin for the same purpose, if any, is noted in the Portfolio of Investments.
The fund’s accounting policy with respect to balance sheet offsetting is that, absent an event of default by the counterparty or a termination of the agreement, the ISDA Master Agreement does not result in an offset of reported amounts of financial assets and financial liabilities in the Statement of Assets and Liabilities across transactions between the fund and the applicable counterparty.
Written Options – In exchange for a premium, the fund wrote call options on securities that it anticipated the price would decline and also wrote put options on securities that it anticipated the price would increase. At the time the option was written, the fund believed the premium received exceeded the potential loss that could result from adverse price changes in the options’ underlying securities. In a written option, the fund as the option writer grants the buyer the right to purchase from, or sell to, the fund a specified number of shares or units of a particular security, currency or index at a specified price within a specified period of time.
The premium received is initially recorded as a liability in the Statement of Assets and Liabilities. The option is subsequently marked-to-market daily with the difference between the premium received and the market value of the written option being recorded as unrealized appreciation or depreciation. When a written option expires, the fund realizes a gain equal to the amount of the premium received. The difference between the premium received and the amount paid on effecting a closing transaction is considered a realized gain or loss. When a written call option is exercised, the premium received is offset against the proceeds to determine the realized gain or loss. When a written put option is exercised, the premium reduces the cost basis of the security purchased by the fund.
At the initiation of the written option contract, for exchange traded options, the fund is required to deposit securities or cash as collateral with the custodian for the benefit of the broker. For over-the-counter options, the fund may post collateral subject to the terms of an ISDA Master Agreement as generally described above if the market value of the options contract moves against it. The fund, as writer of an option, may have no control over whether the underlying securities may be sold (call) or purchased (put) and, as a result, bears the market risk of an unfavorable change in the price of the securities underlying the written option. Losses from writing options can exceed the premium received and can exceed the potential loss from an ordinary buy and sell transaction. Although the fund’s market risk may be significant, the maximum counterparty credit risk to the fund is equal to the market value of any collateral posted to the broker. For over-the-counter options, this risk is mitigated in cases where there is an ISDA Master Agreement between the fund and the counterparty providing for netting as described above.
13
MFS Technology Portfolio
Notes to Financial Statements (unaudited) – continued
The following table represents the written option activity in the fund during the six months ended June 30, 2013:
| | | | | | | | |
| | | Number of contracts | | | Premiums
received | |
| Outstanding, beginning of period | | | — | | | | $— | |
| Options written | | | 7,469 | | | | 317,198 | |
| Options closed | | | (868 | ) | | | (61,981 | ) |
| Options exercised | | | (1,701 | ) | | | (68,496 | ) |
| Options expired | | | (4,635 | ) | | | (168,780 | ) |
| Outstanding, end of period | | | 265 | | | | $17,941 | |
Purchased Options – The fund purchased call and put options for a premium. Purchased call and put options entitle the holder to buy and sell a specified number of shares or units of a particular security, currency or index at a specified price at a specified date or within a specified period of time. Purchasing call options may hedge against an anticipated increase in the dollar cost of securities or currency to be acquired or increase the fund’s exposure to an underlying instrument. Purchasing put options may hedge against an anticipated decline in the value of portfolio securities or currency or decrease the fund’s exposure to an underlying instrument.
The premium paid is initially recorded as an investment in the Statement of Assets and Liabilities. That investment is subsequently marked-to-market daily with the difference between the premium paid and the market value of the purchased option being recorded as unrealized appreciation or depreciation. Premiums paid for purchased call and put options which have expired are treated as realized losses on investments in the Statement of Operations. Upon the exercise or closing of a purchased call option, the premium paid is added to the cost of the security or financial instrument purchased. Upon the exercise or closing of a purchased put option, the premium paid is offset against the proceeds on the sale of the underlying security or financial instrument in order to determine the realized gain or loss on investments.
Whether or not the option is exercised, the fund’s maximum risk of loss from purchasing an option is the amount of premium paid. All option contracts involve credit risk if the counterparty to the option contract fails to perform. For over-the-counter options, this risk is mitigated in cases where there is an ISDA Master Agreement between the fund and the counterparty providing for netting as described above and for posting of collateral by the counterparty to the fund to cover the fund’s exposure to the counterparty under such ISDA Master Agreement.
Short Sales – The fund entered into short sales whereby it sells a security it does not own in anticipation of a decline in the value of that security. The fund will realize a gain if the security price decreases and a loss if the security price increases between the date of the short sale and the date on which the fund replaces the borrowed security. Losses from short sales can exceed the proceeds of the security sold; and they can also exceed the potential loss from an ordinary buy and sell transaction. The amount of any premium, dividends, or interest the fund may be required to pay in connection with a short sale will be recognized as a fund expense. During the six months ended June 30, 2013, this expense amounted to $27,351. The fund segregates cash or marketable securities in an amount that, when combined with the amount of proceeds from the short sale deposited with the broker, at least equals the current market value of the security sold short.
Indemnifications – Under the fund’s organizational documents, its officers and Trustees may be indemnified against certain liabilities and expenses arising out of the performance of their duties to the fund. Additionally, in the normal course of business, the fund enters into agreements with service providers that may contain indemnification clauses. The fund’s maximum exposure under these agreements is unknown as this would involve future claims that may be made against the fund that have not yet occurred.
Investment Transactions and Income – Investment transactions are recorded on the trade date. Interest income is recorded on the accrual basis. Dividends received in cash are recorded on the ex-dividend date. Certain dividends from foreign securities will be recorded when the fund is informed of the dividend if such information is obtained subsequent to the ex-dividend date. Dividend and interest payments received in additional securities are recorded on the ex-dividend or ex-interest date in an amount equal to the value of the security on such date.
The fund may receive proceeds from litigation settlements. Any proceeds received from litigation involving portfolio holdings are reflected in the Statement of Operations in realized gain/loss if the security has been disposed of by the fund or in unrealized gain/loss if the security is still held by the fund. Any other proceeds from litigation not related to portfolio holdings are reflected as other income in the Statement of Operations.
Fees Paid Indirectly – The fund’s custody fee may be reduced according to an arrangement that measures the value of cash deposited with the custodian by the fund. This amount, for the six months ended June 30, 2013, is shown as a reduction of total expenses in the Statement of Operations.
Tax Matters and Distributions – The fund intends to qualify as a regulated investment company, as defined under Subchapter M of the Internal Revenue Code, and to distribute all of its taxable income, including realized capital gains. As a result, no provision for federal income tax is required. The fund’s federal tax returns, when filed, will remain subject to examination by the Internal Revenue Service for a three year period.
14
MFS Technology Portfolio
Notes to Financial Statements (unaudited) – continued
Distributions to shareholders are recorded on the ex-dividend date. Income and capital gain distributions are determined in accordance with income tax regulations, which may differ from U.S. generally accepted accounting principles. Certain capital accounts in the financial statements are periodically adjusted for permanent differences in order to reflect their tax character. These adjustments have no impact on net assets or net asset value per share. Temporary differences which arise from recognizing certain items of income, expense, gain or loss in different periods for financial statement and tax purposes will reverse at some time in the future. Distributions in excess of net investment income or net realized gains are temporary overdistributions for financial statement purposes resulting from differences in the recognition or classification of income or distributions for financial statement and tax purposes.
Book/tax differences primarily relate to net operating losses, wash sale loss deferrals, and straddle loss deferrals.
The fund declared no distributions for the year ended December 31, 2012.
The federal tax cost and the tax basis components of distributable earnings were as follows:
| | | | |
| As of 6/30/13 | | | | |
| Cost of investments | | | $48,437,144 | |
| Gross appreciation | | | 7,434,477 | |
| Gross depreciation | | | (1,879,179 | ) |
| Net unrealized appreciation (depreciation) | | | $5,555,298 | |
| |
| As of 12/31/12 | | | | |
| Undistributed long-term capital gain | | | 56,254 | |
| Other temporary differences | | | (212,780 | ) |
| Net unrealized appreciation (depreciation) | | | 2,701,991 | |
The aggregate cost above includes prior fiscal year end tax adjustments, if applicable.
Multiple Classes of Shares of Beneficial Interest – The fund offers multiple classes of shares, which differ in their respective distribution and service fees. The fund’s income, realized and unrealized gain (loss), and common expenses are allocated to shareholders based on the daily net assets of each class. Dividends are declared separately for each class. Differences in per share dividend rates are generally due to differences in separate class expenses.
| (3) | | Transactions with Affiliates |
Investment Adviser – The fund has an investment advisory agreement with MFS to provide overall investment management and related administrative services and facilities to the fund.
The management fee is computed daily and paid monthly at the following annual rates:
| | | | |
| First $1 billion of average daily net assets | | | 0.75% | |
| Average daily net assets in excess of $1 billion | | | 0.70% | |
Effective April 1, 2013, MFS has agreed in writing to reduce its management fee by a specified amount if certain MFS mutual fund assets exceed thresholds agreed to by MFS and the fund’s Board of Trustees. For the period April 1, 2013 through June 30, 2013, this management fee reduction amounted to $69, which is shown as a reduction of total expenses in the Statement of Operations. The management fee incurred for the six months ended June 30, 2013 was equivalent to an annual effective rate of 0.75% of the fund’s average daily net assets.
The investment adviser has agreed in writing to pay a portion of the fund’s total annual operating expenses, exclusive of interest, taxes, extraordinary expenses, brokerage and transaction costs, and investment-related expenses (such as short sale dividend and interest expenses incurred in connection with the fund’s investment activity), such that total annual operating expenses do not exceed 1.00% of average daily net assets for the Initial Class shares and 1.25% of average daily net assets for the Service Class shares. This written agreement will continue until modified by the fund’s Board of Trustees, but such agreement will continue at least until April 30, 2015. For the six months ended June 30, 2013, the fund’s actual operating expenses did not exceed the limit and therefore, the investment adviser did not pay any portion of the fund’s expenses related to this agreement.
Distributor – MFS Fund Distributors, Inc. (MFD), a wholly-owned subsidiary of MFS, is the distributor of shares of the fund. The Trustees have adopted a distribution plan for the Service Class shares pursuant to Rule 12b-1 under the Investment Company Act of 1940.
The fund’s distribution plan provides that the fund will pay MFD distribution and/or service fees equal to 0.25% per annum of its average daily net assets attributable to Service Class shares as partial consideration for services performed and expenses incurred by MFD and financial intermediaries (including participating insurance companies that invest in the fund to fund variable annuity and variable life insurance contracts, sponsors of qualified retirement and pension plans that invest in the fund, and affiliates of these
15
MFS Technology Portfolio
Notes to Financial Statements (unaudited) – continued
participating insurance companies and plan sponsors) in connection with the sale and distribution of the Service Class shares. MFD may subsequently pay all, or a portion, of the distribution and/or service fees to financial intermediaries.
Shareholder Servicing Agent – MFS Service Center, Inc. (MFSC), a wholly-owned subsidiary of MFS, receives a fee from the fund for its services as shareholder servicing agent. For the six months ended June 30, 2013, the fee was $2,537, which equated to 0.0103% annually of the fund’s average daily net assets. MFSC also receives payment from the fund for out-of-pocket expenses paid by MFSC on behalf of the fund. For the six months ended June 30, 2013, these costs amounted to $13.
Administrator – MFS provides certain financial, legal, shareholder communications, compliance, and other administrative services to the fund. Under an administrative services agreement, the fund partially reimburses MFS the costs incurred to provide these services. The fund is charged an annual fixed amount of $17,500 plus a fee based on average daily net assets. The administrative services fee incurred for the six months ended June 30, 2013 was equivalent to an annual effective rate of 0.0356% of the fund’s average daily net assets.
Trustees’ and Officers’ Compensation – The fund pays compensation to independent Trustees in the form of a retainer, attendance fees, and additional compensation to Board and Committee chairpersons. The fund does not pay compensation directly to Trustees or officers of the fund who are also officers of the investment adviser, all of whom receive remuneration for their services to the fund from MFS. Certain officers and Trustees of the fund are officers or directors of MFS, MFD, and MFSC.
Other – This fund and certain other funds managed by MFS (the funds) have entered into services agreements (the Agreements) which provide for payment of fees by the funds to Tarantino LLC and Griffin Compliance LLC in return for the provision of services of an Independent Chief Compliance Officer (ICCO) and Assistant ICCO, respectively, for the funds. The ICCO and Assistant ICCO are officers of the funds and the sole members of Tarantino LLC and Griffin Compliance LLC, respectively. The funds can terminate the Agreements with Tarantino LLC and Griffin Compliance LLC at any time under the terms of the Agreements. For the six months ended June 30, 2013, the aggregate fees paid by the fund to Tarantino LLC and Griffin Compliance LLC were $181 and are included in “Miscellaneous” expense in the Statement of Operations. MFS has agreed to reimburse the fund for a portion of the payments made by the fund in the amount of $92, which is shown as a reduction of total expenses in the Statement of Operations. Additionally, MFS has agreed to bear all expenses associated with office space, other administrative support, and supplies provided to the ICCO and Assistant ICCO.
The fund invests in the MFS Institutional Money Market Portfolio which is managed by MFS and seeks current income consistent with preservation of capital and liquidity. Income earned on this investment is included in “Dividends from underlying affiliated funds” in the Statement of Operations. This money market fund does not pay a management fee to MFS.
Purchases and sales of investments, other than purchased option transactions, short sales, and short-term obligations, aggregated $19,972,105 and $15,176,113, respectively.
| (5) | | Shares of Beneficial Interest |
The fund’s Declaration of Trust permits the Trustees to issue an unlimited number of full and fractional shares of beneficial interest. Transactions in fund shares were as follows:
| | | | | | | | | | | | | | | | |
| | | Six months ended 6/30/13 | | | Year ended 12/31/12 | |
| | | Shares | | | Amount | | | Shares | | | Amount | |
| Shares sold | | | | | | | | | | | | | | | | |
Initial Class | | | 35,676 | | | | $303,500 | | | | 183,167 | | | | $1,425,060 | |
Service Class | | | 912,926 | | | | 7,412,390 | | | | 2,570,116 | | | | 19,344,946 | |
| | | 948,602 | | | | $7,715,890 | | | | 2,753,283 | | | | $20,770,006 | |
| Shares reacquired | | | | | | | | | | | | | | | | |
Initial Class | | | (176,392 | ) | | | $(1,469,717 | ) | | | (650,110 | ) | | | $(4,988,560 | ) |
Service Class | | | (215,178 | ) | | | (1,741,252 | ) | | | (586,332 | ) | | | (4,366,420 | ) |
| | | (391,570 | ) | | | $(3,210,969 | ) | | | (1,236,442 | ) | | | $(9,354,980 | ) |
| Net change | | | | | | | | | | | | | | | | |
Initial Class | | | (140,716 | ) | | | $(1,166,217 | ) | | | (466,943 | ) | | | $(3,563,500 | ) |
Service Class | | | 697,748 | | | | 5,671,138 | | | | 1,983,784 | | | | 14,978,526 | |
| | | 557,032 | | | | $4,504,921 | | | | 1,516,841 | | | | $11,415,026 | |
The fund and certain other funds managed by MFS participate in a $1.1 billion unsecured committed line of credit, subject to a $1 billion sublimit, provided by a syndication of banks under a credit agreement. Borrowings may be made for temporary financing needs. Interest is charged to each fund, based on its borrowings, generally at a rate equal to the higher of the Federal Reserve funds
16
MFS Technology Portfolio
Notes to Financial Statements (unaudited) – continued
rate or one month LIBOR plus an agreed upon spread. A commitment fee, based on the average daily, unused portion of the committed line of credit, is allocated among the participating funds at the end of each calendar quarter. In addition, the fund and other funds managed by MFS have established unsecured uncommitted borrowing arrangements with certain banks for temporary financing needs. Interest is charged to each fund, based on its borrowings, at a rate equal to the Federal Reserve funds rate plus an agreed upon spread. For the six months ended June 30, 2013, the fund’s commitment fee and interest expense were $119 and $0, respectively, and are included in “Miscellaneous” expense in the Statement of Operations.
| (7) | | Transactions in Underlying Affiliated Funds – Affiliated Issuers |
An affiliated issuer may be considered one in which the fund owns 5% or more of the outstanding voting securities, or a company which is under common control. For the purposes of this report, the fund assumes the following to be an affiliated issuer:
| | | | | | | | | | | | | | | | |
| Underlying Affiliated Fund | | Beginning Shares/Par Amount | | | Acquisitions Shares/Par Amount | | | Dispositions Shares/Par Amount | | | Ending Shares/Par Amount | |
| MFS Institutional Money Market Portfolio | | | 391,077 | | | | 7,430,186 | | | | (6,928,484 | ) | | | 892,779 | |
| | | | |
| Underlying Affiliated Fund | | Realized Gain (Loss) | | | Capital Gain
Distributions | | | Dividend Income | | | Ending Value | |
| MFS Institutional Money Market Portfolio | | | $— | | | | $— | | | | $195 | | | | $892,779 | |
17
MFS Technology Portfolio
BOARD REVIEW OF INVESTMENT ADVISORY AGREEMENT
A discussion regarding the Board’s most recent review and renewal of the fund’s Investment Advisory Agreement with MFS will be available on or about November 1, 2013 by clicking on the fund’s name under “Variable Insurance Portfolios — VIT II” in the “Products” section of the MFS Web site (mfs.com).
PROXY VOTING POLICIES AND INFORMATION
A general description of the MFS funds’ proxy voting policies and procedures is available without charge, upon request, by calling 1-800-225-2606, by visiting the Proxy Voting section of mfs.com or by visiting the SEC’s Web site at http://www.sec.gov.
Information regarding how the fund voted proxies relating to portfolio securities during the most recent twelve-month period ended June 30 is available without charge by visiting the Proxy Voting section of mfs.com or by visiting the SEC’s Web site at http://www.sec.gov.
QUARTERLY PORTFOLIO DISCLOSURE
The fund will file a complete schedule of portfolio holdings with the Securities and Exchange Commission (the Commission) for the first and third quarters of each fiscal year on Form N-Q. The fund’s Form N-Q is available on the EDGAR database on the Commission’s Internet Web site at http://www.sec.gov, and may be reviewed and copied at the:
Public Reference Room
Securities and Exchange Commission
100 F Street, NE, Room 1580
Washington, D.C. 20549
Information on the operation of the Public Reference Room may be obtained by calling the Commission at 1-800-SEC-0330. Copies of the fund’s Form N-Q also may be obtained, upon payment of a duplicating fee, by electronic request at the following e-mail address: publicinfo@sec.gov or by writing the Public Reference Section at the above address.
FURTHER INFORMATION
From time to time, MFS may post important information about the fund or the MFS funds on the MFS web site (mfs.com). This information is available by visiting the “News & Commentary” section of mfs.com or by clicking on the fund’s name under “Variable Insurance Portfolios — VIT II” in the “Products” section of mfs.com.
18
SEMIANNUAL REPORT
June 30, 2013

MFS® INTERNATIONAL VALUE PORTFOLIO
MFS® Variable Insurance Trust II

FCG-SEM
MFS® INTERNATIONAL VALUE PORTFOLIO
CONTENTS
The report is prepared for the general information of contract owners. It is authorized for distribution to prospective investors only when preceded or accompanied by a current prospectus.
NOT FDIC INSURED Ÿ MAY LOSE VALUE Ÿ NO BANK OR CREDIT UNION GUARANTEE Ÿ NOT A DEPOSIT Ÿ NOT INSURED BY ANY FEDERAL GOVERNMENT AGENCY OR NCUA/NCUSIF
MFS International Value Portfolio
LETTER FROM THE CHAIRMAN AND CEO

Dear Contract Owners:
As the year progresses, the global economy continues to grind ahead slowly, held back by broad austerity measures. The U.S. economy remains a steadying force, driven by resilient consumers, who have taken the payroll tax increase and the sequestration’s early impact in stride. With U.S. housing and jobs showing steady expansion, domestic consumer-driven growth has offset weaker exports and the U.S. government’s spending constraints. In response to these developments, the U.S. Federal Reserve has begun to brace investors for an eventual shift in its monetary policy, causing global market tremors.
Japan has been another bright spot, with government and central bank stimulus policies leading to increased exports, a resurgent stock market and improved economic sentiment. After a six-month rally, Japan’s stocks slipped late in the second quarter, then picked up momentum on fresh signs that the country could soon break free of its chronic deflation. The major deterrent to global growth remains the eurozone, still in the grip of persistent recession. China has seen its pace of economic growth decelerate, a troubling turn for the country’s trading partners, who have come to rely on it as an engine for global growth.
As always, managing risk in the face of uncertainty remains a top priority for investors. At MFS®, our uniquely collaborative investment process employs integrated, global research and active risk management. Our global team of investment professionals shares ideas and evaluates opportunities across continents, investment disciplines and asset classes — all with a goal of building better insights, and ultimately better results, for our clients.
We are mindful of the many economic challenges investors face, and believe it is more important than ever to maintain a long-term view and employ time-tested principles, such as asset allocation and diversification. We remain confident that our unique approach can serve investors well as they work with their financial advisors to identify and pursue the most suitable opportunities.
Respectfully,

Robert J. Manning
Chairman and Chief Executive Officer
MFS Investment Management®
August 16, 2013
The opinions expressed in this letter are subject to change, may not be relied upon for investment advice, and no forecasts can be guaranteed.
1
MFS International Value Portfolio
PORTFOLIO COMPOSITION
Portfolio structure (i)

| | | | |
| Top ten holdings | | | | |
| KDDI Corp. | | | 4.5% | |
| Groupe Danone | | | 3.7% | |
| GlaxoSmithKline PLC | | | 3.2% | |
| Kao Corp. | | | 3.0% | |
| Roche Holding AG | | | 2.8% | |
| Nestle S.A. | | | 2.5% | |
| Japan Tobacco, Inc. | | | 2.4% | |
| HSBC Holdings PLC | | | 2.4% | |
| Royal Dutch Shell PLC, “A” | | | 2.3% | |
| Reckitt Benckiser Group PLC | | | 2.2% | |
| |
| Equity sectors | | | | |
| Consumer Staples | | | 20.5% | |
| Financial Services | | | 18.0% | |
| Health Care | | | 11.6% | |
| Utilities & Communications | | | 9.7% | |
| Technology | | | 8.5% | |
| Special Products & Services | | | 7.3% | |
| Industrial Goods & Services | | | 4.4% | |
| Energy | | | 4.3% | |
| Leisure | | | 3.4% | |
| Basic Materials | | | 2.4% | |
| Transportation | | | 1.9% | |
| Retailing | | | 1.8% | |
| Autos & Housing | | | 1.5% | |
| | | | |
| Issuer country weightings (i)(x) | | | | |
| Japan | | | 28.6% | |
| United Kingdom | | | 24.9% | |
| Switzerland | | | 12.1% | |
| Germany | | | 8.3% | |
| France | | | 6.1% | |
| United States | | | 4.7% | |
| Netherlands | | | 3.8% | |
| Sweden | | | 1.8% | |
| Spain | | | 1.7% | |
| Other Countries | | | 8.0% | |
| |
| Currency exposure weightings (i)(y) | | | | |
| British Pound Sterling | | | 24.9% | |
| Japanese Yen | | | 24.4% | |
| Euro | | | 23.3% | |
| Swiss Franc | | | 12.1% | |
| United States Dollar | | | 7.8% | |
| Swedish Krona | | | 1.8% | |
| Taiwan Dollar | | | 1.4% | |
| Danish Krone | | | 1.3% | |
| Norwegian Krone | | | 1.1% | |
| Other Currencies | | | 1.9% | |
| (i) | For purposes of this presentation, the components include the market value of securities, less any securities sold short, and reflect the impact of the equivalent exposure of derivative positions. These amounts may be negative from time to time. Equivalent exposure is a calculated amount that translates the derivative position into a reasonable approximation of the amount of the underlying asset that the portfolio would have to hold at a given point in time to have the same price sensitivity that results from the portfolio’s ownership of the derivative contract. When dealing with derivatives, equivalent exposure is a more representative measure of the potential impact of a position on portfolio performance than market value. |
| (x) | Represents the portfolio’s exposure to issuer countries as a percentage of a portfolio’s net assets. |
| (y) | Represents the portfolio’s exposure to a particular currency as a percentage of a portfolio’s net assets. |
Percentages are based on net assets as of 6/30/13.
The portfolio is actively managed and current holdings may be different.
2
MFS International Value Portfolio
EXPENSE TABLE
Fund Expenses Borne by the Contract Holders During the Period,
January 1, 2013 through June 30, 2013
As a contract holder of the fund, you incur ongoing costs, including management fees; distribution and/or service (12b-1) fees; and other fund expenses. This example is intended to help you understand your ongoing costs (in dollars) of investing in the fund and to compare these costs with the ongoing costs of investing in other mutual funds.
The example is based on an investment of $1,000 invested at the beginning of the period and held for the entire period January 1, 2013 through June 30, 2013.
Actual Expenses
The first line for each share class in the following table provides information about actual account values and actual expenses. You may use the information in this line, together with the amount you invested, to estimate the expenses that you paid over the period. Simply divide your account value by $1,000 (for example, an $8,600 account value divided by $1,000 = 8.6), then multiply the result by the number in the first line under the heading entitled “Expenses Paid During Period” to estimate the expenses you paid on your account during this period.
Hypothetical Example for Comparison Purposes
The second line for each share class in the following table provides information about hypothetical account values and hypothetical expenses based on the fund’s actual expense ratio and an assumed rate of return of 5% per year before expenses, which is not the fund’s actual return. The hypothetical account values and expenses may not be used to estimate the actual ending account balance or expenses you paid for the period. You may use this information to compare the ongoing costs of investing in the fund and other funds. To do so, compare this 5% hypothetical example with the 5% hypothetical examples that appear in the shareholder reports of the other funds.
Please note that the expenses shown in the table are meant to highlight the fund’s ongoing costs only and do not take into account the fees and expenses imposed under the variable contracts through which your investment in the fund is made. Therefore, the second line for each share class in the table is useful in comparing ongoing costs associated with an investment in vehicles (such as the fund) which fund benefits under variable annuity and variable life insurance contracts and to qualified pension and retirement plans only, and will not help you determine the relative total costs of investing in the fund through variable annuity and variable life insurance contracts. If the fees and expenses imposed under the variable contracts were included, your costs would have been higher.
| | | | | | | | | | | | | | | | | | |
| Share Class | | | | Annualized
Expense Ratio | | | Beginning
Account Value
1/01/13 | | | Ending Account Value
6/30/13 | | | Expenses Paid
During Period (p)
1/01/13-6/30/13 | |
| Initial Class | | Actual | | | 0.96% | | | | $1,000.00 | | | | $1,125.65 | | | | $5.06 | |
| | Hypothetical (h) | | | 0.96% | | | | $1,000.00 | | | | $1,020.03 | | | | $4.81 | |
| Service Class | | Actual | | | 1.20% | | | | $1,000.00 | | | | $1,124.85 | | | | $6.32 | |
| | Hypothetical (h) | | | 1.20% | | | | $1,000.00 | | | | $1,018.84 | | | | $6.01 | |
| (h) | 5% class return per year before expenses. |
| (p) | Expenses paid are equal to each class’s annualized expense ratio, as shown above, multiplied by the average account value over the period, multiplied by the number of days in the period, divided by the number of days in the year. |
3
MFS International Value Portfolio
PORTFOLIO OF INVESTMENTS – 6/30/13 (unaudited)
The Portfolio of Investments is a complete list of all securities owned by your fund. It is categorized by broad-based asset classes.
| | | | | | | | |
| Issuer | | Shares/Par | | | Value ($) | |
| | | | | | | | |
| COMMON STOCKS – 95.3% | | | | | | | | |
| Aerospace – 1.0% | | | | | | | | |
| Cobham PLC | | | 2,304,857 | | | $ | 9,212,672 | |
| | | | | | | | |
| Alcoholic Beverages – 2.0% | | | | | | | | |
| Heineken N.V. | | | 281,406 | | | $ | 17,889,667 | |
| | | | | | | | |
| Automotive – 0.8% | | | | | | | | |
| USS Co. Ltd. | | | 52,650 | | | $ | 6,683,439 | |
| | | | | | | | |
| Broadcasting – 1.8% | | | | | | | | |
| Fuji Television Network, Inc. | | | 4,150 | | | $ | 8,384,189 | |
| Nippon Television Holdings, Inc. | | | 420,800 | | | | 7,696,423 | |
| | | | | | | | |
| | | | | | $ | 16,080,612 | |
| | | | | | | | |
| Brokerage & Asset Managers – 1.5% | | | | | | | | |
| Computershare Ltd. | | | 488,497 | | | $ | 4,558,721 | |
| Daiwa Securities Group, Inc. | | | 759,000 | | | | 6,374,743 | |
| IG Group Holdings PLC | | | 316,429 | | | | 2,799,716 | |
| | | | | | | | |
| | | | | | $ | 13,733,180 | |
| | | | | | | | |
| Business Services – 7.3% | | | | | | | | |
| Amadeus IT Holding S.A. | | | 474,872 | | | $ | 15,177,860 | |
| Brenntag AG | | | 40,571 | | | | 6,162,836 | |
| Bunzl PLC | | | 623,327 | | | | 12,166,189 | |
| Compass Group PLC | | | 1,420,525 | | | | 18,204,872 | |
| Nomura Research, Inc. | | | 397,700 | | | | 12,979,387 | |
| | | | | | | | |
| | | | | | $ | 64,691,144 | |
| | | | | | | | |
| Chemicals – 1.2% | | | | | | | | |
| Givaudan S.A. | | | 8,570 | | | $ | 11,060,113 | |
| | | | | | | | |
| Computer Software – 0.8% | | | | | | | | |
| OBIC Co. Ltd. | | | 25,830 | | | $ | 6,758,303 | |
| | | | | | | | |
| Computer Software – Systems – 1.9% | |
| Canon, Inc. | | | 315,900 | | | $ | 10,375,324 | |
| Nintendo Co. Ltd. | | | 36,900 | | | | 4,352,995 | |
| Venture Corp. Ltd. | | | 438,000 | | | | 2,504,499 | |
| | | | | | | | |
| | | | | | $ | 17,232,818 | |
| | | | | | | | |
| Construction – 0.7% | | | | | | | | |
| Geberit AG | | | 25,797 | | | $ | 6,386,798 | |
| | | | | | | | |
| Consumer Products – 7.7% | | | | | | | | |
| Henkel KGaA, IPS | | | 203,680 | | | $ | 19,112,566 | |
| Kao Corp. | | | 779,400 | | | | 26,522,232 | |
| KOSE Corp. | | | 131,400 | | | | 3,645,491 | |
| Reckitt Benckiser Group PLC | | | 277,277 | | | | 19,656,142 | |
| | | | | | | | |
| | | | | | $ | 68,936,431 | |
| | | | | | | | |
| Containers – 0.4% | | | | | | | | |
| Brambles Ltd. | | | 408,703 | | | $ | 3,478,244 | |
| | | | | | | | |
| Electrical Equipment – 1.7% | | | | | | | | |
| Legrand S.A. | | | 230,553 | | | $ | 10,654,678 | |
| Spectris PLC | | | 157,359 | | | | 4,558,876 | |
| | | | | | | | |
| | | | | | $ | 15,213,554 | |
| | | | | | | | |
| Electronics – 3.1% | | | | | | | | |
| ASM International N.V. | | | 72,556 | | | $ | 2,438,410 | |
| | | | | | | | |
| Issuer | | Shares/Par | | | Value ($) | |
| | | | | | | | |
| COMMON STOCKS – continued | | | | | |
| Electronics – continued | | | | | | | | |
| Halma PLC | | | 781,938 | | | $ | 6,006,264 | |
| Hirose Electric Co. Ltd. | | | 51,700 | | | | 6,818,270 | |
| Taiwan Semiconductor Manufacturing Co. Ltd., ADR | | | 668,207 | | | | 12,241,552 | |
| | | | | | | | |
| | | | | | $ | 27,504,496 | |
| | | | | | | | |
| Energy – Independent – 0.5% | | | | | | | | |
| Cairn Energy PLC (a) | | | 1,140,486 | | | $ | 4,373,890 | |
| | | | | | | | |
| Energy – Integrated – 3.8% | | | | | | | | |
| BP PLC | | | 1,983,312 | | | $ | 13,758,581 | |
| Royal Dutch Shell PLC, “A” | | | 638,452 | | | | 20,373,766 | |
| | | | | | | | |
| | | | | | $ | 34,132,347 | |
| | | | | | | | |
| Food & Beverages – 6.4% | | | | | | | | |
| Groupe Danone | | | 435,054 | | | $ | 32,652,155 | |
| ITO EN Ltd. | | | 98,200 | | | | 2,273,313 | |
| Nestle S.A. | | | 340,413 | | | | 22,265,197 | |
| | | | | | | | |
| | | | | | $ | 57,190,665 | |
| | | | | | | | |
| Food & Drug Stores – 1.3% | | | | | | | | |
| Lawson, Inc. | | | 147,100 | | | $ | 11,227,536 | |
| | | | | | | | |
| Insurance – 6.5% | | | | | | | | |
| Amlin PLC | | | 420,634 | | | $ | 2,522,544 | |
| Catlin Group Ltd. | | | 428,905 | | | | 3,256,496 | |
| Delta Lloyd N.V. | | | 262,680 | | | | 5,233,160 | |
| Euler Hermes | | | 29,909 | | | | 3,015,209 | |
| Hiscox Ltd. | | | 671,314 | | | | 5,831,370 | |
| ING Groep N.V. (a) | | | 801,790 | | | | 7,326,514 | |
| Jardine Lloyd Thompson Group PLC | | | 281,105 | | | | 3,896,525 | |
| Sony Financial Holdings, Inc. | | | 432,700 | | | | 6,836,468 | |
| Swiss Re Ltd. | | | 130,765 | | | | 9,686,613 | |
| Zurich Insurance Group AG | | | 41,022 | | | | 10,631,207 | |
| | | | | | | | |
| | | | | | $ | 58,236,106 | |
| | | | | | | | |
| Leisure & Toys – 0.3% | | | | | | | | |
| Sankyo Co. Ltd. | | | 53,100 | | | $ | 2,508,303 | |
| | | | | | | | |
| Machinery & Tools – 1.7% | | | | | | | | |
| Glory Ltd. | | | 139,000 | | | $ | 3,259,871 | |
| Neopost S.A. | | | 119,607 | | | | 7,906,650 | |
| Schindler Holding AG | | | 26,255 | | | | 3,651,808 | |
| | | | | | | | |
| | | | | | $ | 14,818,329 | |
| | | | | | | | |
| Major Banks – 3.7% | | | | | | | | |
| Bank of Ireland | | | 7,906,770 | | | $ | 1,615,819 | |
| HSBC Holdings PLC | | | 2,057,032 | | | | 21,337,338 | |
| Sumitomo Mitsui Financial Group, Inc. | | | 224,000 | | | | 10,276,265 | |
| | | | | | | | |
| | | | | | $ | 33,229,422 | |
| | | | | | | | |
| Medical & Health Technology & Services – 0.7% | |
| Kobayashi Pharmaceutical Co. Ltd. | | | 116,600 | | | $ | 6,159,672 | |
| | | | | | | | |
| Medical Equipment – 0.5% | | | | | | | | |
| Nihon Kohden Corp. | | | 108,500 | | | $ | 4,146,148 | |
| | | | | | | | |
4
MFS International Value Portfolio
Portfolio of Investments (unaudited) – continued
| | | | | | | | |
| Issuer | | Shares/Par | | | Value ($) | |
| | | | | | | | |
| COMMON STOCKS – continued | | | | | |
| Network & Telecom – 2.7% | | | | | | | | |
| Ericsson, Inc., “B” | | | 1,426,327 | | | $ | 16,153,880 | |
| Nokia Oyj (a)(l) | | | 2,110,717 | | | | 7,862,089 | |
| | | | | | | | |
| | | | | | $ | 24,015,969 | |
| | | | | | | | |
| Other Banks & Diversified Financials – 4.1% | |
| Chiba Bank Ltd. | | | 474,000 | | | $ | 3,230,732 | |
| DnB NOR A.S.A. | | | 688,991 | | | | 9,953,666 | |
| Hachijuni Bank Ltd. | | | 465,000 | | | | 2,727,766 | |
| Joyo Bank Ltd. | | | 668,000 | | | | 3,657,229 | |
| Julius Baer Group Ltd. | | | 112,271 | | | | 4,362,782 | |
| Jyske Bank A.S. (a) | | | 46,413 | | | | 1,746,912 | |
| North Pacific Bank Ltd. | | | 696,200 | | | | 2,562,140 | |
| Sydbank A.S. (a) | | | 75,632 | | | | 1,502,208 | |
| UniCredit S.p.A. | | | 1,319,667 | | | | 6,180,442 | |
| Unione di Banche Italiane S.c.p.A. | | | 248,357 | | | | 899,348 | |
| | | | | | | | |
| | | | | | $ | 36,823,225 | |
| | | | | | | | |
| Pharmaceuticals – 10.4% | | | | | | | | |
| Bayer AG | | | 169,803 | | | $ | 18,108,495 | |
| GlaxoSmithKline PLC | | | 1,127,457 | | | | 28,205,392 | |
| Novartis AG | | | 209,140 | | | | 14,821,628 | |
| Roche Holding AG | | | 100,787 | | | | 24,973,443 | |
| Santen Pharmaceutical Co. Ltd. | | | 147,500 | | | | 6,350,323 | |
| | | | | | | | |
| | | | | | $ | 92,459,281 | |
| | | | | | | | |
| Printing & Publishing – 1.3% | | | | | | | | |
| Pearson PLC | | | 494,040 | | | $ | 8,772,032 | |
| United Business Media Ltd. | | | 241,351 | | | | 2,415,431 | |
| | | | | | | | |
| | | | | | $ | 11,187,463 | |
| | | | | | | | |
| Real Estate – 2.2% | | | | | | | | |
| Deutsche Wohnen AG | | | 480,519 | | | $ | 8,159,221 | |
| GSW Immobilien AG (l) | | | 170,934 | | | | 6,589,704 | |
| TAG Immobilien AG | | | 435,860 | | | | 4,743,363 | |
| | | | | | | | |
| | | | | | $ | 19,492,288 | |
| | | | | | | | |
| Specialty Chemicals – 0.8% | | | | | | | | |
| Symrise AG | | | 166,205 | | | $ | 6,710,664 | |
| | | | | | | | |
| Specialty Stores – 0.5% | | | | | | | | |
| Esprit Holdings Ltd. | | | 2,951,958 | | | $ | 4,382,224 | |
| | | | | | | | |
| Telecommunications – Wireless – 7.5% | |
| KDDI Corp. | | | 775,400 | | | $ | 40,341,440 | |
| NTT DoCoMo, Inc. | | | 6,350 | | | | 9,866,253 | |
| Vodafone Group PLC | | | 5,769,330 | | | | 16,556,353 | |
| | | | | | | | |
| | | | | | $ | 66,764,046 | |
| | | | | | | | |
| Telephone Services – 2.2% | | | | | | | | |
| China Unicom (Hong Kong) Ltd. | | | 1,484,000 | | | $ | 1,953,616 | |
| Deutsche Telekom AG | | | 368,900 | | | | 4,304,320 | |
| Royal KPN N.V. | | | 290,173 | | | | 600,133 | |
| TDC A.S. | | | 989,947 | | | | 8,008,734 | |
| Telecom Italia S.p.A. | | | 8,712,412 | | | | 4,814,283 | |
| | | | | | | | |
| | | | | | $ | 19,681,086 | |
| | | | | | | | |
| Tobacco – 4.4% | | | | | | | | |
| British American Tobacco PLC | | | 340,808 | | | $ | 17,501,649 | |
| Japan Tobacco, Inc. | | | 614,200 | | | | 21,705,697 | |
| | | | | | | | |
| | | | | | $ | 39,207,346 | |
| | | | | | | | |
| | | | | | | | |
| Issuer | | Shares/Par | | | Value ($) | |
| | | | | | | | |
| COMMON STOCKS – continued | |
| Trucking – 1.9% | | | | | | | | |
| Yamato Holdings Co. Ltd. | | | 809,500 | | | $ | 17,066,591 | |
| | | | | | | | |
Total Common Stocks
(Identified Cost, $726,951,511) | | | $ | 848,674,072 | |
| | | | | | | | |
| Issuer/Expiration Date/Strike Price | | Par Amount
of Contracts | | | | |
|
| PUT OPTIONS PURCHASED – 0.3% | |
JPY Currency – June 2014
@ EUR 0.0071 | | JPY | 960,031,205 | | | $ | 187,206 | |
| JPY Currency – January 2014 @ $0.0102 | | JPY | 646,022,802 | | | | 292,002 | |
| JPY Currency – December 2013 @ $0.0106 | | JPY | 973,680,094 | | | | 730,260 | |
| JPY Currency – April 2014 @ $0.0098 | | JPY | 4,947,981,165 | | | | 1,553,666 | |
| | | | | | | | |
Total Put Options Purchased (Premiums Paid $1,213,792) | | | $ | 2,763,134 | |
| | | | | | | | |
|
| CALL OPTIONS PURCHASED – 0.1% | |
EUR Currency – December 2013
@ JPY 124.50
(Premiums Paid, $176,799) | | EUR | 8,144,843 | | | $ | 665,393 | |
| | | | | | | | |
| Issuer | | Shares/Par | | | | |
|
| MONEY MARKET FUNDS – 4.1% | |
MFS Institutional Money Market Portfolio, 0.11%, at Cost and Net
Asset Value (v) | | | 36,133,474 | | | $ | 36,133,474 | |
| | | | | | | | |
|
| COLLATERAL FOR SECURITIES LOANED – 0.0% | |
Navigator Securities Lending Prime Portfolio, 0.17%, at Cost and Net
Asset Value (j) | | | 315,572 | | | $ | 315,572 | |
| | | | | | | | |
Total Investments (Identified Cost, $764,791,148) | | | $ | 888,551,645 | |
| | | | | | | | |
OTHER ASSETS, LESS
LIABILITIES – 0.2% | | | | 1,781,252 | |
| | | | | | | | |
| Net Assets – 100.0% | | | $ | 890,332,897 | |
| | | | | | | | |
| (a) | | Non-income producing security. |
| (j) | | The rate quoted is the annualized seven-day yield of the fund at period end. |
| (l) | | A portion of this security is on loan. |
| (v) | | Underlying affiliated fund that is available only to investment companies managed by MFS. The rate quoted for the MFS Institutional Money Market Portfolio is the annualized seven-day yield of the fund at period end. |
The following abbreviations are used in this report and are defined:
| ADR | | American Depositary Receipt |
| IPS | | International Preference Stock |
| PLC | | Public Limited Company |
Abbreviations indicate amounts shown in currencies other than the U.S. dollar. All amounts are stated in U.S. dollars unless otherwise indicated. A list of abbreviations is shown below:
See Notes to Financial Statements
5
MFS International Value Portfolio
FINANCIAL STATEMENTS | STATEMENT OF ASSETS AND LIABILITIES (unaudited)
This statement represents your fund’s balance sheet, which details the assets and liabilities comprising the total value of the fund.
| | | | | | | | |
At 6/30/13 | | | | | | | | |
Assets | | | | | | | | |
Investments – | | | | | | | | |
Non-affiliated issuers, at value (identified cost, $728,657,674) | | | $852,418,171 | | | | | |
Underlying affiliated funds, at cost and value | | | 36,133,474 | | | | | |
Total investments, at value, including $291,581 of securities on loan (identified cost, $764,791,148) | | | $888,551,645 | | | | | |
Foreign currency, at value (identified cost, $498,656) | | | 493,815 | | | | | |
Receivables for | | | | | | | | |
Fund shares sold | | | 1,034,247 | | | | | |
Interest and dividends | | | 2,855,146 | | | | | |
Other assets | | | 3,155 | | | | | |
Total assets | | | | | | | $892,938,008 | |
Liabilities | | | | | | | | |
Payable for fund shares reacquired | | | $2,123,860 | | | | | |
Collateral for securities loaned, at value | | | 315,572 | | | | | |
Payable to affiliates | | | | | | | | |
Investment adviser | | | 88,347 | | | | | |
Shareholder servicing costs | | | 389 | | | | | |
Distribution and/or service fees | | | 18,848 | | | | | |
Payable for independent Trustees’ compensation | | | 2,686 | | | | | |
Accrued expenses and other liabilities | | | 55,409 | | | | | |
Total liabilities | | | | | | | $2,605,111 | |
Net assets | | | | | | | $890,332,897 | |
Net assets consist of | | | | | | | | |
Paid-in capital | | | $753,471,180 | | | | | |
Unrealized appreciation (depreciation) on investments and translation of assets and liabilities in foreign currencies | | | 123,697,257 | | | | | |
Accumulated net realized gain (loss) on investments and foreign currency | | | (12,360,910 | ) | | | | |
Undistributed net investment income | | | 25,525,370 | | | | | |
Net assets | | | | | | | $890,332,897 | |
Shares of beneficial interest outstanding | | | | | | | 46,052,015 | |
| | | | | | | | | | | | |
| | | Net assets | | | Shares outstanding | | | Net asset value per share | |
Initial Class | | | $198,514,208 | | | | 10,165,672 | | | | $19.53 | |
Service Class | | | 691,818,689 | | | | 35,886,343 | | | | 19.28 | |
See Notes to Financial Statements
6
MFS International Value Portfolio
FINANCIAL STATEMENTS | STATEMENT OF OPERATIONS (unaudited)
This statement describes how much your fund earned in investment income and accrued in expenses. It also describes any gains and/or losses generated by fund operations.
| | | | | | | | |
Six months ended 6/30/13 | | | | | | | | |
Net investment income | | | | | | | | |
Income | | | | | | | | |
Dividends | | | $18,200,280 | | | | | |
Interest | | | 246,336 | | | | | |
Dividends from underlying affiliated funds | | | 23,268 | | | | | |
Foreign taxes withheld | | | (1,296,263 | ) | | | | |
Total investment income | | | | | | | $17,173,621 | |
Expenses | | | | | | | | |
Management fee | | | $3,683,284 | | | | | |
Distribution and/or service fees | | | 781,289 | | | | | |
Shareholder servicing costs | | | 19,470 | | | | | |
Administrative services fee | | | 56,526 | | | | | |
Independent Trustees’ compensation | | | 8,800 | | | | | |
Custodian fee | | | 85,285 | | | | | |
Shareholder communications | | | 10,899 | | | | | |
Audit and tax fees | | | 27,610 | | | | | |
Legal fees | | | 6,132 | | | | | |
Miscellaneous | | | 17,682 | | | | | |
Total expenses | | | | | | | $4,696,977 | |
Fees paid indirectly | | | (9 | ) | | | | |
Reduction of expenses by investment adviser | | | (2,706 | ) | | | | |
Net expenses | | | | | | | $4,694,262 | |
Net investment income | | | | | | | $12,479,359 | |
Realized and unrealized gain (loss) on investments and foreign currency | | | | | | | | |
Realized gain (loss) (identified cost basis) | | | | | | | | |
Investments | | | $10,271,528 | | | | | |
Foreign currency | | | (416,796 | ) | | | | |
Net realized gain (loss) on investments and foreign currency | | | | | | | $9,854,732 | |
Change in unrealized appreciation (depreciation) | | | | | | | | |
Investments | | | $70,188,252 | | | | | |
Translation of assets and liabilities in foreign currencies | | | (65,150 | ) | | | | |
Net unrealized gain (loss) on investments and foreign currency translation | | | | | | | $70,123,102 | |
Net realized and unrealized gain (loss) on investments and foreign currency | | | | | | | $79,977,834 | |
Change in net assets from operations | | | | | | | $92,457,193 | |
See Notes to Financial Statements
7
MFS International Value Portfolio
FINANCIAL STATEMENTS | STATEMENTS OF CHANGES IN NET ASSETS
These statements describe the increases and/or decreases in net assets resulting from operations, any distributions, and any shareholder transactions.
| | | | | | | | |
| |
| Six months ended
6/30/13
(unaudited |
) | |
| Year ended
12/31/12 |
|
Change in net assets | | | | | | | | |
| From operations | | | | | | | | |
Net investment income | | | $12,479,359 | | | | $12,893,870 | |
Net realized gain (loss) on investments and foreign currency | | | 9,854,732 | | | | 2,459,804 | |
Net unrealized gain (loss) on investments and foreign currency translation | | | 70,123,102 | | | | 66,691,549 | |
Change in net assets from operations | | | $92,457,193 | | | | $82,045,223 | |
| Distributions declared to shareholders | | | | | | | | |
From net investment income | | | $— | | | | $(7,900,234 | ) |
Change in net assets from fund share transactions | | | $74,067,326 | | | | $207,562,600 | |
Total change in net assets | | | $166,524,519 | | | | $281,707,589 | |
| Net assets | | | | | | | | |
At beginning of period | | | 723,808,378 | | | | 442,100,789 | |
At end of period (including undistributed net investment income of $25,525,370 and
$13,046,011, respectively) | | | $890,332,897 | | | | $723,808,378 | |
See Notes to Financial Statements
8
MFS International Value Portfolio
FINANCIAL STATEMENTS | FINANCIAL HIGHLIGHTS
The financial highlights table is intended to help you understand the fund’s financial performance for the semiannual period and the past 5 fiscal years. Certain information reflects financial results for a single fund share. The total returns in the table represent the rate by which an investor would have earned (or lost) on an investment in the fund share class (assuming reinvestment of all distributions) held for the entire period.
| | | | | | | | | | | | | | | | | | | | | | | | |
| Initial Class | | Six months ended 6/30/13 | | | Years ended 12/31 | |
| | | | 2012 | | | 2011 | | | 2010 | | | 2009 | | | 2008 | |
| | | (unaudited) | | | | | | | | | | | | | | | | |
Net asset value, beginning of period | | | $17.34 | | | | $15.16 | | | | $15.59 | | | | $14.51 | | | | $12.03 | | | | $18.68 | |
| Income (loss) from investment operations | | | | | | | | | | | | | | | | | | | | | | | | |
Net investment income (d) | | | $0.30 | | | | $0.38 | | | | $0.36 | | | | $0.26 | | | | $0.25 | | | | $0.44 | |
Net realized and unrealized gain (loss) on investments
and foreign currency | | | 1.89 | | | | 2.05 | | | | (0.59 | ) | | | 1.05 | | | | 2.64 | | | | (5.94 | ) |
Total from investment operations | | | $2.19 | | | | $2.43 | | | | $(0.23 | ) | | | $1.31 | | | | $2.89 | | | | $(5.50 | ) |
| Less distributions declared to shareholders | | | | | | | | | | | | | | | | | | | | | | | | |
From net investment income | | | $— | | | | $(0.25 | ) | | | $(0.20 | ) | | | $(0.23 | ) | | | $(0.41 | ) | | | $(0.16 | ) |
From net realized gain on investments | | | — | | | | — | | | | — | | | | — | | | | — | | | | (0.99 | ) |
Total distributions declared to shareholders | | | $— | | | | $(0.25 | ) | | | $(0.20 | ) | | | $(0.23 | ) | | | $(0.41 | ) | | | $(1.15 | ) |
Net asset value, end of period (x) | | | $19.53 | | | | $17.34 | | | | $15.16 | | | | $15.59 | | | | $14.51 | | | | $12.03 | |
Total return (%) (k)(r)(s)(x) | | | 12.63 | (n) | | | 16.16 | | | | (1.52 | ) | | | 9.11 | | | | 25.37 | | | | (31.41 | ) |
Ratios (%) (to average net assets)
and Supplemental data: | | | | | | | | | | | | | | | | | | | | | | | | |
Expenses before expense reductions (f) | | | 0.96 | (a) | | | 0.98 | | | | 1.01 | | | | 1.06 | | | | 1.09 | | | | 1.05 | |
Expenses after expense reductions (f) | | | 0.96 | (a) | | | 0.98 | | | | N/A | | | | N/A | | | | N/A | | | | N/A | |
Net investment income | | | 3.21 | (a) | | | 2.33 | | | | 2.28 | | | | 1.79 | | | | 2.00 | | | | 2.82 | |
Portfolio turnover | | | 5 | (n) | | | 16 | | | | 16 | | | | 28 | | | | 49 | | | | 44 | |
Net assets at end of period (000 omitted) | | | $198,514 | | | | $182,382 | | | | $60,532 | | | | $68,356 | | | | $63,978 | | | | $57,968 | |
| | |
| Service Class | | Six months
ended
6/30/13 (unaudited) | | | Years ended 12/31 | |
| | | | 2012 | | | 2011 | | | 2010 | | | 2009 | | | 2008 | |
| | | | | | | | | | | | | | | | | | | |
Net asset value, beginning of period | | | $17.14 | | | | $14.99 | | | | $15.43 | | | | $14.38 | | | | $11.91 | | | | $18.53 | |
| Income (loss) from investment operations | | | | | | | | | | | | | | | | | | | | | | | | |
Net investment income (d) | | | $0.28 | | | | $0.38 | | | | $0.31 | | | | $0.20 | | | | $0.23 | | | | $0.39 | |
Net realized and unrealized gain (loss) on investments
and foreign currency | | | 1.86 | | | | 2.00 | | | | (0.58 | ) | | | 1.05 | | | | 2.62 | | | | (5.87 | ) |
Total from investment operations | | | $2.14 | | | | $2.38 | | | | $(0.27 | ) | | | $1.25 | | | | $2.85 | | | | $(5.48 | ) |
| Less distributions declared to shareholders | | | | | | | | | | | | | | | | | | | | | | | | |
From net investment income | | | $— | | | | $(0.23 | ) | | | $(0.17 | ) | | | $(0.20 | ) | | | $(0.38 | ) | | | $(0.15 | ) |
From net realized gain on investments | | | — | | | | — | | | | — | | | | — | | | | — | | | | (0.99 | ) |
Total distributions declared to shareholders | | | $— | | | | $(0.23 | ) | | | $(0.17 | ) | | | $(0.20 | ) | | | $(0.38 | ) | | | $(1.14 | ) |
Net asset value, end of period (x) | | | $19.28 | | | | $17.14 | | | | $14.99 | | | | $15.43 | | | | $14.38 | | | | $11.91 | |
Total return (%) (k)(r)(s)(x) | | | 12.49 | (n) | | | 15.93 | | | | (1.78 | ) | | | 8.78 | | | | 25.11 | | | | (31.58 | ) |
Ratios (%) (to average net assets)
and Supplemental data: | | | | | | | | | | | | | | | | | | | | | | | | |
Expenses before expense reductions (f) | | | 1.21 | (a) | | | 1.23 | | | | 1.26 | | | | 1.31 | | | | 1.34 | | | | 1.30 | |
Expenses after expense reductions (f) | | | 1.20 | (a) | | | 1.23 | | | | N/A | | | | N/A | | | | N/A | | | | N/A | |
Net investment income | | | 3.00 | (a) | | | 2.35 | | | | 1.98 | | | | 1.43 | | | | 1.83 | | | | 2.52 | |
Portfolio turnover | | | 5 | (n) | | | 16 | | | | 16 | | | | 28 | | | | 49 | | | | 44 | |
Net assets at end of period (000 omitted) | | | $691,819 | | | | $541,427 | | | | $381,569 | | | | $325,202 | | | | $206,006 | | | | $179,067 | |
See Notes to Financial Statements
9
MFS International Value Portfolio
Financial Highlights – continued
| (d) | Per share data is based on average shares outstanding. |
| (f) | Ratios do not reflect reductions from fees paid indirectly, if applicable. |
| (k) | The total return does not reflect expenses that apply to separate accounts. Inclusion of these charges would reduce the total return figures for all periods shown. |
| (r) | Certain expenses have been reduced without which performance would have been lower. |
| (s) | From time to time the fund may receive proceeds from litigation settlements, without which performance would be lower. |
| (x) | The net asset values per share and total returns have been calculated on net assets which include adjustments made in accordance with U.S. generally accepted accounting principles required at period end for financial reporting purposes. |
See Notes to Financial Statements
10
MFS International Value Portfolio
NOTES TO FINANCIAL STATEMENTS (unaudited)
| (1) | | Business and Organization |
MFS International Value Portfolio (the fund) is a series of MFS Variable Insurance Trust II (the trust). The trust is organized as a Massachusetts business trust and is registered under the Investment Company Act of 1940, as amended, as an open-end management investment company. The shareholders of each series of the trust are separate accounts of insurance companies, which offer variable annuity and/or life insurance products, and qualified retirement and pension plans.
| (2) | | Significant Accounting Policies |
General – The preparation of financial statements in conformity with U.S. generally accepted accounting principles requires management to make estimates and assumptions that affect the reported amounts of assets and liabilities, and disclosure of contingent assets and liabilities at the date of the financial statements and the reported amounts of revenues and expenses during the reporting period. Actual results could differ from those estimates. In the preparation of these financial statements, management has evaluated subsequent events occurring after the date of the fund’s Statement of Assets and Liabilities through the date that the financial statements were issued. The fund invests in foreign securities. Investments in foreign securities are vulnerable to the effects of changes in the relative values of the local currency and the U.S. dollar and to the effects of changes in each country’s legal, political, and economic environment.
In this reporting period, the fund adopted the disclosure provisions of the Financial Accounting Standards Board (FASB) Accounting Standards Update 2011-11 (“ASU 2011-11”), Balance Sheet (Topic 210) – Disclosures about Offsetting Assets and Liabilities along with the related scope clarification provisions of FASB Accounting Standards Update 2013-01 (“ASU 2013-01”) entitled Balance Sheet (Topic 210) – Clarifying the Scope of Disclosures about Offsetting Assets and Liabilities. ASU 2011-11 is intended to enhance disclosures on the offsetting of financial assets and liabilities by requiring entities to disclose both gross and net information about financial instruments and transactions that are either offset in the statement of financial position or subject to a Master Netting Agreement or similar arrangement. ASU 2013-01 limits the scope of ASU 2011-11’s disclosure requirements on offsetting to financial assets and financial liabilities related to derivatives, repurchase and reverse repurchase agreements, and securities lending and securities borrowing transactions. The disclosures required by ASU 2011-11, to the extent applicable to the fund, have been included in the fund’s Significant Accounting Policies note under the captions for each of the fund’s in-scope financial instruments and transactions.
In June 2013, FASB issued Accounting Standards Update 2013-08 Financial Services – Investment Companies (Topic 946) – Amendments to the Scope, Measurement, and Disclosure Requirements (“ASU 2013-08”) which is effective for interim and annual reporting periods in fiscal years that begin after December 15, 2013. ASU 2013-08 sets forth an approach for determining whether an entity should be characterized as an investment company and prescribes fair value accounting for an investment company’s non-controlling ownership interest in another investment company. FASB has determined that a fund registered under the Investment Company Act of 1940 automatically meets ASU 2013-08’s criteria for an investment company. Although still evaluating the potential impacts of ASU 2013-08 to the fund, management expects that the impact of the fund’s adoption will be limited to additional financial statement disclosures.
Investment Valuations – Equity securities, including restricted equity securities, are generally valued at the last sale or official closing price as provided by a third-party pricing service on the market or exchange on which they are primarily traded. Equity securities, for which there were no sales reported that day, are generally valued at the last quoted daily bid quotation as provided by a third-party pricing service on the market or exchange on which such securities are primarily traded. Short-term instruments with a maturity at issuance of 60 days or less generally are valued at amortized cost, which approximates market value. Exchange-traded options are generally valued at the last sale or official closing price as provided by a third-party pricing service on the exchange on which such options are primarily traded. Exchange-traded options for which there were no sales reported that day are generally valued at the last daily bid quotation as provided by a third-party pricing service on the exchange on which such options are primarily traded. Options not traded on an exchange are generally valued at a broker/dealer bid quotation. Foreign currency options are generally valued at valuations provided by a third-party pricing service. Open-end investment companies are generally valued at net asset value per share. Securities and other assets generally valued on the basis of information from a third-party pricing service may also be valued at a broker/dealer bid quotation. Values obtained from third-party pricing services can utilize both transaction data and market information such as yield, quality, coupon rate, maturity, type of issue, trading characteristics, and other market data. The values of foreign securities and other assets and liabilities expressed in foreign currencies are converted to U.S. dollars using the mean of bid and asked prices for rates provided by a third-party pricing service.
The Board of Trustees has delegated primary responsibility for determining or causing to be determined the value of the fund’s investments (including any fair valuation) to the adviser pursuant to valuation policies and procedures approved by the Board. If the adviser determines that reliable market quotations are not readily available, investments are valued at fair value as determined in good faith by the adviser in accordance with such procedures under the oversight of the Board of Trustees. Under the fund’s valuation policies and procedures, market quotations are not considered to be readily available for most types of debt instruments and floating rate loans and many types of derivatives. These investments are generally valued at fair value based on information from third-party pricing services. In addition, investments may be valued at fair value if the adviser determines that an investment’s value
11
MFS International Value Portfolio
Notes to Financial Statements (unaudited) – continued
has been materially affected by events occurring after the close of the exchange or market on which the investment is principally traded (such as foreign exchange or market) and prior to the determination of the fund’s net asset value, or after the halting of trading of a specific security where trading does not resume prior to the close of the exchange or market on which the security is principally traded. Events that occur on a frequent basis after foreign markets close (such as developments in foreign markets and significant movements in the U.S. markets) and prior to the determination of the fund’s net asset value may be deemed to have a material effect on the value of securities traded in foreign markets. Accordingly, the fund’s foreign equity securities may often be valued at fair value. The adviser generally relies on third-party pricing services or other information (such as the correlation with price movements of similar securities in the same or other markets; the type, cost and investment characteristics of the security; the business and financial condition of the issuer; and trading and other market data) to assist in determining whether to fair value and at what value to fair value an investment. The value of an investment for purposes of calculating the fund’s net asset value can differ depending on the source and method used to determine value. When fair valuation is used, the value of an investment used to determine the fund’s net asset value may differ from quoted or published prices for the same investment. There can be no assurance that the fund could obtain the fair value assigned to an investment if it were to sell the investment at the same time at which the fund determines its net asset value per share.
Various inputs are used in determining the value of the fund’s assets or liabilities. These inputs are categorized into three broad levels. In certain cases, the inputs used to measure fair value may fall into different levels of the fair value hierarchy. In such cases, an investment’s level within the fair value hierarchy is based on the lowest level of input that is significant to the fair value measurement. The fund’s assessment of the significance of a particular input to the fair value measurement in its entirety requires judgment, and considers factors specific to the investment. Level 1 includes unadjusted quoted prices in active markets for identical assets or liabilities. Level 2 includes other significant observable market-based inputs (including quoted prices for similar securities, interest rates, prepayment speed, and credit risk). Level 3 includes unobservable inputs, which may include the adviser’s own assumptions in determining the fair value of investments. The following is a summary of the levels used as of June 30, 2013 in valuing the fund’s assets or liabilities:
| | | | | | | | | | | | | | | | |
| Investments at Value | | Level 1 | | | Level 2 | | | Level 3 | | | Total | |
| Equity Securities: | | | | | | | | | | | | | | | | |
Japan | | | $210,514,715 | | | | $44,271,829 | | | | $— | | | | $254,786,544 | |
United Kingdom | | | 24,593,833 | | | | 196,812,264 | | | | — | | | | 221,406,097 | |
Switzerland | | | 11,060,113 | | | | 96,779,476 | | | | — | | | | 107,839,589 | |
Germany | | | 36,734,872 | | | | 37,156,297 | | | | — | | | | 73,891,169 | |
France | | | 35,667,363 | | | | 18,561,328 | | | | — | | | | 54,228,691 | |
Netherlands | | | — | | | | 33,487,884 | | | | — | | | | 33,487,884 | |
Sweden | | | 16,153,880 | | | | — | | | | — | | | | 16,153,880 | |
Spain | | | 15,177,860 | | | | — | | | | — | | | | 15,177,860 | |
Taiwan | | | 12,241,552 | | | | — | | | | — | | | | 12,241,552 | |
Other Countries | | | 8,695,609 | | | | 50,765,197 | | | | — | | | | 59,460,806 | |
| Purchased Currency Options | | | — | | | | 3,428,527 | | | | — | | | | 3,428,527 | |
| Mutual Funds | | | 36,449,046 | | | | — | | | | — | | | | 36,449,046 | |
| Total Investments | | | $407,288,843 | | | | $481,262,802 | | | | $— | | | | $888,551,645 | |
For further information regarding security characteristics, see the Portfolio of Investments.
Of the level 2 investments presented above, equity investments amounting to $49,963,982 would have been considered level 1 investments at the beginning of the period. Of the level 1 investments presented above, equity investments amounting to $302,060,304 would have been considered level 2 investments at the beginning of the period. The primary reason for changes in the classifications between levels 1 and 2 occurs when foreign equity securities are fair valued using other observable market-based inputs in place of the closing exchange price due to events occurring after the close of the exchange or market on which the investment is principally traded. The fund’s foreign equity securities may often be valued at fair value.
The following is a reconciliation of level 3 assets for which significant unobservable inputs were used to determine fair value. The fund’s policy is to recognize transfers between the levels as of the end of the period. The table presents the activity of level 3 securities held at the beginning and the end of the period.
| | | | |
| | | Equity
Securities | |
| Balance as of 12/31/12 | | | $0 | |
Realized gain (loss) | | | (1,294,039 | ) |
Change in unrealized appreciation (depreciation) | | | 1,294,039 | |
Disposition of worthless securities | | | 0 | |
| Balance as of 6/30/13 | | | $— | |
12
MFS International Value Portfolio
Notes to Financial Statements (unaudited) – continued
Foreign Currency Translation – Purchases and sales of foreign investments, income, and expenses are converted into U.S. dollars based upon currency exchange rates prevailing on the respective dates of such transactions or on the reporting date for foreign denominated receivables and payables. Gains and losses attributable to foreign currency exchange rates on sales of securities are recorded for financial statement purposes as net realized gains and losses on investments. Gains and losses attributable to foreign exchange rate movements on receivables, payables, income and expenses are recorded for financial statement purposes as foreign currency transaction gains and losses. That portion of both realized and unrealized gains and losses on investments that results from fluctuations in foreign currency exchange rates is not separately disclosed.
Derivatives – The fund uses derivatives for different purposes, primarily to increase or decrease exposure to a particular market or segment of the market, or security, to increase or decrease interest rate or currency exposure, or as alternatives to direct investments. Derivatives are used for hedging or non-hedging purposes. While hedging can reduce or eliminate losses, it can also reduce or eliminate gains. When the fund uses derivatives as an investment to increase market exposure, or for hedging purposes, gains and losses from derivative instruments may be substantially greater than the derivative’s original cost.
The derivative instruments used by the fund were purchased options. The fund’s period end derivatives, as presented in the Portfolio of Investments, generally are indicative of the volume of its derivative activity during the period.
The following table presents, by major type of derivative contract, the fair value, on a gross basis, of the asset and liability components of derivatives held by the fund at June 30, 2013 as reported in the Statement of Assets and Liabilities:
| | | | | | | | |
| | | | | | | Fair Value (a) | |
| Risk | | Derivative Contracts | | | | Asset Derivatives | |
| Foreign Exchange | | Purchased Currency Options | | | | | $3,428,527 | |
| (a) | The value of purchased options outstanding is included in total investments, at value, within the fund’s Statement of Assets and Liabilities. |
The following table presents, by major type of derivative contract, the realized gain (loss) on derivatives held by the fund for the six months ended June 30, 2013 as reported in the Statement of Operations:
| | | | |
| Risk | | Investments
(Purchased Options) | |
| Foreign Exchange | | | $1,067,194 | |
The following table presents, by major type of derivative contract, the change in unrealized appreciation (depreciation) on derivatives held by the fund for the six months ended June 30, 2013 as reported in the Statement of Operations:
| | | | |
| Risk | | Investments
(Purchased Options) | |
| Foreign Exchange | | | $1,934,412 | |
Derivative counterparty credit risk is managed through formal evaluation of the creditworthiness of all potential counterparties. On certain, but not all, over-the-counter derivatives, the fund attempts to reduce its exposure to counterparty credit risk whenever possible by entering into an International Swaps and Derivatives Association (ISDA) Master Agreement on a bilateral basis with each of the counterparties with whom it undertakes a significant volume of transactions. The ISDA Master Agreement gives each party to the agreement the right to terminate all transactions traded under such agreement if there is a certain deterioration in the credit quality of the other party. Upon an event of default or a termination of the ISDA Master Agreement, the non-defaulting party has the right to close out all transactions traded under such agreement and to net amounts owed under each transaction to one net amount payable by one party to the other. This right to close out and net payments across all transactions traded under the ISDA Master Agreement could result in a reduction of the fund’s credit risk to such counterparty equal to any amounts payable by the fund under the applicable transactions, if any.
Collateral and margin requirements differ by type of derivative. Margin requirements are set by the broker or clearing house for cleared derivatives (i.e., futures contracts, cleared swaps, and exchange-traded options) while collateral terms are contract specific for over-the-counter traded derivatives (i.e., forward foreign currency exchange contracts, uncleared swap agreements, and over-the-counter options). For derivatives traded under an ISDA Master Agreement, the collateral requirements are netted across all transactions traded under such agreement and one amount is posted from one party to the other to collateralize such obligations. Cash that has been segregated to cover the fund’s collateral or margin obligations under derivative contracts, if any, will be reported separately in the Statement of Assets and Liabilities as restricted cash. Securities pledged as collateral or margin for the same purpose, if any, is noted in the Portfolio of Investments.
The fund’s accounting policy with respect to balance sheet offsetting is that, absent an event of default by the counterparty or a termination of the agreement, the ISDA Master Agreement does not result in an offset of reported amounts of financial assets and financial liabilities in the Statement of Assets and Liabilities across transactions between the fund and the applicable counterparty.
13
MFS International Value Portfolio
Notes to Financial Statements (unaudited) – continued
Purchased Options – The fund purchased call and put options for a premium. Purchased call and put options entitle the holder to buy and sell a specified number of shares or units of a particular security, currency or index at a specified price at a specified date or within a specified period of time. Purchasing call options may hedge against an anticipated increase in the dollar cost of securities or currency to be acquired or increase the fund’s exposure to an underlying instrument. Purchasing put options may hedge against an anticipated decline in the value of portfolio securities or currency or decrease the fund’s exposure to an underlying instrument.
The premium paid is initially recorded as an investment in the Statement of Assets and Liabilities. That investment is subsequently marked-to-market daily with the difference between the premium paid and the market value of the purchased option being recorded as unrealized appreciation or depreciation. Premiums paid for purchased call and put options which have expired are treated as realized losses on investments in the Statement of Operations. Upon the exercise or closing of a purchased call option, the premium paid is added to the cost of the security or financial instrument purchased. Upon the exercise or closing of a purchased put option, the premium paid is offset against the proceeds on the sale of the underlying security or financial instrument in order to determine the realized gain or loss on investments.
Whether or not the option is exercised, the fund’s maximum risk of loss from purchasing an option is the amount of premium paid. All option contracts involve credit risk if the counterparty to the option contract fails to perform. For over-the-counter options, this risk is mitigated in cases where there is an ISDA Master Agreement between the fund and the counterparty providing for netting as described above and for posting of collateral by the counterparty to the fund to cover the fund’s exposure to the counterparty under such ISDA Master Agreement.
Security Loans – Under its Securities Lending Agency Agreement with the fund, State Street Bank and Trust Company (“State Street”), as lending agent, loans the securities of the fund to certain qualified institutions (the “Borrowers”) approved by the fund. The loans are collateralized by cash and/or U.S. Treasury and federal agency obligations in an amount typically at least equal to the market value of the securities loaned. The market value of the loaned securities is determined at the close of business of the fund and any additional required collateral is delivered to the fund on the next business day. State Street provides the fund with indemnification against Borrower default. In the event of Borrower default, State Street will for the benefit of the fund either purchase securities identical to those loaned or, when such purchase is commercially impracticable, pay the fund the market value of the loaned securities. In return, State Street assumes the fund’s rights to the related collateral. If the collateral value is less than the cost to purchase identical securities, State Street is responsible for the shortfall, but only to the extent that such shortfall is not due to a decline in collateral value resulting from collateral reinvestment for which the fund bears the risk of loss. On loans collateralized by cash, the cash collateral is invested in a money market fund or short-term securities. At period end, the fund had investment securities on loan with a fair value of $291,581 and a related liability of $315,572 for collateral received on securities loaned, both of which are presented gross on the Statement of Assets and Liabilities. The carrying value of the collateral for securities loaned approximates fair value which would have been considered level 2 under the fair value hierarchy if the collateral for securities loaned were carried at fair value. The collateral received on securities loaned exceeded the value of securities on loan at period end. A portion of the income generated upon investment of the collateral is remitted to the Borrowers, and the remainder is allocated between the fund and the lending agent. On loans collateralized by U.S. Treasury and/or federal agency obligations, a fee is received from the Borrower, and is allocated between the fund and the lending agent. Income from securities lending is included in “Interest” income in the Statement of Operations. The dividend and interest income earned on the securities loaned is accounted for in the same manner as other dividend and interest income.
Indemnifications – Under the fund’s organizational documents, its officers and Trustees may be indemnified against certain liabilities and expenses arising out of the performance of their duties to the fund. Additionally, in the normal course of business, the fund enters into agreements with service providers that may contain indemnification clauses. The fund’s maximum exposure under these agreements is unknown as this would involve future claims that may be made against the fund that have not yet occurred.
Investment Transactions and Income – Investment transactions are recorded on the trade date. Interest income is recorded on the accrual basis. Dividends received in cash are recorded on the ex-dividend date. Certain dividends from foreign securities will be recorded when the fund is informed of the dividend if such information is obtained subsequent to the ex-dividend date. Dividend and interest payments received in additional securities are recorded on the ex-dividend or ex-interest date in an amount equal to the value of the security on such date.
The fund may receive proceeds from litigation settlements. Any proceeds received from litigation involving portfolio holdings are reflected in the Statement of Operations in realized gain/loss if the security has been disposed of by the fund or in unrealized gain/loss if the security is still held by the fund. Any other proceeds from litigation not related to portfolio holdings are reflected as other income in the Statement of Operations.
Fees Paid Indirectly – The fund’s custody fee may be reduced according to an arrangement that measures the value of cash deposited with the custodian by the fund. This amount, for the six months ended June 30, 2013, is shown as a reduction of total expenses in the Statement of Operations.
14
MFS International Value Portfolio
Notes to Financial Statements (unaudited) – continued
Tax Matters and Distributions – The fund intends to qualify as a regulated investment company, as defined under Subchapter M of the Internal Revenue Code, and to distribute all of its taxable income, including realized capital gains. As a result, no provision for federal income tax is required. The fund’s federal tax returns, when filed, will remain subject to examination by the Internal Revenue Service for a three year period. Foreign taxes have been accrued by the fund in the accompanying financial statements in accordance with the applicable foreign tax law. Foreign income taxes may be withheld by certain countries in which the fund invests.
Distributions to shareholders are recorded on the ex-dividend date. Income and capital gain distributions are determined in accordance with income tax regulations, which may differ from U.S. generally accepted accounting principles. Certain capital accounts in the financial statements are periodically adjusted for permanent differences in order to reflect their tax character. These adjustments have no impact on net assets or net asset value per share. Temporary differences which arise from recognizing certain items of income, expense, gain or loss in different periods for financial statement and tax purposes will reverse at some time in the future. Distributions in excess of net investment income or net realized gains are temporary overdistributions for financial statement purposes resulting from differences in the recognition or classification of income or distributions for financial statement and tax purposes.
Book/tax differences primarily relate to passive foreign investment company adjustments and wash sale loss deferrals.
The tax character of distributions declared to shareholders for the last fiscal year is as follows:
| | | | |
| | | 12/31/12 | |
| Ordinary income (including any short-term capital gains) | | | $7,900,234 | |
The federal tax cost and the tax basis components of distributable earnings were as follows:
| | | | |
| As of 6/30/13 | | | | |
| Cost of investments | | | $766,108,149 | |
| Gross appreciation | | | 150,056,227 | |
| Gross depreciation | | | (27,612,731 | ) |
| Net unrealized appreciation (depreciation) | | | $122,443,496 | |
| |
| As of 12/31/12 | | | | |
| Undistributed ordinary income | | | 13,072,947 | |
| Capital loss carryforwards | | | (20,898,640 | ) |
| Other temporary differences | | | (25,026 | ) |
| Net unrealized appreciation (depreciation) | | | 52,255,243 | |
The aggregate cost above includes prior fiscal year end tax adjustments, if applicable.
Under the Regulated Investment Company Modernization Act of 2010 (the “Act”), net capital losses recognized for fund fiscal years beginning after December 31, 2010 may be carried forward indefinitely, and their character is retained as short-term and/or long-term losses (“post-enactment losses”). Previously, net capital losses were carried forward for eight years and treated as short-term losses (“pre-enactment losses”). As a transition rule, the Act requires that all post-enactment net capital losses be used before pre-enactment net capital losses.
As of December 31, 2012, the fund had capital loss carryforwards available to offset future realized gains. Such pre-enactment losses expire as follows:
| | | | |
| 12/31/16 | | | $(1,584,443 | ) |
| 12/31/17 | | | (18,221,256 | ) |
| 12/31/18 | | | (1,092,941 | ) |
| Total | | | $(20,898,640 | ) |
Multiple Classes of Shares of Beneficial Interest – The fund offers multiple classes of shares, which differ in their respective distribution and/or service fees. The fund’s income, realized and unrealized gain (loss), and common expenses are allocated to shareholders based on the daily net assets of each class. Dividends are declared separately for each class. Differences in per share dividend rates are generally due to differences in separate class expenses. The fund’s distributions declared to shareholders as reported in the Statements of Changes in Net Assets are presented by class as follows:
| | | | | | | | |
| | | From net investment
income | |
| | | Six months ended
6/30/13 | | | Year ended
12/31/12 | |
| Initial Class | | | $— | | | | $1,091,327 | |
| Service Class | | | — | | | | 6,808,907 | |
| Total | | | $— | | | | $7,900,234 | |
15
MFS International Value Portfolio
Notes to Financial Statements (unaudited) – continued
| (3) | | Transactions with Affiliates |
Investment Adviser – The fund has an investment advisory agreement with MFS to provide overall investment management and related administrative services and facilities to the fund. The management fee is computed daily and paid monthly at the following annual rates:
| | | | |
| First $1 billion of average daily net assets | | | 0.90% | |
| Next $1 billion of average daily net assets | | | 0.80% | |
| Average daily net assets in excess of $2 billion | | | 0.70% | |
Effective April 1, 2013, MFS has agreed in writing to reduce its management fee by a specified amount if certain MFS mutual fund assets exceed thresholds agreed to by MFS and the fund’s Board of Trustees. For the period April 1, 2013 through June 30, 2013, this management fee reduction amounted to $1,177, which is shown as a reduction of total expenses in the Statement of Operations. The management fee incurred for the six months ended June 30, 2013 was equivalent to an annual effective rate of 0.90% of the fund’s average daily net assets.
Distributor – MFS Fund Distributors, Inc. (MFD), a wholly-owned subsidiary of MFS, is the distributor of shares of the fund. The Trustees have adopted a distribution plan for the Service Class shares pursuant to Rule 12b-1 under the Investment Company Act of 1940.
The fund’s distribution plan provides that the fund will pay MFD distribution and/or service fees equal to 0.25% per annum of its average daily net assets attributable to Service Class shares as partial consideration for services performed and expenses incurred by MFD and financial intermediaries (including participating insurance companies that invest in the fund to fund variable annuity and variable life insurance contracts, sponsors of qualified retirement and pension plans that invest in the fund, and affiliates of these participating insurance companies and plan sponsors) in connection with the sale and distribution of the Service Class shares. MFD may subsequently pay all, or a portion, of the distribution and/or service fees to financial intermediaries.
Shareholder Servicing Agent – MFS Service Center, Inc. (MFSC), a wholly-owned subsidiary of MFS, receives a fee from the fund for its services as shareholder servicing agent. For the six months ended June 30, 2013, the fee was $19,429, which equated to 0.0047% annually of the fund’s average daily net assets. MFSC also receives payment from the fund for out-of-pocket expenses paid by MFSC on behalf of the fund. For the six months ended June 30, 2013, these costs amounted to $41.
Administrator – MFS provides certain financial, legal, shareholder communications, compliance, and other administrative services to the fund. Under an administrative services agreement, the fund partially reimburses MFS the costs incurred to provide these services. The fund is charged an annual fixed amount of $17,500 plus a fee based on average daily net assets. The administrative services fee incurred for the six months ended June 30, 2013 was equivalent to an annual effective rate of 0.0138% of the fund’s average daily net assets.
Trustees’ and Officers’ Compensation – The fund pays compensation to independent Trustees in the form of a retainer, attendance fees, and additional compensation to Board and Committee chairpersons. The fund does not pay compensation directly to Trustees or officers of the fund who are also officers of the investment adviser, all of whom receive remuneration for their services to the fund from MFS. Certain officers and Trustees of the fund are officers or directors of MFS, MFD, and MFSC.
Other – This fund and certain other funds managed by MFS (the funds) have entered into services agreements (the Agreements) which provide for payment of fees by the funds to Tarantino LLC and Griffin Compliance LLC in return for the provision of services of an Independent Chief Compliance Officer (ICCO) and Assistant ICCO, respectively, for the funds. The ICCO and Assistant ICCO are officers of the funds and the sole members of Tarantino LLC and Griffin Compliance LLC, respectively. The funds can terminate the Agreements with Tarantino LLC and Griffin Compliance LLC at any time under the terms of the Agreements. For the six months ended June 30, 2013, the aggregate fees paid by the fund to Tarantino LLC and Griffin Compliance LLC were $3,033 and are included in “Miscellaneous” expense in the Statement of Operations. MFS has agreed to reimburse the fund for a portion of the payments made by the fund in the amount of $1,529, which is shown as a reduction of total expenses in the Statement of Operations. Additionally, MFS has agreed to bear all expenses associated with office space, other administrative support, and supplies provided to the ICCO and Assistant ICCO.
The fund invests in the MFS Institutional Money Market Portfolio which is managed by MFS and seeks current income consistent with preservation of capital and liquidity. Income earned on this investment is included in “Dividends from underlying affiliated funds” in the Statement of Operations. This money market fund does not pay a management fee to MFS.
Purchases and sales of investments, other than purchased option transactions and short-term obligations, aggregated $122,539,368 and $42,447,561, respectively.
16
MFS International Value Portfolio
Notes to Financial Statements (unaudited) – continued
| (5) | | Shares of Beneficial Interest |
The fund’s Declaration of Trust permits the Trustees to issue an unlimited number of full and fractional shares of beneficial interest. Transactions in fund shares were as follows:
| | | | | | | | | | | | | | | | |
| | | Six months ended 6/30/13 | | | Year ended 12/31/12 | |
| | | Shares | | | Amount | | | Shares | | | Amount | |
| Shares sold | | | | | | | | | | | | | | | | |
Initial Class | | | 967,417 | | | | $18,226,726 | | | | 7,497,848 | | | | $125,694,409 | |
Service Class | | | 6,619,731 | | | | 123,876,610 | | | | 10,941,466 | | | | 175,785,767 | |
| | | 7,587,148 | | | | $142,103,336 | | | | 18,439,314 | | | | $301,480,176 | |
| Shares issued to shareholders in reinvestment of distributions | | | | | | | | | | | | | | | | |
Initial Class | | | — | | | | $— | | | | 66,342 | | | | $1,091,327 | |
Service Class | | | — | | | | — | | | | 418,238 | | | | 6,808,907 | |
| | | — | | | | $— | | | | 484,580 | | | | $7,900,234 | |
| Shares reacquired | | | | | | | | | | | | | | | | |
Initial Class | | | (1,316,756 | ) | | | $(24,801,852 | ) | | | (1,042,544 | ) | | | $(17,035,479 | ) |
Service Class | | | (2,314,275 | ) | | | (43,234,158 | ) | | | (5,227,172 | ) | | | (84,782,331 | ) |
| | | (3,631,031 | ) | | | $(68,036,010 | ) | | | (6,269,716 | ) | | | $(101,817,810 | ) |
| Net change | | | | | | | | | | | | | | | | |
Initial Class | | | (349,339 | ) | | | $(6,575,126 | ) | | | 6,521,646 | | | | $109,750,257 | |
Service Class | | | 4,305,456 | | | | 80,642,452 | | | | 6,132,532 | | | | 97,812,343 | |
| | | 3,956,117 | | | | $74,067,326 | | | | 12,654,178 | | | | $207,562,600 | |
The fund is one of several mutual funds in which the MFS funds-of-funds may invest. The MFS funds-of-funds do not invest in the underlying MFS funds for the purpose of exercising management or control. At the end of the period, the MFS Moderate Allocation Portfolio, the MFS Growth Allocation Portfolio, and the MFS Conservative Allocation Portfolio were the owners of record of approximately 7%, 3%, and 2%, respectively, of the value of outstanding voting shares of the fund.
The fund and certain other funds managed by MFS participate in a $1.1 billion unsecured committed line of credit, subject to a $1 billion sublimit, provided by a syndication of banks under a credit agreement. Borrowings may be made for temporary financing needs. Interest is charged to each fund, based on its borrowings, generally at a rate equal to the higher of the Federal Reserve funds rate or one month LIBOR plus an agreed upon spread. A commitment fee, based on the average daily, unused portion of the committed line of credit, is allocated among the participating funds at the end of each calendar quarter. In addition, the fund and other funds managed by MFS have established unsecured uncommitted borrowing arrangements with certain banks for temporary financing needs. Interest is charged to each fund, based on its borrowings, at a rate equal to the Federal Reserve funds rate plus an agreed upon spread. For the six months ended June 30, 2013, the fund’s commitment fee and interest expense were $1,973 and $0, respectively, and are included in “Miscellaneous” expense in the Statement of Operations.
| (7) | | Transactions in Underlying Affiliated Funds – Affiliated Issuers |
An affiliated issuer may be considered one in which the fund owns 5% or more of the outstanding voting securities, or a company which is under common control. For the purposes of this report, the fund assumes the following to be an affiliated issuer:
| | | | | | | | | | | | | | | | |
| Underlying Affiliated Fund | | Beginning
Shares/Par
Amount | | | Acquisitions
Shares/Par
Amount | | | Dispositions
Shares/Par
Amount | | | Ending
Shares/Par
Amount | |
| MFS Institutional Money Market Portfolio | | | 31,817,466 | | | | 101,148,539 | | | | (96,832,531 | ) | | | 36,133,474 | |
| | | | |
| Underlying Affiliated Fund | | Realized
Gain (Loss) | | | Capital Gain
Distributions | | | Dividend
Income | | | Ending
Value | |
| MFS Institutional Money Market Portfolio | | | $— | | | | $— | | | | $23,268 | | | | $36,133,474 | |
17
MFS International Value Portfolio
BOARD REVIEW OF INVESTMENT ADVISORY AGREEMENT
A discussion regarding the Board’s most recent review and renewal of the fund’s Investment Advisory Agreement with MFS will be available on or about November 1, 2013 by clicking on the fund’s name under “Variable Insurance Portfolios — VIT II” in the “Products” section of the MFS Web site (mfs.com).
PROXY VOTING POLICIES AND INFORMATION
A general description of the MFS funds’ proxy voting policies and procedures is available without charge, upon request, by calling 1-800-225-2606, by visiting the Proxy Voting section of mfs.com or by visiting the SEC’s Web site at http://www.sec.gov.
Information regarding how the fund voted proxies relating to portfolio securities during the most recent twelve-month period ended June 30 is available without charge by visiting the Proxy Voting section of mfs.com or by visiting the SEC’s Web site at http://www.sec.gov.
QUARTERLY PORTFOLIO DISCLOSURE
The fund will file a complete schedule of portfolio holdings with the Securities and Exchange Commission (the Commission) for the first and third quarters of each fiscal year on Form N-Q. The fund’s Form N-Q is available on the EDGAR database on the Commission’s Internet Web site at http://www.sec.gov, and may be reviewed and copied at the:
Public Reference Room
Securities and Exchange Commission
100 F Street, NE, Room 1580
Washington, D.C. 20549
Information on the operation of the Public Reference Room may be obtained by calling the Commission at 1-800-SEC-0330. Copies of the fund’s Form N-Q also may be obtained, upon payment of a duplicating fee, by electronic request at the following e-mail address: publicinfo@sec.gov or by writing the Public Reference Section at the above address.
FURTHER INFORMATION
From time to time, MFS may post important information about the fund or the MFS funds on the MFS web site (mfs.com). This information is available by visiting the “News & Commentary” section of mfs.com or by clicking on the fund’s name under “Variable Insurance Portfolios — VIT II” in the “Products” section of mfs.com.
18
SEMIANNUAL REPORT
June 30, 2013

MFS® GLOBAL GROWTH PORTFOLIO
MFS® Variable Insurance Trust II

WGO-SEM
MFS® GLOBAL GROWTH PORTFOLIO
CONTENTS
The report is prepared for the general information of contract owners. It is authorized for distribution to prospective investors only when preceded or accompanied by a current prospectus.
NOT FDIC INSURED Ÿ MAY LOSE VALUE Ÿ NO BANK OR CREDIT UNION GUARANTEE Ÿ NOT A DEPOSIT Ÿ NOT INSURED BY ANY FEDERAL GOVERNMENT AGENCY OR NCUA/NCUSIF
MFS Global Growth Portfolio
LETTER FROM THE CHAIRMAN AND CEO

Dear Contract Owners:
As the year progresses, the global economy continues to grind ahead slowly, held back by broad austerity measures. The U.S. economy remains a steadying force, driven by resilient consumers, who have taken the payroll tax increase and the sequestration’s early impact in stride. With U.S. housing and jobs showing steady expansion, domestic consumer-driven growth has offset weaker exports and the U.S. government’s spending constraints. In response to these developments, the U.S. Federal Reserve has begun to brace investors for an eventual shift in its monetary policy, causing global market tremors.
Japan has been another bright spot, with government and central bank stimulus policies leading to increased exports, a resurgent stock market and improved economic sentiment. After a six-month rally, Japan’s stocks slipped late in the second quarter, then picked up momentum on fresh signs that the country could soon break free of its chronic deflation. The major deterrent to global growth remains the eurozone, still in the grip of persistent recession. China has seen its pace of economic growth decelerate, a troubling turn for the country’s trading partners, who have come to rely on it as an engine for global growth.
As always, managing risk in the face of uncertainty remains a top priority for investors. At MFS®, our uniquely collaborative investment process employs integrated, global research and active risk management. Our global team of investment professionals shares ideas and evaluates opportunities across continents, investment disciplines and asset classes — all with a goal of building better insights, and ultimately better results, for our clients.
We are mindful of the many economic challenges investors face, and believe it is more important than ever to maintain a long-term view and employ time-tested principles, such as asset allocation and diversification. We remain confident that our unique approach can serve investors well as they work with their financial advisors to identify and pursue the most suitable opportunities.
Respectfully,

Robert J. Manning
Chairman and Chief Executive Officer
MFS Investment Management®
August 16, 2013
The opinions expressed in this letter are subject to change, may not be relied upon for investment advice, and no forecasts can be guaranteed.
1
MFS Global Growth Portfolio
PORTFOLIO COMPOSITION
Portfolio structure
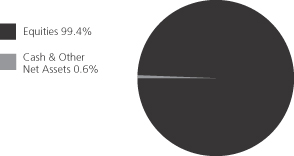
| | | | |
| Top ten holdings | | | | |
| Groupe Danone | | | 2.8% | |
| LVMH Moet Hennessy Louis Vuitton S.A. | | | 2.7% | |
| Google, Inc., “A” | | | 2.4% | |
| Pernod Ricard S.A. | | | 2.2% | |
| Danaher Corp. | | | 2.2% | |
| Compass Group PLC | | | 2.1% | |
| Schlumberger Ltd. | | | 2.0% | |
| United Technologies Corp. | | | 2.0% | |
| Procter & Gamble Co. | | | 1.8% | |
| Colgate-Palmolive Co. | | | 1.8% | |
| |
| Equity sectors | | | | |
| Consumer Staples | | | 15.3% | |
| Technology | | | 12.9% | |
| Industrial Goods & Services | | | 12.8% | |
| Retailing | | | 10.8% | |
| Health Care | | | 10.6% | |
| Financial Services | | | 10.0% | |
| Special Products & Services | | | 7.8% | |
| Leisure | | | 6.1% | |
| Basic Materials | | | 5.2% | |
| Energy | | | 4.9% | |
| Transportation | | | 2.5% | |
| Autos & Housing | | | 0.5% | |
| | | | |
| Issuer country weightings (x) | | | | |
| United States | | | 53.0% | |
| United Kingdom | | | 11.8% | |
| France | | | 11.5% | |
| Switzerland | | | 6.4% | |
| Germany | | | 4.0% | |
| Brazil | | | 3.6% | |
| Taiwan | | | 1.5% | |
| South Korea | | | 1.2% | |
| Spain | | | 1.1% | |
| Other Countries | | | 5.9% | |
| |
| Currency exposure weightings (y) | | | | |
| United States Dollar | | | 54.0% | |
| Euro | | | 17.7% | |
| British Pound Sterling | | | 11.8% | |
| Swiss Franc | | | 6.4% | |
| Brazilian Real | | | 3.6% | |
| Taiwan Dollar | | | 1.5% | |
| South Korean Won | | | 1.2% | |
| Japanese Yen | | | 1.1% | |
| Hong Kong Dollar | | | 1.1% | |
| Other Currencies | | | 1.6% | |
| (x) | Represents the portfolio’s exposure to issuer countries as a percentage of a portfolio’s net assets. |
| (y) | Represents the portfolio’s exposure to a particular currency as a percentage of a portfolio’s net assets. |
Percentages are based on net assets as of 6/30/13.
The portfolio is actively managed and current holdings may be different.
2
MFS Global Growth Portfolio
EXPENSE TABLE
Fund Expenses Borne by the Contract Holders During the Period,
January 1, 2013 through June 30, 2013
As a contract holder of the fund, you incur ongoing costs, including management fees; distribution and/or service (12b-1) fees; and other fund expenses. This example is intended to help you understand your ongoing costs (in dollars) of investing in the fund and to compare these costs with the ongoing costs of investing in other mutual funds.
The example is based on an investment of $1,000 invested at the beginning of the period and held for the entire period January 1, 2013 through June 30, 2013.
Actual Expenses
The first line for each share class in the following table provides information about actual account values and actual expenses. You may use the information in this line, together with the amount you invested, to estimate the expenses that you paid over the period. Simply divide your account value by $1,000 (for example, an $8,600 account value divided by $1,000 = 8.6), then multiply the result by the number in the first line under the heading entitled “Expenses Paid During Period” to estimate the expenses you paid on your account during this period.
Hypothetical Example for Comparison Purposes
The second line for each share class in the following table provides information about hypothetical account values and hypothetical expenses based on the fund’s actual expense ratio and an assumed rate of return of 5% per year before expenses, which is not the fund’s actual return. The hypothetical account values and expenses may not be used to estimate the actual ending account balance or expenses you paid for the period. You may use this information to compare the ongoing costs of investing in the fund and other funds. To do so, compare this 5% hypothetical example with the 5% hypothetical examples that appear in the shareholder reports of the other funds.
Please note that the expenses shown in the table are meant to highlight the fund’s ongoing costs only and do not take into account the fees and expenses imposed under the variable contracts through which your investment in the fund is made. Therefore, the second line for each share class in the table is useful in comparing ongoing costs associated with an investment in vehicles (such as the fund) which fund benefits under variable annuity and variable life insurance contracts and to qualified pension and retirement plans only, and will not help you determine the relative total costs of investing in the fund through variable annuity and variable life insurance contracts. If the fees and expenses imposed under the variable contracts were included, your costs would have been higher.
| | | | | | | | | | | | | | | | | | |
| Share Class | | | | Annualized
Expense Ratio | | | Beginning
Account Value
1/01/13 | | | Ending Account Value
6/30/13 | | | Expenses Paid
During Period (p)
1/01/13-6/30/13 | |
| Initial Class | | Actual | | | 1.19% | | | | $1,000.00 | | | | $1,046.77 | | | | $6.04 | |
| | Hypothetical (h) | | | 1.19% | | | | $1,000.00 | | | | $1,018.89 | | | | $5.96 | |
| Service Class | | Actual | | | 1.44% | | | | $1,000.00 | | | | $1,045.28 | | | | $7.30 | |
| | Hypothetical (h) | | | 1.44% | | | | $1,000.00 | | | | $1,017.65 | | | | $7.20 | |
| (h) | 5% class return per year before expenses. |
| (p) | Expenses paid are equal to each class’s annualized expense ratio, as shown above, multiplied by the average account value over the period, multiplied by the number of days in the period, divided by the number of days in the year. |
3
MFS Global Growth Portfolio
PORTFOLIO OF INVESTMENTS – 6/30/13 (unaudited)
The Portfolio of Investments is a complete list of all securities owned by your fund. It is categorized by broad-based asset classes.
| | | | | | | | |
| Issuer | | Shares/Par | | | Value ($) | |
| | | | | | | | |
| COMMON STOCKS – 99.4% | | | | | | | | |
| Aerospace – 3.8% | | | | | | | | |
| Precision Castparts Corp. | | | 2,665 | | | $ | 602,314 | |
| Rolls-Royce Holdings PLC | | | 27,332 | | | | 472,909 | |
| United Technologies Corp. | | | 12,500 | | | | 1,161,750 | |
| | | | | | | | |
| | | | | | $ | 2,236,973 | |
| | | | | | | | |
| Alcoholic Beverages – 4.3% | | | | | | | | |
| Diageo PLC | | | 27,988 | | | $ | 802,786 | |
| Heineken N.V. | | | 6,341 | | | | 403,113 | |
| Pernod Ricard S.A. | | | 11,818 | | | | 1,310,469 | |
| | | | | | | | |
| | | | | | $ | 2,516,368 | |
| | | | | | | | |
| Apparel Manufacturers – 5.8% | | | | | | | | |
| Cia.Hering S.A. | | | 24,600 | | | $ | 345,074 | |
| Compagnie Financiere Richemont S.A. | | | 4,667 | | | | 409,397 | |
| Li & Fung Ltd. | | | 459,600 | | | | 626,739 | |
| LVMH Moet Hennessy Louis Vuitton S.A. | | | 9,910 | | | | 1,595,870 | |
| NIKE, Inc., “B” | | | 7,040 | | | | 448,307 | |
| | | | | | | | |
| | | | | | $ | 3,425,387 | |
| | | | | | | | |
| Automotive – 0.5% | | | | | | | | |
| Johnson Controls, Inc. | | | 8,350 | | | $ | 298,847 | |
| | | | | | | | |
| Broadcasting – 4.2% | | | | | | | | |
| Discovery Communications, Inc., “A” (a) | | | 4,570 | | | $ | 352,850 | |
| Publicis Groupe S.A. | | | 5,864 | | | | 415,819 | |
| Time Warner, Inc. | | | 10,500 | | | | 607,110 | |
| Viacom, Inc., “B” | | | 4,550 | | | | 309,628 | |
| Walt Disney Co. | | | 12,360 | | | | 780,534 | |
| | | | | | | | |
| | | | | | $ | 2,465,941 | |
| | | | | | | | |
| Brokerage & Asset Managers – 2.2% | | | | | |
| BM&F Bovespa S.A. | | | 75,300 | | | $ | 417,105 | |
| Charles Schwab Corp. | | | 14,210 | | | | 301,678 | |
| Franklin Resources, Inc. | | | 4,353 | | | | 592,095 | |
| | | | | | | | |
| | | | | | $ | 1,310,878 | |
| | | | | | | | |
| Business Services – 7.8% | | | | | | | | |
| Accenture PLC, “A” | | | 13,240 | | | $ | 952,750 | |
| Brenntag AG | | | 3,769 | | | | 572,520 | |
| Cognizant Technology Solutions Corp., “A” (a) | | | 7,980 | | | | 499,628 | |
| Compass Group PLC | | | 95,190 | | | | 1,219,916 | |
| Experian Group Ltd. | | | 25,893 | | | | 449,102 | |
| Intertek Group PLC | | | 7,488 | | | | 333,662 | |
| LPS Brasil – Consultoria de Imoveis S.A. | | | 38,200 | | | | 309,866 | |
| Verisk Analytics, Inc., “A” (a) | | | 4,370 | | | | 260,889 | |
| | | | | | | | |
| | | | | | $ | 4,598,333 | |
| | | | | | | | |
| Chemicals – 0.5% | | | | | | | | |
| Monsanto Co. | | | 3,273 | | | $ | 323,372 | |
| | | | | | | | |
| Computer Software – 2.4% | | | | | | | | |
| Autodesk, Inc. (a) | | | 11,510 | | | $ | 390,649 | |
| Dassault Systems S.A. | | | 2,372 | | | | 290,164 | |
| | | | | | | | |
| Issuer | | Shares/Par | | | Value ($) | |
| | | | | | | | |
| COMMON STOCKS – continued | | | | | |
| Computer Software – continued | | | | | | | | |
| Oracle Corp. | | | 24,510 | | | $ | 752,947 | |
| | | | | | | | |
| | | | | | $ | 1,433,760 | |
| | | | | | | | |
| Computer Software – Systems – 3.2% | | | | | |
| Apple, Inc. | | | 985 | | | $ | 390,139 | |
| EMC Corp. | | | 42,560 | | | | 1,005,267 | |
| International Business Machines Corp. | | | 2,462 | | | | 470,513 | |
| | | | | | | | |
| | | | | | $ | 1,865,919 | |
| | | | | | | | |
| Consumer Products – 5.3% | | | | | | | | |
| Colgate-Palmolive Co. | | | 18,666 | | | $ | 1,069,375 | |
| Procter & Gamble Co. | | | 14,120 | | | | 1,087,099 | |
| Reckitt Benckiser Group PLC | | | 13,589 | | | | 963,323 | |
| | | | | | | | |
| | | | | | $ | 3,119,797 | |
| | | | | | | | |
| Electrical Equipment – 8.2% | | | | | | | | |
| Amphenol Corp., “A” | | | 4,770 | | | $ | 371,774 | |
| Danaher Corp. | | | 20,300 | | | | 1,284,990 | |
| Legrand S.A. | | | 10,660 | | | | 492,637 | |
| Mettler-Toledo International, Inc. (a) | | | 3,319 | | | | 667,783 | |
| Schneider Electric S.A. | | | 5,896 | | | | 425,074 | |
| Sensata Technologies Holding B.V. (a) | | | 23,360 | | | | 815,264 | |
| W.W. Grainger, Inc. | | | 3,216 | | | | 811,011 | |
| | | | | | | | |
| | | | | | $ | 4,868,533 | |
| | | | | | | | |
| Electronics – 3.8% | | | | | | | | |
| Microchip Technology, Inc. | | | 25,110 | | | $ | 935,348 | |
| Samsung Electronics Co. Ltd. | | | 357 | | | | 419,504 | |
| Taiwan Semiconductor Manufacturing Co. Ltd., ADR | | | 46,958 | | | | 860,271 | |
| | | | | | | | |
| | | | | | $ | 2,215,123 | |
| | | | | | | | |
| Energy – Independent – 1.3% | | | | | | | | |
| Occidental Petroleum Corp. | | | 8,850 | | | $ | 789,686 | |
| | | | | | | | |
| Energy – Integrated – 0.6% | | | | | | | | |
| BG Group PLC | | | 21,185 | | | $ | 361,564 | |
| | | | | | | | |
| Food & Beverages – 5.7% | | | | | | | | |
| Groupe Danone | | | 22,257 | | | $ | 1,670,457 | |
| M. Dias Branco S.A. Industria e Comercio de Alimentos | | | 7,800 | | | | 291,886 | |
| Mead Johnson Nutrition Co., “A” | | | 5,050 | | | | 400,112 | |
| Nestle S.A. | | | 8,284 | | | | 541,827 | |
| PepsiCo, Inc. | | | 5,420 | | | | 443,302 | |
| | | | | | | | |
| | | | | | $ | 3,347,584 | |
| | | | | | | | |
| Food & Drug Stores – 2.0% | | | | | | | | |
| CVS Caremark Corp. | | | 15,140 | | | $ | 865,705 | |
| Sundrug Co. Ltd. | | | 7,800 | | | | 331,095 | |
| | | | | | | | |
| | | | | | $ | 1,196,800 | |
| | | | | | | | |
| General Merchandise – 1.9% | | | | | | | | |
| Dollarama, Inc. | | | 7,590 | | | $ | 531,235 | |
| Lojas Renner S.A. | | | 9,400 | | | | 269,402 | |
4
MFS Global Growth Portfolio
Portfolio of Investments (unaudited) – continued
| | | | | | | | |
| Issuer | | Shares/Par | | | Value ($) | |
| | | | | | | | |
| COMMON STOCKS – continued | | | | | |
| General Merchandise – continued | | | | | | | | |
| Target Corp. | | | 4,330 | | | $ | 298,164 | |
| | | | | | | | |
| | | | | | $ | 1,098,801 | |
| | | | | | | | |
| Internet – 3.5% | | | | | | | | |
| Google, Inc., “A” (a) | | | 1,625 | | | $ | 1,430,601 | |
| NHN Corp. | | | 1,156 | | | | 294,565 | |
| Yahoo Japan Corp. | | | 676 | | | | 334,042 | |
| | | | | | | | |
| | | | | | $ | 2,059,208 | |
| | | | | | | | |
| Machinery & Tools – 0.8% | | | | | | | | |
| Schindler Holding AG | | | 3,280 | | | $ | 456,215 | |
| | | | | | | | |
| Major Banks – 1.7% | | | | | | | | |
| HSBC Holdings PLC | | | 25,801 | | | $ | 267,631 | |
| Standard Chartered PLC | | | 33,426 | | | | 721,661 | |
| | | | | | | | |
| | | | | | $ | 989,292 | |
| | | | | | | | |
| Medical & Health Technology & Services – 2.0% | |
| Express Scripts Holding Co. (a) | | | 13,940 | | | $ | 859,959 | |
| Fresenius Medical Care AG & Co. KGaA | | | 4,352 | | | | 308,328 | |
| | | | | | | | |
| | | | | | $ | 1,168,287 | |
| | | | | | | | |
| Medical Equipment – 5.8% | | | | | | | | |
| DENTSPLY International, Inc. | | | 21,070 | | | $ | 863,027 | |
| Essilor International S.A. | | | 2,923 | | | | 310,998 | |
| Sonova Holding AG | | | 7,237 | | | | 767,717 | |
| Thermo Fisher Scientific, Inc. | | | 11,100 | | | | 939,393 | |
| Waters Corp. (a) | | | 5,430 | | | | 543,272 | |
| | | | | | | | |
| | | | | | $ | 3,424,407 | |
| | | | | | | | |
| Metals & Mining – 1.1% | | | | | | | | |
| Rio Tinto Ltd. | | | 15,530 | | | $ | 636,521 | |
| | | | | | | | |
| Oil Services – 3.0% | | | | | | | | |
| National Oilwell Varco, Inc. | | | 4,630 | | | $ | 319,007 | |
| Saipem S.p.A. | | | 14,960 | | | | 242,050 | |
| Schlumberger Ltd. | | | 16,660 | | | | 1,193,856 | |
| | | | | | | | |
| | | | | | $ | 1,754,913 | |
| | | | | | | | |
| Other Banks & Diversified Financials – 6.1% | |
| Credicorp Ltd. | | | 2,965 | | | $ | 379,401 | |
| HDFC Bank Ltd. | | | 36,336 | | | | 409,372 | |
| Itau Unibanco Holding S.A., ADR | | | 35,126 | | | | 453,828 | |
| Julius Baer Group Ltd. | | | 17,138 | | | | 665,972 | |
| MasterCard, Inc., “A” | | | 888 | | | | 510,156 | |
| Sberbank of Russia, ADR | | | 20,203 | | | | 230,112 | |
| Visa, Inc., “A” | | | 5,359 | | | | 979,357 | |
| | | | | | | | |
| | | | | | $ | 3,628,198 | |
| | | | | | | | |
| Pharmaceuticals – 2.8% | | | | | | | | |
| Allergan, Inc. | | | 3,582 | | | $ | 301,748 | |
| Bayer AG | | | 4,895 | | | | 522,023 | |
| Johnson & Johnson | | | 9,350 | | | | 802,791 | |
| | | | | | | | |
| | | | | | $ | 1,626,562 | |
| | | | | | | | |
| Railroad & Shipping – 1.6% | | | | | | | | |
| Kuehne & Nagel, Inc. AG | | | 8,630 | | | $ | 946,188 | |
| | | | | | | | |
| | | | | | | | |
| Issuer | | Shares/Par | | | Value ($) | |
| | | | | | | | |
| COMMON STOCKS – continued | | | | | |
| Restaurants – 1.9% | | | | | | | | |
| McDonald’s Corp. | | | 7,860 | | | $ | 778,140 | |
| Whitbread PLC | | | 7,505 | | | | 349,982 | |
| | | | | | | | |
| | | | | | $ | 1,128,122 | |
| | | | | | | | |
| Specialty Chemicals – 3.6% | | | | | | | | |
| Croda International PLC | | | 10,292 | | | $ | 388,833 | |
| L’Air Liquide S.A. | | | 2,172 | | | | 267,203 | |
| Linde AG | | | 3,658 | | | | 681,135 | |
| Praxair, Inc. | | | 4,404 | | | | 507,165 | |
| Symrise AG | | | 7,373 | | | | 297,691 | |
| | | | | | | | |
| | | | | | $ | 2,142,027 | |
| | | | | | | | |
| Specialty Stores – 1.1% | | | | | | | | |
| Industria de Diseno Textil S.A. | | | 5,405 | | | $ | 667,239 | |
| | | | | | | | |
| Trucking – 0.9% | | | | | | | | |
| Expeditors International of Washington, Inc. | | | 13,920 | | | $ | 529,099 | |
| | | | | | | | |
Total Common Stocks
(Identified Cost, $51,384,168) | | | | | | $ | 58,629,944 | |
| | | | | | | | |
| |
| MONEY MARKET FUNDS – 0.6% | | | | | |
| MFS Institutional Money Market Portfolio, 0.11%, at Cost and Net Asset Value (v) | | | 351,735 | | | $ | 351,735 | |
| | | | | | | | |
Total Investments
(Identified Cost, $51,735,903) | | | | | | $ | 58,981,679 | |
| | | | | | | | |
OTHER ASSETS, LESS
LIABILITIES – (0.0)% | | | | | | | (6,575 | ) |
| | | | | | | | |
| Net Assets – 100.0% | | | | | | $ | 58,975,104 | |
| | | | | | | | |
| (a) | | Non-income producing security. |
| (v) | | Underlying affiliated fund that is available only to investment companies managed by MFS. The rate quoted for the MFS Institutional Money Market Portfolio is the annualized seven-day yield of the fund at period end. |
The following abbreviations are used in this report and are defined:
| ADR | | American Depositary Receipt |
| PLC | | Public Limited Company |
See Notes to Financial Statements
5
MFS Global Growth Portfolio
FINANCIAL STATEMENTS | STATEMENT OF ASSETS AND LIABILITIES (unaudited)
This statement represents your fund’s balance sheet, which details the assets and liabilities comprising the total value of the fund.
| | | | | | | | |
At 6/30/13 | | | | | | | | |
Assets | | | | | | | | |
Investments – | | | | | | | | |
Non-affiliated issuers, at value (identified cost, $51,384,168) | | | $58,629,944 | | | | | |
Underlying affiliated funds, at cost and value | | | 351,735 | | | | | |
Total investments, at value (identified cost, $51,735,903) | | | $58,981,679 | | | | | |
Foreign currency, at value (identified cost, $3,231) | | | 3,209 | | | | | |
Receivables for | | | | | | | | |
Investments sold | | | 5,124 | | | | | |
Interest and dividends | | | 107,159 | | | | | |
Other assets | | | 498 | | | | | |
Total assets | | | | | | | $59,097,669 | |
| Liabilities | | | | | | | | |
Payables for | | | | | | | | |
Investments purchased | | | $5,123 | | | | | |
Fund shares reacquired | | | 55,077 | | | | | |
Payable to affiliates | | | | | | | | |
Investment adviser | | | 6,022 | | | | | |
Shareholder servicing costs | | | 27 | | | | | |
Distribution and/or service fees | | | 79 | | | | | |
Payable for independent Trustees’ compensation | | | 534 | | | | | |
Accrued expenses and other liabilities | | | 55,703 | | | | | |
Total liabilities | | | | | | | $122,565 | |
Net assets | | | | | | | $58,975,104 | |
| Net assets consist of | | | | | | | | |
Paid-in capital | | | $54,973,482 | | | | | |
Unrealized appreciation (depreciation) on investments and translation of assets and liabilities in foreign currencies | | | 7,244,604 | | | | | |
Accumulated net realized gain (loss) on investments and foreign currency | | | (3,933,437 | ) | | | | |
Undistributed net investment income | | | 690,455 | | | | | |
Net assets | | | | | | | $58,975,104 | |
Shares of beneficial interest outstanding | | | | | | | 3,138,223 | |
| | | | | | | | | | | | |
| | | Net assets | | | Shares
outstanding | | | Net asset value
per share | |
Initial Class | | | $56,101,731 | | | | 2,984,538 | | | | $18.80 | |
Service Class | | | 2,873,373 | | | | 153,685 | | | | 18.70 | |
See Notes to Financial Statements
6
MFS Global Growth Portfolio
FINANCIAL STATEMENTS | STATEMENT OF OPERATIONS (unaudited)
This statement describes how much your fund earned in investment income and accrued in expenses. It also describes any gains and/or losses generated by fund operations.
| | | | | | | | |
Six months ended 6/30/13 | | | | | | | | |
Net investment income | | | | | | | | |
Income | | | | | | | | |
Dividends | | | $693,949 | | | | | |
Interest | | | 4,802 | | | | | |
Dividends from underlying affiliated funds | | | 225 | | | | | |
Foreign taxes withheld | | | (42,863 | ) | | | | |
Total investment income | | | | | | | $656,113 | |
Expenses | | | | | | | | |
Management fee | | | $275,500 | | | | | |
Distribution and/or service fees | | | 3,837 | | | | | |
Shareholder servicing costs | | | 1,639 | | | | | |
Administrative services fee | | | 9,401 | | | | | |
Independent Trustees’ compensation | | | 1,469 | | | | | |
Custodian fee | | | 33,403 | | | | | |
Shareholder communications | | | 3,797 | | | | | |
Audit and tax fees | | | 33,389 | | | | | |
Legal fees | | | 518 | | | | | |
Miscellaneous | | | 5,834 | | | | | |
Total expenses | | | | | | | $368,787 | |
Fees paid indirectly | | | (1 | ) | | | | |
Reduction of expenses by investment adviser | | | (200 | ) | | | | |
Net expenses | | | | | | | $368,586 | |
Net investment income | | | | | | | $287,527 | |
Realized and unrealized gain (loss) on investments and foreign currency | | | | | | | | |
Realized gain (loss) (identified cost basis) | | | | | | | | |
Investments | | | $3,125,453 | | | | | |
Foreign currency | | | (6,079 | ) | | | | |
Net realized gain (loss) on investments and foreign currency | | | | | | | $3,119,374 | |
Change in unrealized appreciation (depreciation) | | | | | | | | |
Investments | | | $(548,845 | ) | | | | |
Translation of assets and liabilities in foreign currencies | | | (805 | ) | | | | |
Net unrealized gain (loss) on investments and foreign currency translation | | | | | | | $(549,650 | ) |
Net realized and unrealized gain (loss) on investments and foreign currency | | | | | | | $2,569,724 | |
Change in net assets from operations | | | | | | | $2,857,251 | |
See Notes to Financial Statements
7
MFS Global Growth Portfolio
FINANCIAL STATEMENTS | STATEMENTS OF CHANGES IN NET ASSETS
These statements describe the increases and/or decreases in net assets resulting from operations, any distributions, and any shareholder transactions.
| | | | | | | | |
| |
| Six months ended
6/30/13 (unaudited |
) | |
| Year ended
12/31/12 |
|
Change in net assets | | | | | | | | |
| From operations | | | | | | | | |
Net investment income | | | $287,527 | | | | $411,150 | |
Net realized gain (loss) on investments and foreign currency | | | 3,119,374 | | | | 2,479,819 | |
Net unrealized gain (loss) on investments and foreign currency translation | | | (549,650 | ) | | | 8,178,684 | |
Change in net assets from operations | | | $2,857,251 | | | | $11,069,653 | |
| Distributions declared to shareholders | | | | | | | | |
From net investment income | | | $— | | | | $(430,008 | ) |
Change in net assets from fund share transactions | | | $(4,333,991 | ) | | | $(9,597,983 | ) |
Total change in net assets | | | $(1,476,740 | ) | | | $1,041,662 | |
| Net assets | | | | | | | | |
At beginning of period | | | 60,451,844 | | | | 59,410,182 | |
At end of period (including undistributed net investment income of $690,455 and
$402,928, respectively) | | | $58,975,104 | | | | $60,451,844 | |
See Notes to Financial Statements
8
MFS Global Growth Portfolio
FINANCIAL STATEMENTS | FINANCIAL HIGHLIGHTS
The financial highlights table is intended to help you understand the fund’s financial performance for the semiannual period and the past 5 fiscal years. Certain information reflects financial results for a single fund share. The total returns in the table represent the rate by which an investor would have earned (or lost) on an investment in the fund share class (assuming reinvestment of all distributions) held for the entire period.
| | | | | | | | | | | | | | | | | | | | | | | | |
| Initial Class | | Six months
ended
6/30/13 | | | Years ended 12/31 | |
| | | | 2012 | | | 2011 | | | 2010 | | | 2009 | | | 2008 | |
| | | (unaudited) | | | | | | | | | | | | | | | | |
Net asset value, beginning of period | | | $17.96 | | | | $15.11 | | | | $16.26 | | | | $14.65 | | | | $10.62 | | | | $17.54 | |
| Income (loss) from investment operations | | | | | | | | | | | | | | | | | | | | | | | | |
Net investment income (d) | | | $0.09 | | | | $0.11 | | | | $0.11 | | | | $0.10 | | | | $0.10 | | | | $0.13 | |
Net realized and unrealized gain (loss) on investments
and foreign currency | | | 0.75 | | | | 2.86 | | | | (1.15 | ) | | | 1.62 | | | | 4.07 | | | | (6.90 | ) |
Total from investment operations | | | $0.84 | | | | $2.97 | | | | $(1.04 | ) | | | $1.72 | | | | $4.17 | | | | $(6.77 | ) |
| Less distributions declared to shareholders | | | | | | | | | | | | | | | | | | | | | | | | |
From net investment income | | | $— | | | | $(0.12 | ) | | | $(0.11 | ) | | | $(0.11 | ) | | | $(0.14 | ) | | | $(0.15 | ) |
Net asset value, end of period (x) | | | $18.80 | | | | $17.96 | | | | $15.11 | | | | $16.26 | | | | $14.65 | | | | $10.62 | |
Total return (%) (k)(r)(s)(x) | | | 4.68 (n | ) | | | 19.72 | | | | (6.38 | ) | | | 11.80 | | | | 39.81 | | | | (38.93 | ) |
Ratios (%) (to average net assets)
and Supplemental data: | | | | | | | | | | | | | | | | | | | | | | | | |
Expenses before expense reductions (f) | | | 1.19 | (a) | | | 1.19 | | | | 1.22 | | | | 1.19 | | | | 1.34 | | | | 1.25 | |
Expenses after expense reductions (f) | | | 1.19 | (a) | | | 1.19 | | | | N/A | | | | N/A | | | | N/A | | | | N/A | |
Net investment income | | | 0.95 | (a) | | | 0.68 | | | | 0.72 | | | | 0.66 | | | | 0.85 | | | | 0.90 | |
Portfolio turnover | | | 17 | (n) | | | 40 | | | | 36 | | | | 61 | | | | 76 | | | | 81 | |
Net assets at end of period (000 omitted) | | | $56,102 | | | | $57,300 | | | | $56,309 | | | | $71,546 | | | | $75,171 | | | | $62,289 | |
| | |
| Service Class | | Six months
ended
6/30/13 | | | Years ended 12/31 | |
| | | | 2012 | | | 2011 | | | 2010 | | | 2009 | | | 2008 | |
| | | (unaudited) | | | | | | | | | | | | | | | | |
Net asset value, beginning of period | | | $17.89 | | | | $15.04 | | | | $16.18 | | | | $14.58 | | | | $10.55 | | | | $17.42 | |
| Income (loss) from investment operations | | | | | | | | | | | | | | | | | | | | | | | | |
Net investment income (d) | | | $0.06 | | | | $0.07 | | | | $0.08 | | | | $0.06 | | | | $0.07 | | | | $0.10 | |
Net realized and unrealized gain (loss) on investments
and foreign currency | | | 0.75 | | | | 2.86 | | | | (1.16 | ) | | | 1.62 | | | | 4.05 | | | | (6.86 | ) |
Total from investment operations | | | $0.81 | | | | $2.93 | | | | $(1.08 | ) | | | $1.68 | | | | $4.12 | | | | $(6.76 | ) |
| Less distributions declared to shareholders | | | | | | | | | | | | | | | | | | | | | | | | |
From net investment income | | | $— | | | | $(0.08 | ) | | | $(0.06 | ) | | | $(0.08 | ) | | | $(0.09 | ) | | | $(0.11 | ) |
Net asset value, end of period (x) | | | $18.70 | | | | $17.89 | | | | $15.04 | | | | $16.18 | | | | $14.58 | | | | $10.55 | |
Total return (%) (k)(r)(s)(x) | | | 4.53 | (n) | | | 19.49 | | | | (6.67 | ) | | | 11.53 | | | | 39.43 | | | | (39.07 | ) |
Ratios (%) (to average net assets)
and Supplemental data: | | | | | | | | | | | | | | | | | | | | | | | | |
Expenses before expense reductions (f) | | | 1.44 | (a) | | | 1.44 | | | | 1.47 | | | | 1.44 | | | | 1.59 | | | | 1.49 | |
Expenses after expense reductions (f) | | | 1.44 | (a) | | | 1.44 | | | | N/A | | | | N/A | | | | N/A | | | | N/A | |
Net investment income | | | 0.69 | (a) | | | 0.44 | | | | 0.49 | | | | 0.42 | | | | 0.58 | | | | 0.67 | |
Portfolio turnover | | | 17 | (n) | | | 40 | | | | 36 | | | | 61 | | | | 76 | | | | 81 | |
Net assets at end of period (000 omitted) | | | $2,873 | | | | $3,152 | | | | $3,101 | | | | $4,098 | | | | $5,002 | | | | $4,670 | |
See Notes to Financial Statements
9
MFS Global Growth Portfolio
Financial Highlights – continued
| (d) | Per share data is based on average shares outstanding. |
| (f) | Ratios do not reflect reductions from fees paid indirectly, if applicable. |
| (k) | The total return does not reflect expenses that apply to separate accounts. Inclusion of these charges would reduce the total return figures for all periods shown. |
| (r) | Certain expenses have been reduced without which performance would have been lower. |
| (s) | From time to time the fund may receive proceeds from litigation settlements, without which performance would be lower. |
| (x) | The net asset values per share and total returns have been calculated on net assets which include adjustments made in accordance with U.S. generally accepted accounting principles required at period end for financial reporting purposes. |
See Notes to Financial Statements
10
MFS Global Growth Portfolio
NOTES TO FINANCIAL STATEMENTS (unaudited)
| (1) | | Business and Organization |
MFS Global Growth Portfolio (the fund) is a series of MFS Variable Insurance Trust II (the trust). The trust is organized as a Massachusetts business trust and is registered under the Investment Company Act of 1940, as amended, as an open-end management investment company. The shareholders of each series of the trust are separate accounts of insurance companies, which offer variable annuity and/or life insurance products, and qualified retirement and pension plans.
| (2) | | Significant Accounting Policies |
General – The preparation of financial statements in conformity with U.S. generally accepted accounting principles requires management to make estimates and assumptions that affect the reported amounts of assets and liabilities, and disclosure of contingent assets and liabilities at the date of the financial statements and the reported amounts of revenues and expenses during the reporting period. Actual results could differ from those estimates. In the preparation of these financial statements, management has evaluated subsequent events occurring after the date of the fund’s Statement of Assets and Liabilities through the date that the financial statements were issued. The fund invests in foreign securities. Investments in foreign securities are vulnerable to the effects of changes in the relative values of the local currency and the U.S. dollar and to the effects of changes in each country’s legal, political, and economic environment.
In this reporting period, the fund adopted the disclosure provisions of the Financial Accounting Standards Board (FASB) Accounting Standards Update 2011-11 (“ASU 2011-11”), Balance Sheet (Topic 210) – Disclosures about Offsetting Assets and Liabilities along with the related scope clarification provisions of FASB Accounting Standards Update 2013-01 (“ASU 2013-01”) entitled Balance Sheet (Topic 210) – Clarifying the Scope of Disclosures about Offsetting Assets and Liabilities. ASU 2011-11 is intended to enhance disclosures on the offsetting of financial assets and liabilities by requiring entities to disclose both gross and net information about financial instruments and transactions that are either offset in the statement of financial position or subject to a Master Netting Agreement or similar arrangement. ASU 2013-01 limits the scope of ASU 2011-11’s disclosure requirements on offsetting to financial assets and financial liabilities related to derivatives, repurchase and reverse repurchase agreements, and securities lending and securities borrowing transactions. The disclosures required by ASU 2011-11, to the extent applicable to the fund, have been included in the fund’s Significant Accounting Policies note under the captions for each of the fund’s in-scope financial instruments and transactions.
In June 2013, FASB issued Accounting Standards Update 2013-08 Financial Services – Investment Companies (Topic 946) – Amendments to the Scope, Measurement, and Disclosure Requirements (“ASU 2013-08”) which is effective for interim and annual reporting periods in fiscal years that begin after December 15, 2013. ASU 2013-08 sets forth a methodology for determining whether an entity should be characterized as an investment company and prescribes fair value accounting for an investment company’s non-controlling ownership interest in another investment company. FASB has determined that a fund registered under the Investment Company Act of 1940 automatically meets ASU 2013-08’s criteria for an investment company. Although still evaluating the potential impacts of ASU 2013-08 to the fund, management expects that the impact of the fund’s adoption will be limited to additional financial statement disclosures.
Investment Valuations – Equity securities, including restricted equity securities, are generally valued at the last sale or official closing price as provided by a third-party pricing service on the market or exchange on which they are primarily traded. Equity securities, for which there were no sales reported that day, are generally valued at the last quoted daily bid quotation as provided by a third-party pricing service on the market or exchange on which such securities are primarily traded. Short-term instruments with a maturity at issuance of 60 days or less generally are valued at amortized cost, which approximates market value. Open-end investment companies are generally valued at net asset value per share. Securities and other assets generally valued on the basis of information from a third-party pricing service may also be valued at a broker/dealer bid quotation. Values obtained from third-party pricing services can utilize both transaction data and market information such as yield, quality, coupon rate, maturity, type of issue, trading characteristics, and other market data. The values of foreign securities and other assets and liabilities expressed in foreign currencies are converted to U.S. dollars using the mean of bid and asked prices for rates provided by a third-party pricing service.
The Board of Trustees has delegated primary responsibility for determining or causing to be determined the value of the fund’s investments (including any fair valuation) to the adviser pursuant to valuation policies and procedures approved by the Board. If the adviser determines that reliable market quotations are not readily available, investments are valued at fair value as determined in good faith by the adviser in accordance with such procedures under the oversight of the Board of Trustees. Under the fund’s valuation policies and procedures, market quotations are not considered to be readily available for most types of debt instruments and floating rate loans and many types of derivatives. These investments are generally valued at fair value based on information from third-party pricing services. In addition, investments may be valued at fair value if the adviser determines that an investment’s value has been materially affected by events occurring after the close of the exchange or market on which the investment is principally traded (such as foreign exchange or market) and prior to the determination of the fund’s net asset value, or after the halting of trading of a specific security where trading does not resume prior to the close of the exchange or market on which the security is principally traded. Events that occur on a frequent basis after foreign markets close (such as developments in foreign markets and significant movements in the U.S. markets) and prior to the determination of the fund’s net asset value may be deemed to have a
11
MFS Global Growth Portfolio
Notes to Financial Statements (unaudited) – continued
material effect on the value of securities traded in foreign markets. Accordingly, the fund’s foreign equity securities may often be valued at fair value. The adviser generally relies on third-party pricing services or other information (such as the correlation with price movements of similar securities in the same or other markets; the type, cost and investment characteristics of the security; the business and financial condition of the issuer; and trading and other market data) to assist in determining whether to fair value and at what value to fair value an investment. The value of an investment for purposes of calculating the fund’s net asset value can differ depending on the source and method used to determine value. When fair valuation is used, the value of an investment used to determine the fund’s net asset value may differ from quoted or published prices for the same investment. There can be no assurance that the fund could obtain the fair value assigned to an investment if it were to sell the investment at the same time at which the fund determines its net asset value per share.
Various inputs are used in determining the value of the fund’s assets or liabilities. These inputs are categorized into three broad levels. In certain cases, the inputs used to measure fair value may fall into different levels of the fair value hierarchy. In such cases, an investment’s level within the fair value hierarchy is based on the lowest level of input that is significant to the fair value measurement. The fund’s assessment of the significance of a particular input to the fair value measurement in its entirety requires judgment, and considers factors specific to the investment. Level 1 includes unadjusted quoted prices in active markets for identical assets or liabilities. Level 2 includes other significant observable market-based inputs (including quoted prices for similar securities, interest rates, prepayment speed, and credit risk). Level 3 includes unobservable inputs, which may include the adviser’s own assumptions in determining the fair value of investments. The following is a summary of the levels used as of June 30, 2013 in valuing the fund’s assets or liabilities:
| | | | | | | | | | | | | | | | |
| Investments at Value | | Level 1 | | | Level 2 | | | Level 3 | | | Total | |
| Equity Securities: | | | | | | | | | | | | | | | | |
United States | | | $30,898,451 | | | | $— | | | | $— | | | | $30,898,451 | |
United Kingdom | | | 267,630 | | | | 6,700,260 | | | | — | | | | 6,967,890 | |
France | | | 3,582,088 | | | | 3,196,603 | | | | — | | | | 6,778,691 | |
Switzerland | | | 767,717 | | | | 3,019,599 | | | | — | | | | 3,787,316 | |
Germany | | | 1,094,544 | | | | 1,287,154 | | | | — | | | | 2,381,698 | |
Brazil | | | 2,087,161 | | | | — | | | | — | | | | 2,087,161 | |
Taiwan | | | 860,271 | | | | — | | | | — | | | | 860,271 | |
South Korea | | | 419,503 | | | | 294,565 | | | | — | | | | 714,068 | |
Spain | | | 667,239 | | | | — | | | | — | | | | 667,239 | |
Other Countries | | | 1,881,216 | | | | 1,605,943 | | | | — | | | | 3,487,159 | |
| Mutual Funds | | | 351,735 | | | | — | | | | — | | | | 351,735 | |
| Total Investments | | | $42,877,555 | | | | $16,104,124 | | | | $— | | | | $58,981,679 | |
For further information regarding security characteristics, see the Portfolio of Investments.
Of the level 2 investments presented above, equity investments amounting to $839,518 would have been considered level 1 investments at the beginning of the period. Of the level 1 investments presented above, equity investments amounting to $8,404,805 would have been considered level 2 investments at the beginning of the period. The primary reason for changes in the classifications between levels 1 and 2 occurs when foreign equity securities are fair valued using other observable market-based inputs in place of the closing exchange price due to events occurring after the close of the exchange or market on which the investment is principally traded. The fund’s foreign equity securities may often be valued at fair value. The fund’s policy is to recognize transfers between the levels as of the end of the period.
Foreign Currency Translation – Purchases and sales of foreign investments, income, and expenses are converted into U.S. dollars based upon currency exchange rates prevailing on the respective dates of such transactions or on the reporting date for foreign denominated receivables and payables. Gains and losses attributable to foreign currency exchange rates on sales of securities are recorded for financial statement purposes as net realized gains and losses on investments. Gains and losses attributable to foreign exchange rate movements on receivables, payables, income and expenses are recorded for financial statement purposes as foreign currency transaction gains and losses. That portion of both realized and unrealized gains and losses on investments that results from fluctuations in foreign currency exchange rates is not separately disclosed.
Security Loans – Under its Securities Lending Agency Agreement with the fund, State Street Bank and Trust Company (“State Street”), as lending agent, loans the securities of the fund to certain qualified institutions (the “Borrowers”) approved by the fund. The loans are collateralized by cash and/or U.S. Treasury and federal agency obligations in an amount typically at least equal to the market value of the securities loaned. The market value of the loaned securities is determined at the close of business of the fund and any additional required collateral is delivered to the fund on the next business day. State Street provides the fund with indemnification against Borrower default. In the event of Borrower default, State Street will for the benefit of the fund either purchase securities identical to those loaned or, when such purchase is commercially impracticable, pay the fund the market value of the loaned securities. In return, State Street assumes the fund’s rights to the related collateral. If the collateral value is less than the
12
MFS Global Growth Portfolio
Notes to Financial Statements (unaudited) – continued
cost to purchase identical securities, State Street is responsible for the shortfall, but only to the extent that such shortfall is not due to a decline in collateral value resulting from collateral reinvestment for which the fund bears the risk of loss. On loans collateralized by cash, the cash collateral is invested in a money market fund or short-term securities. A portion of the income generated upon investment of the collateral is remitted to the Borrowers, and the remainder is allocated between the fund and the lending agent. On loans collateralized by U.S. Treasury and/or federal agency obligations, a fee is received from the Borrower, and is allocated between the fund and the lending agent. Income from securities lending is included in “Interest” income in the Statement of Operations. The dividend and interest income earned on the securities loaned is accounted for in the same manner as other dividend and interest income. At June 30, 2013, there were no securities on loan or collateral outstanding.
Indemnifications – Under the fund’s organizational documents, its officers and Trustees may be indemnified against certain liabilities and expenses arising out of the performance of their duties to the fund. Additionally, in the normal course of business, the fund enters into agreements with service providers that may contain indemnification clauses. The fund’s maximum exposure under these agreements is unknown as this would involve future claims that may be made against the fund that have not yet occurred.
Investment Transactions and Income – Investment transactions are recorded on the trade date. Interest income is recorded on the accrual basis. Dividends received in cash are recorded on the ex-dividend date. Certain dividends from foreign securities will be recorded when the fund is informed of the dividend if such information is obtained subsequent to the ex-dividend date. Dividend and interest payments received in additional securities are recorded on the ex-dividend or ex-interest date in an amount equal to the value of the security on such date.
The fund may receive proceeds from litigation settlements. Any proceeds received from litigation involving portfolio holdings are reflected in the Statement of Operations in realized gain/loss if the security has been disposed of by the fund or in unrealized gain/loss if the security is still held by the fund. Any other proceeds from litigation not related to portfolio holdings are reflected as other income in the Statement of Operations.
Fees Paid Indirectly – The fund’s custody fee may be reduced according to an arrangement that measures the value of cash deposited with the custodian by the fund. This amount, for the six months ended June 30, 2013, is shown as a reduction of total expenses in the Statement of Operations.
Tax Matters and Distributions – The fund intends to qualify as a regulated investment company, as defined under Subchapter M of the Internal Revenue Code, and to distribute all of its taxable income, including realized capital gains. As a result, no provision for federal income tax is required. The fund’s federal tax returns, when filed, will remain subject to examination by the Internal Revenue Service for a three year period. Foreign taxes have been accrued by the fund in the accompanying financial statements in accordance with the applicable foreign tax law. Foreign income taxes may be withheld by certain countries in which the fund invests.
Distributions to shareholders are recorded on the ex-dividend date. Income and capital gain distributions are determined in accordance with income tax regulations, which may differ from U.S. generally accepted accounting principles. Certain capital accounts in the financial statements are periodically adjusted for permanent differences in order to reflect their tax character. These adjustments have no impact on net assets or net asset value per share. Temporary differences which arise from recognizing certain items of income, expense, gain or loss in different periods for financial statement and tax purposes will reverse at some time in the future. Distributions in excess of net investment income or net realized gains are temporary overdistributions for financial statement purposes resulting from differences in the recognition or classification of income or distributions for financial statement and tax purposes.
Book/tax differences primarily relate to wash sale loss deferrals.
The tax character of distributions declared to shareholders for the last fiscal year is as follows:
| | | | |
| | | 12/31/12 | |
| Ordinary income (including any short-term capital gains) | | | $430,008 | |
The federal tax cost and the tax basis components of distributable earnings were as follows:
| | | | |
| As of 6/30/13 | | | | |
| Cost of investments | | | $51,756,658 | |
| Gross appreciation | | | 9,908,565 | |
| Gross depreciation | | | (2,683,544 | ) |
| Net unrealized appreciation (depreciation) | | | $7,225,021 | |
| |
| As of 12/31/12 | | | | |
| Undistributed ordinary income | | | 402,928 | |
| Capital loss carryforwards | | | (7,032,057 | ) |
| Other temporary differences | | | (367 | ) |
| Net unrealized appreciation (depreciation) | | | 7,773,867 | |
13
MFS Global Growth Portfolio
Notes to Financial Statements (unaudited) – continued
The aggregate cost above includes prior fiscal year end tax adjustments, if applicable.
Under the Regulated Investment Company Modernization Act of 2010 (the “Act”), net capital losses recognized for fund fiscal years beginning after December 31, 2010 may be carried forward indefinitely, and their character is retained as short-term and/or long-term losses (“post-enactment losses”). Previously, net capital losses were carried forward for eight years and treated as short-term losses (“pre-enactment losses”). As a transition rule, the Act requires that all post-enactment net capital losses be used before pre-enactment net capital losses.
As of December 31, 2012, the fund had capital loss carryforwards available to offset future realized gains. Such pre-enactment losses expire as follows:
| | | | |
| 12/31/16 | | | $(1,708,730 | ) |
| 12/31/17 | | | (5,323,327 | ) |
| Total | | | $(7,032,057 | ) |
Multiple Classes of Shares of Beneficial Interest – The fund offers multiple classes of shares, which differ in their respective distribution and/or service fees. The fund’s income, realized and unrealized gain (loss), and common expenses are allocated to shareholders based on the daily net assets of each class. Dividends are declared separately for each class. Differences in per share dividend rates are generally due to differences in separate class expenses. The fund’s distributions declared to shareholders as reported in the Statements of Changes in Net Assets are presented by class as follows:
| | | | | | | | |
| | | From net investment
income | |
| | | Six months ended
6/30/13 | | | Year ended
12/31/12 | |
| Initial Class | | | $— | | | | $414,299 | |
| Service Class | | | — | | | | 15,709 | |
| Total | | | $— | | | | $430,008 | |
| (3) | | Transactions with Affiliates |
Investment Adviser – The fund has an investment advisory agreement with MFS to provide overall investment management and related administrative services and facilities to the fund. The management fee is computed daily and paid monthly at the following annual rates:
| | | | |
| First $1 billion of average daily net assets | | | 0.90% | |
| Next $1 billion of average daily net assets | | | 0.75% | |
| Average daily net assets in excess of $2 billion | | | 0.65% | |
Effective April 1, 2013, MFS has agreed in writing to reduce its management fee by a specified amount if certain MFS mutual fund assets exceed thresholds agreed to by MFS and the fund’s Board of Trustees. For the period April 1, 2013 through June 30, 2013, this management fee reduction amounted to $83, which is shown as a reduction of total expenses in the Statement of Operations. The management fee incurred for the six months ended June 30, 2013 was equivalent to an annual effective rate of 0.90% of the fund’s average daily net assets.
The investment adviser has agreed in writing to pay a portion of the fund’s total annual operating expenses, exclusive of interest, taxes, extraordinary expenses, brokerage and transaction costs, and investment-related expenses, such that total annual operating expenses do not exceed 1.40% of average daily net assets for the Initial Class shares and 1.65% of average daily net assets for the Service Class shares. This written agreement will continue until modified by the fund’s Board of Trustees, but such agreement will continue at least until April 30, 2015. For the six months ended June 30, 2013, the fund’s actual operating expenses did not exceed the limit and therefore, the investment adviser did not pay any portion of the fund’s expenses related to this agreement.
Distributor – MFS Fund Distributors, Inc. (MFD), a wholly-owned subsidiary of MFS, is the distributor of shares of the fund. The Trustees have adopted a distribution plan for the Service Class shares pursuant to Rule 12b-1 under the Investment Company Act of 1940.
The fund’s distribution plan provides that the fund will pay MFD distribution and/or service fees equal to 0.25% per annum of its average daily net assets attributable to Service Class shares as partial consideration for services performed and expenses incurred by MFD and financial intermediaries (including participating insurance companies that invest in the fund to fund variable annuity and variable life insurance contracts, sponsors of qualified retirement and pension plans that invest in the fund, and affiliates of these participating insurance companies and plan sponsors) in connection with the sale and distribution of the Service Class shares. MFD may subsequently pay all, or a portion, of the distribution and/or service fees to financial intermediaries.
Shareholder Servicing Agent – MFS Service Center, Inc. (MFSC), a wholly-owned subsidiary of MFS, receives a fee from the fund for its services as shareholder servicing agent. For the six months ended June 30, 2013, the fee was $1,637, which equated to
14
MFS Global Growth Portfolio
Notes to Financial Statements (unaudited) – continued
0.0053% annually of the fund’s average daily net assets. MFSC also receives payment from the fund for out-of-pocket expenses paid by MFSC on behalf of the fund. For the six months ended June 30, 2013, these costs amounted to $2.
Administrator – MFS provides certain financial, legal, shareholder communications, compliance, and other administrative services to the fund. Under an administrative services agreement, the fund partially reimburses MFS the costs incurred to provide these services. The fund is charged an annual fixed amount of $17,500 plus a fee based on average daily net assets. The administrative services fee incurred for the six months ended June 30, 2013 was equivalent to an annual effective rate of 0.0307% of the fund’s average daily net assets.
Trustees’ and Officers’ Compensation – The fund pays compensation to independent Trustees in the form of a retainer, attendance fees, and additional compensation to Board and Committee chairpersons. The fund does not pay compensation directly to Trustees or officers of the fund who are also officers of the investment adviser, all of whom receive remuneration for their services to the fund from MFS. Certain officers and Trustees of the fund are officers or directors of MFS, MFD, and MFSC.
Other – This fund and certain other funds managed by MFS (the funds) have entered into services agreements (the Agreements) which provide for payment of fees by the funds to Tarantino LLC and Griffin Compliance LLC in return for the provision of services of an Independent Chief Compliance Officer (ICCO) and Assistant ICCO, respectively, for the funds. The ICCO and Assistant ICCO are officers of the funds and the sole members of Tarantino LLC and Griffin Compliance LLC, respectively. The funds can terminate the Agreements with Tarantino LLC and Griffin Compliance LLC at any time under the terms of the Agreements. For the six months ended June 30, 2013, the aggregate fees paid by the fund to Tarantino LLC and Griffin Compliance LLC were $236 and are included in “Miscellaneous” expense in the Statement of Operations. MFS has agreed to reimburse the fund for a portion of the payments made by the fund in the amount of $117, which is shown as a reduction of total expenses in the Statement of Operations. Additionally, MFS has agreed to bear all expenses associated with office space, other administrative support, and supplies provided to the ICCO and Assistant ICCO.
The fund invests in the MFS Institutional Money Market Portfolio which is managed by MFS and seeks current income consistent with preservation of capital and liquidity. Income earned on this investment is included in “Dividends from underlying affiliated funds” in the Statement of Operations. This money market fund does not pay a management fee to MFS.
Purchases and sales of investments, other than short-term obligations, aggregated $10,100,694 and $14,357,753, respectively.
| (5) | | Shares of Beneficial Interest |
The fund’s Declaration of Trust permits the Trustees to issue an unlimited number of full and fractional shares of beneficial interest. Transactions in fund shares were as follows:
| | | | | | | | | | | | | | | | |
| | | Six months ended 6/30/13 | | | Year ended 12/31/12 | |
| | | Shares | | | Amount | | | Shares | | | Amount | |
| Shares sold | | | | | | | | | | | | | | | | |
Initial Class | | | 12,913 | | | | $243,471 | | | | 26,437 | | | | $433,659 | |
Service Class | | | 4,844 | | | | 90,432 | | | | 26,595 | | | | 450,556 | |
| | | 17,757 | | | | $333,903 | | | | 53,032 | | | | $884,215 | |
| Shares issued to shareholders in reinvestment of distributions | | | | | | | | | | | | | | | | |
Initial Class | | | — | | | | $— | | | | 24,838 | | | | $414,299 | |
Service Class | | | — | | | | — | | | | 945 | | | | 15,709 | |
| | | — | | | | $— | | | | 25,783 | | | | $430,008 | |
| Shares reacquired | | | | | | | | | | | | | | | | |
Initial Class | | | (218,231 | ) | | | $(4,152,067 | ) | | | (588,888 | ) | | | $(9,932,676 | ) |
Service Class | | | (27,337 | ) | | | (515,827 | ) | | | (57,532 | ) | | | (979,530 | ) |
| | | (245,568 | ) | | | $(4,667,894 | ) | | | (646,420 | ) | | | $(10,912,206 | ) |
| Net change | | | | | | | | | | | | | | | | |
Initial Class | | | (205,318 | ) | | | $(3,908,596 | ) | | | (537,613 | ) | | | $(9,084,718 | ) |
Service Class | | | (22,493 | ) | | | (425,395 | ) | | | (29,992 | ) | | | (513,265 | ) |
| | | (227,811 | ) | | | $(4,333,991 | ) | | | (567,605 | ) | | | $(9,597,983 | ) |
The fund and certain other funds managed by MFS participate in a $1.1 billion unsecured committed line of credit, subject to a $1 billion sublimit, provided by a syndication of banks under a credit agreement. Borrowings may be made for temporary financing needs. Interest is charged to each fund, based on its borrowings, generally at a rate equal to the higher of the Federal Reserve funds rate or one month LIBOR plus an agreed upon spread. A commitment fee, based on the average daily, unused portion of the committed line of credit, is allocated among the participating funds at the end of each calendar quarter. In addition, the fund and
15
MFS Global Growth Portfolio
Notes to Financial Statements (unaudited) – continued
other funds managed by MFS have established unsecured uncommitted borrowing arrangements with certain banks for temporary financing needs. Interest is charged to each fund, based on its borrowings, at a rate equal to the Federal Reserve funds rate plus an agreed upon spread. For the six months ended June 30, 2013, the fund’s commitment fee and interest expense were $155 and $0, respectively, and are included in “Miscellaneous” expense in the Statement of Operations.
| (7) | | Transactions in Underlying Affiliated Funds – Affiliated Issuers |
An affiliated issuer may be considered one in which the fund owns 5% or more of the outstanding voting securities, or a company which is under common control. For the purposes of this report, the fund assumes the following to be an affiliated issuer:
| | | | | | | | | | | | | | | | |
| Underlying Affiliated Fund | | Beginning
Shares/Par
Amount | | | Acquisitions
Shares/Par
Amount | | | Dispositions
Shares/Par
Amount | | | Ending
Shares/Par
Amount | |
| MFS Institutional Money Market Portfolio | | | 207,579 | | | | 5,001,231 | | | | (4,857,075 | ) | | | 351,735 | |
| | | | |
| Underlying Affiliated Fund | | Realized
Gain (Loss) | | | Capital Gain
Distributions | | | Dividend
Income | | | Ending
Value | |
| MFS Institutional Money Market Portfolio | | | $— | | | | $— | | | | $225 | | | | $351,735 | |
16
MFS Global Growth Portfolio
BOARD REVIEW OF INVESTMENT ADVISORY AGREEMENT
A discussion regarding the Board’s most recent review and renewal of the fund’s Investment Advisory Agreement with MFS will be available on or about November 1, 2013 by clicking on the fund’s name under “Variable Insurance Portfolios — VIT II” in the “Products” section of the MFS Web site (mfs.com).
PROXY VOTING POLICIES AND INFORMATION
A general description of the MFS funds’ proxy voting policies and procedures is available without charge, upon request, by calling 1-800-225-2606, by visiting the Proxy Voting section of mfs.com or by visiting the SEC’s Web site at http://www.sec.gov.
Information regarding how the fund voted proxies relating to portfolio securities during the most recent twelve-month period ended June 30 is available without charge by visiting the Proxy Voting section of mfs.com or by visiting the SEC’s Web site at http://www.sec.gov.
QUARTERLY PORTFOLIO DISCLOSURE
The fund will file a complete schedule of portfolio holdings with the Securities and Exchange Commission (the Commission) for the first and third quarters of each fiscal year on Form N-Q. The fund’s Form N-Q is available on the EDGAR database on the Commission’s Internet Web site at http://www.sec.gov, and may be reviewed and copied at the:
Public Reference Room
Securities and Exchange Commission
100 F Street, NE, Room 1580
Washington, D.C. 20549
Information on the operation of the Public Reference Room may be obtained by calling the Commission at 1-800-SEC-0330. Copies of the fund’s Form N-Q also may be obtained, upon payment of a duplicating fee, by electronic request at the following e-mail address: publicinfo@sec.gov or by writing the Public Reference Section at the above address.
FURTHER INFORMATION
From time to time, MFS may post important information about the fund or the MFS funds on the MFS web site (mfs.com). This information is available by visiting the “News & Commentary” section of mfs.com or by clicking on the fund’s name under “Variable Insurance Portfolios — VIT II” in the “Products” section of mfs.com.
17
SEMIANNUAL REPORT
June 30, 2013

MFS® BOND PORTFOLIO
MFS® Variable Insurance Trust II

BDS-SEM
MFS® BOND PORTFOLIO
CONTENTS
The report is prepared for the general information of contract owners. It is authorized for distribution to prospective investors only when preceded or accompanied by a current prospectus.
NOT FDIC INSURED Ÿ MAY LOSE VALUE Ÿ NO BANK OR CREDIT UNION GUARANTEE Ÿ NOT A DEPOSIT Ÿ NOT INSURED BY ANY FEDERAL GOVERNMENT AGENCY OR NCUA/NCUSIF
MFS Bond Portfolio
LETTER FROM THE CHAIRMAN AND CEO

Dear Contract Owners:
As the year progresses, the global economy continues to grind ahead slowly, held back by broad austerity measures. The U.S. economy remains a steadying force, driven by resilient consumers, who have taken the payroll tax increase and the sequestration’s early impact in stride. With U.S. housing and jobs showing steady expansion, domestic consumer-driven growth has offset weaker exports and the U.S. government’s spending constraints. In response to these developments, the U.S. Federal Reserve has begun to brace investors for an eventual shift in its monetary policy, causing global market tremors.
Japan has been another bright spot, with government and central bank stimulus policies leading to increased exports, a resurgent stock market and improved economic sentiment. After a six-month rally, Japan’s stocks slipped late in the second quarter, then picked up momentum on fresh signs that the country could soon break free of its chronic deflation. The major deterrent to global growth remains the eurozone, still in the grip of persistent recession. China has seen its pace of economic growth decelerate, a troubling turn for the country’s trading partners, who have come to rely on it as an engine for global growth.
As always, managing risk in the face of uncertainty remains a top priority for investors. At MFS®, our uniquely collaborative investment process employs integrated, global research and active risk management. Our global team of investment professionals shares ideas and evaluates opportunities across continents, investment disciplines and asset classes — all with a goal of building better insights, and ultimately better results, for our clients.
We are mindful of the many economic challenges investors face, and believe it is more important than ever to maintain a long-term view and employ time-tested principles, such as asset allocation and diversification. We remain confident that our unique approach can serve investors well as they work with their financial advisors to identify and pursue the most suitable opportunities.
Respectfully,

Robert J. Manning
Chairman and Chief Executive Officer
MFS Investment Management®
August 16, 2013
The opinions expressed in this letter are subject to change, may not be relied upon for investment advice, and no forecasts can be guaranteed.
1
MFS Bond Portfolio
PORTFOLIO COMPOSITION
Portfolio structure (i)
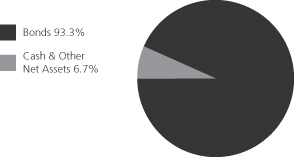
| | | | |
| Fixed income sectors (i) | | | | |
| High Grade Corporates | | | 68.3% | |
| High Yield Corporates | | | 17.4% | |
| Emerging Markets Bonds | | | 5.9% | |
| Commercial Mortgage-Backed Securities | | | 0.9% | |
| Collateralized Debt Obligations | | | 0.4% | |
| Non-U.S. Government Bonds | | | 0.4% | |
| Asset-Backed Securities (o) | | | 0.0% | |
| Mortgage-Backed Securities (o) | | | 0.0% | |
| | | | |
Composition including fixed income credit
quality (a)(i) | |
| AAA (o) | | | 0.0% | |
| AA | | | 0.4% | |
| A | | | 15.5% | |
| BBB | | | 58.3% | |
| BB | | | 16.3% | |
| B | | | 2.5% | |
| CCC | | | 0.1% | |
| C | | | 0.1% | |
| D | | | 0.1% | |
| Federal Agencies (o) | | | 0.0% | |
| Not Rated (o) | | | 0.0% | |
| Cash & Other | | | 6.7% | |
| |
| Portfolio facts (i) | | | | |
| Average Duration (d) | | | 5.2 | |
| Average Effective Maturity (m) | | | 7.5 yrs. | |
| (a) | | For all securities other than those specifically described below, ratings are assigned to underlying securities utilizing ratings from Moody’s, Fitch, and Standard & Poor’s rating agencies and applying the following hierarchy: If all three agencies provide a rating, the middle rating (after dropping the highest and lowest ratings) is assigned; if two of the three agencies rate a security, the lower of the two is assigned. Ratings are shown in the S&P and Fitch scale (e.g., AAA). Securities rated BBB or higher are considered investment grade. All ratings are subject to change. Federal Agencies includes rated and unrated U.S. Agency fixed-income securities, U.S. Agency mortgage-backed securities, and collateralized mortgage obligations of U.S. Agency mortgage-backed securities. Not Rated includes fixed income securities, including fixed income futures contracts, which have not been rated by any rating agency. Cash & Other includes cash, other assets less liabilities, offsets to derivative positions, and short-term securities. The fund may not hold all of these instruments. The fund is not rated by these agencies. |
| (d) | | Duration is a measure of how much a bond’s price is likely to fluctuate with general changes in interest rates, e.g., if rates rise 1.00%, a bond with a 5-year duration is likely to lose about 5.00% of its value due to the interest rate move. |
| (i) | | For purposes of this presentation, the components include the market value of securities, and reflect the impact of the equivalent exposure of derivative positions, if any. These amounts may be negative from time to time. Equivalent exposure is a calculated amount that translates the derivative position into a reasonable approximation of the amount of the underlying asset that the portfolio would have to hold at a given point in time to have the same price sensitivity that results from the portfolio’s ownership of the derivative contract. When dealing with derivatives, equivalent exposure is a more representative measure of the potential impact of a position on portfolio performance than market value. The bond component will include any accrued interest amounts. |
| (m) | | In determining an instrument’s effective maturity for purposes of calculating the fund’s dollar-weighted average effective maturity, MFS uses the instrument’s stated maturity or, if applicable, an earlier date on which MFS believes it is probable that a maturity-shortening device (such as a put, pre-refunding or prepayment) will cause the instrument to be repaid. Such an earlier date can be substantially shorter than the instrument’s stated maturity. |
Where the fund holds convertible bonds, these are treated as part of the equity portion of the portfolio.
Percentages are based on net assets as of 6/30/13.
The portfolio is actively managed and current holdings may be different.
2
MFS Bond Portfolio
EXPENSE TABLE
Fund Expenses Borne by the Contract Holders During the Period,
January 1, 2013 through June 30, 2013
As a contract holder of the fund, you incur ongoing costs, including management fees; distribution and/or service (12b-1) fees; and other fund expenses. This example is intended to help you understand your ongoing costs (in dollars) of investing in the fund and to compare these costs with the ongoing costs of investing in other mutual funds.
The example is based on an investment of $1,000 invested at the beginning of the period and held for the entire period January 1, 2013 through June 30, 2013.
Actual Expenses
The first line for each share class in the following table provides information about actual account values and actual expenses. You may use the information in this line, together with the amount you invested, to estimate the expenses that you paid over the period. Simply divide your account value by $1,000 (for example, an $8,600 account value divided by $1,000 = 8.6), then multiply the result by the number in the first line under the heading entitled “Expenses Paid During Period” to estimate the expenses you paid on your account during this period.
Hypothetical Example for Comparison Purposes
The second line for each share class in the following table provides information about hypothetical account values and hypothetical expenses based on the fund’s actual expense ratio and an assumed rate of return of 5% per year before expenses, which is not the fund’s actual return. The hypothetical account values and expenses may not be used to estimate the actual ending account balance or expenses you paid for the period. You may use this information to compare the ongoing costs of investing in the fund and other funds. To do so, compare this 5% hypothetical example with the 5% hypothetical examples that appear in the shareholder reports of the other funds.
Please note that the expenses shown in the table are meant to highlight the fund’s ongoing costs only and do not take into account the fees and expenses imposed under the variable contracts through which your investment in the fund is made. Therefore, the second line for each share class in the table is useful in comparing ongoing costs associated with an investment in vehicles (such as the fund) which fund benefits under variable annuity and variable life insurance contracts and to qualified pension and retirement plans only, and will not help you determine the relative total costs of investing in the fund through variable annuity and variable life insurance contracts. If the fees and expenses imposed under the variable contracts were included, your costs would have been higher.
| | | | | | | | | | | | | | | | | | |
| Share Class | | | | Annualized
Expense Ratio | | | Beginning
Account Value
1/01/13 | | | Ending
Account Value
6/30/13 | | | Expenses Paid
During Period (p)
1/01/13-6/30/13 | |
| Initial Class | | Actual | | | 0.67% | | | | $1,000.00 | | | | $974.92 | | | | $3.28 | |
| | Hypothetical (h) | | | 0.67% | | | | $1,000.00 | | | | $1,021.47 | | | | $3.36 | |
| Service Class | | Actual | | | 0.92% | | | | $1,000.00 | | | | $973.84 | | | | $4.50 | |
| | Hypothetical (h) | | | 0.92% | | | | $1,000.00 | | | | $1,020.23 | | | | $4.61 | |
| (h) | 5% class return per year before expenses. |
| (p) | Expenses paid are equal to each class’s annualized expense ratio, as shown above, multiplied by the average account value over the period, multiplied by the number of days in the period, divided by the number of days in the year. |
3
MFS Bond Portfolio
PORTFOLIO OF INVESTMENTS – 6/30/13 (unaudited)
The Portfolio of Investments is a complete list of all securities owned by your fund. It is categorized by broad-based asset classes.
| | | | | | | | |
| Issuer | | Shares/Par | | | Value ($) | |
| | | | | | | | |
| BONDS – 92.1% | | | | | | | | |
| Aerospace – 0.3% | | | | | | | | |
| BE Aerospace, Inc., 5.25%, 2022 | | $ | 773,000 | | | $ | 769,135 | |
| | | | | | | | |
| Airlines – 0.1% | | | | | | | | |
| Continental Airlines, Inc., 7.25%, 2021 | | $ | 319,259 | | | $ | 373,533 | |
| | | | | | | | |
| Apparel Manufacturers – 0.7% | | | | | |
| PVH Corp., 7.375%, 2020 | | $ | 1,702,000 | | | $ | 1,846,670 | |
| PVH Corp., 4.5%, 2022 | | | 190,000 | | | | 182,400 | |
| | | | | | | | |
| | | | | | $ | 2,029,070 | |
| | | | | | | | |
| Asset-Backed & Securitized – 1.4% | |
| Anthracite Ltd., “A”, CDO, FRN, 0.553%, 2019 (z) | | $ | 231,203 | | | $ | 229,284 | |
| Bayview Financial Revolving Mortgage Loan Trust, FRN, 1.795%, 2040 (z) | | | 295,720 | | | | 142,802 | |
| Capital Trust Realty Ltd., CDO, 5.16%, 2035 (n) | | | 319,653 | | | | 319,845 | |
| Commercial Mortgage Acceptance Corp., FRN, 2.116%, 2030 (i) | | | 543,247 | | | | 19,286 | |
| Falcon Franchise Loan LLC, FRN, 11.464%, 2025 (i)(z) | | | 210,259 | | | | 31,539 | |
| G-Force LLC, CDO, “A2”, 4.83%, 2036 (z) | | | 311,254 | | | | 312,810 | |
| GMAC LLC, FRN, 8.388%, 2034 (d)(n)(q) | | | 524,002 | | | | 338,980 | |
| Greenwich Capital Commercial Funding Corp., FRN, 6.056%, 2038 | | | 350,000 | | | | 382,428 | |
| JPMorgan Chase Commercial Mortgage Securities Corp., “A4”, FRN, 6.002%, 2049 | | | 1,195,039 | | | | 1,337,363 | |
| JPMorgan Chase Commercial Mortgage Securities Corp., FRN, 5.62%, 2042 (n) | | | 765,072 | | | | 130,106 | |
| KKR Financial CLO Ltd., “C”, FRN, 1.725%, 2021 (n) | | | 505,395 | | | | 487,706 | |
| Lehman Brothers Commercial Conduit Mortgage Trust, FRN, 1.176%, 2030 (i) | | | 563,940 | | | | 11,195 | |
| Morgan Stanley Capital I, Inc., FRN, 1.117%, 2030 (i)(n) | | | 1,329,217 | | | | 39,201 | |
| Spirit Master Funding LLC, 5.05%, 2023 (z) | | | 289,071 | | | | 289,938 | |
| | | | | | | | |
| | | | | | $ | 4,072,483 | |
| | | | | | | | |
| Automotive – 5.3% | | | | | |
| American Honda Finance Corp., 2.125%, 2017 (n) | | $ | 1,672,000 | | | $ | 1,690,981 | |
| Delphi Corp., 6.125%, 2021 | | | 1,271,000 | | | | 1,385,390 | |
| Ford Motor Credit Co. LLC, 4.207%, 2016 | | | 560,000 | | | | 585,003 | |
| Ford Motor Credit Co. LLC, 3.984%, 2016 | | | 638,000 | | | | 668,388 | |
| General Motors Financial Co., 2.75%, 2016 (z) | | | 170,000 | | | | 167,238 | |
| Harley Davidson Financial Services, 1.15%, 2015 (n) | | | 607,000 | | | | 605,918 | |
| Harley-Davidson Financial Services, 3.875%, 2016 (n) | | | 1,061,000 | | | | 1,124,971 | |
| Harley-Davidson Financial Services, 2.7%, 2017 (n) | | | 942,000 | | | | 954,515 | |
| Hyundai Capital America, 2.125%, 2017 (n) | | | 496,000 | | | | 479,523 | |
| Lear Corp., 8.125%, 2020 | | | 1,898,000 | | | | 2,078,310 | |
| | | | | | | | |
| Issuer | | Shares/Par | | | Value ($) | |
| | | | | | | | |
| BONDS – continued | | | | | | | | |
| Automotive – continued | | | | | |
| Lear Corp., 4.75%, 2023 (n) | | $ | 75,000 | | | $ | 71,250 | |
| Nissan Motor Acceptance Corp., 1.95%, 2017 (n) | | | 908,000 | | | | 902,094 | |
| TRW Automotive, Inc., 4.5%, 2021 (n) | | | 940,000 | | | | 937,650 | |
| TRW Automotive, Inc., 7.25%, 2017 (n) | | | 1,613,000 | | | | 1,826,720 | |
| Volkswagen International Finance N.V., 1.15%, 2015 (n) | | | 1,895,000 | | | | 1,899,434 | |
| Volkswagen International Finance N.V., 2.375%, 2017 (n) | | | 500,000 | | | | 507,564 | |
| | | | | | | | |
| | | | | | $ | 15,884,949 | |
| | | | | | | | |
| Biotechnology – 1.1% | | | | | | | | |
| Life Technologies Corp., 6%, 2020 | | $ | 2,997,000 | | | $ | 3,376,327 | |
| | | | | | | | |
| Broadcasting – 1.9% | | | | | | | | |
| CBS Corp., 8.875%, 2019 | | $ | 760,000 | | | $ | 979,445 | |
| CBS Corp., 5.75%, 2020 | | | 440,000 | | | | 499,059 | |
| Discovery Communications, Inc., 4.875%, 2043 | | | 584,000 | | | | 539,853 | |
| News America, Inc., 8.5%, 2025 | | | 770,000 | | | | 979,730 | |
| Omnicom Group, Inc., 3.625%, 2022 | | | 1,283,000 | | | | 1,237,429 | |
| SES S.A., 3.6%, 2023 (n) | | | 585,000 | | | | 568,725 | |
| WPP Finance, 8%, 2014 | | | 366,000 | | | | 394,991 | |
| WPP Finance, 3.625%, 2022 | | | 404,000 | | | | 381,185 | |
| | | | | | | | |
| | | | | | $ | 5,580,417 | |
| | | | | | | | |
| Brokerage & Asset Managers – 0.4% | | | | | |
| Franklin Resources, Inc., 1.375%, 2017 | | $ | 374,000 | | | $ | 362,817 | |
| TD Ameritrade Holding Co., 4.15%, 2014 | | | 855,000 | | | | 895,203 | |
| | | | | | | | |
| | | | | | $ | 1,258,020 | |
| | | | | | | | |
| Building – 1.2% | | | | | | | | |
| Mohawk Industries, Inc., 6.375%, 2016 | | $ | 2,090,000 | | | $ | 2,307,147 | |
| Mohawk Industries, Inc., 3.85%, 2023 | | | 999,000 | | | | 958,729 | |
| Owens Corning, Inc., 6.5%, 2016 | | | 451,000 | | | | 503,445 | |
| | | | | | | | |
| | | | | | $ | 3,769,321 | |
| | | | | | | | |
| Business Services – 1.0% | | | | | |
| Fidelity National Information Services, Inc., 2%, 2018 | | $ | 135,000 | | | $ | 130,296 | |
| Fidelity National Information Services, Inc., 5%, 2022 | | | 1,270,000 | | | | 1,277,938 | |
| Fidelity National Information Services, Inc., 3.5%, 2023 | | | 416,000 | | | | 375,718 | |
| Tencent Holdings Ltd., 3.375%, 2018 (n) | | | 1,273,000 | | | | 1,268,183 | |
| | | | | | | | |
| | | | | | $ | 3,052,135 | |
| | | | | | | | |
| Cable TV – 3.4% | | | | | | | | |
| CCO Holdings LLC, 5.25%, 2022 | | $ | 1,894,000 | | | $ | 1,799,300 | |
| Comcast Corp., 4.65%, 2042 | | | 628,000 | | | | 602,208 | |
| Cox Communications, Inc., 6.25%, 2018 (n) | | | 261,000 | | | | 305,139 | |
| DIRECTV Holdings LLC, 5.875%, 2019 | | | 490,000 | | | | 551,445 | |
| DIRECTV Holdings LLC, 6.375%, 2041 | | | 690,000 | | | | 721,102 | |
| DIRECTV Holdings LLC, 5.15%, 2042 | | | 750,000 | | | | 669,056 | |
4
MFS Bond Portfolio
Portfolio of Investments (unaudited) – continued
| | | | | | | | |
| Issuer | | Shares/Par | | | Value ($) | |
| | | | | | | | |
| BONDS – continued | | | | | | | | |
| Cable TV – continued | | | | | | | | |
| Lynx I Corp., 5.375%, 2021 (n) | | $ | 275,000 | | | $ | 276,375 | |
| Myriad International Holdings B.V., 6.375%, 2017 (n) | | | 586,000 | | | | 641,670 | |
| NBCUniversal Enterprise, Inc., 1.974%, 2019 (n) | | | 578,000 | | | | 562,543 | |
| Time Warner Cable, Inc., 8.25%, 2019 | | | 850,000 | | | | 1,023,395 | |
| Time Warner Cable, Inc., 5%, 2020 | | | 354,000 | | | | 369,534 | |
| Time Warner Cable, Inc., 4.5%, 2042 | | | 1,002,000 | | | | 777,035 | |
| Time Warner Entertainment Co. LP, 8.375%, 2033 | | | 266,000 | | | | 313,512 | |
| Videotron Ltee, 5%, 2022 | | | 1,555,000 | | | | 1,516,125 | |
| | | | | | | | |
| | | | | | $ | 10,128,439 | |
| | | | | | | | |
| Chemicals – 1.8% | | | | | | | | |
| Ashland, Inc., 3.875%, 2018 (n) | | $ | 375,000 | | | $ | 371,250 | |
| Ashland, Inc., 4.75%, 2022 (n) | | | 698,000 | | | | 691,020 | |
| CF Industries, Inc., 3.45%, 2023 | | | 62,000 | | | | 59,583 | |
| Dow Chemical Co., 8.55%, 2019 | | | 936,000 | | | | 1,194,220 | |
| LyondellBasell Industries N.V., 5%, 2019 | | | 1,614,000 | | | | 1,756,187 | |
| LyondellBasell Industries N.V., 6%, 2021 | | | 1,256,000 | | | | 1,411,375 | |
| | | | | | | | |
| | | | | | $ | 5,483,635 | |
| | | | | | | | |
| Computer Software – 0.0% | | | | | |
| Seagate Technology HDD Holdings, 6.8%, 2016 | | $ | 27,000 | | | $ | 29,901 | |
| Verisign, Inc., 4.625%, 2023 (n) | | | 30,000 | | | | 29,100 | |
| | | | | | | | |
| | | | | | $ | 59,001 | |
| | | | | | | | |
| Conglomerates – 0.9% | | | | | |
| Ingersoll-Rand Global Holding Co., Ltd., 5.75%, 2043 (n) | | $ | 567,000 | | | $ | 576,204 | |
| Pentair Finance S.A., 1.35%, 2015 | | | 702,000 | | | | 703,125 | |
| Roper Industries, Inc., 1.85%, 2017 | | | 1,171,000 | | | | 1,152,444 | |
| Roper Industries, Inc., 2.05%, 2018 | | | 233,000 | | | | 228,524 | |
| | | | | | | | |
| | | | | | $ | 2,660,297 | |
| | | | | | | | |
| Consumer Products – 1.5% | | | | | |
| Avon Products, Inc., 5%, 2023 | | $ | 1,380,000 | | | $ | 1,371,702 | |
| Mattel, Inc., 1.7%, 2018 | | | 393,000 | | | | 383,876 | |
| Mattel, Inc., 5.45%, 2041 | | | 630,000 | | | | 648,554 | |
| Newell Rubbermaid, Inc., 2.05%, 2017 | | | 589,000 | | | | 577,200 | |
| Newell Rubbermaid, Inc., 4.7%, 2020 | | | 501,000 | | | | 535,043 | |
| Tupperware Brands Corp., 4.75%, 2021 | | | 847,000 | | | | 859,053 | |
| | | | | | | | |
| | | | | | $ | 4,375,428 | |
| | | | | | | | |
| Consumer Services – 0.5% | | | | | |
| Experian Finance PLC, 2.375%, 2017 (n) | | $ | 807,000 | | | $ | 799,542 | |
| Service Corp. International, 7%, 2019 | | | 450,000 | | | | 475,875 | |
| Service Corp. International, 5.375%, 2022 (z) | | | 170,000 | | | | 169,575 | |
| | | | | | | | |
| | | | | | $ | 1,444,992 | |
| | | | | | | | |
| Containers – 0.9% | | | | | | | | |
| Ball Corp., 5%, 2022 | | $ | 576,000 | | | $ | 573,120 | |
| Ball Corp., 4%, 2023 | | | 430,000 | | | | 397,750 | |
| Crown Americas LLC, 4.5%, 2023 (n) | | | 645,000 | | | | 607,913 | |
| | | | | | | | |
| Issuer | | Shares/Par | | | Value ($) | |
| | | | | | | | |
| BONDS – continued | | | | | | | | |
| Containers – continued | | | | | | | | |
| Greif, Inc., 6.75%, 2017 | | $ | 1,136,000 | | | $ | 1,249,600 | |
| | | | | | | | |
| | | | | | $ | 2,828,383 | |
| | | | | | | | |
| Defense Electronics – 0.5% | | | | | |
| BAE Systems Holdings, Inc., 6.375%, 2019 (n) | | $ | 1,358,000 | | | $ | 1,572,439 | |
| | | | | | | | |
| Electronics – 0.3% | | | | | | | | |
| Jabil Circuit, Inc., 4.7%, 2022 | | $ | 399,000 | | | $ | 384,038 | |
| Tyco Electronics Group S.A., 6.55%, 2017 | | | 360,000 | | | | 416,736 | |
| Tyco Electronics Group S.A., 3.5%, 2022 | | | 252,000 | | | | 244,196 | |
| | | | | | | | |
| | | | | | $ | 1,044,970 | |
| | | | | | | | |
| Emerging Market Quasi-Sovereign – 1.2% | | | | | |
| CNPC General Capital Ltd., 2.75%, 2017 (z) | | $ | 1,559,000 | | | $ | 1,561,052 | |
| Gaz Capital S.A., 8.125%, 2014 (n) | | | 409,000 | | | | 434,481 | |
| Rosneft, 3.149%, 2017 (n) | | | 533,000 | | | | 525,005 | |
| Rosneft, 4.199%, 2022 (n) | | | 885,000 | | | | 819,950 | |
| State Grid International Development Co. Ltd., 1.75%, 2018 (z) | | | 247,000 | | | | 236,733 | |
| | | | | | | | |
| | | | | | $ | 3,577,221 | |
| | | | | | | | |
| Energy – Independent – 3.5% | | | | | | | | |
| Anadarko Petroleum Corp., 6.375%, 2017 | | $ | 1,337,000 | | | $ | 1,537,523 | |
| Continental Resources, Inc., 4.5%, 2023 (n) | | | 492,000 | | | | 478,470 | |
| EQT Corp., 4.875%, 2021 | | | 253,000 | | | | 260,283 | |
| Hess Corp., 8.125%, 2019 | | | 440,000 | | | | 551,532 | |
| Noble Energy, Inc., 4.15%, 2021 | | | 1,920,000 | | | | 1,982,425 | |
Pioneer Natural Resources Co.,
6.65%, 2017 | | | 1,100,000 | | | | 1,254,770 | |
| Pioneer Natural Resources Co., 7.5%, 2020 | | | 1,518,000 | | | | 1,864,057 | |
| QEP Resources, Inc., 5.375%, 2022 | | | 259,000 | | | | 256,410 | |
| QEP Resources, Inc., 5.25%, 2023 | | | 140,000 | | | | 136,500 | |
| Southwestern Energy Co., 7.5%, 2018 | | | 1,851,000 | | | | 2,194,934 | |
| | | | | | | | |
| | | | | | $ | 10,516,904 | |
| | | | | | | | |
| Energy – Integrated – 1.0% | | | | | |
| Lukoil International Finance B.V., 3.416%, 2018 (n) | | $ | 713,000 | | | $ | 693,393 | |
| Lukoil International Finance B.V., 4.563%, 2023 (n) | | | 964,000 | | | | 896,520 | |
| Murphy Oil Corp., 2.5%, 2017 | | | 1,309,000 | | | | 1,291,046 | |
| Pacific Rubiales Energy Corp., 5.125%, 2023 (n) | | | 100,000 | | | | 94,500 | |
| | | | | | | | |
| | | | | | $ | 2,975,459 | |
| | | | | | | | |
| Entertainment – 0.3% | | | | | | | | |
| Viacom, Inc., 3.5%, 2017 | | $ | 800,000 | | | $ | 837,676 | |
| | | | | | | | |
| Financial Institutions – 4.0% | | | | | |
| CIT Group, Inc., 4.25%, 2017 | | $ | 353,000 | | | $ | 354,765 | |
| CIT Group, Inc., 5.25%, 2018 | | | 365,000 | | | | 375,038 | |
| CIT Group, Inc., 6.625%, 2018 (n) | | | 1,900,000 | | | | 2,052,000 | |
| CIT Group, Inc., 5.5%, 2019 (n) | | | 781,000 | | | | 806,383 | |
| General Electric Capital Corp., 1%, 2016 | | | 846,000 | | | | 841,317 | |
| General Electric Capital Corp., 1.6%, 2017 | | | 883,000 | | | | 861,973 | |
| General Electric Capital Corp., 5.5%, 2020 | | | 1,470,000 | | | | 1,657,404 | |
| General Electric Capital Corp., 3.15%, 2022 | | | 1,000,000 | | | | 944,921 | |
5
MFS Bond Portfolio
Portfolio of Investments (unaudited) – continued
| | | | | | | | |
| Issuer | | Shares/Par | | | Value ($) | |
| | | | | | | | |
| BONDS – continued | | | | | | | | |
| Financial Institutions – continued | | | | | | | | |
| International Lease Finance Corp., 7.125%, 2018 (n) | | $ | 570,000 | | | $ | 629,850 | |
| International Lease Finance Corp., 6.25%, 2019 | | | 1,147,000 | | | | 1,178,543 | |
| SLM Corp., 6.25%, 2016 | | | 727,000 | | | | 770,620 | |
| SLM Corp., 6%, 2017 | | | 1,147,000 | | | | 1,198,615 | |
| SLM Corp., 8%, 2020 | | | 468,000 | | | | 506,610 | |
| | | | | | | | |
| | | | | | $ | 12,178,039 | |
| | | | | | | | |
| Food & Beverages – 4.9% | | | | | |
| Anheuser-Busch InBev S.A., 7.75%, 2019 | | $ | 610,000 | | | $ | 771,548 | |
| BFF International Ltd., 7.25%, 2020 | | | 1,634,000 | | | | 1,790,864 | |
| Conagra Foods, Inc., 1.35%, 2015 | | | 307,000 | | | | 309,103 | |
| Conagra Foods, Inc., 1.9%, 2018 | | | 413,000 | | | | 406,012 | |
| Constellation Brands, Inc., 7.25%, 2016 | | | 1,119,000 | | | | 1,271,464 | |
| Grupo Bimbo S.A.B. de C.V., 4.5%, 2022 (n) | | | 1,517,000 | | | | 1,517,149 | |
| Heineken N.V., 1.4%, 2017 (n) | | | 248,000 | | | | 240,957 | |
| Ingredion, Inc., 1.8%, 2017 | | | 365,000 | | | | 357,934 | |
| J.M. Smucker Co., 3.5%, 2021 | | | 880,000 | | | | 878,196 | |
| Pernod Ricard S.A., 5.75%, 2021 (n) | | | 831,000 | | | | 923,155 | |
| SABMiller Holdings, Inc., 3.75%, 2022 (n) | | | 1,341,000 | | | | 1,364,717 | |
| Smithfield Foods, Inc., 7.75%, 2017 | | | 1,370,000 | | | | 1,510,425 | |
| Smithfield Foods, Inc., 6.625%, 2022 | | | 348,000 | | | | 374,100 | |
| Tyson Foods, Inc., 6.6%, 2016 | | | 2,229,000 | | | | 2,517,736 | |
| Tyson Foods, Inc., 4.5%, 2022 | | | 598,000 | | | | 611,051 | |
| | | | | | | | |
| | | | | | $ | 14,844,411 | |
| | | | | | | | |
| Food & Drug Stores – 1.1% | | | | | |
| CVS Caremark Corp., 3.25%, 2015 | | $ | 296,000 | | | $ | 308,045 | |
| CVS Caremark Corp., 5.75%, 2017 | | | 324,000 | | | | 372,215 | |
| CVS Caremark Corp., 2.75%, 2022 | | | 500,000 | | | | 467,148 | |
| CVS Caremark Corp., 5.75%, 2041 | | | 1,465,000 | | | | 1,651,388 | |
| Walgreen Co., 1.8%, 2017 | | | 616,000 | | | | 608,291 | |
| | | | | | | | |
| | | | | | $ | 3,407,087 | |
| | | | | | | | |
| Forest & Paper Products – 0.9% | | | | | |
| Fibria Overseas Finance Ltd., 7.5%, 2020 (n) | | $ | 249,000 | | | $ | 268,920 | |
| Georgia-Pacific LLC, 5.4%, 2020 (n) | | | 806,000 | | | | 898,771 | |
| International Paper Co., 6%, 2041 | | | 860,000 | | | | 914,871 | |
| Packaging Corp. of America, 3.9%, 2022 | | | 712,000 | | | | 698,363 | |
| | | | | | | | |
| | | | | | $ | 2,780,925 | |
| | | | | | | | |
| Gaming & Lodging – 1.1% | | | | | |
| Carnival Corp., 1.875%, 2017 | | $ | 435,000 | | | $ | 420,175 | |
| Host Hotels & Resorts, Inc., REIT, 6.75%, 2016 | | | 700,000 | | | | 710,360 | |
| Host Hotels & Resorts, Inc., REIT, 4.75%, 2023 | | | 157,000 | | | | 156,651 | |
| Wyndham Worldwide Corp., 2.5%, 2018 | | | 811,000 | | | | 796,494 | |
| Wyndham Worldwide Corp., 4.25%, 2022 | | | 1,227,000 | | | | 1,194,980 | |
| | | | | | | | |
| | | | | | $ | 3,278,660 | |
| | | | | | | | |
| Insurance – 2.0% | | | | | |
| American International Group, Inc., 3.8%, 2017 | | $ | 937,000 | | | $ | 982,272 | |
| American International Group, Inc., 6.4%, 2020 | | | 1,200,000 | | | | 1,391,623 | |
| | | | | | | | |
| Issuer | | Shares/Par | | | Value ($) | |
| | | | | | | | |
| BONDS – continued | | | | | | | | |
| Insurance – continued | | | | | | | | |
| MetLife, Inc., 1.756%, 2017 | | $ | 397,000 | | | $ | 390,834 | |
| Metropolitan Life Global Funding I, 5.125%, 2014 (n) | | | 370,000 | | | | 385,939 | |
| Prudential Financial, Inc., 4.75%, 2015 | | | 631,000 | | | | 678,998 | |
| Unum Group, 7.125%, 2016 | | | 500,000 | | | | 578,244 | |
| UnumProvident Corp., 6.85%, 2015 (n) | | | 1,340,000 | | | | 1,493,012 | |
| | | | | | | | |
| | | | | | $ | 5,900,922 | |
| | | | | | | | |
| Insurance – Health – 1.4% | | | | | |
| CIGNA Corp., 2.75%, 2016 | | $ | 1,400,000 | | | $ | 1,452,816 | |
| CIGNA Corp., 5.375%, 2042 | | | 700,000 | | | | 746,297 | |
| Humana, Inc., 7.2%, 2018 | | | 1,157,000 | | | | 1,378,222 | |
| Wellpoint, Inc., 1.875%, 2018 | | | 618,000 | | | | 605,111 | |
| | | | | | | | |
| | | | | | $ | 4,182,446 | |
| | | | | | | | |
| Insurance – Property & Casualty – 2.5% | |
| AXIS Capital Holdings Ltd., 5.75%, 2014 | | $ | 855,000 | | | $ | 906,253 | |
| AXIS Capital Holdings Ltd., 5.875%, 2020 | | | 190,000 | | | | 210,735 | |
| Chubb Corp., 6.375% to 2017, FRN to 2067 | | | 279,000 | | | | 298,530 | |
| CNA Financial Corp., 5.875%, 2020 | | | 1,570,000 | | | | 1,776,811 | |
| Marsh & McLennan Cos., Inc., 4.8%, 2021 | | | 900,000 | | | | 970,980 | |
| Swiss Re Ltd., 4.25%, 2042 (n) | | | 468,000 | | | | 411,778 | |
| XL Group PLC, 5.75%, 2021 | | | 1,110,000 | | | | 1,256,175 | |
| XL Group PLC, 6.5% to 2017, FRN to 2049 | | | 663,000 | | | | 646,425 | |
| ZFS Finance USA Trust V, 6.5% to 2017, FRN to 2067 (n) | | | 896,000 | | | | 954,240 | |
| | | | | | | | |
| | | | | | $ | 7,431,927 | |
| | | | | | | | |
| International Market Quasi-Sovereign – 0.4% | |
| Israel Electric Corp. Ltd., 5.625%, 2018 (z) | | $ | 544,000 | | | $ | 551,728 | |
| Israel Electric Corp. Ltd., 6.875%, 2023 (z) | | | 542,000 | | | | 545,351 | |
| | | | | | | | |
| | | | | | $ | 1,097,079 | |
| | | | | | | | |
| Machinery & Tools – 0.9% | | | | | |
| Case New Holland, Inc., 7.875%, 2017 | | $ | 1,989,000 | | | $ | 2,252,543 | |
| CNH Capital LLC, 3.625%, 2018 (n) | | | 380,000 | | | | 361,950 | |
| | | | | | | | |
| | | | | | $ | 2,614,493 | |
| | | | | | | | |
| Major Banks – 6.0% | | | | | |
| Bank of America Corp., 5.65%, 2018 | | $ | 580,000 | | | $ | 644,370 | |
| Bank of America Corp., 7.625%, 2019 | | | 500,000 | | | | 600,888 | |
| Bank of America Corp., 5.625%, 2020 | | | 185,000 | | | | 203,679 | |
| Bank of America Corp., FRN, 5.2%, 2049 | | | 637,000 | | | | 598,780 | |
| Goldman Sachs Group, Inc., 1.6%, 2015 | | | 1,600,000 | | | | 1,603,651 | |
| Goldman Sachs Group, Inc., 5.625%, 2017 | | | 1,123,000 | | | | 1,217,091 | |
| JPMorgan Chase & Co., 4.25%, 2020 | | | 893,000 | | | | 928,217 | |
| JPMorgan Chase & Co., 4.5%, 2022 | | | 500,000 | | | | 523,561 | |
| JPMorgan Chase & Co., 3.25%, 2022 | | | 904,000 | | | | 858,259 | |
| Merrill Lynch & Co., Inc., 6.05%, 2016 | | | 349,000 | | | | 377,900 | |
| Morgan Stanley, 1.75%, 2016 | | | 409,000 | | | | 405,184 | |
| Morgan Stanley, 5.75%, 2016 | | | 906,000 | | | | 1,000,132 | |
| Morgan Stanley, 5.5%, 2021 | | | 1,245,000 | | | | 1,329,446 | |
| Morgan Stanley, 4.1%, 2023 | | | 1,700,000 | | | | 1,570,662 | |
| PNC Funding Corp., 5.625%, 2017 | | | 1,095,000 | | | | 1,214,855 | |
| Regions Financial Corp., 2%, 2018 | | | 1,460,000 | | | | 1,380,151 | |
| Royal Bank of Scotland PLC, 2.55%, 2015 | | | 1,054,000 | | | | 1,071,664 | |
6
MFS Bond Portfolio
Portfolio of Investments (unaudited) – continued
| | | | | | | | |
| Issuer | | Shares/Par | | | Value ($) | |
| | | | | | | | |
| BONDS – continued | | | | | | | | |
| Major Banks – continued | | | | | | | | |
| Wachovia Corp., 6.605%, 2025 | | $ | 1,270,000 | | | $ | 1,529,022 | |
| Wells Fargo & Co., 2.625%, 2016 | | | 919,000 | | | | 952,238 | |
| | | | | | | | |
| | | | | | $ | 18,009,750 | |
| | | | | | | | |
| Medical & Health Technology & Services – 2.6% | |
| Davita, Inc., 6.625%, 2020 | | $ | 2,018,000 | | | $ | 2,139,080 | |
| Davita, Inc., 5.75%, 2022 | | | 352,000 | | | | 351,120 | |
| Fresenius Medical Care AG & Co. KGaA, 9%, 2015 (n) | | | 1,775,000 | | | | 1,961,375 | |
| Fresenius Medical Care US Finance II, Inc., 6.5%, 2018 (n) | | | 734,000 | | | | 798,225 | |
| HCA, Inc., 4.75%, 2023 | | | 1,409,000 | | | | 1,349,118 | |
| McKesson Corp., 5.7%, 2017 | | | 770,000 | | | | 869,704 | |
| McKesson Corp., 7.5%, 2019 | | | 120,000 | | | | 150,234 | |
| McKesson Corp., 2.7%, 2022 | | | 158,000 | | | | 147,318 | |
| | | | | | | | |
| | | | | | $ | 7,766,174 | |
| | | | | | | | |
| Metals & Mining – 2.1% | | | | | |
| Barrick North America Finance LLC, 5.75%, 2043 (n) | | $ | 1,013,000 | | | $ | 819,311 | |
| Plains Exploration & Production Co., 6.875%, 2023 | | | 1,200,000 | | | | 1,283,882 | |
| Rio Tinto Finance (USA) PLC, 2.25%, 2018 | | | 527,000 | | | | 512,119 | |
| Southern Copper Corp., 6.75%, 2040 | | | 2,181,000 | | | | 2,144,377 | |
| Vale Overseas Ltd., 5.625%, 2019 | | | 1,501,000 | | | | 1,617,212 | |
| | | | | | | | |
| | | | | | $ | 6,376,901 | |
| | | | | | | | |
| Mortgage-Backed – 0.0% | | | | | |
| Fannie Mae, 7.5%, 2030 – 2031 | | $ | 54,612 | | | $ | 64,942 | |
| | | | | | | | |
| | | | | | $ | 64,942 | |
| | | | | | | | |
| Natural Gas – Distribution – 0.5% | | | | | |
| AmeriGas Finance LLC, 7%, 2022 | | $ | 1,448,000 | | | $ | 1,480,580 | |
| | | | | | | | |
| Natural Gas – Pipeline – 4.8% | | | | | |
| El Paso Pipeline Partners LP, 6.5%, 2020 | | $ | 940,000 | | | $ | 1,087,974 | |
| El Paso Pipeline Partners LP, 5%, 2021 | | | 311,000 | | | | 333,675 | |
| Energy Transfer Partners LP, 8.5%, 2014 | | | 1,004,000 | | | | 1,062,155 | |
| Energy Transfer Partners LP, 9.7%, 2019 | | | 213,000 | | | | 276,426 | |
| Energy Transfer Partners LP, 5.15%, 2043 | | | 1,112,000 | | | | 1,010,721 | |
| Enterprise Products Partners LP, 1.25%, 2015 | | | 758,000 | | | | 760,488 | |
| Enterprise Products Partners LP, 6.3%, 2017 | | | 540,000 | | | | 631,586 | |
| Enterprise Products Partners LP, 4.45%, 2043 | | | 473,000 | | | | 419,863 | |
| Enterprise Products Partners LP, 8.375% to 2016, FRN to 2066 | | | 506,000 | | | | 564,190 | |
| Enterprise Products Partners LP, 7.034% to 2018, FRN to 2068 | | | 267,000 | | | | 299,708 | |
| Kinder Morgan Energy Partners LP, 5.125%, 2014 | | | 410,000 | | | | 433,171 | |
| Kinder Morgan Energy Partners LP, 6.85%, 2020 | | | 370,000 | | | | 440,503 | |
| Kinder Morgan Energy Partners LP, 7.4%, 2031 | | | 581,000 | | | | 688,898 | |
| | | | | | | | |
| Issuer | | Shares/Par | | | Value ($) | |
| | | | | | | | |
| BONDS – continued | | | | | | | | |
| Natural Gas – Pipeline – continued | | | | | | | | |
| Kinder Morgan Energy Partners LP, 5%, 2042 | | $ | 470,000 | | | $ | 443,388 | |
| MarkWest Energy Partners LP, 4.5%, 2023 | | | 1,121,000 | | | | 1,025,715 | |
| NiSource Finance Corp., 3.85%, 2023 | | | 1,106,000 | | | | 1,073,186 | |
| NiSource Finance Corp., 4.8%, 2044 | | | 761,000 | | | | 689,084 | |
| ONEOK Partners LP, 2%, 2017 | | | 447,000 | | | | 439,594 | |
| Plains All American Pipeline, LP, 3.95%, 2015 | | | 1,290,000 | | | | 1,368,165 | |
| Spectra Energy Capital LLC, 8%, 2019 | | | 942,000 | | | | 1,192,199 | |
| Williams Cos., Inc., 3.7%, 2023 | | | 209,000 | | | | 194,178 | |
| | | | | | | | |
| | | | | | $ | 14,434,867 | |
| | | | | | | | |
| Network & Telecom – 1.4% | | | | | |
| AT&T, Inc., 1.4%, 2017 | | $ | 1,463,000 | | | $ | 1,422,317 | |
| AT&T, Inc., 5.55%, 2041 | | | 593,000 | | | | 617,435 | |
| CenturyLink, Inc., 7.6%, 2039 | | | 1,563,000 | | | | 1,484,850 | |
| Verizon Communications, Inc., 6%, 2041 | | | 690,000 | | | | 774,156 | |
| | | | | | | | |
| | | | | | $ | 4,298,758 | |
| | | | | | | | |
| Oil Services – 0.2% | | | | | | | | |
| Transocean, Inc., 2.5%, 2017 | | $ | 569,000 | | | $ | 562,309 | |
| | | | | | | | |
| Oils – 0.3% | | | | | | | | |
| Tesoro Corp., 5.375%, 2022 | | $ | 828,000 | | | $ | 838,350 | |
| | | | | | | | |
| Other Banks & Diversified Financials – 3.7% | | | | | |
| American Express Co., 2.65%, 2022 | | $ | 368,000 | | | $ | 339,781 | |
| American Express Credit Corp., 2.375%, 2017 | | | 745,000 | | | | 760,556 | |
| BB&T Corp., 3.95%, 2016 | | | 500,000 | | | | 535,667 | |
| BB&T Corp., 1.45%, 2018 | | | 970,000 | | | | 937,088 | |
| Capital One Bank (USA) N.A., 3.375%, 2023 | | | 1,200,000 | | | | 1,134,305 | |
| Capital One Financial Corp., 2.15%, 2015 | | | 700,000 | | | | 711,030 | |
| Citigroup, Inc., 1.25%, 2016 | | | 676,000 | | | | 667,919 | |
| Citigroup, Inc., 1.75%, 2018 | | | 1,234,000 | | | | 1,180,027 | |
| Discover Bank, 7%, 2020 | | | 2,197,000 | | | | 2,563,961 | |
| Fifth Third Bancorp, 3.5%, 2022 | | | 673,000 | | | | 667,081 | |
| Santander UK PLC, 3.875%, 2014 (n) | | | 413,000 | | | | 425,281 | |
| Swedbank AB, 2.125%, 2017 (n) | | | 1,238,000 | | | | 1,230,436 | |
| | | | | | | | |
| | | | | | $ | 11,153,132 | |
| | | | | | | | |
| Personal Computers & Peripherals – 0.5% | |
| Equifax, Inc., 3.3%, 2022 | | $ | 849,000 | | | $ | 796,965 | |
| Motorola Solutions, Inc., 3.5%, 2023 | | | 785,000 | | | | 740,011 | |
| | | | | | | | |
| | | | | | $ | 1,536,976 | |
| | | | | | | | |
| Pharmaceuticals – 2.6% | | | | | | | | |
| Celgene Corp., 2.45%, 2015 | | $ | 606,000 | | | $ | 624,085 | |
| Celgene Corp., 1.9%, 2017 | | | 1,583,000 | | | | 1,571,636 | |
| Hospira, Inc., 6.05%, 2017 | | | 906,000 | | | | 969,473 | |
| Mylan Laboratories, Inc., 7.625%, 2017 (n) | | | 1,977,000 | | | | 2,188,956 | |
| Mylan, Inc., 3.125%, 2023 (n) | | | 500,000 | | | | 457,081 | |
| Valeant Pharmaceuticals International, Inc., 7.25%, 2022 (n) | | | 1,013,000 | | | | 1,028,195 | |
| Watson Pharmaceuticals, Inc., 1.875%, 2017 | | | 320,000 | | | | 311,955 | |
| Watson Pharmaceuticals, Inc., 3.25%, 2022 | | | 414,000 | | | | 385,972 | |
7
MFS Bond Portfolio
Portfolio of Investments (unaudited) – continued
| | | | | | | | |
| Issuer | | Shares/Par | | | Value ($) | |
| | | | | | | | |
| BONDS – continued | | | | | | | | |
| Pharmaceuticals – continued | | | | | | | | |
| Watson Pharmaceuticals, Inc., 4.625%, 2042 | | $ | 347,000 | | | $ | 309,661 | |
| | | | | | | | |
| | | | | | $ | 7,847,014 | |
| | | | | | | | |
| Pollution Control – 0.4% | | | | | | | | |
| Republic Services, Inc., 5.25%, 2021 | | $ | 1,160,000 | | | $ | 1,273,583 | |
| | | | | | | | |
| Printing & Publishing – 1.6% | | | | | | | | |
| Moody’s Corp., 4.5%, 2022 | | $ | 2,606,000 | | | $ | 2,610,253 | |
| Pearson Funding Four PLC, 3.75%, 2022 (n) | | | 693,000 | | | | 676,220 | |
| Pearson PLC, 4%, 2016 (n) | | | 1,320,000 | | | | 1,403,040 | |
| | | | | | | | |
| | | | | | $ | 4,689,513 | |
| | | | | | | | |
| Railroad & Shipping – 0.5% | | | | | | | | |
| Canadian Pacific Railway Co., 7.25%, 2019 | | $ | 424,000 | | | $ | 519,932 | |
| Canadian Pacific Railway Co., 4.5%, 2022 | | | 400,000 | | | | 417,917 | |
| CSX Corp., 7.375%, 2019 | | | 365,000 | | | | 450,187 | |
| | | | | | | | |
| | | | | | $ | 1,388,036 | |
| | | | | | | | |
| Real Estate – 3.6% | | | | | | | | |
| Boston Properties LP, REIT, 3.7%, 2018 | | $ | 754,000 | | | $ | 791,923 | |
| Boston Properties LP, REIT, 3.85%, 2023 | | | 1,131,000 | | | | 1,110,674 | |
| DDR Corp., REIT, 4.625%, 2022 | | | 362,000 | | | | 365,833 | |
| ERP Operating LP, REIT, 4.625%, 2021 | | | 670,000 | | | | 709,700 | |
| HCP, Inc., REIT, 2.625%, 2020 | | | 530,000 | | | | 496,506 | |
| HCP, Inc., REIT, 5.375%, 2021 | | | 1,893,000 | | | | 2,053,413 | |
| Health Care, Inc., REIT, 2.25%, 2018 | | | 826,000 | | | | 810,993 | |
| Simon Property Group, Inc., REIT, 5.75%, 2015 | | | 440,000 | | | | 484,810 | |
| Simon Property Group, Inc., REIT, 1.5%, 2018 (n) | | | 503,000 | | | | 484,485 | |
| Simon Property Group, Inc., REIT, 10.35%, 2019 | | | 1,026,000 | | | | 1,420,940 | |
| Ventas Realty LP, REIT, 2%, 2018 | | | 678,000 | | | | 656,289 | |
| Ventas Realty LP, REIT, 4%, 2019 | | | 343,000 | | | | 356,684 | |
| WEA Finance LLC, 6.75%, 2019 (n) | | | 1,044,000 | | | | 1,232,962 | |
| | | | | | | | |
| | | | | | $ | 10,975,212 | |
| | | | | | | | |
| Restaurants – 0.3% | | | | | | | | |
| Darden Restaurants, Inc., 3.35%, 2022 | | $ | 914,000 | | | $ | 841,962 | |
| | | | | | | | |
| Retailers – 2.9% | | | | | | | | |
| Dollar General Corp., 4.125%, 2017 | | $ | 2,144,000 | | | $ | 2,261,453 | |
| Gap, Inc., 5.95%, 2021 | | | 2,613,000 | | | | 2,890,051 | |
| Kohl’s Corp., 4%, 2021 | | | 585,000 | | | | 585,458 | |
| Kohl’s Corp., 3.25%, 2023 | | | 848,000 | | | | 784,468 | |
| Limited Brands, Inc., 7%, 2020 | | | 1,441,000 | | | | 1,599,510 | |
| Limited Brands, Inc., 5.625%, 2022 | | | 479,000 | | | | 486,185 | |
| Wesfarmers Ltd., 1.874%, 2018 (n) | | | 270,000 | | | | 265,167 | |
| | | | | | | | |
| | | | | | $ | 8,872,292 | |
| | | | | | | | |
| Specialty Chemicals – 0.8% | | | | | |
| Ecolab, Inc., 4.35%, 2021 | | $ | 804,000 | | | $ | 848,797 | |
| Mexichem S.A.B. de C.V., 6.75%, 2042 (n) | | | 1,459,000 | | | | 1,429,820 | |
| | | | | | | | |
| | | | | | $ | 2,278,617 | |
| | | | | | | | |
| | | | | | | | |
| Issuer | | Shares/Par | | | Value ($) | |
| | | | | | | | |
| BONDS – continued | | | | | | | | |
| Specialty Stores – 0.4% | | | | | | | | |
| Advance Auto Parts, Inc., 5.75%, 2020 | | $ | 765,000 | | | $ | 811,477 | |
| Advance Auto Parts, Inc., 4.5%, 2022 | | | 433,000 | | | | 421,083 | |
| | | | | | | | |
| | | | | | $ | 1,232,560 | |
| | | | | | | | |
| Telecommunications – Wireless – 1.9% | | | | | |
| American Tower Corp., REIT, 4.625%, 2015 | | $ | 1,770,000 | | | $ | 1,870,453 | |
| American Tower Corp., REIT, 4.5%, 2018 | | | 1,150,000 | | | | 1,226,484 | |
| American Tower Corp., REIT, 3.5%, 2023 | | | 371,000 | | | | 339,715 | |
| Crown Castle International Corp., 5.25%, 2023 | | | 470,000 | | | | 451,200 | |
| Crown Castle Towers LLC, 6.113%, 2020 (n) | | | 955,000 | | | | 1,095,839 | |
| MTS International Funding Ltd., 5%, 2023 (n) | | | 201,000 | | | | 192,458 | |
| Rogers Cable, Inc., 5.5%, 2014 | | | 364,000 | | | | 375,843 | |
| Vodafone Group PLC, 5.625%, 2017 | | | 201,000 | | | | 223,423 | |
| | | | | | | | |
| | | | | | $ | 5,775,415 | |
| | | | | | | | |
| Tobacco – 3.6% | | | | | | | | |
| Altria Group, Inc., 2.95%, 2023 | | $ | 1,400,000 | | | $ | 1,296,746 | |
| B.A.T. International Finance PLC, 2.125%, 2017 (n) | | | 1,052,000 | | | | 1,055,124 | |
| B.A.T. International Finance PLC, 9.5%, 2018 (n) | | | 1,048,000 | | | | 1,404,074 | |
| Imperial Tobacco Finance PLC, 2.05%, 2018 (n) | | | 733,000 | | | | 720,527 | |
| Lorillard Tobacco Co., 2.3%, 2017 | | | 945,000 | | | | 933,116 | |
| Lorillard Tobacco Co., 8.125%, 2019 | | | 2,001,000 | | | | 2,451,985 | |
| Reynolds American, Inc., 6.75%, 2017 | | | 1,100,000 | | | | 1,274,660 | |
| Reynolds American, Inc., 4.75%, 2042 | | | 1,810,000 | | | | 1,616,446 | |
| | | | | | | | |
| | | | | | $ | 10,752,678 | |
| | | | | | | | |
| Transportation – Services – 0.1% | | | | | | | | |
| ERAC USA Finance Co., 6.375%, 2017 (n) | | $ | 200,000 | | | $ | 232,233 | |
| | | | | | | | |
| Utilities – Electric Power – 2.9% | | | | | | | | |
| American Electric Power Co., Inc., 1.65%, 2017 | | $ | 487,000 | | | $ | 473,426 | |
| Calpine Corp., 7.875%, 2020 (n) | | | 1,291,000 | | | | 1,400,735 | |
| CenterPoint Energy, Inc., 5.95%, 2017 | | | 800,000 | | | | 909,678 | |
| CMS Energy Corp., 2.75%, 2014 | | | 780,000 | | | | 791,025 | |
| CMS Energy Corp., 6.25%, 2020 | | | 1,010,000 | | | | 1,173,301 | |
| CMS Energy Corp., 5.05%, 2022 | | | 209,000 | | | | 225,804 | |
| Duke Energy Corp., 1.625%, 2017 | | | 488,000 | | | | 479,040 | |
| Enersis S.A., 7.375%, 2014 | | | 686,000 | | | | 705,299 | |
| FirstEnergy Corp., 2.75%, 2018 | | | 143,000 | | | | 139,216 | |
| NextEra Energy Capital Co., 1.2%, 2015 | | | 85,000 | | | | 85,430 | |
| PPL Capital Funding, Inc., 1.9%, 2018 | | | 215,000 | | | | 211,196 | |
| PPL WEM Holdings PLC, 5.375%, 2021 (n) | | | 1,057,000 | | | | 1,159,134 | |
| PSEG Power LLC, 5.32%, 2016 | | | 288,000 | | | | 319,433 | |
| System Energy Resources, Inc., 5.129%, 2014 (z) | | | 129,047 | | | | 129,910 | |
| Waterford 3 Funding Corp., 8.09%, 2017 | | | 435,627 | | | | 441,006 | |
| | | | | | | | |
| | | | | | $ | 8,643,633 | |
| | | | | | | | |
Total Bonds
(Identified Cost, $270,954,188) | | | | | | $ | 276,711,710 | |
| | | | | | | | |
8
MFS Bond Portfolio
Portfolio of Investments (unaudited) – continued
| | | | | | | | |
| Issuer | | Shares/Par | | | Value ($) | |
| | | | | | | | |
| MONEY MARKET FUNDS – 6.3% | | | | | |
| MFS Institutional Money Market Portfolio, 0.11%, at Cost and Net Asset Value (v) | | | 18,877,452 | | | $ | 18,877,452 | |
| | | | | | | | |
Total Investments
(Identified Cost, $289,831,640) | | | | | | $ | 295,589,162 | |
| | | | | | | | |
OTHER ASSETS, LESS
LIABILITIES – 1.6% | | | | | | | 4,739,052 | |
| | | | | | | | |
| Net Assets – 100.0% | | | | | | $ | 300,328,214 | |
| | | | | | | | |
| (d) | | In default. Interest and/or scheduled principal payment(s) have been missed. |
| (i) | | Interest only security for which the fund receives interest on notional principal (Par amount). Par amount shown is the notional principal and does not reflect the cost of the security. |
| (n) | | Securities exempt from registration under Rule 144A of the Securities Act of 1933. These securities may be sold in the ordinary course of business in transactions exempt from registration, normally to qualified institutional buyers. At period end, the aggregate value of these securities was $58,498,379, representing 19.5% of net assets. |
| (q) | | Interest received was less than stated coupon rate. |
| (v) | | Underlying affiliated fund that is available only to investment companies managed by MFS. The rate quoted for the MFS Institutional Money Market Portfolio is the annualized seven-day yield of the fund at period end. |
| (z) | | Restricted securities are not registered under the Securities Act of 1933 and are subject to legal restrictions on resale. These securities generally may be resold in transactions exempt from registration or to the public if the securities are subsequently registered. Disposal of these securities may involve time-consuming negotiations and prompt sale at an acceptable price may be difficult. The fund holds the following restricted securities: |
| | | | | | | | | | |
| Restricted Securities | | Acquisition
Date | | Cost | | | Value | |
| Anthracite Ltd., “A”, CDO, FRN, 0.553%, 2019 | | 1/15/10 | | | $181,849 | | | | $229,284 | |
| Bayview Financial Revolving Mortgage Loan Trust, FRN, 1.795%, 2040 | | 3/01/06 | | | 295,720 | | | | 142,802 | |
| CNPC General Capital Ltd., 2.75%, 2017 | | 4/12/12 | | | 1,558,892 | | | | 1,561,052 | |
| Falcon Franchise Loan LLC, FRN, 11.464%, 2025 | | 1/29/03 | | | 17,389 | | | | 31,539 | |
| G-Force LLC, CDO, “A2”, 4.83%, 2036 | | 1/20/11 | | | 302,594 | | | | 312,810 | |
| General Motors Financial Co., 2.75%, 2016 | | 5/07/13 | | | 170,000 | | | | 167,238 | |
| Israel Electric Corp. Ltd., 5.625%, 2018 | | 6/18/13 | | | 544,000 | | | | 551,728 | |
| Israel Electric Corp. Ltd., 6.875%, 2023 | | 6/18/13 | | | 542,000 | | | | 545,351 | |
| Service Corp. International, 5.375%, 2022 | | 6/17/13 | | | 170,000 | | | | 169,575 | |
| Spirit Master Funding LLC, 5.05%, 2023 | | 10/04/05 | | | 286,797 | | | | 289,938 | |
| State Grid International Development Co. Ltd., 1.75%, 2018 | | 5/15/13 | | | 246,620 | | | | 236,733 | |
| System Energy Resources, Inc., 5.129%, 2014 | | 4/16/04-9/08/04 | | | 129,126 | | | | 129,910 | |
| Total Restricted Securities | | | | | | | | | $4,367,960 | |
| % of Net assets | | | | | | | | | 1.5% | |
The following abbreviations are used in this report and are defined:
| CDO | | Collateralized Debt Obligation |
| CLO | | Collateralized Loan Obligation |
| FRN | | Floating Rate Note. Interest rate resets periodically and may not be the rate reported at period end. |
| PLC | | Public Limited Company |
| REIT | | Real Estate Investment Trust |
See Notes to Financial Statements
9
MFS Bond Portfolio
FINANCIAL STATEMENTS | STATEMENT OF ASSETS AND LIABILITIES (unaudited)
This statement represents your fund’s balance sheet, which details the assets and liabilities comprising the total value of the fund.
| | | | | | | | |
At 6/30/13 | | | | | | | | |
Assets | | | | | | | | |
Investments – | | | | | | | | |
Non-affiliated issuers, at value (identified cost, $270,954,188) | | | $276,711,710 | | | | | |
Underlying affiliated funds, at cost and value | | | 18,877,452 | | | | | |
Total investments, at value (identified cost, $289,831,640) | | | $295,589,162 | | | | | |
Receivables for | | | | | | | | |
Investments sold | | | 1,482,054 | | | | | |
Fund shares sold | | | 369,623 | | | | | |
Interest | | | 3,528,151 | | | | | |
Other assets | | | 1,747 | | | | | |
Total assets | | | | | | | $300,970,737 | |
Liabilities | | | | | | | | |
Payable to custodian | | | $49,201 | | | | | |
Payables for | | | | | | | | |
Investments purchased | | | 170,000 | | | | | |
Fund shares reacquired | | | 338,703 | | | | | |
Payable to affiliates | | | | | | | | |
Investment adviser | | | 20,074 | | | | | |
Shareholder servicing costs | | | 108 | | | | | |
Distribution and/or service fees | | | 5,719 | | | | | |
Payable for independent Trustees’ compensation | | | 1,694 | | | | | |
Accrued expenses and other liabilities | | | 57,024 | | | | | |
Total liabilities | | | | | | | $642,523 | |
Net assets | | | | | | | $300,328,214 | |
Net assets consist of | | | | | | | | |
Paid-in capital | | | $272,841,503 | | | | | |
Unrealized appreciation (depreciation) on investments | | | 5,757,522 | | | | | |
Accumulated net realized gain (loss) on investments | | | 4,583,130 | | | | | |
Undistributed net investment income | | | 17,146,059 | | | | | |
Net assets | | | | | | | $300,328,214 | �� |
Shares of beneficial interest outstanding | | | | | | | 25,126,379 | |
| | | | | | | | | | | | |
| | | Net assets | | | Shares outstanding | | | Net asset value per share | |
Initial Class | | | $90,895,277 | | | | 7,543,746 | | | | $12.05 | |
Service Class | | | 209,432,937 | | | | 17,582,633 | | | | 11.91 | |
See Notes to Financial Statements
10
MFS Bond Portfolio
FINANCIAL STATEMENTS | STATEMENT OF OPERATIONS (unaudited)
This statement describes how much your fund earned in investment income and accrued in expenses. It also describes any gains and/or losses generated by fund operations.
| | | | | | | | |
Six months ended 6/30/13 | | | | | | | | |
Net investment income | | | | | | | | |
Income | | | | | | | | |
Interest | | | $6,217,270 | | | | | |
Dividends from underlying affiliated funds | | | 5,432 | | | | | |
Total investment income | | | | | | | $6,222,702 | |
Expenses | | | | | | | | |
Management fee | | | $887,526 | | | | | |
Distribution and/or service fees | | | 255,358 | | | | | |
Shareholder servicing costs | | | 2,507 | | | | | |
Administrative services fee | | | 24,007 | | | | | |
Independent Trustees’ compensation | | | 5,025 | | | | | |
Custodian fee | | | 18,190 | | | | | |
Shareholder communications | | | 6,998 | | | | | |
Audit and tax fees | | | 33,562 | | | | | |
Legal fees | | | 2,462 | | | | | |
Miscellaneous | | | 10,802 | | | | | |
Total expenses | | | | | | | $1,246,437 | |
Fees paid indirectly | | | (55 | ) | | | | |
Reduction of expenses by investment adviser | | | (971 | ) | | | | |
Net expenses | | | | | | | $1,245,411 | |
Net investment income | | | | | | | $4,977,291 | |
Realized and unrealized gain (loss) on investments | | | | | | | | |
Realized gain (loss) on investments (identified cost basis) | | | | | | | $1,285,122 | |
Change in unrealized appreciation (depreciation) on investments | | | | | | | $(14,164,944 | ) |
Net realized and unrealized gain (loss) on investments | | | | | | | $(12,879,822 | ) |
Change in net assets from operations | | | | | | | $(7,902,531 | ) |
See Notes to Financial Statements
11
MFS Bond Portfolio
FINANCIAL STATEMENTS | STATEMENTS OF CHANGES IN NET ASSETS
These statements describe the increases and/or decreases in net assets resulting from operations, any distributions, and any shareholder transactions.
| | | | | | | | |
| |
| Six months ended
6/30/13 (unaudited |
) | |
| Year ended
12/31/12 |
|
Change in net assets | | | | | | | | |
From operations | | | | | | | | |
Net investment income | | | $4,977,291 | | | | $10,969,492 | |
Net realized gain (loss) on investments | | | 1,285,122 | | | | 6,857,384 | |
Net unrealized gain (loss) on investments | | | (14,164,944 | ) | | | 11,103,033 | |
Change in net assets from operations | | | $(7,902,531 | ) | | | $28,929,909 | |
| Distributions declared to shareholders | | | | | | | | |
From net investment income | | | $— | | | | $(13,345,100 | ) |
Change in net assets from fund share transactions | | | $17,088,531 | | | | $19,367,944 | |
Total change in net assets | | | $9,186,000 | | | | $34,952,753 | |
| Net assets | | | | | | | | |
At beginning of period | | | 291,142,214 | | | | 256,189,461 | |
At end of period (including undistributed net investment income of $17,146,059 and
$12,168,768, respectively) | | | $300,328,214 | | | | $291,142,214 | |
See Notes to Financial Statements
12
MFS Bond Portfolio
FINANCIAL STATEMENTS | FINANCIAL HIGHLIGHTS
The financial highlights table is intended to help you understand the fund’s financial performance for the semiannual period and the past 5 fiscal years. Certain information reflects financial results for a single fund share. The total returns in the table represent the rate by which an investor would have earned (or lost) on an investment in the fund share class (assuming reinvestment of all distributions) held for the entire period.
| | | | | | | | | | | | | | | | | | | | | | | | |
| Initial Class | | Six months ended 6/30/13 | | | Years ended 12/31 | |
| | | | 2012 | | | 2011 | | | 2010 | | | 2009 | | | 2008 | |
| | | (unaudited) | | | | | | | | | | | | | | | | |
Net asset value, beginning of period | | | $12.36 | | | | $11.67 | | | | $11.49 | | | | $10.84 | | | | $9.11 | | | | $10.89 | |
| Income (loss) from investment operations | | | | | | | | | | | | | | | | | | | | | | | | |
Net investment income (d) | | | $0.22 | | | | $0.50 | | | | $0.57 | | | | $0.58 | | | | $0.59 | | | | $0.57 | |
Net realized and unrealized gain (loss) on investments | | | (0.53 | ) | | | 0.80 | | | | 0.18 | | | | 0.57 | | | | 1.81 | | | | (1.64 | ) |
Total from investment operations | | | $(0.31 | ) | | | $1.30 | | | | $0.75 | | | | $1.15 | | | | $2.40 | | | | $(1.07 | ) |
| Less distributions declared to shareholders | | | | | | | | | | | | | | | | | | | | | | | | |
From net investment income | | | $— | | | | $(0.61 | ) | | | $(0.57 | ) | | | $(0.50 | ) | | | $(0.67 | ) | | | $(0.71 | ) |
Net asset value, end of period (x) | | | $12.05 | | | | $12.36 | | | | $11.67 | | | | $11.49 | | | | $10.84 | | | | $9.11 | |
Total return (%) (k)(r)(s)(x) | | | (2.51 | )(n) | | | 11.31 | | | | 6.63 | | | | 10.86 | | | | 27.96 | | | | (10.53 | ) |
Ratios (%) (to average net assets)
and Supplemental data: | | | | | | | | | | | | | | | | | | | | | | | | |
Expenses before expense reductions (f) | | | 0.67 | (a) | | | 0.68 | | | | 0.70 | | | | 0.72 | | | | 0.74 | | | | 0.74 | |
Expenses after expense reductions (f) | | | 0.67 | (a) | | | 0.68 | | | | N/A | | | | N/A | | | | N/A | | | | N/A | |
Net investment income | | | 3.54 | (a) | | | 4.13 | | | | 4.85 | | | | 5.17 | | | | 5.93 | | | | 5.64 | |
Portfolio turnover | | | 18 | (n) | | | 57 | | | | 55 | | | | 58 | | | | 71 | | | | 46 | |
Net assets at end of period (000 omitted) | | | $90,895 | | | | $95,361 | | | | $90,822 | | | | $95,584 | | | | $92,244 | | | | $70,504 | |
| | |
| Service Class | | Six months ended 6/30/13 | | | Years ended 12/31 | |
| | | | 2012 | | | 2011 | | | 2010 | | | 2009 | | | 2008 | |
| | | (unaudited) | | | | | | | | | | | | | | | | |
Net asset value, beginning of period | | | $12.23 | | | | $11.56 | | | | $11.40 | | | | $10.76 | | | | $9.04 | | | | $10.81 | |
| Income (loss) from investment operations | | | | | | | | | | | | | | | | | | | | | | | | |
Net investment income (d) | | | $0.20 | | | | $0.47 | | | | $0.53 | | | | $0.55 | | | | $0.56 | | | | $0.54 | |
Net realized and unrealized gain (loss) on investments | | | (0.52 | ) | | | 0.78 | | | | 0.18 | | | | 0.57 | | | | 1.80 | | | | (1.63 | ) |
Total from investment operations | | | $(0.32 | ) | | | $1.25 | | | | $0.71 | | | | $1.12 | | | | $2.36 | | | | $(1.09 | ) |
| Less distributions declared to shareholders | | | | | | | | | | | | | | | | | | | | | | | | |
From net investment income | | | $— | | | | $(0.58 | ) | | | $(0.55 | ) | | | $(0.48 | ) | | | $(0.64 | ) | | | $(0.68 | ) |
Net asset value, end of period (x) | | | $11.91 | | | | $12.23 | | | | $11.56 | | | | $11.40 | | | | $10.76 | | | | $9.04 | |
Total return (%) (k)(r)(s)(x) | | | (2.62 | )(n) | | | 11.00 | | | | 6.30 | | | | 10.67 | | | | 27.66 | | | | (10.77 | ) |
Ratios (%) (to average net assets)
and Supplemental data: | | | | | | | | | | | | | | | | | | | | | | | | |
Expenses before expense reductions (f) | | | 0.92 | (a) | | | 0.93 | | | | 0.95 | | | | 0.97 | | | | 0.99 | | | | 0.99 | |
Expenses after expense reductions (f) | | | 0.92 | (a) | | | 0.93 | | | | N/A | | | | N/A | | | | N/A | | | | N/A | |
Net investment income | | | 3.29 | (a) | | | 3.86 | | | | 4.59 | | | | 4.90 | | | | 5.64 | | | | 5.39 | |
Portfolio turnover | | | 18 | (n) | | | 57 | | | | 55 | | | | 58 | | | | 71 | | | | 46 | |
Net assets at end of period (000 omitted) | | | $209,433 | | | | $195,781 | | | | $165,367 | | | | $146,977 | | | | $96,293 | | | | $52,038 | |
See Notes to Financial Statements
13
MFS Bond Portfolio
Financial Highlights – continued
| (d) | Per share data is based on average shares outstanding. |
| (f) | Ratios do not reflect reductions from fees paid indirectly, if applicable. |
| (k) | The total return does not reflect expenses that apply to separate accounts. Inclusion of these charges would reduce the total return figures for all periods shown. |
| (r) | Certain expenses have been reduced without which performance would have been lower. |
| (s) | From time to time the fund may receive proceeds from litigation settlements, without which performance would be lower. |
| (x) | The net asset values per share and total returns have been calculated on net assets which include adjustments made in accordance with U.S. generally accepted accounting principles required at period end for financial reporting purposes. |
See Notes to Financial Statements
14
MFS Bond Portfolio
NOTES TO FINANCIAL STATEMENTS (unaudited)
| (1) | | Business and Organization |
MFS Bond Portfolio (the fund) is a series of MFS Variable Insurance Trust II (the trust). The trust is organized as a Massachusetts business trust and is registered under the Investment Company Act of 1940, as amended, as an open-end management investment company. The shareholders of each series of the trust are separate accounts of insurance companies, which offer variable annuity and/or life insurance products, and qualified retirement and pension plans.
| (2) | | Significant Accounting Policies |
General – The preparation of financial statements in conformity with U.S. generally accepted accounting principles requires management to make estimates and assumptions that affect the reported amounts of assets and liabilities, and disclosure of contingent assets and liabilities at the date of the financial statements and the reported amounts of revenues and expenses during the reporting period. Actual results could differ from those estimates. In the preparation of these financial statements, management has evaluated subsequent events occurring after the date of the fund’s Statement of Assets and Liabilities through the date that the financial statements were issued. The fund invests in high-yield securities rated below investment grade. Investments in high-yield securities involve greater degrees of credit and market risk than investments in higher-rated securities and tend to be more sensitive to economic conditions. The fund invests in foreign securities. Investments in foreign securities are vulnerable to the effects of changes in the relative values of the local currency and the U.S. dollar and to the effects of changes in each country’s legal, political, and economic environment.
In this reporting period, the fund adopted the disclosure provisions of the Financial Accounting Standards Board (FASB) Accounting Standards Update 2011-11 (“ASU 2011-11”), Balance Sheet (Topic 210) – Disclosures about Offsetting Assets and Liabilities along with the related scope clarification provisions of FASB Accounting Standards Update 2013-01 (“ASU 2013-01”) entitled Balance Sheet (Topic 210) – Clarifying the Scope of Disclosures about Offsetting Assets and Liabilities. ASU 2011-11 is intended to enhance disclosures on the offsetting of financial assets and liabilities by requiring entities to disclose both gross and net information about financial instruments and transactions that are either offset in the statement of financial position or subject to a Master Netting Agreement or similar arrangement. ASU 2013-01 limits the scope of ASU 2011-11’s disclosure requirements on offsetting to financial assets and financial liabilities related to derivatives, repurchase and reverse repurchase agreements, and securities lending and securities borrowing transactions. The disclosures required by ASU 2011-11, to the extent applicable to the fund, have been included in the fund’s Significant Accounting Policies note under the captions for each of the fund’s in-scope financial instruments and transactions.
In June 2013, FASB issued Accounting Standards Update 2013-08 Financial Services – Investment Companies (Topic 946) – Amendments to the Scope, Measurement, and Disclosure Requirements (“ASU 2013-08”) which is effective for interim and annual reporting periods in fiscal years that begin after December 15, 2013. ASU 2013-08 sets forth a methodology for determining whether an entity should be characterized as an investment company and prescribes fair value accounting for an investment company’s non-controlling ownership interest in another investment company. FASB has determined that a fund registered under the Investment Company Act of 1940 automatically meets ASU 2013-08’s criteria for an investment company. Although still evaluating the potential impacts of ASU 2013-08 to the fund, management expects that the impact of the fund’s adoption will be limited to additional financial statement disclosures.
Investment Valuations – Debt instruments and floating rate loans (other than short-term instruments), including restricted debt instruments, are generally valued at an evaluated or composite bid as provided by a third-party pricing service. Short-term instruments with a maturity at issuance of 60 days or less generally are valued at amortized cost, which approximates market value. Open-end investment companies are generally valued at net asset value per share. Securities and other assets generally valued on the basis of information from a third-party pricing service may also be valued at a broker/dealer bid quotation. Values obtained from third-party pricing services can utilize both transaction data and market information such as yield, quality, coupon rate, maturity, type of issue, trading characteristics, and other market data. The values of foreign securities and other assets and liabilities expressed in foreign currencies are converted to U.S. dollars using the mean of bid and asked prices for rates provided by a third-party pricing service.
The Board of Trustees has delegated primary responsibility for determining or causing to be determined the value of the fund’s investments (including any fair valuation) to the adviser pursuant to valuation policies and procedures approved by the Board. If the adviser determines that reliable market quotations are not readily available, investments are valued at fair value as determined in good faith by the adviser in accordance with such procedures under the oversight of the Board of Trustees. Under the fund’s valuation policies and procedures, market quotations are not considered to be readily available for most types of debt instruments and floating rate loans and many types of derivatives. These investments are generally valued at fair value based on information from third-party pricing services. In addition, investments may be valued at fair value if the adviser determines that an investment’s value has been materially affected by events occurring after the close of the exchange or market on which the investment is principally traded (such as foreign exchange or market) and prior to the determination of the fund’s net asset value, or after the halting of trading of a specific security where trading does not resume prior to the close of the exchange or market on which the security is principally traded. The adviser generally relies on third-party pricing services or other information (such as the correlation with price
15
MFS Bond Portfolio
Notes to Financial Statements (unaudited) – continued
movements of similar securities in the same or other markets; the type, cost and investment characteristics of the security; the business and financial condition of the issuer; and trading and other market data) to assist in determining whether to fair value and at what value to fair value an investment. The value of an investment for purposes of calculating the fund’s net asset value can differ depending on the source and method used to determine value. When fair valuation is used, the value of an investment used to determine the fund’s net asset value may differ from quoted or published prices for the same investment. There can be no assurance that the fund could obtain the fair value assigned to an investment if it were to sell the investment at the same time at which the fund determines its net asset value per share.
Various inputs are used in determining the value of the fund’s assets or liabilities. These inputs are categorized into three broad levels. In certain cases, the inputs used to measure fair value may fall into different levels of the fair value hierarchy. In such cases, an investment’s level within the fair value hierarchy is based on the lowest level of input that is significant to the fair value measurement. The fund’s assessment of the significance of a particular input to the fair value measurement in its entirety requires judgment, and considers factors specific to the investment. Level 1 includes unadjusted quoted prices in active markets for identical assets or liabilities. Level 2 includes other significant observable market-based inputs (including quoted prices for similar securities, interest rates, prepayment speed, and credit risk). Level 3 includes unobservable inputs, which may include the adviser’s own assumptions in determining the fair value of investments. The following is a summary of the levels used as of June 30, 2013 in valuing the fund’s assets or liabilities:
| | | | | | | | | | | | | | | | |
| Investments at Value | | Level 1 | | | Level 2 | | | Level 3 | | | Total | |
| Non-U.S. Sovereign Debt | | | $— | | | | $4,674,300 | | | | $— | | | | $4,674,300 | |
| U.S. Corporate Bonds | | | — | | | | 228,588,747 | | | | — | | | | 228,588,747 | |
| Residential Mortgage-Backed Securities | | | — | | | | 64,942 | | | | — | | | | 64,942 | |
| Commercial Mortgage-Backed Securities | | | — | | | | 2,580,036 | | | | — | | | | 2,580,036 | |
| Asset-Backed Securities (including CDOs) | | | — | | | | 1,492,447 | | | | — | | | | 1,492,447 | |
| Foreign Bonds | | | — | | | | 39,311,238 | | | | — | | | | 39,311,238 | |
| Mutual Funds | | | 18,877,452 | | | | — | | | | — | | | | 18,877,452 | |
| Total Investments | | | $18,877,452 | | | | $276,711,710 | | | | $— | | | | $295,589,162 | |
For further information regarding security characteristics, see the Portfolio of Investments.
Indemnifications – Under the fund’s organizational documents, its officers and Trustees may be indemnified against certain liabilities and expenses arising out of the performance of their duties to the fund. Additionally, in the normal course of business, the fund enters into agreements with service providers that may contain indemnification clauses. The fund’s maximum exposure under these agreements is unknown as this would involve future claims that may be made against the fund that have not yet occurred.
Investment Transactions and Income – Investment transactions are recorded on the trade date. Interest income is recorded on the accrual basis. All premium and discount is amortized or accreted for financial statement purposes in accordance with U.S. generally accepted accounting principles. Interest payments received in additional securities are recorded on the or ex-interest date in an amount equal to the value of the security on such date. Debt obligations may be placed on non-accrual status or set to accrue at a rate of interest less than the contractual coupon when the collection of all or a portion of interest has become doubtful. Interest income for those debt obligations may be further reduced by the write-off of the related interest receivables when deemed uncollectible.
The fund may receive proceeds from litigation settlements. Any proceeds received from litigation involving portfolio holdings are reflected in the Statement of Operations in realized gain/loss if the security has been disposed of by the fund or in unrealized gain/loss if the security is still held by the fund. Any other proceeds from litigation not related to portfolio holdings are reflected as other income in the Statement of Operations.
Fees Paid Indirectly – The fund’s custody fee may be reduced according to an arrangement that measures the value of cash deposited with the custodian by the fund. This amount, for the six months ended June 30, 2013, is shown as a reduction of total expenses in the Statement of Operations.
Tax Matters and Distributions – The fund intends to qualify as a regulated investment company, as defined under Subchapter M of the Internal Revenue Code, and to distribute all of its taxable income, including realized capital gains. As a result, no provision for federal income tax is required. The fund’s federal tax returns, when filed, will remain subject to examination by the Internal Revenue Service for a three year period.
Distributions to shareholders are recorded on the ex-dividend date. Income and capital gain distributions are determined in accordance with income tax regulations, which may differ from U.S. generally accepted accounting principles. Certain capital accounts in the financial statements are periodically adjusted for permanent differences in order to reflect their tax character. These adjustments have no impact on net assets or net asset value per share. Temporary differences which arise from recognizing certain items of income, expense, gain or loss in different periods for financial statement and tax purposes will reverse at some time in the
16
MFS Bond Portfolio
Notes to Financial Statements (unaudited) – continued
future. Distributions in excess of net investment income or net realized gains are temporary overdistributions for financial statement purposes resulting from differences in the recognition or classification of income or distributions for financial statement and tax purposes.
Book/tax differences primarily relate to amortization and accretion of debt securities.
The tax character of distributions declared to shareholders for the last fiscal year is as follows:
| | | | |
| | | 12/31/12 | |
| Ordinary income (including any short-term capital gains) | | | $13,345,100 | |
The federal tax cost and the tax basis components of distributable earnings were as follows:
| | | | |
| As of 6/30/13 | | | | |
| Cost of investments | | | $291,610,145 | |
| Gross appreciation | | | 10,105,253 | |
| Gross depreciation | | | (6,126,236 | ) |
| Net unrealized appreciation (depreciation) | | | $3,979,017 | |
| |
| As of 12/31/12 | | | | |
| Undistributed ordinary income | | | 15,105,469 | |
| Undistributed long-term capital gain | | | 2,244,177 | |
| Other temporary differences | | | (50,327 | ) |
| Net unrealized appreciation (depreciation) | | | 18,089,923 | |
The aggregate cost above includes prior fiscal year end tax adjustments, if applicable.
Multiple Classes of Shares of Beneficial Interest – The fund offers multiple classes of shares, which differ in their respective distribution and/or service fees. The fund’s income, realized and unrealized gain (loss), and common expenses are allocated to shareholders based on the daily net assets of each class. Dividends are declared separately for each class. Differences in per share dividend rates are generally due to differences in separate class expenses. The fund’s distributions declared to shareholders as reported in the Statements of Changes in Net Assets are presented by class as follows:
| | | | | | | | |
| | | From net investment
income | |
| | | Six months ended
6/30/13 | | | Year ended
12/31/12 | |
| Initial Class | | | $— | | | | $4,578,734 | |
| Service Class | | | — | | | | 8,766,366 | |
| Total | | | $— | | | | $13,345,100 | |
| (3) | | Transactions with Affiliates |
Investment Adviser – The fund has an investment advisory agreement with MFS to provide overall investment management and related administrative services and facilities to the fund. The management fee is computed daily and paid monthly at the following annual rates:
| | | | |
| First $1 billion of average daily net assets | | | 0.60% | |
| Average daily net assets in excess of $1 billion | | | 0.50% | |
Effective April 1, 2013, MFS has agreed in writing to reduce its management fee by a specified amount if certain MFS mutual fund assets exceed thresholds agreed to by MFS and the fund’s Board of Trustees. For the period April 1, 2013 through June 30, 2013, this management fee reduction amounted to $409, which is shown as a reduction of total expenses in the Statement of Operations. The management fee incurred for the six months ended June 30, 2013 was equivalent to an annual effective rate of 0.60% of the fund’s average daily net assets.
Distributor – MFS Fund Distributors, Inc. (MFD), a wholly-owned subsidiary of MFS, is the distributor of shares of the fund. The Trustees have adopted a distribution plan for the Service Class shares pursuant to Rule 12b-1 under the Investment Company Act of 1940.
The fund’s distribution plan provides that the fund will pay MFD distribution and/or service fees equal to 0.25% per annum of its average daily net assets attributable to Service Class shares as partial consideration for services performed and expenses incurred by MFD and financial intermediaries (including participating insurance companies that invest in the fund to fund variable annuity and variable life insurance contracts, sponsors of qualified retirement and pension plans that invest in the fund, and affiliates of these participating insurance companies and plan sponsors) in connection with the sale and distribution of the Service Class shares. MFD may subsequently pay all, or a portion, of the distribution and/or service fees to financial intermediaries.
17
MFS Bond Portfolio
Notes to Financial Statements (unaudited) – continued
Shareholder Servicing Agent – Effective April 1, 2013, MFS Service Center, Inc. (MFSC), a wholly-owned subsidiary of MFS, receives a fee from the fund for its services as shareholder servicing agent. For the period from April 1, 2013 through June 30, 2013, the fee was $2,500, which equated to 0.0017% annually of the fund’s average daily net assets. MFSC also receives payment from the fund for out-of-pocket expenses paid by MFSC on behalf of the fund. For the period from April 1, 2013 through June 30, 2013, these costs amounted to $7.
Administrator – MFS provides certain financial, legal, shareholder communications, compliance, and other administrative services to the fund. Under an administrative services agreement, the fund partially reimburses MFS the costs incurred to provide these services. The fund is charged an annual fixed amount of $17,500 plus a fee based on average daily net assets. The administrative services fee incurred for the six months ended June 30, 2013 was equivalent to an annual effective rate of 0.0162% of the fund’s average daily net assets.
Trustees’ and Officers’ Compensation – The fund pays compensation to independent Trustees in the form of a retainer, attendance fees, and additional compensation to Board and Committee chairpersons. The fund does not pay compensation directly to Trustees or officers of the fund who are also officers of the investment adviser, all of whom receive remuneration for their services to the fund from MFS. Certain officers and Trustees of the fund are officers or directors of MFS, MFD, and MFSC.
Other – This fund and certain other funds managed by MFS (the funds) have entered into services agreements (the Agreements) which provide for payment of fees by the funds to Tarantino LLC and Griffin Compliance LLC in return for the provision of services of an Independent Chief Compliance Officer (ICCO) and Assistant ICCO, respectively, for the funds. The ICCO and Assistant ICCO are officers of the funds and the sole members of Tarantino LLC and Griffin Compliance LLC, respectively. The funds can terminate the Agreements with Tarantino LLC and Griffin Compliance LLC at any time under the terms of the Agreements. For the six months ended June 30, 2013, the aggregate fees paid by the fund to Tarantino LLC and Griffin Compliance LLC were $1,128 and are included in “Miscellaneous” expense in the Statement of Operations. MFS has agreed to reimburse the fund for a portion of the payments made by the fund in the amount of $562, which is shown as a reduction of total expenses in the Statement of Operations. Additionally, MFS has agreed to bear all expenses associated with office space, other administrative support, and supplies provided to the ICCO and Assistant ICCO.
The fund invests in the MFS Institutional Money Market Portfolio which is managed by MFS and seeks current income consistent with preservation of capital and liquidity. Income earned on this investment is included in “Dividends from underlying affiliated funds” in the Statement of Operations. This money market fund does not pay a management fee to MFS.
Purchases and sales of investments, other than short-term obligations, were as follows:
| | | | | | | | |
| | | Purchases | | | Sales | |
| U.S. Government securities | | | $— | | | | $1,095 | |
| Investments (non-U.S. Government securities) | | | $57,339,951 | | | | $52,139,836 | |
| (5) | | Shares of Beneficial Interest |
The fund’s Declaration of Trust permits the Trustees to issue an unlimited number of full and fractional shares of beneficial interest. Transactions in fund shares were as follows:
| | | | | | | | | | | | | | | | |
| | | Six months ended 6/30/13 | | | Year ended 12/31/12 | |
| | | Shares | | | Amount | | | Shares | | | Amount | |
| Shares sold | | | | | | | | | | | | | | | | |
Initial Class | | | 591,442 | | | | $7,148,772 | | | | 614,917 | | | | $7,492,743 | |
Service Class | | | 2,712,953 | | | | 33,243,171 | | | | 3,732,125 | | | | 45,035,703 | |
| | | 3,304,395 | | | | $40,391,943 | | | | 4,347,042 | | | | $52,528,446 | |
| Shares issued to shareholders in reinvestment of distributions | | | | | | | | | | | | | | | | |
Initial Class | | | — | | | | $— | | | | 383,158 | | | | $4,578,734 | |
Service Class | | | — | | | | — | | | | 740,403 | | | | 8,766,366 | |
| | | — | | | | $— | | | | 1,123,561 | | | | $13,345,100 | |
| Shares reacquired | | | | | | | | | | | | | | | | |
Initial Class | | | (763,105 | ) | | | $(9,443,050 | ) | | | (1,067,141 | ) | | | $(12,999,556 | ) |
Service Class | | | (1,133,673 | ) | | | (13,860,362 | ) | | | (2,777,826 | ) | | | (33,506,046 | ) |
| | | (1,896,778 | ) | | | $(23,303,412 | ) | | | (3,844,967 | ) | | | $(46,505,602 | ) |
| Net change | | | | | | | | | | | | | | | | |
Initial Class | | | (171,663 | ) | | | $(2,294,278 | ) | | | (69,066 | ) | | | $(928,079 | ) |
Service Class | | | 1,579,280 | | | | 19,382,809 | | | | 1,694,702 | | | | 20,296,023 | |
| | | 1,407,617 | | | | $17,088,531 | | | | 1,625,636 | | | | $19,367,944 | |
18
MFS Bond Portfolio
Notes to Financial Statements (unaudited) – continued
The fund and certain other funds managed by MFS participate in a $1.1 billion unsecured committed line of credit, subject to a $1 billion sublimit, provided by a syndication of banks under a credit agreement. Borrowings may be made for temporary financing needs. Interest is charged to each fund, based on its borrowings, generally at a rate equal to the higher of the Federal Reserve funds rate or one month LIBOR plus an agreed upon spread. A commitment fee, based on the average daily, unused portion of the committed line of credit, is allocated among the participating funds at the end of each calendar quarter. In addition, the fund and other funds managed by MFS have established unsecured uncommitted borrowing arrangements with certain banks for temporary financing needs. Interest is charged to each fund, based on its borrowings, at a rate equal to the Federal Reserve funds rate plus an agreed upon spread. For the six months ended June 30, 2013, the fund’s commitment fee and interest expense were $743 and $0, respectively, and are included in “Miscellaneous” expense in the Statement of Operations.
| (7) | | Transactions in Underlying Affiliated Funds – Affiliated Issuers |
An affiliated issuer may be considered one in which the fund owns 5% or more of the outstanding voting securities, or a company which is under common control. For the purposes of this report, the fund assumes the following to be an affiliated issuer:
| | | | | | | | | | | | | | | | |
| Underlying Affiliated Fund | | Beginning Shares/Par Amount | | | Acquisitions Shares/Par Amount | | | Dispositions Shares/Par Amount | | | Ending Shares/Par Amount | |
| MFS Institutional Money Market Portfolio | | | 2,689,612 | | | | 66,934,438 | | | | (50,746,598 | ) | | | 18,877,452 | |
| | | | |
| Underlying Affiliated Fund | | Realized Gain (Loss) | | | Capital Gain Distributions | | | Dividend Income | | | Ending Value | |
| MFS Institutional Money Market Portfolio | | | $— | | | | $— | | | | $5,432 | | | | $18,877,452 | |
19
MFS Bond Portfolio
BOARD REVIEW OF INVESTMENT ADVISORY AGREEMENT
A discussion regarding the Board’s most recent review and renewal of the fund’s Investment Advisory Agreement with MFS will be available on or about November 1, 2013 by clicking on the fund’s name under “Variable Insurance Portfolios — VIT II” in the “Products” section of the MFS Web site (mfs.com).
PROXY VOTING POLICIES AND INFORMATION
A general description of the MFS funds’ proxy voting policies and procedures is available without charge, upon request, by calling 1-800-225-2606, by visiting the Proxy Voting section of mfs.com or by visiting the SEC’s Web site at http://www.sec.gov.
Information regarding how the fund voted proxies relating to portfolio securities during the most recent twelve-month period ended June 30 is available without charge by visiting the Proxy Voting section of mfs.com or by visiting the SEC’s Web site at http://www.sec.gov.
QUARTERLY PORTFOLIO DISCLOSURE
The fund will file a complete schedule of portfolio holdings with the Securities and Exchange Commission (the Commission) for the first and third quarters of each fiscal year on Form N-Q. The fund’s Form N-Q is available on the EDGAR database on the Commission’s Internet Web site at http://www.sec.gov, and may be reviewed and copied at the:
Public Reference Room
Securities and Exchange Commission
100 F Street, NE, Room 1580
Washington, D.C. 20549
Information on the operation of the Public Reference Room may be obtained by calling the Commission at 1-800-SEC-0330. Copies of the fund’s Form N-Q also may be obtained, upon payment of a duplicating fee, by electronic request at the following e-mail address: publicinfo@sec.gov or by writing the Public Reference Section at the above address.
FURTHER INFORMATION
From time to time, MFS may post important information about the fund or the MFS funds on the MFS web site (mfs.com). This information is available by visiting the “News & Commentary” section of mfs.com or by clicking on the fund’s name under “Variable Insurance Portfolios — VIT II” in the “Products” section of mfs.com.
20
SEMIANNUAL REPORT
June 30, 2013

MFS® MASSACHUSETTS INVESTORS GROWTH STOCK PORTFOLIO
MFS® Variable Insurance Trust II

MIS-SEM
MFS® MASSACHUSETTS INVESTORS GROWTH STOCK PORTFOLIO
CONTENTS
The report is prepared for the general information of contract owners. It is authorized for distribution to prospective investors only when preceded or accompanied by a current prospectus.
NOT FDIC INSURED Ÿ MAY LOSE VALUE Ÿ NO BANK OR CREDIT UNION GUARANTEE Ÿ NOT A DEPOSIT Ÿ NOT INSURED BY ANY FEDERAL GOVERNMENT AGENCY OR NCUA/NCUSIF
MFS Massachusetts Investors Growth Stock Portfolio
LETTER FROM THE CHAIRMAN AND CEO

Dear Contract Owners:
As the year progresses, the global economy continues to grind ahead slowly, held back by broad austerity measures. The U.S. economy remains a steadying force, driven by resilient consumers, who have taken the payroll tax increase and the sequestration’s early impact in stride. With U.S. housing and jobs showing steady expansion, domestic consumer-driven growth has offset weaker exports and the U.S. government’s spending constraints. In response to these developments, the U.S. Federal Reserve has begun to brace investors for an eventual shift in its monetary policy, causing global market tremors.
Japan has been another bright spot, with government and central bank stimulus policies leading to increased exports, a resurgent stock market and improved economic sentiment. After a six-month rally, Japan’s stocks slipped late in the second quarter, then picked up momentum on fresh signs that the country could soon break free of its chronic deflation. The major deterrent to global growth remains the eurozone, still in the grip of persistent recession. China has seen its pace of economic growth decelerate, a troubling turn for the country’s trading partners, who have come to rely on it as an engine for global growth.
As always, managing risk in the face of uncertainty remains a top priority for investors. At MFS®, our uniquely collaborative investment process employs integrated, global research and active risk management. Our global team of investment professionals shares ideas and evaluates opportunities across continents, investment disciplines and asset classes — all with a goal of building better insights, and ultimately better results, for our clients.
We are mindful of the many economic challenges investors face, and believe it is more important than ever to maintain a long-term view and employ time-tested principles, such as asset allocation and diversification. We remain confident that our unique approach can serve investors well as they work with their financial advisors to identify and pursue the most suitable opportunities.
Respectfully,

Robert J. Manning
Chairman and Chief Executive Officer
MFS Investment Management®
August 16, 2013
The opinions expressed in this letter are subject to change, may not be relied upon for investment advice, and no forecasts can be guaranteed.
1
MFS Massachusetts Investors Growth Stock Portfolio
PORTFOLIO COMPOSITION
Portfolio structure
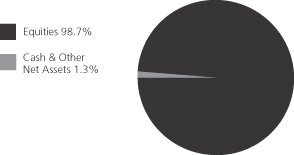
| | | | |
| Top ten holdings | | | | |
| Google, Inc., “A” | | | 4.5% | |
| United Technologies Corp. | | | 3.7% | |
| Danaher Corp. | | | 3.7% | |
| Visa, Inc., “A” | | | 3.4% | |
| Procter & Gamble Co. | | | 3.2% | |
| Colgate-Palmolive Co. | | | 3.1% | |
| Thermo Fisher Scientific, Inc. | | | 3.0% | |
| Accenture PLC, “A” | | | 2.8% | |
| EMC Corp. | | | 2.6% | |
| Oracle Corp. | | | 2.6% | |
| | | | |
| Equity sectors | | | | |
| Technology | | | 18.0% | |
| Industrial Goods & Services | | | 15.4% | |
| Health Care | | | 13.2% | |
| Consumer Staples | | | 13.1% | |
| Leisure | | | 8.1% | |
| Retailing | | | 7.7% | |
| Financial Services | | | 7.6% | |
| Special Products & Services | | | 4.6% | |
| Energy | | | 4.3% | |
| Transportation | | | 3.3% | |
| Basic Materials | | | 2.4% | |
| Autos & Housing | | | 1.0% | |
Percentages are based on net assets as of 6/30/13.
The portfolio is actively managed and current holdings may be different.
2
MFS Massachusetts Investors Growth Stock Portfolio
EXPENSE TABLE
Fund Expenses Borne by the Contract Holders During the Period,
January 1, 2013 through June 30, 2013
As a contract holder of the fund, you incur ongoing costs, including management fees; distribution and/or service (12b-1) fees; and other fund expenses. This example is intended to help you understand your ongoing costs (in dollars) of investing in the fund and to compare these costs with the ongoing costs of investing in other mutual funds.
The example is based on an investment of $1,000 invested at the beginning of the period and held for the entire period January 1, 2013 through June 30, 2013.
Actual Expenses
The first line for each share class in the following table provides information about actual account values and actual expenses. You may use the information in this line, together with the amount you invested, to estimate the expenses that you paid over the period. Simply divide your account value by $1,000 (for example, an $8,600 account value divided by $1,000 = 8.6), then multiply the result by the number in the first line under the heading entitled “Expenses Paid During Period” to estimate the expenses you paid on your account during this period.
Hypothetical Example for Comparison Purposes
The second line for each share class in the following table provides information about hypothetical account values and hypothetical expenses based on the fund’s actual expense ratio and an assumed rate of return of 5% per year before expenses, which is not the fund’s actual return. The hypothetical account values and expenses may not be used to estimate the actual ending account balance or expenses you paid for the period. You may use this information to compare the ongoing costs of investing in the fund and other funds. To do so, compare this 5% hypothetical example with the 5% hypothetical examples that appear in the shareholder reports of the other funds.
Please note that the expenses shown in the table are meant to highlight the fund’s ongoing costs only and do not take into account the fees and expenses imposed under the variable contracts through which your investment in the fund is made. Therefore, the second line for each share class in the table is useful in comparing ongoing costs associated with an investment in vehicles (such as the fund) which fund benefits under variable annuity and variable life insurance contracts and to qualified pension and retirement plans only, and will not help you determine the relative total costs of investing in the fund through variable annuity and variable life insurance contracts. If the fees and expenses imposed under the variable contracts were included, your costs would have been higher.
| | | | | | | | | | | | | | | | | | |
| Share Class | | | | Annualized
Expense Ratio | | | Beginning
Account Value
1/01/13 | | | Ending
Account Value
6/30/13 | | | Expenses Paid
During Period (p)
1/01/13-6/30/13 | |
| Initial Class | | Actual | | | 0.80% | | | | $1,000.00 | | | | $1,107.70 | | | | $4.18 | |
| | Hypothetical (h) | | | 0.80% | | | | $1,000.00 | | | | $1,020.83 | | | | $4.01 | |
| Service Class | | Actual | | | 1.05% | | | | $1,000.00 | | | | $1,107.01 | | | | $5.49 | |
| | Hypothetical (h) | | | 1.05% | | | | $1,000.00 | | | | $1,019.59 | | | | $5.26 | |
| (h) | 5% class return per year before expenses. |
| (p) | Expenses paid are equal to each class’s annualized expense ratio, as shown above, multiplied by the average account value over the period, multiplied by the number of days in the period, divided by the number of days in the year. |
3
MFS Massachusetts Investors Growth Stock Portfolio
PORTFOLIO OF INVESTMENTS – 6/30/13 (unaudited)
The Portfolio of Investments is a complete list of all securities owned by your fund. It is categorized by broad-based asset classes.
| | | | | | | | |
| Issuer | | Shares/Par | | | Value ($) | |
| | | | | | | | |
| COMMON STOCKS – 98.7% | |
| Aerospace – 5.5% | | | | | | | | |
| Precision Castparts Corp. | | | 44,745 | | | $ | 10,112,817 | |
| United Technologies Corp. | | | 221,830 | | | | 20,616,880 | |
| | | | | | | | |
| | | | | | $ | 30,729,697 | |
| | | | | | | | |
| Alcoholic Beverages – 1.2% | |
| Pernod Ricard S.A. | | | 59,288 | | | $ | 6,574,299 | |
| | | | | | | | |
| Apparel Manufacturers – 3.1% | |
| LVMH Moet Hennessy Louis Vuitton S.A. | | | 62,159 | | | $ | 10,009,859 | |
| NIKE, Inc., “B” | | | 114,400 | | | | 7,284,992 | |
| | | | | | | | |
| | | | | | $ | 17,294,851 | |
| | | | | | | | |
| Automotive – 1.0% | | | | | | | | |
| Johnson Controls, Inc. | | | 159,210 | | | $ | 5,698,126 | |
| | | | | | | | |
| Broadcasting – 6.1% | | | | | | | | |
| Discovery Communications, Inc., “A” (a) | | | 66,420 | | | $ | 5,128,288 | |
| Omnicom Group, Inc. | | | 42,940 | | | | 2,699,638 | |
| Time Warner, Inc. | | | 156,050 | | | | 9,022,811 | |
| Viacom, Inc., “B” | | | 78,700 | | | | 5,355,535 | |
| Walt Disney Co. | | | 189,880 | | | | 11,990,922 | |
| | | | | | | | |
| | | | | | $ | 34,197,194 | |
| | | | | | | | |
| Brokerage & Asset Managers – 2.9% | |
| Charles Schwab Corp. | | | 162,970 | | | $ | 3,459,853 | |
| CME Group, Inc. | | | 48,110 | | | | 3,655,398 | |
| Franklin Resources, Inc. | | | 66,549 | | | | 9,051,995 | |
| | | | | | | | |
| | | | | | $ | 16,167,246 | |
| | | | | | | | |
| Business Services – 4.6% | | | | | | | | |
| Accenture PLC, “A” | | | 220,560 | | | $ | 15,871,498 | |
| Cognizant Technology Solutions Corp., “A” (a) | | | 49,230 | | | | 3,082,290 | |
| MSCI, Inc., “A” (a) | | | 96,690 | | | | 3,216,876 | |
| Verisk Analytics, Inc., “A” (a) | | | 59,020 | | | | 3,523,494 | |
| | | | | | | | |
| | | | | | $ | 25,694,158 | |
| | | | | | | | |
| Chemicals – 0.6% | | | | | | | | |
| Monsanto Co. | | | 32,397 | | | $ | 3,200,824 | |
| | | | | | | | |
| Computer Software – 3.9% | |
| Autodesk, Inc. (a) | | | 209,600 | | | $ | 7,113,824 | |
| Oracle Corp. | | | 470,430 | | | | 14,451,610 | |
| | | | | | | | |
| | | | | | $ | 21,565,434 | |
| | | | | | | | |
| Computer Software – Systems – 5.2% | |
| Apple, Inc. | | | 16,765 | | | $ | 6,640,281 | |
| EMC Corp. | | | 619,040 | | | | 14,621,725 | |
| International Business Machines Corp. | | | 39,566 | | | | 7,561,458 | |
| | | | | | | | |
| | | | | | $ | 28,823,464 | |
| | | | | | | | |
| Consumer Products – 7.0% | | | | | | | | |
| Church & Dwight Co., Inc. | | | 61,810 | | | $ | 3,814,295 | |
| Colgate-Palmolive Co. | | | 301,714 | | | | 17,285,195 | |
| Procter & Gamble Co. | | | 230,341 | | | | 17,733,954 | |
| | | | | | | | |
| | | | | | $ | 38,833,444 | |
| | | | | | | | |
| | | | | | | | |
| Issuer | | Shares/Par | | | Value ($) | |
| | | | | | | | |
| COMMON STOCKS – continued | |
| Electrical Equipment – 9.9% | | | | | | | | |
| Amphenol Corp., “A” | | | 56,880 | | | $ | 4,433,227 | |
| Danaher Corp. | | | 323,170 | | | | 20,456,661 | |
| Mettler-Toledo International, Inc. (a) | | | 38,444 | | | | 7,734,933 | |
| Sensata Technologies Holding B.V. (a) | | | 338,810 | | | | 11,824,469 | |
| W.W. Grainger, Inc. | | | 43,086 | | | | 10,865,427 | |
| | | | | | | | |
| | | | | | $ | 55,314,717 | |
| | | | | | | | |
| Electronics – 3.6% | | | | | | | | |
| Microchip Technology, Inc. | | | 359,290 | | | $ | 13,383,553 | |
| Taiwan Semiconductor Manufacturing Co. Ltd., ADR | | | 361,839 | | | | 6,628,890 | |
| | | | | | | | |
| | | | | | $ | 20,012,443 | |
| | | | | | | | |
| Energy – Independent – 1.1% | | | | | | | | |
| Occidental Petroleum Corp. | | | 69,200 | | | $ | 6,174,716 | |
| | | | | | | | |
| Food & Beverages – 4.9% | | | | | | | | |
| Groupe Danone | | | 175,931 | | | $ | 13,204,168 | |
| Mead Johnson Nutrition Co., “A” | | | 77,780 | | | | 6,162,509 | |
| PepsiCo, Inc. | | | 97,110 | | | | 7,942,627 | |
| | | | | | | | |
| | | | | | $ | 27,309,304 | |
| | | | | | | | |
| Food & Drug Stores – 2.3% | | | | | | | | |
| CVS Caremark Corp. | | | 225,056 | | | $ | 12,868,702 | |
| | | | | | | | |
| General Merchandise – 1.4% | | | | | | | | |
| Kohl’s Corp. | | | 64,740 | | | $ | 3,270,017 | |
| Target Corp. | | | 63,230 | | | | 4,354,018 | |
| | | | | | | | |
| | | | | | $ | 7,624,035 | |
| | | | | | | | |
| Internet – 5.3% | | | | | | | | |
| eBay, Inc. (a) | | | 92,260 | | | $ | 4,771,687 | |
| Google, Inc., “A” (a) | | | 28,258 | | | | 24,877,495 | |
| | | | | | | | |
| | | | | | $ | 29,649,182 | |
| | | | | | | | |
| Medical & Health Technology & Services – 2.9% | |
| Express Scripts Holding Co. (a) | | | 219,487 | | | $ | 13,540,153 | |
| Patterson Cos., Inc. | | | 73,112 | | | | 2,749,011 | |
| | | | | | | | |
| | | | | | $ | 16,289,164 | |
| | | | | | | | |
| Medical Equipment – 7.5% | | | | | | | | |
| Becton, Dickinson & Co. | | | 30,170 | | | $ | 2,981,701 | |
| DENTSPLY International, Inc. | | | 282,550 | | | | 11,573,248 | |
| St. Jude Medical, Inc. | | | 76,430 | | | | 3,487,501 | |
| Thermo Fisher Scientific, Inc. | | | 194,770 | | | | 16,483,385 | |
| Waters Corp. (a) | | | 74,850 | | | | 7,488,743 | |
| | | | | | | | |
| | | | | | $ | 42,014,578 | |
| | | | | | | | |
| Metals & Mining – 0.4% | | | | | | | | |
| Rio Tinto Ltd. | | | 54,230 | | | $ | 2,222,700 | |
| | | | | | | | |
| Oil Services – 3.2% | | | | | | | | |
| National Oilwell Varco, Inc. | | | 48,720 | | | $ | 3,356,808 | |
| Schlumberger Ltd. | | | 199,730 | | | | 14,312,652 | |
| | | | | | | | |
| | | | | | $ | 17,669,460 | |
| | | | | | | | |
4
MFS Massachusetts Investors Growth Stock Portfolio
Portfolio of Investments (unaudited) – continued
| | | | | | | | |
| Issuer | | Shares/Par | | | Value ($) | |
| | | | | | | | |
| COMMON STOCKS – continued | |
| Other Banks & Diversified Financials – 4.7% | |
| MasterCard, Inc., “A” | | | 12,941 | | | $ | 7,434,605 | |
| Visa, Inc., “A” | | | 104,507 | | | | 19,098,654 | |
| | | | | | | | |
| | | | | | $ | 26,533,259 | |
| | | | | | | | |
| Pharmaceuticals – 2.8% | | | | | | | | |
| Allergan, Inc. | | | 40,969 | | | $ | 3,451,229 | |
| Johnson & Johnson | | | 138,590 | | | | 11,899,337 | |
| Zoetis, Inc. | | | 10,630 | | | | 328,361 | |
| | | | | | | | |
| | | | | | $ | 15,678,927 | |
| | | | | | | | |
| Railroad & Shipping – 1.4% | | | | | | | | |
| Kuehne & Nagel, Inc. AG | | | 70,010 | | | $ | 7,675,855 | |
| | | | | | | | |
| Restaurants – 2.0% | | | | | | | | |
| McDonald’s Corp. | | | 115,479 | | | $ | 11,432,421 | |
| | | | | | | | |
| Specialty Chemicals – 1.4% | | | | | | | | |
| Praxair, Inc. | | | 68,218 | | | $ | 7,855,985 | |
| | | | | | | | |
| Specialty Stores – 0.9% | | | | | | | | |
| Industria de Diseno Textil S.A. | | | 40,614 | | | $ | 5,013,735 | |
| | | | | | | | |
| Trucking – 1.9% | | | | | | | | |
| Expeditors International of Washington, Inc. | | | 284,300 | | | $ | 10,806,243 | |
| | | | | | | | |
Total Common Stocks
(Identified Cost, $441,042,292) | | | $ | 550,924,163 | |
| | | | | | | | |
| | | | | | | | |
| Issuer | | Shares/Par | | | Value ($) | |
| | | | | | | | |
| MONEY MARKET FUNDS – 0.4% | |
| MFS Institutional Money Market Portfolio, 0.11%, at Cost and Net Asset Value (v) | | | 1,983,445 | | | $ | 1,983,445 | |
| | | | | | | | |
Total Investments
(Identified Cost, $443,025,737) | | | | | | $ | 552,907,608 | |
| | | | | | | | |
OTHER ASSETS, LESS
LIABILITIES – 0.9% | | | | | | | 4,988,454 | |
| | | | | | | | |
| Net Assets – 100.0% | | | | | | $ | 557,896,062 | |
| | | | | | | | |
| (a) | | Non-income producing security. |
| (v) | | Underlying affiliated fund that is available only to investment companies managed by MFS. The rate quoted for the MFS Institutional Money Market Portfolio is the annualized seven-day yield of the fund at period end. |
The following abbreviations are used in this report and are defined:
| ADR | | American Depositary Receipt |
| PLC | | Public Limited Company |
See Notes to Financial Statements
5
MFS Massachusetts Investors Growth Stock Portfolio
FINANCIAL STATEMENTS | STATEMENT OF ASSETS AND LIABILITIES (unaudited)
This statement represents your fund’s balance sheet, which details the assets and liabilities comprising the total value of the fund.
| | | | | | | | |
At 6/30/13 | | | | | | | | |
Assets | | | | | | | | |
Investments – | | | | | | | | |
Non-affiliated issuers, at value (identified cost, $441,042,292) | | | $550,924,163 | | | | | |
Underlying affiliated funds, at cost and value | | | 1,983,445 | | | | | |
Total investments, at value (identified cost, $443,025,737) | | | $552,907,608 | | | | | |
Cash | | | 68,511 | | | | | |
Receivables for | | | | | | | | |
Investments sold | | | 4,964,144 | | | | | |
Interest and dividends | | | 524,436 | | | | | |
Other assets | | | 2,922 | | | | | |
Total assets | | | | | | | $558,467,621 | |
Liabilities | | | | | | | | |
Payable for fund shares reacquired | | | $439,596 | | | | | |
Payable to affiliates | | | | | | | | |
Investment adviser | | | 49,876 | | | | | |
Shareholder servicing costs | | | 135 | | | | | |
Distribution and/or service fees | | | 1,375 | | | | | |
Payable for independent Trustees’ compensation | | | 2,799 | | | | | |
Accrued expenses and other liabilities | | | 77,778 | | | | | |
Total liabilities | | | | | | | $571,559 | |
Net assets | | | | | | | $557,896,062 | |
Net assets consist of | | | | | | | | |
Paid-in capital | | | $447,346,126 | | | | | |
Unrealized appreciation (depreciation) on investments and translation of assets and liabilities in foreign currencies | | | 109,893,316 | | | | | |
Accumulated net realized gain (loss) on investments and foreign currency | | | (5,147,205 | ) | | | | |
Undistributed net investment income | | | 5,803,825 | | | | | |
Net assets | | | | | | | $557,896,062 | |
Shares of beneficial interest outstanding | | | | | | | 37,703,435 | |
| | | | | | | | | | | | |
| | | Net assets | | | Shares
outstanding | | | Net asset value
per share | |
Initial Class | | | $507,965,304 | | | | 34,304,110 | | | | $14.81 | |
Service Class | | | 49,930,758 | | | | 3,399,325 | | | | 14.69 | |
See Notes to Financial Statements
6
MFS Massachusetts Investors Growth Stock Portfolio
FINANCIAL STATEMENTS | STATEMENT OF OPERATIONS (unaudited)
This statement describes how much your fund earned in investment income and accrued in expenses. It also describes any gains and/or losses generated by fund operations.
| | | | | | | | |
Six months ended 6/30/13 | | | | | | | | |
Net investment income | | | | | | | | |
Income | | | | | | | | |
Dividends | | | $4,262,231 | | | | | |
Interest | | | 28,276 | | | | | |
Dividends from underlying affiliated funds | | | 3,080 | | | | | |
Foreign taxes withheld | | | (115,803 | ) | | | | |
Total investment income | | | | | | | $4,177,784 | |
Expenses | | | | | | | | |
Management fee | | | $2,118,736 | | | | | |
Distribution and/or service fees | | | 64,669 | | | | | |
Shareholder servicing costs | | | 3,144 | | | | | |
Administrative services fee | | | 40,704 | | | | | |
Independent Trustees’ compensation | | | 8,560 | | | | | |
Custodian fee | | | 32,394 | | | | | |
Shareholder communications | | | 13,902 | | | | | |
Audit and tax fees | | | 25,205 | | | | | |
Legal fees | | | 4,644 | | | | | |
Miscellaneous | | | 12,186 | | | | | |
Total expenses | | | | | | | $2,324,144 | |
Fees paid indirectly | | | (2 | ) | | | | |
Reduction of expenses by investment adviser | | | (1,838 | ) | | | | |
Net expenses | | | | | | | $2,322,304 | |
Net investment income | | | | | | | $1,855,480 | |
Realized and unrealized gain (loss) on investments and foreign currency | | | | | | | | |
Realized gain (loss) (identified cost basis) | | | | | | | | |
Investments | | | $34,050,541 | | | | | |
Foreign currency | | | (6,225 | ) | | | | |
Net realized gain (loss) on investments and foreign currency | | | | | | | $34,044,316 | |
Change in unrealized appreciation (depreciation) | | | | | | | | |
Investments | | | $21,823,655 | | | | | |
Translation of assets and liabilities in foreign currencies | | | (1,551 | ) | | | | |
Net unrealized gain (loss) on investments and foreign currency translation | | | | | | | $21,822,104 | |
Net realized and unrealized gain (loss) on investments and foreign currency | | | | | | | $55,866,420 | |
Change in net assets from operations | | | | | | | $57,721,900 | |
See Notes to Financial Statements
7
MFS Massachusetts Investors Growth Stock Portfolio
FINANCIAL STATEMENTS | STATEMENTS OF CHANGES IN NET ASSETS
These statements describe the increases and/or decreases in net assets resulting from operations, any distributions, and any shareholder transactions.
| | | | | | | | |
| |
| Six months ended
6/30/13
(unaudited |
) | |
| Year ended
12/31/12 |
|
Change in net assets | | | | | | | | |
| From operations | | | | | | | | |
Net investment income | | | $1,855,480 | | | | $3,950,427 | |
Net realized gain (loss) on investments and foreign currency | | | 34,044,316 | | | | 45,115,735 | |
Net unrealized gain (loss) on investments and foreign currency translation | | | 21,822,104 | | | | 39,033,027 | |
Change in net assets from operations | | | $57,721,900 | | | | $88,099,189 | |
| Distributions declared to shareholders | | | | | | | | |
From net investment income | | | $— | | | | $(2,110,200 | ) |
Change in net assets from fund share transactions | | | $(41,038,667 | ) | | | $(83,879,993 | ) |
Total change in net assets | | | $16,683,233 | | | | $2,108,996 | |
| Net assets | | | | | | | | |
At beginning of period | | | 541,212,829 | | | | 539,103,833 | |
At end of period (including undistributed net investment income of $5,803,825 and
$3,948,345, respectively) | | | $557,896,062 | | | | $541,212,829 | |
See Notes to Financial Statements
8
MFS Massachusetts Investors Growth Stock Portfolio
FINANCIAL STATEMENTS | FINANCIAL HIGHLIGHTS
The financial highlights table is intended to help you understand the fund’s financial performance for the semiannual period and the past 5 fiscal years. Certain information reflects financial results for a single fund share. The total returns in the table represent the rate by which an investor would have earned (or lost) on an investment in the fund share class (assuming reinvestment of all distributions) held for the entire period.
| | | | | | | | | | | | | | | | | | | | | | | | |
| Initial Class | | Six months
ended
6/30/13 | | | Years ended 12/31 | |
| | | | 2012 | | | 2011 | | | 2010 | | | 2009 | | | 2008 | |
| | | (unaudited) | | | | | | | | | | | | | | | | |
Net asset value, beginning of period | | | $13.37 | | | | $11.45 | | | | $11.43 | | | | $10.13 | | | | $7.30 | | | | $11.69 | |
| Income (loss) from investment operations | | | | | | | | | | | | | | | | | | | | | | | | |
Net investment income (d) | | | $0.05 | | | | $0.09 | | | | $0.06 | | | | $0.06 | | | | $0.05 | | | | $0.06 | |
Net realized and unrealized gain (loss) on investments
and foreign currency | | | 1.39 | | | | 1.88 | | | | 0.03 | | | | 1.27 | | | | 2.85 | | | | (4.39 | ) |
Total from investment operations | | | $1.44 | | | | $1.97 | | | | $0.09 | | | | $1.33 | | | | $2.90 | | | | $(4.33 | ) |
| Less distributions declared to shareholders | | | | | | | | | | | | | | | | | | | | | | | | |
From net investment income | | | $— | | | | $(0.05 | ) | | | $(0.07 | ) | | | $(0.03 | ) | | | $(0.07 | ) | | | $(0.06 | ) |
Net asset value, end of period (x) | | | $14.81 | | | | $13.37 | | | | $11.45 | | | | $11.43 | | | | $10.13 | | | | $7.30 | |
Total return (%) (k)(r)(s)(x) | | | 10.77 | (n) | | | 17.25 | | | | 0.80 | | | | 13.15 | | | | 40.14 | | | | (37.22 | ) |
Ratios (%) (to average net assets)
and Supplemental data: | | | | | | | | | | | | | | | | | | | | | | | | |
Expenses before expense reductions (f) | | | 0.80 | (a) | | | 0.80 | | | | 0.83 | | | | 0.86 | | | | 0.87 | | | | 0.86 | |
Expenses after expense reductions (f) | | | 0.80 | (a) | | | 0.80 | | | | 0.82 | | | | 0.82 | | | | 0.82 | | | | 0.83 | |
Net investment income | | | 0.68 | (a) | | | 0.74 | | | | 0.47 | | | | 0.55 | | | | 0.62 | | | | 0.62 | |
Portfolio turnover | | | 14 | (n) | | | 30 | | | | 24 | | | | 45 | | | | 53 | | | | 42 | |
Net assets at end of period (000 omitted) | | | $507,965 | | | | $490,630 | | | | $485,484 | | | | $429,925 | | | | $448,333 | | | | $145,858 | |
| | |
| Service Class | | Six months
ended
6/30/13 | | | Years ended 12/31 | |
| | | | 2012 | | | 2011 | | | 2010 | | | 2009 | | | 2008 | |
| | | (unaudited) | | | | | | | | | | | | | | | | |
Net asset value, beginning of period | | | $13.27 | | | | $11.37 | | | | $11.34 | | | | $10.06 | | | | $7.24 | | | | $11.59 | |
| Income (loss) from investment operations | | | | | | | | | | | | | | | | | | | | | | | | |
Net investment income (d) | | | $0.03 | | | | $0.06 | | | | $0.03 | | | | $0.03 | | | | $0.04 | | | | $0.04 | |
Net realized and unrealized gain (loss) on investments
and foreign currency | | | 1.39 | | | | 1.86 | | | | 0.03 | | | | 1.26 | | | | 2.82 | | | | (4.36 | ) |
Total from investment operations | | | $1.42 | | | | $1.92 | | | | $0.06 | | | | $1.29 | | | | $2.86 | | | | $(4.32 | ) |
| Less distributions declared to shareholders | | | | | | | | | | | | | | | | | | | | | | | | |
From net investment income | | | $— | | | | $(0.02 | ) | | | $(0.03 | ) | | | $(0.01 | ) | | | $(0.04 | ) | | | $(0.03 | ) |
Net asset value, end of period (x) | | | $14.69 | | | | $13.27 | | | | $11.37 | | | | $11.34 | | | | $10.06 | | | | $7.24 | |
Total return (%) (k)(r)(s)(x) | | | 10.70 | (n) | | | 16.85 | | | | 0.57 | | | | 12.83 | | | | 39.78 | | | | (37.35 | ) |
Ratios (%) (to average net assets)
and Supplemental data: | | | | | | | | | | | | | | | | | | | | | | | | |
Expenses before expense reductions (f) | | | 1.05 | (a) | | | 1.05 | | | | 1.08 | | | | 1.11 | | | | 1.12 | | | | 1.11 | |
Expenses after expense reductions (f) | | | 1.05 | (a) | | | 1.05 | | | | 1.07 | | | | 1.07 | | | | 1.07 | | | | 1.08 | |
Net investment income | | | 0.43 | (a) | | | 0.48 | | | | 0.22 | | | | 0.30 | | | | 0.43 | | | | 0.37 | |
Portfolio turnover | | | 14 | (n) | | | 30 | | | | 24 | | | | 45 | | | | 53 | | | | 42 | |
Net assets at end of period (000 omitted) | | | $49,931 | | | | $50,583 | | | | $53,620 | | | | $69,714 | | | | $80,269 | | | | $59,579 | |
See Notes to Financial Statements
9
MFS Massachusetts Investors Growth Stock Portfolio
Financial Highlights – continued
| (d) | Per share data is based on average shares outstanding. |
| (f) | Ratios do not reflect reductions from fees paid indirectly, if applicable. |
| (k) | The total return does not reflect expenses that apply to separate accounts. Inclusion of these charges would reduce the total return figures for all periods shown. |
| (r) | Certain expenses have been reduced without which performance would have been lower. |
| (s) | From time to time the fund may receive proceeds from litigation settlements, without which performance would be lower. |
| (x) | The net asset values per share and total returns have been calculated on net assets which include adjustments made in accordance with U.S. generally accepted accounting principles required at period end for financial reporting purposes. |
See Notes to Financial Statements
10
MFS Massachusetts Investors Growth Stock Portfolio
NOTES TO FINANCIAL STATEMENTS (unaudited)
| (1) | | Business and Organization |
MFS Massachusetts Investors Growth Stock Portfolio (the fund) is a series of MFS Variable Insurance Trust II (the trust). The trust is organized as a Massachusetts business trust and is registered under the Investment Company Act of 1940, as amended, as an open-end management investment company. The shareholders of each series of the trust are separate accounts of insurance companies, which offer variable annuity and/or life insurance products, and qualified retirement and pension plans.
| (2) | | Significant Accounting Policies |
General – The preparation of financial statements in conformity with U.S. generally accepted accounting principles requires management to make estimates and assumptions that affect the reported amounts of assets and liabilities, and disclosure of contingent assets and liabilities at the date of the financial statements and the reported amounts of revenues and expenses during the reporting period. Actual results could differ from those estimates. In the preparation of these financial statements, management has evaluated subsequent events occurring after the date of the fund’s Statement of Assets and Liabilities through the date that the financial statements were issued.
In this reporting period, the fund adopted the disclosure provisions of the Financial Accounting Standards Board (FASB) Accounting Standards Update 2011-11 (“ASU 2011-11”), Balance Sheet (Topic 210) – Disclosures about Offsetting Assets and Liabilities along with the related scope clarification provisions of FASB Accounting Standards Update 2013-01 (“ASU 2013-01”) entitled Balance Sheet (Topic 210) – Clarifying the Scope of Disclosures about Offsetting Assets and Liabilities. ASU 2011-11 is intended to enhance disclosures on the offsetting of financial assets and liabilities by requiring entities to disclose both gross and net information about financial instruments and transactions that are either offset in the statement of financial position or subject to a Master Netting Agreement or similar arrangement. ASU 2013-01 limits the scope of ASU 2011-11’s disclosure requirements on offsetting to financial assets and financial liabilities related to derivatives, repurchase and reverse repurchase agreements, and securities lending and securities borrowing transactions. The disclosures required by ASU 2011-11, to the extent applicable to the fund have been included in the fund’s Significant Accounting Policies note under the captions for each of the fund’s in-scope financial instruments and transactions.
In June 2013, FASB issued Accounting Standards Update 2013-08 Financial Services – Investment Companies (Topic 946) – Amendments to the Scope, Measurement, and Disclosure Requirements (“ASU 2013-08”) which is effective for interim and annual reporting periods in fiscal years that begin after December 15, 2013. ASU 2013-08 sets forth a methodology for determining whether an entity should be characterized as an investment company and prescribes fair value accounting for an investment company’s non-controlling ownership interest in another investment company. FASB has determined that a fund registered under the Investment Company Act of 1940 automatically meets ASU 2013-08’s criteria for an investment company. Although still evaluating the potential impacts of ASU 2013-08 to the fund, management expects that the impact of the fund’s adoption will be limited to additional financial statement disclosures.
Investment Valuations – Equity securities, including restricted equity securities, are generally valued at the last sale or official closing price as provided by a third-party pricing service on the market or exchange on which they are primarily traded. Equity securities, for which there were no sales reported that day, are generally valued at the last quoted daily bid quotation as provided by a third-party pricing service on the market or exchange on which such securities are primarily traded. Short-term instruments with a maturity at issuance of 60 days or less generally are valued at amortized cost, which approximates market value. Open-end investment companies are generally valued at net asset value per share. Securities and other assets generally valued on the basis of information from a third-party pricing service may also be valued at a broker/dealer bid quotation. Values obtained from third-party pricing services can utilize both transaction data and market information such as yield, quality, coupon rate, maturity, type of issue, trading characteristics, and other market data. The values of foreign securities and other assets and liabilities expressed in foreign currencies are converted to U.S. dollars using the mean of bid and asked prices for rates provided by a third-party pricing service.
The Board of Trustees has delegated primary responsibility for determining or causing to be determined the value of the fund’s investments (including any fair valuation) to the adviser pursuant to valuation policies and procedures approved by the Board. If the adviser determines that reliable market quotations are not readily available, investments are valued at fair value as determined in good faith by the adviser in accordance with such procedures under the oversight of the Board of Trustees. Under the fund’s valuation policies and procedures, market quotations are not considered to be readily available for most types of debt instruments and floating rate loans and many types of derivatives. These investments are generally valued at fair value based on information from third-party pricing services. In addition, investments may be valued at fair value if the adviser determines that an investment’s value has been materially affected by events occurring after the close of the exchange or market on which the investment is principally traded (such as foreign exchange or market) and prior to the determination of the fund’s net asset value, or after the halting of trading of a specific security where trading does not resume prior to the close of the exchange or market on which the security is principally traded. Events that occur on a frequent basis after foreign markets close (such as developments in foreign markets and significant movements in the U.S. markets) and prior to the determination of the fund’s net asset value may be deemed to have a material effect on the value of securities traded in foreign markets. Accordingly, the fund’s foreign equity securities may often be
11
MFS Massachusetts Investors Growth Stock Portfolio
Notes to Financial Statements (unaudited) – continued
valued at fair value. The adviser generally relies on third-party pricing services or other information (such as the correlation with price movements of similar securities in the same or other markets; the type, cost and investment characteristics of the security; the business and financial condition of the issuer; and trading and other market data) to assist in determining whether to fair value and at what value to fair value an investment. The value of an investment for purposes of calculating the fund’s net asset value can differ depending on the source and method used to determine value. When fair valuation is used, the value of an investment used to determine the fund’s net asset value may differ from quoted or published prices for the same investment. There can be no assurance that the fund could obtain the fair value assigned to an investment if it were to sell the investment at the same time at which the fund determines its net asset value per share.
Various inputs are used in determining the value of the fund’s assets or liabilities. These inputs are categorized into three broad levels. In certain cases, the inputs used to measure fair value may fall into different levels of the fair value hierarchy. In such cases, an investment’s level within the fair value hierarchy is based on the lowest level of input that is significant to the fair value measurement. The fund’s assessment of the significance of a particular input to the fair value measurement in its entirety requires judgment, and considers factors specific to the investment. Level 1 includes unadjusted quoted prices in active markets for identical assets or liabilities. Level 2 includes other significant observable market-based inputs (including quoted prices for similar securities, interest rates, prepayment speed, and credit risk). Level 3 includes unobservable inputs, which may include the adviser’s own assumptions in determining the fair value of investments. The following is a summary of the levels used as of June 30, 2013 in valuing the fund’s assets or liabilities:
| | | | | | | | | | | | | | | | |
| Investments at Value | | Level 1 | | | Level 2 | | | Level 3 | | | Total | |
| Equity Securities: | | | | | | | | | | | | | | | | |
United States | | | $499,594,657 | | | | $— | | | | $— | | | | $499,594,657 | |
France | | | 19,778,467 | | | | 10,009,859 | | | | — | | | | 29,788,326 | |
Switzerland | | | — | | | | 7,675,855 | | | | — | | | | 7,675,855 | |
Taiwan | | | 6,628,890 | | | | — | | | | — | | | | 6,628,890 | |
Spain | | | 5,013,735 | | | | — | | | | — | | | | 5,013,735 | |
United Kingdom | | | — | | | | 2,222,700 | | | | — | | | | 2,222,700 | |
| Mutual Funds | | | 1,983,445 | | | | — | | | | — | | | | 1,983,445 | |
| Total Investments | | | $532,999,194 | | | | $19,908,414 | | | | $— | | | | $552,907,608 | |
For further information regarding security characteristics, see the Portfolio of Investments.
Of the level 1 investments presented above, equity investments amounting to $18,217,903 would have been considered level 2 investments at the beginning of the period. The primary reason for changes in the classifications between levels 1 and 2 occurs when foreign equity securities are fair valued using other observable market-based inputs in place of the closing exchange price due to events occurring after the close of the exchange or market on which the investment is principally traded. The fund’s foreign equity securities may often be valued at fair value. The fund’s policy is to recognize transfers between the levels as of the end of the period.
Foreign Currency Translation – Purchases and sales of foreign investments, income, and expenses are converted into U.S. dollars based upon currency exchange rates prevailing on the respective dates of such transactions or on the reporting date for foreign denominated receivables and payables. Gains and losses attributable to foreign currency exchange rates on sales of securities are recorded for financial statement purposes as net realized gains and losses on investments. Gains and losses attributable to foreign exchange rate movements on receivables, payables, income and expenses are recorded for financial statement purposes as foreign currency transaction gains and losses. That portion of both realized and unrealized gains and losses on investments that results from fluctuations in foreign currency exchange rates is not separately disclosed.
Security Loans – Under its Securities Lending Agency Agreement with the fund, State Street Bank and Trust Company (“State Street”), as lending agent, loans the securities of the fund to certain qualified institutions (the “Borrowers”) approved by the fund. The loans are collateralized by cash and/or U.S. Treasury and federal agency obligations in an amount typically at least equal to the market value of the securities loaned. The market value of the loaned securities is determined at the close of business of the fund and any additional required collateral is delivered to the fund on the next business day. State Street provides the fund with indemnification against Borrower default. In the event of Borrower default, State Street will for the benefit of the fund either purchase securities identical to those loaned or, when such purchase is commercially impracticable, pay the fund the market value of the loaned securities. In return, State Street assumes the fund’s rights to the related collateral. If the collateral value is less than the cost to purchase identical securities, State Street is responsible for the shortfall, but only to the extent that such shortfall is not due to a decline in collateral value resulting from collateral reinvestment for which the fund bears the risk of loss. On loans collateralized by cash, the cash collateral is invested in a money market fund or short-term securities. A portion of the income generated upon investment of the collateral is remitted to the Borrowers, and the remainder is allocated between the fund and the lending agent. On loans collateralized by U.S. Treasury and/or federal agency obligations, a fee is received from the Borrower, and is allocated between the fund and the lending agent. Income from securities lending is included in “Interest” income in the Statement of Operations. The
12
MFS Massachusetts Investors Growth Stock Portfolio
Notes to Financial Statements (unaudited) – continued
dividend and interest income earned on the securities loaned is accounted for in the same manner as other dividend and interest income. At June 30, 2013, there were no securities on loan or collateral outstanding.
Indemnifications – Under the fund’s organizational documents, its officers and Trustees may be indemnified against certain liabilities and expenses arising out of the performance of their duties to the fund. Additionally, in the normal course of business, the fund enters into agreements with service providers that may contain indemnification clauses. The fund’s maximum exposure under these agreements is unknown as this would involve future claims that may be made against the fund that have not yet occurred.
Investment Transactions and Income – Investment transactions are recorded on the trade date. Interest income is recorded on the accrual basis. Dividends received in cash are recorded on the ex-dividend date. Certain dividends from foreign securities will be recorded when the fund is informed of the dividend if such information is obtained subsequent to the ex-dividend date. Dividend and interest payments received in additional securities are recorded on the ex-dividend or ex-interest date in an amount equal to the value of the security on such date.
The fund may receive proceeds from litigation settlements. Any proceeds received from litigation involving portfolio holdings are reflected in the Statement of Operations in realized gain/loss if the security has been disposed of by the fund or in unrealized gain/loss if the security is still held by the fund. Any other proceeds from litigation not related to portfolio holdings are reflected as other income in the Statement of Operations.
Fees Paid Indirectly – The fund’s custody fee may be reduced according to an arrangement that measures the value of cash deposited with the custodian by the fund. This amount, for the six months ended June 30, 2013, is shown as a reduction of total expenses in the Statement of Operations.
Tax Matters and Distributions – The fund intends to qualify as a regulated investment company, as defined under Subchapter M of the Internal Revenue Code, and to distribute all of its taxable income, including realized capital gains. As a result, no provision for federal income tax is required. The fund’s federal tax returns, when filed, will remain subject to examination by the Internal Revenue Service for a three year period. Foreign taxes have been accrued by the fund in the accompanying financial statements in accordance with the applicable foreign tax law. Foreign income taxes may be withheld by certain countries in which the fund invests.
Distributions to shareholders are recorded on the ex-dividend date. Income and capital gain distributions are determined in accordance with income tax regulations, which may differ from U.S. generally accepted accounting principles. Certain capital accounts in the financial statements are periodically adjusted for permanent differences in order to reflect their tax character. These adjustments have no impact on net assets or net asset value per share. Temporary differences which arise from recognizing certain items of income, expense, gain or loss in different periods for financial statement and tax purposes will reverse at some time in the future. Distributions in excess of net investment income or net realized gains are temporary overdistributions for financial statement purposes resulting from differences in the recognition or classification of income or distributions for financial statement and tax purposes.
Book/tax differences primarily relate to wash sale loss deferrals.
The tax character of distributions declared to shareholders for the last fiscal year is as follows:
| | | | |
| | | 12/31/12 | |
| Ordinary income (including any short-term capital gains) | | | $2,110,200 | |
The federal tax cost and the tax basis components of distributable earnings were as follows:
| | | | |
| As of 6/30/13 | | | | |
| Cost of investments | | | $443,285,288 | |
| Gross appreciation | | | 116,537,493 | |
| Gross depreciation | | | (6,915,173 | ) |
| Net unrealized appreciation (depreciation) | | | $109,622,320 | |
| |
| As of 12/31/12 | | | | |
| Undistributed ordinary income | | | 3,948,345 | |
| Capital loss carryforwards | | | (38,931,970 | ) |
| Other temporary differences | | | 12,996 | |
| Net unrealized appreciation (depreciation) | | | 87,798,665 | |
The aggregate cost above includes prior fiscal year end tax adjustments, if applicable.
Under the Regulated Investment Company Modernization Act of 2010 (the “Act”), net capital losses recognized for fund fiscal years beginning after December 31, 2010 may be carried forward indefinitely, and their character is retained as short-term and/or long-term losses (“post-enactment losses”). Previously, net capital losses were carried forward for eight years and treated as short-term losses (“pre-enactment losses”). As a transition rule, the Act requires that all post-enactment net capital losses be used before pre-enactment net capital losses.
13
MFS Massachusetts Investors Growth Stock Portfolio
Notes to Financial Statements (unaudited) – continued
As of December 31, 2012, the fund had capital loss carryforwards available to offset future realized gains. Such pre-enactment losses expire as follows:
| | | | |
| 12/31/15 | | | $(12,959,471 | ) |
| 12/31/16 | | | (19,823,665 | ) |
| 12/31/17 | | | (6,148,834 | ) |
| Total | | | $(38,931,970 | ) |
The availability of $32,783,136 of the capital loss carryforwards, which were acquired on December 4, 2009 in connection with the MFS Capital Appreciation Portfolio merger, may be limited in a given year.
Multiple Classes of Shares of Beneficial Interest – The fund offers multiple classes of shares, which differ in their respective distribution and/or service fees. The fund’s income, realized and unrealized gain (loss), and common expenses are allocated to shareholders based on the daily net assets of each class. Dividends are declared separately for each class. Differences in per share dividend rates are generally due to differences in separate class expenses. The fund’s distributions declared to shareholders as reported in the Statements of Changes in Net Assets are presented by class as follows:
| | | | | | | | |
| | | From net investment
income | |
| | | Six months ended
6/30/13 | | | Year ended
12/31/12 | |
| Initial Class | | | $— | | | | $2,044,442 | |
| Service Class | | | — | | | | 65,758 | |
| Total | | | $— | | | | $2,110,200 | |
| (3) | | Transactions with Affiliates |
Investment Adviser – The fund has an investment advisory agreement with MFS to provide overall investment management and related administrative services and facilities to the fund. The management fee is computed daily and paid monthly at the following annual rates:
| | | | |
| First $1 billion of average daily net assets | | | 0.75% | |
| Average daily net assets in excess of $1 billion | | | 0.65% | |
Effective April 1, 2013, MFS has agreed in writing to reduce its management fee by a specified amount if certain MFS mutual fund assets exceed thresholds agreed to by MFS and the fund’s Board of Trustees. For the period April 1, 2013 through June 30, 2013, this management fee reduction amounted to $770, which is shown as a reduction of total expenses in the Statement of Operations. The management fee incurred for the six months ended June 30, 2013 was equivalent to an annual effective rate of 0.75% of the fund’s average daily net assets.
The investment adviser has agreed in writing to pay a portion of the fund’s total annual operating expenses, exclusive of interest, taxes, extraordinary expenses, brokerage and transaction costs, and investment-related expenses, such that total annual operating expenses do not exceed 0.82% of average daily net assets for the Initial Class shares and 1.07% of average daily net assets for the Service Class shares. This written agreement will continue until modified by the fund’s Board of Trustees, but such agreement will continue at least until April 30, 2015. For the six months ended June 30, 2013, the fund’s actual operating expenses did not exceed the limit and therefore, the investment adviser did not pay any portion of the fund’s expenses related to this agreement.
Distributor – MFS Fund Distributors, Inc. (MFD), a wholly-owned subsidiary of MFS, is the distributor of shares of the fund. The Trustees have adopted a distribution plan for the Service Class shares pursuant to Rule 12b-1 under the Investment Company Act of 1940.
The fund’s distribution plan provides that the fund will pay MFD distribution and/or service fees equal to 0.25% per annum of its average daily net assets attributable to Service Class shares as partial consideration for services performed and expenses incurred by MFD and financial intermediaries (including participating insurance companies that invest in the fund to fund variable annuity and variable life insurance contracts, sponsors of qualified retirement and pension plans that invest in the fund, and affiliates of these participating insurance companies and plan sponsors) in connection with the sale and distribution of the Service Class shares. MFD may subsequently pay all, or a portion, of the distribution and/or service fees to financial intermediaries.
Shareholder Servicing Agent – Effective April 1, 2013, MFS Service Center, Inc. (MFSC), a wholly-owned subsidiary of MFS, receives a fee from the fund for its services as shareholder servicing agent. For the period from April 1, 2013 through June 30, 2013, the fee was $3,139, which equated to 0.0011% annually of the fund’s average daily net assets. MFSC also receives payment from the fund for out-of-pocket expenses paid by MFSC on behalf of the fund. For the period from April 1, 2013 through June 30, 2013, these costs amounted to $5.
Administrator – MFS provides certain financial, legal, shareholder communications, compliance, and other administrative services to the fund. Under an administrative services agreement, the fund partially reimburses MFS the costs incurred to provide these services.
14
MFS Massachusetts Investors Growth Stock Portfolio
Notes to Financial Statements (unaudited) – continued
The fund is charged an annual fixed amount of $17,500 plus a fee based on average daily net assets. The administrative services fee incurred for the six months ended June 30, 2013 was equivalent to an annual effective rate of 0.0144% of the fund’s average daily net assets.
Trustees’ and Officers’ Compensation – The fund pays compensation to independent Trustees in the form of a retainer, attendance fees, and additional compensation to Board and Committee chairpersons. The fund does not pay compensation directly to Trustees or officers of the fund who are also officers of the investment adviser, all of whom receive remuneration for their services to the fund from MFS. Certain officers and Trustees of the fund are officers or directors of MFS, MFD, and MFSC.
Other – This fund and certain other funds managed by MFS (the funds) have entered into services agreements (the Agreements) which provide for payment of fees by the funds to Tarantino LLC and Griffin Compliance LLC in return for the provision of services of an Independent Chief Compliance Officer (ICCO) and Assistant ICCO, respectively, for the funds. The ICCO and Assistant ICCO are officers of the funds and the sole members of Tarantino LLC and Griffin Compliance LLC, respectively. The funds can terminate the Agreements with Tarantino LLC and Griffin Compliance LLC at any time under the terms of the Agreements. For the six months ended June 30, 2013, the aggregate fees paid by the fund to Tarantino LLC and Griffin Compliance LLC were $2,154 and are included in “Miscellaneous” expense in the Statement of Operations. MFS has agreed to reimburse the fund for a portion of the payments made by the fund in the amount of $1,068, which is shown as a reduction of total expenses in the Statement of Operations. Additionally, MFS has agreed to bear all expenses associated with office space, other administrative support, and supplies provided to the ICCO and Assistant ICCO.
The fund invests in the MFS Institutional Money Market Portfolio which is managed by MFS and seeks current income consistent with preservation of capital and liquidity. Income earned on this investment is included in “Dividends from underlying affiliated funds” in the Statement of Operations. This money market fund does not pay a management fee to MFS.
Purchases and sales of investments, other than short-term obligations, aggregated $76,617,395 and $118,452,647, respectively.
| (5) | | Shares of Beneficial Interest |
The fund’s Declaration of Trust permits the Trustees to issue an unlimited number of full and fractional shares of beneficial interest. Transactions in fund shares were as follows:
| | | | | | | | | | | | | | | | |
| | | Six months ended 6/30/13 | | | Year ended 12/31/12 | |
| | | Shares | | | Amount | | | Shares | | | Amount | |
| Shares sold | | | | | | | | | | | | | | | | |
Initial Class | | | 105,793 | | | | $1,521,300 | | | | 95,060 | | | | $1,196,872 | |
Service Class | | | 33,784 | | | | 483,055 | | | | 76,428 | | | | 972,175 | |
| | | 139,577 | | | | $2,004,355 | | | | 171,488 | | | | $2,169,047 | |
| Shares issued to shareholders in reinvestment of distributions | | | | | | | | | | | | | | | | |
Initial Class | | | — | | | | $— | | | | 158,853 | | | | $2,044,442 | |
Service Class | | | — | | | | — | | | | 5,137 | | | | 65,758 | |
| | | — | | | | $— | | | | 163,990 | | | | $2,110,200 | |
| Shares reacquired | | | | | | | | | | | | | | | | |
Initial Class | | | (2,509,827 | ) | | | $(36,604,759 | ) | | | (5,956,629 | ) | | | $(75,655,121 | ) |
Service Class | | | (445,035 | ) | | | (6,438,263 | ) | | | (988,916 | ) | | | (12,504,119 | ) |
| | | (2,954,862 | ) | | | $(43,043,022 | ) | | | (6,945,545 | ) | | | $(88,159,240 | ) |
| Net change | | | | | | | | | | | | | | | | |
Initial Class | | | (2,404,034 | ) | | | $(35,083,459 | ) | | | (5,702,716 | ) | | | $(72,413,807 | ) |
Service Class | | | (411,251 | ) | | | (5,955,208 | ) | | | (907,351 | ) | | | (11,466,186 | ) |
| | | (2,815,285 | ) | | | $(41,038,667 | ) | | | (6,610,067 | ) | | | $(83,879,993 | ) |
The fund and certain other funds managed by MFS participate in a $1.1 billion unsecured committed line of credit, subject to a $1 billion sublimit, provided by a syndication of banks under a credit agreement. Borrowings may be made for temporary financing needs. Interest is charged to each fund, based on its borrowings, generally at a rate equal to the higher of the Federal Reserve funds rate or one month LIBOR plus an agreed upon spread. A commitment fee, based on the average daily, unused portion of the committed line of credit, is allocated among the participating funds at the end of each calendar quarter. In addition, the fund and other funds managed by MFS have established unsecured uncommitted borrowing arrangements with certain banks for temporary financing needs. Interest is charged to each fund, based on its borrowings, at a rate equal to the Federal Reserve funds rate plus an agreed upon spread. For the six months ended June 30, 2013, the fund’s commitment fee and interest expense were $1,413 and $0, respectively, and are included in “Miscellaneous” expense in the Statement of Operations.
15
MFS Massachusetts Investors Growth Stock Portfolio
Notes to Financial Statements (unaudited) – continued
| (7) | | Transactions in Underlying Affiliated Funds – Affiliated Issuers |
An affiliated issuer may be considered one in which the fund owns 5% or more of the outstanding voting securities, or a company which is under common control. For the purposes of this report, the fund assumes the following to be an affiliated issuer:
| | | | | | | | | | | | | | | | |
| Underlying Affiliated Fund | | Beginning
Shares/Par
Amount | | | Acquisitions
Shares/Par
Amount | | | Dispositions
Shares/Par
Amount | | | Ending
Shares/Par
Amount | |
| MFS Institutional Money Market Portfolio | | | 4,898,676 | | | | 50,008,119 | | | | (52,923,350 | ) | | | 1,983,445 | |
| | | | |
| Underlying Affiliated Fund | | Realized
Gain (Loss) | | | Capital Gain
Distributions | | | Dividend
Income | | | Ending
Value | |
| MFS Institutional Money Market Portfolio | | | $— | | | | $— | | | | $3,080 | | | | $1,983,445 | |
16
MFS Massachusetts Investors Growth Stock Portfolio
BOARD REVIEW OF INVESTMENT ADVISORY AGREEMENT
A discussion regarding the Board’s most recent review and renewal of the fund’s Investment Advisory Agreement with MFS will be available on or about November 1, 2013 by clicking on the fund’s name under ”Variable Insurance Portfolios — VIT II“ in the “Products” section of the MFS Web site (mfs.com).
PROXY VOTING POLICIES AND INFORMATION
A general description of the MFS funds’ proxy voting policies and procedures is available without charge, upon request, by calling 1-800-225-2606, by visiting the Proxy Voting section of mfs.com or by visiting the SEC’s Web site at http://www.sec.gov.
Information regarding how the fund voted proxies relating to portfolio securities during the most recent twelve-month period ended June 30 is available without charge by visiting the Proxy Voting section of mfs.com or by visiting the SEC’s Web site at http://www.sec.gov.
QUARTERLY PORTFOLIO DISCLOSURE
The fund will file a complete schedule of portfolio holdings with the Securities and Exchange Commission (the Commission) for the first and third quarters of each fiscal year on Form N-Q. The fund’s Form N-Q is available on the EDGAR database on the Commission’s Internet Web site at http://www.sec.gov, and may be reviewed and copied at the:
Public Reference Room
Securities and Exchange Commission
100 F Street, NE, Room 1580
Washington, D.C. 20549
Information on the operation of the Public Reference Room may be obtained by calling the Commission at 1-800-SEC-0330. Copies of the fund’s Form N-Q also may be obtained, upon payment of a duplicating fee, by electronic request at the following e-mail address: publicinfo@sec.gov or by writing the Public Reference Section at the above address.
FURTHER INFORMATION
From time to time, MFS may post important information about the fund or the MFS funds on the MFS web site (mfs.com). This information is available by visiting the ”News & Commentary“ section of mfs.com or by clicking on the fund’s name under ”Variable Insurance Portfolios — VIT II“ in the ”Products“ section of mfs.com.
17
SEMIANNUAL REPORT
June 30, 2013

MFS® BLENDED RESEARCH® CORE EQUITY PORTFOLIO
MFS® Variable Insurance Trust II

CGS-SEM
MFS® BLENDED RESEARCH® CORE EQUITY PORTFOLIO
CONTENTS
The report is prepared for the general information of contract owners. It is authorized for distribution to prospective investors only when preceded or accompanied by a current prospectus.
NOT FDIC INSURED Ÿ MAY LOSE VALUE Ÿ NO BANK OR CREDIT UNION GUARANTEE Ÿ NOT A DEPOSIT Ÿ NOT INSURED BY ANY FEDERAL GOVERNMENT AGENCY OR NCUA/NCUSIF
MFS Blended Research Core Equity Portfolio
LETTER FROM THE CHAIRMAN AND CEO

Dear Contract Owners:
As the year progresses, the global economy continues to grind ahead slowly, held back by broad austerity measures. The U.S. economy remains a steadying force, driven by resilient consumers, who have taken the payroll tax increase and the sequestration’s early impact in stride. With U.S. housing and jobs showing steady expansion, domestic consumer-driven growth has offset weaker exports and the U.S. government’s spending constraints. In response to these developments, the U.S. Federal Reserve has begun to brace investors for an eventual shift in its monetary policy, causing global market tremors.
Japan has been another bright spot, with government and central bank stimulus policies leading to increased exports, a resurgent stock market and improved economic sentiment. After a six-month rally, Japan’s stocks slipped late in the second quarter, then picked up momentum on fresh signs that the country could soon break free of its chronic deflation. The major deterrent to global growth remains the eurozone, still in the grip of persistent recession. China has seen its pace of economic growth decelerate, a troubling turn for the country’s trading partners, who have come to rely on it as an engine for global growth.
As always, managing risk in the face of uncertainty remains a top priority for investors. At MFS®, our uniquely collaborative investment process employs integrated, global research and active risk management. Our global team of investment professionals shares ideas and evaluates opportunities across continents, investment disciplines and asset classes — all with a goal of building better insights, and ultimately better results, for our clients.
We are mindful of the many economic challenges investors face, and believe it is more important than ever to maintain a long-term view and employ time-tested principles, such as asset allocation and diversification. We remain confident that our unique approach can serve investors well as they work with their financial advisors to identify and pursue the most suitable opportunities.
Respectfully,

Robert J. Manning
Chairman and Chief Executive Officer
MFS Investment Management®
August 16, 2013
The opinions expressed in this letter are subject to change, may not be relied upon for investment advice, and no forecasts can be guaranteed.
1
MFS Blended Research Core Equity Portfolio
PORTFOLIO COMPOSITION
Portfolio structure
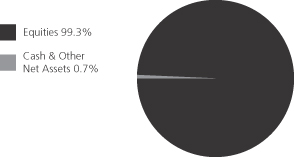
| | | | |
| Top ten holdings | | | | |
| Exxon Mobil Corp. | | | 4.1% | |
| Chevron Corp. | | | 2.7% | |
| JPMorgan Chase & Co. | | | 2.6% | |
| Pfizer, Inc. | | | 2.3% | |
| Google, Inc., “A” | | | 2.2% | |
| Apple, Inc. | | | 2.0% | |
| Citigroup, Inc. | | | 2.0% | |
| Johnson & Johnson | | | 1.8% | |
| CVS Caremark Corp. | | | 1.8% | |
| Verizon Communications, Inc. | | | 1.7% | |
| | | | |
| Equity sectors | | | | |
| Financial Services | | | 16.2% | |
| Technology | | | 15.8% | |
| Health Care | | | 13.0% | |
| Energy | | | 10.3% | |
| Consumer Staples | | | 9.0% | |
| Utilities & Communications | | | 7.3% | |
| Retailing | | | 6.3% | |
| Leisure | | | 5.7% | |
| Industrial Goods & Services | | | 5.6% | |
| Basic Materials | | | 3.2% | |
| Autos & Housing | | | 2.5% | |
| Special Products & Services | | | 2.5% | |
| Transportation | | | 1.9% | |
Percentages are based on net assets as of 6/30/13.
The portfolio is actively managed and current holdings may be different.
2
MFS Blended Research Core Equity Portfolio
EXPENSE TABLE
Fund Expenses Borne by the Contract Holders During the Period,
January 1, 2013 through June 30, 2013
As a contract holder of the fund, you incur ongoing costs, including management fees; distribution and/or service (12b-1) fees; and other fund expenses. This example is intended to help you understand your ongoing costs (in dollars) of investing in the fund and to compare these costs with the ongoing costs of investing in other mutual funds.
The example is based on an investment of $1,000 invested at the beginning of the period and held for the entire period January 1, 2013 through June 30, 2013.
Actual Expenses
The first line for each share class in the following table provides information about actual account values and actual expenses. You may use the information in this line, together with the amount you invested, to estimate the expenses that you paid over the period. Simply divide your account value by $1,000 (for example, an $8,600 account value divided by $1,000 = 8.6), then multiply the result by the number in the first line under the heading entitled “Expenses Paid During Period” to estimate the expenses you paid on your account during this period.
Hypothetical Example for Comparison Purposes
The second line for each share class in the following table provides information about hypothetical account values and hypothetical expenses based on the fund’s actual expense ratio and an assumed rate of return of 5% per year before expenses, which is not the fund’s actual return. The hypothetical account values and expenses may not be used to estimate the actual ending account balance or expenses you paid for the period. You may use this information to compare the ongoing costs of investing in the fund and other funds. To do so, compare this 5% hypothetical example with the 5% hypothetical examples that appear in the shareholder reports of the other funds.
Please note that the expenses shown in the table are meant to highlight the fund’s ongoing costs only and do not take into account the fees and expenses imposed under the variable contracts through which your investment in the fund is made. Therefore, the second line for each share class in the table is useful in comparing ongoing costs associated with an investment in vehicles (such as the fund) which fund benefits under variable annuity and variable life insurance contracts and to qualified pension and retirement plans only, and will not help you determine the relative total costs of investing in the fund through variable annuity and variable life insurance contracts. If the fees and expenses imposed under the variable contracts were included, your costs would have been higher.
| | | | | | | | | | | | | | | | | | |
| Share Class | | | | Annualized
Expense Ratio | | | Beginning
Account Value
1/01/13 | | | Ending
Account Value
6/30/13 | | | Expenses Paid
During Period (p)
1/01/13-6/30/13 | |
| Initial Class | | Actual | | | 0.55% | | | | $1,000.00 | | | | $1,137.76 | | | | $2.92 | |
| | Hypothetical (h) | | | 0.55% | | | | $1,000.00 | | | | $1,022.07 | | | | $2.76 | |
| Service Class | | Actual | | | 0.80% | | | | $1,000.00 | | | | $1,136.38 | | | | $4.24 | |
| | Hypothetical (h) | | | 0.80% | | | | $1,000.00 | | | | $1,020.83 | | | | $4.01 | |
| (h) | 5% class return per year before expenses. |
| (p) | Expenses paid are equal to each class’s annualized expense ratio, as shown above, multiplied by the average account value over the period, multiplied by the number of days in the period, divided by the number of days in the year. |
Changes to the fund’s fee arrangements occurred during the six month period. Had these fee changes been in effect throughout the entire six month period, the annualized expense ratios would have been 0.45% for the Initial Class shares and 0.70% for the Service Class shares; the actual expenses paid during the period would have been approximately $2.39 for the Initial Class shares and $3.71 for the Service Class shares; and the hypothetical expenses paid during the period would have been approximately $2.26 for the Initial Class shares and $3.51 for the Service Class shares. For further information about the fund’s fee arrangements and changes to those fee arrangements, please see Note 3 in the Notes to Financial Statements.
3
MFS Blended Research Core Equity Portfolio
PORTFOLIO OF INVESTMENTS – 6/30/13 (unaudited)
The Portfolio of Investments is a complete list of all securities owned by your fund. It is categorized by broad-based asset classes.
| | | | | | | | |
| Issuer | | Shares/Par | | | Value ($) | |
| | | | | | | | |
| COMMON STOCKS – 99.3% | |
| Aerospace – 3.4% | |
| Lockheed Martin Corp. | | | 57,560 | | | $ | 6,242,953 | |
| Precision Castparts Corp. | | | 15,228 | | | | 3,441,680 | |
| United Technologies Corp. | | | 62,770 | | | | 5,833,844 | |
| | | | | | | | |
| | | | | | $ | 15,518,477 | |
| | | | | | | | |
| Automotive – 2.1% | |
| Delphi Automotive PLC | | | 101,980 | | | $ | 5,169,366 | |
| Johnson Controls, Inc. | | | 128,950 | | | | 4,615,121 | |
| | | | | | | | |
| | | | | | $ | 9,784,487 | |
| | | | | | | | |
| Biotechnology – 2.7% | |
| Amgen, Inc. | | | 52,333 | | | $ | 5,163,174 | |
| Gilead Sciences, Inc. (a) | | | 138,760 | | | | 7,105,900 | |
| | | | | | | | |
| | | | | | $ | 12,269,074 | |
| | | | | | | | |
| Broadcasting – 1.3% | |
| Viacom, Inc., “B” | | | 87,090 | | | $ | 5,926,475 | |
| | | | | | | | |
| Business Services – 2.5% | |
| Accenture PLC, “A” | | | 79,740 | | | $ | 5,738,090 | |
| CoreLogic, Inc. (a) | | | 129,620 | | | | 3,003,295 | |
| FleetCor Technologies, Inc. (a) | | | 31,850 | | | | 2,589,405 | |
| | | | | | | | |
| | | | | | $ | 11,330,790 | |
| | | | | | | | |
| Cable TV – 2.9% | |
| Comcast Corp., “A” | | | 141,570 | | | $ | 5,928,952 | |
| Time Warner Cable, Inc. | | | 65,260 | | | | 7,340,445 | |
| | | | | | | | |
| | | | | | $ | 13,269,397 | |
| | | | | | | | |
| Chemicals – 2.3% | |
| CF Industries Holdings, Inc. | | | 24,521 | | | $ | 4,205,352 | |
| LyondellBasell Industries N.V., “A” | | | 20,260 | | | | 1,342,428 | |
| PPG Industries, Inc. | | | 35,441 | | | | 5,188,917 | |
| | | | | | | | |
| | | | | | $ | 10,736,697 | |
| | | | | | | | |
| Computer Software – 4.4% | |
| Microsoft Corp. | | | 107,840 | | | $ | 3,723,715 | |
| Oracle Corp. | | | 236,000 | | | | 7,249,920 | |
| SolarWinds, Inc. (a) | | | 103,650 | | | | 4,022,657 | |
| Symantec Corp. | | | 233,280 | | | | 5,241,802 | |
| | | | | | | | |
| | | | | | $ | 20,238,094 | |
| | | | | | | | |
| Computer Software – Systems – 5.1% | |
| Apple, Inc. | | | 23,394 | | | $ | 9,265,896 | |
| Hewlett-Packard Co. | | | 284,380 | | | | 7,052,624 | |
| International Business Machines Corp. | | | 13,311 | | | | 2,543,865 | |
| Western Digital Corp. | | | 74,830 | | | | 4,646,195 | |
| | | | | | | | |
| | | | | | $ | 23,508,580 | |
| | | | | | | | |
| Construction – 0.4% | |
| Pulte Homes, Inc. (a) | | | 92,990 | | | $ | 1,764,020 | |
| | | | | | | | |
| Consumer Products – 3.0% | |
| Nu Skin Enterprises, Inc., “A” | | | 96,670 | | | $ | 5,908,470 | |
| | | | | | | | |
| Issuer | | Shares/Par | | | Value ($) | |
| | | | | | | | |
| COMMON STOCKS – continued | |
| Consumer Products – continued | |
| Procter & Gamble Co. | | | 100,350 | | | $ | 7,725,947 | |
| | | | | | | | |
| | | | | | $ | 13,634,417 | |
| | | | | | | | |
| Electrical Equipment – 0.7% | |
| General Electric Co. | | | 136,540 | | | $ | 3,166,363 | |
| | | | | | | | |
| Electronics – 1.5% | |
| Intel Corp. | | | 283,160 | | | $ | 6,858,135 | |
| | | | | | | | |
| Energy – Independent – 2.3% | |
| EOG Resources, Inc. | | | 41,928 | | | $ | 5,521,079 | |
| Marathon Petroleum Corp. | | | 70,920 | | | | 5,039,575 | |
| | | | | | | | |
| | | | | | $ | 10,560,654 | |
| | | | | | | | |
| Energy – Integrated – 6.8% | |
| Chevron Corp. | | | 104,819 | | | $ | 12,404,280 | |
| Exxon Mobil Corp. | | | 210,670 | | | | 19,034,035 | |
| | | | | | | | |
| | | | | | $ | 31,438,315 | |
| | | | | | | | |
| Food & Beverages – 3.7% | |
| Coca-Cola Co. | | | 14,410 | | | $ | 577,985 | |
| Coca-Cola Enterprises, Inc. | | | 150,820 | | | | 5,302,831 | |
| General Mills, Inc. | | | 119,550 | | | | 5,801,762 | |
| Tyson Foods, Inc., “A” | | | 213,060 | | | | 5,471,381 | |
| | | | | | | | |
| | | | | | $ | 17,153,959 | |
| | | | | | | | |
| Food & Drug Stores – 4.2% | |
| CVS Caremark Corp. | | | 142,250 | | | $ | 8,133,855 | |
| Kroger Co. | | | 167,480 | | | | 5,784,759 | |
| Walgreen Co. | | | 127,800 | | | | 5,648,760 | |
| | | | | | | | |
| | | | | | $ | 19,567,374 | |
| | | | | | | | |
| General Merchandise – 2.0% | |
| Dillard’s, Inc. | | | 28,880 | | | $ | 2,367,294 | |
| Macy’s, Inc. | | | 116,840 | | | | 5,608,320 | |
| Target Corp. | | | 20,850 | | | | 1,435,731 | |
| | | | | | | | |
| | | | | | $ | 9,411,345 | |
| | | | | | | | |
| Health Maintenance Organizations – 1.3% | |
| WellPoint, Inc. | | | 72,220 | | | $ | 5,910,485 | |
| | | | | | | | |
| Insurance – 5.6% | |
| American International Group, Inc. (a) | | | 38,060 | | | $ | 1,701,282 | |
| Berkshire Hathaway, Inc., “B” (a) | | | 6,092 | | | | 681,817 | |
| Everest Re Group Ltd. | | | 36,530 | | | | 4,685,338 | |
| MetLife, Inc. | | | 149,570 | | | | 6,844,323 | |
| Prudential Financial, Inc. | | | 97,770 | | | | 7,140,143 | |
| Validus Holdings Ltd. | | | 127,290 | | | | 4,597,715 | |
| | | | | | | | |
| | | | | | $ | 25,650,618 | |
| | | | | | | | |
| Internet – 3.8% | |
| AOL, Inc. | | | 52,720 | | | $ | 1,923,226 | |
| Google, Inc., “A” (a) | | | 11,763 | | | | 10,355,792 | |
| Yahoo!, Inc. (a) | | | 216,850 | | | | 5,445,104 | |
| | | | | | | | |
| | | | | | $ | 17,724,122 | |
| | | | | | | | |
4
MFS Blended Research Core Equity Portfolio
Portfolio of Investments (unaudited) – continued
| | | | | | | | |
| Issuer | | Shares/Par | | | Value ($) | |
| | | | | | | | |
| COMMON STOCKS – continued | |
| Machinery & Tools – 1.5% | |
| Cummins, Inc. | | | 47,605 | | | $ | 5,163,238 | |
| Kennametal, Inc. | | | 49,510 | | | | 1,922,473 | |
| | | | | | | | |
| | | | | | $ | 7,085,711 | |
| | | | | | | | |
| Major Banks – 6.6% | |
| Goldman Sachs Group, Inc. | | | 47,712 | | | $ | 7,216,440 | |
| JPMorgan Chase & Co. | | | 229,290 | | | | 12,104,219 | |
| PNC Financial Services Group, Inc. | | | 83,750 | | | | 6,107,050 | |
| Wells Fargo & Co. | | | 115,830 | | | | 4,780,304 | |
| | | | | | | | |
| | | | | | $ | 30,208,013 | |
| | | | | | | | |
| Medical Equipment – 2.9% | |
| Abbott Laboratories | | | 123,290 | | | $ | 4,300,355 | |
| Medtronic, Inc. | | | 54,830 | | | | 2,822,100 | |
| Thermo Fisher Scientific, Inc. | | | 75,140 | | | | 6,359,098 | |
| | | | | | | | |
| | | | | | $ | 13,481,553 | |
| | | | | | | | |
| Network & Telecom – 1.0% | |
| Qualcomm, Inc. | | | 74,730 | | | $ | 4,564,508 | |
| | | | | | | | |
| Oil Services – 1.2% | |
| Ensco PLC, “A” | | | 51,310 | | | $ | 2,982,137 | |
| Halliburton Co. | | | 12,330 | | | | 514,408 | |
| Superior Energy Services, Inc. (a) | | | 82,530 | | | | 2,140,828 | |
| | | | | | | | |
| | | | | | $ | 5,637,373 | |
| | | | | | | | |
| Other Banks & Diversified Financials – 3.7% | |
| Citigroup, Inc. | | | 191,243 | | | $ | 9,173,927 | |
| Discover Financial Services | | | 143,570 | | | | 6,839,675 | |
| Visa, Inc., “A” | | | 6,289 | | | | 1,149,315 | |
| | | | | | | | |
| | | | | | $ | 17,162,917 | |
| | | | | | | | |
| Pharmaceuticals – 6.1% | |
| AbbVie, Inc. | | | 102,130 | | | $ | 4,222,054 | |
| Johnson & Johnson | | | 94,790 | | | | 8,138,669 | |
| Merck & Co., Inc. | | | 113,890 | | | | 5,290,191 | |
| Pfizer, Inc. | | | 377,810 | | | | 10,582,458 | |
| | | | | | | | |
| | | | | | $ | 28,233,372 | |
| | | | | | | | |
| Railroad & Shipping – 0.7% | |
| Union Pacific Corp. | | | 19,737 | | | $ | 3,045,024 | |
| | | | | | | | |
| Real Estate – 0.3% | |
| Public Storage, Inc., REIT | | | 9,120 | | | $ | 1,398,370 | |
| | | | | | | | |
| Restaurants – 1.5% | |
| McDonald’s Corp. | | | 69,102 | | | $ | 6,841,098 | |
| | | | | | | | |
| Specialty Chemicals – 0.9% | |
| Airgas, Inc. | | | 42,700 | | | $ | 4,076,142 | |
| | | | | | | | |
| Specialty Stores – 0.1% | |
| Abercrombie & Fitch Co., “A” | | | 11,590 | | | $ | 524,448 | |
| | | | | | | | |
| Telecommunications – Wireless – 1.2% | |
| American Tower Corp., REIT | | | 74,210 | | | $ | 5,429,946 | |
| | | | | | | | |
| Telephone Services – 3.3% | |
| AT&T, Inc. | | | 88,750 | | | $ | 3,141,750 | |
| CenturyLink, Inc. | | | 114,350 | | | | 4,042,273 | |
| | | | | | | | |
| Issuer | | Shares/Par | | | Value ($) | |
| | | | | | | | |
| COMMON STOCKS – continued | |
| Telephone Services – continued | |
| Verizon Communications, Inc. | | | 156,790 | | | $ | 7,892,809 | |
| | | | | | | | |
| | | | | | $ | 15,076,832 | |
| | | | | | | | |
| Tobacco – 2.3% | |
| Lorillard, Inc. | | | 124,310 | | | $ | 5,429,861 | |
| Philip Morris International, Inc. | | | 61,590 | | | | 5,334,926 | |
| | | | | | | | |
| | | | | | $ | 10,764,787 | |
| | | | | | | | |
| Trucking – 1.2% | |
| United Parcel Service, Inc., “B” | | | 62,280 | | | $ | 5,385,974 | |
| | | | | | | | |
| Utilities – Electric Power – 2.8% | |
| AES Corp. | | | 408,260 | | | $ | 4,895,037 | |
| American Electric Power Co., Inc. | | | 113,580 | | | | 5,086,112 | |
| NRG Energy, Inc. | | | 116,240 | | | | 3,103,608 | |
| | | | | | | | |
| | | | | | $ | 13,084,757 | |
| | | | | | | | |
Total Common Stocks
(Identified Cost, $379,077,894) | | | $ | 457,422,703 | |
| | | | | | | | |
| |
| MONEY MARKET FUNDS – 0.3% | | | | | |
| MFS Institutional Money Market Portfolio, 0.11%, at Cost and Net Asset Value (v) | | | 1,448,037 | | | $ | 1,448,037 | |
| | | | | | | | |
Total Investments
(Identified Cost, $380,525,931) | | | $ | 458,870,740 | |
| | | | | | | | |
OTHER ASSETS, LESS
LIABILITIES – 0.4% | | | | | | | 1,893,762 | |
| | | | | | | | |
| Net Assets – 100.0% | | | | | | $ | 460,764,502 | |
| | | | | | | | |
| (a) | | Non-income producing security. |
| (v) | | Underlying affiliated fund that is available only to investment companies managed by MFS. The rate quoted for the MFS Institutional Money Market Portfolio is the annualized seven-day yield of the fund at period end. |
The following abbreviations are used in this report and are defined:
| PLC | | Public Limited Company |
| REIT | | Real Estate Investment Trust |
See Notes to Financial Statements
5
MFS Blended Research Core Equity Portfolio
FINANCIAL STATEMENTS | STATEMENT OF ASSETS AND LIABILITIES (unaudited)
This statement represents your fund’s balance sheet, which details the assets and liabilities comprising the total value of the fund.
| | | | | | | | |
At 6/30/13 | | | | | | | | |
Assets | | | | | | | | |
Investments – | | | | | | | | |
Non-affiliated issuers, at value (identified cost, $379,077,894) | | | $457,422,703 | | | | | |
Underlying affiliated funds, at cost and value | | | 1,448,037 | | | | | |
Total investments, at value (identified cost, $380,525,931) | | | $458,870,740 | | | | | |
Receivables for | | | | | | | | |
Investments sold | | | 2,188,807 | | | | | |
Dividends | | | 327,450 | | | | | |
Other assets | | | 2,477 | | | | | |
Total assets | | | | | | | $461,389,474 | |
Liabilities | | | | | | | | |
Payable for fund shares reacquired | | | $510,156 | | | | | |
Payable to affiliates | | | | | | | | |
Investment adviser | | | 20,777 | | | | | |
Shareholder servicing costs | | | 111 | | | | | |
Distribution and/or service fees | | | 3,597 | | | | | |
Payable for independent Trustees’ compensation | | | 1,665 | | | | | |
Accrued expenses and other liabilities | | | 88,666 | | | | | |
Total liabilities | | | | | | | $624,972 | |
Net assets | | | | | | | $460,764,502 | |
Net assets consist of | | | | | | | | |
Paid-in capital | | | $434,758,839 | | | | | |
Unrealized appreciation (depreciation) on investments | | | 78,344,809 | | | | | |
Accumulated net realized gain (loss) on investments | | | (65,373,089 | ) | | | | |
Undistributed net investment income | | | 13,033,943 | | | | | |
Net assets | | | | | | | $460,764,502 | |
Shares of beneficial interest outstanding | | | | | | | 11,225,309 | |
| | | | | | | | | | | | |
| | | Net assets | | | Shares
outstanding | | | Net asset value
per share | |
Initial Class | | | $329,845,300 | | | | 8,018,774 | | | | $41.13 | |
Service Class | | | 130,919,202 | | | | 3,206,535 | | | | 40.83 | |
See Notes to Financial Statements
6
MFS Blended Research Core Equity Portfolio
FINANCIAL STATEMENTS | STATEMENT OF OPERATIONS (unaudited)
This statement describes how much your fund earned in investment income and accrued in expenses. It also describes any gains and/or losses generated by fund operations.
| | | | | | | | |
Six months ended 6/30/13 | | | | | | | | |
Net investment income | | | | | | | | |
Income | | | | | | | | |
Dividends | | | $5,243,329 | | | | | |
Dividends from underlying affiliated funds | | | 1,383 | | | | | |
Total investment income | | | | | | | $5,244,712 | |
Expenses | | | | | | | | |
Management fee | | | $1,277,120 | | | | | |
Distribution and/or service fees | | | 170,687 | | | | | |
Shareholder servicing costs | | | 10,138 | | | | | |
Administrative services fee | | | 34,496 | | | | | |
Independent Trustees’ compensation | | | 5,244 | | | | | |
Custodian fee | | | 23,963 | | | | | |
Shareholder communications | | | 15,493 | | | | | |
Audit and tax fees | | | 24,253 | | | | | |
Legal fees | | | 3,826 | | | | | |
Miscellaneous | | | 10,448 | | | | | |
Total expenses | | | | | | | $1,575,668 | |
Fees paid indirectly | | | (1 | ) | | | | |
Reduction of expenses by investment adviser | | | (129,282 | ) | | | | |
Net expenses | | | | | | | $1,446,385 | |
Net investment income | | | | | | | $3,798,327 | |
Realized and unrealized gain (loss) on investments | | | | | | | | |
Realized gain (loss) on investments (identified cost basis) | | | | | | | $26,205,532 | |
Change in unrealized appreciation (depreciation) on investments | | | | | | | $29,845,903 | |
Net realized and unrealized gain (loss) on investments | | | | | | | $56,051,435 | |
Change in net assets from operations | | | | | | | $59,849,762 | |
See Notes to Financial Statements
7
MFS Blended Research Core Equity Portfolio
FINANCIAL STATEMENTS | STATEMENTS OF CHANGES IN NET ASSETS
These statements describe the increases and/or decreases in net assets resulting from operations, any distributions, and any shareholder transactions.
| | | | | | | | |
| |
| Six months ended
6/30/13
(unaudited |
) | |
| Year ended
12/31/12 |
|
Change in net assets | | | | | | | | |
| From operations | | | | | | | | |
Net investment income | | | $3,798,327 | | | | $9,242,680 | |
Net realized gain (loss) on investments | | | 26,205,532 | | | | 26,292,756 | |
Net unrealized gain (loss) on investments | | | 29,845,903 | | | | 31,981,039 | |
Change in net assets from operations | | | $59,849,762 | | | | $67,516,475 | |
| Distributions declared to shareholders | | | | | | | | |
From net investment income | | | $— | | | | $(7,350,033 | ) |
Change in net assets from fund share transactions | | | $(44,729,713 | ) | | | $(77,518,816 | ) |
Total change in net assets | | | $15,120,049 | | | | $(17,352,374 | ) |
| Net assets | | | | | | | | |
At beginning of period | | | 445,644,453 | | | | 462,996,827 | |
At end of period (including undistributed net investment income of $13,033,943 and
$9,235,616, respectively) | | | $460,764,502 | | | | $445,644,453 | |
See Notes to Financial Statements
8
MFS Blended Research Core Equity Portfolio
FINANCIAL STATEMENTS | FINANCIAL HIGHLIGHTS
The financial highlights table is intended to help you understand the fund’s financial performance for the semiannual period and the past 5 fiscal years. Certain information reflects financial results for a single fund share. The total returns in the table represent the rate by which an investor would have earned (or lost) on an investment in the fund share class (assuming reinvestment of all distributions) held for the entire period.
| | | | | | | | | | | | | | | | | | | | | | | | |
| Initial Class | | Six months
ended
6/30/13 | | | Years ended 12/31 | |
| | | | 2012 | | | 2011 | | | 2010 | | | 2009 | | | 2008 | |
| | | (unaudited) | | | | | | | | | | | | | | | | |
Net asset value, beginning of period | | | $36.15 | | | | $31.86 | | | | $31.89 | | | | $27.84 | | | | $22.80 | | | | $35.51 | |
| Income (loss) from investment operations | | | | | | | | | | | | | | | | | | | | | | | | |
Net investment income (d) | | | $0.34 | | | | $0.72 | | | | $0.49 | | | | $0.51 | | | | $0.43 | | | | $0.48 | |
Net realized and unrealized gain (loss) on investments
and foreign currency | | | 4.64 | | | | 4.17 | | | | 0.10 | | | | 4.05 | | | | 5.16 | | | | (12.74 | ) |
Total from investment operations | | | $4.98 | | | | $4.89 | | | | $0.59 | | | | $4.56 | | | | $5.59 | | | | $(12.26 | ) |
| Less distributions declared to shareholders | | | | | | | | | | | | | | | | | | | | | | | | |
From net investment income | | | $— | | | | $(0.60 | ) | | | $(0.62 | ) | | | $(0.51 | ) | | | $(0.55 | ) | | | $(0.45 | ) |
Net asset value, end of period (x) | | | $41.13 | | | | $36.15 | | | | $31.86 | | | | $31.89 | | | | $27.84 | | | | $22.80 | |
Total return (%) (k)(r)(s)(x) | | | 13.78 | (n) | | | 15.37 | | | | 1.97 | | | | 16.46 | | | | 25.26 | | | | (34.95 | ) |
Ratios (%) (to average net assets) and Supplemental data: | | | | | | | | | | | | | | | | | | | | | | | | |
Expenses before expense reductions (f) | | | 0.60 | (a) | | | 0.61 | | | | 0.64 | | | | 0.65 | | | | 0.66 | | | | 0.64 | |
Expenses after expense reductions (f) | | | 0.55 | (a) | | | 0.60 | | | | 0.60 | | | | 0.60 | | | | 0.60 | | | | 0.60 | |
Net investment income | | | 1.71 | (a) | | | 2.06 | | | | 1.52 | | | | 1.77 | | | | 1.81 | | | | 1.60 | |
Portfolio turnover | | | 25 | (n) | | | 54 | | | | 77 | | | | 68 | | | | 74 | | | | 76 | |
Net assets at end of period (000 omitted) | | | $329,845 | | | | $311,265 | | | | $315,115 | | | | $360,667 | | | | $361,105 | | | | $342,241 | |
| | |
| Service Class | | Six months
ended
6/30/13 | | | Years ended 12/31 | |
| | | | 2012 | | | 2011 | | | 2010 | | | 2009 | | | 2008 | |
| | | (unaudited) | | | | | | | | | | | | | | | | |
Net asset value, beginning of period | | | $35.93 | | | | $31.65 | | | | $31.66 | | | | $27.66 | | | | $22.62 | | | | $35.23 | |
| Income (loss) from investment operations | | | | | | | | | | | | | | | | | | | | | | | | |
Net investment income (d) | | | $0.29 | | | | $0.62 | | | | $0.41 | | | | $0.44 | | | | $0.37 | | | | $0.41 | |
Net realized and unrealized gain (loss) on investments
and foreign currency | | | 4.61 | | | | 4.15 | | | | 0.11 | | | | 4.00 | | | | 5.14 | | | | (12.66 | ) |
Total from investment operations | | | $4.90 | | | | $4.77 | | | | $0.52 | | | | $4.44 | | | | $5.51 | | | | $(12.25 | ) |
| Less distributions declared to shareholders | | | | | | | | | | | | | | | | | | | | | | | | |
From net investment income | | | $— | | | | $(0.49 | ) | | | $(0.53 | ) | | | $(0.44 | ) | | | $(0.47 | ) | | | $(0.36 | ) |
Net asset value, end of period (x) | | | $40.83 | | | | $35.93 | | | | $31.65 | | | | $31.66 | | | | $27.66 | | | | $22.62 | |
Total return (%) (k)(r)(s)(x) | | | 13.64 | (n) | | | 15.10 | | | | 1.74 | | | | 16.12 | | | | 25.00 | | | | (35.12 | ) |
Ratios (%) (to average net assets) and Supplemental data: | | | | | | | | | | | | | | | | | | | | | | | | |
Expenses before expense reductions (f) | | | 0.85 | (a) | | | 0.86 | | | | 0.89 | | | | 0.90 | | | | 0.91 | | | | 0.90 | |
Expenses after expense reductions (f) | | | 0.80 | (a) | | | 0.85 | | | | 0.85 | | | | 0.85 | | | | 0.85 | | | | 0.85 | |
Net investment income | | | 1.46 | (a) | | | 1.80 | | | | 1.26 | | | | 1.52 | | | | 1.57 | | | | 1.35 | |
Portfolio turnover | | | 25 | (n) | | | 54 | | | | 77 | | | | 68 | | | | 74 | | | | 76 | |
Net assets at end of period (000 omitted) | | | $130,919 | | | | $134,379 | | | | $147,882 | | | | $184,799 | | | | $199,348 | | | | $193,658 | |
See Notes to Financial Statements
9
MFS Blended Research Core Equity Portfolio
Financial Highlights – continued
| (d) | Per share data is based on average shares outstanding. |
| (f) | Ratios do not reflect reductions from fees paid indirectly, if applicable. |
| (k) | The total return does not reflect expenses that apply to separate accounts. Inclusion of these charges would reduce the total return figures for all periods shown. |
| (r) | Certain expenses have been reduced without which performance would have been lower. |
| (s) | From time to time the fund may receive proceeds from litigation settlements, without which performance would be lower. |
| (x) | The net asset values per share and total returns have been calculated on net assets which include adjustments made in accordance with U.S. generally accepted accounting principles required at period end for financial reporting purposes. |
See Notes to Financial Statements
10
MFS Blended Research Core Equity Portfolio
NOTES TO FINANCIAL STATEMENTS (unaudited)
| (1) | | Business and Organization |
MFS Blended Research Core Equity Portfolio (the fund) is a series of MFS Variable Insurance Trust II (the trust). The trust is organized as a Massachusetts business trust and is registered under the Investment Company Act of 1940, as amended, as an open-end management investment company. The shareholders of each series of the trust are separate accounts of insurance companies, which offer variable annuity and/or life insurance products, and qualified retirement and pension plans.
| (2) | | Significant Accounting Policies |
General – The preparation of financial statements in conformity with U.S. generally accepted accounting principles requires management to make estimates and assumptions that affect the reported amounts of assets and liabilities, and disclosure of contingent assets and liabilities at the date of the financial statements and the reported amounts of revenues and expenses during the reporting period. Actual results could differ from those estimates. In the preparation of these financial statements, management has evaluated subsequent events occurring after the date of the fund’s Statement of Assets and Liabilities through the date that the financial statements were issued.
In this reporting period, the fund adopted the disclosure provisions of the Financial Accounting Standards Board (FASB) Accounting Standards Update 2011-11 (“ASU 2011-11”), Balance Sheet (Topic 210) – Disclosures about Offsetting Assets and Liabilities along with the related scope clarification provisions of FASB Accounting Standards Update 2013-01 (“ASU 2013-01”) entitled Balance Sheet (Topic 210) – Clarifying the Scope of Disclosures about Offsetting Assets and Liabilities. ASU 2011-11 is intended to enhance disclosures on the offsetting of financial assets and liabilities by requiring entities to disclose both gross and net information about financial instruments and transactions that are either offset in the statement of financial position or subject to a Master Netting Agreement or similar arrangement. ASU 2013-01 limits the scope of ASU 2011-11’s disclosure requirements on offsetting to financial assets and financial liabilities related to derivatives, repurchase and reverse repurchase agreements, and securities lending and securities borrowing transactions. The disclosures required by ASU 2011-11, to the extent applicable to the fund, have been included in the fund’s Significant Accounting Policies note under the captions for each of the fund’s in-scope financial instruments and transactions.
In June 2013, FASB issued Accounting Standards Update 2013-08 Financial Services – Investment Companies (Topic 946) – Amendments to the Scope, Measurement, and Disclosure Requirements (“ASU 2013-08”) which is effective for interim and annual reporting periods in fiscal years that begin after December 15, 2013. ASU 2013-08 sets forth a methodology for determining whether an entity should be characterized as an investment company and prescribes fair value accounting for an investment company’s non-controlling ownership interest in another investment company. FASB has determined that a fund registered under the Investment Company Act of 1940 automatically meets ASU 2013-08’s criteria for an investment company. Although still evaluating the potential impacts of ASU 2013-08 to the fund, management expects that the impact of the fund’s adoption will be limited to additional financial statement disclosures.
Investment Valuations – Equity securities, including restricted equity securities, are generally valued at the last sale or official closing price as provided by a third-party pricing service on the market or exchange on which they are primarily traded. Equity securities, for which there were no sales reported that day, are generally valued at the last quoted daily bid quotation as provided by a third-party pricing service on the market or exchange on which such securities are primarily traded. Short-term instruments with a maturity at issuance of 60 days or less generally are valued at amortized cost, which approximates market value. Open end investment companies are generally valued at net asset value per share. Securities and other assets generally valued on the basis of information from a third-party pricing service may also be valued at a broker/dealer bid quotation. Values obtained from third-party pricing services can utilize both transaction data and market information such as yield, quality, coupon rate, maturity, type of issue, trading characteristics, and other market data.
The Board of Trustees has delegated primary responsibility for determining or causing to be determined the value of the fund’s investments (including any fair valuation) to the adviser pursuant to valuation policies and procedures approved by the Board. If the adviser determines that reliable market quotations are not readily available, investments are valued at fair value as determined in good faith by the adviser in accordance with such procedures under the oversight of the Board of Trustees. Under the fund’s valuation policies and procedures, market quotations are not considered to be readily available for most types of debt instruments and floating rate loans and many types of derivatives. These investments are generally valued at fair value based on information from third-party pricing services. In addition, investments may be valued at fair value if the adviser determines that an investment’s value has been materially affected by events occurring after the close of the exchange or market on which the investment is principally traded (such as foreign exchange or market) and prior to the determination of the fund’s net asset value, or after the halting of trading of a specific security where trading does not resume prior to the close of the exchange or market on which the security is principally traded. Events that occur on a frequent basis after foreign markets close (such as developments in foreign markets and significant movements in the U.S. markets) and prior to the determination of the fund’s net asset value may be deemed to have a material effect on the value of securities traded in foreign markets. Accordingly, the fund’s foreign equity securities may often be valued at fair value. The adviser generally relies on third-party pricing services or other information (such as the correlation with price movements of similar securities in the same or other markets; the type, cost and investment characteristics of the security; the
11
MFS Blended Research Core Equity Portfolio
Notes to Financial Statements (unaudited) – continued
business and financial condition of the issuer; and trading and other market data) to assist in determining whether to fair value and at what value to fair value an investment. The value of an investment for purposes of calculating the fund’s net asset value can differ depending on the source and method used to determine value. When fair valuation is used, the value of an investment used to determine the fund’s net asset value may differ from quoted or published prices for the same investment. There can be no assurance that the fund could obtain the fair value assigned to an investment if it were to sell the investment at the same time at which the fund determines its net asset value per share.
Various inputs are used in determining the value of the fund’s assets or liabilities. These inputs are categorized into three broad levels. In certain cases, the inputs used to measure fair value may fall into different levels of the fair value hierarchy. In such cases, an investment’s level within the fair value hierarchy is based on the lowest level of input that is significant to the fair value measurement. The fund’s assessment of the significance of a particular input to the fair value measurement in its entirety requires judgment, and considers factors specific to the investment. Level 1 includes unadjusted quoted prices in active markets for identical assets or liabilities. Level 2 includes other significant observable market-based inputs (including quoted prices for similar securities, interest rates, prepayment speed, and credit risk). Level 3 includes unobservable inputs, which may include the adviser’s own assumptions in determining the fair value of investments. The following is a summary of the levels used as of June 30, 2013 in valuing the fund’s assets or liabilities:
| | | | | | | | | | | | | | | | |
| Investments at Value | | Level 1 | | | Level 2 | | | Level 3 | | | Total | |
| Equity Securities | | | $457,422,703 | | | | $— | | | | $— | | | | $457,422,703 | |
| Mutual Funds | | | 1,448,037 | | | | — | | | | — | | | | 1,448,037 | |
| Total Investments | | | $458,870,740 | | | | $— | | | | $— | | | | $458,870,740 | |
For further information regarding security characteristics, see the Portfolio of Investments.
Indemnifications – Under the fund’s organizational documents, its officers and Trustees may be indemnified against certain liabilities and expenses arising out of the performance of their duties to the fund. Additionally, in the normal course of business, the fund enters into agreements with service providers that may contain indemnification clauses. The fund’s maximum exposure under these agreements is unknown as this would involve future claims that may be made against the fund that have not yet occurred.
Investment Transactions and Income – Investment transactions are recorded on the trade date. Dividends received in cash are recorded on the ex-dividend date. Certain dividends from foreign securities will be recorded when the fund is informed of the dividend if such information is obtained subsequent to the ex-dividend date. Dividend payments received in additional securities are recorded on the ex-dividend date in an amount equal to the value of the security on such date.
The fund may receive proceeds from litigation settlements. Any proceeds received from litigation involving portfolio holdings are reflected in the Statement of Operations in realized gain/loss if the security has been disposed of by the fund or in unrealized gain/loss if the security is still held by the fund. Any other proceeds from litigation not related to portfolio holdings are reflected as other income in the Statement of Operations.
Fees Paid Indirectly – The fund’s custody fee may be reduced according to an arrangement that measures the value of cash deposited with the custodian by the fund. This amount, for the six months ended June 30, 2013, is shown as a reduction of total expenses in the Statement of Operations.
Tax Matters and Distributions – The fund intends to qualify as a regulated investment company, as defined under Subchapter M of the Internal Revenue Code, and to distribute all of its taxable income, including realized capital gains. As a result, no provision for federal income tax is required. The fund’s federal tax returns, when filed, will remain subject to examination by the Internal Revenue Service for a three year period.
Distributions to shareholders are recorded on the ex-dividend date. Income and capital gain distributions are determined in accordance with income tax regulations, which may differ from U.S. generally accepted accounting principles. Certain capital accounts in the financial statements are periodically adjusted for permanent differences in order to reflect their tax character. These adjustments have no impact on net assets or net asset value per share. Temporary differences which arise from recognizing certain items of income, expense, gain or loss in different periods for financial statement and tax purposes will reverse at some time in the future. Distributions in excess of net investment income or net realized gains are temporary overdistributions for financial statement purposes resulting from differences in the recognition or classification of income or distributions for financial statement and tax purposes.
Book/tax differences primarily relate to wash sale loss deferrals.
The tax character of distributions declared to shareholders for the last fiscal year is as follows:
| | | | |
| | | 12/31/12 | |
| Ordinary income (including any short-term capital gains) | | | $7,350,033 | |
12
MFS Blended Research Core Equity Portfolio
Notes to Financial Statements (unaudited) – continued
The federal tax cost and the tax basis components of distributable earnings were as follows:
| | | | |
| As of 6/30/13 | | | | |
| Cost of investments | | | $380,640,217 | |
| Gross appreciation | | | 82,670,032 | |
| Gross depreciation | | | (4,439,509 | ) |
| Net unrealized appreciation (depreciation) | | | $78,230,523 | |
| |
| As of 12/31/12 | | | | |
| Undistributed ordinary income | | | 9,235,616 | |
| Capital loss carryforwards | | | (91,464,335 | ) |
| Net unrealized appreciation (depreciation) | | | 48,384,620 | |
The aggregate cost above includes prior fiscal year end tax adjustments, if applicable.
Under the Regulated Investment Company Modernization Act of 2010 (the “Act”), net capital losses recognized for fund fiscal years beginning after December 31, 2010 may be carried forward indefinitely, and their character is retained as short-term and/or long-term losses (“post-enactment losses”). Previously, net capital losses were carried forward for eight years and treated as short-term losses (“pre-enactment losses”). As a transition rule, the Act requires that all post-enactment net capital losses be used before pre-enactment net capital losses.
As of December 31, 2012, the fund had capital loss carryforwards available to offset future realized gains. Such pre-enactment losses expire as follows:
| | | | |
| 12/31/16 | | | $(19,639,670 | ) |
| 12/31/17 | | | (71,824,665 | ) |
| Total | | | $(91,464,335 | ) |
Multiple Classes of Shares of Beneficial Interest – The fund offers multiple classes of shares, which differ in their respective distribution and/or service fees. The fund’s income, realized and unrealized gain (loss), and common expenses are allocated to shareholders based on the daily net assets of each class. Dividends are declared separately for each class. Differences in per share dividend rates are generally due to differences in separate class expenses. The fund’s distributions declared to shareholders as reported in the Statements of Changes in Net Assets are presented by class as follows:
| | | | | | | | |
| | | From net investment
income | |
| | | Six months ended
6/30/13 | | | Year ended
12/31/12 | |
| Initial Class | | | $— | | | | $5,385,734 | |
| Service Class | | | — | | | | 1,964,299 | |
| Total | | | $— | | | | $7,350,033 | |
| (3) | | Transactions with Affiliates |
Investment Adviser – The fund has an investment advisory agreement with MFS to provide overall investment management and related administrative services and facilities to the fund. The management fee is computed daily and paid monthly at an annual rate of 0.55% of the fund’s average daily net assets.
Effective May 1, 2013, the investment adviser has agreed in writing to reduce its management fee to 0.40% of average daily net assets. This written agreement will continue until modified by the fund’s Board of Trustees, but such agreement will continue at least until April 30, 2015. For the period May 1, 2013 through June 30, 2013, this management fee reduction amounted to $119,334, which is shown as a reduction of total expenses in the Statement of Operations. Effective April 1, 2013, MFS has agreed in writing to reduce its management fee by a specified amount if certain MFS mutual fund assets exceed thresholds agreed to by MFS and the fund’s Board of Trustees. For the period April 1, 2013 through June 30, 2013, this management fee reduction amounted to $637, which is shown as a reduction of total expenses in the Statement of Operations. The management fee incurred for the six months ended June 30, 2013 was equivalent to an annual effective rate of 0.50% of the fund’s average daily net assets.
The investment adviser had agreed in writing to pay a portion of the fund’s total annual operating expenses, exclusive of interest, taxes, extraordinary expenses, and brokerage and transaction costs, and investment related expenses, such that total annual operating expenses did not exceed 0.60% of average daily net assets for the Initial Class shares and 0.85% of average daily net assets for the Service Class shares. This written agreement expired April 30, 2013. For the period January 1, 2013 to April 30, 2013, this reduction amounted to $8,432 and is reflected as a reduction of total expenses in the Statements of Operations.
13
MFS Blended Research Core Equity Portfolio
Notes to Financial Statements (unaudited) – continued
Distributor – MFS Fund Distributors, Inc. (MFD), a wholly-owned subsidiary of MFS, is the distributor of shares of the fund. The Trustees have adopted a distribution plan for the Service Class shares pursuant to Rule 12b-1 under the Investment Company Act of 1940.
The fund’s distribution plan provides that the fund will pay MFD distribution and/or service fees equal to 0.25% per annum of its average daily net assets attributable to Service Class shares as partial consideration for services performed and expenses incurred by MFD and financial intermediaries (including participating insurance companies that invest in the fund to fund variable annuity and variable life insurance contracts, sponsors of qualified retirement and pension plans that invest in the fund, and affiliates of these participating insurance companies and plan sponsors) in connection with the sale and distribution of the Service Class shares. MFD may subsequently pay all, or a portion, of the distribution and/or service fees to financial intermediaries.
Shareholder Servicing Agent – MFS Service Center, Inc. (MFSC), a wholly-owned subsidiary of MFS, receives a fee from the fund for its services as shareholder servicing agent. For the six months ended June 30, 2013, the fee was $10,135, which equated to 0.0044% annually of the fund’s average daily net assets. MFSC also receives payment from the fund for out-of-pocket expenses paid by MFSC on behalf of the fund. For the six months ended June 30, 2013, these costs amounted to $3.
Administrator – MFS provides certain financial, legal, shareholder communications, compliance, and other administrative services to the fund. Under an administrative services agreement, the fund partially reimburses MFS the costs incurred to provide these services. The fund is charged an annual fixed amount of $17,500 plus a fee based on average daily net assets. The administrative services fee incurred for the six months ended June 30, 2013 was equivalent to an annual effective rate of 0.0148% of the fund’s average daily net assets.
Trustees’ and Officers’ Compensation – The fund pays compensation to independent Trustees in the form of a retainer, attendance fees, and additional compensation to Board and Committee chairpersons. The fund does not pay compensation directly to Trustees or officers of the fund who are also officers of the investment adviser, all of whom receive remuneration for their services to the fund from MFS. Certain officers and Trustees of the fund are officers or directors of MFS, MFD, and MFSC.
Other – This fund and certain other funds managed by MFS (the funds) have entered into services agreements (the Agreements) which provide for payment of fees by the funds to Tarantino LLC and Griffin Compliance LLC in return for the provision of services of an Independent Chief Compliance Officer (ICCO) and Assistant ICCO, respectively, for the funds. The ICCO and Assistant ICCO are officers of the funds and the sole members of Tarantino LLC and Griffin Compliance LLC, respectively. The funds can terminate the Agreements with Tarantino LLC and Griffin Compliance LLC at any time under the terms of the Agreements. For the six months ended June 30, 2013, the aggregate fees paid by the fund to Tarantino LLC and Griffin Compliance LLC were $1,772 and are included in “Miscellaneous” expense in the Statement of Operations. MFS has agreed to reimburse the fund for a portion of the payments made by the fund in the amount of $879, which is shown as a reduction of total expenses in the Statement of Operations. Additionally, MFS has agreed to bear all expenses associated with office space, other administrative support, and supplies provided to the ICCO and Assistant ICCO.
The fund invests in the MFS Institutional Money Market Portfolio which is managed by MFS and seeks current income consistent with preservation of capital and liquidity. Income earned on this investment is included in “Dividends from underlying affiliated funds” in the Statement of Operations. This money market fund does not pay a management fee to MFS.
Purchases and sales of investments, other than short-term obligations, aggregated $116,001,575 and $157,940,047, respectively.
| (5) | | Shares of Beneficial Interest |
The fund’s Declaration of Trust permits the Trustees to issue an unlimited number of full and fractional shares of beneficial interest. Transactions in fund shares were as follows:
| | | | | | | | | | | | | | | | |
| | | Six months ended 6/30/13 | | | Year ended 12/31/12 | |
| | | Shares | | | Amount | | | Shares | | | Amount | |
| Shares sold | | | | | | | | | | | | | | | | |
Initial Class | | | 26,449 | | | | $1,082,488 | | | | 47,190 | | | | $1,656,069 | |
Service Class | | | 2,620 | | | | 98,308 | | | | 61,692 | | | | 2,204,861 | |
| | | 29,069 | | | | $1,180,796 | | | | 108,882 | | | | $3,860,930 | |
| Shares issued to shareholders in reinvestment of distributions | | | | | | | | | | | | | | | | |
Initial Class | | | — | | | | $— | | | | 151,839 | | | | $5,385,734 | |
Service Class | | | — | | | | — | | | | 55,677 | | | | 1,964,299 | |
| | | — | | | | $— | | | | 207,516 | | | | $7,350,033 | |
14
MFS Blended Research Core Equity Portfolio
Notes to Financial Statements (unaudited) – continued
| | | | | | | | | | | | | | | | |
| | | Six months ended 6/30/13 | | | Year ended 12/31/12 | |
| | | Shares | | | Amount | | | Shares | | | Amount | |
| Shares reacquired | | | | | | | | | | | | | | | | |
Initial Class | | | (617,298 | ) | | | $(24,614,367 | ) | | | (1,481,040 | ) | | | $(52,044,470 | ) |
Service Class | | | (536,171 | ) | | | (21,296,142 | ) | | | (1,050,058 | ) | | | (36,685,309 | ) |
| | | (1,153,469 | ) | | | $(45,910,509 | ) | | | (2,531,098 | ) | | | $(88,729,779 | ) |
| Net change | | | | | | | | | | | | | | | | |
Initial Class | | | (590,849 | ) | | | $(23,531,879 | ) | | | (1,282,011 | ) | | | $(45,002,667 | ) |
Service Class | | | (533,551 | ) | | | (21,197,834 | ) | | | (932,689 | ) | | | (32,516,149 | ) |
| | | (1,124,400 | ) | | | $(44,729,713 | ) | | | (2,214,700 | ) | | | $(77,518,816 | ) |
The fund and certain other funds managed by MFS participate in a $1.1 billion unsecured committed line of credit, subject to a $1 billion sublimit, provided by a syndication of banks under a credit agreement. Borrowings may be made for temporary financing needs. Interest is charged to each fund, based on its borrowings, generally at a rate equal to the higher of the Federal Reserve funds rate or one month LIBOR plus an agreed upon spread. A commitment fee, based on the average daily, unused portion of the committed line of credit, is allocated among the participating funds at the end of each calendar quarter. In addition, the fund and other funds managed by MFS have established unsecured uncommitted borrowing arrangements with certain banks for temporary financing needs. Interest is charged to each fund, based on its borrowings, at a rate equal to the Federal Reserve funds rate plus an agreed upon spread. For the six months ended June 30, 2013, the fund’s commitment fee and interest expense were $1,163 and $0, respectively, and are included in “Miscellaneous” expense in the Statement of Operations.
| (7) | | Transactions in Underlying Affiliated Funds – Affiliated Issuers |
An affiliated issuer may be considered one in which the fund owns 5% or more of the outstanding voting securities, or a company which is under common control. For the purposes of this report, the fund assumes the following to be an affiliated issuer:
| | | | | | | | | | | | | | | | |
| Underlying Affiliated Fund | | Beginning
Shares/Par
Amount | | | Acquisitions
Shares/Par
Amount | | | Dispositions
Shares/Par
Amount | | | Ending
Shares/Par
Amount | |
| MFS Institutional Money Market Portfolio | | | 2,624,089 | | | | 33,468,361 | | | | (34,644,413 | ) | | | 1,448,037 | |
| | | | |
| Underlying Affiliated Fund | | Realized
Gain (Loss) | | | Capital Gain
Distributions | | | Dividend
Income | | | Ending
Value | |
| MFS Institutional Money Market Portfolio | | | $— | | | | $— | | | | $1,383 | | | | $1,448,037 | |
15
MFS Blended Research Core Equity Portfolio
BOARD REVIEW OF INVESTMENT ADVISORY AGREEMENT
A discussion regarding the Board’s most recent review and renewal of the fund’s Investment Advisory Agreement with MFS will be available on or about November 1, 2013 by clicking on the fund’s name under “Variable Insurance Portfolios — VIT II” in the “Products” section of the MFS Web site (mfs.com).
PROXY VOTING POLICIES AND INFORMATION
A general description of the MFS funds’ proxy voting policies and procedures is available without charge, upon request, by calling 1-800-225-2606, by visiting the Proxy Voting section of mfs.com or by visiting the SEC’s Web site at http://www.sec.gov.
Information regarding how the fund voted proxies relating to portfolio securities during the most recent twelve-month period ended June 30 is available without charge by visiting the Proxy Voting section of mfs.com or by visiting the SEC’s Web site at http://www.sec.gov.
QUARTERLY PORTFOLIO DISCLOSURE
The fund will file a complete schedule of portfolio holdings with the Securities and Exchange Commission (the Commission) for the first and third quarters of each fiscal year on Form N-Q. The fund’s Form N-Q is available on the EDGAR database on the Commission’s Internet Web site at http://www.sec.gov, and may be reviewed and copied at the:
Public Reference Room
Securities and Exchange Commission
100 F Street, NE, Room 1580
Washington, D.C. 20549
Information on the operation of the Public Reference Room may be obtained by calling the Commission at 1-800-SEC-0330. Copies of the fund’s Form N-Q also may be obtained, upon payment of a duplicating fee, by electronic request at the following e-mail address: publicinfo@sec.gov or by writing the Public Reference Section at the above address.
FURTHER INFORMATION
From time to time, MFS may post important information about the fund or the MFS funds on the MFS web site (mfs.com). This information is available by visiting the “News & Commentary” section of mfs.com or by clicking on the fund’s name under “Variable Insurance Portfolios — VIT II” in the “Products” section of mfs.com.
16
SEMIANNUAL REPORT
June 30, 2013

MFS® RESEARCH INTERNATIONAL PORTFOLIO
MFS® Variable Insurance Trust II

RSS-SEM
MFS® RESEARCH INTERNATIONAL PORTFOLIO
CONTENTS
The report is prepared for the general information of contract owners. It is authorized for distribution to prospective investors only when preceded or accompanied by a current prospectus.
NOT FDIC INSURED Ÿ MAY LOSE VALUE Ÿ NO BANK OR CREDIT UNION GUARANTEE Ÿ NOT A DEPOSIT Ÿ NOT INSURED BY ANY FEDERAL GOVERNMENT AGENCY OR NCUA/NCUSIF
MFS Research International Portfolio
LETTER FROM THE CHAIRMAN AND CEO

Dear Contract Owners:
As the year progresses, the global economy continues to grind ahead slowly, held back by broad austerity measures. The U.S. economy remains a steadying force, driven by resilient consumers, who have taken the payroll tax increase and the sequestration’s early impact in stride. With U.S. housing and jobs showing steady expansion, domestic consumer-driven growth has offset weaker exports and the U.S. government’s spending constraints. In response to these developments, the U.S. Federal Reserve has begun to brace investors for an eventual shift in its monetary policy, causing global market tremors.
Japan has been another bright spot, with government and central bank stimulus policies leading to increased exports, a resurgent stock market and improved economic sentiment. After a six-month rally, Japan’s stocks slipped late in the second quarter, then picked up momentum on fresh signs that the country could soon break free of its chronic deflation. The major deterrent to global growth remains the eurozone, still in the grip of persistent recession. China has seen its pace of economic growth decelerate, a troubling turn for the country’s trading partners, who have come to rely on it as an engine for global growth.
As always, managing risk in the face of uncertainty remains a top priority for investors. At MFS®, our uniquely collaborative investment process employs integrated, global research and active risk management. Our global team of investment professionals shares ideas and evaluates opportunities across continents, investment disciplines and asset classes — all with a goal of building better insights, and ultimately better results, for our clients.
We are mindful of the many economic challenges investors face, and believe it is more important than ever to maintain a long-term view and employ time-tested principles, such as asset allocation and diversification. We remain confident that our unique approach can serve investors well as they work with their financial advisors to identify and pursue the most suitable opportunities.
Respectfully,

Robert J. Manning
Chairman and Chief Executive Officer
MFS Investment Management®
August 16, 2013
The opinions expressed in this letter are subject to change, may not be relied upon for investment advice, and no forecasts can be guaranteed.
1
MFS Research International Portfolio
PORTFOLIO COMPOSITION
Portfolio structure
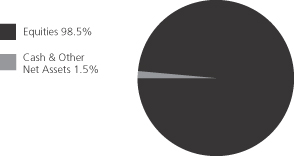
| | | | |
| Top ten holdings | | | | |
| Royal Dutch Shell PLC, “A” | | | 2.6% | |
| Nestle S.A. | | | 2.6% | |
| HSBC Holdings PLC | | | 2.5% | |
| Novartis AG | | | 2.3% | |
| Roche Holding AG | | | 2.3% | |
| GlaxoSmithKline PLC | | | 2.1% | |
| Sumitomo Mitsui Financial Group, Inc. | | | 2.0% | |
| Honda Motor Co. Ltd. | | | 1.9% | |
| Groupe Danone | | | 1.9% | |
| Rio Tinto Ltd. | | | 1.9% | |
| |
| Global equity sectors | | | | |
| Financial Services | | | 24.7% | |
| Capital Goods | | | 22.6% | |
| Energy | | | 10.5% | |
| Health Care | | | 10.5% | |
| Consumer Staples | | | 9.6% | |
| Consumer Cyclicals | | | 7.7% | |
| Technology | | | 7.4% | |
| Telecommunications/Cable Television | | | 5.5% | |
| | | | |
| Issuer country weightings (x) | | | | |
| Japan | | | 23.8% | |
| United Kingdom | | | 19.4% | |
| Switzerland | | | 10.7% | |
| France | | | 9.9% | |
| Germany | | | 6.0% | |
| Hong Kong | | | 4.4% | |
| Netherlands | | | 3.7% | |
| United States | | | 3.5% | |
| Australia | | | 3.2% | |
| Other Countries | | | 15.4% | |
| |
| Currency exposure weightings (y) | | | | |
| Japanese Yen | | | 23.8% | |
| Euro | | | 22.7% | |
| British Pound Sterling | | | 19.4% | |
| Swiss Franc | | | 10.7% | |
| Hong Kong Dollar | | | 5.5% | |
| United States Dollar | | | 4.9% | |
| Australian Dollar | | | 3.2% | |
| Swedish Krona | | | 3.1% | |
| Brazilian Real | | | 2.1% | |
| Other Currencies | | | 4.6% | |
| (x) | Represents the portfolio’s exposure to issuer countries as a percentage of a portfolio’s net assets. |
| (y) | Represents the portfolio’s exposure to a particular currency as a percentage of a portfolio’s net assets. |
Percentages are based on net assets as of 6/30/13.
The portfolio is actively managed and current holdings may be different.
2
MFS Research International Portfolio
EXPENSE TABLE
Fund Expenses Borne by the Contract Holders During the Period,
January 1, 2013 through June 30, 2013
As a contract holder of the fund, you incur ongoing costs, including management fees; distribution and/or service (12b-1) fees; and other fund expenses. This example is intended to help you understand your ongoing costs (in dollars) of investing in the fund and to compare these costs with the ongoing costs of investing in other mutual funds.
The example is based on an investment of $1,000 invested at the beginning of the period and held for the entire period January 1, 2013 through June 30, 2013.
Actual Expenses
The first line for each share class in the following table provides information about actual account values and actual expenses. You may use the information in this line, together with the amount you invested, to estimate the expenses that you paid over the period. Simply divide your account value by $1,000 (for example, an $8,600 account value divided by $1,000 = 8.6), then multiply the result by the number in the first line under the heading entitled “Expenses Paid During Period” to estimate the expenses you paid on your account during this period.
Hypothetical Example for Comparison Purposes
The second line for each share class in the following table provides information about hypothetical account values and hypothetical expenses based on the fund’s actual expense ratio and an assumed rate of return of 5% per year before expenses, which is not the fund’s actual return. The hypothetical account values and expenses may not be used to estimate the actual ending account balance or expenses you paid for the period. You may use this information to compare the ongoing costs of investing in the fund and other funds. To do so, compare this 5% hypothetical example with the 5% hypothetical examples that appear in the shareholder reports of the other funds.
Please note that the expenses shown in the table are meant to highlight the fund’s ongoing costs only and do not take into account the fees and expenses imposed under the variable contracts through which your investment in the fund is made. Therefore, the second line for each share class in the table is useful in comparing ongoing costs associated with an investment in vehicles (such as the fund) which fund benefits under variable annuity and variable life insurance contracts and to qualified pension and retirement plans only, and will not help you determine the relative total costs of investing in the fund through variable annuity and variable life insurance contracts. If the fees and expenses imposed under the variable contracts were included, your costs would have been higher.
| | | | | | | | | | | | | | | | | | |
| Share Class | | | | Annualized
Expense Ratio | | | Beginning
Account Value
1/01/13 | | | Ending Account Value
6/30/13 | | | Expenses Paid
During Period (p)
1/01/13-6/30/13 | |
| Initial Class | | Actual | | | 1.00% | | | | $1,000.00 | | | | $1,035.24 | | | | $5.05 | |
| | Hypothetical (h) | | | 1.00% | | | | $1,000.00 | | | | $1,019.84 | | | | $5.01 | |
| Service Class | | Actual | | | 1.25% | | | | $1,000.00 | | | | $1,034.18 | | | | $6.30 | |
| | Hypothetical (h) | | | 1.25% | | | | $1,000.00 | | | | $1,018.60 | | | | $6.26 | |
| (h) | 5% class return per year before expenses. |
| (p) | Expenses paid are equal to each class’s annualized expense ratio, as shown above, multiplied by the average account value over the period, multiplied by the number of days in the period, divided by the number of days in the year. |
3
MFS Research International Portfolio
PORTFOLIO OF INVESTMENTS – 6/30/13 (unaudited)
The Portfolio of Investments is a complete list of all securities owned by your fund. It is categorized by broad-based asset classes.
| | | | | | | | |
| Issuer | | Shares/Par | | | Value ($) | |
| | | | | | | | |
| COMMON STOCKS – 98.5% | | | | | | | | |
| Alcoholic Beverages – 1.8% | | | | | | | | |
| Heineken N.V. | | | 38,789 | | | $ | 2,465,910 | |
| Pernod Ricard S.A. | | | 35,418 | | | | 3,927,414 | |
| | | | | | | | |
| | | | | | $ | 6,393,324 | |
| | | | | | | | |
| Apparel Manufacturers – 2.0% | | | | | | | | |
| Li & Fung Ltd. | | | 2,680,000 | | | $ | 3,654,613 | |
| LVMH Moet Hennessy Louis Vuitton S.A. | | | 20,574 | | | | 3,313,162 | |
| | | | | | | | |
| | | | | | $ | 6,967,775 | |
| | | | | | | | |
| Automotive – 4.5% | | | | | | | | |
| Autoliv, Inc. | | | 38,600 | | | $ | 2,987,254 | |
| DENSO Corp. | | | 133,300 | | | | 6,251,870 | |
| Honda Motor Co. Ltd. | | | 182,600 | | | | 6,784,442 | |
| | | | | | | | |
| | | | | | $ | 16,023,566 | |
| | | | | | | | |
| Broadcasting – 1.7% | | | | | | | | |
| Nippon Television Holdings, Inc. | | | 132,500 | | | $ | 2,423,422 | |
| Publicis Groupe S.A. | | | 51,882 | | | | 3,678,975 | |
| | | | | | | | |
| | | | | | $ | 6,102,397 | |
| | | | | | | | |
| Business Services – 3.1% | | | | | | | | |
| Amadeus IT Holding S.A. | | | 17,817 | | | $ | 569,467 | |
| Cognizant Technology Solutions Corp., “A” (a) | | | 23,820 | | | | 1,491,370 | |
| Compass Group PLC | | | 141,566 | | | | 1,814,252 | |
| Experian Group Ltd. | | | 133,878 | | | | 2,322,052 | |
| Mitsubishi Corp. | | | 115,000 | | | | 1,970,004 | |
| Nomura Research, Inc. | | | 83,700 | | | | 2,731,644 | |
| | | | | | | | |
| | | | | | $ | 10,898,789 | |
| | | | | | | | |
| Computer Software – 0.4% | | | | | | | | |
| Dassault Systems S.A. | | | 12,244 | | | $ | 1,497,796 | |
| | | | | | | | |
| Computer Software – Systems –0.9% | | | | | |
| Canon, Inc. | | | 91,300 | | | $ | 2,998,630 | |
| | | | | | | | |
| Conglomerates – 0.8% | | | | | | | | |
| Hutchison Whampoa Ltd. | | | 278,000 | | | $ | 2,905,367 | |
| | | | | | | | |
| Consumer Products – 1.0% | | | | | | | | |
| Reckitt Benckiser Group PLC | | | 48,775 | | | $ | 3,457,655 | |
| | | | | | | | |
| Electrical Equipment – 3.4% | | | | | | | | |
| Legrand S.A. | | | 25,239 | | | $ | 1,166,384 | |
| Schneider Electric S.A. | | | 73,625 | | | | 5,308,022 | |
| Siemens AG | | | 54,575 | | | | 5,516,063 | |
| | | | | | | | |
| | | | | | $ | 11,990,469 | |
| | | | | | | | |
| Electronics – 1.2% | | | | | | | | |
| Infineon Technologies AG | | | 223,199 | | | $ | 1,868,088 | |
| Taiwan Semiconductor Manufacturing Co. Ltd. | | | 613,804 | | | | 2,221,355 | |
| | | | | | | | |
| | | | | | $ | 4,089,443 | |
| | | | | | | | |
| Energy – Independent – 2.1% | | | | | | | | |
| Cairn Energy PLC (a) | | | 187,816 | | | $ | 720,295 | |
| | | | | | | | |
| Issuer | | Shares/Par | | | Value ($) | |
| | | | | | | | |
| COMMON STOCKS – continued | | | | | | | | |
| Energy – Independent – continued | | | | | | | | |
| Cenovus Energy, Inc. | | | 58,030 | | | $ | 1,655,320 | |
| INPEX Corp. | | | 488 | | | | 2,040,120 | |
| Oil Search Ltd. | | | 162,030 | | | | 1,137,751 | |
| Reliance Industries Ltd. | | | 136,071 | | | | 1,975,176 | |
| | | | | | | | |
| | | | | | $ | 7,528,662 | |
| | | | | | | | |
| Energy – Integrated – 5.5% | | | | | | | | |
| BG Group PLC | | | 217,705 | | | $ | 3,715,569 | |
| BP PLC | | | 919,319 | | | | 6,377,476 | |
| Royal Dutch Shell PLC, “A” | | | 289,119 | | | | 9,226,133 | |
| | | | | | | | |
| | | | | | $ | 19,319,178 | |
| | | | | | | | |
| Engineering – Construction – 1.4% | | | | | | | | |
| JGC Corp. | | | 142,000 | | | $ | 5,111,313 | |
| | | | | | | | |
| Food & Beverages – 5.0% | | | | | | | | |
| Groupe Danone | | | 89,659 | | | $ | 6,729,187 | |
| M. Dias Branco S.A. Industria e Comercio de Alimentos | | | 49,000 | | | | 1,833,643 | |
| Nestle S.A. | | | 139,695 | | | | 9,136,950 | |
| | | | | | | | |
| | | | | | $ | 17,699,780 | |
| | | | | | | | |
| Food & Drug Stores – 0.8% | | | | | | | | |
| Lawson, Inc. | | | 25,800 | | | $ | 1,969,208 | |
| Wumart Stores, Inc., “H” | | | 426,000 | | | | 785,426 | |
| | | | | | | | |
| | | | | | $ | 2,754,634 | |
| | | | | | | | |
| Gaming & Lodging – 0.9% | | | | | | | | |
| Sands China Ltd. | | | 699,600 | | | $ | 3,267,676 | |
| | | | | | | | |
| Insurance – 4.1% | | | | | | | | |
| AIA Group Ltd. | | | 1,381,400 | | | $ | 5,805,425 | |
| Delta Lloyd N.V. | | | 70,938 | | | | 1,413,240 | |
| Hiscox Ltd. | | | 180,385 | | | | 1,566,915 | |
| ING Groep N.V. (a) | | | 458,597 | | | | 4,190,520 | |
| Sony Financial Holdings, Inc. | | | 88,700 | | | | 1,401,421 | |
| | | | | | | | |
| | | | | | $ | 14,377,521 | |
| | | | | | | | |
| Internet – 0.8% | | | | | | | | |
| Yahoo Japan Corp. | | | 5,487 | | | $ | 2,711,370 | |
| | | | | | | | |
| Machinery & Tools – 3.8% | | | | | | | | |
| Atlas Copco AB, “A” | | | 169,951 | | | $ | 4,081,578 | |
| Glory Ltd. | | | 107,800 | | | | 2,528,159 | |
| Joy Global, Inc. | | | 54,190 | | | | 2,629,841 | |
| Schindler Holding AG | | | 29,099 | | | | 4,047,380 | |
| Sinotruk Hong Kong Ltd. | | | 21,000 | | | | 10,220 | |
| | | | | | | | |
| | | | | | $ | 13,297,178 | |
| | | | | | | | |
| Major Banks – 12.1% | | | | | | | | |
| Banco Santander S.A. | | | 275,038 | | | $ | 1,741,239 | |
| Barclays PLC | | | 1,228,495 | | | | 5,266,248 | |
| BNP Paribas | | | 100,491 | | | | 5,490,500 | |
| HSBC Holdings PLC | | | 839,422 | | | | 8,707,220 | |
| Mitsubishi UFJ Financial Group, Inc. | | | 647,400 | | | | 4,017,421 | |
4
MFS Research International Portfolio
Portfolio of Investments (unaudited) – continued
| | | | | | | | |
| Issuer | | Shares/Par | | | Value ($) | |
| | | | | | | | |
| COMMON STOCKS – continued | | | | | |
| Major Banks – continued | | | | | | | | |
| Standard Chartered PLC | | | 176,493 | | | $ | 3,810,450 | |
| Sumitomo Mitsui Financial Group, Inc. | | | 155,300 | | | | 7,124,571 | |
| Westpac Banking Corp. | | | 247,340 | | | | 6,475,208 | |
| | | | | | | | |
| | | | | | $ | 42,632,857 | |
| | | | | | | | |
| Medical & Health Technology & Services – 0.8% | | | | | |
| Diagnosticos da America S.A. | | | 185,600 | | | $ | 962,373 | |
| Kobayashi Pharmaceutical Co. Ltd. | | | 17,100 | | | | 903,348 | |
| Miraca Holdings, Inc. | | | 24,500 | | | | 1,128,764 | |
| | | | | | | | |
| | | | | | $ | 2,994,485 | |
| | | | | | | | |
| Medical Equipment – 0.6% | | | | | | | | |
| Sonova Holding AG | | | 18,441 | | | $ | 1,956,263 | |
| | | | | | | | |
| Metals & Mining – 2.8% | | | | | | | | |
| Iluka Resources Ltd. | | | 357,519 | | | $ | 3,227,847 | |
| Rio Tinto Ltd. | | | 163,062 | | | | 6,683,348 | |
| | | | | | | | |
| | | | | | $ | 9,911,195 | |
| | | | | | | | |
| Natural Gas – Distribution – 1.9% | | | | | | | | |
| China Resources Gas Group Ltd. | | | 416,000 | | | $ | 1,067,282 | |
| GDF SUEZ | | | 125,665 | | | | 2,450,255 | |
| Tokyo Gas Co. Ltd. | | | 587,000 | | | | 3,248,782 | |
| | | | | | | | |
| | | | | | $ | 6,766,319 | |
| | | | | | | | |
| Network & Telecom – 1.0% | | | | | | | | |
| Ericsson, Inc., “B” | | | 297,770 | | | $ | 3,372,397 | |
| | | | | | | | |
| Other Banks & Diversified Financials – 6.9% | | | | | |
| Aeon Credit Service Co. Ltd. | | | 66,200 | | | $ | 1,880,222 | |
| Bank Rakyat Indonesia | | | 847,000 | | | | 656,221 | |
| DBS Group Holdings Ltd. | | | 211,000 | | | | 2,568,528 | |
| Erste Group Bank AG | | | 108,798 | | | | 2,896,797 | |
| HDFC Bank Ltd., ADR | | | 54,850 | | | | 1,987,764 | |
| ICICI Bank Ltd. | | | 58,863 | | | | 1,060,624 | |
| Itau Unibanco Holding S.A., ADR | | | 71,117 | | | | 918,832 | |
| Kasikornbank PLC, NVDR | | | 271,200 | | | | 1,651,884 | |
| KBC Group N.V. | | | 84,662 | | | | 3,131,416 | |
| Sberbank of Russia, ADR | | | 177,119 | | | | 2,017,385 | |
| UBS AG | | | 233,183 | | | | 3,961,386 | |
| UniCredit S.p.A. | | | 356,115 | | | | 1,667,806 | |
| | | | | | | | |
| | | | | | $ | 24,398,865 | |
| | | | | | | | |
| Pharmaceuticals – 9.1% | | | | | | | | |
| Bayer AG | | | 46,141 | | | $ | 4,920,667 | |
| GlaxoSmithKline PLC | | | 293,348 | | | | 7,338,635 | |
| Novartis AG | | | 115,857 | | | | 8,210,717 | |
| Roche Holding AG | | | 32,126 | | | | 7,960,321 | |
| Santen Pharmaceutical Co. Ltd. | | | 89,600 | | | | 3,857,552 | |
| | | | | | | | |
| | | | | | $ | 32,287,892 | |
| | | | | | | | |
| Precious Metals & Minerals – 0.1% | | | | | | | | |
| Newcrest Mining Ltd. | | | 56,918 | | | $ | 511,208 | |
| | | | | | | | |
| Railroad & Shipping – 0.7% | | | | | | | | |
| Kuehne & Nagel, Inc. AG | | | 22,601 | | | $ | 2,477,960 | |
| | | | | | | | |
| | | | | | | | |
| Issuer | | Shares/Par | | | Value ($) | |
| | | | | | | | |
| COMMON STOCKS – continued | | | | | |
| Real Estate – 1.6% | | | | | | | | |
| GSW Immobilien AG | | | 31,146 | | | $ | 1,200,714 | |
| Mitsubishi Estate Co. Ltd. | | | 169,000 | | | | 4,500,192 | |
| | | | | | | | |
| | | | | | $ | 5,700,906 | |
| | | | | | | | |
| Restaurants – 1.7% | | | | | | | | |
| Arcos Dorados Holdings, Inc. | | | 247,910 | | | $ | 2,895,589 | |
| Whitbread PLC | | | 69,891 | | | | 3,259,237 | |
| | | | | | | | |
| | | | | | $ | 6,154,826 | |
| | | | | | | | |
| Specialty Chemicals – 3.7% | | | | | | | | |
| Akzo Nobel N.V. | | | 87,295 | | | $ | 4,903,471 | |
| Chugoku Marine Paints Ltd. | | | 117,000 | | | | 579,220 | |
| Linde AG | | | 32,574 | | | | 6,065,418 | |
| Symrise AG | | | 40,011 | | | | 1,615,477 | |
| | | | | | | | |
| | | | | | $ | 13,163,586 | |
| | | | | | | | |
| Specialty Stores – 0.6% | | | | | | | | |
| Hennes & Mauritz AB, “B” | | | 67,794 | | | $ | 2,219,858 | |
| | | | | | | | |
| Telecommunications – Wireless – 3.4% | | | | | |
| KDDI Corp. | | | 127,700 | | | $ | 6,643,799 | |
| Tele2 AB, “B” | | | 120,439 | | | | 1,409,179 | |
| TIM Participacoes S.A., ADR | | | 83,634 | | | | 1,555,592 | |
| Vodafone Group PLC | | | 843,130 | | | | 2,419,546 | |
| | | | | | | | |
| | | | | | $ | 12,028,116 | |
| | | | | | | | |
| Telephone Services – 2.1% | | | | | | | | |
| Bezeq - The Israel Telecommunication Corp. Ltd. | | | 398,220 | | | $ | 529,310 | |
| BT Group PLC | | | 435,204 | | | | 2,036,597 | |
| China Unicom (Hong Kong) Ltd. | | | 1,528,000 | | | | 2,011,540 | |
| TDC A.S. | | | 214,024 | | | | 1,731,468 | |
| Telecom Italia S.p.A. - Savings Shares | | | 1,935,809 | | | | 1,069,685 | |
| | | | | | | | |
| | | | | | $ | 7,378,600 | |
| | | | | | | | |
| Tobacco – 1.8% | | | | | | | | |
| Japan Tobacco, Inc. | | | 182,900 | | | $ | 6,463,647 | |
| | | | | | | | |
| Trucking – 1.4% | | | | | | | | |
| Yamato Holdings Co. Ltd. | | | 236,700 | | | $ | 4,990,318 | |
| | | | | | | | |
| Utilities – Electric Power – 0.6% | | | | | |
| Energias do Brasil S.A. | | | 433,500 | | | $ | 2,201,158 | |
| | | | | | | | |
| Utilities – Water – 0.4% | | | | | | | | |
| SUEZ Environnement | | | 113,427 | | | $ | 1,460,395 | |
| | | | | | | | |
Total Common Stocks
(Identified Cost, $345,166,860) | | | | | | $ | 348,463,374 | |
| | | | | | | | |
| |
| MONEY MARKET FUNDS – 0.8% | | | | | |
| MFS Institutional Money Market Portfolio, 0.11%, at Cost and Net Asset Value (v) | | | 2,872,273 | | | $ | 2,872,273 | |
| | | | | | | | |
Total Investments
(Identified Cost, $348,039,133) | | | | | | $ | 351,335,647 | |
| | | | | | | | |
OTHER ASSETS, LESS
LIABILITIES – 0.7% | | | | | | | 2,425,438 | |
| | | | | | | | |
| Net Assets – 100.0% | | | | | | $ | 353,761,085 | |
| | | | | | | | |
5
MFS Research International Portfolio
Portfolio of Investments (unaudited) – continued
| (a) | | Non-income producing security. |
| (v) | | Underlying affiliated fund that is available only to investment companies managed by MFS. The rate quoted for the MFS Institutional Money Market Portfolio is the annualized seven-day yield of the fund at period end. |
The following abbreviations are used in this report and are defined:
| ADR | | American Depositary Receipt |
| NVDR | | Non-Voting Depositary Receipt |
| PLC | | Public Limited Company |
See Notes to Financial Statements
6
MFS Research International Portfolio
FINANCIAL STATEMENTS | STATEMENT OF ASSETS AND LIABILITIES (unaudited)
This statement represents your fund’s balance sheet, which details the assets and liabilities comprising the total value of the fund.
| | | | | | | | |
At 6/30/13 | | | | | | | | |
Assets | | | | | | | | |
Investments – | | | | | | | | |
Non-affiliated issuers, at value (identified cost, $345,166,860) | | | $348,463,374 | | | | | |
Underlying affiliated funds, at cost and value | | | 2,872,273 | | | | | |
Total investments, at value (identified cost, $348,039,133) | | | $351,335,647 | | | | | |
Foreign currency, at value (identified cost, $311,058) | | | 308,438 | | | | | |
Receivables for | | | | | | | | |
Investments sold | | | 528,453 | | | | | |
Fund shares sold | | | 732,712 | | | | | |
Interest and dividends | | | 1,176,306 | | | | | |
Other assets | | | 889 | | | | | |
Total assets | | | | | | | $354,082,445 | |
Liabilities | | | | | | | | |
Payables for | | | | | | | | |
Investments purchased | | | $9,257 | | | | | |
Fund shares reacquired | | | 186,786 | | | | | |
Payable to affiliates | | | | | | | | |
Investment adviser | | | 35,268 | | | | | |
Shareholder servicing costs | | | 54 | | | | | |
Distribution and/or service fees | | | 2,419 | | | | | |
Payable for independent Trustees’ compensation | | | 1,689 | | | | | |
Accrued expenses and other liabilities | | | 85,887 | | | | | |
Total liabilities | | | | | | | $321,360 | |
Net assets | | | | | | | $353,761,085 | |
Net assets consist of | | | | | | | | |
Paid-in capital | | | $350,008,933 | | | | | |
Unrealized appreciation (depreciation) on investments and translation of assets and liabilities in foreign currencies | | | 3,251,367 | | | | | |
Accumulated net realized gain (loss) on investments and foreign currency | | | (7,001,589 | ) | | | | |
Undistributed net investment income | | | 7,502,374 | | | | | |
Net assets | | | | | | | $353,761,085 | |
Shares of beneficial interest outstanding | | | | | | | 25,166,633 | |
| | | | | | | | | | | | |
| | | Net assets | | | Shares outstanding | | | Net asset value per share | |
Initial Class | | | $265,397,845 | | | | 18,819,657 | | | | $14.10 | |
Service Class | | | 88,363,240 | | | | 6,346,976 | | | | 13.92 | |
See Notes to Financial Statements
7
MFS Research International Portfolio
FINANCIAL STATEMENTS | STATEMENT OF OPERATIONS (unaudited)
This statement describes how much your fund earned in investment income and accrued in expenses. It also describes any gains and/or losses generated by fund operations.
| | | | | | | | |
Six months ended 6/30/13 | | | | | | | | |
Net investment income | | | | | | | | |
Income | | | | | | | | |
Dividends | | | $7,552,655 | | | | | |
Interest | | | 97,868 | | | | | |
Dividends from underlying affiliated funds | | | 732 | | | | | |
Foreign taxes withheld | | | (666,181 | ) | | | | |
Total investment income | | | | | | | $6,985,074 | |
Expenses | | | | | | | | |
Management fee | | | $1,635,670 | | | | | |
Distribution and/or service fees | | | 114,086 | | | | | |
Shareholder servicing costs | | | 3,452 | | | | | |
Administrative services fee | | | 28,218 | | | | | |
Independent trustees’ compensation | | | 5,128 | | | | | |
Custodian fee | | | 88,236 | | | | | |
Shareholder communications | | | 7,105 | | | | | |
Audit and tax fees | | | 29,519 | | | | | |
Legal fees | | | 3,099 | | | | | |
Miscellaneous | | | 10,734 | | | | | |
Total expenses | | | | | | | $1,925,247 | |
Reduction of expenses by investment adviser | | | (1,187 | ) | | | | |
Net expenses | | | | | | | $1,924,060 | |
Net investment income | | | | | | | $5,061,014 | |
Realized and unrealized gain (loss) on investments and foreign currency | | | | | | | | |
Realized gain (loss) (identified cost basis) | | | | | | | | |
Investments (net of $26,068 country tax) | | | $14,619,159 | | | | | |
Foreign currency | | | (115,163 | ) | | | | |
Net realized gain (loss) on investments and foreign currency | | | | | | | $14,503,996 | |
Change in unrealized appreciation (depreciation) | | | | | | | | |
Investments (net of $45,814 decrease in deferred country tax) | | | $(6,384,101 | ) | | | | |
Translation of assets and liabilities in foreign currencies | | | (44,976 | ) | | | | |
Net unrealized gain (loss) on investments and foreign currency translation | | | | | | | $(6,429,077 | ) |
Net realized and unrealized gain (loss) on investments and foreign currency | | | | | | | $8,074,919 | |
Change in net assets from operations | | | | | | | $13,135,933 | |
See Notes to Financial Statements
8
MFS Research International Portfolio
FINANCIAL STATEMENTS | STATEMENTS OF CHANGES IN NET ASSETS
These statements describe the increases and/or decreases in net assets resulting from operations, any distributions, and any shareholder transactions.
| | | | | | | | |
| |
| Six months ended
6/30/13 (unaudited |
) | |
| Year ended
12/31/12 |
|
Change in net assets | | | | | | | | |
| From operations | | | | | | | | |
Net investment income | | | $5,061,014 | | | | $2,617,061 | |
Net realized gain (loss) on investments and foreign currency | | | 14,503,996 | | | | 1,858,818 | |
Net unrealized gain (loss) on investments and foreign currency translation | | | (6,429,077 | ) | | | 24,116,963 | |
Change in net assets from operations | | | $13,135,933 | | | | $28,592,842 | |
| Distributions declared to shareholders | | | | | | | | |
From net investment income | | | $— | | | | $(2,715,065 | ) |
Change in net assets from fund share transactions | | | $(19,926,527 | ) | | | $197,571,017 | |
Total change in net assets | | | $(6,790,594 | ) | | | $223,448,794 | |
| Net assets | | | | | | | | |
At beginning of period | | | 360,551,679 | | | | 137,102,885 | |
At end of period (including undistributed net investment income of $7,502,374 and
$2,441,360, respectively) | | | $353,761,085 | | | | $360,551,679 | |
See Notes to Financial Statements
9
MFS Research International Portfolio
FINANCIAL STATEMENTS | FINANCIAL HIGHLIGHTS
The financial highlights table is intended to help you understand the fund’s financial performance for the semiannual period and the past 5 fiscal years. Certain information reflects financial results for a single fund share. The total returns in the table represent the rate by which an investor would have earned (or lost) on an investment in the fund share class (assuming reinvestment of all distributions) held for the entire period.
| | | | | | | | | | | | | | | | | | | | | | | | |
| Initial Class | | Six months ended 6/30/13 | | | Years ended 12/31 | |
| | | | 2012 | | | 2011 | | | 2010 | | | 2009 | | | 2008 | |
| | | (unaudited) | | | | | | | | | | | | | | | | |
Net asset value, beginning of period | | | $13.62 | | | | $11.94 | | | | $13.69 | | | | $12.54 | | | | $9.94 | | | | $19.92 | |
| Income (loss) from investment operations | | | | | | | | | | | | | | | | | | | | | | | | |
Net investment income (d) | | | $0.20 | | | | $0.19 | | | | $0.25 | | | | $0.20 | | | | $0.17 | | | | $0.37 | |
Net realized and unrealized gain (loss) on investments
and foreign currency | | | 0.28 | | | | 1.77 | | | | (1.72 | ) | | | 1.12 | | | | 2.77 | | | | (7.71 | ) |
Total from investment operations | | | $0.48 | | | | $1.96 | | | | $(1.47 | ) | | | $1.32 | | | | $2.94 | | | | $(7.34 | ) |
| Less distributions declared to shareholders | | | | | | | | | | | | | | | | | | | | | | | | |
From net investment income | | | $— | | | | $(0.28 | ) | | | $(0.28 | ) | | | $(0.17 | ) | | | $(0.34 | ) | | | $(0.29 | ) |
From net realized gain on investments | | | — | | | | — | | | | — | | | | — | | | | — | | | | (2.35 | ) |
Total distributions declared to shareholders | | | $— | | | | $(0.28 | ) | | | $(0.28 | ) | | | $(0.17 | ) | | | $(0.34 | ) | | | $(2.64 | ) |
Net asset value, end of period (x) | | | $14.10 | | | | $13.62 | | | | $11.94 | | | | $13.69 | | | | $12.54 | | | | $9.94 | |
Total return (%) (k)(r)(s)(x) | | | 3.52 | (n) | | | 16.59 | | | | (10.88 | ) | | | 10.63 | | | | 30.94 | | | | (42.49 | ) |
Ratios (%) (to average net assets)
and Supplemental data: | | | | | | | | | | | | | | | | | | | | | | | | |
Expenses before expense reductions (f) | | | 1.00 | (a) | | | 1.07 | | | | 1.14 | | | | 1.12 | | | | 1.18 | | | | 1.17 | |
Expenses after expense reductions (f) | | | 1.00 | (a) | | | 1.07 | | | | 1.10 | | | | 1.10 | | | | 1.10 | | | | 1.11 | |
Net investment income | | | 2.85 | (a) | | | 1.44 | | | | 1.89 | | | | 1.66 | | | | 1.62 | | | | 2.43 | |
Portfolio turnover | | | 19 | (n) | | | 46 | | | | 45 | | | | 60 | | | | 75 | | | | 82 | |
Net assets at end of period (000 omitted) | | | $265,398 | | | | $269,211 | | | | $40,134 | | | | $52,239 | | | | $93,714 | | | | $45,835 | |
| | |
| Service Class | | Six months
ended
6/30/13 | | | Years ended 12/31 | |
| | | | 2012 | | | 2011 | | | 2010 | | | 2009 | | | 2008 | |
| | | (unaudited) | | | | | | | | | | | | | | | | |
Net asset value, beginning of period | | | $13.46 | | | | $11.80 | | | | $13.52 | | | | $12.39 | | | | $9.82 | | | | $19.70 | |
| Income (loss) from investment operations | | | | | | | | | | | | | | | | | | | | | | | | |
Net investment income (d) | | | $0.18 | | | | $0.23 | | | | $0.22 | | | | $0.16 | | | | $0.17 | | | | $0.32 | |
Net realized and unrealized gain (loss) on investments
and foreign currency | | | 0.28 | | | | 1.67 | | | | (1.70 | ) | | | 1.11 | | | | 2.70 | | | | (7.61 | ) |
Total from investment operations | | | $0.46 | | | | $1.90 | | | | $(1.48 | ) | | | $1.27 | | | | $2.87 | | | | $(7.29 | ) |
| Less distributions declared to shareholders | | | | | | | | | | | | | | | | | | | | | | | | |
From net investment income | | | $— | | | | $(0.24 | ) | | | $(0.24 | ) | | | $(0.14 | ) | | | $(0.30 | ) | | | $(0.24 | ) |
From net realized gain on investments | | | — | | | | — | | | | — | | | | — | | | | — | | | | (2.35 | ) |
Total distributions declared to shareholders | | | $— | | | | $(0.24 | ) | | | $(0.24 | ) | | | $(0.14 | ) | | | $(0.30 | ) | | | $(2.59 | ) |
Net asset value, end of period (x) | | | $13.92 | | | | $13.46 | | | | $11.80 | | | | $13.52 | | | | $12.39 | | | | $9.82 | |
Total return (%) (k)(r)(s)(x) | | | 3.42 | (n) | | | 16.29 | | | | (11.06 | ) | | | 10.34 | | | | 30.50 | | | | (42.60 | ) |
Ratios (%) (to average net assets)
and Supplemental data: | | | | | | | | | | | | | | | | | | | | | | | | |
Expenses before expense reductions (f) | | | 1.25 | (a) | | | 1.34 | | | | 1.39 | | | | 1.37 | | | | 1.43 | | | | 1.42 | |
Expenses after expense reductions (f) | | | 1.25 | (a) | | | 1.34 | | | | 1.35 | | | | 1.35 | | | | 1.35 | | | | 1.36 | |
Net investment income | | | 2.59 | (a) | | | 1.87 | | | | 1.64 | | | | 1.31 | | | | 1.64 | | | | 2.17 | |
Portfolio turnover | | | 19 | (n) | | | 46 | | | | 45 | | | | 60 | | | | 75 | | | | 82 | |
Net assets at end of period (000 omitted) | | | $88,363 | | | | $91,341 | | | | $96,969 | | | | $121,479 | | | | $126,055 | | | | $113,966 | |
See Notes to Financial Statements
10
MFS Research International Portfolio
Financial Highlights – continued
| (d) | Per share data is based on average shares outstanding. |
| (f) | Ratios do not reflect reductions from fees paid indirectly, if applicable. |
| (k) | The total return does not reflect expenses that apply to separate accounts. Inclusion of these charges would reduce the total return figures for all periods shown. |
| (r) | Certain expenses have been reduced without which performance would have been lower. |
| (s) | From time to time the fund may receive proceeds from litigation settlements, without which performance would be lower. |
| (x) | The net asset values per share and total returns have been calculated on net assets which include adjustments made in accordance with U.S. generally accepted accounting principles required at period end for financial reporting purposes. |
See Notes to Financial Statements
11
MFS Research International Portfolio
NOTES TO FINANCIAL STATEMENTS (unaudited)
| (1) | | Business and Organization |
MFS Research International Portfolio (the fund) is a series of MFS Variable Insurance Trust II (the trust). The trust is organized as a Massachusetts business trust and is registered under the Investment Company Act of 1940, as amended, as an open-end management investment company. The shareholders of each series of the trust are separate accounts of insurance companies, which offer variable annuity and/or life insurance products, and qualified retirement and pension plans.
| (2) | | Significant Accounting Policies |
General – The preparation of financial statements in conformity with U.S. generally accepted accounting principles requires management to make estimates and assumptions that affect the reported amounts of assets and liabilities, and disclosure of contingent assets and liabilities at the date of the financial statements and the reported amounts of revenues and expenses during the reporting period. Actual results could differ from those estimates. In the preparation of these financial statements, management has evaluated subsequent events occurring after the date of the fund’s Statement of Assets and Liabilities through the date that the financial statements were issued. The fund invests in foreign securities. Investments in foreign securities are vulnerable to the effects of changes in the relative values of the local currency and the U.S. dollar and to the effects of changes in each country’s legal, political, and economic environment.
In this reporting period, the fund adopted the disclosure provisions of the Financial Accounting Standards Board (FASB) Accounting Standards Update 2011-11 (“ASU 2011-11”), Balance Sheet (Topic 210) – Disclosures about Offsetting Assets and Liabilities along with the related scope clarification provisions of FASB Accounting Standards Update 2013-01 (“ASU 2013-01”) entitled Balance Sheet (Topic 210) – Clarifying the Scope of Disclosures about Offsetting Assets and Liabilities. ASU 2011-11 is intended to enhance disclosures on the offsetting of financial assets and liabilities by requiring entities to disclose both gross and net information about financial instruments and transactions that are either offset in the statement of financial position or subject to a Master Netting Agreement or similar arrangement. ASU 2013-01 limits the scope of ASU 2011-11’s disclosure requirements on offsetting to financial assets and financial liabilities related to derivatives, repurchase and reverse repurchase agreements, and securities lending and securities borrowing transactions. The disclosures required by ASU 2011-11, to the extent applicable to the fund, have been included in the fund’s Significant Accounting Policies note under the captions for each of the fund’s in-scope financial instruments and transactions.
In June 2013, FASB issued Accounting Standards Update 2013-08 Financial Services – Investment Companies (Topic 946) – Amendments to the Scope, Measurement, and Disclosure Requirements (“ASU 2013-08”) which is effective for interim and annual reporting periods in fiscal years that begin after December 15, 2013. ASU 2013-08 sets forth a methodology for determining whether an entity should be characterized as an investment company and prescribes fair value accounting for an investment company’s non-controlling ownership interest in another investment company. FASB has determined that a fund registered under the Investment Company Act of 1940 automatically meets ASU 2013-08’s criteria for an investment company. Although still evaluating the potential impacts of ASU 2013-08 to the fund, management expects that the impact of the fund’s adoption will be limited to additional financial statement disclosures.
Investment Valuations – Equity securities, including restricted equity securities, are generally valued at the last sale or official closing price as provided by a third-party pricing service on the market or exchange on which they are primarily traded. Equity securities, for which there were no sales reported that day, are generally valued at the last quoted daily bid quotation as provided by a third-party pricing service on the market or exchange on which such securities are primarily traded. Short-term instruments with a maturity at issuance of 60 days or less generally are valued at amortized cost, which approximates market value. Open-end investment companies are generally valued at net asset value per share. Securities and other assets generally valued on the basis of information from a third-party pricing service may also be valued at a broker/dealer bid quotation. Values obtained from third-party pricing services can utilize both transaction data and market information such as yield, quality, coupon rate, maturity, type of issue, trading characteristics, and other market data. The values of foreign securities and other assets and liabilities expressed in foreign currencies are converted to U.S. dollars using the mean of bid and asked prices for rates provided by a third-party pricing service.
The Board of Trustees has delegated primary responsibility for determining or causing to be determined the value of the fund’s investments (including any fair valuation) to the adviser pursuant to valuation policies and procedures approved by the Board. If the adviser determines that reliable market quotations are not readily available, investments are valued at fair value as determined in good faith by the adviser in accordance with such procedures under the oversight of the Board of Trustees. Under the fund’s valuation policies and procedures, market quotations are not considered to be readily available for most types of debt instruments and floating rate loans and many types of derivatives. These investments are generally valued at fair value based on information from third-party pricing services. In addition, investments may be valued at fair value if the adviser determines that an investment’s value has been materially affected by events occurring after the close of the exchange or market on which the investment is principally traded (such as foreign exchange or market) and prior to the determination of the fund’s net asset value, or after the halting of trading of a specific security where trading does not resume prior to the close of the exchange or market on which the security is principally traded. Events that occur on a frequent basis after foreign markets close (such as developments in foreign markets and significant movements in the U.S. markets) and prior to the determination of the fund’s net asset value may be deemed to have a material effect on the value of
12
MFS Research International Portfolio
Notes to Financial Statements (unaudited) – continued
securities traded in foreign markets. Accordingly, the fund’s foreign equity securities may often be valued at fair value. The adviser generally relies on third-party pricing services or other information (such as the correlation with price movements of similar securities in the same or other markets; the type, cost and investment characteristics of the security; the business and financial condition of the issuer; and trading and other market data) to assist in determining whether to fair value and at what value to fair value an investment. The value of an investment for purposes of calculating the fund’s net asset value can differ depending on the source and method used to determine value. When fair valuation is used, the value of an investment used to determine the fund’s net asset value may differ from quoted or published prices for the same investment. There can be no assurance that the fund could obtain the fair value assigned to an investment if it were to sell the investment at the same time at which the fund determines its net asset value per share.
Various inputs are used in determining the value of the fund’s assets or liabilities. These inputs are categorized into three broad levels. In certain cases, the inputs used to measure fair value may fall into different levels of the fair value hierarchy. In such cases, an investment’s level within the fair value hierarchy is based on the lowest level of input that is significant to the fair value measurement. The fund’s assessment of the significance of a particular input to the fair value measurement in its entirety requires judgment, and considers factors specific to the investment. Level 1 includes unadjusted quoted prices in active markets for identical assets or liabilities. Level 2 includes other significant observable market-based inputs (including quoted prices for similar securities, interest rates, prepayment speed, and credit risk). Level 3 includes unobservable inputs, which may include the adviser’s own assumptions in determining the fair value of investments. The following is a summary of the levels used as of June 30, 2013 in valuing the fund’s assets or liabilities:
| | | | | | | | | | | | | | | | |
| Investments at Value | | Level 1 | | | Level 2 | | | Level 3 | | | Total | |
| Equity Securities: | | | | | | | | | | | | | | | | |
Japan | | | $56,347,268 | | | | $27,912,171 | | | | $— | | | | $84,259,439 | |
United Kingdom | | | 8,707,220 | | | | 60,014,408 | | | | — | | | | 68,721,628 | |
Switzerland | | | 1,956,263 | | | | 35,794,714 | | | | — | | | | 37,750,977 | |
France | | | 17,644,897 | | | | 17,377,193 | | | | — | | | | 35,022,090 | |
Germany | | | 12,304,818 | | | | 8,881,609 | | | | — | | | | 21,186,427 | |
Hong Kong | | | — | | | | 15,633,081 | | | | — | | | | 15,633,081 | |
Netherlands | | | — | | | | 12,973,141 | | | | — | | | | 12,973,141 | |
Australia | | | — | | | | 11,352,014 | | | | — | | | | 11,352,014 | |
Sweden | | | 3,372,397 | | | | 7,710,615 | | | | — | | | | 11,083,012 | |
Other Countries | | | 29,723,930 | | | | 20,757,635 | | | | — | | | | 50,481,565 | |
| Mutual Funds | | | 2,872,273 | | | | — | | | | — | | | | 2,872,273 | |
| Total Investments | | | $132,929,066 | | | | $218,406,581 | | | | $— | | | | $351,335,647 | |
For further information regarding security characteristics, see the Portfolio of Investments.
Of the level 2 investments presented above, equity investments amounting to $15,934,326 would have been considered level 1 investments at the beginning of the period. Of the level 1 investments presented above, equity investments amounting to $84,144,933 would have been considered level 2 investments at the beginning of the period. The primary reason for changes in the classifications between levels 1 and 2 occurs when foreign equity securities are fair valued using other observable market-based inputs in place of the closing exchange price due to events occurring after the close of the exchange or market on which the investment is principally traded. The fund’s foreign equity securities may often be valued at fair value. The fund’s policy is to recognize transfers between the levels as of the end of the period.
Foreign Currency Translation – Purchases and sales of foreign investments, income, and expenses are converted into U.S. dollars based upon currency exchange rates prevailing on the respective dates of such transactions or on the reporting date for foreign denominated receivables and payables. Gains and losses attributable to foreign currency exchange rates on sales of securities are recorded for financial statement purposes as net realized gains and losses on investments. Gains and losses attributable to foreign exchange rate movements on receivables, payables, income and expenses are recorded for financial statement purposes as foreign currency transaction gains and losses. That portion of both realized and unrealized gains and losses on investments that results from fluctuations in foreign currency exchange rates is not separately disclosed.
Security Loans – Under its Securities Lending Agency Agreement with the fund, State Street Bank and Trust Company (“State Street”), as lending agent, loans the securities of the fund to certain qualified institutions (the “Borrowers”) approved by the fund. The loans are collateralized by cash and/or U.S. Treasury and federal agency obligations in an amount typically at least equal to the market value of the securities loaned. The market value of the loaned securities is determined at the close of business of the fund and any additional required collateral is delivered to the fund on the next business day. State Street provides the fund with indemnification against Borrower default. In the event of Borrower default, State Street will for the benefit of the fund either purchase securities identical to those loaned or, when such purchase is commercially impracticable, pay the fund the market value of the loaned securities. In return, State Street assumes the fund’s rights to the related collateral. If the collateral value is less than the cost to purchase identical securities, State Street is responsible for the shortfall, but only to the extent that such shortfall is not due to
13
MFS Research International Portfolio
Notes to Financial Statements (unaudited) – continued
a decline in collateral value resulting from collateral reinvestment for which the fund bears the risk of loss. On loans collateralized by cash, the cash collateral is invested in a money market fund or short-term securities. A portion of the income generated upon investment of the collateral is remitted to the Borrowers, and the remainder is allocated between the fund and the lending agent. On loans collateralized by U.S. Treasury and/or federal agency obligations, a fee is received from the Borrower, and is allocated between the fund and the lending agent. Income from securities lending is included in “Interest” income, separately reported in the Statement of Operations. The dividend and interest income earned on the securities loaned is accounted for in the same manner as other dividend and interest income. At June 30, 2013, there were no securities on loan or collateral outstanding.
Indemnifications – Under the fund’s organizational documents, its officers and Trustees may be indemnified against certain liabilities and expenses arising out of the performance of their duties to the fund. Additionally, in the normal course of business, the fund enters into agreements with service providers that may contain indemnification clauses. The fund’s maximum exposure under these agreements is unknown as this would involve future claims that may be made against the fund that have not yet occurred.
Investment Transactions and Income – Investment transactions are recorded on the trade date. Interest income is recorded on the accrual basis. Dividends received in cash are recorded on the ex-dividend date. Certain dividends from foreign securities will be recorded when the fund is informed of the dividend if such information is obtained subsequent to the ex-dividend date. Dividend and interest payments received in additional securities are recorded on the ex-dividend or ex-interest date in an amount equal to the value of the security on such date.
The fund may receive proceeds from litigation settlements. Any proceeds received from litigation involving portfolio holdings are reflected in the Statement of Operations in realized gain/loss if the security has been disposed of by the fund or in unrealized gain/loss if the security is still held by the fund. Any other proceeds from litigation not related to portfolio holdings are reflected as other income in the Statement of Operations.
Fees Paid Indirectly – The fund’s custody fee may be reduced according to an arrangement that measures the value of cash deposited with the custodian by the fund. For the six months ended June 30, 2013, custody fees were not reduced.
Tax Matters and Distributions – The fund intends to qualify as a regulated investment company, as defined under Subchapter M of the Internal Revenue Code, and to distribute all of its taxable income, including realized capital gains. As a result, no provision for federal income tax is required. The fund’s federal tax returns, when filed, will remain subject to examination by the Internal Revenue Service for a three year period. Foreign taxes have been accrued by the fund in the accompanying financial statements in accordance with the applicable foreign tax law. Foreign income taxes may be withheld by certain countries in which the fund invests. Additionally, capital gains realized by the fund on securities issued in or by certain foreign countries may be subject to capital gains tax imposed by those countries.
Distributions to shareholders are recorded on the ex-dividend date. Income and capital gain distributions are determined in accordance with income tax regulations, which may differ from U.S. generally accepted accounting principles. Certain capital accounts in the financial statements are periodically adjusted for permanent differences in order to reflect their tax character. These adjustments have no impact on net assets or net asset value per share. Temporary differences which arise from recognizing certain items of income, expense, gain or loss in different periods for financial statement and tax purposes will reverse at some time in the future. Distributions in excess of net investment income or net realized gains are temporary overdistributions for financial statement purposes resulting from differences in the recognition or classification of income or distributions for financial statement and tax purposes.
Book/tax differences primarily relate to wash sale loss deferrals.
The tax character of distributions declared to shareholders for the last fiscal year is as follows:
| | | | |
| | | 12/31/12 | |
| Ordinary income (including any short-term capital gains) | | | $2,715,065 | |
The federal tax cost and the tax basis components of distributable earnings were as follows:
| | | | |
| As of 6/30/13 | | | | |
| Cost of investments | | | $349,108,787 | |
| Gross appreciation | | | 25,377,573 | |
| Gross depreciation | | | (23,150,713 | ) |
| Net unrealized appreciation (depreciation) | | | $2,226,860 | |
| |
| As of 12/31/12 | | | | |
| Undistributed ordinary income | | | 2,461,912 | |
Capital loss carryforwards | | | (20,435,931 | ) |
| Other temporary differences | | | (66,537 | ) |
| Net unrealized appreciation (depreciation) | | | 8,656,775 | |
The aggregate cost above includes prior fiscal year end tax adjustments, if applicable.
14
MFS Research International Portfolio
Notes to Financial Statements (unaudited) – continued
Under the Regulated Investment Company Modernization Act of 2010 (the “Act”), net capital losses recognized for fund fiscal years beginning after December 31, 2010 may be carried forward indefinitely, and their character is retained as short-term and/or long-term losses (“post-enactment losses”). Previously, net capital losses were carried forward for eight years and treated as short-term losses (“pre-enactment losses”). As a transition rule, the Act requires that all post-enactment net capital losses be used before pre-enactment net capital losses.
As of December 31, 2012, the fund had capital loss carryforwards available to offset future realized gains. Such pre-enactment losses expire as follows:
| | | | |
| 12/31/16 | | | $(8,391,479 | ) |
| 12/31/17 | | | (12,044,452 | ) |
| Total | | | $(20,435,931 | ) |
Multiple Classes of Shares of Beneficial Interest – The fund offers multiple classes of shares, which differ in their respective distribution and/or service fees. The fund’s income, realized and unrealized gain (loss), and common expenses are allocated to shareholders based on the daily net assets of each class. Dividends are declared separately for each class. Differences in per share dividend rates are generally due to differences in separate class expenses. The fund’s distributions declared to shareholders as reported in the Statements of Changes in Net Assets are presented by class as follows:
| | | | | | | | |
| | | From net investment
income | |
| | | Six months ended
6/30/13 | | | Year ended
12/31/12 | |
| Initial Class | | | $— | | | | $875,101 | |
| Service Class | | | — | | | | 1,839,964 | |
| Total | | | $— | | | | $2,715,065 | |
| (3) | | Transactions with Affiliates |
Investment Adviser – The fund has an investment advisory agreement with MFS to provide overall investment management and related administrative services and facilities to the fund. The management fee is computed daily and paid monthly at the following annual rates:
| | | | |
| First $1 billion of average daily net assets | | | 0.90% | |
| Next $1 billion of average daily net assets | | | 0.80% | |
| Average daily net assets in excess of $2 billion | | | 0.70% | |
Effective April 1, 2013, MFS has agreed in writing to reduce its management fee by a specified amount if certain MFS mutual fund assets exceed thresholds agreed to by MFS and the fund’s Board of Trustees. For the period April 1, 2013 through June 30, 2013, this management fee reduction amounted to $493, which is shown as a reduction of total expenses in the Statement of Operations. The management fee incurred for the six months ended June 30, 2013 was equivalent to an annual effective rate of 0.90% of the fund’s average daily net assets.
The investment adviser has agreed in writing to pay a portion of the fund’s total annual operating expenses, exclusive of interest, taxes, extraordinary expenses, brokerage and transaction costs, and investment-related expenses, such that total annual operating expenses do not exceed 1.10% of average daily net assets for the Initial Class shares and 1.35% of average daily net assets for the Service Class shares. This written agreement will continue until modified by the fund’s Board of Trustees, but such agreement will continue at least until April 30, 2015. For the six months ended June 30, 2013, the fund’s actual operating expenses did not exceed the limit and therefore, the investment adviser did not pay any portion of the fund’s expenses related to this agreement.
Distributor – MFS Fund Distributors, Inc. (MFD), a wholly-owned subsidiary of MFS, is the distributor of shares of the fund. The Trustees have adopted a distribution plan for the Service Class shares pursuant to Rule 12b-1 under the Investment Company Act of 1940.
The fund’s distribution plan provides that the fund will pay MFD distribution and/or service fees equal to 0.25% per annum of its average daily net assets attributable to Service Class shares as partial consideration for services performed and expenses incurred by MFD and financial intermediaries (including participating insurance companies that invest in the fund to fund variable annuity and variable life insurance contracts, sponsors of qualified retirement and pension plans that invest in the fund, and affiliates of these participating insurance companies and plan sponsors) in connection with the sale and distribution of the Service Class shares. MFD may subsequently pay all, or a portion, of the distribution and/or service fees to financial intermediaries.
15
MFS Research International Portfolio
Notes to Financial Statements (unaudited) – continued
Shareholder Servicing Agent – MFS Service Center, Inc. (MFSC), a wholly-owned subsidiary of MFS, receives a fee from the fund for its services as shareholder servicing agent. For the six months ended June 30, 2013, the fee was $3,449, which equated to 0.0019% annually of the fund’s average daily net assets. MFSC also receives payment from the fund for out-of-pocket expenses paid by MFSC on behalf of the fund. For the six months ended June 30, 2013, these costs amounted to $3.
Administrator – MFS provides certain financial, legal, shareholder communications, compliance, and other administrative services to the fund. Under an administrative services agreement, the fund partially reimburses MFS the costs incurred to provide these services. The fund is charged an annual fixed amount of $17,500 plus a fee based on average daily net assets. The administrative services fee incurred for the six months ended June 30, 2013 was equivalent to an annual effective rate of 0.0155% of the fund’s average daily net assets.
Trustees’ and Officers’ Compensation – The fund pays compensation to independent Trustees in the form of a retainer, attendance fees, and additional compensation to Board and Committee chairpersons. The fund does not pay compensation directly to Trustees or officers of the fund who are also officers of the investment adviser, all of whom receive remuneration for their services to the fund from MFS. Certain officers and Trustees of the fund are officers or directors of MFS, MFD, and MFSC.
Other – This fund and certain other funds managed by MFS (the funds) have entered into services agreements (the Agreements) which provide for payment of fees by the funds to Tarantino LLC and Griffin Compliance LLC in return for the provision of services of an Independent Chief Compliance Officer (ICCO) and Assistant ICCO, respectively, for the funds. The ICCO and Assistant ICCO are officers of the funds and the sole members of Tarantino LLC and Griffin Compliance LLC, respectively. The funds can terminate the Agreements with Tarantino LLC and Griffin Compliance LLC at any time under the terms of the Agreements. For the six months ended June 30, 2013, the aggregate fees paid by the fund to Tarantino LLC and Griffin Compliance LLC were $1,410 and are included in “Miscellaneous” expense in the Statement of Operations. MFS has agreed to reimburse the fund for a portion of the payments made by the fund in the amount of $694, which is shown as a reduction of total expenses in the Statement of Operations. Additionally, MFS has agreed to bear all expenses associated with office space, other administrative support, and supplies provided to the ICCO and Assistant ICCO.
The fund invests in the MFS Institutional Money Market Portfolio which is managed by MFS and seeks current income consistent with preservation of capital and liquidity. Income earned on this investment is included in “Dividends from underlying affiliated funds” in the Statement of Operations. This money market fund does not pay a management fee to MFS.
Purchases and sales of investments, other than short-term obligations, aggregated $69,339,064 and $92,416,296, respectively.
| (5) | | Shares of Beneficial Interest |
The fund’s Declaration of Trust permits the Trustees to issue an unlimited number of full and fractional shares of beneficial interest. Transactions in fund shares were as follows:
| | | | | | | | | | | | | | | | |
| | | Six months ended 6/30/13 | | | Year ended 12/31/12 | |
| | | Shares | | | Amount | | | Shares | | | Amount | |
| Shares sold | | | | | | | | | | | | | | | | |
Initial Class | | | 151,672 | | | | $2,153,202 | | | | 17,478,710 | | | | $230,319,858 | |
Service Class | | | 157,682 | | | | 2,227,554 | | | | 482,180 | | | | 5,706,383 | |
| | | 309,354 | | | | $4,380,756 | | | | 17,960,890 | | | | $236,026,241 | |
| Shares issued to shareholders in reinvestment of distributions | | | | | | | | | | | | | | | | |
Initial Class | | | — | | | | $— | | | | 69,729 | | | | $875,101 | |
Service Class | | | — | | | | — | | | | 148,265 | | | | 1,839,964 | |
| | | — | | | | $— | | | | 217,994 | | | | $2,715,065 | |
| Shares reacquired | | | | | | | | | | | | | | | | |
Initial Class | | | (1,101,263 | ) | | | $(15,872,787 | ) | | | (1,139,852 | ) | | | $(14,928,327 | ) |
Service Class | | | (596,572 | ) | | | (8,434,496 | ) | | | (2,060,553 | ) | | | (26,241,962 | ) |
| | | (1,697,835 | ) | | | $(24,307,283 | ) | | | (3,200,405 | ) | | | $(41,170,289 | ) |
| Net change | | | | | | | | | | | | | | | | |
Initial Class | | | (949,591 | ) | | | $(13,719,585 | ) | | | 16,408,587 | | | | $216,266,632 | |
Service Class | | | (438,890 | ) | | | (6,206,942 | ) | | | (1,430,108 | ) | | | (18,695,615 | ) |
| | | (1,388,481 | ) | | | $(19,926,527 | ) | | | 14,978,479 | | | | $197,571,017 | |
The fund is one of several mutual funds in which the MFS funds-of-funds may invest. The MFS funds-of-funds do not invest in the underlying MFS funds for the purpose of exercising management or control. At the end of the period, the MFS Moderate Allocation Portfolio, MFS Growth Allocation Portfolio, and the MFS Concervative Allocation Portfolio were the owners of record of approximately 39%, 15%, and 10%, respectively, of the value of outstanding voting shares of the fund.
16
MFS Research International Portfolio
Notes to Financial Statements (unaudited) – continued
The fund and certain other funds managed by MFS participate in a $1.1 billion unsecured committed line of credit, subject to a $1 billion sublimit, provided by a syndication of banks under a credit agreement. Borrowings may be made for temporary financing needs. Interest is charged to each fund, based on its borrowings, generally at a rate equal to the higher of the Federal Reserve funds rate or one month LIBOR plus an agreed upon spread. A commitment fee, based on the average daily, unused portion of the committed line of credit, is allocated among the participating funds at the end of each calendar quarter. In addition, the fund and other funds managed by MFS have established unsecured uncommitted borrowing arrangements with certain banks for temporary financing needs. Interest is charged to each fund, based on its borrowings, at a rate equal to the Federal Reserve funds rate plus an agreed upon spread. For the six months ended June 30, 2013, the fund’s commitment fee and interest expense were $945 and $0, respectively, and are included in “Miscellaneous” expense in the Statement of Operations.
| (7) | | Transactions in Underlying Affiliated Funds – Affiliated Issuers |
An affiliated issuer may be considered one in which the fund owns 5% or more of the outstanding voting securities, or a company which is under common control. For the purposes of this report, the fund assumes the following to be an affiliated issuer:
| | | | | | | | | | | | | | |
| Underlying Affiliated Fund | | Beginning
Shares/Par
Amount | | Acquisitions
Shares/Par
Amount | | | Dispositions
Shares/Par
Amount | | | Ending
Shares/Par
Amount | |
| MFS Institutional Money Market Portfolio | | 1,671 | | | 27,942,511 | | | | (25,071,909 | ) | | | 2,872,273 | |
| | | | |
| Underlying Affiliated Fund | | Realized
Gain (Loss) | | Capital Gain
Distributions | | | Dividend
Income | | | Ending
Value | |
| MFS Institutional Money Market Portfolio | | $— | | | $— | | | | $732 | | | | $2,872,273 | |
17
MFS Research International Portfolio
BOARD REVIEW OF INVESTMENT ADVISORY AGREEMENT
A discussion regarding the Board’s most recent review and renewal of the fund’s Investment Advisory Agreement with MFS will be available on or about November 1, 2013 by clicking on the fund’s name under “Variable Insurance Portfolios — VIT II” in the “Products” section of the MFS Web site (mfs.com).
PROXY VOTING POLICIES AND INFORMATION
A general description of the MFS funds’ proxy voting policies and procedures is available without charge, upon request, by calling 1-800-225-2606, by visiting the Proxy Voting section of mfs.com or by visiting the SEC’s Web site at http://www.sec.gov.
Information regarding how the fund voted proxies relating to portfolio securities during the most recent twelve-month period ended June 30 is available without charge by visiting the Proxy Voting section of mfs.com or by visiting the SEC’s Web site at http://www.sec.gov.
QUARTERLY PORTFOLIO DISCLOSURE
The fund will file a complete schedule of portfolio holdings with the Securities and Exchange Commission (the Commission) for the first and third quarters of each fiscal year on Form N-Q. The fund’s Form N-Q is available on the EDGAR database on the Commission’s Internet Web site at http://www.sec.gov, and may be reviewed and copied at the:
Public Reference Room
Securities and Exchange Commission
100 F Street, NE, Room 1580
Washington, D.C. 20549
Information on the operation of the Public Reference Room may be obtained by calling the Commission at 1-800-SEC-0330. Copies of the fund’s Form N-Q also may be obtained, upon payment of a duplicating fee, by electronic request at the following e-mail address: publicinfo@sec.gov or by writing the Public Reference Section at the above address.
FURTHER INFORMATION
From time to time, MFS may post important information about the fund or the MFS funds on the MFS web site (mfs.com). This information is available by visiting the “News & Commentary” section of mfs.com or by clicking on the fund’s name under “Variable Insurance Portfolios — VIT II” in the “Products” section of mfs.com.
18
SEMIANNUAL REPORT
June 30, 2013

MFS® GLOBAL RESEARCH PORTFOLIO
MFS® Variable Insurance Trust II

RES-SEM
MFS® GLOBAL RESEARCH PORTFOLIO
CONTENTS
The report is prepared for the general information of contract owners. It is authorized for distribution to prospective investors only when preceded or accompanied by a current prospectus.
NOT FDIC INSURED Ÿ MAY LOSE VALUE Ÿ NO BANK OR CREDIT UNION GUARANTEE Ÿ NOT A DEPOSIT Ÿ NOT INSURED BY ANY FEDERAL GOVERNMENT AGENCY OR NCUA/NCUSIF
MFS Global Research Portfolio
LETTER FROM THE CHAIRMAN AND CEO

Dear Contract Owners:
As the year progresses, the global economy continues to grind ahead slowly, held back by broad austerity measures. The U.S. economy remains a steadying force, driven by resilient consumers, who have taken the payroll tax increase and the sequestration’s early impact in stride. With U.S. housing and jobs showing steady expansion, domestic consumer-driven growth has offset weaker exports and the U.S. government’s spending constraints. In response to these developments, the U.S. Federal Reserve has begun to brace investors for an eventual shift in its monetary policy, causing global market tremors.
Japan has been another bright spot, with government and central bank stimulus policies leading to increased exports, a resurgent stock market and improved economic sentiment. After a six-month rally, Japan’s stocks slipped late in the second quarter, then picked up momentum on fresh signs that the country could soon break free of its chronic deflation. The major deterrent to global growth remains the eurozone, still in the grip of persistent recession. China has seen its pace of economic growth decelerate, a troubling turn for the country’s trading partners, who have come to rely on it as an engine for global growth.
As always, managing risk in the face of uncertainty remains a top priority for investors. At MFS®, our uniquely collaborative investment process employs integrated, global research and active risk management. Our global team of investment professionals shares ideas and evaluates opportunities across continents, investment disciplines and asset classes — all with a goal of building better insights, and ultimately better results, for our clients.
We are mindful of the many economic challenges investors face, and believe it is more important than ever to maintain a long-term view and employ time-tested principles, such as asset allocation and diversification. We remain confident that our unique approach can serve investors well as they work with their financial advisors to identify and pursue the most suitable opportunities.
Respectfully,

Robert J. Manning
Chairman and Chief Executive Officer
MFS Investment Management®
August 16, 2013
The opinions expressed in this letter are subject to change, may not be relied upon for investment advice, and no forecasts can be guaranteed.
1
MFS Global Research Portfolio
PORTFOLIO COMPOSITION
Portfolio structure
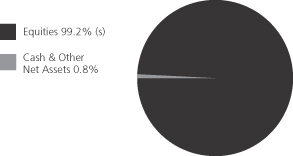
| | | | |
| Top ten holdings | | | | |
| Exxon Mobil Corp. | | | 2.0% | |
| Hewlett-Packard Co. | | | 1.7% | |
| Japan Tobacco, Inc. | | | 1.6% | |
| Groupe Danone | | | 1.6% | |
| Pfizer, Inc. | | | 1.5% | |
| Danaher Corp. | | | 1.5% | |
| Novartis AG | | | 1.4% | |
| Roche Holding AG | | | 1.4% | |
| Google, Inc. | | | 1.3% | |
| Target Corp. | | | 1.2% | |
| |
| Global equity sectors | | | | |
| Financial Services | | | 21.7% | |
| Capital Goods (s) | | | 18.5% | |
| Energy | | | 12.8% | |
| Technology | | | 12.6% | |
| Health Care | | | 10.3% | |
| Consumer Cyclicals | | | 9.6% | |
| Consumer Staples | | | 8.1% | |
| Telecommunications/Cable Television | | | 5.6% | |
| | | | |
| Issuer country weightings (s)(x) | | | | |
| United States | | | 53.9% | |
| Japan | | | 9.5% | |
| United Kingdom | | | 6.5% | |
| Switzerland | | | 5.7% | |
| France | | | 4.5% | |
| Hong Kong | | | 2.5% | |
| Germany | | | 2.3% | |
| Netherlands | | | 2.2% | |
| India | | | 1.7% | |
| Other Countries | | | 11.2% | |
| |
| Currency exposure weightings (s)(y) | | | | |
| United States Dollar | | | 55.7% | |
| Euro | | | 10.8% | |
| Japanese Yen | | | 9.5% | |
| British Pound Sterling | | | 6.5% | |
| Swiss Franc | | | 5.7% | |
| Hong Kong Dollar | | | 3.7% | |
| Indian Rupee | | | 1.7% | |
| Brazilian Real | | | 1.6% | |
| Australian Dollar | | | 0.8% | |
| Other Currencies | | | 4.0% | |
| (s) | Includes securities sold short. |
| (x) | Represents the portfolio’s exposure to issuer countries as a percentage of a portfolio’s net assets. |
| (y) | Represents the portfolio’s exposure to a particular currency as a percentage of a portfolio’s net assets. |
Percentages are based on net assets as of 6/30/13.
The portfolio is actively managed and current holdings may be different.
2
MFS Global Research Portfolio
EXPENSE TABLE
Fund Expenses Borne by the Contract Holders During the Period,
January 1, 2013 through June 30, 2013
As a contract holder of the fund, you incur ongoing costs, including management fees; distribution and/or service (12b-1) fees; and other fund expenses. This example is intended to help you understand your ongoing costs (in dollars) of investing in the fund and to compare these costs with the ongoing costs of investing in other mutual funds.
The example is based on an investment of $1,000 invested at the beginning of the period and held for the entire period January 1, 2013 through June 30, 2013.
Actual Expenses
The first line for each share class in the following table provides information about actual account values and actual expenses. You may use the information in this line, together with the amount you invested, to estimate the expenses that you paid over the period. Simply divide your account value by $1,000 (for example, an $8,600 account value divided by $1,000 = 8.6), then multiply the result by the number in the first line under the heading entitled “Expenses Paid During Period” to estimate the expenses you paid on your account during this period.
Hypothetical Example for Comparison Purposes
The second line for each share class in the following table provides information about hypothetical account values and hypothetical expenses based on the fund’s actual expense ratio and an assumed rate of return of 5% per year before expenses, which is not the fund’s actual return. The hypothetical account values and expenses may not be used to estimate the actual ending account balance or expenses you paid for the period. You may use this information to compare the ongoing costs of investing in the fund and other funds. To do so, compare this 5% hypothetical example with the 5% hypothetical examples that appear in the shareholder reports of the other funds.
Please note that the expenses shown in the table are meant to highlight the fund’s ongoing costs only and do not take into account the fees and expenses imposed under the variable contracts through which your investment in the fund is made. Therefore, the second line for each share class in the table is useful in comparing ongoing costs associated with an investment in vehicles (such as the fund) which fund benefits under variable annuity and variable life insurance contracts and to qualified pension and retirement plans only, and will not help you determine the relative total costs of investing in the fund through variable annuity and variable life insurance contracts. If the fees and expenses imposed under the variable contracts were included, your costs would have been higher.
| | | | | | | | | | | | | | | | | | |
| Share Class | | | | Annualized
Expense Ratio | | | Beginning
Account Value
1/01/13 | | | Ending Account Value
6/30/13 | | | Expenses Paid
During Period (p)
1/01/13-6/30/13 | |
| Initial Class | | Actual | | | 0.93% | | | | $1,000.00 | | | | $1,071.71 | | | | $4.78 | |
| | Hypothetical (h) | | | 0.93% | | | | $1,000.00 | | | | $1,020.18 | | | | $4.66 | |
| Service Class | | Actual | | | 1.18% | | | | $1,000.00 | | | | $1,070.12 | | | | $6.06 | |
| | Hypothetical (h) | | | 1.18% | | | | $1,000.00 | | | | $1,018.94 | | | | $5.91 | |
| (h) | 5% class return per year before expenses. |
| (p) | Expenses paid are equal to each class’s annualized expense ratio, as shown above, multiplied by the average account value over the period, multiplied by the number of days in the period, divided by the number of days in the year. |
3
MFS Global Research Portfolio
PORTFOLIO OF INVESTMENTS – 6/30/13 (unaudited)
The Portfolio of Investments is a complete list of all securities owned by your fund. It is categorized by broad-based asset classes.
| | | | | | | | |
| Issuer | | Shares/Par | | | Value ($) | |
| | | | | | | | |
| COMMON STOCKS – 99.5% | | | | | | | | |
| Aerospace – 2.3% | | | | | |
| Honeywell International, Inc. | | | 13,430 | | | $ | 1,065,536 | |
| Precision Castparts Corp. | | | 4,540 | | | | 1,026,085 | |
| United Technologies Corp. | | | 9,070 | | | | 842,966 | |
| | | | | | | | |
| | | | | | $ | 2,934,587 | |
| | | | | | | | |
| Alcoholic Beverages – 0.9% | | | | | |
| Pernod Ricard S.A. | | | 10,681 | | | $ | 1,184,390 | |
| | | | | | | | |
| Apparel Manufacturers – 2.7% | | | | | |
| Guess?, Inc. | | | 21,560 | | | $ | 669,007 | |
| Li & Fung Ltd. | | | 578,000 | | | | 788,196 | |
| LVMH Moet Hennessy Louis Vuitton S.A. | | | 2,999 | | | | 482,948 | |
| NIKE, Inc., “B” | | | 13,030 | | | | 829,750 | |
| VF Corp. | | | 3,659 | | | | 706,407 | |
| | | | | | | | |
| | | | | | $ | 3,476,308 | |
| | | | | | | | |
| Automotive – 2.7% | | | | | |
| Delphi Automotive PLC | | | 23,810 | | | $ | 1,206,929 | |
| Guangzhou Automobile Group Co. Ltd., “H” | | | 586,000 | | | | 551,358 | |
| Honda Motor Co. Ltd. | | | 30,000 | | | | 1,114,640 | |
| Kia Motors Corp. | | | 11,200 | | | | 605,495 | |
| | | | | | | | |
| | | | | | $ | 3,478,422 | |
| | | | | | | | |
| Biotechnology – 0.6% | | | | | |
| Gilead Sciences, Inc. (a) | | | 16,140 | | | $ | 826,529 | |
| | | | | | | | |
| Broadcasting – 2.0% | | | | | |
| News Corp., “A” | | | 46,450 | | | $ | 1,514,270 | |
| Walt Disney Co. | | | 16,900 | | | | 1,067,235 | |
| | | | | | | | |
| | | | | | $ | 2,581,505 | |
| | | | | | | | |
| Brokerage & Asset Managers – 0.9% | | | | | |
| BlackRock, Inc. | | | 2,380 | | | $ | 611,303 | |
| Franklin Resources, Inc. | | | 3,692 | | | | 502,186 | |
| | | | | | | | |
| | | | | | $ | 1,113,489 | |
| | | | | | | | |
| Business Services – 1.7% | | | | | |
| Accenture PLC, “A” | | | 12,790 | | | $ | 920,368 | |
| Cognizant Technology Solutions Corp., “A” (a) | | | 8,690 | | | | 544,081 | |
| Fidelity National Information Services, Inc. | | | 18,000 | | | | 771,120 | |
| | | | | | | | |
| | | | | | $ | 2,235,569 | |
| | | | | | | | |
| Cable TV – 1.2% | | | | | |
| Comcast Corp., “Special A” | | | 25,240 | | | $ | 1,001,271 | |
| Time Warner Cable, Inc. | | | 4,220 | | | | 474,666 | |
| | | | | | | | |
| | | | | | $ | 1,475,937 | |
| | | | | | | | |
| Chemicals – 0.4% | | | | | |
| Celanese Corp. | | | 9,890 | | | $ | 443,072 | |
| | | | | | | | |
| Computer Software – 2.6% | | | | | |
| Autodesk, Inc. (a) | | | 5,500 | | | $ | 186,670 | |
| CDW Corp. (a) | | | 18,590 | | | | 346,146 | |
| Citrix Systems, Inc. (a) | | | 6,680 | | | | 403,004 | |
| Oracle Corp. | | | 31,060 | | | | 954,163 | |
| | | | | | | | |
| Issuer | | Shares/Par | | | Value ($) | |
| | | | | | | | |
| COMMON STOCKS – continued | |
| Computer Software – continued | | | | | |
| Salesforce.com, Inc. (a) | | | 13,046 | | | $ | 498,096 | |
| Symantec Corp. | | | 24,720 | | | | 555,458 | �� |
| TIBCO Software, Inc. (a) | | | 15,830 | | | | 338,762 | |
| | | | | | | | |
| | | | | | $ | 3,282,299 | |
| | | | | | | | |
| Computer Software – Systems – 3.5% | | | | | |
| Apple, Inc. (s) | | | 3,430 | | | $ | 1,358,554 | |
| EMC Corp. | | | 41,100 | | | | 970,782 | |
| Hewlett-Packard Co. | | | 88,630 | | | | 2,198,024 | |
| | | | | | | | |
| | | | | | $ | 4,527,360 | |
| | | | | | | | |
| Conglomerates – 0.4% | | | | | |
| Hutchison Whampoa Ltd. | | | 54,000 | | | $ | 564,352 | |
| | | | | | | | |
| Construction – 0.8% | | | | | |
| Anhui Conch Cement Co. Ltd. | | | 119,000 | | | $ | 319,157 | |
| Stanley Black & Decker, Inc. | | | 9,670 | | | | 747,491 | |
| | | | | | | | |
| | | | | | $ | 1,066,648 | |
| | | | | | | | |
| Consumer Products – 1.0% | | | | | |
| Procter & Gamble Co. | | | 16,950 | | | $ | 1,304,981 | |
| | | | | | | | |
| Electrical Equipment – 2.7% | | | | | |
| Danaher Corp. (s) | | | 29,550 | | | $ | 1,870,515 | |
| Schneider Electric S.A. | | | 10,833 | | | | 781,009 | |
| Siemens AG | | | 8,593 | | | | 868,521 | |
| | | | | | | | |
| | | | | | $ | 3,520,045 | |
| | | | | | | | |
| Electronics – 2.9% | | | | | |
| Altera Corp. | | | 22,740 | | | $ | 750,193 | |
| JDS Uniphase Corp. (a) | | | 26,640 | | | | 383,083 | |
| Mellanox Technologies Ltd. (a) | | | 8,520 | | | | 421,740 | |
| Microchip Technology, Inc. | | | 27,040 | | | | 1,007,240 | |
| NXP Semiconductors N.V. (a) | | | 16,590 | | | | 513,958 | |
| Taiwan Semiconductor Manufacturing Co. Ltd. | | | 194,000 | | | | 702,086 | |
| | | | | | | | |
| | | | | | $ | 3,778,300 | |
| | | | | | | | |
| Energy – Independent – 4.2% | | | | | |
| Anadarko Petroleum Corp. | | | 9,370 | | | $ | 805,164 | |
| Cabot Oil & Gas Corp. | | | 17,800 | | | | 1,264,156 | |
| Cairn Energy PLC (a) | | | 43,821 | | | | 168,058 | |
| Cenovus Energy, Inc. | | | 15,690 | | | | 447,561 | |
| EOG Resources, Inc. | | | 6,087 | | | | 801,536 | |
| INPEX Corp. | | | 88 | | | | 367,890 | |
| Occidental Petroleum Corp. | | | 9,480 | | | | 845,900 | |
| Oil Search Ltd. | | | 57,840 | | | | 406,144 | |
| Pioneer Natural Resources Co. | | | 2,411 | | | | 348,992 | |
| | | | | | | | |
| | | | | | $ | 5,455,401 | |
| | | | | | | | |
| Energy – Integrated – 4.6% | | | | | |
| BG Group PLC | | | 51,778 | | | $ | 883,695 | |
| BP PLC | | | 138,943 | | | | 963,872 | |
| Exxon Mobil Corp. (s) | | | 28,820 | | | | 2,603,887 | |
| Royal Dutch Shell PLC, “A” | | | 47,351 | | | | 1,511,027 | |
| | | | | | | | |
| | | | | | $ | 5,962,481 | |
| | | | | | | | |
4
MFS Global Research Portfolio
Portfolio of Investments (unaudited) – continued
| | | | | | | | |
| Issuer | | Shares/Par | | | Value ($) | |
| | | | | | | | |
| COMMON STOCKS – continued | |
| Engineering – Construction – 1.6% | | | | | |
| Fluor Corp. | | | 12,470 | | | $ | 739,596 | |
| JGC Corp. | | | 37,000 | | | | 1,331,821 | |
| | | | | | | | |
| | | | | | $ | 2,071,417 | |
| | | | | | | | |
| Food & Beverages – 4.0% | | | | | |
| Groupe Danone | | | 26,808 | | | $ | 2,012,024 | |
| M. Dias Branco S.A. Industria e Comercio de Alimentos | | | 10,300 | | | | 385,439 | |
| Mondelez International, Inc. | | | 38,890 | | | | 1,109,532 | |
| Nestle S.A. | | | 19,711 | | | | 1,289,226 | |
| Want Want China Holdings Ltd. | | | 207,000 | | | | 290,202 | |
| | | | | | | | |
| | | | | | $ | 5,086,423 | |
| | | | | | | | |
| Food & Drug Stores – 1.5% | | | | | |
| CVS Caremark Corp. | | | 16,460 | | | $ | 941,183 | |
| Jeronimo Martins SGPS S.A. | | | 24,503 | | | | 516,369 | |
| Lawson, Inc. | | | 5,500 | | | | 419,792 | |
| | | | | | | | |
| | | | | | $ | 1,877,344 | |
| | | | | | | | |
| Gaming & Lodging – 0.6% | | | | | |
| Sands China Ltd. | | | 163,600 | | | $ | 764,139 | |
| | | | | | | | |
| General Merchandise – 1.2% | | | | | |
| Target Corp. (s) | | | 22,940 | | | $ | 1,579,648 | |
| | | | | | | | |
| Insurance – 4.1% | | | | | |
| ACE Ltd. | | | 8,590 | | | $ | 768,633 | |
| AIA Group Ltd. | | | 258,600 | | | | 1,086,784 | |
| Delta Lloyd N.V. | | | 38,200 | | | | 761,028 | |
| Hiscox Ltd. (a) | | | 88,598 | | | | 769,607 | |
| ING Groep N.V. (a) | | | 77,327 | | | | 706,591 | |
| MetLife, Inc. | | | 24,770 | | | | 1,133,475 | |
| | | | | | | | |
| | | | | | $ | 5,226,118 | |
| | | | | | | | |
| Internet – 1.7% | | | | | | | | |
| eBay, Inc. (a) | | | 10,660 | | | $ | 551,335 | |
| Google, Inc., “A” (a) | | | 1,870 | | | | 1,646,292 | |
| | | | | | | | |
| | | | | | $ | 2,197,627 | |
| | | | | | | | |
| Machinery & Tools – 3.0% | | | | | |
| Atlas Copco AB, “A” | | | 21,362 | | | $ | 513,034 | |
| Eaton Corp. PLC | | | 10,950 | | | | 720,620 | |
| Glory Ltd. | | | 19,000 | | | | 445,594 | |
| Joy Global, Inc. | | | 16,740 | | | | 812,392 | |
| Roper Industries, Inc. | | | 5,668 | | | | 704,079 | |
| Schindler Holding AG | | | 5,061 | | | | 703,935 | |
| Sinotruk Hong Kong Ltd. | | | 8,500 | | | | 4,137 | |
| | | | | | | | |
| | | | | | $ | 3,903,791 | |
| | | | | | | | |
| Major Banks – 7.2% | | | | | |
| Barclays PLC | | | 161,130 | | | $ | 690,724 | |
| BNP Paribas | | | 13,652 | | | | 745,901 | |
| Goldman Sachs Group, Inc. | | | 4,182 | | | | 632,528 | |
| HSBC Holdings PLC | | | 95,703 | | | | 992,715 | |
| JPMorgan Chase & Co. | | | 28,500 | | | | 1,504,515 | |
| Morgan Stanley | | | 39,150 | | | | 956,435 | |
| Standard Chartered PLC | | | 27,515 | | | | 594,044 | |
| | | | | | | | |
| Issuer | | Shares/Par | | | Value ($) | |
| | | | | | | | |
| COMMON STOCKS – continued | |
| Major Banks – continued | | | | | |
| State Street Corp. | | | 11,160 | | | $ | 727,744 | |
| Sumitomo Mitsui Financial Group, Inc. | | | 24,600 | | | | 1,128,554 | |
| Wells Fargo & Co. | | | 30,110 | | | | 1,242,640 | |
| | | | | | | | |
| | | | | | $ | 9,215,800 | |
| | | | | | | | |
| Medical & Health Technology & Services – 0.7% | | | | | |
| Kobayashi Pharmaceutical Co. Ltd. | | | 16,400 | | | $ | 866,369 | |
| | | | | | | | |
| Medical Equipment – 3.0% | | | | | |
| Covidien PLC | | | 17,210 | | | $ | 1,081,476 | |
| Sonova Holding AG | | | 6,188 | | | | 656,437 | |
| St. Jude Medical, Inc. | | | 18,720 | | | | 854,194 | |
| Thermo Fisher Scientific, Inc. | | | 14,120 | | | | 1,194,976 | |
| | | | | | | | |
| | | | | | $ | 3,787,083 | |
| | | | | | | | |
| Metals & Mining – 1.5% | | | | | |
| Iluka Resources Ltd. | | | 58,515 | | | $ | 528,300 | |
| Rio Tinto Ltd. | | | 24,810 | | | | 1,016,876 | |
| Steel Authority of India Ltd. | | | 413,616 | | | | 352,504 | |
| | | | | | | | |
| | | | | | $ | 1,897,680 | |
| | | | | | | | |
| Natural Gas – Distribution – 0.8% | | | | | |
| GDF SUEZ | | | 28,660 | | | $ | 558,821 | |
| Tokyo Gas Co. Ltd. | | | 87,000 | | | | 481,506 | |
| | | | | | | | |
| | | | | | $ | 1,040,327 | |
| | | | | | | | |
| Network & Telecom – 0.2% | | | | | |
| Qualcomm, Inc. | | | 4,140 | | | $ | 252,871 | |
| | | | | | | | |
| Oil Services – 1.2% | | | | | | | | |
| Dresser-Rand Group, Inc. (a) | | | 7,450 | | | $ | 446,851 | |
| Ensco PLC, “A” | | | 8,660 | | | | 503,319 | |
| Schlumberger Ltd. | | | 8,170 | | | | 585,462 | |
| | | | | | | | |
| | | | | | $ | 1,535,632 | |
| | | | | | | | |
| Other Banks & Diversified Financials – 8.5% | | | | | |
| American Express Co. | | | 12,120 | | | $ | 906,091 | |
| DBS Group Holdings Ltd. | | | 65,000 | | | | 791,253 | |
| Discover Financial Services | | | 17,990 | | | | 857,044 | |
| Erste Group Bank AG | | | 29,146 | | | | 776,026 | |
| Federal Bank Ltd. | | | 75,562 | | | | 519,457 | |
| Fifth Third Bancorp | | | 31,070 | | | | 560,814 | |
| Housing Development Finance Corp. Ltd. | | | 46,643 | | | | 686,615 | |
| ICICI Bank Ltd. | | | 35,486 | | | | 639,405 | |
| Itau Unibanco Holding S.A., IPS | | | 42,420 | | | | 546,944 | |
| Kasikornbank PLC, NVDR | | | 104,200 | | | | 634,684 | |
| Sberbank of Russia, ADR | | | 63,916 | | | | 728,003 | |
| Siam Commercial Bank Co. Ltd. | | | 45,800 | | | | 253,993 | |
| UBS AG | | | 61,948 | | | | 1,052,392 | |
| UniCredit S.p.A. | | | 125,403 | | | | 587,304 | |
| Visa, Inc., “A” | | | 7,880 | | | | 1,440,070 | |
| | | | | | | | |
| | | | | | $ | 10,980,095 | |
| | | | | | | | |
| Pharmaceuticals – 6.0% | | | | | |
| Bayer AG | | | 11,177 | | | $ | 1,191,962 | |
| Novartis AG | | | 26,260 | | | | 1,861,031 | |
| Pfizer, Inc. | | | 70,440 | | | | 1,973,024 | |
5
MFS Global Research Portfolio
Portfolio of Investments (unaudited) – continued
| | | | | | | | |
| Issuer | | Shares/Par | | | Value ($) | |
| | | | | | | | |
| COMMON STOCKS – continued | |
| Pharmaceuticals – continued | | | | | |
| Roche Holding AG | | | 7,367 | | | $ | 1,825,427 | |
| Santen Pharmaceutical Co. Ltd. | | | 18,700 | | | | 805,092 | |
| | | | | | | | |
| | | | | | $ | 7,656,536 | |
| | | | | | | | |
| Precious Metals & Minerals – 0.1% | | | | | |
| Newcrest Mining Ltd. | | | 16,385 | | | $ | 147,161 | |
| | | | | | | | |
| Railroad & Shipping – 0.5% | | | | | |
| Union Pacific Corp. | | | 4,123 | | | $ | 636,096 | |
| | | | | | | | |
| Real Estate – 1.0% | | | | | |
| Mitsubishi Estate Co. Ltd. | | | 48,000 | | | $ | 1,278,161 | |
| | | | | | | | |
| Restaurants – 1.1% | | | | | |
| Arcos Dorados Holdings, Inc. | | | 53,990 | | | $ | 630,603 | |
| McDonald’s Corp. | | | 8,439 | | | | 835,461 | |
| | | | | | | | |
| | | | | | $ | 1,466,064 | |
| | | | | | | | |
| Specialty Chemicals – 1.6% | | | | | |
| Akzo Nobel N.V. | | | 15,095 | | | $ | 847,905 | |
| FMC Corp. | | | 5,390 | | | | 329,113 | |
| Linde AG | | | 4,431 | | | | 825,071 | |
| | | | | | | | |
| | | | | | $ | 2,002,089 | |
| | | | | | | | |
| Specialty Stores – 0.5% | | | | | |
| Industria de Diseno Textil S.A. | | | 5,148 | | | $ | 635,513 | |
| | | | | | | | |
| Telecommunications – Wireless – 2.3% | | | | | |
| American Tower Corp., REIT | | | 10,140 | | | $ | 741,944 | |
| KDDI Corp. | | | 21,746 | | | | 1,131,371 | |
| Tele2 AB, “B” | | | 43,314 | | | | 506,789 | |
| TIM Participacoes S.A., ADR | | | 29,570 | | | | 550,002 | |
| | | | | | | | |
| | | | | | $ | 2,930,106 | |
| | | | | | | | |
| Telephone Services – 2.1% | | | | | |
| BT Group PLC | | | 162,880 | | | $ | 762,219 | |
| China Unicom (Hong Kong) Ltd. | | | 278,000 | | | | 365,974 | |
| TDC A.S. | | | 86,303 | | | | 698,197 | |
| Telecom Italia S.p.A. – Ordinary Shares | | | 192,031 | | | | 133,477 | |
| Telecom Italia S.p.A. – Savings Shares | | | 470,405 | | | | 259,935 | |
| Verizon Communications, Inc. | | | 10,440 | | | | 525,550 | |
| | | | | | | | |
| | | | | | $ | 2,745,352 | |
| | | | | | | | |
| Tobacco – 2.2% | | | | | |
| Japan Tobacco, Inc. | | | 59,900 | | | $ | 2,116,853 | |
| Philip Morris International, Inc. | | | 8,350 | | | | 723,277 | |
| | | | | | | | |
| | | | | | $ | 2,840,130 | |
| | | | | | | | |
| | | | | | | | |
| Issuer | | Shares/Par | | | Value ($) | |
| | | | | | | | |
| COMMON STOCKS – continued | |
| Trucking – 1.2% | | | | | |
| Expeditors International of Washington, Inc. | | | 21,330 | | | $ | 810,753 | |
| Yamato Holdings Co. Ltd. | | | 36,800 | | | | 775,850 | |
| | | | | | | | |
| | | | | | $ | 1,586,603 | |
| | | | | | | | |
| Utilities – Electric Power – 2.0% | | | | | |
| CMS Energy Corp. | | | 50,990 | | | $ | 1,385,397 | |
| Edison International | | | 13,560 | | | | 653,050 | |
| Energias do Brasil S.A. | | | 102,000 | | | | 517,920 | |
| | | | | | | | |
| | | | | | $ | 2,556,367 | |
| | | | | | | | |
Total Common Stocks
(Identified Cost, $114,648,946) | | | $ | 127,974,217 | |
| | | | | | | | |
|
| MONEY MARKET FUNDS – 0.2% | |
| MFS Institutional Money Market Portfolio, 0.11%, at Cost and Net Asset Value (v) | | | 281,713 | | | $ | 281,713 | |
| | | | | | | | |
Total Investments
(Identified Cost, $114,930,659) | | | $ | 128,255,930 | |
| | | | | | | | |
|
| SECURITIES SOLD SHORT – (0.3)% | |
| Machinery & Tools – (0.3)% | | | | | |
Manitowoc Co., Inc.
(Proceeds Received, $315,793) | | | (18,250 | ) | | $ | (326,858 | ) |
| | | | | | | | |
OTHER ASSETS, LESS
LIABILITIES – 0.6% | | | | | | | 769,633 | |
| | | | | | | | |
| Net Assets – 100.0% | | | | | | $ | 128,698,705 | |
| | | | | | | | |
| (a) | | Non-income producing security. |
| (s) | | Security or a portion of the security was pledged to cover collateral requirements for securities sold short. |
| (v) | | Underlying affiliated fund that is available only to investment companies managed by MFS. The rate quoted for the MFS Institutional Money Market Portfolio is the annualized seven-day yield of the fund at period end. |
At June 30, 2013, the fund had cash collateral of $1,259 and other liquid securities with an aggregate value of $836,369 to cover any commitments for securities sold short. Cash collateral is comprised of “Deposits with brokers” on the Statement of Assets and Liabilities.
The following abbreviations are used in this report and are defined:
| ADR | | American Depositary Receipt |
| IPS | | International Preference Stock |
| NVDR | | Non-Voting Depositary Receipt |
| PLC | | Public Limited Company |
| REIT | | Real Estate Investment Trust |
See Notes to Financial Statements
6
MFS Global Research Portfolio
FINANCIAL STATEMENTS | STATEMENT OF ASSETS AND LIABILITIES (unaudited)
This statement represents your fund’s balance sheet, which details the assets and liabilities comprising the total value of the fund.
| | | | | | | | |
At 6/30/13 | | | | | | | | |
Assets | | | | | | | | |
Investments – | | | | | | | | |
Non-affiliated issuers, at value (identified cost, $114,648,946) | | | $127,974,217 | | | | | |
Underlying affiliated funds, at cost and value | | | 281,713 | | | | | |
Total investments, at value (identified cost, $114,930,659) | | | $128,255,930 | | | | | |
Foreign currency, at value (identified cost, $32,547) | | | 32,310 | | | | | |
Deposits with brokers | | | 1,259 | | | | | |
Receivables for | | | | | | | | |
Investments sold | | | 1,401,658 | | | | | |
Interest and dividends | | | 218,006 | | | | | |
Other assets | | | 881 | | | | | |
Total assets | | | | | | | $129,910,044 | |
Liabilities | | | | | | | | |
Payables for | | | | | | | | |
Securities sold short, at value (proceeds received, $315,793) | | | $326,858 | | | | | |
Investments purchased | | | 712,679 | | | | | |
Fund shares reacquired | | | 67,267 | | | | | |
Payable to affiliates | | | | | | | | |
Investment adviser | | | 10,803 | | | | | |
Shareholder servicing costs | | | 42 | | | | | |
Distribution and/or service fees | | | 317 | | | | | |
Payable for independent Trustees’ compensation | | | 841 | | | | | |
Deferred country tax expense payable | | | 13,350 | | | | | |
Accrued expenses and other liabilities | | | 79,182 | | | | | |
Total liabilities | | | | | | | $1,211,339 | |
Net assets | | | | | | | $128,698,705 | |
Net assets consist of | | | | | | | | |
Paid-in capital | | | $142,847,826 | | | | | |
Unrealized appreciation (depreciation) on investments and translation of assets and liabilities
in foreign currencies (net of $13,350 deferred country tax) | | | 13,295,918 | | | | | |
Accumulated net realized gain (loss) on investments and foreign currency | | | (30,555,152 | ) | | | | |
Undistributed net investment income | | | 3,110,113 | | | | | |
Net assets | | | | | | | $128,698,705 | |
Shares of beneficial interest outstanding | | | | | | | 5,902,336 | |
| | | | | | | | | | | | |
| | | Net assets | | | Shares
outstanding | | | Net asset value
per share | |
Initial Class | | | $117,108,917 | | | | 5,367,530 | | | | $21.82 | |
Service Class | | | 11,589,788 | | | | 534,806 | | | | 21.67 | |
See Notes to Financial Statements
7
MFS Global Research Portfolio
FINANCIAL STATEMENTS | STATEMENT OF OPERATIONS (unaudited)
This statement describes how much your fund earned in investment income and accrued in expenses. It also describes any gains and/or losses generated by fund operations.
| | | | | | | | |
Six months ended 6/30/13 | | | | | | | | |
Net investment income | | | | | | | | |
Income | | | | | | | | |
Dividends | | | $1,802,695 | | | | | |
Interest | | | 8,509 | | | | | |
Dividends from underlying affiliated funds | | | 474 | | | | | |
Foreign taxes withheld | | | (109,894 | ) | | | | |
Total investment income | | | | | | | $1,701,784 | |
Expenses | | | | | | | | |
Management fee | | | $493,772 | | | | | |
Distribution and/or service fees | | | 15,316 | | | | | |
Shareholder servicing costs | | | 3,156 | | | | | |
Administrative services fee | | | 13,787 | | | | | |
Independent Trustees’ compensation | | | 2,500 | | | | | |
Custodian fee | | | 50,105 | | | | | |
Shareholder communications | | | 6,905 | | | | | |
Audit and tax fees | | | 31,695 | | | | | |
Legal fees | | | 1,111 | | | | | |
Dividend and interest expense on securities sold short | | | 1,404 | | | | | |
Miscellaneous | | | 8,413 | | | | | |
Total expenses | | | | | | | $628,164 | |
Fees paid indirectly | | | (12 | ) | | | | |
Reduction of expenses by investment adviser | | | (430 | ) | | | | |
Net expenses | | | | | | | $627,722 | |
Net investment income | | | | | | | $1,074,062 | |
Realized and unrealized gain (loss) on investments and foreign currency | | | | | | | | |
Realized gain (loss) (identified cost basis) | | | | | | | | |
Investments (net of $25,352 country tax) | | | $9,165,635 | | | | | |
Written options | | | 2,158 | | | | | |
Securities sold short | | | (38,955 | ) | | | | |
Foreign currency | | | (21,336 | ) | | | | |
Net realized gain (loss) on investments and foreign currency | | | | | | | $9,107,502 | |
Change in unrealized appreciation (depreciation) | | | | | | | | |
Investments (net of $34,474 decrease in deferred country tax) | | | $(959,082 | ) | | | | |
Securities sold short | | | (2,349 | ) | | | | |
Translation of assets and liabilities in foreign currencies | | | (5,145 | ) | | | | |
Net unrealized gain (loss) on investments and foreign currency translation | | | | | | | $(966,576 | ) |
Net realized and unrealized gain (loss) on investments and foreign currency | | | | | | | $8,140,926 | |
Change in net assets from operations | | | | | | | $9,214,988 | |
See Notes to Financial Statements
8
MFS Global Research Portfolio
FINANCIAL STATEMENTS | STATEMENTS OF CHANGES IN NET ASSETS
These statements describe the increases and/or decreases in net assets resulting from operations, any distributions, and any shareholder transactions.
| | | | | | | | |
| |
| Six months ended
6/30/13
(unaudited |
) | |
| Year ended
12/31/12 |
|
Change in net assets | | | | | | | | |
| From operations | | | | | | | | |
Net investment income | | | $1,074,062 | | | | $2,059,471 | |
Net realized gain (loss) on investments and foreign currency | | | 9,107,502 | | | | 6,695,105 | |
Net unrealized gain (loss) on investments and foreign currency translation | | | (966,576 | ) | | | 11,893,536 | |
Change in net assets from operations | | | $9,214,988 | | | | $20,648,112 | |
| Distributions declared to shareholders | | | | | | | | |
From net investment income | | | $— | | | | $(2,040,059 | ) |
Change in net assets from fund share transactions | | | $(10,482,153 | ) | | | $(19,027,284 | ) |
Total change in net assets | | | $(1,267,165 | ) | | | $(419,231 | ) |
| Net assets | | | | | | | | |
At beginning of period | | | 129,965,870 | | | | 130,385,101 | |
At end of period (including undistributed net investment income of $3,110,113 and
$2,036,051, respectively) | | | $128,698,705 | | | | $129,965,870 | |
See Notes to Financial Statements
9
MFS Global Research Portfolio
FINANCIAL STATEMENTS | FINANCIAL HIGHLIGHTS
The financial highlights table is intended to help you understand the fund’s financial performance for the semiannual period and the past 5 fiscal years .
Certain information reflects financial results for a single fund share. The total returns in the table represent the rate by which an investor would have earned (or lost) on an investment in the fund share class (assuming reinvestment of all distributions) held for the entire period.
| | | | | | | | | | | | | | | | | | | | | | | | |
| Initial Class | | Six months
ended 6/30/13 | | | Years ended 12/31 | |
| | | | 2012 | | | 2011 | | | 2010 | | | 2009 | | | 2008 | |
| | | (unaudited) | | | | | | | | | | | | | | | | |
Net asset value, beginning of period | | | $20.36 | | | | $17.71 | | | | $19.23 | | | | $17.29 | | | | $13.30 | | | | $21.04 | |
| Income (loss) from investment operations | | | | | | | | | | | | | | | | | | | | | | | | |
Net investment income (d) | | | $0.18 | | | | $0.30 | | | | $0.27 | | | | $0.20 | | | | $0.20 | | | | $0.19 | |
Net realized and unrealized gain (loss) on investments
and foreign currency | | | 1.28 | | | | 2.66 | | | | (1.56 | ) | | | 1.97 | | | | 4.03 | | | | (7.81 | ) |
Total from investment operations | | | $1.46 | | | | $2.96 | | | | $(1.29 | ) | | | $2.17 | | | | $4.23 | | | | $(7.62 | ) |
| Less distributions declared to shareholders | | | | | | | | | | | | | | | | | | | | | | | | |
From net investment income | | | $— | | | | $(0.31 | ) | | | $(0.23 | ) | | | $(0.23 | ) | | | $(0.24 | ) | | | $(0.12 | ) |
Net asset value, end of period (x) | | | $21.82 | | | | $20.36 | | | | $17.71 | | | | $19.23 | | | | $17.29 | | | | $13.30 | |
Total return (%) (k)(s)(x) | | | 7.17 | (n) | | | 16.81 | | | | (6.73 | ) | | | 12.66 | | | | 32.44 | | | | (36.43 | ) |
Ratios (%) (to average net assets)
and Supplemental data: | | | | | | | | | | | | | | | | | | | | | | | | |
Expenses before expense reductions (f) | | | 0.93 | (a) | | | 0.94 | | | | 0.97 | | | | 0.97 | | | | 0.98 | | | | 0.87 | |
Expenses after expense reductions (f) | | | 0.93 | (a) | | | 0.94 | | | | N/A | | | | N/A | | | | N/A | | | | N/A | |
Net investment income | | | 1.66 | (a) | | | 1.58 | | | | 1.38 | | | | 1.18 | | | | 1.42 | | | | 1.06 | |
Portfolio turnover | | | 26 | (n) | | | 40 | | | | 54 | | | | 59 | | | | 63 | | | | 144 | |
Net assets at end of period (000 omitted) | | | $117,109 | | | | $117,388 | | | | $117,312 | | | | $144,156 | | | | $149,758 | | | | $134,672 | |
| Supplemental Ratios (%): | | | | | | | | | | | | | | | | | | | | | | | | |
Ratio of expenses to average net assets after expense
reductions excluding short sale dividend and
interest expense (f) | | | 0.93 | (a) | | | 0.93 | | | | 0.96 | | | | 0.96 | | | | 0.98 | | | | N/A | |
| Service Class | | Six months
ended
6/30/13 | | | Years ended 12/31 | |
| | | | 2012 | | | 2011 | | | 2010 | | | 2009 | | | 2008 | |
| | | (unaudited) | | | | | | | | | | | | | | | | |
Net asset value, beginning of period | | | $20.25 | | | | $17.60 | | | | $19.11 | | | | $17.18 | | | | $13.21 | | | | $20.89 | |
| Income (loss) from investment operations | | | | | | | | | | | | | | | | | | | | | | | | |
Net investment income (d) | | | $0.15 | | | | $0.26 | | | | $0.22 | | | | $0.16 | | | | $0.17 | | | | $0.14 | |
Net realized and unrealized gain (loss) on investments
and foreign currency | | | 1.27 | | | | 2.64 | | | | (1.55 | ) | | | 1.96 | | | | 3.99 | | | | (7.76 | ) |
Total from investment operations | | | $1.42 | | | | $2.90 | | | | $(1.33 | ) | | | $2.12 | | | | $4.16 | | | | $(7.62 | ) |
| Less distributions declared to shareholders | | | | | | | | | | | | | | | | | | | | | | | | |
From net investment income | | | $— | | | | $(0.25 | ) | | | $(0.18 | ) | | | $(0.19 | ) | | | $(0.19 | ) | | | $(0.06 | ) |
Net asset value, end of period (x) | | | $21.67 | | | | $20.25 | | | | $17.60 | | | | $19.11 | | | | $17.18 | | | | $13.21 | |
Total return (%) (k)(s)(x) | | | 7.01 | (n) | | | 16.57 | | | | (7.00 | ) | | | 12.42 | | | | 32.03 | | | | (36.57 | ) |
Ratios (%) (to average net assets)
and Supplemental data: | | | | | | | | | | | | | | | | | | | | | | | | |
Expenses before expense reductions (f) | | | 1.18 | (a) | | | 1.19 | | | | 1.22 | | | | 1.22 | | | | 1.23 | | | | 1.12 | |
Expenses after expense reductions (f) | | | 1.18 | (a) | | | 1.19 | | | | N/A | | | | N/A | | | | N/A | | | | N/A | |
Net investment income | | | 1.38 | (a) | | | 1.35 | | | | 1.13 | | | | 0.93 | | | | 1.21 | | | | 0.81 | |
Portfolio turnover | | | 26 | (n) | | | 40 | | | | 54 | | | | 59 | | | | 63 | | | | 144 | |
Net assets at end of period (000 omitted) | | | $11,590 | | | | $12,578 | | | | $13,073 | | | | $17,036 | | | | $17,901 | | | | $18,199 | |
| Supplemental Ratios (%): | | | | | | | | | | | | | | | | | | | | | | | | |
Ratio of expenses to average net assets after expense
reductions excluding short sale dividend and
interest expense (f) | | | 1.18 | (a) | | | 1.18 | | | | 1.21 | | | | 1.21 | | | | 1.23 | | | | N/A | |
See Notes to Financial Statements
10
MFS Global Research Portfolio
Financial Highlights – continued
| (d) | Per share data is based on average shares outstanding. |
| (f) | Ratios do not reflect reductions from fees paid indirectly, if applicable. |
| (k) | The total return does not reflect expenses that apply to separate accounts. Inclusion of these charges would reduce the total return figures for all periods shown. |
| (r) | Certain expenses have been reduced without which performance would have been lower. |
| (s) | From time to time the fund may receive proceeds from litigation settlements, without which performance would be lower. Excluding the effect of the proceeds received from a non-recurring litigation settlement against Enron Corp., the Initial Class and Service Class total returns for the year ended December 31, 2008 would have each been lower by approximately 0.86%. Excluding the effect of the proceeds received from a non-recurring litigation settlement against Tyco International Ltd., the Initial Class and Service Class total returns for the year ended December 31, 2010 would have been lower by approximately 0.71% and 0.70%, respectively. |
| (x) | The net asset values per share and total returns have been calculated on net assets which include adjustments made in accordance with U.S. generally accepted accounting principles required at period end for financial reporting purposes. |
See Notes to Financial Statements
11
MFS Global Research Portfolio
NOTES TO FINANCIAL STATEMENTS (unaudited)
| (1) | | Business and Organization |
MFS Global Research Portfolio (the fund) is a series of MFS Variable Insurance Trust II (the trust). The trust is organized as a Massachusetts business trust and is registered under the Investment Company Act of 1940, as amended, as an open-end management investment company. The shareholders of each series of the trust are separate accounts of insurance companies, which offer variable annuity and/or life insurance products, and qualified retirement and pension plans.
| (2) | | Significant Accounting Policies |
General – The preparation of financial statements in conformity with U.S. generally accepted accounting principles requires management to make estimates and assumptions that affect the reported amounts of assets and liabilities, and disclosure of contingent assets and liabilities at the date of the financial statements and the reported amounts of revenues and expenses during the reporting period. Actual results could differ from those estimates. In the preparation of these financial statements, management has evaluated subsequent events occurring after the date of the fund’s Statement of Assets and Liabilities through the date that the financial statements were issued. The fund invests in foreign securities. Investments in foreign securities are vulnerable to the effects of changes in the relative values of the local currency and the U.S. dollar and to the effects of changes in each country’s legal, political, and economic environment.
In this reporting period, the fund adopted the disclosure provisions of the Financial Accounting Standards Board (FASB) Accounting Standards Update 2011-11 (“ASU 2011-11”), Balance Sheet (Topic 210) – Disclosures about Offsetting Assets and Liabilities along with the related scope clarification provisions of FASB Accounting Standards Update 2013-01 (“ASU 2013-01”) entitled Balance Sheet (Topic 210) – Clarifying the Scope of Disclosures about Offsetting Assets and Liabilities. ASU 2011-11 is intended to enhance disclosures on the offsetting of financial assets and liabilities by requiring entities to disclose both gross and net information about financial instruments and transactions that are either offset in the statement of financial position or subject to a Master Netting Agreement or similar arrangement. ASU 2013-01 limits the scope of ASU 2011-11’s disclosure requirements on offsetting to financial assets and financial liabilities related to derivatives, repurchase and reverse repurchase agreements, and securities lending and securities borrowing transactions. The disclosures required by ASU 2011-11, to the extent applicable to the fund, have been included in the fund’s Significant Accounting Policies note under the captions for each of the fund’s in-scope financial instruments and transactions.
In June 2013, FASB issued Accounting Standards Update 2013-08 Financial Services – Investment Companies (Topic 946) – Amendments to the Scope, Measurement, and Disclosure Requirements (“ASU 2013-08”) which is effective for interim and annual reporting periods in fiscal years that begin after December 15, 2013. ASU 2013-08 sets forth a methodology for determining whether an entity should be characterized as an investment company and prescribes fair value accounting for an investment company’s non-controlling ownership interest in another investment company. FASB has determined that a fund registered under the Investment Company Act of 1940 automatically meets ASU 2013-08’s criteria for an investment company. Although still evaluating the potential impacts of ASU 2013-08 to the fund, management expects that the impact of the fund’s adoption will be limited to additional financial statement disclosures.
Investment Valuations – Equity securities, including restricted equity securities, are generally valued at the last sale or official closing price as provided by a third-party pricing service on the market or exchange on which they are primarily traded. Equity securities, for which there were no sales reported that day, are generally valued at the last quoted daily bid quotation as provided by a third-party pricing service on the market or exchange on which such securities are primarily traded. Equity securities held short, for which there were no sales reported for that day, are generally valued at the last quoted daily ask quotation as provided by a third-party pricing service on the market or exchange on which such securities are primarily traded. Short-term instruments with a maturity at issuance of 60 days or less generally are valued at amortized cost, which approximates market value. Exchange-traded options are generally valued at the last sale or official closing price as provided by a third-party pricing service on the exchange on which such options are primarily traded. Exchange-traded options for which there were no sales reported that day are generally valued at the last daily bid quotation as provided by a third-party pricing service on the exchange on which such options are primarily traded. Options not traded on an exchange are generally valued at a broker/dealer bid quotation. Foreign currency options are generally valued at valuations provided by a third-party pricing service. Open-end investment companies are generally valued at net asset value per share. Securities and other assets generally valued on the basis of information from a third-party pricing service may also be valued at a broker/dealer bid quotation. Values obtained from third-party pricing services can utilize both transaction data and market information such as yield, quality, coupon rate, maturity, type of issue, trading characteristics, and other market data. The values of foreign securities and other assets and liabilities expressed in foreign currencies are converted to U.S. dollars using the mean of bid and asked prices for rates provided by a third-party pricing service.
The Board of Trustees has delegated primary responsibility for determining or causing to be determined the value of the fund’s investments (including any fair valuation) to the adviser pursuant to valuation policies and procedures approved by the Board. If the adviser determines that reliable market quotations are not readily available, investments are valued at fair value as determined in good faith by the adviser in accordance with such procedures under the oversight of the Board of Trustees. Under the fund’s valuation policies and procedures, market quotations are not considered to be readily available for most types of debt instruments
12
MFS Global Research Portfolio
Notes to Financial Statements (unaudited) – continued
and floating rate loans and many types of derivatives. These investments are generally valued at fair value based on information from third-party pricing services. In addition, investments may be valued at fair value if the adviser determines that an investment’s value has been materially affected by events occurring after the close of the exchange or market on which the investment is principally traded (such as foreign exchange or market) and prior to the determination of the fund’s net asset value, or after the halting of trading of a specific security where trading does not resume prior to the close of the exchange or market on which the security is principally traded. Events that occur on a frequent basis after foreign markets close (such as developments in foreign markets and significant movements in the U.S. markets) and prior to the determination of the fund’s net asset value may be deemed to have a material effect on the value of securities traded in foreign markets. Accordingly, the fund’s foreign equity securities may often be valued at fair value. The adviser generally relies on third-party pricing services or other information (such as the correlation with price movements of similar securities in the same or other markets; the type, cost and investment characteristics of the security; the business and financial condition of the issuer; and trading and other market data) to assist in determining whether to fair value and at what value to fair value an investment. The value of an investment for purposes of calculating the fund’s net asset value can differ depending on the source and method used to determine value. When fair valuation is used, the value of an investment used to determine the fund’s net asset value may differ from quoted or published prices for the same investment. There can be no assurance that the fund could obtain the fair value assigned to an investment if it were to sell the investment at the same time at which the fund determines its net asset value per share.
Various inputs are used in determining the value of the fund’s assets or liabilities. These inputs are categorized into three broad levels. In certain cases, the inputs used to measure fair value may fall into different levels of the fair value hierarchy. In such cases, an investment’s level within the fair value hierarchy is based on the lowest level of input that is significant to the fair value measurement. The fund’s assessment of the significance of a particular input to the fair value measurement in its entirety requires judgment, and considers factors specific to the investment. Level 1 includes unadjusted quoted prices in active markets for identical assets or liabilities. Level 2 includes other significant observable market-based inputs (including quoted prices for similar securities, interest rates, prepayment speed, and credit risk). Level 3 includes unobservable inputs, which may include the adviser’s own assumptions in determining the fair value of investments. The following is a summary of the levels used as of June 30, 2013 in valuing the fund’s assets or liabilities:
| | | | | | | | | | | | | | | | |
| Investments at Value | | Level 1 | | | Level 2 | | | Level 3 | | | Total | |
| Equity Securities: | | | | | | | | | | | | | | | | |
United States | | | $68,633,059 | | | | $— | | | | $— | | | | $68,633,059 | |
Japan | | | 10,547,728 | | | | 1,715,765 | | | | — | | | | 12,263,493 | |
United Kingdom | | | 992,715 | | | | 7,360,122 | | | | — | | | | 8,352,837 | |
Switzerland | | | 656,437 | | | | 6,732,011 | | | | — | | | | 7,388,448 | |
France | | | 3,942,314 | | | | 1,822,779 | | | | — | | | | 5,765,093 | |
Hong Kong | | | — | | | | 3,203,471 | | | | — | | | | 3,203,471 | |
Germany | | | 2,060,483 | | | | 825,071 | | | | — | | | | 2,885,554 | |
Netherlands | | | 513,958 | | | | 2,315,523 | | | | — | | | | 2,829,481 | |
India | | | 639,405 | | | | 1,558,576 | | | | — | | | | 2,197,981 | |
Other Countries | | | 6,100,875 | | | | 8,353,925 | | | | — | | | | 14,454,800 | |
| Mutual Funds | | | 281,713 | | | | — | | | | — | | | | 281,713 | |
| Total Investments | | | $94,368,687 | | | | $33,887,243 | | | | $— | | | | $128,255,930 | |
| Short Sales | | | $(326,858 | ) | | | $— | | | | $— | | | | $(326,858 | ) |
For further information regarding security characteristics, see the Portfolio of Investments.
Of the level 2 investments presented above, equity investments amounting to $2,102,040 would have been considered level 1 investments at the beginning of the period. Of the level 1 investments presented above, equity investments amounting to $12,777,029 would have been considered level 2 investments at the beginning of the period. The primary reason for changes in the classifications between levels 1 and 2 occurs when foreign equity securities are fair valued using other observable market-based inputs in place of the closing exchange price due to events occurring after the close of the exchange or market on which the investment is principally traded. The fund’s foreign equity securities may often be valued at fair value. The fund’s policy is to recognize transfers between the levels as of the end of the period.
Foreign Currency Translation – Purchases and sales of foreign investments, income, and expenses are converted into U.S. dollars based upon currency exchange rates prevailing on the respective dates of such transactions or on the reporting date for foreign denominated receivables and payables. Gains and losses attributable to foreign currency exchange rates on sales of securities are recorded for financial statement purposes as net realized gains and losses on investments. Gains and losses attributable to foreign exchange rate movements on receivables, payables, income and expenses are recorded for financial statement purposes as foreign currency transaction gains and losses. That portion of both realized and unrealized gains and losses on investments that results from fluctuations in foreign currency exchange rates is not separately disclosed.
13
MFS Global Research Portfolio
Notes to Financial Statements (unaudited) – continued
Derivatives – The fund uses derivatives for different purposes, primarily to increase or decrease exposure to a particular market or segment of the market, or security, to increase or decrease interest rate or currency exposure, or as alternatives to direct investments. Derivatives are used for hedging or non-hedging purposes. While hedging can reduce or eliminate losses, it can also reduce or eliminate gains. When the fund uses derivatives as an investment to increase market exposure, or for hedging purposes, gains and losses from derivative instruments may be substantially greater than the derivative’s original cost.
The derivative instruments used by the fund were written options and purchased options. At June 30, 2013, the fund did not have any outstanding derivative instruments.
The following table presents, by major type of derivative contract, the realized gain (loss) on derivatives held by the fund for the six months ended June 30, 2013 as reported in the Statement of Operations:
| | | | |
| Risk | | Written Options | |
| Equity | | | $2,158 | |
There is no change in unrealized gain (loss) from derivative transactions at period end.
Derivative counterparty credit risk is managed through formal evaluation of the creditworthiness of all potential counterparties. On certain, but not all, over-the-counter derivatives, the fund attempts to reduce its exposure to counterparty credit risk whenever possible by entering into an International Swaps and Derivatives Association (ISDA) Master Agreement on a bilateral basis with each of the counterparties with whom it undertakes a significant volume of transactions. The ISDA Master Agreement gives each party to the agreement the right to terminate all transactions traded under such agreement if there is a certain deterioration in the credit quality of the other party. Upon an event of default or a termination of the ISDA Master Agreement, the non-defaulting party has the right to close out all transactions traded under such agreement and to net amounts owed under each transaction to one net amount payable by one party to the other. This right to close out and net payments across all transactions traded under the ISDA Master Agreement could result in a reduction of the fund’s credit risk to such counterparty equal to any amounts payable by the fund under the applicable transactions, if any.
Collateral and margin requirements differ by type of derivative. Margin requirements are set by the broker or clearing house for cleared derivatives (i.e., futures contracts, cleared swaps and exchange-traded options) while collateral terms are contract specific for over-the-counter traded derivatives (i.e., forward foreign currency exchange contracts, uncleared swaps agreements, and over-the-counter options). For derivatives traded under an ISDA Master Agreement, the collateral requirements are netted across all transactions traded under such agreement and one amount is posted from one party to the other to collateralize such obligations. Cash that has been segregated to cover the fund’s collateral or margin obligations under derivative contracts, if any, will be reported separately on the Statement of Assets and Liabilities as “Deposits with brokers.” Securities pledged as collateral or margin for the same purpose, if any, is noted in the Portfolio of Investments.
The fund’s accounting policy with respect to balance sheet offsetting is that, absent an event of default by the counterparty or a termination of the agreement, the ISDA Master Agreement does not result in an offset of reported amounts of financial assets and financial liabilities in the Statement of Assets and Liabilities across transactions between the fund and the applicable counterparty.
Written Options – In exchange for a premium, the fund wrote call options on securities that it anticipated the price would decline. At the time the option was written, the fund believed the premium received exceeded the potential loss that could result from adverse price changes in the options’ underlying securities. In a written option, the fund as the option writer grants the buyer the right to purchase from, or sell to, the fund a specified number of shares or units of a particular security, currency or index at a specified price within a specified period of time.
The premium received is initially recorded as a liability in the Statement of Assets and Liabilities. The option is subsequently marked-to-market daily with the difference between the premium received and the market value of the written option being recorded as unrealized appreciation or depreciation. When a written option expires, the fund realizes a gain equal to the amount of the premium received. The difference between the premium received and the amount paid on effecting a closing transaction is considered a realized gain or loss. When a written call option is exercised, the premium received is offset against the proceeds to determine the realized gain or loss.
At the initiation of the written option contract, for exchange traded options, the fund is required to deposit securities or cash as collateral with the custodian for the benefit of the broker. For over-the-counter options, the fund may post collateral subject to the terms of an ISDA Master Agreement as generally described above if the market value of the options contract moves against it. The fund, as writer of an option, may have no control over whether the underlying securities may be sold (call) or purchased (put) and, as a result, bears the market risk of an unfavorable change in the price of the securities underlying the written option. Losses from writing options can exceed the premium received and can exceed the potential loss from an ordinary buy and sell transaction.
14
MFS Global Research Portfolio
Notes to Financial Statements (unaudited) – continued
Although the fund’s market risk may be significant, the maximum counterparty credit risk to the fund is equal to the market value of any collateral posted to the broker. For over-the-counter options, this risk is mitigated in cases where there is an ISDA Master Agreement between the fund and the counterparty providing for netting as described above.
The following table represents the written option activity in the fund during the six months ended June 30, 2013:
| | | | | | | | |
| | | Number of
contracts | | | Premiums
received | |
| Outstanding, beginning of period | | | — | | | | $— | |
| Options written | | | 155 | | | | 4,276 | |
| Options exercised | | | (51 | ) | | | (2,118 | ) |
| Options expired | | | (104 | ) | | | (2,158 | ) |
| Outstanding, end of period | | | — | | | | $— | |
Short Sales – The fund entered into short sales whereby it sells a security it does not own in anticipation of a decline in the value of that security. The fund will realize a gain if the security price decreases and a loss if the security price increases between the date of the short sale and the date on which the fund replaces the borrowed security. Losses from short sales can exceed the proceeds of the security sold; and they can also exceed the potential loss from an ordinary buy and sell transaction. The amount of any premium, dividends, or interest the fund may be required to pay in connection with a short sale will be recognized as a fund expense. During the six months ended June 30, 2013, this expense amounted to $1,404. The fund segregates cash or marketable securities in an amount that, when combined with the amount of proceeds from the short sale deposited with the broker, at least equals the current market value of the security sold short.
Security Loans – Under its Securities Lending Agency Agreement with the fund, State Street Bank and Trust Company (“State Street”), as lending agent, loans the securities of the fund to certain qualified institutions (the “Borrowers”) approved by the fund. The loans are collateralized by cash and/or U.S. Treasury and federal agency obligations in an amount typically at least equal to the market value of the securities loaned. The market value of the loaned securities is determined at the close of business of the fund and any additional required collateral is delivered to the fund on the next business day. State Street provides the fund with indemnification against Borrower default. In the event of Borrower default, State Street will for the benefit of the fund either purchase securities identical to those loaned or, when such purchase is commercially impracticable, pay the fund the market value of the loaned securities. In return, State Street assumes the fund’s rights to the related collateral. If the collateral value is less than the cost to purchase identical securities, State Street is responsible for the shortfall, but only to the extent that such shortfall is not due to a decline in collateral value resulting from collateral reinvestment for which the fund bears the risk of loss. On loans collateralized by cash, the cash collateral is invested in a money market fund or short-term securities. A portion of the income generated upon investment of the collateral is remitted to the Borrowers, and the remainder is allocated between the fund and the lending agent. On loans collateralized by U.S. Treasury and/or federal agency obligations, a fee is received from the Borrower, and is allocated between the fund and the lending agent. Income from securities lending is included in “Interest” income in the Statement of Operations. The dividend and interest income earned on the securities loaned is accounted for in the same manner as other dividend and interest income. At June 30, 2013, there were no securities on loan or collateral outstanding.
Indemnifications – Under the fund’s organizational documents, its officers and Trustees may be indemnified against certain liabilities and expenses arising out of the performance of their duties to the fund. Additionally, in the normal course of business, the fund enters into agreements with service providers that may contain indemnification clauses. The fund’s maximum exposure under these agreements is unknown as this would involve future claims that may be made against the fund that have not yet occurred.
Investment Transactions and Income – Investment transactions are recorded on the trade date. Interest income is recorded on the accrual basis. Dividends received in cash are recorded on the ex-dividend date. Certain dividends from foreign securities will be recorded when the fund is informed of the dividend if such information is obtained subsequent to the ex-dividend date. Dividend and interest payments received in additional securities are recorded on the ex-dividend or ex-interest date in an amount equal to the value of the security on such date.
The fund may receive proceeds from litigation settlements. Any proceeds received from litigation involving portfolio holdings are reflected in the Statement of Operations in realized gain/loss if the security has been disposed of by the fund or in unrealized gain/loss if the security is still held by the fund. Any other proceeds from litigation not related to portfolio holdings are reflected as other income in the Statement of Operations.
Fees Paid Indirectly – The fund’s custody fee may be reduced according to an arrangement that measures the value of cash deposited with the custodian by the fund. This amount, for the six months ended June 30, 2013, is shown as a reduction of total expenses in the Statement of Operations.
Tax Matters and Distributions – The fund intends to qualify as a regulated investment company, as defined under Subchapter M of the Internal Revenue Code, and to distribute all of its taxable income, including realized capital gains. As a result, no provision for
15
MFS Global Research Portfolio
Notes to Financial Statements (unaudited) – continued
federal income tax is required. The fund’s federal tax returns, when filed, will remain subject to examination by the Internal Revenue Service for a three year period. Foreign taxes have been accrued by the fund in the accompanying financial statements in accordance with the applicable foreign tax law. Foreign income taxes may be withheld by certain countries in which the fund invests. Additionally, capital gains realized by the fund on securities issued in or by certain foreign countries may be subject to capital gains tax imposed by those countries.
Distributions to shareholders are recorded on the ex-dividend date. Income and capital gain distributions are determined in accordance with income tax regulations, which may differ from U.S. generally accepted accounting principles. Certain capital accounts in the financial statements are periodically adjusted for permanent differences in order to reflect their tax character. These adjustments have no impact on net assets or net asset value per share. Temporary differences which arise from recognizing certain items of income, expense, gain or loss in different periods for financial statement and tax purposes will reverse at some time in the future. Distributions in excess of net investment income or net realized gains are temporary overdistributions for financial statement purposes resulting from differences in the recognition or classification of income or distributions for financial statement and tax purposes.
Book/tax differences primarily relate to wash sale loss deferrals and straddle loss deferrals.
The tax character of distributions declared to shareholders for the last fiscal year is as follows:
| | | | |
| | | 12/31/12 | |
| Ordinary income (including any short-term capital gains) | | | $2,040,059 | |
The federal tax cost and the tax basis components of distributable earnings were as follows:
| | | | |
| As of 6/30/13 | | | | |
| Cost of investments | | | $115,019,783 | |
| Gross appreciation | | | 20,675,052 | |
| Gross depreciation | | | (7,438,905 | ) |
| Net unrealized appreciation (depreciation) | | | $13,236,147 | |
| |
| As of 12/31/12 | | | | |
| Undistributed ordinary income | | | 2,036,051 | |
| Capital loss carryforwards | | | (39,522,841 | ) |
| Other temporary differences | | | (107,022 | ) |
| Net unrealized appreciation (depreciation) | | | 14,229,703 | |
The aggregate cost above includes prior fiscal year end tax adjustments, if applicable.
Under the Regulated Investment Company Modernization Act of 2010 (the “Act”), net capital losses recognized for fund fiscal years beginning after December 31, 2010 may be carried forward indefinitely, and their character is retained as short-term and/or long-term losses (“post-enactment losses”). Previously, net capital losses were carried forward for eight years and treated as short-term losses (“pre-enactment losses”). As a transition rule, the Act requires that all post-enactment net capital losses be used before pre-enactment net capital losses.
As of December 31, 2012, the fund had capital loss carryforwards available to offset future realized gains. Such pre-enactment losses expire as follows:
| | | | |
| 12/31/16 | | | $(20,801,086 | ) |
| 12/31/17 | | | (18,721,755 | ) |
| Total | | | $(39,522,841 | ) |
Multiple Classes of Shares of Beneficial Interest – The fund offers multiple classes of shares, which differ in their respective distribution and/or service fees. The fund’s income, realized and unrealized gain (loss), and common expenses are allocated to shareholders based on the daily net assets of each class. Dividends are declared separately for each class. Differences in per share dividend rates are generally due to differences in separate class expenses. The fund’s distributions declared to shareholders as reported in the Statements of Changes in Net Assets are presented by class as follows:
| | | | | | | | |
| | | From net investment
income | |
| | | Six months ended
6/30/13 | | | Year ended
12/31/12 | |
| Initial Class | | | $— | | | | $1,870,542 | |
| Service Class | | | — | | | | 169,517 | |
| Total | | | $— | | | | $2,040,059 | |
16
MFS Global Research Portfolio
Notes to Financial Statements (unaudited) – continued
| (3) | | Transactions with Affiliates |
Investment Adviser – The fund has an investment advisory agreement with MFS to provide overall investment management and related administrative services and facilities to the fund. The management fee is computed daily and paid monthly at the following annual rates:
| | | | |
| First $300 million of average daily net assets | | | 0.75% | |
| Average daily net assets in excess of $300 million | | | 0.675% | |
Effective April 1, 2013, MFS has agreed in writing to reduce its management fee by a specified amount if certain MFS mutual fund assets exceed thresholds agreed to by MFS and the fund’s Board of Trustees. For the period April 1, 2013 through June 30, 2013, this management fee reduction amounted to $179, which is shown as a reduction of total expenses in the Statement of Operations. The management fee incurred for the six months ended June 30, 2013 was equivalent to an annual effective rate of 0.75% of the fund’s average daily net assets.
Distributor – MFS Fund Distributors, Inc. (MFD), a wholly-owned subsidiary of MFS, is the distributor of shares of the fund. The Trustees have adopted a distribution plan for the Service Class shares pursuant to Rule 12b-1 under the Investment Company Act of 1940.
The fund’s distribution plan provides that the fund will pay MFD distribution and/or service fees equal to 0.25% per annum of its average daily net assets attributable to Service Class shares as partial consideration for services performed and expenses incurred by MFD and financial intermediaries (including participating insurance companies that invest in the fund to fund variable annuity and variable life insurance contracts, sponsors of qualified retirement and pension plans that invest in the fund, and affiliates of these participating insurance companies and plan sponsors) in connection with the sale and distribution of the Service Class shares. MFD may subsequently pay all, or a portion, of the distribution and/or service fees to financial intermediaries.
Shareholder Servicing Agent – MFS Service Center, Inc. (MFSC), a wholly-owned subsidiary of MFS, receives a fee from the fund for its services as shareholder servicing agent. For the six months ended June 30, 2013, the fee was $3,154, which equated to 0.0048% annually of the fund’s average daily net assets. MFSC also receives payment from the fund for out-of-pocket expenses paid by MFSC on behalf of the fund. For the six months ended June 30, 2013, these costs amounted to $2.
Administrator – MFS provides certain financial, legal, shareholder communications, compliance, and other administrative services to the fund. Under an administrative services agreement, the fund partially reimburses MFS the costs incurred to provide these services. The fund is charged an annual fixed amount of $17,500 plus a fee based on average daily net assets. The administrative services fee incurred for the six months ended June 30, 2013 was equivalent to an annual effective rate of 0.0209% of the fund’s average daily net assets.
Trustees’ and Officers’ Compensation – The fund pays compensation to independent Trustees in the form of a retainer, attendance fees, and additional compensation to Board and Committee chairpersons. The fund does not pay compensation directly to Trustees or officers of the fund who are also officers of the investment adviser, all of whom receive remuneration for their services to the fund from MFS. Certain officers and Trustees of the fund are officers or directors of MFS, MFD, and MFSC.
Other – This fund and certain other funds managed by MFS (the funds) have entered into services agreements (the Agreements) which provide for payment of fees by the funds to Tarantino LLC and Griffin Compliance LLC in return for the provision of services of an Independent Chief Compliance Officer (ICCO) and Assistant ICCO, respectively, for the funds. The ICCO and Assistant ICCO are officers of the funds and the sole members of Tarantino LLC and Griffin Compliance LLC, respectively. The funds can terminate the Agreements with Tarantino LLC and Griffin Compliance LLC at any time under the terms of the Agreements. For the six months ended June 30, 2013, the aggregate fees paid by the fund to Tarantino LLC and Griffin Compliance LLC were $506 and are included in “Miscellaneous” expense in the Statement of Operations. MFS has agreed to reimburse the fund for a portion of the payments made by the fund in the amount of $251, which is shown as a reduction of total expenses in the Statement of Operations. Additionally, MFS has agreed to bear all expenses associated with office space, other administrative support, and supplies provided to the ICCO and Assistant ICCO.
The fund invests in the MFS Institutional Money Market Portfolio which is managed by MFS and seeks current income consistent with preservation of capital and liquidity. Income earned on this investment is included in “Dividends from underlying affiliated funds” in the Statement of Operations. This money market fund does not pay a management fee to MFS.
Purchases and sales of investments, other than purchased option transactions, short sales, and short-term obligations, aggregated $34,363,450 and $44,188,724, respectively.
17
MFS Global Research Portfolio
Notes to Financial Statements (unaudited) – continued
| (5) | | Shares of Beneficial Interest |
The fund’s Declaration of Trust permits the Trustees to issue an unlimited number of full and fractional shares of beneficial interest. Transactions in fund shares were as follows:
| | | | | | | | | | | | | | | | |
| | | Six months ended 6/30/13 | | | Year ended 12/31/12 | |
| | | Shares | | | Amount | | | Shares | | | Amount | |
| Shares sold | | | | | | | | | | | | | | | | |
Initial Class | | | 4,175 | | | | $91,639 | | | | 30,009 | | | | $587,110 | |
Service Class | | | 7,760 | | | | 167,183 | | | | 51,613 | | | | 977,622 | |
| | | 11,935 | | | | $258,822 | | | | 81,622 | | | | $1,564,732 | |
| Shares issued to shareholders in reinvestment of distributions | | | | | | | | | | | | | | | | |
Initial Class | | | — | | | | $— | | | | 97,020 | | | | $1,870,542 | |
Service Class | | | — | | | | — | | | | 8,834 | | | | 169,517 | |
| | | — | | | | $— | | | | 105,854 | | | | $2,040,059 | |
| Shares reacquired | | | | | | | | | | | | | | | | |
Initial Class | | | (402,556 | ) | | | $(8,716,657 | ) | | | (986,978 | ) | | | $(19,101,113 | ) |
Service Class | | | (94,168 | ) | | | (2,024,318 | ) | | | (181,973 | ) | | | (3,530,962 | ) |
| | | (496,724 | ) | | | $(10,740,975 | ) | | | (1,168,951 | ) | | | $(22,632,075 | ) |
| Net change | | | | | | | | | | | | | | | | |
Initial Class | | | (398,381 | ) | | | $(8,625,018 | ) | | | (859,949 | ) | | | $(16,643,461 | ) |
Service Class | | | (86,408 | ) | | | (1,857,135 | ) | | | (121,526 | ) | | | (2,383,823 | ) |
| | | (484,789 | ) | | | $(10,482,153 | ) | | | (981,475 | ) | | | $(19,027,284 | ) |
The fund and certain other funds managed by MFS participate in a $1.1 billion unsecured committed line of credit, subject to a $1 billion sublimit, provided by a syndication of banks under a credit agreement. Borrowings may be made for temporary financing needs. Interest is charged to each fund, based on its borrowings, generally at a rate equal to the higher of the Federal Reserve funds rate or one month LIBOR plus an agreed upon spread. A commitment fee, based on the average daily, unused portion of the committed line of credit, is allocated among the participating funds at the end of each calendar quarter. In addition, the fund and other funds managed by MFS have established unsecured uncommitted borrowing arrangements with certain banks for temporary financing needs. Interest is charged to each fund, based on its borrowings, at a rate equal to the Federal Reserve funds rate plus an agreed upon spread. For the six months ended June 30, 2013, the fund’s commitment fee and interest expense were $333 and $0, respectively, and are included in “Miscellaneous” expense in the Statement of Operations.
| (7) | | Transactions in Underlying Affiliated Funds – Affiliated Issuers |
An affiliated issuer may be considered one in which the fund owns 5% or more of the outstanding voting securities, or a company which is under common control. For the purposes of this report, the fund assumes the following to be an affiliated issuer:
| | | | | | | | | | | | | | |
| Underlying Affiliated Fund | | Beginning
Shares/Par
Amount | | Acquisitions
Shares/Par
Amount | | | Dispositions
Shares/Par
Amount | | | Ending
Shares/Par
Amount | |
| MFS Institutional Money Market Portfolio | | 480,187 | | | 13,606,999 | | | | (13,805,473 | ) | | | 281,713 | |
| | | | |
| Underlying Affiliated Fund | | Realized
Gain (Loss) | | Capital Gain
Distributions | | | Dividend
Income | | | Ending
Value | |
| MFS Institutional Money Market Portfolio | | $— | | | $— | | | | $474 | | | | $281,713 | |
18
MFS Global Research Portfolio
BOARD REVIEW OF INVESTMENT ADVISORY AGREEMENT
A discussion regarding the Board’s most recent review and renewal of the fund’s Investment Advisory Agreement with MFS will be available on or about November 1, 2013 by clicking on the fund’s name under “Variable Insurance Portfolios — VIT II” in the “Products” section of the MFS Web site (mfs.com).
PROXY VOTING POLICIES AND INFORMATION
A general description of the MFS funds’ proxy voting policies and procedures is available without charge, upon request, by calling 1-800-225-2606, by visiting the Proxy Voting section of mfs.com or by visiting the SEC’s Web site at http://www.sec.gov.
Information regarding how the fund voted proxies relating to portfolio securities during the most recent twelve-month period ended June 30 is available without charge by visiting the Proxy Voting section of mfs.com or by visiting the SEC’s Web site at http://www.sec.gov.
QUARTERLY PORTFOLIO DISCLOSURE
The fund will file a complete schedule of portfolio holdings with the Securities and Exchange Commission (the Commission) for the first and third quarters of each fiscal year on Form N-Q. The fund’s Form N-Q is available on the EDGAR database on the Commission’s Internet Web site at http://www.sec.gov, and may be reviewed and copied at the:
Public Reference Room
Securities and Exchange Commission
100 F Street, NE, Room 1580
Washington, D.C. 20549
Information on the operation of the Public Reference Room may be obtained by calling the Commission at 1-800-SEC-0330. Copies of the fund’s Form N-Q also may be obtained, upon payment of a duplicating fee, by electronic request at the following e-mail address: publicinfo@sec.gov or by writing the Public Reference Section at the above address.
FURTHER INFORMATION
From time to time, MFS may post important information about the fund or the MFS funds on the MFS web site (mfs.com). This information is available by visiting the “News & Commentary” section of mfs.com or by clicking on the fund’s name under “Variable Insurance Portfolios — VIT II” in the “Products” section of mfs.com.
19
SEMIANNUAL REPORT
June 30, 2013

MFS® GLOBAL GOVERNMENTS PORTFOLIO
MFS® Variable Insurance Trust II

WGS-SEM
MFS® GLOBAL GOVERNMENTS PORTFOLIO
CONTENTS
The report is prepared for the general information of contract owners. It is authorized for distribution to prospective investors only when preceded or accompanied by a current prospectus.
NOT FDIC INSURED Ÿ MAY LOSE VALUE Ÿ NO BANK OR CREDIT UNION GUARANTEE Ÿ NOT A DEPOSIT Ÿ NOT INSURED BY ANY FEDERAL GOVERNMENT AGENCY OR NCUA/NCUSIF
MFS Global Governments Portfolio
LETTER FROM THE CHAIRMAN AND CEO

Dear Contract Owners:
As the year progresses, the global economy continues to grind ahead slowly, held back by broad austerity measures. The U.S. economy remains a steadying force, driven by resilient consumers, who have taken the payroll tax increase and the sequestration’s early impact in stride. With U.S. housing and jobs showing steady expansion, domestic consumer-driven growth has offset weaker exports and the U.S. government’s spending constraints. In response to these developments, the U.S. Federal Reserve has begun to brace investors for an eventual shift in its monetary policy, causing global market tremors.
Japan has been another bright spot, with government and central bank stimulus policies leading to increased exports, a resurgent stock market and improved economic sentiment. After a six-month rally, Japan’s stocks slipped late in the second quarter, then picked up momentum on fresh signs that the country could soon break free of its chronic deflation. The major deterrent to global growth remains the eurozone, still in the grip of persistent recession. China has seen its pace of economic growth decelerate, a troubling turn for the country’s trading partners, who have come to rely on it as an engine for global growth.
As always, managing risk in the face of uncertainty remains a top priority for investors. At MFS®, our uniquely collaborative investment process employs integrated, global research and active risk management. Our global team of investment professionals shares ideas and evaluates opportunities across continents, investment disciplines and asset classes — all with a goal of building better insights, and ultimately better results, for our clients.
We are mindful of the many economic challenges investors face, and believe it is more important than ever to maintain a long-term view and employ time-tested principles, such as asset allocation and diversification. We remain confident that our unique approach can serve investors well as they work with their financial advisors to identify and pursue the most suitable opportunities.
Respectfully,

Robert J. Manning
Chairman and Chief Executive Officer
MFS Investment Management®
August 16, 2013
The opinions expressed in this letter are subject to change, may not be relied upon for investment advice, and no forecasts can be guaranteed.
1
MFS Global Governments Portfolio
PORTFOLIO COMPOSITION
Portfolio structure (i)
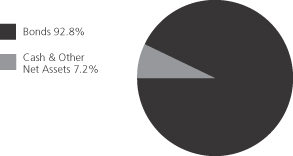
| | | | |
| Fixed income sectors (i) | | | | |
| Non-U.S. Government Bonds | | | 61.8% | |
| U.S. Treasury Securities | | | 28.2% | |
| High Grade Corporates | | | 1.3% | |
| U.S. Government Agencies | | | 0.8% | |
| Mortgage-Backed Securities | | | 0.6% | |
| Commercial Mortgage-Backed Securities | | | 0.1% | |
|
| Composition including fixed income credit quality (a)(i) | |
| AAA | | | 9.2% | |
| AA | | | 12.5% | |
| A | | | 20.4% | |
| BBB | | | 19.5% | |
| BB | | | 1.6% | |
| B (o) | | | 0.0% | |
| CCC (o) | | | 0.0% | |
| U.S. Government | | | 28.2% | |
| Federal Agencies | | | 1.4% | |
| Cash & Other | | | 7.2% | |
| | | | |
| Portfolio facts (i) | | | | |
| Average Duration (d) | | | 6.8 | |
| Average Effective Maturity (m) | | | 9.0 yrs. | |
| |
| Issuer country weightings (i)(x) | | | | |
| United States | | | 36.9% | |
| Japan | | | 20.8% | |
| Italy | | | 10.4% | |
| Spain | | | 5.8% | |
| United Kingdom | | | 5.7% | |
| Germany | | | 4.6% | |
| France | | | 4.2% | |
| Ireland | | | 2.8% | |
| Canada | | | 2.4% | |
| Other Countries | | | 6.4% | |
| |
| Currency exposure (i)(y) | | | | |
| United States Dollar | | | 38.1% | |
| Euro | | | 25.8% | |
| Japanese Yen | | | 25.8% | |
| British Pound Sterling | | | 6.7% | |
| Canadian Dollar | | | 1.6% | |
| Australian Dollar | | | 1.0% | |
| Danish Krone | | | 0.6% | |
| Swedish Krona | | | 0.4% | |
| Polish Zloty (o) | | | 0.0% | |
| Other Countries (o) | | | (0.0)% | |
| (a) | | For all securities other than those specifically described below, ratings are assigned to underlying securities utilizing ratings from Moody’s, Fitch, and Standard & Poor’s rating agencies and applying the following hierarchy: If all three agencies provide a rating, the middle rating (after dropping the highest and lowest ratings) is assigned; if two of the three agencies rate a security, the lower of the two is assigned. Ratings are shown in the S&P and Fitch scale (e.g., AAA). Securities rated BBB or higher are considered investment grade. All ratings are subject to change. U.S. Government includes securities issued by the U.S. Department of the Treasury. Federal Agencies includes rated and unrated U.S. Agency fixed-income securities, U.S. Agency mortgage-backed securities, and collateralized mortgage obligations of U.S. Agency mortgage-backed securities. Cash & Other includes cash, other assets less liabilities, offsets to derivative positions, and short-term securities. The fund may not hold all of these instruments. The fund is not rated by these agencies. |
| (d) | | Duration is a measure of how much a bond’s price is likely to fluctuate with general changes in interest rates, e.g., if rates rise 1.00%, a bond with a 5-year duration is likely to lose about 5.00% of its value due to the interest rate move. |
| (i) | | For purposes of this presentation, the components include the market value of securities, and reflect the impact of the equivalent exposure of derivative positions, if any. These amounts may be negative from time to time. Equivalent exposure is a calculated amount that translates the derivative position into a reasonable approximation of the amount of the underlying asset that the portfolio would have to hold at a given point in time to have the same price sensitivity that results from the portfolio’s ownership of the derivative contract. When dealing with derivatives, equivalent exposure is a more representative measure of the potential impact of a position on portfolio performance than market value. The bond component will include any accrued interest amounts. |
| (m) | | In determining an instrument’s effective maturity for purposes of calculating the fund’s dollar-weighted average effective maturity, MFS uses the instrument’s stated maturity or, if applicable, an earlier date on which MFS believes it is probable that a maturity-shortening device (such as a put, pre-refunding or prepayment) will cause the instrument to be repaid. Such an earlier date can be substantially shorter than the instrument’s stated maturity. |
| (x) | | Represents the portfolio’s exposure to issuer countries as a percentage of a portfolio’s net assets. |
| (y) | | Represents the portfolio’s exposure to a particular currency as a percentage of a portfolio’s net assets. |
Where the fund holds convertible bonds, these are treated as part of the equity portion of the portfolio.
Percentages are based on net assets as of 6/30/13.
The portfolio is actively managed and current holdings may be different.
2
MFS Global Governments Portfolio
EXPENSE TABLE
Fund Expenses Borne by the Contract Holders During the Period,
January 1, 2013 through June 30, 2013
As a contract holder of the fund, you incur ongoing costs, including management fees; distribution and/or service (12b-1) fees; and other fund expenses. This example is intended to help you understand your ongoing costs (in dollars) of investing in the fund and to compare these costs with the ongoing costs of investing in other mutual funds.
The example is based on an investment of $1,000 invested at the beginning of the period and held for the entire period January 1, 2013 through June 30, 2013.
Actual Expenses
The first line for each share class in the following table provides information about actual account values and actual expenses. You may use the information in this line, together with the amount you invested, to estimate the expenses that you paid over the period. Simply divide your account value by $1,000 (for example, an $8,600 account value divided by $1,000 = 8.6), then multiply the result by the number in the first line under the heading entitled “Expenses Paid During Period” to estimate the expenses you paid on your account during this period.
Hypothetical Example for Comparison Purposes
The second line for each share class in the following table provides information about hypothetical account values and hypothetical expenses based on the fund’s actual expense ratio and an assumed rate of return of 5% per year before expenses, which is not the fund’s actual return. The hypothetical account values and expenses may not be used to estimate the actual ending account balance or expenses you paid for the period. You may use this information to compare the ongoing costs of investing in the fund and other funds. To do so, compare this 5% hypothetical example with the 5% hypothetical examples that appear in the shareholder reports of the other funds.
Please note that the expenses shown in the table are meant to highlight the fund’s ongoing costs only and do not take into account the fees and expenses imposed under the variable contracts through which your investment in the fund is made. Therefore, the second line for each share class in the table is useful in comparing ongoing costs associated with an investment in vehicles (such as the fund) which fund benefits under variable annuity and variable life insurance contracts and to qualified pension and retirement plans only, and will not help you determine the relative total costs of investing in the fund through variable annuity and variable life insurance contracts. If the fees and expenses imposed under the variable contracts were included, your costs would have been higher.
| | | | | | | | | | | | | | | | | | |
| Share Class | | | | Annualized
Expense Ratio | | | Beginning
Account Value
1/01/13 | | | Ending Account Value
6/30/13 | | | Expenses Paid
During Period (p)
1/01/13-6/30/13 | |
| Initial Class | | Actual | | | 0.83% | | | | $1,000.00 | | | | $937.44 | | | | $3.99 | |
| | Hypothetical (h) | | | 0.83% | | | | $1,000.00 | | | | $1,020.68 | | | | $4.16 | |
| Service Class | | Actual | | | 1.08% | | | | $1,000.00 | | | | $936.52 | | | | $5.19 | |
| | Hypothetical (h) | | | 1.08% | | | | $1,000.00 | | | | $1,019.44 | | | | $5.41 | |
| (h) | 5% class return per year before expenses. |
| (p) | Expenses paid is equal to each class’s annualized expense ratio, as shown above, multiplied by the average account value over the period, multiplied by the number of days in the period, divided by the number of days in the year. |
3
MFS Global Governments Portfolio
PORTFOLIO OF INVESTMENTS – 6/30/13 (unaudited)
The Portfolio of Investments is a complete list of all securities owned by your fund. It is categorized by broad-based asset classes.
| | | | | | | | |
| Issuer | | Shares/Par | | | Value ($) | |
| | | | | | | | |
| BONDS – 91.6% | | | | | | | | |
| Foreign Bonds – 62.3% | | | | | |
| Australia – 1.5% | | | | | | | | |
| Commonwealth of Australia, 5.75%, 2021 | | AUD | 3,162,000 | | | $ | 3,317,858 | |
| | | | | | | | |
| Belgium – 1.6% | | | | | | | | |
| Kingdom of Belgium, 4.25%, 2021 | | EUR | 2,307,000 | | | $ | 3,457,845 | |
| | | | | | | | |
| Canada – 2.4% | | | | | | | | |
| Bayview Commercial Asset Trust, FRN, 1.72%, 2023 (z) | | CAD | 132,097 | | | $ | 124,735 | |
| Government of Canada, 4.5%, 2015 | | CAD | 2,570,000 | | | | 2,595,023 | |
| Government of Canada, 4.25%, 2018 | | CAD | 12,000 | | | | 12,706 | |
| Government of Canada, 3.25%, 2021 | | CAD | 924,000 | | | | 941,633 | |
| Government of Canada, 5.75%, 2033 | | CAD | 1,262,000 | | | | 1,722,701 | |
| | | | | | | | |
| | | $ | 5,396,798 | |
| | | | | | | | |
| France – 4.1% | | | | | | | | |
| Republic of France, 2.5%, 2020 | | EUR | 2,349,000 | | | $ | 3,213,083 | |
| Republic of France, 6%, 2025 | | EUR | 1,428,000 | | | | 2,512,718 | |
| Republic of France, 4.75%, 2035 | | EUR | 2,171,000 | | | | 3,508,105 | |
| | | | | | | | |
| | | $ | 9,233,906 | |
| | | | | | | | |
| Germany – 4.5% | | | | | | | | |
| Federal Republic of Germany, 4.25%, 2018 | | EUR | 1,521,000 | | | $ | 2,319,940 | |
| Federal Republic of Germany, 3.25%, 2021 | | EUR | 3,473,000 | | | | 5,181,997 | |
| Federal Republic of Germany, 6.25%, 2030 | | EUR | 1,234,000 | | | | 2,478,743 | |
| | | | | | | | |
| | | $ | 9,980,680 | |
| | | | | | | | |
| Iceland – 0.5% | | | | | | | | |
| Republic of Iceland, 4.875%, 2016 (n) | | $ | 1,122,000 | | | $ | 1,172,490 | |
| | | | | | | | |
| Ireland – 2.7% | | | | | | | | |
| Republic of Ireland, 5.5%, 2017 | | EUR | 3,054,000 | | | $ | 4,394,625 | |
| Republic of Ireland, 4.5%, 2020 | | EUR | 1,225,000 | | | | 1,664,705 | |
| | | | | | | | |
| | | $ | 6,059,330 | |
| | | | | | | | |
| Italy – 10.2% | | | | | | | | |
| Republic of Italy, 4.25%, 2015 | | EUR | 1,744,000 | | | $ | 2,355,148 | |
| Republic of Italy, 5.25%, 2017 | | EUR | 9,746,000 | | | | 13,659,466 | |
| Republic of Italy, 3.75%, 2021 | | EUR | 5,287,000 | | | | 6,789,604 | |
| | | | | | | | |
| | | $ | 22,804,218 | |
| | | | | | | | |
| Japan – 20.7% | | | | | | | | |
| Government of Japan, 2%, 2052 | | JPY | 87,900,000 | | | $ | 912,077 | |
| Government of Japan, 1.1%, 2020 | | JPY | 1,682,200,000 | | | | 17,565,099 | |
| Government of Japan, 2.1%, 2024 | | JPY | 1,087,350,000 | | | | 12,283,612 | |
| Government of Japan, 2.2%, 2027 | | JPY | 819,900,000 | | | | 9,298,772 | |
| Government of Japan, 2.4%, 2037 | | JPY | 448,600,000 | | | | 5,088,381 | |
| Toyota Motor Credit Corp., FRN, 0.564%, 2016 | | $ | 1,227,000 | | | | 1,224,899 | |
| | | | | | | | |
| | | | | | $ | 46,372,840 | |
| | | | | | | | |
| | | | | | | | |
| Issuer | | Shares/Par | | | Value ($) | |
| | | | | | | | |
| BONDS – continued | | | | | | | | |
| Foreign Bonds – continued | | | | | |
| Netherlands – 0.7% | | | | | | | | |
| ABN AMRO Bank N.V., FRN, 2.045%, 2014 (n) | | $ | 200,000 | | | $ | 201,736 | |
| Kingdom of the Netherlands, 5.5%, 2028 | | EUR | 807,000 | | | | 1,443,807 | |
| | | | | | | | |
| | | | | | $ | 1,645,543 | |
| | | | | | | | |
| Norway – 0.0% | | | | | | | | |
| Statoil A.S.A., FRN, 0.565%, 2018 | | $ | 45,000 | | | $ | 45,022 | |
| | | | | | | | |
| Portugal – 1.6% | | | | | | | | |
| Republic of Portugal, 4.45%, 2018 | | EUR | 1,580,000 | | | $ | 1,959,312 | |
| Republic of Portugal, 4.8%, 2020 | | EUR | 1,402,000 | | | | 1,684,394 | |
| | | | | | | | |
| | | | | | $ | 3,643,706 | |
| | | | | | | | |
| Spain – 5.6% | | | | | | | | |
| Kingdom of Spain, 4%, 2015 | | EUR | 4,679,000 | | | $ | 6,266,431 | |
| Kingdom of Spain, 5.5%, 2017 | | EUR | 1,795,000 | | | | 2,519,826 | |
| Kingdom of Spain, 4.6%, 2019 | | EUR | 2,761,000 | | | | 3,717,123 | |
| | | | | | | | |
| | | | | | $ | 12,503,380 | |
| | | | | | | | |
| Sweden – 0.5% | | | | | | | | |
| Nordea Bank AB, FRN, 0.735%, 2016 (z) | | $ | 1,000,000 | | | $ | 1,001,422 | |
| | | | | | | | |
| United Kingdom – 5.7% | | | | | | | | |
| HSBC Bank PLC, FRN, 0.915%, 2018 (z) | | $ | 403,000 | | | $ | 402,998 | |
| United Kingdom Treasury, 8%, 2021 | | GBP | 2,421,100 | | | | 5,265,054 | |
| United Kingdom Treasury, 4.25%, 2027 | | GBP | 1,174,000 | | | | 2,052,256 | |
| United Kingdom Treasury, 4.25%, 2036 | | GBP | 2,887,000 | | | | 4,997,534 | |
| | | | | | | | |
| | | | | | $ | 12,717,842 | |
| | | | | | | | |
| Total Foreign Bonds | | | | | | $ | 139,352,880 | |
| | | | | | | | |
| | |
| U.S. Bonds – 29.3% | | | | | | | | |
| Asset-Backed & Securitized – 0.0% | | | | | |
| Commercial Mortgage Asset Trust, FRN, 0.659%, 2032 (i)(z) | | $ | 2,332,638 | | | $ | 10,702 | |
| First Union National Bank Commercial Mortgage Trust, FRN, 1.893%, 2043 (i)(z) | | | 252,925 | | | | 433 | |
| | | | | | | | |
| | | | | | $ | 11,135 | |
| | | | | | | | |
| Mortgage-Backed – 0.6% | | | | | |
| Fannie Mae, 4.78%, 2015 | | $ | 86,973 | | | $ | 92,077 | |
| Fannie Mae, 4.856%, 2015 | | | 41,849 | | | | 44,263 | |
| Fannie Mae, 5.5%, 2015 | | | 47,006 | | | | 49,440 | |
| Fannie Mae, 5.09%, 2016 | | | 83,461 | | | | 90,790 | |
| Fannie Mae, 5.424%, 2016 | | | 85,692 | | | | 94,610 | |
| Fannie Mae, 5.05%, 2017 | | | 51,466 | | | | 56,110 | |
| Fannie Mae, 5.16%, 2018 | | | 135,511 | | | | 147,678 | |
| Fannie Mae, 5.1%, 2019 | | | 61,547 | | | | 67,779 | |
4
MFS Global Governments Portfolio
Portfolio of Investments (unaudited) – continued
| | | | | | | | |
| Issuer | | Shares/Par | | | Value ($) | |
| | | | | | | | |
| BONDS – continued | | | | | | | | |
| Foreign Bonds – continued | | | | | |
| Mortgage-Backed – continued | | | | | |
| Fannie Mae, 5.18%, 2019 | | $ | 61,601 | | | $ | 68,014 | |
| Fannie Mae, 6.16%, 2019 | | | 40,963 | | | | 45,870 | |
| Freddie Mac, 1.426%, 2017 | | | 560,000 | | | | 562,003 | |
| Freddie Mac, 3.882%, 2017 | | | 89,000 | | | | 96,112 | |
| Freddie Mac, 5.085%, 2019 | | | 43,000 | | | | 49,318 | |
| | | | | | | | |
| | | | | | $ | 1,464,064 | |
| | | | | | | | |
| U.S. Government Agencies and Equivalents – 0.8% | |
| Aid-Egypt, 4.45%, 2015 | | $ | 301,000 | | | $ | 326,687 | |
| Small Business Administration, 4.57%, 2025 | | | 19,527 | | | | 21,132 | |
| Small Business Administration, 5.09%, 2025 | | | 21,145 | | | | 23,333 | |
| Small Business Administration, 5.21%, 2026 | | | 319,471 | | | | 346,728 | |
| Small Business Administration, 2.22%, 2033 | | | 1,032,000 | | | | 994,293 | |
| | | | | | | | |
| | | | | | $ | 1,712,173 | |
| | | | | | | | |
| U.S. Treasury Obligations – 27.9% | | | | | |
| U.S. Treasury Bonds, 6.875%, 2025 | | $ | 4,183,000 | | | $ | 5,989,533 | |
| U.S. Treasury Bonds, 5.25%, 2029 | | | 2,868,000 | | | | 3,648,635 | |
| | | | | | | | |
| Issuer | | Shares/Par | | | Value ($) | |
| | | | | | | | |
| BONDS – continued | | | | | | | | |
| Foreign Bonds – continued | | | | | |
| U.S. Treasury Obligations – continued | | | | | |
| U.S. Treasury Bonds, 4.5%, 2039 | | $ | 6,716,400 | | | $ | 8,030,296 | |
| U.S. Treasury Notes, 4.125%, 2015 | | | 13,403,000 | | | | 14,348,541 | |
| U.S. Treasury Notes, 4.75%, 2017 | | | 15,558,000 | | | | 17,857,659 | |
| U.S. Treasury Notes, 3.5%, 2020 | | | 11,412,000 | | | | 12,625,415 | |
| | | | | | | | |
| | | | | | $ | 62,500,079 | |
| | | | | | | | |
| Total U.S. Bonds | | | | | | $ | 65,687,451 | |
| | | | | | | | |
Total Bonds
(Identified Cost, $214,377,021) | | | | | | $ | 205,040,331 | |
| | | | | | | | |
| |
| MONEY MARKET FUNDS – 6.8% | | | | | |
| MFS Institutional Money Market Portfolio, 0.11%, at Cost and Net Asset Value (v) | | | 15,289,929 | | | $ | 15,289,929 | |
| | | | | | | | |
Total Investments
(Identified Cost, $229,666,950) | | | | | | $ | 220,330,260 | |
| | | | | | | | |
OTHER ASSETS, LESS
LIABILITIES – 1.6% | | | | | | | 3,470,356 | |
| | | | | | | | |
| Net Assets – 100.0% | | | | | | $ | 223,800,616 | |
| | | | | | | | |
| (i) | | Interest only security for which the fund receives interest on notional principal (Par amount). Par amount shown is the notional principal and does not reflect the cost of the security. |
| (n) | | Securities exempt from registration under Rule 144A of the Securities Act of 1933. These securities may be sold in the ordinary course of business in transactions exempt from registration, normally to qualified institutional buyers. At period end, the aggregate value of these securities was $1,374,226, representing 0.6% of net assets. |
| (v) | | Underlying affiliated fund that is available only to investment companies managed by MFS. The rate quoted for the MFS Institutional Money Market Portfolio is the annualized seven-day yield of the fund at period end. |
| (z) | | Restricted securities are not registered under the Securities Act of 1933 and are subject to legal restrictions on resale. These securities generally may be resold in transactions exempt from registration or to the public if the securities are subsequently registered. Disposal of these securities may involve time-consuming negotiations and prompt sale at an acceptable price may be difficult. The fund holds the following restricted securities: |
| | | | | | | | | | |
| Restricted Securities | | Acquisition
Date | | Cost | | | Value | |
| Bayview Commercial Asset Trust, FRN, 1.72%, 2023 | | 5/25/06 | | | $132,289 | | | | $124,735 | |
| Commercial Mortgage Asset Trust, FRN, 0.659%, 2032 | | 8/25/03-12/02/11 | | | 13,151 | | | | 10,702 | |
| First Union National Bank Commercial Mortgage Trust, FRN, 1.893%, 2043 | | 12/11/03-11/30/11 | | | 186 | | | | 433 | |
| HSBC Bank PLC, FRN, 0.915%, 2018 | | 5/08/13 | | | 403,000 | | | | 402,998 | |
| Nordea Bank AB, FRN, 0.735%, 2016 | | 5/07/13 | | | 1,000,000 | | | | 1,001,422 | |
| Total Restricted Securities | | | | $1,540,290 | |
| % of Net assets | | | | 0.7% | |
The following abbreviations are used in this report and are defined:
| FRN | | Floating Rate Note. Interest rate resets periodically and may not be the rate reported at period end. |
| PLC | | Public Limited Company |
Abbreviations indicate amounts shown in currencies other than the U.S. dollar. All amounts are stated in U.S. dollars unless otherwise indicated. A list of abbreviations is shown below:
| CNY | | Chinese Yuan Renminbi |
5
MFS Global Governments Portfolio
Portfolio of Investments (unaudited) – continued
Derivative Contracts at 6/30/13
Forward Foreign Currency Exchange Contracts at 6/30/13
| | | | | | | | | | | | | | | | | | | | |
| Type | | Currency | | Counterparty | | Contracts to
Deliver/Receive | | Settlement Date Range | | In Exchange For | | | Contracts
at Value | | | Net Unrealized
Appreciation
(Depreciation) | |
| Asset Derivatives | | | | | | | | | | | | | | | | | | |
| SELL | | AUD | | Barclays Bank PLC | | 1,156,162 | | 7/16/13 | | $ | 1,150,000 | | | $ | 1,056,282 | | | $ | 93,718 | |
| SELL | | AUD | | Deutsche Bank AG | | 40,000 | | 7/16/13 | | | 40,967 | | | | 36,544 | | | | 4,423 | |
| SELL | | AUD | | Westpac Banking Corp. | | 1,319,531 | | 7/16/13 | | | 1,372,859 | | | | 1,205,536 | | | | 167,323 | |
| SELL | | CAD | | Deutsche Bank AG | | 171,000 | | 7/16/13 | | | 169,357 | | | | 162,540 | | | | 6,817 | |
| SELL | | CAD | | Goldman Sachs International | | 1,157,000 | | 7/16/13 | | | 1,117,649 | | | | 1,099,760 | | | | 17,889 | |
| SELL | | CAD | | Merrill Lynch International Bank | | 1,921,235 | | 7/16/13 | | | 1,885,292 | | | | 1,826,186 | | | | 59,106 | |
| SELL | | CAD | | UBS AG | | 63,000 | | 7/16/13 | | | 62,123 | | | | 59,883 | | | | 2,240 | |
| SELL | | CHF | | UBS AG | | 1,000 | | 7/16/13 | | | 1,073 | | | | 1,059 | | | | 14 | |
| BUY | | CNY | | Deutsche Bank AG | | 7,120,000 | | 1/15/14 | | | 1,140,366 | | | | 1,146,341 | | | | 5,975 | |
| SELL | | DKK | | Goldman Sachs International | | 343,000 | | 7/16/13 | | | 60,365 | | | | 59,868 | | | | 497 | |
| BUY | | EUR | | Citibank N.A. | | 195,000 | | 7/16/13 | | | 253,735 | | | | 253,836 | | | | 101 | |
| BUY | | EUR | | Deutsche Bank AG | | 333,000 | | 7/16/13 | | | 431,540 | | | | 433,473 | | | | 1,933 | |
| BUY | | EUR | | UBS AG | | 84,000 | | 7/16/13 | | | 108,471 | | | | 109,345 | | | | 874 | |
| SELL | | EUR | | Barclays Bank PLC | | 2,187,652 | | 7/16/13-9/18/13 | | | 2,884,175 | | | | 2,847,965 | | | | 36,210 | |
| SELL | | EUR | | Credit Suisse Group | | 1,084,033 | | 7/16/13 | | | 1,427,534 | | | | 1,411,110 | | | | 16,424 | |
| SELL | | EUR | | Deutsche Bank AG | | 3,477,829 | | 7/16/13 | | | 4,546,080 | | | | 4,527,166 | | | | 18,914 | |
| SELL | | EUR | | JPMorgan Chase Bank N.A. | | 5,184,832 | | 7/16/13 | | | 6,776,716 | | | | 6,749,209 | | | | 27,507 | |
| SELL | | EUR | | Merrill Lynch International Bank | | 243,000 | | 7/16/13 | | | 318,970 | | | | 316,318 | | | | 2,652 | |
| SELL | | EUR | | UBS AG | | 2,740,475 | | 7/16/13-9/18/13 | | | 3,607,483 | | | | 3,567,587 | | | | 39,896 | |
| SELL | | GBP | | Barclays Bank PLC | | 2,398,515 | | 7/16/13 | | | 3,689,133 | | | | 3,647,673 | | | | 41,460 | |
| SELL | | GBP | | Deutsche Bank AG | | 26,000 | | 7/16/13 | | | 40,746 | | | | 39,541 | | | | 1,205 | |
| SELL | | GBP | | Goldman Sachs International | | 131,000 | | 7/16/13 | | | 199,629 | | | | 199,225 | | | | 404 | |
| SELL | | GBP | | JPMorgan Chase Bank N.A. | | 58,000 | | 7/16/13 | | | 90,197 | | | | 88,207 | | | | 1,990 | |
| SELL | | GBP | | Merrill Lynch International Bank | | 53,000 | | 7/16/13 | | | 81,770 | | | | 80,603 | | | | 1,167 | |
| BUY | | JPY | | Barclays Bank PLC | | 35,360,000 | | 7/16/13 | | | 351,315 | | | | 356,542 | | | | 5,227 | |
| BUY | | JPY | | Credit Suisse Group | | 459,064,179 | | 7/16/13 | | | 4,609,532 | | | | 4,628,837 | | | | 19,305 | |
| BUY | | JPY | | Deutsche Bank AG | | 263,701,000 | | 7/16/13 | | | 2,654,624 | | | | 2,658,950 | | | | 4,326 | |
| BUY | | JPY | | Goldman Sachs International | | 44,014,390 | | 7/16/13 | | | 430,467 | | | | 443,806 | | | | 13,339 | |
| BUY | | JPY | | Merrill Lynch International Bank | | 353,333,178 | | 7/16/13 | | | 3,548,687 | | | | 3,562,730 | | | | 14,043 | |
| SELL | | JPY | | Barclays Bank PLC | | 43,096,680 | | 7/16/13 | | | 452,763 | | | | 434,553 | | | | 18,210 | |
| SELL | | JPY | | Citibank N.A. | | 227,813,846 | | 7/16/13 | | | 2,315,267 | | | | 2,297,093 | | | | 18,174 | |
| SELL | | JPY | | Deutsche Bank AG | | 273,030,000 | | 7/16/13 | | | 2,794,877 | | | | 2,753,016 | | | | 41,861 | |
| SELL | | JPY | | Goldman Sachs International | | 111,891,000 | | 7/16/13 | | | 1,152,886 | | | | 1,128,219 | | | | 24,667 | |
| SELL | | JPY | | Merrill Lynch International Bank | | 78,645,000 | | 7/16/13 | | | 804,525 | | | | 792,993 | | | | 11,532 | |
| SELL | | JPY | | UBS AG | | 89,971,000 | | 7/16/13 | | | 921,686 | | | | 907,196 | | | | 14,490 | |
| BUY | | MXN | | JPMorgan Chase Bank N.A. | | 4,000 | | 7/05/13 | | | 307 | | | | 309 | | | | 2 | |
| SELL | | MXN | | JPMorgan Chase Bank N.A. | | 4,000 | | 7/05/13 | | | 311 | | | | 309 | | | | 2 | |
| SELL | | NOK | | Goldman Sachs International | | 120,258 | | 7/16/13 | | | 20,838 | | | | 19,788 | | | | 1,050 | |
| SELL | | PLN | | Citibank N.A. | | 5,392,240 | | 7/16/13 | | | 1,693,091 | | | | 1,621,416 | | | | 71,675 | |
| SELL | | SEK | | Goldman Sachs International | | 1,000,000 | | 7/16/13 | | | 150,660 | | | | 149,069 | | | | 1,591 | |
| SELL | | THB | | JPMorgan Chase Bank N.A. | | 17,148,000 | | 7/18/13 | | | 579,716 | | | | 552,457 | | | | 27,259 | |
| | | | | | | | | | | | | | | | | | | | |
| | | | | | | | | | | | | | | | | | $ | 835,492 | |
| | | | | | | | | | | | | | | | | | | | |
6
MFS Global Governments Portfolio
Portfolio of Investments (unaudited) – continued
Forward Foreign Currency Exchange Contracts at 6/30/13 – continued
| | | | | | | | | | | | | | | | | | | | |
| Type | | Currency | | Counterparty | | Contracts to
Deliver/Receive | | Settlement Date Range | | In Exchange For | | | Contracts
at Value | | | Net Unrealized
Appreciation
(Depreciation) | |
| Liability Derivatives | | | | | | | | | | | | | | | | |
| BUY | | AUD | | Deutsche Bank AG | | 1,193,000 | | 7/16/13 | | $ | 1,145,446 | | | $ | 1,089,936 | | | $ | (55,510 | ) |
| BUY | | AUD | | Goldman Sachs International | | 35,000 | | 7/16/13 | | | 33,700 | | | | 31,976 | | | | (1,724 | ) |
| BUY | | CAD | | Credit Suisse Group | | 12,000 | | 7/16/13 | | | 11,758 | | | | 11,406 | | | | (352 | ) |
| BUY | | CAD | | Deutsche Bank AG | | 1,178,000 | | 7/16/13 | | | 1,151,900 | | | | 1,119,721 | | | | (32,179 | ) |
| BUY | | CAD | | Merrill Lynch International Bank | | 133,000 | | 7/16/13 | | | 128,736 | | | | 126,420 | | | | (2,316 | ) |
| SELL | | CNY | | Deutsche Bank AG | | 7,120,000 | | 1/15/14 | | | 1,145,431 | | | | 1,146,341 | | | | (910 | ) |
| BUY | | DKK | | Deutsche Bank AG | | 7,743,290 | | 7/16/13 | | | 1,357,658 | | | | 1,351,529 | | | | (6,129 | ) |
| BUY | | DKK | | JPMorgan Chase Bank N.A. | | 106,000 | | 7/16/13 | | | 18,663 | | | | 18,501 | | | | (162 | ) |
| BUY | | EUR | | Barclays Bank PLC | | 878,000 | | 7/16/13 | | | 1,167,296 | | | | 1,142,912 | | | | (24,384 | ) |
| BUY | | EUR | | Citibank N.A. | | 311,387 | | 7/16/13 | | | 407,549 | | | | 405,339 | | | | (2,210 | ) |
| BUY | | EUR | | Deutsche Bank AG | | 5,509,370 | | 7/16/13 | | | 7,233,535 | | | | 7,171,666 | | | | (61,869 | ) |
| BUY | | EUR | | Goldman Sachs International | | 181,000 | | 7/16/13 | | | 236,171 | | | | 235,612 | | | | (559 | ) |
| BUY | | EUR | | JPMorgan Chase Bank N.A. | | 39,000 | | 7/16/13 | | | 51,157 | | | | 50,767 | | | | (390 | ) |
| BUY | | EUR | | UBS AG | | 327,000 | | 7/16/13 | | | 430,586 | | | | 425,663 | | | | (4,923 | ) |
| SELL | | EUR | | Citibank N.A. | | 997,000 | | 7/16/13 | | | 1,297,413 | | | | 1,297,817 | | | | (404 | ) |
| SELL | | EUR | | Credit Suisse Group | | 440,000 | | 7/16/13 | | | 571,713 | | | | 572,758 | | | | (1,045 | ) |
| SELL | | EUR | | Deutsche Bank AG | | 255,000 | | 7/16/13 | | | 327,078 | | | | 331,939 | | | | (4,861 | ) |
| SELL | | EUR | | Goldman Sachs International | | 748,000 | | 7/16/13 | | | 970,856 | | | | 973,688 | | | | (2,832 | ) |
| SELL | | EUR | | UBS AG | | 437,000 | | 7/16/13 | | | 562,105 | | | | 568,852 | | | | (6,747 | ) |
| BUY | | GBP | | Brown Brothers Harriman & Co | | 54,000 | | 7/16/13 | | | 82,238 | | | | 82,123 | | | | (115 | ) |
| BUY | | GBP | | Credit Suisse Group | | 2,003,576 | | 7/16/13 | | | 3,070,260 | | | | 3,047,049 | | | | (23,211 | ) |
| BUY | | GBP | | Deutsche Bank AG | | 2,224,576 | | 7/16/13 | | | 3,413,267 | | | | 3,383,147 | | | | (30,120 | ) |
| BUY | | GBP | | Goldman Sachs International | | 236,000 | | 7/16/13 | | | 366,382 | | | | 358,910 | | | | (7,472 | ) |
| BUY | | GBP | | UBS AG | | 38,000 | | 7/16/13 | | | 58,379 | | | | 57,791 | | | | (588 | ) |
| SELL | | GBP | | Deutsche Bank AG | | 195,000 | | 7/16/13 | | | 296,297 | | | | 296,557 | | | | (260 | ) |
| BUY | | JPY | | Citibank N.A. | | 1,412,185,937 | | 7/16/13 | | | 14,326,302 | | | | 14,239,355 | | | | (86,947 | ) |
| BUY | | JPY | | Deutsche Bank AG | | 283,497,791 | | 7/16/13 | | | 2,913,007 | | | | 2,858,565 | | | | (54,442 | ) |
| BUY | | JPY | | Goldman Sachs International | | 102,220,000 | | 7/16/13 | | | 1,052,895 | | | | 1,030,705 | | | | (22,190 | ) |
| BUY | | JPY | | UBS AG | | 166,143,000 | | 7/16/13 | | | 1,713,374 | | | | 1,675,253 | | | | (38,121 | ) |
| SELL | | JPY | | Barclays Bank PLC | | 11,320,000 | | 7/16/13 | | | 113,062 | | | | 114,142 | | | | (1,080 | ) |
| SELL | | JPY | | Credit Suisse Group | | 55,189,000 | | 7/16/13 | | | 537,829 | | | | 556,482 | | | | (18,653 | ) |
| SELL | | JPY | | Deutsche Bank AG | | 117,944,000 | | 7/16/13 | | | 1,175,304 | | | | 1,189,253 | | | | (13,949 | ) |
| SELL | | JPY | | Goldman Sachs International | | 871,500,706 | | 7/16/13 | | | 8,687,068 | | | | 8,787,517 | | | | (100,449 | ) |
| SELL | | MXN | | JPMorgan Chase Bank N.A. | | 4,000 | | 9/03/13 | | | 305 | | | | 307 | | | | (2 | ) |
| BUY | | PLN | | Citibank N.A. | | 5,416,875 | | 7/16/13 | | | 1,636,845 | | | | 1,628,824 | | | | (8,021 | ) |
| BUY | | SEK | | Deutsche Bank AG | | 5,752,903 | | 7/16/13 | | | 897,306 | | | | 857,581 | | | | (39,725 | ) |
| BUY | | SEK | | JPMorgan Chase Bank N.A. | | 1,190,000 | | 7/16/13 | | | 182,972 | | | | 177,391 | | | | (5,581 | ) |
| SELL | | SEK | | Barclays Bank PLC | | 268,000 | | 7/16/13 | | | 39,615 | | | | 39,952 | | | | (337 | ) |
| BUY | | THB | | JPMorgan Chase Bank N.A. | | 17,169,000 | | 7/18/13 | | | 588,181 | | | | 553,133 | | | | (35,048 | ) |
| | | | | | | | | | | | | | | | | | | | |
| | | | | | | | | | | | | | | | | | $ | (695,817 | ) |
| | | | | | | | | | | | | | | | | | | | |
7
MFS Global Governments Portfolio
FINANCIAL STATEMENTS | STATEMENT OF ASSETS AND LIABILITIES (unaudited)
This statement represents your fund’s balance sheet, which details the assets and liabilities comprising the total value of the fund.
| | | | | | | | |
At 6/30/13 | | | | | | | | |
Assets | | | | | | | | |
Investments – | | | | | | | | |
Non-affiliated issuers, at value (identified cost, $214,377,021) | | | $205,040,331 | | | | | |
Underlying affiliated funds, at cost and value | | | 15,289,929 | | | | | |
Total investments, at value (identified cost, $229,666,950) | | | $220,330,260 | | | | | |
Foreign currency, at value (identified cost, $45,587) | | | 45,548 | | | | | |
Receivables for | | | | | | | | |
Forward foreign currency exchange contracts | | | 835,492 | | | | | |
Fund shares sold | | | 1,543,329 | | | | | |
Interest | | | 2,612,571 | | | | | |
Other assets | | | 351 | | | | | |
Total assets | | | | | | | $225,367,551 | |
Liabilities | | | | | | | | |
Payables for | | | | | | | | |
Forward foreign currency exchange contracts | | | $695,817 | | | | | |
Investments purchased | | | 787,036 | | | | | |
Fund shares reacquired | | | 20,324 | | | | | |
Payable to affiliates | | | | | | | | |
Investment adviser | | | 18,723 | | | | | |
Shareholder servicing costs | | | 34 | | | | | |
Distribution and/or service fees | | | 76 | | | | | |
Payable for independent Trustees’ compensation | | | 1,667 | | | | | |
Accrued expenses and other liabilities | | | 43,258 | | | | | |
Total liabilities | | | | | | | $1,566,935 | |
Net assets | | | | | | | $223,800,616 | |
Net assets consist of | | | | | | | | |
Paid-in capital | | | $237,828,666 | | | | | |
Unrealized appreciation (depreciation) on investments and translation of assets and liabilities in foreign currencies | | | (9,208,541 | ) | | | | |
Accumulated net realized gain (loss) on investments and foreign currency | | | (6,418,663 | ) | | | | |
Undistributed net investment income | | | 1,599,154 | | | | | |
Net assets | | | | | | | $223,800,616 | |
Shares of beneficial interest outstanding | | | | | | | 21,650,874 | |
| | | | | | | | | | | | |
| | | Net assets | | | Shares
outstanding | | | Net asset value
per share | |
Initial Class | | | $220,998,373 | | | | 21,375,693 | | | | $10.34 | |
Service Class | | | 2,802,243 | | | | 275,181 | | | | 10.18 | |
See Notes to Financial Statements
8
MFS Global Governments Portfolio
FINANCIAL STATEMENTS | STATEMENT OF OPERATIONS (unaudited)
This statement describes how much your fund earned in investment income and accrued in expenses. It also describes any gains and/or losses generated by fund operations.
| | | | | | | | |
Six months ended 6/30/13 | | | | | |
Net investment income | | | | | |
Income | | | | | | | | |
Interest | | | $1,949,256 | | | | | |
Dividends from underlying affiliated funds | | | 10,608 | | | | | |
Total investment income | | | | | | | $1,959,864 | |
Expenses | | | | | | | | |
Management fee | | | $845,504 | | | | | |
Distribution and/or service fees | | | 3,370 | | | | | |
Shareholder servicing costs | | | 802 | | | | | |
Administrative services fee | | | 19,627 | | | | | |
Independent trustees’ compensation | | | 4,971 | | | | | |
Custodian fee | | | 25,755 | | | | | |
Shareholder communications | | | 3,234 | | | | | |
Audit and tax fees | | | 32,441 | | | | | |
Legal fees | | | 1,939 | | | | | |
Miscellaneous | | | 7,029 | | | | | |
Total expenses | | | | | | | $944,672 | |
Fees paid indirectly | | | (7 | ) | | | | |
Reduction of expenses by investment adviser | | | (740 | ) | | | | |
Net expenses | | | | | | | $943,925 | |
Net investment income | | | | | | | $1,015,939 | |
Realized and unrealized gain (loss) on investments and foreign currency | | | | | | | | |
Realized gain (loss) (identified cost basis) | | | | | | | | |
Investments | | | $(2,616,673 | ) | | | | |
Foreign currency | | | (2,714,808 | ) | | | | |
Net realized gain (loss) on investments and foreign currency | | | | | | | $(5,331,481 | ) |
Change in unrealized appreciation (depreciation) | | | | | | | | |
Investments | | | $(11,402,498 | ) | | | | |
Translation of assets and liabilities in foreign currencies | | | 1,154,450 | | | | | |
Net unrealized gain (loss) on investments and foreign currency translation | | | | | | | $(10,248,048 | ) |
Net realized and unrealized gain (loss) on investments and foreign currency | | | | | | | $(15,579,529 | ) |
Change in net assets from operations | | | | | | | $(14,563,590 | ) |
See Notes to Financial Statements
9
MFS Global Governments Portfolio
FINANCIAL STATEMENTS | STATEMENTS OF CHANGES IN NET ASSETS
These statements describe the increases and/or decreases in net assets resulting from operations, any distributions, and any shareholder transactions.
| | | | | | | | |
| |
| Six months ended
6/30/13
(unaudited |
) | |
| Year ended
12/31/12 |
|
Change in net assets | | | | | | | | |
| From operations | | | | | | | | |
Net investment income | | | $1,015,939 | | | | $505,308 | |
Net realized gain (loss) on investments and foreign currency | | | (5,331,481 | ) | | | (322,539 | ) |
Net unrealized gain (loss) on investments and foreign currency translation | | | (10,248,048 | ) | | | (1,604,280 | ) |
Change in net assets from operations | | | $(14,563,590 | ) | | | $(1,421,511 | ) |
| Distributions declared to shareholders | | | | | | | | |
From net investment income | | | $— | | | | $(996,242 | ) |
From tax return of capital | | | — | | | | (3,795 | ) |
Total distributions declared to shareholders | | | $— | | | | $(1,000,037 | ) |
Change in net assets from fund share transactions | | | $9,428,373 | | | | $194,488,112 | |
Total change in net assets | | | $(5,135,217 | ) | | | $192,066,564 | |
| Net assets | | | | | | | | |
At beginning of period | | | 228,935,833 | | | | 36,869,269 | |
At end of period (including undistributed net investment income of $1,599,154 and
$583,215, respectively) | | | $223,800,616 | | | | $228,935,833 | |
See Notes to Financial Statements
10
MFS Global Governments Portfolio
FINANCIAL STATEMENTS | FINANCIAL HIGHLIGHTS
The financial highlights table is intended to help you understand the fund’s financial performance for the semiannual period and the past 5 fiscal years. Certain information reflects financial results for a single fund share. The total returns in the table represent the rate by which an investor would have earned (or lost) on an investment in the fund share class (assuming reinvestment of all distributions) held for the entire period.
| | | | | | | | | | | | | | | | | | | | | | | | |
| Initial Class | | Six months
ended
6/30/13 | | | Years ended 12/31 | |
| | | | 2012 | | | 2011 | | | 2010 | | | 2009 | | | 2008 | |
| | | (unaudited) | | | | | | | | | | | | | | | | |
Net asset value, beginning of period | | | $11.03 | | | | $11.29 | | | | $11.00 | | | | $10.60 | | | | $11.59 | | | | $11.43 | |
| Income (loss) from investment operations | |
Net investment income (d) | | | $0.05 | | | | $0.11 | | | | $0.18 | | | | $0.18 | | | | $0.22 | | | | $0.26 | |
Net realized and unrealized gain (loss) on investments
and foreign currency | | | (0.74 | ) | | | (0.04 | ) | | | 0.49 | | | | 0.30 | | | | 0.13 | | | | 0.84 | |
Total from investment operations | | | $(0.69 | ) | | | $0.07 | | | | $0.67 | | | | $0.48 | | | | $0.35 | | | | $1.10 | |
| Less distributions declared to shareholders | |
From net investment income | | | $— | | | | $(0.33 | ) | | | $(0.26 | ) | �� | | $— | | | | $(1.34 | ) | | | $(0.94 | ) |
From net realized gain on investments | | | — | | | | — | | | | (0.12 | ) | | | (0.08 | ) | | | — | | | | — | |
From tax return of capital | | | — | | | | (0.00 | )(w) | | | — | | | | — | | | | — | | | | — | |
Total distributions declared to shareholders | | | $— | | | | $(0.33 | ) | | | $(0.38 | ) | | | $(0.08 | ) | | | $(1.34 | ) | | | $(0.94 | ) |
Net asset value, end of period (x) | | | $10.34 | | | | $11.03 | | | | $11.29 | | | | $11.00 | | | | $10.60 | | | | $11.59 | |
Total return (%) (k)(r)(s)(x) | | | (6.26 | )(n) | | | 0.64 | | | | 6.06 | | | | 4.61 | | | | 4.06 | | | | 10.12 | |
Ratios (%) (to average net assets)
and Supplemental data: | |
Expenses before expense reductions (f) | | | 0.84 | (a) | | | 0.98 | | | | 1.14 | | | | 1.15 | | | | 1.16 | | | | 1.09 | |
Expenses after expense reductions (f) | | | 0.83 | (a) | | | 0.98 | | | | 1.00 | | | | 1.00 | | | | 1.00 | | | | 1.00 | |
Net investment income | | | 0.90 | (a) | | | 0.96 | | | | 1.59 | | | | 1.64 | | | | 2.08 | | | | 2.31 | |
Portfolio turnover | | | 33 | (n) | | | 15 | | | | 70 | | | | 66 | | | | 84 | | | | 113 | |
Net assets at end of period (000 omitted) | | | $220,998 | | | | $226,668 | | | | $34,252 | | | | $30,047 | | | | $32,034 | | | | $36,813 | |
| | |
| Service Class | | Six months
ended
6/30/13 | | | Years ended 12/31 | |
| | | | 2012 | | | 2011 | | | 2010 | | | 2009 | | | 2008 | |
| | | (unaudited) | | | | | | | | | | | | | | | | |
Net asset value, beginning of period | | | $10.87 | | | | $11.13 | | | | $10.85 | | | | $10.48 | | | | $11.47 | | | | $11.32 | |
| Income (loss) from investment operations | |
Net investment income (d) | | | $0.03 | | | | $0.08 | | | | $0.15 | | | | $0.15 | | | | $0.19 | | | | $0.23 | |
Net realized and unrealized gain (loss) on investments
and foreign currency | | | (0.72 | ) | | | (0.04 | ) | | | 0.48 | | | | 0.30 | | | | 0.12 | | | | 0.84 | |
Total from investment operations | | | $(0.69 | ) | | | $0.04 | | | | $0.63 | | | | $0.45 | | | | $0.31 | | | | $1.07 | |
| Less distributions declared to shareholders | |
From net investment income | | | $— | | | | $(0.30 | ) | | | $(0.23 | ) | | | $— | | | | $(1.30 | ) | | | $(0.92 | ) |
From net realized gain on investments | | | — | | | | — | | | | (0.12 | ) | | | (0.08 | ) | | | — | | | | — | |
From tax return of capital | | | — | | | | (0.00 | )(w) | | | — | | | | — | | | | — | | | | — | |
Total distributions declared to shareholders | | | $— | | | | $(0.30 | ) | | | $(0.35 | ) | | | $(0.08 | ) | | | $(1.30 | ) | | | $(0.92 | ) |
Net asset value, end of period (x) | | | $10.18 | | | | $10.87 | | | | $11.13 | | | | $10.85 | | | | $10.48 | | | | $11.47 | |
Total return (%) (k)(r)(s)(x) | | | (6.35 | )(n) | | | 0.33 | | | | 5.75 | | | | 4.38 | | | | 3.77 | | | | 9.93 | |
Ratios (%) (to average net assets)
and Supplemental data: | |
Expenses before expense reductions (f) | | | 1.09 | (a) | | | 1.25 | | | | 1.39 | | | | 1.40 | | | | 1.41 | | | | 1.35 | |
Expenses after expense reductions (f) | | | 1.08 | (a) | | | 1.25 | | | | 1.25 | | | | 1.25 | | | | 1.25 | | | | 1.25 | |
Net investment income | | | 0.65 | (a) | | | 0.71 | | | | 1.34 | | | | 1.39 | | | | 1.78 | | | | 2.03 | |
Portfolio turnover | | | 33 | (n) | | | 15 | | | | 70 | | | | 66 | | | | 84 | | | | 113 | |
Net assets at end of period (000 omitted) | | | $2,802 | | | | $2,268 | | | | $2,617 | | | | $3,093 | | | | $3,573 | | | | $6,371 | |
See Notes to Financial Statements
11
MFS Global Governments Portfolio
Financial Highlights – continued
| (d) | | Per share data is based on average shares outstanding. |
| (f) | | Ratios do not reflect reductions from fees paid indirectly, if applicable. |
| (k) | | The total return does not reflect expenses that apply to separate accounts. Inclusion of these charges would reduce the total return figures for all periods shown. |
| (r) | | Certain expenses have been reduced without which performance would have been lower. |
| (s) | | From time to time the fund may receive proceeds from litigation settlements, without which performance would be lower. |
| (w) | | Per share amount was less than $0.01. |
| (x) | | The net asset values per share and total returns have been calculated on net assets which include adjustments made in accordance with U.S. generally accepted accounting principles required at period end for financial reporting purposes. |
See Notes to Financial Statements
12
MFS Global Governments Portfolio
NOTES TO FINANCIAL STATEMENTS (unaudited)
| (1) | | Business and Organization |
MFS Global Governments Portfolio (the fund) is a series of MFS Variable Insurance Trust II (the trust). The trust is organized as a Massachusetts business trust and is registered under the Investment Company Act of 1940, as amended, as an open-end management investment company. The shareholders of each series of the trust are separate accounts of insurance companies, which offer variable annuity and/or life insurance products, and qualified retirement and pension plans.
| (2) | | Significant Accounting Policies |
General – The preparation of financial statements in conformity with U.S. generally accepted accounting principles requires management to make estimates and assumptions that affect the reported amounts of assets and liabilities, and disclosure of contingent assets and liabilities at the date of the financial statements and the reported amounts of revenues and expenses during the reporting period. Actual results could differ from those estimates. In the preparation of these financial statements, management has evaluated subsequent events occurring after the date of the fund’s Statement of Assets and Liabilities through the date that the financial statements were issued. The fund invests in foreign securities. Investments in foreign securities are vulnerable to the effects of changes in the relative values of the local currency and the U.S. dollar and to the effects of changes in each country’s legal, political, and economic environment.
In this reporting period, the fund adopted the disclosure provisions of the Financial Accounting Standards Board (FASB) Accounting Standards Update 2011-11 (“ASU 2011-11”), Balance Sheet (Topic 210) – Disclosures about Offsetting Assets and Liabilities along with the related scope clarification provisions of FASB Accounting Standards Update 2013-01 (“ASU 2013-01”) entitled Balance Sheet (Topic 210) – Clarifying the Scope of Disclosures about Offsetting Assets and Liabilities. ASU 2011-11 is intended to enhance disclosures on the offsetting of financial assets and liabilities by requiring entities to disclose both gross and net information about financial instruments and transactions that are either offset in the statement of financial position or subject to a Master Netting Agreement or similar arrangement. ASU 2013-01 limits the scope of ASU 2011-11’s disclosure requirements on offsetting to financial assets and financial liabilities related to derivatives, repurchase and reverse repurchase agreements, and securities lending and securities borrowing transactions. The disclosures required by ASU 2011-11, to the extent applicable to the fund, have been included in the fund’s Significant Accounting Policies note under the captions for each of the fund’s in-scope financial instruments and transactions.
In June 2013, FASB issued Accounting Standards Update 2013-08 Financial Services – Investment Companies (Topic 946) – Amendments to the Scope, Measurement, and Disclosure Requirements (“ASU 2013-08”) which is effective for interim and annual reporting periods in fiscal years that begin after December 15, 2013. ASU 2013-08 sets forth a methodology for determining whether an entity should be characterized as an investment company and prescribes fair value accounting for an investment company’s non-controlling ownership interest in another investment company. FASB has determined that a fund registered under the Investment Company Act of 1940 automatically meets ASU 2013-08’s criteria for an investment company. Although still evaluating the potential impacts of ASU 2013-08 to the fund, management expects that the impact of the fund’s adoption will be limited to additional financial statement disclosures.
Investment Valuations – Debt instruments and floating rate loans (other than short-term instruments), including restricted debt instruments, are generally valued at an evaluated or composite bid as provided by a third-party pricing service. Short-term instruments with a maturity at issuance of 60 days or less generally are valued at amortized cost, which approximates market value. Forward foreign currency exchange contracts are generally valued at the mean of bid and asked prices for the time period interpolated from rates provided by a third-party pricing service for proximate time periods. Open-end investment companies are generally valued at net asset value per share. Securities and other assets generally valued on the basis of information from a third-party pricing service may also be valued at a broker/dealer bid quotation. Values obtained from third-party pricing services can utilize both transaction data and market information such as yield, quality, coupon rate, maturity, type of issue, trading characteristics, and other market data. The values of foreign securities and other assets and liabilities expressed in foreign currencies are converted to U.S. dollars using the mean of bid and asked prices for rates provided by a third-party pricing service.
The Board of Trustees has delegated primary responsibility for determining or causing to be determined the value of the fund’s investments (including any fair valuation) to the adviser pursuant to valuation policies and procedures approved by the Board. If the adviser determines that reliable market quotations are not readily available, investments are valued at fair value as determined in good faith by the adviser in accordance with such procedures under the oversight of the Board of Trustees. Under the fund’s valuation policies and procedures, market quotations are not considered to be readily available for most types of debt instruments and floating rate loans and many types of derivatives. These investments are generally valued at fair value based on information from third-party pricing services. In addition, investments may be valued at fair value if the adviser determines that an investment’s value has been materially affected by events occurring after the close of the exchange or market on which the investment is principally traded (such as foreign exchange or market) and prior to the determination of the fund’s net asset value, or after the halting of trading of a specific security where trading does not resume prior to the close of the exchange or market on which the security is principally traded. The adviser generally relies on third-party pricing services or other information (such as the correlation with price movements of similar securities in the same or other markets; the type, cost and investment characteristics of the security; the
13
MFS Global Governments Portfolio
Notes to Financial Statements (unaudited) – continued
business and financial condition of the issuer; and trading and other market data) to assist in determining whether to fair value and at what value to fair value an investment. The value of an investment for purposes of calculating the fund’s net asset value can differ depending on the source and method used to determine value. When fair valuation is used, the value of an investment used to determine the fund’s net asset value may differ from quoted or published prices for the same investment. There can be no assurance that the fund could obtain the fair value assigned to an investment if it were to sell the investment at the same time at which the fund determines its net asset value per share.
Various inputs are used in determining the value of the fund’s assets or liabilities. These inputs are categorized into three broad levels. In certain cases, the inputs used to measure fair value may fall into different levels of the fair value hierarchy. In such cases, an investment’s level within the fair value hierarchy is based on the lowest level of input that is significant to the fair value measurement. The fund’s assessment of the significance of a particular input to the fair value measurement in its entirety requires judgment, and considers factors specific to the investment. Level 1 includes unadjusted quoted prices in active markets for identical assets or liabilities. Level 2 includes other significant observable market-based inputs (including quoted prices for similar securities, interest rates, prepayment speed, and credit risk). Level 3 includes unobservable inputs, which may include the adviser’s own assumptions in determining the fair value of investments. Other financial instruments are derivative instruments not reflected in total investments, such as forward foreign currency exchange contracts. The following is a summary of the levels used as of June 30, 2013 in valuing the fund’s assets or liabilities:
| | | | | | | | | | | | | | | | |
| Investments at Value | | Level 1 | | | Level 2 | | | Level 3 | | | Total | |
| U.S. Treasury Bonds & U.S. Government Agency & Equivalents | | | $— | | | | $64,212,252 | | | | $— | | | | $64,212,252 | |
| Non-U.S. Sovereign Debt | | | — | | | | 136,397,090 | | | | — | | | | 136,397,090 | |
| Residential Mortgage-Backed Securities | | | — | | | | 1,464,064 | | | | — | | | | 1,464,064 | |
| Commercial Mortgage-Backed Securities | | | — | | | | 135,870 | | | | — | | | | 135,870 | |
| Foreign Bonds | | | — | | | | 2,831,055 | | | | — | | | | 2,831,055 | |
| Mutual Funds | | | 15,289,929 | | | | — | | | | — | | | | 15,289,929 | |
| Total Investments | | | $15,289,929 | | | | $205,040,331 | | | | $— | | | | $220,330,260 | |
| | | | |
| Other Financial Instruments | | | | | | | | | | | | |
| Forward Foreign Currency Exchange Contracts | | | $— | | | | $139,675 | | | | $— | | | | $139,675 | |
For further information regarding security characteristics, see the Portfolio of Investments.
Foreign Currency Translation – Purchases and sales of foreign investments, income, and expenses are converted into U.S. dollars based upon currency exchange rates prevailing on the respective dates of such transactions or on the reporting date for foreign denominated receivables and payables. Gains and losses attributable to foreign currency exchange rates on sales of securities are recorded for financial statement purposes as net realized gains and losses on investments. Gains and losses attributable to foreign exchange rate movements on receivables, payables, income and expenses are recorded for financial statement purposes as foreign currency transaction gains and losses. That portion of both realized and unrealized gains and losses on investments that results from fluctuations in foreign currency exchange rates is not separately disclosed.
Derivatives – The fund uses derivatives for different purposes, primarily to increase or decrease exposure to a particular market or segment of the market, or security, to increase or decrease interest rate or currency exposure, or as alternatives to direct investments. Derivatives are used for hedging or non-hedging purposes. While hedging can reduce or eliminate losses, it can also reduce or eliminate gains. When the fund uses derivatives as an investment to increase market exposure, or for hedging purposes, gains and losses from derivative instruments may be substantially greater than the derivative’s original cost.
The derivative instruments used by the fund were forward foreign currency exchange contracts. The fund’s period end derivatives, as presented in the Portfolio of Investments and the associated Derivative Contract tables, generally are indicative of the volume of its derivative activity during the period.
The following table presents, by major type of derivative contract, the fair value, on a gross basis, of the asset and liability components of derivatives held by the fund at June 30, 2013 as reported in the Statement of Assets and Liabilities:
| | | | | | | | | | |
| | | | | Fair Value | |
| Risk | | Derivative Contracts | | Asset Derivatives | | | Liability Derivatives | |
| Foreign Exchange | | Forward Foreign Currency Exchange | | | $835,492 | | | | $(695,817 | ) |
The following table presents, by major type of derivative contract, the realized gain (loss) on derivatives held by the fund for the six months ended June 30, 2013 as reported in the Statement of Operations:
| | | | |
| Risk | | Foreign Currency | |
| Foreign Exchange | | | $(2,696,255 | ) |
14
MFS Global Governments Portfolio
Notes to Financial Statements (unaudited) – continued
The following table presents, by major type of derivative contract, the change in unrealized appreciation (depreciation) on derivatives held by the fund for the six months ended June 30, 2013 as reported in the Statement of Operations:
| | | | |
| Risk | | Translation of
Assets and Liabilities in Foreign Currencies | |
| Foreign Exchange | | | $1,179,156 | |
Derivative counterparty credit risk is managed through formal evaluation of the creditworthiness of all potential counterparties. On certain, but not all, over-the-counter derivatives, the fund attempts to reduce its exposure to counterparty credit risk whenever possible by entering into an International Swaps and Derivatives Association (ISDA) Master Agreement on a bilateral basis with each of the counterparties with whom it undertakes a significant volume of transactions. The ISDA Master Agreement gives each party to the agreement the right to terminate all transactions traded under such agreement if there is a certain deterioration in the credit quality of the other party. Upon an event of default or a termination of the ISDA Master Agreement, the non-defaulting party has the right to close out all transactions traded under such agreement and to net amounts owed under each transaction to one net amount payable by one party to the other. This right to close out and net payments across all transactions traded under the ISDA Master Agreement could result in a reduction of the fund’s credit risk to such counterparty equal to any amounts payable by the fund under the applicable transactions, if any.
Collateral and margin requirements differ by type of derivative. Margin requirements are set by the broker or clearing house for cleared derivatives (i.e., futures contracts, cleared swaps and exchange-traded options) while collateral terms are contract specific for over-the-counter traded derivatives (i.e., forward foreign currency exchange contracts, uncleared swap agreements, and over-the-counter options). For derivatives traded under an ISDA Master Agreement, the collateral requirements are netted across all transactions traded under such agreement and one amount is posted from one party to the other to collateralize such obligations. Cash that has been segregated to cover the fund’s collateral or margin obligations under derivative contracts, if any, will be reported separately on the Statement of Assets and Liabilities as restricted cash. Securities pledged as collateral or margin for the same purpose, if any, is noted in the Portfolio of Investments.
The fund’s accounting policy with respect to balance sheet offsetting is that, absent an event of default by the counterparty or a termination of the agreement, the ISDA Master Agreement does not result in an offset of reported amounts of financial assets and financial liabilities in the Statement of Assets and Liabilities across transactions between the fund and the applicable counterparty.
Forward Foreign Currency Exchange Contracts – The fund entered into forward foreign currency exchange contracts for the purchase or sale of a specific foreign currency at a fixed price on a future date. These contracts may be used to hedge the fund’s currency risk or for non-hedging purposes. For hedging purposes, the fund may enter into contracts to deliver or receive foreign currency that the fund will receive from or use in its normal investment activities. The fund may also use contracts to hedge against declines in the value of foreign currency denominated securities due to unfavorable exchange rate movements. For non-hedging purposes, the fund may enter into contracts with the intent of changing the relative exposure of the fund’s portfolio of securities to different currencies to take advantage of anticipated exchange rate changes.
Forward foreign currency exchange contracts are adjusted by the daily exchange rate of the underlying currency and any unrealized gains or losses are recorded as a receivable or payable for forward foreign currency exchange contracts until the contract settlement date. On contract settlement date, any gain or loss on the contract is recorded as realized gains or losses on foreign currency.
Risks may arise upon entering into these contracts from unanticipated movements in the value of the contract and from the potential inability of counterparties to meet the terms of their contracts. Generally, the fund’s maximum risk due to counterparty credit risk is the unrealized gain on the contract due to the use of Continuous Linked Settlement, an industry accepted settlement system. This risk is mitigated in cases where there is an ISDA Master Agreement between the fund and the counterparty providing for netting as described above and for posting of collateral by the counterparty to the fund to cover the fund’s exposure to the counterparty under such ISDA Master Agreement.
Indemnifications – Under the fund’s organizational documents, its officers and Trustees may be indemnified against certain liabilities and expenses arising out of the performance of their duties to the fund. Additionally, in the normal course of business, the fund enters into agreements with service providers that may contain indemnification clauses. The fund’s maximum exposure under these agreements is unknown as this would involve future claims that may be made against the fund that have not yet occurred.
Investment Transactions and Income – Investment transactions are recorded on the trade date. Interest income is recorded on the accrual basis. All premium and discount is amortized or accreted for financial statement purposes in accordance with U.S. generally accepted accounting principles. Interest payments received in additional securities are recorded on the ex-interest date in an amount equal to the value of the security on such date.
15
MFS Global Governments Portfolio
Notes to Financial Statements (unaudited) – continued
The fund may receive proceeds from litigation settlements. Any proceeds received from litigation involving portfolio holdings are reflected in the Statement of Operations in realized gain/loss if the security has been disposed of by the fund or in unrealized gain/loss if the security is still held by the fund. Any other proceeds from litigation not related to portfolio holdings are reflected as other income in the Statement of Operations.
Fees Paid Indirectly – The fund’s custody fee may be reduced according to an arrangement that measures the value of cash deposited with the custodian by the fund. This amount, for the six months ended June 30, 2013, is shown as a reduction of total expenses in the Statement of Operations.
Tax Matters and Distributions – The fund intends to qualify as a regulated investment company, as defined under Subchapter M of the Internal Revenue Code, and to distribute all of its taxable income, including realized capital gains. As a result, no provision for federal income tax is required. The fund’s federal tax returns, when filed, will remain subject to examination by the Internal Revenue Service for a three year period.
Distributions to shareholders are recorded on the ex-dividend date. Income and capital gain distributions are determined in accordance with income tax regulations, which may differ from U.S. generally accepted accounting principles. Certain capital accounts in the financial statements are periodically adjusted for permanent differences in order to reflect their tax character. These adjustments have no impact on net assets or net asset value per share. Temporary differences which arise from recognizing certain items of income, expense, gain or loss in different periods for financial statement and tax purposes will reverse at some time in the future. Distributions in excess of net investment income or net realized gains are temporary overdistributions for financial statement purposes resulting from differences in the recognition or classification of income or distributions for financial statement and tax purposes.
Book/tax differences primarily relate to amortization and accretion of debt securities, straddle loss deferrals, and derivative transactions.
The tax character of distributions declared to shareholders for the last fiscal year is as follows:
| | | | |
| | | 12/31/12 | |
| Ordinary income (including any short-term capital gains) | | | $996,242 | |
| Tax return of capital (b) | | | 3,795 | |
| Total distributions | | | $1,000,037 | |
| | (b) | Distributions in excess of tax basis earnings and profits are reported in the financial statements as a tax return of capital. | |
The federal tax cost and the tax basis components of distributable earnings were as follows:
| | | | |
| As of 6/30/13 | | | | |
| Cost of investments | | | $231,503,390 | |
| Gross appreciation | | | 415,028 | |
| Gross depreciation | | | (11,588,158 | ) |
| Net unrealized appreciation (depreciation) | | | $(11,173,130 | ) |
| |
| As of 12/31/12 | | | | |
| Capital loss carryforwards | | | (142,224 | ) |
| Other temporary differences | | | (472,075 | ) |
| Net unrealized appreciation (depreciation) | | | 1,149,839 | |
The aggregate cost above includes prior fiscal year end tax adjustments, if applicable.
Under the Regulated Investment Company Modernization Act of 2010 (the “Act”), net capital losses recognized for fund fiscal years beginning after December 31, 2010 may be carried forward indefinitely, and their character is retained as short-term and/or long-term losses (“post-enactment losses”). Previously, net capital losses were carried forward for eight years and treated as short-term losses (“pre-enactment losses”). As a transition rule, the Act requires that all post-enactment net capital losses be used before pre-enactment net capital losses.
As of December 31, 2012, the fund had capital loss carryforwards available to offset future realized gains. Such post-enactment losses are characterized as follows:
| | | | |
| Short-Term | | | $(32,762 | ) |
| Long-Term | | | (109,462 | ) |
| Total | | | $(142,224 | ) |
Multiple Classes of Shares of Beneficial Interest – The fund offers multiple classes of shares, which differ in their respective distribution and/or service fees. The fund’s income, realized and unrealized gain (loss), and common expenses are allocated to
16
MFS Global Governments Portfolio
Notes to Financial Statements (unaudited) – continued
shareholders based on the daily net assets of each class. Dividends are declared separately for each class. Differences in per share dividend rates are generally due to differences in separate class expenses. The fund’s distributions declared to shareholders as reported in the Statements of Changes in Net Assets are presented by class as follows:
| | | | | | | | | | | | | | | | |
| | | From net investment
income | | | From tax return of
capital | |
| | | Six months ended
6/30/13 | | | Year ended
12/31/12 | | | Six months ended
6/30/13 | | | Year ended
12/31/12 | |
| Initial Class | | | $— | | | | $935,868 | | | | $— | | | | $3,565 | |
| Service Class | | | — | | | | 60,374 | | | | — | | | | 230 | |
| Total | | | $— | | | | $996,242 | | | | $— | | | | $3,795 | |
| (3) | | Transactions with Affiliates |
Investment Adviser – The fund has an investment advisory agreement with MFS to provide overall investment management and related administrative services and facilities to the fund. The management fee is computed daily and paid monthly at the following annual rates:
| | | | |
| First $300 million of average daily net assets | | | 0.75% | |
| Average daily net assets in excess of $300 million | | | 0.675% | |
Effective April 1, 2013, MFS has agreed in writing to reduce its management fee by a specified amount if certain MFS mutual fund assets exceed thresholds agreed to by MFS and the fund’s Board of Trustees. For the period April 1, 2013 through June 30, 2013, this management fee reduction amounted to $308, which is shown as a reduction of total expenses in the Statement of Operations. The management fee incurred for the six months ended June 30, 2013 was equivalent to an annual effective rate of 0.75% of the fund’s average daily net assets.
The investment adviser has agreed in writing to pay a portion of the fund’s total annual operating expenses, exclusive of interest, taxes, extraordinary expenses, brokerage and transaction costs, and investment-related expenses, such that total annual operating expenses do not exceed 1.00% of average daily net assets for the Initial Class shares and 1.25% of average daily net assets for the Service Class shares. This written agreement will continue until modified by the fund’s Board of Trustees, but such agreement will continue at least until April 30, 2015. For the six months ended June 30, 2013, the fund’s actual operating expenses did not exceed the limit and therefore, the investment adviser did not pay any portion of the fund’s expenses related to this agreement.
Distributor – MFS Fund Distributors, Inc. (MFD), a wholly-owned subsidiary of MFS, is the distributor of shares of the fund. The Trustees have adopted a distribution plan for the Service Class shares pursuant to Rule 12b-1 under the Investment Company Act of 1940.
The fund’s distribution plan provides that the fund will pay MFD distribution and/or service fees equal to 0.25% per annum of its average daily net assets attributable to Service Class shares as partial consideration for services performed and expenses incurred by MFD and financial intermediaries (including participating insurance companies that invest in the fund to fund variable annuity and variable life insurance contracts, sponsors of qualified retirement and pension plans that invest in the fund, and affiliates of these participating insurance companies and plan sponsors) in connection with the sale and distribution of the Service Class shares. MFD may subsequently pay all, or a portion, of the distribution and/or service fees to financial intermediaries.
Shareholder Servicing Agent – Effective April 1, 2013, MFS Service Center, Inc. (MFSC), a wholly-owned subsidiary of MFS, receives a fee from the fund for its services as shareholder servicing agent. For the period from April 1, 2013 through June 30, 2013, the fee was $800, which equated to 0.0007% annually of the fund’s average daily net assets. MFSC also receives payment from the fund for out-of-pocket expenses paid by MFSC on behalf of the fund. For the period from April 1, 2013 through June 30, 2013, these costs amounted to $2.
Administrator – MFS provides certain financial, legal, shareholder communications, compliance, and other administrative services to the fund. Under an administrative services agreement, the fund partially reimburses MFS the costs incurred to provide these services. The fund is charged an annual fixed amount of $17,500 plus a fee based on average daily net assets. The administrative services fee incurred for the six months ended June 30, 2013 was equivalent to an annual effective rate of 0.0174% of the fund’s average daily net assets.
Trustees’ and Officers’ Compensation – The fund pays compensation to independent Trustees in the form of a retainer, attendance fees, and additional compensation to Board and Committee chairpersons. The fund does not pay compensation directly to Trustees or officers of the fund who are also officers of the investment adviser, all of whom receive remuneration for their services to the fund from MFS. Certain officers and Trustees of the fund are officers or directors of MFS, MFD, and MFSC.
Other – This fund and certain other funds managed by MFS (the funds) have entered into services agreements (the Agreements) which provide for payment of fees by the funds to Tarantino LLC and Griffin Compliance LLC in return for the provision of services of an Independent Chief Compliance Officer (ICCO) and Assistant ICCO, respectively, for the funds. The ICCO and Assistant ICCO are
17
MFS Global Governments Portfolio
Notes to Financial Statements (unaudited) – continued
officers of the funds and the sole members of Tarantino LLC and Griffin Compliance LLC, respectively. The funds can terminate the Agreements with Tarantino LLC and Griffin Compliance LLC at any time under the terms of the Agreements. For the six months ended June 30, 2013, the aggregate fees paid by the fund to Tarantino LLC and Griffin Compliance LLC were $903 and are included in “Miscellaneous” expense in the Statement of Operations. MFS has agreed to reimburse the fund for a portion of the payments made by the fund in the amount of $432, which is shown as a reduction of total expenses in the Statement of Operations. Additionally, MFS has agreed to bear all expenses associated with office space, other administrative support, and supplies provided to the ICCO and Assistant ICCO.
The fund invests in the MFS Institutional Money Market Portfolio which is managed by MFS and seeks current income consistent with preservation of capital and liquidity. Income earned on this investment is included in “Dividends from underlying affiliated funds” in the Statement of Operations. This money market fund does not pay a management fee to MFS.
Purchases and sales of investments, other than and short-term obligations, were as follows:
| | | | | | | | |
| | | Purchases | | | Sales | |
| U.S. Government securities | | | $22,627,058 | | | | $20,129,658 | |
| Investments (non-U.S. Government securities) | | | $54,550,008 | | | | $50,349,042 | |
| (5) | | Shares of Beneficial Interest |
The fund’s Declaration of Trust permits the Trustees to issue an unlimited number of full and fractional shares of beneficial interest. Transactions in fund shares were as follows:
| | | | | | | | | | | | | | | | |
| | | Six months ended 6/30/13 | | | Year ended 12/31/12 | |
| | | Shares | | | Amount | | | Shares | | | Amount | |
| Shares sold | | | | | | | | | | | | | | | | |
Initial Class | | | 1,336,594 | | | | $14,229,101 | | | | 18,036,331 | | | | $200,579,042 | |
Service Class | | | 89,151 | | | | 939,718 | | | | 54,810 | | | | 604,238 | |
| | | 1,425,745 | | | | $15,168,819 | | | | 18,091,141 | | | | $201,183,280 | |
| Shares issued to shareholders in reinvestment of distributions | | | | | | | | | | | | | | | | |
Initial Class | | | — | | | | $— | | | | 85,248 | | | | $939,433 | |
Service Class | | | — | | | | — | | | | 5,565 | | | | 60,604 | |
| | | — | | | | $— | | | | 90,813 | | | | $1,000,037 | |
| Shares reacquired | | | | | | | | | | | | | | | | |
Initial Class | | | (517,250 | ) | | | $(5,503,957 | ) | | | (599,556 | ) | | | $(6,730,887 | ) |
Service Class | | | (22,519 | ) | | | (236,489 | ) | | | (86,883 | ) | | | (964,318 | ) |
| | | (539,769 | ) | | | $(5,740,446 | ) | | | (686,439 | ) | | | $(7,695,205 | ) |
| Net change | | | | | | | | | | | | | | | | |
Initial Class | | | 819,344 | | | | $8,725,144 | | | | 17,522,023 | | | | $194,787,588 | |
Service Class | | | 66,632 | | | | 703,229 | | | | (26,508 | ) | | | (299,476 | ) |
| | | 885,976 | | | | $9,428,373 | | | | 17,495,515 | | | | $194,488,112 | |
The fund is one of several mutual funds in which the MFS funds-of-funds may invest. The MFS funds-of-funds do not invest in the underlying MFS funds for the purpose of exercising management or control. At the end of the period, the MFS Moderate Allocation Portfolio, the MFS Conservative Allocation Portfolio and the MFS Growth Allocation Portfolio were the owners of record of approximately 44%, 33%, and 10%, respectively, of the value of outstanding voting shares of the fund.
The fund and certain other funds managed by MFS participate in a $1.1 billion unsecured committed line of credit, subject to a $1 billion sublimit, provided by a syndication of banks under a credit agreement. Borrowings may be made for temporary financing needs. Interest is charged to each fund, based on its borrowings, generally at a rate equal to the higher of the Federal Reserve funds rate or one month LIBOR plus an agreed upon spread. A commitment fee, based on the average daily, unused portion of the committed line of credit, is allocated among the participating funds at the end of each calendar quarter. In addition, the fund and other funds managed by MFS have established unsecured uncommitted borrowing arrangements with certain banks for temporary financing needs. Interest is charged to each fund, based on its borrowings, at a rate equal to the Federal Reserve funds rate plus an agreed upon spread. For the six months ended June 30, 2013, the fund’s commitment fee and interest expense were $606 and $0, respectively, and are included in “Miscellaneous” expense in the Statement of Operations.
18
MFS Global Governments Portfolio
Notes to Financial Statements (unaudited) – continued
| (7) | | Transactions in Underlying Affiliated Funds – Affiliated Issuers |
An affiliated issuer may be considered one in which the fund owns 5% or more of the outstanding voting securities, or a company which is under common control. For the purposes of this report, the fund assumes the following to be an affiliated issuer:
| | | | | | | | | | | | | | |
| Underlying Affiliated Fund | | Beginning Shares/Par Amount | | Acquisitions Shares/Par Amount | | | Dispositions Shares/Par Amount | | | Ending Shares/Par Amount | |
| MFS Institutional Money Market Portfolio | | 11,270,805 | | | 62,760,250 | | | | (58,741,126 | ) | | | 15,289,929 | |
| | | | |
| Underlying Affiliated Fund | | Realized Gain (Loss) | | Capital Gain Distributions | | | Dividend Income | | | Ending Value | |
| MFS Institutional Money Market Portfolio | | $— | | | $— | | | | $10,608 | | | | $15,289,929 | |
19
MFS Global Governments Portfolio
BOARD REVIEW OF INVESTMENT ADVISORY AGREEMENT
A discussion regarding the Board’s most recent review and renewal of the fund’s Investment Advisory Agreement with MFS will be available on or about November 1, 2013 by clicking on the fund’s name under ”Variable Insurance Portfolios — VIT II“ in the “Products” section of the MFS Web site (mfs.com).
PROXY VOTING POLICIES AND INFORMATION
A general description of the MFS funds’ proxy voting policies and procedures is available without charge, upon request, by calling 1-800-225-2606, by visiting the Proxy Voting section of mfs.com or by visiting the SEC’s Web site at http://www.sec.gov.
Information regarding how the fund voted proxies relating to portfolio securities during the most recent twelve-month period ended June 30 is available without charge by visiting the Proxy Voting section of mfs.com or by visiting the SEC’s Web site at http://www.sec.gov.
QUARTERLY PORTFOLIO DISCLOSURE
The fund will file a complete schedule of portfolio holdings with the Securities and Exchange Commission (the Commission) for the first and third quarters of each fiscal year on Form N-Q. The fund’s Form N-Q is available on the EDGAR database on the Commission’s Internet Web site at http://www.sec.gov, and may be reviewed and copied at the:
Public Reference Room
Securities and Exchange Commission
100 F Street, NE, Room 1580
Washington, D.C. 20549
Information on the operation of the Public Reference Room may be obtained by calling the Commission at 1-800-SEC-0330. Copies of the fund’s Form N-Q also may be obtained, upon payment of a duplicating fee, by electronic request at the following e-mail address: publicinfo@sec.gov or by writing the Public Reference Section at the above address.
FURTHER INFORMATION
From time to time, MFS may post important information about the fund or the MFS funds on the MFS web site (mfs.com). This information is available by visiting the ”News & Commentary“ section of mfs.com or by clicking on the fund’s name under ”Variable Insurance Portfolios — VIT II“ in the ”Products“ section of mfs.com.
20
SEMIANNUAL REPORT
June 30, 2013

MFS® MONEY MARKET PORTFOLIO
MFS® Variable Insurance Trust II

MKS-SEM
MFS® MONEY MARKET PORTFOLIO
CONTENTS
The report is prepared for the general information of contract owners. It is authorized for distribution to prospective investors only when preceded or accompanied by a current prospectus.
NOT FDIC INSURED Ÿ MAY LOSE VALUE Ÿ NO BANK OR CREDIT UNION GUARANTEE Ÿ NOT A DEPOSIT Ÿ NOT INSURED BY ANY FEDERAL GOVERNMENT AGENCY OR NCUA/NCUSIF
MFS Money Market Portfolio
LETTER FROM THE CHAIRMAN AND CEO

Dear Contract Owners:
As the year progresses, the global economy continues to grind ahead slowly, held back by broad austerity measures. The U.S. economy remains a steadying force, driven by resilient consumers, who have taken the payroll tax increase and the sequestration’s early impact in stride. With U.S. housing and jobs showing steady expansion, domestic consumer-driven growth has offset weaker exports and the U.S. government’s spending constraints. In response to these developments, the U.S. Federal Reserve has begun to brace investors for an eventual shift in its monetary policy, causing global market tremors.
Japan has been another bright spot, with government and central bank stimulus policies leading to increased exports, a resurgent stock market and improved economic sentiment. After a six-month rally, Japan’s stocks slipped late in the second quarter, then picked up momentum on fresh signs that the country could soon break free of its chronic deflation. The major deterrent to global growth remains the eurozone, still in the grip of persistent recession. China has seen its pace of economic growth decelerate, a troubling turn for the country’s trading partners, who have come to rely on it as an engine for global growth.
As always, managing risk in the face of uncertainty remains a top priority for investors. At MFS®, our uniquely collaborative investment process employs integrated, global research and active risk management. Our global team of investment professionals shares ideas and evaluates opportunities across continents, investment disciplines and asset classes — all with a goal of building better insights, and ultimately better results, for our clients.
We are mindful of the many economic challenges investors face, and believe it is more important than ever to maintain a long-term view and employ time-tested principles, such as asset allocation and diversification. We remain confident that our unique approach can serve investors well as they work with their financial advisors to identify and pursue the most suitable opportunities.
Respectfully,

Robert J. Manning
Chairman and Chief Executive Officer
MFS Investment Management®
August 16, 2013
The opinions expressed in this letter are subject to change, may not be relied upon for investment advice, and no forecasts can be guaranteed.
1
MFS Money Market Portfolio
PORTFOLIO COMPOSITION
Portfolio structure (u)

| | | | |
| Composition including fixed income credit quality (a)(u) | |
| A-1+ | | | 30.5% | |
| A-1 | | | 66.5% | |
| A-2 | | | 3.0% | |
| Not Rated | | | 0.0% | |
| Cash & Other (o) | | | (0.0)% | |
| | | | |
| Maturity breakdown (u) | | | | |
| 0 - 7 days | | | 16.5% | |
| 8 - 29 days | | | 35.3% | |
| 30 - 59 days | | | 15.7% | |
| 60 - 89 days | | | 12.8% | |
| 90 - 365 days | | | 19.7% | |
| Other Assets Less Liabilities (o) | | | (0.0)% | |
| (a) | Ratings are assigned to portfolio securities utilizing ratings from Moody’s, Fitch, and Standard & Poor’s rating agencies and applying the following hierarchy: If all three agencies provide a rating, the middle rating (after dropping the highest and lowest ratings) is assigned; if two of the three agencies rate a security, the lower of the two is assigned. Cash & Other portfolio assets that are not securities are not included in the categories mentioned above. Ratings are shown in the S&P scale. All ratings are subject to change. The fund is not rated by these agencies. |
| (u) | For purposes of this presentation, accrued interest, where applicable, is included. |
From time to time, “Other Assets Less Liabilities”, may be negative due to timing of cash receipts.
Percentages are based on net assets as of 6/30/13.
The portfolio is actively managed and current holdings may be different.
2
MFS Money Market Portfolio
EXPENSE TABLE
Fund Expenses Borne by the Contract Holders During the Period,
January 1, 2013 through June 30, 2013
As a contract holder of the fund, you incur ongoing costs, including management fees; distribution and/or service (12b-1) fees; and other fund expenses. This example is intended to help you understand your ongoing costs (in dollars) of investing in the fund and to compare these costs with the ongoing costs of investing in other mutual funds.
The example is based on an investment of $1,000 invested at the beginning of the period and held for the entire period January 1, 2013 through June 30, 2013.
Actual Expenses
The first line for each share class in the following table provides information about actual account values and actual expenses. You may use the information in this line, together with the amount you invested, to estimate the expenses that you paid over the period. Simply divide your account value by $1,000 (for example, an $8,600 account value divided by $1,000 = 8.6), then multiply the result by the number in the first line under the heading entitled “Expenses Paid During Period” to estimate the expenses you paid on your account during this period.
Hypothetical Example for Comparison Purposes
The second line for each share class in the following table provides information about hypothetical account values and hypothetical expenses based on the fund’s actual expense ratio and an assumed rate of return of 5% per year before expenses, which is not the fund’s actual return. The hypothetical account values and expenses may not be used to estimate the actual ending account balance or expenses you paid for the period. You may use this information to compare the ongoing costs of investing in the fund and other funds. To do so, compare this 5% hypothetical example with the 5% hypothetical examples that appear in the shareholder reports of the other funds.
Please note that the expenses shown in the table are meant to highlight the fund’s ongoing costs only and do not take into account the fees and expenses imposed under the variable contracts through which your investment in the fund is made. Therefore, the second line for each share class in the table is useful in comparing ongoing costs associated with an investment in vehicles (such as the fund) which fund benefits under variable annuity and variable life insurance contracts and to qualified pension and retirement plans only, and will not help you determine the relative total costs of investing in the fund through variable annuity and variable life insurance contracts. If the fees and expenses imposed under the variable contracts were included, your costs would have been higher.
| | | | | | | | | | | | | | | | | | |
| Share Class | | | | Annualized Expense Ratio | | | Beginning Account Value 1/01/13 | | | Ending Account Value 6/30/13 | | | Expenses Paid During Period (p)
1/01/13-6/30/13 | |
| Initial Class | | Actual | | | 0.14% | | | | $1,000.00 | | | | $1,000.00 | | | | $0.69 | |
| | Hypothetical (h) | | | 0.14% | | | | $1,000.00 | | | | $1,024.10 | | | | $0.70 | |
| Service Class | | Actual | | | 0.14% | | | | $1,000.00 | | | | $1,000.00 | | | | $0.69 | |
| | Hypothetical (h) | | | 0.14% | | | | $1,000.00 | | | | $1,024.10 | | | | $0.70 | |
| (h) | 5% class return per year before expenses. |
| (p) | Expenses paid are equal to each class’s annualized expense ratio, as shown above, multiplied by the average account value over the period, multiplied by the number of days in the period, divided by the number of days in the year. |
Expense Changes Impacting Table
As more fully disclosed in footnote 3 to the financial statements, the expense ratios reported above include additional expense reductions to avoid a negative yield.
3
MFS Money Market Portfolio
PORTFOLIO OF INVESTMENTS – 6/30/13 (unaudited)
The Portfolio of Investments is a complete list of all securities owned by your fund. It is categorized by broad-based asset classes.
| | | | | | | | |
| Issuer | | Shares/Par | | | Value ($) | |
| | | | | | | | |
| CERTIFICATES OF DEPOSIT – 16.3% | | | | | |
| Major Banks – 8.4% | | | | | | | | |
| Bank of Montreal/Chicago Branch, 0.15%, due 7/22/13 | | $ | 10,825,000 | | | $ | 10,825,000 | |
| Bank of Montreal/Chicago Branch, 0.25%, due 9/09/13 | | | 8,825,000 | | | | 8,825,000 | |
Canadian Imperial Bank of
Commerce/New York Branch,
0.06%, due 7/15/13 | | | 1,000,000 | | | | 1,000,000 | |
| Chase Bank USA N.A., 0.22%, due 12/04/13 | | | 1,700,000 | | | | 1,700,000 | |
| Toronto Dominion Holdings (USA), Inc., 0.125%, due 7/19/13 | | | 4,935,000 | | | | 4,935,000 | |
| Toronto Dominion Holdings (USA), Inc., 0.115%, due 7/18/13 | | | 14,740,000 | | | | 14,740,000 | |
| | | | | | | | |
| | | | | | $ | 42,025,000 | |
| | | | | | | | |
| Other Banks & Diversified Financials – 7.9% | | | | | |
| Branch Banking & Trust Co, 0.15%, due 7/01/13 | | $ | 16,635,000 | | | $ | 16,635,000 | |
| Branch Banking & Trust Co., 0.17%, due 7/19/13 | | | 2,975,000 | | | | 2,975,000 | |
| Mizuho Corporate Bank (USA)/New York Branch, 0.22%, due 9/17/13 | | | 19,670,000 | | | | 19,670,000 | |
| | | | | | | | |
| | | | | | $ | 39,280,000 | |
| | | | | | | | |
| Total Certificates of Deposit, at Cost and Value | | | $ | 81,305,000 | |
| | | | | | | | |
|
| COMMERCIAL PAPER (y) – 48.3% | |
| Automotive – 6.4% | | | | | | | | |
| American Honda Finance Corp., 0.1%, due 8/06/13 | | $ | 4,616,000 | | | $ | 4,615,538 | |
| American Honda Finance Corp., 0.15%, due 7/17/13 | | | 1,000,000 | | | | 999,933 | |
| American Honda Finance Corp., 0.12%, due 8/28/13 | | | 13,640,000 | | | | 13,637,363 | |
| Toyota Motor Credit Corp., 0.14%, due 7/03/13 | | | 5,853,000 | | | | 5,852,954 | |
| Toyota Motor Credit Corp., 0.1%, due 7/11/13 | | | 6,704,000 | | | | 6,703,814 | |
| | | | | | | | |
| | | | | | $ | 31,809,602 | |
| | | | | | | | |
| Consumer Products – 3.9% | | | | | | | | |
| Procter & Gamble Co., 0.11%, due 8/30/13 (t) | | $ | 19,543,000 | | | $ | 19,539,417 | |
| | | | | | | | |
| Electronics – 3.9% | | | | | | | | |
| Emerson Electric Co., 0.07%, due 7/25/13 (t) | | $ | 3,917,000 | | | $ | 3,916,817 | |
| Emerson Electric Co., 0.11%, due 7/25/13 (t) | | | 15,350,000 | | | | 15,348,874 | |
| | | | | | | | |
| | | | | | $ | 19,265,691 | |
| | | | | | | | |
| Food & Beverages – 10.7% | | | | | | | | |
| Anheuser-Busch InBev Worldwide, Inc., 0.21%, due 9/18/13 (t) | | $ | 2,200,000 | | | $ | 2,198,986 | |
| | | | | | | | |
| Issuer | | Shares/Par | | | Value ($) | |
| | | | | | | | |
| COMMERCIAL PAPER (y) – continued | |
| Food & Beverages – continued | | | | | | | | |
| Anheuser-Busch InBev Worldwide, Inc., 0.23%, due 7/02/13 (t) | | $ | 10,388,000 | | | $ | 10,387,934 | |
| Anheuser-Busch InBev Worldwide, Inc., 0.24%, due 8/21/13 (t) | | | 1,555,000 | | | | 1,554,471 | |
| Coca-Cola Co., 0.15%, due 7/12/13 (t) | | | 2,527,000 | | | | 2,526,884 | |
| Coca-Cola Co., 0.11%, due 8/07/13 (t) | | | 11,598,000 | | | | 11,596,689 | |
| Coca-Cola Co., 0.15%, due 8/19/13 (t) | | | 2,760,000 | | | | 2,759,437 | |
| Coca-Cola Co., 0.17%, due 10/21/13 (t) | | | 2,658,000 | | | | 2,656,594 | |
| PepsiCo, Inc., 0.07%, due 8/05/13 (t) | | | 7,575,000 | | | | 7,574,484 | |
| PepsiCo, Inc., 0.06%, due 7/18/13 (t) | | | 12,103,000 | | | | 12,102,657 | |
| | | | | | | | |
| | | | | | $ | 53,358,136 | |
| | | | | | | | |
| Major Banks – 9.7% | | | | | | | | |
| ANZ National (International) Ltd., 0.24%, due 10/09/13 (t) | | $ | 11,894,000 | | | $ | 11,886,071 | |
| JPMorgan Chase & Co., 0.25%, due 7/15/13 | | | 2,256,000 | | | | 2,255,781 | |
| JPMorgan Chase & Co., 0.3%, due 11/04/13 (t) | | | 14,800,000 | | | | 14,784,460 | |
| Wells Fargo & Co., 0.18%, due 12/06/13 | | | 19,710,000 | | | | 19,694,429 | |
| | | | | | | | |
| | | | | | $ | 48,620,741 | |
| | | | | | | | |
| Other Banks & Diversified Financials – 3.9% | | | | | |
| General Electric Capital Corp., 0.08%, due 7/29/13 | | $ | 19,720,000 | | | $ | 19,718,773 | |
| | | | | | | | |
| Pharmaceuticals – 3.9% | | | | | | | | |
| Merck & Co., Inc., 0.08%, due 7/19/13 (t) | | $ | 5,060,000 | | | $ | 5,059,798 | |
| Merck & Co., Inc., 0.08%, due 7/17/13 (t) | | | 14,518,000 | | | | 14,517,484 | |
| | | | | | | | |
| | | | | | $ | 19,577,282 | |
| | | | | | | | |
| Retailers – 2.1% | | | | | | | | |
| Wal-Mart Stores, Inc., 0.06%, due 7/02/13 (t) | | $ | 10,265,000 | | | $ | 10,264,983 | |
| | | | | | | | |
| Tobacco – 3.8% | | | | | | | | |
| Philip Morris International, Inc., 0.08%, due 7/16/13 (t) | | $ | 10,900,000 | | | $ | 10,899,637 | |
| Philip Morris International, Inc., 0.07%, due 7/16/13 (t) | | | 8,281,000 | | | | 8,280,758 | |
| | | | | | | | |
| | | | | | $ | 19,180,395 | |
| | | | | | | | |
Total Commercial Paper,
at Amortized Cost and Value | | | $ | 241,335,020 | |
| | | | | | | | |
|
U.S. GOVERNMENT AGENCIES AND
EQUIVALENTS (y) – 29.7% | |
| Fannie Mae, 0.06%, due 7/10/13 | | $ | 19,880,000 | | | $ | 19,879,702 | |
| Federal Home Loan Bank, 0.065%, due 7/26/13 | | | 1,220,000 | | | | 1,219,949 | |
| Federal Home Loan Bank, 0.058%, due 7/31/13 | | | 19,590,000 | | | | 19,589,053 | |
| Federal Home Loan Bank, 0.065%, due 8/16/13 | | | 10,960,000 | | | | 10,959,090 | |
4
MFS Money Market Portfolio
Portfolio of Investments (unaudited) – continued
| | | | | | | | |
| Issuer | | Shares/Par | | | Value ($) | |
| | | | | | | | |
| U.S. GOVERNMENT AGENCIES AND EQUIVALENTS (y) – continued | | | | | |
| Freddie Mac, 0.109%, due 7/22/13 | | $ | 5,800,000 | | | $ | 5,799,631 | |
| U.S. Treasury Bills, 0.105%, due 7/05/13 | | | 10,500,000 | | | | 10,499,878 | |
| U.S. Treasury Bills, 0.06%, due 7/11/13 | | | 10,000,000 | | | | 9,999,833 | |
| U.S. Treasury Bills, 0.03%, due 7/18/13 | | | 19,950,000 | | | | 19,949,717 | |
| U.S. Treasury Bills, 0.03%, due 7/25/13 | | | 2,500,000 | | | | 2,499,950 | |
| U.S. Treasury Bills, 0.098%, due 10/03/13 | | | 30,000,000 | | | | 29,992,363 | |
| U.S. Treasury Bills, 0.093%, due 10/10/13 | | | 5,000,000 | | | | 4,998,702 | |
| U.S. Treasury Bills, 0.085%, due 12/05/13 | | | 12,000,000 | | | | 11,995,552 | |
| U.S. Treasury Bills, 0.09%, due 12/19/13 | | | 1,000,000 | | | | 999,573 | |
| | | | | | | | |
| Total U.S. Government Agencies and Equivalents, at Amortized Cost and Value | | | $ | 148,382,993 | |
| | | | | | | | |
|
| FLOATING RATE DEMAND NOTES – 2.7% | |
| East Baton Rouge, LA, Pollution Control Rev. (Exxon Mobil Corp.), 0.03%, due 7/01/13 | | $ | 3,300,000 | | | $ | 3,300,000 | |
| Lincoln County, WY, Pollution Control Rev. (Exxon Mobil Corp.), 0.03%, due 7/01/13 | | | 7,200,000 | | | | 7,200,000 | |
| Lincoln County, WY, Pollution Control Rev. (Exxon Mobil Corp.), “C”, 0.04%, due 7/01/13 | | | 3,200,000 | | | | 3,200,000 | |
| | | | | | | | |
Total Floating Rate Demand Notes,
at Cost and Value | | | $ | 13,700,000 | |
| | | | | | | | |
| | | | | | | | |
| Issuer | | Shares/Par | | | Value ($) | |
| | | | | | | | |
| REPURCHASE AGREEMENTS – 3.0% | | | | | |
| Goldman Sachs, 0.11%, dated 6/28/13, due 7/01/13, total to be received $14,994,137 (secured by U.S. Treasury and Federal Agency obligations valued at $15,293,930 in a jointly traded account), at Cost and Value | | $ | 14,994,000 | | | $ | 14,994,000 | |
| | | | | | | | |
Total Investments,
at Amortized Cost and Value | | | $ | 499,717,013 | |
| | | | | | | | |
OTHER ASSETS, LESS
LIABILITIES – (0.0)% | | | | | | | (93,529 | ) |
| | | | | | | | |
| Net Assets – 100.0% | | | | | | $ | 499,623,484 | |
| | | | | | | | |
| (t) | | Security exempt from registration with the U.S. Securities and Exchange Commission under Section 4(2) of the Securities Act of 1933. |
| (y) | | The rate shown represents an annualized yield at time of purchase. |
See Notes to Financial Statements
5
MFS Money Market Portfolio
FINANCIAL STATEMENTS | STATEMENT OF ASSETS AND LIABILITIES (unaudited)
This statement represents your fund’s balance sheet, which details the assets and liabilities comprising the total value of the fund.
| | | | | | | | |
At 6/30/13 | | | | | | | | |
Assets | | | | | | | | |
Investments, at amortized cost and value | | | $499,717,013 | | | | | |
Cash | | | 193 | | | | | |
Receivables for | | | | | | | | |
Fund shares sold | | | 996,376 | | | | | |
Interest | | | 18,689 | | | | | |
Other assets | | | 1,780 | | | | | |
Total assets | | | | | | | $500,734,051 | |
Liabilities | | | | | | | | |
Payable for fund shares reacquired | | | $1,057,576 | | | | | |
Payable to affiliates | | | | | | | | |
Investment adviser | | | 4,554 | | | | | |
Shareholder servicing costs | | | 131 | | | | | |
Payable for independent Trustees’ compensation | | | 2,836 | | | | | |
Accrued expenses and other liabilities | | | 45,470 | | | | | |
Total liabilities | | | | | | | $1,110,567 | |
Net assets | | | | | | | $499,623,484 | |
Net assets consist of | | | | | | | | |
Paid-in capital | | | $499,846,193 | | | | | |
Accumulated net realized gain (loss) on investments | | | (222,709 | ) | | | | |
Net assets | | | | | | | $499,623,484 | |
Shares of beneficial interest outstanding | | | | | | | 499,847,288 | |
| | | | | | | | | | | | |
| | | Net assets | | | Shares
outstanding | | | Net asset value
per share | |
Initial Class | | | $238,569,006 | | | | 238,694,291 | | | | $1.00 | |
Service Class | | | 261,054,478 | | | | 261,152,997 | | | | 1.00 | |
See Notes to Financial Statements
6
MFS Money Market Portfolio
FINANCIAL STATEMENTS | STATEMENT OF OPERATIONS (unaudited)
This statement describes how much your fund earned in investment income and accrued in expenses. It also describes any gains and/or losses generated by fund operations.
| | | | | | | | |
Six months ended 6/30/13 | | | | | | | | |
Net investment income | | | | | | | | |
| Interest income | | | | | | | $356,133 | |
Expenses | | | | | | | | |
Management fee | | | $1,248,064 | | | | | |
Distribution and/or service fees | | | 329,271 | | | | | |
Shareholder servicing costs | | | 2,966 | | | | | |
Administrative services fee | | | 36,697 | | | | | |
Independent Trustees’ compensation | | | 8,538 | | | | | |
Custodian fee | | | 17,742 | | | | | |
Shareholder communications | | | 8,404 | | | | | |
Audit and tax fees | | | 16,124 | | | | | |
Legal fees | | | 4,424 | | | | | |
Miscellaneous | | | 9,079 | | | | | |
Total expenses | | | | | | | $1,681,309 | |
Fees paid indirectly | | | (4 | ) | | | | |
Reduction of expenses by investment adviser and distributor | | | (1,325,172 | ) | | | | |
Net expenses | | | | | | | $356,133 | |
Net investment income | | | | | | | $0 | |
Net realized gain (loss) on investments | | | | | | | $736 | |
Change in net assets from operations | | | | | | | $736 | |
See Notes to Financial Statements
7
MFS Money Market Portfolio
FINANCIAL STATEMENTS | STATEMENTS OF CHANGES IN NET ASSETS
These statements describe the increases and/or decreases in net assets resulting from operations, any distributions, and any shareholder transactions.
| | | | | | | | |
| |
| Six months ended
6/30/13
(unaudited |
) | |
| Year ended
12/31/12 |
|
Change in net assets | | | | | | | | |
| From operations | | | | | | | | |
Net investment income | | | $0 | | | | $0 | |
Net realized gain (loss) on investments | | | 736 | | | | 0 | |
Change in net assets from operations | | | $736 | | | | $0 | |
Change in net assets from fund share transactions | | | $(32,784,753 | ) | | | $212,377,435 | |
Total change in net assets | | | $(32,784,017 | ) | | | $212,377,435 | |
| Net assets | | | | | | | | |
At beginning of period | | | 532,407,501 | | | | 320,030,066 | |
At end of period | | | $499,623,484 | | | | $532,407,501 | |
See Notes to Financial Statements
8
MFS Money Market Portfolio
FINANCIAL STATEMENTS | FINANCIAL HIGHLIGHTS
The financial highlights table is intended to help you understand the fund’s financial performance for the semiannual period and the past 5 fiscal years. Certain information reflects financial results for a single fund share. The total returns in the table represent the rate by which an investor would have earned (or lost) on an investment in the fund share class (assuming reinvestment of all distributions) held for the entire period.
| | | | | | | | | | | | | | | | | | | | | | | | |
| Initial Class | | Six months
ended
6/30/13 | | | Years ended 12/31 | |
| | | | 2012 | | | 2011 | | | 2010 | | | 2009 | | | 2008 | |
| | | (unaudited) | | | | | | | | | | | | | | | | |
Net asset value, beginning of period | | | $1.00 | | | | $1.00 | | | | $1.00 | | | | $1.00 | | | | $1.00 | | | | $1.00 | |
| Income (loss) from investment operations | | | | | | | | | | | | | | | | | | | | | |
Net investment income (d) | | | $0.00 | | | | $0.00 | | | | $0.00 | | | | $0.00 | | | | $0.00 | (w) | | | $0.02 | |
Net realized and unrealized gain (loss) on investments | | | 0.00 | (w) | | | 0.00 | | | | 0.00 | (w) | | | 0.00 | (w) | | | 0.00 | | | | (0.00 | )(w) |
Total from investment operations | | | $0.00 | (w) | | | $0.00 | | | | $0.00 | (w) | | | $0.00 | (w) | | | $0.00 | (w) | | | $0.02 | |
| Less distributions declared to shareholders | | | | | | | | | | | | | | | | | | | | | |
From net investment income | | | $— | | | | $— | | | | $— | | | | $— | | | | $(0.00 | )(w) | | | $(0.02 | ) |
Net asset value, end of period (m) | | | $1.00 | | | | $1.00 | | | | $1.00 | | | | $1.00 | | | | $1.00 | | | | $1.00 | |
Total return (%) (k)(r)(m) | | | 0.00 | (n) | | | 0.00 | | | | 0.00 | | | | 0.00 | | | | 0.00 | (x) | | | 2.03 | |
Ratios (%) (to average net assets)
and Supplemental data: | | | | | | | | | | | | | | | | | | | | | |
Expenses before expense reductions (f) | | | 0.54 | (a) | | | 0.55 | | | | 0.58 | | | | 0.59 | | | | 0.60 | | | | 0.59 | |
Expenses after expense reductions (f) | | | 0.14 | (a) | | | 0.16 | | | | 0.15 | | | | 0.27 | | | | 0.33 | | | | 0.57 | |
Net investment income | | | 0.00 | (a) | | | 0.00 | | | | 0.00 | | | | 0.00 | | | | 0.00 | | | | 2.02 | |
Net assets at end of period (000 omitted) | | | $238,569 | | | | $242,646 | | | | $188,106 | | | | $172,365 | | | | $206,513 | | | | $322,980 | |
| | |
| Service Class | | Six months
ended
6/30/13 | | | Years ended 12/31 | |
| | | | 2012 | | | 2011 | | | 2010 | | | 2009 | | | 2008 | |
| | | (unaudited) | | | | | | | | | | | | | | | | |
Net asset value, beginning of period | | | $1.00 | | | | $1.00 | | | | $1.00 | | | | $1.00 | | | | $1.00 | | | | $1.00 | |
| Income (loss) from investment operations | | | | | | | | | | | | | | | | | | | | | |
Net investment income (d) | | | $0.00 | | | | $0.00 | | | | $0.00 | | | | $0.00 | | | | $0.00 | | | | $0.02 | |
Net realized and unrealized gain (loss) on investments | | | 0.00 | (w) | | | 0.00 | | | | 0.00 | (w) | | | 0.00 | (w) | | | 0.00 | | | | (0.00 | )(w) |
Total from investment operations | | | $0.00 | (w) | | | $0.00 | | | | $0.00 | (w) | | | $0.00 | (w) | | | $0.00 | | | | $0.02 | |
| Less distributions declared to shareholders | | | | | | | | | | | | | | | | | | | | | |
From net investment income | | | $— | | | | $— | | | | $— | | | | $— | | | | $(0.00 | )(w) | | | $(0.02 | ) |
Net asset value, end of period (m) | | | $1.00 | | | | $1.00 | | | | $1.00 | | | | $1.00 | | | | $1.00 | | | | $1.00 | |
Total return (%) (k)(r)(m) | | | 0.00 | (n) | | | 0.00 | | | | 0.00 | | | | 0.00 | | | | 0.00 | (x) | | | 1.80 | |
Ratios (%) (to average net assets)
and Supplemental data: | | | | | | | | | | | | | | | | | | | | | |
Expenses before expense reductions (f) | | | 0.79 | (a) | | | 0.80 | | | | 0.83 | | | | 0.84 | | | | 0.85 | | | | 0.84 | |
Expenses after expense reductions (f) | | | 0.14 | (a) | | | 0.15 | | | | 0.16 | | | | 0.27 | | | | 0.33 | | | | 0.80 | |
Net investment income | | | 0.00 | (a) | | | 0.00 | | | | 0.00 | | | | 0.00 | | | | 0.00 | | | | 1.76 | |
Net assets at end of period (000 omitted) | | | $261,054 | | | | $289,762 | | | | $131,924 | | | | $168,459 | | | | $192,109 | | | | $241,404 | |
| (d) | | Per share data is based on average shares outstanding. |
| (f) | | Ratios do not reflect reductions from fees paid indirectly, if applicable. |
| (k) | | The total return does not reflect expenses that apply to separate accounts. Inclusion of these charges would reduce the total return figures for all periods shown. |
| (m) | | The net asset values per share and total returns have been calculated on net assets which include adjustments made in accordance with U.S. generally accepted accounting principles required at period end for financial reporting purposes. |
| (r) | | Certain expenses have been reduced without which performance would have been lower. |
| (w) | | Per share amount was less than $0.01. |
| (x) | | Total return was less than 0.01%. |
See Notes to Financial Statements
9
MFS Money Market Portfolio
NOTES TO FINANCIAL STATEMENTS (unaudited)
| (1) | | Business and Organization |
MFS Money Market Portfolio (the fund) is a series of MFS Variable Insurance Trust II (the trust). The trust is organized as a Massachusetts business trust and is registered under the Investment Company Act of 1940, as amended, as an open-end management investment company. The shareholders of each series of the trust are separate accounts of insurance companies, which offer variable annuity and/or life insurance products, and qualified retirement and pension plans.
| (2) | | Significant Accounting Policies |
General – The preparation of financial statements in conformity with U.S. generally accepted accounting principles requires management to make estimates and assumptions that affect the reported amounts of assets and liabilities, and disclosure of contingent assets and liabilities at the date of the financial statements and the reported amounts of revenues and expenses during the reporting period. Actual results could differ from those estimates. In the preparation of these financial statements, management has evaluated subsequent events occurring after the date of the fund’s Statement of Assets and Liabilities through the date that the financial statements were issued.
In this reporting period, the fund adopted the disclosure provisions of the Financial Accounting Standards Board (FASB) Accounting Standards Update 2011-11 (“ASU 2011-11”), Balance Sheet (Topic 210) – Disclosures about Offsetting Assets and Liabilities along with the related scope clarification provisions of FASB Accounting Standards Update 2013-01 (“ASU 2013-01”) entitled Balance Sheet (Topic 210) – Clarifying the Scope of Disclosures about Offsetting Assets and Liabilities. ASU 2011-11 is intended to enhance disclosures on the offsetting of financial assets and liabilities by requiring entities to disclose both gross and net information about financial instruments and transactions that are either offset in the statement of financial position or subject to a Master Netting Agreement or similar arrangement. ASU 2013-01 limits the scope of ASU 2011-11’s disclosure requirements on offsetting to financial assets and financial liabilities related to derivatives, repurchase and reverse repurchase agreements, and securities lending and securities borrowing transactions. The disclosures required by ASU 2011-11, to the extent applicable to the fund, have been included in the fund’s Significant Accounting Policies note under the captions for each of the fund’s in-scope financial instruments and transactions.
In June 2013, FASB issued Accounting Standards Update 2013-08 Financial Services – Investment Companies (Topic 946) – Amendments to the Scope, Measurement, and Disclosure Requirements (“ASU 2013-08”) which is effective for interim and annual reporting periods in fiscal years that begin after December 15, 2013. ASU 2013-08 sets forth a methodology for determining whether an entity should be characterized as an investment company and prescribes fair value accounting for an investment company’s non-controlling ownership interest in another investment company. FASB has determined that a fund registered under the Investment Company Act of 1940 automatically meets ASU 2013-08’s criteria for an investment company. Although still evaluating the potential impacts of ASU 2013-08 to the fund, management expects that the impact of the fund’s adoption will be limited to additional financial statement disclosures.
Investment Valuations – Pursuant to procedures approved by the Board of Trustees, investments held by the fund are generally valued at amortized cost, which approximates market value. Amortized cost involves valuing an instrument at its cost as adjusted for amortization of premium or accretion of discount rather than its current market value. The amortized cost value of an instrument can be different from the market value of an instrument.
Various inputs are used in determining the value of the fund’s assets or liabilities. These inputs are categorized into three broad levels. In certain cases, the inputs used to measure fair value may fall into different levels of the fair value hierarchy. In such cases, an investment’s level within the fair value hierarchy is based on the lowest level of input that is significant to the fair value measurement. The fund’s assessment of the significance of a particular input to the fair value measurement in its entirety requires judgment, and considers factors specific to the investment. Level 1 includes unadjusted quoted prices in active markets for identical assets or liabilities. Level 2 includes other significant observable market-based inputs (including quoted prices for similar securities, interest rates, prepayment speed, and credit risk). Level 3 includes unobservable inputs, which may include the adviser’s own assumptions in determining the fair value of investments. The following is a summary of the levels used as of June 30, 2013 in valuing the fund’s assets or liabilities:
| | | | | | | | | | | | | | | | |
| Investments at Value | | Level 1 | | | Level 2 | | | Level 3 | | | Total | |
| Short term securities | | | $— | | | | $499,717,013 | | | | $— | | | | $499,717,013 | |
For further information regarding security characteristics, see the Portfolio of Investments.
Repurchase Agreements – The fund enters into repurchase agreements under the terms of Master Repurchase Agreements with approved counterparties. Each repurchase agreement is recorded at cost. The fund requires that the securities collateral in a repurchase transaction be transferred to a custodian. The fund monitors, on a daily basis, the value of the collateral to ensure that its value, including accrued interest, is greater than amounts owed to the fund under each such repurchase agreement. Upon an event of default under a Master Repurchase Agreement, the non-defaulting party may close out all transactions traded under such agreement and net amounts owed under each transaction to one net amount payable by one party to the other. Absent an event of
10
MFS Money Market Portfolio
Notes to Financial Statements (unaudited) – continued
default, the Master Repurchase Agreement does not result in an offset of reported amounts of assets and liabilities in the Statement of Assets and Liabilities across transactions between the fund and the applicable counterparty. The fund and other funds managed by MFS may utilize a joint trading account for the purpose of entering into one or more repurchase agreements. At period end the fund had investments in repurchase agreements with a gross value of $14,994,000 included “Investments” in the Statement of Assets and Liabilities. The value of the related collateral exceeded the value of the repurchase agreements at period end.
Indemnifications – Under the fund’s organizational documents, its officers and Trustees may be indemnified against certain liabilities and expenses arising out of the performance of their duties to the fund. Additionally, in the normal course of business, the fund enters into agreements with service providers that may contain indemnification clauses. The fund’s maximum exposure under these agreements is unknown as this would involve future claims that may be made against the fund that have not yet occurred.
Investment Transactions and Income – Investment transactions are recorded on the trade date. Interest income is recorded on the accrual basis. All premium and discount is amortized or accreted for financial statement purposes in accordance with U.S. generally accepted accounting principles.
Fees Paid Indirectly – The fund’s custody fee may be reduced according to an arrangement that measures the value of cash deposited with the custodian by the fund. This amount, for the six months ended June 30, 2013, is shown as a reduction of total expenses in the Statement of Operations.
Tax Matters and Distributions – The fund intends to qualify as a regulated investment company, as defined under Subchapter M of the Internal Revenue Code, and to distribute all of its taxable income, including realized capital gains. As a result, no provision for federal income tax is required. The fund’s federal tax returns, when filed, will remain subject to examination by the Internal Revenue Service for a three year period.
Distributions to shareholders are recorded on the ex-dividend date. Income and capital gain distributions are determined in accordance with income tax regulations, which may differ from U.S. generally accepted accounting principles. Certain capital accounts in the financial statements are periodically adjusted for permanent differences in order to reflect their tax character. These adjustments have no impact on net assets or net asset value per share. Temporary differences which arise from recognizing certain items of income, expense, gain or loss in different periods for financial statement and tax purposes will reverse at some time in the future. Distributions in excess of net investment income or net realized gains are temporary overdistributions for financial statement purposes resulting from differences in the recognition or classification of income or distributions for financial statement and tax purposes.
During the year ended December 31, 2012, there were no significant adjustment due to differences between book and tax accounting.
The fund declared no distributions for the current period or for the year ended December 31, 2012.
The federal tax cost and the tax basis components of distributable earnings were as follows:
| | | | |
| As of 6/30/13 | | | | |
| Cost of investments | | | $499,717,013 | |
| |
| As of 12/31/12 | | | | |
| Capital loss carryforwards | | | (223,445 | ) |
Under the Regulated Investment Company Modernization Act of 2010 (the “Act”), net capital losses recognized for fund fiscal years beginning after December 31, 2010 may be carried forward indefinitely, and their character is retained as short-term and/or long-term losses (“post-enactment losses”). Previously, net capital losses were carried forward for eight years and treated as short-term losses (“pre-enactment losses”). As a transition rule, the Act requires that all post-enactment net capital losses be used before pre-enactment net capital losses.
As of December 31, 2012, the fund had capital loss carryforwards available to offset future realized gains. Such pre-enactment losses expire as follows:
| | | | |
| 12/31/15 | | | $(30,520 | ) |
| 12/31/16 | | | (192,925 | ) |
| Total | | | $(223,445 | ) |
Multiple Classes of Shares of Beneficial Interest – The fund offers multiple classes of shares, which differ in their respective distribution and/or service fees. The fund’s income and common expenses are allocated to shareholders based on the value of settled shares outstanding of each class. The fund’s realized and unrealized gain (loss) are allocated to shareholders based on the daily net assets of each class. Dividends are declared separately for each class. Differences in per share dividend rates are generally due to differences in separate class expenses.
11
MFS Money Market Portfolio
Notes to Financial Statements (unaudited) – continued
| (3) | | Transactions with Affiliates |
Investment Adviser – The fund has an investment advisory agreement with MFS to provide overall investment management and related administrative services and facilities to the fund. The management fee is computed daily and paid monthly at the following annual rates:
| | | | |
| First $500 million of average daily net assets | | | 0.50% | |
| Average daily net assets in excess of $500 million | | | 0.45% | |
During the six months ended June 30, 2013, MFS voluntarily waived receipt of $994,277 of the fund’s management fee in order to avoid a negative yield. For the six months ended June 30, 2013, this voluntary waiver had the effect of reducing the management fee by 0.40% of average daily net assets on an annualized basis. Effective April 1, 2013, MFS has agreed in writing to reduce its management fee by a specified amount if certain MFS mutual fund assets exceed thresholds agreed to by MFS and the fund’s Board of Trustees. For the period April 1, 2013 through June 30, 2013, this management fee reduction amounted to $666, which is shown as a reduction of total expenses in the Statement of Operations. The management fee incurred for the six months ended June 30, 2013 was equivalent to an annual effective rate of 0.10% of the fund’s average daily net assets.
The investment adviser has agreed in writing to pay a portion of the fund’s total annual operating expenses, exclusive of interest, taxes, extraordinary expenses, brokerage and transaction costs, and investment-related expenses, such that total annual operating expenses do not exceed 0.57% of average daily net assets for the Initial Class shares and 0.82% of average daily net assets for the Service Class shares. This written agreement will continue until modified by the fund’s Board of Trustees, but such agreement will continue at least until April 30, 2015. For the six months ended June 30, 2013, the fund’s actual operating expenses did not exceed the limit and therefore, the investment adviser did not pay any portion of the fund’s expenses related to this agreement.
Distributor – MFS Fund Distributors, Inc. (MFD), a wholly-owned subsidiary of MFS, is the distributor of shares of the fund. The Trustees have adopted a distribution plan for the Service Class shares pursuant to Rule 12b-1 under the Investment Company Act of 1940.
The fund’s distribution plan provides that the fund will pay MFD distribution and/or service fees equal to 0.25% per annum of its average daily net assets attributable to Service Class shares as partial consideration for services performed and expenses incurred by MFD and financial intermediaries (including participating insurance companies that invest in the fund to fund variable annuity and variable life insurance contracts, sponsors of qualified retirement and pension plans that invest in the fund, and affiliates of these participating insurance companies and plan sponsors) in connection with the sale and distribution of the Service Class shares. MFD may subsequently pay all, or a portion, of the distribution and/or service fees to financial intermediaries. During the six months ended June 30, 2013, MFD voluntarily waived receipt of $329,271 of the fund’s distribution and/or service fees in order to avoid a negative yield. For the six months ended June 30, 2013, this voluntary waiver had the effect of reducing the distribution fee by 0.25% of average daily net assets attributable to Service class shares on an annualized basis. The distribution and/or service fees incurred for the six months ended June 30, 2013 were equivalent to an annual effective rate of 0.00% of the average daily net assets attributable to Service Class shares.
Shareholder Servicing Agent – Effective April 1, 2013, MFS Service Center, Inc. (MFSC), a wholly-owned subsidiary of MFS, receives a fee from the fund for its services as shareholder servicing agent. For the period from April 1, 2013 through June 30, 2013, the fee was $2,958, which equated to 0.0012% annually of the fund’s average daily net assets. MFSC also receives payment from the fund for out-of-pocket expenses paid by MFSC on behalf of the fund. For the period from April 1, 2013 through June 30, 2013, these costs amounted to $8.
Administrator – MFS provides certain financial, legal, shareholder communications, compliance, and other administrative services to the fund. Under an administrative services agreement, the fund partially reimburses MFS the costs incurred to provide these services. The fund is charged an annual fixed amount of $17,500 plus a fee based on average daily net assets. The administrative services fee incurred for the six months ended June 30, 2013 was equivalent to an annual effective rate of 0.0147% of the fund’s average daily net assets.
Trustees’ and Officers’ Compensation – The fund pays compensation to independent Trustees in the form of a retainer, attendance fees, and additional compensation to Board and Committee chairpersons. The fund does not pay compensation directly to Trustees or officers of the fund who are also officers of the investment adviser, all of whom receive remuneration for their services to the fund from MFS. Certain officers and Trustees of the fund are officers or directors of MFS, MFD, and MFSC.
Other – This fund and certain other funds managed by MFS (the funds) have entered into services agreements (the Agreements) which provide for payment of fees by the funds to Tarantino LLC and Griffin Compliance LLC in return for the provision of services of an Independent Chief Compliance Officer (ICCO) and Assistant ICCO, respectively, for the funds. The ICCO and Assistant ICCO are officers of the funds and the sole members of Tarantino LLC and Griffin Compliance LLC, respectively. The funds can terminate the Agreements with Tarantino LLC and Griffin Compliance LLC at any time under the terms of the Agreements. For the six months ended June 30, 2013, the aggregate fees paid by the fund to Tarantino LLC and Griffin Compliance LLC were $1,941 and are
12
MFS Money Market Portfolio
Notes to Financial Statements (unaudited) – continued
included in “Miscellaneous” expense in the Statement of Operations. MFS has agreed to reimburse the fund for a portion of the payments made by the fund in the amount of $958, which is shown as a reduction of total expenses in the Statement of Operations. Additionally, MFS has agreed to bear all expenses associated with office space, other administrative support, and supplies provided to the ICCO and Assistant ICCO.
| (4) | | Shares of Beneficial Interest |
The fund’s Declaration of Trust permits the Trustees to issue an unlimited number of full and fractional shares of beneficial interest. Transactions in fund shares were as follows:
| | | | | | | | | | | | | | | | |
| | | Six months ended 6/30/13 | | | Year ended 12/31/12 | |
| | | Shares | | | Amount | | | Shares | | | Amount | |
| Shares sold | | | | | | | | | | | | | | | | |
Initial Class | | | 34,451,749 | | | | $34,451,749 | | | | 119,845,606 | | | | $119,845,605 | |
Service Class | | | 43,327,850 | | | | 43,327,850 | | | | 211,996,646 | | | | 211,996,647 | |
| | | 77,779,599 | | | | $77,779,599 | | | | 331,842,252 | | | | $331,842,252 | |
| Shares reacquired | | | | | | | | | | | | | | | | |
Initial Class | | | (38,528,744 | ) | | | $(38,528,744 | ) | | | (65,306,019 | ) | | | $(65,306,019 | ) |
Service Class | | | (72,035,608 | ) | | | (72,035,608 | ) | | | (54,158,798 | ) | | | (54,158,798 | ) |
| | | (110,564,352 | ) | | | $(110,564,352 | ) | | | (119,464,817 | ) | | | $(119,464,817 | ) |
| Net change | | | | | | | | | | | | | | | | |
Initial Class | | | (4,076,995 | ) | | | $(4,076,995 | ) | | | 54,539,587 | | | | $54,539,586 | |
Service Class | | | (28,707,758 | ) | | | (28,707,758 | ) | | | 157,837,848 | | | | 157,837,849 | |
| | | (32,784,753 | ) | | | $(32,784,753 | ) | | | 212,377,435 | | | | $212,377,435 | |
The fund and certain other funds managed by MFS participate in a $1.1 billion unsecured committed line of credit, subject to a $1 billion sublimit, provided by a syndication of banks under a credit agreement. Borrowings may be made for temporary financing needs. Interest is charged to each fund, based on its borrowings, generally at a rate equal to the higher of the Federal Reserve funds rate or one month LIBOR plus an agreed upon spread. A commitment fee, based on the average daily, unused portion of the committed line of credit, is allocated among the participating funds at the end of each calendar quarter. In addition, the fund and other funds managed by MFS have established unsecured uncommitted borrowing arrangements with certain banks for temporary financing needs. Interest is charged to each fund, based on its borrowings, at a rate equal to the Federal Reserve funds rate plus an agreed upon spread. For the six months ended June 30, 2013, the fund’s commitment fee and interest expense were $1,305 and $0, respectively, and are included in “Miscellaneous” expense in the Statement of Operations.
13
MFS Money Market Portfolio
BOARD REVIEW OF INVESTMENT ADVISORY AGREEMENT
A discussion regarding the Board’s most recent review and renewal of the fund’s Investment Advisory Agreement with MFS will be available on or about November 1, 2013 by clicking on the fund’s name under ”Variable Insurance Portfolios — VIT II“ in the “Products” section of the MFS Web site (mfs.com).
PROXY VOTING POLICIES AND INFORMATION
A general description of the MFS funds’ proxy voting policies and procedures is available without charge, upon request, by calling 1-800-225-2606, by visiting the Proxy Voting section of mfs.com or by visiting the SEC’s Web site at http://www.sec.gov.
Information regarding how the fund voted proxies relating to portfolio securities during the most recent twelve-month period ended June 30 is available without charge by visiting the Proxy Voting section of mfs.com or by visiting the SEC’s Web site at http://www.sec.gov.
QUARTERLY PORTFOLIO DISCLOSURE
The fund will file a complete schedule of portfolio holdings with the Securities and Exchange Commission (the Commission) for the first and third quarters of each fiscal year on Form N-Q. The fund’s Form N-Q is available on the EDGAR database on the Commission’s Internet Web site at http://www.sec.gov, and may be reviewed and copied at the:
Public Reference Room
Securities and Exchange Commission
100 F Street, NE, Room 1580
Washington, D.C. 20549
Information on the operation of the Public Reference Room may be obtained by calling the Commission at 1-800-SEC-0330. Copies of the fund’s Form N-Q also may be obtained, upon payment of a duplicating fee, by electronic request at the following e-mail address: publicinfo@sec.gov or by writing the Public Reference Section at the above address.
FURTHER INFORMATION
From time to time, MFS may post important information about the fund or the MFS funds on the MFS web site (mfs.com). This information is available by visiting the ”News & Commentary“ section of mfs.com or by clicking on the fund’s name under ”Variable Insurance Portfolios — VIT II“ in the ”Products“ section of mfs.com.
14
SEMIANNUAL REPORT
June 30, 2013

MFS® NEW DISCOVERY PORTFOLIO
MFS® Variable Insurance Trust II

NWD-SEM
MFS® NEW DISCOVERY PORTFOLIO
CONTENTS
The report is prepared for the general information of contract owners. It is authorized for distribution to prospective investors only when preceded or accompanied by a current prospectus.
NOT FDIC INSURED Ÿ MAY LOSE VALUE Ÿ NO BANK OR CREDIT UNION GUARANTEE Ÿ NOT A DEPOSIT Ÿ NOT INSURED BY ANY FEDERAL GOVERNMENT AGENCY OR NCUA/NCUSIF
MFS New Discovery Portfolio
LETTER FROM THE CHAIRMAN AND CEO

Dear Contract Owners:
As the year progresses, the global economy continues to grind ahead slowly, held back by broad austerity measures. The U.S. economy remains a steadying force, driven by resilient consumers, who have taken the payroll tax increase and the sequestration’s early impact in stride. With U.S. housing and jobs showing steady expansion, domestic consumer-driven growth has offset weaker exports and the U.S. government’s spending constraints. In response to these developments, the U.S. Federal Reserve has begun to brace investors for an eventual shift in its monetary policy, causing global market tremors.
Japan has been another bright spot, with government and central bank stimulus policies leading to increased exports, a resurgent stock market and improved economic sentiment. After a six-month rally, Japan’s stocks slipped late in the second quarter, then picked up momentum on fresh signs that the country could soon break free of its chronic deflation. The major deterrent to global growth remains the eurozone, still in the grip of persistent recession. China has seen its pace of economic growth decelerate, a troubling turn for the country’s trading partners, who have come to rely on it as an engine for global growth.
As always, managing risk in the face of uncertainty remains a top priority for investors. At MFS®, our uniquely collaborative investment process employs integrated, global research and active risk management. Our global team of investment professionals shares ideas and evaluates opportunities across continents, investment disciplines and asset classes — all with a goal of building better insights, and ultimately better results, for our clients.
We are mindful of the many economic challenges investors face, and believe it is more important than ever to maintain a long-term view and employ time-tested principles, such as asset allocation and diversification. We remain confident that our unique approach can serve investors well as they work with their financial advisors to identify and pursue the most suitable opportunities.
Respectfully,

Robert J. Manning
Chairman and Chief Executive Officer
MFS Investment Management®
August 16, 2013
The opinions expressed in this letter are subject to change, may not be relied upon for investment advice, and no forecasts can be guaranteed.
1
MFS New Discovery Portfolio
PORTFOLIO COMPOSITION
Portfolio structure
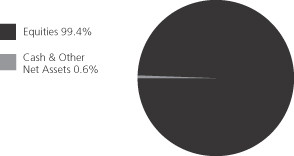
| | | | |
| Top ten holdings | | | | |
| Tronox Ltd., “A” | | | 2.3% | |
| Swift Transportation Co. | | | 2.0% | |
| Diana Shipping, Inc. | | | 1.9% | |
| Constant Contact, Inc. | | | 1.9% | |
| Cabot Oil & Gas Corp. | | | 1.9% | |
| Polypore International, Inc. | | | 1.8% | |
| Atwood Oceanics, Inc. | | | 1.8% | |
| Endologix, Inc. | | | 1.8% | |
| FleetMatics Group PLC | | | 1.7% | |
| CommVault Systems, Inc. | | | 1.7% | |
| | | | |
| Equity sectors | | | | |
| Technology | | | 23.0% | |
| Industrial Goods & Services | | | 14.5% | |
| Health Care | | | 14.2% | |
| Basic Materials | | | 10.1% | |
| Energy | | | 9.8% | |
| Special Products & Services | | | 9.4% | |
| Transportation | | | 6.5% | |
| Retailing | | | 4.2% | |
| Leisure | | | 2.8% | |
| Financial Services | | | 2.3% | |
| Consumer Staples | | | 1.6% | |
| Autos & Housing | | | 1.0% | |
Percentages are based on net assets as of 6/30/13.
The portfolio is actively managed and current holdings may be different.
2
MFS New Discovery Portfolio
EXPENSE TABLE
Fund Expenses Borne by the Contract Holders During the Period,
January 1, 2013 through June 30, 2013
As a contract holder of the fund, you incur ongoing costs, including management fees; distribution and/or service (12b-1) fees; and other fund expenses. This example is intended to help you understand your ongoing costs (in dollars) of investing in the fund and to compare these costs with the ongoing costs of investing in other mutual funds.
The example is based on an investment of $1,000 invested at the beginning of the period and held for the entire period January 1, 2013 through June 30, 2013.
Actual Expenses
The first line for each share class in the following table provides information about actual account values and actual expenses. You may use the information in this line, together with the amount you invested, to estimate the expenses that you paid over the period. Simply divide your account value by $1,000 (for example, an $8,600 account value divided by $1,000 = 8.6), then multiply the result by the number in the first line under the heading entitled “Expenses Paid During Period” to estimate the expenses you paid on your account during this period.
Hypothetical Example for Comparison Purposes
The second line for each share class in the following table provides information about hypothetical account values and hypothetical expenses based on the fund’s actual expense ratio and an assumed rate of return of 5% per year before expenses, which is not the fund’s actual return. The hypothetical account values and expenses may not be used to estimate the actual ending account balance or expenses you paid for the period. You may use this information to compare the ongoing costs of investing in the fund and other funds. To do so, compare this 5% hypothetical example with the 5% hypothetical examples that appear in the shareholder reports of the other funds.
Please note that the expenses shown in the table are meant to highlight the fund’s ongoing costs only and do not take into account the fees and expenses imposed under the variable contracts through which your investment in the fund is made. Therefore, the second line for each share class in the table is useful in comparing ongoing costs associated with an investment in vehicles (such as the fund) which fund benefits under variable annuity and variable life insurance contracts and to qualified pension and retirement plans only, and will not help you determine the relative total costs of investing in the fund through variable annuity and variable life insurance contracts. If the fees and expenses imposed under the variable contracts were included, your costs would have been higher.
| | | | | | | | | | | | | | | | | | |
| Share Class | | | | Annualized
Expense Ratio | | | Beginning
Account Value
1/01/13 | | | Ending Account Value
6/30/13 | | | Expenses Paid
During Period (p)
1/01/13-6/30/13 | |
| Initial Class | | Actual | | | 0.95% | | | | $1,000.00 | | | | $1,189.56 | | | | $5.16 | |
| | Hypothetical (h) | | | 0.95% | | | | $1,000.00 | | | | $1,020.08 | | | | $4.76 | |
| Service Class | | Actual | | | 1.20% | | | | $1,000.00 | | | | $1,187.66 | | | | $6.51 | |
| | Hypothetical (h) | | | 1.20% | | | | $1,000.00 | | | | $1,018.84 | | | | $6.01 | |
| (h) | 5% class return per year before expenses. |
| (p) | Expenses paid are equal to each class’s annualized expense ratio, as shown above, multiplied by the average account value over the period, multiplied by the number of days in the period, divided by the number of days in the year. |
3
MFS New Discovery Portfolio
PORTFOLIO OF INVESTMENTS – 6/30/13 (unaudited)
The Portfolio of Investments is a complete list of all securities owned by your fund. It is categorized by broad-based asset classes.
| | | | | | | | |
| Issuer | | Shares/Par | | | Value ($) | |
| | | | | | | | |
| COMMON STOCKS – 99.4% | |
| Brokerage & Asset Managers – 1.4% | |
| LPL Financial Holdings, Inc. | | | 60,310 | | | $ | 2,277,306 | |
| | | | | | | | |
| Business Services – 7.2% | | | | | | | | |
| Bright Horizons Family Solutions, Inc. (a) | | | 78,250 | | | $ | 2,716,058 | |
| Concur Technologies, Inc. (a) | | | 14,610 | | | | 1,188,962 | |
| Constant Contact, Inc. (a) | | | 195,198 | | | | 3,136,832 | |
| FleetCor Technologies, Inc. (a) | | | 13,892 | | | | 1,129,420 | |
| Gartner, Inc. (a) | | | 20,900 | | | | 1,191,091 | |
| Performant Financial Corp. (a) | | | 106,500 | | | | 1,234,335 | |
| Xoom Corp. (a) | | | 64,780 | | | | 1,484,758 | |
| | | | | | | | |
| | | | | | $ | 12,081,456 | |
| | | | | | | | |
| Chemicals – 1.4% | | | | | |
| Intrepid Potash, Inc. | | | 118,890 | | | $ | 2,264,855 | |
| | | | | | | | |
| Computer Software – 4.2% | | | | | |
| ANSYS, Inc. (a) | | | 15,630 | | | $ | 1,142,553 | |
| CommVault Systems, Inc. (a) | | | 36,490 | | | | 2,769,226 | |
| Qlik Technologies, Inc. (a) | | | 55,924 | | | | 1,580,971 | |
| SolarWinds, Inc. (a) | | | 40,720 | | | | 1,580,343 | |
| | | | | | | | |
| | | | | | $ | 7,073,093 | |
| | | | | | | | |
| Computer Software – Systems – 8.3% | |
| Exa Corp. (a) | | | 52,270 | | | $ | 538,381 | |
| FleetMatics Group PLC (a) | | | 86,660 | | | | 2,879,712 | |
| Greenway Medical Technologies, Inc. (a) | | | 46,710 | | | | 576,401 | |
| Guidewire Software, Inc. (a) | | | 34,260 | | | | 1,440,633 | |
| Linx S.A. | | | 40,100 | | | | 646,963 | |
| Model N, Inc. (a) | | | 103,790 | | | | 2,424,534 | |
| SciQuest, Inc. (a) | | | 107,438 | | | | 2,691,322 | |
| SS&C Technologies Holdings, Inc. (a) | | | 64,860 | | | | 2,133,894 | |
| Tableau Software, Inc., “A” (a) | | | 8,400 | | | | 465,528 | |
| | | | | | | | |
| | | | | | $ | 13,797,368 | |
| | | | | | | | |
| Consumer Services – 2.2% | | | | | |
| HomeAway, Inc. (a) | | | 75,778 | | | $ | 2,450,661 | |
| MakeMyTrip Ltd. (a) | | | 86,210 | | | | 1,230,217 | |
| | | | | | | | |
| | | | | | $ | 3,680,878 | |
| | | | | | | | |
| Electrical Equipment – 2.5% | | | | | |
| MSC Industrial Direct Co., Inc., “A” | | | 25,742 | | | $ | 1,993,975 | |
| Sensata Technologies Holding B.V. (a) | | | 62,588 | | | | 2,184,321 | |
| | | | | | | | |
| | | | | | $ | 4,178,296 | |
| | | | | | | | |
| Electronics – 7.0% | | | | | |
| Mellanox Technologies Ltd. (a) | | | 40,110 | | | $ | 1,985,445 | |
| Monolithic Power Systems, Inc. | | | 46,291 | | | | 1,116,076 | |
| Silicon Laboratories, Inc. (a) | | | 46,510 | | | | 1,925,979 | |
| Stratasys Ltd. (a) | | | 21,130 | | | | 1,769,426 | |
| Ultratech, Inc. (a) | | | 61,980 | | | | 2,275,906 | |
| Universal Display Corp. (a) | | | 20,661 | | | | 580,781 | |
| Veeco Instruments, Inc. (a) | | | 57,420 | | | | 2,033,816 | |
| | | | | | | | |
| | | | | | $ | 11,687,429 | |
| | | | | | | | |
| | | | | | | | |
| Issuer | | Shares/Par | | | Value ($) | |
| | | | | | | | |
| COMMON STOCKS – continued | |
| Energy – Independent – 6.2% | | | | | |
| Alpha Natural Resources, Inc. (a) | | | 127,930 | | | $ | 670,353 | |
| Arch Coal, Inc. | | | 165,360 | | | | 625,061 | |
| Cabot Oil & Gas Corp. | | | 44,158 | | | | 3,136,101 | |
| CONSOL Energy, Inc. | | | 85,110 | | | | 2,306,481 | |
| Peabody Energy Corp. | | | 45,930 | | | | 672,415 | |
| Range Resources Corp. | | | 30,007 | | | | 2,320,141 | |
| Walter Energy, Inc. (l) | | | 54,280 | | | | 564,512 | |
| | | | | | | | |
| | | | | | $ | 10,295,064 | |
| | | | | | | | |
| Food & Beverages – 1.6% | | | | | |
| Flowers Foods, Inc. | | | 29,340 | | | $ | 646,947 | |
| Green Mountain Coffee Roasters, Inc. (a) | | | 27,940 | | | | 2,097,176 | |
| | | | | | | | |
| | | | | | $ | 2,744,123 | |
| | | | | | | | |
| Food & Drug Stores – 1.2% | | | | | |
| Fairway Group Holdings Corp. (a) | | | 81,930 | | | $ | 1,980,248 | |
| | | | | | | | |
| Furniture & Appliances – 1.0% | | | | | |
| SodaStream International Ltd. (a)(l) | | | 22,940 | | | $ | 1,666,591 | |
| | | | | | | | |
| Gaming & Lodging – 0.9% | | | | | |
| Norwegian Cruise Line Holdings Ltd. (a) | | | 49,540 | | | $ | 1,501,557 | |
| | | | | | | | |
| General Merchandise – 0.7% | | | | | |
| Five Below, Inc. (a) | | | 31,330 | | | $ | 1,151,691 | |
| | | | | | | | |
| Internet – 3.0% | | | | | |
| ChannelAdvisor Corp. (a) | | | 25,780 | | | $ | 405,519 | |
| Millennial Media, Inc. (a) | | | 89,550 | | | | 779,981 | |
| Pandora Media, Inc. (a) | | | 26,310 | | | | 484,104 | |
| Shutterfly, Inc. (a) | | | 41,210 | | | | 2,299,106 | |
| Shutterstock, Inc. (a) | | | 18,080 | | | | 1,008,502 | |
| | | | | | | | |
| | | | | | $ | 4,977,212 | |
| | | | | | | | |
| Machinery & Tools – 12.0% | |
| Allison Transmission Holdings, Inc. | | | 103,790 | | | $ | 2,395,473 | |
| IPG Photonics Corp. | | | 37,352 | | | | 2,268,387 | |
| Joy Global, Inc. | | | 42,904 | | | | 2,082,131 | |
| Kennametal, Inc. | | | 57,320 | | | | 2,225,736 | |
| Nordson Corp. | | | 17,060 | | | | 1,182,429 | |
| Polypore International, Inc. (a) | | | 76,173 | | | | 3,069,772 | |
| Proto Labs, Inc. (a) | | | 41,440 | | | | 2,692,357 | |
| United Rentals, Inc. (a) | | | 33,426 | | | | 1,668,292 | |
| WABCO Holdings, Inc. (a) | | | 31,707 | | | | 2,368,196 | |
| | | | | | | | |
| | | | | | $ | 19,952,773 | |
| | | | | | | | |
| Medical & Health Technology & Services – 4.9% | |
| Advisory Board Co. (a) | | | 30,846 | | | $ | 1,685,734 | |
| Community Health Systems, Inc. | | | 22,620 | | | | 1,060,426 | |
| Health Management Associates, Inc., “A” (a) | | | 70,430 | | | | 1,107,160 | |
| Healthcare Services Group, Inc. | | | 102,696 | | | | 2,518,106 | |
| HealthStream, Inc. (a) | | | 34,270 | | | | 867,716 | |
| LifePoint Hospitals, Inc. (a) | | | 18,190 | | | | 888,400 | |
| | | | | | | | |
| | | | | | $ | 8,127,542 | |
| | | | | | | | |
4
MFS New Discovery Portfolio
Portfolio of Investments (unaudited) – continued
| | | | | | | | |
| Issuer | | Shares/Par | | | Value ($) | |
| | | | | | | | |
| COMMON STOCKS – continued | |
| Medical Equipment – 8.3% | |
| Align Technology, Inc. (a) | | | 63,901 | | | $ | 2,366,893 | |
| Cardiovascular Systems, Inc. (a) | | | 89,780 | | | | 1,903,336 | |
| Cepheid, Inc. (a) | | | 68,421 | | | | 2,355,051 | |
| Endologix, Inc. (a) | | | 219,902 | | | | 2,920,299 | |
| Genmark Diagnostics, Inc. (a) | | | 61,700 | | | | 637,978 | |
| Globus Medical, Inc., “A” (a) | | | 88,640 | | | | 1,494,470 | |
| Novadaq Technologies, Inc. (a) | | | 31,870 | | | | 428,970 | |
| NxStage Medical, Inc. (a) | | | 89,795 | | | | 1,282,273 | |
| TearLab Corp. (a) | | | 8,220 | | | | 87,296 | |
| Uroplasty, Inc. (a) | | | 133,665 | | | | 276,687 | |
| | | | | | | | |
| | | | | | $ | 13,753,253 | |
| | | | | | | | |
| Metals & Mining – 5.6% | |
| Century Aluminum Co. (a) | | | 135,170 | | | $ | 1,254,378 | |
| Globe Specialty Metals, Inc. | | | 191,617 | | | | 2,082,877 | |
| GrafTech International Ltd. (a) | | | 250,830 | | | | 1,826,042 | |
| Horsehead Holding Corp. (a) | | | 70,880 | | | | 907,973 | |
| Iluka Resources Ltd. | | | 224,179 | | | | 2,023,992 | |
| Molycorp, Inc. (a)(l) | | | 213,470 | | | | 1,323,514 | |
| | | | | | | | |
| | | | | | $ | 9,418,776 | |
| | | | | | | | |
| Network & Telecom – 0.5% | |
| Palo Alto Networks, Inc. (a) | | | 20,000 | | | $ | 843,200 | |
| | | | | | | | |
| Oil Services – 3.6% | | | | | | | | |
| Atwood Oceanics, Inc. (a) | | | 57,679 | | | $ | 3,002,192 | |
| Dresser-Rand Group, Inc. (a) | | | 38,573 | | | | 2,313,609 | |
| Superior Energy Services, Inc. (a) | | | 27,810 | | | | 721,391 | |
| | | | | | | | |
| | | | | | $ | 6,037,192 | |
| | | | | | | | |
| Other Banks & Diversified Financials – 0.9% | |
| First Republic Bank | | | 41,080 | | | $ | 1,580,758 | |
| | | | | | | | |
| Pharmaceuticals – 1.0% | | | | | |
| Kythera Biopharmaceuticals, Inc. (a) | | | 24,310 | | | $ | 657,586 | |
| Perrigo Co. | | | 8,044 | | | | 973,324 | |
| | | | | | | | |
| | | | | | $ | 1,630,910 | |
| | | | | | | | |
| Railroad & Shipping – 2.8% | | | | | |
| Diana Shipping, Inc. (a) | | | 314,288 | | | $ | 3,155,452 | |
| Navios Maritime Holdings, Inc. | | | 268,790 | | | | 1,505,224 | |
| | | | | | | | |
| | | | | | $ | 4,660,676 | |
| | | | | | | | |
| Restaurants – 1.9% | | | | | | | | |
| Arcos Dorados Holdings, Inc. | | | 155,304 | | | $ | 1,813,951 | |
| Chuy’s Holdings, Inc. (a) | | | 34,030 | | | | 1,304,710 | |
| | | | | | | | |
| | | | | | $ | 3,118,661 | |
| | | | | | | | |
| | | | | | | | |
| Issuer | | Shares/Par | | | Value ($) | |
| | | | | | | | |
| COMMON STOCKS – continued | |
| Specialty Chemicals – 3.1% | | | | | |
| Rockwood Holdings, Inc. | | | 21,550 | | | $ | 1,379,847 | |
| Tronox Ltd., “A” | | | 186,820 | | | | 3,764,423 | |
| | | | | | | | |
| | | | | | $ | 5,144,270 | |
| | | | | | | | |
| Specialty Stores – 2.3% | | | | | |
| Citi Trends, Inc. (a) | | | 109,673 | | | $ | 1,593,549 | |
| Monro Muffler Brake, Inc. | | | 46,073 | | | | 2,213,808 | |
| | | | | | | | |
| | | | | | $ | 3,807,357 | |
| | | | | | | | |
| Trucking – 3.7% | | | | | |
| Atlas Air Worldwide Holdings, Inc. (a) | | | 48,465 | | | $ | 2,120,822 | |
| Celadon Group, Inc. | | | 36,170 | | | | 660,103 | |
| Swift Transportation Co. (a) | | | 201,566 | | | | 3,333,902 | |
| | | | | | | | |
| | | | | | $ | 6,114,827 | |
| | | | | | | | |
Total Common Stocks (Identified Cost, $139,146,909) | | | | | | $ | 165,547,362 | |
| | | | | | | | |
|
| MONEY MARKET FUNDS – 0.1% | |
| MFS Institutional Money Market Portfolio, 0.11%, at Cost and Net Asset Value (v) | | | 180,401 | | | $ | 180,401 | |
| | | | | | | | |
|
| COLLATERAL FOR SECURITIES LOANED – 1.4% | |
| Navigator Securities Lending Prime Portfolio, 0.17%, at Cost and Net Asset Value (j) | | | 2,286,669 | | | $ | 2,286,669 | |
| | | | | | | | |
Total Investments (Identified Cost, $141,613,979) | | | | | | $ | 168,014,432 | |
| | | | | | | | |
OTHER ASSETS, LESS
LIABILITIES – (0.9)% | | | | | | | (1,507,030 | ) |
| | | | | | | | |
| Net Assets – 100.0% | | | | | | $ | 166,507,402 | |
| | | | | | | | |
| (a) | | Non-income producing security. |
| (j) | | The rate quoted is the annualized seven-day yield of the portfolio at period end. |
| (l) | | A portion of this security is on loan. |
| (v) | | Underlying affiliated fund that is available only to investment companies managed by MFS. The rate quoted for the MFS Institutional Money Market Portfolio is the annualized seven-day yield of the fund at period end. |
The following abbreviations are used in this report and are defined:
| PLC | | Public Limited Company |
See Notes to Financial Statements
5
MFS New Discovery Portfolio
FINANCIAL STATEMENTS | STATEMENT OF ASSETS AND LIABILITIES (unaudited)
This statement represents your fund’s balance sheet, which details the assets and liabilities comprising the total value of the fund.
| | | | | | | | |
At 6/30/13 | | | | | | | | |
Assets | | | | | | | | |
Investments – | | | | | | | | |
Non-affiliated issuers, at value (identified cost, $141,433,578) | | | $167,834,031 | | | | | |
Underlying affiliated funds, at cost and value | | | 180,401 | | | | | |
Total investments, at value, including $2,336,887 of securities on loan (identified cost, $141,613,979) | | | $168,014,432 | | | | | |
Receivables for | | | | | | | | |
Investments sold | | | 2,705,976 | | | | | |
Fund shares sold | | | 62,405 | | | | | |
Interest and dividends | | | 16,150 | | | | | |
Other assets | | | 1,028 | | | | | |
Total assets | | | | | | | $170,799,991 | |
Liabilities | | | | | | | | |
Payables for | | | | | | | | |
Investments purchased | | | $1,767,938 | | | | | |
Fund shares reacquired | | | 168,939 | | | | | |
Collateral for securities loaned, at value | | | 2,286,669 | | | | | |
Payable to affiliates | | | | | | | | |
Investment adviser | | | 9,715 | | | | | |
Shareholder servicing costs | | | 82 | | | | | |
Distribution and/or service fees | | | 2,358 | | | | | |
Payable for independent Trustees’ compensation | | | 877 | | | | | |
Accrued expenses and other liabilities | | | 56,011 | | | | | |
Total liabilities | | | | | | | $4,292,589 | |
Net assets | | | | | | | $166,507,402 | |
Net assets consist of | | | | | | | | |
Paid-in capital | | | $122,305,033 | | | | | |
Unrealized appreciation (depreciation) on investments and translation of assets and liabilities in foreign currencies | | | 26,400,410 | | | | | |
Accumulated net realized gain (loss) on investments and foreign currency | | | 18,293,011 | | | | | |
Accumulated net investment loss | | | (491,052 | ) | | | | |
Net assets | | | | | | | $166,507,402 | |
Shares of beneficial interest outstanding | | | | | | | 8,576,502 | |
| | | | | | | | | | | | |
| | | Net assets | | | Shares
outstanding | | | Net asset value
per share | |
Initial Class | | | $80,205,034 | | | | 4,046,051 | | | | $19.82 | |
Service Class | | | 86,302,368 | | | | 4,530,451 | | | | 19.05 | |
See Notes to Financial Statements
6
MFS New Discovery Portfolio
FINANCIAL STATEMENTS | STATEMENT OF OPERATIONS (unaudited)
This statement describes how much your fund earned in investment income and accrued in expenses. It also describes any gains and/or losses generated by fund operations.
| | | | | | | | |
Six months ended 6/30/13 | | | | | | | | |
Net investment loss | | | | | | | | |
Income | | | | | | | | |
Dividends | | | $364,453 | | | | | |
Income on securities loaned | | | 32,632 | | | | | |
Dividends from underlying affiliated funds | | | 370 | | | | | |
Total investment income | | | | | | | $397,455 | |
Expenses | | | | | | | | |
Management fee | | | $739,475 | | | | | |
Distribution and/or service fees | | | 107,472 | | | | | |
Shareholder servicing costs | | | 1,863 | | | | | |
Administrative services fee | | | 15,799 | | | | | |
Independent Trustees’ compensation | | | 2,504 | | | | | |
Custodian fee | | | 14,586 | | | | | |
Shareholder communications | | | 10,239 | | | | | |
Audit and tax fees | | | 24,526 | | | | | |
Legal fees | | | 1,323 | | | | | |
Miscellaneous | | | 7,062 | | | | | |
Total expenses | | | | | | | $924,849 | |
Fees paid indirectly | | | (2 | ) | | | | |
Reduction of expenses by investment adviser | | | (36,340 | ) | | | | |
Net expenses | | | | | | | $888,507 | |
Net investment loss | | | | | | | $(491,052 | ) |
Realized and unrealized gain (loss) on investments and foreign currency | | | | | | | | |
Realized gain (loss) (identified cost basis) | | | | | | | | |
Investments | | | $18,263,696 | | | | | |
Foreign currency | | | (1,332 | ) | | | | |
Net realized gain (loss) on investments and foreign currency | | | | | | | $18,262,364 | |
Change in unrealized appreciation (depreciation) | | | | | | | | |
Investments | | | $10,654,646 | | | | | |
Translation of assets and liabilities in foreign currencies | | | 700 | | | | | |
Net unrealized gain (loss) on investments and foreign currency translation | | | | | | | $10,655,346 | |
Net realized and unrealized gain (loss) on investments and foreign currency | | | | | | | $28,917,710 | |
Change in net assets from operations | | | | | | | $28,426,658 | |
See Notes to Financial Statements
7
MFS New Discovery Portfolio
FINANCIAL STATEMENTS | STATEMENTS OF CHANGES IN NET ASSETS
These statements describe the increases and/or decreases in net assets resulting from operations, any distributions, and any shareholder transactions.
| | | | | | | | |
| |
| Six months ended
6/30/13
(unaudited |
) | |
| Year ended
12/31/12 |
|
Change in net assets | | | | | | | | |
| From operations | | | | | | | | |
Net investment loss | | | $(491,052 | ) | | | $(680,455 | ) |
Net realized gain (loss) on investments and foreign currency | | | 18,262,364 | | | | 5,371,353 | |
Net unrealized gain (loss) on investments and foreign currency translation | | | 10,655,346 | | | | 25,675,663 | |
Change in net assets from operations | | | $28,426,658 | | | | $30,366,561 | |
| Distributions declared to shareholders | | | | | | | | |
From net realized gain on investments | | | $— | | | | $(15,102,700 | ) |
Change in net assets from fund share transactions | | | $(18,055,744 | ) | | | $(8,449,969 | ) |
Total change in net assets | | | $10,370,914 | | | | $6,813,892 | |
| Net assets | | | | | | | | |
At beginning of period | | | 156,136,488 | | | | 149,322,596 | |
At end of period (including accumulated net investment loss of $491,052 and
$0, respectively) | | | $166,507,402 | | | | $156,136,488 | |
See Notes to Financial Statements
8
MFS New Discovery Portfolio
FINANCIAL STATEMENTS | FINANCIAL HIGHLIGHTS
The financial highlights table is intended to help you understand the fund’s financial performance for the semiannual period and the past 5 fiscal years. Certain information reflects financial results for a single fund share. The total returns in the table represent the rate by which an investor would have earned (or lost) on an investment in the fund share class (assuming reinvestment of all distributions) held for the entire period.
| | | | | | | | | | | | | | | | | | | | | | | | |
| Initial Class | | Six months
ended
6/30/13 | | | Years ended 12/31 | |
| | | | 2012 | | | 2011 | | | 2010 | | | 2009 | | | 2008 | |
| | | (unaudited) | | | | | | | | | | | | | | | | |
Net asset value, beginning of period | | | $16.67 | | | | $15.20 | | | | $18.63 | | | | $13.64 | | | | $8.37 | | | | $16.24 | |
| Income (loss) from investment operations | | | | | | | | | | | | | | | | | | | | | | | | |
Net investment loss (d) | | | $(0.04 | ) | | | $(0.05 | ) | | | $(0.10 | ) | | | $(0.07 | ) | | | $(0.05 | ) | | | $(0.04 | ) |
Net realized and unrealized gain (loss) on investments and foreign currency | | | 3.19 | | | | 3.19 | | | | (1.78 | ) | | | 5.06 | | | | 5.32 | | | | (5.42 | ) |
Total from investment operations | | | $3.15 | | | | $3.14 | | | | $(1.88 | ) | | | $4.99 | | | | $5.27 | | | | $(5.46 | ) |
| Less distributions declared to shareholders | | | | | | | | | | | | | | | | | | | | | | | | |
From net realized gain on investments | | | $— | | | | $(1.67 | ) | | | $(1.55 | ) | | | $— | | | | $— | | | | $(2.41 | ) |
Net asset value, end of period (x) | | | $19.82 | | | | $16.67 | | | | $15.20 | | | | $18.63 | | | | $13.64 | | | | $8.37 | |
Total return (%) (k)(r)(s)(x) | | | 18.90 | (n) | | | 21.22 | | | | (10.37 | ) | | | 36.58 | | | | 62.96 | | | | (39.57 | ) |
Ratios (%) (to average net assets)
and Supplemental data: | | | | | | | | | | | | | | | | | | | | | | | | |
Expenses before expense reductions (f) | | | 0.99 | (a) | | | 1.01 | | | | 1.04 | | | | 1.09 | | | | 1.05 | | | | 1.02 | |
Expenses after expense reductions (f) | | | 0.95 | (a) | | | 0.95 | | | | 0.95 | | | | 0.95 | | | | 0.95 | | | | 0.95 | |
Net investment loss | | | (0.47 | )(a) | | | (0.31 | ) | | | (0.55 | ) | | | (0.48 | ) | | | (0.49 | ) | | | (0.28 | ) |
Portfolio turnover | | | 61 | (n) | | | 120 | | | | 176 | | | | 192 | | | | 153 | | | | 127 | |
Net assets at end of period (000 omitted) | | | $80,205 | | | | $72,880 | | | | $69,664 | | | | $87,806 | | | | $78,620 | | | | $59,861 | |
| | |
| Service Class | | Six months
ended
6/30/13 | | | Years ended 12/31 | |
| | | | 2012 | | | 2011 | | | 2010 | | | 2009 | | | 2008 | |
| | | (unaudited) | | | | | | | | | | | | | | | | |
Net asset value, beginning of period | | | $16.04 | | | | $14.72 | | | | $18.13 | | | | $13.31 | | | | $8.18 | | | | $15.97 | |
| Income (loss) from investment operations | | | | | | | | | | | | | | | | | | | | | | | | |
Net investment loss (d) | | | $(0.06 | ) | | | $(0.09 | ) | | | $(0.14 | ) | | | $(0.11 | ) | | | $(0.07 | ) | | | $(0.07 | ) |
Net realized and unrealized gain (loss) on investments and foreign currency | | | 3.07 | | | | 3.08 | | | | (1.72 | ) | | | 4.93 | | | | 5.20 | | | | (5.31 | ) |
Total from investment operations | | | $3.01 | | | | $2.99 | | | | $(1.86 | ) | | | $4.82 | | | | $5.13 | | | | $(5.38 | ) |
| Less distributions declared to shareholders | | | | | | | | | | | | | | | | | | | | | | | | |
From net realized gain on investments | | | $— | | | | $(1.67 | ) | | | $(1.55 | ) | | | $— | | | | $— | | | | $(2.41 | ) |
Net asset value, end of period (x) | | | $19.05 | | | | $16.04 | | | | $14.72 | | | | $18.13 | | | | $13.31 | | | | $8.18 | |
Total return (%) (k)(r)(s)(x) | | | 18.77 | (n) | | | 20.88 | | | | (10.55 | ) | | | 36.21 | | | | 62.71 | | | | (39.76 | ) |
Ratios (%) (to average net assets)
and Supplemental data: | | | | | | | | | | | | | | | | | | | | | | | | |
Expenses before expense reductions (f) | | | 1.24 | (a) | | | 1.26 | | | | 1.29 | | | | 1.34 | | | | 1.30 | | | | 1.27 | |
Expenses after expense reductions (f) | | | 1.20 | (a) | | | 1.20 | | | | 1.20 | | | | 1.20 | | | | 1.20 | | | | 1.20 | |
Net investment loss | | | (0.72 | )(a) | | | (0.55 | ) | | | (0.80 | ) | | | (0.73 | ) | | | (0.74 | ) | | | (0.54 | ) |
Portfolio turnover | | | 61 | (n) | | | 120 | | | | 176 | | | | 192 | | | | 153 | | | | 127 | |
Net assets at end of period (000 omitted) | | | $86,302 | | | | $83,257 | | | | $79,659 | | | | $107,214 | | | | $115,516 | | | | $104,937 | |
| (d) | Per share data is based on average shares outstanding. |
| (f) | Ratios do not reflect reductions from fees paid indirectly, if applicable. |
| (k) | The total return does not reflect expenses that apply to separate accounts. Inclusion of these charges would reduce the total return figures for all periods shown. |
| (r) | Certain expenses have been reduced without which performance would have been lower. |
| (s) | From time to time the fund may receive proceeds from litigation settlements, without which performance would be lower. |
| (x) | The net asset values per share and total returns have been calculated on net assets which include adjustments made in accordance with U.S. generally accepted accounting principles required at period end for financial reporting purposes. |
See Notes to Financial Statements
9
MFS New Discovery Portfolio
NOTES TO FINANCIAL STATEMENTS (unaudited)
| (1) | | Business and Organization |
MFS New Discovery Portfolio (the fund) is a series of MFS Variable Insurance Trust II (the trust). The trust is organized as a Massachusetts business trust and is registered under the Investment Company Act of 1940, as amended, as an open-end management investment company. The shareholders of each series of the trust are separate accounts of insurance companies, which offer variable annuity and/or life insurance products, and qualified retirement and pension plans.
| (2) | | Significant Accounting Policies |
General – The preparation of financial statements in conformity with U.S. generally accepted accounting principles requires management to make estimates and assumptions that affect the reported amounts of assets and liabilities, and disclosure of contingent assets and liabilities at the date of the financial statements and the reported amounts of revenues and expenses during the reporting period. Actual results could differ from those estimates. In the preparation of these financial statements, management has evaluated subsequent events occurring after the date of the fund’s Statement of Assets and Liabilities through the date that the financial statements were issued.
In this reporting period, the fund adopted the disclosure provisions of the Financial Accounting Standards Board (FASB) Accounting Standards Update 2011-11 (“ASU 2011-11”), Balance Sheet (Topic 210) – Disclosures about Offsetting Assets and Liabilities along with the related scope clarification provisions of FASB Accounting Standards Update 2013-01 (“ASU 2013-01”) entitled Balance Sheet (Topic 210) – Clarifying the Scope of Disclosures about Offsetting Assets and Liabilities. ASU 2011-11 is intended to enhance disclosures on the offsetting of financial assets and liabilities by requiring entities to disclose both gross and net information about financial instruments and transactions that are either offset in the statement of financial position or subject to a Master Netting Agreement or similar arrangement. ASU 2013-01 limits the scope of ASU 2011-11’s disclosure requirements on offsetting to financial assets and financial liabilities related to derivatives, repurchase and reverse repurchase agreements, and securities lending and securities borrowing transactions. The disclosures required by ASU 2011-11, to the extent applicable to the fund, have been included in the fund’s Significant Accounting Policies note under the captions for each of the fund’s in-scope financial instruments and transactions.
In June 2013, FASB issued Accounting Standards Update 2013-08 Financial Services – Investment Companies (Topic 946) – Amendments to the Scope, Measurement, and Disclosure Requirements (“ASU 2013-08”) which is effective for interim and annual reporting periods in fiscal years that begin after December 15, 2013. ASU 2013-08 sets forth a methodology for determining whether an entity should be characterized as an investment company and prescribes fair value accounting for an investment company’s non-controlling ownership interest in another investment company. FASB has determined that a fund registered under the Investment Company Act of 1940 automatically meets ASU 2013-08’s criteria for an investment company. Although still evaluating the potential impacts of ASU 2013-08 to the fund, management expects that the impact of the fund’s adoption will be limited to additional financial statement disclosures.
Investment Valuations – Equity securities, including restricted equity securities, are generally valued at the last sale or official closing price as provided by a third-party pricing service on the market or exchange on which they are primarily traded. Equity securities, for which there were no sales reported that day, are generally valued at the last quoted daily bid quotation as provided by a third-party pricing service on the market or exchange on which such securities are primarily traded. Short-term instruments with a maturity at issuance of 60 days or less generally are valued at amortized cost, which approximates market value. Open-end investment companies are generally valued at net asset value per share. Securities and other assets generally valued on the basis of information from a third-party pricing service may also be valued at a broker/dealer bid quotation. Values obtained from third-party pricing services can utilize both transaction data and market information such as yield, quality, coupon rate, maturity, type of issue, trading characteristics, and other market data. The values of foreign securities and other assets and liabilities expressed in foreign currencies are converted to U.S. dollars using the mean of bid and asked prices for rates provided by a third-party pricing service.
The Board of Trustees has delegated primary responsibility for determining or causing to be determined the value of the fund’s investments (including any fair valuation) to the adviser pursuant to valuation policies and procedures approved by the Board. If the adviser determines that reliable market quotations are not readily available, investments are valued at fair value as determined in good faith by the adviser in accordance with such procedures under the oversight of the Board of Trustees. Under the fund’s valuation policies and procedures, market quotations are not considered to be readily available for most types of debt instruments and floating rate loans and many types of derivatives. These investments are generally valued at fair value based on information from third-party pricing services. In addition, investments may be valued at fair value if the adviser determines that an investment’s value has been materially affected by events occurring after the close of the exchange or market on which the investment is principally traded (such as foreign exchange or market) and prior to the determination of the fund’s net asset value, or after the halting of trading of a specific security where trading does not resume prior to the close of the exchange or market on which the security is principally traded. Events that occur on a frequent basis after foreign markets close (such as developments in foreign markets and significant movements in the U.S. markets) and prior to the determination of the fund’s net asset value may be deemed to have a material effect on the value of securities traded in foreign markets. Accordingly, the fund’s foreign equity securities may often be valued at fair value. The adviser generally relies on third-party pricing services or other information (such as the correlation with price
10
MFS New Discovery Portfolio
Notes to Financial Statements (unaudited) – continued
movements of similar securities in the same or other markets; the type, cost and investment characteristics of the security; the business and financial condition of the issuer; and trading and other market data) to assist in determining whether to fair value and at what value to fair value an investment. The value of an investment for purposes of calculating the fund’s net asset value can differ depending on the source and method used to determine value. When fair valuation is used, the value of an investment used to determine the fund’s net asset value may differ from quoted or published prices for the same investment. There can be no assurance that the fund could obtain the fair value assigned to an investment if it were to sell the investment at the same time at which the fund determines its net asset value per share.
Various inputs are used in determining the value of the fund’s assets or liabilities. These inputs are categorized into three broad levels. In certain cases, the inputs used to measure fair value may fall into different levels of the fair value hierarchy. In such cases, an investment’s level within the fair value hierarchy is based on the lowest level of input that is significant to the fair value measurement. The fund’s assessment of the significance of a particular input to the fair value measurement in its entirety requires judgment, and considers factors specific to the investment. Level 1 includes unadjusted quoted prices in active markets for identical assets or liabilities. Level 2 includes other significant observable market-based inputs (including quoted prices for similar securities, interest rates, prepayment speed, and credit risk). Level 3 includes unobservable inputs, which may include the adviser’s own assumptions in determining the fair value of investments. The following is a summary of the levels used as of June 30, 2013 in valuing the fund’s assets or liabilities:
| | | | | | | | | | | | | | | | |
| Investments at Value | | Level 1 | | | Level 2 | | | Level 3 | | | Total | |
| Equity Securities: | | | | | | | | | | | | | | | | |
United States | | | $149,321,131 | | | | $— | | | | $— | | | | $149,321,131 | |
Israel | | | 5,421,462 | | | | — | | | | — | | | | 5,421,462 | |
Greece | | | 4,660,676 | | | | — | | | | — | | | | 4,660,676 | |
Australia | | | — | | | | 2,023,992 | | | | — | | | | 2,023,992 | |
Argentina | | | 1,813,951 | | | | — | | | | — | | | | 1,813,951 | |
India | | | 1,230,217 | | | | — | | | | — | | | | 1,230,217 | |
Brazil | | | 646,963 | | | | — | | | | — | | | | 646,963 | |
Canada | | | 428,970 | | | | — | | | | — | | | | 428,970 | |
| Mutual Funds | | | 2,467,070 | | | | — | | | | — | | | | 2,467,070 | |
| Total Investments | | | $165,990,440 | | | | $2,023,992 | | | | $— | | | | $168,014,432 | |
For further information regarding security characteristics, see the Portfolio of Investments.
Foreign Currency Translation – Purchases and sales of foreign investments, income, and expenses are converted into U.S. dollars based upon currency exchange rates prevailing on the respective dates of such transactions or on the reporting date for foreign denominated receivables and payables. Gains and losses attributable to foreign currency exchange rates on sales of securities are recorded for financial statement purposes as net realized gains and losses on investments. Gains and losses attributable to foreign exchange rate movements on receivables, payables, income and expenses are recorded for financial statement purposes as foreign currency transaction gains and losses. That portion of both realized and unrealized gains and losses on investments that results from fluctuations in foreign currency exchange rates is not separately disclosed.
Security Loans – Under its Securities Lending Agency Agreement with the fund, State Street Bank and Trust Company (“State Street”), as lending agent, loans the securities of the fund to certain qualified institutions (the “Borrowers”) approved by the fund. The loans are collateralized by cash and/or U.S. Treasury and federal agency obligations in an amount typically at least equal to the market value of the securities loaned. The market value of the loaned securities is determined at the close of business of the fund and any additional required collateral is delivered to the fund on the next business day. State Street provides the fund with indemnification against Borrower default. In the event of Borrower default, State Street will for the benefit of the fund either purchase securities identical to those loaned or, when such purchase is commercially impracticable, pay the fund the market value of the loaned securities. In return, State Street assumes the fund’s rights to the related collateral. If the collateral value is less than the cost to purchase identical securities, State Street is responsible for the shortfall, but only to the extent that such shortfall is not due to a decline in collateral value resulting from collateral reinvestment for which the fund bears the risk of loss. On loans collateralized by cash, the cash collateral is invested in a money market fund or short-term securities. At period end, the fund had investment securities on loan with a fair value of $2,336,887 and a related liability of $2,286,669 for collateral received on securities loaned, both of which are presented gross on the Statement of Assets and Liabilities. The carrying value of the collateral for securities loaned approximates fair value which would have been considered level 2 under the fair value hierarchy if the collateral for securities loaned were carried at fair value. The value of the fund’s securities on loan net of the related collateral is $50,218 at period end. A portion of the income generated upon investment of the collateral is remitted to the Borrowers, and the remainder is allocated between the fund and the lending agent. On loans collateralized by U.S. Treasury and/or federal agency obligations, a fee is received from the Borrower, and is allocated between the fund and the lending agent. Income from securities lending is included in “Interest” income
11
MFS New Discovery Portfolio
Notes to Financial Statements (unaudited) – continued
in the Statement of Operations. The dividend and interest income earned on the securities loaned is accounted for in the same manner as other dividend and interest income.
Indemnifications – Under the fund’s organizational documents, its officers and Trustees may be indemnified against certain liabilities and expenses arising out of the performance of their duties to the fund. Additionally, in the normal course of business, the fund enters into agreements with service providers that may contain indemnification clauses. The fund’s maximum exposure under these agreements is unknown as this would involve future claims that may be made against the fund that have not yet occurred.
Investment Transactions and Income – Investment transactions are recorded on the trade date. Interest income is recorded on the accrual basis. Dividends received in cash are recorded on the ex-dividend date. Certain dividends from foreign securities will be recorded when the fund is informed of the dividend if such information is obtained subsequent to the ex-dividend date. Dividend and interest payments received in additional securities are recorded on the ex-dividend or ex-interest date in an amount equal to the value of the security on such date.
The fund may receive proceeds from litigation settlements. Any proceeds received from litigation involving portfolio holdings are reflected in the Statement of Operations in realized gain/loss if the security has been disposed of by the fund or in unrealized gain/loss if the security is still held by the fund. Any other proceeds from litigation not related to portfolio holdings are reflected as other income in the Statement of Operations.
Fees Paid Indirectly – The fund’s custody fee may be reduced according to an arrangement that measures the value of cash deposited with the custodian by the fund. This amount, for the six months ended June 30, 2013, is shown as a reduction of total expenses in the Statement of Operations.
Tax Matters and Distributions – The fund intends to qualify as a regulated investment company, as defined under Subchapter M of the Internal Revenue Code, and to distribute all of its taxable income, including realized capital gains. As a result, no provision for federal income tax is required. The fund’s federal tax returns, when filed, will remain subject to examination by the Internal Revenue Service for a three year period.
Distributions to shareholders are recorded on the ex-dividend date. Income and capital gain distributions are determined in accordance with income tax regulations, which may differ from U.S. generally accepted accounting principles. Certain capital accounts in the financial statements are periodically adjusted for permanent differences in order to reflect their tax character. These adjustments have no impact on net assets or net asset value per share. Temporary differences which arise from recognizing certain items of income, expense, gain or loss in different periods for financial statement and tax purposes will reverse at some time in the future. Distributions in excess of net investment income or net realized gains are temporary overdistributions for financial statement purposes resulting from differences in the recognition or classification of income or distributions for financial statement and tax purposes.
Book/tax differences primarily relate to wash sale loss deferrals.
The tax character of distributions declared to shareholders for the last fiscal year is as follows:
| | | | |
| | | 12/31/12 | |
| Ordinary income (including any short-term capital gains) | | | $15,102,700 | |
The federal tax cost and the tax basis components of distributable earnings were as follows:
| | | | |
| As of 6/30/13 | | | | |
| Cost of investments | | | $144,210,574 | |
| Gross appreciation | | | 29,948,705 | |
| Gross depreciation | | | (6,144,847 | ) |
| Net unrealized appreciation (depreciation) | | | $23,803,858 | |
| |
| As of 12/31/12 | | | | |
| Undistributed ordinary income | | | 2,627,242 | |
| Other temporary differences | | | (743 | ) |
| Net unrealized appreciation (depreciation) | | | 13,149,212 | |
The aggregate cost above includes prior fiscal year end tax adjustments, if applicable.
Multiple Classes of Shares of Beneficial Interest – The fund offers multiple classes of shares, which differ in their respective distribution and/or service fees. The fund’s income, realized and unrealized gain (loss), and common expenses are allocated to shareholders based on the daily net assets of each class. Dividends are declared separately for each class. Differences in per share
12
MFS New Discovery Portfolio
Notes to Financial Statements (unaudited) – continued
dividend rates are generally due to differences in separate class expenses. The fund’s distributions declared to shareholders as reported in the Statements of Changes in Net Assets are presented by class as follows:
| | | | | | | | |
| | | From net realized gain on
investments | |
| | | Six months ended
6/30/13 | | | Year ended
12/31/12 | |
| Initial Class | | | $— | | | | $7,020,338 | |
| Service Class | | | — | | | | 8,082,362 | |
| Total | | | $— | | | | $15,102,700 | |
| (3) | | Transactions with Affiliates |
Investment Adviser – The fund has an investment advisory agreement with MFS to provide overall investment management and related administrative services and facilities to the fund. The management fee is computed daily and paid monthly at the following annual rates:
| | | | |
| First $1 billion of average daily net assets | | | 0.90% | |
| Average daily net assets in excess of $1 billion | | | 0.80% | |
The investment adviser has agreed in writing to reduce its management fee to 0.75% of average daily net assets in excess of $2.5 billion. This written agreement will continue until modified by the fund’s Board of Trustees, but such agreement will continue at least until April 30, 2015. For the six months ended June 30, 2013, the fund’s average daily net assets did not exceed $2.5 billion and therefore, the management fee was not reduced under this agreement. Effective April 1, 2013, MFS has agreed in writing to reduce its management fee by a specified amount if certain MFS mutual fund assets exceed thresholds agreed to by MFS and the fund’s Board of Trustees. For the period April 1, 2013 through June 30, 2013, this management fee reduction amounted to $222, which is shown as a reduction of total expenses in the Statement of Operations. The management fee incurred for the six months ended June 30, 2013 was equivalent to an annual effective rate of 0.90% of the fund’s average daily net assets.
The investment adviser has agreed in writing to pay a portion of the fund’s total annual operating expenses, exclusive of interest, taxes, extraordinary expenses, brokerage and transaction costs, and investment-related expenses, such that total annual operating expenses do not exceed 0.95% of average daily net assets for the Initial Class shares and 1.20% of average daily net assets for the Service Class shares. This written agreement will continue until modified by the fund’s Board of Trustees, but such agreement will continue at least until April 30, 2015. For the six months ended June 30, 2013, this reduction amounted to $35,806 and is reflected as a reduction of total expenses in the Statement of Operations.
Distributor – MFS Fund Distributors, Inc. (MFD), a wholly-owned subsidiary of MFS, is the distributor of shares of the fund. The Trustees have adopted a distribution plan for the Service Class shares pursuant to Rule 12b-1 under the Investment Company Act of 1940.
The fund’s distribution plan provides that the fund will pay MFD distribution and/or service fees equal to 0.25% per annum of its average daily net assets attributable to Service Class shares as partial consideration for services performed and expenses incurred by MFD and financial intermediaries (including participating insurance companies that invest in the fund to fund variable annuity and variable life insurance contracts, sponsors of qualified retirement and pension plans that invest in the fund, and affiliates of these participating insurance companies and plan sponsors) in connection with the sale and distribution of the Service Class shares. MFD may subsequently pay all, or a portion, of the distribution and/or service fees to financial intermediaries.
Shareholder Servicing Agent – Effective April 1, 2013, MFS Service Center, Inc. (MFSC), a wholly-owned subsidiary of MFS, receives a fee from the fund for its services as shareholder servicing agent. For the period from April 1, 2013 through June 30, 2013, the fee was $1,847, which equated to 0.0022% annually of the fund’s average daily net assets. MFSC also receives payment from the fund for out-of-pocket expenses paid by MFSC on behalf of the fund. For the period from April 1, 2013 through June 30, 2013, these costs amounted to $16.
Administrator – MFS provides certain financial, legal, shareholder communications, compliance, and other administrative services to the fund. Under an administrative services agreement, the fund partially reimburses MFS the costs incurred to provide these services. The fund is charged an annual fixed amount of $17,500 plus a fee based on average daily net assets. The administrative services fee incurred for the six months ended June 30, 2013 was equivalent to an annual effective rate of 0.0192% of the fund’s average daily net assets.
Trustees’ and Officers’ Compensation – The fund pays compensation to independent Trustees in the form of a retainer, attendance fees, and additional compensation to Board and Committee chairpersons. The fund does not pay compensation directly to Trustees or officers of the fund who are also officers of the investment adviser, all of whom receive remuneration for their services to the fund from MFS. Certain officers and Trustees of the fund are officers or directors of MFS, MFD, and MFSC.
13
MFS New Discovery Portfolio
Notes to Financial Statements (unaudited) – continued
Other – This fund and certain other funds managed by MFS (the funds) have entered into services agreements (the Agreements) which provide for payment of fees by the funds to Tarantino LLC and Griffin Compliance LLC in return for the provision of services of an Independent Chief Compliance Officer (ICCO) and Assistant ICCO, respectively, for the funds. The ICCO and Assistant ICCO are officers of the funds and the sole members of Tarantino LLC and Griffin Compliance LLC, respectively. The funds can terminate the Agreements with Tarantino LLC and Griffin Compliance LLC at any time under the terms of the Agreements. For the six months ended June 30, 2013, the aggregate fees paid by the fund to Tarantino LLC and Griffin Compliance LLC were $619 and are included in “Miscellaneous” expense in the Statement of Operations. MFS has agreed to reimburse the fund for a portion of the payments made by the fund in the amount of $312, which is shown as a reduction of total expenses in the Statement of Operations. Additionally, MFS has agreed to bear all expenses associated with office space, other administrative support, and supplies provided to the ICCO and Assistant ICCO.
The fund invests in the MFS Institutional Money Market Portfolio which is managed by MFS and seeks current income consistent with preservation of capital and liquidity. Income earned on this investment is included in “Dividends from underlying affiliated funds” in the Statement of Operations. This money market fund does not pay a management fee to MFS.
Purchases and sales of investments, other than short-term obligations, aggregated $100,412,793 and $116,879,674, respectively.
| (5) | | Shares of Beneficial Interest |
The fund’s Declaration of Trust permits the Trustees to issue an unlimited number of full and fractional shares of beneficial interest. Transactions in fund shares were as follows:
| | | | | | | | | | | | | | | | |
| | | Six months ended 6/30/13 | | | Year ended 12/31/12 | |
| | | Shares | | | Amount | | | Shares | | | Amount | |
| Shares sold | | | | | | | | | | | | | | | | |
Initial Class | | | 74,341 | | | | $1,372,674 | | | | 185,133 | | | | $3,029,396 | |
Service Class | | | 211,078 | | | | 3,779,670 | | | | 707,513 | | | | 11,160,128 | |
| | | 285,419 | | | | $5,152,344 | | | | 892,646 | | | | $14,189,524 | |
| Shares issued to shareholders in reinvestment of distributions | | | | | | | | | | | | | | | | |
Initial Class | | | — | | | | $— | | | | 443,203 | | | | $7,020,338 | |
Service Class | | | — | | | | — | | | | 529,644 | | | | 8,082,362 | |
| | | — | | | | $— | | | | 972,847 | | | | $15,102,700 | |
| Shares reacquired | | | | | | | | | | | | | | | | |
Initial Class | | | (399,557 | ) | | | $(7,499,867 | ) | | | (839,595 | ) | | | $(14,044,726 | ) |
Service Class | | | (870,627 | ) | | | (15,708,221 | ) | | | (1,460,233 | ) | | | (23,697,467 | ) |
| | | (1,270,184 | ) | | | $(23,208,088 | ) | | | (2,299,828 | ) | | | $(37,742,193 | ) |
| Net change | | | | | | | | | | | | | | | | |
Initial Class | | | (325,216 | ) | | | $(6,127,193 | ) | | | (211,259 | ) | | | $(3,994,992 | ) |
Service Class | | | (659,549 | ) | | | (11,928,551 | ) | | | (223,076 | ) | | | (4,454,977 | ) |
| | | (984,765 | ) | | | $(18,055,744 | ) | | | (434,335 | ) | | | $(8,449,969 | ) |
The fund and certain other funds managed by MFS participate in a $1.1 billion unsecured committed line of credit, subject to a $1 billion sublimit, provided by a syndication of banks under a credit agreement. Borrowings may be made for temporary financing needs. Interest is charged to each fund, based on its borrowings, generally at a rate equal to the higher of the Federal Reserve funds rate or one month LIBOR plus an agreed upon spread. A commitment fee, based on the average daily, unused portion of the committed line of credit, is allocated among the participating funds at the end of each calendar quarter. In addition, the fund and other funds managed by MFS have established unsecured uncommitted borrowing arrangements with certain banks for temporary financing needs. Interest is charged to each fund, based on its borrowings, at a rate equal to the Federal Reserve funds rate plus an agreed upon spread. For the six months ended June 30, 2013, the fund’s commitment fee and interest expense were $406 and $0, respectively, and are included in “Miscellaneous” expense in the Statement of Operations.
14
MFS New Discovery Portfolio
Notes to Financial Statements (unaudited) – continued
| (7) | | Transactions in Underlying Affiliated Funds – Affiliated Issuers |
An affiliated issuer may be considered one in which the fund owns 5% or more of the outstanding voting securities, or a company which is under common control. For the purposes of this report, the fund assumes the following to be an affiliated issuer:
| | | | | | | | | | | | | | | | |
| Underlying Affiliated Fund | | Beginning Shares/Par Amount | | | Acquisitions Shares/Par Amount | | | Dispositions Shares/Par Amount | | | Ending Shares/Par Amount | |
| MFS Institutional Money Market Portfolio | | | 3,002,788 | | | | 20,262,182 | | | | (23,084,569 | ) | | | 180,401 | |
| | | | |
| Underlying Affiliated Fund | | Realized Gain (Loss) | | | Capital Gain Distributions | | | Dividend Income | | | Ending Value | |
| MFS Institutional Money Market Portfolio | | | $— | | | | $— | | | | $370 | | | | $180,401 | |
15
MFS New Discovery Portfolio
BOARD REVIEW OF INVESTMENT ADVISORY AGREEMENT
A discussion regarding the Board’s most recent review and renewal of the fund’s Investment Advisory Agreement with MFS will be available on or about November 1, 2013 by clicking on the fund’s name under ”Variable Insurance Portfolios — VIT II“ in the “Products” section of the MFS Web site (mfs.com).
PROXY VOTING POLICIES AND INFORMATION
A general description of the MFS funds’ proxy voting policies and procedures is available without charge, upon request, by calling 1-800-225-2606, by visiting the Proxy Voting section of mfs.com or by visiting the SEC’s Web site at http://www.sec.gov.
Information regarding how the fund voted proxies relating to portfolio securities during the most recent twelve-month period ended June 30 is available without charge by visiting the Proxy Voting section of mfs.com or by visiting the SEC’s Web site at http://www.sec.gov.
QUARTERLY PORTFOLIO DISCLOSURE
The fund will file a complete schedule of portfolio holdings with the Securities and Exchange Commission (the Commission) for the first and third quarters of each fiscal year on Form N-Q. The fund’s Form N-Q is available on the EDGAR database on the Commission’s Internet Web site at http://www.sec.gov, and may be reviewed and copied at the:
Public Reference Room
Securities and Exchange Commission
100 F Street, NE, Room 1580
Washington, D.C. 20549
Information on the operation of the Public Reference Room may be obtained by calling the Commission at 1-800-SEC-0330. Copies of the fund’s Form N-Q also may be obtained, upon payment of a duplicating fee, by electronic request at the following e-mail address: publicinfo@sec.gov or by writing the Public Reference Section at the above address.
FURTHER INFORMATION
From time to time, MFS may post important information about the fund or the MFS funds on the MFS web site (mfs.com). This information is available by visiting the ”News & Commentary“ section of mfs.com or by clicking on the fund’s name under ”Variable Insurance Portfolios — VIT II“ in the ”Products“ section of mfs.com.
16
SEMIANNUAL REPORT
June 30, 2013

MFS® VALUE PORTFOLIO
MFS® Variable Insurance Trust II

EIS-SEM
MFS® VALUE PORTFOLIO
CONTENTS
The report is prepared for the general information of contract owners. It is authorized for distribution to prospective investors only when preceded or accompanied by a current prospectus.
NOT FDIC INSURED Ÿ MAY LOSE VALUE Ÿ NO BANK OR CREDIT UNION GUARANTEE Ÿ NOT A DEPOSIT Ÿ NOT INSURED BY ANY FEDERAL GOVERNMENT AGENCY OR NCUA/NCUSIF
MFS Value Portfolio
LETTER FROM THE CHAIRMAN AND CEO

Dear Contract Owners:
As the year progresses, the global economy continues to grind ahead slowly, held back by broad austerity measures. The U.S. economy remains a steadying force, driven by resilient consumers, who have taken the payroll tax increase and the sequestration’s early impact in stride. With U.S. housing and jobs showing steady expansion, domestic consumer-driven growth has offset weaker exports and the U.S. government’s spending constraints. In response to these developments, the U.S. Federal Reserve has begun to brace investors for an eventual shift in its monetary policy, causing global market tremors.
Japan has been another bright spot, with government and central bank stimulus policies leading to increased exports, a resurgent stock market and improved economic sentiment. After a six-month rally, Japan’s stocks slipped late in the second quarter, then picked up momentum on fresh signs that the country could soon break free of its chronic deflation. The major deterrent to global growth remains the eurozone, still in the grip of persistent recession. China has seen its pace of economic growth decelerate, a troubling turn for the country’s trading partners, who have come to rely on it as an engine for global growth.
As always, managing risk in the face of uncertainty remains a top priority for investors. At MFS®, our uniquely collaborative investment process employs integrated, global research and active risk management. Our global team of investment professionals shares ideas and evaluates opportunities across continents, investment disciplines and asset classes — all with a goal of building better insights, and ultimately better results, for our clients.
We are mindful of the many economic challenges investors face, and believe it is more important than ever to maintain a long-term view and employ time-tested principles, such as asset allocation and diversification. We remain confident that our unique approach can serve investors well as they work with their financial advisors to identify and pursue the most suitable opportunities.
Respectfully,

Robert J. Manning
Chairman and Chief Executive Officer
MFS Investment Management®
August 16, 2013
The opinions expressed in this letter are subject to change, may not be relied upon for investment advice, and no forecasts can be guaranteed.
1
MFS Value Portfolio
PORTFOLIO COMPOSITION
Portfolio structure
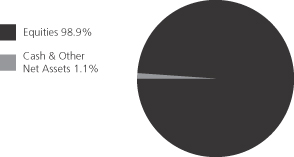
| | | | |
| Top ten holdings | | | | |
| Philip Morris International, Inc. | | | 3.7% | |
| Johnson & Johnson | | | 3.6% | |
| JPMorgan Chase & Co. | | | 3.6% | |
| Lockheed Martin Corp. | | | 3.4% | |
| Pfizer, Inc. | | | 3.2% | |
| Wells Fargo & Co. | | | 2.6% | |
| Goldman Sachs Group, Inc. | | | 2.1% | |
| Exxon Mobil Corp. | | | 2.1% | |
| International Business Machines Corp. | | | 2.0% | |
| MetLife, Inc. | | | 2.0% | |
| | | | |
| Equity sectors | | | | |
| Financial Services | | | 21.6% | |
| Health Care | | | 14.1% | |
| Consumer Staples | | | 13.0% | |
| Industrial Goods & Services | | | 12.1% | |
| Leisure | | | 7.4% | |
| Energy | | | 6.5% | |
| Basic Materials | | | 4.3% | |
| Retailing | | | 4.3% | |
| Technology | | | 4.1% | |
| Utilities & Communications | | | 4.0% | |
| Special Products & Services | | | 2.8% | |
| Autos & Housing | | | 2.7% | |
| Transportation | | | 2.0% | |
Percentages are based on net assets as of 6/30/13.
The portfolio is actively managed and current holdings may be different.
2
MFS Value Portfolio
EXPENSE TABLE
Fund Expenses Borne by the Contract Holders During the Period,
January 1, 2013 through June 30, 2013
As a contract holder of the fund, you incur ongoing costs, including management fees; distribution and/or service (12b-1) fees; and other fund expenses. This example is intended to help you understand your ongoing costs (in dollars) of investing in the fund and to compare these costs with the ongoing costs of investing in other mutual funds.
The example is based on an investment of $1,000 invested at the beginning of the period and held for the entire period January 1, 2013 through June 30, 2013.
Actual Expenses
The first line for each share class in the following table provides information about actual account values and actual expenses. You may use the information in this line, together with the amount you invested, to estimate the expenses that you paid over the period. Simply divide your account value by $1,000 (for example, an $8,600 account value divided by $1,000 = 8.6), then multiply the result by the number in the first line under the heading entitled “Expenses Paid During Period” to estimate the expenses you paid on your account during this period.
Hypothetical Example for Comparison Purposes
The second line for each share class in the following table provides information about hypothetical account values and hypothetical expenses based on the fund’s actual expense ratio and an assumed rate of return of 5% per year before expenses, which is not the fund’s actual return. The hypothetical account values and expenses may not be used to estimate the actual ending account balance or expenses you paid for the period. You may use this information to compare the ongoing costs of investing in the fund and other funds. To do so, compare this 5% hypothetical example with the 5% hypothetical examples that appear in the shareholder reports of the other funds.
Please note that the expenses shown in the table are meant to highlight the fund’s ongoing costs only and do not take into account the fees and expenses imposed under the variable contracts through which your investment in the fund is made. Therefore, the second line for each share class in the table is useful in comparing ongoing costs associated with an investment in vehicles (such as the fund) which fund benefits under variable annuity and variable life insurance contracts and to qualified pension and retirement plans only, and will not help you determine the relative total costs of investing in the fund through variable annuity and variable life insurance contracts. If the fees and expenses imposed under the variable contracts were included, your costs would have been higher.
| | | | | | | | | | | | | | | | | | |
| Share Class | | | | Annualized
Expense Ratio | | | Beginning
Account Value
1/01/13 | | | Ending
Account Value
6/30/13 | | | Expenses Paid
During Period (p)
1/01/13-6/30/13 | |
| Initial Class | | Actual | | | 0.81% | | | | $1,000.00 | | | | $1,166.06 | | | | $4.35 | |
| | Hypothetical (h) | | | 0.81% | | | | $1,000.00 | | | | $1,020.78 | | | | $4.06 | |
| Service Class | | Actual | | | 1.06% | | | | $1,000.00 | | | | $1,164.71 | | | | $5.69 | |
| | Hypothetical (h) | | | 1.06% | | | | $1,000.00 | | | | $1,019.54 | | | | $5.31 | |
| (h) | 5% class return per year before expenses. |
| (p) | Expenses paid are equal to each class’s annualized expense ratio, as shown above, multiplied by the average account value over the period, multiplied by the number of days in the period, divided by the number of days in the year. |
3
MFS Value Portfolio
PORTFOLIO OF INVESTMENTS – 6/30/13 (unaudited)
The Portfolio of Investments is a complete list of all securities owned by your fund. It is categorized by broad-based asset classes.
| | | | | | | | |
| Issuer | | Shares/Par | | | Value ($) | |
| | | | | | | | |
| COMMON STOCKS – 98.7% | | | | | |
| Aerospace – 8.1% | | | | | | | | |
| Honeywell International, Inc. | | | 77,500 | | | $ | 6,148,850 | |
| Lockheed Martin Corp. | | | 101,557 | | | | 11,014,872 | |
| Northrop Grumman Corp. | | | 37,910 | | | | 3,138,948 | |
| United Technologies Corp. | | | 66,825 | | | | 6,210,716 | |
| | | | | | | | |
| | | | | | $ | 26,513,386 | |
| | | | | | | | |
| Alcoholic Beverages – 1.6% | | | | | |
| Diageo PLC | | | 180,363 | | | $ | 5,173,395 | |
| | | | | | | | |
| Automotive – 1.8% | | | | | | | | |
| Delphi Automotive PLC | | | 44,020 | | | $ | 2,231,374 | |
| General Motors Co. (a) | | | 21,550 | | | | 717,831 | |
| Johnson Controls, Inc. | | | 81,445 | | | | 2,914,917 | |
| | | | | | | | |
| | | | | | $ | 5,864,122 | |
| | | | | | | | |
| Broadcasting – 4.1% | | | | | | | | |
| Omnicom Group, Inc. | | | 62,528 | | | $ | 3,931,135 | |
| Viacom, Inc., “B” | | | 60,970 | | | | 4,149,009 | |
| Walt Disney Co. | | | 82,382 | | | | 5,202,423 | |
| | | | | | | | |
| | | | | | $ | 13,282,567 | |
| | | | | | | | |
| Brokerage & Asset Managers – 1.8% | | | | | |
| BlackRock, Inc. | | | 11,224 | | | $ | 2,882,884 | |
| Franklin Resources, Inc. | | | 17,640 | | | | 2,399,393 | |
| NASDAQ OMX Group, Inc. | | | 21,753 | | | | 713,281 | |
| | | | | | | | |
| | | | | | $ | 5,995,558 | |
| | | | | | | | |
| Business Services – 2.8% | | | | | |
| Accenture PLC, “A” | | | 83,447 | | | $ | 6,004,846 | |
| Dun & Bradstreet Corp. | | | 9,237 | | | | 900,146 | |
| Fidelity National Information Services, Inc. | | | 12,010 | | | | 514,508 | |
| Fiserv, Inc. (a) | | | 17,980 | | | | 1,571,632 | |
| | | | | | | | |
| | | | | | $ | 8,991,132 | |
| | | | | | | | |
| Cable TV – 0.9% | | | | | | | | |
| Comcast Corp., “Special A” | | | 76,880 | | | $ | 3,049,830 | |
| | | | | | | | |
| Chemicals – 3.4% | | | | | | | | |
| 3M Co. | | | 55,809 | | | $ | 6,102,714 | |
| PPG Industries, Inc. | | | 33,791 | | | | 4,947,340 | |
| | | | | | | | |
| | | | | | $ | 11,050,054 | |
| | | | | | | | |
| Computer Software – 1.2% | | | | | |
| Oracle Corp. | | | 125,683 | | | $ | 3,860,982 | |
| | | | | | | | |
| Computer Software – Systems – 2.2% | | | | | |
| Hewlett-Packard Co. | | | 28,320 | | | $ | 702,336 | |
| International Business Machines Corp. | | | 34,022 | | | | 6,501,944 | |
| | | | | | | | |
| | | | | | $ | 7,204,280 | |
| | | | | | | | |
| Construction – 0.9% | | | | | |
| Stanley Black & Decker, Inc. | | | 38,956 | | | $ | 3,011,299 | |
| | | | | | | | |
| Consumer Products – 0.6% | | | | | |
| Procter & Gamble Co. | | | 24,778 | | | $ | 1,907,658 | |
| | | | | | | | |
| | | | | | | | |
| Issuer | | Shares/Par | | | Value ($) | |
| | | | | | | | |
| COMMON STOCKS – continued | | | | | |
| Electrical Equipment – 2.6% | | | | | |
| Danaher Corp. | | | 63,210 | | | $ | 4,001,193 | |
| Pentair Ltd. | | | 22,786 | | | | 1,314,524 | |
| Tyco International Ltd. | | | 101,480 | | | | 3,343,766 | |
| | | | | | | | |
| | | | | | $ | 8,659,483 | |
| | | | | | | | |
| Electronics – 0.7% | | | | | | | | |
| Intel Corp. | | | 92,172 | | | $ | 2,232,406 | |
| | | | | | | | |
| Energy – Independent – 2.7% | | | | | |
| Apache Corp. | | | 20,715 | | | $ | 1,736,538 | |
| EOG Resources, Inc. | | | 15,975 | | | | 2,103,588 | |
| Occidental Petroleum Corp. | | | 54,557 | | | | 4,868,121 | |
| | | | | | | | |
| | | | | | $ | 8,708,247 | |
| | | | | | | | |
| Energy – Integrated – 3.8% | | | | | |
| Chevron Corp. | | | 48,771 | | | $ | 5,771,560 | |
| Exxon Mobil Corp. | | | 74,867 | | | | 6,764,233 | |
| | | | | | | | |
| | | | | | $ | 12,535,793 | |
| | | | | | | | |
| Engineering – Construction – 0.1% | | | | | |
| Fluor Corp. | | | 7,350 | | | $ | 435,929 | |
| | | | | | | | |
| Food & Beverages – 5.5% | | | | | |
| Coca-Cola Enterprises, Inc. | | | 30,770 | | | $ | 1,081,873 | |
| Dr Pepper Snapple Group, Inc. | | | 29,900 | | | | 1,373,307 | |
| General Mills, Inc. | | | 104,360 | | | | 5,064,591 | |
| Groupe Danone | | | 42,681 | | | | 3,203,342 | |
| J.M. Smucker Co. | | | 8,860 | | | | 913,909 | |
| Kellogg Co. | | | 18,190 | | | | 1,168,344 | |
| Nestle S.A. | | | 59,834 | | | | 3,913,528 | |
| PepsiCo, Inc. | | | 13,793 | | | | 1,128,129 | |
| | | | | | | | |
| | | | | | $ | 17,847,023 | |
| | | | | | | | |
| Food & Drug Stores – 1.6% | | | | | |
| CVS Caremark Corp. | | | 93,643 | | | $ | 5,354,507 | |
| | | | | | | | |
| General Merchandise – 1.9% | | | | | |
| Kohl’s Corp. | | | 17,400 | | | $ | 878,874 | |
| Target Corp. | | | 75,840 | | | | 5,222,342 | |
| | | | | | | | |
| | | | | | $ | 6,101,216 | |
| | | | | | | | |
| Insurance – 7.2% | | | | | | | | |
| ACE Ltd. | | | 40,420 | | | $ | 3,616,782 | |
| Aon PLC | | | 47,070 | | | | 3,028,955 | |
| Chubb Corp. | | | 25,975 | | | | 2,198,784 | |
| MetLife, Inc. | | | 141,168 | | | | 6,459,848 | |
| Prudential Financial, Inc. | | | 57,277 | | | | 4,182,939 | |
| Travelers Cos., Inc. | | | 52,165 | | | | 4,169,027 | |
| | | | | | | | |
| | | | | | $ | 23,656,335 | |
| | | | | | | | |
| Leisure & Toys – 0.7% | | | | | | | | |
| Hasbro, Inc. | | | 51,713 | | | $ | 2,318,294 | |
| | | | | | | | |
4
MFS Value Portfolio
Portfolio of Investments (unaudited) – continued
| | | | | | | | |
| Issuer | | Shares/Par | | | Value ($) | |
| | | | | | | | |
| COMMON STOCKS – continued | | | | | |
| Machinery & Tools – 1.2% | | | | | |
| Eaton Corp. PLC | | | 45,320 | | | $ | 2,982,509 | |
| Illinois Tool Works, Inc. | | | 14,900 | | | | 1,030,633 | |
| | | | | | | | |
| | | | | | $ | 4,013,142 | |
| | | | | | | | |
| Major Banks – 11.4% | | | | | | | | |
| Bank of New York Mellon Corp. | | | 159,635 | | | $ | 4,477,762 | |
| Goldman Sachs Group, Inc. | | | 44,828 | | | | 6,780,235 | |
| JPMorgan Chase & Co. | | | 223,752 | | | | 11,811,868 | |
| PNC Financial Services Group, Inc. | | | 33,035 | | | | 2,408,912 | |
| State Street Corp. | | | 50,055 | | | | 3,264,087 | |
| Wells Fargo & Co. | | | 205,362 | | | | 8,475,290 | |
| | | | | | | | |
| | | | | | $ | 37,218,154 | |
| | | | | | | | |
| Medical & Health Technology & Services – 1.0% | |
| Express Scripts Holding Co. (a) | | | 27,590 | | | $ | 1,702,027 | |
| Quest Diagnostics, Inc. | | | 24,590 | | | | 1,490,892 | |
| | | | | | | | |
| | | | | | $ | 3,192,919 | |
| | | | | | | | |
| Medical Equipment – 4.4% | | | | | | | | |
| Abbott Laboratories | | | 69,742 | | | $ | 2,432,601 | |
| Becton, Dickinson & Co. | | | 6,752 | | | | 667,300 | |
| Covidien PLC | | | 15,900 | | | | 999,156 | |
| Medtronic, Inc. | | | 73,900 | | | | 3,803,633 | |
| St. Jude Medical, Inc. | | | 58,700 | | | | 2,678,481 | |
| Thermo Fisher Scientific, Inc. | | | 45,735 | | | | 3,870,553 | |
| | | | | | | | |
| | | | | | $ | 14,451,724 | |
| | | | | | | | |
| Other Banks & Diversified Financials – 1.2% | |
| MasterCard, Inc., “A” | | | 2,284 | | | $ | 1,312,158 | |
| Western Union Co. | | | 142,815 | | | | 2,443,565 | |
| | | | | | | | |
| | | | | | $ | 3,755,723 | |
| | | | | | | | |
| Pharmaceuticals – 8.7% | | | | | |
| AbbVie, Inc. | | | 28,602 | | | $ | 1,182,407 | |
| Johnson & Johnson | | | 137,757 | | | | 11,827,816 | |
| Merck & Co., Inc. | | | 61,602 | | | | 2,861,413 | |
| Pfizer, Inc. | | | 375,848 | | | | 10,527,502 | |
| Roche Holding AG | | | 8,036 | | | | 1,991,195 | |
| Zoetis, Inc. | | | 3,370 | | | | 104,099 | |
| | | | | | | | |
| | | | | | $ | 28,494,432 | |
| | | | | | | | |
| Printing & Publishing – 1.0% | | | | | |
| McGraw-Hill Cos., Inc. | | | 25,990 | | | $ | 1,382,408 | |
| Moody’s Corp. | | | 29,760 | | | | 1,813,277 | |
| | | | | | | | |
| | | | | | $ | 3,195,685 | |
| | | | | | | | |
| Railroad & Shipping – 0.4% | | | | | |
| Canadian National Railway Co. | | | 14,760 | | | $ | 1,435,705 | |
| | | | | | | | |
| Restaurants – 0.7% | | | | | | | | |
| McDonald’s Corp. | | | 23,152 | | | $ | 2,292,048 | |
| | | | | | | | |
| Specialty Chemicals – 0.9% | | | | | |
| Air Products & Chemicals, Inc. | | | 33,427 | | | $ | 3,060,910 | |
| | | | | | | | |
| Specialty Stores – 0.8% | | | | | |
| Advance Auto Parts, Inc. | | | 22,260 | | | $ | 1,806,844 | |
| Staples, Inc. | | | 49,200 | | | | 780,312 | |
| | | | | | | | |
| | | | | | $ | 2,587,156 | |
| | | | | | | | |
| | | | | | | | |
| Issuer | | Shares/Par | | | Value ($) | |
| | | | | | | | |
| COMMON STOCKS – continued | | | | | |
| Telecommunications – Wireless – 1.2% | |
| Vodafone Group PLC | | | 1,394,145 | | | $ | 4,000,804 | |
| | | | | | | | |
| Telephone Services – 2.4% | | | | | |
| AT&T, Inc. | | | 147,032 | | | $ | 5,204,933 | |
| Verizon Communications, Inc. | | | 53,600 | | | | 2,698,224 | |
| | | | | | | | |
| | | | | | $ | 7,903,157 | |
| | | | | | | | |
| Tobacco – 5.3% | | | | | | | | |
| Altria Group, Inc. | | | 46,122 | | | $ | 1,613,809 | |
| Lorillard, Inc. | | | 84,680 | | | | 3,698,822 | |
| Philip Morris International, Inc. | | | 138,615 | | | | 12,006,831 | |
| | | | | | | | |
| | | | | | $ | 17,319,462 | |
| | | | | | | | |
| Trucking – 1.6% | | | | | | | | |
| United Parcel Service, Inc., “B” | | | 60,150 | | | $ | 5,201,772 | |
| | | | | | | | |
| Utilities – Electric Power – 0.3% | | | | | |
| PPL Corp. | | | 18,142 | | | $ | 548,977 | |
| Public Service Enterprise Group, Inc. | | | 18,043 | | | | 589,282 | |
| | | | | | | | |
| | | | | | $ | 1,138,259 | |
| | | | | | | | |
Total Common Stocks (Identified Cost, $227,576,391) | | | | | | $ | 323,014,548 | |
| | | | | | | | |
|
| CONVERTIBLE PREFERRED STOCKS – 0.2% | |
| Aerospace – 0.1% | | | | | | | | |
| United Technologies Corp., 7.5% | | | 5,450 | | | $ | 323,512 | |
| | | | | | | | |
| Utilities – Electric Power – 0.1% | |
| PPL Corp., 9.5% | | | 6,380 | | | $ | 334,376 | |
| | | | | | | | |
Total Convertible Preferred Stocks
(Identified Cost, $591,500) | | | $ | 657,888 | |
| | | | | | | | |
| |
| MONEY MARKET FUNDS – 1.0% | | | | | |
| MFS Institutional Money Market Portfolio, 0.11%, at Cost and Net Asset Value (v) | | | 3,169,269 | | | $ | 3,169,269 | |
| | | | | | | | |
Total Investments
(Identified Cost, $231,337,160) | | | $ | 326,841,705 | |
| | | | | | | | |
OTHER ASSETS, LESS
LIABILITIES – 0.1% | | | | | | | 276,375 | |
| | | | | | | | |
| Net Assets – 100.0% | | | | | | $ | 327,118,080 | |
| | | | | | | | |
| (a) | | Non-income producing security. |
| (v) | | Underlying affiliated fund that is available only to investment companies managed by MFS. The rate quoted for the MFS Institutional Money Market Portfolio is the annualized seven-day yield of the fund at period end. |
The following abbreviations are used in this report and are defined:
| PLC | | Public Limited Company |
See Notes to Financial Statements
5
MFS Value Portfolio
FINANCIAL STATEMENTS | STATEMENT OF ASSETS AND LIABILITIES (unaudited)
This statement represents your fund’s balance sheet, which details the assets and liabilities comprising the total value of the fund.
| | | | | | | | |
At 6/30/13 | | | | | | | | |
Assets | | | | | | | | |
Investments – | | | | | | | | |
Non-affiliated issuers, at value (identified cost, $228,167,891) | | | $323,672,436 | | | | | |
Underlying affiliated funds, at cost and value | | | 3,169,269 | | | | | |
Total investments, at value (identified cost, $231,337,160) | | | $326,841,705 | | | | | |
Receivables for | | | | | | | | |
Investments sold | | | 222,201 | | | | | |
Fund shares sold | | | 84,425 | | | | | |
Interest and dividends | | | 663,384 | | | | | |
Other assets | | | 2,756 | | | | | |
Total assets | | | | | | | $327,814,471 | |
Liabilities | | | | | | | | |
Payable to custodian | | | $56 | | | | | |
Payable for fund shares reacquired | | | 604,152 | | | | | |
Payable to affiliates | | | | | | | | |
Investment adviser | | | 29,512 | | | | | |
Shareholder servicing costs | | | 101 | | | | | |
Distribution and/or service fees | | | 5,384 | | | | | |
Payable for independent trustees’ compensation | | | 1,636 | | | | | |
Accrued expenses and other liabilities | | | 55,550 | | | | | |
Total liabilities | | | | | | | $696,391 | |
Net assets | | | | | | | $327,118,080 | |
Net assets consist of | | | | | | | | |
Paid-in capital | | | $193,061,601 | | | | | |
Unrealized appreciation (depreciation) on investments and translation of assets and liabilities in foreign currencies | | | 95,497,135 | | | | | |
Accumulated net realized gain (loss) on investments and foreign currency | | | 26,695,330 | | | | | |
Undistributed net investment income | | | 11,864,014 | | | | | |
Net assets | | | | | | | $327,118,080 | |
Shares of beneficial interest outstanding | | | | | | | 20,565,477 | |
| | | | | | | | | | | | |
| | | Net assets | | | Shares outstanding | | | Net asset value per share | |
Initial Class | | | $131,685,267 | | | | 8,225,250 | | | | $16.01 | |
Service Class | | | 195,432,813 | | | | 12,340,227 | | | | 15.84 | |
See Notes to Financial Statements
6
MFS Value Portfolio
FINANCIAL STATEMENTS | STATEMENT OF OPERATIONS (unaudited)
This statement describes how much your fund earned in investment income and accrued in expenses. It also describes any gains and/or losses generated by fund operations.
| | | | | | | | |
Six months ended 6/30/13 | | | | | | | | |
Net investment income | | | | | | | | |
Income | | | | | | | | |
Dividends | | | $4,332,193 | | | | | |
Interest | | | 1,117 | | | | | |
Dividends from underlying affiliated funds | | | 1,695 | | | | | |
Foreign taxes withheld | | | (43,734 | ) | | | | |
Total investment income | | | | | | | $4,291,271 | |
Expenses | | | | | | | | |
Management fee | | | $1,245,237 | | | | | |
Distribution and/or service fees | | | 252,672 | | | | | |
Shareholder servicing costs | | | 2,367 | | | | | |
Administrative services fee | | | 26,222 | | | | | |
Independent trustees’ compensation | | | 5,096 | | | | | |
Custodian fee | | | 21,332 | | | | | |
Shareholder communications | | | 7,845 | | | | | |
Audit and tax fees | | | 24,166 | | | | | |
Legal fees | | | 2,713 | | | | | |
Miscellaneous | | | 10,572 | | | | | |
Total expenses | | | | | | | $1,598,222 | |
Fees paid indirectly | | | (3 | ) | | | | |
Reduction of expenses by investment adviser | | | (1,083 | ) | | | | |
Net expenses | | | | | | | $1,597,136 | |
Net investment income | | | | | | | $2,694,135 | |
Realized and unrealized gain (loss) on investments and foreign currency | | | | | | | | |
Realized gain (loss) (identified cost basis) | | | | | | | | |
Investments | | | $10,015,303 | | | | | |
Foreign currency | | | (5,011 | ) | | | | |
Net realized gain (loss) on investments and foreign currency | | | | | | | $10,010,292 | |
Change in unrealized appreciation (depreciation) | | | | | | | | |
Investments | | | $37,959,177 | | | | | |
Translation of assets and liabilities in foreign currencies | | | (10,611 | ) | | | | |
Net unrealized gain (loss) on investments and foreign currency translation | | | | | | | $37,948,566 | |
Net realized and unrealized gain (loss) on investments and foreign currency | | | | | | | $47,958,858 | |
Change in net assets from operations | | | | | | | $50,652,993 | |
See Notes to Financial Statements
7
MFS Value Portfolio
FINANCIAL STATEMENTS | STATEMENTS OF CHANGES IN NET ASSETS
These statements describe the increases and/or decreases in net assets resulting from operations, any distributions, and any shareholder transactions.
| | | | | | | | |
| |
| Six months ended
6/30/13 (unaudited |
) | |
| Year ended
12/31/12 |
|
Change in net assets | | | | | | | | |
| From operations | | | | | | | | |
Net investment income | | | $2,694,135 | | | | $9,183,843 | |
Net realized gain (loss) on investments and foreign currency | | | 10,010,292 | | | | 19,841,464 | |
Net unrealized gain (loss) on investments and foreign currency translation | | | 37,948,566 | | | | 44,601,691 | |
Change in net assets from operations | | | $50,652,993 | | | | $73,626,998 | |
| Distributions declared to shareholders | | | | | | | | |
From net investment income | | | $— | | | | $(8,840,197 | ) |
From net realized gain on investments | | | — | | | | (24,335,355 | ) |
Total distributions declared to shareholders | | | $— | | | | $(33,175,552 | ) |
Change in net assets from fund share transactions | | | $(37,305,184 | ) | | | $(238,128,206 | ) |
Total change in net assets | | | $13,347,809 | | | | $(197,676,760 | ) |
| Net assets | | | | | | | | |
At beginning of period | | | 313,770,271 | | | | 511,447,031 | |
At end of period (including undistributed net investment income of $11,864,014 and
$9,169,879, respectively) | | | $327,118,080 | | | | $313,770,271 | |
See Notes to Financial Statements
8
MFS Value Portfolio
FINANCIAL STATEMENTS | FINANCIAL HIGHLIGHTS
The financial highlights table is intended to help you understand the fund’s financial performance for the semiannual period and the past 5 fiscal years. Certain information reflects financial results for a single fund share. The total returns in the table represent the rate by which an investor would have earned (or lost) on an investment in the fund share class (assuming reinvestment of all distributions) held for the entire period.
| | | | | | | | | | | | | | | | | | | | | | | | |
| Initial Class | | Six months ended 6/30/13 | | | Years ended 12/31 | |
| | | | 2012 | | | 2011 | | | 2010 | | | 2009 | | | 2008 | |
| | | (unaudited) | | | | | | | | | | | | | | | | |
Net asset value, beginning of period | | | $13.73 | | | | $12.64 | | | | $13.91 | | | | $12.64 | | | | $10.70 | | | | $18.78 | |
| Income (loss) from investment operations | | | | | | | | | | | | | | | | | | | | | | | | |
Net investment income (d) | | | $0.14 | | | | $0.26 | | | | $0.24 | | | | $0.20 | | | | $0.22 | | | | $0.25 | |
Net realized and unrealized gain (loss) on investments and foreign currency | | | 2.14 | | | | 1.76 | | | | (0.31 | ) | | | 1.25 | | | | 1.92 | | | | (5.50 | ) |
Total from investment operations | | | $2.28 | | | | $2.02 | | | | $(0.07 | ) | | | $1.45 | | | | $2.14 | | | | $(5.25 | ) |
| Less distributions declared to shareholders | | | | | | | | | | | | | | | | | | | | | | | | |
From net investment income | | | $— | | | | $(0.26 | ) | | | $(0.23 | ) | | | $(0.18 | ) | | | $(0.20 | ) | | | $(0.30 | ) |
From net realized gain on investments | | | — | | | | (0.67 | ) | | | (0.97 | ) | | | — | | | | — | | | | (2.53 | ) |
Total distributions declared to shareholders | | | $— | | | | $(0.93 | ) | | | $(1.20 | ) | | | $(0.18 | ) | | | $(0.20 | ) | | | $(2.83 | ) |
Net asset value, end of period (x) | | | $16.01 | | | | $13.73 | | | | $12.64 | | | | $13.91 | | | | $12.64 | | | | $10.70 | |
Total return (%) (k)(r)(s)(x) | | | 16.61 | (n) | | | 16.22 | | | | (0.00 | )(w) | | | 11.51 | | | | 20.49 | | | | (32.64 | ) |
Ratios (%) (to average net assets)
and Supplemental data: | | | | | | | | | | | | | | | | | | | | | | | | |
Expenses before expense reductions (f) | | | 0.81 | (a) | | | 0.80 | | | | 0.82 | | | | 0.84 | | | | 0.85 | | | | 0.84 | |
Expenses after expense reductions (f) | | | 0.81 | (a) | | | 0.80 | | | | N/A | | | | N/A | | | | N/A | | | | N/A | |
Net investment income | | | 1.77 | (a) | | | 1.93 | | | | 1.81 | | | | 1.59 | | | | 1.98 | | | | 1.75 | |
Portfolio turnover | | | 7 | (n) | | | 15 | | | | 22 | | | | 34 | | | | 27 | | | | 44 | |
Net assets at end of period (000 omitted) | | | $131,685 | | | | $120,665 | | | | $307,523 | | | | $298,799 | | | | $268,001 | | | | $146,011 | |
| | |
| Service Class | | Six months ended 6/30/13 | | | Years ended 12/31 | |
| | | | 2012 | | | 2011 | | | 2010 | | | 2009 | | | 2008 | |
| | | (unaudited) | | | | | | | | | | | | | | | | |
Net asset value, beginning of period | | | $13.60 | | | | $12.52 | | | | $13.79 | | | | $12.54 | | | | $10.61 | | | | $18.66 | |
| Income (loss) from investment operations | | | | | | | | | | | | | | | | | | | | | | | | |
Net investment income (d) | | | $0.12 | | | | $0.23 | | | | $0.21 | | | | $0.17 | | | | $0.19 | | | | $0.22 | |
Net realized and unrealized gain (loss) on investments and foreign currency | | | 2.12 | | | | 1.74 | | | | (0.31 | ) | | | 1.23 | | | | 1.91 | | | | (5.48 | ) |
Total from investment operations | | | $2.24 | | | | $1.97 | | | | $(0.10 | ) | | | $1.40 | | | | $2.10 | | | | $(5.26 | ) |
| Less distributions declared to shareholders | | | | | | | | | | | | | | | | | | | | | | | | |
From net investment income | | | $— | | | | $(0.22 | ) | | | $(0.20 | ) | | | $(0.15 | ) | | | $(0.17 | ) | | | $(0.26 | ) |
From net realized gain on investments | | | — | | | | (0.67 | ) | | | (0.97 | ) | | | — | | | | — | | | | (2.53 | ) |
Total distributions declared to shareholders | | | $— | | | | $(0.89 | ) | | | $(1.17 | ) | | | $(0.15 | ) | | | $(0.17 | ) | | | $(2.79 | ) |
Net asset value, end of period (x) | | | $15.84 | | | | $13.60 | | | | $12.52 | | | | $13.79 | | | | $12.54 | | | | $10.61 | |
Total return (%) (k)(r)(s)(x) | | | 16.47 | (n) | | | 15.97 | | | | (0.29 | ) | | | 11.22 | | | | 20.30 | | | | (32.87 | ) |
Ratios (%) (to average net assets)
and Supplemental data: | | | | | | | | | | | | | | | | | | | | | | | | |
Expenses before expense reductions (f) | | | 1.06 | (a) | | | 1.05 | | | | 1.07 | | | | 1.09 | | | | 1.10 | | | | 1.09 | |
Expenses after expense reductions (f) | | | 1.06 | (a) | | | 1.05 | | | | N/A | | | | N/A | | | | N/A | | | | N/A | |
Net investment income | | | 1.53 | (a) | | | 1.73 | | | | 1.54 | | | | 1.33 | | | | 1.73 | | | | 1.62 | |
Portfolio turnover | | | 7 | (n) | | | 15 | | | | 22 | | | | 34 | | | | 27 | | | | 44 | |
Net assets at end of period (000 omitted) | | | $195,433 | | | | $193,106 | | | | $203,924 | | | | $232,425 | | | | $228,388 | | | | $165,519 | |
See Notes to Financial Statements
9
MFS Value Portfolio
Financial Highlights – continued
| (d) | | Per share data is based on average shares outstanding. |
| (f) | | Ratios do not reflect reductions from fees paid indirectly, if applicable. |
| (k) | | The total return does not reflect expenses that apply to separate accounts. Inclusion of these charges would reduce the total return figures for all periods shown. |
| (r) | | Certain expenses have been reduced without which performance would have been lower. |
| (s) | | From time to time the fund may receive proceeds from litigation settlements, without which performance would be lower. |
| (w) | | Per share amount was less than $0.01 and total return or ratio was less than 0.01%, as applicable. |
| (x) | | The net asset values per share and total returns have been calculated on net assets which include adjustments made in accordance with U.S. generally accepted accounting principles required at period end for financial reporting purposes. |
See Notes to Financial Statements
10
MFS Value Portfolio
NOTES TO FINANCIAL STATEMENTS (unaudited)
| (1) | | Business and Organization |
MFS Value Portfolio (the fund) is a series of MFS Variable Insurance Trust II (the trust). The trust is organized as a Massachusetts business trust and is registered under the Investment Company Act of 1940, as amended, as an open-end management investment company. The shareholders of each series of the trust are separate accounts of insurance companies, which offer variable annuity and/or life insurance products, and qualified retirement and pension plans.
| (2) | | Significant Accounting Policies |
General – The preparation of financial statements in conformity with U.S. generally accepted accounting principles requires management to make estimates and assumptions that affect the reported amounts of assets and liabilities, and disclosure of contingent assets and liabilities at the date of the financial statements and the reported amounts of revenues and expenses during the reporting period. Actual results could differ from those estimates. In the preparation of these financial statements, management has evaluated subsequent events occurring after the date of the fund’s Statement of Assets and Liabilities through the date that the financial statements were issued.
In this reporting period, the fund adopted the disclosure provisions of the Financial Accounting Standards Board (FASB) Accounting Standards Update 2011-11 (“ASU 2011-11”), Balance Sheet (Topic 210) – Disclosures about Offsetting Assets and Liabilities along with the related scope clarification provisions of FASB Accounting Standards Update 2013-01 (“ASU 2013-01”) entitled Balance Sheet (Topic 210) – Clarifying the Scope of Disclosures about Offsetting Assets and Liabilities. ASU 2011-11 is intended to enhance disclosures on the offsetting of financial assets and liabilities by requiring entities to disclose both gross and net information about financial instruments and transactions that are either offset in the statement of financial position or subject to a Master Netting Agreement or similar arrangement. ASU 2013-01 limits the scope of ASU 2011-11’s disclosure requirements on offsetting to financial assets and financial liabilities related to derivatives, repurchase and reverse repurchase agreements, and securities lending and securities borrowing transactions. The disclosures required by ASU 2011-11, to the extent applicable to the fund, have been included in the fund’s Significant Accounting Policies note under the captions for each of the fund’s in-scope financial instruments and transactions.
In June 2013, FASB issued Accounting Standards Update 2013-08 Financial Services – Investment Companies (Topic 946) – Amendments to the Scope, Measurement, and Disclosure Requirements (“ASU 2013-08”) which is effective for interim and annual reporting periods in fiscal years that begin after December 15, 2013. ASU 2013-08 sets forth a methodology for determining whether an entity should be characterized as an investment company and prescribes fair value accounting for an investment company’s non-controlling ownership interest in another investment company. FASB has determined that a fund registered under the Investment Company Act of 1940 automatically meets ASU 2013-08’s criteria for an investment company. Although still evaluating the potential impacts of ASU 2013-08 to the fund, management expects that the impact of the fund’s adoption will be limited to additional financial statement disclosures.
Investment Valuations – Equity securities, including restricted equity securities, are generally valued at the last sale or official closing price as provided by a third-party pricing service on the market or exchange on which they are primarily traded. Equity securities, for which there were no sales reported that day, are generally valued at the last quoted daily bid quotation as provided by a third-party pricing service on the market or exchange on which such securities are primarily traded. Short-term instruments with a maturity at issuance of 60 days or less generally are valued at amortized cost, which approximates market value. Open-end investment companies are generally valued at net asset value per share. Securities and other assets generally valued on the basis of information from a third-party pricing service may also be valued at a broker/dealer bid quotation. Values obtained from third-party pricing services can utilize both transaction data and market information such as yield, quality, coupon rate, maturity, type of issue, trading characteristics, and other market data. The values of foreign securities and other assets and liabilities expressed in foreign currencies are converted to U.S. dollars using the mean of bid and asked prices for rates provided by a third-party pricing service.
The Board of Trustees has delegated primary responsibility for determining or causing to be determined the value of the fund’s investments (including any fair valuation) to the adviser pursuant to valuation policies and procedures approved by the Board. If the adviser determines that reliable market quotations are not readily available, investments are valued at fair value as determined in good faith by the adviser in accordance with such procedures under the oversight of the Board of Trustees. Under the fund’s valuation policies and procedures, market quotations are not considered to be readily available for most types of debt instruments and floating rate loans and many types of derivatives. These investments are generally valued at fair value based on information from third-party pricing services. In addition, investments may be valued at fair value if the adviser determines that an investment’s value has been materially affected by events occurring after the close of the exchange or market on which the investment is principally traded (such as foreign exchange or market) and prior to the determination of the fund’s net asset value, or after the halting of trading of a specific security where trading does not resume prior to the close of the exchange or market on which the security is principally traded. Events that occur on a frequent basis after foreign markets close (such as developments in foreign markets and significant movements in the U.S. markets) and prior to the determination of the fund’s net asset value may be deemed to have a material effect on the value of securities traded in foreign markets. Accordingly, the fund’s foreign equity securities may often be valued at fair value. The adviser generally relies on third-party pricing services or other information (such as the correlation with price
11
MFS Value Portfolio
Notes to Financial Statements (unaudited) – continued
movements of similar securities in the same or other markets; the type, cost and investment characteristics of the security; the business and financial condition of the issuer; and trading and other market data) to assist in determining whether to fair value and at what value to fair value an investment. The value of an investment for purposes of calculating the fund’s net asset value can differ depending on the source and method used to determine value. When fair valuation is used, the value of an investment used to determine the fund’s net asset value may differ from quoted or published prices for the same investment. There can be no assurance that the fund could obtain the fair value assigned to an investment if it were to sell the investment at the same time at which the fund determines its net asset value per share.
Various inputs are used in determining the value of the fund’s assets or liabilities. These inputs are categorized into three broad levels. In certain cases, the inputs used to measure fair value may fall into different levels of the fair value hierarchy. In such cases, an investment’s level within the fair value hierarchy is based on the lowest level of input that is significant to the fair value measurement. The fund’s assessment of the significance of a particular input to the fair value measurement in its entirety requires judgment, and considers factors specific to the investment. Level 1 includes unadjusted quoted prices in active markets for identical assets or liabilities. Level 2 includes other significant observable market-based inputs (including quoted prices for similar securities, interest rates, prepayment speed, and credit risk). Level 3 includes unobservable inputs, which may include the adviser’s own assumptions in determining the fair value of investments. The following is a summary of the levels used as of June 30, 2013 in valuing the fund’s assets or liabilities:
| | | | | | | | | | | | | | | | |
| Investments at Value | | Level 1 | | | Level 2 | | | Level 3 | | | Total | |
| Equity Securities: | | | | | | | | | | | | | | | | |
United States | | | $303,954,467 | | | | $— | | | | $— | | | | $303,954,467 | |
United Kingdom | | | — | | | | 9,174,199 | | | | — | | | | — | |
Switzerland | | | — | | | | 5,904,723 | | | | — | | | | 5,904,723 | |
France | | | 3,203,342 | | | | — | | | | — | | | | 3,203,342 | |
Canada | | | 1,435,705 | | | | — | | | | — | | | | 1,435,705 | |
| Mutual Funds | | | 3,169,269 | | | | — | | | | — | | | | 3,169,269 | |
| Total Investments | | | $311,762,783 | | | | $15,078,922 | | | | $— | | | | $326,841,705 | |
For further information regarding security characteristics, see the Portfolio of Investments.
Of the level 2 investments presented above, equity investments amounting to $3,913,528 would have been considered level 1 investments at the beginning of the period. Of the level 1 investments presented above, equity investments amounting to $3,203,342 would have been considered level 2 investments at the beginning of the period. The primary reason for changes in the classifications between levels 1 and 2 occurs when foreign equity securities are fair valued using other observable market-based inputs in place of the closing exchange price due to events occurring after the close of the exchange or market on which the investment is principally traded. The fund’s foreign equity securities may often be valued at fair value. The fund’s policy is to recognize transfers between the levels as of the end of the period.
Foreign Currency Translation – Purchases and sales of foreign investments, income, and expenses are converted into U.S. dollars based upon currency exchange rates prevailing on the respective dates of such transactions or on the reporting date for foreign denominated receivables and payables. Gains and losses attributable to foreign currency exchange rates on sales of securities are recorded for financial statement purposes as net realized gains and losses on investments. Gains and losses attributable to foreign exchange rate movements on receivables, payables, income and expenses are recorded for financial statement purposes as foreign currency transaction gains and losses. That portion of both realized and unrealized gains and losses on investments that results from fluctuations in foreign currency exchange rates is not separately disclosed.
Security Loans – Under its Securities Lending Agency Agreement with the fund, State Street Bank and Trust Company (“State Street”), as lending agent, loans the securities of the fund to certain qualified institutions (the “Borrowers”) approved by the fund. The loans are collateralized by cash and/or U.S. Treasury and federal agency obligations in an amount typically at least equal to the market value of the securities loaned. The market value of the loaned securities is determined at the close of business of the fund and any additional required collateral is delivered to the fund on the next business day. State Street provides the fund with indemnification against Borrower default. In the event of Borrower default, State Street will for the benefit of the fund either purchase securities identical to those loaned or, when such purchase is commercially impracticable, pay the fund the market value of the loaned securities. In return, State Street assumes the fund’s rights to the related collateral. If the collateral value is less than the cost to purchase identical securities, State Street is responsible for the shortfall, but only to the extent that such shortfall is not due to a decline in collateral value resulting from collateral reinvestment for which the fund bears the risk of loss. On loans collateralized by cash, the cash collateral is invested in a money market fund or short-term securities. A portion of the income generated upon investment of the collateral is remitted to the Borrowers, and the remainder is allocated between the fund and the lending agent. On loans collateralized by U.S. Treasury and/or federal agency obligations, a fee is received from the Borrower, and is allocated between the fund and the lending agent. Income from securities lending is included in “Interest” income, separately reported in the
12
MFS Value Portfolio
Notes to Financial Statements (unaudited) – continued
Statement of Operations. The dividend and interest income earned on the securities loaned is accounted for in the same manner as other dividend and interest income. At June 30, 2013, there were no securities on loan or collateral outstanding.
Indemnifications – Under the fund’s organizational documents, its officers and Trustees may be indemnified against certain liabilities and expenses arising out of the performance of their duties to the fund. Additionally, in the normal course of business, the fund enters into agreements with service providers that may contain indemnification clauses. The fund’s maximum exposure under these agreements is unknown as this would involve future claims that may be made against the fund that have not yet occurred.
Investment Transactions and Income – Investment transactions are recorded on the trade date. Interest income is recorded on the accrual basis. Dividends received in cash are recorded on the ex-dividend date. Certain dividends from foreign securities will be recorded when the fund is informed of the dividend if such information is obtained subsequent to the ex-dividend date. Dividend and interest payments received in additional securities are recorded on the ex-dividend or ex-interest date in an amount equal to the value of the security on such date.
The fund may receive proceeds from litigation settlements. Any proceeds received from litigation involving portfolio holdings are reflected in the Statement of Operations in realized gain/loss if the security has been disposed of by the fund or in unrealized gain/loss if the security is still held by the fund. Any other proceeds from litigation not related to portfolio holdings are reflected as other income in the Statement of Operations.
Fees Paid Indirectly – The fund’s custody fee may be reduced according to an arrangement that measures the value of cash deposited with the custodian by the fund. This amount, for the six months ended June 30, 2013, is shown as a reduction of total expenses in the Statement of Operations.
Tax Matters and Distributions – The fund intends to qualify as a regulated investment company, as defined under Subchapter M of the Internal Revenue Code, and to distribute all of its taxable income, including realized capital gains. As a result, no provision for federal income tax is required. The fund’s federal tax returns, when filed, will remain subject to examination by the Internal Revenue Service for a three year period. Foreign taxes have been accrued by the fund in the accompanying financial statements in accordance with the applicable foreign tax law. Foreign income taxes may be withheld by certain countries in which the fund invests.
Distributions to shareholders are recorded on the ex-dividend date. Income and capital gain distributions are determined in accordance with income tax regulations, which may differ from U.S. generally accepted accounting principles. Certain capital accounts in the financial statements are periodically adjusted for permanent differences in order to reflect their tax character. These adjustments have no impact on net assets or net asset value per share. Temporary differences which arise from recognizing certain items of income, expense, gain or loss in different periods for financial statement and tax purposes will reverse at some time in the future. Distributions in excess of net investment income or net realized gains are temporary overdistributions for financial statement purposes resulting from differences in the recognition or classification of income or distributions for financial statement and tax purposes.
Book/tax differences primarily relate expiration of capital loss carryforwards and wash sale loss deferrals.
The tax character of distributions declared to shareholders for the last fiscal year is as follows:
| | | | |
| | | 12/31/12 | |
| Ordinary income (including any short-term capital gains) | | | $12,869,003 | |
| Long-term capital gains | | | 20,306,549 | |
| Total distributions | | | $33,175,552 | |
The federal tax cost and the tax basis components of distributable earnings were as follows:
| | | | |
| As of 6/30/13 | | | | |
| Cost of investments | | | $232,053,669 | |
| Gross appreciation | | | 95,316,825 | |
Gross depreciation | | | (528,789 | ) |
| Net unrealized appreciation (depreciation) | | | $94,788,036 | |
| |
| As of 12/31/12 | | | | |
| Undistributed ordinary income | | | 12,307,197 | |
| Undistributed long-term capital gain | | | 16,253,160 | |
| Capital loss carryforwards | | | (1,988,931 | ) |
| Other temporary differences | | | 3,201 | |
| Net unrealized appreciation (depreciation) | | | 56,828,859 | |
The aggregate cost above includes prior fiscal year end tax adjustments, if applicable.
13
MFS Value Portfolio
Notes to Financial Statements (unaudited) – continued
Under the Regulated Investment Company Modernization Act of 2010 (the “Act”), net capital losses recognized for fund fiscal years beginning after December 31, 2010 may be carried forward indefinitely, and their character is retained as short-term and/or long-term losses (“post-enactment losses”). Previously, net capital losses were carried forward for eight years and treated as short-term losses (“pre-enactment losses”). As a transition rule, the Act requires that all post-enactment net capital losses be used before pre-enactment net capital losses.
As of December 31, 2012, the fund had capital loss carryforwards available to offset future realized gains. Such pre-enactment losses expire as follows:
| | | | |
| 12/31/15 | | | $(1,874,262 | ) |
| 12/31/16 | | | (114,669 | ) |
| Total | | | $(1,988,931 | ) |
The availability of $1,988,931 of the capital loss carryforwards, which were acquired on June 26, 2009 in connection with the MFS Strategic Value Portfolio and on December 4, 2009 in connection with the Mid Cap Value Portfolio mergers, may be limited in a given year.
Multiple Classes of Shares of Beneficial Interest – The fund offers multiple classes of shares, which differ in their respective distribution and/or service fees. The fund’s income, realized and unrealized gain (loss), and common expenses are allocated to shareholders based on the daily net assets of each class. Dividends are declared separately for each class. Differences in per share dividend rates are generally due to differences in separate class expenses. The fund’s distributions declared to shareholders as reported in the Statements of Changes in Net Assets are presented by class as follows:
| | | | | | | | | | | | | | | | |
| | | From net investment
income | | | From net realized gain on
investments | |
| | | Six months ended
6/30/13 | | | Year ended
12/31/12 | | | Six months ended
6/30/13 | | | Year ended
12/31/12 | |
| Initial Class | | | $— | | | | $5,626,721 | | | | $— | | | | $14,575,946 | |
| Service Class | | | — | | | | 3,213,476 | | | | — | | | | 9,759,409 | |
| Total | | | $— | | | | $8,840,197 | | | | $— | | | | $ 24,335,355 | |
| (3) | | Transactions with Affiliates |
Investment Adviser – The fund has an investment advisory agreement with MFS to provide overall investment management and related administrative services and facilities to the fund. The management fee is computed daily and paid monthly at the following annual rates:
| | | | |
| First $1 billion of average daily net assets | | | 0.75% | |
| Average daily net assets in excess of $1 billion | | | 0.65% | |
Effective April 1, 2013, MFS has agreed in writing to reduce its management fee by a specified amount if certain MFS mutual fund assets exceed thresholds agreed to by MFS and the fund’s Board of Trustees. For the period April 1, 2013 through June 30, 2013, this management fee reduction amounted to $456, which is shown as a reduction of total expenses in the Statement of Operations. The management fee incurred for the six months ended June 30, 2013 was equivalent to an annual effective rate of 0.75% of the fund’s average daily net assets.
The investment adviser has agreed in writing to pay a portion of the fund’s total annual operating expenses, exclusive of interest, taxes, extraordinary expenses, brokerage and transaction costs, and investment-related expenses, such that total annual operating expenses do not exceed 0.90% of average daily net assets for the Initial Class shares and 1.15% of average daily net assets for the Service Class shares. This written agreement will continue until modified by the fund’s Board of Trustees, but such agreement will continue at least until April 30, 2015. For the six months ended June 30, 2013, the fund’s actual operating expenses did not exceed the limit and therefore, the investment adviser did not pay any portion of the fund’s expenses related to this agreement.
Distributor – MFS Fund Distributors, Inc. (MFD), a wholly-owned subsidiary of MFS, is the distributor of shares of the fund. The Trustees have adopted a distribution plan for the Service Class shares pursuant to Rule 12b-1 under the Investment Company Act of 1940.
The fund’s distribution plan provides that the fund will pay MFD distribution and/or service fees equal to 0.25% per annum of its average daily net assets attributable to Service Class shares as partial consideration for services performed and expenses incurred by MFD and financial intermediaries (including participating insurance companies that invest in the fund to fund variable annuity and variable life insurance contracts, sponsors of qualified retirement and pension plans that invest in the fund, and affiliates of these participating insurance companies and plan sponsors) in connection with the sale and distribution of the Service Class shares. MFD may subsequently pay all, or a portion, of the distribution and/or service fees to financial intermediaries.
Shareholder Servicing Agent – Effective April 1, 2013, MFS Service Center, Inc. (MFSC), a wholly-owned subsidiary of MFS, receives a fee from the fund for its services as shareholder servicing agent. For the period from April 1, 2013 through June 30, 2013,
14
MFS Value Portfolio
Notes to Financial Statements (unaudited) – continued
the fee was $2,363, which equated to 0.0014% annually of the fund’s average daily net assets. MFSC also receives payment from the fund for out-of-pocket expenses paid by MFSC on behalf of the fund. For the period from April 1, 2013 through June 30, 2013, these costs amounted to $4.
Administrator – MFS provides certain financial, legal, shareholder communications, compliance, and other administrative services to the fund. Under an administrative services agreement, the fund partially reimburses MFS the costs incurred to provide these services. The fund is charged an annual fixed amount of $17,500 plus a fee based on average daily net assets. The administrative services fee incurred for the six months ended June 30, 2013 was equivalent to an annual effective rate of 0.0158% of the fund’s average daily net assets.
Trustees’ and Officers’ Compensation – The fund pays compensation to independent Trustees in the form of a retainer, attendance fees, and additional compensation to Board and Committee chairpersons. The fund does not pay compensation directly to Trustees or officers of the fund who are also officers of the investment adviser, all of whom receive remuneration for their services to the fund from MFS. Certain officers and Trustees of the fund are officers or directors of MFS, MFD, and MFSC.
Other – This fund and certain other funds managed by MFS (the funds) have entered into services agreements (the Agreements) which provide for payment of fees by the funds to Tarantino LLC and Griffin Compliance LLC in return for the provision of services of an Independent Chief Compliance Officer (ICCO) and Assistant ICCO, respectively, for the funds. The ICCO and Assistant ICCO are officers of the funds and the sole members of Tarantino LLC and Griffin Compliance LLC, respectively. The funds can terminate the Agreements with Tarantino LLC and Griffin Compliance LLC at any time under the terms of the Agreements. For the six months ended June 30, 2013, the aggregate fees paid by the fund to Tarantino LLC and Griffin Compliance LLC were $1,240 and are included in “Miscellaneous” expense in the Statement of Operations. MFS has agreed to reimburse the fund for a portion of the payments made by the fund in the amount of $627, which is shown as a reduction of total expenses in the Statement of Operations. Additionally, MFS has agreed to bear all expenses associated with office space, other administrative support, and supplies provided to the ICCO and Assistant ICCO.
The fund invests in the MFS Institutional Money Market Portfolio which is managed by MFS and seeks current income consistent with preservation of capital and liquidity. Income earned on this investment is included in “Dividends from underlying affiliated funds” in the Statement of Operations. This money market fund does not pay a management fee to MFS.
Purchases and sales of investments, other than short-term obligations, aggregated $24,026,074 and $60,492,055, respectively.
| (5) | | Shares of Beneficial Interest |
The fund’s Declaration of Trust permits the Trustees to issue an unlimited number of full and fractional shares of beneficial interest. Transactions in fund shares were as follows:
| | | | | | | | | | | | | | | | |
| | | Six months ended 6/30/13 | | | Year ended 12/31/12 | |
| | | Shares | | | Amount | | | Shares | | | Amount | |
| Shares sold | | | | | | | | | | | | | | | | |
Initial Class | | | 211,302 | | | | $3,220,237 | | | | 807,884 | | | | $10,887,580 | |
Service Class | | | 178,857 | | | | 2,711,125 | | | | 408,431 | | | | 5,468,944 | |
| | | 390,159 | | | | $5,931,362 | | | | 1,216,315 | | | | $16,356,524 | |
| Shares issued to shareholders in reinvestment of distributions | | | | | | | | | | | | | | | | |
Initial Class | | | — | | | | $— | | | | 1,522,432 | | | | $20,202,667 | |
Service Class | | | — | | | | — | | | | 985,782 | | | | 12,972,885 | |
| | | — | | | | $— | | | | 2,508,214 | | | | $33,175,552 | |
| Shares reacquired | | | | | | | | | | | | | | | | |
Initial Class | | | (776,569 | ) | | | $(11,875,232 | ) | | | (17,870,918 | ) | | | $(240,747,874 | ) |
Service Class | | | (2,042,534 | ) | | | (31,361,314 | ) | | | (3,477,370 | ) | | | (46,912,408 | ) |
| | | (2,819,103 | ) | | | $(43,236,546 | ) | | | (21,348,288 | ) | | | $(287,660,282 | ) |
| Net change | | | | | | | | | | | | | | | | |
Initial Class | | | (565,267 | ) | | | $(8,654,995 | ) | | | (15,540,602 | ) | | | $(209,657,627 | ) |
Service Class | | | (1,863,677 | ) | | | (28,650,189 | ) | | | (2,083,157 | ) | | | (28,470,579 | ) |
| | | (2,428,944 | ) | | | $(37,305,184 | ) | | | (17,623,759 | ) | | | $(238,128,206 | ) |
The fund and certain other funds managed by MFS participate in a $1.1 billion unsecured committed line of credit, subject to a $1 billion sublimit, provided by a syndication of banks under a credit agreement. Borrowings may be made for temporary financing needs. Interest is charged to each fund, based on its borrowings, generally at a rate equal to the higher of the Federal Reserve funds
15
MFS Value Portfolio
Notes to Financial Statements (unaudited) – continued
rate or one month LIBOR plus an agreed upon spread. A commitment fee, based on the average daily, unused portion of the committed line of credit, is allocated among the participating funds at the end of each calendar quarter. In addition, the fund and other funds managed by MFS have established unsecured uncommitted borrowing arrangements with certain banks for temporary financing needs. Interest is charged to each fund, based on its borrowings, at a rate equal to the Federal Reserve funds rate plus an agreed upon spread. For the six months ended June 30, 2013, the fund’s commitment fee and interest expense were $805 and $0, respectively, and are included in “Miscellaneous” expense in the Statement of Operations.
| (7) | | Transactions in Underlying Affiliated Funds – Affiliated Issuers |
An affiliated issuer may be considered one in which the fund owns 5% or more of the outstanding voting securities, or a company which is under common control. For the purposes of this report, the fund assumes the following to be an affiliated issuer:
| | | | | | | | | | | | | | | | |
| Underlying Affiliated Fund | | Beginning Shares/Par Amount | | | Acquisitions Shares/Par Amount | | | Dispositions Shares/Par Amount | | | Ending Shares/Par Amount | |
| MFS Institutional Money Market Portfolio | | | 1,687,422 | | | | 41,317,662 | | | | (39,835,815 | ) | | | 3,169,269 | |
| | | | |
| Underlying Affiliated Fund | | Realized Gain (Loss) | | | Capital Gain Distributions | | | Dividend Income | | | Ending Value | |
| MFS Institutional Money Market Portfolio | | | $— | | | | $— | | | | $1,695 | | | | $3,169,269 | |
16
MFS Value Portfolio
BOARD REVIEW OF INVESTMENT ADVISORY AGREEMENT
A discussion regarding the Board’s most recent review and renewal of the fund’s Investment Advisory Agreement with MFS will be available on or about November 1, 2013 by clicking on the fund’s name under ”Variable Insurance Portfolios — VIT II“ in the “Products” section of the MFS Web site (mfs.com).
PROXY VOTING POLICIES AND INFORMATION
A general description of the MFS funds’ proxy voting policies and procedures is available without charge, upon request, by calling 1-800-225-2606, by visiting the Proxy Voting section of mfs.com or by visiting the SEC’s Web site at http://www.sec.gov.
Information regarding how the fund voted proxies relating to portfolio securities during the most recent twelve-month period ended June 30 is available without charge by visiting the Proxy Voting section of mfs.com or by visiting the SEC’s Web site at http://www.sec.gov.
QUARTERLY PORTFOLIO DISCLOSURE
The fund will file a complete schedule of portfolio holdings with the Securities and Exchange Commission (the Commission) for the first and third quarters of each fiscal year on Form N-Q. The fund’s Form N-Q is available on the EDGAR database on the Commission’s Internet Web site at http://www.sec.gov, and may be reviewed and copied at the:
Public Reference Room
Securities and Exchange Commission
100 F Street, NE, Room 1580
Washington, D.C. 20549
Information on the operation of the Public Reference Room may be obtained by calling the Commission at 1-800-SEC-0330. Copies of the fund’s Form N-Q also may be obtained, upon payment of a duplicating fee, by electronic request at the following e-mail address: publicinfo@sec.gov or by writing the Public Reference Section at the above address.
FURTHER INFORMATION
From time to time, MFS may post important information about the fund or the MFS funds on the MFS web site (mfs.com). This information is available by visiting the ”News & Commentary“ section of mfs.com or by clicking on the fund’s name under ”Variable Insurance Portfolios — VIT II“ in the ”Products“ section of mfs.com.
17
SEMIANNUAL REPORT
June 30, 2013

MFS® CORE
EQUITY PORTFOLIO
MFS® Variable Insurance Trust II

RGS-SEM
MFS® CORE EQUITY PORTFOLIO
CONTENTS
The report is prepared for the general information of contract owners. It is authorized for distribution to prospective investors only when preceded or accompanied by a current prospectus.
NOT FDIC INSURED Ÿ MAY LOSE VALUE Ÿ NO BANK OR CREDIT UNION GUARANTEE Ÿ NOT A DEPOSIT Ÿ NOT INSURED BY ANY FEDERAL GOVERNMENT AGENCY OR NCUA/NCUSIF
MFS Core Equity Portfolio
LETTER FROM THE CHAIRMAN AND CEO

Dear Contract Owners:
As the year progresses, the global economy continues to grind ahead slowly, held back by broad austerity measures. The U.S. economy remains a steadying force, driven by resilient consumers, who have taken the payroll tax increase and the sequestration’s early impact in stride. With U.S. housing and jobs showing steady expansion, domestic consumer-driven growth has offset weaker exports and the U.S. government’s spending constraints. In response to these developments, the U.S. Federal Reserve has begun to brace investors for an eventual shift in its monetary policy, causing global market tremors.
Japan has been another bright spot, with government and central bank stimulus policies leading to increased exports, a resurgent stock market and improved economic sentiment. After a six-month rally, Japan’s stocks slipped late in the second quarter, then picked up momentum on fresh signs that the country could soon break free of its chronic deflation. The major deterrent to global growth remains the eurozone, still in the grip of persistent recession. China has seen its pace of economic growth decelerate, a troubling turn for the country’s trading partners, who have come to rely on it as an engine for global growth.
As always, managing risk in the face of uncertainty remains a top priority for investors. At MFS®, our uniquely collaborative investment process employs integrated, global research and active risk management. Our global team of investment professionals shares ideas and evaluates opportunities across continents, investment disciplines and asset classes — all with a goal of building better insights, and ultimately better results, for our clients.
We are mindful of the many economic challenges investors face, and believe it is more important than ever to maintain a long-term view and employ time-tested principles, such as asset allocation and diversification. We remain confident that our unique approach can serve investors well as they work with their financial advisors to identify and pursue the most suitable opportunities.
Respectfully,

Robert J. Manning
Chairman and Chief Executive Officer
MFS Investment Management®
August 16, 2013
The opinions expressed in this letter are subject to change, may not be relied upon for investment advice, and no forecasts can be guaranteed.
1
MFS Core Equity Portfolio
PORTFOLIO COMPOSITION
Portfolio structure (i)
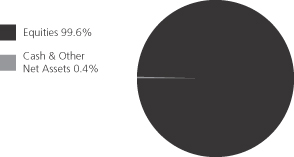
| | | | |
| Top ten holdings (i) | | | | |
| Exxon Mobil Corp. | | | 4.0% | |
| Apple, Inc. | | | 1.9% | |
| ACE Ltd. | | | 1.9% | |
| Hewlett-Packard Co. | | | 1.8% | |
| Procter & Gamble Co. | | | 1.7% | |
| Pfizer, Inc. | | | 1.7% | |
| Wells Fargo & Co. | | | 1.7% | |
| JPMorgan Chase & Co. | | | 1.5% | |
| Johnson & Johnson | | | 1.5% | |
| Google, Inc., “A” | | | 1.4% | |
| | | | |
| Equity sectors (i) | | | | |
| Financial Services | | | 18.4% | |
| Technology | | | 15.1% | |
| Health Care | | | 12.4% | |
| Energy | | | 9.4% | |
| Industrial Goods & Services | | | 7.5% | |
| Consumer Staples | | | 7.0% | |
| Retailing | | | 6.9% | |
| Leisure | | | 6.4% | |
| Utilities & Communications | | | 6.2% | |
| Basic Materials | | | 3.3% | |
| Special Products & Services | | | 2.5% | |
| Autos & Housing | | | 2.3% | |
| Transportation | | | 2.2% | |
| (i) | For purposes of this presentation, the components include the market value of securities, less any securities sold short, and reflect the impact of the equivalent exposure of derivative positions. These amounts may be negative from time to time. Equivalent exposure is a calculated amount that translates the derivative position into a reasonable approximation of the amount of the underlying asset that the portfolio would have to hold at a given point in time to have the same price sensitivity that results from the portfolio’s ownership of the derivative contract. When dealing with derivatives, equivalent exposure is a more representative measure of the potential impact of a position on portfolio performance than market value. |
Percentages are based on net assets as of 6/30/13.
The portfolio is actively managed and current holdings may be different.
2
MFS Core Equity Portfolio
EXPENSE TABLE
Fund Expenses Borne by the Contract Holders During the Period,
January 1, 2013 through June 30, 2013
As a contract holder of the fund, you incur ongoing costs, including management fees; distribution and/or service (12b-1) fees; and other fund expenses. This example is intended to help you understand your ongoing costs (in dollars) of investing in the fund and to compare these costs with the ongoing costs of investing in other mutual funds.
The example is based on an investment of $1,000 invested at the beginning of the period and held for the entire period January 1, 2013 through June 30, 2013.
Actual Expenses
The first line for each share class in the following table provides information about actual account values and actual expenses. You may use the information in this line, together with the amount you invested, to estimate the expenses that you paid over the period. Simply divide your account value by $1,000 (for example, an $8,600 account value divided by $1,000 = 8.6), then multiply the result by the number in the first line under the heading entitled “Expenses Paid During Period” to estimate the expenses you paid on your account during this period.
Hypothetical Example for Comparison Purposes
The second line for each share class in the following table provides information about hypothetical account values and hypothetical expenses based on the fund’s actual expense ratio and an assumed rate of return of 5% per year before expenses, which is not the fund’s actual return. The hypothetical account values and expenses may not be used to estimate the actual ending account balance or expenses you paid for the period. You may use this information to compare the ongoing costs of investing in the fund and other funds. To do so, compare this 5% hypothetical example with the 5% hypothetical examples that appear in the shareholder reports of the other funds.
Please note that the expenses shown in the table are meant to highlight the fund’s ongoing costs only and do not take into account the fees and expenses imposed under the variable contracts through which your investment in the fund is made. Therefore, the second line for each share class in the table is useful in comparing ongoing costs associated with an investment in vehicles (such as the fund) which fund benefits under variable annuity and variable life insurance contracts and to qualified pension and retirement plans only, and will not help you determine the relative total costs of investing in the fund through variable annuity and variable life insurance contracts. If the fees and expenses imposed under the variable contracts were included, your costs would have been higher.
| | | | | | | | | | | | | | | | | | |
| Share Class | | | | Annualized
Expense Ratio | | | Beginning
Account Value
1/01/13 | | | Ending Account Value
6/30/13 | | | Expenses Paid
During Period (p)
1/01/13-6/30/13 | |
| Initial Class | | Actual | | | 0.85% | | | | $1,000.00 | | | | $1,150.12 | | | | $4.53 | |
| | Hypothetical (h) | | | 0.85% | | | | $1,000.00 | | | | $1,020.58 | | | | $4.26 | |
| Service Class | | Actual | | | 1.10% | | | | $1,000.00 | | | | $1,148.13 | | | | $5.86 | |
| | Hypothetical (h) | | | 1.10% | | | | $1,000.00 | | | | $1,019.34 | | | | $5.51 | |
| (h) | 5% class return per year before expenses. |
| (p) | Expenses paid are equal to each class’s annualized expense ratio, as shown above, multiplied by the average account value over the period, multiplied by the number of days in the period, divided by the number of days in the year. |
Expenses Impacting Table
Expense ratios include 0.01% of investment related expenses from short sale dividend and interest expenses.
3
MFS Core Equity Portfolio
PORTFOLIO OF INVESTMENTS – 6/30/13 (unaudited)
The Portfolio of Investments is a complete list of all securities owned by your fund. It is categorized by broad-based asset classes.
| | | | | | | | |
| Issuer | | Shares/Par | | | Value ($) | |
| | | | | | | | |
| COMMON STOCKS – 98.9% | | | | | | | | |
| Aerospace – 3.3% | | | | | | | | |
| Honeywell International, Inc. | | | 21,880 | | | $ | 1,735,959 | |
| Lockheed Martin Corp. | | | 4,310 | | | | 467,463 | |
| Precision Castparts Corp. | | | 5,602 | | | | 1,266,108 | |
| United Technologies Corp. | | | 16,550 | | | | 1,538,157 | |
| | | | | | | | |
| | | | | | $ | 5,007,687 | |
| | | | | | | | |
| Apparel Manufacturers – 1.7% | | | | | | | | |
| Guess?, Inc. | | | 21,880 | | | $ | 678,936 | |
| Michael Kors Holdings Ltd. (a) | | | 8,720 | | | | 540,814 | |
| NIKE, Inc., “B” | | | 11,670 | | | | 743,146 | |
| VF Corp. | | | 3,387 | | | | 653,894 | |
| | | | | | | | |
| | | | | | $ | 2,616,790 | |
| | | | | | | | |
| Automotive – 1.7% | | | | | | | | |
| Delphi Automotive PLC | | | 29,760 | | | $ | 1,508,534 | |
| General Motors Co. (a) | | | 33,110 | | | | 1,102,894 | |
| | | | | | | | |
| | | | | | $ | 2,611,428 | |
| | | | | | | | |
| Biotechnology – 2.0% | | | | | | | | |
| Biogen Idec, Inc. (a) | | | 3,637 | | | $ | 782,682 | |
| Celgene Corp. (a) | | | 7,688 | | | | 898,804 | |
| Gilead Sciences, Inc. (a) | | | 12,140 | | | | 621,689 | |
| ViroPharma, Inc. (a) | | | 22,770 | | | | 652,361 | |
| | | | | | | | |
| | | | | | $ | 2,955,536 | |
| | | | | | | | |
| Broadcasting – 2.2% | | | | | | | | |
| News Corp., “A” | | | 53,730 | | | $ | 1,751,598 | |
| Time Warner, Inc. | | | 11,720 | | | | 677,650 | |
| Walt Disney Co. | | | 14,890 | | | | 940,304 | |
| | | | | | | | |
| | | | | | $ | 3,369,552 | |
| | | | | | | | |
| Brokerage & Asset Managers – 1.4% | | | | | | | | |
| BlackRock, Inc. | | | 1,684 | | | $ | 432,535 | |
| Franklin Resources, Inc. | | | 2,669 | | | | 363,037 | |
| FXCM, Inc., “A” | | | 16,140 | | | | 264,857 | |
| IntercontinentalExchange, Inc. (a) | | | 3,450 | | | | 613,272 | |
| NASDAQ OMX Group, Inc. | | | 13,542 | | | | 444,042 | |
| | | | | | | | |
| | | | | | $ | 2,117,743 | |
| | | | | | | | |
| Business Services – 1.4% | | | | | | | | |
| Accenture PLC, “A” | | | 8,210 | | | $ | 590,792 | |
| Fidelity National Information Services, Inc. | | | 18,500 | | | | 792,540 | |
| FleetCor Technologies, Inc. (a) | | | 5,710 | | | | 464,223 | |
| Performant Financial Corp. (a) | | | 21,930 | | | | 254,169 | |
| | | | | | | | |
| | | | | | $ | 2,101,724 | |
| | | | | | | | |
| Cable TV – 1.4% | | | | | | | | |
| Comcast Corp., “Special A” | | | 21,670 | | | $ | 859,649 | |
| Time Warner Cable, Inc. | | | 11,800 | | | | 1,327,264 | |
| | | | | | | | |
| | | | | | $ | 2,186,913 | |
| | | | | | | | |
| Chemicals – 1.3% | | | | | | | | |
| Celanese Corp. | | | 13,520 | | | $ | 605,696 | |
| LyondellBasell Industries N.V., “A” | | | 10,410 | | | | 689,767 | |
| | | | | | | | |
| Issuer | | Shares/Par | | | Value ($) | |
| | | | | | | | |
| COMMON STOCKS – continued | |
| Chemicals – continued | | | | | | | | |
| PPG Industries, Inc. | | | 4,398 | | | $ | 643,911 | |
| | | | | | | | |
| | | | | | $ | 1,939,374 | |
| | | | | | | | |
| Computer Software – 4.2% | | | | | | | | |
| Autodesk, Inc. (a) | | | 16,300 | | | $ | 553,222 | |
| Check Point Software Technologies Ltd. (a) | | | 25,110 | | | | 1,247,465 | |
| Citrix Systems, Inc. (a) | | | 11,760 | | | | 709,481 | |
| CommVault Systems, Inc. (a) | | | 12,010 | | | | 911,439 | |
| Microsoft Corp. | | | 12,060 | | | | 416,432 | |
| Oracle Corp. | | | 30,620 | | | | 940,646 | |
| Qlik Technologies, Inc. (a) | | | 16,390 | | | | 463,345 | |
| Salesforce.com, Inc. (a) | | | 11,054 | | | | 422,042 | |
| Symantec Corp. | | | 32,780 | | | | 736,567 | |
| | | | | | | | |
| | | | | | $ | 6,400,639 | |
| | | | | | | | |
| Computer Software – Systems – 5.8% | | | | | | | | |
| Apple, Inc. (s) | | | 7,274 | | | $ | 2,881,086 | |
| EMC Corp. | | | 50,890 | | | | 1,202,022 | |
| Hewlett-Packard Co. | | | 110,660 | | | | 2,744,368 | |
| International Business Machines Corp. | | | 697 | | | | 133,204 | |
| NCR Corp. (a) | | | 5,440 | | | | 179,466 | |
| SS&C Technologies Holdings, Inc. (a) | | | 22,460 | | | | 738,934 | |
| Vantiv, Inc., “A” (a) | | | 32,680 | | | | 901,968 | |
| | | | | | | | |
| | | | | | $ | 8,781,048 | |
| | | | | | | | |
| Construction – 0.5% | | | | | | | | |
| Stanley Black & Decker, Inc. | | | 10,420 | | | $ | 805,466 | |
| | | | | | | | |
| Consumer Products – 2.5% | | | | | | | | |
| Estee Lauder Cos., Inc., “A” | | | 17,300 | | | $ | 1,137,821 | |
| Procter & Gamble Co. | | | 34,310 | | | | 2,641,527 | |
| | | | | | | | |
| | | | | | $ | 3,779,348 | |
| | | | | | | | |
| Consumer Services – 1.1% | | | | | | | | |
| Grand Canyon Education, Inc. (a) | | | 14,260 | | | $ | 459,600 | |
| Priceline.com, Inc. (a) | | | 1,453 | | | | 1,201,820 | |
| | | | | | | | |
| | | | | | $ | 1,661,420 | |
| | | | | | | | |
| Containers – 0.6% | | | | | | | | |
| Packaging Corp. of America | | | 13,980 | | | $ | 684,461 | |
| Silgan Holdings, Inc. | | | 5,970 | | | | 280,351 | |
| | | | | | | | |
| | | | | | $ | 964,812 | |
| | | | | | | | |
| Electrical Equipment – 1.6% | | | | | | | | |
| AMETEK, Inc. | | | 13,720 | | | $ | 580,356 | |
| Danaher Corp. | | | 15,240 | | | | 964,692 | |
| Sensata Technologies Holding B.V. (a) | | | 16,340 | | | | 570,266 | |
| W.W. Grainger, Inc. | | | 1,441 | | | | 363,391 | |
| | | | | | | | |
| | | | | | $ | 2,478,705 | |
| | | | | | | | |
| Electronics – 2.8% | | | | | | | | |
| Altera Corp. | | | 36,070 | | | $ | 1,189,949 | |
| ASML Holding N.V. | | | 6,789 | | | | 537,010 | |
| KLA-Tencor Corp. | | | 2,540 | | | | 141,554 | |
4
MFS Core Equity Portfolio
Portfolio of Investments (unaudited) – continued
| | | | | | | | |
| Issuer | | Shares/Par | | | Value ($) | |
| | | | | | | | |
| COMMON STOCKS – continued | |
| Electronics – continued | | | | | | | | |
| Linear Technology Corp. | | | 10,190 | | | $ | 375,400 | |
| Microchip Technology, Inc. | | | 33,410 | | | | 1,244,523 | |
| NXP Semiconductors N.V. (a) | | | 22,980 | | | | 711,920 | |
| | | | | | | | |
| | | | | | $ | 4,200,356 | |
| | | | | | | | |
| Energy – Independent – 3.9% | | | | | | | | |
| Anadarko Petroleum Corp. | | | 4,320 | | | $ | 371,218 | |
| Cabot Oil & Gas Corp. | | | 9,310 | | | | 661,196 | |
| Concho Resources, Inc. (a) | | | 4,090 | | | | 342,415 | |
| CONSOL Energy, Inc. | | | 3,610 | | | | 97,831 | |
| Energen Corp. | | | 3,000 | | | | 156,780 | |
| EOG Resources, Inc. | | | 3,762 | | | | 495,380 | |
| EQT Corp. | | | 6,150 | | | | 488,126 | |
| Gulfport Energy Corp. (a) | | | 1,820 | | | | 85,667 | |
| Marathon Petroleum Corp. | | | 8,810 | | | | 626,039 | |
| Noble Energy, Inc. | | | 15,243 | | | | 915,190 | |
| PDC Energy, Inc. (a) | | | 1,540 | | | | 79,279 | |
| Peabody Energy Corp. | | | 3,840 | | | | 56,218 | |
| Pioneer Natural Resources Co. | | | 6,412 | | | | 928,137 | |
| SM Energy Co. | | | 1,292 | | | | 77,494 | |
| Valero Energy Corp. | | | 13,160 | | | | 457,573 | |
| | | | | | | | |
| | | | | | $ | 5,838,543 | |
| | | | | | | | |
| Energy – Integrated – 4.0% | | | | | | | | |
| Exxon Mobil Corp. (s) | | | 66,346 | | | $ | 5,994,361 | |
| | | | | | | | |
| Food & Beverages – 2.9% | | | | | | | | |
| Coca-Cola Co. | | | 43,250 | | | $ | 1,734,755 | |
| Coca-Cola Enterprises, Inc. | | | 9,980 | | | | 350,897 | |
| General Mills, Inc. | | | 16,120 | | | | 782,304 | |
| Mead Johnson Nutrition Co., “A” | | | 5,200 | | | | 411,996 | |
| Mondelez International, Inc. | | | 37,920 | | | | 1,081,858 | |
| | | | | | | | |
| | | | | | $ | 4,361,810 | |
| | | | | | | | |
| Food & Drug Stores – 1.1% | | | | | | | | |
| CVS Caremark Corp. | | | 22,560 | | | $ | 1,289,981 | |
| Fairway Group Holdings Corp. (a) | | | 18,580 | | | | 449,079 | |
| | | | | | | | |
| | | | | | $ | 1,739,060 | |
| | | | | | | | |
| Gaming & Lodging – 0.6% | | | | | | | | |
| Wynn Resorts Ltd. | | | 7,582 | | | $ | 970,496 | |
| | | | | | | | |
| General Merchandise – 1.9% | | | | | | | | |
| Kohl’s Corp. | | | 16,560 | | | $ | 836,446 | |
| Target Corp. | | | 28,630 | | | | 1,971,462 | |
| | | | | | | | |
| | | | | | $ | 2,807,908 | |
| | | | | | | | |
| Health Maintenance Organizations – 0.8% | | | | | |
| Aetna, Inc. | | | 14,510 | | | $ | 921,965 | |
| UnitedHealth Group, Inc. | | | 4,970 | | | | 325,436 | |
| | | | | | | | |
| | | | | | $ | 1,247,401 | |
| | | | | | | | |
| Insurance – 4.2% | | | | | | | | |
| ACE Ltd. | | | 31,430 | | | $ | 2,812,356 | |
| American International Group, Inc. (a) | | | 24,490 | | | | 1,094,703 | |
| MetLife, Inc. | | | 44,320 | | | | 2,028,083 | |
| Validus Holdings Ltd. | | | 12,870 | | | | 464,864 | |
| | | | | | | | |
| | | | | | $ | 6,400,006 | |
| | | | | | | | |
| | | | | | | | |
| Issuer | | Shares/Par | | | Value ($) | |
| | | | | | | | |
| COMMON STOCKS – continued | |
| Internet �� 2.0% | | | | | | | | |
| eBay, Inc. (a) | | | 9,190 | | | $ | 475,307 | |
| Google, Inc., “A” (a) | | | 2,442 | | | | 2,149,864 | |
| Yahoo!, Inc. (a) | | | 15,290 | | | | 383,932 | |
| | | | | | | | |
| | | | | | $ | 3,009,103 | |
| | | | | | | | |
| Leisure & Toys – 0.4% | | | | | | | | |
| Brunswick Corp. | | | 17,870 | | | $ | 570,947 | |
| | | | | | | | |
| Machinery & Tools – 2.3% | | | | | | | | |
| Eaton Corp. PLC | | | 12,950 | | | $ | 852,240 | |
| Illinois Tool Works, Inc. | | | 4,810 | | | | 332,708 | |
| Joy Global, Inc. | | | 13,350 | | | | 647,876 | |
| Kennametal, Inc. | | | 13,240 | | | | 514,109 | |
| Roper Industries, Inc. | | | 9,277 | | | | 1,152,389 | |
| | | | | | | | |
| | | | | | $ | 3,499,322 | |
| | | | | | | | |
| Major Banks – 4.6% | | | | | | | | |
| Goldman Sachs Group, Inc. | | | 4,099 | | | $ | 619,974 | |
| JPMorgan Chase & Co. (s) | | | 43,180 | | | | 2,279,472 | |
| Morgan Stanley | | | 30,980 | | | | 756,841 | |
| State Street Corp. | | | 12,200 | | | | 795,562 | |
| Wells Fargo & Co. | | | 60,830 | | | | 2,510,454 | |
| | | | | | | | |
| | | | | | $ | 6,962,303 | |
| | | | | | | | |
| Medical & Health Technology & Services – 1.2% | | | | | |
| AmerisourceBergen Corp. | | | 8,650 | | | $ | 482,930 | |
| Cerner Corp. (a) | | | 2,080 | | | | 199,867 | |
| Express Scripts Holding Co. (a) | | | 13,850 | | | | 854,407 | |
| Henry Schein, Inc. (a) | | | 2,690 | | | | 257,568 | |
| | | | | | | | |
| | | | | | $ | 1,794,772 | |
| | | | | | | | |
| Medical Equipment – 2.9% | | | | | | | | |
| AtriCure, Inc. (a) | | | 16,750 | | | $ | 159,125 | |
| Cooper Cos., Inc. | | | 5,668 | | | | 674,775 | |
| Covidien PLC | | | 13,170 | | | | 827,603 | |
| DexCom, Inc. (a) | | | 9,690 | | | | 217,541 | |
| Endologix, Inc. (a) | | | 9,190 | | | | 122,043 | |
| NxStage Medical, Inc. (a) | | | 23,420 | | | | 334,438 | |
| Sirona Dental Systems, Inc. (a) | | | 3,290 | | | | 216,745 | |
| St. Jude Medical, Inc. | | | 12,990 | | | | 592,734 | |
| Stryker Corp. | | | 9,640 | | | | 623,515 | |
| Thermo Fisher Scientific, Inc. | | | 7,200 | | | | 609,336 | |
| | | | | | | | |
| | | | | | $ | 4,377,855 | |
| | | | | | | | |
| Metals & Mining – 0.3% | | | | | | | | |
| Lundin Mining Corp. (a) | | | 50,600 | | | $ | 192,450 | |
| Teck Resources Ltd., “B” | | | 9,905 | | | | 211,624 | |
| Uranium Participation Corp. (a) | | | 24,430 | | | | 116,378 | |
| | | | | | | | |
| | | | | | $ | 520,452 | |
| | | | | | | | |
| Natural Gas – Distribution – 0.3% | | | | | | | | |
| Spectra Energy Corp. | | | 11,420 | | | $ | 393,533 | |
| | | | | | | | |
| Natural Gas – Pipeline – 0.4% | | | | | | | | |
| Enbridge, Inc. | | | 15,790 | | | $ | 664,285 | |
| | | | | | | | |
5
MFS Core Equity Portfolio
Portfolio of Investments (unaudited) – continued
| | | | | | | | |
| Issuer | | Shares/Par | | | Value ($) | |
| | | | | | | | |
| COMMON STOCKS – continued | |
| Network & Telecom – 0.3% | | | | | | | | |
| Juniper Networks, Inc. (a) | | | 8,930 | | | $ | 172,438 | |
| Qualcomm, Inc. | | | 3,730 | | | | 227,828 | |
| | | | | | | | |
| | | | | | $ | 400,266 | |
| | | | | | | | |
| Oil Services – 1.6% | | | | | | | | |
| Cameron International Corp. (a) | | | 10,880 | | | $ | 665,421 | |
| Dresser-Rand Group, Inc. (a) | | | 9,160 | | | | 549,417 | |
| Ensco PLC, “A” | | | 3,420 | | | | 198,770 | |
| FMC Technologies, Inc. (a) | | | 6,560 | | | | 365,261 | |
| Schlumberger Ltd. | | | 6,530 | | | | 467,940 | |
| Superior Energy Services, Inc. (a) | | | 4,580 | | | | 118,805 | |
| | | | | | | | |
| | | | | | $ | 2,365,614 | |
| | | | | | | | |
| Other Banks & Diversified Financials – 4.9% | | | | | |
| American Express Co. | | | 10,270 | | | $ | 767,785 | |
| Cathay General Bancorp, Inc. | | | 15,180 | | | | 308,913 | |
| CIT Group, Inc. (a) | | | 12,660 | | | | 590,336 | |
| Citigroup, Inc. | | | 41,060 | | | | 1,969,648 | |
| EuroDekania Ltd. (a)(z) | | | 100,530 | | | | 108,937 | |
| Fifth Third Bancorp | | | 56,320 | | | | 1,016,576 | |
| PrivateBancorp, Inc. | | | 34,510 | | | | 731,957 | |
| TCF Financial Corp. | | | 32,420 | | | | 459,716 | |
| Visa, Inc., “A” | | | 8,424 | | | | 1,539,486 | |
| | | | | | | | |
| | | | | | $ | 7,493,354 | |
| | | | | | | | |
| Pharmaceuticals – 5.5% | | | | | | | | |
| Bristol-Myers Squibb Co. | | | 20,570 | | | $ | 919,273 | |
| Johnson & Johnson | | | 25,600 | | | | 2,198,016 | |
| Perrigo Co. | | | 4,009 | | | | 485,089 | |
| Pfizer, Inc. | | | 90,492 | | | | 2,534,681 | |
| Valeant Pharmaceuticals International, Inc. (a) | | | 17,310 | | | | 1,490,045 | |
| Zoetis, Inc. | | | 21,770 | | | | 672,475 | |
| | | | | | | | |
| | | | | | $ | 8,299,579 | |
| | | | | | | | |
| Pollution Control – 0.2% | | | | | | | | |
| Stericycle, Inc. (a) | | | 2,771 | | | $ | 306,002 | |
| | | | | | | | |
| Railroad & Shipping – 1.1% | | | | | | | | |
| Canadian Pacific Railway Ltd. | | | 1,374 | | | $ | 166,776 | |
| Diana Shipping, Inc. (a) | | | 32,280 | | | | 324,091 | |
| Kansas City Southern Co. | | | 2,292 | | | | 242,860 | |
| Union Pacific Corp. | | | 5,888 | | | | 908,401 | |
| | | | | | | | |
| | | | | | $ | 1,642,128 | |
| | | | | | | | |
| Real Estate – 3.3% | | | | | | | | |
| Equity Lifestyle Properties, Inc., REIT | | | 17,690 | | | $ | 1,390,257 | |
| Mid-America Apartment Communities, Inc., REIT | | | 24,510 | | | | 1,661,043 | |
| Public Storage, Inc., REIT | | | 5,350 | | | | 820,316 | |
| Tanger Factory Outlet Centers, Inc., REIT | | | 32,520 | | | | 1,088,119 | |
| | | | | | | | |
| | | | | | $ | 4,959,735 | |
| | | | | | | | |
| Restaurants – 1.8% | | | | | | | | |
| McDonald’s Corp. | | | 9,184 | | | $ | 909,216 | |
| Starbucks Corp. | | | 9,930 | | | | 650,316 | |
| YUM! Brands, Inc. | | | 15,810 | | | | 1,096,265 | |
| | | | | | | | |
| | | | | | $ | 2,655,797 | |
| | | | | | | | |
| | | | | | | | |
| Issuer | | Shares/Par | | | Value ($) | |
| | | | | | | | |
| COMMON STOCKS – continued | |
| Specialty Chemicals – 1.1% | | | | | | | | |
| Airgas, Inc. | | | 4,740 | | | $ | 452,480 | |
| Ecolab, Inc. | | | 6,970 | | | | 593,774 | |
| FMC Corp. | | | 9,180 | | | | 560,531 | |
| | | | | | | | |
| | | | | | $ | 1,606,785 | |
| | | | | | | | |
| Specialty Stores – 2.2% | | | | | | | | |
| Amazon.com, Inc. (a) | | | 609 | | | $ | 169,113 | |
| AutoZone, Inc. (a) | | | 1,973 | | | | 835,940 | |
| Bed Bath & Beyond, Inc. (a) | | | 13,900 | | | | 985,510 | |
| Children’s Place Retail Store, Inc. (a) | | | 9,240 | | | | 506,352 | |
| Dick’s Sporting Goods, Inc. | | | 15,880 | | | | 794,953 | |
| | | | | | | | |
| | | | | | $ | 3,291,868 | |
| | | | | | | | |
| Telecommunications – Wireless – 1.0% | | | | | |
| American Tower Corp., REIT | | | 13,070 | | | $ | 956,332 | |
| SBA Communications Corp. (a) | | | 8,120 | | | | 601,854 | |
| | | | | | | | |
| | | | | | $ | 1,558,186 | |
| | | | | | | | |
| Telephone Services – 1.7% | | | | | | | | |
| AT&T, Inc. | | | 34,200 | | | $ | 1,210,680 | |
| Verizon Communications, Inc. | | | 28,020 | | | | 1,410,527 | |
| | | | | | | | |
| | | | | | $ | 2,621,207 | |
| | | | | | | | |
| Tobacco – 1.6% | | | | | | | | |
| Lorillard, Inc. | | | 13,890 | | | $ | 606,715 | |
| Philip Morris International, Inc. | | | 20,630 | | | | 1,786,971 | |
| | | | | | | | |
| | | | | | $ | 2,393,686 | |
| | | | | | | | |
| Trucking – 1.1% | | | | | | | | |
| Expeditors International of Washington, Inc. | | | 20,720 | | | $ | 787,567 | |
| Swift Transportation Co. (a) | | | 53,610 | | | | 886,709 | |
| | | | | | | | |
| | | | | | $ | 1,674,276 | |
| | | | | | | | |
| Utilities – Electric Power – 2.2% | | | | | | | | |
| AES Corp. | | | 26,780 | | | $ | 321,092 | |
| American Electric Power Co., Inc. | | | 11,190 | | | | 501,088 | |
| Calpine Corp. (a) | | | 26,370 | | | | 559,835 | |
| CMS Energy Corp. | | | 19,600 | | | | 532,532 | |
| Edison International | | | 10,550 | | | | 508,088 | |
| Great Plains Energy, Inc. | | | 20,910 | | | | 471,311 | |
| PG&E Corp. | | | 9,440 | | | | 431,691 | |
| | | | | | | | |
| | | | | | $ | 3,325,637 | |
| | | | | | | | |
Total Common Stocks
(Identified Cost, $125,634,692) | | | | | | $ | 149,724,818 | |
| | | | | | | | |
|
| CONVERTIBLE PREFERRED STOCKS – 0.5% | |
| Utilities – Electric Power – 0.5% | | | | | | | | |
| PPL Corp., 9% | | | 8,010 | | | $ | 419,804 | |
| PPL Corp., 8.75% | | | 7,350 | | | | 397,047 | |
| | | | | | | | |
Total Convertible Preferred Stocks
(Identified Cost, $780,978) | | | | | | $ | 816,851 | |
| | | | | | | | |
6
MFS Core Equity Portfolio
Portfolio of Investments (unaudited) – continued
| | | | | | | | |
| Issuer/Expiration Date/Strike Price | | Number of
Contracts | | | Value ($) | |
| | | | | | | | |
| |
| CALL OPTIONS PURCHASED – 0.0% | | | | | |
| Pharmaceuticals – 0.0% | | | | | | | | |
| Eli Lilly & Co. – October 2013 @ $55 (Premiums Paid, $7,556) | | | 111 | | | $ | 6,882 | |
| | | | | | | | |
Total Call Options Purchased
(Identified Cost, $7,556) | | | | | | $ | 6,882 | |
| | | | | | | | |
| Issuer | | Shares/Par | | | | |
| |
| MONEY MARKET FUNDS – 0.9% | | | | | |
| MFS Institutional Money Market Portfolio, 0.11%, at Cost and Net Asset Value (v) | | | 1,369,808 | | | $ | 1,369,808 | |
| | | | | | | | |
Total Investments
(Identified Cost, $127,793,034) | | | | | | $ | 151,918,359 | |
| | | | | | | | |
| Issuer/Expiration Date/Strike Price | | Number of
Contracts | | | Value ($) | |
| | | | | | | | |
| |
| PUT OPTIONS WRITTEN – 0.0% | | | | | |
| Pharmaceuticals – 0.0% | | | | | | | | |
| Eli Lilly & Co. – October 2013 @ $42 (Premiums Received, $5,986) | | | (111 | ) | | $ | (6,105 | ) |
| | | | | | | | |
OTHER ASSETS, LESS
LIABILITIES – (0.3)% | | | | | | | (510,981 | ) |
| | | | | | | | |
| Net Assets – 100.0% | | | | | | $ | 151,401,273 | |
| | | | | | | | |
| (a) | | Non-income producing security. |
| (s) | | Security or a portion of the security was pledged to cover collateral requirements for securities sold short and/or certain derivative transactions. At June 30, 2013, the fund had no short sales outstanding. |
| (v) | | Underlying affiliated fund that is available only to investment companies managed by MFS. The rate quoted for the MFS Institutional Money Market Portfolio is the annualized seven-day yield of the fund at period end. |
| (z) | | Restricted securities are not registered under the Securities Act of 1933 and are subject to legal restrictions on resale. These securities generally may be resold in transactions exempt from registration or to the public if the securities are subsequently registered. Disposal of these securities may involve time-consuming negotiations and prompt sale at an acceptable price may be difficult. The fund holds the following restricted securities: |
| | | | | | | | | | |
| Restricted Securities | | Acquisition
Date | | Cost | | | Value | |
| EuroDekania Ltd. | | 3/08/07-6/25/07 | | | $1,412,164 | | | | $108,937 | |
| % of Net assets | | | | | | | | | 0.1% | |
At June 30, 2013, the fund had cash collateral of $9,485 and other liquid securities with an aggregate value of $562,123 to cover any commitments for securities sold short and certain derivative contracts. Cash collateral is comprised of “Deposits with brokers” in the Statement of Assets and Liabilities.
The following abbreviations are used in this report and are defined:
| ADR | | American Depositary Receipt |
| PLC | | Public Limited Company |
| REIT | | Real Estate Investment Trust |
See Notes to Financial Statements
7
MFS Core Equity Portfolio
FINANCIAL STATEMENTS | STATEMENT OF ASSETS AND LIABILITIES (unaudited)
This statement represents your fund’s balance sheet, which details the assets and liabilities comprising the total value of the fund.
| | | | | | | | |
At 6/30/13 | | | | | | | | |
Assets | | | | | | | | |
Investments – | | | | | | | | |
Non-affiliated issuers, at value (identified cost, $126,423,226) | | | $150,548,551 | | | | | |
Underlying affiliated funds, at cost and value | | | 1,369,808 | | | | | |
Total investments, at value (identified cost, $127,793,034) | | | $151,918,359 | | | | | |
Deposits with brokers | | | 9,485 | | | | | |
Receivables for | | | | | | | | |
Premiums on options written | | | 5,986 | | | | | |
Investments sold | | | 348,033 | | | | | |
Interest and dividends | | | 165,318 | | | | | |
Other assets | | | 917 | | | | | |
Total assets | | | | | | | $152,448,098 | |
Liabilities | | | | | | | | |
Payables for | | | | | | | | |
Investments purchased | | | $362,250 | | | | | |
Fund shares reacquired | | | 618,431 | | | | | |
Written options outstanding, at value (premiums received, $5,986) | | | 6,105 | | | | | |
Payable to affiliates | | | | | | | | |
Investment adviser | | | 13,705 | | | | | |
Shareholder servicing costs | | | 48 | | | | | |
Distribution and/or service fees | | | 1,239 | | | | | |
Payable for independent trustees’ compensation | | | 821 | | | | | |
Accrued expenses and other liabilities | | | 44,226 | | | | | |
Total liabilities | | | | | | | $1,046,825 | |
Net assets | | | | | | | $151,401,273 | |
Net assets consist of | | | | | | | | |
Paid-in capital | | | $134,169,551 | | | | | |
Unrealized appreciation (depreciation) on investments and translation of assets and liabilities in foreign currencies | | | 24,125,084 | | | | | |
Accumulated net realized gain (loss) on investments and foreign currency | | | (9,017,962 | ) | | | | |
Undistributed net investment income | | | 2,124,600 | | | | | |
Net assets | | | | | | | $151,401,273 | |
Shares of beneficial interest outstanding | | | | | | | 8,188,817 | |
| | | | | | | | | | | | |
| | | Net assets | | | Shares
outstanding | | | Net asset value per share | |
Initial Class | | | $106,317,981 | | | | 5,735,131 | | | | $18.54 | |
Service Class | | | 45,083,292 | | | | 2,453,686 | | | | 18.37 | |
See Notes to Financial Statements
8
MFS Core Equity Portfolio
FINANCIAL STATEMENTS | STATEMENT OF OPERATIONS (unaudited)
This statement describes how much your fund earned in investment income and accrued in expenses. It also describes any gains and/or losses generated by fund operations.
| | | | | | | | |
Six months ended 6/30/13 | | | | | | | | |
Net investment income | | | | | | | | |
Income | | | | | | | | |
Dividends | | | $1,383,300 | | | | | |
Interest | | | 11,087 | | | | | |
Dividends from underlying affiliated funds | | | 885 | | | | | |
Foreign taxes withheld | | | (4,556 | ) | | | | |
Total investment income | | | | | | | $1,390,716 | |
Expenses | | | | | | | | |
Management fee | | | $559,680 | | | | | |
Distribution and/or service fees | | | 56,648 | | | | | |
Shareholder servicing costs | | | 1,109 | | | | | |
Administrative services fee | | | 14,863 | | | | | |
Independent trustees’ compensation | | | 2,516 | | | | | |
Custodian fee | | | 11,732 | | | | | |
Shareholder communications | | | 6,816 | | | | | |
Audit and tax fees | | | 25,205 | | | | | |
Legal fees | | | 1,183 | | | | | |
Dividend and interest expense on securities sold short | | | 3,925 | | | | | |
Miscellaneous | | | 7,292 | | | | | |
Total expenses | | | | | | | $690,969 | |
Reduction of expenses by investment adviser | | | (487 | ) | | | | |
Net expenses | | | | | | | $690,482 | |
Net investment income | | | | | | | $700,234 | |
Realized and unrealized gain (loss) on investments and foreign currency | | | | | | | | |
Realized gain (loss) (identified cost basis) | | | | | | | | |
Investments | | | $10,589,599 | | | | | |
Written options | | | 852 | | | | | |
Securities sold short | | | (47,182 | ) | | | | |
Foreign currency | | | 263 | | | | | |
Net realized gain (loss) on investments and foreign currency | | | | | | | $10,543,532 | |
Change in unrealized appreciation (depreciation) | | | | | | | | |
Investments | | | $9,272,491 | | | | | |
Written options | | | (8,015 | ) | | | | |
Securities sold short | | | 21,998 | | | | | |
Translation of assets and liabilities in foreign currencies | | | (60 | ) | | | | |
Net unrealized gain (loss) on investments and foreign currency translation | | | | | | | $9,286,414 | |
Net realized and unrealized gain (loss) on investments and foreign currency | | | | | | | $19,829,946 | |
Change in net assets from operations | | | | | | | $20,530,180 | |
See Notes to Financial Statements
9
MFS Core Equity Portfolio
FINANCIAL STATEMENTS | STATEMENTS OF CHANGES IN NET ASSETS
These statements describe the increases and/or decreases in net assets resulting from operations, any distributions, and any shareholder transactions.
| | | | | | | | |
| |
| Six months ended
6/30/13
(unaudited |
) | |
| Year ended
12/31/12 |
|
Change in net assets | | | | | | | | |
| From operations | | | | | | | | |
Net investment income | | | $700,234 | | | | $1,429,838 | |
Net realized gain (loss) on investments and foreign currency | | | 10,543,532 | | | | 10,472,362 | |
Net unrealized gain (loss) on investments and foreign currency translation | | | 9,286,414 | | | | 9,155,126 | |
Change in net assets from operations | | | $20,530,180 | | | | $21,057,326 | |
| Distributions declared to shareholders | | | | | | | | |
From net investment income | | | $— | | | | $(980,068 | ) |
Change in net assets from fund share transactions | | | $(8,184,318 | ) | | | $(14,733,806 | ) |
Total change in net assets | | | $12,345,862 | | | | $5,343,452 | |
| Net assets | | | | | | | | |
At beginning of period | | | 139,055,411 | | | | 133,711,959 | |
At end of period (including undistributed net investment income of $2,124,600 and
$1,424,366, respectively) | | | $151,401,273 | | | | $139,055,411 | |
See Notes to Financial Statements
10
MFS Core Equity Portfolio
FINANCIAL STATEMENTS | FINANCIAL HIGHLIGHTS
The financial highlights table is intended to help you understand the fund’s financial performance for the semiannual period and the past 5 fiscal years. Certain information reflects financial results for a single fund share. The total returns in the table represent the rate by which an investor would have earned (or lost) on an investment in the fund share class (assuming reinvestment of all distributions) held for the entire period.
| | | | | | | | | | | | | | | | | | | | | | | | |
| Initial Class | | Six months
ended
6/30/13 | | | Years ended 12/31 | |
| | | | 2012 | | | 2011 | | | 2010 | | | 2009 | | | 2008 | |
| | | (unaudited) | | | | | | | | | | | | | | | | |
Net asset value, beginning of period | | | $16.12 | | | | $13.95 | | | | $14.23 | | | | $12.27 | | | | $9.43 | | | | $16.52 | |
| Income (loss) from investment operations | | | | | | | | | | | | | | | | | | | | | | | | |
Net investment income (d) | | | $0.09 | | | | $0.17 | | | | $0.11 | | | | $0.12 | | | | $0.13 | | | | $0.16 | |
Net realized and unrealized gain (loss) on investments and foreign currency | | | 2.33 | | | | 2.12 | | | | (0.25 | ) | | | 1.98 | | | | 2.89 | | | | (6.11 | ) |
Total from investment operations | | | $2.42 | | | | $2.29 | | | | $(0.14 | ) | | | $2.10 | | | | $3.02 | | | | $(5.95 | ) |
| Less distributions declared to shareholders | | | | | | | | | | | | | | | | | | | | | | | | |
From net investment income | | | $— | | | | $(0.12 | ) | | | $(0.14 | ) | | | $(0.14 | ) | | | $(0.18 | ) | | | $(0.09 | ) |
From net realized gain on investments | | | — | | | | — | | | | — | | | | — | | | | — | | | | (1.05 | ) |
Total distributions declared to shareholders | | | $— | | | | $(0.12 | ) | | | $(0.14 | ) | | | $(0.14 | ) | | | $(0.18 | ) | | | $(1.14 | ) |
Net asset value, end of period (x) | | | $18.54 | | | | $16.12 | | | | $13.95 | | | | $14.23 | | | | $12.27 | | | | $9.43 | |
Total return (%) (k)(r)(s)(x) | | | 15.01 | (n) | | | 16.46 | | | | (0.94 | ) | | | 17.22 | | | | 32.74 | | | | (38.63 | ) |
Ratios (%) (to average net assets)
and Supplemental data: | | | | | | | | | | | | | | | | | | | | | | | | |
Expenses before expense reductions (f) | | | 0.85 | (a) | | | 0.85 | | | | 0.88 | | | | 0.90 | | | | 0.89 | | | | 0.88 | |
Expenses after expense reductions (f) | | | 0.85 | (a) | | | 0.85 | | | | 0.87 | | | | 0.86 | | | | 0.85 | | | | 0.85 | |
Net investment income | | | 1.01 | (a) | | | 1.10 | | | | 0.75 | | | | 0.98 | | | | 1.28 | | | | 1.22 | |
Portfolio turnover | | | 30 | (n) | | | 63 | | | | 65 | | | | 69 | | | | 91 | | | | 109 | |
Net assets at end of period (000 omitted) | | | $106,318 | | | | $97,349 | | | | $96,375 | | | | $112,121 | | | | $109,322 | | | | $97,648 | |
| Supplemental Ratios (%): | | | | | | | | | | | | | | | | | | | | | | | | |
Ratio of expenses to average net assets after expense reductions excluding short sale dividend and interest expense (f) | | | 0.84 | (a) | | | 0.85 | | | | 0.87 | | | | 0.85 | | | | 0.85 | | | | N/A | |
| | |
| Service Class | | Six months
ended
6/30/13 | | | Years ended 12/31 | |
| | | | 2012 | | | 2011 | | | 2010 | | | 2009 | | | 2008 | |
| | | (unaudited) | | | | | | | | | | | | | | | | |
Net asset value, beginning of period | | | $16.00 | | | | $13.84 | | | | $14.13 | | | | $12.19 | | | | $9.36 | | | | $16.42 | |
| Income (loss) from investment operations | | | | | | | | | | | | | | | | | | | | | | | | |
Net investment income (d) | | | $0.07 | | | | $0.13 | | | | $0.07 | | | | $0.09 | | | | $0.10 | | | | $0.13 | |
Net realized and unrealized gain (loss) on investments and foreign currency | | | 2.30 | | | | 2.11 | | | | (0.25 | ) | | | 1.97 | | | | 2.88 | | | | (6.08 | ) |
Total from investment operations | | | $2.37 | | | | $2.24 | | | | $(0.18 | ) | | | $2.06 | | | | $2.98 | | | | $(5.95 | ) |
| Less distributions declared to shareholders | | | | | | | | | | | | | | | | | | | | | | | | |
From net investment income | | | $— | | | | $(0.08 | ) | | | $(0.11 | ) | | | $(0.12 | ) | | | $(0.15 | ) | | | $(0.06 | ) |
From net realized gain on investments | | | — | | | | — | | | | — | | | | — | | | | — | | | | (1.05 | ) |
Total distributions declared to shareholders | | | $— | | | | $(0.08 | ) | | | $(0.11 | ) | | | $(0.12 | ) | | | $(0.15 | ) | | | $(1.11 | ) |
Net asset value, end of period (x) | | | $18.37 | | | | $16.00 | | | | $13.84 | | | | $14.13 | | | | $12.19 | | | | $9.36 | |
Total return (%) (k)(r)(s)(x) | | | 14.81 | (n) | | | 16.24 | | | | (1.25 | ) | | | 16.95 | | | | 32.44 | | | | (38.79 | ) |
Ratios (%) (to average net assets)
and Supplemental data: | | | | | | | | | | | | | | | | | | | | | | | | |
Expenses before expense reductions (f) | | | 1.10 | (a) | | | 1.10 | | | | 1.13 | | | | 1.15 | | | | 1.14 | | | | 1.13 | |
Expenses after expense reductions (f) | | | 1.10 | (a) | | | 1.10 | | | | 1.12 | | | | 1.11 | | | | 1.10 | | | | 1.10 | |
Net investment income | | | 0.77 | (a) | | | 0.85 | | | | 0.51 | | | | 0.73 | | | | 1.02 | | | | 1.00 | |
Portfolio turnover | | | 30 | (n) | | | 63 | | | | 65 | | | | 69 | | | | 91 | | | | 109 | |
Net assets at end of period (000 omitted) | | | $45,083 | | | | $41,707 | | | | $37,337 | | | | $35,819 | | | | $33,583 | | | | $21,684 | |
| Supplemental Ratios (%): | | | | | | | | | | | | | | | | | | | | | | | | |
Ratio of expenses to average net assets after expense reductions excluding short sale dividend and interest expense (f) | | | 1.09 | (a) | | | 1.10 | | | | 1.12 | | | | 1.10 | | | | 1.10 | | | | N/A | |
See Notes to Financial Statements
11
MFS Core Equity Portfolio
Financial Highlights – continued
| (d) | Per share data is based on average shares outstanding. |
| (f) | Ratios do not reflect reductions from fees paid indirectly, if applicable. |
| (k) | The total return does not reflect expenses that apply to separate accounts. Inclusion of these charges would reduce the total return figures for all periods shown. |
| (r) | Certain expenses have been reduced without which performance would have been lower. |
| (s) | From time to time the fund may receive proceeds from litigation settlements, without which performance would be lower. |
| (x) | The net asset values per share and total returns have been calculated on net assets which include adjustments made in accordance with U.S. generally accepted accounting principles required at period end for financial reporting purposes. |
See Notes to Financial Statements
12
MFS Core Equity Portfolio
NOTES TO FINANCIAL STATEMENTS (unaudited)
| (1) | | Business and Organization |
MFS Core Equity Portfolio (the fund) is a series of MFS Variable Insurance Trust II (the trust). The trust is organized as a Massachusetts business trust and is registered under the Investment Company Act of 1940, as amended, as an open-end management investment company. The shareholders of each series of the trust are separate accounts of insurance companies, which offer variable annuity and/or life insurance products, and qualified retirement and pension plans.
| (2) | | Significant Accounting Policies |
General – The preparation of financial statements in conformity with U.S. generally accepted accounting principles requires management to make estimates and assumptions that affect the reported amounts of assets and liabilities, and disclosure of contingent assets and liabilities at the date of the financial statements and the reported amounts of revenues and expenses during the reporting period. Actual results could differ from those estimates. In the preparation of these financial statements, management has evaluated subsequent events occurring after the date of the fund’s Statement of Assets and Liabilities through the date that the financial statements were issued.
In this reporting period, the fund adopted the disclosure provisions of the Financial Accounting Standards Board (FASB) Accounting Standards Update 2011-11 (“ASU 2011-11”), Balance Sheet (Topic 210) – Disclosures about Offsetting Assets and Liabilities along with the related scope clarification provisions of FASB Accounting Standards Update 2013-01 (“ASU 2013-01”) entitled Balance Sheet (Topic 210) – Clarifying the Scope of Disclosures about Offsetting Assets and Liabilities. ASU 2011-11 is intended to enhance disclosures on the offsetting of financial assets and liabilities by requiring entities to disclose both gross and net information about financial instruments and transactions that are either offset in the statement of financial position or subject to a Master Netting Agreement or similar arrangement. ASU 2013-01 limits the scope of ASU 2011-11’s disclosure requirements on offsetting to financial assets and financial liabilities related to derivatives, repurchase and reverse repurchase agreements, and securities lending and securities borrowing transactions. The disclosures required by ASU 2011-11, to the extent applicable to the fund, have been included in the fund’s Significant Accounting Policies note under the captions for each of the fund’s in-scope financial instruments and transactions.
In June 2013, FASB issued Accounting Standards Update 2013-08 Financial Services – Investment Companies (Topic 946) – Amendments to the Scope, Measurement, and Disclosure Requirements (“ASU 2013-08”) which is effective for interim and annual reporting periods in fiscal years that begin after December 15, 2013. ASU 2013-08 sets forth a methodology for determining whether an entity should be characterized as an investment company and prescribes fair value accounting for an investment company’s non-controlling ownership interest in another investment company. FASB has determined that a fund registered under the Investment Company Act of 1940 automatically meets ASU 2013-08’s criteria for an investment company. Although still evaluating the potential impacts of ASU 2013-08 to the fund, management expects that the impact of the fund’s adoption will be limited to additional financial statement disclosures.
Investment Valuations – Equity securities, including restricted equity securities, are generally valued at the last sale or official closing price as provided by a third-party pricing service on the market or exchange on which they are primarily traded. Equity securities, for which there were no sales reported that day, are generally valued at the last quoted daily bid quotation as provided by a third-party pricing service on the market or exchange on which such securities are primarily traded. Equity securities held short, for which there were no sales reported for that day, are generally valued at the last quoted daily ask quotation as provided by a third-party pricing service on the market or exchange on which such securities are primarily traded. Short-term instruments with a maturity at issuance of 60 days or less generally are valued at amortized cost, which approximates market value. Exchange-traded options are generally valued at the last sale or official closing price as provided by a third-party pricing service on the exchange on which such options are primarily traded. Exchange-traded options for which there were no sales reported that day are generally valued at the last daily bid quotation as provided by a third-party pricing service on the exchange on which such options are primarily traded. Options not traded on an exchange are generally valued at a broker/dealer bid quotation. Foreign currency options are generally valued at valuations provided by a third-party pricing service. Open-end investment companies are generally valued at net asset value per share. Securities and other assets generally valued on the basis of information from a third-party pricing service may also be valued at a broker/dealer bid quotation. Values obtained from third-party pricing services can utilize both transaction data and market information such as yield, quality, coupon rate, maturity, type of issue, trading characteristics, and other market data. The values of foreign securities and other assets and liabilities expressed in foreign currencies are converted to U.S. dollars using the mean of bid and asked prices for rates provided by a third-party pricing service.
The Board of Trustees has delegated primary responsibility for determining or causing to be determined the value of the fund’s investments (including any fair valuation) to the adviser pursuant to valuation policies and procedures approved by the Board. If the adviser determines that reliable market quotations are not readily available, investments are valued at fair value as determined in good faith by the adviser in accordance with such procedures under the oversight of the Board of Trustees. Under the fund’s valuation policies and procedures, market quotations are not considered to be readily available for most types of debt instruments and floating rate loans and many types of derivatives. These investments are generally valued at fair value based on information from third-party pricing services. In addition, investments may be valued at fair value if the adviser determines that an investment’s value
13
MFS Core Equity Portfolio
Notes to Financial Statements (unaudited) – continued
has been materially affected by events occurring after the close of the exchange or market on which the investment is principally traded (such as foreign exchange or market) and prior to the determination of the fund’s net asset value, or after the halting of trading of a specific security where trading does not resume prior to the close of the exchange or market on which the security is principally traded. Events that occur on a frequent basis after foreign markets close (such as developments in foreign markets and significant movements in the U.S. markets) and prior to the determination of the fund’s net asset value may be deemed to have a material effect on the value of securities traded in foreign markets. Accordingly, the fund’s foreign equity securities may often be valued at fair value. The adviser generally relies on third-party pricing services or other information (such as the correlation with price movements of similar securities in the same or other markets; the type, cost and investment characteristics of the security; the business and financial condition of the issuer; and trading and other market data) to assist in determining whether to fair value and at what value to fair value an investment. The value of an investment for purposes of calculating the fund’s net asset value can differ depending on the source and method used to determine value. When fair valuation is used, the value of an investment used to determine the fund’s net asset value may differ from quoted or published prices for the same investment. There can be no assurance that the fund could obtain the fair value assigned to an investment if it were to sell the investment at the same time at which the fund determines its net asset value per share.
Various inputs are used in determining the value of the fund’s assets or liabilities. These inputs are categorized into three broad levels. In certain cases, the inputs used to measure fair value may fall into different levels of the fair value hierarchy. In such cases, an investment’s level within the fair value hierarchy is based on the lowest level of input that is significant to the fair value measurement. The fund’s assessment of the significance of a particular input to the fair value measurement in its entirety requires judgment, and considers factors specific to the investment. Level 1 includes unadjusted quoted prices in active markets for identical assets or liabilities. Level 2 includes other significant observable market-based inputs (including quoted prices for similar securities, interest rates, prepayment speed, and credit risk). Level 3 includes unobservable inputs, which may include the adviser’s own assumptions in determining the fair value of investments. Other financial instruments are derivative instruments not reflected in total investments, such as written options. The following is a summary of the levels used as of June 30, 2013 in valuing the fund’s assets or liabilities:
| | | | | | | | | | | | | | | | |
| Investments at Value | | Level 1 | | | Level 2 | | | Level 3 | | | Total | |
| Equity Securities: | | | | | | | | | | | | | | | | |
United States | | | $144,777,570 | | | | $— | | | | $— | | | | $144,777,570 | |
Canada | | | 2,841,558 | | | | — | | | | — | | | | 2,841,558 | |
Netherlands | | | 1,248,930 | | | | — | | | | — | | | | 1,248,930 | |
Israel | | | 1,247,465 | | | | — | | | | — | | | | 1,247,465 | |
Greece | | | 324,091 | | | | — | | | | — | | | | 324,091 | |
United Kingdom | | | — | | | | — | | | | 108,937 | | | | 108,937 | |
| Mutual Funds | | | 1,369,808 | | | | — | | | | — | | | | 1,369,808 | |
| Total Investments | | | $151,809,422 | | | | $— | | | | $108,937 | | | | $151,918,359 | |
| | | | |
| Other Financial Instruments | | | | | | | | | | | | |
| Written Options | | | $(6,105 | ) | | | $— | | | | $— | | | | $(6,105 | ) |
For further information regarding security characteristics, see the Portfolio of Investments.
The following is a reconciliation of level 3 assets for which significant unobservable inputs were used to determine fair value. The fund’s policy is to recognize transfers between the levels as of the end of the period. The table presents the activity of level 3 securities held at the beginning and the end of the period.
| | | | |
| | | Equity Securities | |
| Balance as of 12/31/13 | | | $130,373 | |
Change in unrealized appreciation (depreciation) | | | (21,436 | ) |
| Balance as of 6/30/13 | | | $108,937 | |
The net change in unrealized appreciation (depreciation) from investments still held as level 3 at June 30, 2013 is $(21,436).
Foreign Currency Translation – Purchases and sales of foreign investments, income, and expenses are converted into U.S. dollars based upon currency exchange rates prevailing on the respective dates of such transactions or on the reporting date for foreign denominated receivables and payables. Gains and losses attributable to foreign currency exchange rates on sales of securities are recorded for financial statement purposes as net realized gains and losses on investments. Gains and losses attributable to foreign exchange rate movements on receivables, payables, income and expenses are recorded for financial statement purposes as foreign currency transaction gains and losses. That portion of both realized and unrealized gains and losses on investments that results from fluctuations in foreign currency exchange rates is not separately disclosed.
Derivatives – The fund uses derivatives for different purposes, primarily to increase or decrease exposure to a particular market or segment of the market, or security, to increase or decrease interest rate or currency exposure, or as alternatives to direct investments.
14
MFS Core Equity Portfolio
Notes to Financial Statements (unaudited) – continued
Derivatives are used for hedging or non-hedging purposes. While hedging can reduce or eliminate losses, it can also reduce or eliminate gains. When the fund uses derivatives as an investment to increase market exposure, or for hedging purposes, gains and losses from derivative instruments may be substantially greater than the derivative’s original cost.
The derivative instruments used by the fund were written options and purchased options. The fund’s period end derivatives, as presented in the Portfolio of Investments, generally are indicative of the volume of its derivative activity during the period.
The following table presents, by major type of derivative contract, the fair value, on a gross basis, of the asset and liability components of derivatives held by the fund at June 30, 2013 as reported in the Statement of Assets and Liabilities:
| | | | | | | | | | |
| | | | | Fair Value (a) | |
| Risk | | Derivative Contracts | | Asset Derivatives | | | Liability Derivatives | |
| Equity | | Purchased Equity Options | | | $6,882 | | | | $— | |
| Equity | | Written Equity Options | | | — | | | | (6,105 | ) |
| (a) | The value of purchased options outstanding is included in total investments, at value, within the fund’s Statement of Assets and Liabilities. |
The following table presents, by major type of derivative contract, the realized gain (loss) on derivatives held by the fund for the six months ended June 30, 2013 as reported in the Statement of Operations:
| | | | | | | | |
| Risk | | Investments
(Purchased Options) | | | Written Options | |
| Equity | | | $(9,364 | ) | | | $852 | |
The following table presents, by major type of derivative contract, the change in unrealized appreciation (depreciation) on derivatives held by the fund for the six months ended June 30, 2013 as reported in the Statement of Operations:
| | | | | | | | |
| Risk | | Investments
(Purchased Options) | | | Written Options | |
| Equity | | | $8,683 | | | | $(8,015 | ) |
Derivative counterparty credit risk is managed through formal evaluation of the creditworthiness of all potential counterparties. On certain, but not all, over-the-counter derivatives, the fund attempts to reduce its exposure to counterparty credit risk whenever possible by entering into an International Swaps and Derivatives Association (ISDA) Master Agreement on a bilateral basis with each of the counterparties with whom it undertakes a significant volume of transactions. The ISDA Master Agreement gives each party to the agreement the right to terminate all transactions traded under such agreement if there is a certain deterioration in the credit quality of the other party. Upon an event of default or a termination of the ISDA Master Agreement, the non-defaulting party has the right to close out all transactions traded under such agreement and to net amounts owed under each transaction to one net amount payable by one party to the other. This right to close out and net payments across all transactions traded under the ISDA Master Agreement could result in a reduction of the fund’s credit risk to such counterparty equal to any amounts payable by the fund under the applicable transactions, if any.
Collateral and margin requirements differ by type of derivative. Margin requirements are set by the broker or clearing house for cleared derivatives (i.e., futures contracts, cleared swaps, and exchange-traded options) while collateral terms are contract specific for over-the-counter traded derivatives (i.e., forward foreign currency exchange contracts, uncleared swap agreements, and over-the-counter options). For derivatives traded under an ISDA Master Agreement, the collateral requirements are netted across all transactions traded under such agreement and one amount is posted from one party to the other to collateralize such obligations. Cash that has been segregated to cover the fund’s collateral or margin obligations under derivative contracts, if any, will be reported separately in the Statement of Assets and Liabilities as “Deposits with brokers.” Securities pledged as collateral or margin for the same purpose, if any, is noted in the Portfolio of Investments.
The fund’s accounting policy with respect to balance sheet offsetting is that, absent an event of default by the counterparty or a termination of the agreement, the ISDA Master Agreement does not result in an offset of reported amounts of financial assets and financial liabilities in the Statement of Assets and Liabilities across transactions between the fund and the applicable counterparty.
Written Options – In exchange for a premium, the fund wrote call options on securities that it anticipated the price would decline and also wrote put options on securities that it anticipated the price would increase. At the time the option was written, the fund believed the premium received exceeded the potential loss that could result from adverse price changes in the options’ underlying securities. In a written option, the fund as the option writer grants the buyer the right to purchase from, or sell to, the fund a specified number of shares or units of a particular security, currency or index at a specified price within a specified period of time.
The premium received is initially recorded as a liability in the Statement of Assets and Liabilities. The option is subsequently marked-to-market daily with the difference between the premium received and the market value of the written option being recorded as unrealized appreciation or depreciation. When a written option expires, the fund realizes a gain equal to the amount of the premium
15
MFS Core Equity Portfolio
Notes to Financial Statements (unaudited) – continued
received. The difference between the premium received and the amount paid on effecting a closing transaction is considered a realized gain or loss. When a written call option is exercised, the premium received is offset against the proceeds to determine the realized gain or loss. When a written put option is exercised, the premium reduces the cost basis of the security purchased by the fund.
At the initiation of the written option contract, for exchange traded options, the fund is required to deposit securities or cash as collateral with the custodian for the benefit of the broker. For over-the-counter options, the fund may post collateral subject to the terms of an ISDA Master Agreement as generally described above if the market value of the options contract moves against it. The fund, as writer of an option, may have no control over whether the underlying securities may be sold (call) or purchased (put) and, as a result, bears the market risk of an unfavorable change in the price of the securities underlying the written option. Losses from writing options can exceed the premium received and can exceed the potential loss from an ordinary buy and sell transaction. Although the fund’s market risk may be significant, the maximum counterparty credit risk to the fund is equal to the market value of any collateral posted to the broker. For over-the-counter options, this risk is mitigated in cases where there is an ISDA Master Agreement between the fund and the counterparty providing for netting as described above.
The following table represents the written option activity in the fund during the six months ended June 30, 2013:
| | | | | | | | |
| | | Number of
contracts | | | Premiums
received | |
| Outstanding, beginning of period | | | 187 | | | | $79,396 | |
| Options written | | | 111 | | | | 5,986 | |
| Options closed | | | (187 | ) | | | (79,396 | ) |
| Outstanding, end of period | | | 111 | | | | $5,986 | |
Purchased Options – The fund purchased call and put options for a premium. Purchased call and put options entitle the holder to buy and sell a specified number of shares or units of a particular security, currency or index at a specified price at a specified date or within a specified period of time. Purchasing call options may hedge against an anticipated increase in the dollar cost of securities or currency to be acquired or increase the fund’s exposure to an underlying instrument. Purchasing put options may hedge against an anticipated decline in the value of portfolio securities or currency or decrease the fund’s exposure to an underlying instrument.
The premium paid is initially recorded as an investment in the Statement of Assets and Liabilities. That investment is subsequently marked-to-market daily with the difference between the premium paid and the market value of the purchased option being recorded as unrealized appreciation or depreciation. Premiums paid for purchased call and put options which have expired are treated as realized losses on investments in the Statement of Operations. Upon the exercise or closing of a purchased call option, the premium paid is added to the cost of the security or financial instrument purchased. Upon the exercise or closing of a purchased put option, the premium paid is offset against the proceeds on the sale of the underlying security or financial instrument in order to determine the realized gain or loss on investments.
Whether or not the option is exercised, the fund’s maximum risk of loss from purchasing an option is the amount of premium paid. All option contracts involve credit risk if the counterparty to the option contract fails to perform. For over-the-counter options, this risk is mitigated in cases where there is an ISDA Master Agreement between the fund and the counterparty providing for netting as described above and for posting of collateral by the counterparty to the fund to cover the fund’s exposure to the counterparty under such ISDA Master Agreement.
Short Sales – The fund entered into short sales whereby it sells a security it does not own in anticipation of a decline in the value of that security. The fund will realize a gain if the security price decreases and a loss if the security price increases between the date of the short sale and the date on which the fund replaces the borrowed security. Losses from short sales can exceed the proceeds of the security sold; and they can also exceed the potential loss from an ordinary buy and sell transaction. The amount of any premium, dividends, or interest the fund may be required to pay in connection with a short sale will be recognized as a fund expense. During the six months ended June 30, 2013, this expense amounted to $3,925. The fund segregates cash or marketable securities in an amount that, when combined with the amount of proceeds from the short sale deposited with the broker, at least equals the current market value of the security sold short. At June 30, 2013, the fund had no short sales outstanding.
Security Loans – Under its Securities Lending Agency Agreement with the fund, State Street Bank and Trust Company (“State Street”), as lending agent, loans the securities of the fund to certain qualified institutions (the “Borrowers”) approved by the fund. The loans are collateralized by cash and/or U.S. Treasury and federal agency obligations in an amount typically at least equal to the market value of the securities loaned. The market value of the loaned securities is determined at the close of business of the fund and any additional required collateral is delivered to the fund on the next business day. State Street provides the fund with indemnification against Borrower default. In the event of Borrower default, State Street will for the benefit of the fund either purchase securities identical to those loaned or, when such purchase is commercially impracticable, pay the fund the market value of the loaned securities. In return, State Street assumes the fund’s rights to the related collateral. If the collateral value is less than the
16
MFS Core Equity Portfolio
Notes to Financial Statements (unaudited) – continued
cost to purchase identical securities, State Street is responsible for the shortfall, but only to the extent that such shortfall is not due to a decline in collateral value resulting from collateral reinvestment for which the fund bears the risk of loss. On loans collateralized by cash, the cash collateral is invested in a money market fund or short-term securities. A portion of the income generated upon investment of the collateral is remitted to the Borrowers, and the remainder is allocated between the fund and the lending agent. On loans collateralized by U.S. Treasury and/or federal agency obligations, a fee is received from the Borrower, and is allocated between the fund and the lending agent. Income from securities lending is included in “Interest” income in the Statement of Operations. The dividend and interest income earned on the securities loaned is accounted for in the same manner as other dividend and interest income. At June 30, 2013, there were no securities on loan or collateral outstanding.
Indemnifications – Under the fund’s organizational documents, its officers and Trustees may be indemnified against certain liabilities and expenses arising out of the performance of their duties to the fund. Additionally, in the normal course of business, the fund enters into agreements with service providers that may contain indemnification clauses. The fund’s maximum exposure under these agreements is unknown as this would involve future claims that may be made against the fund that have not yet occurred.
Investment Transactions and Income – Investment transactions are recorded on the trade date. Interest income is recorded on the accrual basis. Dividends received in cash are recorded on the ex-dividend date. Certain dividends from foreign securities will be recorded when the fund is informed of the dividend if such information is obtained subsequent to the ex-dividend date. Dividend and interest payments received in additional securities are recorded on the ex-dividend or ex-interest date in an amount equal to the value of the security on such date.
The fund may receive proceeds from litigation settlements. Any proceeds received from litigation involving portfolio holdings are reflected in the Statement of Operations in realized gain/loss if the security has been disposed of by the fund or in unrealized gain/loss if the security is still held by the fund. Any other proceeds from litigation not related to portfolio holdings are reflected as other income in the Statement of Operations.
Fees Paid Indirectly – The fund’s custody fee may be reduced according to an arrangement that measures the value of cash deposited with the custodian by the fund. For the six months ended June 30, 2013, custody fees were not reduced.
Tax Matters and Distributions – The fund intends to qualify as a regulated investment company, as defined under Subchapter M of the Internal Revenue Code, and to distribute all of its taxable income, including realized capital gains. As a result, no provision for federal income tax is required. The fund’s federal tax returns, when filed, will remain subject to examination by the Internal Revenue Service for a three year period. Foreign taxes have been accrued by the fund in the accompanying financial statements in accordance with the applicable foreign tax law. Foreign income taxes may be withheld by certain countries in which the fund invests.
Distributions to shareholders are recorded on the ex-dividend date. Income and capital gain distributions are determined in accordance with income tax regulations, which may differ from U.S. generally accepted accounting principles. Certain capital accounts in the financial statements are periodically adjusted for permanent differences in order to reflect their tax character. These adjustments have no impact on net assets or net asset value per share. Temporary differences which arise from recognizing certain items of income, expense, gain or loss in different periods for financial statement and tax purposes will reverse at some time in the future. Distributions in excess of net investment income or net realized gains are temporary overdistributions for financial statement purposes resulting from differences in the recognition or classification of income or distributions for financial statement and tax purposes.
Book/tax differences primarily relate to wash sale loss deferrals.
The tax character of distributions declared to shareholders for the last fiscal year is as follows:
| | | | |
| | | 12/31/12 | |
| Ordinary income (including any short-term capital gains) | | | $980,068 | |
The federal tax cost and the tax basis components of distributable earnings were as follows:
| | | | |
| As of 6/30/13 | | | | |
| Cost of investments | | | $127,902,390 | |
| Gross appreciation | | | 27,410,577 | |
| Gross depreciation | | | (3,394,608 | ) |
| Net unrealized appreciation (depreciation) | | | $24,015,969 | |
| |
| As of 12/31/12 | | | | |
| Undistributed ordinary income | | | 1,424,366 | |
| Capital loss carryforwards | | | (19,428,682 | ) |
| Other temporary differences | | | (46,991 | ) |
| Net unrealized appreciation (depreciation) | | | 14,752,849 | |
17
MFS Core Equity Portfolio
Notes to Financial Statements (unaudited) – continued
The aggregate cost above includes prior fiscal year end tax adjustments, if applicable.
Under the Regulated Investment Company Modernization Act of 2010 (the “Act”), net capital losses recognized for fund fiscal years beginning after December 31, 2010 may be carried forward indefinitely, and their character is retained as short-term and/or long-term losses (“post-enactment losses”). Previously, net capital losses were carried forward for eight years and treated as short-term losses (“pre-enactment losses”). As a transition rule, the Act requires that all post-enactment net capital losses be used before pre-enactment net capital losses.
As of, the fund had capital loss carryforwards available to offset future realized gains. Such pre-enactment losses expire as follows:
| | | | |
| 12/31/16 | | | $(3,057,756 | ) |
| 12/31/17 | | | (16,370,926 | ) |
| Total | | | $(19,428,682 | ) |
Multiple Classes of Shares of Beneficial Interest – The fund offers multiple classes of shares, which differ in their respective distribution and/or service fees. The fund’s income, realized and unrealized gain (loss), and common expenses are allocated to shareholders based on the daily net assets of each class. Dividends are declared separately for each class. Differences in per share dividend rates are generally due to differences in separate class expenses. The fund’s distributions declared to shareholders as reported in the Statements of Changes in Net Assets are presented by class as follows:
| | | | | | | | |
| | | From net investment
income | |
| | | Six months ended
6/30/13 | | | Year ended
12/31/12 | |
| Initial Class | | | $— | | | | $764,938 | |
| Service Class | | | — | | | | 215,130 | |
| Total | | | $— | | | | $980,068 | |
| (3) | | Transactions with Affiliates |
Investment Adviser – The fund has an investment advisory agreement with MFS to provide overall investment management and related administrative services and facilities to the fund. The management fee is computed daily and paid monthly at the following annual rates:
| | | | |
| First $1 billion of average daily net assets | | | 0.75% | |
| Average daily net assets in excess of $1 billion | | | 0.65% | |
The investment adviser has agreed in writing to reduce its management fee to 0.60% of average daily net assets in excess of $2.5 billion. This written agreement will continue until modified by the fund’s Board of Trustees, but such agreement will continue at least until April 30, 2015. For the six months ended June 30, 2013, the fund’s average daily net assets did not exceed $2.5 billion and therefore, the management fee was not reduced.
Effective April 1, 2013, MFS has agreed in writing to reduce its management fee by a specified amount if certain MFS mutual fund assets exceed thresholds agreed to by MFS and the fund’s Board of Trustees. For the period April 1, 2013 through June 30, 2013, this management fee reduction amounted to $206, which is shown as a reduction of total expenses in the Statement of Operations. The management fee incurred for the six months ended June 30, 2013 was equivalent to an annual effective rate of 0.75% of the fund’s average daily net assets.
Distributor – MFS Fund Distributors, Inc. (MFD), a wholly-owned subsidiary of MFS, is the distributor of shares of the fund. The Trustees have adopted a distribution plan for the Service Class shares pursuant to Rule 12b-1 under the Investment Company Act of 1940.
The fund’s distribution plan provides that the fund will pay MFD distribution and/or service fees equal to 0.25% per annum of its average daily net assets attributable to Service Class shares as partial consideration for services performed and expenses incurred by MFD and financial intermediaries (including participating insurance companies that invest in the fund to fund variable annuity and variable life insurance contracts, sponsors of qualified retirement and pension plans that invest in the fund, and affiliates of these participating insurance companies and plan sponsors) in connection with the sale and distribution of the Service Class shares. MFD may subsequently pay all, or a portion, of the distribution and/or service fees to financial intermediaries.
Shareholder Servicing Agent – Effective April 1, 2013, MFS Service Center, Inc. (MFSC), a wholly-owned subsidiary of MFS, receives a fee from the fund for its services as shareholder servicing agent. For the period from April 1, 2013 through June 30, 2013, the fee was $1,108, which equated to 0.0015% annually of the fund’s average daily net assets. MFSC also receives payment from the fund for out-of-pocket expenses paid by MFSC on behalf of the fund. For the period from April 1, 2013 through June 30, 2013, these costs amounted to $1.
18
MFS Core Equity Portfolio
Notes to Financial Statements (unaudited) – continued
Administrator – MFS provides certain financial, legal, shareholder communications, compliance, and other administrative services to the fund. Under an administrative services agreement, the fund partially reimburses MFS the costs incurred to provide these services. The fund is charged an annual fixed amount of $17,500 plus a fee based on average daily net assets. The administrative services fee incurred for the six months ended June 30, 2013 was equivalent to an annual effective rate of 0.0199% of the fund’s average daily net assets.
Trustees’ and Officers’ Compensation – The fund pays compensation to independent Trustees in the form of a retainer, attendance fees, and additional compensation to Board and Committee chairpersons. The fund does not pay compensation directly to Trustees or officers of the fund who are also officers of the investment adviser, all of whom receive remuneration for their services to the fund from MFS. Certain officers and Trustees of the fund are officers or directors of MFS, MFD, and MFSC.
Other – This fund and certain other funds managed by MFS (the funds) have entered into services agreements (the Agreements) which provide for payment of fees by the funds to Tarantino LLC and Griffin Compliance LLC in return for the provision of services of an Independent Chief Compliance Officer (ICCO) and Assistant ICCO, respectively, for the funds. The ICCO and Assistant ICCO are officers of the funds and the sole members of Tarantino LLC and Griffin Compliance LLC, respectively. The funds can terminate the Agreements with Tarantino LLC and Griffin Compliance LLC at any time under the terms of the Agreements. For the six months ended June 30, 2013, the aggregate fees paid by the fund to Tarantino LLC and Griffin Compliance LLC were $561 and are included in “Miscellaneous” expense in the Statement of Operations. MFS has agreed to reimburse the fund for a portion of the payments made by the fund in the amount of $281, which is shown as a reduction of total expenses in the Statement of Operations. Additionally, MFS has agreed to bear all expenses associated with office space, other administrative support, and supplies provided to the ICCO and Assistant ICCO.
The fund invests in the MFS Institutional Money Market Portfolio which is managed by MFS and seeks current income consistent with preservation of capital and liquidity. Income earned on this investment is included in “Dividends from underlying affiliated funds” in the Statement of Operations. This money market fund does not pay a management fee to MFS.
Purchases and sales of investments, other than purchased option transactions and short-term obligations, aggregated $44,011,220 and $51,289,727, respectively.
| (5) | | Shares of Beneficial Interest |
The fund’s Declaration of Trust permits the Trustees to issue an unlimited number of full and fractional shares of beneficial interest. Transactions in fund shares were as follows:
| | | | | | | | | | | | | | | | |
| | | Six months ended 6/30/13 | | | Year ended 12/31/12 | |
| | | Shares | | | Amount | | | Shares | | | Amount | |
| Shares sold | | | | | | | | | | | | | | | | |
Initial Class | | | 39,520 | | | | $703,711 | | | | 49,337 | | | | $773,627 | |
Service Class | | | 223,227 | | | | 3,860,842 | | | | 406,072 | | | | 6,223,938 | |
| | | 262,747 | | | | $4,564,553 | | | | 455,409 | | | | $6,997,565 | |
| Shares issued to shareholders in reinvestment of distributions | | | | | | | | | | | | | | | | |
Initial Class | | | — | | | | $— | | | | 49,415 | | | | $764,938 | |
Service Class | | | — | | | | — | | | | 13,988 | | | | 215,130 | |
| | | — | | | | $— | | | | 63,403 | | | | $980,068 | |
| Shares reacquired | | | | | | | | | | | | | | | | |
Initial Class | | | (342,662 | ) | | | $(6,072,070 | ) | | | (971,381 | ) | | | $(14,911,745 | ) |
Service Class | | | (376,424 | ) | | | (6,676,801 | ) | | | (510,896 | ) | | | (7,799,694 | ) |
| | | (719,086 | ) | | | $(12,748,871 | ) | | | (1,482,277 | ) | | | $(22,711,439 | ) |
| Net change | | | | | | | | | | | | | | | | |
Initial Class | | | (303,142 | ) | | | $(5,368,359 | ) | | | (872,629 | ) | | | $(13,373,180 | ) |
Service Class | | | (153,197 | ) | | | (2,815,959 | ) | | | (90,836 | ) | | | (1,360,626 | ) |
| | | (456,339 | ) | | | $(8,184,318 | ) | | | (963,465 | ) | | | $(14,733,806 | ) |
The fund and certain other funds managed by MFS participate in a $1.1 billion unsecured committed line of credit, subject to a $1 billion sublimit, provided by a syndication of banks under a credit agreement. Borrowings may be made for temporary financing needs. Interest is charged to each fund, based on its borrowings, generally at a rate equal to the higher of the Federal Reserve funds rate or one month LIBOR plus an agreed upon spread. A commitment fee, based on the average daily, unused portion of the committed line of credit, is allocated among the participating funds at the end of each calendar quarter. In addition, the fund and other funds managed by MFS have established unsecured uncommitted borrowing arrangements with certain banks for temporary
19
MFS Core Equity Portfolio
Notes to Financial Statements (unaudited) – continued
financing needs. Interest is charged to each fund, based on its borrowings, at a rate equal to the Federal Reserve funds rate plus an agreed upon spread. For the six months ended June 30, 2013, the fund’s commitment fee and interest expense were $368 and $0, respectively, and are included in “Miscellaneous” expense in the Statement of Operations.
| (7) | | Transactions in Underlying Affiliated Funds – Affiliated Issuers |
An affiliated issuer may be considered one in which the fund owns 5% or more of the outstanding voting securities, or a company which is under common control. For the purposes of this report, the fund assumes the following to be an affiliated issuer:
| | | | | | | | | | | | | | | | |
| Underlying Affiliated Fund | | Beginning
Shares/Par
Amount | | | Acquisitions
Shares/Par
Amount | | | Dispositions
Shares/Par
Amount | | | Ending
Shares/Par
Amount | |
| MFS Institutional Money Market Portfolio | | | 896,829 | | | | 14,678,727 | | | | (14,205,748 | ) | | | 1,369,808 | |
| | | | |
| Underlying Affiliated Fund | | Realized
Gain (Loss) | | | Capital Gain
Distributions | | | Dividend
Income | | | Ending
Value | |
| MFS Institutional Money Market Portfolio | | | $— | | | | $— | | | | $885 | | | | $1,369,808 | |
20
MFS Core Equity Portfolio
BOARD REVIEW OF INVESTMENT ADVISORY AGREEMENT
A discussion regarding the Board’s most recent review and renewal of the fund’s Investment Advisory Agreement with MFS will be available on or about November 1, 2013 by clicking on the fund’s name under “Variable Insurance Portfolios — VIT II” in the “Products” section of the MFS Web site (mfs.com).
PROXY VOTING POLICIES AND INFORMATION
A general description of the MFS funds’ proxy voting policies and procedures is available without charge, upon request, by calling 1-800-225-2606, by visiting the Proxy Voting section of mfs.com or by visiting the SEC’s Web site at http://www.sec.gov.
Information regarding how the fund voted proxies relating to portfolio securities during the most recent twelve-month period ended June 30 is available without charge by visiting the Proxy Voting section of mfs.com or by visiting the SEC’s Web site at http://www.sec.gov.
QUARTERLY PORTFOLIO DISCLOSURE
The fund will file a complete schedule of portfolio holdings with the Securities and Exchange Commission (the Commission) for the first and third quarters of each fiscal year on Form N-Q. The fund’s Form N-Q is available on the EDGAR database on the Commission’s Internet Web site at http://www.sec.gov, and may be reviewed and copied at the:
Public Reference Room
Securities and Exchange Commission
100 F Street, NE, Room 1580
Washington, D.C. 20549
Information on the operation of the Public Reference Room may be obtained by calling the Commission at 1-800-SEC-0330. Copies of the fund’s Form N-Q also may be obtained, upon payment of a duplicating fee, by electronic request at the following e-mail address: publicinfo@sec.gov or by writing the Public Reference Section at the above address.
FURTHER INFORMATION
From time to time, MFS may post important information about the fund or the MFS funds on the MFS web site (mfs.com). This information is available by visiting the ”News & Commentary“ section of mfs.com or by clicking on the fund’s name under ”Variable Insurance Portfolios — VIT II“ in the ”Products“ section of mfs.com.
21
SEMIANNUAL REPORT
June 30, 2013

MFS® GOVERNMENT SECURITIES PORTFOLIO
MFS® Variable Insurance Trust II

GSS-SEM
MFS® GOVERNMENT SECURITIES PORTFOLIO
CONTENTS
The report is prepared for the general information of contract owners. It is authorized for distribution to prospective investors only when preceded or accompanied by a current prospectus.
NOT FDIC INSURED Ÿ MAY LOSE VALUE Ÿ NO BANK OR CREDIT UNION GUARANTEE Ÿ NOT A DEPOSIT Ÿ NOT INSURED BY ANY FEDERAL GOVERNMENT AGENCY OR NCUA/NCUSIF
MFS Government Securities Portfolio
LETTER FROM THE CHAIRMAN AND CEO

Dear Contract Owners:
As the year progresses, the global economy continues to grind ahead slowly, held back by broad austerity measures. The U.S. economy remains a steadying force, driven by resilient consumers, who have taken the payroll tax increase and the sequestration’s early impact in stride. With U.S. housing and jobs showing steady expansion, domestic consumer-driven growth has offset weaker exports and the U.S. government’s spending constraints. In response to these developments, the U.S. Federal Reserve has begun to brace investors for an eventual shift in its monetary policy, causing global market tremors.
Japan has been another bright spot, with government and central bank stimulus policies leading to increased exports, a resurgent stock market and improved economic sentiment. After a six-month rally, Japan’s stocks slipped late in the second quarter, then picked up momentum on fresh signs that the country could soon break free of its chronic deflation. The major deterrent to global growth remains the eurozone, still in the grip of persistent recession. China has seen its pace of economic growth decelerate, a troubling turn for the country’s trading partners, who have come to rely on it as an engine for global growth.
As always, managing risk in the face of uncertainty remains a top priority for investors. At MFS®, our uniquely collaborative investment process employs integrated, global research and active risk management. Our global team of investment professionals shares ideas and evaluates opportunities across continents, investment disciplines and asset classes — all with a goal of building better insights, and ultimately better results, for our clients.
We are mindful of the many economic challenges investors face, and believe it is more important than ever to maintain a long-term view and employ time-tested principles, such as asset allocation and diversification. We remain confident that our unique approach can serve investors well as they work with their financial advisors to identify and pursue the most suitable opportunities.
Respectfully,

Robert J. Manning
Chairman and Chief Executive Officer
MFS Investment Management®
August 16, 2013
The opinions expressed in this letter are subject to change, may not be relied upon for investment advice, and no forecasts can be guaranteed.
1
MFS Government Securities Portfolio
PORTFOLIO COMPOSITION
Portfolio structure (i)
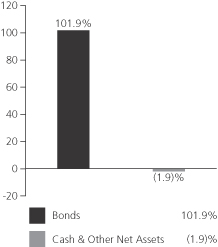
| | | | |
| Fixed income sectors (i) | | | | |
| Mortgage-Backed Securities | | | 53.2% | |
| U.S. Treasury Securities | | | 39.3% | |
| U.S. Government Agencies | | | 6.2% | |
| Commercial Mortgage-Backed Securities | | | 2.0% | |
| High Grade Corporates | | | 1.0% | |
| Municipal Bonds | | | 0.2% | |
| | | | |
| Composition including fixed income credit quality (a)(i) | |
| AAA | | | 1.1% | |
| AA | | | 0.8% | |
| A | | | 0.9% | |
| BBB | | | 0.5% | |
| U.S. Government | | | 39.3% | |
| Federal Agencies | | | 59.3% | |
| Cash & Other | | | (1.9)% | |
| |
| Portfolio facts (i) | | | | |
| Average Duration (d) | | | 4.8 | |
| Average Effective Maturity (m) | | | 5.8 yrs. | |
| (a) | | For all securities other than those specifically described below, ratings are assigned to underlying securities utilizing ratings from Moody’s, Fitch, and Standard & Poor’s rating agencies and applying the following hierarchy: If all three agencies provide a rating, the middle rating (after dropping the highest and lowest ratings) is assigned; if two of the three agencies rate a security, the lower of the two is assigned. Ratings are shown in the S&P and Fitch scale (e.g., AAA). Securities rated BBB or higher are considered investment grade. All ratings are subject to change. U.S. Government includes securities issued by the U.S. Department of the Treasury. Federal Agencies includes rated and unrated U.S. Agency fixed-income securities, U.S. Agency mortgage-backed securities, and collateralized mortgage obligations of U.S. Agency mortgage-backed securities. Cash & Other includes cash, other assets less liabilities, offsets to derivative positions, and short-term securities. The fund may not hold all of these instruments. The fund is not rated by these agencies. |
| (d) | | Duration is a measure of how much a bond’s price is likely to fluctuate with general changes in interest rates, e.g., if rates rise 1.00%, a bond with a 5-year duration is likely to lose about 5.00% of its value due to the interest rate move. |
| (i) | | For purposes of this presentation, the components include the market value of securities, and reflect the impact of the equivalent exposure of derivative positions, if any. These amounts may be negative from time to time. Equivalent exposure is a calculated amount that translates the derivative position into a reasonable approximation of the amount of the underlying asset that the portfolio would have to hold at a given point in time to have the same price sensitivity that results from the portfolio’s ownership of the derivative contract. When dealing with derivatives, equivalent exposure is a more representative measure of the potential impact of a position on portfolio performance than market value. The bond component will include any accrued interest amounts. |
| (m) | | In determining an instrument’s effective maturity for purposes of calculating the fund’s dollar-weighted average effective maturity, MFS uses the instrument’s stated maturity or, if applicable, an earlier date on which MFS believes it is probable that a maturity-shortening device (such as a put, pre-refunding or prepayment) will cause the instrument to be repaid. Such an earlier date can be substantially shorter than the instrument’s stated maturity. |
| From | | time to time “Cash & Other Net Assets” may be negative due to timing of cash receipts and/or equivalent exposure from any derivative holdings. |
Where the fund holds convertible bonds, these are treated as part of the equity portion of the portfolio.
Percentages are based on net assets as of 6/30/13.
The portfolio is actively managed and current holdings may be different.
2
MFS Government Securities Portfolio
EXPENSE TABLE
Fund Expenses Borne by the Contract Holders During the Period,
January 1, 2013 through June 30, 2013
As a contract holder of the fund, you incur ongoing costs, including management fees; distribution and/or service (12b-1) fees; and other fund expenses. This example is intended to help you understand your ongoing costs (in dollars) of investing in the fund and to compare these costs with the ongoing costs of investing in other mutual funds.
The example is based on an investment of $1,000 invested at the beginning of the period and held for the entire period January 1, 2013 through June 30, 2013.
Actual Expenses
The first line for each share class in the following table provides information about actual account values and actual expenses. You may use the information in this line, together with the amount you invested, to estimate the expenses that you paid over the period. Simply divide your account value by $1,000 (for example, an $8,600 account value divided by $1,000 = 8.6), then multiply the result by the number in the first line under the heading entitled “Expenses Paid During Period” to estimate the expenses you paid on your account during this period.
Hypothetical Example for Comparison Purposes
The second line for each share class in the following table provides information about hypothetical account values and hypothetical expenses based on the fund’s actual expense ratio and an assumed rate of return of 5% per year before expenses, which is not the fund’s actual return. The hypothetical account values and expenses may not be used to estimate the actual ending account balance or expenses you paid for the period. You may use this information to compare the ongoing costs of investing in the fund and other funds. To do so, compare this 5% hypothetical example with the 5% hypothetical examples that appear in the shareholder reports of the other funds.
Please note that the expenses shown in the table are meant to highlight the fund’s ongoing costs only and do not take into account the fees and expenses imposed under the variable contracts through which your investment in the fund is made. Therefore, the second line for each share class in the table is useful in comparing ongoing costs associated with an investment in vehicles (such as the fund) which fund benefits under variable annuity and variable life insurance contracts and to qualified pension and retirement plans only, and will not help you determine the relative total costs of investing in the fund through variable annuity and variable life insurance contracts. If the fees and expenses imposed under the variable contracts were included, your costs would have been higher.
| | | | | | | | | | | | | | | | | | |
| Share Class | | | | Annualized
Expense Ratio | | | Beginning
Account Value
1/01/13 | | | Ending Account Value
6/30/13 | | | Expenses Paid
During Period (p)
1/01/13-6/30/13 | |
| Initial Class | | Actual | | | 0.59% | | | | $1,000.00 | | | | $976.28 | | | | $2.89 | |
| | Hypothetical (h) | | | 0.59% | | | | $1,000.00 | | | | $1,021.87 | | | | $2.96 | |
| Service Class | | Actual | | | 0.84% | | | | $1,000.00 | | | | $975.36 | | | | $4.11 | |
| | Hypothetical (h) | | | 0.84% | | | | $1,000.00 | | | | $1,020.63 | | | | $4.21 | |
| (h) | 5% class return per year before expenses. |
| (p) | Expenses paid is equal to each class’s annualized expense ratio, as shown above, multiplied by the average account value over the period, multiplied by the number of days in the period, divided by the number of days in the year. |
3
MFS Government Securities Portfolio
PORTFOLIO OF INVESTMENTS – 6/30/13 (unaudited)
The Portfolio of Investments is a complete list of all securities owned by your fund. It is categorized by broad-based asset classes.
| | | | | | | | |
| Issuer | | Shares/Par | | | Value ($) | |
| | | | | | | | |
| BONDS – 101.4% | | | | | | | | |
| Agency – Other – 3.8% | | | | | | | | |
| Financing Corp., 9.4%, 2018 | | $ | 6,495,000 | | | $ | 8,686,764 | |
| Financing Corp., 9.8%, 2018 | | | 7,760,000 | | | | 10,596,978 | |
| Financing Corp., 10.35%, 2018 | | | 3,915,000 | | | | 5,520,487 | |
| Financing Corp., STRIPS, 0%, 2017 | | | 10,160,000 | | | | 9,471,467 | |
| | | | | | | | |
| | | | | | $ | 34,275,696 | |
| | | | | | | | |
| Asset-Backed & Securitized – 1.9% | |
| Citigroup/Deutsche Bank Commercial Mortgage Trust, 5.322%, 2049 | | $ | 1,860,000 | | | $ | 2,047,555 | |
| Commercial Mortgage Pass-Through Certificates, “A4”, 5.306%, 2046 | | | 3,870,649 | | | | 4,270,181 | |
| Goldman Sachs Mortgage Securities Corp., FRN, 5.981%, 2045 | | | 3,910,026 | | | | 4,357,169 | |
| JPMorgan Chase Commercial Mortgage Securities Corp., “A3”, FRN, 6.125%, 2051 | | | 2,223,578 | | | | 2,310,887 | |
| JPMorgan Chase Commercial Mortgage Securities Corp., “A4”, FRN, 6.002%, 2049 | | | 3,985,116 | | | | 4,459,727 | |
| | | | | | | | |
| | | | | | $ | 17,445,519 | |
| | | | | | | | |
| Local Authorities – 0.9% | | | | | | | | |
| Nashville & Davidson County, TN, Metropolitan Government Convention Center Authority (Build America Bonds), 6.731%, 2043 | | $ | 2,225,000 | | | $ | 2,584,293 | |
| Port Authority NY & NJ (168th Series), 4.926%, 2051 | | | 2,735,000 | | | | 2,698,351 | |
| San Francisco, CA, City & County Public Utilities Commission, Water Rev. (Build America Bonds), 6%, 2040 | | | 320,000 | | | | 362,845 | |
| State of California (Build America Bonds), 7.625%, 2040 | | | 435,000 | | | | 584,279 | |
| University of California Rev. (Build America Bonds), 5.77%, 2043 | | | 1,345,000 | | | | 1,480,885 | |
| | | | | | | | |
| | | | | | $ | 7,710,653 | |
| | | | | | | | |
| Medical & Health Technology & Services – 0.2% | |
| Catholic Health Initiatives, 2.95%, 2022 | | $ | 1,504,000 | | | $ | 1,405,586 | |
| | | | | | | | |
| Mortgage-Backed – 53.1% | | | | | | | | |
| Fannie Mae, 5.214%, 2013 | | $ | 753,403 | | | $ | 752,831 | |
| Fannie Mae, 4.606%, 2014 | | | 3,131,409 | | | | 3,154,727 | |
| Fannie Mae, 4.629%, 2014 | | | 685,078 | | | | 696,057 | |
| Fannie Mae, 4.77%, 2014 | | | 741,668 | | | | 758,543 | |
| Fannie Mae, 4.789%, 2014 | | | 2,547,495 | | | | 2,556,228 | |
| Fannie Mae, 4.82%, 2014 – 2015 | | | 894,150 | | | | 937,369 | |
| Fannie Mae, 4.826%, 2014 | | | 4,791,755 | | | | 4,903,419 | |
| Fannie Mae, 5.1%, 2014 – 2019 | | | 1,204,005 | | | | 1,256,099 | |
| Fannie Mae, 2.38%, 2015 | | | 625,000 | | | | 642,157 | |
| Fannie Mae, 4.56%, 2015 | | | 1,128,147 | | | | 1,188,952 | |
| Fannie Mae, 4.62%, 2015 | | | 1,535,210 | | | | 1,595,945 | |
| Fannie Mae, 4.665%, 2015 | | | 763,276 | | | | 798,214 | |
| Fannie Mae, 4.74%, 2015 | | | 718,023 | | | | 754,030 | |
| | | | | | | | |
| Issuer | | Shares/Par | | | Value ($) | |
| | | | | | | | |
| BONDS – continued | | | | | | | | |
| Mortgage-Backed – continued | | | | | | | | |
| Fannie Mae, 4.78%, 2015 | | $ | 867,986 | | | $ | 918,928 | |
| Fannie Mae, 4.81%, 2015 | | | 986,393 | | | | 1,044,558 | |
| Fannie Mae, 4.815%, 2015 | | | 899,837 | | | | 947,986 | |
| Fannie Mae, 4.85%, 2015 | | | 547,284 | | | | 571,668 | |
| Fannie Mae, 4.856%, 2015 | | | 296,431 | | | | 313,531 | |
| Fannie Mae, 4.87%, 2015 | | | 575,699 | | | | 606,494 | |
| Fannie Mae, 4.89%, 2015 | | | 729,088 | | | | 763,925 | |
| Fannie Mae, 4.908%, 2015 | | | 1,183,381 | | | | 1,244,423 | |
| Fannie Mae, 4.997%, 2015 | | | 152,606 | | | | 162,800 | |
| Fannie Mae, 5.464%, 2015 | | | 3,005,184 | | | | 3,246,010 | |
| Fannie Mae, 5.137%, 2016 | | | 1,451,878 | | | | 1,573,139 | |
| Fannie Mae, 5.35%, 2016 | | | 51,812 | | | | 56,647 | |
| Fannie Mae, 5.424%, 2016 | | | 1,761,440 | | | | 1,944,758 | |
| Fannie Mae, 5.724%, 2016 | | | 1,613,645 | | | | 1,793,419 | |
| Fannie Mae, 6.5%, 2016 – 2037 | | | 2,841,773 | | | | 3,141,187 | |
| Fannie Mae, 1.18%, 2017 | | | 887,849 | | | | 881,029 | |
| Fannie Mae, 4.992%, 2017 | | | 3,227,491 | | | | 3,388,579 | |
| Fannie Mae, 5.5%, 2017 – 2038 | | | 37,366,953 | | | | 40,697,409 | |
| Fannie Mae, 6%, 2017 – 2037 | | | 4,857,913 | | | | 5,256,625 | |
| Fannie Mae, 3.738%, 2018 | | | 639,305 | | | | 698,737 | |
| Fannie Mae, 3.8%, 2018 | | | 637,880 | | | | 684,061 | |
| Fannie Mae, 3.99%, 2018 | | | 600,000 | | | | 654,511 | |
| Fannie Mae, 4%, 2018 – 2041 | | | 9,286,610 | | | | 9,739,915 | |
| Fannie Mae, 4.19%, 2018 | | | 388,988 | | | | 426,905 | |
| Fannie Mae, 5%, 2018 – 2041 | | | 24,543,686 | | | | 26,488,941 | |
| Fannie Mae, 5.16%, 2018 | | | 1,362,281 | | | | 1,484,593 | |
| Fannie Mae, 5.68%, 2018 | | | 497,247 | | | | 550,598 | |
| Fannie Mae, 1.97%, 2019 | | | 395,880 | | | | 391,014 | |
| Fannie Mae, 1.99%, 2019 | | | 1,000,000 | | | | 999,280 | |
| Fannie Mae, 4.5%, 2019 – 2041 | | | 22,581,844 | | | | 24,045,793 | |
| Fannie Mae, 4.67%, 2019 | | | 525,000 | | | | 588,314 | |
| Fannie Mae, 4.83%, 2019 | | | 380,759 | | | | 424,640 | |
| Fannie Mae, 4.877%, 2019 | | | 2,532,756 | | | | 2,826,051 | |
| Fannie Mae, 5.05%, 2019 | | | 319,311 | | | | 351,969 | |
| Fannie Mae, 5.6%, 2019 | | | 572,779 | | | | 629,466 | |
| Fannie Mae, 3.87%, 2020 | | | 740,950 | | | | 795,639 | |
| Fannie Mae, 4.14%, 2020 | | | 457,054 | | | | 499,924 | |
| Fannie Mae, 4.88%, 2020 | | | 438,402 | | | | 480,806 | |
| Fannie Mae, 7.5%, 2022 – 2031 | | | 428,832 | | | | 506,952 | |
| Fannie Mae, 4.5%, 2025 | | | 504,660 | | | | 535,345 | |
| Fannie Mae, 3%, 2027 | | | 4,841,946 | | | | 4,985,368 | |
| Fannie Mae, 2.5%, 2028 | | | 2,017,153 | | | | 2,032,024 | |
| Fannie Mae, 3.5%, 2042 | | | 2,434,716 | | | | 2,477,220 | |
| Fannie Mae, TBA, 3%, 2028 | | | 4,095,000 | | | | 4,191,617 | |
| Fannie Mae, TBA, 3.5%, 2043 | | | 35,019,000 | | | | 35,347,301 | |
| Fannie Mae, TBA, 4.5%, 2043 | | | 17,429,000 | | | | 18,382,157 | |
| Freddie Mac, 1.655%, 2016 | | | 2,969,038 | | | | 3,011,958 | |
| Freddie Mac, 5%, 2016 – 2040 | | | 6,059,403 | | | | 6,460,977 | |
| Freddie Mac, 1.426%, 2017 | | | 5,495,000 | | | | 5,514,650 | |
| Freddie Mac, 3.882%, 2017 | | | 2,158,000 | | | | 2,330,452 | |
| Freddie Mac, 2.22%, 2018 | | | 1,500,000 | | | | 1,508,671 | |
| Freddie Mac, 2.303%, 2018 | | | 2,800,000 | | | | 2,832,169 | |
4
MFS Government Securities Portfolio
Portfolio of Investments (unaudited) – continued
| | | | | | | | |
| Issuer | | Shares/Par | | | Value ($) | |
| | | | | | | | |
| BONDS – continued | | | | | | | | |
| Mortgage-Backed – continued | | | | | | | | |
| Freddie Mac, 3.154%, 2018 | | $ | 2,151,000 | | | $ | 2,262,359 | |
| Freddie Mac, 1.869%, 2019 | | | 3,000,000 | | | | 2,914,023 | |
| Freddie Mac, 1.883%, 2019 | | | 5,750,000 | | | | 5,645,321 | |
| Freddie Mac, 2.086%, 2019 | | | 2,800,000 | | | | 2,765,056 | |
| Freddie Mac, 4.186%, 2019 | | | 814,000 | | | | 892,396 | |
| Freddie Mac, 5.085%, 2019 | | | 3,191,000 | | | | 3,659,889 | |
| Freddie Mac, 6%, 2019 – 2038 | | | 11,436,138 | | | | 12,662,592 | |
| Freddie Mac, 2.313%, 2020 | | | 3,022,000 | | | | 3,009,879 | |
| Freddie Mac, 3.32%, 2020 | | | 915,414 | | | | 971,427 | |
| Freddie Mac, 4.224%, 2020 | | | 1,911,350 | | | | 2,092,972 | |
| Freddie Mac, 4.251%, 2020 | | | 1,449,000 | | | | 1,589,782 | |
| Freddie Mac, 4.5%, 2022 – 2040 | | | 4,398,761 | | | | 4,630,162 | |
| Freddie Mac, 5.5%, 2022 – 2041 | | | 9,476,670 | | | | 10,297,198 | |
| Freddie Mac, 4%, 2025 | | | 2,064,437 | | | | 2,165,750 | |
| Freddie Mac, 2.5%, 2028 | | | 30,700,925 | | | | 30,910,184 | |
| Freddie Mac, 6.5%, 2032 – 2037 | | | 1,795,522 | | | | 2,029,273 | |
| Freddie Mac, 3.5%, 2041 – 2043 | | | 44,133,517 | | | | 44,802,109 | |
| Freddie Mac, 3%, 2043 | | | 13,170,729 | | | | 12,867,470 | |
| Freddie Mac, TBA, 5%, 2028 | | | 4,800,000 | | | | 5,069,812 | |
| Ginnie Mae, 5.5%, 2033 – 2042 | | | 5,649,769 | | | | 6,201,890 | |
| Ginnie Mae, 4%, 2039 – 2041 | | | 2,638,542 | | | | 2,785,939 | |
| Ginnie Mae, 4.5%, 2039 – 2041 | | | 12,578,336 | | | | 13,575,239 | |
| Ginnie Mae, 3.5%, 2041 – 2043 | | | 36,183,650 | | | | 37,209,048 | |
| Ginnie Mae, 3%, 2043 | | | 6,312,000 | | | | 6,254,349 | |
| Ginnie Mae, 5.612%, 2058 | | | 3,235,460 | | | | 3,417,015 | |
| Ginnie Mae, 6.357%, 2058 | | | 1,703,952 | | | | 1,817,921 | |
| | | | | | | | |
| | | | | | $ | 473,924,759 | |
| | | | | | | | |
| Municipals – 0.2% | | | | | |
| Florida Hurricane Catastrophe Fund Finance Corp. Rev., “A”, 1.298%, 2016 | | $ | 15,000 | | | $ | 14,851 | |
| Massachusetts School Building Authority, Dedicated Sales Tax Rev., “A”, 5%, 2023 | | | 200,000 | | | | 235,620 | |
| New York Environmental Facilities Corp., Clean Water and Drinking Revolving Funds Rev. (NYC Municipal Water Finance Authority Projects), “A”, 5%, 2023 | | | 250,000 | | | | 296,992 | |
| New York, NY, Transitional Finance Authority Rev., “I”, 5%, 2022 | | | 200,000 | | | | 235,050 | |
| New York, NY, Transitional Finance Authority Rev., “I”, 5%, 2023 | | | 400,000 | | | | 470,996 | |
| Riverside County, CA, Transportation Commission, Sales Tax Rev., “A”, 5%, 2021 | | | 335,000 | | | | 386,195 | |
| Riverside County, CA, Transportation Commission, Sales Tax Rev., “A”, 5%, 2023 | | | 345,000 | | | | 393,914 | |
| | | | | | | | |
| | | | | | $ | 2,033,618 | |
| | | | | | | | |
| U.S. Government Agencies and Equivalents – 2.2% | |
| Aid-Egypt, 4.45%, 2015 | | $ | 3,162,000 | | | $ | 3,431,845 | |
| Freddie Mac, 2.375%, 2022 | | | 3,990,000 | | | | 3,877,390 | |
| Small Business Administration, 6.35%, 2021 | | | 540,840 | | | | 596,902 | |
| | | | | | | | |
| Issuer | | Shares/Par | | | Value ($) | |
| | | | | | | | |
| BONDS – continued | | | | | | | | |
| U.S. Government Agencies and Equivalents – continued | |
| Small Business Administration, 6.34%, 2021 | | $ | 417,207 | | | $ | 458,563 | |
| Small Business Administration, 6.44%, 2021 | | | 668,192 | | | | 740,342 | |
| Small Business Administration, 6.625%, 2021 | | | 892,203 | | | | 986,955 | |
| Small Business Administration, 6.07%, 2022 | | | 542,652 | | | | 596,403 | |
| Small Business Administration, 4.98%, 2023 | | | 657,969 | | | | 719,697 | |
| Small Business Administration, 4.77%, 2024 | | | 1,353,913 | | | | 1,451,352 | |
| Small Business Administration, 5.52%, 2024 | | | 801,577 | | | | 889,385 | |
| Small Business Administration, 4.99%, 2024 | | | 113,806 | | | | 124,116 | |
| Small Business Administration, 5.11%, 2025 | | | 1,070,686 | | | | 1,179,960 | |
| Small Business Administration, 2.21%, 2033 | | | 1,486,000 | | | | 1,430,908 | |
| Small Business Administration, 2.22%, 2033 | | | 2,605,000 | | | | 2,509,818 | |
| U.S. Department of Housing & Urban Development, 6.36%, 2016 | | | 467,000 | | | | 467,810 | |
| U.S. Department of Housing & Urban Development, 6.59%, 2016 | | | 239,000 | | | | 239,329 | |
| | | | | | | | |
| | | | | | $ | 19,700,775 | |
| | | | | | | | |
| U.S. Treasury Obligations – 39.1% | | | | | |
| U.S. Treasury Bonds, 9.25%, 2016 | | $ | 19,000 | | | $ | 23,282 | |
| U.S. Treasury Bonds, 7.5%, 2016 | | | 218,000 | | | | 266,505 | |
| U.S. Treasury Bonds, 7.875%, 2021 | | | 177,000 | | | | 250,842 | |
| U.S. Treasury Bonds, 6.25%, 2023 | | | 2,891,000 | | | | 3,879,361 | |
| U.S. Treasury Bonds, 6%, 2026 | | | 2,699,000 | | | | 3,623,407 | |
| U.S. Treasury Bonds, 6.75%, 2026 | | | 1,862,000 | | | | 2,666,151 | |
| U.S. Treasury Bonds, 6.375%, 2027 | | | 326,000 | | | | 456,400 | |
| U.S. Treasury Bonds, 5.25%, 2029 | | | 284,000 | | | | 361,301 | |
| U.S. Treasury Bonds, 4.5%, 2036 | | | 1,226,000 | | | | 1,459,898 | |
| U.S. Treasury Bonds, 5%, 2037 | | | 488,000 | | | | 622,886 | |
| U.S. Treasury Bonds, 4.375%, 2038 | | | 1,501,000 | | | | 1,757,578 | |
| U.S. Treasury Bonds, 4.5%, 2039 | | | 28,053,500 | | | | 33,541,466 | |
| U.S. Treasury Bonds, 3.125%, 2043 | | | 2,288,700 | | | | 2,136,360 | |
| U.S. Treasury Notes, 4%, 2014 | | | 211,000 | | | | 216,061 | |
| U.S. Treasury Notes, 1.875%, 2014 | | | 52,060,000 | | | | 52,655,827 | |
| U.S. Treasury Notes, 1.875%, 2014 | | | 12,853,000 | | | | 13,033,739 | |
| U.S. Treasury Notes, 4%, 2015 | | | 6,718,000 | | | | 7,120,556 | |
| U.S. Treasury Notes, 2.125%, 2015 | | | 34,052,000 | | | | 35,206,567 | |
| U.S. Treasury Notes, 2.625%, 2016 | | | 201,000 | | | | 212,259 | |
| U.S. Treasury Notes, 0.875%, 2016 | | | 112,449,000 | | | | 112,378,719 | |
| U.S. Treasury Notes, 2.625%, 2018 | | | 19,419,000 | | | | 20,596,277 | |
| U.S. Treasury Notes, 2.75%, 2019 | | | 13,302,400 | | | | 14,158,742 | |
| U.S. Treasury Notes, 3.125%, 2019 | | | 1,637,000 | | | | 1,776,528 | |
| U.S. Treasury Notes, 3.5%, 2020 | | | 4,084,000 | | | | 4,518,244 | |
| U.S. Treasury Notes, 2.625%, 2020 | | | 3,987,000 | | | | 4,166,415 | |
5
MFS Government Securities Portfolio
Portfolio of Investments (unaudited) – continued
| | | | | | | | |
| Issuer | | Shares/Par | | | Value ($) | |
| | | | | | | | |
| BONDS – continued | | | | | | | | |
| U.S. Treasury Obligations – continued | | | | | |
| U.S. Treasury Notes, 3.125%, 2021 | | $ | 1,901,000 | | | $ | 2,041,347 | |
| U.S. Treasury Notes, 1.75%, 2022 | | | 31,412,000 | | | | 29,951,845 | |
| | | | | | | | |
| | | | | | $ | 349,078,563 | |
| | | | | | | | |
Total Bonds (Identified Cost, $890,491,711) | | | $ | 905,575,169 | |
| | | | | | | | |
| | | | | | | | |
| Issuer | | Shares/Par | | | Value ($) | |
| | | | | | | | |
| MONEY MARKET FUNDS – 19.2% | |
| MFS Institutional Money Market Portfolio, 0.11%, at Cost and Net Asset Value (v) | | | 171,489,840 | | | $ | 171,489,840 | |
| | | | | | | | |
Total Investments (Identified Cost, $1,061,981,551) | | | | | | $ | 1,077,065,009 | |
| | | | | | | | |
OTHER ASSETS, LESS
LIABILITIES – (20.6)% | | | | (183,846,775 | ) |
| | | | | | | | |
| Net Assets – 100.0% | | | | | | $ | 893,218,234 | |
| | | | | | | | |
| (v) | | Underlying affiliated fund that is available only to investment companies managed by MFS. The rate quoted for the MFS Institutional Money Market Portfolio is the annualized seven-day yield of the fund at period end. |
The following abbreviations are used in this report and are defined:
| FRN | | Floating Rate Note. Interest rate resets periodically and may not be the rate reported at period end. |
| STRIPS | | Separate Trading of Registered Interest and Principal of Securities |
See Notes to Financial Statements
6
MFS Government Securities Portfolio
FINANCIAL STATEMENTS | STATEMENT OF ASSETS AND LIABILITIES (unaudited)
This statement represents your fund’s balance sheet, which details the assets and liabilities comprising the total value of the fund.
| | | | | | | | |
| At 6/30/13 | | | | | | | | |
Assets | | | | | | | | |
Investments – | | | | | | | | |
Non-affiliated issuers, at value (identified cost, $890,491,711) | | | $905,575,169 | | | | | |
Underlying affiliated funds, at cost and value | | | 171,489,840 | | | | | |
Total investments, at value (identified cost, $1,061,981,551) | | | $1,077,065,009 | | | | | |
Cash | | | 152,359 | | | | | |
Receivables for | | | | | | | | |
TBA sale commitments | | | 98,821,743 | | | | | |
Fund shares sold | | | 360,150 | | | | | |
Interest | | | 4,487,945 | | | | | |
Other assets | | | 3,553 | | | | | |
Total assets | | | | | | | $1,180,890,759 | |
Liabilities | | | | | | | | |
Payables for | | | | | | | | |
Investments purchased | | | $142,778,529 | | | | | |
TBA purchase commitments | | | 144,188,861 | | | | | |
Fund shares reacquired | | | 540,505 | | | | | |
Payable to affiliates | | | | | | | | |
Investment adviser | | | 54,629 | | | | | |
Shareholder servicing costs | | | 176 | | | | | |
Distribution and/or service fees | | | 10,365 | | | | | |
Payable for independent Trustees’ compensation | | | 2,801 | | | | | |
Accrued expenses and other liabilities | | | 96,659 | | | | | |
Total liabilities | | | | | | | $287,672,525 | |
Net assets | | | | | | | $893,218,234 | |
Net assets consist of | | | | | | | | |
Paid-in capital | | | $856,917,626 | | | | | |
Unrealized appreciation (depreciation) on investments | | | 15,083,458 | | | | | |
Accumulated net realized gain (loss) on investments | | | (4,907,865 | ) | | | | |
Undistributed net investment income | | | 26,125,015 | | | | | |
Net assets | | | | | | | $893,218,234 | |
Shares of beneficial interest outstanding | | | | | | | 68,031,115 | |
| | | | | | | | | | | | |
| | | Net assets | | | Shares outstanding | | | Net asset value per share | |
Initial Class | | | $514,150,746 | | | | 39,016,023 | | | | $13.18 | |
Service Class | | | 379,067,488 | | | | 29,015,092 | | | | 13.06 | |
See Notes to Financial Statements
7
MFS Government Securities Portfolio
FINANCIAL STATEMENTS | STATEMENT OF OPERATIONS (unaudited)
This statement describes how much your fund earned in investment income and accrued in expenses. It also describes any gains and/or losses generated by fund operations.
| | | | | | | | |
Six months ended 6/30/13 | | | | | | | | |
Net investment income | | | | | | | | |
Income | | | | | | | | |
Interest | | | $10,323,802 | | | | | |
Dividends from underlying affiliated funds | | | 142,810 | | | | | |
Total investment income | | | | | | | $10,466,612 | |
Expenses | | | | | | | | |
Management fee | | | $2,516,443 | | | | | |
Distribution and/or service fees | | | 487,496 | | | | | |
Shareholder servicing costs | | | 4,135 | | | | | |
Administrative services fee | | | 62,560 | | | | | |
Independent Trustees’ compensation | | | 9,083 | | | | | |
Custodian fee | | | 47,163 | | | | | |
Shareholder communications | | | 16,653 | | | | | |
Audit and tax fees | | | 28,116 | | | | | |
Legal fees | | | 7,931 | | | | | |
Miscellaneous | | | 20,387 | | | | | |
Total expenses | | | | | | | $3,199,967 | |
Fees paid indirectly | | | (225 | ) | | | | |
Reduction of expenses by investment adviser | | | (2,992 | ) | | | | |
Net expenses | | | | | | | $3,196,750 | |
Net investment income | | | | | | | $7,269,862 | |
Realized and unrealized gain (loss) on investments | | | | | | | | |
Realized gain (loss) on investments (identified cost basis) | | | | | | | $(4,692,485 | ) |
Change in unrealized appreciation (depreciation) on investments | | | | | | | $(24,491,577 | ) |
Net realized and unrealized gain (loss) on investments | | | | | | | $(29,184,062 | ) |
Change in net assets from operations | | | | | | | $(21,914,200 | ) |
See Notes to Financial Statements
8
MFS Government Securities Portfolio
FINANCIAL STATEMENTS | STATEMENTS OF CHANGES IN NET ASSETS
These statements describe the increases and/or decreases in net assets resulting from operations, any distributions, and any shareholder transactions.
| | | | | | | | |
| |
| Six months ended
6/30/13 (unaudited |
) | |
| Year ended
12/31/12 |
|
Change in net assets | | | | | | | | |
| From operations | | | | | | | | |
Net investment income | | | $7,269,862 | | | | $15,498,073 | |
Net realized gain (loss) on investments | | | (4,692,485 | ) | | | 9,075,857 | |
Net unrealized gain (loss) on investments | | | (24,491,577 | ) | | | (9,104,959 | ) |
Change in net assets from operations | | | $(21,914,200 | ) | | | $15,468,971 | |
| Distributions declared to shareholders | | | | | | | | |
From net investment income | | | $— | | | | $(19,810,017 | ) |
From net realized gain on investments | | | — | | | | (5,909,509 | ) |
Total distributions declared to shareholders | | | $— | | | | $(25,719,526 | ) |
Change in net assets from fund share transactions | | | $(26,585,550 | ) | | | $267,475,908 | |
Total change in net assets | | | $(48,499,750 | ) | | | $257,225,353 | |
| Net assets | | | | | | | | |
At beginning of period | | | 941,717,984 | | | | 684,492,631 | |
At end of period (including undistributed net investment income of $26,125,015 and
$18,855,153, respectively) | | | $893,218,234 | | | | $941,717,984 | |
See Notes to Financial Statements
9
MFS Government Securities Portfolio
FINANCIAL STATEMENTS | FINANCIAL HIGHLIGHTS
The financial highlights table is intended to help you understand the fund’s financial performance for the semiannual period and the past 5 fiscal years. Certain information reflects financial results for a single fund share. The total returns in the table represent the rate by which an investor would have earned (or lost) on an investment in the fund share class (assuming reinvestment of all distributions) held for the entire period.
| | | | | | | | | | | | | | | | | | | | | | | | |
| Initial Class | | Six months ended 6/30/13 | | | Years ended 12/31 | |
| | | | 2012 | | | 2011 | | | 2010 | | | 2009 | | | 2008 | |
| | | (unaudited) | | | | | | | | | | | | | | | | |
Net asset value, beginning of period | | | $13.49 | | | | $13.72 | | | | $13.27 | | | | $13.14 | | | | $13.23 | | | | $12.89 | |
| Income (loss) from investment operations | | | | | | | | | | | | | | | | | | | | | | | | |
Net investment income (d) | | | $0.11 | | | | $0.32 | | | | $0.39 | | | | $0.45 | | | | $0.50 | | | | $0.55 | |
Net realized and unrealized gain (loss) on investments | | | (0.42 | ) | | | 0.03 | (g) | | | 0.58 | | | | 0.16 | | | | 0.08 | | | | 0.51 | |
Total from investment operations | | | $(0.31 | ) | | | $0.35 | | | | $0.97 | | | | $0.61 | | | | $0.58 | | | | $1.06 | |
| Less distributions declared to shareholders | | | | | | | | | | | | | | | | | | | | | | | | |
From net investment income | | | $— | | | | $(0.45 | ) | | | $(0.52 | ) | | | $(0.48 | ) | | | $(0.67 | ) | | | $(0.72 | ) |
From net realized gain on investments | | | — | | | | (0.13 | ) | | | (0.00 | )(w) | | | — | | | | — | | | | — | |
Total distributions declared to shareholders | | | $— | | | | $(0.58 | ) | | | $(0.52 | ) | | | $(0.48 | ) | | | $(0.67 | ) | | | $(0.72 | ) |
Net asset value, end of period (x) | | | $13.18 | | | | $13.49 | | | | $13.72 | | | | $13.27 | | | | $13.14 | | | | $13.23 | |
Total return (%) (k)(r)(s)(x) | | | (2.30 | )(n) | | | 2.53 | | | | 7.40 | | | | 4.75 | | | | 4.49 | | | | 8.55 | |
Ratios (%) (to average net assets)
and Supplemental data: | | | | | | | | | | | | | | | | | | | | | | | | |
Expenses before expense reductions (f) | | | 0.59 | (a) | | | 0.60 | | | | 0.63 | | | | 0.64 | | | | 0.64 | | | | 0.65 | |
Expenses after expense reductions (f) | | | 0.59 | (a) | | | 0.60 | | | | N/A | | | | N/A | | | | N/A | | | | N/A | |
Net investment income | | | 1.70 | (a) | | | 2.33 | | | | 2.88 | | | | 3.39 | | | | 3.85 | | | | 4.31 | |
Portfolio turnover | | | 84 | (n) | | | 78 | | | | 29 | | | | 36 | | | | 36 | | | | 52 | |
Net assets at end of period (000 omitted) | | | $514,151 | | | | $537,397 | | | | $264,328 | | | | $227,694 | | | | $250,133 | | | | $266,170 | |
| | |
| Service Class | | Six months
ended
6/30/13 | | | Years ended 12/31 | |
| | | | 2012 | | | 2011 | | | 2010 | | | 2009 | | | 2008 | |
| | | (unaudited) | | | | | | | | | | | | | | | | |
Net asset value, beginning of period | | | $13.39 | | | | $13.62 | | | | $13.18 | | | | $13.06 | | | | $13.15 | | | | $12.81 | |
| Income (loss) from investment operations | | | | | | | | | | | | | | | | | | | | | | | | |
Net investment income (d) | | | $0.10 | | | | $0.29 | | | | $0.35 | | | | $0.41 | | | | $0.46 | | | | $0.52 | |
Net realized and unrealized gain (loss) on investments | | | (0.43 | ) | | | 0.02 | (g) | | | 0.57 | | | | 0.17 | | | | 0.08 | | | | 0.50 | |
Total from investment operations | | | $(0.33 | ) | | | $0.31 | | | | $0.92 | | | | $0.58 | | | | $0.54 | | | | $1.02 | |
| Less distributions declared to shareholders | | | | | | | | | | | | | | | | | | | | | | | | |
From net investment income | | | $— | | | | $(0.41 | ) | | | $(0.48 | ) | | | $(0.46 | ) | | | $(0.63 | ) | | | $(0.68 | ) |
From net realized gain on investments | | | — | | | | (0.13 | ) | | | (0.00 | )(w) | | | — | | | | — | | | | — | |
Total distributions declared to shareholders | | | $— | | | | $(0.54 | ) | | | $(0.48 | ) | | | $(0.46 | ) | | | $(0.63 | ) | | | $(0.68 | ) |
Net asset value, end of period (x) | | | $13.06 | | | | $13.39 | | | | $13.62 | | | | $13.18 | | | | $13.06 | | | | $13.15 | |
Total return (%) (k)(r)(s)(x) | | | (2.46 | )(n) | | | 2.27 | | | | 7.11 | | | | 4.49 | | | | 4.23 | | | | 8.29 | |
Ratios (%) (to average net assets)
and Supplemental data: | | | | | | | | | | | | | | | | | | | | | | | | |
Expenses before expense reductions (f) | | | 0.84 | (a) | | | 0.85 | | | | 0.88 | | | | 0.89 | | | | 0.89 | | | | 0.90 | |
Expenses after expense reductions (f) | | | 0.84 | (a) | | | 0.85 | | | | N/A | | | | N/A | | | | N/A | | | | N/A | |
Net investment income | | | 1.45 | (a) | | | 2.16 | | | | 2.64 | | | | 3.13 | | | | 3.54 | | | | 4.06 | |
Portfolio turnover | | | 84 | (n) | | | 78 | | | | 29 | | | | 36 | | | | 36 | | | | 52 | |
Net assets at end of period (000 omitted) | | | $379,067 | | | | $404,321 | | | | $420,164 | | | | $440,930 | | | | $417,263 | | | | $271,052 | |
See Notes to Financial Statements
10
MFS Government Securities Portfolio
Financial Highlights – continued
| (d) | | Per share data is based on average shares outstanding. |
| (f) | | Ratios do not reflect reductions from fees paid indirectly, if applicable. |
| (g) | | The per share amount varies from the net realized and unrealized gain/loss for the period because of the timing of sales of fund shares and the per share amount of realized and unrealized gains and losses at such time. |
| (k) | | The total return does not reflect expenses that apply to separate accounts. Inclusion of these charges would reduce the total return figures for all periods shown. |
| (r) | | Certain expenses have been reduced without which performance would have been lower. |
| (s) | | From time to time the fund may receive proceeds from litigation settlements, without which performance would be lower. |
| (w) | | Per share amount was less than $0.01. |
| (x) | | The net asset values per share and total returns have been calculated on net assets which include adjustments made in accordance with U.S. generally accepted accounting principles required at period end for financial reporting purposes. |
See Notes to Financial Statements
11
MFS Government Securities Portfolio
NOTES TO FINANCIAL STATEMENTS (unaudited)
| (1) | | Business and Organization |
MFS Government Securities Portfolio (the fund) is a series of MFS Variable Insurance Trust II (the trust). The trust is organized as a Massachusetts business trust and is registered under the Investment Company Act of 1940, as amended, as an open-end management investment company. The shareholders of each series of the trust are separate accounts of insurance companies, which offer variable annuity and/or life insurance products, and qualified retirement and pension plans.
| (2) | | Significant Accounting Policies |
General – The preparation of financial statements in conformity with U.S. generally accepted accounting principles requires management to make estimates and assumptions that affect the reported amounts of assets and liabilities, and disclosure of contingent assets and liabilities at the date of the financial statements and the reported amounts of revenues and expenses during the reporting period. Actual results could differ from those estimates. In the preparation of these financial statements, management has evaluated subsequent events occurring after the date of the fund’s Statement of Assets and Liabilities through the date that the financial statements were issued. The fund invests a significant portion of its assets in asset-backed and/or mortgage-backed securities. The value of these securities may depend, in part, on the issuer’s or borrower’s credit quality or ability to pay principal and interest when due and may fall if an issuer or borrower defaults on its obligation to pay principal or interest or if the instrument’s credit rating is downgraded by a credit rating agency. U.S. Government securities not supported as to the payment of principal or interest by the U.S. Treasury, such as those issued by Fannie Mae, Freddie Mac, and the Federal Home Loan Banks, are subject to greater credit risk than are U.S. Government securities supported by the U.S. Treasury, such as those issued by Ginnie Mae.
In this reporting period, the fund adopted the disclosure provisions of the Financial Accounting Standards Board (FASB) Accounting Standards Update 2011-11 (“ASU 2011-11”), Balance Sheet (Topic 210) – Disclosures about Offsetting Assets and Liabilities along with the related scope clarification provisions of FASB Accounting Standards Update 2013-01 (“ASU 2013-01”) entitled Balance Sheet (Topic 210) – Clarifying the Scope of Disclosures about Offsetting Assets and Liabilities. ASU 2011-11 is intended to enhance disclosures on the offsetting of financial assets and liabilities by requiring entities to disclose both gross and net information about financial instruments and transactions that are either offset in the statement of financial position or subject to a Master Netting Agreement or similar arrangement. ASU 2013-01 limits the scope of ASU 2011-11’s disclosure requirements on offsetting to financial assets and financial liabilities related to derivatives, repurchase and reverse repurchase agreements, and securities lending and securities borrowing transactions. The disclosures required by ASU 2011-11, to the extent applicable to the fund, have been included in the fund’s Significant Accounting Policies note under the captions for each of the fund’s in-scope financial instruments and transactions.
In June 2013, FASB issued Accounting Standards Update 2013-08 Financial Services – Investment Companies (Topic 946) – Amendments to the Scope, Measurement, and Disclosure Requirements (“ASU 2013-08”) which is effective for interim and annual reporting periods in fiscal years that begin after December 15, 2013. ASU 2013-08 sets forth a methodology for determining whether an entity should be characterized as an investment company and prescribes fair value accounting for an investment company’s non-controlling ownership interest in another investment company. FASB has determined that a fund registered under the Investment Company Act of 1940 automatically meets ASU 2013-08’s criteria for an investment company. Although still evaluating the potential impacts of ASU 2013-08 to the fund, management expects that the impact of the fund’s adoption will be limited to additional financial statement disclosures.
Investment Valuations – Debt instruments and floating rate loans (other than short-term instruments), including restricted debt instruments, are generally valued at an evaluated or composite bid as provided by a third-party pricing service. Short-term instruments with a maturity at issuance of 60 days or less generally are valued at amortized cost, which approximates market value. Open-end investment companies are generally valued at net asset value per share. Securities and other assets generally valued on the basis of information from a third-party pricing service may also be valued at a broker/dealer bid quotation. Values obtained from third-party pricing services can utilize both transaction data and market information such as yield, quality, coupon rate, maturity, type of issue, trading characteristics, and other market data.
The Board of Trustees has delegated primary responsibility for determining or causing to be determined the value of the fund’s investments (including any fair valuation) to the adviser pursuant to valuation policies and procedures approved by the Board. If the adviser determines that reliable market quotations are not readily available, investments are valued at fair value as determined in good faith by the adviser in accordance with such procedures under the oversight of the Board of Trustees. Under the fund’s valuation policies and procedures, market quotations are not considered to be readily available for most types of debt instruments and floating rate loans and many types of derivatives. These investments are generally valued at fair value based on information from third-party pricing services. In addition, investments may be valued at fair value if the adviser determines that an investment’s value has been materially affected by events occurring after the close of the exchange or market on which the investment is principally traded (such as foreign exchange or market) and prior to the determination of the fund’s net asset value, or after the halting of trading of a specific security where trading does not resume prior to the close of the exchange or market on which the security is principally traded. The adviser generally relies on third-party pricing services or other information (such as the correlation with price movements of similar securities in the same or other markets; the type, cost and investment characteristics of the security; the
12
MFS Government Securities Portfolio
Notes to Financial Statements (unaudited) – continued
business and financial condition of the issuer; and trading and other market data) to assist in determining whether to fair value and at what value to fair value an investment. The value of an investment for purposes of calculating the fund’s net asset value can differ depending on the source and method used to determine value. When fair valuation is used, the value of an investment used to determine the fund’s net asset value may differ from quoted or published prices for the same investment. There can be no assurance that the fund could obtain the fair value assigned to an investment if it were to sell the investment at the same time at which the fund determines its net asset value per share.
Various inputs are used in determining the value of the fund’s assets or liabilities. These inputs are categorized into three broad levels. In certain cases, the inputs used to measure fair value may fall into different levels of the fair value hierarchy. In such cases, an investment’s level within the fair value hierarchy is based on the lowest level of input that is significant to the fair value measurement. The fund’s assessment of the significance of a particular input to the fair value measurement in its entirety requires judgment, and considers factors specific to the investment. Level 1 includes unadjusted quoted prices in active markets for identical assets or liabilities. Level 2 includes other significant observable market-based inputs (including quoted prices for similar securities, interest rates, prepayment speed, and credit risk). Level 3 includes unobservable inputs, which may include the adviser’s own assumptions in determining the fair value of investments. The following is a summary of the levels used as of June 30, 2013 in valuing the fund’s assets or liabilities:
| | | | | | | | | | | | | | | | |
| Investments at Value | | Level 1 | | | Level 2 | | | Level 3 | | | Total | |
| U.S. Treasury Bonds & U.S. Government Agency & Equivalents | | | $— | | | | $403,055,034 | | | | $— | | | | $403,055,034 | |
| Municipal Bonds | | | — | | | | 2,033,618 | | | | — | | | | 2,033,618 | |
| U.S. Corporate Bonds | | | — | | | | 9,116,239 | | | | — | | | | 9,116,239 | |
| Residential Mortgage-Backed Securities | | | — | | | | 473,924,759 | | | | — | | | | 473,924,759 | |
| Commercial Mortgage-Backed Securities | | | — | | | | 17,445,519 | | | | — | | | | 17,445,519 | |
| Mutual Funds | | | 171,489,840 | | | | — | | | | — | | | | 171,489,840 | |
| Total Investments | | | $171,489,840 | | | | $905,575,169 | | | | $— | | | | $1,077,065,009 | |
For further information regarding security characteristics, see the Portfolio of Investments.
Indemnifications – Under the fund’s organizational documents, its officers and Trustees may be indemnified against certain liabilities and expenses arising out of the performance of their duties to the fund. Additionally, in the normal course of business, the fund enters into agreements with service providers that may contain indemnification clauses. The fund’s maximum exposure under these agreements is unknown as this would involve future claims that may be made against the fund that have not yet occurred.
Investment Transactions and Income – Investment transactions are recorded on the trade date. Interest income is recorded on the accrual basis. All premium and discount is amortized or accreted for financial statement purposes in accordance with U.S. generally accepted accounting principles. Interest payments received in additional securities are recorded on the ex-interest date in an amount equal to the value of the security on such date.
The fund may receive proceeds from litigation settlements. Any proceeds received from litigation involving portfolio holdings are reflected in the Statement of Operations in realized gain/loss if the security has been disposed of by the fund or in unrealized gain/loss if the security is still held by the fund. Any other proceeds from litigation not related to portfolio holdings are reflected as other income in the Statement of Operations.
The fund purchased or sold debt securities on a when-issued or delayed delivery basis, or in a “To Be Announced” (TBA) or “forward commitment” transaction with delivery or payment to occur at a later date beyond the normal settlement period. TBA securities resulting from these transactions are included in the Portfolio of Investments. At the time a fund enters into a commitment to purchase or sell a security, the transaction is recorded and the value of the security acquired is reflected in the fund’s net asset value. The price of such security and the date that the security will be delivered and paid for are fixed at the time the transaction is negotiated. The value of the security may vary with market fluctuations. TBA purchase commitments are held at carrying amount, which approximates fair value and are categorized as level 2 within the fair value hierarchy disclosure. No interest accrues to the fund until payment takes place. At the time that a fund enters into this type of transaction, the fund is required to have sufficient cash and/or liquid securities to cover its commitments. Losses may arise due to changes in the value of the underlying securities or if the counterparty does not perform under the contract’s terms, or if the issuer does not issue the securities due to political, economic or other factors. Additionally, losses may arise due to declines in the value of the securities prior to settlement date.
Fees Paid Indirectly – The fund’s custody fee may be reduced according to an arrangement that measures the value of cash deposited with the custodian by the fund. This amount, for the six months ended June 30, 2013, is shown as a reduction of total expenses in the Statement of Operations.
13
MFS Government Securities Portfolio
Notes to Financial Statements (unaudited) – continued
Tax Matters and Distributions – The fund intends to qualify as a regulated investment company, as defined under Subchapter M of the Internal Revenue Code, and to distribute all of its taxable income, including realized capital gains. As a result, no provision for federal income tax is required. The fund’s federal tax returns, when filed, will remain subject to examination by the Internal Revenue Service for a three year period.
Distributions to shareholders are recorded on the ex-dividend date. Income and capital gain distributions are determined in accordance with income tax regulations, which may differ from U.S. generally accepted accounting principles. Certain capital accounts in the financial statements are periodically adjusted for permanent differences in order to reflect their tax character. These adjustments have no impact on net assets or net asset value per share. Temporary differences which arise from recognizing certain items of income, expense, gain or loss in different periods for financial statement and tax purposes will reverse at some time in the future. Distributions in excess of net investment income or net realized gains are temporary overdistributions for financial statement purposes resulting from differences in the recognition or classification of income or distributions for financial statement and tax purposes.
Book/tax differences primarily relate to amortization and accretion of debt securities and wash sale loss deferrals.
The tax character of distributions declared to shareholders for the last fiscal year is as follows:
| | | | |
| | | 12/31/12 | |
| Ordinary income (including any short-term capital gains) | | | $23,925,510 | |
| Long-term capital gains | | | 1,794,016 | |
| Total distributions | | | $25,719,526 | |
The federal tax cost and the tax basis components of distributable earnings were as follows:
| | | | |
| As of 6/30/13 | | | | |
| Cost of investments | | | $1,070,732,704 | |
| Gross appreciation | | | 18,717,202 | |
| Gross depreciation | | | (12,384,897 | ) |
| Net unrealized appreciation (depreciation) | | | $6,332,305 | |
| |
| As of 12/31/12 | | | | |
| Undistributed ordinary income | | | 21,589,316 | |
| Undistributed long-term capital gain | | | 4,481,763 | |
| Other temporary differences | | | (69,733 | ) |
| Net unrealized appreciation (depreciation) | | | 32,213,462 | |
Multiple Classes of Shares of Beneficial Interest – The fund offers multiple classes of shares, which differ in their respective distribution and/or service fees. The fund’s income, realized and unrealized gain (loss), and common expenses are allocated to shareholders based on the daily net assets of each class. Dividends are declared separately for each class. Differences in per share dividend rates are generally due to differences in separate class expenses. The fund’s distributions declared to shareholders as reported in the Statements of Changes in Net Assets are presented by class as follows:
| | | | | | | | | | | | | | | | |
| | | From net investment
income | | | From net realized gain on
investments | |
| | | Six months ended
6/30/13 | | | Year ended
12/31/12 | | | Six months ended
6/30/13 | | | Year ended
12/31/12 | |
| Initial Class | | | $— | | | | $7,988,058 | | | | $— | | | | $2,260,778 | |
| Service Class | | | — | | | | 11,821,959 | | | | — | | | | 3,648,731 | |
| Total | | | $— | | | | $19,810,017 | | | | $— | | | | $5,909,509 | |
| (3) | | Transactions with Affiliates |
Investment Adviser – The fund has an investment advisory agreement with MFS to provide overall investment management and related administrative services and facilities to the fund. The management fee is computed daily and paid monthly at the following annual rates:
| | | | |
| First $1 billion of average daily net assets | | | 0.55% | |
| Average daily net assets in excess of $1 billion | | | 0.50% | |
Effective April 1, 2013, MFS has agreed in writing to reduce its management fee by a specified amount if certain MFS mutual fund assets exceed thresholds agreed to by MFS and the fund’s Board of Trustees. For the period April 1, 2013 through June 30, 2013, this management fee reduction amounted to $1,237, which is shown as a reduction of total expenses in the Statement of Operations. The management fee incurred for the six months ended June 30, 2013 was equivalent to an annual effective rate of 0.55% of the fund’s average daily net assets.
14
MFS Government Securities Portfolio
Notes to Financial Statements (unaudited) – continued
The investment adviser has agreed in writing to pay a portion of the fund’s total annual operating expenses, exclusive of interest, taxes, extraordinary expenses, brokerage and transaction costs, and investment-related expenses such that total annual operating expenses do not exceed 0.61% of average daily net assets for the Initial Class shares and 0.86% of average daily net assets for the Service Class shares. This written agreement will continue until modified by the fund’s Board of Trustees, but such agreement will continue at least until April 30, 2015. For the six months ended June 30, 2013, the fund’s actual operating expenses did not exceed the limit and therefore, the investment adviser did not pay any portion of the fund’s expenses related to this agreement.
Distributor – MFS Fund Distributors, Inc. (MFD), a wholly-owned subsidiary of MFS, is the distributor of shares of the fund. The Trustees have adopted a distribution plan for the Service Class shares pursuant to Rule 12b-1 under the Investment Company Act of 1940.
The fund’s distribution plan provides that the fund will pay MFD distribution and/or service fees equal to 0.25% per annum of its average daily net assets attributable to Service Class shares as partial consideration for services performed and expenses incurred by MFD and financial intermediaries (including participating insurance companies that invest in the fund to fund variable annuity and variable life insurance contracts, sponsors of qualified retirement and pension plans that invest in the fund, and affiliates of these participating insurance companies and plan sponsors) in connection with the sale and distribution of the Service Class shares. MFD may subsequently pay all, or a portion, of the distribution and/or service fees to financial intermediaries.
Shareholder Servicing Agent – Effective April 1, 2013, MFS Service Center, Inc. (MFSC), a wholly-owned subsidiary of MFS, receives a fee from the fund for its services as shareholder servicing agent. For the period from April 1, 2013 through June 30, 2013, the fee was $4,125, which equated to 0.0009% annually of the fund’s average daily net assets. MFSC also receives payment from the fund for out-of-pocket expenses paid by MFSC on behalf of the fund. For the period from April 1, 2013 through June 30, 2013, these costs amounted to $10.
Administrator – MFS provides certain financial, legal, shareholder communications, compliance, and other administrative services to the fund. Under an administrative services agreement, the fund partially reimburses MFS the costs incurred to provide these services. The fund is charged an annual fixed amount of $17,500 plus a fee based on average daily net assets. The administrative services fee incurred for the six months ended June 30, 2013 was equivalent to an annual effective rate of 0.0137% of the fund’s average daily net assets.
Trustees’ and Officers’ Compensation – The fund pays compensation to independent Trustees in the form of a retainer, attendance fees, and additional compensation to Board and Committee chairpersons. The fund does not pay compensation directly to Trustees or officers of the fund who are also officers of the investment adviser, all of whom receive remuneration for their services to the fund from MFS. Certain officers and Trustees of the fund are officers or directors of MFS, MFD, and MFSC.
Other – This fund and certain other funds managed by MFS (the funds) have entered into services agreements (the Agreements) which provide for payment of fees by the funds to Tarantino LLC and Griffin Compliance LLC in return for the provision of services of an Independent Chief Compliance Officer (ICCO) and Assistant ICCO, respectively, for the funds. The ICCO and Assistant ICCO are officers of the funds and the sole members of Tarantino LLC and Griffin Compliance LLC, respectively. The funds can terminate the Agreements with Tarantino LLC and Griffin Compliance LLC at any time under the terms of the Agreements. For the six months ended June 30, 2013, the aggregate fees paid by the fund to Tarantino LLC and Griffin Compliance LLC were $3,598 and are included in “Miscellaneous” expense in the Statement of Operations. MFS has agreed to reimburse the fund for a portion of the payments made by the fund in the amount of $1,755, which is shown as a reduction of total expenses in the Statement of Operations. Additionally, MFS has agreed to bear all expenses associated with office space, other administrative support, and supplies provided to the ICCO and Assistant ICCO.
The fund invests in the MFS Institutional Money Market Portfolio which is managed by MFS and seeks current income consistent with preservation of capital and liquidity. Income earned on this investment is included in “Dividends from underlying affiliated funds” in the Statement of Operations. This money market fund does not pay a management fee to MFS.
Purchases and sales of investments, other than short-term obligations, were as follows:
| | | | | | | | |
| | | Purchases | | | Sales | |
| U.S. Government securities | | | $795,741,593 | | | | $753,220,762 | |
| Investments (non-U.S. Government securities) | | | $12,758,449 | | | | $1,488,436 | |
15
MFS Government Securities Portfolio
Notes to Financial Statements (unaudited) – continued
| (5) | | Shares of Beneficial Interest |
The fund’s Declaration of Trust permits the Trustees to issue an unlimited number of full and fractional shares of beneficial interest. Transactions in fund shares were as follows:
| | | | | | | | | | | | | | | | |
| | | Six months ended 6/30/13 | | | Year ended 12/31/12 | |
| | | Shares | | | Amount | | | Shares | | | Amount | |
| Shares sold | | | | | | | | | | | | | | | | |
Initial Class | | | 1,231,521 | | | | $16,505,155 | | | | 22,950,076 | | | | $310,242,152 | |
Service Class | | | 1,901,765 | | | | 25,217,788 | | | | 4,062,154 | | | | 54,796,819 | |
| | | 3,133,286 | | | | $41,722,943 | | | | 27,012,230 | | | | $365,038,971 | |
| Shares issued to shareholders in reinvestment of distributions | | | | | | | | | | | | | | | | |
Initial Class | | | — | | | | $— | | | | 764,268 | | | | $10,248,836 | |
Service Class | | | — | | | | — | | | | 1,161,463 | | | | 15,470,690 | |
| | | — | | | | $— | | | | 1,925,731 | | | | $25,719,526 | |
| Shares reacquired | | | | | | | | | | | | | | | | |
Initial Class | | | (2,044,223 | ) | | | $(27,412,816 | ) | | | (3,144,680 | ) | | | $(43,168,053 | ) |
Service Class | | | (3,074,995 | ) | | | (40,895,677 | ) | | | (5,878,104 | ) | | | (80,114,536 | ) |
| | | (5,119,218 | ) | | | $(68,308,493 | ) | | | (9,022,784 | ) | | | $(123,282,589 | ) |
| Net change | | | | | | | | | | | | | | | | |
Initial Class | | | (812,702 | ) | | | $(10,907,661 | ) | | | 20,569,664 | | | | $277,322,935 | |
Service Class | | | (1,173,230 | ) | | | (15,677,889 | ) | | | (654,487 | ) | | | (9,847,027 | ) |
| | | (1,985,932 | ) | | | $(26,585,550 | ) | | | 19,915,177 | | | | $267,475,908 | |
The fund is one of several mutual funds in which the MFS funds-of-funds may invest. The MFS funds-of-funds do not invest in the underlying MFS funds for the purpose of exercising management or control. At the end of the period, the MFS Conservative Allocation Portfolio and the MFS Moderate Allocation Portfolio were the owners of record of approximately 10% and 22%, respectively, of the value of outstanding voting shares of the fund.
The fund and certain other funds managed by MFS participate in a $1.1 billion unsecured committed line of credit, subject to a $1 billion sublimit, provided by a syndication of banks under a credit agreement. Borrowings may be made for temporary financing needs. Interest is charged to each fund, based on its borrowings, generally at a rate equal to the higher of the Federal Reserve funds rate or one month LIBOR plus an agreed upon spread. A commitment fee, based on the average daily, unused portion of the committed line of credit, is allocated among the participating funds at the end of each calendar quarter. In addition, the fund and other funds managed by MFS have established unsecured uncommitted borrowing arrangements with certain banks for temporary financing needs. Interest is charged to each fund, based on its borrowings, at a rate equal to the Federal Reserve funds rate plus an agreed upon spread. For the six months ended June 30, 2013, the fund’s commitment fee and interest expense were $2,396 and $0, respectively, and are included in “Miscellaneous” expense in the Statement of Operations.
| (7) | | Transactions in Underlying Affiliated Funds – Affiliated Issuers |
An affiliated issuer may be considered one in which the fund owns 5% or more of the outstanding voting securities, or a company which is under common control. For the purposes of this report, the fund assumes the following to be an affiliated issuer:
| | | | | | | | | | | | | | | | |
| Underlying Affiliated Fund | | Beginning
Shares/Par Amount | | | Acquisitions
Shares/Par
Amount | | | Dispositions
Shares/Par
Amount | | | Ending Shares/Par
Amount | |
| MFS Institutional Money Market Portfolio | | | 254,827,213 | | | | 114,979,459 | | | | (198,316,832 | ) | | | 171,489,840 | |
| | | | |
| Underlying Affiliated Fund | | Realized Gain (Loss) | | | Capital Gain Distributions | | | Dividend Income | | | Ending Value | |
| MFS Institutional Money Market Portfolio | | | $— | | | | $— | | | | $142,810 | | | | $171,489,840 | |
16
MFS Government Securities Portfolio
BOARD REVIEW OF INVESTMENT ADVISORY AGREEMENT
A discussion regarding the Board’s most recent review and renewal of the fund’s Investment Advisory Agreement with MFS will be available on or about November 1, 2013 by clicking on the fund’s name under “Variable Insurance Portfolios — VIT II” in the “Products” section of the MFS Web site (mfs.com).
PROXY VOTING POLICIES AND INFORMATION
A general description of the MFS funds’ proxy voting policies and procedures is available without charge, upon request, by calling 1-800-225-2606, by visiting the Proxy Voting section of mfs.com or by visiting the SEC’s Web site at http://www.sec.gov.
Information regarding how the fund voted proxies relating to portfolio securities during the most recent twelve-month period ended June 30 is available without charge by visiting the Proxy Voting section of mfs.com or by visiting the SEC’s Web site at http://www.sec.gov.
QUARTERLY PORTFOLIO DISCLOSURE
The fund will file a complete schedule of portfolio holdings with the Securities and Exchange Commission (the Commission) for the first and third quarters of each fiscal year on Form N-Q. The fund’s Form N-Q is available on the EDGAR database on the Commission’s Internet Web site at http://www.sec.gov, and may be reviewed and copied at the:
Public Reference Room
Securities and Exchange Commission
100 F Street, NE, Room 1580
Washington, D.C. 20549
Information on the operation of the Public Reference Room may be obtained by calling the Commission at 1-800-SEC-0330. Copies of the fund’s Form N-Q also may be obtained, upon payment of a duplicating fee, by electronic request at the following e-mail address: publicinfo@sec.gov or by writing the Public Reference Section at the above address.
FURTHER INFORMATION
From time to time, MFS may post important information about the fund or the MFS funds on the MFS web site (mfs.com). This information is available by visiting the “News & Commentary” section of mfs.com or by clicking on the fund’s name under “Variable Insurance Portfolios — VIT II” in the “Products” section of mfs.com.
17
SEMIANNUAL REPORT
June 30, 2013

MFS® TOTAL RETURN PORTFOLIO
MFS® Variable Insurance Trust II

TRS-SEM
MFS® TOTAL RETURN PORTFOLIO
CONTENTS
The report is prepared for the general information of contract owners. It is authorized for distribution to prospective investors only when preceded or accompanied by a current prospectus.
NOT FDIC INSURED Ÿ MAY LOSE VALUE Ÿ NO BANK OR CREDIT UNION GUARANTEE Ÿ NOT A DEPOSIT Ÿ NOT INSURED BY ANY FEDERAL GOVERNMENT AGENCY OR NCUA/NCUSIF
MFS Total Return Portfolio
LETTER FROM THE CHAIRMAN AND CEO

Dear Contract Owners:
As the year progresses, the global economy continues to grind ahead slowly, held back by broad austerity measures. The U.S. economy remains a steadying force, driven by resilient consumers, who have taken the payroll tax increase and the sequestration’s early impact in stride. With U.S. housing and jobs showing steady expansion, domestic consumer-driven growth has offset weaker exports and the U.S. government’s spending constraints. In response to these developments, the U.S. Federal Reserve has begun to brace investors for an eventual shift in its monetary policy, causing global market tremors.
Japan has been another bright spot, with government and central bank stimulus policies leading to increased exports, a resurgent stock market and improved economic sentiment. After a six-month rally, Japan’s stocks slipped late in the second quarter, then picked up momentum on fresh signs that the country could soon break free of its chronic deflation. The major deterrent to global growth remains the eurozone, still in the grip of persistent recession. China has seen its pace of economic growth decelerate, a troubling turn for the country’s trading partners, who have come to rely on it as an engine for global growth.
As always, managing risk in the face of uncertainty remains a top priority for investors. At MFS®, our uniquely collaborative investment process employs integrated, global research and active risk management. Our global team of investment professionals shares ideas and evaluates opportunities across continents, investment disciplines and asset classes — all with a goal of building better insights, and ultimately better results, for our clients.
We are mindful of the many economic challenges investors face, and believe it is more important than ever to maintain a long-term view and employ time-tested principles, such as asset allocation and diversification. We remain confident that our unique approach can serve investors well as they work with their financial advisors to identify and pursue the most suitable opportunities.
Respectfully,

Robert J. Manning
Chairman and Chief Executive Officer
MFS Investment Management®
August 16, 2013
The opinions expressed in this letter are subject to change, may not be relied upon for investment advice, and no forecasts can be guaranteed.
1
MFS Total Return Portfolio
PORTFOLIO COMPOSITION
Portfolio structure (i)
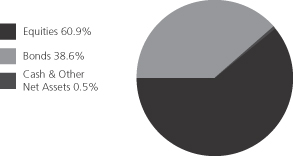
| | | | |
| Top ten holdings (i) | | | | |
| U.S. Treasury Notes, 0.875%, 2016 | | | 3.8% | |
| JPMorgan Chase & Co. | | | 2.2% | |
| Johnson & Johnson | | | 1.8% | |
| Exxon Mobil Corp. | | | 1.8% | |
| Philip Morris International, Inc. | | | 1.8% | |
| Pfizer, Inc. | | | 1.7% | |
| U.S. Treasury Bonds, 4.5%, 2039 | | | 1.6% | |
| Wells Fargo & Co. | | | 1.5% | |
| Fannie Mae, 5.5%, 30 Years | | | 1.4% | |
| Fannie Mae, 3.5%, 30 Years | | | 1.4% | |
|
| Composition including fixed income credit quality (a)(i) | |
| AAA | | | 1.8% | |
| AA | | | 1.3% | |
| A | | | 4.5% | |
| BBB | | | 5.7% | |
| BB | | | 0.4% | |
| CCC (o) | | | 0.0% | |
| CC | | | 0.1% | |
| C (o) | | | 0.0% | |
| U.S. Government | | | 11.3% | |
| Federal Agencies | | | 13.5% | |
| Not Rated (o) | | | 0.0% | |
| Non-Fixed Income | | | 60.9% | |
| Cash & Other | | | 0.5% | |
| | | | |
| Equity sectors | | | | |
| Financial Services | | | 13.2% | |
| Health Care | | | 7.7% | |
| Consumer Staples | | | 6.4% | |
| Energy | | | 5.8% | |
| Industrial Goods & Services | | | 5.5% | |
| Utilities & Communications | | | 4.5% | |
Leisure | | | 4.3% | |
| Technology | | | 4.2% | |
| Retailing | | | 3.2% | |
| Basic Materials | | | 2.5% | |
| Autos & Housing | | | 2.1% | |
| Transportation | | | 0.8% | |
| Special Products & Services | | | 0.7% | |
| |
| Fixed income sectors (i) | | | | |
| Mortgage-Backed Securities | | | 13.1% | |
| U.S. Treasury Securities | | | 11.3% | |
| High Grade Corporates | | | 9.1% | |
| Commercial Mortgage-Backed Securities | | | 2.3% | |
| Emerging Markets Bonds | | | 1.2% | |
| Non-U.S. Government Bonds | | | 0.7% | |
| U.S. Government Agencies | | | 0.4% | |
| High Yield Corporates | | | 0.2% | |
| Asset-Backed Securities | | | 0.2% | |
| Collateralized Debt Obligations | | | 0.1% | |
| Residential Mortgage-Backed Securities (o) | | | 0.0% | |
| (a) | For all securities other than those specifically described below, ratings are assigned to underlying securities utilizing ratings from Moody’s, Fitch, and Standard & Poor’s rating agencies and applying the following hierarchy: If all three agencies provide a rating, the middle rating (after dropping the highest and lowest ratings) is assigned; if two of the three agencies rate a security, the lower of the two is assigned. Ratings are shown in the S&P and Fitch scale (e.g., AAA). Securities rated BBB or higher are considered investment grade. All ratings are subject to change. U.S. Government includes securities issued by the U.S. Department of the Treasury. Federal Agencies includes rated and unrated U.S. Agency fixed-income securities, U.S. Agency mortgage-backed securities, and collateralized mortgage obligations of U.S. Agency mortgage-backed securities. Not Rated includes fixed income securities, including fixed income futures contracts, which have not been rated by any rating agency. Non-Fixed Income includes equity securities (including convertible bonds and equity derivatives) and commodities. Cash & Other includes cash, other assets less liabilities, offsets to derivative positions, and short-term securities. The fund may not hold all of these instruments. The fund is not rated by these agencies. |
| (i) | For purposes of this presentation, the components include the market value of securities, and reflect the impact of the equivalent exposure of derivative positions, if any. These amounts may be negative from time to time. Equivalent exposure is a calculated amount that translates the derivative position into a reasonable approximation of the amount of the underlying asset that the portfolio would have to hold at a given point in time to have the same price sensitivity that results from the portfolio’s ownership of the derivative contract. When dealing with derivatives, equivalent exposure is a more representative measure of the potential impact of a position on portfolio performance than market value. The bond component will include any accrued interest amounts. |
2
MFS Total Return Portfolio
Portfolio Composition – continued
Where the fund holds convertible bonds, these are treated as part of the equity portion of the portfolio.
Percentages are based on net assets as of 6/30/13.
The portfolio is actively managed and current holdings may be different.
3
MFS Total Return Portfolio
EXPENSE TABLE
Fund Expenses Borne by the Contract Holders During the Period,
January 1, 2013 through June 30, 2013
As a contract holder of the fund, you incur ongoing costs, including management fees; distribution and/or service (12b-1) fees; and other fund expenses. This example is intended to help you understand your ongoing costs (in dollars) of investing in the fund and to compare these costs with the ongoing costs of investing in other mutual funds.
The example is based on an investment of $1,000 invested at the beginning of the period and held for the entire period January 1, 2013 through June 30, 2013.
Actual Expenses
The first line for each share class in the following table provides information about actual account values and actual expenses. You may use the information in this line, together with the amount you invested, to estimate the expenses that you paid over the period. Simply divide your account value by $1,000 (for example, an $8,600 account value divided by $1,000 = 8.6), then multiply the result by the number in the first line under the heading entitled “Expenses Paid During Period” to estimate the expenses you paid on your account during this period.
Hypothetical Example for Comparison Purposes
The second line for each share class in the following table provides information about hypothetical account values and hypothetical expenses based on the fund’s actual expense ratio and an assumed rate of return of 5% per year before expenses, which is not the fund’s actual return. The hypothetical account values and expenses may not be used to estimate the actual ending account balance or expenses you paid for the period. You may use this information to compare the ongoing costs of investing in the fund and other funds. To do so, compare this 5% hypothetical example with the 5% hypothetical examples that appear in the shareholder reports of the other funds.
Please note that the expenses shown in the table are meant to highlight the fund’s ongoing costs only and do not take into account the fees and expenses imposed under the variable contracts through which your investment in the fund is made. Therefore, the second line for each share class in the table is useful in comparing ongoing costs associated with an investment in vehicles (such as the fund) which fund benefits under variable annuity and variable life insurance contracts and to qualified pension and retirement plans only, and will not help you determine the relative total costs of investing in the fund through variable annuity and variable life insurance contracts. If the fees and expenses imposed under the variable contracts were included, your costs would have been higher.
| | | | | | | | | | | | | | | | | | |
| Share Class | | | | Annualized
Expense Ratio | | | Beginning
Account Value
1/01/13 | | | Ending
Account Value
6/30/13 | | | Expenses Paid
During Period (p)
1/01/13-6/30/13 | |
| Initial Class | | Actual | | | 0.72% | | | | $1,000.00 | | | | $1,083.75 | | | | $3.72 | |
| | Hypothetical (h) | | | 0.72% | | | | $1,000.00 | | | | $1,021.22 | | | | $3.61 | |
| Service Class | | Actual | | | 0.97% | | | | $1,000.00 | | | | $1,082.35 | | | | $5.01 | |
| | Hypothetical (h) | | | 0.97% | | | | $1,000.00 | | | | $1,019.98 | | | | $4.86 | |
| (h) | 5% class return per year before expenses. |
| (p) | Expenses paid are equal to each class’s annualized expense ratio, as shown above, multiplied by the average account value over the period, multiplied by the number of days in the period, divided by the number of days in the year. |
4
MFS Total Return Portfolio
PORTFOLIO OF INVESTMENTS – 6/30/13 (unaudited)
The Portfolio of Investments is a complete list of all securities owned by your fund. It is categorized by broad-based asset classes.
| | | | | | | | |
| Issuer | | Shares/Par | | | Value ($) | |
| | | | | | | | |
| COMMON STOCKS – 60.5% | |
| Aerospace – 3.4% | |
| General Dynamics Corp. | | | 18,340 | | | $ | 1,436,572 | |
| Honeywell International, Inc. | | | 136,740 | | | | 10,848,951 | |
| Lockheed Martin Corp. | | | 147,920 | | | | 16,043,402 | |
| Northrop Grumman Corp. | | | 29,923 | | | | 2,477,622 | |
| Precision Castparts Corp. | | | 6,480 | | | | 1,464,542 | |
| United Technologies Corp. | | | 107,617 | | | | 10,001,922 | |
| | | | | | | | |
| | | | | | $ | 42,273,011 | |
| | | | | | | | |
| Airlines – 0.1% | | | | | | | | |
| Copa Holdings S.A., “A” | | | 9,839 | | | $ | 1,290,090 | |
| | | | | | | | |
| Alcoholic Beverages – 0.5% | |
| Diageo PLC | | | 221,941 | | | $ | 6,365,984 | |
| | | | | | | | |
| Automotive – 1.6% | |
| Delphi Automotive PLC | | | 170,180 | | | $ | 8,626,422 | |
| General Motors Co. (a) | | | 90,290 | | | | 3,007,560 | |
| Johnson Controls, Inc. | | | 141,421 | | | | 5,061,456 | |
| Magna International, Inc. | | | 49,440 | | | | 3,519,139 | |
| | | | | | | | |
| | | | | | $ | 20,214,577 | |
| | | | | | | | |
| Broadcasting – 1.6% | |
| News Corp., “A” | | | 39,787 | | | $ | 1,297,056 | |
| Omnicom Group, Inc. | | | 73,237 | | | | 4,604,410 | |
| Time Warner, Inc. | | | 36,820 | | | | 2,128,932 | |
| Viacom, Inc., “B” | | | 47,010 | | | | 3,199,031 | |
| Walt Disney Co. | | | 133,791 | | | | 8,448,902 | |
| | | | | | | | |
| | | | | | $ | 19,678,331 | |
| | | | | | | | |
| Brokerage & Asset Managers – 0.7% | |
| BlackRock, Inc. | | | 16,273 | | | $ | 4,179,720 | |
| Franklin Resources, Inc. | | | 30,189 | | | | 4,106,308 | |
| NASDAQ OMX Group, Inc. | | | 17,004 | | | | 557,561 | |
| | | | | | | | |
| | | | | | $ | 8,843,589 | |
| | | | | | | | |
| Business Services – 0.7% | |
| Accenture PLC, “A” | | | 82,667 | | | $ | 5,948,717 | |
| Dun & Bradstreet Corp. | | | 7,230 | | | | 704,564 | |
| Fidelity National Information Services, Inc. | | | 9,307 | | | | 398,712 | |
| Fiserv, Inc. (a) | | | 14,153 | | | | 1,237,114 | |
| | | | | | | | |
| | | | | | $ | 8,289,107 | |
| | | | | | | | |
| Cable TV – 1.4% | | | | | | | | |
| Comcast Corp., “Special A” | | | 261,300 | | | $ | 10,365,771 | |
| Time Warner Cable, Inc. | | | 61,430 | | | | 6,909,646 | |
| | | | | | | | |
| | | | | | $ | 17,275,417 | |
| | | | | | | | |
| Chemicals – 1.5% | | | | | | | | |
| 3M Co. | | | 83,210 | | | $ | 9,099,014 | |
| Celanese Corp. | | | 32,884 | | | | 1,473,203 | |
| LyondellBasell Industries N.V., “A” | | | 21,220 | | | | 1,406,037 | |
| PPG Industries, Inc. | | | 49,801 | | | | 7,291,364 | |
| | | | | | | | |
| | | | | | $ | 19,269,618 | |
| | | | | | | | |
| | | | | | | | |
| Issuer | | Shares/Par | | | Value ($) | |
| | | | | | | | |
| COMMON STOCKS – continued | |
| Computer Software – 1.2% | |
| CA, Inc. | | | 31,570 | | | $ | 903,849 | |
| Microsoft Corp. | | | 205,950 | | | | 7,111,454 | |
| Oracle Corp. | | | 184,260 | | | | 5,660,467 | |
| Symantec Corp. | | | 48,940 | | | | 1,099,682 | |
| | | | | | | | |
| | | | | | $ | 14,775,452 | |
| | | | | | | | |
| Computer Software – Systems – 1.8% | |
| Apple, Inc. | | | 8,285 | | | $ | 3,281,523 | |
| Canon, Inc. | | | 60,100 | | | | 1,973,906 | |
| Hewlett-Packard Co. | | | 353,520 | | | | 8,767,296 | |
| International Business Machines Corp. | | | 33,899 | | | | 6,478,438 | |
| Western Digital Corp. | | | 27,390 | | | | 1,700,645 | |
| | | | | | | | |
| | | | | | $ | 22,201,808 | |
| | | | | | | | |
| Construction – 0.3% | |
| Stanley Black & Decker, Inc. | | | 44,491 | | | $ | 3,439,154 | |
| | | | | | | | |
| Consumer Products – 0.8% | |
| Nu Skin Enterprises, Inc., “A” | | | 23,550 | | | $ | 1,439,376 | |
| Procter & Gamble Co. | | | 88,334 | | | | 6,800,835 | |
| Reckitt Benckiser Group PLC | | | 21,314 | | | | 1,510,948 | |
| | | | | | | | |
| | | | | | $ | 9,751,159 | |
| | | | | | | | |
| Containers – 0.1% | |
| Packaging Corp. of America | | | 19,380 | | | $ | 948,845 | |
| | | | | | | | |
| Electrical Equipment – 1.3% | |
| Danaher Corp. | | | 149,631 | | | $ | 9,471,642 | |
| Pentair Ltd. | | | 23,190 | | | | 1,337,831 | |
| Siemens AG | | | 18,525 | | | | 1,872,379 | |
| Tyco International Ltd. | | | 119,751 | | | | 3,945,795 | |
| | | | | | | | |
| | | | | | $ | 16,627,647 | |
| | | | | | | | |
| Electronics – 0.8% | |
| Hoya Corp. | | | 48,500 | | | $ | 995,157 | |
| Intel Corp. | | | 73,577 | | | | 1,782,035 | |
| Microchip Technology, Inc. | | | 152,880 | | | | 5,694,780 | |
| Taiwan Semiconductor Manufacturing Co. Ltd., ADR | | | 102,060 | | | | 1,869,739 | |
| | | | | | | | |
| | | | | | $ | 10,341,711 | |
| | | | | | | | |
| Energy – Independent – 2.4% | |
| Anadarko Petroleum Corp. | | | 43,017 | | | $ | 3,696,451 | |
| Apache Corp. | | | 54,873 | | | | 4,600,004 | |
| Canadian Natural Resources Ltd. | | | 40,484 | | | | 1,144,078 | |
| EOG Resources, Inc. | | | 12,393 | | | | 1,631,910 | |
| EQT Corp. | | | 25,280 | | | | 2,006,474 | |
| HollyFrontier Corp. | | | 55,960 | | | | 2,393,969 | |
| Marathon Petroleum Corp. | | | 26,890 | | | | 1,910,803 | |
| Noble Energy, Inc. | | | 69,058 | | | | 4,146,242 | |
| Occidental Petroleum Corp. | | | 70,887 | | | | 6,325,247 | |
| Valero Energy Corp. | | | 59,800 | | | | 2,079,246 | |
| | | | | | | | |
| | | | | | $ | 29,934,424 | |
| | | | | | | | |
5
MFS Total Return Portfolio
Portfolio of Investments (unaudited) – continued
| | | | | | | | |
| Issuer | | Shares/Par | | | Value ($) | |
| | | | | | | | |
| COMMON STOCKS – continued | |
| Energy – Integrated – 3.2% | |
| Chevron Corp. | | | 126,480 | | | $ | 14,967,643 | |
| Exxon Mobil Corp. | | | 243,598 | | | | 22,009,079 | |
| Royal Dutch Shell PLC, “A” | | | 107,070 | | | | 3,416,732 | |
| | | | | | | | |
| | | | | | $ | 40,393,454 | |
| | | | | | | | |
| Engineering – Construction – 0.1% | |
| Fluor Corp. | | | 24,286 | | | $ | 1,440,403 | |
| | | | | | | | |
| Food & Beverages – 2.3% | |
| Coca-Cola Co. | | | 46,124 | | | $ | 1,850,034 | |
| Coca-Cola Enterprises, Inc. | | | 23,980 | | | | 843,137 | |
| Dr Pepper Snapple Group, Inc. | | | 25,950 | | | | 1,191,884 | |
| General Mills, Inc. | | | 143,780 | | | | 6,977,643 | |
| Groupe Danone | | | 58,277 | | | | 4,373,870 | |
| Ingredion, Inc. | | | 17,040 | | | | 1,118,165 | |
| J.M. Smucker Co. | | | 6,900 | | | | 711,735 | |
| Kellogg Co. | | | 14,133 | | | | 907,763 | |
| Kraft Foods Group, Inc. | | | 9,327 | | | | 521,099 | |
| Mondelez International, Inc. | | | 50,947 | | | | 1,453,518 | |
| Nestle S.A. | | | 103,064 | | | | 6,741,048 | |
| PepsiCo, Inc. | | | 10,730 | | | | 877,607 | |
| Tyson Foods, Inc., “A” | | | 53,120 | | | | 1,364,122 | |
| | | | | | | | |
| | | | | | $ | 28,931,625 | |
| | | | | | | | |
| Food & Drug Stores – 1.7% | |
| CVS Caremark Corp. | | | 196,096 | | | $ | 11,212,769 | |
| Kroger Co. | | | 146,860 | | | | 5,072,544 | |
| Safeway, Inc. | | | 43,760 | | | | 1,035,362 | |
| Walgreen Co. | | | 97,770 | | | | 4,321,434 | |
| | | | | | | | |
| | | | | | $ | 21,642,109 | |
| | | | | | | | |
| Gaming & Lodging – 0.1% | |
| Wynn Resorts Ltd. | | | 10,790 | | | $ | 1,381,120 | |
| | | | | | | | |
| General Merchandise – 1.3% | |
| Kohl’s Corp. | | | 56,701 | | | $ | 2,863,968 | |
| Macy’s, Inc. | | | 83,350 | | | | 4,000,800 | |
| Target Corp. | | | 141,640 | | | | 9,753,330 | |
| | | | | | | | |
| | | | | | $ | 16,618,098 | |
| | | | | | | | |
| Health Maintenance Organizations – 0.1% | |
| Aetna, Inc. | | | 9,860 | | | $ | 626,504 | |
| | | | | | | | |
| Insurance – 4.3% | |
| ACE Ltd. | | | 84,237 | | | $ | 7,537,527 | |
| American International Group, Inc. (a) | | | 75,160 | | | | 3,359,652 | |
| Aon PLC | | | 65,040 | | | | 4,185,324 | |
| Chubb Corp. | | | 20,150 | | | | 1,705,698 | |
| Delta Lloyd N.V. | | | 131,380 | | | | 2,617,377 | |
| MetLife, Inc. | | | 276,250 | | | | 12,641,200 | |
| Prudential Financial, Inc. | | | 147,460 | | | | 10,769,004 | |
| Swiss Re Ltd. | | | 15,370 | | | | 1,138,556 | |
| Travelers Cos., Inc. | | | 71,177 | | | | 5,688,466 | |
| Validus Holdings Ltd. | | | 96,720 | | | | 3,493,526 | |
| Zurich Insurance Group AG | | | 3,073 | | | | 796,395 | |
| | | | | | | | |
| | | | | | $ | 53,932,725 | |
| | | | | | | | |
| | | | | | | | |
| Issuer | | Shares/Par | | | Value ($) | |
| | | | | | | | |
| COMMON STOCKS – continued | |
| Internet – 0.4% | |
| Google, Inc., “A” (a) | | | 3,775 | | | $ | 3,323,397 | |
| Yahoo!, Inc. (a) | | | 49,950 | | | | 1,254,245 | |
| | | | | | | | |
| | | | | | $ | 4,577,642 | |
| | | | | | | | |
| Leisure & Toys – 0.7% | |
| Activision Blizzard, Inc. | | | 231,520 | | | $ | 3,301,475 | |
| Hasbro, Inc. | | | 64,957 | | | | 2,912,022 | |
| Mattel, Inc. | | | 33,240 | | | | 1,506,104 | |
| Polaris Industries, Inc. | | | 9,690 | | | | 920,550 | |
| | | | | | | | |
| | | | | | $ | 8,640,151 | |
| | | | | | | | |
| Machinery & Tools – 0.7% | |
| Cummins, Inc. | | | 21,798 | | | $ | 2,364,211 | |
| Eaton Corp. PLC | | | 68,811 | | | | 4,528,452 | |
| Illinois Tool Works, Inc. | | | 31,930 | | | | 2,208,598 | |
| | | | | | | | |
| | | | | | $ | 9,101,261 | |
| | | | | | | | |
| Major Banks – 6.9% | |
| Bank of America Corp. | | | 249,828 | | | $ | 3,212,788 | |
| Bank of New York Mellon Corp. | | | 273,529 | | | | 7,672,488 | |
| BOC Hong Kong Holdings Ltd. | | | 300,500 | | | | 917,750 | |
| Goldman Sachs Group, Inc. | | | 61,866 | | | | 9,357,233 | |
| JPMorgan Chase & Co. | | | 525,444 | | | | 27,738,189 | |
| Mizuho Financial Group, Inc. | | | 1,224,400 | | | | 2,548,417 | |
| Morgan Stanley | | | 80,354 | | | | 1,963,048 | |
| PNC Financial Services Group, Inc. | | | 45,126 | | | | 3,290,588 | |
| State Street Corp. | | | 89,694 | | | | 5,848,946 | |
| Sumitomo Mitsui Financial Group, Inc. | | | 38,400 | | | | 1,761,645 | |
| Wells Fargo & Co. | | | 458,360 | | | | 18,916,517 | |
| Westpac Banking Corp. | | | 79,840 | | | | 2,090,162 | |
| | | | | | | | |
| | | | | | $ | 85,317,771 | |
| | | | | | | | |
| Medical & Health Technology & Services – 0.5% | |
| AmerisourceBergen Corp. | | | 32,693 | | | $ | 1,825,250 | |
| Express Scripts Holding Co. (a) | | | 50,460 | | | | 3,112,877 | |
| Quest Diagnostics, Inc. | | | 18,807 | | | | 1,140,268 | |
| | | | | | | | |
| | | | | | $ | 6,078,395 | |
| | | | | | | | |
| Medical Equipment – 1.8% | |
| Abbott Laboratories | | | 96,377 | | | $ | 3,361,630 | |
| Becton, Dickinson & Co. | | | 5,263 | | | | 520,142 | |
| Covidien PLC | | | 72,067 | | | | 4,528,690 | |
| Medtronic, Inc. | | | 57,317 | | | | 2,950,106 | |
| St. Jude Medical, Inc. | | | 93,407 | | | | 4,262,161 | |
| Thermo Fisher Scientific, Inc. | | | 80,227 | | | | 6,789,611 | |
| | | | | | | | |
| | | | | | $ | 22,412,340 | |
| | | | | | | | |
| Metals & Mining – 0.4% | |
| Iluka Resources Ltd. | | | 129,704 | | | $ | 1,171,028 | |
| Rio Tinto Ltd. | | | 38,750 | | | | 1,588,229 | |
| Vale S.A., ADR | | | 120,260 | | | | 1,581,419 | |
| | | | | | | | |
| | | | | | $ | 4,340,676 | |
| | | | | | | | |
| Natural Gas – Distribution – 0.2% | |
| GDF SUEZ | | | 129,921 | | | $ | 2,533,239 | |
| | | | | | | | |
6
MFS Total Return Portfolio
Portfolio of Investments (unaudited) – continued
| | | | | | | | |
| Issuer | | Shares/Par | | | Value ($) | |
| | | | | | | | |
| COMMON STOCKS – continued | |
| Natural Gas – Pipeline – 0.2% | |
| Williams Cos., Inc. | | | 75,244 | | | $ | 2,443,173 | |
| | | | | | | | |
| Oil Services – 0.2% | |
| Noble Corp. | | | 46,767 | | | $ | 1,757,504 | |
| Schlumberger Ltd. | | | 16,083 | | | | 1,152,508 | |
| | | | | | | | |
| | | | | | $ | 2,910,012 | |
| | | | | | | | |
| Other Banks & Diversified Financials – 0.9% | |
| American Express Co. | | | 20,323 | | | $ | 1,519,347 | |
| Fifth Third Bancorp | | | 44,260 | | | | 798,893 | |
| MasterCard, Inc., “A” | | | 1,794 | | | | 1,030,653 | |
| SunTrust Banks, Inc. | | | 35,770 | | | | 1,129,259 | |
| Visa, Inc., “A” | | | 19,771 | | | | 3,613,150 | |
| Western Union Co. | | | 110,297 | | | | 1,887,182 | |
| Zions Bancorporation | | | 51,650 | | | | 1,491,652 | |
| | | | | | | | |
| | | | | | $ | 11,470,136 | |
| | | | | | | | |
| Pharmaceuticals – 5.3% | |
| AbbVie, Inc. | | | 66,540 | | | $ | 2,750,764 | |
| Bayer AG | | | 14,729 | | | | 1,570,762 | |
| Bristol-Myers Squibb Co. | | | 80,510 | | | | 3,597,992 | |
| Eli Lilly & Co. | | | 77,500 | | | | 3,806,800 | |
| Johnson & Johnson | | | 260,610 | | | | 22,375,975 | |
| Merck & Co., Inc. | | | 154,740 | | | | 7,187,673 | |
| Pfizer, Inc. | | | 748,368 | | | | 20,961,788 | |
| Roche Holding AG | | | 5,992 | | | | 1,484,724 | |
| Teva Pharmaceutical Industries Ltd., ADR | | | 31,570 | | | | 1,237,544 | |
| Valeant Pharmaceuticals International, Inc. (a) | | | 13,130 | | | | 1,130,230 | |
| Zoetis, Inc. | | | 6,413 | | | | 198,098 | |
| | | | | | | | |
| | | | | | $ | 66,302,350 | |
| | | | | | | | |
| Printing & Publishing – 0.2% | |
| McGraw-Hill Cos., Inc. | | | 20,170 | | | $ | 1,072,842 | |
| Moody’s Corp. | | | 23,257 | | | | 1,417,049 | |
| | | | | | | | |
| | | | | | $ | 2,489,891 | |
| | | | | | | | |
| Railroad & Shipping – 0.2% | |
| Canadian National Railway Co. | | | 11,427 | | | $ | 1,111,504 | |
| Union Pacific Corp. | | | 8,227 | | | | 1,269,262 | |
| | | | | | | | |
| | | | | | $ | 2,380,766 | |
| | | | | | | | |
| Real Estate – 0.4% | |
| Annaly Mortgage Management, Inc., REIT | | | 123,770 | | | $ | 1,555,789 | |
| Corio N.V., REIT | | | 19,877 | | | | 788,121 | |
| Digital Realty Trust, Inc., REIT | | | 21,050 | | | | 1,284,050 | |
| EPR Properties, REIT | | | 22,040 | | | | 1,107,951 | |
| | | | | | | | |
| | | | | | $ | 4,735,911 | |
| | | | | | | | |
| Restaurants – 0.3% | |
| McDonald’s Corp. | | | 33,194 | | | $ | 3,286,206 | |
| | | | | | | | |
| Specialty Chemicals – 0.5% | |
| Air Products & Chemicals, Inc. | | | 52,380 | | | $ | 4,796,437 | |
| FMC Corp. | | | 21,090 | | | | 1,287,755 | |
| | | | | | | | |
| | | | | | $ | 6,084,192 | |
| | | | | | | | |
| | | | | | | | |
| Issuer | | Shares/Par | | | Value ($) | |
| | | | | | | | |
| COMMON STOCKS – continued | |
| Specialty Stores – 0.2% | |
| Advance Auto Parts, Inc. | | | 17,273 | | | $ | 1,402,049 | |
| Staples, Inc. | | | 104,757 | | | | 1,661,446 | |
| | | | | | | | |
| | | | | | $ | 3,063,495 | |
| | | | | | | | |
| Telecommunications – Wireless – 0.3% | |
| Vodafone Group PLC | | | 1,089,480 | | | $ | 3,126,501 | |
| | | | | | | | |
| Telephone Services – 2.1% | |
| AT&T, Inc. | | | 202,181 | | | $ | 7,157,207 | |
Bezeq – The Israel Telecommunication
Corp. Ltd. | | | 378,000 | | | | 502,434 | |
| CenturyLink, Inc. | | | 94,658 | | | | 3,346,160 | |
| Frontier Communications Corp. (l) | | | 888,990 | | | | 3,600,410 | |
| TDC A.S. | | | 244,641 | | | | 1,979,161 | |
| Telecom Italia S.p.A. | | | 1,370,511 | | | | 757,314 | |
| Telefonica Brasil S.A., ADR | | | 63,480 | | | | 1,448,614 | |
| Verizon Communications, Inc. | | | 108,330 | | | | 5,453,332 | |
| Windstream Corp. (l) | | | 226,670 | | | | 1,747,626 | |
| | | | | | | | |
| | | | | | $ | 25,992,258 | |
| | | | | | | | |
| Tobacco – 2.8% | |
| Altria Group, Inc. | | | 96,450 | | | $ | 3,374,786 | |
| Lorillard, Inc. | | | 216,750 | | | | 9,467,640 | |
| Philip Morris International, Inc. | | | 252,851 | | | | 21,901,954 | |
| | | | | | | | |
| | | | | | $ | 34,744,380 | |
| | | | | | | | |
| Trucking – 0.5% | |
| United Parcel Service, Inc., “B” | | | 69,687 | | | $ | 6,026,532 | |
| | | | | | | | |
| Utilities – Electric Power – 1.5% | |
| American Electric Power Co., Inc. | | | 71,320 | | | $ | 3,193,710 | |
| Companhia Energetica de Minas Gerais, IPS | | | 116,600 | | | | 1,040,404 | |
| Duke Energy Corp. | | | 18,193 | | | | 1,228,028 | |
| Fortum Corp. | | | 64,810 | | | | 1,210,696 | |
| NRG Energy, Inc. | | | 148,590 | | | | 3,967,353 | |
| PG&E Corp. | | | 59,550 | | | | 2,723,222 | |
| PPL Corp. | | | 115,110 | | | | 3,483,229 | |
| Public Service Enterprise Group, Inc. | | | 59,313 | | | | 1,937,163 | |
| | | | | | | | |
| | | | | | $ | 18,783,805 | |
| | | | | | | | |
Total Common Stocks
(Identified Cost, $655,617,736) | | | | | | $ | 753,327,045 | |
| | | | | | | | |
|
| BONDS – 38.3% | |
| Agency – Other – 0.1% | |
| Financing Corp., 9.65%, 2018 | | $ | 535,000 | | | $ | 741,655 | |
| | | | | | | | |
| Asset-Backed & Securitized – 2.5% | |
| Bayview Financial Revolving Mortgage Loan Trust, FRN, 1.795%, 2040 (z) | | $ | 1,321,302 | | | $ | 638,051 | |
BlackRock Capital Finance LP,
7.75%, 2026 (n) | | | 128,260 | | | | 16,353 | |
Capital Trust Realty Ltd., CDO,
5.16%, 2035 (n) | | | 244,063 | | | | 244,209 | |
| Citigroup Commercial Mortgage Trust, FRN, 5.884%, 2017 | | | 3,050,000 | | | | 3,452,990 | |
7
MFS Total Return Portfolio
Portfolio of Investments (unaudited) – continued
| | | | | | | | |
| Issuer | | Shares/Par | | | Value ($) | |
| | | | | | | | |
| BONDS – continued | |
| Asset-Backed & Securitized – continued | |
| Citigroup/Deutsche Bank Commercial Mortgage Trust, 5.322%, 2049 | | $ | 137,638 | | | $ | 151,517 | |
| Credit Suisse Mortgage Capital Certificate, FRN, 5.695%, 2017 | | | 2,034,095 | | | | 2,271,327 | |
GMAC Mortgage Corp. Loan Trust,
FRN, 5.805%, 2036 | | | 643,483 | | | | 608,770 | |
| Goldman Sachs Mortgage Securities Corp., FRN, 5.981%, 2045 | | | 4,382,610 | | | | 4,883,797 | |
JPMorgan Chase Commercial Mortgage
Securities Corp., 4.78%, 2042 | | | 1,772,000 | | | | 1,862,893 | |
JPMorgan Chase Commercial
Mortgage Securities Corp., 5.552%, 2045 | | | 1,120,921 | | | | 1,235,824 | |
| JPMorgan Chase Commercial Mortgage Securities Corp., “A3”, FRN, 6.125%, 2051 | | | 2,664,573 | | | | 2,769,197 | |
| JPMorgan Chase Commercial Mortgage Securities Corp., “A4”, FRN, 6.002%, 2049 | | | 777,548 | | | | 870,151 | |
| JPMorgan Chase Commercial Mortgage Securities Corp., FRN, 5.383%, 2041 | | | 2,024,903 | | | | 2,075,574 | |
| JPMorgan Chase Commercial Mortgage Securities Corp., FRN, 5.475%, 2043 | | | 1,766,013 | | | | 1,932,289 | |
| Merrill Lynch Mortgage Trust, “A3”, FRN, 6.038%, 2050 | | | 28,792 | | | | 30,005 | |
| Merrill Lynch/Countrywide Commercial Mortgage Trust, FRN, 5.81%, 2050 | | | 2,460,824 | | | | 2,749,663 | |
Morgan Stanley Capital I, Inc.,
FRN, 1.117%, 2030 (i)(n) | | | 4,131,215 | | | | 121,838 | |
Race Point CLO Ltd., “A1A”, FRN,
0.474%, 2021 (n) | | | 1,030,000 | | | | 1,011,559 | |
| Residential Asset Mortgage Products, Inc., FRN, 4.97%, 2034 | | | 30,266 | | | | 30,207 | |
| Residential Funding Mortgage Securities, Inc., FRN, 5.32%, 2035 | | | 1,457,695 | | | | 835,732 | |
Spirit Master Funding LLC,
5.05%, 2023 (z) | | | 1,156,284 | | | | 1,159,753 | |
| Wachovia Bank Commercial Mortgage Trust, “A4”, FRN, 6.122%, 2017 | | | 772,500 | | | | 859,353 | |
Wachovia Bank Commercial Mortgage
Trust, FRN, 5.937%, 2049 | | | 1,402,125 | | | | 1,568,263 | |
| | | | | | | | |
| | | | | | $ | 31,379,315 | |
| | | | | | | | |
| Automotive – 0.3% | |
Hyundai Capital America,
2.125%, 2017 (n) | | $ | 86,000 | | | $ | 83,143 | |
| Toyota Motor Credit Corp., 3.2%, 2015 | | | 770,000 | | | | 804,984 | |
| Toyota Motor Credit Corp., 3.4%, 2021 | | | 1,120,000 | | | | 1,109,811 | |
| Volkswagen International Finance N.V., 2.375%, 2017 (n) | | | 1,084,000 | | | | 1,100,399 | |
| | | | | | | | |
| | | | | | $ | 3,098,337 | |
| | | | | | | | |
| Broadcasting – 0.2% | |
Discovery Communications, Inc.,
4.875%, 2043 | | $ | 760,000 | | | $ | 702,548 | |
| News America, Inc., 8.5%, 2025 | | | 1,253,000 | | | | 1,594,287 | |
| | | | | | | | |
| | | | | | $ | 2,296,835 | |
| | | | | | | | |
| | | | | | | | |
| Issuer | | Shares/Par | | | Value ($) | |
| | | | | | | | |
| BONDS – continued | |
| Cable TV – 0.3% | |
| Comcast Corp., 2.85%, 2023 | | $ | 1,230,000 | | | $ | 1,167,747 | |
| DIRECTV Holdings LLC, 4.6%, 2021 | | | 690,000 | | | | 715,629 | |
| Time Warner Entertainment Co. LP, 8.375%, 2033 | | | 1,940,000 | | | | 2,286,519 | |
| | | | | | | | |
| | | | | | $ | 4,169,895 | |
| | | | | | | | |
| Computer Software – Systems – 0.0% | |
| Apple, Inc., 3.85%, 2043 | | $ | 461,000 | | | $ | 409,475 | |
| | | | | | | | |
| Conglomerates – 0.2% | |
| ABB Finance (USA), Inc., 2.875%, 2022 | | $ | 393,000 | | | $ | 376,518 | |
| General Electric Co., 2.7%, 2022 | | | 1,330,000 | | | | 1,258,703 | |
| United Technologies Corp., 3.1%, 2022 | | | 540,000 | | | | 533,428 | |
| | | | | | | | |
| | | | | | $ | 2,168,649 | |
| | | | | | | | |
| Consumer Services – 0.0% | | | | | |
| eBay, Inc., 1.35%, 2017 | | $ | 367,000 | | | $ | 360,706 | |
| | | | | | | | |
| Defense Electronics – 0.1% | |
BAE Systems Holdings, Inc.,
5.2%, 2015 (n) | | $ | 862,000 | | | $ | 927,587 | |
| | | | | | | | |
| Emerging Market Quasi-Sovereign – 0.5% | |
| CNOOC Finance (2012) Ltd., 3.875%, 2022 (n) | | $ | 1,280,000 | | | $ | 1,235,914 | |
| Corporacion Nacional del Cobre de Chile, 3.75%, 2020 (n) | | | 342,000 | | | | 332,814 | |
| Gaz Capital S.A., 3.85%, 2020 (n) | | | 364,000 | | | | 338,520 | |
| Petrobras Global Finance Co., FRN, 2.414%, 2019 | | | 774,000 | | | | 758,520 | |
| Petrobras International Finance Co., 5.375%, 2021 | | | 481,000 | | | | 483,258 | |
| Petrobras International Finance Co., 6.75%, 2041 | | | 340,000 | | | | 339,681 | |
| Petroleos Mexicanos, 8%, 2019 | | | 918,000 | | | | 1,110,780 | |
| Ras Laffan Liquefied Natural Gas Co. Ltd., 5.832%, 2016 (n) | | | 657,321 | | | | 698,404 | |
| State Grid International Development Co. Ltd., 1.75%, 2018 (z) | | | 601,000 | | | | 576,019 | |
| | | | | | | | |
| | | | | | $ | 5,873,910 | |
| | | | | | | | |
| Emerging Market Sovereign – 0.4% | |
| Republic of Peru, 7.35%, 2025 | | $ | 103,000 | | | $ | 131,840 | |
| Russian Federation, 3.625%, 2015 (z) | | | 2,700,000 | | | | 2,794,500 | |
| United Mexican States, 4.75%, 2044 | | | 1,739,000 | | | | 1,547,710 | |
| | | | | | | | |
| | | | | | $ | 4,474,050 | |
| | | | | | | | |
| Energy – Independent – 0.1% | |
| Apache Corp., 3.25%, 2022 | | $ | 534,000 | | | $ | 526,019 | |
| Apache Corp., 4.75%, 2043 | | | 407,000 | | | | 386,045 | |
| EOG Resources, Inc., 2.625%, 2023 | | | 382,000 | | | | 357,453 | |
| Hess Corp., 8.125%, 2019 | | | 350,000 | | | | 438,719 | |
| | | | | | | | |
| | | | | | $ | 1,708,236 | |
| | | | | | | | |
| Energy – Integrated – 0.6% | |
| BP Capital Markets PLC, 4.5%, 2020 | | $ | 371,000 | | | $ | 402,493 | |
| BP Capital Markets PLC, 4.742%, 2021 | | | 1,061,000 | | | | 1,154,466 | |
| Husky Energy, Inc., 5.9%, 2014 | | | 944,000 | | | | 987,593 | |
8
MFS Total Return Portfolio
Portfolio of Investments (unaudited) – continued
| | | | | | | | |
| Issuer | | Shares/Par | | | Value ($) | |
| | | | | | | | |
| BONDS – continued | |
| Energy – Integrated – continued | |
| Husky Energy, Inc., 7.25%, 2019 | | $ | 959,000 | | | $ | 1,181,660 | |
| Petro-Canada, 6.05%, 2018 | | | 1,942,000 | | | | 2,249,945 | |
Total Capital International S.A.,
1.55%, 2017 | | | 1,570,000 | | | | 1,556,003 | |
| | | | | | | | |
| | | | | | $ | 7,532,160 | |
| | | | | | | | |
| Financial Institutions – 0.1% | |
General Electric Capital Corp.,
3.1%, 2023 | | $ | 765,000 | | | $ | 722,669 | |
| | | | | | | | |
| Food & Beverages – 0.3% | |
| Anheuser-Busch InBev S.A., 8%, 2039 | | $ | 1,270,000 | | | $ | 1,827,799 | |
| Conagra Foods, Inc., 3.2%, 2023 | | | 657,000 | | | | 628,270 | |
| Diageo Capital PLC, 2.625%, 2023 | | | 1,270,000 | | | | 1,181,467 | |
| Kraft Foods Group, Inc., 3.5%, 2022 | | | 525,000 | | | | 519,896 | |
| | | | | | | | |
| | | | | | $ | 4,157,432 | |
| | | | | | | | |
| Insurance – 0.2% | |
American International Group, Inc.,
4.875%, 2022 | | $ | 2,190,000 | | | $ | 2,334,374 | |
Metropolitan Life Global Funding I,
5.125%, 2014 (n) | | | 680,000 | | | | 709,294 | |
| | | | | | | | |
| | | | | | $ | 3,043,668 | |
| | | | | | | | |
| Insurance – Health – 0.1% | |
| WellPoint, Inc., 3.3%, 2023 | | $ | 759,000 | | | $ | 722,532 | |
| | | | | | | | |
| Insurance – Property & Casualty – 0.4% | |
| ACE Ltd., 2.7%, 2023 | | $ | 1,250,000 | | | $ | 1,166,565 | |
Chubb Corp., 6.375% to 2017,
FRN to 2067 | | | 1,910,000 | | | | 2,043,700 | |
| Marsh & McLennan Cos., Inc., 4.8%, 2021 | | | 1,160,000 | | | | 1,251,486 | |
ZFS Finance USA Trust V,
6.5% to 2017, FRN to 2067 (n) | | | 524,000 | | | | 558,060 | |
| | | | | | | | |
| | | | | | $ | 5,019,811 | |
| | | | | | | | |
| International Market Quasi-Sovereign – 0.4% | |
Achmea Hypotheekbank N.V.,
3.2%, 2014 (n) | | $ | 663,000 | | | $ | 688,194 | |
KFW International Finance, Inc.,
4.875%, 2019 | | | 1,580,000 | | | | 1,832,010 | |
| Societe Financement de l’ Economie Francaise, 3.375%, 2014 (n) | | | 900,000 | | | | 922,140 | |
Temasek Financial I Ltd.,
2.375%, 2023 (n) | | | 2,270,000 | | | | 2,016,471 | |
| | | | | | | | |
| | | | | | $ | 5,458,815 | |
| | | | | | | | |
| International Market Sovereign – 0.1% | |
| Republic of Iceland, 4.875%, 2016 (n) | | $ | 1,200,000 | | | $ | 1,254,000 | |
| | | | | | | | |
| Internet – 0.1% | |
| Baidu, Inc., 3.5%, 2022 | | $ | 1,380,000 | | | $ | 1,233,055 | |
| | | | | | | | |
| Local Authorities – 0.1% | |
| New Jersey Turnpike Authority Rev. (Build America Bonds), “F”, 7.414%, 2040 | | $ | 1,280,000 | | | $ | 1,704,077 | |
| | | | | | | | |
| Machinery & Tools – 0.2% | |
| Atlas Copco AB, 5.6%, 2017 (n) | | $ | 1,850,000 | | | $ | 2,082,073 | |
| | | | | | | | |
| | | | | | | | |
| Issuer | | Shares/Par | | | Value ($) | |
| | | | | | | | |
| BONDS – continued | |
| Major Banks – 1.6% | |
ABN AMRO Bank N.V., FRN,
2.045%, 2014 (n) | | $ | 1,310,000 | | | $ | 1,321,371 | |
| Banco Santander U.S. Debt S.A.U., 3.781%, 2015 (n) | | | 700,000 | | | | 713,500 | |
| Bank of America Corp., 7.375%, 2014 | | | 590,000 | | | | 620,730 | |
| Bank of America Corp., 5.49%, 2019 | | | 829,000 | | | | 893,861 | |
| Bank of America Corp., 7.625%, 2019 | | | 840,000 | | | | 1,009,491 | |
BNP Paribas, 7.195% to 2037,
FRN to 2049 (n) | | | 800,000 | | | | 774,000 | |
Commonwealth Bank of Australia,
5%, 2019 (n) | | | 840,000 | | | | 939,978 | |
| Credit Suisse New York, 5.5%, 2014 | | | 1,200,000 | | | | 1,248,905 | |
Goldman Sachs Group, Inc.,
5.625%, 2017 | | | 1,547,000 | | | | 1,676,615 | |
| HSBC Holdings PLC, 5.1%, 2021 | | | 842,000 | | | | 925,072 | |
| ING Bank N.V., 3.75%, 2017 (n) | | | 1,048,000 | | | | 1,096,879 | |
| JPMorgan Chase & Co., 6.3%, 2019 | | | 1,410,000 | | | | 1,637,994 | |
| JPMorgan Chase & Co., 3.25%, 2022 | | | 426,000 | | | | 404,445 | |
| Morgan Stanley, 6.625%, 2018 | | | 2,530,000 | | | | 2,867,641 | |
| PNC Funding Corp., 5.625%, 2017 | | | 1,270,000 | | | | 1,409,010 | |
| Royal Bank of Scotland PLC, 2.55%, 2015 | | | 312,000 | | | | 317,229 | |
| Wachovia Corp., 5.25%, 2014 | | | 868,000 | | | | 906,652 | |
| Wells Fargo & Co., 2.1%, 2017 | | | 1,570,000 | | | | 1,575,614 | |
| | | | | | | | |
| | | | | | $ | 20,338,987 | |
| | | | | | | | |
| Medical & Health Technology & Services – 0.3% | |
| Baxter International, Inc., 3.2%, 2023 | | $ | 760,000 | | | $ | 745,467 | |
| CareFusion Corp., 6.375%, 2019 | | | 1,400,000 | | | | 1,615,895 | |
| Express Scripts Holding Co., 2.65%, 2017 | | | 1,640,000 | | | | 1,669,935 | |
| | | | | | | | |
| | | | | | $ | 4,031,297 | |
| | | | | | | | |
| Metals & Mining – 0.2% | |
| Freeport-McMoRan Copper & Gold, Inc., 3.875%, 2023 (n) | | $ | 1,250,000 | | | $ | 1,131,365 | |
| Rio Tinto Finance (USA) PLC, 3.5%, 2022 | | | 1,130,000 | | | | 1,089,656 | |
| Vale Overseas Ltd., 4.625%, 2020 | | | 337,000 | | | | 332,854 | |
| Vale Overseas Ltd., 6.875%, 2039 | | | 257,000 | | | | 259,411 | |
| | | | | | | | |
| | | | | | $ | 2,813,286 | |
| | | | | | | | |
| Mortgage-Backed – 13.1% | |
| Fannie Mae, 4.629%, 2014 | | $ | 585,411 | | | $ | 594,793 | |
| Fannie Mae, 4.826%, 2014 | | | 718,240 | | | | 734,978 | |
| Fannie Mae, 4.56%, 2015 | | | 315,247 | | | | 332,238 | |
| Fannie Mae, 4.78%, 2015 | | | 436,602 | | | | 462,227 | |
| Fannie Mae, 4.856%, 2015 | | | 287,712 | | | | 304,310 | |
| Fannie Mae, 4.907%, 2015 | | | 41,077 | | | | 43,196 | |
| Fannie Mae, 4.997%, 2015 | | | 126,813 | | | | 135,285 | |
| Fannie Mae, 5.1%, 2015 | | | 480,000 | | | | 509,914 | |
| Fannie Mae, 5.09%, 2016 | | | 496,794 | | | | 540,414 | |
| Fannie Mae, 5.27%, 2016 | | | 527,430 | | | | 599,106 | |
| Fannie Mae, 5.5%, 2016 – 2040 | | | 17,072,184 | | | | 18,614,631 | |
| Fannie Mae, 5.661%, 2016 | | | 405,895 | | | | 443,292 | |
| Fannie Mae, 5.724%, 2016 | | | 300,317 | | | | 333,775 | |
| Fannie Mae, 4.992%, 2017 | | | 75,145 | | | | 78,896 | |
| Fannie Mae, 5.05%, 2017 | | | 475,585 | | | | 518,501 | |
| Fannie Mae, 6%, 2017 – 2037 | | | 10,312,412 | | | | 11,271,084 | |
9
MFS Total Return Portfolio
Portfolio of Investments (unaudited) – continued
| | | | | | | | |
| Issuer | | Shares/Par | | | Value ($) | |
| | | | | | | | |
| BONDS – continued | |
| Mortgage-Backed – continued | |
| Fannie Mae, 2.578%, 2018 | | $ | 843,000 | | | $ | 865,830 | |
| Fannie Mae, 4.5%, 2018 – 2041 | | | 4,852,542 | | | | 5,175,374 | |
| Fannie Mae, 5%, 2018 – 2041 | | | 8,911,088 | | | | 9,602,883 | |
| Fannie Mae, 4.6%, 2019 | | | 184,305 | | | | 206,199 | |
| Fannie Mae, 3%, 2027 | | | 1,113,934 | | | | 1,146,929 | |
| Fannie Mae, 2.5%, 2028 | | | 989,510 | | | | 996,968 | |
| Fannie Mae, 7.5%, 2030 – 2031 | | | 135,552 | | | | 160,757 | |
| Fannie Mae, 6.5%, 2031 – 2037 | | | 2,982,676 | | | | 3,322,041 | |
| Fannie Mae, 4%, 2040 – 2041 | | | 756,841 | | | | 790,225 | |
| Fannie Mae, 3.5%, 2041 – 2042 | | | 1,751,511 | | | | 1,782,098 | |
| Fannie Mae, TBA, 2.5%, 2028 | | | 2,125,000 | | | | 2,137,285 | |
| Fannie Mae, TBA, 3%, 2028 | | | 3,513,000 | | | | 3,595,885 | |
| Fannie Mae, TBA, 4%, 2028 | | | 960,000 | | | | 1,011,862 | |
| Fannie Mae, TBA, 3.5%, 2041 | | | 15,278,000 | | | | 15,421,230 | |
| Fannie Mae, TBA, 4.5%, 2041 | | | 3,000,000 | | | | 3,164,064 | |
| Freddie Mac, 6%, 2016 – 2037 | | | 3,683,003 | | | | 4,049,494 | |
| Freddie Mac, 3.882%, 2017 | | | 406,817 | | | | 439,327 | |
| Freddie Mac, 5%, 2017 – 2039 | | | 5,170,282 | | | | 5,573,610 | |
| Freddie Mac, 2.303%, 2018 | | | 216,058 | | | | 218,540 | |
| Freddie Mac, 2.412%, 2018 | | | 594,000 | | | | 604,204 | |
| Freddie Mac, 3.154%, 2018 | | | 156,000 | | | | 164,076 | |
| Freddie Mac, 4.5%, 2018 – 2039 | | | 4,052,083 | | | | 4,267,983 | |
| Freddie Mac, 1.869%, 2019 | | | 442,000 | | | | 429,333 | |
| Freddie Mac, 5.085%, 2019 | | | 1,523,000 | | | | 1,746,791 | |
| Freddie Mac, 5.5%, 2019 – 2037 | | | 4,629,569 | | | | 5,019,379 | |
| Freddie Mac, 3.808%, 2020 | | | 1,303,000 | | | | 1,391,131 | |
| Freddie Mac, 6.5%, 2034 – 2038 | | | 1,600,801 | | | | 1,799,884 | |
| Freddie Mac, 4%, 2040 – 2041 | | | 5,030,992 | | | | 5,234,742 | |
| Freddie Mac, 3.5%, 2042 – 2043 | | | 3,605,531 | | | | 3,666,202 | |
| Freddie Mac, 3%, 2043 | | | 4,731,206 | | | | 4,622,819 | |
| Freddie Mac, TBA, 2.5%, 2028 | | | 1,662,000 | | | | 1,670,310 | |
| Freddie Mac, TBA, 3.5%, 2043 | | | 5,471,000 | | | | 5,521,694 | |
| Freddie Mac, TBA, 3%, 2043 | | | 2,890,000 | | | | 2,816,847 | |
| Ginnie Mae, 4.5%, 2041 | | | 411,727 | | | | 439,543 | |
| Ginnie Mae, 4%, 2042 | | | 1,328,183 | | | | 1,396,219 | |
| Ginnie Mae, 3%, 2043 | | | 2,932,914 | | | | 2,906,822 | |
| Ginnie Mae, 4.5%, 2033 – 2041 | | | 4,899,662 | | | | 5,264,404 | |
| Ginnie Mae, 5%, 2033 – 2034 | | | 533,860 | | | | 580,949 | |
| Ginnie Mae, 5.5%, 2033 – 2035 | | | 1,990,873 | | | | 2,190,826 | |
| Ginnie Mae, 6%, 2033 – 2038 | | | 2,442,638 | | | | 2,742,145 | |
| Ginnie Mae, 3.5%, 2041 – 2042 | | | 976,983 | | | | 1,007,640 | |
| Ginnie Mae, 4%, 2041 | | | 4,227,677 | | | | 4,458,602 | |
| Ginnie Mae, TBA, 3%, 2043 | | | 1,180,000 | | | | 1,166,909 | |
| Ginnie Mae, TBA, 3.5%, 2043 | | | 6,253,000 | | | | 6,417,141 | |
| | | | | | | | |
| | | | | | $ | 162,703,836 | |
| | | | | | | | |
| Natural Gas – Pipeline – 0.4% | |
| Energy Transfer Partners LP, 3.6%, 2023 | | $ | 708,000 | | | $ | 662,609 | |
Enterprise Products Operating LLC,
6.5%, 2019 | | | 1,042,000 | | | | 1,243,099 | |
Kinder Morgan Energy Partners LP,
7.4%, 2031 | | | 804,000 | | | | 953,311 | |
Kinder Morgan Energy Partners LP,
7.75%, 2032 | | | 661,000 | | | | 816,669 | |
| Spectra Energy Capital LLC, 8%, 2019 | | | 1,040,000 | | | | 1,316,228 | |
| | | | | | | | |
| | | | | | $ | 4,991,916 | |
| | | | | | | | |
| | | | | | | | |
| Issuer | | Shares/Par | | | Value ($) | |
| | | | | | | | |
| BONDS – continued | |
| Network & Telecom – 0.1% | |
| AT&T, Inc., 5.55%, 2041 | | $ | 312,000 | | | $ | 324,856 | |
| Telecom Italia Capital, 5.25%, 2013 | | | 812,000 | | | | 822,176 | |
| | | | | | | | |
| | | | | | $ | 1,147,032 | |
| | | | | | | | |
| Oil Services – 0.1% | |
| Transocean, Inc., 3.8%, 2022 | | $ | 638,000 | | | $ | 607,728 | |
| | | | | | | | |
| Other Banks & Diversified Financials – 0.7% | |
| American Express Co., 5.5%, 2016 | | $ | 1,034,000 | | | $ | 1,154,704 | |
| Banco Bradesco S.A., 6.75%, 2019 (n) | | | 681,000 | | | | 735,480 | |
| Banco de Credito del Peru, 5.375%, 2020 | | | 1,038,000 | | | | 1,061,355 | |
BBVA Bancomer S.A. de C.V.,
6.75%, 2022 (n) | | | 1,010,000 | | | | 1,090,800 | |
| Capital One Financial Corp., 6.15%, 2016 | | | 1,670,000 | | | | 1,863,573 | |
| Citigroup, Inc., 3.375%, 2023 | | | 451,000 | | | | 431,433 | |
Groupe BPCE S.A., 12.5% to 2019,
FRN to 2049 (n) | | | 1,081,000 | | | | 1,310,713 | |
Svenska Handelsbanken AB,
4.875%, 2014 (n) | | | 1,220,000 | | | | 1,266,165 | |
| Swedbank AB, 2.125%, 2017 (n) | | | 294,000 | | | | 292,204 | |
| | | | | | | | |
| | | | | | $ | 9,206,427 | |
| | | | | | | | |
| Pharmaceuticals – 0.6% | |
| AbbVie, Inc., 1.2%, 2015 (n) | | $ | 2,310,000 | | | $ | 2,312,539 | |
| Hospira, Inc., 6.05%, 2017 | | | 1,164,000 | | | | 1,245,549 | |
| Roche Holdings, Inc., 6%, 2019 (n) | | | 1,578,000 | | | | 1,884,105 | |
| Teva Pharmaceutical Finance IV LLC, 3.65%, 2021 | | | 1,610,000 | | | | 1,610,148 | |
| | | | | | | | |
| | | | | | $ | 7,052,341 | |
| | | | | | | | |
| Real Estate – 0.5% | |
| Boston Properties, Inc., REIT, 5%, 2015 | | $ | 411,000 | | | $ | 441,728 | |
| ERP Operating LP, REIT, 5.375%, 2016 | | | 320,000 | | | | 356,703 | |
| ERP Operating LP, REIT, 4.625%, 2021 | | | 1,141,000 | | | | 1,208,608 | |
| HCP, Inc., REIT, 5.375%, 2021 | | | 919,000 | | | | 996,876 | |
| Simon Property Group, Inc., REIT, 5.875%, 2017 | | | 1,131,000 | | | | 1,276,310 | |
| WEA Finance LLC, 6.75%, 2019 (n) | | | 330,000 | | | | 389,729 | |
| WEA Finance LLC, REIT, 4.625%, 2021 (n) | | | 1,240,000 | | | | 1,308,131 | |
| | | | | | | | |
| | | | | | $ | 5,978,085 | |
| | | | | | | | |
| Retailers – 0.4% | |
| Gap, Inc., 5.95%, 2021 | | $ | 760,000 | | | $ | 840,581 | |
| Home Depot, Inc., 5.95%, 2041 | | | 346,000 | | | | 412,207 | |
| Limited Brands, Inc., 5.25%, 2014 | | | 440,000 | | | | 456,500 | |
| Target Corp., 4%, 2042 | | | 1,292,000 | | | | 1,174,898 | |
| Wal-Mart Stores, Inc., 5.25%, 2035 | | | 2,435,000 | | | | 2,643,718 | |
| | | | | | | | |
| | | | | | $ | 5,527,904 | |
| | | | | | | | |
| Supranational – 0.2% | |
| Asian Development Bank, 2.75%, 2014 | | $ | 1,120,000 | | | $ | 1,144,394 | |
| Asian Development Bank, 1.125%, 2017 | | | 729,000 | | | | 733,593 | |
| | | | | | | | |
| | | | | | $ | 1,877,987 | |
| | | | | | | | |
| Telecommunications – Wireless – 0.4% | |
| American Tower Trust I, 3.07%, 2023 (n) | | $ | 1,250,000 | | | $ | 1,193,919 | |
Crown Castle Towers LLC,
6.113%, 2020 (n) | | | 888,000 | | | | 1,018,958 | |
10
MFS Total Return Portfolio
Portfolio of Investments (unaudited) – continued
| | | | | | | | |
| Issuer | | Shares/Par | | | Value ($) | |
| | | | | | | | |
| BONDS – continued | |
| Telecommunications – Wireless – continued | |
Crown Castle Towers LLC,
4.883%, 2020 (n) | | $ | 440,000 | | | $ | 473,147 | |
| Rogers Communications, Inc., 6.8%, 2018 | | | 1,686,000 | | | | 2,035,477 | |
| | | | | | | | |
| | | | | | $ | 4,721,501 | |
| | | | | | | | |
| Tobacco – 0.2% | |
| Altria Group, Inc., 2.85%, 2022 | | $ | 1,270,000 | | | $ | 1,174,340 | |
B.A.T. International Finance PLC,
3.25%, 2022 (n) | | | 1,302,000 | | | | 1,274,441 | |
| | | | | | | | |
| | | | | | $ | 2,448,781 | |
| | | | | | | | |
| Transportation – Services – 0.1% | |
| ERAC USA Finance Co., 7%, 2037 (n) | | $ | 1,423,000 | | | $ | 1,675,584 | |
| | | | | | | | |
| U.S. Government Agencies and Equivalents – 0.3% | |
| Aid-Egypt, 4.45%, 2015 | | $ | 152,000 | | | $ | 164,972 | |
Small Business Administration,
4.35%, 2023 | | | 15,729 | | | | 16,828 | |
Small Business Administration,
4.77%, 2024 | | | 399,041 | | | | 427,760 | |
Small Business Administration,
5.18%, 2024 | | | 665,699 | | | | 731,992 | |
Small Business Administration,
5.52%, 2024 | | | 81,658 | | | | 90,603 | |
Small Business Administration,
4.99%, 2024 | | | 640,672 | | | | 698,712 | |
Small Business Administration,
4.95%, 2025 | | | 40,949 | | | | 44,352 | |
Small Business Administration,
5.11%, 2025 | | | 1,357,720 | | | | 1,493,596 | |
| | | | | | | | |
| | | | | | $ | 3,668,815 | |
| | | | | | | | |
| U.S. Treasury Obligations – 11.2% | |
| U.S. Treasury Bonds, 8.5%, 2020 | | $ | 2,604,000 | | | $ | 3,704,799 | |
| U.S. Treasury Bonds, 8%, 2021 | | | 357,000 | | | | 517,566 | |
| U.S. Treasury Bonds, 6%, 2026 | | | 499,000 | | | | 669,908 | |
| U.S. Treasury Bonds, 6.75%, 2026 | | | 440,000 | | | | 630,025 | |
| U.S. Treasury Bonds, 5.25%, 2029 | | | 159,000 | | | | 202,278 | |
| U.S. Treasury Bonds, 5.375%, 2031 | | | 79,000 | | | | 102,910 | |
| U.S. Treasury Bonds, 4.5%, 2036 | | | 94,000 | | | | 111,933 | |
| U.S. Treasury Bonds, 5%, 2037 | | | 6,446,000 | | | | 8,227,713 | |
| U.S. Treasury Bonds, 4.5%, 2039 | | | 16,701,200 | | | | 19,968,372 | |
| U.S. Treasury Notes, 1.875%, 2014 | | | 6,085,000 | | | | 6,154,643 | |
| U.S. Treasury Notes, 1.875%, 2014 | | | 15,111,000 | | | | 15,323,491 | |
| U.S. Treasury Notes, 4.75%, 2014 | | | 150,000 | | | | 155,947 | |
| U.S. Treasury Notes, 4.125%, 2015 | | | 4,512,000 | | | | 4,830,308 | |
| U.S. Treasury Notes, 2.125%, 2015 | | | 6,296,000 | | | | 6,509,472 | |
| U.S. Treasury Notes, 2.625%, 2016 | | | 936,000 | | | | 987,261 | |
| U.S. Treasury Notes, 5.125%, 2016 | | | 488,000 | | | | 550,487 | |
| U.S. Treasury Notes, 0.875%, 2016 | | | 47,222,000 | | | | 47,192,486 | |
| U.S. Treasury Notes, 4.75%, 2017 | | | 1,507,000 | | | | 1,729,753 | |
| | | | | | | | |
| Issuer | | Shares/Par | | | Value ($) | |
| | | | | | | | |
| BONDS – continued | |
| U.S. Treasury Obligations – continued | |
| U.S. Treasury Notes, 3.75%, 2018 | | $ | 1,633,000 | | | $ | 1,825,516 | |
| U.S. Treasury Notes, 2.75%, 2019 | | | 405,500 | | | | 431,604 | |
| U.S. Treasury Notes, 3.5%, 2020 | | | 13,238,000 | | | | 14,645,570 | |
| U.S. Treasury Notes, 3.125%, 2021 | | | 4,926,000 | | | | 5,289,677 | |
| | | | | | | | |
| | | | | | $ | 139,761,719 | |
| | | | | | | | |
| Utilities – Electric Power – 0.6% | |
MidAmerican Funding LLC,
6.927%, 2029 | | $ | 516,000 | | | $ | 639,915 | |
| Oncor Electric Delivery Co., 7%, 2022 | | | 988,000 | | | | 1,226,430 | |
| Pacific Gas & Electric Co., 4.6%, 2043 | | | 1,100,000 | | | | 1,082,904 | |
| PPL Corp., 3.4%, 2023 | | | 1,090,000 | | | | 1,032,746 | |
| Progress Energy, Inc., 3.15%, 2022 | | | 1,374,000 | | | | 1,316,119 | |
| PSEG Power LLC, 5.32%, 2016 | | | 1,014,000 | | | | 1,124,669 | |
System Energy Resources, Inc.,
5.129%, 2014 (z) | | | 173,565 | | | | 174,726 | |
| Waterford 3 Funding Corp., 8.09%, 2017 | | | 1,211,276 | | | | 1,226,232 | |
| | | | | | | | |
| | | | | | $ | 7,823,741 | |
| | | | | | | | |
Total Bonds
(Identified Cost, $462,730,156) | | | $ | 476,915,909 | |
| | | | | | | | |
|
| CONVERTIBLE PREFERRED STOCKS – 0.4% | |
| Aerospace – 0.0% | |
| United Technologies Corp., 7.5% | | | 6,347 | | | $ | 376,758 | |
| | | | | | | | |
| Automotive – 0.2% | |
| General Motors Co., 4.75% | | | 45,390 | | | $ | 2,185,982 | |
| | | | | | | | |
| Utilities – Electric Power – 0.2% | |
| PPL Corp., 9.5% | | | 13,190 | | | $ | 691,288 | |
| PPL Corp., 8.75% | | | 34,240 | | | | 1,849,645 | |
| | | | | | | | |
| | | | | | $ | 2,540,933 | |
| | | | | | | | |
Total Convertible Preferred Stocks
(Identified Cost, $5,158,327) | | | $ | 5,103,673 | |
| | | | | | | | |
|
| COLLATERAL FOR SECURITIES LOANED – 0.3% | |
| Navigator Securities Lending Prime Portfolio, 0.17%, Cost and Net Asset Value (j) | | | 3,339,820 | | | $ | 3,339,820 | |
| | | | | | | | |
|
| MONEY MARKET FUNDS – 4.1% | |
| MFS Institutional Money Market Portfolio, 0.11%, at Cost and Net Asset Value (v) | | | 50,637,307 | | | $ | 50,637,307 | |
| | | | | | | | |
Total Investments
(Identified Cost, $1,177,483,346) | | | $ | 1,289,323,754 | |
| | | | | | | | |
OTHER ASSETS, LESS
LIABILITIES – (3.6)% | | | | | | | (45,162,230 | ) |
| | | | | | | | |
| Net Assets – 100.0% | | | | | | $ | 1,244,161,524 | |
| | | | | | | | |
| (a) | | Non-income producing security. |
| (i) | | Interest only security for which the fund receives interest on notional principal (Par amount). Par amount shown is the notional principal and does not reflect the cost of the security. |
| (j) | | The rate quoted is the annualized seven-day yield of the fund at period end. |
| (l) | | A portion of this security is on loan. |
11
MFS Total Return Portfolio
Portfolio of Investments (unaudited) – continued
| (n) | | Securities exempt from registration under Rule 144A of the Securities Act of 1933. These securities may be sold in the ordinary course of business in transactions exempt from registration, normally to qualified institutional buyers. At period end, the aggregate value of these securities was $36,543,980, representing 2.9% of net assets. |
| (v) | | Underlying affiliated fund that is available only to investment companies managed by MFS. The rate quoted for the MFS Institutional Money Market Portfolio is the annualized seven-day yield of the fund at period end. |
| (z) | | Restricted securities are not registered under the Securities Act of 1933 and are subject to legal restrictions on resale. These securities generally may be resold in transactions exempt from registration or to the public if the securities are subsequently registered. Disposal of these securities may involve time-consuming negotiations and prompt sale at an acceptable price may be difficult. The fund holds the following restricted securities: |
| | | | | | | | | | |
| Restricted Securities | | Acquisition Date | | Cost | | | Value | |
| Bayview Financial Revolving Mortgage Loan Trust, FRN, 1.795%, 2040 | | 3/01/06 | | | $1,321,302 | | | | $638,051 | |
| Russian Federation, 3.625%, 2015 | | 4/22/10 | | | 2,694,514 | | | | 2,794,500 | |
| Spirit Master Funding LLC, 5.05%, 2023 | | 10/04/05 | | | 1,147,191 | | | | 1,159,753 | |
| State Grid International Development Co. Ltd., 1.75%, 2018 | | 5/15/13 | | | 600,076 | | | | 576,019 | |
| System Energy Resources, Inc., 5.129%, 2014 | | 4/16/04 | | | 173,565 | | | | 174,726 | |
| Total Restricted Securities | | | | | | | | | $5,343,049 | |
| % of Net assets | | | | | | | | | 0.4% | |
The following abbreviations are used in this report and are defined:
| ADR | | American Depositary Receipt |
CDO Collateralized Debt Obligation
| CLO | | Collateralized Loan Obligation |
| FRN | | Floating Rate Note. Interest rate resets periodically and may not be the rate reported at period end. |
| IPS | | International Preference Stock |
| PLC | | Public Limited Company |
| REIT | | Real Estate Investment Trust |
See Notes to Financial Statements
12
MFS Total Return Portfolio
FINANCIAL STATEMENTS | STATEMENT OF ASSETS AND LIABILITIES (unaudited)
This statement represents your fund’s balance sheet, which details the assets and liabilities comprising the total value of the fund.
| | | | | | | | |
| At 6/30/13 | | | | | | | | |
Assets | | | | | | | | |
Investments – | | | | | | | | |
Non-affiliated issuers, at value (identified cost, $1,126,846,039) | | | $1,238,686,447 | | | | | |
Underlying affiliated funds, at cost and value | | | 50,637,307 | | | | | |
Total investments, at value, including $3,196,960 of securities on loan (identified cost, $1,177,483,346) | | | $1,289,323,754 | | | | | |
Cash | | | 8,419 | | | | | |
Receivables for | | | | | | | | |
Investments sold | | | 1,756,448 | | | | | |
TBA sale commitments | | | 28,135,477 | | | | | |
Interest and dividends | | | 4,563,818 | | | | | |
Other assets | | | 6,440 | | | | | |
Total assets | | | | | | | $1,323,794,356 | |
Liabilities | | | | | | | | |
Payables for | | | | | | | | |
Investments purchased | | | $2,311,304 | | | | | |
TBA purchase commitments | | | 72,685,495 | | | | | |
Fund shares reacquired | | | 1,057,238 | | | | | |
Collateral for securities loaned, at value | | | 3,339,820 | | | | | |
Payable to affiliates | | | | | | | | |
Investment adviser | | | 93,809 | | | | | |
Shareholder servicing costs | | | 273 | | | | | |
Distribution and/or service fees | | | 18,063 | | | | | |
Payable for independent Trustees’ compensation | | | 4,290 | | | | | |
Accrued expenses and other liabilities | | | 122,540 | | | | | |
Total liabilities | | | | | | | $79,632,832 | |
Net assets | | | | | | | $1,244,161,524 | |
Net assets consist of | | | | | | | | |
Paid-in capital | | | $1,039,494,175 | | | | | |
Unrealized appreciation (depreciation) on investments and translation of assets and liabilities in foreign currencies | | | 111,832,573 | | | | | |
Accumulated net realized gain (loss) on investments and foreign currency | | | 49,821,723 | | | | | |
Undistributed net investment income | | | 43,013,053 | | | | | |
Net assets | | | | | | | $1,244,161,524 | |
Shares of beneficial interest outstanding | | | | | | | 64,053,866 | |
| | | | | | | | | | | | |
| | | Net assets | | | Shares outstanding | | | Net asset value per share | |
Initial Class | | | $585,710,197 | | | | 29,980,398 | | | | $19.54 | |
Service Class | | | 658,451,327 | | | | 34,073,468 | | | | 19.32 | |
See Notes to Financial Statements
13
MFS Total Return Portfolio
FINANCIAL STATEMENTS | STATEMENT OF OPERATIONS (unaudited)
This statement describes how much your fund earned in investment income and accrued in expenses. It also describes any gains and/or losses generated by fund operations.
| | | | | | | | |
| Six months ended 6/30/13 | | | | | | | | |
Net investment income | | | | | | | | |
Income | | | | | | | | |
Dividends | | | $9,879,332 | | | | | |
Interest | | | 8,110,366 | | | | | |
Dividends from underlying affiliated funds | | | 28,016 | | | | | |
Foreign taxes withheld | | | (126,088 | ) | | | | |
Total investment income | | | | | | | $17,891,626 | |
Expenses | | | | | | | | |
Management fee | | | $4,285,848 | | | | | |
Distribution and/or service fees | | | 845,639 | | | | | |
Shareholder servicing costs | | | 6,386 | | | | | |
Administrative services fee | | | 84,488 | | | | | |
Independent Trustees’ compensation | | | 13,627 | | | | | |
Custodian fee | | | 68,315 | | | | | |
Shareholder communications | | | 20,093 | | | | | |
Audit and tax fees | | | 32,698 | | | | | |
Legal fees | | | 10,684 | | | | | |
Miscellaneous | | | 26,929 | | | | | |
Total expenses | | | | | | | $5,394,707 | |
Fees paid indirectly | | | (92 | ) | | | | |
Reduction of expenses by investment adviser | | | (4,135 | ) | | | | |
Net expenses | | | | | | | $5,390,480 | |
Net investment income | | | | | | | $12,501,146 | |
Realized and unrealized gain (loss) on investments and foreign currency | | | | | | | | |
Realized gain (loss) (identified cost basis) | | | | | | | | |
Investments | | | $88,418,519 | | | | | |
Foreign currency | | | (5,071 | ) | | | | |
Net realized gain (loss) on investments and foreign currency | | | | | | | $88,413,448 | |
Change in unrealized appreciation (depreciation) | | | | | | | | |
Investments | | | $1,190,655 | | | | | |
Translation of assets and liabilities in foreign currencies | | | (15,089 | ) | | | | |
Net unrealized gain (loss) on investments and foreign currency translation | | | | | | | $1,175,566 | |
Net realized and unrealized gain (loss) on investments and foreign currency | | | | | | | $89,589,014 | |
Change in net assets from operations | | | | | | | $102,090,160 | |
See Notes to Financial Statements
14
MFS Total Return Portfolio
FINANCIAL STATEMENTS | STATEMENTS OF CHANGES IN NET ASSETS
These statements describe the increases and/or decreases in net assets resulting from operations, any distributions, and any shareholder transactions.
| | | | | | | | |
| |
| Six months ended
6/30/13 (unaudited |
) | |
| Year ended
12/31/12 |
|
Change in net assets | | | | | | | | |
| From operations | | | | | | | | |
Net investment income | | | $12,501,146 | | | | $28,706,147 | |
Net realized gain (loss) on investments and foreign currency | | | 88,413,448 | | | | 50,128,094 | |
Net unrealized gain (loss) on investments and foreign currency translation | | | 1,175,566 | | | | 60,278,619 | |
Change in net assets from operations | | | $102,090,160 | | | | $139,112,860 | |
| Distributions declared to shareholders | | | | | | | | |
From net investment income | | | $— | | | | $(31,575,153 | ) |
Change in net assets from fund share transactions | | | $(108,063,450 | ) | | | $(181,788,269 | ) |
Total change in net assets | | | $(5,973,290 | ) | | | $(74,250,562 | ) |
| Net assets | | | | | | | | |
At beginning of period | | | 1,250,134,814 | | | | 1,324,385,376 | |
At end of period (including undistributed net investment income of $43,013,053 and
$30,511,907, respectively) | | | $1,244,161,524 | | | | $1,250,134,814 | |
See Notes to Financial Statements
15
MFS Total Return Portfolio
FINANCIAL STATEMENTS | FINANCIAL HIGHLIGHTS
The financial highlights table is intended to help you understand the fund’s financial performance for the semiannual period and the past 5 fiscal years. Certain information reflects financial results for a single fund share. The total returns in the table represent the rate by which an investor would have earned (or lost) on an investment in the fund share class (assuming reinvestment of all distributions) held for the entire period.
| | | | | | | | | | | | | | | | | | | | | | | | |
| Initial Class | | Six months ended 6/30/13 | | | Years ended 12/31 | |
| | | | 2012 | | | 2011 | | | 2010 | | | 2009 | | | 2008 | |
| | | (unaudited) | | | | | | | | | | | | | | | | |
Net asset value, beginning of period | | | $18.03 | | | | $16.62 | | | | $16.77 | | | | $15.66 | | | | $13.83 | | | | $19.50 | |
| Income (loss) from investment operations | | | | | | | | | | | | | | | | | | | | | | | | |
Net investment income (d) | | | $0.20 | | | | $0.41 | | | | $0.40 | | | | $0.38 | | | | $0.40 | | | | $0.49 | |
Net realized and unrealized gain (loss) on investments
and foreign currency | | | 1.31 | | | | 1.46 | | | | (0.09 | ) | | | 1.16 | | | | 1.98 | | | | (4.30 | ) |
Total from investment operations | | | $1.51 | | | | $1.87 | | | | $0.31 | | | | $1.54 | | | | $2.38 | | | | $(3.81 | ) |
| Less distributions declared to shareholders | | | | | | | | | | | | | | | | | | | | | | | | |
From net investment income | | | $ — | | | | $(0.46 | ) | | | $(0.46 | ) | | | $(0.43 | ) | | | $(0.55 | ) | | | $(0.60 | ) |
From net realized gain on investments | | | — | | | | — | | | | — | | | | — | | | | — | | | | (1.26 | ) |
Total distributions declared to shareholders | | | $— | | | | $(0.46 | ) | | | $(0.46 | ) | | | $(0.43 | ) | | | $(0.55 | ) | | | $(1.86 | ) |
Net asset value, end of period (x) | | | $19.54 | | | | $18.03 | | | | $16.62 | | | | $16.77 | | | | $15.66 | | | | $13.83 | |
Total return (%) (k)(r)(s)(x) | | | 8.37 | (n) | | | 11.34 | | | | 1.93 | | | | 9.97 | | | | 18.09 | | | | (21.55 | ) |
Ratios (%) (to average net assets)
and Supplemental data: | | | | | | | | | | | | | | | | | | | | | | | | |
Expenses before expense reductions (f) | | | 0.72 | (a) | | | 0.72 | | | | 0.76 | | | | 0.75 | | | | 0.76 | | | | 0.74 | |
Expenses after expense reductions (f) | | | 0.72 | (a) | | | 0.72 | | | | 0.74 | | | | 0.74 | | | | N/A | | | | N/A | |
Net investment income | | | 2.10 | (a) | | | 2.33 | | | | 2.38 | | | | 2.37 | | | | 2.87 | | | | 2.93 | |
Portfolio turnover | | | 36 | (n) | | | 22 | | | | 20 | | | | 32 | | | | 45 | | | | 62 | |
Net assets at end of period (000 omitted) | | | $585,710 | | | | $576,174 | | | | $593,602 | | | | $571,781 | | | | $604,214 | | | | $604,843 | |
| | |
| Service Class | | Six months ended 6/30/13 | | | Years ended 12/31 | |
| | | | 2012 | | | 2011 | | | 2010 | | | 2009 | | | 2008 | |
| | | (unaudited) | | | | | | | | | | | | | | | | |
Net asset value, beginning of period | | | $17.85 | | | | $16.46 | | | | $16.61 | | | | $15.52 | | | | $13.70 | | | | $19.33 | |
| Income (loss) from investment operations | | | | | | | | | | | | | | | | | | | | | | | | |
Net investment income (d) | | | $0.18 | | | | $0.36 | | | | $0.36 | | | | $0.33 | | | | $0.36 | | | | $0.44 | |
Net realized and unrealized gain (loss) on investments
and foreign currency | | | 1.29 | | | | 1.44 | | | | (0.10 | ) | | | 1.16 | | | | 1.97 | | | | (4.26 | ) |
Total from investment operations | | | $1.47 | | | | $1.80 | | | | $0.26 | | | | $1.49 | | | | $2.33 | | | | $(3.82 | ) |
| Less distributions declared to shareholders | | | | | | | | | | | | | | | | | | | | | | | | |
From net investment income | | | $— | | | | $(0.41 | ) | | | $(0.41 | ) | | | $(0.40 | ) | | | $(0.51 | ) | | | $(0.55 | ) |
From net realized gain on investments | | | — | | | | — | | | | — | | | | — | | | | — | | | | (1.26 | ) |
Total distributions declared to shareholders | | | $— | | | | $(0.41 | ) | | | $(0.41 | ) | | | $(0.40 | ) | | | $(0.51 | ) | | | $(1.81 | ) |
Net asset value, end of period (x) | | | $19.32 | | | | $17.85 | | | | $16.46 | | | | $16.61 | | | | $15.52 | | | | $13.70 | |
Total return (%) (k)(r)(s)(x) | | | 8.24 | (n) | | | 11.02 | | | | 1.66 | | | | 9.69 | | | | 17.81 | | | | (21.74 | ) |
Ratios (%) (to average net assets)
and Supplemental data: | | | | | | | | | | | | | | | | | | | | | | | | |
Expenses before expense reductions (f) | | | 0.97 | (a) | | | 0.97 | | | | 1.01 | | | | 1.00 | | | | 1.00 | | | | 0.99 | |
Expenses after expense reductions (f) | | | 0.97 | (a) | | | 0.97 | | | | 0.99 | | | | 0.99 | | | | N/A | | | | N/A | |
Net investment income | | | 1.85 | (a) | | | 2.08 | | | | 2.13 | | | | 2.12 | | | | 2.60 | | | | 2.69 | |
Portfolio turnover | | | 36 | (n) | | | 22 | | | | 20 | | | | 32 | | | | 45 | | | | 62 | |
Net assets at end of period (000 omitted) | | | $658,451 | | | | $673,960 | | | | $730,783 | | | | $833,059 | | | | $855,092 | | | | $708,517 | |
See Notes to Financial Statements
16
MFS Total Return Portfolio
Financial Highlights – continued
| (d) | Per share data is based on average shares outstanding. |
| (f) | Ratios do not reflect reductions from fees paid indirectly, if applicable. |
| (k) | The total return does not reflect expenses that apply to separate accounts. Inclusion of these charges would reduce the total return figures for all periods shown. |
| (r) | Certain expenses have been reduced without which performance would have been lower. |
| (s) | From time to time the fund may receive proceeds from litigation settlements, without which performance would be lower. |
| (x) | The net asset values per share and total returns have been calculated on net assets which include adjustments made in accordance with U.S. generally accepted accounting principles required at period end for financial reporting purposes. |
See Notes to Financial Statements
17
MFS Total Return Portfolio
NOTES TO FINANCIAL STATEMENTS (unaudited)
| (1) | | Business and Organization |
MFS Total Return Portfolio (the fund) is a series of MFS Variable Insurance Trust II (the trust). The trust is organized as a Massachusetts business trust and is registered under the Investment Company Act of 1940, as amended, as an open-end management investment company. The shareholders of each series of the trust are separate accounts of insurance companies, which offer variable annuity and/or life insurance products, and qualified retirement and pension plans.
| (2) | | Significant Accounting Policies |
General – The preparation of financial statements in conformity with U.S. generally accepted accounting principles requires management to make estimates and assumptions that affect the reported amounts of assets and liabilities, and disclosure of contingent assets and liabilities at the date of the financial statements and the reported amounts of revenues and expenses during the reporting period. Actual results could differ from those estimates. In the preparation of these financial statements, management has evaluated subsequent events occurring after the date of the fund’s Statement of Assets and Liabilities through the date that the financial statements were issued. The fund invests a significant portion of its assets in asset-backed and/or mortgage-backed securities. The value of these securities may depend, in part, on the issuer’s or borrower’s credit quality or ability to pay principal and interest when due and may fall if an issuer or borrower defaults on its obligation to pay principal or interest or if the instrument’s credit rating is downgraded by a credit rating agency. U.S. Government securities not supported as to the payment of principal or interest by the U.S. Treasury, such as those issued by Fannie Mae, Freddie Mac, and the Federal Home Loan Banks, are subject to greater credit risk than are U.S. Government securities supported by the U.S. Treasury, such as those issued by Ginnie Mae.
In this reporting period, the fund adopted the disclosure provisions of the Financial Accounting Standards Board (FASB) Accounting Standards Update 2011-11 (“ASU 2011-11”), Balance Sheet (Topic 210) – Disclosures about Offsetting Assets and Liabilities along with the related scope clarification provisions of FASB Accounting Standards Update 2013-01 (“ASU 2013-01”) entitled Balance Sheet (Topic 210) – Clarifying the Scope of Disclosures about Offsetting Assets and Liabilities. ASU 2011-11 is intended to enhance disclosures on the offsetting of financial assets and liabilities by requiring entities to disclose both gross and net information about financial instruments and transactions that are either offset in the statement of financial position or subject to a Master Netting Agreement or similar arrangement. ASU 2013-01 limits the scope of ASU 2011-11’s disclosure requirements on offsetting to financial assets and financial liabilities related to derivatives, repurchase and reverse repurchase agreements, and securities lending and securities borrowing transactions. The disclosures required by ASU 2011-11, to the extent applicable to the fund, have been included in the fund’s Significant Accounting Policies note under the captions for each of the fund’s in-scope financial instruments and transactions.
In June 2013, FASB issued Accounting Standards Update 2013-08 Financial Services – Investment Companies (Topic 946) – Amendments to the Scope, Measurement, and Disclosure Requirements (“ASU 2013-08”) which is effective for interim and annual reporting periods in fiscal years that begin after December 15, 2013. ASU 2013-08 sets forth a methodology for determining whether an entity should be characterized as an investment company and prescribes fair value accounting for an investment company’s non-controlling ownership interest in another investment company. FASB has determined that a fund registered under the Investment Company Act of 1940 automatically meets ASU 2013-08’s criteria for an investment company. Although still evaluating the potential impacts of ASU 2013-08 to the fund, management expects that the impact of the fund’s adoption will be limited to additional financial statement disclosures.
Investment Valuations – Equity securities, including restricted equity securities, are generally valued at the last sale or official closing price as provided by a third-party pricing service on the market or exchange on which they are primarily traded. Equity securities, for which there were no sales reported that day, are generally valued at the last quoted daily bid quotation as provided by a third-party pricing service on the market or exchange on which such securities are primarily traded. Debt instruments and floating rate loans (other than short-term instruments), including restricted debt instruments, are generally valued at an evaluated or composite bid as provided by a third-party pricing service. Short-term instruments with a maturity at issuance of 60 days or less generally are valued at amortized cost, which approximates market value. Open-end investment companies are generally valued at net asset value per share. Securities and other assets generally valued on the basis of information from a third-party pricing service may also be valued at a broker/dealer bid quotation. Values obtained from third-party pricing services can utilize both transaction data and market information such as yield, quality, coupon rate, maturity, type of issue, trading characteristics, and other market data. The values of foreign securities and other assets and liabilities expressed in foreign currencies are converted to U.S. dollars using the mean of bid and asked prices for rates provided by a third-party pricing service.
The Board of Trustees has delegated primary responsibility for determining or causing to be determined the value of the fund’s investments (including any fair valuation) to the adviser pursuant to valuation policies and procedures approved by the Board. If the adviser determines that reliable market quotations are not readily available, investments are valued at fair value as determined in good faith by the adviser in accordance with such procedures under the oversight of the Board of Trustees. Under the fund’s valuation policies and procedures, market quotations are not considered to be readily available for most types of debt instruments and floating rate loans and many types of derivatives. These investments are generally valued at fair value based on information from third-party pricing services. In addition, investments may be valued at fair value if the adviser determines that an investment’s value
18
MFS Total Return Portfolio
Notes to Financial Statements (unaudited) – continued
has been materially affected by events occurring after the close of the exchange or market on which the investment is principally traded (such as foreign exchange or market) and prior to the determination of the fund’s net asset value, or after the halting of trading of a specific security where trading does not resume prior to the close of the exchange or market on which the security is principally traded. Events that occur on a frequent basis after foreign markets close (such as developments in foreign markets and significant movements in the U.S. markets) and prior to the determination of the fund’s net asset value may be deemed to have a material effect on the value of securities traded in foreign markets. Accordingly, the fund’s foreign equity securities may often be valued at fair value. The adviser generally relies on third-party pricing services or other information (such as the correlation with price movements of similar securities in the same or other markets; the type, cost and investment characteristics of the security; the business and financial condition of the issuer; and trading and other market data) to assist in determining whether to fair value and at what value to fair value an investment. The value of an investment for purposes of calculating the fund’s net asset value can differ depending on the source and method used to determine value. When fair valuation is used, the value of an investment used to determine the fund’s net asset value may differ from quoted or published prices for the same investment. There can be no assurance that the fund could obtain the fair value assigned to an investment if it were to sell the investment at the same time at which the fund determines its net asset value per share.
Various inputs are used in determining the value of the fund’s assets or liabilities. These inputs are categorized into three broad levels. In certain cases, the inputs used to measure fair value may fall into different levels of the fair value hierarchy. In such cases, an investment’s level within the fair value hierarchy is based on the lowest level of input that is significant to the fair value measurement. The fund’s assessment of the significance of a particular input to the fair value measurement in its entirety requires judgment, and considers factors specific to the investment. Level 1 includes unadjusted quoted prices in active markets for identical assets or liabilities. Level 2 includes other significant observable market-based inputs (including quoted prices for similar securities, interest rates, prepayment speed, and credit risk). Level 3 includes unobservable inputs, which may include the adviser’s own assumptions in determining the fair value of investments. The following is a summary of the levels used as of June 30, 2013 in valuing the fund’s assets or liabilities:
| | | | | | | | | | | | | | | | |
| Investments at Value | | Level 1 | | | Level 2 | | | Level 3 | | | Total | |
| Equity Securities | | | | | | | | | | | | | | | | |
United States | | | $687,225,039 | | | | $— | | | | $— | | | | $687,225,039 | |
United Kingdom | | | — | | | | 16,008,395 | | | | — | | | | 16,008,395 | |
Switzerland | | | — | | | | 10,160,722 | | | | — | | | | 10,160,722 | |
Japan | | | 1,761,645 | | | | 5,517,480 | | | | — | | | | 7,279,125 | |
France | | | 4,373,870 | | | | 2,533,239 | | | | — | | | | 6,907,109 | |
Canada | | | 6,904,951 | | | | — | | | | — | | | | 6,904,951 | |
Brazil | | | 4,070,437 | | | | — | | | | — | | | | 4,070,437 | |
Germany | | | 3,443,140 | | | | — | | | | — | | | | 3,443,140 | |
Netherlands | | | — | | | | 3,405,498 | | | | — | | | | 3,405,498 | |
Other Countries | | | 4,397,373 | | | | 8,628,936 | | | | — | | | | 13,026,309 | |
U.S. Treasury Bonds & U.S. Government
Agency & Equivalents | | | — | | | | 144,172,190 | | | | — | | | | 144,172,190 | |
| Non-U.S. Sovereign Debt | | | — | | | | 18,938,760 | | | | — | | | | 18,938,760 | |
| U.S. Corporate Bonds | | | — | | | | 81,444,463 | | | | — | | | | 81,444,463 | |
| Residential Mortgage-Backed Securities | | | — | | | | 164,194,894 | | | | — | | | | 164,194,894 | |
| Commercial Mortgage-Backed Securities | | | — | | | | 27,994,434 | | | | — | | | | 27,994,434 | |
| Asset-Backed Securities (including CDOs) | | | — | | | | 1,893,819 | | | | — | | | | 1,893,819 | |
| Foreign Bonds | | | — | | | | 38,277,342 | | | | — | | | | 38,277,342 | |
| Mutual Funds | | | 53,977,127 | | | | — | | | | — | | | | 53,977,127 | |
| Total Investments | | | $766,153,582 | | | | $523,170,172 | | | | $— | | | | $1,289,323,754 | |
For further information regarding security characteristics, see the Portfolio of Investments.
Of the level 2 investments presented above, equity investments amounting to $6,741,048 would have been considered level 1 investments at the beginning of the period. Of the level 1 investments presented above, equity investments amounting to $5,944,631 would have been considered level 2 investments at the beginning of the period. The primary reason for changes in the classifications between levels 1 and 2 occurs when foreign equity securities are fair valued using other observable market-based inputs in place of the closing exchange price due to events occurring after the close of the exchange or market on which the investment is principally traded. The fund’s foreign equity securities may often be valued at fair value. The fund’s policy is to recognize transfers between the levels as of the end of the period.
Foreign Currency Translation – Purchases and sales of foreign investments, income, and expenses are converted into U.S. dollars based upon currency exchange rates prevailing on the respective dates of such transactions or on the reporting date for foreign
19
MFS Total Return Portfolio
Notes to Financial Statements (unaudited) – continued
denominated receivables and payables. Gains and losses attributable to foreign currency exchange rates on sales of securities are recorded for financial statement purposes as net realized gains and losses on investments. Gains and losses attributable to foreign exchange rate movements on receivables, payables, income and expenses are recorded for financial statement purposes as foreign currency transaction gains and losses. That portion of both realized and unrealized gains and losses on investments that results from fluctuations in foreign currency exchange rates is not separately disclosed.
Security Loans – Under its Securities Lending Agency Agreement with the fund, State Street Bank and Trust Company (“State Street”), as lending agent, loans the securities of the fund to certain qualified institutions (the “Borrowers”) approved by the fund. The loans are collateralized by cash and/or U.S. Treasury and federal agency obligations in an amount typically at least equal to the market value of the securities loaned. The market value of the loaned securities is determined at the close of business of the fund and any additional required collateral is delivered to the fund on the next business day. State Street provides the fund with indemnification against Borrower default. In the event of Borrower default, State Street will for the benefit of the fund either purchase securities identical to those loaned or, when such purchase is commercially impracticable, pay the fund the market value of the loaned securities. In return, State Street assumes the fund’s rights to the related collateral. If the collateral value is less than the cost to purchase identical securities, State Street is responsible for the shortfall, but only to the extent that such shortfall is not due to a decline in collateral value resulting from collateral reinvestment for which the fund bears the risk of loss. On loans collateralized by cash, the cash collateral is invested in a money market fund or short-term securities. At period end, the fund had investment securities on loan with a fair value of $3,196,960 and a related liability of $3,339,820 for collateral received on securities loaned, both of which are presented gross on the Statement of Assets and Liabilities. The carrying value of the collateral for securities loaned approximates fair value which would have been considered level 2 under the fair value hierarchy if the collateral for securities loaned were carried at fair value. The collateral received on securities loaned exceeded the value of securities on loan at period end. A portion of the income generated upon investment of the collateral is remitted to the Borrowers, and the remainder is allocated between the fund and the lending agent. On loans collateralized by U.S. Treasury and/or federal agency obligations, a fee is received from the Borrower, and is allocated between the fund and the lending agent. Income from securities lending is included in “Interest” income in the Statement of Operations. The dividend and interest income earned on the securities loaned is accounted for in the same manner as other dividend and interest income.
Indemnifications – Under the fund’s organizational documents, its officers and Trustees may be indemnified against certain liabilities and expenses arising out of the performance of their duties to the fund. Additionally, in the normal course of business, the fund enters into agreements with service providers that may contain indemnification clauses. The fund’s maximum exposure under these agreements is unknown as this would involve future claims that may be made against the fund that have not yet occurred.
Investment Transactions and Income – Investment transactions are recorded on the trade date. Interest income is recorded on the accrual basis. All premium and discount is amortized or accreted for financial statement purposes in accordance with U.S. generally accepted accounting principles. Dividends received in cash are recorded on the ex-dividend date. Certain dividends from foreign securities will be recorded when the fund is informed of the dividend if such information is obtained subsequent to the ex-dividend date. Dividend and interest payments received in additional securities are recorded on the ex-dividend or ex-interest date in an amount equal to the value of the security on such date.
The fund may receive proceeds from litigation settlements. Any proceeds received from litigation involving portfolio holdings are reflected in the Statement of Operations in realized gain/loss if the security has been disposed of by the fund or in unrealized gain/loss if the security is still held by the fund. Any other proceeds from litigation not related to portfolio holdings are reflected as other income in the Statement of Operations.
The fund purchased or sold debt securities on a when-issued or delayed delivery basis, or in a “To Be Announced” (TBA) or “forward commitment” transaction with delivery or payment to occur at a later date beyond the normal settlement period. TBA securities resulting from these transactions are included in the Portfolio of Investments. At the time a fund enters into a commitment to purchase or sell a security, the transaction is recorded and the value of the security acquired is reflected in the fund’s net asset value. The price of such security and the date that the security will be delivered and paid for are fixed at the time the transaction is negotiated. The value of the security may vary with market fluctuations. TBA purchase commitments are held at carrying amount, which approximates fair value and are categorized as level 2 within the fair value hierarchy disclosure. No interest accrues to the fund until payment takes place. At the time that a fund enters into this type of transaction, the fund is required to have sufficient cash and/or liquid securities to cover its commitments. Losses may arise due to changes in the value of the underlying securities or if the counterparty does not perform under the contract’s terms, or if the issuer does not issue the securities due to political, economic or other factors. Additionally, losses may arise due to declines in the value of the securities prior to settlement date.
Fees Paid Indirectly – The fund’s custody fee may be reduced according to an arrangement that measures the value of cash deposited with the custodian by the fund. This amount, for the six months ended June 30, 2013, is shown as a reduction of total expenses in the Statement of Operations.
20
MFS Total Return Portfolio
Notes to Financial Statements (unaudited) – continued
Tax Matters and Distributions – The fund intends to qualify as a regulated investment company, as defined under Subchapter M of the Internal Revenue Code, and to distribute all of its taxable income, including realized capital gains. As a result, no provision for federal income tax is required. The fund’s federal tax returns, when filed, will remain subject to examination by the Internal Revenue Service for a three year period. Foreign taxes have been accrued by the fund in the accompanying financial statements in accordance with the applicable foreign tax law. Foreign income taxes may be withheld by certain countries in which the fund invests.
Distributions to shareholders are recorded on the ex-dividend date. Income and capital gain distributions are determined in accordance with income tax regulations, which may differ from U.S. generally accepted accounting principles. Certain capital accounts in the financial statements are periodically adjusted for permanent differences in order to reflect their tax character. These adjustments have no impact on net assets or net asset value per share. Temporary differences which arise from recognizing certain items of income, expense, gain or loss in different periods for financial statement and tax purposes will reverse at some time in the future. Distributions in excess of net investment income or net realized gains are temporary overdistributions for financial statement purposes resulting from differences in the recognition or classification of income or distributions for financial statement and tax purposes.
Book/tax differences primarily relate to amortization and accretion of debt securities and wash sale loss deferrals.
The tax character of distributions declared to shareholders for the last fiscal year is as follows:
| | | | |
| | | 12/31/12 | |
| Ordinary income (including any short-term capital gains) | | | $31,575,153 | |
The federal tax cost and the tax basis components of distributable earnings were as follows:
| | | | |
| As of 6/30/13 | | | | |
| Cost of investments | | | $1,185,686,462 | |
| Gross appreciation | | | 135,553,448 | |
| Gross depreciation | | | (31,916,156 | ) |
| Net unrealized appreciation (depreciation) | | | $103,637,292 | |
| |
| As of 12/31/12 | | | | |
| Undistributed ordinary income | | | 30,511,907 | |
| Capital loss carryforwards | | | (29,948,427 | ) |
| Other temporary differences | | | 7,254 | |
| Net unrealized appreciation (depreciation) | | | 102,006,455 | |
The aggregate cost above includes prior fiscal year end tax adjustments, if applicable.
Under the Regulated Investment Company Modernization Act of 2010 (the “Act”), net capital losses recognized for fund fiscal years beginning after December 31, 2010 may be carried forward indefinitely, and their character is retained as short-term and/or long-term losses (“post-enactment losses”). Previously, net capital losses were carried forward for eight years and treated as short-term losses (“pre-enactment losses”). As a transition rule, the Act requires that all post-enactment net capital losses be used before pre-enactment net capital losses.
As of December 31, 2012 the fund had capital loss carryforwards available to offset future realized gains. Such pre-enactment losses expire as follows:
| | | | |
| 12/31/16 | | | $(13,894,109 | ) |
| 12/31/17 | | | (16,054,318 | ) |
| Total | | | $(29,948,427 | ) |
Multiple Classes of Shares of Beneficial Interest – The fund offers multiple classes of shares, which differ in their respective distribution and/or service fees. The fund’s income, realized and unrealized gain (loss), and common expenses are allocated to shareholders based on the daily net assets of each class. Dividends are declared separately for each class. Differences in per share dividend rates are generally due to differences in separate class expenses. The fund’s distributions declared to shareholders as reported in the Statements of Changes in Net Assets are presented by class as follows:
| | | | | | | | |
| | | From net investment
income | |
| | | Six months ended
6/30/13 | | | Year ended
12/31/12 | |
| Initial Class | | | $— | | | | $15,190,277 | |
| Service Class | | | — | | | | 16,384,876 | |
| Total | | | $— | | | | $31,575,153 | |
21
MFS Total Return Portfolio
Notes to Financial Statements (unaudited) – continued
| (3) | | Transactions with Affiliates |
Investment Adviser – The fund has an investment advisory agreement with MFS to provide overall investment management and related administrative services and facilities to the fund. The management fee is computed daily and paid monthly at the following annual rates:
| | | | |
| First $300 million of average daily net assets | | | 0.75% | |
| Next $700 million of average daily net assets | | | 0.675% | |
| Average daily net assets in excess of $1 billion | | | 0.60% | |
Effective April 1, 2013, MFS has agreed in writing to reduce its management fee by a specified amount if certain MFS mutual fund assets exceed thresholds agreed to by MFS and the fund’s Board of Trustees. For the period April 1, 2013 through June 30, 2013, this management fee reduction amounted to $1,723, which is shown as a reduction of total expenses in the Statement of Operations. The management fee incurred for the six months ended June 30, 2013 was equivalent to an annual effective rate of 0.68% of the fund’s average daily net assets.
The investment adviser has agreed in writing to pay a portion of the fund’s total annual operating expenses, exclusive of interest, taxes, extraordinary expenses, brokerage and transaction costs, and investment-related expenses such that total annual operating expenses do not exceed 0.74% of average daily net assets for the Initial Class shares and 0.99% of average daily net assets for the Service Class shares. This written agreement will continue until modified by the fund’s Board of Trustees, but such agreement will continue at least until April 30, 2014. For the six months ended June 30, 2013, the fund’s actual operating expenses did not exceed the limit and therefore, the investment adviser did not pay any portion of the fund’s expenses, related to this agreement.
Distributor – MFS Fund Distributors, Inc. (MFD), a wholly-owned subsidiary of MFS, is the distributor of shares of the fund. The Trustees have adopted a distribution plan for the Service Class shares pursuant to Rule 12b-1 under the Investment Company Act of 1940.
The fund’s distribution plan provides that the fund will pay MFD distribution and/or service fees equal to 0.25% per annum of its average daily net assets attributable to Service Class shares as partial consideration for services performed and expenses incurred by MFD and financial intermediaries (including participating insurance companies that invest in the fund to fund variable annuity and variable life insurance contracts, sponsors of qualified retirement and pension plans that invest in the fund, and affiliates of these participating insurance companies and plan sponsors) in connection with the sale and distribution of the Service Class shares. MFD may subsequently pay all, or a portion, of the distribution and/or service fees to financial intermediaries.
Shareholder Servicing Agent – Effective April 1, 2013, MFS Service Center, Inc. (MFSC), a wholly-owned subsidiary of MFS, receives a fee from the fund for its services as shareholder servicing agent. For the period from April 1, 2013 through June 30, 2013, the fee was $6,381, which equated to 0.001% annually of the fund’s average daily net assets. MFSC also receives payment from the fund for out-of-pocket expenses paid by MFSC on behalf of the fund. For the period from April 1, 2013 through June 30, 2013, these costs amounted to $5.
Administrator – MFS provides certain financial, legal, shareholder communications, compliance, and other administrative services to the fund. Under an administrative services agreement, the fund partially reimburses MFS the costs incurred to provide these services. The fund is charged an annual fixed amount of $17,500 plus a fee based on average daily net assets. The administrative services fee incurred for the six months ended June 30, 2013 was equivalent to an annual effective rate of 0.0133% of the fund’s average daily net assets.
Trustees’ and Officers’ Compensation – The fund pays compensation to independent Trustees in the form of a retainer, attendance fees, and additional compensation to Board and Committee chairpersons. The fund does not pay compensation directly to Trustees or officers of the fund who are also officers of the investment adviser, all of whom receive remuneration for their services to the fund from MFS. Certain officers and Trustees of the fund are officers or directors of MFS, MFD, and MFSC.
Other – This fund and certain other funds managed by MFS (the funds) have entered into services agreements (the Agreements) which provide for payment of fees by the funds to Tarantino LLC and Griffin Compliance LLC in return for the provision of services of an Independent Chief Compliance Officer (ICCO) and Assistant ICCO, respectively, for the funds. The ICCO and Assistant ICCO are officers of the funds and the sole members of Tarantino LLC and Griffin Compliance LLC, respectively. The funds can terminate the Agreements with Tarantino LLC and Griffin Compliance LLC at any time under the terms of the Agreements. For the six months ended June 30, 2013, the aggregate fees paid by the fund to Tarantino LLC and Griffin Compliance LLC were $4,878 and are included in “Miscellaneous” expense in the Statement of Operations. MFS has agreed to reimburse the fund for a portion of the payments made by the fund in the amount of $2,412, which is shown as a reduction of total expenses in the Statement of Operations. Additionally, MFS has agreed to bear all expenses associated with office space, other administrative support, and supplies provided to the ICCO and Assistant ICCO.
22
MFS Total Return Portfolio
Notes to Financial Statements (unaudited) – continued
The fund invests in the MFS Institutional Money Market Portfolio which is managed by MFS and seeks current income consistent with preservation of capital and liquidity. Income earned on this investment is included in “Dividends from underlying affiliated funds” in the Statement of Operations. This money market fund does not pay a management fee to MFS.
Purchases and sales of investments, other than short-term obligations, were as follows:
| | | | | | | | |
| | | Purchases | | | Sales | |
| U.S. Government securities | | | $195,912,007 | | | | $189,003,755 | |
| Investments (non-U.S. Government securities) | | | $260,196,948 | | | | $363,753,078 | |
| (5) | | Shares of Beneficial Interest |
The fund’s Declaration of Trust permits the Trustees to issue an unlimited number of full and fractional shares of beneficial interest. Transactions in fund shares were as follows:
| | | | | | | | | | | | | | | | |
| | | Six months ended 6/30/13 | | | Year ended 12/31/12 | |
| | | Shares | | | Amount | | | Shares | | | Amount | |
| Shares sold | | | | | | | | | | | | | | | | |
Initial Class | | | 98,683 | | | | $1,904,432 | | | | 254,736 | | | | $4,488,706 | |
Service Class | | | 194,748 | | | | 3,748,466 | | | | 294,390 | | | | 5,092,764 | |
| | | 293,431 | | | | $5,652,898 | | | | 549,126 | | | | $9,581,470 | |
| Shares issued to shareholders in reinvestment of distributions | | | | | | | | | | | | | | | | |
Initial Class | | | — | | | | $— | | | | 867,520 | | | | $15,190,277 | |
Service Class | | | — | | | | — | | | | 943,829 | | | | 16,384,876 | |
| | | — | | | | $— | | | | 1,811,349 | | | | $31,575,153 | |
| Shares reacquired | | | | | | | | | | | | | | | | |
Initial Class | | | (2,080,747 | ) | | | $(40,057,462 | ) | | | (4,874,788 | ) | | | $(85,781,901 | ) |
Service Class | | | (3,871,649 | ) | | | (73,658,886 | ) | | | (7,886,087 | ) | | | (137,162,991 | ) |
| | | (5,952,396 | ) | | | $(113,716,348 | ) | | | (12,760,875 | ) | | | $(222,944,892 | ) |
| Net change | | | | | | | | | | | | | | | | |
Initial Class | | | (1,982,064 | ) | | | $(38,153,030 | ) | | | (3,752,532 | ) | | | $(66,102,918 | ) |
Service Class | | | (3,676,901 | ) | | | (69,910,420 | ) | | | (6,647,868 | ) | | | (115,685,351 | ) |
| | | (5,658,965 | ) | | | $(108,063,450 | ) | | | (10,400,400 | ) | | | $(181,788,269 | ) |
The fund and certain other funds managed by MFS participate in a $1.1 billion unsecured committed line of credit, subject to a $1 billion sublimit, provided by a syndication of banks under a credit agreement. Borrowings may be made for temporary financing needs. Interest is charged to each fund, based on its borrowings, generally at a rate equal to the higher of the Federal Reserve funds rate or one month LIBOR plus an agreed upon spread. A commitment fee, based on the average daily, unused portion of the committed line of credit, is allocated among the participating funds at the end of each calendar quarter. In addition, the fund and other funds managed by MFS have established unsecured uncommitted borrowing arrangements with certain banks for temporary financing needs. Interest is charged to each fund, based on its borrowings, at a rate equal to the Federal Reserve funds rate plus an agreed upon spread. For the six months ended June 30, 2013, the fund’s commitment fee and interest expense were $3,210 and $0, respectively, and are included in “Miscellaneous” expense in the Statement of Operations.
| (7) | | Transactions in Underlying Affiliated Funds – Affiliated Issuers |
An affiliated issuer may be considered one in which the fund owns 5% or more of the outstanding voting securities, or a company which is under common control. For the purposes of this report, the fund assumes the following to be an affiliated issuer:
| | | | | | | | | | | | | | | | |
| Underlying Affiliated Fund | | Beginning
Shares/Par
Amount | | | Acquisitions
Shares/Par
Amount | | | Dispositions
Shares/Par
Amount | | | Ending
Shares/Par
Amount | |
| MFS Institutional Money Market Portfolio | | | 24,125,189 | | | | 143,491,286 | | | | (116,979,168 | ) | | | 50,637,307 | |
| | | | |
| Underlying Affiliated Fund | | Realized
Gain (Loss) | | | Capital Gain
Distributions | | | Dividend
Income | | | Ending
Value | |
| MFS Institutional Money Market Portfolio | | | $— | | | | $— | | | | $28,016 | | | | $50,637,307 | |
On April 9, 2013, the Board of Trustees of the fund approved the proposed Agreement and Plan of Reorganization, whereby MFS Total Return Portfolio would be reorganized into MFS Total Return Series, a series of MFS Variable Insurance Trust. The
23
MFS Total Return Portfolio
Notes to Financial Statements (unaudited) – continued
Agreement and Plan of Reorganization is subject to the approval of the shareholders of the MFS Total Return Portfolio. The proposed Agreement and Plan of Reorganization provides for the transfer of the assets of the MFS Total Return Portfolio to the MFS Total Return Series and the assumption by the MFS Total Return Series of the liabilities of the MFS Total Return Portfolio in exchange solely for shares of beneficial interest in the MFS Total Return Series. Immediately following the transfer, the MFS Total Return Series shares received by the MFS Total Return Portfolio will be distributed to shareholders, pro rata, and the MFS Total Return Portfolio will be liquidated and terminated. On August 8, 2013, shareholders approved the reorganization. It is expected that the reorganization will occur on or around August 16, 2013.
24
MFS Total Return Portfolio
BOARD REVIEW OF INVESTMENT ADVISORY AGREEMENT
A discussion regarding the Board’s most recent review and renewal of the fund’s Investment Advisory Agreement with MFS will be available on or about November 1, 2013 by clicking on the fund’s name under “Variable Insurance Portfolios — VIT II” in the “Products” section of the MFS Web site (mfs.com).
PROXY VOTING POLICIES AND INFORMATION
A general description of the MFS funds’ proxy voting policies and procedures is available without charge, upon request, by calling 1-800-225-2606, by visiting the Proxy Voting section of mfs.com or by visiting the SEC’s Web site at http://www.sec.gov.
Information regarding how the fund voted proxies relating to portfolio securities during the most recent twelve-month period ended June 30 is available without charge by visiting the Proxy Voting section of mfs.com or by visiting the SEC’s Web site at http://www.sec.gov.
QUARTERLY PORTFOLIO DISCLOSURE
The fund will file a complete schedule of portfolio holdings with the Securities and Exchange Commission (the Commission) for the first and third quarters of each fiscal year on Form N-Q. The fund’s Form N-Q is available on the EDGAR database on the Commission’s Internet Web site at http://www.sec.gov, and may be reviewed and copied at the:
Public Reference Room
Securities and Exchange Commission
100 F Street, NE, Room 1580
Washington, D.C. 20549
Information on the operation of the Public Reference Room may be obtained by calling the Commission at 1-800-SEC-0330. Copies of the fund’s Form N-Q also may be obtained, upon payment of a duplicating fee, by electronic request at the following e-mail address: publicinfo@sec.gov or by writing the Public Reference Section at the above address.
FURTHER INFORMATION
From time to time, MFS may post important information about the fund or the MFS funds on the MFS web site (mfs.com). This information is available by visiting the “News & Commentary” section of mfs.com or by clicking on the fund’s name under “Variable Insurance Portfolios — VIT II” in the “Products” section of mfs.com.
25
SEMIANNUAL REPORT
June 30, 2013

MFS® HIGH YIELD PORTFOLIO
MFS® Variable Insurance Trust II

HYS-SEM
MFS® HIGH YIELD PORTFOLIO
CONTENTS
The report is prepared for the general information of contract owners. It is authorized for distribution to prospective investors only when preceded or accompanied by a current prospectus.
NOT FDIC INSURED Ÿ MAY LOSE VALUE Ÿ NO BANK OR CREDIT UNION GUARANTEE Ÿ NOT A DEPOSIT Ÿ NOT INSURED BY ANY FEDERAL GOVERNMENT AGENCY OR NCUA/NCUSIF
MFS High Yield Portfolio
LETTER FROM THE CHAIRMAN AND CEO

Dear Contract Owners:
As the year progresses, the global economy continues to grind ahead slowly, held back by broad austerity measures. The U.S. economy remains a steadying force, driven by resilient consumers, who have taken the payroll tax increase and the sequestration’s early impact in stride. With U.S. housing and jobs showing steady expansion, domestic consumer-driven growth has offset weaker exports and the U.S. government’s spending constraints. In response to these developments, the U.S. Federal Reserve has begun to brace investors for an eventual shift in its monetary policy, causing global market tremors.
Japan has been another bright spot, with government and central bank stimulus policies leading to increased exports, a resurgent stock market and improved economic sentiment. After a six-month rally, Japan’s stocks slipped late in the second quarter, then picked up momentum on fresh signs that the country could soon break free of its chronic deflation. The major deterrent to global growth remains the eurozone, still in the grip of persistent recession. China has seen its pace of economic growth decelerate, a troubling turn for the country’s trading partners, who have come to rely on it as an engine for global growth.
As always, managing risk in the face of uncertainty remains a top priority for investors. At MFS®, our uniquely collaborative investment process employs integrated, global research and active risk management. Our global team of investment professionals shares ideas and evaluates opportunities across continents, investment disciplines and asset classes — all with a goal of building better insights, and ultimately better results, for our clients.
We are mindful of the many economic challenges investors face, and believe it is more important than ever to maintain a long-term view and employ time-tested principles, such as asset allocation and diversification. We remain confident that our unique approach can serve investors well as they work with their financial advisors to identify and pursue the most suitable opportunities.
Respectfully,

Robert J. Manning
Chairman and Chief Executive Officer
MFS Investment Management®
August 16, 2013
The opinions expressed in this letter are subject to change, may not be relied upon for investment advice, and no forecasts can be guaranteed.
1
MFS High Yield Portfolio
PORTFOLIO COMPOSITION
Portfolio structure (i)
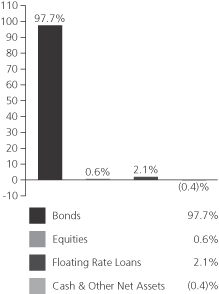
| | | | |
| Top five industries (i) | | | | |
| Energy-Independent | | | 8.5% | |
| Medical & Health Technology & Services | | | 5.3% | |
| Broadcasting | | | 5.1% | |
| Wireless Communications | | | 4.5% | |
| Utilities-Electric Power | | | 4.0% | |
| | | | |
| Composition including fixed income credit quality (a)(i) | |
| A (o) | | | 0.0% | |
| BBB | | | 4.1% | |
| BB | | | 36.0% | |
| B | | | 45.0% | |
| CCC | | | 13.2% | |
| C (o) | | | 0.0% | |
| D (o) | | | 0.0% | |
| Not Rated | | | 1.5% | |
| Non-Fixed Income | | | 0.6% | |
| Cash & Other | | | (0.4)% | |
| |
| Portfolio facts (i) | | | | |
| Average Duration (d) | | | 4.5 | |
| Average Effective Maturity (m) | | | 6.9 yrs. | |
| (a) | | For all securities other than those specifically described below, ratings are assigned to underlying securities utilizing ratings from Moody’s, Fitch, and Standard & Poor’s rating agencies and applying the following hierarchy: If all three agencies provide a rating, the middle rating (after dropping the highest and lowest ratings) is assigned; if two of the three agencies rate a security, the lower of the two is assigned. Ratings are shown in the S&P and Fitch scale (e.g., AAA). Securities rated BBB or higher are considered investment grade. All ratings are subject to change. Not Rated includes fixed income securities, including fixed income futures contracts, which have not been rated by any rating agency. Non-Fixed Income includes equity securities (including convertible bonds and equity derivatives) and commodities. Cash & Other includes cash, other assets less liabilities, offsets to derivative positions, and short-term securities. The fund may not hold all of these instruments. The fund is not rated by these agencies. |
| (d) | | Duration is a measure of how much a bond’s price is likely to fluctuate with general changes in interest rates, e.g., if rates rise 1.00%, a bond with a 5-year duration is likely to lose about 5.00% of its value due to the interest rate move. |
| (i) | | For purposes of this presentation, the components include the market value of securities, and reflect the impact of the equivalent exposure of derivative positions, if any. These amounts may be negative from time to time. Equivalent exposure is a calculated amount that translates the derivative position into a reasonable approximation of the amount of the underlying asset that the portfolio would have to hold at a given point in time to have the same price sensitivity that results from the portfolio’s ownership of the derivative contract. When dealing with derivatives, equivalent exposure is a more representative measure of the potential impact of a position on portfolio performance than market value. The bond component will include any accrued interest amounts. |
| (m) | | In determining an instrument’s effective maturity for purposes of calculating the fund’s dollar-weighted average effective maturity, MFS uses the instrument’s stated maturity or, if applicable, an earlier date on which MFS believes it is probable that a maturity-shortening device (such as a put, pre-refunding or prepayment) will cause the instrument to be repaid. Such an earlier date can be substantially shorter than the instrument’s stated maturity. |
From time to time “Cash & Other Net Assets” may be negative due to borrowings for leverage transactions, timing of cash receipts, and/or equivalent exposure from any derivative holdings.
Where the fund holds convertible bonds, these are treated as part of the equity portion of the portfolio.
Percentages are based on net assets as of 6/30/13.
The portfolio is actively managed and current holdings may be different.
2
MFS High Yield Portfolio
EXPENSE TABLE
Fund Expenses Borne by the Contract Holders During the Period,
January 1, 2013 through June 30, 2013
As a contract holder of the fund, you incur ongoing costs, including management fees; distribution and/or service (12b-1) fees; and other fund expenses. This example is intended to help you understand your ongoing costs (in dollars) of investing in the fund and to compare these costs with the ongoing costs of investing in other mutual funds.
The example is based on an investment of $1,000 invested at the beginning of the period and held for the entire period January 1, 2013 through June 30, 2013.
Actual Expenses
The first line for each share class in the following table provides information about actual account values and actual expenses. You may use the information in this line, together with the amount you invested, to estimate the expenses that you paid over the period. Simply divide your account value by $1,000 (for example, an $8,600 account value divided by $1,000 = 8.6), then multiply the result by the number in the first line under the heading entitled “Expenses Paid During Period” to estimate the expenses you paid on your account during this period.
Hypothetical Example for Comparison Purposes
The second line for each share class in the following table provides information about hypothetical account values and hypothetical expenses based on the fund’s actual expense ratio and an assumed rate of return of 5% per year before expenses, which is not the fund’s actual return. The hypothetical account values and expenses may not be used to estimate the actual ending account balance or expenses you paid for the period. You may use this information to compare the ongoing costs of investing in the fund and other funds. To do so, compare this 5% hypothetical example with the 5% hypothetical examples that appear in the shareholder reports of the other funds.
Please note that the expenses shown in the table are meant to highlight the fund’s ongoing costs only and do not take into account the fees and expenses imposed under the variable contracts through which your investment in the fund is made. Therefore, the second line for each share class in the table is useful in comparing ongoing costs associated with an investment in vehicles (such as the fund) which fund benefits under variable annuity and variable life insurance contracts and to qualified pension and retirement plans only, and will not help you determine the relative total costs of investing in the fund through variable annuity and variable life insurance contracts. If the fees and expenses imposed under the variable contracts were included, your costs would have been higher.
| | | | | | | | | | | | | | | | | | |
| Share Class | | | | Annualized
Expense Ratio | | | Beginning
Account Value
1/01/13 | | | Ending
Account Value
6/30/13 | | | Expenses Paid
During Period (p)
1/01/13-6/30/13 | |
| Initial Class | | Actual | | | 0.75% | | | | $1,000.00 | | | | $1,008.26 | | | | $3.73 | |
| | Hypothetical (h) | | | 0.75% | | | | $1,000.00 | | | | $1,021.08 | | | | $3.76 | |
| Service Class | | Actual | | | 1.00% | | | | $1,000.00 | | | | $1,006.68 | | | | $4.98 | |
| | Hypothetical (h) | | | 1.00% | | | | $1,000.00 | | | | $1,019.84 | | | | $5.01 | |
| (h) | 5% class return per year before expenses. |
| (p) | Expenses paid are equal to each class’s annualized expense ratio, as shown above, multiplied by the average account value over the period, multiplied by the number of days in the period, divided by the number of days in the year. |
3
MFS High Yield Portfolio
PORTFOLIO OF INVESTMENTS – 6/30/13 (unaudited)
The Portfolio of Investments is a complete list of all securities owned by your fund. It is categorized by broad-based asset classes.
| | | | | | | | |
| Issuer | | Shares/Par | | | Value ($) | |
| | | | | | | | |
| BONDS – 94.8% | | | | | | | | |
| Aerospace – 2.4% | | | | | | | | |
| Bombardier, Inc., 4.25%, 2016 (n) | | $ | 294,000 | | | $ | 300,615 | |
| Bombardier, Inc., 7.5%, 2018 (n) | | | 2,795,000 | | | | 3,102,450 | |
| Bombardier, Inc., 7.75%, 2020 (n) | | | 525,000 | | | | 582,750 | |
| CPI International, Inc., 8%, 2018 | | | 1,504,000 | | | | 1,549,082 | |
| Heckler & Koch GmbH, 9.5%, 2018 (z) | | EUR | 705,000 | | | | 821,308 | |
| Huntington Ingalls Industries, Inc., 6.875%, 2018 | | $ | 250,000 | | | | 267,188 | |
| Huntington Ingalls Industries, Inc., 7.125%, 2021 | | | 2,100,000 | | | | 2,257,500 | |
| Kratos Defense & Security Solutions, Inc., 10%, 2017 | | | 1,995,000 | | | | 2,134,650 | |
| | | | | | | | |
| | | | | | $ | 11,015,543 | |
| | | | | | | | |
| Apparel Manufacturers – 0.9% | | | | | |
| Hanesbrands, Inc., 6.375%, 2020 | | $ | 1,185,000 | | | $ | 1,263,506 | |
| Jones Group, Inc., 6.875%, 2019 | | | 1,055,000 | | | | 1,060,275 | |
| PVH Corp., 7.375%, 2020 | | | 1,295,000 | | | | 1,405,075 | |
| PVH Corp., 4.5%, 2022 | | | 430,000 | | | | 412,800 | |
| | | | | | | | |
| | | | | | $ | 4,141,656 | |
| | | | | | | | |
| Asset-Backed & Securitized – 0.2% | |
| Arbor Realty Mortgage Securities, CDO, FRN, 2.576%, 2038 (z) | | $ | 568,229 | | | $ | 170,469 | |
| Citigroup Commercial Mortgage Trust, FRN, 5.884%, 2049 | | | 1,100,909 | | | | 143,118 | |
| Crest Ltd., CDO, 7%, 2040 (a)(p) | | | 189,642 | | | | 9,482 | |
| CWCapital Cobalt Ltd., CDO, 6.23%, 2045 (a)(p)(z) | | | 1,254,699 | | | | 12,547 | |
| CWCapital Cobalt Ltd., CDO, “F”, FRN, 1.575%, 2050 (p)(z) | | | 530,196 | | | | 1,325 | |
| First Union National Bank Commercial Mortgage Trust, 6.75%, 2032 | | | 743,426 | | | | 371,367 | |
| G-Force LLC, CDO, “A2”, 4.83%, 2036 (z) | | | 201,268 | | | | 202,274 | |
JPMorgan Chase Commercial Mortgage Securities Corp., “C”,
FRN, 6.197%, 2051 | | | 800,000 | | | | 163,719 | |
| | | | | | | | |
| | | | | | $ | 1,074,301 | |
| | | | | | | | |
| Automotive – 3.7% | | | | | | | | |
| Accuride Corp., 9.5%, 2018 | | $ | 1,550,000 | | | $ | 1,577,125 | |
Allison Transmission, Inc.,
7.125%, 2019 (n) | | | 2,235,000 | | | | 2,363,513 | |
| Conti-Gummi Finance B.V., 8.5%, 2015 | | EUR | 75,000 | | | | 101,812 | |
| Conti-Gummi Finance B.V., 7.5%, 2017 | | EUR | 100,000 | | | | 135,870 | |
Conti-Gummi Finance B.V.,
7.125%, 2018 | | EUR | 250,000 | | | | 338,429 | |
| Continental Rubber of America Corp., 4.5%, 2019 (n) | | $ | 165,000 | | | | 169,896 | |
| Delphi Corp., 5%, 2023 | | | 1,190,000 | | | | 1,222,725 | |
| Ford Motor Credit Co. LLC, 12%, 2015 | | | 130,000 | | | | 153,293 | |
| Ford Motor Credit Co. LLC, 8%, 2016 | | | 500,000 | | | | 585,569 | |
| | | | | | | | |
| Issuer | | Shares/Par | | | Value ($) | |
| | | | | | | | |
| BONDS – continued | | | | | | | | |
| Automotive – continued | | | | | | | | |
Ford Motor Credit Co. LLC,
8.125%, 2020 | | $ | 280,000 | | | $ | 337,280 | |
General Motors Financial Co., Inc.,
4.75%, 2017 (n) | | | 330,000 | | | | 338,250 | |
General Motors Financial Co., Inc.,
6.75%, 2018 | | | 1,830,000 | | | | 1,990,125 | |
General Motors Financial Co., Inc.,
4.25%, 2023 (n) | | | 510,000 | | | | 474,938 | |
Goodyear Tire & Rubber Co.,
8.25%, 2020 | | | 160,000 | | | | 175,200 | |
| Goodyear Tire & Rubber Co., 6.5%, 2021 | | | 1,230,000 | | | | 1,251,525 | |
| Goodyear Tire & Rubber Co., 7%, 2022 | | | 795,000 | | | | 814,875 | |
| Jaguar Land Rover PLC, 7.75%, 2018 (n) | | | 325,000 | | | | 351,000 | |
| Jaguar Land Rover PLC, 8.125%, 2021 (n) | | | 2,055,000 | | | | 2,260,500 | |
| Jaguar Land Rover PLC, 5.625%, 2023 (n) | | | 600,000 | | | | 582,000 | |
| Lear Corp., 8.125%, 2020 | | | 360,000 | | | | 394,200 | |
| Lear Corp., 4.75%, 2023 (n) | | | 365,000 | | | | 346,750 | |
| LKQ Corp., 4.75%, 2023 (n) | | | 570,000 | | | | 544,350 | |
| | | | | | | | |
| | | | | | $ | 16,509,225 | |
| | | | | | | | |
| Broadcasting – 5.0% | | | | | | | | |
| Allbritton Communications Co., 8%, 2018 | | $ | 590,000 | | | $ | 626,875 | |
| AMC Networks, Inc., 7.75%, 2021 | | | 1,854,000 | | | | 2,025,495 | |
| Clear Channel Communications, Inc., 9%, 2021 | | | 1,396,000 | | | | 1,326,200 | |
| Clear Channel Worldwide Holdings, Inc., 6.5%, 2022 (n) | | | 415,000 | | | | 425,375 | |
| Clear Channel Worldwide Holdings, Inc., 6.5%, 2022 (n) | | | 1,010,000 | | | | 1,040,300 | |
| Clear Channel Worldwide Holdings, Inc., “A”, 7.625%, 2020 | | | 35,000 | | | | 36,050 | |
| Clear Channel Worldwide Holdings, Inc., “B”, 7.625%, 2020 | | | 560,000 | | | | 579,600 | |
Hughes Network Systems LLC,
6.5%, 2019 | | | 125,000 | | | | 132,500 | |
Hughes Network Systems LLC,
7.625%, 2021 | | | 655,000 | | | | 695,938 | |
| IAC/InterActiveCorp, 4.75%, 2022 (n) | | | 400,000 | | | | 378,000 | |
| Inmarsat Finance PLC, 7.375%, 2017 (n) | | | 1,110,000 | | | | 1,154,400 | |
Intelsat Jackson Holdings S.A.,
6.625%, 2022 (n) | | | 1,415,000 | | | | 1,372,550 | |
Intelsat Jackson Holdings S.A.,
6.625%, 2022 (n) | | | 280,000 | | | | 271,600 | |
| Intelsat S.A., 8.125%, 2023 (n) | | | 810,000 | | | | 836,325 | |
LBI Media, Inc., 13.5% to 2015,
11.5% to 2020 (p)(z) | | | 486,303 | | | | 184,795 | |
| Liberty Media Corp., 8.5%, 2029 | | | 965,000 | | | | 1,056,675 | |
| Local TV Finance LLC, 9.25%, 2015 (p)(z) | | | 1,172,186 | | | | 1,173,651 | |
| Netflix, Inc., 5.375%, 2021 (n) | | | 695,000 | | | | 691,525 | |
Nexstar Broadcasting Group, Inc.,
8.875%, 2017 | | | 315,000 | | | | 337,050 | |
Nexstar Broadcasting Group, Inc.,
6.875%, 2020 (n) | | | 585,000 | | | | 602,550 | |
4
MFS High Yield Portfolio
Portfolio of Investments (unaudited) – continued
| | | | | | | | |
| Issuer | | Shares/Par | | | Value ($) | |
| | | | | | | | |
| BONDS – continued | | | | | | | | |
| Broadcasting – continued | | | | | | | | |
Sinclair Broadcast Group, Inc.,
9.25%, 2017 (n) | | $ | 465,000 | | | $ | 492,900 | |
| Sinclair Broadcast Group, Inc., 8.375%, 2018 | | | 875,000 | | | | 940,625 | |
| SIRIUS XM Radio, Inc., 8.75%, 2015 (n) | | | 535,000 | | | | 588,500 | |
| SIRIUS XM Radio, Inc., 7.625%, 2018 (n) | | | 595,000 | | | | 648,550 | |
| SIRIUS XM Radio, Inc., 4.25%, 2020 (n) | | | 305,000 | | | | 286,700 | |
| SIRIUS XM Radio, Inc., 5.25%, 2022 (n) | | | 1,605,000 | | | | 1,556,850 | |
| Univision Communications, Inc., 6.875%, 2019 (n) | | | 940,000 | | | | 987,000 | |
| Univision Communications, Inc., 7.875%, 2020 (n) | | | 700,000 | | | | 757,750 | |
Univision Communications, Inc.,
8.5%, 2021 (n) | | | 745,000 | | | | 791,563 | |
Univision Communications, Inc.,
6.75%, 2022 (n) | | | 250,000 | | | | 262,500 | |
| | | | | | | | |
| | | | | | $ | 22,260,392 | |
| | | | | | | | |
| Brokerage & Asset Managers – 0.6% | |
| E*TRADE Financial Corp., 6.75%, 2016 | | $ | 100,000 | | | $ | 102,750 | |
| E*TRADE Financial Corp., 6.375%, 2019 | | | 2,450,000 | | | | 2,486,750 | |
| | | | | | | | |
| | | | | | $ | 2,589,500 | |
| | | | | | | | |
| Building – 2.9% | | | | | | | | |
| ABC Supply Co., Inc., 5.625%, 2021 (n) | | $ | 270,000 | | | $ | 265,275 | |
| Boise Cascade Co., 6.375%, 2020 | | | 890,000 | | | | 901,125 | |
| Building Materials Holding Corp., 6.875%, 2018 (n) | | | 1,415,000 | | | | 1,492,825 | |
Building Materials Holding Corp.,
7%, 2020 (n) | | | 345,000 | | | | 367,425 | |
Building Materials Holding Corp.,
7.5%, 2020 (n) | | | 250,000 | | | | 267,500 | |
| Building Materials Holding Corp., 6.75%, 2021 (n) | | | 555,000 | | | | 589,688 | |
| CEMEX Espana S.A., 9.25%, 2020 (n) | | | 650,000 | | | | 685,750 | |
| CEMEX S.A.B. de C.V., 9%, 2018 (n) | | | 500,000 | | | | 525,000 | |
| CEMEX S.A.B. de C.V., 5.875%, 2019 (n) | | | 265,000 | | | | 257,050 | |
| CEMEX S.A.B. de C.V., 9.25%, 2020 | | | 575,000 | | | | 606,625 | |
| HD Supply, Inc., 8.125%, 2019 | | | 575,000 | | | | 629,625 | |
| HD Supply, Inc., 11.5%, 2020 | | | 840,000 | | | | 974,400 | |
| HD Supply, Inc., 10.5%, 2021 | | | 105,000 | | | | 108,675 | |
| Nortek, Inc., 8.5%, 2021 | | | 2,070,000 | | | | 2,214,900 | |
| Roofing Supply Group LLC/Roofing Supply Finance, Inc., 10%, 2020 (n) | | | 772,000 | | | | 835,690 | |
| USG Corp., 6.3%, 2016 | | | 1,831,000 | | | | 1,867,620 | |
| USG Corp., 7.875%, 2020 (n) | | | 340,000 | | | | 370,600 | |
| | | | | | | | |
| | | | | | $ | 12,959,773 | |
| | | | | | | | |
| Business Services – 1.8% | | | | | | | | |
| Equinix, Inc., 4.875%, 2020 | | $ | 795,000 | | | $ | 779,100 | |
| Fidelity National Information Services, Inc., 5%, 2022 | | | 1,770,000 | | | | 1,781,063 | |
| iGATE Corp., 9%, 2016 | | | 1,771,000 | | | | 1,841,840 | |
| Iron Mountain, Inc., 8.375%, 2021 | | | 1,845,000 | | | | 1,962,619 | |
Legend Acquisition Sub, Inc.,
10.75%, 2020 (n) | | | 375,000 | | | | 301,875 | |
| | | | | | | | |
| Issuer | | Shares/Par | | | Value ($) | |
| | | | | | | | |
| BONDS – continued | | | | | | | | |
| Business Services – continued | | | | | | | | |
| Neustar, Inc., 4.5%, 2023 (n) | | $ | 735,000 | | | $ | 694,575 | |
SunGard Data Systems, Inc.,
7.375%, 2018 | | | 650,000 | | | | 685,750 | |
SunGard Data Systems, Inc.,
7.625%, 2020 | | | 250,000 | | | | 265,000 | |
| | | | | | | | |
| | | | | | $ | 8,311,822 | |
| | | | | | | | |
| Cable TV – 3.4% | | | | | | | | |
| CCO Holdings LLC, 8.125%, 2020 | | $ | 1,615,000 | | | $ | 1,764,388 | |
| CCO Holdings LLC, 7.375%, 2020 | | | 520,000 | | | | 565,500 | |
| CCO Holdings LLC, 6.5%, 2021 | | | 1,395,000 | | | | 1,454,288 | |
| CCO Holdings LLC, 5.25%, 2022 | | | 250,000 | | | | 237,500 | |
| CCO Holdings LLC, 5.125%, 2023 | | | 495,000 | | | | 464,063 | |
| CCO Holdings LLC/CCO Capital Corp., 5.75%, 2024 | | | 620,000 | | | | 598,300 | |
| Cequel Communications Holdings, 6.375%, 2020 (n) | | | 930,000 | | | | 946,275 | |
| DISH DBS Corp., 7.75%, 2015 | | | 75,000 | | | | 81,188 | |
| DISH DBS Corp., 7.875%, 2019 | | | 100,000 | | | | 112,000 | |
| DISH DBS Corp., 6.75%, 2021 | | | 635,000 | | | | 674,688 | |
| DISH DBS Corp., 5.875%, 2022 | | | 500,000 | | | | 507,500 | |
| DISH DBS Corp., 5%, 2023 | | | 410,000 | | | | 394,625 | |
| EchoStar Corp., 7.125%, 2016 | | | 1,355,000 | | | | 1,466,788 | |
| Lynx I Corp., 5.375%, 2021 (n) | | | 650,000 | | | | 653,250 | |
| Lynx II Corp., 6.375%, 2023 (n) | | | 435,000 | | | | 438,263 | |
Telenet Finance Luxembourg,
6.375%, 2020 (n) | | EUR | 715,000 | | | | 952,085 | |
| UPC Holding B.V., 9.875%, 2018 (n) | | $ | 775,000 | | | | 840,875 | |
| UPC Holding B.V., 8.375%, 2020 | | EUR | 500,000 | | | | 692,803 | |
| UPC Holding B.V., 6.375%, 2022 (n) | | EUR | 250,000 | | | | 312,396 | |
| UPCB Finance III Ltd., 6.625%, 2020 (n) | | $ | 609,000 | | | | 630,315 | |
| UPCB Finance Ltd., 7.625%, 2020 | | EUR | 250,000 | | | | 343,310 | |
| UPCB Finance VI Ltd., 6.875%, 2022 (z) | | $ | 350,000 | | | | 362,250 | |
Virgin Media Finance PLC,
8.375%, 2019 | | | 184,000 | | | | 199,640 | |
| Ziggo Bond Co. B.V., 8%, 2018 (n) | | EUR | 495,000 | | | | 687,808 | |
| | | | | | | | |
| | | | | | $ | 15,380,098 | |
| | | | | | | | |
| Chemicals – 2.0% | | | | | | | | |
Celanese U.S. Holdings LLC,
6.625%, 2018 | | $ | 755,000 | | | $ | 798,413 | |
Celanese U.S. Holdings LLC,
5.875%, 2021 | | | 250,000 | | | | 265,000 | |
| Flash Dutch 2 B.V./U.S. Coatings Acquisition, 7.375%, 2021 (n) | | | 510,000 | | | | 520,200 | |
Hexion U.S. Finance Corp.,
6.625%, 2020 (n) | | | 540,000 | | | | 538,650 | |
| Hexion U.S. Finance Corp./Hexion Nova Scotia Finance, 8.875%, 2018 | | | 1,230,000 | | | | 1,254,600 | |
| Hexion U.S. Finance Corp./Hexion Nova Scotia Finance, 9%, 2020 | | | 940,000 | | | | 897,700 | |
Huntsman International LLC,
8.625%, 2020 | | | 400,000 | | | | 435,000 | |
Huntsman International LLC,
8.625%, 2021 | | | 875,000 | | | | 960,313 | |
5
MFS High Yield Portfolio
Portfolio of Investments (unaudited) – continued
| | | | | | | | |
| Issuer | | Shares/Par | | | Value ($) | |
| | | | | | | | |
| BONDS – continued | | | | | | | | |
| Chemicals – continued | | | | | | | | |
| INEOS Finance PLC, 8.375%, 2019 (n) | | $ | 470,000 | | | $ | 513,475 | |
| INEOS Finance PLC, 7.5%, 2020 (n) | | | 100,000 | | | | 106,250 | |
INEOS Group Holdings PLC,
7.875%, 2016 | | EUR | 505,243 | | | | 658,438 | |
INEOS Group Holdings S.A.,
6.125%, 2018 (n) | | $ | 420,000 | | | | 401,100 | |
| LyondellBasell Industries N.V., 5%, 2019 | | | 620,000 | | | | 674,620 | |
LyondellBasell Industries N.V.,
5.75%, 2024 | | | 200,000 | | | | 219,933 | |
| Polypore International, Inc., 7.5%, 2017 | | | 570,000 | | | | 594,225 | |
| | | | | | | | |
| | | | | | $ | 8,837,917 | |
| | | | | | | | |
| Computer Software – 1.1% | | | | | | | | |
| Infor U.S., Inc., 11.5%, 2018 | | $ | 715,000 | | | $ | 809,738 | |
Nuance Communications, Inc.,
5.375%, 2020 (n) | | | 460,000 | | | | 449,650 | |
| Syniverse Holdings, Inc., 9.125%, 2019 | | | 1,925,000 | | | | 2,054,938 | |
TransUnion Holding Co., Inc.,
8.125%, 2018 (n) | | | 100,000 | | | | 105,875 | |
TransUnion Holding Co., Inc.,
9.625%, 2018 | | | 290,000 | | | | 309,575 | |
| TransUnion LLC/TransUnion Financing Corp., 11.375%, 2018 | | | 640,000 | | | | 708,800 | |
| Verisign, Inc., 4.625%, 2023 (n) | | | 610,000 | | | | 591,700 | |
| | | | | | | | |
| | | | | | $ | 5,030,276 | |
| | | | | | | | |
| Computer Software – Systems – 1.0% | | | | | |
Audatex North America, Inc.,
6.75%, 2018 | | $ | 1,075,000 | | | $ | 1,128,750 | |
Audatex North America, Inc.,
6%, 2021 (z) | | | 520,000 | | | | 518,700 | |
CDW LLC/CDW Finance Corp.,
12.535%, 2017 | | | 412,000 | | | | 434,660 | |
CDW LLC/CDW Finance Corp.,
8.5%, 2019 | | | 2,215,000 | | | | 2,381,125 | |
| | | | | | | | |
| | | | | | $ | 4,463,235 | |
| | | | | | | | |
| Conglomerates – 1.7% | | | | | | | | |
Amsted Industries, Inc.,
8.125%, 2018 (n) | | $ | 1,455,000 | | | $ | 1,535,025 | |
| BC Mountain LLC, 7%, 2021 (n) | | | 750,000 | | | | 765,000 | |
Dynacast International LLC,
9.25%, 2019 | | | 1,030,000 | | | | 1,122,700 | |
| Griffon Corp., 7.125%, 2018 | | | 1,645,000 | | | | 1,723,138 | |
| Rexel S.A., 6.125%, 2019 (n) | | | 945,000 | | | | 963,900 | |
| Rexel S.A., 5.25%, 2020 (n) | | | 325,000 | | | | 324,188 | |
| Silver II Borrower, 7.75%, 2020 (n) | | | 1,365,000 | | | | 1,371,825 | |
| | | | | | | | |
| | | | | | $ | 7,805,776 | |
| | | | | | | | |
| Construction – 0.1% | | | | | | | | |
Empresas ICA S.A.B. de C.V.,
8.9%, 2021 | | $ | 305,000 | | | $ | 268,400 | |
| | | | | | | | |
| Consumer Products – 1.0% | | | | | | | | |
| Elizabeth Arden, Inc., 7.375%, 2021 | | $ | 1,400,000 | | | $ | 1,498,000 | |
| Jarden Corp., 7.5%, 2017 | | | 500,000 | | | | 548,125 | |
| Jarden Corp., 7.5%, 2020 | | | 545,000 | | | | 583,150 | |
| | | | | | | | |
| Issuer | | Shares/Par | | | Value ($) | |
| | | | | | | | |
| BONDS – continued | | | | | | | | |
| Consumer Products – continued | | | | | | | | |
| Libbey Glass, Inc., 6.875%, 2020 | | $ | 203,000 | | | $ | 212,389 | |
| Prestige Brands, Inc., 8.125%, 2020 | | | 587,000 | | | | 641,298 | |
Spectrum Brands Escrow Corp.,
6.375%, 2020 (n) | | | 705,000 | | | | 738,488 | |
Spectrum Brands Escrow Corp.,
6.625%, 2022 (n) | | | 50,000 | | | | 52,375 | |
| | | | | | | | |
| | | | | | $ | 4,273,825 | |
| | | | | | | | |
| Consumer Services – 0.7% | | | | | | | | |
| QVC, Inc., 7.375%, 2020 (n) | | $ | 440,000 | | | $ | 479,971 | |
| Service Corp. International, 7%, 2017 | | | 2,325,000 | | | | 2,563,313 | |
| | | | | | | | |
| | | | | | $ | 3,043,284 | |
| | | | | | | | |
| Containers – 3.2% | | | | | | | | |
| ARD Finance S.A., 11.125%, 2018 (n) | | $ | 249,296 | | | $ | 264,254 | |
Ardagh Packaging Finance PLC ,
7%, 2020 (n) | | | 1,010,000 | | | | 973,388 | |
Ardagh Packaging Finance PLC,
7.375%, 2017 (n) | | | 535,000 | | | | 570,444 | |
Ardagh Packaging Finance PLC,
7.375%, 2017 (n) | | | 200,000 | | | | 213,500 | |
Ardagh Packaging Finance PLC,
7.375%, 2017 | | EUR | 200,000 | | | | 272,696 | |
Ardagh Packaging Finance PLC,
9.125%, 2020 (n) | | $ | 690,000 | | | | 732,263 | |
Ardagh Packaging Finance PLC,
9.25%, 2020 | | EUR | 100,000 | | | | 136,348 | |
Ardagh Packaging Finance PLC,
4.875%, 2022 (z) | | $ | 360,000 | | | | 336,600 | |
| Ball Corp., 5%, 2022 | | | 872,000 | | | | 867,640 | |
| Ball Corp., 4%, 2023 | | | 190,000 | | | | 175,750 | |
| Berry Plastics Group, Inc., 9.5%, 2018 | | | 735,000 | | | | 799,313 | |
| Berry Plastics Group, Inc., 9.75%, 2021 | | | 715,000 | | | | 807,950 | |
| Crown Americas LLC, 4.5%, 2023 (n) | | | 815,000 | | | | 768,138 | |
| Crown Euro Holdings S.A., 7.125%, 2018 | | EUR | 50,000 | | | | 68,987 | |
| Greif, Inc., 6.75%, 2017 | | $ | 770,000 | | | | 847,000 | |
| Greif, Inc., 7.75%, 2019 | | | 1,090,000 | | | | 1,248,050 | |
| Reynolds Group, 8.5%, 2018 | | | 250,000 | | | | 257,500 | |
| Reynolds Group, 7.125%, 2019 | | | 920,000 | | | | 971,750 | |
| Reynolds Group, 9%, 2019 | | | 500,000 | | | | 516,250 | |
| Reynolds Group, 7.875%, 2019 | | | 250,000 | | | | 272,500 | |
| Reynolds Group, 9.875%, 2019 | | | 990,000 | | | | 1,059,300 | |
| Reynolds Group, 5.75%, 2020 | | | 760,000 | | | | 765,700 | |
| Reynolds Group, 6.875%, 2021 | | | 100,000 | | | | 105,000 | |
| Reynolds Group, 8.25%, 2021 | | | 1,420,000 | | | | 1,405,800 | |
| | | | | | | | |
| | | | | | $ | 14,436,121 | |
| | | | | | | | |
| Defense Electronics – 0.4% | | | | | | | | |
| Ducommun, Inc., 9.75%, 2018 | | $ | 664,000 | | | $ | 725,420 | |
| MOOG, Inc., 7.25%, 2018 | | | 1,020,000 | | | | 1,055,700 | |
| | | | | | | | |
| | | | | | $ | 1,781,120 | |
| | | | | | | | |
| Electrical Equipment – 0.3% | | | | | | | | |
| Avaya, Inc., 9.75%, 2015 | | $ | 445,000 | | | $ | 440,550 | |
| Avaya, Inc., 7%, 2019 (n) | | | 1,175,000 | | | | 1,060,438 | |
| | | | | | | | |
| | | | | | $ | 1,500,988 | |
| | | | | | | | |
6
MFS High Yield Portfolio
Portfolio of Investments (unaudited) – continued
| | | | | | | | |
| Issuer | | Shares/Par | | | Value ($) | |
| | | | | | | | |
| BONDS – continued | | | | | | | | |
| Electronics – 1.2% | | | | | | | | |
Freescale Semiconductor, Inc.,
9.25%, 2018 (n) | | $ | 1,605,000 | | | $ | 1,729,388 | |
| Nokia Corp., 5.375%, 2019 | | | 235,000 | | | | 228,538 | |
| Nokia Corp., 6.625%, 2039 | | | 680,000 | | | | 613,700 | |
| NXP B.V., 9.75%, 2018 (n) | | | 100,000 | | | | 111,875 | |
| NXP B.V., 5.75%, 2021 (n) | | | 350,000 | | | | 354,375 | |
| NXP B.V., 5.75%, 2023 (n) | | | 715,000 | | | | 720,363 | |
Sensata Technologies B.V.,
6.5%, 2019 (n) | | | 1,465,000 | | | | 1,574,875 | |
| | | | | | | | |
| | | | | | $ | 5,333,114 | |
| | | | | | | | |
| Energy – Independent – 8.2% | | | | | | | | |
| Berry Petroleum Corp., 6.75%, 2020 | | $ | 295,000 | | | $ | 305,325 | |
BreitBurn Energy Partners LP,
8.625%, 2020 | | | 1,075,000 | | | | 1,139,500 | |
Breitburn Energy Partners LP,
7.875%, 2022 | | | 660,000 | | | | 673,200 | |
| Carrizo Oil & Gas, Inc., 8.625%, 2018 | | | 280,000 | | | | 299,600 | |
| Chaparral Energy, Inc., 7.625%, 2022 | | | 855,000 | | | | 872,100 | |
Chesapeake Energy Corp.,
6.875%, 2020 | | | 1,555,000 | | | | 1,687,175 | |
| Concho Resources, Inc., 7%, 2021 | | | 200,000 | | | | 215,000 | |
| Concho Resources, Inc., 6.5%, 2022 | | | 2,210,000 | | | | 2,337,075 | |
| Concho Resources, Inc., 5.5%, 2023 | | | 855,000 | | | | 842,175 | |
Continental Resources, Inc.,
8.25%, 2019 | | | 1,215,000 | | | | 1,330,425 | |
Continental Resources, Inc.,
7.375%, 2020 | | | 530,000 | | | | 588,300 | |
Continental Resources, Inc.,
7.125%, 2021 | | | 75,000 | | | | 82,500 | |
Continental Resources, Inc.,
4.5%, 2023 (n) | | | 407,000 | | | | 395,808 | |
| Denbury Resources, Inc., 8.25%, 2020 | | | 1,844,000 | | | | 1,991,520 | |
| Denbury Resources, Inc., 4.625%, 2023 | | | 510,000 | | | | 470,475 | |
Energy XXI Gulf Coast, Inc.,
9.25%, 2017 | | | 1,985,000 | | | | 2,178,538 | |
| EP Energy LLC, 6.875%, 2019 | | | 100,000 | | | | 107,000 | |
| EP Energy LLC, 9.375%, 2020 | | | 1,880,000 | | | | 2,124,400 | |
| EP Energy LLC, 7.75%, 2022 | | | 1,225,000 | | | | 1,310,750 | |
| EPL Oil & Gas, Inc., 8.25%, 2018 | | | 975,000 | | | | 1,004,250 | |
| Halcon Resources Corp., 8.875%, 2021 | | | 1,185,000 | | | | 1,149,450 | |
| Harvest Operations Corp., 6.875%, 2017 | | | 885,000 | | | | 986,775 | |
Hilcorp Energy I/Hilcorp Finance Co.,
8%, 2020 (n) | | | 255,000 | | | | 274,125 | |
| Laredo Petroleum, Inc., 9.5%, 2019 | | | 445,000 | | | | 489,500 | |
| Laredo Petroleum, Inc., 7.375%, 2022 | | | 250,000 | | | | 262,500 | |
| LINN Energy LLC, 8.625%, 2020 | | | 1,895,000 | | | | 1,989,750 | |
| LINN Energy LLC, 7.75%, 2021 | | | 428,000 | | | | 429,070 | |
| MEG Energy Corp., 6.5%, 2021 (n) | | | 1,030,000 | | | | 1,020,988 | |
| QEP Resources, Inc., 6.875%, 2021 | | | 1,940,000 | | | | 2,090,350 | |
| Range Resources Corp., 8%, 2019 | | | 650,000 | | | | 692,250 | |
| Range Resources Corp., 6.75%, 2020 | | | 150,000 | | | | 160,875 | |
| Range Resources Corp., 5.75%, 2021 | | | 250,000 | | | | 257,500 | |
| Range Resources Corp., 5%, 2022 | | | 210,000 | | | | 205,275 | |
| Rosetta Resources, Inc., 5.625%, 2021 | | | 510,000 | | | | 497,888 | |
| | | | | | | | |
| Issuer | | Shares/Par | | | Value ($) | |
| | | | | | | | |
| BONDS – continued | | | | | | | | |
| Energy – Independent – continued | | | | | |
Samson Investment Co.,
10%, 2020 (n) | | $ | 1,540,000 | | | $ | 1,622,775 | |
SandRidge Energy, Inc.,
7.5%, 2021 | | | 1,250,000 | | | | 1,193,750 | |
SandRidge Energy, Inc.,
8.125%, 2022 | | | 1,270,000 | | | | 1,257,300 | |
| SM Energy Co., 6.5%, 2021 | | | 1,395,000 | | | | 1,464,750 | |
| Whiting Petroleum Corp., 6.5%, 2018 | | | 915,000 | | | | 967,613 | |
| | | | | | | | |
| | | | | | $ | 36,967,600 | |
| | | | | | | | |
| Engineering – Construction – 0.2% | | | | | |
BakerCorp International, Inc.,
8.25%, 2019 | | $ | 990,000 | | | $ | 970,200 | |
| | | | | | | | |
| Entertainment – 1.2% | | | | | | | | |
AMC Entertainment, Inc.,
8.75%, 2019 | | $ | 760,000 | | | $ | 813,200 | |
| Cedar Fair LP, 9.125%, 2018 | | | 1,420,000 | | | | 1,547,800 | |
| Cedar Fair LP, 5.25%, 2021 (n) | | | 595,000 | | | | 571,200 | |
Cinemark USA, Inc.,
4.875%, 2023 (n) | | | 760,000 | | | | 729,600 | |
| Cinemark USA, Inc., 5.125%, 2022 | | | 125,000 | | | | 120,625 | |
NAI Entertainment Holdings LLC,
8.25%, 2017 (n) | | | 297,000 | | | | 317,790 | |
Six Flags Entertainment Corp.,
5.25%, 2021 (n) | | | 1,300,000 | | | | 1,254,500 | |
| | | | | | | | |
| | | | | | $ | 5,354,715 | |
| | | | | | | | |
| Financial Institutions – 4.6% | | | | | | | | |
Aviation Capital Group,
4.625%, 2018 (n) | | $ | 915,000 | | | $ | 900,790 | |
| CIT Group, Inc., 5.25%, 2014 (n) | | | 645,000 | | | | 654,675 | |
| CIT Group, Inc., 5%, 2017 | | | 250,000 | | | | 255,313 | |
| CIT Group, Inc., 4.25%, 2017 | | | 500,000 | | | | 502,500 | |
| CIT Group, Inc., 5.25%, 2018 | | | 975,000 | | | | 1,001,813 | |
| CIT Group, Inc., 6.625%, 2018 (n) | | | 1,006,000 | | | | 1,086,480 | |
| CIT Group, Inc., 5.5%, 2019 (n) | | | 577,000 | | | | 595,753 | |
| CIT Group, Inc., 5%, 2022 | | | 865,000 | | | | 858,513 | |
Credit Acceptance Corp.,
9.125%, 2017 | | | 1,085,000 | | | | 1,147,388 | |
| Icahn Enterprises LP, 7.75%, 2016 | | | 300,000 | | | | 309,750 | |
| Icahn Enterprises LP, 8%, 2018 | | | 1,759,000 | | | | 1,846,950 | |
International Lease Finance Corp.,
6.625%, 2013 | | | 100,000 | | | | 101,375 | |
International Lease Finance Corp.,
4.875%, 2015 | | | 290,000 | | | | 294,713 | |
International Lease Finance Corp.,
8.625%, 2015 | | | 1,045,000 | | | | 1,144,275 | |
International Lease Finance Corp.,
7.125%, 2018 (n) | | | 941,000 | | | | 1,039,805 | |
International Lease Finance Corp.,
6.25%, 2019 | | | 200,000 | | | | 205,500 | |
| Nationstar Mortgage LLC/Capital Corp., 10.875%, 2015 | | | 800,000 | | | | 838,000 | |
| Nationstar Mortgage LLC/Capital Corp., 9.625%, 2019 | | | 245,000 | | | | 274,400 | |
7
MFS High Yield Portfolio
Portfolio of Investments (unaudited) – continued
| | | | | | | | |
| Issuer | | Shares/Par | | | Value ($) | |
| | | | | | | | |
| BONDS – continued | | | | | | | | |
| Financial Institutions – continued | | | | | |
| Nationstar Mortgage LLC/Capital Corp., 7.875%, 2020 | | $ | 1,700,000 | | | $ | 1,802,000 | |
| PHH Corp., 9.25%, 2016 | | | 675,000 | | | | 750,938 | |
| PHH Corp., 7.375%, 2019 | | | 965,000 | | | | 1,022,900 | |
| SLM Corp., 8.45%, 2018 | | | 645,000 | | | | 715,950 | |
| SLM Corp., 8%, 2020 | | | 1,810,000 | | | | 1,959,325 | |
| SLM Corp., 7.25%, 2022 | | | 1,330,000 | | | | 1,396,500 | |
| | | | | | | | |
| | | | | | $ | 20,705,606 | |
| | | | | | | | |
| Food & Beverages – 0.9% | | | | | | | | |
| ARAMARK Corp., 5.75%, 2020 (n) | | $ | 405,000 | | | $ | 414,113 | |
| B&G Foods, Inc., 4.625%, 2021 | | | 615,000 | | | | 587,325 | |
| Constellation Brands, Inc., 7.25%, 2016 | | | 230,000 | | | | 261,338 | |
| Constellation Brands, Inc., 7.25%, 2017 | | | 150,000 | | | | 170,625 | |
| Constellation Brands, Inc., 3.75%, 2021 | | | 205,000 | | | | 191,931 | |
| Constellation Brands, Inc., 6%, 2022 | | | 150,000 | | | | 160,875 | |
| Constellation Brands, Inc., 4.25%, 2023 | | | 405,000 | | | | 382,219 | |
Hawk Acquisition Sub, Inc.,
4.25%, 2020 (n) | | | 1,035,000 | | | | 989,719 | |
Pinnacle Foods Finance LLC,
4.875%, 2021 (z) | | | 235,000 | | | | 224,425 | |
| TreeHouse Foods, Inc., 7.75%, 2018 | | | 840,000 | | | | 889,350 | |
| | | | | | | | |
| | | | | | $ | 4,271,920 | |
| | | | | | | | |
| Forest & Paper Products – 1.2% | | | | | | | | |
| Boise, Inc., 8%, 2020 | | $ | 585,000 | | | $ | 623,025 | |
Graphic Packaging Holding Co.,
7.875%, 2018 | | | 775,000 | | | | 837,000 | |
Sappi Papier Holding GmbH,
7.75%, 2017 (n) | | | 430,000 | | | | 453,650 | |
Sappi Papier Holding GmbH,
6.625%, 2021 (n) | | | 200,000 | | | | 194,000 | |
Smurfit Kappa Group PLC,
7.75%, 2019 (n) | | EUR | 1,565,000 | | | | 2,184,770 | |
| Tembec Industries, Inc., 11.25%, 2018 | | $ | 845,000 | | | | 912,600 | |
| | | | | | | | |
| | | | | | $ | 5,205,045 | |
| | | | | | | | |
| Gaming & Lodging – 3.5% | | | | | | | | |
| Caesars Entertainment Operating Co., Inc., 8.5%, 2020 | | $ | 645,000 | | | $ | 607,913 | |
Chester Downs & Marina LLC,
9.25%, 2020 (z) | | | 650,000 | | | | 627,250 | |
Choice Hotels International, Inc.,
5.75%, 2022 | | | 105,000 | | | | 111,300 | |
CityCenter Holdings LLC,
10.75%, 2017 (p) | | | 510,000 | | | | 550,800 | |
Fontainebleau Las Vegas Holdings LLC,
10.25%, 2015 (a)(d)(n) | | | 1,450,000 | | | | 906 | |
GWR Operating Partnership LLP,
10.875%, 2017 | | | 340,000 | | | | 371,450 | |
Host Hotels & Resorts, Inc., REIT,
6%, 2020 | | | 500,000 | | | | 538,700 | |
Host Hotels & Resorts, Inc., REIT,
5.25%, 2022 | | | 350,000 | | | | 362,593 | |
| Isle of Capri Casinos, Inc., 8.875%, 2020 | | | 1,550,000 | | | | 1,619,750 | |
MGM Resorts International,
7.625%, 2017 | | | 1,250,000 | | | | 1,365,625 | |
| | | | | | | | |
| Issuer | | Shares/Par | | | Value ($) | |
| | | | | | | | |
| BONDS – continued | | | | | | | | |
| Gaming & Lodging – continued | | | | | | | | |
MGM Resorts International,
11.375%, 2018 | | $ | 630,000 | | | $ | 787,500 | |
MGM Resorts International,
6.625%, 2021 | | | 255,000 | | | | 262,969 | |
| NCL Corp., 5%, 2018 (n) | | | 500,000 | | | | 490,000 | |
Peninsula Gaming LLC,
8.375%, 2018 (z) | | | 270,000 | | | | 280,800 | |
Penn National Gaming, Inc.,
8.75%, 2019 | | | 1,230,000 | | | | 1,346,850 | |
Pinnacle Entertainment, Inc.,
8.75%, 2020 | | | 940,000 | | | | 1,008,150 | |
Pinnacle Entertainment, Inc.,
7.75%, 2022 | | | 270,000 | | | | 282,150 | |
| Ryman Hospitality Properties, Inc., REIT, 5%, 2021 (n) | | | 520,000 | | | | 504,400 | |
Seven Seas Cruises S. DE R.L.,
9.125%, 2019 | | | 1,840,000 | | | | 1,950,400 | |
| Viking Cruises Ltd., 8.5%, 2022 (n) | | | 895,000 | | | | 980,025 | |
| Wynn Las Vegas LLC, 7.75%, 2020 | | | 1,630,000 | | | | 1,809,952 | |
| | | | | | | | |
| | | | | | $ | 15,859,483 | |
| | | | | | | | |
| Industrial – 0.8% | | | | | | | | |
| Dematic S.A., 7.75%, 2020 (z) | | $ | 1,185,000 | | | $ | 1,238,325 | |
| Hyva Global B.V., 8.625%, 2016 (n) | | | 717,000 | | | | 673,980 | |
Mueller Water Products, Inc.,
8.75%, 2020 | | | 489,000 | | | | 533,010 | |
SPL Logistics Escrow LLC,
8.875%, 2020 (n) | | | 1,255,000 | | | | 1,305,200 | |
| | | | | | | | |
| | | | | | $ | 3,750,515 | |
| | | | | | | | |
| Insurance – Property & Casualty – 0.7% | |
Liberty Mutual Group, Inc.,
10.75% to 2038, FRN to 2088 (n) | | $ | 1,315,000 | | | $ | 2,005,375 | |
XL Group PLC, 6.5% to 2017,
FRN to 2049 | | | 1,275,000 | | | | 1,243,125 | |
| | | | | | | | |
| | | | | | $ | 3,248,500 | |
| | | | | | | | |
| International Market Quasi-Sovereign – 0.3% | |
| Eksportfinans A.S.A., 5.5%, 2016 | | $ | 435,000 | | | $ | 453,161 | |
| Eksportfinans A.S.A., 5.5%, 2017 | | | 655,000 | | | | 677,925 | |
Electricite de France, FRN,
5.25%, 2049 (n) | | | 122,000 | | | | 116,632 | |
| | | | | | | | |
| | | | | | $ | 1,247,718 | |
| | | | | | | | |
| Machinery & Tools – 2.4% | | | | | | | | |
| Case New Holland, Inc., 7.875%, 2017 | | $ | 3,000,000 | | | $ | 3,397,500 | |
| CNH America LLC, 7.25%, 2016 | | | 390,000 | | | | 423,150 | |
| CNH Capital LLC, 3.875%, 2015 | | | 130,000 | | | | 130,650 | |
| CNH Capital LLC, 6.25%, 2016 | | | 175,000 | | | | 186,375 | |
| CNH Capital LLC, 3.625%, 2018 (n) | | | 1,000,000 | | | | 952,500 | |
| H&E Equipment Services Co., 7%, 2022 | | | 1,260,000 | | | | 1,313,550 | |
| NESCO LLC/NESCO Holdings Corp., 11.75%, 2017 (n) | | | 1,580,000 | | | | 1,714,300 | |
RSC Equipment Rental, Inc.,
8.25%, 2021 | | | 1,165,000 | | | | 1,275,675 | |
8
MFS High Yield Portfolio
Portfolio of Investments (unaudited) – continued
| | | | | | | | |
| Issuer | | Shares/Par | | | Value ($) | |
| | | | | | | | |
| BONDS – continued | | | | | | | | |
| Machinery & Tools – continued | | | | | |
| United Rentals North America, Inc., 5.75%, 2018 | | $ | 320,000 | | | $ | 336,000 | |
| United Rentals North America, Inc., 7.375%, 2020 | | | 250,000 | | | | 266,875 | |
| United Rentals North America, Inc., 7.625%, 2022 | | | 574,000 | | | | 621,355 | |
| United Rentals North America, Inc., 6.125%, 2023 | | | 100,000 | | | | 99,500 | |
| | | | | | | | |
| | | | | | $ | 10,717,430 | |
| | | | | | | | |
| Major Banks – 1.0% | | | | | | | | |
| Bank of America Corp., FRN, 5.2%, 2049 | | $ | 1,040,000 | | | $ | 977,600 | |
| Barclays Bank PLC, 7.625%, 2022 | | | 900,000 | | | | 883,125 | |
| RBS Capital Trust A, FRN, 2.312%, 2049 | | EUR | 50,000 | | | | 40,384 | |
| Royal Bank of Scotland Group PLC, 7.648% to 2031, FRN to 2049 | | $ | 2,500,000 | | | | 2,287,500 | |
| Royal Bank of Scotland Group PLC,, 6.99% to 2017, FRN to 2049 (n) | | | 320,000 | | | | 299,200 | |
| | | | | | | | |
| | | | | | $ | 4,487,809 | |
| | | | | | | | |
| Medical & Health Technology & Services – 5.2% | |
| AmSurg Corp., 5.625%, 2020 | | $ | 1,095,000 | | | $ | 1,095,000 | |
| CDRT Holding Corp., 9.25%, 2017 (n)(p) | | | 305,000 | | | | 308,813 | |
| Davita, Inc., 6.375%, 2018 | | | 2,155,000 | | | | 2,249,281 | |
| Davita, Inc., 6.625%, 2020 | | | 1,150,000 | | | | 1,219,000 | |
| Davita, Inc., 5.75%, 2022 | | | 350,000 | | | | 349,125 | |
| Fresenius Medical Care AG & Co. KGaA, 9%, 2015 (n) | | | 720,000 | | | | 795,600 | |
| Fresenius Medical Care Capital Trust III, 5.625%, 2019 (n) | | | 480,000 | | | | 499,200 | |
| Fresenius Medical Care Capital Trust III, 5.875%, 2022 (n) | | | 855,000 | | | | 899,888 | |
| HCA, Inc., 8.5%, 2019 | | | 1,545,000 | | | | 1,657,978 | |
| HCA, Inc., 6.5%, 2020 | | | 900,000 | | | | 973,688 | |
| HCA, Inc., 7.25%, 2020 | | | 875,000 | | | | 939,531 | |
| HCA, Inc., 7.5%, 2022 | | | 1,910,000 | | | | 2,115,325 | |
| HCA, Inc., 5.875%, 2022 | | | 1,075,000 | | | | 1,103,219 | |
| HCA, Inc., 4.75%, 2023 | | | 200,000 | | | | 191,500 | |
| HCA, Inc., 5.875%, 2023 | | | 250,000 | | | | 250,625 | |
| HealthSouth Corp., 8.125%, 2020 | | | 2,130,000 | | | | 2,305,725 | |
| IASIS Healthcare LLC/IASIS Capital Corp., 8.375%, 2019 | | | 995,000 | | | | 1,004,328 | |
| Kinetic Concepts, Inc., 12.5%, 2019 | | | 315,000 | | | | 324,450 | |
| Tenet Healthcare Corp., 9.25%, 2015 | | | 175,000 | | | | 189,656 | |
| Tenet Healthcare Corp., 8%, 2020 | | | 1,280,000 | | | | 1,323,200 | |
| Tenet Healthcare Corp., 4.5%, 2021 (n) | | | 1,045,000 | | | | 974,463 | |
Universal Health Services, Inc.,
7%, 2018 | | | 1,015,000 | | | | 1,069,556 | |
Universal Health Services, Inc.,
7.625%, 2020 | | | 1,550,000 | | | | 1,619,750 | |
| | | | | | | | |
| | | | | | $ | 23,458,901 | |
| | | | | | | | |
| Medical Equipment – 0.4% | | | | | |
| Biomet, Inc., 6.5%, 2020 | | $ | 900,000 | | | $ | 927,563 | |
| Physio-Control International, Inc., 9.875%, 2019 (n) | | | 425,000 | | | | 467,500 | |
| | | | | | | | |
| Issuer | | Shares/Par | | | Value ($) | |
| | | | | | | | |
| BONDS – continued | | | | | | | | |
| Medical Equipment – continued | | | | | |
| Teleflex, Inc., 6.875%, 2019 | | $ | 340,000 | | | $ | 358,700 | |
| | | | | | | | |
| | | | | | $ | 1,753,763 | |
| | | | | | | | |
| Metals & Mining – 3.3% | | | | | | | | |
| ArcelorMittal S.A., 7.25%, 2041 | | $ | 495,000 | | | $ | 462,825 | |
| Arch Coal, Inc., 7.25%, 2020 | | | 1,085,000 | | | | 889,700 | |
| Arch Coal, Inc., 7.25%, 2021 | | | 250,000 | | | | 202,500 | |
| Boart Longyear Ltd., 7%, 2021 (z) | | | 275,000 | | | | 259,188 | |
| Century Aluminum Co., 7.5%, 2021 (n) | | | 815,000 | | | | 790,550 | |
| Cloud Peak Energy, Inc., 8.25%, 2017 | | | 1,185,000 | | | | 1,247,213 | |
| Cloud Peak Energy, Inc., 8.5%, 2019 | | | 1,105,000 | | | | 1,176,825 | |
| Commercial Metals Co., 4.875%, 2023 | | | 515,000 | | | | 473,800 | |
| Consol Energy, Inc., 8%, 2017 | | | 1,305,000 | | | | 1,373,513 | |
| Consol Energy, Inc., 8.25%, 2020 | | | 395,000 | | | | 413,763 | |
| Consol Energy, Inc., 6.375%, 2021 | | | 150,000 | | | | 149,250 | |
First Quantum Minerals Ltd.,
7.25%, 2019 (n) | | | 1,537,000 | | | | 1,444,780 | |
| FMG Resources, 6%, 2017 (n) | | | 175,000 | | | | 170,188 | |
| FMG Resources, 6.875%, 2022 (n) | | | 500,000 | | | | 485,000 | |
Fortescue Metals Group Ltd.,
8.25%, 2019 (n) | | | 975,000 | | | | 1,004,250 | |
| Peabody Energy Corp., 6%, 2018 | | | 805,000 | | | | 807,013 | |
| Peabody Energy Corp., 6.5%, 2020 | | | 100,000 | | | | 100,250 | |
| Peabody Energy Corp., 6.25%, 2021 | | | 305,000 | | | | 294,325 | |
| Plains Exploration & Production Co., 6.125%, 2019 | | | 1,430,000 | | | | 1,516,262 | |
| Plains Exploration & Production Co., 8.625%, 2019 | | | 375,000 | | | | 412,707 | |
| Plains Exploration & Production Co., 6.5%, 2020 | | | 390,000 | | | | 413,480 | |
| Plains Exploration & Production Co., 6.625%, 2021 | | | 500,000 | | | | 529,329 | |
| | | | | | | | |
| | | | | | $ | 14,616,711 | |
| | | | | | | | |
| Natural Gas – Distribution – 0.5% | |
| AmeriGas Finance LLC, 6.75%, 2020 | | $ | 1,510,000 | | | $ | 1,562,850 | |
| Ferrellgas LP/Ferrellgas Finance Corp., 6.5%, 2021 | | | 890,000 | | | | 892,225 | |
| | | | | | | | |
| | | | | | $ | 2,455,075 | |
| | | | | | | | |
| Natural Gas – Pipeline – 3.3% | | | | | | | | |
Access Midstream Partners Co.,
4.875%, 2023 | | $ | 495,000 | | | $ | 459,113 | |
Atlas Pipeline Partners LP,
4.75%, 2021 (n) | | | 405,000 | | | | 364,500 | |
Atlas Pipeline Partners LP,
5.875%, 2023 (n) | | | 765,000 | | | | 726,750 | |
| Crosstex Energy, Inc., 8.875%, 2018 | | | 2,290,000 | | | | 2,427,400 | |
| El Paso Corp., 7%, 2017 | | | 660,000 | | | | 717,525 | |
| El Paso Corp., 8.05%, 2030 | | | 1,010,000 | | | | 1,074,591 | |
| El Paso Corp., 7.8%, 2031 | | | 200,000 | | | | 211,236 | |
| El Paso Corp., 7.75%, 2032 | | | 1,355,000 | | | | 1,439,591 | |
| Energy Transfer Equity LP, 7.5%, 2020 | | | 1,405,000 | | | | 1,534,963 | |
Enterprise Products Partners LP,
8.375% to 2016, FRN to 2066 | | | 965,000 | | | | 1,075,975 | |
9
MFS High Yield Portfolio
Portfolio of Investments (unaudited) – continued
| | | | | | | | |
| Issuer | | Shares/Par | | | Value ($) | |
| | | | | | | | |
| BONDS – continued | | | | | | | | |
| Natural Gas – Pipeline – continued | | | | | |
Enterprise Products Partners LP,
7.034% to 2018, FRN to 2068 | | $ | 287,000 | | | $ | 322,158 | |
| Inergy Midstream LP, 6%, 2020 (n) | | | 1,160,000 | | | | 1,119,400 | |
MarkWest Energy Partners LP,
6.75%, 2020 | | | 100,000 | | | | 105,500 | |
MarkWest Energy Partners LP,
5.5%, 2023 | | | 575,000 | | | | 566,375 | |
MarkWest Energy Partners LP,
4.5%, 2023 | | | 443,000 | | | | 405,345 | |
Sabine Pass Liquefaction,
5.625%, 2021 (n) | | | 870,000 | | | | 843,900 | |
Sabine Pass Liquefaction,
5.625%, 2023 (n) | | | 1,040,000 | | | | 982,800 | |
Summit Midstream Holdings LLC,
7.5%, 2021 (z) | | | 570,000 | | | | 578,550 | |
| | | | | | | | |
| | | | | | $ | 14,955,672 | |
| | | | | | | | |
| Network & Telecom – 1.2% | | | | | | | | |
| Centurylink, Inc., 7.65%, 2042 | | $ | 1,605,000 | | | $ | 1,524,750 | |
| Citizens Communications Co., 9%, 2031 | | | 485,000 | | | | 480,150 | |
Frontier Communications Corp.,
8.25%, 2017 | | | 200,000 | | | | 225,000 | |
Frontier Communications Corp.,
8.125%, 2018 | | | 275,000 | | | | 301,813 | |
Frontier Communications Corp.,
8.5%, 2020 | | | 250,000 | | | | 275,625 | |
| TW Telecom Holdings, Inc., 8%, 2018 | | | 100,000 | | | | 106,000 | |
TW Telecom Holdings, Inc.,
5.375%, 2022 | | | 760,000 | | | | 754,300 | |
| Windstream Corp., 7.875%, 2017 | | | 200,000 | | | | 219,500 | |
| Windstream Corp., 8.125%, 2018 | | | 150,000 | | | | 159,750 | |
| Windstream Corp., 7.75%, 2020 | | | 490,000 | | | | 507,150 | |
| Windstream Corp., 7.75%, 2021 | | | 840,000 | | | | 869,400 | |
| | | | | | | | |
| | | | | | $ | 5,423,438 | |
| | | | | | | | |
| Oil Services – 1.6% | | | | | | | | |
| Bristow Group, Inc., 6.25%, 2022 | | $ | 1,050,000 | | | $ | 1,076,250 | |
Chesapeake Energy Corp.,
6.625%, 2019 (n) | | | 230,000 | | | | 227,700 | |
| Dresser-Rand Group, Inc., 6.5%, 2021 | | | 500,000 | | | | 530,000 | |
| Edgen Murray Corp., 8.75%, 2020 (n) | | | 1,530,000 | | | | 1,522,350 | |
| Pacific Drilling S.A., 5.375%, 2020 (z) | | | 510,000 | | | | 476,850 | |
| Shale-Inland Holdings LLC/Finance Co., 8.75%, 2019 (n) | | | 1,605,000 | | | | 1,637,100 | |
| Unit Corp., 6.625%, 2021 | | | 1,745,000 | | | | 1,779,900 | |
| | | | | | | | |
| | | | | | $ | 7,250,150 | |
| | | | | | | | |
| Other Banks & Diversified Financials – 2.4% | |
| Ally Financial, Inc., 8.3%, 2015 | | $ | 500,000 | | | $ | 538,750 | |
| Ally Financial, Inc., 0%, 2015 | | | 500,000 | | | | 462,600 | |
| Ally Financial, Inc., 5.5%, 2017 | | | 1,770,000 | | | | 1,849,314 | |
| Ally Financial, Inc., 6.25%, 2017 | | | 250,000 | | | | 267,443 | |
Groupe BPCE S.A.,
12.5% to 2019, FRN to 2049 (n) | | | 1,437,000 | | | | 1,742,363 | |
LBG Capital No. 1 PLC,
7.875%, 2020 (n) | | | 2,235,000 | | | | 2,306,520 | |
| | | | | | | | |
| Issuer | | Shares/Par | | | Value ($) | |
| | | | | | | | |
| BONDS – continued | | | | | | | | |
| Other Banks & Diversified Financials – continued | |
Santander UK PLC,
8.963% to 2030, FRN to 2049 | | $ | 2,749,000 | | | $ | 3,298,800 | |
| UBS AG, 7.625%, 2022 | | | 300,000 | | | | 329,234 | |
| | | | | | | | |
| | | | | | $ | 10,795,024 | |
| | | | | | | | |
| Pharmaceuticals – 0.8% | | | | | | | | |
Capsugel FinanceCo. SCA,
9.875%, 2019 (n) | | EUR | 375,000 | | | $ | 539,859 | |
Mylan Laboratories, Inc.,
7.625%, 2017 (n) | | $ | 200,000 | | | | 221,442 | |
Mylan Laboratories, Inc.,
7.875%, 2020 (n) | | | 500,000 | | | | 576,974 | |
| Valeant Pharmaceuticals International, Inc., 6.5%, 2016 (n) | | | 250,000 | | | | 257,500 | |
| Valeant Pharmaceuticals International, Inc., 6.75%, 2017 (n) | | | 100,000 | | | | 103,500 | |
| Valeant Pharmaceuticals International, Inc., 7%, 2020 (n) | | | 1,115,000 | | | | 1,137,300 | |
| Valeant Pharmaceuticals International, Inc., 7.25%, 2022 (n) | | | 615,000 | | | | 624,225 | |
| Vantage Point Imaging, 7.5%, 2021 (z) | | | 320,000 | | | | 331,200 | |
| | | | | | | | |
| | | | | | $ | 3,792,000 | |
| | | | | | | | |
| Pollution Control – 0.3% | | | | | | | | |
| Heckmann Corp., 9.875%, 2018 | | $ | 970,000 | | | $ | 1,018,500 | |
| Heckmann Corp., 9.875%, 2018 (n) | | | 150,000 | | | | 156,375 | |
| | | | | | | | |
| | | | | | $ | 1,174,875 | |
| | | | | | | | |
| Precious Metals & Minerals – 0.5% | |
| Eldorado Gold Corp., 6.125%, 2020 (n) | | $ | 805,000 | | | $ | 776,825 | |
| IAMGOLD Corp., 6.75%, 2020 (n) | | | 1,622,000 | | | | 1,370,590 | |
| | | | | | | | |
| | | | | | $ | 2,147,415 | |
| | | | | | | | |
| Printing & Publishing – 0.6% | | | | | | | | |
| American Media, Inc., 13.5%, 2018 (z) | | $ | 100,346 | | | $ | 92,820 | |
| Lamar Media Corp., 5%, 2023 | | | 495,000 | | | | 475,200 | |
| Nielsen Finance LLC, 7.75%, 2018 | | | 1,005,000 | | | | 1,080,375 | |
| Nielsen Finance LLC, 4.5%, 2020 (n) | | | 1,130,000 | | | | 1,084,800 | |
| | | | | | | | |
| | | | | | $ | 2,733,195 | |
| | | | | | | | |
| Railroad & Shipping – 0.2% | | | | | | | | |
| Kansas City Southern de Mexico S.A. de C.V., 6.125%, 2021 | | $ | 55,000 | | | $ | 62,425 | |
| Watco Cos. LLC, 6.375%, 2023 (n) | | | 620,000 | | | | 616,900 | |
| | | | | | | | |
| | | | | | $ | 679,325 | |
| | | | | | | | |
| Real Estate – 1.4% | | | | | | | | |
| CNL Lifestyle Properties, Inc., REIT, 7.25%, 2019 | | $ | 700,000 | | | $ | 698,250 | |
| DuPont Fabros Technology, Inc., REIT, 8.5%, 2017 | | | 915,000 | | | | 965,325 | |
| ERP Properties, REIT, 7.75%, 2020 | | | 755,000 | | | | 857,279 | |
| ERP Properties, REIT, 5.75%, 2022 | | | 1,115,000 | | | | 1,128,243 | |
| Felcor Lodging LP, REIT, 5.625%, 2023 | | | 200,000 | | | | 194,500 | |
| Kennedy Wilson, Inc., 8.75%, 2019 | | | 280,000 | | | | 301,000 | |
10
MFS High Yield Portfolio
Portfolio of Investments (unaudited) – continued
| | | | | | | | |
| Issuer | | Shares/Par | | | Value ($) | |
| | | | | | | | |
| BONDS – continued | | | | | | | | |
| Real Estate – continued | | | | | | | | |
| MPT Operating Partnership LP, REIT, 6.875%, 2021 | | $ | 1,560,000 | | | $ | 1,653,600 | |
| MPT Operating Partnership LP, REIT, 6.375%, 2022 | | | 430,000 | | | | 451,500 | |
| | | | | | | | |
| | | | | | $ | 6,249,697 | |
| | | | | | | | |
| Retailers – 2.7% | | | | | | | | |
| Academy Ltd., 9.25%, 2019 (n) | | $ | 330,000 | | | $ | 365,475 | |
| Burlington Coat Factory Warehouse Corp., 10%, 2019 | | | 1,405,000 | | | | 1,552,525 | |
| CST Brands, Inc., 5%, 2023 (n) | | | 130,000 | | | | 126,750 | |
| J. Crew Group, Inc., 8.125%, 2019 | | | 1,305,000 | | | | 1,370,250 | |
Jo-Ann Stores Holdings, Inc.,
9.75%, 2019 (n)(p) | | | 630,000 | | | | 647,325 | |
| Limited Brands, Inc., 6.9%, 2017 | | | 925,000 | | | | 1,029,063 | |
| Limited Brands, Inc., 7%, 2020 | | | 280,000 | | | | 310,800 | |
| Limited Brands, Inc., 6.625%, 2021 | | | 175,000 | | | | 190,094 | |
| Limited Brands, Inc., 6.95%, 2033 | | | 320,000 | | | | 318,400 | |
| Rite Aid Corp., 9.5%, 2017 | | | 500,000 | | | | 518,900 | |
| Rite Aid Corp., 9.25%, 2020 | | | 1,435,000 | | | | 1,583,881 | |
Sally Beauty Holdings, Inc.,
6.875%, 2019 | | | 415,000 | | | | 445,088 | |
| Sally Beauty Holdings, Inc., 5.75%, 2022 | | | 150,000 | | | | 152,250 | |
| The Pantry, Inc., 8.375%, 2020 | | | 265,000 | | | | 284,544 | |
Toys “R” Us Property Co. II LLC,
8.5%, 2017 | | | 249,000 | | | | 258,649 | |
| Toys “R” Us, Inc., 10.75%, 2017 | | | 2,550,000 | | | | 2,690,250 | |
| YCC Holdings LLC/Yankee Finance, Inc., 10.25%, 2016 (p) | | | 120,000 | | | | 123,000 | |
| | | | | | | | |
| | | | | | $ | 11,967,244 | |
| | | | | | | | |
| Specialty Chemicals – 0.2% | | | | | | | | |
| Eagle Spinco, Inc., 4.625%, 2021 (n) | | $ | 255,000 | | | $ | 244,800 | |
| Koppers, Inc., 7.875%, 2019 | | | 755,000 | | | | 807,850 | |
| | | | | | | | |
| | | | | | $ | 1,052,650 | |
| | | | | | | | |
| Specialty Stores – 0.3% | | | | | | | | |
| Michaels Stores, Inc., 11.375%, 2016 | | $ | 212,000 | | | $ | 221,012 | |
| Michaels Stores, Inc., 7.75%, 2018 | | | 855,000 | | | | 914,850 | |
| | | | | | | | |
| | | | | | $ | 1,135,862 | |
| | | | | | | | |
| Telecommunications – Wireless – 4.4% | | | | | |
| Clearwire Corp., 12%, 2015 (n) | | $ | 1,340,000 | | | $ | 1,423,750 | |
Cricket Communications, Inc.,
7.75%, 2020 | | | 965,000 | | | | 926,400 | |
| Crown Castle International Corp., 7.125%, 2019 | | | 1,650,000 | | | | 1,761,375 | |
| Crown Castle International Corp., 5.25%, 2023 | | | 670,000 | | | | 643,200 | |
| Digicel Group Ltd., 8.25%, 2017 (n) | | | 1,895,000 | | | | 1,970,800 | |
| Digicel Group Ltd., 10.5%, 2018 (n) | | | 280,000 | | | | 296,800 | |
| Digicel Group Ltd., 8.25%, 2020 (n) | | | 250,000 | | | | 258,750 | |
| Eileme 2 AB, 11.625%, 2020 (n) | | | 1,004,000 | | | | 1,134,520 | |
| MetroPCS Wireless, Inc., 7.875%, 2018 | | | 765,000 | | | | 814,725 | |
| MetroPCS Wireless, Inc., 6.625%, 2020 | | | 250,000 | | | | 259,375 | |
| | | | | | | | |
| Issuer | | Shares/Par | | | Value ($) | |
| | | | | | | | |
| BONDS – continued | | | | | | | | |
| Telecommunications – Wireless – continued | | | | | |
MetroPCS Wireless, Inc.,
6.25%, 2021 (n) | | $ | 695,000 | | | $ | 707,163 | |
| Sprint Capital Corp., 6.9%, 2019 | | | 1,500,000 | | | | 1,560,000 | |
| Sprint Capital Corp., 6.875%, 2028 | | | 665,000 | | | | 638,400 | |
| Sprint Nextel Corp., 6%, 2016 | | | 745,000 | | | | 785,975 | |
| Sprint Nextel Corp., 8.375%, 2017 | | | 1,175,000 | | | | 1,318,938 | |
| Sprint Nextel Corp., 9%, 2018 (n) | | | 310,000 | | | | 362,700 | |
| Sprint Nextel Corp., 6%, 2022 | | | 1,215,000 | | | | 1,190,700 | |
| Sprint Nextel Corp., 8.75%, 2032 | | | 500,000 | | | | 550,000 | |
Wind Acquisition Finance S.A.,
11.75%, 2017 (n) | | | 1,280,000 | | | | 1,331,200 | |
Wind Acquisition Finance S.A.,
7.25%, 2018 (n) | | | 1,765,000 | | | | 1,778,238 | |
| | | | | | | | |
| | | | | | $ | 19,713,009 | |
| | | | | | | | |
| Telephone Services – 0.5% | | | | | | | | |
| Cogent Communications Group, Inc., 8.375%, 2018 (n) | | $ | 320,000 | | | $ | 348,800 | |
| Level 3 Financing, Inc., 9.375%, 2019 | | | 1,385,000 | | | | 1,495,800 | |
| Level 3 Financing, Inc., 8.625%, 2020 | | | 295,000 | | | | 314,175 | |
| | | | | | | | |
| | | | | | $ | 2,158,775 | |
| | | | | | | | |
| Tobacco – 0.1% | | | | | | | | |
| New Jersey Tobacco Settlement Financing Corp., “1-A”, 4.5%, 2023 | | $ | 650,000 | | | $ | 629,753 | |
| | | | | | | | |
| Transportation – Services – 2.6% | | | | | |
| Aguila American Resources Ltd., 7.875%, 2018 (n) | | $ | 1,065,000 | | | $ | 1,096,950 | |
Avis Budget Car Rental LLC,
8.25%, 2019 | | | 1,430,000 | | | | 1,555,125 | |
Avis Budget Car Rental LLC,
9.75%, 2020 | | | 260,000 | | | | 299,000 | |
| CEVA Group PLC, 8.375%, 2017 (n) | | | 2,160,000 | | | | 2,116,800 | |
| Navios Maritime Acquisition Corp., 8.625%, 2017 | | | 1,770,000 | | | | 1,809,825 | |
Navios Maritime Holdings, Inc.,
8.875%, 2017 | | | 495,000 | | | | 512,325 | |
| Navios South American Logistics, Inc., 9.25%, 2019 (n) | | | 396,000 | | | | 424,710 | |
| Navios South American Logistics, Inc., 9.25%, 2019 | | | 547,000 | | | | 586,658 | |
| Swift Services Holdings, Inc., 10%, 2018 | | | 2,455,000 | | | | 2,712,775 | |
Ultrapetrol (Bahamas) Ltd.,
8.875%, 2021 (n) | | | 591,000 | | | | 591,000 | |
| | | | | | | | |
| | | | | | $ | 11,705,168 | |
| | | | | | | | |
| Utilities – Electric Power – 3.6% | | | | | |
| AES Corp., 7.75%, 2015 | | $ | 99,000 | | | $ | 109,148 | |
| AES Corp., 8%, 2017 | | | 72,000 | | | | 81,000 | |
| AES Corp., 7.375%, 2021 | | | 910,000 | | | | 998,725 | |
| AES Corp., 4.875%, 2023 | | | 110,000 | | | | 102,575 | |
| Calpine Corp., 7.875%, 2020 (n) | | | 1,206,000 | | | | 1,308,510 | |
| Calpine Corp., 7.5%, 2021 (n) | | | 675,000 | | | | 720,563 | |
| Calpine Corp., 7.875%, 2023 (n) | | | 225,000 | | | | 241,875 | |
| CMS Energy Corp., 8.75%, 2019 | | | 150,000 | | | | 193,526 | |
11
MFS High Yield Portfolio
Portfolio of Investments (unaudited) – continued
| | | | | | | | |
| Issuer | | Shares/Par | | | Value ($) | |
| | | | | | | | |
| BONDS – continued | | | | | | | | |
| Utilities – Electric Power – continued | | | | | |
| Covanta Holding Corp., 7.25%, 2020 | | $ | 1,385,000 | | | $ | 1,452,292 | |
| Covanta Holding Corp., 6.375%, 2022 | | | 190,000 | | | | 192,014 | |
| EDP Finance B.V., 6%, 2018 (n) | | | 1,440,000 | | | | 1,483,200 | |
Energy Future Holdings Corp.,
10%, 2020 | | | 3,485,000 | | | | 3,816,075 | |
Energy Future Holdings Corp.,
10%, 2020 (n) | | | 1,527,000 | | | | 1,668,248 | |
Energy Future Holdings Corp.,
12.25%, 2022 (n) | | | 665,000 | | | | 734,825 | |
| InterGen N.V., 7%, 2023 (z) | | | 470,000 | | | | 458,250 | |
| NRG Energy, Inc., 7.625%, 2018 | | | 250,000 | | | | 267,500 | |
| NRG Energy, Inc., 8.25%, 2020 | | | 685,000 | | | | 738,088 | |
| NRG Energy, Inc., 7.875%, 2021 | | | 150,000 | | | | 160,125 | |
| NRG Energy, Inc., 6.625%, 2023 (n) | | | 570,000 | | | | 570,000 | |
| Texas Competitive Electric Holdings Co. LLC, 11.5%, 2020 (n) | | | 1,340,000 | | | | 1,001,650 | |
| | | | | | | | |
| | | | | | $ | 16,298,189 | |
| | | | | | | | |
| Utilities – Gas – 0.1% | | | | | | | | |
Suburban Propane Partners LP,
7.5%, 2018 | | $ | 230,000 | | | $ | 241,500 | |
| | | | | | | | |
Total Bonds
(Identified Cost, $426,531,503) | | | | | | $ | 426,190,298 | |
| | | | | | | | |
|
| FLOATING RATE LOANS (g)(r) – 2.1% | |
| Aerospace – 0.2% | | | | | | | | |
TransDigm, Inc., Term Loan C,
3.75%, 2020 | | $ | 696,489 | | | $ | 686,912 | |
| | | | | | | | |
| Building – 0.4% | | | | | | | | |
ABC Supply Co., Inc., Term Loan,
3.5%, 2020 | | $ | 255,911 | | | $ | 253,809 | |
| Calpine Construction Finance Co., Term Loan B1, 3%, 2020 | | | 1,384,301 | | | | 1,366,997 | |
| | | | | | | | |
| | | | | | $ | 1,620,806 | |
| | | | | | | | |
| Conglomerates – 0.1% | | | | | | | | |
Silver II U.S. Holdings LLC, Term Loan,
4%, 2019 | | $ | 690,441 | | | $ | 683,860 | |
| | | | | | | | |
| Consumer Services – 0.1% | | | | | | | | |
| Realogy Corp., Term Loan, 4.5%, 2020 | | $ | 455,454 | | | $ | 456,593 | |
| | | | | | | | |
| Energy – Independent – 0.1% | | | | | | | | |
MEG Energy Corp., Term Loan,
3.75%, 2020 | | $ | 668,806 | | | $ | 665,183 | |
| | | | | | | | |
| Entertainment – 0.1% | | | | | | | | |
| Cedar Fair LP, Term Loan B, 3.25%, 2020 | | $ | 591,293 | | | $ | 592,476 | |
| | | | | | | | |
| Food & Beverages – 0.2% | | | | | | | | |
| Aramark Corp., Term Loan D, 4%, 2019 | | $ | 701,233 | | | $ | 702,285 | |
| H.J. Heinz Co., Term Loan B2, 3.5%, 2020 | | | 387,181 | | | | 386,745 | |
| | | | | | | | |
| | | | | | $ | 1,089,030 | |
| | | | | | | | |
| Machinery & Tools – 0.3% | | | | | | | | |
| Gardner Denver, Inc., Term Loan, 2014 (o) | | $ | 1,270,000 | | | $ | 1,270,000 | |
| | | | | | | | |
| | | | | | | | |
| Issuer | | Shares/Par | | | Value ($) | |
| | | | | | | | |
|
| FLOATING RATE LOANS (g)(r) – continued | |
| Specialty Stores – 0.1% | | | | | | | | |
| Rite Aid Corp., Term Loan, 2021 (o) | | $ | 428,335 | | | $ | 426,193 | |
| | | | | | | | |
| Transportation – Services – 0.5% | | | | | | | | |
Commercial Barge Line Co., Term Loan,
7.5%, 2019 | | $ | 2,210,723 | | | $ | 2,133,348 | |
| | | | | | | | |
| Total Floating Rate Loans (Identified Cost, $9,716,220) | | | | | | $ | 9,624,401 | |
| | | | | | | | |
|
| CONVERTIBLE PREFERRED STOCKS – 0.2% | |
| Automotive – 0.2% | | | | | | | | |
| General Motors Co., 4.75% (Identified Cost, $785,464) | | | 16,480 | | | $ | 793,677 | |
| | | | | | | | |
|
| PREFERRED STOCKS – 0.2% | |
| Other Banks & Diversified Financials – 0.2% | |
| Ally Financial, Inc., 7% (z) | | | 363 | | | $ | 345,020 | |
| GMAC Capital Trust I, 8.125% | | | 19,950 | | | | 519,698 | |
| | | | | | | | |
Total Preferred Stocks
(Identified Cost, $845,303) | | | | | | $ | 864,718 | |
| | | | | | | | |
|
| CONVERTIBLE BONDS – 0.1% | |
| Network & Telecom – 0.1% | | | | | | | | |
| Nortel Networks Corp., 2.125%, 2014 (Identified Cost, $676,063) (a)(d) | | $ | 685,000 | | | $ | 664,878 | |
| | | | | | | | |
|
| COMMON STOCKS – 0.1% | |
| Automotive – 0.0% | | | | | | | | |
| Accuride Corp. (a) | | | 17,214 | | | $ | 87,103 | |
| | | | | | | | |
| Printing & Publishing – 0.1% | | | | | |
| American Media Operations, Inc. (a) | | | 25,715 | | | $ | 135,004 | |
| | | | | | | | |
Total Common Stocks
(Identified Cost, $645,252) | | | | | | $ | 222,107 | |
| | | | | | | | |
| | | | | | | | | | | | | | | | |
| | | Strike
Price | | | First
Exercise | | | | | | | |
| | | | | | | | | | | | | | | | |
| | |
| WARRANTS – 0.1% | | | | | | | | | |
| Broadcasting – 0.1% | | | | | | | | | |
| New Young Broadcasting Holding Co., Inc. (1 share for 1 warrant) (Identified Cost, $67,667) (a) | | $ | 0.01 | | | | 7/14/10 | | | | 35 | | | $ | 234,500 | |
| | | | | | | | | | | | | | | | |
| | | | | | | | |
| | | | | | | | |
| |
| MONEY MARKET FUNDS – 1.2% | | | | | |
| MFS Institutional Money Market Portfolio, 0.11%, at Cost and Net Asset Value (v) | | | 5,498,403 | | | $ | 5,498,403 | |
| | | | | | | | |
Total Investments
(Identified Cost, $444,765,875) | | | | | | $ | 444,092,982 | |
| | | | | | | | |
OTHER ASSETS, LESS
LIABILITIES – 1.2% | | | | | | | 5,592,105 | |
| | | | | | | | |
| Net Assets – 100.0% | | | | | | $ | 449,685,087 | |
| | | | | | | | |
12
MFS High Yield Portfolio
Portfolio of Investments (unaudited) – continued
| (a) | | Non-income producing security. |
| (d) | | In default. Interest and/or scheduled principal payment(s) have been missed. |
| (g) | | The rate shown represents a weighted average coupon rate on settled positions at period end, unless otherwise indicated. |
| (n) | | Securities exempt from registration under Rule 144A of the Securities Act of 1933. These securities may be sold in the ordinary course of business in transactions exempt from registration, normally to qualified institutional buyers. At period end, the aggregate value of these securities was $128,685,809, representing 28.6% of net assets. |
| (o) | | All or a portion of this position has not settled. Upon settlement date, interest rates for unsettled amounts will be determined. The rate shown, if any, represents the weighted average coupon rate for settled amounts. |
| (p) | | Payment-in-kind security. |
| (r) | | Remaining maturities of floating rate loans may be less than stated maturities shown as a result of contractual or optional prepayments by the borrower. Such prepayments cannot be predicted with certainty. These loans may be subject to restrictions on resale. Floating rate loans generally have rates of interest which are determined periodically by reference to a base lending rate plus a premium. |
| (v) | | Underlying affiliated fund that is available only to investment companies managed by MFS. The rate quoted for the MFS Institutional Money Market Portfolio is the annualized seven-day yield of the fund at period end. |
| (z) | | Restricted securities are not registered under the Securities Act of 1933 and are subject to legal restrictions on resale. These securities generally may be resold in transactions exempt from registration or to the public if the securities are subsequently registered. Disposal of these securities may involve time-consuming negotiations and prompt sale at an acceptable price may be difficult. The fund holds the following restricted securities: |
| | | | | | | | | | |
| Restricted Securities | | Acquisition
Date | | Cost | | | Value | |
| Ally Financial, Inc., 7% (Preferred Stock) | | 4/13/11-4/14/11 | | | $340,313 | | | | $345,020 | |
| American Media, Inc., 13.5%, 2018 | | 12/22/10 | | | 101,570 | | | | 92,820 | |
| Arbor Realty Mortgage Securities, CDO, FRN, 2.576%, 2038 | | 12/20/05 | | | 568,229 | | | | 170,469 | |
| Ardagh Packaging Finance PLC, 4.875%, 2022 | | 6/05/13 | | | 349,699 | | | | 336,600 | |
| Audatex North America, Inc., 6%, 2021 | | 6/27/13 | | | 520,000 | | | | 518,700 | |
| Boart Longyear Ltd., 7%, 2021 | | 6/04/13 | | | 270,901 | | | | 259,188 | |
| CWCapital Cobalt Ltd., CDO, 6.23%, 2045 | | 3/20/06 | | | 985,965 | | | | 12,547 | |
| CWCapital Cobalt Ltd., CDO, “F”, FRN, 1.575%, 2050 | | 4/12/06 | | | 530,418 | | | | 1,325 | |
| Chester Downs & Marina LLC, 9.25%, 2020 | | 6/18/13-6/27/13 | | | 646,600 | | | | 627,250 | |
| Dematic S.A., 7.75%, 2020 | | 12/13/12-6/05/13 | | | 1,202,743 | | | | 1,238,325 | |
| G-Force LLC, CDO, “A2”, 4.83%, 2036 | | 1/20/11 | | | 195,668 | | | | 202,274 | |
| Heckler & Koch GmbH, 9.5%, 2018 | | 5/06/11-1/02/13 | | | 928,254 | | | | 821,308 | |
| InterGen N.V., 7%, 2023 | | 6/07/13 | | | 461,714 | | | | 458,250 | |
| LBI Media, Inc., 13.5% to 2015, 11.5% to , 2020 | | 12/26/12-5/15/13 | | | 245,040 | | | | 184,795 | |
| Local TV Finance LLC, 9.25%, 2015 | | 12/10/07-2/06/13 | | | 1,181,371 | | | | 1,173,651 | |
| Pacific Drilling S.A., 5.375%, 2020 | | 6/05/13-6/13/13 | | | 494,738 | | | | 476,850 | |
| Peninsula Gaming LLC, 8.375%, 2018 | | 6/26/13 | | | 280,800 | | | | 280,800 | |
| Pinnacle Foods Finance LLC, 4.875%, 2021 | | 6/11/13 | | | 232,294 | | | | 224,425 | |
| Summit Midstream Holdings LLC, 7.5%, 2021 | | 6/12/13 | | | 570,000 | | | | 578,550 | |
| UPCB Finance VI Ltd., 6.875%, 2022 | | 1/31/12 | | | 350,000 | | | | 362,250 | |
| Vantage Point Imaging, 7.5%, 2021 | | 6/27/13 | | | 320,000 | | | | 331,200 | |
| Total Restricted Securities | | | | | | | | | $8,696,597 | |
| % of Net assets | | | | | | | | | 1.9% | |
The following abbreviations are used in this report and are defined:
CDO Collateralized Debt Obligation
| FRN | | Floating Rate Note. Interest rate resets periodically and may not be the rate reported at period end. |
| PLC | | Public Limited Company |
| REIT | | Real Estate Investment Trust |
Abbreviations indicate amounts shown in currencies other than the U.S. dollar. All amounts are stated in U.S. dollars unless otherwise indicated. A list of abbreviations is shown below:
13
MFS High Yield Portfolio
Portfolio of Investments (unaudited) – continued
Derivative Contracts at 6/30/13
Forward Foreign Currency Exchange Contracts at 6/30/13
| | | | | | | | | | | | | | | | | | | | | | |
| Type | | | | Currency | | Counterparty | | Contracts to
Deliver/Receive | | Settlement Date
Range | | In Exchange For | | | Contracts
at Value | | | Net Unrealized
Appreciation
(Depreciation) | |
| Asset Derivatives | | | | | | | | | | | | | | | | |
| SELL | | | | EUR | | Deutsche Bank AG | | 3,572,954 | | 7/16/13 | | $ | 4,670,423 | | | $ | 4,650,992 | | | $ | 19,431 | |
| SELL | | | | EUR | | JPMorgan Chase Bank N.A. | | 3,572,954 | | 7/16/13 | | | 4,670,498 | | | | 4,650,992 | | | | 19,506 | |
| SELL | | | | EUR | | UBS AG | | 215,426 | | 7/16/13 | | | 282,262 | | | | 280,425 | | | | 1,837 | |
| | | | | | | | | | | | | | | | | | | | | | |
| | | | | | | | | | | | | | | | | | | | $ | 40,774 | |
| | | | | | | | | | | | | | | | | | | | | | |
| | | | | |
| Liability Derivatives | | | | | | | | | | | | | | | | |
| BUY | | | | EUR | | Barclays Bank PLC | | 361,525 | | 7/16/13 | | $ | 484,662 | | | $ | 470,605 | | | $ | (14,057 | ) |
| BUY | | | | EUR | | UBS AG | | 25,912 | | 7/16/13 | | | 33,743 | | | | 33,730 | | | | (13 | ) |
| | | | | | | | | | | | | | | | | | | | | | |
| | | | | | | | | | | | | | | | | | | | $ | (14,070 | ) |
| | | | | | | | | | | | | | | | | | | | | | |
Swap Agreements at 6/30/13
| | | | | | | | | | | | | | | | |
| Expiration | | Currency | | Notional
Amount | | | Counterparty | | Cash Flows to
Receive | | Cash Flows to Pay | | Fair
Value | |
| Asset Derivatives | | | | | | | | | | | | | | |
| Credit Default Swap Agreements | | | | | | | | | | | |
| 12/20/17 | | USD | | | 4,800,000 | | | Goldman Sachs International (a) | | 5.00% (fixed rate) | | (1) | | | $222,268 | |
| | | | | | | | | | | | | | | | |
| (1) | | Fund, as protection seller, to pay notional amount upon a defined credit event by a reference obligation specified in the CDX.NA.HY.19 Index, a B rated credit default index. The fund entered into the agreement to manage market/sector exposure. |
| (a) | | Net unamortized premiums paid by the fund amounted to $192,909. |
The credit ratings presented here are an indicator of the current payment/performance risk of the related swap agreement, the reference obligation for which may be either a single security or, in the case of a credit default index, a basket of securities issued by corporate or sovereign issuers. Ratings are assigned to each reference security, including each individual security within a reference basket of securities, utilizing ratings from Moody’s, Fitch, and Standard & Poor’s rating agencies and applying the following hierarchy: If all three agencies provide a rating, the middle rating (after dropping the highest and lowest ratings) is assigned; if two of the three agencies rate a security, the lower of the two is assigned. Ratings are shown in the S&P and Fitch scale (e.g., AAA). The ratings for a credit default index are calculated by MFS as a weighted average of the external credit ratings of the individual securities that compose the index’s reference basket of securities.
At June 30, 2013, the fund had cash collateral of $685,512 to cover any commitments for certain derivative contracts. Cash collateral is comprised of “Restricted cash” in the Statement of Assets and Liabilities.
See Notes to Financial Statements
14
MFS High Yield Portfolio
FINANCIAL STATEMENTS | STATEMENT OF ASSETS AND LIABILITIES (unaudited)
This statement represents your fund’s balance sheet, which details the assets and liabilities comprising the total value of the fund.
| | | | | | | | |
At 6/30/13 | | | | | | | | |
Assets | | | | | | | | |
Investments – | | | | | | | | |
Non-affiliated issuers, at value (identified cost, $439,267,472) | | | $438,594,579 | | | | | |
Underlying affiliated funds, at cost and value | | | 5,498,403 | | | | | |
Total investments, at value (identified cost, $444,765,875) | | | $444,092,982 | | | | | |
Restricted cash | | | 685,512 | | | | | |
Foreign currency, at value (identified cost, $296,624) | | | 296,708 | | | | | |
Receivables for | | | | | | | | |
Forward foreign currency exchange contracts | | | 40,774 | | | | | |
Investments sold | | | 1,643,232 | | | | | |
Fund shares sold | | | 482,521 | | | | | |
Interest | | | 7,821,637 | | | | | |
Swaps, at value (net unamortized premiums paid, $192,909) | | | 222,268 | | | | | |
Other assets | | | 2,599 | | | | | |
Total assets | | | | | | | $455,288,233 | |
Liabilities | | | | | | | | |
Payables for | | | | | | | | |
Forward foreign currency exchange contracts | | | $14,070 | | | | | |
Investments purchased | | | 4,054,975 | | | | | |
Fund shares reacquired | | | 1,414,626 | | | | | |
Payable to affiliates | | | | | | | | |
Investment adviser | | | 32,886 | | | | | |
Shareholder servicing costs | | | 89 | | | | | |
Distribution and/or service fees | | | 2,672 | | | | | |
Payable for independent Trustees’ compensation | | | 1,720 | | | | | |
Accrued expenses and other liabilities | | | 82,108 | | | | | |
Total liabilities | | | | | | | $5,603,146 | |
Net assets | | | | | | | $449,685,087 | |
Net assets consist of | | | | | | | | |
Paid-in capital | | | $459,304,303 | | | | | |
Unrealized appreciation (depreciation) on investments and translation of assets and liabilities in foreign currencies | | | (617,461 | ) | | | | |
Accumulated net realized gain (loss) on investments and foreign currency | | | (39,757,778 | ) | | | | |
Undistributed net investment income | | | 30,756,023 | | | | | |
Net assets | | | | | | | $449,685,087 | |
Shares of beneficial interest outstanding | | | | | | | 73,901,288 | |
| | | | | | | | | | | | |
| | | Net assets | | | Shares
outstanding | | | Net asset value
per share | |
Initial Class | | | $351,882,853 | | | | 57,686,800 | | | | $6.10 | |
Service Class | | | 97,802,234 | | | | 16,214,488 | | | | 6.03 | |
See Notes to Financial Statements
15
MFS High Yield Portfolio
FINANCIAL STATEMENTS | STATEMENT OF OPERATIONS (unaudited)
This statement describes how much your fund earned in investment income and accrued in expenses. It also describes any gains and/or losses generated by fund operations.
| | | | | | | | |
Six months ended 6/30/13 | | | | | | | | |
Net investment income | | | | | | | | |
Income | | | | | | | | |
Interest | | | $15,636,230 | | | | | |
Dividends | | | 58,206 | | | | | |
Dividends from underlying affiliated funds | | | 6,317 | | | | | |
Foreign taxes withheld | | | (3 | ) | | | | |
Total investment income | | | | | | | $15,700,750 | |
Expenses | | | | | | | | |
Management fee | | | $1,657,301 | | | | | |
Distribution and/or service fees | | | 134,372 | | | | | |
Shareholder servicing costs | | | 2,136 | | | | | |
Administrative services fee | | | 35,072 | | | | | |
Independent Trustees’ compensation | | | 5,256 | | | | | |
Custodian fee | | | 24,302 | | | | | |
Shareholder communications | | | 13,758 | | | | | |
Audit and tax fees | | | 35,723 | | | | | |
Legal fees | | | 4,059 | | | | | |
Miscellaneous | | | 13,355 | | | | | |
Total expenses | | | | | | | $1,925,334 | |
Fees paid indirectly | | | (342 | ) | | | | |
Reduction of expenses by investment adviser | | | (10,997 | ) | | | | |
Net expenses | | | | | | | $1,913,995 | |
Net investment income | | | | | | | $13,786,755 | |
Realized and unrealized gain (loss) on investments and foreign currency | | | | | | | | |
Realized gain (loss) (identified cost basis) | | | | | | | | |
Investments | | | $8,932,305 | | | | | |
Swap agreements | | | 52,743 | | | | | |
Foreign currency | | | 109,437 | | | | | |
Net realized gain (loss) on investments and foreign currency | | | | | | | $9,094,485 | |
Change in unrealized appreciation (depreciation) | | | | | | | | |
Investments | | | $(18,327,092 | ) | | | | |
Swap agreements | | | 29,359 | | | | | |
Translation of assets and liabilities in foreign currencies | | | 92,408 | | | | | |
Net unrealized gain (loss) on investments and foreign currency translation | | | | | | | $(18,205,325 | ) |
Net realized and unrealized gain (loss) on investments and foreign currency | | | | | | | $(9,110,840 | ) |
Change in net assets from operations | | | | | | | $4,675,915 | |
See Notes to Financial Statements
16
MFS High Yield Portfolio
FINANCIAL STATEMENTS | STATEMENTS OF CHANGES IN NET ASSETS
These statements describe the increases and/or decreases in net assets resulting from operations, any distributions, and any shareholder transactions.
| | | | | | | | |
| |
| Six months ended
6/30/13
(unaudited |
) | |
| Year ended
12/31/12 |
|
Change in net assets | | | | | | | | |
| From operations | | | | | | | | |
Net investment income | | | $13,786,755 | | | | $16,255,469 | |
Net realized gain (loss) on investments and foreign currency | | | 9,094,485 | | | | 1,099,753 | |
Net unrealized gain (loss) on investments and foreign currency translation | | | (18,205,325 | ) | | | 15,517,435 | |
Change in net assets from operations | | | $4,675,915 | | | | $32,872,657 | |
| Distributions declared to shareholders | | | | | | | | |
From net investment income | | | $— | | | | $(15,115,079 | ) |
Change in net assets from fund share transactions | | | $(34,316,093 | ) | | | $232,394,674 | |
Total change in net assets | | | $(29,640,178 | ) | | | $250,152,252 | |
| Net assets | | | | | | | | |
At beginning of period | | | 479,325,265 | | | | 229,173,013 | |
At end of period (including undistributed net investment income of $30,756,023 and
$16,969,268, respectively) | | | $449,685,087 | | | | $479,325,265 | |
See Notes to Financial Statements
17
MFS High Yield Portfolio
FINANCIAL STATEMENTS | FINANCIAL HIGHLIGHTS
The financial highlights table is intended to help you understand the fund’s financial performance for the semiannual period and the past 5 fiscal years. Certain information reflects financial results for a single fund share. The total returns in the table represent the rate by which an investor would have earned (or lost) on an investment in the fund share class (assuming reinvestment of all distributions) held for the entire period.
| | | | | | | | | | | | | | | | | | | | | | | | |
| Initial Class | | Six months
ended
6/30/13 | | | Years ended 12/31 | |
| | | | 2012 | | | 2011 | | | 2010 | | | 2009 | | | 2008 | |
| | | (unaudited) | | | | | | | | | | | | | | | | |
Net asset value, beginning of period | | | $6.05 | | | | $5.64 | | | | $5.96 | | | | $5.67 | | | | $4.25 | | | | $6.56 | |
| Income (loss) from investment operations | | | | | | | | | | | | | | | | | | | | | | | | |
Net investment income (d) | | | $0.18 | | | | $0.40 | | | | $0.41 | | | | $0.42 | | | | $0.44 | | | | $0.49 | |
Net realized and unrealized gain (loss) on investments and foreign currency | | | (0.13 | ) | | | 0.42 | | | | (0.18 | ) | | | 0.42 | | | | 1.49 | | | | (2.26 | ) |
Total from investment operations | | | $0.05 | | | | $0.82 | | | | $0.23 | | | | $0.84 | | | | $1.93 | | | | $(1.77 | ) |
| Less distributions declared to shareholders | | | | | | | | | | | | | | | | | | | | | | | | |
From net investment income | | | $— | | | | $(0.41 | ) | | | $(0.55 | ) | | | $(0.55 | ) | | | $(0.51 | ) | | | $(0.54 | ) |
Net asset value, end of period (x) | | | $6.10 | | | | $6.05 | | | | $5.64 | | | | $5.96 | | | | $5.67 | | | | $4.25 | |
Total return (%) (k)(r)(s)(x) | | | 0.83 | (n) | | | 14.91 | | | | 4.13 | | | | 15.53 | | | | 50.00 | | | | (29.50 | ) |
Ratios (%) (to average net assets)
and Supplemental data: | | | | | | | | | | | | | | | | | | | | | | | | |
Expenses before expense reductions (f) | | | 0.76 | (a) | | | 0.81 | | | | 0.86 | | | | 0.88 | | | | 0.87 | | | | 0.89 | |
Expenses after expense reductions (f) | | | 0.75 | (a) | | | 0.79 | | | | 0.81 | | | | 0.83 | | | | 0.82 | | | | 0.84 | |
Net investment income | | | 5.88 | (a) | | | 6.65 | | | | 6.97 | | | | 7.42 | | | | 9.21 | | | | 8.60 | |
Portfolio turnover | | | 23 | (n) | | | 48 | | | | 57 | | | | 62 | | | | 58 | | | | 63 | |
Net assets at end of period (000 omitted) | | | $351,883 | | | | $368,899 | | | | $145,773 | | | | $122,666 | | | | $121,416 | | | | $96,605 | |
| | |
| Service Class | | Six months
ended
6/30/13 | | | Years ended 12/31 | |
| | | | 2012 | | | 2011 | | | 2010 | | | 2009 | | | 2008 | |
| | | (unaudited) | | | | | | | | | | | | | | | | |
Net asset value, beginning of period | | | $5.99 | | | | $5.59 | | | | $5.91 | | | | $5.63 | | | | $4.21 | | | | $6.50 | |
| Income (loss) from investment operations | | | | | | | | | | | | | | | | | | | | | | | | |
Net investment income (d) | | | $0.17 | | | | $0.38 | | | | $0.40 | | | | $0.41 | | | | $0.43 | | | | $0.47 | |
Net realized and unrealized gain (loss) on investments and foreign currency | | | (0.13 | ) | | | 0.41 | | | | (0.19 | ) | | | 0.40 | | | | 1.49 | | | | (2.24 | ) |
Total from investment operations | | | $0.04 | | | | $0.79 | | | | $0.21 | | | | $0.81 | | | | $1.92 | | | | $(1.77 | ) |
| Less distributions declared to shareholders | | | | | | | | | | | | | | | | | | | | | | | | |
From net investment income | | | $— | | | | $(0.39 | ) | | | $(0.53 | ) | | | $(0.53 | ) | | | $(0.50 | ) | | | $(0.52 | ) |
Net asset value, end of period (x) | | | $6.03 | | | | $5.99 | | | | $5.59 | | | | $5.91 | | | | $5.63 | | | | $4.21 | |
Total return (%) (k)(r)(s)(x) | | | 0.67 | (n) | | | 14.54 | | | | 3.86 | | | | 15.17 | | | | 49.97 | | | | (29.64 | ) |
Ratios (%) (to average net assets)
and Supplemental data: | | | | | | | | | | | | | | | | | | | | | | | | |
Expenses before expense reductions (f) | | | 1.01 | (a) | | | 1.06 | | | | 1.11 | | | | 1.13 | | | | 1.12 | | | | 1.14 | |
Expenses after expense reductions (f) | | | 1.00 | (a) | | | 1.04 | | | | 1.06 | | | | 1.08 | | | | 1.07 | | | | 1.09 | |
Net investment income | | | 5.63 | (a) | | | 6.46 | | | | 6.73 | | | | 7.18 | | | | 9.01 | | | | 8.38 | |
Portfolio turnover | | | 23 | (n) | | | 48 | | | | 57 | | | | 62 | | | | 58 | | | | 63 | |
Net assets at end of period (000 omitted) | | | $97,802 | | | | $110,426 | | | | $83,400 | | | | $101,189 | | | | $108,217 | | | | $103,169 | |
See Notes to Financial Statements
18
MFS High Yield Portfolio
Financial Highlights – continued
| (d) | | Per share data is based on average shares outstanding. |
| (f) | | Ratios do not reflect reductions from fees paid indirectly, if applicable. |
| (k) | | The total return does not reflect expenses that apply to separate accounts. Inclusion of these charges would reduce the total return figures for all periods shown. |
| (r) | | Certain expenses have been reduced without which performance would have been lower. |
| (s) | | From time to time the fund may receive proceeds from litigation settlements, without which performance would be lower. |
| (x) | | The net asset values per share and total returns have been calculated on net assets which include adjustments made in accordance with U.S. generally accepted accounting principles required at period end for financial reporting purposes. |
See Notes to Financial Statements
19
MFS High Yield Portfolio
NOTES TO FINANCIAL STATEMENTS (unaudited)
| (1) | | Business and Organization |
MFS High Yield Portfolio (the fund) is a series of MFS Variable Insurance Trust II (the trust). The trust is organized as a Massachusetts business trust and is registered under the Investment Company Act of 1940, as amended, as an open-end management investment company. The shareholders of each series of the trust are separate accounts of insurance companies, which offer variable annuity and/or life insurance products, and qualified retirement and pension plans.
| (2) | | Significant Accounting Policies |
General – The preparation of financial statements in conformity with U.S. generally accepted accounting principles requires management to make estimates and assumptions that affect the reported amounts of assets and liabilities, and disclosure of contingent assets and liabilities at the date of the financial statements and the reported amounts of revenues and expenses during the reporting period. Actual results could differ from those estimates. In the preparation of these financial statements, management has evaluated subsequent events occurring after the date of the fund’s Statement of Assets and Liabilities through the date that the financial statements were issued. The fund invests in high-yield securities rated below investment grade. Investments in high-yield securities involve greater degrees of credit and market risk than investments in higher-rated securities and tend to be more sensitive to economic conditions. The fund invests in foreign securities. Investments in foreign securities are vulnerable to the effects of changes in the relative values of the local currency and the U.S. dollar and to the effects of changes in each country’s legal, political, and economic environment.
In this reporting period, the fund adopted the disclosure provisions of the Financial Accounting Standards Board (FASB) Accounting Standards Update 2011-11 (“ASU 2011-11”), Balance Sheet (Topic 210) – Disclosures about Offsetting Assets and Liabilities along with the related scope clarification provisions of FASB Accounting Standards Update 2013-01 (“ASU 2013-01”) entitled Balance Sheet (Topic 210) – Clarifying the Scope of Disclosures about Offsetting Assets and Liabilities. ASU 2011-11 is intended to enhance disclosures on the offsetting of financial assets and liabilities by requiring entities to disclose both gross and net information about financial instruments and transactions that are either offset in the statement of financial position or subject to a Master Netting Agreement or similar arrangement. ASU 2013-01 limits the scope of ASU 2011-11’s disclosure requirements on offsetting to financial assets and financial liabilities related to derivatives, repurchase and reverse repurchase agreements, and securities lending and securities borrowing transactions. The disclosures required by ASU 2011-11, to the extent applicable to the fund, have been included in the fund’s Significant Accounting Policies note under the captions for each of the fund’s in-scope financial instruments and transactions.
In June 2013, FASB issued Accounting Standards Update 2013-08 Financial Services – Investment Companies (Topic 946) – Amendments to the Scope, Measurement, and Disclosure Requirements (“ASU 2013-08”) which is effective for interim and annual reporting periods in fiscal years that begin after December 15, 2013. ASU 2013-08 sets forth a methodology for determining whether an entity should be characterized as an investment company and prescribes fair value accounting for an investment company’s non-controlling ownership interest in another investment company. FASB has determined that a fund registered under the Investment Company Act of 1940 automatically meets ASU 2013-08’s criteria for an investment company. Although still evaluating the potential impacts of ASU 2013-08 to the fund, management expects that the impact of the fund’s adoption will be limited to additional financial statement disclosures.
Investment Valuations – Debt instruments and floating rate loans (other than short-term instruments), including restricted debt instruments, are generally valued at an evaluated or composite bid as provided by a third-party pricing service. Equity securities, including restricted equity securities, are generally valued at the last sale or official closing price as provided by a third-party pricing service on the market or exchange on which they are primarily traded. Equity securities, for which there were no sales reported that day, are generally valued at the last quoted daily bid quotation as provided by a third-party pricing service on the market or exchange on which such securities are primarily traded. Short-term instruments with a maturity at issuance of 60 days or less generally are valued at amortized cost, which approximates market value. Exchange-traded options are generally valued at the last sale or official closing price as provided by a third-party pricing service on the exchange on which such options are primarily traded. Exchange-traded options for which there were no sales reported that day are generally valued at the last daily bid quotation as provided by a third-party pricing service on the exchange on which such options are primarily traded. Options not traded on an exchange are generally valued at a broker/dealer bid quotation. Foreign currency options are generally valued at valuations provided by a third-party pricing service. Forward foreign currency exchange contracts are generally valued at the mean of bid and asked prices for the time period interpolated from rates provided by a third-party pricing service for proximate time periods. Swap agreements are generally valued at valuations provided by a third-party pricing service, which for cleared swaps includes an evaluation of any trading activity at the clearinghouses. Open-end investment companies are generally valued at net asset value per share. Securities and other assets generally valued on the basis of information from a third-party pricing service may also be valued at a broker/dealer bid quotation. Values obtained from third-party pricing services can utilize both transaction data and market information such as yield, quality, coupon rate, maturity, type of issue, trading characteristics, and other market data. The values of foreign securities and other assets and liabilities expressed in foreign currencies are converted to U.S. dollars using the mean of bid and asked prices for rates provided by a third-party pricing service.
20
MFS High Yield Portfolio
Notes to Financial Statements (unaudited) – continued
The Board of Trustees has delegated primary responsibility for determining or causing to be determined the value of the fund’s investments (including any fair valuation) to the adviser pursuant to valuation policies and procedures approved by the Board. If the adviser determines that reliable market quotations are not readily available, investments are valued at fair value as determined in good faith by the adviser in accordance with such procedures under the oversight of the Board of Trustees. Under the fund’s valuation policies and procedures, market quotations are not considered to be readily available for most types of debt instruments and floating rate loans and many types of derivatives. These investments are generally valued at fair value based on information from third-party pricing services. In addition, investments may be valued at fair value if the adviser determines that an investment’s value has been materially affected by events occurring after the close of the exchange or market on which the investment is principally traded (such as foreign exchange or market) and prior to the determination of the fund’s net asset value, or after the halting of trading of a specific security where trading does not resume prior to the close of the exchange or market on which the security is principally traded. The adviser generally relies on third-party pricing services or other information (such as the correlation with price movements of similar securities in the same or other markets; the type, cost and investment characteristics of the security; the business and financial condition of the issuer; and trading and other market data) to assist in determining whether to fair value and at what value to fair value an investment. The value of an investment for purposes of calculating the fund’s net asset value can differ depending on the source and method used to determine value. When fair valuation is used, the value of an investment used to determine the fund’s net asset value may differ from quoted or published prices for the same investment. There can be no assurance that the fund could obtain the fair value assigned to an investment if it were to sell the investment at the same time at which the fund determines its net asset value per share.
Various inputs are used in determining the value of the fund’s assets or liabilities. These inputs are categorized into three broad levels. In certain cases, the inputs used to measure fair value may fall into different levels of the fair value hierarchy. In such cases, an investment’s level within the fair value hierarchy is based on the lowest level of input that is significant to the fair value measurement. The fund’s assessment of the significance of a particular input to the fair value measurement in its entirety requires judgment, and considers factors specific to the investment. Level 1 includes unadjusted quoted prices in active markets for identical assets or liabilities. Level 2 includes other significant observable market-based inputs (including quoted prices for similar securities, interest rates, prepayment speed, and credit risk). Level 3 includes unobservable inputs, which may include the adviser’s own assumptions in determining the fair value of investments. Other financial instruments are derivative instruments not reflected in total investments, such as forward foreign currency exchange contracts and swap agreements. The following is a summary of the levels used as of June 30, 2013 in valuing the fund’s assets or liabilities:
| | | | | | | | | | | | | | | | |
| Investments at Value | | Level 1 | | | Level 2 | | | Level 3 | | | Total | |
| Equity Securities | | | $1,400,478 | | | | $579,520 | | | | $135,004 | | | | $2,115,002 | |
| Non-U.S. Sovereign Debt | | | — | | | | 1,247,718 | | | | — | | | | 1,247,718 | |
| Municipal Bonds | | | — | | | | 629,753 | | | | — | | | | 629,753 | |
| U.S. Corporate Bonds | | | — | | | | 349,283,463 | | | | — | | | | 349,283,463 | |
| Commercial Mortgage-Backed Securities | | | — | | | | 678,205 | | | | — | | | | 678,205 | |
| Asset-Backed Securities (including CDOs) | | | — | | | | 396,097 | | | | — | | | | 396,097 | |
| Foreign Bonds | | | — | | | | 74,619,940 | | | | — | | | | 74,619,940 | |
| Floating Rate Loans | | | — | | | | 9,624,401 | | | | — | | | | 9,624,401 | |
| Mutual Funds | | | 5,498,403 | | | | — | | | | — | | | | 5,498,403 | |
| Total Investments | | | $6,898,881 | | | | $437,059,097 | | | | $135,004 | | | | $444,092,982 | |
| | | | |
| Other Financial Instruments | | | | | | | | | | | | |
| Swap Agreements | | | $— | | | | $222,268 | | | | $— | | | | $222,268 | |
| Forward Foreign Currency Exchange Contracts | | | — | | | | 26,704 | | | | — | | | | 26,704 | |
For further information regarding security characteristics, see the Portfolio of Investments.
The following is a reconciliation of level 3 assets for which significant unobservable inputs were used to determine fair value. The fund’s policy is to recognize transfers between the levels as of the end of the period. The table presents the activity of level 3 securities held at the beginning and the end of the period.
| | | | |
| | | Equity Securities | |
| Balance as of 12/31/12 | | | $148,986 | |
Realized gain (loss) | | | (19,620 | ) |
Change in unrealized appreciation (depreciation) | | | 39,362 | |
Sales | | | (33,724 | ) |
| Balance as of 6/30/13 | | | $135,004 | |
The net change in unrealized appreciation (depreciation) from investments still held as level 3 at June 30, 2013 is $12,858.
21
MFS High Yield Portfolio
Notes to Financial Statements (unaudited) – continued
Foreign Currency Translation – Purchases and sales of foreign investments, income, and expenses are converted into U.S. dollars based upon currency exchange rates prevailing on the respective dates of such transactions or on the reporting date for foreign denominated receivables and payables. Gains and losses attributable to foreign currency exchange rates on sales of securities are recorded for financial statement purposes as net realized gains and losses on investments. Gains and losses attributable to foreign exchange rate movements on receivables, payables, income and expenses are recorded for financial statement purposes as foreign currency transaction gains and losses. That portion of both realized and unrealized gains and losses on investments that results from fluctuations in foreign currency exchange rates is not separately disclosed.
Derivatives – The fund uses derivatives for different purposes, primarily to increase or decrease exposure to a particular market or segment of the market, or security, to increase or decrease interest rate or currency exposure, or as alternatives to direct investments. Derivatives are used for hedging or non-hedging purposes. While hedging can reduce or eliminate losses, it can also reduce or eliminate gains. When the fund uses derivatives as an investment to increase market exposure, or for hedging purposes, gains and losses from derivative instruments may be substantially greater than the derivative’s original cost.
The derivative instruments used by the fund were purchased options, forward foreign currency exchange contracts, and swap agreements. The fund’s period end derivatives, as presented in the Portfolio of Investments and the associated Derivative Contract tables, generally are indicative of the volume of its derivative activity during the period.
The following table presents, by major type of derivative contract, the fair value, on a gross basis, of the asset and liability components of derivatives held by the fund at June 30, 2013 as reported in the Statement of Assets and Liabilities:
| | | | | | | | | | |
| | | | | Fair Value | |
| Risk | | Derivative Contracts | | Asset Derivatives | | | Liability Derivatives | |
| Foreign Exchange | | Forward Foreign Currency Exchange | | | $40,774 | | | | $(14,070 | ) |
| Credit | | Credit Default Swaps | | | 222,268 | | | | — | |
| Total | | | | | $263,042 | | | | $(14,070 | ) |
The following table presents, by major type of derivative contract, the realized gain (loss) on derivatives held by the fund for the six months ended June 30, 2013 as reported in the Statement of Operations:
| | | | | | | | | | | | |
| Risk | | Swap Agreements | | | Foreign Currency | | | Investments (Purchased Options) | |
| Foreign Exchange | | | $— | | | | $98,336 | | | | $— | |
| Equity | | | — | | | | — | | | | 818,931 | |
| Credit | | | 52,743 | | | | — | | | | — | |
| Total | | | $52,743 | | | | $98,336 | | | | $818,931 | |
The following table presents, by major type of derivative contract, the change in unrealized appreciation (depreciation) on derivatives held by the fund for the six months ended June 30, 2013 as reported in the Statement of Operations:
| | | | | | | | | | | | |
| Risk | | Swap Agreements | | | Translation of Assets and Liabilities in Foreign Currencies | | | Investments (Purchased Options) | |
| Foreign Exchange | | | $— | | | | $91,342 | | | | $— | |
| Equity | | | — | | | | — | | | | (9,458 | ) |
| Credit | | | 29,359 | | | | — | | | | — | |
| Total | | | $29,359 | | | | $91,342 | | | | $(9,458 | ) |
Derivative counterparty credit risk is managed through formal evaluation of the creditworthiness of all potential counterparties. On certain, but not all, over-the-counter derivatives, the fund attempts to reduce its exposure to counterparty credit risk whenever possible by entering into an International Swaps and Derivatives Association (ISDA) Master Agreement on a bilateral basis with each of the counterparties with whom it undertakes a significant volume of transactions. The ISDA Master Agreement gives each party to the agreement the right to terminate all transactions traded under such agreement if there is a certain deterioration in the credit quality of the other party. Upon an event of default or a termination of the ISDA Master Agreement, the non-defaulting party has the right to close out all transactions traded under such agreement and to net amounts owed under each transaction to one net amount payable by one party to the other. This right to close out and net payments across all transactions traded under the ISDA Master Agreement could result in a reduction of the fund’s credit risk to such counterparty equal to any amounts payable by the fund under the applicable transactions, if any.
Collateral and margin requirements differ by type of derivative. Margin requirements are set by the broker or clearing house for cleared derivatives (i.e., futures contracts, cleared swaps, and exchange-traded options) while collateral terms are contract specific for
22
MFS High Yield Portfolio
Notes to Financial Statements (unaudited) – continued
over-the-counter traded derivatives (i.e., forward foreign currency exchange contracts, uncleared swap agreements, and over-the-counter options). For derivatives traded under an ISDA Master Agreement, the collateral requirements are netted across all transactions traded under such agreement and one amount is posted from one party to the other to collateralize such obligations. Cash that has been segregated to cover the fund’s collateral or margin obligations under derivative contracts, if any, will be reported separately in the Statement of Assets and Liabilities as “Restricted cash”. Securities pledged as collateral or margin for the same purpose, if any, is noted in the Portfolio of Investments.
The fund’s accounting policy with respect to balance sheet offsetting is that, absent an event of default by the counterparty or a termination of the agreement, the ISDA Master Agreement does not result in an offset of reported amounts of financial assets and financial liabilities in the Statement of Assets and Liabilities across transactions between the fund and the applicable counterparty.
Purchased Options – The fund purchased call options for a premium. Purchased call options entitle the holder to buy a specified number of shares or units of a particular security, currency or index at a specified price at a specified date or within a specified period of time. Purchasing call options may hedge against an anticipated increase in the dollar cost of securities or currency to be acquired or increase the fund’s exposure to an underlying instrument.
The premium paid is initially recorded as an investment in the Statement of Assets and Liabilities. That investment is subsequently marked-to-market daily with the difference between the premium paid and the market value of the purchased option being recorded as unrealized appreciation or depreciation. Premiums paid for purchased call options which have expired are treated as realized losses on investments in the Statement of Operations. Upon the exercise or closing of a purchased call option, the premium paid is added to the cost of the security or financial instrument purchased.
Whether or not the option is exercised, the fund’s maximum risk of loss from purchasing an option is the amount of premium paid. All option contracts involve credit risk if the counterparty to the option contract fails to perform. For over-the-counter options, this risk is mitigated in cases where there is an ISDA Master Agreement between the fund and the counterparty providing for netting as described above and for posting of collateral by the counterparty to the fund to cover the fund’s exposure to the counterparty under such ISDA Master Agreement.
Forward Foreign Currency Exchange Contracts – The fund entered into forward foreign currency exchange contracts for the purchase or sale of a specific foreign currency at a fixed price on a future date. These contracts may be used to hedge the fund’s currency risk or for non-hedging purposes. For hedging purposes, the fund may enter into contracts to deliver or receive foreign currency that the fund will receive from or use in its normal investment activities. The fund may also use contracts to hedge against declines in the value of foreign currency denominated securities due to unfavorable exchange rate movements. For non-hedging purposes, the fund may enter into contracts with the intent of changing the relative exposure of the fund’s portfolio of securities to different currencies to take advantage of anticipated exchange rate changes.
Forward foreign currency exchange contracts are adjusted by the daily exchange rate of the underlying currency and any unrealized gains or losses are recorded as a receivable or payable for forward foreign currency exchange contracts until the contract settlement date. On contract settlement date, any gain or loss on the contract is recorded as realized gains or losses on foreign currency.
Risks may arise upon entering into these contracts from unanticipated movements in the value of the contract and from the potential inability of counterparties to meet the terms of their contracts. Generally, the fund’s maximum risk due to counterparty credit risk is the unrealized gain on the contract due to the use of Continuous Linked Settlement, an industry accepted settlement system. This risk is mitigated in cases where there is an ISDA Master Agreement between the fund and the counterparty providing for netting as described above and for posting of collateral by the counterparty to the fund to cover the fund’s exposure to the counterparty under such ISDA Master Agreement.
Swap Agreements – During the period the fund entered into swap agreements. Effective June 10, 2013, certain types of swaps (“cleared swaps”) are required to be centrally cleared under provisions of the Dodd-Frank Regulatory Reform Bill. In a cleared swap transaction, the swap agreement is novated to a central counterparty (the “clearinghouse”) immediately following execution of the swap contract with an executing broker. Thereafter, throughout the term of the cleared swap, the fund interfaces indirectly with the clearinghouse through a clearing broker.
A swap agreement is generally an exchange of cash payments, at specified intervals or upon the occurrence of specified events, between the fund and a counterparty. The net cash payments exchanged are recorded as a realized gain or loss on swap agreements in the Statement of Operations. The value of the swap agreement, which is adjusted daily and includes any related interest accruals to be paid or received by the fund, is recorded in the Statement of Assets and Liabilities. The daily change in value, including any related interest accruals to be paid or received, is recorded as unrealized appreciation or depreciation on swap agreements in the Statement of Operations. The daily change in valuation of centrally cleared swaps is recorded as a receivable or payable for variation margin in the Statement of Assets and Liabilities. Amounts paid or received at the inception of the swap agreement are reflected as premiums paid or received in the Statement of Assets and Liabilities and are amortized using the effective interest method over the term of the agreement. A liquidation payment received or made upon early termination is recorded as a realized gain or loss on swap agreements in the Statement of Operations.
23
MFS High Yield Portfolio
Notes to Financial Statements (unaudited) – continued
Risks related to swap agreements include the possible lack of a liquid market, unfavorable market and interest rate movements of the underlying instrument and the failure of the counterparty to perform under the terms of the agreements. To address counterparty risk, swap agreements are limited to only highly-rated counterparties. For uncleared swaps, that risk is further reduced by having an ISDA Master Agreement between the fund and the counterparty providing for netting as described above and by the posting of collateral by the counterparty to the fund to cover the fund’s exposure to the counterparty under such ISDA Master Agreement. Although not covered by an ISDA Master Agreement, the fund’s counterparty risk due to cleared swaps is mitigated by the clearinghouses’ margining requirements and financial safeguards in the event of a clearing broker default.
The fund entered into credit default swap agreements in order to manage its exposure to the market or certain sectors of the market, to reduce its credit risk exposure to defaults of corporate and sovereign issuers or to create exposure to corporate or sovereign issuers to which it is not otherwise exposed. In a credit default swap agreement, the protection buyer can make an upfront payment and will make a stream of payments based on a fixed percentage applied to the agreement notional amount to the protection seller in exchange for the right to receive a specified return upon the occurrence of a defined credit event on the reference obligation (which may be either a single security or a basket of securities issued by corporate or sovereign issuers) and, with respect to the rare cases where physical settlement applies, the delivery by the buyer to the seller of a defined deliverable obligation. Although agreement-specific, credit events generally consist of a combination of the following: bankruptcy, failure to pay, restructuring, obligation acceleration, obligation default, or repudiation/moratorium, each as defined in the 2003 ISDA Credit Derivatives Definitions as amended by the relevant agreement. Restructuring is generally not applicable when the reference obligation is issued by a North American corporation and obligation acceleration, obligation default, or repudiation/moratorium are generally only applicable when the reference obligation is issued by a sovereign entity or an entity in an emerging country. Upon determination of the final price for the deliverable obligation (or upon delivery of the deliverable obligation in the case of physical settlement), the difference between the value of the deliverable obligation and the swap agreement’s notional amount is recorded as realized gain or loss on swap agreements in the Statement of Operations.
Credit default swap agreements are considered to have credit-risk-related contingent features since they trigger payment by the protection seller to the protection buyer upon the occurrence of a defined credit event. As discussed earlier in this note, any collateral requirements for these swap agreements are based generally on the market value of the swap agreement netted against collateral requirements for other types of over-the-counter derivatives traded under each counterparty’s ISDA Master Agreement. The maximum amount of future, undiscounted payments that the fund, as protection seller, could be required to make is equal to the swap agreement’s notional amount. The protection seller’s payment obligation would be offset to the extent of the value of the agreement’s deliverable obligation. At June 30, 2013, the fund did not hold any credit default swap agreements at an unrealized loss where it is the protection seller.
The fund’s maximum risk of loss from counterparty risk, either as the protection seller or as the protection buyer, is the fair value of the agreement. For uncleared swaps, counterparty risk is reduced by having an ISDA Master Agreement between the fund and the counterparty providing for netting as described above and by the posting of collateral by the counterparty to the fund to cover the fund’s exposure to the counterparty under such ISDA Master Agreement. For cleared swaps, the fund’s counterparty risk is mitigated by the clearinghouses’ margining requirements and financial safeguards in the event of a clearing broker default.
Loans and Other Direct Debt Instruments – The fund invests in loans and loan participations or other receivables. These investments may include standby financing commitments, including revolving credit facilities, which obligate the fund to supply additional cash to the borrower on demand. Loan participations involve a risk of insolvency of the lending bank or other financial intermediary.
Indemnifications – Under the fund’s organizational documents, its officers and Trustees may be indemnified against certain liabilities and expenses arising out of the performance of their duties to the fund. Additionally, in the normal course of business, the fund enters into agreements with service providers that may contain indemnification clauses. The fund’s maximum exposure under these agreements is unknown as this would involve future claims that may be made against the fund that have not yet occurred.
Investment Transactions and Income – Investment transactions are recorded on the trade date. Interest income is recorded on the accrual basis. All premium and discount is amortized or accreted for financial statement purposes in accordance with U.S. generally accepted accounting principles. The fund earns certain fees in connection with its floating rate loan purchasing activities. These fees are in addition to interest payments earned and may include amendment fees, commitment fees, facility fees, consent fees, and prepayment fees. Commitment fees are recorded on an accrual basis as income in the accompanying financial statements. Dividends received in cash are recorded on the ex-dividend date. Certain dividends from foreign securities will be recorded when the fund is informed of the dividend if such information is obtained subsequent to the ex-dividend date. Dividend and interest payments received in additional securities are recorded on the ex-dividend or ex-interest date in an amount equal to the value of the security on such date. Debt obligations may be placed on non-accrual status or set to accrue at a rate of interest less than the contractual coupon when the collection of all or a portion of interest has become doubtful. Interest income for those debt obligations may be further reduced by the write-off of the related interest receivables when deemed uncollectible.
24
MFS High Yield Portfolio
Notes to Financial Statements (unaudited) – continued
The fund may receive proceeds from litigation settlements. Any proceeds received from litigation involving portfolio holdings are reflected in the Statement of Operations in realized gain/loss if the security has been disposed of by the fund or in unrealized gain/loss if the security is still held by the fund. Any other proceeds from litigation not related to portfolio holdings are reflected as other income in the Statement of Operations.
Fees Paid Indirectly – The fund’s custody fee may be reduced according to an arrangement that measures the value of cash deposited with the custodian by the fund. This amount, for the six months ended June 30, 2013, is shown as a reduction of total expenses in the Statement of Operations.
Tax Matters and Distributions – The fund intends to qualify as a regulated investment company, as defined under Subchapter M of the Internal Revenue Code, and to distribute all of its taxable income, including realized capital gains. As a result, no provision for federal income tax is required. The fund’s federal tax returns, when filed, will remain subject to examination by the Internal Revenue Service for a three year period. Foreign taxes have been accrued by the fund in the accompanying financial statements in accordance with the applicable foreign tax law. Foreign income taxes may be withheld by certain countries in which the fund invests.
Distributions to shareholders are recorded on the ex-dividend date. Income and capital gain distributions are determined in accordance with income tax regulations, which may differ from U.S. generally accepted accounting principles. Certain capital accounts in the financial statements are periodically adjusted for permanent differences in order to reflect their tax character. These adjustments have no impact on net assets or net asset value per share. Temporary differences which arise from recognizing certain items of income, expense, gain or loss in different periods for financial statement and tax purposes will reverse at some time in the future. Distributions in excess of net investment income or net realized gains are temporary overdistributions for financial statement purposes resulting from differences in the recognition or classification of income or distributions for financial statement and tax purposes.
Book/tax differences primarily relate to amortization and accretion of debt securities.
The tax character of distributions declared to shareholders for the last fiscal year is as follows:
| | | | |
| | | 12/31/12 | |
| Ordinary income (including any short-term capital gains) | | | $15,115,079 | |
The federal tax cost and the tax basis components of distributable earnings were as follows:
| | | | |
| As of 6/30/13 | | | | |
| Cost of investments | | | $446,684,054 | |
| Gross appreciation | | | 9,649,390 | |
| Gross depreciation | | | (12,240,462 | ) |
| Net unrealized appreciation (depreciation) | | | $(2,591,072 | ) |
| |
| As of 12/31/12 | | | | |
| Undistributed ordinary income | | | 17,011,962 | |
| Capital loss carryforwards | | | (47,585,584 | ) |
| Other temporary differences | | | (118,487 | ) |
| Net unrealized appreciation (depreciation) | | | 16,396,978 | |
The aggregate cost above includes prior fiscal year end tax adjustments, if applicable.
Under the Regulated Investment Company Modernization Act of 2010 (the “Act”), net capital losses recognized for fund fiscal years beginning after December 31, 2010 may be carried forward indefinitely, and their character is retained as short-term and/or long-term losses (“post-enactment losses”). Previously, net capital losses were carried forward for eight years and treated as short-term losses (“pre-enactment losses”). As a transition rule, the Act requires that all post-enactment net capital losses be used before pre-enactment net capital losses.
As of December 31, 2012, the fund had capital loss carryforwards available to offset future realized gains as follows:
| | | | |
Pre-enactment losses which expire as follows: | | | | |
| 12/31/13 | | | $(5,089,839 | ) |
| 12/31/14 | | | (7,011,353 | ) |
| 12/31/16 | | | (23,243,372 | ) |
| 12/31/17 | | | (11,194,472 | ) |
| Total | | | $(46,539,036 | ) |
| |
Post-enactment losses which are characterized as follows: | | | | |
| Long-Term | | | $(1,046,548 | ) |
25
MFS High Yield Portfolio
Notes to Financial Statements (unaudited) – continued
Multiple Classes of Shares of Beneficial Interest – The fund offers multiple classes of shares, which differ in their respective distribution and/or service fees. The fund’s income, realized and unrealized gain (loss), and common expenses are allocated to shareholders based on the daily net assets of each class. Dividends are declared separately for each class. Differences in per share dividend rates are generally due to differences in separate class expenses. The fund’s distributions declared to shareholders as reported in the Statements of Changes in Net Assets are presented by class as follows:
| | | | | | | | |
| | | From net investment
income | |
| | | Six months ended
6/30/13 | | | Year ended
12/31/12 | |
| Initial Class | | | $— | | | | $9,977,961 | |
| Service Class | | | — | | | | 5,137,118 | |
| Total | | | $— | | | | $15,115,079 | |
| (3) | | Transactions with Affiliates |
Investment Adviser – The fund has an investment advisory agreement with MFS to provide overall investment management and related administrative services and facilities to the fund. The management fee is computed daily and paid monthly at the following annual rates:
| | | | |
| First $1 billion of average daily net assets | | | 0.70% | |
| Average daily net assets in excess of $1 billion | | | 0.65% | |
Effective April 1, 2013, MFS has agreed in writing to reduce its management fee by a specified amount if certain MFS mutual fund assets exceed thresholds agreed to by MFS and the fund’s Board of Trustees. For the period April 1, 2013 through June 30, 2013, this management fee reduction amounted to $639, which is shown as a reduction of total expenses in the Statement of Operations. The management fee incurred for the six months ended June 30, 2013 was equivalent to an annual effective rate of 0.70% of the fund’s average daily net assets.
The investment adviser has agreed in writing to pay a portion of the fund’s total annual operating expenses, exclusive of interest, taxes, extraordinary expenses, brokerage and transaction costs, and investment-related expenses, such that total annual operating expenses do not exceed 0.75% of average daily net assets for the Initial Class shares and 1.00% of average daily net assets for the Service Class shares. This written agreement will continue until modified by the fund’s Board of Trustees, but such agreement will continue at least until December 31, 2014. For the six months ended June 30, 2013, this reduction amounted to $9,450 and is reflected as a reduction of total expenses in the Statement of Operations.
Distributor – MFS Fund Distributors, Inc. (MFD), a wholly-owned subsidiary of MFS, is the distributor of shares of the fund. The Trustees have adopted a distribution plan for the Service Class shares pursuant to Rule 12b-1 under the Investment Company Act of 1940.
The fund’s distribution plan provides that the fund will pay MFD distribution and/or service fees equal to 0.25% per annum of its average daily net assets attributable to Service Class shares as partial consideration for services performed and expenses incurred by MFD and financial intermediaries (including participating insurance companies that invest in the fund to fund variable annuity and variable life insurance contracts, sponsors of qualified retirement and pension plans that invest in the fund, and affiliates of these participating insurance companies and plan sponsors) in connection with the sale and distribution of the Service Class shares. MFD may subsequently pay all, or a portion, of the distribution and/or service fees to financial intermediaries.
Shareholder Servicing Agent – Effective April 1, 2013, MFS Service Center, Inc. (MFSC), a wholly-owned subsidiary of MFS, receives a fee from the fund for its services as shareholder servicing agent. For the period from April 1, 2013 through June 30, 2013, the fee was $2,131, which equated to 0.0009% annually of the fund’s average daily net assets. MFSC also receives payment from the fund for out-of-pocket expenses paid by MFSC on behalf of the fund. For the period from April 1, 2013 through June 30, 2013, these costs amounted to $5.
Administrator – MFS provides certain financial, legal, shareholder communications, compliance, and other administrative services to the fund. Under an administrative services agreement, the fund partially reimburses MFS the costs incurred to provide these services. The fund is charged an annual fixed amount of $17,500 plus a fee based on average daily net assets. The administrative services fee incurred for the six months ended June 30, 2013 was equivalent to an annual effective rate of 0.0148% of the fund’s average daily net assets.
Trustees’ and Officers’ Compensation – The fund pays compensation to independent Trustees in the form of a retainer, attendance fees, and additional compensation to Board and Committee chairpersons. The fund does not pay compensation directly to Trustees or officers of the fund who are also officers of the investment adviser, all of whom receive remuneration for their services to the fund from MFS. Certain officers and Trustees of the fund are officers or directors of MFS, MFD, and MFSC.
26
MFS High Yield Portfolio
Notes to Financial Statements (unaudited) – continued
Other – This fund and certain other funds managed by MFS (the funds) have entered into services agreements (the Agreements) which provide for payment of fees by the funds to Tarantino LLC and Griffin Compliance LLC in return for the provision of services of an Independent Chief Compliance Officer (ICCO) and Assistant ICCO, respectively, for the funds. The ICCO and Assistant ICCO are officers of the funds and the sole members of Tarantino LLC and Griffin Compliance LLC, respectively. The funds can terminate the Agreements with Tarantino LLC and Griffin Compliance LLC at any time under the terms of the Agreements. For the six months ended June 30, 2013, the aggregate fees paid by the fund to Tarantino LLC and Griffin Compliance LLC were $1,834 and are included in “Miscellaneous” expense in the Statement of Operations. MFS has agreed to reimburse the fund for a portion of the payments made by the fund in the amount of $908, which is shown as a reduction of total expenses in the Statement of Operations. Additionally, MFS has agreed to bear all expenses associated with office space, other administrative support, and supplies provided to the ICCO and Assistant ICCO.
The fund invests in the MFS Institutional Money Market Portfolio which is managed by MFS and seeks current income consistent with preservation of capital and liquidity. Income earned on this investment is included in “Dividends from underlying affiliated funds” in the Statement of Operations. This money market fund does not pay a management fee to MFS.
Purchases and sales of investments, other than purchased option transactions and short-term obligations, aggregated $97,070,067 and $101,730,692, respectively.
| (5) | | Shares of Beneficial Interest |
The fund’s Declaration of Trust permits the Trustees to issue an unlimited number of full and fractional shares of beneficial interest. Transactions in fund shares were as follows:
| | | | | | | | | | | | | | | | |
| | | Six months ended 6/30/13 | | | Year ended 12/31/12 | |
| | | Shares | | | Amount | | | Shares | | | Amount | |
| Shares sold | | | | | | | | | | | | | | | | |
Initial Class | | | 1,176,038 | | | | $7,271,355 | | | | 1,603,075 | | | | $9,608,510 | |
Service Class | | | 700,276 | | | | 4,267,156 | | | | 1,054,005 | | | | 6,297,096 | |
| | | 1,876,314 | | | | $11,538,511 | | | | 2,657,080 | | | | $15,905,606 | |
| Shares issued in connection with acquisition of SC PIMCO High Yield Fund | | | | | | | | | | | | | | | | |
Initial Class | | | — | | | | $— | | | | 36,405,923 | | | | $218,799,595 | |
Service Class | | | — | | | | — | | | | 5,600,234 | | | | 33,321,569 | |
| | | — | | | | $— | | | | 42,006,157 | | | | $252,121,164 | |
| Shares issued to shareholders in reinvestment of distributions | | | | | | | | | | | | | | | | |
Initial Class | | | — | | | | $— | | | | 1,726,291 | | | | $9,977,961 | |
Service Class | | | — | | | | — | | | | 898,098 | | | | 5,137,118 | |
| | | — | | | | $— | | | | 2,624,389 | | | | $15,115,079 | |
| Shares reacquired | | | | | | | | | | | | | | | | |
Initial Class | | | (4,510,771 | ) | | | $(27,889,220 | ) | | | (4,555,720 | ) | | | $(27,054,094 | ) |
Service Class | | | (2,935,288 | ) | | | (17,965,384 | ) | | | (4,035,220 | ) | | | (23,693,081 | ) |
| | | (7,446,059 | ) | | | $(45,854,604 | ) | | | (8,590,940 | ) | | | $(50,747,175 | ) |
| Net change | | | | | | | | | | | | | | | | |
Initial Class | | | (3,334,733 | ) | | | $(20,617,865 | ) | | | 35,179,569 | | | | $211,331,972 | |
Service Class | | | (2,235,012 | ) | | | (13,698,228 | ) | | | 3,517,117 | | | | 21,062,702 | |
| | | (5,569,745 | ) | | | $(34,316,093 | ) | | | 38,696,686 | | | | $232,394,674 | |
The fund is one of several mutual funds in which the MFS funds-of-funds may invest. The MFS funds-of-funds do not invest in the underlying MFS funds for the purpose of exercising management or control. At the end of the period, the MFS Moderate Allocation Portfolio, the MFS Conservative Allocation Portfolio, and the MFS Growth Allocation Portfolio were the owners of record of approximately 22%, 10%, and 6%, respectively, of the value of outstanding voting shares of the fund.
The fund and certain other funds managed by MFS participate in a $1.1 billion unsecured committed line of credit, subject to a $1 billion sublimit, provided by a syndication of banks under a credit agreement. Borrowings may be made for temporary financing needs. Interest is charged to each fund, based on its borrowings, generally at a rate equal to the higher of the Federal Reserve funds rate or one month LIBOR plus an agreed upon spread. A commitment fee, based on the average daily, unused portion of the committed line of credit, is allocated among the participating funds at the end of each calendar quarter. In addition, the fund and other funds managed by MFS have established unsecured uncommitted borrowing arrangements with certain banks for temporary
27
MFS High Yield Portfolio
Notes to Financial Statements (unaudited) – continued
financing needs. Interest is charged to each fund, based on its borrowings, at a rate equal to the Federal Reserve funds rate plus an agreed upon spread. For the six months ended June 30, 2013, the fund’s commitment fee and interest expense were $1,230 and $0, respectively, and are included in “Miscellaneous” expense in the Statement of Operations.
| (7) | | Transactions in Underlying Affiliated Funds – Affiliated Issuers |
An affiliated issuer may be considered one in which the fund owns 5% or more of the outstanding voting securities, or a company which is under common control. For the purposes of this report, the fund assumes the following to be an affiliated issuer:
| | | | | | | | | | | | | | | | |
| Underlying Affiliated Fund | | Beginning Shares/Par Amount | | | Acquisitions Shares/Par Amount | | | Dispositions Shares/Par Amount | | | Ending Shares/Par Amount | |
| MFS Institutional Money Market Portfolio | | | 13,317,185 | | | | 62,086,479 | | | | (69,905,261 | ) | | | 5,498,403 | |
| | | | |
| Underlying Affiliated Fund | | Realized Gain (Loss) | | | Capital Gain Distributions | | | Dividend Income | | | Ending Value | |
| MFS Institutional Money Market Portfolio | | | $— | | | | $— | | | | $6,317 | | | | $5,498,403 | |
At close of business on December 7, 2012, the fund with net assets of approximately $230,425,881, acquired all of the assets and liabilities of SC PIMCO High Yield Fund, a series of Sun Capital Advisers Trust. The purpose of the transaction was to provide shareholders of SC PIMCO High Yield Fund the opportunity to participate in a larger combined portfolio with a similar investment objective and similar investment policies and strategies. The acquisition was accomplished by a tax-free exchange of approximately 42,006,187 shares of the fund (valued at approximately $252,121,164) for all of the assets and liabilities of SC PIMCO High Yield Fund. SC PIMCO High Yield Fund then distributed the shares of the fund that SC PIMCO High Yield Fund received from the fund to its shareholders. SC PIMCO High Yield Fund’s investments on that date were valued at approximately $229,224,942 with a cost basis of approximately $219,889,002. For financial reporting purposes, assets received and shares issued by the fund were recorded at fair value; however, the cost basis of the investments received from SC PIMCO High Yield Fund were carried forward to align ongoing reporting of the fund’s realized and unrealized gains and losses with amounts distributable to shareholders for tax purposes.
28
MFS High Yield Portfolio
BOARD REVIEW OF INVESTMENT ADVISORY AGREEMENT
A discussion regarding the Board’s most recent review and renewal of the fund’s Investment Advisory Agreement with MFS will be available on or about November 1, 2013 by clicking on the fund’s name under “Variable Insurance Portfolios — VIT II” in the “Products” section of the MFS Web site (mfs.com).
PROXY VOTING POLICIES AND INFORMATION
A general description of the MFS funds’ proxy voting policies and procedures is available without charge, upon request, by calling 1-800-225-2606, by visiting the Proxy Voting section of mfs.com or by visiting the SEC’s Web site at http://www.sec.gov.
Information regarding how the fund voted proxies relating to portfolio securities during the most recent twelve-month period ended June 30 is available without charge by visiting the Proxy Voting section of mfs.com or by visiting the SEC’s Web site at http://www.sec.gov.
QUARTERLY PORTFOLIO DISCLOSURE
The fund will file a complete schedule of portfolio holdings with the Securities and Exchange Commission (the Commission) for the first and third quarters of each fiscal year on Form N-Q. The fund’s Form N-Q is available on the EDGAR database on the Commission’s Internet Web site at http://www.sec.gov, and may be reviewed and copied at the:
Public Reference Room
Securities and Exchange Commission
100 F Street, NE, Room 1580
Washington, D.C. 20549
Information on the operation of the Public Reference Room may be obtained by calling the Commission at 1-800-SEC-0330. Copies of the fund’s Form N-Q also may be obtained, upon payment of a duplicating fee, by electronic request at the following e-mail address: publicinfo@sec.gov or by writing the Public Reference Section at the above address.
FURTHER INFORMATION
From time to time, MFS may post important information about the fund or the MFS funds on the MFS web site (mfs.com). This information is available by visiting the “News & Commentary” section of mfs.com or by clicking on the fund’s name under “Variable Insurance Portfolios — VIT II” in the “Products” section of mfs.com.
29
SEMIANNUAL REPORT
June 30, 2013

MFS® GLOBAL TACTICAL ALLOCATION PORTFOLIO
MFS® Variable Insurance Trust II

WTS-SEM
MFS® GLOBAL TACTICAL ALLOCATION PORTFOLIO
CONTENTS
The report is prepared for the general information of contract owners. It is authorized for distribution to prospective investors only when preceded or accompanied by a current prospectus.
NOT FDIC INSURED Ÿ MAY LOSE VALUE Ÿ NO BANK OR CREDIT UNION GUARANTEE Ÿ NOT A DEPOSIT Ÿ NOT INSURED BY ANY FEDERAL GOVERNMENT AGENCY OR NCUA/NCUSIF
MFS Global Tactical Allocation Portfolio
LETTER FROM THE CHAIRMAN AND CEO

Dear Contract Owners:
As the year progresses, the global economy continues to grind ahead slowly, held back by broad austerity measures. The U.S. economy remains a steadying force, driven by resilient consumers, who have taken the payroll tax increase and the sequestration’s early impact in stride. With U.S. housing and jobs showing steady expansion, domestic consumer-driven growth has offset weaker exports and the U.S. government’s spending constraints. In response to these developments, the U.S. Federal Reserve has begun to brace investors for an eventual shift in its monetary policy, causing global market tremors.
Japan has been another bright spot, with government and central bank stimulus policies leading to increased exports, a resurgent stock market and improved economic sentiment. After a six-month rally, Japan’s stocks slipped late in the second quarter, then picked up momentum on fresh signs that the country could soon break free of its chronic deflation. The major deterrent to global growth remains the eurozone, still in the grip of persistent recession. China has seen its pace of economic growth decelerate, a troubling turn for the country’s trading partners, who have come to rely on it as an engine for global growth.
As always, managing risk in the face of uncertainty remains a top priority for investors. At MFS®, our uniquely collaborative investment process employs integrated, global research and active risk management. Our global team of investment professionals shares ideas and evaluates opportunities across continents, investment disciplines and asset classes — all with a goal of building better insights, and ultimately better results, for our clients.
We are mindful of the many economic challenges investors face, and believe it is more important than ever to maintain a long-term view and employ time-tested principles, such as asset allocation and diversification. We remain confident that our unique approach can serve investors well as they work with their financial advisors to identify and pursue the most suitable opportunities.
Respectfully,

Robert J. Manning
Chairman and Chief Executive Officer
MFS Investment Management®
August 16, 2013
The opinions expressed in this letter are subject to change, may not be relied upon for investment advice, and no forecasts can be guaranteed.
1
MFS Global Tactical Allocation Portfolio
PORTFOLIO COMPOSITION
Portfolio structure
| | | | | | | | | | | | | | |
| | | | | Active Security
Selection (a) | | | Tactical
Overlay (b) | | | Net Market
Exposure (c) | |
| Fixed Income | | U.S. | | | 19.7% | | | | (3.3)% | | | | 16.4% | |
| | Europe ex-U.K. | | | 19.5% | | | | (5.4)% | | | | 14.1% | |
| | Japan | | | 7.9% | | | | 0.0% | | | | 7.9% | |
| | Emerging Markets | | | 4.1% | | | | 0.0% | | | | 4.1% | |
| | United Kingdom | | | 5.1% | | | | (1.7)% | | | | 3.4% | |
| | North America ex-U.S. | | | 2.9% | | | | 0.0% | | | | 2.9% | |
| | Developed - Middle East/Africa | | | 0.1% | | | | 0.0% | | | | 0.1% | |
| | Asia/Pacific ex-Japan | | | 1.8% | | | | (2.4)% | | | | (0.6)% | |
| | | Total | | | 61.1% | | | | (12.8)% | | | | 48.3% | |
| Equity | | U.S. Large Cap | | | 16.4% | | | | 2.1% | | | | 18.5% | |
| | Europe ex-U.K. | | | 6.8% | | | | 10.7% | | | | 17.5% | |
| | Japan | | | 4.9% | | | | 1.7% | | | | 6.6% | |
| | United Kingdom | | | 4.5% | | | | 0.1% | | | | 4.6% | |
| | Emerging Markets | | | 0.5% | | | | 2.7% | | | | 3.2% | |
| | North America ex-U.S. | | | 0.4% | | | | (2.0)% | | | | (1.6)% | |
| | U.S. Small/Mid Cap | | | 0.9% | | | | (3.1)% | | | | (2.2)% | |
| | Asia/Pacific ex-Japan | | | 0.2% | | | | (8.3)% | | | | (8.1)% | |
| | | Total | | | 34.6% | | | | 3.9% | | | | 38.5% | |
| Real Estate-related | | U.S. | | | 0.5% | | | | 0.0% | | | | 0.5% | |
| | Non-U.S. | | | 0.5% | | | | 0.0% | | | | 0.5% | |
| | | Total | | | 1.0% | | | | 0.0% | | | | 1.0% | |
| Cash | | Cash & Equivalents (d) | | | 1.4% | | | | 1.7% | | | | 3.1% | |
| | Derivative Offsets (e) | | | 0.0% | (o) | | | 9.1% | | | | 9.1% | |
| | Total | | | 1.4% | | | | 10.8% | | | | 12.2% | |
Total Net Exposure Summary | | | | | 98.1% | | | | 1.9% | | | | 100.0% | |
| | | | | | | | |
Strategic Allocation Targets & Net Exposure Ranges | |
| Asset Class | | | Target (w) | | | | Ranges (z) | |
Equities | | | 35% | | | | 0 to 70% | |
Fixed Income, Cash and Cash Equivalents | | | 65% | | | | 30 to 100% | |
| | | | |
| Top ten holdings (c) | | | | |
Dax Index Future SEP 2013 | | | 3.3% | |
Japan Govt Bond, 1.1%, 2020 | | | 3.3% | |
Japan Govt Bond, 2.1%, 2024 | | | 3.2% | |
CAC 40 Index Future JUL 2013 | | | 3.2% | |
IBEX Index Future JUL 2013 | | | 2.7% | |
UK Treasury Bond, 8.0%, 2021 | | | 2.6% | |
MSCI Singapore Index Future JUL 13 | | | (2.7)% | |
US Treasury Note 10 Yr Future SEP 2013 | | | (3.3)% | |
Australian SPI 200 Index Future SEP 2013 | | | (4.1)% | |
Euro-Bund 10 Yr Future SEP 2013 | | | (5.4)% | |
| (a) | | Represents the actively managed portion of the portfolio and for purposes of this presentation, components include the market value of securities, less any securities sold short. The bond component will include any accrued interest amounts. This also reflects the equivalent exposure of certain derivative positions. These amounts may be negative from time to time. |
| (b) | | Represents the tactical overlay portion of the portfolio which is how the fund manages its exposure to markets and currencies through use of derivative positions. Percentages reflect the equivalent exposure of those derivative positions. |
| (c) | | For purposes of this presentation, the components include the market value of securities, less any securities sold short, and reflect the impact of the equivalent exposure of derivative positions. These amounts may be negative from time to time. The bond component will include any accrued interest amounts. |
2
MFS Global Tactical Allocation Portfolio
Portfolio Composition – continued
| (d) | | Cash & Equivalents includes cash, other assets (excluding interest receivables) less liabilities, short term securities, and the unrealized gain or loss in connection with all forward currency exchange contracts. |
| (e) | | Derivative Offsets represent the offsetting of the leverage produced by the fund’s derivative positions. |
| (w) | | The strategic asset class allocations have been selected for investment over longer time periods. The actual strategic asset class weightings can deviate due to market movements and cash flows. |
| (z) | | The fund’s net exposures to the asset classes referenced will normally fall within theses ranges after taking into account the tactical overlay. |
Equivalent exposure is a calculated amount that translates the derivative position into a reasonable approximation of the amount of the underlying asset that the portfolio would have to hold at a given point in time to have the same price sensitivity that results from the portfolio’s ownership of the derivative contract. When dealing with derivatives, equivalent exposure is a more representative measure of the potential impact of a position on portfolio performance than market value. The market value of derivatives may be different.
Where the fund holds convertible bonds, these are treated as part of the equity portion of the portfolio.
Percentages are based on net assets as of 6/30/13.
The portfolio is actively managed and current holdings may be different.
3
MFS Global Tactical Allocation Portfolio
EXPENSE TABLE
Fund Expenses Borne by the Contract Holders During the Period,
January 1, 2013 through June 30, 2013
As a contract holder of the fund, you incur ongoing costs, including management fees; distribution and/or service (12b-1) fees; and other fund expenses. This example is intended to help you understand your ongoing costs (in dollars) of investing in the fund and to compare these costs with the ongoing costs of investing in other mutual funds.
The example is based on an investment of $1,000 invested at the beginning of the period and held for the entire period January 1, 2013 through June 30, 2013.
Actual Expenses
The first line for each share class in the following table provides information about actual account values and actual expenses. You may use the information in this line, together with the amount you invested, to estimate the expenses that you paid over the period. Simply divide your account value by $1,000 (for example, an $8,600 account value divided by $1,000 = 8.6), then multiply the result by the number in the first line under the heading entitled “Expenses Paid During Period” to estimate the expenses you paid on your account during this period.
Hypothetical Example for Comparison Purposes
The second line for each share class in the following table provides information about hypothetical account values and hypothetical expenses based on the fund’s actual expense ratio and an assumed rate of return of 5% per year before expenses, which is not the fund’s actual return. The hypothetical account values and expenses may not be used to estimate the actual ending account balance or expenses you paid for the period. You may use this information to compare the ongoing costs of investing in the fund and other funds. To do so, compare this 5% hypothetical example with the 5% hypothetical examples that appear in the shareholder reports of the other funds.
Please note that the expenses shown in the table are meant to highlight the fund’s ongoing costs only and do not take into account the fees and expenses imposed under the variable contracts through which your investment in the fund is made. Therefore, the second line for each share class in the table is useful in comparing ongoing costs associated with an investment in vehicles (such as the fund) which fund benefits under variable annuity and variable life insurance contracts and to qualified pension and retirement plans only, and will not help you determine the relative total costs of investing in the fund through variable annuity and variable life insurance contracts. If the fees and expenses imposed under the variable contracts were included, your costs would have been higher.
| | | | | | | | | | | | | | | | | | |
| Share Class | | | | Annualized
Expense Ratio | | | Beginning Account Value 1/01/13 | | | Ending Account Value 6/30/13 | | | Expenses Paid During Period (p) 1/01/13-6/30/13 | |
| Initial Class | | Actual | | | 0.75% | | | | $1,000.00 | | | | $1,020.94 | | | | $3.76 | |
| | Hypothetical (h) | | | 0.75% | | | | $1,000.00 | | | | $1,021.08 | | | | $3.76 | |
| Service Class | | Actual | | | 1.00% | | | | $1,000.00 | | | | $1,019.88 | | | | $5.01 | |
| | Hypothetical (h) | | | 1.00% | | | | $1,000.00 | | | | $1,019.84 | | | | $5.01 | |
| (h) | 5% class return per year before expenses. |
| (p) | Expenses paid are equal to each class’s annualized expense ratio, as shown above, multiplied by the average account value over the period, multiplied by the number of days in the period, divided by the number of days in the year. |
4
MFS Global Tactical Allocation Portfolio
PORTFOLIO OF INVESTMENTS – 6/30/13 (unaudited)
The Portfolio of Investments is a complete list of all securities owned by your fund. It is categorized by broad-based asset classes.
| | | | | | | | |
| Issuer | | Shares/Par | | | Value ($) | |
| | | | | | | | |
| COMMON STOCKS – 35.0% | |
| Aerospace – 2.0% | | | | | | | | |
| Cobham PLC | | | 486,878 | | | $ | 1,946,085 | |
| Honeywell International, Inc. | | | 58,100 | | | | 4,609,654 | |
| Lockheed Martin Corp. | | | 77,080 | | | | 8,360,097 | |
| Northrop Grumman Corp. | | | 20,340 | | | | 1,684,152 | |
| United Technologies Corp. | | | 48,260 | | | | 4,485,284 | |
| | | | | | | | |
| | | | | | $ | 21,085,272 | |
| | | | | | | | |
| Alcoholic Beverages – 0.5% | |
| Heineken N.V. | | | 77,425 | | | $ | 4,922,096 | |
| | | | | | | | |
| Automotive – 0.3% | | | | | | | | |
| Johnson Controls, Inc. | | | 56,160 | | | $ | 2,009,966 | |
| USS Co. Ltd. | | | 13,130 | | | | 1,666,734 | |
| | | | | | | | |
| | | | | | $ | 3,676,700 | |
| | | | | | | | |
| Broadcasting – 1.3% | | | | | | | | |
| Fuji Television Network, Inc. | | | 843 | | | $ | 1,703,102 | |
| Nippon Television Holdings, Inc. | | | 90,700 | | | | 1,658,901 | |
| Omnicom Group, Inc. | | | 45,140 | | | | 2,837,952 | |
| Viacom, Inc., “B” | | | 39,770 | | | | 2,706,349 | |
| Walt Disney Co. | | | 70,990 | | | | 4,483,018 | |
| | | | | | | | |
| | | | | | $ | 13,389,322 | |
| | | | | | | | |
| Brokerage & Asset Managers – 0.6% | | | | | |
| BlackRock, Inc. | | | 13,001 | | | $ | 3,339,307 | |
| Computershare Ltd. | | | 108,156 | | | | 1,009,327 | |
| Daiwa Securities Group, Inc. | | | 197,000 | | | | 1,654,578 | |
| | | | | | | | |
| | | | | | $ | 6,003,212 | |
| | | | | | | | |
| Business Services – 1.9% | | | | | | | | |
| Accenture PLC, “A” | | | 73,200 | | | $ | 5,267,472 | |
| Amadeus IT Holding S.A. | | | 115,587 | | | | 3,694,392 | |
| Bunzl PLC | | | 132,906 | | | | 2,594,079 | |
| Compass Group PLC | | | 341,620 | | | | 4,378,063 | |
| Dun & Bradstreet Corp. | | | 9,790 | | | | 954,035 | |
| Nomura Research, Inc. | | | 96,900 | | | | 3,162,440 | |
| | | | | | | | |
| | | | | | $ | 20,050,481 | |
| | | | | | | | |
| Cable TV – 0.2% | | | | | | | | |
| Comcast Corp., “Special A” | | | 64,140 | | | $ | 2,544,434 | |
| | | | | | | | |
| Chemicals – 1.1% | | | | | | | | |
| 3M Co. | | | 46,310 | | | $ | 5,063,999 | |
| Givaudan S.A. | | | 1,943 | | | | 2,507,561 | |
| PPG Industries, Inc. | | | 26,963 | | | | 3,947,653 | |
| | | | | | | | |
| | | | | | $ | 11,519,213 | |
| | | | | | | | |
| Computer Software – 0.3% | |
| Oracle Corp. | | | 101,890 | | | $ | 3,130,061 | |
| | | | | | | | |
| Computer Software – Systems – 0.8% | | | | | |
| Canon, Inc. | | | 79,300 | | | $ | 2,604,505 | |
| International Business Machines Corp. | | | 28,456 | | | | 5,438,226 | |
| | | | | | | | |
| | | | | | $ | 8,042,731 | |
| | | | | | | | |
| | | | | | | | |
| Issuer | | Shares/Par | | | Value ($) | |
| | | | | | | | |
| COMMON STOCKS – continued | |
| Construction – 0.4% | | | | | | | | |
| Geberit AG | | | 6,800 | | | $ | 1,683,538 | |
| Stanley Black & Decker, Inc. | | | 33,210 | | | | 2,567,133 | |
| | | | | | | | |
| | | | | | $ | 4,250,671 | |
| | | | | | | | |
| Consumer Products – 1.8% | |
| Henkel KGaA, IPS | | | 55,409 | | | $ | 5,199,372 | |
| Kao Corp. | | | 162,800 | | | | 5,539,927 | |
| KOSE Corp. | | | 31,500 | | | | 873,919 | |
| Procter & Gamble Co. | | | 45,880 | | | | 3,532,301 | |
| Reckitt Benckiser Group PLC | | | 52,750 | | | | 3,739,443 | |
| | | | | | | | |
| | | | | | $ | 18,884,962 | |
| | | | | | | | |
| Electrical Equipment – 0.9% | |
| Danaher Corp. | | | 38,760 | | | $ | 2,453,508 | |
| Legrand S.A. | | | 64,678 | | | | 2,989,001 | |
| Pentair Ltd. | | | 12,935 | | | | 746,220 | |
| Spectris PLC | | | 38,791 | | | | 1,123,821 | |
| Tyco International Ltd. | | | 68,520 | | | | 2,257,734 | |
| | | | | | | | |
| | | | | | $ | 9,570,284 | |
| | | | | | | | |
| Electronics – 0.7% | | | | | | | | |
| Halma PLC | | | 175,143 | | | $ | 1,345,318 | |
| Hirose Electric Co. Ltd. | | | 12,600 | | | | 1,661,706 | |
| Taiwan Semiconductor Manufacturing Co. Ltd., ADR | | | 217,688 | | | | 3,988,044 | |
| | | | | | | | |
| | | | | | $ | 6,995,068 | |
| | | | | | | | |
| Energy – Independent – 0.5% | |
| Cairn Energy PLC (a) | | | 291,154 | | | $ | 1,116,608 | |
| Occidental Petroleum Corp. | | | 43,250 | | | | 3,859,198 | |
| | | | | | | | |
| | | | | | $ | 4,975,806 | |
| | | | | | | | |
| Energy – Integrated – 1.6% | |
| Chevron Corp. | | | 24,458 | | | $ | 2,894,360 | |
| Exxon Mobil Corp. | | | 69,670 | | | | 6,294,685 | |
| Royal Dutch Shell PLC, “A” | | | 164,326 | | | | 5,243,839 | |
| Suncor Energy, Inc. | | | 65,677 | | | | 1,935,901 | |
| | | | | | | | |
| | | | | | $ | 16,368,785 | |
| | | | | | | | |
| Food & Beverages – 1.7% | |
| General Mills, Inc. | | | 73,840 | | | $ | 3,583,455 | |
| Groupe Danone | | | 102,683 | | | | 7,706,678 | |
| Nestle S.A. | | | 94,207 | | | | 6,161,743 | |
| | | | | | | | |
| | | | | | $ | 17,451,876 | |
| | | | | | | | |
| Food & Drug Stores – 0.7% | |
| CVS Caremark Corp. | | | 88,080 | | | $ | 5,036,414 | |
| Lawson, Inc. | | | 31,800 | | | | 2,427,163 | |
| | | | | | | | |
| | | | | | $ | 7,463,577 | |
| | | | | | | | |
| General Merchandise – 0.3% | |
| Target Corp. | | | 50,460 | | | $ | 3,474,676 | |
| | | | | | | | |
5
MFS Global Tactical Allocation Portfolio
Portfolio of Investments (unaudited) – continued
| | | | | | | | |
| Issuer | | Shares/Par | | | Value ($) | |
| | | | | | | | |
| COMMON STOCKS – continued | |
| Insurance – 2.0% | | | | | | | | |
| Aon PLC | | | 36,580 | | | $ | 2,353,923 | |
| Hiscox Ltd. | | | 161,735 | | | | 1,404,911 | |
| ING Groep N.V. (a) | | | 234,072 | | | | 2,138,879 | |
| MetLife, Inc. | | | 92,600 | | | | 4,237,376 | |
| Prudential Financial, Inc. | | | 33,060 | | | | 2,414,372 | |
| Swiss Re Ltd. | | | 39,788 | | | | 2,947,356 | |
| Travelers Cos., Inc. | | | 37,390 | | | | 2,988,209 | |
| Zurich Insurance Group AG | | | 7,891 | | | | 2,045,021 | |
| | | | | | | | |
| | | | | | $ | 20,530,047 | |
| | | | | | | | |
| Leisure & Toys – 0.2% | | | | | | | | |
| Hasbro, Inc. | | | 56,180 | | | $ | 2,518,549 | |
| | | | | | | | |
| Machinery & Tools – 0.2% | | | | | | | | |
| Glory Ltd. | | | 32,800 | | | $ | 769,236 | |
| Neopost S.A. | | | 25,010 | | | | 1,653,292 | |
| | | | | | | | |
| | | | | | $ | 2,422,528 | |
| | | | | | | | |
| Major Banks – 2.7% | | | | | | | | |
| Bank of New York Mellon Corp. | | | 112,441 | | | $ | 3,153,970 | |
| Goldman Sachs Group, Inc. | | | 19,946 | | | | 3,016,833 | |
| HSBC Holdings PLC | | | 415,153 | | | | 4,306,330 | |
| JPMorgan Chase & Co. | | | 120,850 | | | | 6,379,672 | |
| State Street Corp. | | | 50,820 | | | | 3,313,972 | |
| Sumitomo Mitsui Financial Group, Inc. | | | 30,600 | | | | 1,403,811 | |
| Toronto-Dominion Bank | | | 13,492 | | | | 1,083,645 | |
| Wells Fargo & Co. | | | 142,410 | | | | 5,877,261 | |
| | | | | | | | |
| | | | | | $ | 28,535,494 | |
| | | | | | | | |
| Medical & Health Technology & Services – 0.3% | |
| Kobayashi Pharmaceutical Co. Ltd. | | | 30,700 | | | $ | 1,621,800 | |
| Quest Diagnostics, Inc. | | | 21,250 | | | | 1,288,388 | |
| | | | | | | | |
| | | | | | $ | 2,910,188 | |
| | | | | | | | |
| Medical Equipment – 0.7% | | | | | | | | |
| Abbott Laboratories | | | 70,660 | | | $ | 2,464,621 | |
| Medtronic, Inc. | | | 64,380 | | | | 3,313,639 | |
| St. Jude Medical, Inc. | | | 44,280 | | | | 2,020,496 | |
| | | | | | | | |
| | | | | | $ | 7,798,756 | |
| | | | | | | | |
| Network & Telecom – 0.7% | | | | | |
| Ericsson, Inc., “B” | �� | | 432,074 | | | $ | 4,893,458 | |
| Nokia Oyj (a) | | | 520,290 | | | | 1,937,999 | |
| | | | | | | | |
| | | | | | $ | 6,831,457 | |
| | | | | | | | |
| Other Banks & Diversified Financials – 0.5% | |
| DnB NOR A.S.A. | | | 158,309 | | | $ | 2,287,047 | |
| Hachijuni Bank Ltd. | | | 107,000 | | | | 627,680 | |
| North Pacific Bank Ltd. | | | 154,700 | | | | 569,323 | |
| Western Union Co. | | | 83,650 | | | | 1,431,252 | |
| | | | | | | | |
| | | | | | $ | 4,915,302 | |
| | | | | | | | |
| Pharmaceuticals – 3.7% | | | | | | | | |
| Bayer AG | | | 51,994 | | | $ | 5,544,855 | |
| GlaxoSmithKline PLC | | | 302,723 | | | | 7,573,168 | |
| Johnson & Johnson | | | 98,980 | | | | 8,498,423 | |
| Pfizer, Inc. | | | 283,850 | | | | 7,950,639 | |
| | | | | | | | |
| Issuer | | Shares/Par | | | Value ($) | |
| | | | | | | | |
| COMMON STOCKS – continued | |
| Pharmaceuticals – continued | |
| Roche Holding AG | | | 30,366 | | | $ | 7,524,220 | |
| Santen Pharmaceutical Co. Ltd. | | | 31,700 | | | | 1,364,781 | |
| | | | | | | | |
| | | | | | $ | 38,456,086 | |
| | | | | | | | |
| Printing & Publishing – 0.3% | |
| Moody’s Corp. | | | 22,950 | | | $ | 1,398,344 | |
| Pearson PLC | | | 100,590 | | | | 1,786,047 | |
| | | | | | | | |
| | | | | | $ | 3,184,391 | |
| | | | | | | | |
| Railroad & Shipping – 0.1% | |
| Canadian National Railway Co. | | | 10,140 | | | $ | 986,318 | |
| | | | | | | | |
| Real Estate – 0.4% | | | | | |
| Deutsche Wohnen AG | | | 162,623 | | | $ | 2,761,341 | |
| GSW Immobilien AG | | | 45,469 | | | | 1,752,883 | |
| | | | | | | | |
| | | | | | $ | 4,514,224 | |
| | | | | | | | |
| Restaurants – 0.3% | | | | | |
| McDonald’s Corp. | | | 32,277 | | | $ | 3,195,423 | |
| | | | | | | | |
| Specialty Stores – 0.1% | |
| Esprit Holdings Ltd. | | | 793,200 | | | $ | 1,177,517 | |
| | | | | | | | |
| Telecommunications – Wireless – 1.7% | |
| KDDI Corp. | | | 211,400 | | | $ | 10,998,427 | |
| NTT DoCoMo, Inc. | | | 1,145 | | | | 1,779,033 | |
| Vodafone Group PLC | | | 1,921,858 | | | | 5,515,191 | |
| | | | | | | | |
| | | | | | $ | 18,292,651 | |
| | | | | | | | |
| Telephone Services – 1.0% | |
| AT&T, Inc. | | | 117,080 | | | $ | 4,144,632 | |
| China Unicom (Hong Kong) Ltd. | | | 646,000 | | | | 850,428 | |
| Deutsche Telekom AG | | | 170,510 | | | | 1,989,508 | |
| TDC A.S. | | | 195,821 | | | | 1,584,204 | |
| Telecom Italia S.p.A. | | | 2,561,369 | | | | 1,415,355 | |
| | | | | | | | |
| | | | | | $ | 9,984,127 | |
| | | | | | | | |
| Tobacco – 1.9% | | | | | | | | |
| British American Tobacco PLC | | | 90,495 | | | $ | 4,647,226 | |
| Japan Tobacco, Inc. | | | 140,300 | | | | 4,958,172 | |
| Lorillard, Inc. | | | 53,740 | | | | 2,347,363 | |
| Philip Morris International, Inc. | | | 85,886 | | | | 7,439,445 | |
| | | | | | | | |
| | | | | | $ | 19,392,206 | |
| | | | | | | | |
| Trucking – 0.6% | | | | | | | | |
| United Parcel Service, Inc., “B” | | | 17,410 | | | $ | 1,505,617 | |
| Yamato Holdings Co. Ltd. | | | 212,100 | | | | 4,471,679 | |
| | | | | | | | |
| | | | | | $ | 5,977,296 | |
| | | | | | | | |
Total Common Stocks
(Identified Cost, $275,363,911) | | | $ | 365,421,787 | |
| | | | | | | | |
| | |
| BONDS – 61.0% | | | | | | | | |
| Asset-Backed & Securitized – 3.0% | |
| Bayview Commercial Asset Trust, FRN, 1.72%, 2023 (z) | | CAD | 124,759 | | | $ | 117,805 | |
| Citigroup/Deutsche Bank Commercial Mortgage Trust, 5.322%, 2049 | | $ | 1,729,018 | | | | 1,903,365 | |
6
MFS Global Tactical Allocation Portfolio
Portfolio of Investments (unaudited) – continued
| | | | | | | | |
| Issuer | | Shares/Par | | | Value ($) | |
| | | | | | | | |
| BONDS – continued | | | | | | | | |
| Asset-Backed & Securitized – continued | | | | | |
| Commercial Mortgage Pass-Through Certificates, “A3”, 5.293%, 2049 | | $ | 532,759 | | | $ | 545,772 | |
| Commercial Mortgage Pass-Through Certificates, “A4”, 5.306%, 2046 | | | 1,432,759 | | | | 1,580,650 | |
| Credit Suisse Mortgage Capital Certificate, 5.311%, 2039 | | | 2,310,000 | | | | 2,536,689 | |
| CWCapital LLC, 5.223%, 2048 | | | 2,310,000 | | | | 2,503,439 | |
| G-Force LLC, CDO, “A2”, 4.83%, 2036 (z) | | | 259,871 | | | | 261,171 | |
| Goldman Sachs Mortgage Securities Corp., FRN, 5.981%, 2045 | | | 5,940,000 | | | | 6,619,287 | |
| JPMorgan Chase Commercial Mortgage Securities Corp., “A3”, FRN, 6.002%, 2049 | | | 1,230,759 | | | | 1,291,138 | |
| JPMorgan Chase Commercial Mortgage Securities Corp., “A3”, FRN, 6.125%, 2051 | | | 1,808,573 | | | | 1,879,587 | |
| JPMorgan Chase Commercial Mortgage Securities Corp., “A4”, FRN, 6.002%, 2049 | | | 2,310,000 | | | | 2,585,112 | |
| Merrill Lynch Mortgage Trust, “A3”, FRN, 6.038%, 2050 | | | 2,373,000 | | | | 2,472,958 | |
| Merrill Lynch Mortgage Trust, FRN, 5.849%, 2050 | | | 3,310,000 | | | | 3,716,134 | |
| Merrill Lynch/Countrywide Commercial Mortgage Trust, FRN, 5.81%, 2050 | | | 2,460,000 | | | | 2,748,743 | |
| Wachovia Bank Commercial Mortgage Trust, “A3”, FRN, 6.122%, 2051 | | | 524,228 | | | | 536,664 | |
| | | | | | | | |
| | | | | | $ | 31,298,514 | |
| | | | | | | | |
| Automotive – 0.7% | | | | | | | | |
| Daimler Finance North America LLC, 1.3%, 2015 (n) | | $ | 3,180,000 | | | $ | 3,186,999 | |
| Daimler Finance North America LLC, 1.875%, 2018 (n) | | | 917,000 | | | | 894,839 | |
| Hyundai Capital America, 2.125%, 2017 (n) | | | 78,000 | | | | 75,409 | |
| Volkswagen International Finance N.V., 1.15%, 2015 (n) | | | 3,117,000 | | | | 3,124,294 | |
| | | | | | | | |
| | | | | | $ | 7,281,541 | |
| | | | | | | | |
| Biotechnology – 0.3% | | | | | | | | |
| Life Technologies Corp., 6%, 2020 | | $ | 2,750,000 | | | $ | 3,098,065 | |
| | | | | | | | |
| Broadcasting – 0.3% | | | | | | | | |
| British Sky Broadcasting Group PLC, 3.125%, 2022 (n) | | $ | 2,630,000 | | | $ | 2,459,355 | |
| Discovery Communications, Inc., 4.875%, 2043 | | | 1,030,000 | | | | 952,137 | |
| | | | | | | | |
| | | | | | $ | 3,411,492 | |
| | | | | | | | |
| | | | | | | | |
| Issuer | | Shares/Par | | | Value ($) | |
| | | | | | | | |
| BONDS – continued | |
| Building – 0.0% | | | | | | | | |
| Owens Corning, Inc., 6.5%, 2016 | | $ | 220,000 | | | $ | 245,583 | |
| | | | | | | | |
| Cable TV – 0.3% | | | | | | | | |
| Cox Communications, Inc., 3.25%, 2022 (n) | | $ | 998,000 | | | $ | 938,944 | |
| NBCUniversal Media LLC, 5.15%, 2020 | | | 1,166,000 | | | | 1,327,481 | |
| Time Warner Cable, Inc., 5%, 2020 | | | 1,020,000 | | | | 1,064,759 | |
| | | | | | | | |
| | | | | | $ | 3,331,184 | |
| | | | | | | | |
| Chemicals – 0.1% | | | | | | | | |
| Dow Chemical Co., 8.55%, 2019 | | $ | 930,000 | | | $ | 1,186,565 | |
| | | | | | | | |
| Conglomerates – 0.1% | | | | | | | | |
| Roper Industries, Inc., 1.85%, 2017 | | $ | 511,000 | | | $ | 502,903 | |
| Votorantim Participacoes S.A., 6.75%, 2021 (n) | | | 600,000 | | | | 639,000 | |
| | | | | | | | |
| | | | | | $ | 1,141,903 | |
| | | | | | | | |
| Consumer Products – 0.1% | |
| Newell Rubbermaid, Inc., 4.7%, 2020 | | $ | 1,350,000 | | | $ | 1,441,733 | |
| | | | | | | | |
| Electrical Equipment – 0.1% | | | | | | | | |
| Ericsson, Inc., 4.125%, 2022 | | $ | 780,000 | | | $ | 762,776 | |
| | | | | | | | |
| Emerging Market Quasi-Sovereign – 1.5% | |
| Banco do Nordeste do Brasil (BNB), 3.625%, 2015 (n) | | $ | 519,000 | | | $ | 515,471 | |
| BNDES Participacoes S.A., 6.5%, 2019 (n) | | | 700,000 | | | | 763,000 | |
| CNPC (HK) Overseas Capital Ltd., 4.5%, 2021 (n) | | | 669,000 | | | | 687,695 | |
| Comision Federal de Electricidad, 5.75%, 2042 (n) | | | 1,163,000 | | | | 1,075,775 | |
| Corporacion Nacional del Cobre de Chile, 3.75%, 2020 (n) | | | 474,000 | | | | 461,268 | |
| Empresa Nacional del Petroleo, 6.25%, 2019 | | | 619,000 | | | | 666,650 | |
| Gaz Capital S.A., 3.85%, 2020 (n) | | | 1,925,000 | | | | 1,790,250 | |
| Pemex Project Funding Master Trust, 5.75%, 2018 | | | 1,003,000 | | | | 1,098,285 | |
| Petrobras Global Finance Co., FRN, 2.414%, 2019 | | | 1,036,000 | | | | 1,015,280 | |
| Petrobras International Finance Co., 5.375%, 2021 | | | 2,072,000 | | | | 2,081,726 | |
| Petroleos Mexicanos, 6%, 2020 | | | 600,000 | | | | 660,000 | |
| Petroleos Mexicanos, 5.5%, 2021 | | | 664,000 | | | | 707,160 | |
| PTT PLC, 3.375%, 2022 (n) | | | 2,610,000 | | | | 2,368,411 | |
| Rosneft, 3.149%, 2017 (n) | | | 348,000 | | | | 342,780 | |
| Rosneft, 4.199%, 2022 (n) | | | 578,000 | | | | 535,517 | |
| State Grid International Development Co. Ltd., 1.75%, 2018 (z) | | | 755,000 | | | | 723,618 | |
| | | | | | | | |
| | | | | | $ | 15,492,886 | |
| | | | | | | | |
| Emerging Market Sovereign – 1.2% | |
| Government of Poland, 5.75%, 2021 | | PLN | 5,729,000 | | | $ | 1,906,103 | |
7
MFS Global Tactical Allocation Portfolio
Portfolio of Investments (unaudited) – continued
| | | | | | | | |
| Issuer | | Shares/Par | | | Value ($) | |
| | | | | | | | |
| BONDS – continued | |
| Emerging Market Sovereign – continued | |
| Kingdom of Thailand, 3.625%, 2023 | | THB | 92,380,000 | | | $ | 2,938,554 | |
| Republic of Colombia, 6.125%, 2041 | | $ | 1,241,000 | | | | 1,380,612 | |
| Republic of Peru, 7.35%, 2025 | | | 1,400,000 | | | | 1,792,000 | |
| Republic of Peru, 5.625%, 2050 | | | 51,000 | | | | 52,530 | |
| Russian Federation, 4.5%, 2022 (n) | | | 400,000 | | | | 408,548 | |
| Russian Federation, 5.625%, 2042 (n) | | | 200,000 | | | | 207,500 | |
| United Mexican States, 8.5%, 2029 | | MXN | 46,700,000 | | | | 4,295,995 | |
| | | | | | | | |
| | | | | | $ | 12,981,842 | |
| | | | | | | | |
| Financial Institutions – 0.2% | |
| General Electric Capital Corp., 3.1%, 2023 | | $ | 1,328,000 | | | $ | 1,254,516 | |
| SLM Corp., 6.25%, 2016 | | | 493,000 | | | | 522,580 | |
| | | | | | | | |
| | | | | | $ | 1,777,096 | |
| | | | | | | | |
| Food & Beverages – 0.7% | | | | | | | | |
| Anheuser-Busch InBev S.A., 5.375%, 2020 | | $ | 1,310,000 | | | $ | 1,510,264 | |
| Conagra Foods, Inc., 3.2%, 2023 | | | 1,365,000 | | | | 1,305,310 | |
| Grupo Bimbo S.A.B. de C.V., 4.5%, 2022 (n) | | | 1,924,000 | | | | 1,924,189 | |
| Tyson Foods, Inc., 6.6%, 2016 | | | 2,382,000 | | | | 2,690,555 | |
| | | | | | | | |
| | | | | | $ | 7,430,318 | |
| | | | | | | | |
| Food & Drug Stores – 0.1% | |
| CVS Caremark Corp., 5.75%, 2017 | | $ | 444,000 | | | $ | 510,073 | |
| | | | | | | | |
| Forest & Paper Products – 0.2% | |
| Georgia-Pacific LLC, 5.4%, 2020 (n) | | $ | 1,590,000 | | | $ | 1,773,011 | |
| | | | | | | | |
| Insurance – 0.8% | | | | | | | | |
| American International Group, Inc., 4.875%, 2016 | | $ | 1,460,000 | | | $ | 1,599,233 | |
| American International Group, Inc., 4.875%, 2022 | | | 1,630,000 | | | | 1,737,456 | |
| Aviva PLC, FRN, 5.7%, 2049 | | EUR | 1,570,000 | | | | 2,032,350 | |
| UnumProvident Corp., 6.85%, 2015 (n) | | $ | 2,429,000 | | | | 2,706,363 | |
| | | | | | | | |
| | | | | | $ | 8,075,402 | |
| | | | | | | | |
| Insurance – Property & Casualty – 0.8% | |
| AXIS Capital Holdings Ltd., 5.75%, 2014 | | $ | 320,000 | | | $ | 339,182 | |
| Berkshire Hathaway, Inc., 4.5%, 2043 | | | 1,660,000 | | | | 1,577,368 | |
| Chubb Corp., 6.375% to 2017, FRN to 2067 | | | 1,010,000 | | | | 1,080,700 | |
| Liberty Mutual Group, Inc., 4.95%, 2022 (n) | | | 677,000 | | | | 695,066 | |
| QBE Capital Funding III Ltd., FRN, 7.25%, 2041 (n) | | | 1,089,000 | | | | 1,149,984 | |
| Swiss Re Ltd., 2.875%, 2022 (n) | | | 1,550,000 | | | | 1,440,260 | |
| | | | | | | | |
| Issuer | | Shares/Par | | | Value ($) | |
| | | | | | | | |
| BONDS – continued | |
| Insurance – Property & Casualty – continued | |
| ZFS Finance USA Trust II, 6.45% to 2016, FRN to 2065 (n) | | $ | 2,000,000 | | | $ | 2,140,000 | |
| | | | | | | | |
| | | | | | $ | 8,422,560 | |
| | | | | | | | |
| International Market Quasi-Sovereign – 0.6% | |
| Electricite de France, FRN, 5.25%, 2049 (n) | | $ | 1,497,000 | | | $ | 1,431,132 | |
| Statoil A.S.A., 4.25%, 2041 | | | 1,260,000 | | | | 1,189,099 | |
| Statoil A.S.A., FRN, 0.565%, 2018 | | | 759,000 | | | | 759,370 | |
| Temasek Financial I Ltd., 2.375%, 2023 (n) | | | 2,880,000 | | | | 2,558,341 | |
| | | | | | | | |
| | | | | | $ | 5,937,942 | |
| | | | | | | | |
| International Market Sovereign – 31.8% | |
| Commonwealth of Australia, 5.75%, 2021 | | AUD | 12,073,000 | | | $ | 12,668,085 | |
| Federal Republic of Germany, 3.25%, 2021 | | EUR | 9,002,000 | | | | 13,431,711 | |
| Federal Republic of Germany, 6.25%, 2030 | | EUR | 3,684,000 | | | | 7,400,071 | |
| Government of Canada, 4.5%, 2015 | | CAD | 8,870,000 | | | | 8,956,364 | |
| Government of Canada, 4.25%, 2018 | | CAD | 12,349,000 | | | | 13,075,944 | |
| Government of Canada, 3.25%, 2021 | | CAD | 4,330,000 | | | | 4,412,631 | |
| Government of Canada, 5.75%, 2033 | | CAD | 2,557,000 | | | | 3,490,450 | |
| Government of Japan, 2%, 2052 | | JPY | 221,000,000 | | | | 2,293,164 | |
| Government of Japan, 1.1%, 2020 | | JPY | 3,334,700,000 | | | | 34,820,078 | |
| Government of Japan, 2.1%, 2024 | | JPY | 2,965,200,000 | | | | 33,497,372 | |
| Government of Japan, 2.2%, 2027 | | JPY | 553,450,000 | | | | 6,276,870 | |
| Government of Japan, 2.4%, 2037 | | JPY | 520,200,000 | | | | 5,900,525 | |
| Kingdom of Belgium, 4.25%, 2021 | | EUR | 4,063,000 | | | | 6,089,825 | |
| Kingdom of Spain, 4%, 2015 | | EUR | 11,607,000 | | | | 15,544,873 | |
| Kingdom of Spain, 5.5%, 2017 | | EUR | 2,511,000 | | | | 3,524,949 | |
| Kingdom of Spain, 4.6%, 2019 | | EUR | 6,644,000 | | | | 8,944,791 | |
| Kingdom of the Netherlands, 3.5%, 2020 | | EUR | 3,903,000 | | | | 5,738,292 | |
| Kingdom of the Netherlands, 5.5%, 2028 | | EUR | 1,899,000 | | | | 3,397,509 | |
| Republic of Austria, 4.65%, 2018 | | EUR | 4,163,000 | | | | 6,284,144 | |
| Republic of France, 2.5%, 2020 | | EUR | 9,891,000 | | | | 13,529,418 | |
| Republic of France, 6%, 2025 | | EUR | 3,767,000 | | | | 6,628,436 | |
| Republic of France, 4.75%, 2035 | | EUR | 3,664,000 | | | | 5,920,634 | |
| Republic of Iceland, 4.875%, 2016 (n) | | $ | 4,712,000 | | | | 4,924,040 | |
| Republic of Ireland, 5.5%, 2017 | | EUR | 8,798,000 | | | | 12,660,089 | |
| Republic of Ireland, 4.5%, 2020 | | EUR | 4,387,000 | | | | 5,961,682 | |
| Republic of Italy, 4.25%, 2015 | | EUR | 3,186,000 | | | | 4,302,466 | |
| Republic of Italy, 5.25%, 2017 | | EUR | 13,734,000 | | | | 19,248,831 | |
| Republic of Italy, 3.75%, 2021 | | EUR | 17,424,000 | | | | 22,376,029 | |
| United Kingdom Treasury, 5%, 2018 | | GBP | 5,369,000 | | | | 9,550,356 | |
| United Kingdom Treasury, 8%, 2021 | | GBP | 12,436,000 | | | | 27,043,993 | |
8
MFS Global Tactical Allocation Portfolio
Portfolio of Investments (unaudited) – continued
| | | | | | | | |
| Issuer | | Shares/Par | | | Value ($) | |
| | | | | | | | |
| BONDS – continued | | | | | |
| International Market Sovereign – continued | |
| United Kingdom Treasury, 4.25%, 2036 | | GBP | 2,673,000 | | | $ | 4,627,090 | |
| | | | | | | | |
| | | | | | $ | 332,520,712 | |
| | | | | | | | |
| Internet – 0.1% | | | | | | | | |
| Baidu, Inc., 3.5%, 2022 | | $ | 1,640,000 | | | $ | 1,465,369 | |
| | | | | | | | |
| Major Banks – 3.0% | | | | | | | | |
| ABN AMRO Bank N.V., 4.25%, 2017 (n) | | $ | 2,915,000 | | | $ | 3,107,798 | |
| Banco Santander U.S. Debt S.A.U., 3.781%, 2015 (n) | | | 1,300,000 | | | | 1,325,072 | |
| Bank of America Corp., 5.65%, 2018 | | | 1,535,000 | | | | 1,705,357 | |
| Bank of America Corp., 7.625%, 2019 | | | 690,000 | | | | 829,225 | |
| Barclays Bank PLC, 6%, 2021 | | EUR | 1,973,000 | | | | 2,777,726 | |
| Goldman Sachs Group, Inc., 5.75%, 2022 | | $ | 1,056,000 | | | | 1,164,782 | |
| HSBC Bank PLC, FRN, 0.915%, 2018 (z) | | | 1,833,000 | | | | 1,832,991 | |
| HSBC USA, Inc., 4.875%, 2020 | | | 1,870,000 | | | | 2,003,290 | |
| ING Bank N.V., FRN, 1.674%, 2014 (n) | | | 1,900,000 | | | | 1,915,496 | |
| JPMorgan Chase & Co., 4.25%, 2020 | | | 2,760,000 | | | | 2,868,846 | |
| Morgan Stanley, 7.3%, 2019 | | | 1,772,000 | | | | 2,058,380 | |
| Morgan Stanley, 5.5%, 2021 | | | 850,000 | | | | 907,654 | |
| Nordea Bank AB, FRN, 0.735%, 2016 (z) | | | 3,520,000 | | | | 3,525,005 | |
| PNC Financial Services Group, Inc., FRN, 6.75%, 2049 | | | 1,510,000 | | | | 1,638,350 | |
| Standard Chartered PLC, 3.95%, 2023 (n) | | | 1,850,000 | | | | 1,720,955 | |
| Wells Fargo & Co., 2.1%, 2017 | | | 2,240,000 | | | | 2,248,010 | |
| | | | | | | | |
| | | | | | $ | 31,628,937 | |
| | | | | | | | |
| Medical & Health Technology & Services – 0.3% | |
| Express Scripts Holding Co., 2.65%, 2017 | | $ | 2,800,000 | | | $ | 2,851,108 | |
| | | | | | | | |
| Metals & Mining – 0.5% | | | | | | | | |
| Barrick Gold Corp., 4.1%, 2023 (n) | | $ | 827,000 | | | $ | 690,922 | |
| Rio Tinto Finance (USA) PLC, 3.5%, 2022 | | | 1,920,000 | | | | 1,851,450 | |
| Southern Copper Corp., 6.75%, 2040 | | | 1,352,000 | | | | 1,329,297 | |
| Vale Overseas Ltd., 4.625%, 2020 | | | 410,000 | | | | 404,956 | |
| Vale Overseas Ltd., 4.375%, 2022 | | | 998,000 | | | | 947,935 | |
| | | | | | | | |
| | | | | | $ | 5,224,560 | |
| | | | | | | | |
| Mortgage-Backed – 7.4% | | | | | | | | |
| Fannie Mae, 4.606%, 2014 | | $ | 110,077 | | | $ | 110,897 | |
| Fannie Mae, 4.629%, 2014 | | | 49,104 | | | | 49,891 | |
| Fannie Mae, 4.808%, 2014 | | | 90,533 | | | | 91,135 | |
| Fannie Mae, 4.78%, 2015 | | | 88,712 | | | | 93,919 | |
| Fannie Mae, 4.815%, 2015 | | | 234,283 | | | | 246,819 | |
| | | | | | | | |
| Issuer | | Shares/Par | | | Value ($) | |
| | | | | | | | |
| BONDS – continued | | | | | |
| Mortgage-Backed – continued | |
| Fannie Mae, 4.832%, 2015 | | $ | 329,869 | | | $ | 337,449 | |
| Fannie Mae, 4.856%, 2015 | | | 70,620 | | | | 74,694 | |
| Fannie Mae, 4.997%, 2015 | | | 279,777 | | | | 298,467 | |
| Fannie Mae, 5.464%, 2015 | | | 136,528 | | | | 147,469 | |
| Fannie Mae, 5.5%, 2015 - 2037 | | | 1,456,065 | | | | 1,567,046 | |
| Fannie Mae, 5.09%, 2016 | | | 98,365 | | | | 107,002 | |
| Fannie Mae, 5.272%, 2016 | | | 536,980 | | | | 585,084 | |
| Fannie Mae, 5.424%, 2016 | | | 93,482 | | | | 103,211 | |
| Fannie Mae, 5.724%, 2016 | | | 672,352 | | | | 747,258 | |
| Fannie Mae, 3.308%, 2017 (f) | | | 1,634,745 | | | | 1,743,088 | |
| Fannie Mae, 4.992%, 2017 | | | 37,573 | | | | 39,448 | |
| Fannie Mae, 5.05%, 2017 | | | 476,538 | | | | 519,540 | |
| Fannie Mae, 2.578%, 2018 | | | 1,800,000 | | | | 1,848,748 | |
| Fannie Mae, 3.84%, 2018 | | | 484,598 | | | | 525,581 | |
| Fannie Mae, 3.849%, 2018 (f) | | | 1,757,058 | | | | 1,912,770 | |
| Fannie Mae, 5.341%, 2018 | | | 597,729 | | | | 681,575 | |
| Fannie Mae, 4.45%, 2019 | | | 428,534 | | | | 476,111 | |
| Fannie Mae, 4.57%, 2019 | | | 235,530 | | | | 262,207 | |
| Fannie Mae, 4.6%, 2019 | | | 609,397 | | | | 681,786 | |
| Fannie Mae, 6.16%, 2019 | | | 54,617 | | | | 61,160 | |
| Fannie Mae, 5%, 2020 - 2040 | | | 2,520,404 | | | | 2,715,026 | |
| Fannie Mae, 4.5%, 2023 - 2040 | | | 1,170,080 | | | | 1,250,723 | |
| Fannie Mae, 4%, 2025 | | | 255,136 | | | | 274,276 | |
| Fannie Mae, 4.5%, 2034 (f) | | | 5,397,551 | | | | 5,729,092 | |
| Fannie Mae, 6%, 2037 | | | 353,714 | | | | 384,397 | |
| Fannie Mae, 6%, 2038 (f) | | | 1,243,454 | | | | 1,351,427 | |
| Fannie Mae, 5%, 2039 - 2040 (f) | | | 3,796,713 | | | | 4,157,031 | |
| Fannie Mae, 4%, 2041 (f) | | | 2,812,034 | | | | 2,940,134 | |
| Fannie Mae, TBA, 3.5%, 2043 | | | 6,250,000 | | | | 6,308,593 | |
| Freddie Mac, 3.882%, 2017 | | | 1,357,000 | | | | 1,465,442 | |
| Freddie Mac, 2.323%, 2018 | | | 447,000 | | | | 452,509 | |
| Freddie Mac, 2.412%, 2018 | | | 2,482,000 | | | | 2,524,638 | |
| Freddie Mac, 2.699%, 2018 | | | 705,000 | | | | 728,897 | |
| Freddie Mac, 4.186%, 2019 | | | 650,000 | | | | 712,601 | |
| Freddie Mac, 5.085%, 2019 | | | 30,000 | | | | 34,408 | |
| Freddie Mac, 2.757%, 2020 | | | 306,046 | | | | 319,726 | |
| Freddie Mac, 3.32%, 2020 | | | 1,730,133 | | | | 1,835,996 | |
| Freddie Mac, 4%, 2025 | | | 558,108 | | | | 585,497 | |
| Freddie Mac, 5.5%, 2034 - 2037 | | | 221,207 | | | | 239,032 | |
| Freddie Mac, 5%, 2036 - 2038 | | | 1,586,089 | | | | 1,692,260 | |
| Freddie Mac, 4.5%, 2040 (f) | | | 4,318,645 | | | | 4,551,473 | |
| Freddie Mac, TBA, 3.5%, 2043 | | | 11,195,000 | | | | 11,338,436 | |
| Ginnie Mae, 5%, 2040 | | | 431,788 | | | | 470,877 | |
| Ginnie Mae, TBA, 3.5%, 2043 | | | 11,802,000 | | | | 12,111,801 | |
| | | | | | | | |
| | | | | | $ | 77,486,647 | |
| | | | | | | | |
| Natural Gas – Pipeline – 0.2% | | | | | |
| Energy Transfer Partners LP, 4.65%, 2021 | | $ | 1,664,000 | | | $ | 1,722,035 | |
| Energy Transfer Partners LP, 3.6%, 2023 | | | 745,000 | | | | 697,237 | |
| | | | | | | | |
| | | | | | $ | 2,419,272 | |
| | | | | | | | |
| Network & Telecom – 0.1% | | | | | | | | |
| AT&T, Inc., 5.55%, 2041 | | $ | 666,000 | | | $ | 693,442 | |
| | | | | | | | |
9
MFS Global Tactical Allocation Portfolio
Portfolio of Investments (unaudited) – continued
| | | | | | | | |
| Issuer | | Shares/Par | | | Value ($) | |
| | | | | | | | |
| BONDS – continued | | | | | | | | |
| Oil Services – 0.1% | | | | | | | | |
| Transocean, Inc., 6.5%, 2020 | | $ | 1,320,000 | | | $ | 1,485,804 | |
| | | | | | | | |
| Other Banks & Diversified Financials – 2.1% | | | | | |
| Banco de Credito del Peru, 6.125% to 2022, FRN to 2027 (n) | | $ | 1,510,000 | | | $ | 1,528,875 | |
| BB&T Corp., 3.95%, 2016 | | | 1,820,000 | | | | 1,949,828 | |
| BBVA Bancomer S.A. de C.V., 6.75%, 2022 (n) | | | 1,604,000 | | | | 1,732,320 | |
| Capital One Bank (USA) N.A., 3.375%, 2023 | | | 978,000 | | | | 924,458 | |
| Citigroup, Inc., 6.125%, 2018 | | | 733,000 | | | | 839,093 | |
| Citigroup, Inc., 3.375%, 2023 | | | 485,000 | | | | 463,958 | |
| Deutsche Bank AG, FRN, 4.296%, 2028 | | | 2,839,000 | | | | 2,621,362 | |
| Discover Bank, 7%, 2020 | | | 2,471,000 | | | | 2,883,726 | |
| Intesa Sanpaolo S.p.A., 3.875%, 2018 | | | 857,000 | | | | 822,901 | |
| Skandinaviska Enskilda, 1.75%, 2018 (z) | | | 2,160,000 | | | | 2,100,600 | |
| SunTrust Banks, Inc., 3.5%, 2017 | | | 550,000 | | | | 575,557 | |
| Svenska Handelsbanken AB, 2.875%, 2017 | | | 757,000 | | | | 781,466 | |
| Svenska Handelsbanken AB, FRN, 0.721%, 2016 | | | 2,150,000 | | | | 2,150,028 | |
| Swedbank AB, 2.125%, 2017 (n) | | | 421,000 | | | | 418,428 | |
| Swedbank AB, 1.75%, 2018 (n) | | | 1,294,000 | | | | 1,257,250 | |
| U.S. Bancorp, 2.95%, 2022 | | | 402,000 | | | | 372,915 | |
| | | | | | | | |
| | | | | | $ | 21,422,765 | |
| | | | | | | | |
| Pharmaceuticals – 0.1% | | | | | | | | |
| Teva Pharmaceutical Finance B.V., 2.95%, 2022 | | $ | 1,134,000 | | | $ | 1,062,460 | |
| | | | | | | | |
| Printing & Publishing – 0.0% | | | | | |
| Pearson Funding Five PLC, 3.25%, 2023 (z) | | $ | 361,000 | | | $ | 332,783 | |
| | | | | | | | |
| Railroad & Shipping – 0.2% | | | | | |
| CSX Corp., 4.1%, 2044 | | $ | 1,882,000 | | | $ | 1,634,201 | |
| | | | | | | | |
| Real Estate – 0.5% | | | | | | | | |
| Boston Properties Ltd., 3.125%, 2023 | | $ | 2,050,000 | | | $ | 1,893,585 | |
| ERP Operating LP, REIT, 3%, 2023 | | | 412,000 | | | | 378,637 | |
| Simon Property Group, Inc., REIT, 5.65%, 2020 | | | 1,948,000 | | | | 2,225,668 | |
| WEA Finance LLC/WT Finance Australia, 3.375%, 2022 (n) | | | 631,000 | | | | 594,735 | |
| | | | | | | | |
| | | | | | $ | 5,092,625 | |
| | | | | | | | |
| Retailers – 0.5% | | | | | | | | |
| Cencosud S.A., 5.5%, 2021 | | $ | 1,006,000 | | | $ | 1,032,298 | |
| Cencosud S.A., 4.875%, 2023 (n) | | | 830,000 | | | | 813,642 | |
| Gap, Inc., 5.95%, 2021 | | | 1,905,000 | | | | 2,106,983 | |
| Home Depot, Inc., 5.95%, 2041 | | | 1,029,000 | | | | 1,225,898 | |
| Wesfarmers Ltd., 1.874%, 2018 (n) | | | 306,000 | | | | 300,523 | |
| | | | | | | | |
| | | | | | $ | 5,479,344 | |
| | | | | | | | |
| | | | | | | | |
| Issuer | | Shares/Par | | | Value ($) | |
| | | | | | | | |
| BONDS – continued | | | | | | | | |
| Telecommunications – Wireless – 0.4% | | | | | |
| America Movil S.A.B. de C.V., 4.75%, 2022 | | EUR | 1,580,000 | | | $ | 2,315,944 | |
| American Tower Corp., REIT, 4.7%, 2022 | | $ | 327,000 | | | | 329,810 | |
| American Tower Corp., REIT, 3.5%, 2023 | | | 308,000 | | | | 282,028 | |
| Crown Castle Towers LLC, 6.113%, 2020 (n) | | | 1,380,000 | | | | 1,583,515 | |
| | | | | | | | |
| | | | | | $ | 4,511,297 | |
| | | | | | | | |
| Tobacco – 0.2% | | | | | | | | |
| Altria Group, Inc., 9.7%, 2018 | | $ | 492,000 | | | $ | 654,068 | |
| Altria Group, Inc., 2.85%, 2022 | | | 1,720,000 | | | | 1,590,444 | |
| | | | | | | | |
| | | | | | $ | 2,244,512 | |
| | | | | | | | |
| Transportation – Services – 0.2% | | | | | |
| ERAC USA Finance Co., 2.75%, 2017 (n) | | $ | 376,000 | | | $ | 383,402 | |
| ERAC USA Finance Co., 7%, 2037 (n) | | | 1,224,000 | | | | 1,441,261 | |
| | | | | | | | |
| | | | | | $ | 1,824,663 | |
| | | | | | | | |
| U.S. Government Agencies and Equivalents – 0.4% | |
| Aid-Egypt, 4.45%, 2015 | | $ | 649,000 | | | $ | 704,386 | |
| Small Business Administration, 5.09%, 2025 | | | 27,343 | | | | 30,172 | |
| Small Business Administration, 5.21%, 2026 | | | 998,345 | | | | 1,083,525 | |
| Small Business Administration, 5.31%, 2027 | | | 238,080 | | | | 262,173 | |
| Small Business Administration, 2.22%, 2033 | | | 2,286,000 | | | | 2,202,474 | |
| | | | | | | | |
| | | | | | $ | 4,282,730 | |
| | | | | | | | |
| U.S. Treasury Obligations – 1.4% | |
| U.S. Treasury Bonds, 4.5%, 2039 (f) | | $ | 4,469,000 | | | $ | 5,343,248 | |
| U.S. Treasury Notes, 4.75%, 2017 (f) | | | 6,127,000 | | | | 7,032,644 | |
| U.S. Treasury Notes, 3.5%, 2020 | | | 1,824,000 | | | | 2,017,942 | |
| | | | | | | | |
| | | | | | $ | 14,393,834 | |
| | | | | | | | |
| Utilities – Electric Power – 0.4% | |
| Enel Finance International S.A., 6%, 2039 (n) | | $ | 894,000 | | | $ | 825,611 | |
| Exelon Generation Co. LLC, 4.25%, 2022 | | | 1,095,000 | | | | 1,095,121 | |
| Progress Energy, Inc., 7.05%, 2019 | | | 2,150,000 | | | | 2,605,144 | |
| | | | | | | | |
| | | | | | $ | 4,525,876 | |
| | | | | | | | |
Total Bonds
(Identified Cost, $650,590,229) | | | $ | 638,183,427 | |
| | | | | | | | |
10
MFS Global Tactical Allocation Portfolio
Portfolio of Investments (unaudited) – continued
| | | | | | | | |
| Issuer/Expiration Date/Strike Price | | Number of Contracts | | | Value ($) | |
| | | | | | | | |
| PUT OPTIONS PURCHASED – 0.2% | | | | | |
| Russell 2000 Index – November 2013 @ $900 (Premiums Paid, $1,854,200) | | | 650 | | | $ | 1,755,000 | |
| | | | | | | | |
| | | | | | | | |
Issuer | | Shares/Par | | | Value ($) | |
| | | | | | | | |
| MONEY MARKET FUNDS – 5.6% | |
| MFS Institutional Money Market Portfolio, 0.11%, at Cost and Net Asset Value (v) | | | 58,921,450 | | | $ | 58,921,450 | |
| | | | | | | | |
Total Investments
(Identified Cost, $986,729,790) | | | $ | 1,064,281,664 | |
| | | | | | | | |
OTHER ASSETS, LESS
LIABILITIES – (1.8)% | | | | | | | (19,073,304 | ) |
| | | | | | | | |
| Net Assets – 100.0% | | | | | | $ | 1,045,208,360 | |
| | | | | | | | |
| (a) | | Non-income producing security. |
| (f) | | All or a portion of the security has been segregated as collateral for open futures contracts. |
| (n) | | Securities exempt from registration under Rule 144A of the Securities Act of 1933. These securities may be sold in the ordinary course of business in transactions exempt from registration, normally to qualified institutional buyers. At period end, the aggregate value of these securities was $60,857,246, representing 5.8% of net assets. |
| (v) | | Underlying affiliated fund that is available only to investment companies managed by MFS. The rate quoted for the MFS Institutional Money Market Portfolio is the annualized seven-day yield of the fund at period end. |
| (z) | | Restricted securities are not registered under the Securities Act of 1933 and are subject to legal restrictions on resale. These securities generally may be resold in transactions exempt from registration or to the public if the securities are subsequently registered. Disposal of these securities may involve time-consuming negotiations and prompt sale at an acceptable price may be difficult. The fund holds the following restricted securities: |
| | | | | | | | | | |
| Restricted Securities | | Acquisition Date | | Cost | | | Value | |
| Bayview Commercial Asset Trust, FRN, 1.72%, 2023 | | 5/25/06 | | | $124,940 | | | | $117,805 | |
| G-Force LLC, CDO, “A2”, 4.83%, 2036 | | 1/20/11 | | | 252,641 | | | | 261,171 | |
| HSBC Bank PLC, FRN, 0.915%, 2018 | | 5/08/13 | | | 1,833,000 | | | | 1,832,991 | |
| Nordea Bank AB, FRN, 0.735%, 2016 | | 5/07/13 | | | 3,520,000 | | | | 3,525,005 | |
| Pearson Funding Five PLC, 3.25%, 2023 | | 5/01/13 | | | 360,547 | | | | 332,783 | |
| Skandinaviska Enskilda, 1.75%, 2018 | | 3/13/13 | | | 2,148,253 | | | | 2,100,600 | |
| State Grid International Development Co. Ltd., 1.75%, 2018 | | 5/15/13 | | | 753,839 | | | | 723,618 | |
| Total Restricted Securities | | | | | | | | | $8,893,973 | |
| % of Net assets | | | | | | | | | 0.9% | |
The following abbreviations are used in this report and are defined:
| ADR | | American Depositary Receipt |
| CDO | | Collateralized Debt Obligation |
| FRN | | Floating Rate Note. Interest rate resets periodically and may not be the rate reported at period end. |
| IPS | | International Preference Stock |
| PLC | | Public Limited Company |
| REIT | | Real Estate Investment Trust |
Abbreviations indicate amounts shown in currencies other than the U.S. dollar. All amounts are stated in U.S. dollars unless otherwise indicated. A list of abbreviations is shown below:
| CNY | | Chinese Yuan Renminbi |
11
MFS Global Tactical Allocation Portfolio
Portfolio of Investments (unaudited) – continued
Derivative Contracts at 6/30/13
Forward Foreign Currency Exchange Contracts at 6/30/13
| | | | | | | | | | | | | | | | | | | | | | | | |
| Type | | Currency | | | Counterparty | | Contracts to Deliver/Receive | | Settlement Date Range | | In Exchange For | | | Contracts at Value | | | Net Unrealized Appreciation (Depreciation) | |
| Asset Derivatives | | | | | | | | | | | | | | | | | | | |
| SELL | | | AUD | | | Barclays Bank PLC | | 3,481,557 | | 7/16/13 | | $ | 3,463,000 | | | $ | 3,180,783 | | | $ | 282,217 | |
| SELL | | | AUD | | | Deutsche Bank AG | | 382,000 | | 7/16/13 | | | 388,742 | | | | 348,999 | | | | 39,743 | |
| SELL | | | AUD | | | JPMorgan Chase Bank | | 80,119,152 | | 8/12/13 | | | 80,046,405 | | | | 73,053,154 | | | | 6,993,251 | |
| SELL | | | AUD | | | Westpac Banking Corp. | | 4,966,792 | | 7/16/13 | | | 5,167,525 | | | | 4,537,708 | | | | 629,817 | |
| SELL | | | CAD | | | Goldman Sachs International | | 3,486,000 | | 7/16/13 | | | 3,367,451 | | | | 3,313,538 | | | | 53,913 | |
| SELL | | | CAD | | | JPMorgan Chase Bank | | 31,925,370 | | 8/12/13 | | | 31,405,947 | | | | 30,326,554 | | | | 1,079,393 | |
| SELL | | | CAD | | | Merrill Lynch International Bank | | 17,955,963 | | 7/16/13 | | | 17,620,037 | | | | 17,067,631 | | | | 552,406 | |
| SELL | | | CAD | | | UBS AG | | 443,000 | | 7/16/13 | | | 434,091 | | | | 421,084 | | | | 13,007 | |
| BUY | | | CHF | | | Credit Suisse Group | | 520,000 | | 7/16/13 | | | 547,517 | | | | 550,593 | | | | 3,076 | |
| BUY | | | CHF | | | Goldman Sachs International | | 124,000 | | 7/16/13 | | | 130,689 | | | | 131,295 | | | | 606 | |
| BUY | | | CHF | | | JPMorgan Chase Bank | | 5,068,330 | | 8/12/13 | | | 5,224,000 | | | | 5,367,768 | | | | 143,768 | |
| SELL | | | CHF | | | Credit Suisse Group | | 111,000 | | 7/16/13 | | | 119,545 | | | | 117,530 | | | | 2,015 | |
| SELL | | | CHF | | | Goldman Sachs International | | 146,000 | | 7/16/13 | | | 155,835 | | | | 154,589 | | | | 1,246 | |
| SELL | | | CHF | | | JPMorgan Chase Bank | | 81,967,888 | | 8/12/13 | | | 87,597,304 | | | | 86,810,561 | | | | 786,743 | |
| BUY | | | CNY | | | Deutsche Bank AG | | 10,633,000 | | 10/15/13-1/15/14 | | | 1,694,411 | | | | 1,712,318 | | | | 17,907 | |
| BUY | | | DKK | | | Goldman Sachs International | | 275,000 | | 7/16/13 | | | 47,746 | | | | 47,999 | | | | 253 | |
| SELL | | | DKK | | | Goldman Sachs International | | 11,206,333 | | 7/16/13-8/12/13 | | | 1,970,495 | | | | 1,956,496 | | | | 13,999 | |
| BUY | | | EUR | | | Deutsche Bank AG | | 1,418,784 | | 7/16/13 | | | 1,836,258 | | | | 1,846,862 | | | | 10,604 | |
| BUY | | | EUR | | | Goldman Sachs International | | 4,449,880 | | 8/12/13 | | | 5,731,000 | | | | 5,793,160 | | | | 62,160 | |
| BUY | | | EUR | | | Merrill Lynch International Bank | | 894,000 | | 7/16/13 | | | 1,158,185 | | | | 1,163,739 | | | | 5,554 | |
| BUY | | | EUR | | | UBS AG | | 143,000 | | 7/16/13 | | | 184,659 | | | | 186,146 | | | | 1,487 | |
| SELL | | | EUR | | | Citibank N.A. | | 12,417,999 | | 7/16/13 | | | 16,264,273 | | | | 16,164,779 | | | | 99,494 | |
| SELL | | | EUR | | | Credit Suisse Group | | 1,044,857 | | 7/16/13 | | | 1,375,944 | | | | 1,360,113 | | | | 15,831 | |
| SELL | | | EUR | | | Deutsche Bank AG | | 91,745 | | 7/16/13 | | | 119,926 | | | | 119,427 | | | | 499 | |
| SELL | | | EUR | | | Goldman Sachs International | | 97,099,160 | | 8/12/13 | | | 127,295,483 | | | | 126,410,369 | | | | 885,114 | |
| SELL | | | EUR | | | JPMorgan Chase Bank | | 37,142,869 | | 7/16/13-8/12/13 | | | 48,669,320 | | | | 48,354,640 | | | | 314,680 | |
| SELL | | | EUR | | | Merrill Lynch International Bank | | 1,351,000 | | 7/16/13 | | | 1,773,366 | | | | 1,758,626 | | | | 14,740 | |
| SELL | | | EUR | | | UBS AG | | 7,541,538 | | 7/16/13 | | | 9,877,075 | | | | 9,816,984 | | | | 60,091 | |
| BUY | | | GBP | | | Deutsche Bank AG | | 1,205,643 | | 7/16/13 | | | 1,823,062 | | | | 1,833,548 | | | | 10,486 | |
| BUY | | | GBP | | | JPMorgan Chase Bank | | 10,704,403 | | 8/12/13 | | | 16,200,000 | | | | 16,276,394 | | | | 76,394 | |
| SELL | | | GBP | | | Barclays Bank PLC | | 6,637,977 | | 7/16/13 | | | 10,214,186 | | | | 10,095,068 | | | | 119,118 | |
| SELL | | | GBP | | | Citibank N.A. | | 616,000 | | 7/16/13 | | | 938,611 | | | | 936,816 | | | | 1,795 | |
| SELL | | | GBP | | | Credit Suisse Group | | 3,553,944 | | 7/16/13 | | | 5,446,027 | | | | 5,404,855 | | | | 41,172 | |
| SELL | | | GBP | | | Deutsche Bank AG | | 3,553,944 | | 7/16/13 | | | 5,446,170 | | | | 5,404,855 | | | | 41,315 | |
| SELL | | | GBP | | | Goldman Sachs International | | 1,630,956 | | 7/16/13 | | | 2,527,672 | | | | 2,480,366 | | | | 47,306 | |
12
MFS Global Tactical Allocation Portfolio
Portfolio of Investments (unaudited) – continued
Forward Foreign Currency Exchange Contracts at 6/30/13 – continued
| | | | | | | | | | | | | | | | | | | | | | | | |
| Type | | Currency | | | Counterparty | | Contracts to Deliver/Receive | | Settlement Date Range | | In Exchange For | | | Contracts at Value | | | Net Unrealized Appreciation (Depreciation) | |
| Asset Derivatives – continued | | | | | | | | | | | | | | |
| SELL | | | GBP | | | JPMorgan Chase Bank | | 27,739,733 | | 7/16/13-8/12/13 | | $ | 42,924,266 | | | $ | 42,179,192 | | | $ | 745,074 | |
| SELL | | | GBP | | | Merrill Lynch International Bank | | 163,000 | | 7/16/13 | | | 251,481 | | | | 247,891 | | | | 3,590 | |
| SELL | | | GBP | | | UBS AG | | 412,000 | | 7/16/13 | | | 632,854 | | | | 626,572 | | | | 6,282 | |
| SELL | | | ILS | | | JPMorgan Chase Bank | | 2,517,156 | | 8/12/13 | | | 698,670 | | | | 691,369 | | | | 7,301 | |
| BUY | | | JPY | | | Credit Suisse Group | | 802,676,804 | | 7/16/13 | | | 8,063,651 | | | | 8,093,552 | | | | 29,901 | |
| BUY | | | JPY | | | Deutsche Bank AG | | 811,834,000 | | 7/16/13 | | | 8,156,802 | | | | 8,185,886 | | | | 29,084 | |
| BUY | | | JPY | | | Goldman Sachs International | | 205,445,092 | | 7/16/13 | | | 2,023,053 | | | | 2,071,544 | | | | 48,491 | |
| BUY | | | JPY | | | Merrill Lynch International Bank | | 802,676,803 | | 7/16/13 | | | 8,061,651 | | | | 8,093,552 | | | | 31,901 | |
| SELL | | | JPY | | | Citibank N.A. | | 333,676,100 | | 7/16/13 | | | 3,374,679 | | | | 3,364,523 | | | | 10,156 | |
| SELL | | | JPY | | | Deutsche Bank AG | | 480,009,000 | | 7/16/13 | | | 4,892,801 | | | | 4,840,027 | | | | 52,774 | |
| SELL | | | JPY | | | Goldman Sachs International | | 4,593,649,889 | | 7/16/13-8/12/13 | | | 47,211,445 | | | | 46,323,199 | | | | 888,246 | |
| SELL | | | JPY | | | JPMorgan Chase Bank | | 8,652,466,739 | | 8/12/13 | | | 88,802,541 | | | | 87,254,120 | | | | 1,548,421 | |
| SELL | | | JPY | | | Merrill Lynch International Bank | | 241,016,000 | | 7/16/13 | | | 2,465,554 | | | | 2,430,213 | | | | 35,341 | |
| SELL | | | JPY | | | UBS AG | | 365,300,000 | | 7/16/13 | | | 3,739,368 | | | | 3,683,393 | | | | 55,975 | |
| BUY | | | KRW | | | JPMorgan Chase Bank | | 656,207,900 | | 8/01/13 | | | 572,732 | | | | 573,688 | | | | 956 | |
| SELL | | | KRW | | | JPMorgan Chase Bank | | 6,830,726,100 | | 7/02/13 | | | 6,065,871 | | | | 5,981,109 | | | | 84,762 | |
| BUY | | | MXN | | | JPMorgan Chase Bank | | 24,793,375 | | 9/03/13 | | | 1,892,841 | | | | 1,902,799 | | | | 9,958 | |
| SELL | | | MXN | | | Credit Suisse Group | | 21,474,000 | | 7/16/13 | | | 1,666,480 | | | | 1,655,208 | | | | 11,272 | |
| SELL | | | MXN | | | JPMorgan Chase Bank | | 11,552,412 | | 7/15/13 | | | 896,683 | | | | 890,535 | | | | 6,148 | |
| BUY | | | MYR | | | JPMorgan Chase Bank | | 4,150,756 | | 7/24/13 | | | 1,294,280 | | | | 1,311,749 | | | | 17,469 | |
| SELL | | | MYR | | | JPMorgan Chase Bank | | 311,000 | | 7/03/13 | | | 100,145 | | | | 98,427 | | | | 1,718 | |
| SELL | | | NOK | | | Goldman Sachs International | | 77,720,347 | | 8/12/13 | | | 13,364,000 | | | | 12,776,812 | | | | 587,188 | |
| SELL | | | NZD | | | JPMorgan Chase Bank | | 38,361,266 | | 8/12/13 | | | 31,438,474 | | | | 29,641,307 | | | | 1,797,167 | |
| SELL | | | PLN | | | Citibank N.A. | | 14,653,258 | | 7/16/13 | | | 4,600,926 | | | | 4,406,153 | | | | 194,773 | |
| SELL | | | RUB | | | JPMorgan Chase Bank | | 43,099,632 | | 7/15/13 | | | 1,341,268 | | | | 1,308,736 | | | | 32,532 | |
| SELL | | | SEK | | | Citibank N.A. | | 2,177,000 | | 7/16/13 | | | 334,190 | | | | 324,524 | | | | 9,666 | |
| SELL | | | SEK | | | Credit Suisse Group | | 1,286,000 | | 7/16/13 | | | 195,921 | | | | 191,703 | | | | 4,218 | |
| SELL | | | SEK | | | Goldman Sachs International | | 28,742,394 | | 7/16/13-8/12/13 | | | 4,407,043 | | | | 4,282,224 | | | | 124,819 | |
| SELL | | | SGD | | | JPMorgan Chase Bank | | 1,238,213 | | 8/12/13 | | | 1,003,680 | | | | 976,968 | | | | 26,712 | |
| SELL | | | THB | | | JPMorgan Chase Bank | | 205,705,350 | | 7/18/13 | | | 6,984,812 | | | | 6,627,202 | | | | 357,610 | |
| | | | | | | | | | | | | | | | | | | | | | | | |
| | | | | | | | | | | | | | | | | | | | $ | 19,180,705 | |
| | | | | | | | | | | | | | | | | | | | | | | | |
| Liability Derivatives | | | | | | | | | | | | | | | | | | | |
| BUY | | | AUD | | | Deutsche Bank AG | | 3,548,000 | | 7/16/13 | | $ | 3,406,577 | | | $ | 3,241,486 | | | $ | (165,091 | ) |
| BUY | | | AUD | | | Goldman Sachs International | | 775,000 | | 7/16/13 | | | 761,395 | | | | 708,047 | | | | (53,348 | ) |
| BUY | | | AUD | | | JPMorgan Chase Bank | | 29,234,853 | | 8/12/13 | | | 29,925,000 | | | | 26,656,525 | | | | (3,268,475 | ) |
| BUY | | | CAD | | | Citibank N.A. | | 4,526,583 | | 7/16/13 | | | 4,367,631 | | | | 4,302,640 | | | | (64,991 | ) |
| BUY | | | CAD | | | Credit Suisse Group | | 118,000 | | 7/16/13 | | | 115,617 | | | | 112,162 | | | | (3,455 | ) |
| BUY | | | CAD | | | Deutsche Bank AG | | 3,751,000 | | 7/16/13 | | | 3,671,217 | | | | 3,565,428 | | | | (105,789 | ) |
| BUY | | | CAD | | | Goldman Sachs International | | 145,000 | | 7/16/13 | | | 141,869 | | | | 137,826 | | | | (4,043 | ) |
| BUY | | | CAD | | | JPMorgan Chase Bank | | 17,173,782 | | 8/12/13 | | | 16,940,000 | | | | 16,313,723 | | | | (626,277 | ) |
| BUY | | | CAD | | | Merrill Lynch International Bank | | 790,000 | | 7/16/13 | | | 784,632 | | | | 750,916 | | | | (33,716 | ) |
| BUY | | | CHF | | | UBS AG | | 5,397,000 | | 7/16/13 | | | 5,788,350 | | | | 5,714,515 | | | | (73,835 | ) |
| SELL | | | CHF | | | Deutsche Bank AG | | 796,000 | | 7/16/13 | | | 819,014 | | | | 842,830 | | | | (23,816 | ) |
| SELL | | | CNY | | | Deutsche Bank AG | | 10,633,000 | | 10/15/13-1/15/14 | | | 1,710,686 | | | | 1,712,318 | | | | (1,632 | ) |
| BUY | | | CZK | | | Citibank N.A. | | 14,758,000 | | 7/16/13 | | | 743,070 | | | | 738,470 | | | | (4,600 | ) |
| BUY | | | DKK | | | Deutsche Bank AG | | 13,860,747 | | 7/16/13 | | | 2,430,254 | | | | 2,419,281 | | | | (10,973 | ) |
| BUY | | | EUR | | | Barclays Bank PLC | | 6,181,208 | | 7/16/13-9/18/13 | | | 8,238,283 | | | | 8,048,438 | | | | (189,845 | ) |
| BUY | | | EUR | | | Citibank N.A. | | 1,301,997 | | 7/16/13 | | | 1,712,006 | | | | 1,694,838 | | | | (17,168 | ) |
| BUY | | | EUR | | | Deutsche Bank AG | | 10,734,459 | | 7/16/13 | | | 14,111,551 | | | | 13,973,278 | | | | (138,273 | ) |
| BUY | | | EUR | | | Goldman Sachs International | | 6,574,000 | | 7/16/13 | | | 8,606,523 | | | | 8,557,518 | | | | (49,005 | ) |
| BUY | | | EUR | | | JPMorgan Chase Bank | | 281,000 | | 7/16/13 | | | 368,596 | | | | 365,784 | | | | (2,812 | ) |
13
MFS Global Tactical Allocation Portfolio
Portfolio of Investments (unaudited) – continued
Forward Foreign Currency Exchange Contracts at 6/30/13 – continued
| | | | | | | | | | | | | | | | | | | | | | | | |
| Type | | Currency | | | Counterparty | | Contracts to Deliver/Receive | | Settlement Date Range | | In Exchange For | | | Contracts at Value | | | Net Unrealized Appreciation (Depreciation) | |
| Liability Derivatives – continued | | | | | | | | | | | | |
| BUY | | | EUR | | | UBS AG | | 8,215,160 | | 7/16/13-9/18/13 | | $ | 10,894,755 | | | $ | 10,696,077 | | | $ | (198,678 | ) |
| SELL | | | EUR | | | Barclays Bank PLC | | 2,299,000 | | 7/16/13 | | | 2,991,590 | | | | 2,992,658 | | | | (1,068 | ) |
| SELL | | | EUR | | | Citibank N.A. | | 818,000 | | 7/16/13 | | | 1,062,831 | | | | 1,064,808 | | | | (1,977 | ) |
| SELL | | | EUR | | | Deutsche Bank AG | | 1,683,000 | | 7/16/13 | | | 2,163,057 | | | | 2,190,798 | | | | (27,741 | ) |
| SELL | | | EUR | | | Goldman Sachs International | | 4,418,965 | | 7/16/13 | | | 5,743,825 | | | | 5,752,263 | | | | (8,438 | ) |
| SELL | | | EUR | | | Merrill Lynch International Bank | | 977,725 | | 7/16/13 | | | 1,258,044 | | | | 1,272,726 | | | | (14,682 | ) |
| SELL | | | EUR | | | UBS AG | | 6,351,146 | | 7/16/13 | | | 8,182,568 | | | | 8,267,424 | | | | (84,856 | ) |
| BUY | | | GBP | | | Barclays Bank PLC | | 9,302,375 | | 7/16/13 | | | 14,471,565 | | | | 14,147,098 | | | | (324,467 | ) |
| BUY | | | GBP | | | Citibank N.A. | | 1,555,000 | | 7/16/13 | | | 2,408,996 | | | | 2,364,852 | | | | (44,144 | ) |
| BUY | | | GBP | | | Deutsche Bank AG | | 494,000 | | 7/16/13 | | | 769,361 | | | | 751,278 | | | | (18,083 | ) |
| BUY | | | GBP | | | Goldman Sachs International | | 1,872,166 | | 7/16/13 | | | 2,873,406 | | | | 2,847,200 | | | | (26,206 | ) |
| BUY | | | GBP | | | JPMorgan Chase Bank | | 4,296,160 | | 7/16/13-8/12/13 | | | 6,684,189 | | | | 6,532,506 | | | | (151,683 | ) |
| BUY | | | GBP | | | Merrill Lynch International Bank | | 44,000 | | 7/16/13 | | | 67,093 | | | | 66,915 | | | | (178 | ) |
| BUY | | | GBP | | | UBS AG | | 61,000 | | 7/16/13 | | | 94,557 | | | | 92,769 | | | | (1,788 | ) |
| SELL | | | GBP | | | Deutsche Bank AG | | 795,000 | | 7/16/13 | | | 1,207,879 | | | | 1,209,040 | | | | (1,161 | ) |
| BUY | | | JPY | | | Barclays Bank PLC | | 193,484,000 | | 7/16/13 | | | 2,017,671 | | | | 1,950,938 | | | | (66,733 | ) |
| BUY | | | JPY | | | Citibank N.A. | | 1,845,602,842 | | 7/16/13 | | | 18,709,964 | | | | 18,609,585 | | | | (100,379 | ) |
| BUY | | | JPY | | | Credit Suisse Group | | 6,519,000 | | 7/16/13 | | | 68,443 | | | | 65,732 | | | | (2,711 | ) |
| BUY | | | JPY | | | Deutsche Bank AG | | 908,699,299 | | 7/16/13 | | | 9,340,091 | | | | 9,162,598 | | | | (177,493 | ) |
| BUY | | | JPY | | | Goldman Sachs International | | 532,185,550 | | 7/16/13-8/12/13 | | | 5,423,778 | | | | 5,366,354 | | | | (57,424 | ) |
| BUY | | | JPY | | | UBS AG | | 438,612,000 | | 7/16/13 | | | 4,508,450 | | | | 4,422,613 | | | | (85,837 | ) |
| SELL | | | JPY | | | Credit Suisse Group | | 125,118,000 | | 7/16/13 | | | 1,219,303 | | | | 1,261,590 | | | | (42,287 | ) |
| SELL | | | JPY | | | Deutsche Bank AG | | 49,077,000 | | 7/16/13 | | | 493,194 | | | | 494,853 | | | | (1,659 | ) |
| SELL | | | JPY | | | Goldman Sachs International | | 2,196,830,739 | | 7/16/13-8/12/13 | | | 21,811,838 | | | | 22,151,460 | | | | (339,622 | ) |
| BUY | | | KRW | | | JPMorgan Chase Bank | | 7,872,725,000 | | 7/02/13 | | | 7,093,203 | | | | 6,893,503 | | | | (199,700 | ) |
| SELL | | | KRW | | | JPMorgan Chase Bank | | 1,041,998,900 | | 7/02/13 | | | 905,900 | | | | 912,393 | | | | (6,493 | ) |
| BUY | | | MXN | | | JPMorgan Chase Bank | | 24,793,375 | | 7/05/13 | | | 1,928,545 | | | | 1,912,935 | | | | (15,610 | ) |
| BUY | | | MXN | | | Merrill Lynch International Bank | | 1,284,000 | | 7/16/13 | | | 106,087 | | | | 98,970 | | | | (7,117 | ) |
| SELL | | | MXN | | | JPMorgan Chase Bank | | 24,793,375 | | 7/05/13 | | | 1,902,792 | | | | 1,912,935 | | | | (10,143 | ) |
| BUY | | | MYR | | | JPMorgan Chase Bank | | 4,461,756 | | 7/03/13 | | | 1,448,011 | | | | 1,412,074 | | | | (35,937 | ) |
| SELL | | | MYR | | | JPMorgan Chase Bank | | 4,150,756 | | 7/03/13 | | | 1,295,897 | | | | 1,313,648 | | | | (17,751 | ) |
| BUY | | | NOK | | | Goldman Sachs International | | 274,009,905 | | 7/16/13-8/12/13 | | | 46,951,831 | | | | 45,046,799 | | | | (1,905,032 | ) |
| BUY | | | NOK | | | JPMorgan Chase Bank | | 48,349,295 | | 8/12/13 | | | 8,276,819 | | | | 7,948,367 | | | | (328,452 | ) |
| BUY | | | NZD | | | Goldman Sachs International | | 47,000 | | 7/16/13 | | | 39,530 | | | | 36,386 | | | | (3,144 | ) |
| BUY | | | NZD | | | JPMorgan Chase Bank | | 17,607,527 | | 7/16/13-8/12/13 | | | 14,945,352 | | | | 13,607,036 | | | | (1,338,316 | ) |
| BUY | | | PLN | | | Citibank N.A. | | 12,406,306 | | 7/16/13 | | | 3,748,059 | | | | 3,730,507 | | | | (17,552 | ) |
| BUY | | | PLN | | | Goldman Sachs International | | 642,000 | | 7/16/13 | | | 195,290 | | | | 193,046 | | | | (2,244 | ) |
| BUY | | | RUB | | | Credit Suisse Group | | 41,384,700 | | 7/15/13 | | | 1,260,000 | | | | 1,256,662 | | | | (3,338 | ) |
| BUY | | | SEK | | | Citibank N.A. | | 225,000 | | 7/16/13 | | | 33,841 | | | | 33,541 | | | | (300 | ) |
| BUY | | | SEK | | | Deutsche Bank AG | | 28,811,733 | | 7/16/13 | | | 4,493,893 | | | | 4,294,944 | | | | (198,949 | ) |
| BUY | | | SEK | | | Goldman Sachs International | | 174,791,562 | | 7/16/13-8/12/13 | | | 26,569,909 | | | | 26,040,166 | | | | (529,743 | ) |
| BUY | | | SEK | | | JPMorgan Chase Bank | | 233,692,070 | | 7/16/13-8/12/13 | | | 35,635,207 | | | | 34,814,984 | | | | (820,223 | ) |
| BUY | | | SEK | | | UBS AG | | 874,000 | | 7/16/13 | | | 133,605 | | | | 130,287 | | | | (3,318 | ) |
| SELL | | | SEK | | | Citibank N.A. | | 831,000 | | 7/16/13 | | | 122,841 | | | | 123,877 | | | | (1,036 | ) |
| BUY | | | SGD | | | Goldman Sachs International | | 1,409,000 | | 7/16/13 | | | 1,137,722 | | | | 1,111,669 | | | | (26,053 | ) |
| BUY | | | THB | | | HSBC Bank | | 44,082,000 | | 8/19/13 | | | 1,427,988 | | | | 1,417,801 | | | | (10,187 | ) |
| BUY | | | THB | | | JPMorgan Chase Bank | | 123,410,000 | | 7/18/13 | | | 4,192,153 | | | | 3,975,896 | | | | (216,257 | ) |
| BUY | | | ZAR | | | JPMorgan Chase Bank | | 16,030,135 | | 7/16/13 | | | 1,721,591 | | | | 1,618,353 | | | | (103,238 | ) |
| BUY | | | ZAR | | | Merrill Lynch International Bank | | 844,000 | | 7/16/13 | | | 92,472 | | | | 85,208 | | | | (7,264 | ) |
| SELL | | | ZAR | | | Goldman Sachs International | | 1,535,000 | | 7/16/13 | | | 152,066 | | | | 154,969 | | | | (2,903 | ) |
| | | | | | | | | | | | | | | | | | | | | | | | |
| | | | | | | | | | | | | | | | | | | | $ | (12,426,739 | ) |
| | | | | | | | | | | | | | | | | | | | | | | | |
14
MFS Global Tactical Allocation Portfolio
Portfolio of Investments (unaudited) – continued
Futures Contracts Outstanding at 6/30/13
| | | | | | | | | | | | | | | | |
| Description | | Currency | | | Contracts | | | Value | | Expiration Date | | Unrealized Appreciation (Depreciation) | |
| Asset Derivatives | | | | | | | | | | | | | | | | |
| Equity Futures | | | | | | | | | | | | | | | | |
| Amsterdam Index (Long) | | | EUR | | | | 142 | | | $12,751,840 | | July - 2013 | | | $5,096 | |
| Hang Seng China ENT Index (Long) | | | HKD | | | | 278 | | | 16,410,488 | | July - 2013 | | | 445,993 | |
| KOSPI 200 Index (Short) | | | KRW | | | | 175 | | | 18,450,368 | | September - 2013 | | | 855,538 | |
| MSCI Taiwan Index (Long) | | | USD | | | | 574 | | | 15,733,873 | | July - 2013 | | | 272,741 | |
| NIKKEI 225 Index (Long) | | | JPY | | | | 132 | | | 18,255,655 | | September - 2013 | | | 254,592 | |
| OMX 30 Index (Short) | | | SEK | | | | 845 | | | 14,511,559 | | July - 2013 | | | 478,513 | |
| Russell 2000 Index (Short) | | | USD | | | | 148 | | | 14,425,560 | | September - 2013 | | | 51,353 | |
| S&P TSE 60 Index (Short) | | | CAD | | | | 161 | | | 21,211,524 | | September - 2013 | | | 219,158 | |
| TURKDEK ISE 30 Index (Long) | | | TRY | | | | 3,279 | | | 15,605,482 | | August - 2013 | | | 410,884 | |
| | | | | | | | | | | | | | | | |
| | | | | | | | | | | | | | | $2,993,868 | |
| | | | | | | | | | | | | | | | |
| Interest Rate Futures | | | | | | | | | | | | | | | | |
| Australian Treasury Bond 10 yr (Short) | | | AUD | | | | 228 | | | $24,686,377 | | September - 2013 | | | $709,000 | |
| German Euro Bund (Short) | | | EUR | | | | 307 | | | 56,552,295 | | September - 2013 | | | 669,741 | |
| US Treasury Note (Short) | | | USD | | | | 272 | | | 34,425,000 | | September - 2013 | | | 774,673 | |
| UK Long Gilt Bond (Short) | | | GBP | | | | 103 | | | 17,530,008 | | September - 2013 | | | 713,452 | |
| | | | | | | | | | | | | | | | |
| | | | | | | | | | | | | | | 2,866,866 | |
| | | | | | | | | | | | | | | | |
| | | | | | | | | | | | | | | $5,860,734 | |
| | | | | | | | | | | | | | | | |
| Liability Derivatives | | | | | | | | | | | | | | | | |
| Equity Futures | | | | | | | | | | | | | | | | |
| AUST SPI 200 Index (Short) | | | AUD | | | | 393 | | | $42,517,555 | | September - 2013 | | | $(674,510 | ) |
| Bovespa Index (Long) | | | BRL | | | | 338 | | | 7,136,422 | | August - 2013 | | | (491,976 | ) |
| CAC 40 Index (Long) | | | EUR | | | | 682 | | | 33,152,087 | | July - 2013 | | | (298,940 | ) |
| DAX Index (Long) | | | EUR | | | | 135 | | | 34,968,985 | | September - 2013 | | | (388,540 | ) |
| FTSE 100 Index (Long) | | | GBP | | | | 8 | | | 752,113 | | September - 2013 | | | (3,739 | ) |
| FTSE Jse Top 40 Index (Long) | | | ZAR | | | | 321 | | | 11,408,658 | | September - 2013 | | | (58,907 | ) |
| FTSE MIB Index (Long) | | | EUR | | | | 168 | | | 16,687,250 | | September - 2013 | | | (713,707 | ) |
| Hang Seng Index (Short) | | | HKD | | | | 111 | | | 14,776,590 | | July - 2013 | | | (620,800 | ) |
| IBEX 35 Index (Long) | | | EUR | | | | 284 | | | 28,329,744 | | July - 2013 | | | (1,307,634 | ) |
| MexBol Index (Short) | | | MXN | | | | 462 | | | 14,554,794 | | September - 2013 | | | (311,164 | ) |
| MSCI Singapore Index (Short) | | | SGD | | | | 512 | | | 28,548,361 | | July - 2013 | | | (944,207 | ) |
| S&P 500 E-Mini Index (Long) | | | USD | | | | 268 | | | 21,430,620 | | September - 2013 | | | (294,269 | ) |
| S&P CNX Nifty Index (Short) | | | USD | | | | 476 | | | 5,526,884 | | July - 2013 | | | (200,816 | ) |
| | | | | | | | | | | | | | | | |
| | | | | | | | | | | | | | | $(6,309,209 | ) |
| | | | | | | | | | | | | | | | |
At June 30, 2013, the fund had cash collateral of $269,894 and other liquid securities with an aggregate value of $33,329,532 to cover any commitments for certain derivative contracts. Cash collateral is comprised of “Restricted cash“on the Statement of Assets and Liabilities.
See Notes to Financial Statements
15
MFS Global Tactical Allocation Portfolio
FINANCIAL STATEMENTS | STATEMENT OF ASSETS AND LIABILITIES (unaudited)
This statement represents your fund’s balance sheet, which details the assets and liabilities comprising the total value of the fund.
| | | | | | | | |
| At 6/30/13 | | | | | | | | |
Assets | | | | | | | | |
Investments – | | | | | | | | |
| Non-affiliated issuers, at value (identified cost, $927,808,340) | | | $1,005,360,214 | | | | | |
Underlying affiliated funds, at cost and value | | | 58,921,450 | | | | | |
Total investments, at value (identified cost, $986,729,790) | | | $1,064,281,664 | | | | | |
Cash | | | 7,673 | | | | | |
Restricted cash | | | 269,894 | | | | | |
Foreign currency, at value (identified cost, $217,001) | | | 215,883 | | | | | |
Receivables for | | | | | | | | |
Forward foreign currency exchange contracts | | | 19,180,705 | | | | | |
Investments sold | | | 3,659,081 | | | | | |
TBA sale commitments | | | 6,454,552 | | | | | |
Fund shares sold | | | 11,602 | | | | | |
Interest and dividends | | | 8,090,114 | | | | | |
Other assets | | | 5,445 | | | | | |
Total assets | | | | | | | $1,102,176,613 | |
Liabilities | | | | | | | | |
Payables for | | | | | | | | |
Forward foreign currency exchange contracts | | | $12,426,739 | | | | | |
Daily variation margin on open futures contracts | | | 1,107,943 | | | | | |
Investments purchased | | | 5,056,113 | | | | | |
TBA purchase commitments | | | 37,511,387 | | | | | |
Fund shares reacquired | | | 647,750 | | | | | |
Payable to affiliates | | | | | | | | |
Investment adviser | | | 80,783 | | | | | |
Shareholder servicing costs | | | 275 | | | | | |
Distribution and/or service fees | | | 26,657 | | | | | |
| Payable for independent Trustees’ compensation | | | 4,272 | | | | | |
Accrued expenses and other liabilities | | | 106,334 | | | | | |
Total liabilities | | | | | | | $56,968,253 | |
Net assets | | | | | | | $1,045,208,360 | |
Net assets consist of | | | | | | | | |
Paid-in capital | | | $946,025,478 | | | | | |
Unrealized appreciation (depreciation) on investments and translation of assets and liabilities in foreign currencies | | | 83,794,462 | | | | | |
Accumulated net realized gain (loss) on investments and foreign currency | | | 3,434,926 | | | | | |
Undistributed net investment income | | | 11,953,494 | | | | | |
Net assets | | | | | | | $1,045,208,360 | |
Shares of beneficial interest outstanding | | | | | | | 67,853,569 | |
| | | | | | | | | | | | |
| | | Net assets | | | Shares outstanding | | | Net asset value per share | |
Initial Class | | | $71,954,405 | | | | 4,612,477 | | | | $15.60 | |
Service Class | | | 973,253,955 | | | | 63,241,092 | | | | 15.39 | |
See Notes to Financial Statements
16
MFS Global Tactical Allocation Portfolio
FINANCIAL STATEMENTS | STATEMENT OF OPERATIONS (unaudited)
This statement describes how much your fund earned in investment income and accrued in expenses. It also describes any gains and/or losses generated by fund operations.
| | | | | | | | |
Six months ended 6/30/13 | | | | | | | | |
Net investment income | | | | | | | | |
Income | | | | | | | | |
Interest | | | $9,218,020 | | | | | |
Dividends | | | 6,847,388 | | | | | |
Dividends from underlying affiliated funds | | | 36,002 | | | | | |
Foreign taxes withheld | | | (319,177 | ) | | | | |
Total investment income | | | | | | | $15,782,233 | |
Expenses | | | | | | | | |
Management fee | | | $3,728,247 | | | | | |
Distribution and/or service fees | | | 1,247,690 | | | | | |
Shareholder servicing costs | | | 24,019 | | | | | |
Administrative services fee | | | 72,303 | | | | | |
Independent Trustees’ compensation | | | 13,397 | | | | | |
Custodian fee | | | 94,225 | | | | | |
Shareholder communications | | | 10,257 | | | | | |
Audit and tax fees | | | 33,795 | | | | | |
Legal fees | | | 9,062 | | | | | |
Miscellaneous | | | 28,730 | | | | | |
Total expenses | | | | | | | $5,261,725 | |
Fees paid indirectly | | | (141 | ) | | | | |
Reduction of expenses by investment adviser | | | (3,502 | ) | | | | |
Net expenses | | | | | | | $5,258,082 | |
Net investment income | | | | | | | $10,524,151 | |
Realized and unrealized gain (loss) on investments and foreign currency | | | | | | | | |
Realized gain (loss) (identified cost basis) | | | | | | | | |
Investments | | | $8,206,125 | | | | | |
Futures contracts | | | (9,445,846 | ) | | | | |
Foreign currency | | | 26,242,218 | | | | | |
Net realized gain (loss) on investments and foreign currency | | | | | | | $25,002,497 | |
Change in unrealized appreciation (depreciation) | | | | | | | | |
Investments | | | $(5,993,804 | ) | | | | |
Futures contracts | | | (2,157,623 | ) | | | | |
Translation of assets and liabilities in foreign currencies | | | (5,616,120 | ) | | | | |
Net unrealized gain (loss) on investments and foreign currency translation | | | | | | | $(13,767,547 | ) |
Net realized and unrealized gain (loss) on investments and foreign currency | | | | | | | $11,234,950 | |
Change in net assets from operations | | | | | | | $21,759,101 | |
See Notes to Financial Statements
17
MFS Global Tactical Allocation Portfolio
FINANCIAL STATEMENTS | STATEMENTS OF CHANGES IN NET ASSETS
These statements describe the increases and/or decreases in net assets resulting from operations, any distributions, and any shareholder transactions.
| | | | | | | | |
| |
| Six months ended
6/30/13
(unaudited |
) | |
| Year ended
12/31/12 |
|
Change in net assets | | | | | | | | |
| From operations | | | | | | | | |
Net investment income | | | $10,524,151 | | | | $18,619,353 | |
Net realized gain (loss) on investments and foreign currency | | | 25,002,497 | | | | (15,094,747 | ) |
Net unrealized gain (loss) on investments and foreign currency translation | | | (13,767,547 | ) | | | 88,945,925 | |
Change in net assets from operations | | | $21,759,101 | | | | $92,470,531 | |
| Distributions declared to shareholders | | | | | | | | |
From net investment income | | | $— | | | | $(18,750,120 | ) |
Change in net assets from fund share transactions | | | $(43,904,796 | ) | | | $(6,063,932 | ) |
Total change in net assets | | | $(22,145,695 | ) | | | $67,656,479 | |
| Net assets | | | | | | | | |
At beginning of period | | | 1,067,354,055 | | | | 999,697,576 | |
At end of period (including undistributed net investment income of $11,953,494 and
$1,429,343, respectively) | | | $1,045,208,360 | | | | $1,067,354,055 | |
See Notes to Financial Statements
18
MFS Global Tactical Allocation Portfolio
FINANCIAL STATEMENTS | FINANCIAL HIGHLIGHTS
The financial highlights table is intended to help you understand the fund’s financial performance for the semiannual period and the past 5 fiscal years. Certain information reflects financial results for a single fund share. The total returns in the table represent the rate by which an investor would have earned (or lost) on an investment in the fund share class (assuming reinvestment of all distributions) held for the entire period.
| | | | | | | | | | | | | | | | | | | | | | | | |
| Initial Class | | Six months
ended
6/30/13 | | | Years ended 12/31 | |
| | | | 2012 | | | 2011 | | | 2010 | | | 2009 | | | 2008 | |
| | | (unaudited) | | | | | | | | | | | | | | | | |
Net asset value, beginning of period | | | $15.27 | | | | $14.22 | | | | $14.20 | | | | $13.56 | | | | $12.89 | | | | $17.59 | |
| Income (loss) from investment operations | | | | | | | | | | | | | | | | | | | | | | | | |
Net investment income (d) | | | $0.17 | | | | $0.30 | | | | $0.32 | | | | $0.24 | | | | $0.27 | | | | $0.37 | |
Net realized and unrealized gain (loss) on investments
and foreign currency | | | 0.16 | | | | 1.04 | | | | (0.10 | ) | | | 0.51 | | | | 1.44 | | | | (2.68 | ) |
Total from investment operations | | | $0.33 | | | | $1.34 | | | | $0.22 | | | | $0.75 | | | | $1.71 | | | | $(2.31 | ) |
| Less distributions declared to shareholders | | | | | | | | | | | | | | | | | | | | | | | | |
From net investment income | | | $— | | | | $(0.29 | ) | | | $(0.14 | ) | | | $(0.11 | ) | | | $(1.04 | ) | | | $(0.86 | ) |
From net realized gain on investments | | | — | | | | — | | | | (0.06 | ) | | | — | | | | — | | | | (1.53 | ) |
Total distributions declared to shareholders | | | $— | | | | $(0.29 | ) | | | $(0.20 | ) | | | $(0.11 | ) | | | $(1.04 | ) | | | $(2.39 | ) |
Net asset value, end of period (x) | | | $15.60 | | | | $15.27 | | | | $14.22 | | | | $14.20 | | | | $13.56 | | | | $12.89 | |
Total return (%) (k)(r)(s)(x) | | | 2.16 | (n) | | | 9.49 | | | | 1.55 | | | | 5.53 | | | | 15.16 | | | | (15.42 | ) |
Ratios (%) (to average net assets)
and Supplemental data: | | | | | | | | | | | | | | | | | | | | | | | | |
Expenses before expense reductions (f) | | | 0.75 | (a) | | | 0.76 | | | | 0.80 | | | | 0.93 | | | | 1.06 | | | | 0.98 | |
Expenses after expense reductions (f) | | | 0.75 | (a) | | | 0.76 | | | | 0.80 | | | | 0.90 | | | | 0.90 | | | | 0.90 | |
Net investment income | | | 2.20 | (a) | | | 2.02 | | | | 2.21 | | | | 1.76 | | | | 2.17 | | | | 2.48 | |
Portfolio turnover | | | 37 | (n) | | | 38 | | | | 56 | | | | 73 | | | | 66 | | | | 75 | |
Net assets at end of period (000 omitted) | | | $71,954 | | | | $73,189 | | | | $77,255 | | | | $87,137 | | | | $92,880 | | | | $93,254 | |
| | |
| Service Class | | Six months
ended
6/30/13 | | | Years ended 12/31 | |
| | | | 2012 | | | 2011 | | | 2010 | | | 2009 | | | 2008 | |
| | | (unaudited) | | | | | | | | | | | | | | | | |
Net asset value, beginning of period | | | $15.09 | | | | $14.06 | | | | $14.07 | | | | $13.46 | | | | $12.79 | | | | $17.46 | |
| Income (loss) from investment operations | | | | | | | | | | | | | | | | | | | | | | | | |
Net investment income (d) | | | $0.15 | | | | $0.26 | | | | $0.27 | | | | $0.20 | | | | $0.24 | | | | $0.34 | |
Net realized and unrealized gain (loss) on investments
and foreign currency | | | 0.15 | | | | 1.03 | | | | (0.09 | ) | | | 0.51 | | | | 1.42 | | | | (2.66 | ) |
Total from investment operations | | | $0.30 | | | | $1.29 | | | | $0.18 | | | | $0.71 | | | | $1.66 | | | | $(2.32 | ) |
| Less distributions declared to shareholders | | | | | | | | | | | | | | | | | | | | | | | | |
From net investment income | | | $— | | | | $(0.26 | ) | | | $(0.13 | ) | | | $(0.10 | ) | | | $(0.99 | ) | | | $(0.82 | ) |
From net realized gain on investments | | | — | | | | — | | | | (0.06 | ) | | | — | | | | — | | | | (1.53 | ) |
Total distributions declared to shareholders | | | $— | | | | $(0.26 | ) | | | $(0.19 | ) | | | $(0.10 | ) | | | $(0.99 | ) | | | $(2.35 | ) |
Net asset value, end of period (x) | | | $15.39 | | | | $15.09 | | | | $14.06 | | | | $14.07 | | | | $13.46 | | | | $12.79 | |
Total return (%) (k)(r)(s)(x) | | | 1.99 | (n) | | | 9.26 | | | | 1.29 | | | | 5.31 | | | | 14.78 | | | | (15.59 | ) |
Ratios (%) (to average net assets)
and Supplemental data: | | | | | | | | | | | | | | | | | | | | | | | | |
Expenses before expense reductions (f) | | | 1.00 | (a) | | | 1.01 | | | | 1.05 | | | | 1.18 | | | | 1.31 | | | | 1.23 | |
Expenses after expense reductions (f) | | | 1.00 | (a) | | | 1.01 | | | | 1.05 | | | | 1.15 | | | | 1.15 | | | | 1.15 | |
Net investment income | | | 1.95 | (a) | | | 1.77 | | | | 1.92 | | | | 1.48 | | | | 1.92 | | | | 2.25 | |
Portfolio turnover | | | 37 | (n) | | | 38 | | | | 56 | | | | 73 | | | | 66 | | | | 75 | |
Net assets at end of period (000 omitted) | | | $973,254 | | | | $994,165 | | | | $922,442 | | | | $400,318 | | | | $11,228 | | | | $12,451 | |
See Notes to Financial Statements
19
MFS Global Tactical Allocation Portfolio
Financial Highlights – continued
| (d) | Per share data is based on average shares outstanding. |
| (f) | Ratios do not reflect reductions from fees paid indirectly, if applicable. |
| (k) | The total return does not reflect expenses that apply to separate accounts. Inclusion of these charges would reduce the total return figures for all periods shown. |
| (r) | Certain expenses have been reduced without which performance would have been lower. |
| (s) | From time to time the fund may receive proceeds from litigation settlements, without which performance would be lower. |
| (x) | The net asset values per share and total returns have been calculated on net assets which include adjustments made in accordance with U.S. generally accepted accounting principles required at period end for financial reporting purposes. |
See Notes to Financial Statements
20
MFS Global Tactical Allocation Portfolio
NOTES TO FINANCIAL STATEMENTS (unaudited)
| (1) | | Business and Organization |
MFS Global Tactical Allocation Portfolio (the fund) is a series of MFS Variable Insurance Trust II (the trust). The trust is organized as a Massachusetts business trust and is registered under the Investment Company Act of 1940, as amended, as an open-end management investment company. The shareholders of each series of the trust are separate accounts of insurance companies, which offer variable annuity and/or life insurance products, and qualified retirement and pension plans.
| (2) | | Significant Accounting Policies |
General – The preparation of financial statements in conformity with U.S. generally accepted accounting principles requires management to make estimates and assumptions that affect the reported amounts of assets and liabilities, and disclosure of contingent assets and liabilities at the date of the financial statements and the reported amounts of revenues and expenses during the reporting period. Actual results could differ from those estimates. In the preparation of these financial statements, management has evaluated subsequent events occurring after the date of the fund’s Statement of Assets and Liabilities through the date that the financial statements were issued. The fund invests in derivatives as part of its principal investment strategy. Derivatives can be highly volatile and involve risks in addition to the risks of the underlying indicators on which the derivative is based. The fund invests a significant portion of its assets in asset-backed and/or mortgage-backed securities. The value of these securities may depend, in part, on the issuer’s or borrower’s credit quality or ability to pay principal and interest when due and may fall if an issuer or borrower defaults on its obligation to pay principal or interest or if the instrument’s credit rating is downgraded by a credit rating agency. U.S. Government securities not supported as to the payment of principal or interest by the U.S. Treasury, such as those issued by Fannie Mae, Freddie Mac, and the Federal Home Loan Banks, are subject to greater credit risk than are U.S. Government securities supported by the U.S. Treasury, such as those issued by Ginnie Mae. The fund invests in foreign securities. Investments in foreign securities are vulnerable to the effects of changes in the relative values of the local currency and the U.S. dollar and to the effects of changes in each country’s legal, political, and economic environment.
In this reporting period, the fund adopted the disclosure provisions of the Financial Accounting Standards Board (FASB) Accounting Standards Update 2011-11 (“ASU 2011-11”), Balance Sheet (Topic 210) – Disclosures about Offsetting Assets and Liabilities along with the related scope clarification provisions of FASB Accounting Standards Update 2013-01 (“ASU 2013-01”) entitled Balance Sheet (Topic 210) – Clarifying the Scope of Disclosures about Offsetting Assets and Liabilities. ASU 2011-11 is intended to enhance disclosures on the offsetting of financial assets and liabilities by requiring entities to disclose both gross and net information about financial instruments and transactions that are either offset in the statement of financial position or subject to a Master Netting Agreement or similar arrangement. ASU 2013-01 limits the scope of ASU 2011-11’s disclosure requirements on offsetting to financial assets and financial liabilities related to derivatives, repurchase and reverse repurchase agreements, and securities lending and securities borrowing transactions. The disclosures required by ASU 2011-11, to the extent applicable to the fund, have been included in the fund’s Significant Accounting Policies note under the captions for each of the fund’s in-scope financial instruments and transactions.
In June 2013, FASB issued Accounting Standards Update 2013-08 Financial Services – Investment Companies (Topic 946) – Amendments to the Scope, Measurement, and Disclosure Requirements (“ASU 2013-08”) which is effective for interim and annual reporting periods in fiscal years that begin after December 15, 2013. ASU 2013-08 sets forth a methodology for determining whether an entity should be characterized as an investment company and prescribes fair value accounting for an investment company’s non-controlling ownership interest in another investment company. FASB has determined that a fund registered under the Investment Company Act of 1940 automatically meets ASU 2013-08’s criteria for an investment company. Although still evaluating the potential impacts of ASU 2013-08 to the fund, management expects that the impact of the fund’s adoption will be limited to additional financial statement disclosures.
Investment Valuations – Equity securities, including restricted equity securities, are generally valued at the last sale or official closing price as provided by a third-party pricing service on the market or exchange on which they are primarily traded. Equity securities, for which there were no sales reported that day, are generally valued at the last quoted daily bid quotation as provided by a third-party pricing service on the market or exchange on which such securities are primarily traded. Debt instruments and floating rate loans (other than short-term instruments), including restricted debt instruments, are generally valued at an evaluated or composite bid as provided by a third-party pricing service. Short-term instruments with a maturity at issuance of 60 days or less generally are valued at amortized cost, which approximates market value. Exchange-traded options are generally valued at the last sale or official closing price as provided by a third-party pricing service on the exchange on which such options are primarily traded. Exchange-traded options for which there were no sales reported that day are generally valued at the last daily bid quotation as provided by a third-party pricing service on the exchange on which such options are primarily traded. Options not traded on an exchange are generally valued at a broker/dealer bid quotation. Foreign currency options are generally valued at valuations provided by a third-party pricing service. Futures contracts are generally valued at last posted settlement price as provided by a third-party pricing service on the market on which they are primarily traded. Futures contracts for which there were no trades that day for a particular position are generally valued at the closing bid quotation as provided by a third-party pricing service on the market on
21
MFS Global Tactical Allocation Portfolio
Notes to Financial Statements (unaudited) – continued
which such futures contracts are primarily traded. Forward foreign currency exchange contracts are generally valued at the mean of bid and asked prices for the time period interpolated from rates provided by a third-party pricing service for proximate time periods. Open-end investment companies are generally valued at net asset value per share. Securities and other assets generally valued on the basis of information from a third-party pricing service may also be valued at a broker/dealer bid quotation. Values obtained from third-party pricing services can utilize both transaction data and market information such as yield, quality, coupon rate, maturity, type of issue, trading characteristics, and other market data. The values of foreign securities and other assets and liabilities expressed in foreign currencies are converted to U.S. dollars using the mean of bid and asked prices for rates provided by a third-party pricing service.
The Board of Trustees has delegated primary responsibility for determining or causing to be determined the value of the fund’s investments (including any fair valuation) to the adviser pursuant to valuation policies and procedures approved by the Board. If the adviser determines that reliable market quotations are not readily available, investments are valued at fair value as determined in good faith by the adviser in accordance with such procedures under the oversight of the Board of Trustees. Under the fund’s valuation policies and procedures, market quotations are not considered to be readily available for most types of debt instruments and floating rate loans and many types of derivatives. These investments are generally valued at fair value based on information from third-party pricing services. In addition, investments may be valued at fair value if the adviser determines that an investment’s value has been materially affected by events occurring after the close of the exchange or market on which the investment is principally traded (such as foreign exchange or market) and prior to the determination of the fund’s net asset value, or after the halting of trading of a specific security where trading does not resume prior to the close of the exchange or market on which the security is principally traded. Events that occur on a frequent basis after foreign markets close (such as developments in foreign markets and significant movements in the U.S. markets) and prior to the determination of the fund’s net asset value may be deemed to have a material effect on the value of securities traded in foreign markets. Accordingly, the fund’s foreign equity securities may often be valued at fair value. The adviser generally relies on third-party pricing services or other information (such as the correlation with price movements of similar securities in the same or other markets; the type, cost and investment characteristics of the security; the business and financial condition of the issuer; and trading and other market data) to assist in determining whether to fair value and at what value to fair value an investment. The value of an investment for purposes of calculating the fund’s net asset value can differ depending on the source and method used to determine value. When fair valuation is used, the value of an investment used to determine the fund’s net asset value may differ from quoted or published prices for the same investment. There can be no assurance that the fund could obtain the fair value assigned to an investment if it were to sell the investment at the same time at which the fund determines its net asset value per share.
Various inputs are used in determining the value of the fund’s assets or liabilities. These inputs are categorized into three broad levels. In certain cases, the inputs used to measure fair value may fall into different levels of the fair value hierarchy. In such cases, an investment’s level within the fair value hierarchy is based on the lowest level of input that is significant to the fair value measurement. The fund’s assessment of the significance of a particular input to the fair value measurement in its entirety requires judgment, and considers factors specific to the investment. Level 1 includes unadjusted quoted prices in active markets for identical assets or liabilities. Level 2 includes other significant observable market-based inputs (including quoted prices for similar securities, interest rates, prepayment speed, and credit risk). Level 3 includes unobservable inputs, which may include the adviser’s own assumptions in determining the fair value of investments. Other financial instruments are derivative instruments not reflected in total investments, such as futures contracts and forward foreign currency exchange contracts. The following is a summary of the levels used as of June 30, 2013 in valuing the fund’s assets or liabilities:
| | | | | | | | | | | | | | | | |
| Investments at Value | | Level 1 | | | Level 2 | | | Level 3 | | | Total | |
| Equity Securities | | | | | | | | | | | | | | | | |
United States | | | $182,568,758 | | | | $— | | | | $— | | | | $182,568,758 | |
Japan | | | 40,923,471 | | | | 10,593,446 | | | | — | | | | 51,516,917 | |
United Kingdom | | | 4,306,331 | | | | 42,413,799 | | | | — | | | | 46,720,130 | |
Switzerland | | | 2,507,561 | | | | 20,361,878 | | | | — | | | | 22,869,439 | |
Germany | | | 10,295,705 | | | | 6,952,255 | | | | — | | | | 17,247,960 | |
France | | | 7,706,678 | | | | 4,642,294 | | | | — | | | | 12,348,972 | |
Netherlands | | | — | | | | 7,060,975 | | | | — | | | | 7,060,975 | |
Sweden | | | 4,893,458 | | | | — | | | | — | | | | 4,893,458 | |
Canada | | | 4,005,864 | | | | — | | | | — | | | | 4,005,864 | |
Other Countries | | | 7,682,436 | | | | 10,261,877 | | | | — | | | | 17,944,313 | |
| U.S. Treasury Bonds & U.S. Government Agency & Equivalents | | | — | | | | 18,676,563 | | | | — | | | | 18,676,563 | |
| Non-U.S. Sovereign Debt | | | — | | | | 366,933,380 | | | | — | | | | 366,933,380 | |
| U.S. Corporate Bonds | | | — | | | | 81,812,929 | | | | — | | | | 81,812,929 | |
| Residential Mortgage-Backed Securities | | | — | | | | 77,486,648 | | | | — | | | | 77,486,648 | |
| Commercial Mortgage-Backed Securities | | | — | | | | 31,037,342 | | | | — | | | | 31,037,342 | |
22
MFS Global Tactical Allocation Portfolio
Notes to Financial Statements (unaudited) – continued
| | | | | | | | | | | | | | | | |
| Investments at Value | | Level 1 | | | Level 2 | | | Level 3 | | | Total | |
| Asset-Backed Securities (including CDOs) | | | $— | | | | $261,171 | | | | $— | | | | $261,171 | |
| Foreign Bonds | | | — | | | | 61,975,395 | | | | — | | | | 61,975,395 | |
| Mutual Funds | | | 58,921,450 | | | | — | | | | — | | | | 58,921,450 | |
| Total Investments | | | $323,811,712 | | | | $740,469,952 | | | | $— | | | | $1,064,281,664 | |
| | | | |
| Other Financial Instruments | | | | | | | | | | | | |
| Futures Contracts | | | $1,027,321 | | | | $(1,475,796 | ) | | | $— | | | | $(448,475 | ) |
| Forward Foreign Currency Exchange Contracts | | | — | | | | 6,753,966 | | | | — | | | | 6,753,966 | |
For further information regarding security characteristics, see the Portfolio of Investments.
Of the level 2 investments presented above, equity investments amounting to $10,908,388 would have been considered level 1 investments at the beginning of the period. Of the level 1 investments presented above, equity investments amounting to $64,109,685 would have been considered level 2 investments at the beginning of the period. The primary reason for changes in the classifications between levels 1 and 2 occurs when foreign equity securities are fair valued using other observable market-based inputs in place of the closing exchange price due to events occurring after the close of the exchange or market on which the investment is principally traded. The fund’s foreign equity securities may often be valued at fair value. The fund’s policy is to recognize transfers between the levels as of the end of the period.
Foreign Currency Translation – Purchases and sales of foreign investments, income, and expenses are converted into U.S. dollars based upon currency exchange rates prevailing on the respective dates of such transactions or on the reporting date for foreign denominated receivables and payables. Gains and losses attributable to foreign currency exchange rates on sales of securities are recorded for financial statement purposes as net realized gains and losses on investments. Gains and losses attributable to foreign exchange rate movements on receivables, payables, income and expenses are recorded for financial statement purposes as foreign currency transaction gains and losses. That portion of both realized and unrealized gains and losses on investments that results from fluctuations in foreign currency exchange rates is not separately disclosed.
Derivatives – The fund uses derivatives in an attempt to adjust exposure to markets, asset classes, and currencies based on the adviser’s assessment of the relative attractiveness of such markets, asset classes, and currencies. Derivatives are used to increase or decrease the fund’s exposure to markets, asset classes, or currencies resulting from the fund’s individual security selections, and to expose the fund to markets, asset classes, or currencies in which the fund’s individual security selection has resulted in little or no exposure. Derivatives are used for hedging or non-hedging purposes. While hedging can reduce or eliminate losses, it can also reduce or eliminate gains. When the fund uses derivatives as an investment to increase or decrease market exposure, or for hedging purposes, gains and losses from derivative instruments may be substantially greater than the derivative’s original cost.
The derivative instruments used by the fund were purchased options, futures contracts and forward foreign currency exchange contracts. The fund’s period end derivatives, as presented in the Portfolio of Investments generally are indicative of the volume of its derivative activity during the period.
The following table presents, by major type of derivative contract, the fair value, on a gross basis, of the asset and liability components of derivatives held by the fund at June 30, 2013 as reported in the Statement of Assets and Liabilities:
| | | | | | | | | | |
| | | | | Fair Value (a) | |
| Risk | | Derivative Contracts | | Asset Derivatives | | | Liability Derivatives | |
| Interest Rate | | Interest Rate Futures | | | $2,866,866 | | | | $— | |
| Foreign Exchange | | Forward Foreign Currency Exchange | | | 19,180,705 | | | | (12,426,739 | ) |
| Equity | | Equity Futures | | | 2,993,868 | | | | (6,309,209 | ) |
| Equity | | Purchased Equity Options | | | 1,755,000 | | | | — | |
| Total | | | | | $26,796,439 | | | | $(18,735,948 | ) |
| (a) | The value of purchased options outstanding is included in total investments, at value, within the fund’s Statement of Assets and Liabilities. The value of futures contracts outstanding includes cumulative appreciation (depreciation) as reported in the fund’s Portfolio of Investments. Only the current day variation margin for futures contracts is separately reported within the fund’s Statement of Assets and Liabilities. |
The following table presents, by major type of derivative contract, the realized gain (loss) on derivatives held by the fund for the six months ended June 30, 2013 as reported in the Statement of Operations:
| | | | | | | | | | | | |
| Risk | | Futures Contracts | | | Foreign Currency | | | Investments
(Purchased Options) | |
| Interest Rate | | | $1,656,764 | | | | $— | | | | $— | |
| Foreign Exchange | | | — | | | | 27,287,329 | | | | — | |
| Equity | | | (11,102,610 | ) | | | — | | | | (1,712,615 | ) |
| Total | | | $(9,445,846 | ) | | | $27,287,329 | | | | $(1,712,615 | ) |
23
MFS Global Tactical Allocation Portfolio
Notes to Financial Statements (unaudited) – continued
The following table presents, by major type of derivative contract, the change in unrealized appreciation (depreciation) on derivatives held by the fund for the six months ended June 30, 2013 as reported in the Statement of Operations:
| | | | | | | | | | | | |
| Risk | | Futures Contracts | | | Translation of
Assets and
Liabilities in
Foreign Currencies | | | Investments
(Purchased Options) | |
| Interest Rate | | | $3,438,245 | | | | $— | | | | $— | |
| Foreign Exchange | | | — | | | | (5,486,042 | ) | | | — | |
| Equity | | | (5,595,868 | ) | | | — | | | | 534,805 | |
| Total | | | $(2,157,623 | ) | | | $(5,486,042 | ) | | | $534,805 | |
Derivative counterparty credit risk is managed through formal evaluation of the creditworthiness of all potential counterparties. On certain, but not all, over-the-counter derivatives, the fund attempts to reduce its exposure to counterparty credit risk whenever possible by entering into an International Swaps and Derivatives Association (ISDA) Master Agreement on a bilateral basis with each of the counterparties with whom it undertakes a significant volume of transactions. The ISDA Master Agreement gives each party to the agreement the right to terminate all transactions traded under such agreement if there is a certain deterioration in the credit quality of the other party. Upon an event of default or a termination of the ISDA Master Agreement, the non-defaulting party has the right to close out all transactions traded under such agreement and to net amounts owed under each transaction to one net amount payable by one party to the other. This right to close out and net payments across all transactions traded under the ISDA Master Agreement could result in a reduction of the fund’s credit risk to such counterparty equal to any amounts payable by the fund under the applicable transactions, if any.
Collateral and margin requirements differ by type of derivative. Margin requirements are set by the broker or clearing house for cleared derivatives (i.e., futures contracts, cleared swaps, and exchange-traded options) while collateral terms are contract specific for over-the-counter traded derivatives (i.e., forward foreign currency exchange contracts, uncleared swap agreements, and over-the-counter options). For derivatives traded under an ISDA Master Agreement, the collateral requirements are netted across all transactions traded under such agreement and one amount is posted from one party to the other to collateralize such obligations. Cash that has been segregated to cover the fund’s collateral or margin obligations under derivative contracts, if any, will be reported separately in the Statement of Assets and Liabilities as “Restricted cash”. Securities pledged as collateral or margin for the same purpose, if any, is noted in the Portfolio of Investments.
The fund’s accounting policy with respect to balance sheet offsetting is that, absent an event of default by the counterparty or a termination of the agreement, the ISDA Master Agreement does not result in an offset of reported amounts of financial assets and financial liabilities in the Statement of Assets and Liabilities across transactions between the fund and the applicable counterparty.
The following table presents the fund’s derivative assets and liabilities (by type) on a gross basis as of June 30, 2013:
| | | | | | | | |
| Gross Amounts of: | | Derivative Assets | | | Derivative Liabilities | |
| Futures Contracts (a) | | | $74,835 | | | | $(1,182,778 | ) |
| Forward Foreign Currency Exchange Contracts | | | 19,180,705 | | | | (12,426,739 | ) |
| Purchased Options | | | 1,755,000 | | | | — | |
| Total Gross Amount of Derivative Assets and Liabilities Presented in the Statement of Assets & Liabilities | | | $21,010,540 | | | | $(13,609,517 | ) |
Derivatives Assets and Liabilities Not Subject to a Master Netting Agreement or Similar Arrangement | | | 2,717,694 | | | | (1,756,025 | ) |
| Total Gross Amount of Derivative Assets and Liabilities Subject to a Master Netting Agreement or Similar Arrangement | | | $18,292,846 | | | | $(11,853,492 | ) |
| (a) | The amount presented here represents the fund’s current day variation margin for futures contracts. This amount, which is recognized within the fund’s Statement of Assets and Liabilities, differs from the fair value of the futures contracts which is presented in the tables that follow the fund’s Portfolio of Investments. |
24
MFS Global Tactical Allocation Portfolio
Notes to Financial Statements (unaudited) – continued
The following table presents (by counterparty) the fund’s derivative assets net of amounts available for offset under Master Netting Agreements (or similar arrangements) and net of the related collateral held by the fund at June 30, 2013:
| | | | | | | | | | | | | | | | | | | | |
| | | | | | Amounts Not Offset in the
Statement of Assets & Liabilities | | | | |
| | | Gross Amount of
Derivative Assets Subject
to a Master Netting
Agreement (or Similar
Arrangement) by
Counterparty | | | Financial
Instruments
Available
for Offset | | | Financial
Instruments
Collateral
Received (b) | | | Cash Collateral
Received (b) | | | Net Amount of
Derivative Assets by
Counterparty | |
| Barclays Bank PLC | | | $401,335 | | | | (401,335 | ) | | | — | | | | — | | | | $— | |
| Citibank N.A. | | | 315,884 | | | | (252,147 | ) | | | — | | | | (63,737 | ) | | | — | |
| Deutsche Bank | | | 202,412 | | | | (202,412 | ) | | | — | | | | — | | | | — | |
| Goldman Sachs International | | | 2,713,341 | | | | (2,713,341 | ) | | | — | | | | — | | | | — | |
| JP Morgan Chase Bank N.A. | | | 14,030,057 | | | | (7,141,367 | ) | | | — | | | | (3,116,433 | ) | | | 3,772,257 | |
| Westpac Banking Corp. | | | 629,817 | | | | — | | | | — | | | | — | | | | 629,817 | |
| Total | | | $18,292,846 | | | | (10,710,602 | ) | | | — | | | | (3,180,170 | ) | | | $4,402,074 | |
The following table presents (by counterparty) the fund’s derivative liabilities net of amounts available for offset under Master Netting Agreements (or similar arrangements) and net of the related collateral pledged by the fund at June 30, 2013:
| | | | | | | | | | | | | | | | | | | | |
| | | | | | Amounts Not Offset in the
Statement of Assets & Liabilities | | | | |
| | | Gross Amounts of
Derivative Liabilities Subject
to a Master Netting
Agreement (or Similar
Arrangement) by
Counterparty | | | Financial
Instruments
Available
for Offset | | | Financial
Instruments
Collateral
Pledged (b) | | | Cash Collateral
Pledged (b) | | | Net Amount of
Derivative Liabilities
by Counterparty | |
| Barclays Bank PLC | | | $(582,113 | ) | | | 401,335 | | | | — | | | | 10,000 | | | | $(170,778 | ) |
| Citibank N.A. | | | (252,147 | ) | | | 252,147 | | | | — | | | | — | | | | — | |
| Deutsche Bank | | | (870,660 | ) | | | 202,412 | | | | — | | | | 250,000 | | | | (418,248 | ) |
| Goldman Sachs International | | | (3,007,205 | ) | | | 2,713,341 | | | | — | | | | — | | | | (293,864 | ) |
| JP Morgan Chase Bank N.A. | | | (7,141,367 | ) | | | 7,141,367 | | | | — | | | | — | | | | — | |
| Total | | | $(11,853,492 | ) | | | 10,710,602 | | | | — | | | | 260,000 | | | | $(882,890 | ) |
| (b) | The amount presented here may be less than the total amount of collateral (received)/pledged as the net amount of derivative assets and liabilities for a counterparty cannot be less than $0. |
Purchased Options – The fund purchased put options for a premium. Purchased put options entitle the holder to sell a specified number of shares or units of a particular security, currency or index at a specified price at a specified date or within a specified period of time. Purchasing put options may hedge against an anticipated decline in the value of portfolio securities or currency or decrease the fund’s exposure to an underlying instrument.
The premium paid is initially recorded as an investment in the Statement of Assets and Liabilities. That investment is subsequently marked-to-market daily with the difference between the premium paid and the market value of the purchased option being recorded as unrealized appreciation or depreciation. Premiums paid for purchased put options which have expired are treated as realized losses on investments in the Statement of Operations. Upon the exercise or closing of a purchased put option, the premium paid is offset against the proceeds on the sale of the underlying security or financial instrument in order to determine the realized gain or loss on investments.
Whether or not the option is exercised, the fund’s maximum risk of loss from purchasing an option is the amount of premium paid. All option contracts involve credit risk if the counterparty to the option contract fails to perform. For over-the-counter options, this risk is mitigated in cases where there is an ISDA Master Agreement between the fund and the counterparty providing for netting as described above and for posting of collateral by the counterparty to the fund to cover the fund’s exposure to the counterparty under such ISDA Master Agreement.
Futures Contracts – The fund entered into futures contracts which may be used to hedge against or obtain broad market exposure, interest rate exposure, currency exposure, or to manage duration. A futures contract represents a commitment for the future purchase or sale of an asset at a specified price on a specified date.
Upon entering into a futures contract, the fund is required to deposit with the broker, either in cash or securities, an initial margin in an amount equal to a certain percentage of the notional amount of the contract. Subsequent payments (variation margin) are made
25
MFS Global Tactical Allocation Portfolio
Notes to Financial Statements (unaudited) – continued
or received by the fund each day, depending on the daily fluctuations in the value of the contract, and are recorded for financial statement purposes as unrealized gain or loss by the fund until the contract is closed or expires at which point the gain or loss on futures contracts is realized.
The fund bears the risk of interest rates, exchange rates or securities prices moving unexpectedly, in which case, the fund may not achieve the anticipated benefits of the futures contracts and may realize a loss. While futures contracts may present less counterparty risk to the fund since the contracts are exchange traded and the exchange’s clearinghouse guarantees payments to the broker, there is still counterparty credit risk due to the insolvency of the broker. The fund’s maximum risk of loss due to counterparty credit risk is equal to the margin posted by the fund to the broker plus any gains or minus any losses on the outstanding futures contracts.
Forward Foreign Currency Exchange Contracts – The fund entered into forward foreign currency exchange contracts for the purchase or sale of a specific foreign currency at a fixed price on a future date. These contracts may be used to hedge the fund’s currency risk or for non-hedging purposes. For hedging purposes, the fund may enter into contracts to deliver or receive foreign currency that the fund will receive from or use in its normal investment activities. The fund may also use contracts to hedge against declines in the value of foreign currency denominated securities due to unfavorable exchange rate movements. For non-hedging purposes, the fund may enter into contracts with the intent of changing the relative exposure of the fund’s portfolio of securities to different currencies to take advantage of anticipated exchange rate changes.
Forward foreign currency exchange contracts are adjusted by the daily exchange rate of the underlying currency and any unrealized gains or losses are recorded as a receivable or payable for forward foreign currency exchange contracts until the contract settlement date. On contract settlement date, any gain or loss on the contract is recorded as realized gains or losses on foreign currency.
Risks may arise upon entering into these contracts from unanticipated movements in the value of the contract and from the potential inability of counterparties to meet the terms of their contracts. Generally, the fund’s maximum risk due to counterparty credit risk is the unrealized gain on the contract due to the use of Continuous Linked Settlement, an industry accepted settlement system. This risk is mitigated in cases where there is an ISDA Master Agreement between the fund and the counterparty providing for netting as described above and for posting of collateral by the counterparty to the fund to cover the fund’s exposure to the counterparty under such ISDA Master Agreement.
Security Loans – Under its Securities Lending Agency Agreement with the fund, State Street Bank and Trust Company (“State Street”), as lending agent, loans the securities of the fund to certain qualified institutions (the “Borrowers”) approved by the fund. The loans are collateralized by cash and/or U.S. Treasury and federal agency obligations in an amount typically at least equal to the market value of the securities loaned. The market value of the loaned securities is determined at the close of business of the fund and any additional required collateral is delivered to the fund on the next business day. State Street provides the fund with indemnification against Borrower default. In the event of Borrower default, State Street will for the benefit of the fund either purchase securities identical to those loaned or, when such purchase is commercially impracticable, pay the fund the market value of the loaned securities. In return, State Street assumes the fund’s rights to the related collateral. If the collateral value is less than the cost to purchase identical securities, State Street is responsible for the shortfall, but only to the extent that such shortfall is not due to a decline in collateral value resulting from collateral reinvestment for which the fund bears the risk of loss. On loans collateralized by cash, the cash collateral is invested in a money market fund or short-term securities.
A portion of the income generated upon investment of the collateral is remitted to the Borrowers, and the remainder is allocated between the fund and the lending agent. On loans collateralized by U.S. Treasury and/or federal agency obligations, a fee is received from the Borrower, and is allocated between the fund and the lending agent. Income from securities lending is included in “Interest” income in the Statement of Operations. The dividend and interest income earned on the securities loaned is accounted for in the same manner as other dividend and interest income.
Indemnifications – Under the fund’s organizational documents, its officers and Trustees may be indemnified against certain liabilities and expenses arising out of the performance of their duties to the fund. Additionally, in the normal course of business, the fund enters into agreements with service providers that may contain indemnification clauses. The fund’s maximum exposure under these agreements is unknown as this would involve future claims that may be made against the fund that have not yet occurred.
Investment Transactions and Income – Investment transactions are recorded on the trade date. Interest income is recorded on the accrual basis. All premium and discount is amortized or accreted for financial statement purposes in accordance with U.S. generally accepted accounting principles. Dividends received in cash are recorded on the ex-dividend date. Certain dividends from foreign securities will be recorded when the fund is informed of the dividend if such information is obtained subsequent to the ex-dividend date. Dividend and interest payments received in additional securities are recorded on the ex-dividend or ex-interest date in an amount equal to the value of the security on such date.
The fund may receive proceeds from litigation settlements. Any proceeds received from litigation involving portfolio holdings are reflected in the Statement of Operations in realized gain/loss if the security has been disposed of by the fund or in unrealized gain/loss if the security is still held by the fund. Any other proceeds from litigation not related to portfolio holdings are reflected as other income in the Statement of Operations.
26
MFS Global Tactical Allocation Portfolio
Notes to Financial Statements (unaudited) – continued
The fund purchased or sold debt securities on a when-issued or delayed delivery basis, or in a “To Be Announced” (TBA) or “forward commitment” transaction with delivery or payment to occur at a later date beyond the normal settlement period. TBA securities resulting from these transactions are included in the Portfolio of Investments. At the time a fund enters into a commitment to purchase or sell a security, the transaction is recorded and the value of the security acquired is reflected in the fund’s net asset value. The price of such security and the date that the security will be delivered and paid for are fixed at the time the transaction is negotiated. The value of the security may vary with market fluctuations. TBA purchase commitments are held at carrying amount, which approximates fair value and are categorized as level 2 within the fair value hierarchy disclosure. No interest accrues to the fund until payment takes place. At the time that a fund enters into this type of transaction, the fund is required to have sufficient cash and/or liquid securities to cover its commitments. Losses may arise due to changes in the value of the underlying securities or if the counterparty does not perform under the contract’s terms, or if the issuer does not issue the securities due to political, economic or other factors. Additionally, losses may arise due to declines in the value of the securities prior to settlement date.
Fees Paid Indirectly – The fund’s custody fee may be reduced according to an arrangement that measures the value of cash deposited with the custodian by the fund. This amount, for the six months ended June 30, 2013, is shown as a reduction of total expenses in the Statement of Operations.
Tax Matters and Distributions – The fund intends to qualify as a regulated investment company, as defined under Subchapter M of the Internal Revenue Code, and to distribute all of its taxable income, including realized capital gains. As a result, no provision for federal income tax is required. The fund’s federal tax returns, when filed, will remain subject to examination by the Internal Revenue Service for a three year period. Foreign taxes have been accrued by the fund in the accompanying financial statements in accordance with the applicable foreign tax law. Foreign income taxes may be withheld by certain countries in which the fund invests.
Distributions to shareholders are recorded on the ex-dividend date. Income and capital gain distributions are determined in accordance with income tax regulations, which may differ from U.S. generally accepted accounting principles. Certain capital accounts in the financial statements are periodically adjusted for permanent differences in order to reflect their tax character. These adjustments have no impact on net assets or net asset value per share. Temporary differences which arise from recognizing certain items of income, expense, gain or loss in different periods for financial statement and tax purposes will reverse at some time in the future. Distributions in excess of net investment income or net realized gains are temporary overdistributions for financial statement purposes resulting from differences in the recognition or classification of income or distributions for financial statement and tax purposes.
Book/tax differences primarily relate to amortization and accretion of debt securities, wash sale loss deferrals, straddle loss deferrals and derivative transactions.
The tax character of distributions made during the current period will be determined at fiscal year end. The tax character of distributions declared to shareholders for the last fiscal year is as follows:
| | | | |
| | | 12/31/12 | |
| Ordinary income (including any short-term capital gains) | | | $18,750,120 | |
The federal tax cost and the tax basis components of distributable earnings were as follows:
| | | | |
| As of 6/30/13 | | | | |
| Cost of investments | | | $993,912,118 | |
| Gross appreciation | | | 98,696,969 | |
| Gross depreciation | | | (28,327,423 | ) |
| Net unrealized appreciation (depreciation) | | | $70,369,546 | |
| |
| As of 12/31/12 | | | | |
| Undistributed ordinary income | | | 25,034,765 | |
| Capital loss carryforwards | | | (12,367,899 | ) |
| Other temporary differences | | | (9,417,912 | ) |
| Net unrealized appreciation (depreciation) | | | 74,174,827 | |
The aggregate cost above includes prior fiscal year end tax adjustments, if applicable.
Under the Regulated Investment Company Modernization Act of 2010 (the “Act”), net capital losses recognized for fund fiscal years beginning after December 31, 2010 may be carried forward indefinitely, and their character is retained as short-term and/or long-term losses (“post-enactment losses”). Previously, net capital losses were carried forward for eight years and treated as short-term losses (“pre-enactment losses”). As a transition rule, the Act requires that all post-enactment net capital losses be used before pre-enactment net capital losses.
27
MFS Global Tactical Allocation Portfolio
Notes to Financial Statements (unaudited) – continued
As of December 31, 2012, the fund had capital loss carryforwards available to offset future realized gains. Such post-enactment losses are characterized as follows:
| | | | |
| Short-Term | | | $(8,510,865 | ) |
| Long-Term | | | (3,857,034 | ) |
| Total | | | $(12,367,899 | ) |
Multiple Classes of Shares of Beneficial Interest – The fund offers multiple classes of shares, which differ in their respective distribution and/or service fees. The fund’s income, realized and unrealized gain (loss), and common expenses are allocated to shareholders based on the daily net assets of each class. Dividends are declared separately for each class. Differences in per share dividend rates are generally due to differences in separate class expenses. The fund’s distributions declared to shareholders as reported in the Statements of Changes in Net Assets are presented by class as follows:
| | | | | | | | |
| | | From net investment
income | |
| | | Six months ended
6/30/13 | | | Year ended
12/31/12 | |
| Initial Class | | | $— | | | | $1,419,916 | |
| Service Class | | | — | | | | 17,330,204 | |
| Total | | | $— | | | | $18,750,120 | |
| (3) | | Transactions with Affiliates |
Investment Adviser – The fund has an investment advisory agreement with MFS to provide overall investment management and related administrative services and facilities to the fund. The management fee is computed daily and paid monthly at the following annual rates:
| | | | |
| First $300 million of average daily net assets | | | 0.75% | |
| Average daily net assets in excess of $300 million | | | 0.675% | |
Effective April 1, 2013, MFS has agreed in writing to reduce its management fee by a specified amount if certain MFS mutual fund assets exceed thresholds agreed to by MFS and the fund’s Board of Trustees. For the period April 1, 2013 through June 30, 2013, this management fee reduction amounted to $1,459, which is shown as a reduction of total expenses in the Statement of Operations. The management fee incurred for the six months ended June 30, 2013 was equivalent to an annual effective rate 0.70% of the fund’s average daily net assets.
The investment adviser has agreed in writing to pay a portion of the fund’s total annual operating expenses, exclusive of interest, taxes, extraordinary expenses, brokerage and transaction costs, and investment-related expenses, such that total annual operating expenses do not exceed 0.90% of average daily net assets for the Initial Class shares and 1.15% of average daily net assets for the Service Class shares. This written agreement will continue until modified by the fund’s Board of Trustees, but such agreement will continue at least until April 30, 2015. For the six months ended June 30, 2013, the fund’s actual operating expenses did not exceed the limit and therefore, the investment adviser did not pay any portion of the fund’s expenses related to this agreement.
Distributor – MFS Fund Distributors, Inc. (MFD), a wholly-owned subsidiary of MFS, is the distributor of shares of the fund. The Trustees have adopted a distribution plan for the Service Class shares pursuant to Rule 12b-1 under the Investment Company Act of 1940.
The fund’s distribution plan provides that the fund will pay MFD distribution and/or service fees equal to 0.25% per annum of its average daily net assets attributable to Service Class shares as partial consideration for services performed and expenses incurred by MFD and financial intermediaries (including participating insurance companies that invest in the fund to fund variable annuity and variable life insurance contracts, sponsors of qualified retirement and pension plans that invest in the fund, and affiliates of these participating insurance companies and plan sponsors) in connection with the sale and distribution of the Service Class shares. MFD may subsequently pay all, or a portion, of the distribution and/or service fees to financial intermediaries.
Shareholder Servicing Agent – MFS Service Center, Inc. (MFSC), a wholly-owned subsidiary of MFS, receives a fee from the fund for its services as shareholder servicing agent. For the six months ended June 30, 2013, the fee was $24,012, which equated to 0.0045% annually of the fund’s average daily net assets. MFSC also receives payment from the fund for out-of-pocket expenses paid by MFSC on behalf of the fund. For the six months ended June 30, 2013, these costs amounted to $7.
Administrator – MFS provides certain financial, legal, shareholder communications, compliance, and other administrative services to the fund. Under an administrative services agreement, the fund partially reimburses MFS the costs incurred to provide these services. The fund is charged an annual fixed amount of $17,500 plus a fee based on average daily net assets. The administrative services fee incurred for the six months ended June 30, 2013 was equivalent to an annual effective rate of 0.0135% of the fund’s average daily net assets.
28
MFS Global Tactical Allocation Portfolio
Notes to Financial Statements (unaudited) – continued
Trustees’ and Officers’ Compensation – The fund pays compensation to independent Trustees in the form of a retainer, attendance fees, and additional compensation to Board and Committee chairpersons. The fund does not pay compensation directly to Trustees or officers of the fund who are also officers of the investment adviser, all of whom receive remuneration for their services to the fund from MFS. Certain officers and Trustees of the fund are officers or directors of MFS, MFD, and MFSC.
Other – This fund and certain other funds managed by MFS (the funds) have entered into services agreements (the Agreements) which provide for payment of fees by the funds to Tarantino LLC and Griffin Compliance LLC in return for the provision of services of an Independent Chief Compliance Officer (ICCO) and Assistant ICCO, respectively, for the funds. The ICCO and Assistant ICCO are officers of the funds and the sole members of Tarantino LLC and Griffin Compliance LLC, respectively. The funds can terminate the Agreements with Tarantino LLC and Griffin Compliance LLC at any time under the terms of the Agreements. For the six months ended June 30, 2013, the aggregate fees paid by the fund to Tarantino LLC and Griffin Compliance LLC were $4,120 and are included in “Miscellaneous” expense in the Statement of Operations . MFS has agreed to reimburse the fund for a portion of the payments made by the fund in the amount of $2,043, which is shown as a reduction of total expenses in the Statement of Operations. Additionally, MFS has agreed to bear all expenses associated with office space, other administrative support, and supplies provided to the ICCO and Assistant ICCO.
The fund invests in the MFS Institutional Money Market Portfolio which is managed by MFS and seeks current income consistent with preservation of capital and liquidity. Income earned on this investment is included in “Dividends from underlying affiliated funds” in the Statement of Operations. This money market fund does not pay a management fee to MFS.
Purchases and sales of investments, other than purchased option transactions and short-term obligations, were as follows:
| | | | | | | | |
| | | Purchases | | | Sales | |
| U.S. Government securities | | | $107,192,122 | | | | $124,062,567 | |
| Investments (non-U.S. Government securities) | | | $273,085,797 | | | | $250,508,400 | |
| (5) | | Shares of Beneficial Interest |
The fund’s Declaration of Trust permits the Trustees to issue an unlimited number of full and fractional shares of beneficial interest. Transactions in fund shares were as follows:
| | | | | | | | | | | | | | | | |
| | | Six months ended 6/30/13 | | | Year ended 12/31/12 | |
| | | Shares | | | Amount | | | Shares | | | Amount | |
| Shares sold | | | | | | | | | | | | | | | | |
Initial Class | | | 82,712 | | | | $1,301,798 | | | | 106,254 | | | | $1,569,305 | |
Service Class | | | 475,390 | | | | 7,356,517 | | | | 2,551,791 | | | | 36,807,230 | |
| | | 558,102 | | | | $8,658,315 | | | | 2,658,045 | | | | $38,376,535 | |
| Shares issued to shareholders in reinvestment of distributions | | | | | | | | | | | | | | | | |
Initial Class | | | — | | | | $— | | | | 96,923 | | | | $1,419,916 | |
Service Class | | | — | | | | — | | | | 1,196,838 | | | | 17,330,204 | |
| | | — | | | | $— | | | | 1,293,761 | | | | $18,750,120 | |
| Shares reacquired | | | | | | | | | | | | | | | | |
Initial Class | | | (261,733 | ) | | | $(4,116,859 | ) | | | (844,895 | ) | | | $(12,446,323 | ) |
Service Class | | | (3,127,808 | ) | | | (48,446,252 | ) | | | (3,468,462 | ) | | | (50,744,264 | ) |
| | | (3,389,541 | ) | | | $(52,563,111 | ) | | | (4,313,357 | ) | | | $(63,190,587 | ) |
| Net change | | | | | | | | | | | | | | | | |
Initial Class | | | (179,021 | ) | | | $(2,815,061 | ) | | | (641,718 | ) | | | $(9,457,102 | ) |
Service Class | | | (2,652,418 | ) | | | (41,089,735 | ) | | | 280,167 | | | | 3,393,170 | |
| | | (2,831,439 | ) | | | $(43,904,796 | ) | | | (361,551 | ) | | | $(6,063,932 | ) |
The fund and certain other funds managed by MFS participate in a $1.1 billion unsecured committed line of credit, subject to a $1 billion sublimit, provided by a syndication of banks under a credit agreement. Borrowings may be made for temporary financing needs. Interest is charged to each fund, based on its borrowings, generally at a rate equal to the higher of the Federal Reserve funds rate or one month LIBOR plus an agreed upon spread. A commitment fee, based on the average daily, unused portion of the committed line of credit, is allocated among the participating funds at the end of each calendar quarter. In addition, the fund and other funds managed by MFS have established unsecured uncommitted borrowing arrangements with certain banks for temporary financing needs. Interest is charged to each fund, based on its borrowings, at a rate equal to the Federal Reserve funds rate plus an agreed upon spread. For the six months ended June 30, 2013, the fund’s commitment fee and interest expense were $2,714 and $0, respectively, and are included in “Miscellaneous” expense in the Statement of Operations.
29
MFS Global Tactical Allocation Portfolio
Notes to Financial Statements (unaudited) – continued
| (7) | | Transactions in Underlying Affiliated Funds – Affiliated Issuers |
An affiliated issuer may be considered one in which the fund owns 5% or more of the outstanding voting securities, or a company which is under common control. For the purposes of this report, the fund assumes the following to be an affiliated issuer:
| | | | | | | | | | | | | | | | |
| Underlying Affiliated Fund | | Beginning
Shares/Par
Amount | | | Acquisitions
Shares/Par
Amount | | | Dispositions
Shares/Par
Amount | | | Ending
Shares/Par
Amount | |
| MFS Institutional Money Market Portfolio | | | 64,672,375 | | | | 248,253,882 | | | | (254,004,807 | ) | | | 58,921,450 | |
| | | | |
| Underlying Affiliated Fund | | Realized
Gain (Loss) | | | Capital Gain
Distributions | | | Dividend
Income | | | Ending
Value | |
| MFS Institutional Money Market Portfolio | | | $— | | | | $— | | | | $36,002 | | | | $58,921,450 | |
30
MFS Global Tactical Allocation Portfolio
BOARD REVIEW OF INVESTMENT ADVISORY AGREEMENT
A discussion regarding the Board’s most recent review and renewal of the fund’s Investment Advisory Agreement with MFS will be available on or about November 1, 2013 by clicking on the fund’s name under “Variable Insurance Portfolios — VIT II” in the “Products” section of the MFS Web site (mfs.com).
PROXY VOTING POLICIES AND INFORMATION
A general description of the MFS funds’ proxy voting policies and procedures is available without charge, upon request, by calling 1-800-225-2606, by visiting the Proxy Voting section of mfs.com or by visiting the SEC’s Web site at http://www.sec.gov.
Information regarding how the fund voted proxies relating to portfolio securities during the most recent twelve-month period ended June 30 is available without charge by visiting the Proxy Voting section of mfs.com or by visiting the SEC’s Web site at http://www.sec.gov.
QUARTERLY PORTFOLIO DISCLOSURE
The fund will file a complete schedule of portfolio holdings with the Securities and Exchange Commission (the Commission) for the first and third quarters of each fiscal year on Form N-Q. The fund’s Form N-Q is available on the EDGAR database on the Commission’s Internet Web site at http://www.sec.gov, and may be reviewed and copied at the:
Public Reference Room
Securities and Exchange Commission
100 F Street, NE, Room 1580
Washington, D.C. 20549
Information on the operation of the Public Reference Room may be obtained by calling the Commission at 1-800-SEC-0330. Copies of the fund’s Form N-Q also may be obtained, upon payment of a duplicating fee, by electronic request at the following e-mail address: publicinfo@sec.gov or by writing the Public Reference Section at the above address.
FURTHER INFORMATION
From time to time, MFS may post important information about the fund or the MFS funds on the MFS web site (mfs.com). This information is available by visiting the “News & Commentary” section of mfs.com or by clicking on the fund’s name under “Variable Insurance Portfolios — VIT II” in the “Products” section of mfs.com.
31
SEMIANNUAL REPORT
June 30, 2013

MFS® INTERNATIONAL GROWTH PORTFOLIO
MFS® Variable Insurance Trust II

FCI-SEM
MFS® INTERNATIONAL GROWTH PORTFOLIO
CONTENTS
The report is prepared for the general information of contract owners. It is authorized for distribution to prospective investors only when preceded or accompanied by a current prospectus.
NOT FDIC INSURED Ÿ MAY LOSE VALUE Ÿ NO BANK OR CREDIT UNION GUARANTEE Ÿ NOT A DEPOSIT Ÿ NOT INSURED BY ANY FEDERAL GOVERNMENT AGENCY OR NCUA/NCUSIF
MFS International Growth Portfolio
LETTER FROM THE CHAIRMAN AND CEO

Dear Contract Owners:
As the year progresses, the global economy continues to grind ahead slowly, held back by broad austerity measures. The U.S. economy remains a steadying force, driven by resilient consumers, who have taken the payroll tax increase and the sequestration’s early impact in stride. With U.S. housing and jobs showing steady expansion, domestic consumer-driven growth has offset weaker exports and the U.S. government’s spending constraints. In response to these developments, the U.S. Federal Reserve has begun to brace investors for an eventual shift in its monetary policy, causing global market tremors.
Japan has been another bright spot, with government and central bank stimulus policies leading to increased exports, a resurgent stock market and improved economic sentiment. After a six-month rally, Japan’s stocks slipped late in the second quarter, then picked up momentum on fresh signs that the country could soon break free of its chronic deflation. The major deterrent to global growth remains the eurozone, still in the grip of persistent recession. China has seen its pace of economic growth decelerate, a troubling turn for the country’s trading partners, who have come to rely on it as an engine for global growth.
As always, managing risk in the face of uncertainty remains a top priority for investors. At MFS®, our uniquely collaborative investment process employs integrated, global research and active risk management. Our global team of investment professionals shares ideas and evaluates opportunities across continents, investment disciplines and asset classes — all with a goal of building better insights, and ultimately better results, for our clients.
We are mindful of the many economic challenges investors face, and believe it is more important than ever to maintain a long-term view and employ time-tested principles, such as asset allocation and diversification. We remain confident that our unique approach can serve investors well as they work with their financial advisors to identify and pursue the most suitable opportunities.
Respectfully,

Robert J. Manning
Chairman and Chief Executive Officer
MFS Investment Management®
August 16, 2013
The opinions expressed in this letter are subject to change, may not be relied upon for investment advice, and no forecasts can be guaranteed.
1
MFS International Growth Portfolio
PORTFOLIO COMPOSITION
Portfolio structure
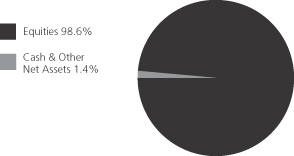
| | | | |
| Top ten holdings | | | | |
| Groupe Danone | | | 3.2% | |
| LVMH Moet Hennessy Louis Vuitton S.A. | | | 2.9% | |
| Japan Tobacco, Inc. | | | 2.5% | |
| Nestle S.A. | | | 2.4% | |
| Compass Group PLC | | | 2.4% | |
| Honda Motor Co. Ltd. | | | 2.4% | |
| Reckitt Benckiser Group PLC | | | 2.1% | |
| Diageo PLC | | | 2.0% | |
| Linde AG | | | 1.9% | |
| Pernod Ricard S.A. | | | 1.9% | |
| |
| Equity sectors | | | | |
| Consumer Staples | | | 20.1% | |
| Retailing | | | 11.2% | |
| Financial Services | | | 10.0% | |
| Special Products & Services | | | 9.3% | |
| Technology | | | 9.1% | |
| Health Care | | | 8.3% | |
| Industrial Goods & Services | | | 7.2% | |
| Basic Materials | | | 7.1% | |
| Energy | | | 4.4% | |
| Transportation | | | 4.1% | |
| Autos & Housing | | | 3.8% | |
| Leisure | | | 2.5% | |
| Utilities & Communications | | | 1.5% | |
| | | | |
| Issuer country weightings (x) | | | | |
| United Kingdom | | | 18.2% | |
| France | | | 14.9% | |
| Japan | | | 11.8% | |
| Switzerland | | | 9.5% | |
| Germany | | | 8.4% | |
| United States | | | 4.1% | |
| Canada | | | 4.0% | |
| Hong Kong | | | 3.9% | |
| Brazil | | | 3.6% | |
| Other Countries | | | 21.6% | |
| |
| Currency exposure weightings (y) | | | | |
| Euro | | | 29.1% | |
| British Pound Sterling | | | 18.2% | |
| Japanese Yen | | | 11.8% | |
| Swiss Franc | | | 9.5% | |
| United States Dollar | | | 9.2% | |
| Hong Kong Dollar | | | 4.9% | |
| Brazilian Real | | | 3.6% | |
| Canadian Dollar | | | 2.2% | |
| Danish Krone | | | 2.1% | |
| Other Currencies | | | 9.4% | |
| (x) | Represents the portfolio’s exposure to issuer countries as a percentage of a portfolio’s net assets. |
| (y) | Represents the portfolio’s exposure to a particular currency as a percentage of a portfolio’s net assets. |
Percentages are based on net assets as of 6/30/13.
The portfolio is actively managed and current holdings may be different.
2
MFS International Growth Portfolio
EXPENSE TABLE
Fund Expenses Borne by the Contract Holders During the Period,
January 1, 2013 through June 30, 2013
As a contract holder of the fund, you incur ongoing costs, including management fees; distribution and/or service (12b-1) fees; and other fund expenses. This example is intended to help you understand your ongoing costs (in dollars) of investing in the fund and to compare these costs with the ongoing costs of investing in other mutual funds.
The example is based on an investment of $1,000 invested at the beginning of the period and held for the entire period January 1, 2013 through June 30, 2013.
Actual Expenses
The first line for each share class in the following table provides information about actual account values and actual expenses. You may use the information in this line, together with the amount you invested, to estimate the expenses that you paid over the period. Simply divide your account value by $1,000 (for example, an $8,600 account value divided by $1,000 = 8.6), then multiply the result by the number in the first line under the heading entitled “Expenses Paid During Period” to estimate the expenses you paid on your account during this period.
Hypothetical Example for Comparison Purposes
The second line for each share class in the following table provides information about hypothetical account values and hypothetical expenses based on the fund’s actual expense ratio and an assumed rate of return of 5% per year before expenses, which is not the fund’s actual return. The hypothetical account values and expenses may not be used to estimate the actual ending account balance or expenses you paid for the period. You may use this information to compare the ongoing costs of investing in the fund and other funds. To do so, compare this 5% hypothetical example with the 5% hypothetical examples that appear in the shareholder reports of the other funds.
Please note that the expenses shown in the table are meant to highlight the fund’s ongoing costs only and do not take into account the fees and expenses imposed under the variable contracts through which your investment in the fund is made. Therefore, the second line for each share class in the table is useful in comparing ongoing costs associated with an investment in vehicles (such as the fund) which fund benefits under variable annuity and variable life insurance contracts and to qualified pension and retirement plans only, and will not help you determine the relative total costs of investing in the fund through variable annuity and variable life insurance contracts. If the fees and expenses imposed under the variable contracts were included, your costs would have been higher.
| | | | | | | | | | | | | | | | | | |
| Share Class | | | | Annualized Expense Ratio | | | Beginning Account Value 1/01/13 | | | Ending Account Value 6/30/13 | | | Expenses Paid During Period (p)
1/01/13-6/30/13 | |
| Initial Class | | Actual | | | 1.03% | | | | $1,000.00 | | | | $1,006.84 | | | | $5.13 | |
| | Hypothetical (h) | | | 1.03% | | | | $1,000.00 | | | | $1,019.69 | | | | $5.16 | |
| Service Class | | Actual | | | 1.28% | | | | $1,000.00 | | | | $1,006.13 | | | | $6.37 | |
| | Hypothetical (h) | | | 1.28% | | | | $1,000.00 | | | | $1,018.45 | | | | $6.41 | |
| (h) | 5% class return per year before expenses. |
| (p) | Expenses paid are equal to each class’s annualized expense ratio, as shown above, multiplied by the average account value over the period, multiplied by the number of days in the period, divided by the number of days in the year. |
3
MFS International Growth Portfolio
PORTFOLIO OF INVESTMENTS – 6/30/13 (unaudited)
The Portfolio of Investments is a complete list of all securities owned by your fund. It is categorized by broad-based asset classes.
| | | | | | | | |
| Issuer | | Shares/Par | | | Value ($) | |
| | | | | | | | |
| COMMON STOCKS – 98.6% | | | | | | | | |
| Aerospace – 1.3% | | | | | | | | |
| Rolls-Royce Holdings PLC | | | 145,567 | | | $ | 2,518,656 | |
| | | | | | | | |
| Airlines – 1.4% | | | | | | | | |
| Copa Holdings S.A., “A” | | | 21,425 | | | $ | 2,809,246 | |
| | | | | | | | |
| Alcoholic Beverages – 7.0% | | | | | | | | |
| Carlsberg A.S., “B” | | | 26,453 | | | $ | 2,361,095 | |
| Companhia de Bebidas das Americas, ADR | | | 23,480 | | | | 876,978 | |
| Diageo PLC | | | 139,737 | | | | 4,008,109 | |
| Heineken N.V. | | | 47,534 | | | | 3,021,853 | |
| Pernod Ricard S.A. | | | 34,473 | | | | 3,822,625 | |
| | | | | | | | |
| | | | | | $ | 14,090,660 | |
| | | | | | | | |
| Apparel Manufacturers – 6.2% | | | | | | | | |
| Adidas AG | | | 11,277 | | | $ | 1,218,853 | |
| Cia.Hering S.A. | | | 67,000 | | | | 939,835 | |
| Compagnie Financiere Richemont S.A. | | | 23,956 | | | | 2,101,459 | |
| Li & Fung Ltd. | | | 1,869,200 | | | | 2,548,956 | |
| LVMH Moet Hennessy Louis Vuitton S.A. | | | 35,978 | | | | 5,793,766 | |
| | | | | | | | |
| | | | | | $ | 12,602,869 | |
| | | | | | | | |
| Automotive – 3.4% | | | | | | | | |
| Guangzhou Automobile Group Co. Ltd., “H” | | | 1,116,000 | | | $ | 1,050,026 | |
| Honda Motor Co. Ltd. | | | 127,900 | | | | 4,752,082 | |
| Toyota Motor Corp. | | | 18,800 | | | | 1,135,431 | |
| | | | | | | | |
| | | | | | $ | 6,937,539 | |
| | | | | | | | |
| Broadcasting – 1.1% | | | | | | | | |
| Publicis Groupe S.A. | | | 32,176 | | | $ | 2,281,614 | |
| | | | | | | | |
| Brokerage & Asset Managers – 1.1% | | | | | | | | |
| Aberdeen Asset Management PLC | | | 199,669 | | | $ | 1,155,869 | |
| BM&F Bovespa S.A. | | | 192,200 | | | | 1,064,643 | |
| | | | | | | | |
| | | | | | $ | 2,220,512 | |
| | | | | | | | |
| Business Services – 9.3% | | | | | | | | |
| Accenture PLC, “A” | | | 41,400 | | | $ | 2,979,144 | |
| Amadeus IT Holding S.A. | | | 51,690 | | | | 1,652,116 | |
| Brenntag AG | | | 16,325 | | | | 2,479,808 | |
| Capita Group PLC | | | 178,069 | | | | 2,623,626 | |
| Compass Group PLC | | | 375,830 | | | | 4,816,485 | |
| Experian Group Ltd. | | | 127,852 | | | | 2,217,534 | |
| Intertek Group PLC | | | 29,528 | | | | 1,315,755 | |
| LPS Brasil – Consultoria de Imoveis S.A. | | | 77,800 | | | | 631,089 | |
| | | | | | | | |
| | | | | | $ | 18,715,557 | |
| | | | | | | | |
| Computer Software – 2.8% | | | | | | | | |
| Dassault Systems S.A. | | | 8,875 | | | $ | 1,085,670 | |
| OBIC Co. Ltd. | | | 8,180 | | | | 2,140,260 | |
| SAP AG | | | 32,487 | | | | 2,379,049 | |
| | | | | | | | |
| | | | | | $ | 5,604,979 | |
| | | | | | | | |
| Computer Software – Systems – 0.9% | | | | | |
| NICE Systems Ltd., ADR | | | 49,410 | | | $ | 1,822,735 | |
| | | | | | | | |
| | | | | | | | |
| Issuer | | Shares/Par | | | Value ($) | |
| | | | | | | | |
| COMMON STOCKS – continued | |
| Construction – 0.4% | | | | | | | | |
| Bellway PLC | | | 36,101 | | | $ | 699,344 | |
| | | | | | | | |
| Consumer Products – 4.4% | | | | | | | | |
| L’Oreal S.A. | | | 14,350 | | | $ | 2,346,252 | |
| Reckitt Benckiser Group PLC | | | 59,132 | | | | 4,191,862 | |
| Uni-Charm Corp. | | | 42,500 | | | | 2,403,962 | |
| | | | | | | | |
| | | | | | $ | 8,942,076 | |
| | | | | | | | |
| Electrical Equipment – 3.2% | | | | | | | | |
| Legrand S.A. | | | 19,997 | | | $ | 924,133 | |
| Mettler-Toledo International, Inc. (a) | | | 12,267 | | | | 2,468,120 | |
| Prysmian S.p.A. | | | 40,810 | | | | 758,771 | |
| Schneider Electric S.A. | | | 32,311 | | | | 2,329,474 | |
| | | | | | | | |
| | | | | | $ | 6,480,498 | |
| | | | | | | | |
| Electronics – 3.0% | | | | | | | | |
| Samsung Electronics Co. Ltd. | | | 1,984 | | | $ | 2,331,359 | |
| Taiwan Semiconductor Manufacturing Co. Ltd., ADR | | | 206,800 | | | | 3,788,576 | |
| | | | | | | | |
| | | | | | $ | 6,119,935 | |
| | | | | | | | |
| Energy – Independent – 0.9% | | | | | | | | |
| INPEX Corp. | | | 419 | | | $ | 1,751,660 | |
| | | | | | | | |
| Energy – Integrated – 2.4% | | | | | | | | |
| BG Group PLC | | | 222,822 | | | $ | 3,802,901 | |
| Suncor Energy, Inc. | | | 38,436 | | | | 1,132,943 | |
| | | | | | | | |
| | | | | | $ | 4,935,844 | |
| | | | | | | | |
| Food & Beverages – 6.2% | | | | | | | | |
| Groupe Danone | | | 86,273 | | | $ | 6,475,057 | |
| M. Dias Branco S.A. Industria e Comercio de Alimentos | | | 27,100 | | | | 1,014,117 | |
| Nestle S.A. | | | 75,208 | | | | 4,919,086 | |
| | | | | | | | |
| | | | | | $ | 12,408,260 | |
| | | | | | | | |
| Food & Drug Stores – 2.7% | | | | | | | | |
| Dairy Farm International Holdings Ltd. | | | 82,800 | | | $ | 996,044 | |
| Lawson, Inc. | | | 31,300 | | | | 2,389,000 | |
| Shoppers Drug Mart Corp. | | | 17,930 | | | | 827,197 | |
| Sundrug Co. Ltd. | | | 27,700 | | | | 1,175,812 | |
| | | | | | | | |
| | | | | | $ | 5,388,053 | |
| | | | | | | | |
| Gaming & Lodging – 0.7% | | | | | | | | |
| Sands China Ltd. | | | 311,600 | | | $ | 1,455,414 | |
| | | | | | | | |
| General Merchandise – 1.2% | | | | | | | | |
| Dollarama, Inc. | | | 27,640 | | | $ | 1,934,563 | |
| Lojas Renner S.A. | | | 19,700 | | | | 564,598 | |
| | | | | | | | |
| | | | | | $ | 2,499,161 | |
| | | | | | | | |
| Insurance – 1.4% | | | | | | | | |
| AIA Group Ltd. | | | 662,200 | | | $ | 2,782,939 | |
| | | | | | | | |
4
MFS International Growth Portfolio
Portfolio of Investments (unaudited) – continued
| | | | | | | | |
| Issuer | | Shares/Par | | | Value ($) | |
| | | | | | | | |
| COMMON STOCKS – continued | |
| Internet – 1.4% | | | | | | | | |
| NHN Corp. | | | 4,359 | | | $ | 1,110,736 | |
| Yahoo Japan Corp. | | | 3,613 | | | | 1,785,344 | |
| | | | | | | | |
| | | | | | $ | 2,896,080 | |
| | | | | | | | |
| Machinery & Tools – 2.7% | | | | | | | | |
| KONE Oyj “B” | | | 17,163 | | | $ | 1,360,538 | |
| Schindler Holding AG | | | 12,496 | | | | 1,738,069 | |
| Weir Group PLC | | | 72,810 | | | | 2,393,558 | |
| | | | | | | | |
| | | | | | $ | 5,492,165 | |
| | | | | | | | |
| Major Banks – 2.0% | | | | | | | | |
| HSBC Holdings PLC | | | 165,406 | | | $ | 1,715,736 | |
| Standard Chartered PLC | | | 107,515 | | | | 2,321,228 | |
| | | | | | | | |
| | | | | | $ | 4,036,964 | |
| | | | | | | | |
| Medical & Health Technology & Services – 1.2% | | | | | |
| Fleury S.A. | | | 20,200 | | | $ | 164,761 | |
| Fresenius Medical Care AG & Co. KGaA | | | 32,322 | | | | 2,289,928 | |
| | | | | | | | |
| | | | | | $ | 2,454,689 | |
| | | | | | | | |
| Medical Equipment – 2.5% | | | | | | | | |
| Essilor International S.A. | | | 17,593 | | | $ | 1,871,839 | |
| Sonova Holding AG | | | 28,979 | | | | 3,074,158 | |
| | | | | | | | |
| | | | | | $ | 4,945,997 | |
| | | | | | | | |
| Metals & Mining – 1.4% | | | | | | | | |
| Iluka Resources Ltd. | | | 71,861 | | | $ | 648,794 | |
| Rio Tinto Ltd. | | | 44,503 | | | | 2,113,781 | |
| | | | | | | | |
| | | | | | $ | 2,762,575 | |
| | | | | | | | |
| Network & Telecom – 1.0% | | | | | | | | |
| Ericsson, Inc., “B” | | | 182,313 | | | $ | 2,064,788 | |
| | | | | | | | |
| Oil Services – 1.1% | | | | | | | | |
| Saipem S.p.A. | | | 81,427 | | | $ | 1,317,472 | |
| Technip | | | 9,520 | | | | 962,181 | |
| | | | | | | | |
| | | | | | $ | 2,279,653 | |
| | | | | | | | |
| Other Banks & Diversified Financials – 5.5% | | | | | |
| Banco Santander Chile, ADR | | | 43,360 | | | $ | 1,060,152 | |
| Bank Rakyat Indonesia | | | 1,599,500 | | | | 1,239,227 | |
| Credicorp Ltd. | | | 12,805 | | | | 1,638,528 | |
| HDFC Bank Ltd. | | | 169,959 | | | | 1,914,809 | |
| Itau Unibanco Holding S.A., ADR | | | 162,048 | | | | 2,093,660 | |
| Julius Baer Group Ltd. | | | 46,567 | | | | 1,809,565 | |
| Sberbank of Russia | | | 443,900 | | | | 1,263,220 | |
| | | | | | | | |
| | | | | | $ | 11,019,161 | |
| | | | | | | | |
| Pharmaceuticals – 4.6% | | | | | | | | |
| Bayer AG | | | 24,739 | | | $ | 2,638,269 | |
| Novo Nordisk A/S, “B” | | | 11,846 | | | | 1,844,275 | |
| Roche Holding AG | | | 14,773 | | | | 3,660,518 | |
| Santen Pharmaceutical Co. Ltd. | | | 26,800 | | | | 1,153,821 | |
| | | | | | | | |
| | | | | | $ | 9,296,883 | |
| | | | | | | | |
| | | | | | | | |
| Issuer | | Shares/Par | | | Value ($) | |
| | | | | | | | |
| COMMON STOCKS – continued | |
| Precious Metals & Minerals – 0.3% | | | | | | | | |
| Goldcorp, Inc. | | | 23,670 | | | $ | 587,868 | |
| | | | | | | | |
| Railroad & Shipping – 2.7% | | | | | | | | |
| Canadian National Railway Co. | | | 36,830 | | | $ | 3,582,454 | |
| Kuehne & Nagel, Inc. AG | | | 16,470 | | | | 1,805,761 | |
| | | | | | | | |
| | | | | | $ | 5,388,215 | |
| | | | | | | | |
| Restaurants – 0.7% | | | | | | | | |
| Whitbread PLC | | | 31,363 | | | $ | 1,462,555 | |
| | | | | | | | |
| Specialty Chemicals – 5.4% | | | | | | | | |
| Akzo Nobel N.V. | | | 21,536 | | | $ | 1,209,704 | |
| Croda International PLC | | | 39,499 | | | | 1,492,277 | |
| L’Air Liquide S.A. | | | 17,070 | | | | 2,099,982 | |
| Linde AG | | | 20,980 | | | | 3,906,566 | |
| Symrise AG | | | 53,294 | | | | 2,151,789 | |
| | | | | | | | |
| | | | | | $ | 10,860,318 | |
| | | | | | | | |
| Specialty Stores – 1.1% | | | | | | | | |
| Industria de Diseno Textil S.A. | | | 18,600 | | | $ | 2,296,141 | |
| | | | | | | | |
| Telecommunications – Wireless – 0.4% | | | | | |
| MTN Group Ltd. | | | 44,240 | | | $ | 820,613 | |
| | | | | | | | |
| Telephone Services – 1.1% | | | | | | | | |
| China Unicom (Hong Kong) Ltd. | | | 1,638,000 | | | $ | 2,156,349 | |
| | | | | | | | |
| Tobacco – 2.5% | | | | | | | | |
| Japan Tobacco, Inc. | | | 144,800 | | | $ | 5,117,204 | |
| | | | | | | | |
Total Common Stocks
(Identified Cost, $156,215,029) | | | | | | $ | 199,005,769 | |
| | | | | | | | |
| |
| MONEY MARKET FUNDS – 1.4% | | | | | |
| MFS Institutional Money Market Portfolio, 0.11%, at Cost and Net Asset Value (v) | | | 2,769,182 | | | $ | 2,769,182 | |
| | | | | | | | |
Total Investments
(Identified Cost, $158,984,211) | | | | | | $ | 201,774,951 | |
| | | | | | | | |
OTHER ASSETS, LESS
LIABILITIES – 0.0% | | | | | | | 33,269 | |
| | | | | | | | |
| Net Assets – 100.0% | | | | | | $ | 201,808,220 | |
| | | | | | | | |
| (a) | | Non-income producing security. |
| (v) | | Underlying affiliated fund that is available only to investment companies managed by MFS. The rate quoted for the MFS Institutional Money Market Portfolio is the annualized seven-day yield of the fund at period end. |
The following abbreviations are used in this report and are defined:
| ADR | | American Depositary Receipt |
| PLC | | Public Limited Company |
See Notes to Financial Statements
5
MFS International Growth Portfolio
FINANCIAL STATEMENTS | STATEMENT OF ASSETS AND LIABILITIES (unaudited)
This statement represents your fund’s balance sheet, which details the assets and liabilities comprising the total value of the fund.
| | | | | | | | |
At 6/30/13 | | | | | | | | |
Assets | | | | | | | | |
Investments – | | | | | | | | |
Non-affiliated issuers, at value (identified cost, $156,215,029) | | | $199,005,769 | | | | | |
Underlying affiliated funds, at cost and value | | | 2,769,182 | | | | | |
Total investments, at value (identified cost, $158,984,211) | | | $201,774,951 | | | | | |
Foreign currency, at value (identified cost, $46,093) | | | 45,874 | | | | | |
Receivables for | | | | | | | | |
Investments sold | | | 105,848 | | | | | |
Fund shares sold | | | 688,392 | | | | | |
Interest and dividends | | | 404,804 | | | | | |
Other assets | | | 1,558 | | | | | |
Total assets | | | | | | | $203,021,427 | |
Liabilities | | | | | | | | |
Payable to custodian | | | $147 | | | | | |
Payables for | | | | | | | | |
Investments purchased | | | 561,382 | | | | | |
Fund shares reacquired | | | 525,231 | | | | | |
Payable to affiliates | | | | | | | | |
Investment adviser | | | 20,302 | | | | | |
Shareholder servicing costs | | | 78 | | | | | |
Distribution and/or service fees | | | 814 | | | | | |
Payable for independent Trustees’ compensation | | | 1,699 | | | | | |
Deferred country tax expense payable | | | 40,787 | | | | | |
Accrued expenses and other liabilities | | | 62,767 | | | | | |
Total liabilities | | | | | | | $1,213,207 | |
Net assets | | | | | | | $201,808,220 | |
Net assets consist of | | | | | | | | |
Paid-in capital | | | $152,346,702 | | | | | |
Unrealized appreciation (depreciation) on investments and translation of assets and liabilities in foreign currencies
(net of $1,421 deferred country tax) | | | 42,784,287 | | | | | |
Accumulated net realized gain (loss) on investments and foreign currency | | | 2,018,480 | | | | | |
Undistributed net investment income | | | 4,658,751 | | | | | |
Net assets | | | | | | | $201,808,220 | |
Shares of beneficial interest outstanding | | | | | | | 15,262,247 | |
| | | | | | | | | | | | |
| | | Net assets | | | Shares
outstanding | | | Net asset value
per share | |
Initial Class | | | $172,212,601 | | | | 13,007,975 | | | | $13.24 | |
Service Class | | | 29,595,619 | | | | 2,254,272 | | | | 13.13 | |
See Notes to Financial Statements
6
MFS International Growth Portfolio
FINANCIAL STATEMENTS | STATEMENT OF OPERATIONS (unaudited)
This statement describes how much your fund earned in investment income and accrued in expenses. It also describes any gains and/or losses generated by fund operations.
| | | | | | | | |
Six months ended 6/30/13 | | | | | |
Net investment income | | | | | |
Income | | | | | | | | |
Dividends | | | $3,273,354 | | | | | |
Interest | | | 57,075 | | | | | |
Dividends from underlying affiliated funds | | | 967 | | | | | |
Foreign taxes withheld | | | (325,531 | ) | | | | |
Total investment income | | | | | | | $3,005,865 | |
Expenses | | | | | | | | |
Management fee | | | $939,689 | | | | | |
Distribution and/or service fees | | | 37,311 | | | | | |
Shareholder servicing costs | | | 3,456 | | | | | |
Administrative services fee | | | 18,590 | | | | | |
Independent Trustees’ compensation | | | 4,918 | | | | | |
Custodian fee | | | 61,502 | | | | | |
Shareholder communications | | | 4,803 | | | | | |
Audit and tax fees | | | 27,339 | | | | | |
Legal fees | | | 1,756 | | | | | |
Miscellaneous | | | 10,711 | | | | | |
Total expenses | | | | | | | $1,110,075 | |
Fees paid indirectly | | | (25 | ) | | | | |
Reduction of expenses by investment adviser | | | (682 | ) | | | | |
Net expenses | | | | | | | $1,109,368 | |
Net investment income | | | | | | | $1,896,497 | |
Realized and unrealized gain (loss) on investments and foreign currency | | | | | | | | |
Realized gain (loss) (identified cost basis) | | | | | | | | |
Investments (net of $141,388 country tax) | | | $5,103,680 | | | | | |
Foreign currency | | | (48,402 | ) | | | | |
Net realized gain (loss) on investments and foreign currency | | | | | | | $5,055,278 | |
Change in unrealized appreciation (depreciation) | | | | | | | | |
Investments (net of $301,838 decrease in deferred country tax) | | | $(5,140,362 | ) | | | | |
Translation of assets and liabilities in foreign currencies | | | (3,312 | ) | | | | |
Net unrealized gain (loss) on investments and foreign currency translation | | | | | | | $(5,143,674 | ) |
Net realized and unrealized gain (loss) on investments and foreign currency | | | | | | | $(88,396 | ) |
Change in net assets from operations | | | | | | | $1,808,101 | |
See Notes to Financial Statements
7
MFS International Growth Portfolio
FINANCIAL STATEMENTS | STATEMENTS OF CHANGES IN NET ASSETS
These statements describe the increases and/or decreases in net assets resulting from operations, any distributions, and any shareholder transactions.
| | | | | | | | |
| |
| Six months ended
6/30/13
(unaudited |
) | |
| Year ended
12/31/12 |
|
Change in net assets | | | | | | | | |
| From operations | | | | | | | | |
Net investment income | | | $1,896,497 | | | | $2,876,256 | |
Net realized gain (loss) on investments and foreign currency | | | 5,055,278 | | | | (26,004 | ) |
Net unrealized gain (loss) on investments and foreign currency translation | | | (5,143,674 | ) | | | 40,275,426 | |
Change in net assets from operations | | | $1,808,101 | | | | $43,125,678 | |
| Distributions declared to shareholders | | | | | | | | |
From net investment income | | | $— | | | | $(2,510,069 | ) |
Change in net assets from fund share transactions | | | $(4,726,998 | ) | | | $(52,864,064 | ) |
Total change in net assets | | | $(2,918,897 | ) | | | $(12,248,455 | ) |
| Net assets | | | | | | | | |
At beginning of period | | | 204,727,117 | | | | 216,975,572 | |
At end of period (including undistributed net investment income of $4,658,751 and
$2,762,254, respectively) | | | $201,808,220 | | | | $204,727,117 | |
See Notes to Financial Statements
8
MFS International Growth Portfolio
FINANCIAL STATEMENTS | FINANCIAL HIGHLIGHTS
The financial highlights table is intended to help you understand the fund’s financial performance for the semiannual period and the past 5 fiscal years.
Certain information reflects financial results for a single fund share. The total returns in the table represent the rate by which an investor would have earned (or lost) on an investment in the fund share class (assuming reinvestment of all distributions) held for the entire period.
| | | | | | | | | | | | | | | | | | | | | | | | |
| Initial Class | | Six months
ended
6/30/13 | | | Years ended 12/31 | |
| | | | 2012 | | | 2011 | | | 2010 | | | 2009 | | | 2008 | |
| | | (unaudited) | | | | | | | | | | | | | | | | |
Net asset value, beginning of period | | | $13.13 | | | | $11.08 | | | | $13.85 | | | | $12.13 | | | | $8.90 | | | | $17.63 | |
| Income (loss) from investment operations | | | | | | | | | | | | | | | | | | | | | | | | |
Net investment income (d) | | | $0.13 | | | | $0.15 | | | | $0.15 | | | | $0.15 | | | | $0.14 | | | | $0.16 | |
Net realized and unrealized gain (loss) on investments
and foreign currency | | | (0.02 | ) | | | 2.02 | | | | (1.60 | ) | | | 1.68 | | | | 3.20 | | | | (6.04 | ) |
Total from investment operations | | | $0.11 | | | | $2.17 | | | | $(1.45 | ) | | | $1.83 | | | | $3.34 | | | | $(5.88 | ) |
| Less distributions declared to shareholders | | | | | | | | | | | | | | | | | | | | | | | | |
From net investment income | | | $— | | | | $(0.12 | ) | | | $(0.15 | ) | | | $(0.11 | ) | | | $(0.11 | ) | | | $(0.19 | ) |
From net realized gain on investments | | | — | | | | — | | | | (1.17 | ) | | | — | | | | — | | | | (2.66 | ) |
Total distributions declared to shareholders | | | $— | | | | $(0.12 | ) | | | $(1.32 | ) | | | $(0.11 | ) | | | $(0.11 | ) | | | $(2.85 | ) |
Net asset value, end of period (x) | | | $13.24 | | | | $13.13 | | | | $11.08 | | | | $13.85 | | | | $12.13 | | | | $8.90 | |
Total return (%) (k)(r)(s)(x) | | | 0.84 | (n) | | | 19.71 | | | | (10.89 | ) | | | 15.16 | | | | 38.06 | | | | (39.82 | ) |
Ratios (%) (to average net assets)
and Supplemental data: | | | | | | | | | | | | | | | | | | | | | | | | |
Expenses before expense reductions (f) | | | 1.03 | (a) | | | 1.04 | | | | 1.06 | | | | 1.09 | | | | 1.25 | | | | 1.22 | |
Expenses after expense reductions (f) | | | 1.03 | (a) | | | 1.04 | | | | N/A | | | | N/A | | | | N/A | | | | N/A | |
Net investment income | | | 1.85 | (a) | | | 1.23 | | | | 1.16 | | | | 1.21 | | | | 1.39 | | | | 1.25 | |
Portfolio turnover | | | 14 | (n) | | | 49 | | | | 52 | | | | 66 | | | | 56 | | | | 73 | |
Net assets at end of period (000 omitted) | | | $172,213 | | | | $175,946 | | | | $188,066 | | | | $221,456 | | | | $179,925 | | | | $87,034 | |
| | |
| Service Class | | Six months
ended
6/30/13 | | | Years ended 12/31 | |
| | | | 2012 | | | 2011 | | | 2010 | | | 2009 | | | 2008 | |
| | | (unaudited) | | | | | | | | | | | | | | | | |
Net asset value, beginning of period | | | $13.04 | | | | $11.00 | | | | $13.76 | | | | $12.06 | | | | $8.84 | | | | $17.53 | |
| Income (loss) from investment operations | | | | | | | | | | | | | | | | | | | | | | | | |
Net investment income (d) | | | $0.11 | | | | $0.12 | | | | $0.11 | | | | $0.11 | | | | $0.12 | | | | $0.13 | |
Net realized and unrealized gain (loss) on investments
and foreign currency | | | (0.02 | ) | | | 2.01 | | | | (1.58 | ) | | | 1.67 | | | | 3.18 | | | | (6.00 | ) |
Total from investment operations | | | $0.09 | | | | $2.13 | | | | $(1.47 | ) | | | $1.78 | | | | $3.30 | | | | $(5.87 | ) |
| Less distributions declared to shareholders | | | | | | | | | | | | | | | | | | | | | | | | |
From net investment income | | | $— | | | | $(0.09 | ) | | | $(0.12 | ) | | | $(0.08 | ) | | | $(0.08 | ) | | | $(0.16 | ) |
From net realized gain on investments | | | — | | | | — | | | | (1.17 | ) | | | — | | | | — | | | | (2.66 | ) |
Total distributions declared to shareholders | | | $— | | | | $(0.09 | ) | | | $(1.29 | ) | | | $(0.08 | ) | | | $(0.08 | ) | | | $(2.82 | ) |
Net asset value, end of period (x) | | | $13.13 | | | | $13.04 | | | | $11.00 | | | | $13.76 | | | | $12.06 | | | | $8.84 | |
Total return (%) (k)(r)(s)(x) | | | 0.69 | (n) | | | 19.45 | | | | (11.11 | ) | | | 14.86 | | | | 37.69 | | | | (39.96 | ) |
Ratios (%) (to average net assets)
and Supplemental data: | | | | | | | | | | | | | | | | | | | | | | | | |
Expenses before expense reductions (f) | | | 1.28 | (a) | | | 1.29 | | | | 1.31 | | | | 1.34 | | | | 1.50 | | | | 1.46 | |
Expenses after expense reductions (f) | | | 1.28 | (a) | | | 1.29 | | | | N/A | | | | N/A | | | | N/A | | | | N/A | |
Net investment income | | | 1.61 | (a) | | | 0.98 | | | | 0.89 | | | | 0.94 | | | | 1.17 | | | | 1.04 | |
Portfolio turnover | | | 14 | (n) | | | 49 | | | | 52 | | | | 66 | | | | 56 | | | | 73 | |
Net assets at end of period (000 omitted) | | | $29,596 | | | | $28,781 | | | | $28,910 | | | | $31,348 | | | | $27,338 | | | | $18,056 | |
See Notes to Financial Statements
9
MFS International Growth Portfolio
Financial Highlights – continued
| (d) | Per share data is based on average shares outstanding. |
| (f) | Ratios do not reflect reductions from fees paid indirectly, if applicable. |
| (k) | The total return does not reflect expenses that apply to separate accounts. Inclusion of these charges would reduce the total return figures for all periods shown. |
| (r) | Certain expenses have been reduced without which performance would have been lower. |
| (s) | From time to time the fund may receive proceeds from litigation settlements, without which performance would be lower. |
| (x) | The net asset values per share and total returns have been calculated on net assets which include adjustments made in accordance with U.S. generally accepted accounting principles required at period end for financial reporting purposes. |
See Notes to Financial Statements
10
MFS International Growth Portfolio
NOTES TO FINANCIAL STATEMENTS (unaudited)
| (1) | | Business and Organization |
MFS International Growth Portfolio (the fund) is a series of MFS Variable Insurance Trust II (the trust). The trust is organized as a Massachusetts business trust and is registered under the Investment Company Act of 1940, as amended, as an open-end management investment company. The shareholders of each series of the trust are separate accounts of insurance companies, which offer variable annuity and/or life insurance products, and qualified retirement and pension plans.
| (2) | | Significant Accounting Policies |
General – The preparation of financial statements in conformity with U.S. generally accepted accounting principles requires management to make estimates and assumptions that affect the reported amounts of assets and liabilities, and disclosure of contingent assets and liabilities at the date of the financial statements and the reported amounts of revenues and expenses during the reporting period. Actual results could differ from those estimates. In the preparation of these financial statements, management has evaluated subsequent events occurring after the date of the fund’s Statement of Assets and Liabilities through the date that the financial statements were issued. The fund invests in foreign securities, including securities of emerging market issuers. Investments in foreign securities are vulnerable to the effects of changes in the relative values of the local currency and the U.S. dollar and to the effects of changes in each country’s legal, political, and economic environment. The markets of emerging markets countries are generally more volatile than the markets of developed countries with more mature economies. All of the risks of investing in foreign securities previously described are heightened when investing in emerging markets countries.
In this reporting period, the fund adopted the disclosure provisions of the Financial Accounting Standards Board (FASB) Accounting Standards Update 2011-11 (“ASU 2011-11”), Balance Sheet (Topic 210) – Disclosures about Offsetting Assets and Liabilities along with the related scope clarification provisions of FASB Accounting Standards Update 2013-01 (“ASU 2013-01”) entitled Balance Sheet (Topic 210) – Clarifying the Scope of Disclosures about Offsetting Assets and Liabilities. ASU 2011-11 is intended to enhance disclosures on the offsetting of financial assets and liabilities by requiring entities to disclose both gross and net information about financial instruments and transactions that are either offset in the statement of financial position or subject to a Master Netting Agreement or similar arrangement. ASU 2013-01 limits the scope of ASU 2011-11’s disclosure requirements on offsetting to financial assets and financial liabilities related to derivatives, repurchase and reverse repurchase agreements, and securities lending and securities borrowing transactions. The disclosures required by ASU 2011-11, to the extent applicable to the fund, have been included in the fund’s Significant Accounting Policies note under the captions for each of the fund’s in-scope financial instruments and transactions.
In June 2013, FASB issued Accounting Standards Update 2013-08 Financial Services – Investment Companies (Topic 946) – Amendments to the Scope, Measurement, and Disclosure Requirements (“ASU 2013-08”) which is effective for interim and annual reporting periods in fiscal years that begin after December 15, 2013. ASU 2013-08 sets forth a methodology for determining whether an entity should be characterized as an investment company and prescribes fair value accounting for an investment company’s non-controlling ownership interest in another investment company. FASB has determined that a fund registered under the Investment Company Act of 1940 automatically meets ASU 2013-08’s criteria for an investment company. Although still evaluating the potential impacts of ASU 2013-08 to the fund, management expects that the impact of the fund’s adoption will be limited to additional financial statement disclosures.
Investment Valuations – Equity securities, including restricted equity securities, are generally valued at the last sale or official closing price as provided by a third-party pricing service on the market or exchange on which they are primarily traded. Equity securities, for which there were no sales reported that day, are generally valued at the last quoted daily bid quotation as provided by a third-party pricing service on the market or exchange on which such securities are primarily traded. Short-term instruments with a maturity at issuance of 60 days or less generally are valued at amortized cost, which approximates market value. Open-end investment companies are generally valued at net asset value per share. Securities and other assets generally valued on the basis of information from a third-party pricing service may also be valued at a broker/dealer bid quotation. Values obtained from third-party pricing services can utilize both transaction data and market information such as yield, quality, coupon rate, maturity, type of issue, trading characteristics, and other market data. The values of foreign securities and other assets and liabilities expressed in foreign currencies are converted to U.S. dollars using the mean of bid and asked prices for rates provided by a third-party pricing service.
The Board of Trustees has delegated primary responsibility for determining or causing to be determined the value of the fund’s investments (including any fair valuation) to the adviser pursuant to valuation policies and procedures approved by the Board. If the adviser determines that reliable market quotations are not readily available, investments are valued at fair value as determined in good faith by the adviser in accordance with such procedures under the oversight of the Board of Trustees. Under the fund’s valuation policies and procedures, market quotations are not considered to be readily available for most types of debt instruments and floating rate loans and many types of derivatives. These investments are generally valued at fair value based on information from third-party pricing services. In addition, investments may be valued at fair value if the adviser determines that an investment’s value has been materially affected by events occurring after the close of the exchange or market on which the investment is principally traded (such as foreign exchange or market) and prior to the determination of the fund’s net asset value, or after the halting of trading of a specific security where trading does not resume prior to the close of the exchange or market on which the security is principally traded. Events
11
MFS International Growth Portfolio
Notes to Financial Statements (unaudited) – continued
that occur on a frequent basis after foreign markets close (such as developments in foreign markets and significant movements in the U.S. markets) and prior to the determination of the fund’s net asset value may be deemed to have a material effect on the value of securities traded in foreign markets. Accordingly, the fund’s foreign equity securities may often be valued at fair value. The adviser generally relies on third-party pricing services or other information (such as the correlation with price movements of similar securities in the same or other markets; the type, cost and investment characteristics of the security; the business and financial condition of the issuer; and trading and other market data) to assist in determining whether to fair value and at what value to fair value an investment. The value of an investment for purposes of calculating the fund’s net asset value can differ depending on the source and method used to determine value. When fair valuation is used, the value of an investment used to determine the fund’s net asset value may differ from quoted or published prices for the same investment. There can be no assurance that the fund could obtain the fair value assigned to an investment if it were to sell the investment at the same time at which the fund determines its net asset value per share.
Various inputs are used in determining the value of the fund’s assets or liabilities. These inputs are categorized into three broad levels. In certain cases, the inputs used to measure fair value may fall into different levels of the fair value hierarchy. In such cases, an investment’s level within the fair value hierarchy is based on the lowest level of input that is significant to the fair value measurement. The fund’s assessment of the significance of a particular input to the fair value measurement in its entirety requires judgment, and considers factors specific to the investment. Level 1 includes unadjusted quoted prices in active markets for identical assets or liabilities. Level 2 includes other significant observable market-based inputs (including quoted prices for similar securities, interest rates, prepayment speed, and credit risk). Level 3 includes unobservable inputs, which may include the adviser’s own assumptions in determining the fair value of investments. The following is a summary of the levels used as of June 30, 2013 in valuing the fund’s assets or liabilities:
| | | | | | | | | | | | | | | | |
| Investments at Value | | Level 1 | | | Level 2 | | | Level 3 | | | Total | |
| Equity Securities: | | | | | | | | | | | | | | | | |
United Kingdom | | | $1,715,736 | | | | $35,019,759 | | | | $— | | | | $36,735,495 | |
France | | | 13,255,191 | | | | 16,737,402 | | | | — | | | | 29,992,593 | |
Japan | | | 20,267,572 | | | | 3,537,004 | | | | — | | | | 23,804,576 | |
Switzerland | | | 3,074,158 | | | | 16,034,458 | | | | — | | | | 19,108,616 | |
Germany | | | 7,497,126 | | | | 9,567,136 | | | | — | | | | 17,064,262 | |
Canada | | | 8,065,025 | | | | — | | | | — | | | | 8,065,025 | |
Hong Kong | | | — | | | | 7,783,353 | | | | — | | | | 7,783,353 | |
Brazil | | | 7,349,681 | | | | — | | | | — | | | | 7,349,681 | |
United States | | | 5,447,264 | | | | — | | | | — | | | | 5,447,264 | |
Other Countries | | | 22,641,670 | | | | 21,013,234 | | | | — | | | | 43,654,904 | |
| Mutual Funds | | | 2,769,182 | | | | — | | | | — | | | | 2,769,182 | |
| Total Investments | | | $92,082,605 | | | | $109,692,346 | | | | $— | | | | $201,774,951 | |
For further information regarding security characteristics, see the Portfolio of Investments.
Of the level 2 investments presented above, equity investments amounting to $7,070,876 would have been considered level 1 investments at the beginning of the period. Of the level 1 investments presented above, equity investments amounting to $45,283,355 would have been considered level 2 investments at the beginning of the period. The primary reason for changes in the classifications between levels 1 and 2 occurs when foreign equity securities are fair valued using other observable market-based inputs in place of the closing exchange price due to events occurring after the close of the exchange or market on which the investment is principally traded. The fund’s foreign equity securities may often be valued at fair value. The fund’s policy is to recognize transfers between the levels as of the end of the period.
Foreign Currency Translation – Purchases and sales of foreign investments, income, and expenses are converted into U.S. dollars based upon currency exchange rates prevailing on the respective dates of such transactions or on the reporting date for foreign denominated receivables and payables. Gains and losses attributable to foreign currency exchange rates on sales of securities are recorded for financial statement purposes as net realized gains and losses on investments. Gains and losses attributable to foreign exchange rate movements on receivables, payables, income and expenses are recorded for financial statement purposes as foreign currency transaction gains and losses. That portion of both realized and unrealized gains and losses on investments that results from fluctuations in foreign currency exchange rates is not separately disclosed.
Security Loans – Under its Securities Lending Agency Agreement with the fund, State Street Bank and Trust Company (“State Street”), as lending agent, loans the securities of the fund to certain qualified institutions (the “Borrowers”) approved by the fund. The loans are collateralized by cash and/or U.S. Treasury and federal agency obligations in an amount typically at least equal to the market value of the securities loaned. The market value of the loaned securities is determined at the close of business of the fund and any additional required collateral is delivered to the fund on the next business day. State Street provides the fund with indemnification against Borrower default. In the event of Borrower default, State Street will for the benefit of the fund either purchase securities identical to those loaned or, when such purchase is commercially impracticable, pay the fund the market value of
12
MFS International Growth Portfolio
Notes to Financial Statements (unaudited) – continued
the loaned securities. In return, State Street assumes the fund’s rights to the related collateral. If the collateral value is less than the cost to purchase identical securities, State Street is responsible for the shortfall, but only to the extent that such shortfall is not due to a decline in collateral value resulting from collateral reinvestment for which the fund bears the risk of loss. On loans collateralized by cash, the cash collateral is invested in a money market fund or short-term securities. A portion of the income generated upon investment of the collateral is remitted to the Borrowers, and the remainder is allocated between the fund and the lending agent. On loans collateralized by U.S. Treasury and/or federal agency obligations, a fee is received from the Borrower, and is allocated between the fund and the lending agent. Income from securities lending is included in “Interest” income in the Statement of Operations. The dividend and interest income earned on the securities loaned is accounted for in the same manner as other dividend and interest income. At June 30, 2013, there were no securities on loan or collateral outstanding.
Indemnifications – Under the fund’s organizational documents, its officers and Trustees may be indemnified against certain liabilities and expenses arising out of the performance of their duties to the fund. Additionally, in the normal course of business, the fund enters into agreements with service providers that may contain indemnification clauses. The fund’s maximum exposure under these agreements is unknown as this would involve future claims that may be made against the fund that have not yet occurred.
Investment Transactions and Income – Investment transactions are recorded on the trade date. Interest income is recorded on the accrual basis. Dividends received in cash are recorded on the ex-dividend date. Certain dividends from foreign securities will be recorded when the fund is informed of the dividend if such information is obtained subsequent to the ex-dividend date. Dividend and interest payments received in additional securities are recorded on the ex-dividend or ex-interest date in an amount equal to the value of the security on such date.
The fund may receive proceeds from litigation settlements. Any proceeds received from litigation involving portfolio holdings are reflected in the Statement of Operations in realized gain/loss if the security has been disposed of by the fund or in unrealized gain/loss if the security is still held by the fund. Any other proceeds from litigation not related to portfolio holdings are reflected as other income in the Statement of Operations.
Fees Paid Indirectly – The fund’s custody fee may be reduced according to an arrangement that measures the value of cash deposited with the custodian by the fund. This amount, for the six months ended June 30, 2013, is shown as a reduction of total expenses in the Statement of Operations.
Tax Matters and Distributions – The fund intends to qualify as a regulated investment company, as defined under Subchapter M of the Internal Revenue Code, and to distribute all of its taxable income, including realized capital gains. As a result, no provision for federal income tax is required. The fund’s federal tax returns, when filed, will remain subject to examination by the Internal Revenue Service for a three year period. Foreign taxes have been accrued by the fund in the accompanying financial statements in accordance with the applicable foreign tax law. Foreign income taxes may be withheld by certain countries in which the fund invests. Additionally, capital gains realized by the fund on securities issued in or by certain foreign countries may be subject to capital gains tax imposed by those countries.
Distributions to shareholders are recorded on the ex-dividend date. Income and capital gain distributions are determined in accordance with income tax regulations, which may differ from U.S. generally accepted accounting principles. Certain capital accounts in the financial statements are periodically adjusted for permanent differences in order to reflect their tax character. These adjustments have no impact on net assets or net asset value per share. Temporary differences which arise from recognizing certain items of income, expense, gain or loss in different periods for financial statement and tax purposes will reverse at some time in the future. Distributions in excess of net investment income or net realized gains are temporary overdistributions for financial statement purposes resulting from differences in the recognition or classification of income or distributions for financial statement and tax purposes.
Book/tax differences primarily relate wash sale loss deferrals.
The tax character of distributions declared to shareholders for the last fiscal year is as follows:
| | | | |
| | | 12/31/12 | |
| Ordinary income (including any short-term capital gains) | | | $2,510,069 | |
13
MFS International Growth Portfolio
Notes to Financial Statements (unaudited) – continued
The federal tax cost and the tax basis components of distributable earnings were as follows:
| | | | |
| As of 6/30/13 | | | | |
| Cost of investments | | | $162,055,241 | |
| Gross appreciation | | | 46,210,675 | |
| Gross depreciation | | | (6,490,965 | ) |
| Net unrealized appreciation (depreciation) | | | $39,719,710 | |
| |
| As of 12/31/12 | | | | |
| Undistributed ordinary income | | | 2,765,343 | |
| Undistributed long-term capital gain | | | 73,598 | |
| Other temporary differences | | | (347,434 | ) |
| Net unrealized appreciation (depreciation) | | | 45,161,910 | |
The aggregate cost above includes prior fiscal year end tax adjustments, if applicable.
Multiple Classes of Shares of Beneficial Interest – The fund offers multiple classes of shares, which differ in their respective distribution and/or service fees. The fund’s income, realized and unrealized gain (loss), and common expenses are allocated to shareholders based on the daily net assets of each class. Dividends are declared separately for each class. Differences in per share dividend rates are generally due to differences in separate class expenses. The fund’s distributions declared to shareholders as reported in the Statements of Changes in Net Assets are presented by class as follows:
| | | | | | | | |
| | | From net investment
income | |
| | | Six months ended
6/30/13 | | | Year ended
12/31/12 | |
| Initial Class | | | $— | | | | $2,288,995 | |
| Service Class | | | — | | | | 221,074 | |
| Total | | | $— | | | | $2,510,069 | |
| (3) | | Transactions with Affiliates |
Investment Adviser – The fund has an investment advisory agreement with MFS to provide overall investment management and related administrative services and facilities to the fund. The management fee is computed daily and paid monthly at the following annual rates:
| | | | |
| First $1 billion of average daily net assets | | | 0.90% | |
| Next $1 billion of average daily net assets | | | 0.80% | |
| Average daily net assets in excess of $2 billion | | | 0.70% | |
Effective April 1, 2013, MFS has agreed in writing to reduce its management fee by a specified amount if certain MFS mutual fund assets exceed thresholds agreed to by MFS and the fund’s Board of Trustees. For the period April 1, 2013 through June 30, 2013, this management fee reduction amounted to $284, which is shown as a reduction of total expenses in the Statement of Operations. The management fee incurred for the six months ended June 30, 2013 was equivalent to an annual effective rate of 0.90% of the fund’s average daily net assets.
The investment adviser has agreed in writing to pay a portion of the fund’s total annual operating expenses, exclusive of interest, taxes, extraordinary expenses, brokerage and transaction costs, and investment-related expenses, such that total annual operating expenses do not exceed 1.35% of average daily net assets for the Initial Class shares and 1.60% of average daily net assets for the Service Class shares. This written agreement will continue until April 30, 2014. For the six months ended June 30, 2013, the fund’s actual operating expenses did not exceed the limit and therefore, the investment adviser did not pay any portion of the fund’s expenses related to this agreement.
Distributor – MFS Fund Distributors, Inc. (MFD), a wholly-owned subsidiary of MFS, is the distributor of shares of the fund. The Trustees have adopted a distribution plan for the Service Class shares pursuant to Rule 12b-1 under the Investment Company Act of 1940.
The fund’s distribution plan provides that the fund will pay MFD distribution and/or service fees equal to 0.25% per annum of its average daily net assets attributable to Service Class shares as partial consideration for services performed and expenses incurred by MFD and financial intermediaries (including participating insurance companies that invest in the fund to fund variable annuity and variable life insurance contracts, sponsors of qualified retirement and pension plans that invest in the fund, and affiliates of these participating insurance companies and plan sponsors) in connection with the sale and distribution of the Service Class shares. MFD may subsequently pay all, or a portion, of the distribution and/or service fees to financial intermediaries.
14
MFS International Growth Portfolio
Notes to Financial Statements (unaudited) – continued
Shareholder Servicing Agent – MFS Service Center, Inc. (MFSC), a wholly-owned subsidiary of MFS, receives a fee from the fund for its services as shareholder servicing agent. For the six months ended June 30, 2013, the fee was $3,446, which equated to 0.0033% annually of the fund’s average daily net assets. MFSC also receives payment from the fund for out-of-pocket expenses paid by MFSC on behalf of the fund. For the six months ended June 30, 2013, these costs amounted to $10.
Administrator – MFS provides certain financial, legal, shareholder communications, compliance, and other administrative services to the fund. Under an administrative services agreement, the fund partially reimburses MFS the costs incurred to provide these services. The fund is charged an annual fixed amount of $17,500 plus a fee based on average daily net assets. The administrative services fee incurred for the six months ended June 30, 2013 was equivalent to an annual effective rate of 0.0178% of the fund’s average daily net assets.
Trustees’ and Officers’ Compensation – The fund pays compensation to independent Trustees in the form of a retainer, attendance fees, and additional compensation to Board and Committee chairpersons. The fund does not pay compensation directly to Trustees or officers of the fund who are also officers of the investment adviser, all of whom receive remuneration for their services to the fund from MFS. Certain officers and Trustees of the fund are officers or directors of MFS, MFD, and MFSC.
Other – This fund and certain other funds managed by MFS (the funds) have entered into services agreements (the Agreements) which provide for payment of fees by the funds to Tarantino LLC and Griffin Compliance LLC in return for the provision of services of an Independent Chief Compliance Officer (ICCO) and Assistant ICCO, respectively, for the funds. The ICCO and Assistant ICCO are officers of the funds and the sole members of Tarantino LLC and Griffin Compliance LLC, respectively. The funds can terminate the Agreements with Tarantino LLC and Griffin Compliance LLC at any time under the terms of the Agreements. For the six months ended June 30, 2013, the aggregate fees paid by the fund to Tarantino LLC and Griffin Compliance LLC were $791 and are included in “Miscellaneous” expense in the Statement of Operations . MFS has agreed to reimburse the fund for a portion of the payments made by the fund in the amount of $398, which is shown as a reduction of total expenses in the Statement of Operations. Additionally, MFS has agreed to bear all expenses associated with office space, other administrative support, and supplies provided to the ICCO and Assistant ICCO.
The fund invests in the MFS Institutional Money Market Portfolio which is managed by MFS and seeks current income consistent with preservation of capital and liquidity. Income earned on this investment is included in “Dividends from underlying affiliated funds” in the Statement of Operations. This money market fund does not pay a management fee to MFS.
Purchases and sales of investments, other than short-term obligations, aggregated $28,556,030 and $33,287,449, respectively.
| (5) | | Shares of Beneficial Interest |
The fund’s Declaration of Trust permits the Trustees to issue an unlimited number of full and fractional shares of beneficial interest. Transactions in fund shares were as follows:
| | | | | | | | | | | | | | | | |
| | | Six months ended 6/30/13 | | | Year ended 12/31/12 | |
| | | Shares | | | Amount | | | Shares | | | Amount | |
| Shares sold | | | | | | | | | | | | | | | | |
Initial Class | | | 443,914 | | | | $6,063,878 | | | | 2,804,887 | | | | $32,459,829 | |
Service Class | | | 243,866 | | | | 3,323,442 | | | | 263,326 | | | | 3,136,358 | |
| | | 687,780 | | | | $9,387,320 | | | | 3,068,213 | | | | $35,596,187 | |
| Shares issued to shareholders in reinvestment of distributions | | | | | | | | | | | | | | | | |
Initial Class | | | — | | | | $— | | | | 189,958 | | | | $2,288,995 | |
Service Class | | | — | | | | — | | | | 18,454 | | | | 221,074 | |
| | | — | | | | $— | | | | 208,412 | | | | $2,510,069 | |
| Shares reacquired | | | | | | | | | | | | | | | | |
Initial Class | | | (831,565 | ) | | | $(11,448,159 | ) | | | (6,567,676 | ) | | | $(82,323,451 | ) |
Service Class | | | (196,265 | ) | | | (2,666,159 | ) | | | (702,254 | ) | | | (8,646,869 | ) |
| | | (1,027,830 | ) | | | $(14,114,318 | ) | | | (7,269,930 | ) | | | $(90,970,320 | ) |
| Net change | | | | | | | | | | | | | | | | |
Initial Class | | | (387,651 | ) | | | $(5,384,281 | ) | | | (3,572,831 | ) | | | $(47,574,627 | ) |
Service Class | | | 47,601 | | | | 657,283 | | | | (420,474 | ) | | | (5,289,437 | ) |
| | | (340,050 | ) | | | $(4,726,998 | ) | | | (3,993,305 | ) | | | $(52,864,064 | ) |
The fund is one of several mutual funds in which the MFS funds-of-funds may invest. The MFS funds-of-funds do not invest in the underlying MFS funds for the purpose of exercising management or control. At the end of the period, the MFS Moderate Allocation Portfolio, the MFS Growth Allocation Portfolio, and the MFS Conservative Allocation Portfolio were the owners of record of approximately 29%,14%, and 9%, respectively, of the value of outstanding voting shares of the fund.
15
MFS International Growth Portfolio
Notes to Financial Statements (unaudited) – continued
The fund and certain other funds managed by MFS participate in a $1.1 billion unsecured committed line of credit, subject to a $1 billion sublimit, provided by a syndication of banks under a credit agreement. Borrowings may be made for temporary financing needs. Interest is charged to each fund, based on its borrowings, generally at a rate equal to the higher of the Federal Reserve funds rate or one month LIBOR plus an agreed upon spread. A commitment fee, based on the average daily, unused portion of the committed line of credit, is allocated among the participating funds at the end of each calendar quarter. In addition, the fund and other funds managed by MFS have established unsecured uncommitted borrowing arrangements with certain banks for temporary financing needs. Interest is charged to each fund, based on its borrowings, at a rate equal to the Federal Reserve funds rate plus an agreed upon spread. For the six months ended June 30, 2013, the fund’s commitment fee and interest expense were $520 and $0, respectively, and are included in “Miscellaneous” expense in the Statement of Operations.
| (7) | | Transactions in Underlying Affiliated Funds – Affiliated Issuers |
An affiliated issuer may be considered one in which the fund owns 5% or more of the outstanding voting securities, or a company which is under common control. For the purposes of this report, the fund assumes the following to be an affiliated issuer:
| | | | | | | | | | | | | | | | |
| Underlying Affiliated Fund | | Beginning
Shares/Par
Amount | | | Acquisitions
Shares/Par
Amount | | | Dispositions
Shares/Par
Amount | | | Ending
Shares/Par
Amount | |
| MFS Institutional Money Market Portfolio | | | 63,117 | | | | 18,596,720 | | | | (15,890,655 | ) | | | 2,769,182 | |
| | | | |
| Underlying Affiliated Fund | | Realized
Gain (Loss) | | | Capital Gain
Distributions | | | Dividend
Income | | | Ending
Value | |
| MFS Institutional Money Market Portfolio | | | $— | | | | $— | | | | $967 | | | | $2,769,182 | |
16
MFS International Growth Portfolio
BOARD REVIEW OF INVESTMENT ADVISORY AGREEMENT
A discussion regarding the Board’s most recent review and renewal of the fund’s Investment Advisory Agreement with MFS will be available on or about November 1, 2013 by clicking on the fund’s name under “Variable Insurance Portfolios — VIT II” in the “Products” section of the MFS Web site (mfs.com).
PROXY VOTING POLICIES AND INFORMATION
A general description of the MFS funds’ proxy voting policies and procedures is available without charge, upon request, by calling 1-800-225-2606, by visiting the Proxy Voting section of mfs.com or by visiting the SEC’s Web site at http://www.sec.gov.
Information regarding how the fund voted proxies relating to portfolio securities during the most recent twelve-month period ended June 30 is available without charge by visiting the Proxy Voting section of mfs.com or by visiting the SEC’s Web site at http://www.sec.gov.
QUARTERLY PORTFOLIO DISCLOSURE
The fund will file a complete schedule of portfolio holdings with the Securities and Exchange Commission (the Commission) for the first and third quarters of each fiscal year on Form N-Q. The fund’s Form N-Q is available on the EDGAR database on the Commission’s Internet Web site at http://www.sec.gov, and may be reviewed and copied at the:
Public Reference Room
Securities and Exchange Commission
100 F Street, NE, Room 1580
Washington, D.C. 20549
Information on the operation of the Public Reference Room may be obtained by calling the Commission at 1-800-SEC-0330. Copies of the fund’s Form N-Q also may be obtained, upon payment of a duplicating fee, by electronic request at the following e-mail address: publicinfo@sec.gov or by writing the Public Reference Section at the above address.
FURTHER INFORMATION
From time to time, MFS may post important information about the fund or the MFS funds on the MFS web site (mfs.com). This information is available by visiting the “News & Commentary” section of mfs.com or by clicking on the fund’s name under “Variable Insurance Portfolios — VIT II” in the “Products” section of mfs.com.
17
SEMIANNUAL REPORT
June 30, 2013

MFS® UTILITIES PORTFOLIO
MFS® Variable Insurance Trust II

UTS-SEM
MFS® UTILITIES PORTFOLIO
CONTENTS
The report is prepared for the general information of contract owners. It is authorized for distribution to prospective investors only when preceded or accompanied by a current prospectus.
NOT FDIC INSURED Ÿ MAY LOSE VALUE Ÿ NO BANK OR CREDIT UNION GUARANTEE Ÿ NOT A DEPOSIT Ÿ NOT INSURED BY ANY FEDERAL GOVERNMENT AGENCY OR NCUA/NCUSIF
MFS Utilities Portfolio
LETTER FROM THE CHAIRMAN AND CEO

Dear Contract Owners:
As the year progresses, the global economy continues to grind ahead slowly, held back by broad austerity measures. The U.S. economy remains a steadying force, driven by resilient consumers, who have taken the payroll tax increase and the sequestration’s early impact in stride. With U.S. housing and jobs showing steady expansion, domestic consumer-driven growth has offset weaker exports and the U.S. government’s spending constraints. In response to these developments, the U.S. Federal Reserve has begun to brace investors for an eventual shift in its monetary policy, causing global market tremors.
Japan has been another bright spot, with government and central bank stimulus policies leading to increased exports, a resurgent stock market and improved economic sentiment. After a six-month rally, Japan’s stocks slipped late in the second quarter, then picked up momentum on fresh signs that the country could soon break free of its chronic deflation. The major deterrent to global growth remains the eurozone, still in the grip of persistent recession. China has seen its pace of economic growth decelerate, a troubling turn for the country’s trading partners, who have come to rely on it as an engine for global growth.
As always, managing risk in the face of uncertainty remains a top priority for investors. At MFS®, our uniquely collaborative investment process employs integrated, global research and active risk management. Our global team of investment professionals shares ideas and evaluates opportunities across continents, investment disciplines and asset classes — all with a goal of building better insights, and ultimately better results, for our clients.
We are mindful of the many economic challenges investors face, and believe it is more important than ever to maintain a long-term view and employ time-tested principles, such as asset allocation and diversification. We remain confident that our unique approach can serve investors well as they work with their financial advisors to identify and pursue the most suitable opportunities.
Respectfully,

Robert J. Manning
Chairman and Chief Executive Officer
MFS Investment Management®
August 16, 2013
The opinions expressed in this letter are subject to change, may not be relied upon for investment advice, and no forecasts can be guaranteed.
1
MFS Utilities Portfolio
PORTFOLIO COMPOSITION
Portfolio structure (i)
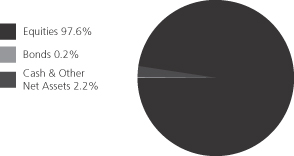
| | | | |
| Top ten holdings (i) | | | | |
| Comcast Corp., “Special A” | | | 3.8% | |
| Energias de Portugal S.A. | | | 3.0% | |
| Kinder Morgan, Inc. | | | 2.8% | |
| Calpine Corp. | | | 2.7% | |
| Edison International | | | 2.6% | |
| CMS Energy Corp. | | | 2.5% | |
| NRG Energy, Inc. | | | 2.5% | |
| Time Warner Cable, Inc. | | | 2.3% | |
| AES Corp. | | | 2.1% | |
| EQT Corp. | | | 2.0% | |
| | | | |
Top five industries (i) | | | | |
Utilities-Electric Power | | | 46.0% | |
Cable TV | | | 10.6% | |
Natural Gas-Pipeline | | | 8.9% | |
| Telecommunications-Wireless | | | 8.7% | |
| Natural Gas-Pipeline | | | 8.1% | |
|
| Issuer country weightings (i)(x) | |
| United States | | | 67.1% | |
| Brazil | | | 5.9% | |
| Portugal | | | 5.1% | |
| Spain | | | 3.9% | |
| United Kingdom | | | 2.6% | |
| Russia | | | 1.7% | |
| Canada | | | 1.6% | |
| Italy | | | 1.4% | |
| Israel | | | 1.3% | |
| Other Countries | | | 9.4% | |
| (i) | For purposes of this presentation, the components include the market value of securities, and reflect the impact of the equivalent exposure of derivative positions, if any. These amounts may be negative from time to time. Equivalent exposure is a calculated amount that translates the derivative position into a reasonable approximation of the amount of the underlying asset that the portfolio would have to hold at a given point in time to have the same price sensitivity that results from the portfolio’s ownership of the derivative contract. When dealing with derivatives, equivalent exposure is a more representative measure of the potential impact of a position on portfolio performance than market value. The bond component will include any accrued interest amounts. |
| (x) | Represents the portfolio’s exposure to issuer countries as a percentage of a portfolio’s net assets. |
Where the fund holds convertible bonds, these are treated as part of the equity portion of the portfolio.
Percentages are based on net assets as of 6/30/13.
The portfolio is actively managed and current holdings may be different.
2
MFS Utilities Portfolio
EXPENSE TABLE
Fund Expenses Borne by the Contract Holders During the Period,
January 1, 2013 through June 30, 2013
As a contract holder of the fund, you incur ongoing costs, including management fees; distribution and/or service (12b-1) fees; and other fund expenses. This example is intended to help you understand your ongoing costs (in dollars) of investing in the fund and to compare these costs with the ongoing costs of investing in other mutual funds.
The example is based on an investment of $1,000 invested at the beginning of the period and held for the entire period January 1, 2013 through June 30, 2013.
Actual Expenses
The first line for each share class in the following table provides information about actual account values and actual expenses. You may use the information in this line, together with the amount you invested, to estimate the expenses that you paid over the period. Simply divide your account value by $1,000 (for example, an $8,600 account value divided by $1,000 = 8.6), then multiply the result by the number in the first line under the heading entitled “Expenses Paid During Period” to estimate the expenses you paid on your account during this period.
Hypothetical Example for Comparison Purposes
The second line for each share class in the following table provides information about hypothetical account values and hypothetical expenses based on the fund’s actual expense ratio and an assumed rate of return of 5% per year before expenses, which is not the fund’s actual return. The hypothetical account values and expenses may not be used to estimate the actual ending account balance or expenses you paid for the period. You may use this information to compare the ongoing costs of investing in the fund and other funds. To do so, compare this 5% hypothetical example with the 5% hypothetical examples that appear in the shareholder reports of the other funds.
Please note that the expenses shown in the table are meant to highlight the fund’s ongoing costs only and do not take into account the fees and expenses imposed under the variable contracts through which your investment in the fund is made. Therefore, the second line for each share class in the table is useful in comparing ongoing costs associated with an investment in vehicles (such as the fund) which fund benefits under variable annuity and variable life insurance contracts and to qualified pension and retirement plans only, and will not help you determine the relative total costs of investing in the fund through variable annuity and variable life insurance contracts. If the fees and expenses imposed under the variable contracts were included, your costs would have been higher.
| | | | | | | | | | | | | | | | | | |
| Share Class | | | | Annualized
Expense Ratio | | | Beginning
Account Value
1/01/13 | | | Ending
Account Value
6/30/13 | | | Expenses Paid
During Period (p)
1/01/13-6/30/13 | |
| Initial Class | | Actual | | | 0.84% | | | | $1,000.00 | | | | $1,097.78 | | | | $4.37 | |
| | Hypothetical (h) | | | 0.84% | | | | $1,000.00 | | | | $1,020.63 | | | | $4.21 | |
| Service Class | | Actual | | | 1.09% | | | | $1,000.00 | | | | $1,095.93 | | | | $5.66 | |
| | Hypothetical (h) | | | 1.09% | | | | $1,000.00 | | | | $1,019.39 | | | | $5.46 | |
| (h) | 5% class return per year before expenses. |
| (p) | Expenses paid are equal to each class’s annualized expense ratio, as shown above, multiplied by the average account value over the period, multiplied by the number of days in the period, divided by the number of days in the year. |
3
MFS Utilities Portfolio
PORTFOLIO OF INVESTMENTS – 6/30/13 (unaudited)
The Portfolio of Investments is a complete list of all securities owned by your fund. It is categorized by broad-based asset classes.
| | | | | | | | |
| Issuer | | Shares/Par | | | Value ($) | |
| | | | | | | | |
| COMMON STOCKS – 91.3% | | | | | | | | |
| Broadcasting – 0.0% | | | | | |
| SIRIUS XM Radio, Inc. | | | 26,940 | | | $ | 90,248 | |
| | | | | | | | |
| Cable TV – 10.6% | | | | | |
| Astro Malaysia Holdings Berhad | | | 1,630,700 | | | $ | 1,563,861 | |
| Comcast Corp., “Special A” | | | 292,080 | | | | 11,586,813 | |
| Kabel Deutschland Holding AG | | | 9,831 | | | | 1,079,770 | |
| Liberty Global PLC, “A” (a) | | | 58,446 | | | | 4,329,680 | |
| Liberty Global PLC, “C” (a) | | | 32,145 | | | | 2,182,323 | |
| Telenet Group Holding N.V. | | | 16,138 | | | | 738,880 | |
| Time Warner Cable, Inc. | | | 61,559 | | | | 6,924,155 | |
| Ziggo N.V. | | | 88,760 | | | | 3,543,379 | |
| | | | | | | | |
| | | | | | $ | 31,948,861 | |
| | | | | | | | |
| Energy – Independent – 5.7% | | | | | |
| Anadarko Petroleum Corp. | | | 17,630 | | | $ | 1,514,946 | |
| Cabot Oil & Gas Corp. | | | 17,590 | | | | 1,249,242 | |
| CONSOL Energy, Inc. | | | 24,370 | | | | 660,427 | |
| Energen Corp. | | | 51,780 | | | | 2,706,023 | |
| EQT Corp. | | | 77,630 | | | | 6,161,493 | |
| Noble Energy, Inc. | | | 34,360 | | | | 2,062,974 | |
| QEP Resources, Inc. | | | 101,370 | | | | 2,816,059 | |
| | | | | | | | |
| | | | | | $ | 17,171,164 | |
| | | | | | | | |
| Natural Gas – Distribution – 8.0% | | | | | |
| AGL Energy Ltd. | | | 69,480 | | | $ | 916,598 | |
| China Resources Gas Group Ltd. | | | 306,000 | | | | 785,068 | |
| Gas Natural SDG S.A. | | | 68,570 | | | | 1,376,803 | |
| GDF SUEZ | | | 129,524 | �� | | | 2,525,498 | |
| Hong Kong & China Gas Co. Ltd. | | | 129,000 | | | | 314,365 | |
| Infraestructura Energetica Nova, S.A. de C.V (a) | | | 142,900 | | | | 514,696 | |
| NiSource, Inc. | | | 89,820 | | | | 2,572,445 | |
| ONEOK, Inc. | | | 89,350 | | | | 3,691,049 | |
| Questar Corp. | | | 18,870 | | | | 450,050 | |
| Sempra Energy | | | 62,170 | | | | 5,083,019 | |
| Snam Rete Gas S.p.A. | | | 530,480 | | | | 2,416,747 | |
| Spectra Energy Corp. | | | 106,430 | | | | 3,667,578 | |
| | | | | | | | |
| | | | | | $ | 24,313,916 | |
| | | | | | | | |
| Natural Gas – Pipeline – 8.9% | | | | | |
| APA Group | | | 72,996 | | | $ | 398,317 | |
| Cheniere Energy, Inc. (a) | | | 28,280 | | | | 785,053 | |
| Enagas S.A. | | | 168,451 | | | | 4,162,730 | |
| Enbridge, Inc. | | | 68,730 | | | | 2,889,183 | |
| Kinder Morgan, Inc. | | | 223,166 | | | | 8,513,783 | |
| TransCanada Corp. | | | 42,500 | | | | 1,829,799 | |
| Williams Cos., Inc. | | | 131,167 | | | | 4,258,992 | |
| Williams Partners LP | | | 77,570 | | | | 4,002,612 | |
| | | | | | | | |
| | | | | | $ | 26,840,469 | |
| | | | | | | | |
| Oil Services – 1.4% | | | | | |
| Ensco PLC, “A” | | | 44,190 | | | $ | 2,568,323 | |
| Noble Corp. | | | 44,590 | | | | 1,675,692 | |
| | | | | | | | |
| | | | | | $ | 4,244,015 | |
| | | | | | | | |
| | | | | | | | |
| Issuer | | Shares/Par | | | Value ($) | |
| | | | | | | | |
| COMMON STOCKS – continued | |
| Telecommunications – Wireless – 8.0% | | | | | |
| American Tower Corp., REIT | | | 61,740 | | | $ | 4,517,516 | |
| Cellcom Israel Ltd. | | | 111,522 | | | | 1,029,348 | |
| KDDI Corp. | | | 3,100 | | | | 161,283 | |
| MegaFon OAO, GDR | | | 25,240 | | | | 788,750 | |
| Mobile TeleSystems OJSC | | | 36,600 | | | | 288,578 | |
| Mobile TeleSystems OJSC, ADR | | | 195,630 | | | | 3,705,232 | |
| SBA Communications Corp. (a) | | | 30,980 | | | | 2,296,238 | |
| Tele2 AB, “B” | | | 103,069 | | | | 1,205,944 | |
| Telefonica Deutschland Holding AG | | | 112,790 | | | | 816,281 | |
| TIM Participacoes S.A., ADR | | | 206,827 | | | | 3,846,982 | |
| Turkcell Iletisim Hizmetleri A.S. (a) | | | 368,950 | | | | 2,142,500 | |
| Vodafone Group PLC | | | 1,125,950 | | | | 3,231,160 | |
| | | | | | | | |
| | | | | | $ | 24,029,812 | |
| | | | | | | | |
| Telephone Services – 8.0% | | | | | |
| Bezeq – The Israel Telecommunication Corp. Ltd. | | | 2,084,930 | | | $ | 2,771,271 | |
| BT Group PLC | | | 266,830 | | | | 1,248,668 | |
| CenturyLink, Inc. | | | 75,725 | | | | 2,676,879 | |
| Frontier Communications Corp. (l) | | | 339,970 | | | | 1,376,879 | |
| Oi S.A., IPS | | | 255,500 | | | | 448,858 | |
| Portugal Telecom, SGPS, S.A. | | | 356,493 | | | | 1,387,446 | |
| PT XL Axiata Tbk | | | 2,323,000 | | | | 1,126,863 | |
| TDC A.S. | | | 386,508 | | | | 3,126,874 | |
| Telecom Italia S.p.A. | | | 3,280,719 | | | | 1,812,852 | |
| Telefonica Brasil S.A., ADR | | | 72,666 | | | | 1,658,238 | |
| Verizon Communications, Inc. | | | 54,160 | | | | 2,726,414 | |
| Windstream Corp. | | | 481,520 | | | | 3,712,519 | |
| | | | | | | | |
| | | | | | $ | 24,073,761 | |
| | | | | | | | |
| Utilities – Electric Power – 40.3% | | | | | |
| AES Corp. | | | 530,130 | | | $ | 6,356,259 | |
| Aksa Enerji Uretim A.S. (a) | | | 736,642 | | | | 1,290,947 | |
| Alliant Energy Corp. | | | 36,330 | | | | 1,831,759 | |
| Ameren Corp. | | | 9,210 | | | | 317,192 | |
| American Electric Power Co., Inc. | | | 77,240 | | | | 3,458,807 | |
| Calpine Corp. (a) | | | 383,970 | | | | 8,151,683 | |
| CenterPoint Energy, Inc. | | | 141,580 | | | | 3,325,714 | |
| CEZ A.S. | | | 73,319 | | | | 1,757,238 | |
| Cheung Kong Infrastructure Holdings Ltd. | | | 253,000 | | | | 1,682,286 | |
| China Longyuan Power Group | | | 821,000 | | | | 845,736 | |
| CLP Holdings Ltd. | | | 180,000 | | | | 1,453,313 | |
| CMS Energy Corp. | | | 277,940 | | | | 7,551,630 | |
| Companhia Energetica de Minas Gerais, IPS | | | 372,922 | | | | 3,327,527 | |
| Companhia Paranaense de Energia, ADR | | | 60,620 | | | | 752,900 | |
| Companhia Paranaense de Energia, IPS | | | 117,600 | | | | 1,458,833 | |
| Dominion Resources, Inc. | | | 26,560 | | | | 1,509,139 | |
| DTE Energy Co. | | | 9,030 | | | | 605,100 | |
| Duke Energy Corp. | | | 55,870 | | | | 3,771,225 | |
| Dynegy, Inc. (a) | | | 4,060 | | | | 91,553 | |
| E.On Russia JSC | | | 5,010,603 | | | | 358,834 | |
| Edison International | | | 161,820 | | | | 7,793,251 | |
| EDP Renovaveis S.A. | | | 968,116 | | | | 4,951,237 | |
4
MFS Utilities Portfolio
Portfolio of Investments (unaudited) – continued
| | | | | | | | |
| Issuer | | Shares/Par | | | Value ($) | |
| | | | | | | | |
| COMMON STOCKS – continued | |
| Utilities – Electric Power – continued | | | | | |
| Energias de Portugal S.A. | | | 2,793,316 | | | $ | 8,998,898 | |
| Energias do Brasil S.A. | | | 478,200 | | | | 2,428,129 | |
| Fortum Corp. | | | 22,168 | | | | 414,114 | |
| Great Plains Energy, Inc. | | | 69,190 | | | | 1,559,543 | |
| Iberdrola S.A. | | | 448,593 | | | | 2,354,402 | |
| ITC Holdings Corp. | | | 22,370 | | | | 2,042,381 | |
| Light S.A. | | | 156,560 | | | | 1,091,047 | |
| National Grid PLC | | | 66,093 | | | | 747,610 | |
| NextEra Energy, Inc. | | | 59,420 | | | | 4,841,542 | |
| Northeast Utilities | | | 54,630 | | | | 2,295,553 | |
| NRG Energy, Inc. | | | 279,735 | | | | 7,468,925 | |
| OGE Energy Corp. | | | 68,960 | | | | 4,703,072 | |
| PG&E Corp. | | | 26,230 | | | | 1,199,498 | |
| Pinnacle West Capital Corp. | | | 20,650 | | | | 1,145,456 | |
| Portland General Electric Co. | | | 98,680 | | | | 3,018,621 | |
| PPL Corp. | | | 44,550 | | | | 1,348,083 | |
| Public Service Enterprise Group, Inc. | | | 162,490 | | | | 5,306,923 | |
| Red Electrica de Espana | | | 72,541 | | | | 3,978,762 | |
| SSE PLC | | | 93,966 | | | | 2,169,345 | |
| Terna Participacoes S.A., IEU | | | 102,020 | | | | 977,062 | |
| Tractebel Energia S.A. | | | 55,600 | | | | 863,895 | |
| | | | | | | | |
| | | | | | $ | 121,595,024 | |
| | | | | | | | |
| Utilities – Water – 0.4% | | | | | |
| Aguas Andinas S.A. | | | 286,995 | | | $ | 204,436 | |
| Companhia de Saneamento de Minas Gerais – Copasa MG | | | 55,400 | | | | 893,809 | |
| | | | | | | | |
| | | | | | $ | 1,098,245 | |
| | | | | | | | |
| Total Common Stocks (Identified Cost, $265,229,023) | | | $ | 275,405,515 | |
| | | | | | | | |
| |
| BONDS – 0.2% | | | | | |
| Asset-Backed & Securitized – 0.0% | | | | | |
| Falcon Franchise Loan LLC, FRN, 7.269%, 2023 (i)(z) | | $ | 137,769 | | | $ | 16,532 | |
| | | | | | | | |
| | | | | | | | |
| Issuer | | Shares/Par | | | Value ($) | |
| | | | | | | | |
| BONDS – continued | | | | | |
| Utilities – Electric Power – 0.2% | | | | | |
| Viridian Group FundCo II, Ltd., 11.125%, 2017 (z) | | $ | 436,000 | | | $ | 447,990 | |
| | | | | | | | |
Total Bonds
(Identified Cost, $429,945) | | | | | | $ | 464,522 | |
| | | | | | | | |
|
| CONVERTIBLE PREFERRED STOCKS – 5.5% | |
| Utilities – Electric Power – 5.5% | | | | | |
| Dominion Resources, Inc., “A”, 6.125% | | | 30,240 | | | $ | 1,518,048 | |
| Dominion Resources, Inc., “B”, 6% | | | 30,240 | | | | 1,513,512 | |
| NextEra Energy, Inc., 7% | | | 59,310 | | | | 3,603,083 | |
| NextEra Energy, Inc., 8.375% | | | 41,040 | | | | 2,279,362 | |
| PPL Corp., 9.5% | | | 65,290 | | | | 3,421,849 | |
| PPL Corp., 8.75% | | | 80,380 | | | | 4,342,128 | |
| | | | | | | | |
Total Convertible Preferred Stocks
(Identified Cost, $15,834,234) | | | | | | $ | 16,677,982 | |
| | | | | | | | |
| |
| CONVERTIBLE BONDS – 0.8% | | | | | |
| Telecommunications – Wireless – 0.8% | | | | | |
| SBA Communications Corp., 4%, 2014 (Identified Cost, $1,093,485) | | $ | 951,000 | | | $ | 2,331,139 | |
| | | | | | | | |
| |
| MONEY MARKET FUNDS – 1.6% | | | | | |
| MFS Institutional Money Market Portfolio, 0.11%, at Cost and Net Asset Value (v) | | | 4,650,944 | | | $ | 4,650,944 | |
| | | | | | | | |
| COLLATERAL FOR SECURITIES LOANED – 0.9% | | | | | |
Navigator Securities Lending Prime Portfolio, 0.17%, at Cost and
Net Asset Value (j) | | | 2,812,072 | | | $ | 2,812,072 | |
| | | | | | | | |
| Total Investments (Identified Cost, $290,049,703) | | | | | | $ | 302,342,174 | |
| | | | | | | | |
OTHER ASSETS, LESS
LIABILITIES – (0.3)% | | | | | | | (774,592 | ) |
| | | | | | | | |
| Net Assets – 100.0% | | | | | | $ | 301,567,582 | |
| | | | | | | | |
| (a) | | Non-income producing security. |
| (i) | | Interest only security for which the series receives interest on notional principal (Par amount). Par amount shown is the notional principal and does not reflect the cost of the security. |
| (j) | | The rate quoted is the annualized seven-day yield of the fund at period end. |
| (l) | | A portion of this security is on loan. |
| (v) | | Underlying affiliated fund that is available only to investment companies managed by MFS. The rate quoted for the MFS Institutional Money Market Portfolio is the annualized seven-day yield of the fund at period end. |
| (z) | | Restricted securities are not registered under the Securities Act of 1933 and are subject to legal restrictions on resale. These securities generally may be resold in transactions exempt from registration or to the public if the securities are subsequently registered. Disposal of these securities may involve time-consuming negotiations and prompt sale at an acceptable price may be difficult. The fund holds the following restricted securities: |
| | | | | | | | | | |
| Restricted Securities | | Acquisition
Date | | Cost | | | Value | |
| Falcon Franchise Loan LLC, FRN, 7.269%, 2023 | | 1/18/02 | | | $5,273 | | | | $16,532 | |
| Viridian Group FundCo II, Ltd., 11.125%, 2017 | | 3/01/12 | | | 424,672 | | | | 447,990 | |
| Total Restricted Securities | | | | | | | | | $464,522 | |
| % of Net assets | | | | | | | | | 0.2% | |
5
MFS Utilities Portfolio
Portfolio of Investments (unaudited) – continued
The following abbreviations are used in this report and are defined:
| ADR | | American Depositary Receipt |
| FRN | | Floating Rate Note. Interest rate resets periodically and may not be the rate reported at period end. |
| GDR | | Global Depositary Receipt |
| IEU | | International Equity Unit |
| IPS | | International Preference Stock |
| PLC | | Public Limited Company |
| REIT | | Real Estate Investment Trust |
Abbreviations indicate amounts shown in currencies other than the U.S. dollar. All amounts are stated in U.S. dollars unless otherwise indicated. A list of abbreviations is shown below:
Derivative Contracts at 6/30/13
Forward Foreign Currency Exchange Contracts at 6/30/13
| | | | | | | | | | | | | | | | | | | | | | | | |
| Type | | | | Currency | | | Counterparty | | Contracts to Deliver/Receive | | Settlement Date
Range | | In Exchange For | | | Contracts at Value | | | Net Unrealized
Appreciation
(Depreciation) | |
| Asset Derivatives | | | | | | | | | | | | | | | | |
| BUY | | | | | EUR | | | UBS AG | | 76,234 | | 7/16/13 | | $ | 99,132 | | | $ | 99,235 | | | $ | 103 | |
| SELL | | | | | EUR | | | Barclays Bank PLC | | 7,304,206 | | 9/18/13 | | | 9,733,951 | | | | 9,510,753 | | | | 223,198 | |
| SELL | | | | | EUR | | | Citibank N.A. | | 38,885 | | 7/16/13 | | | 50,635 | | | | 50,618 | | | | 17 | |
| SELL | | | | | EUR | | | Credit Suisse Group | | 100,103 | | 7/16/13 | | | 131,070 | | | | 130,307 | | | | 763 | |
| SELL | | | | | EUR | | | Deutsche Bank AG | | 2,208,670 | | 7/16/13 | | | 2,887,398 | | | | 2,875,074 | | | | 12,324 | |
| SELL | | | | | EUR | | | JPMorgan Chase Bank N.A. | | 3,553,524 | | 7/16/13 | | | 4,651,291 | | | | 4,625,699 | | | | 25,592 | |
| SELL | | | | | EUR | | | UBS AG | | 7,335,367 | | 7/16/13-9/18/13 | | | 9,774,882 | | | | 9,551,315 | | | | 223,567 | |
| SELL | | | | | GBP | | | Barclays Bank PLC | | 627,422 | | 7/15/13-7/16/13 | | | 973,467 | | | | 954,188 | | | | 19,279 | |
| SELL | | | | | GBP | | | Credit Suisse Group | | 3,136,692 | | 7/16/13 | | | 4,806,635 | | | | 4,770,297 | | | | 36,338 | |
| SELL | | | | | GBP | | | Deutsche Bank AG | | 3,253,598 | | 7/16/13 | | | 4,989,070 | | | | 4,948,088 | | | | 40,982 | |
| SELL | | | | | GBP | | | JPMorgan Chase Bank N.A. | | 673,299 | | 7/16/13 | | | 1,024,026 | | | | 1,023,956 | | | | 70 | |
| | | | | | | | | | | | | | | | | | | | | | | | |
| | | | | | | | | | | | | | | | | | | | | | $ | 582,233 | |
| | | | | | | | | | | | | | | | | | | | | | | | |
| Liability Derivatives | | | | | | | | | | | | | | | | |
| BUY | | | | | EUR | | | Barclays Bank PLC | | 158,559 | | 7/16/13 | | $ | 208,307 | | | $ | 206,399 | | | $ | (1,908 | ) |
| BUY | | | | | EUR | | | Credit Suisse Group | | 134,066 | | 7/16/13 | | | 177,297 | | | | 174,516 | | | | (2,781 | ) |
| BUY | | | | | EUR | | | Deutsche Bank AG | | 73,698 | | 7/16/13 | | | 97,741 | | | | 95,934 | | | | (1,807 | ) |
| BUY | | | | | EUR | | | Goldman Sachs International | | 62,267 | | 7/16/13 | | | 81,290 | | | | 81,054 | | | | (236 | ) |
| BUY | | | | | EUR | | | JPMorgan Chase Bank N.A. | | 371,235 | | 7/16/13 | | | 490,701 | | | | 483,245 | | | | (7,456 | ) |
| BUY | | | | | EUR | | | UBS AG | | 345,807 | | 7/16/13 | | | 455,416 | | | | 450,144 | | | | (5,272 | ) |
| SELL | | | | | EUR | | | Barclays Bank PLC | | 1,181 | | 7/16/13 | | | 1,534 | | | | 1,537 | | | | (3 | ) |
| SELL | | | | | EUR | | | Deutsche Bank AG | | 156,299 | | 7/16/13 | | | 202,552 | | | | 203,458 | | | | (906 | ) |
| SELL | | | | | EUR | | | Goldman Sachs International | | 72,916 | | 7/16/13 | | | 93,571 | | | | 94,917 | | | | (1,346 | ) |
| SELL | | | | | EUR | | | JPMorgan Chase Bank N.A. | | 1,698,903 | | 7/16/13 | | | 2,198,767 | | | | 2,211,499 | | | | (12,732 | ) |
| BUY | | | | | GBP | | | Barclays Bank PLC | | 780,000 | | 9/18/13 | | | 1,223,137 | | | | 1,185,736 | | | | (37,401 | ) |
| BUY | | | | | GBP | | | Credit Suisse Group | | 73,386 | | 7/16/13 | | | 112,167 | | | | 111,606 | | | | (561 | ) |
| BUY | | | | | GBP | | | JPMorgan Chase Bank N.A. | | 3,790,432 | | 7/16/13 | | | 5,863,075 | | | | 5,764,508 | | | | (98,567 | ) |
| SELL | | | | | GBP | | | Citibank N.A. | | 198,183 | | 7/16/13 | | | 300,712 | | | | 301,398 | | | | (686 | ) |
| | | | | | | | | | | | | | | | | | | | | | | | |
| | | | | | | | | | | | | | | | | | | | | | $ | (171,662 | ) |
| | | | | | | | | | | | | | | | | | | | | | | | |
See Notes to Financial Statements
6
MFS Utilities Portfolio
FINANCIAL STATEMENTS | STATEMENT OF ASSETS AND LIABILITIES (unaudited)
This statement represents your fund’s balance sheet, which details the assets and liabilities comprising the total value of the fund.
| | | | | | | | |
At 6/30/13 | | | | | | | | |
Assets | | | | | | | | |
Investments – | | | | | | | | |
Non-affiliated issuers, at value (identified cost, $285,398,759) | | | $297,691,230 | | | | | |
Underlying affiliated funds, at cost and value | | | 4,650,944 | | | | | |
Total investments, at value, including $2,710,134 of securities on loan (identified cost, $290,049,703) | | | $302,342,174 | | | | | |
Cash | | | 110,303 | | | | | |
Restricted cash | | | 40,000 | | | | | |
Foreign currency, at value (identified cost, $115,494) | | | 114,254 | | | | | |
Receivables for | | | | | | | | |
Forward foreign currency exchange contracts | | | 582,233 | | | | | |
Investments sold | | | 2,630,699 | | | | | |
Fund shares sold | | | 259,895 | | | | | |
Interest and dividends | | | 1,473,921 | | | | | |
Other assets | | | 1,797 | | | | | |
Total assets | | | | | | | $307,555,276 | |
Liabilities | | | | | | | | |
Payables for | | | | | | | | |
Forward foreign currency exchange contracts | | | $171,662 | | | | | |
Investments purchased | | | 1,960,646 | | | | | |
Fund shares reacquired | | | 772,818 | | | | | |
Collateral for securities loaned, at value | | | 2,812,072 | | | | | |
Payable to affiliates | | | | | | | | |
Investment adviser | | | 26,707 | | | | | |
Shareholder servicing costs | | | 92 | | | | | |
Distribution and/or service fees | | | 3,307 | | | | | |
Payable for independent Trustees’ compensation | | | 1,673 | | | | | |
Deferred country tax expense payable | | | 169,607 | | | | | |
Accrued expenses and other liabilities | | | 69,110 | | | | | |
Total liabilities | | | | | | | $5,987,694 | |
Net assets | | | | | | | $301,567,582 | |
Net assets consist of | | | | | | | | |
Paid-in capital | | | $235,322,202 | | | | | |
Unrealized appreciation (depreciation) on investments and translation of assets and liabilities in foreign currencies (net of $17,796 deferred country tax) | | | 12,641,205 | | | | | |
Accumulated net realized gain (loss) on investments and foreign currency | | | 39,006,453 | | | | | |
Undistributed net investment income | | | 14,597,722 | | | | | |
Net assets | | | | | | | $301,567,582 | |
Shares of beneficial interest outstanding | | | | | | | 11,348,518 | |
| | | | | | | | | | | | |
| | | Net assets | | | Shares
outstanding | | | Net asset value
per share | |
Initial Class | | | $180,320,862 | | | | 6,752,583 | | | | $26.70 | |
Service Class | | | 121,246,720 | | | | 4,595,935 | | | | 26.38 | |
See Notes to Financial Statements
7
MFS Utilities Portfolio
FINANCIAL STATEMENTS | STATEMENT OF OPERATIONS (unaudited)
This statement describes how much your fund earned in investment income and accrued in expenses. It also describes any gains and/or losses generated by fund operations.
| | | | | | | | |
Six months ended 6/30/13 | | | | | | | | |
Net investment income | | | | | | | | |
Income | | | | | | | | |
Dividends | | | $7,260,251 | | | | | |
Interest | | | 117,322 | | | | | |
Dividends from underlying affiliated funds | | | 4,914 | | | | | |
Foreign taxes withheld | | | (380,196 | ) | | | | |
Total investment income | | | | | | | $7,002,291 | |
Expenses | | | | | | | | |
Management fee | | | $1,143,422 | | | | | |
Distribution and/or service fees | | | 152,541 | | | | | |
Shareholder servicing costs | | | 2,192 | | | | | |
Administrative services fee | | | 24,596 | | | | | |
Independent Trustees’ compensation | | | 5,047 | | | | | |
Custodian fee | | | 58,103 | | | | | |
Shareholder communications | | | 8,999 | | | | | |
Audit and tax fees | | | 24,526 | | | | | |
Legal fees | | | 2,539 | | | | | |
Miscellaneous | | | 11,745 | | | | | |
Total expenses | | | | | | | $1,433,710 | |
Fees paid indirectly | | | (12 | ) | | | | |
Reduction of expenses by investment adviser | | | (1,002 | ) | | | | |
Net expenses | | | | | | | $1,432,696 | |
Net investment income | | | | | | | $5,569,595 | |
Realized and unrealized gain (loss) on investments and foreign currency | | | | | | | | |
Realized gain (loss) (identified cost basis) | | | | | | | | |
Investments (net of $74,505 country tax) | | | $17,862,964 | | | | | |
Foreign currency | | | (170,717 | ) | | | | |
Net realized gain (loss) on investments and foreign currency | | | | | | | $17,692,247 | |
Change in unrealized appreciation (depreciation) | | | | | | | | |
Investments (net of $68,358 decrease in deferred country tax) | | | $3,999,360 | | | | | |
Translation of assets and liabilities in foreign currencies | | | 938,592 | | | | | |
Net unrealized gain (loss) on investments and foreign currency translation | | | | | | | $4,937,952 | |
Net realized and unrealized gain (loss) on investments and foreign currency | | | | | | | $22,630,199 | |
Change in net assets from operations | | | | | | | $28,199,794 | |
See Notes to Financial Statements
8
MFS Utilities Portfolio
FINANCIAL STATEMENTS | STATEMENTS OF CHANGES IN NET ASSETS
These statements describe the increases and/or decreases in net assets resulting from operations, any distributions, and any shareholder transactions.
| | | | | | | | |
| |
| Six months ended
6/30/13
(unaudited |
) | |
| Year ended
12/31/12 |
|
Change in net assets | | | | | | | | |
| From operations | | | | | | | | |
Net investment income | | | $5,569,595 | | | | $9,333,094 | |
Net realized gain (loss) on investments and foreign currency | | | 17,692,247 | | | | 29,384,722 | |
Net unrealized gain (loss) on investments and foreign currency translation | | | 4,937,952 | | | | 1,040,198 | |
Change in net assets from operations | | | $28,199,794 | | | | $39,758,014 | |
| Distributions declared to shareholders | | | | | | | | |
From net investment income | | | $— | | | | $(13,720,002 | ) |
Change in net assets from fund share transactions | | | $(21,707,714 | ) | | | $(39,940,105 | ) |
Total change in net assets | | | $6,492,080 | | | | $(13,902,093 | ) |
| Net assets | | | | | | | | |
At beginning of period | | | 295,075,502 | | | | 308,977,595 | |
At end of period (including undistributed net investment income of $14,597,722 and
$9,028,127, respectively) | | | $301,567,582 | | | | $295,075,502 | |
See Notes to Financial Statements
9
MFS Utilities Portfolio
FINANCIAL STATEMENTS | FINANCIAL HIGHLIGHTS
The financial highlights table is intended to help you understand the fund’s financial performance for the semiannual period and the past 5 fiscal years. Certain information reflects financial results for a single fund share. The total returns in the table represent the rate by which an investor would have earned (or lost) on an investment in the fund share class (assuming reinvestment of all distributions) held for the entire period.
| | | | | | | | | | | | | | | | | | | | | | | | |
| Initial Class | | Six months
ended
6/30/13 | | | Years ended 12/31 | |
| | | | 2012 | | | 2011 | | | 2010 | | | 2009 | | | 2008 | |
| | | (unaudited) | | | | | | | | | | | | | | | | |
Net asset value, beginning of period | | | $24.33 | | | | $22.34 | | | | $21.64 | | | | $19.61 | | | | $15.56 | | | | $29.51 | |
| Income (loss) from investment operations | | | | | | | | | | | | | | | | | | | | | | | | |
Net investment income (d) | | | $0.49 | | | | $0.74 | | | | $0.83 | | | | $0.67 | | | | $0.69 | | | | $0.62 | |
Net realized and unrealized gain (loss) on investments
and foreign currency | | | 1.88 | | | | 2.36 | | | | 0.67 | | | | 1.98 | | | | 4.21 | | | | (9.78 | ) |
Total from investment operations | | | $2.37 | | | | $3.10 | | | | $1.50 | | | | $2.65 | | | | $4.90 | | | | $(9.16 | ) |
| Less distributions declared to shareholders | | | | | | | | | | | | | | | | | | | | | | | | |
From net investment income | | | $— | | | | $(1.11 | ) | | | $(0.80 | ) | | | $(0.62 | ) | | | $(0.85 | ) | | | $(0.47 | ) |
From net realized gain on investments | | | — | | | | — | | | | — | | | | — | | | | — | | | | (4.32 | ) |
Total distributions declared to shareholders | | | $— | | | | $(1.11 | ) | | | $(0.80 | ) | | | $(0.62 | ) | | | $(0.85 | ) | | | $(4.79 | ) |
Net asset value, end of period (x) | | | $26.70 | | | | $24.33 | | | | $22.34 | | | | $21.64 | | | | $19.61 | | | | $15.56 | |
Total return (%) (k)(r)(s)(x) | | | 9.74 | (n) | | | 14.11 | | | | 7.12 | | | | 13.90 | | | | 33.63 | | | | (37.16 | ) |
Ratios (%) (to average net assets)
and Supplemental data: | | | | | | | | | | | | | | | | | | | | | | | | |
Expenses before expense reductions (f) | | | 0.84 | (a) | | | 0.84 | | | | 0.87 | | | | 0.88 | | | | 0.88 | | | | 0.86 | |
Expenses after expense reductions (f) | | | 0.84 | (a) | | | 0.84 | | | | N/A | | | | N/A | | | | N/A | | | | N/A | |
Net investment income | | | 3.74 | (a) | | | 3.17 | | | | 3.69 | | | | 3.43 | | | | 4.14 | | | | 2.73 | |
Portfolio turnover | | | 28 | (n) | | | 48 | | | | 52 | | | | 55 | | | | 70 | | | | 63 | |
Net assets at end of period (000 omitted) | | | $180,321 | | | | $176,525 | | | | $178,973 | | | | $191,566 | | | | $199,634 | | | | $178,805 | |
| | |
| Service Class | | Six months
ended
6/30/13 | | | Years ended 12/31 | |
| | | | 2012 | | | 2011 | | | 2010 | | | 2009 | | | 2008 | |
| | | (unaudited) | | | | | | | | | | | | | | | | |
Net asset value, beginning of period | | | $24.06 | | | | $22.10 | | | | $21.42 | | | | $19.43 | | | | $15.41 | | | | $29.28 | |
| Income (loss) from investment operations | | | | | | | | | | | | | | | | | | | | | | | | |
Net investment income (d) | | | $0.45 | | | | $0.67 | | | | $0.77 | | | | $0.62 | | | | $0.63 | | | | $0.57 | |
Net realized and unrealized gain (loss) on investments
and foreign currency | | | 1.87 | | | | 2.34 | | | | 0.66 | | | | 1.96 | | | | 4.18 | | | | (9.71 | ) |
Total from investment operations | | | $2.32 | | | | $3.01 | | | | $1.43 | | | | $2.58 | | | | $4.81 | | | | $(9.14 | ) |
| Less distributions declared to shareholders | | | | | | | | | | | | | | | | | | | | | | | | |
From net investment income | | | $— | | | | $(1.05 | ) | | | $(0.75 | ) | | | $(0.59 | ) | | | $(0.79 | ) | | | $(0.41 | ) |
From net realized gain on investments | | | — | | | | — | | | | — | | | | — | | | | — | | | | (4.32 | ) |
Total distributions declared to shareholders | | | $— | | | | $(1.05 | ) | | | $(0.75 | ) | | | $(0.59 | ) | | | $(0.79 | ) | | | $(4.73 | ) |
Net asset value, end of period (x) | | | $26.38 | | | | $24.06 | | | | $22.10 | | | | $21.42 | | | | $19.43 | | | | $15.41 | |
Total return (%) (k)(r)(s)(x) | | | 9.64 | (n) | | | 13.83 | | | | 6.84 | | | | 13.60 | | | | 33.27 | | | | (37.31 | ) |
Ratios (%) (to average net assets)
and Supplemental data: | | | | | | | | | | | | | | | | | | | | | | | | |
Expenses before expense reductions (f) | | | 1.09 | (a) | | | 1.09 | | | | 1.12 | | | | 1.13 | | | | 1.13 | | | | 1.12 | |
Expenses after expense reductions (f) | | | 1.09 | (a) | | | 1.09 | | | | N/A | | | | N/A | | | | N/A | | | | N/A | |
Net investment income | | | 3.50 | (a) | | | 2.92 | | | | 3.43 | | | | 3.20 | | | | 3.81 | | | | 2.57 | |
Portfolio turnover | | | 28 | (n) | | | 48 | | | | 52 | | | | 55 | | | | 70 | | | | 63 | |
Net assets at end of period (000 omitted) | | | $121,247 | | | | $118,550 | | | | $130,005 | | | | $125,116 | | | | $115,435 | | | | $83,248 | |
See Notes to Financial Statements
10
MFS Utilities Portfolio
Financial Highlights – continued
| (d) | Per share data is based on average shares outstanding. |
| (f) | Ratios do not reflect reductions from fees paid indirectly, if applicable. |
| (k) | The total return does not reflect expenses that apply to separate accounts. Inclusion of these charges would reduce the total return figures for all periods shown. |
| (r) | Certain expenses have been reduced without which performance would have been lower. |
| (s) | From time to time the fund may receive proceeds from litigation settlements, without which performance would be lower. Excluding the effect of the proceeds received from a non-recurring litigation settlement against Enron Corp., the Initial Class and Service Class total returns for the year ended December 31, 2008 would have been lower by approximately 1.01%. |
| (x) | The net asset values per share and total returns have been calculated on net assets which include adjustments made in accordance with U.S. generally accepted accounting principles required at period end for financial reporting purposes. |
See Notes to Financial Statements
11
MFS Utilities Portfolio
NOTES TO FINANCIAL STATEMENTS (unaudited)
| (1) | | Business and Organization |
MFS Utilities Portfolio (the fund) is a series of MFS Variable Insurance Trust II (the trust). The trust is organized as a Massachusetts business trust and is registered under the Investment Company Act of 1940, as amended, as an open-end management investment company. The shareholders of each series of the trust are separate accounts of insurance companies, which offer variable annuity and/or life insurance products, and qualified retirement and pension plans.
| (2) | | Significant Accounting Policies |
General – The preparation of financial statements in conformity with U.S. generally accepted accounting principles requires management to make estimates and assumptions that affect the reported amounts of assets and liabilities, and disclosure of contingent assets and liabilities at the date of the financial statements and the reported amounts of revenues and expenses during the reporting period. Actual results could differ from those estimates. In the preparation of these financial statements, management has evaluated subsequent events occurring after the date of the fund’s Statement of Assets and Liabilities through the date that the financial statements were issued. The fund invests primarily in securities of issuers in the utility industry. Issuers in a single industry can react similarly to market, economic, political and regulatory conditions and developments. The fund invests in foreign securities, including securities of emerging market issuers. Investments in foreign securities are vulnerable to the effects of changes in the relative values of the local currency and the U.S. dollar and to the effects of changes in each country’s legal, political, and economic environment. The markets of emerging markets countries are generally more volatile than the markets of developed countries with more mature economies. All of the risks of investing in foreign securities previously described are heightened when investing in emerging markets countries.
In this reporting period, the fund adopted the disclosure provisions of the Financial Accounting Standards Board (FASB) Accounting Standards Update 2011-11 (“ASU 2011-11”), Balance Sheet (Topic 210) – Disclosures about Offsetting Assets and Liabilities along with the related scope clarification provisions of FASB Accounting Standards Update 2013-01 (“ASU 2013-01”) entitled Balance Sheet (Topic 210) – Clarifying the Scope of Disclosures about Offsetting Assets and Liabilities. ASU 2011-11 is intended to enhance disclosures on the offsetting of financial assets and liabilities by requiring entities to disclose both gross and net information about financial instruments and transactions that are either offset in the statement of financial position or subject to a Master Netting Agreement or similar arrangement. ASU 2013-01 limits the scope of ASU 2011-11’s disclosure requirements on offsetting to financial assets and financial liabilities related to derivatives, repurchase and reverse repurchase agreements, and securities lending and securities borrowing transactions. The disclosures required by ASU 2011-11, to the extent applicable to the fund, have been included in the fund’s Significant Accounting Policies note under the captions for each of the fund’s in-scope financial instruments and transactions.
In June 2013, FASB issued Accounting Standards Update 2013-08 Financial Services – Investment Companies (Topic 946) – Amendments to the Scope, Measurement, and Disclosure Requirements (“ASU 2013-08”) which is effective for interim and annual reporting periods in fiscal years that begin after December 15, 2013. ASU 2013-08 sets forth a methodology for determining whether an entity should be characterized as an investment company and prescribes fair value accounting for an investment company’s non-controlling ownership interest in another investment company. FASB has determined that a fund registered under the Investment Company Act of 1940 automatically meets ASU 2013-08’s criteria for an investment company. Although still evaluating the potential impacts of ASU 2013-08 to the fund, management expects that the impact of the fund’s adoption will be limited to additional financial statement disclosures.
Investment Valuations – Equity securities, including restricted equity securities, are generally valued at the last sale or official closing price as provided by a third-party pricing service on the market or exchange on which they are primarily traded. Equity securities, for which there were no sales reported that day, are generally valued at the last quoted daily bid quotation as provided by a third-party pricing service on the market or exchange on which such securities are primarily traded. Debt instruments and floating rate loans (other than short-term instruments), including restricted debt instruments, are generally valued at an evaluated or composite bid as provided by a third-party pricing service. Short-term instruments with a maturity at issuance of 60 days or less generally are valued at amortized cost, which approximates market value. Forward foreign currency exchange contracts are generally valued at the mean of bid and asked prices for the time period interpolated from rates provided by a third-party pricing service for proximate time periods. Open-end investment companies are generally valued at net asset value per share. Securities and other assets generally valued on the basis of information from a third-party pricing service may also be valued at a broker/dealer bid quotation. Values obtained from third-party pricing services can utilize both transaction data and market information such as yield, quality, coupon rate, maturity, type of issue, trading characteristics, and other market data. The values of foreign securities and other assets and liabilities expressed in foreign currencies are converted to U.S. dollars using the mean of bid and asked prices for rates provided by a third-party pricing service.
The Board of Trustees has delegated primary responsibility for determining or causing to be determined the value of the fund’s investments (including any fair valuation) to the adviser pursuant to valuation policies and procedures approved by the Board. If the adviser determines that reliable market quotations are not readily available, investments are valued at fair value as determined in good faith by the adviser in accordance with such procedures under the oversight of the Board of Trustees. Under the fund’s
12
MFS Utilities Portfolio
Notes to Financial Statements (unaudited) – continued
valuation policies and procedures, market quotations are not considered to be readily available for most types of debt instruments and floating rate loans and many types of derivatives. These investments are generally valued at fair value based on information from third-party pricing services. In addition, investments may be valued at fair value if the adviser determines that an investment’s value has been materially affected by events occurring after the close of the exchange or market on which the investment is principally traded (such as foreign exchange or market) and prior to the determination of the fund’s net asset value, or after the halting of trading of a specific security where trading does not resume prior to the close of the exchange or market on which the security is principally traded. Events that occur on a frequent basis after foreign markets close (such as developments in foreign markets and significant movements in the U.S. markets) and prior to the determination of the fund’s net asset value may be deemed to have a material effect on the value of securities traded in foreign markets. Accordingly, the fund’s foreign equity securities may often be valued at fair value. The adviser generally relies on third-party pricing services or other information (such as the correlation with price movements of similar securities in the same or other markets; the type, cost and investment characteristics of the security; the business and financial condition of the issuer; and trading and other market data) to assist in determining whether to fair value and at what value to fair value an investment. The value of an investment for purposes of calculating the fund’s net asset value can differ depending on the source and method used to determine value. When fair valuation is used, the value of an investment used to determine the fund’s net asset value may differ from quoted or published prices for the same investment. There can be no assurance that the fund could obtain the fair value assigned to an investment if it were to sell the investment at the same time at which the fund determines its net asset value per share.
Various inputs are used in determining the value of the fund’s assets or liabilities. These inputs are categorized into three broad levels. In certain cases, the inputs used to measure fair value may fall into different levels of the fair value hierarchy. In such cases, an investment’s level within the fair value hierarchy is based on the lowest level of input that is significant to the fair value measurement. The fund’s assessment of the significance of a particular input to the fair value measurement in its entirety requires judgment, and considers factors specific to the investment. Level 1 includes unadjusted quoted prices in active markets for identical assets or liabilities. Level 2 includes other significant observable market-based inputs (including quoted prices for similar securities, interest rates, prepayment speed, and credit risk). Level 3 includes unobservable inputs, which may include the adviser’s own assumptions in determining the fair value of investments. Other financial instruments are derivative instruments not reflected in total investments, such as forward foreign currency exchange contracts. The following is a summary of the levels used as of June 30, 2013 in valuing the fund’s assets or liabilities:
| | | | | | | | | | | | | | | | |
| Investments at Value | | Level 1 | | | Level 2 | | | Level 3 | | | Total | |
| Equity Securities: | | | | | | | | | | | | | | | | |
United States | | | $193,230,314 | | | | $— | | | | $— | | | | $193,230,314 | |
Brazil | | | 17,747,281 | | | | — | | | | — | | | | 17,747,281 | |
Portugal | | | 10,386,344 | | | | 4,951,237 | | | | — | | | | 15,337,581 | |
Spain | | | 4,162,730 | | | | 7,709,967 | | | | — | | | | 11,872,697 | |
United Kingdom | | | — | | | | 7,396,782 | | | | — | | | | 7,396,782 | |
Russia | | | 4,493,982 | | | | 647,412 | | | | — | | | | 5,141,394 | |
Canada | | | 4,718,982 | | | | — | | | | — | | | | 4,718,982 | |
Italy | | | 2,416,747 | | | | 1,812,852 | | | | — | | | | 4,229,599 | |
Israel | | | 3,800,619 | | | | — | | | | — | | | | 3,800,619 | |
Other Countries | | | 9,531,011 | | | | 19,077,237 | | | | — | | | | 28,608,248 | |
| U.S. Corporate Bonds | | | — | | | | 2,331,139 | | | | — | | | | 2,331,139 | |
| Commercial Mortgage-Backed Securities | | | — | | | | 16,532 | | | | — | | | | 16,532 | |
| Foreign Bonds | | | — | | | | 447,990 | | | | — | | | | 447,990 | |
| Mutual Funds | | | 7,463,016 | | | | — | | | | — | | | | 7,463,016 | |
| Total Investments | | | $257,951,026 | | | | $44,391,148 | | | | $— | | | | $302,342,174 | |
| | | | |
| Other Financial Instruments | | | | | | | | | | | | |
| Forward Foreign Currency Exchange Contracts | | | $— | | | | $410,571 | | | | $— | | | | $410,571 | |
For further information regarding security characteristics, see the Portfolio of Investments.
Of the level 2 investments presented above, equity investments amounting to $5,652,373 would have been considered level 1 investments at the beginning of the period. Of the level 1 investments presented above, equity investments amounting to $25,032,625 would have been considered level 2 investments at the beginning of the period. The primary reason for changes in the classifications between levels 1 and 2 occurs when foreign equity securities are fair valued using other observable market-based inputs in place of the closing exchange price due to events occurring after the close of the exchange or market on which the investment is principally traded. The fund’s foreign equity securities may often be valued at fair value. The fund’s policy is to recognize transfers between the levels as of the end of the period.
13
MFS Utilities Portfolio
Notes to Financial Statements (unaudited) – continued
Foreign Currency Translation – Purchases and sales of foreign investments, income, and expenses are converted into U.S. dollars based upon currency exchange rates prevailing on the respective dates of such transactions or on the reporting date for foreign denominated receivables and payables. Gains and losses attributable to foreign currency exchange rates on sales of securities are recorded for financial statement purposes as net realized gains and losses on investments. Gains and losses attributable to foreign exchange rate movements on receivables, payables, income and expenses are recorded for financial statement purposes as foreign currency transaction gains and losses. That portion of both realized and unrealized gains and losses on investments that results from fluctuations in foreign currency exchange rates is not separately disclosed.
Derivatives – The fund uses derivatives for different purposes, primarily to increase or decrease exposure to a particular market or segment of the market, or security, to increase or decrease interest rate or currency exposure, or as alternatives to direct investments. Derivatives are used for hedging or non-hedging purposes. While hedging can reduce or eliminate losses, it can also reduce or eliminate gains. When the fund uses derivatives as an investment to increase market exposure, or for hedging purposes, gains and losses from derivative instruments may be substantially greater than the derivative’s original cost.
The derivative instruments used by the fund were forward foreign currency exchange contracts. The fund’s period end derivatives, as presented in the Portfolio of Investments and the associated Derivative Contract tables generally are indicative of the volume of its derivative activity during the period.
The following table presents, by major type of derivative contract, the fair value, on a gross basis, of the asset and liability components of derivatives held by the fund at June 30, 2013 as reported in the Statement of Assets and Liabilities:
| | | | | | | | | | |
| | | | | Fair Value | |
| Risk | | Derivative Contracts | | Asset Derivatives | | | Liability Derivatives | |
| Foreign Exchange | | Forward Foreign Currency Exchange | | | $582,233 | | | | $(171,662 | ) |
The following table presents, by major type of derivative contract, the realized gain (loss) on derivatives held by the fund for the six months ended June 30, 2013 as reported in the Statement of Operations:
| | | | |
| Risk | | Foreign Currency Transactions | |
| Foreign Exchange | | | $(118,710 | ) |
The following table presents, by major type of derivative contract, the change in unrealized appreciation (depreciation) on derivatives held by the fund for the six months ended June 30, 2013 as reported in the Statement of Operations:
| | | | |
| Risk | | Translation of Assets and Liabilities in Foreign Currencies | |
| Foreign Exchange | | | $986,341 | |
Derivative counterparty credit risk is managed through formal evaluation of the creditworthiness of all potential counterparties. On certain, but not all, over-the-counter derivatives, the fund attempts to reduce its exposure to counterparty credit risk whenever possible by entering into an International Swaps and Derivatives Association (ISDA) Master Agreement on a bilateral basis with each of the counterparties with whom it undertakes a significant volume of transactions. The ISDA Master Agreement gives each party to the agreement the right to terminate all transactions traded under such agreement if there is a certain deterioration in the credit quality of the other party. Upon an event of default or a termination of the ISDA Master Agreement, the non-defaulting party has the right to close out all transactions traded under such agreement and to net amounts owed under each transaction to one net amount payable by one party to the other. This right to close out and net payments across all transactions traded under the ISDA Master Agreement could result in a reduction of the fund’s credit risk to such counterparty equal to any amounts payable by the fund under the applicable transactions, if any.
Collateral and margin requirements differ by type of derivative. Margin requirements are set by the broker or clearing house for cleared derivatives (i.e., futures contracts, cleared swaps, and exchange-traded options) while collateral terms are contract specific for over-the-counter traded derivatives (i.e., forward foreign currency exchange contracts, uncleared swap agreements, and over-the-counter options). For derivatives traded under an ISDA Master Agreement, the collateral requirements are netted across all transactions traded under such agreement and one amount is posted from one party to the other to collateralize such obligations. Cash that has been segregated to cover the fund’s collateral or margin obligations under derivative contracts, if any, will be reported separately in the Statement of Assets and Liabilities as “Restricted cash”. Securities pledged as collateral or margin for the same purpose, if any, is noted in the Portfolio of Investments.
The fund’s accounting policy with respect to balance sheet offsetting is that, absent an event of default by the counterparty or a termination of the agreement, the ISDA Master Agreement does not result in an offset of reported amounts of financial assets and financial liabilities in the Statement of Assets and Liabilities across transactions between the fund and the applicable counterparty.
14
MFS Utilities Portfolio
Notes to Financial Statements (unaudited) – continued
Forward Foreign Currency Exchange Contracts – The fund entered into forward foreign currency exchange contracts for the purchase or sale of a specific foreign currency at a fixed price on a future date. These contracts may be used to hedge the fund’s currency risk or for non-hedging purposes. For hedging purposes, the fund may enter into contracts to deliver or receive foreign currency that the fund will receive from or use in its normal investment activities. The fund may also use contracts to hedge against declines in the value of foreign currency denominated securities due to unfavorable exchange rate movements. For non-hedging purposes, the fund may enter into contracts with the intent of changing the relative exposure of the fund’s portfolio of securities to different currencies to take advantage of anticipated exchange rate changes.
Forward foreign currency exchange contracts are adjusted by the daily exchange rate of the underlying currency and any unrealized gains or losses are recorded as a receivable or payable for forward foreign currency exchange contracts until the contract settlement date. On contract settlement date, any gain or loss on the contract is recorded as realized gains or losses on foreign currency.
Risks may arise upon entering into these contracts from unanticipated movements in the value of the contract and from the potential inability of counterparties to meet the terms of their contracts. Generally, the fund’s maximum risk due to counterparty credit risk is the unrealized gain on the contract due to the use of Continuous Linked Settlement, an industry accepted settlement system. This risk is mitigated in cases where there is an ISDA Master Agreement between the fund and the counterparty providing for netting as described above and for posting of collateral by the counterparty to the fund to cover the fund’s exposure to the counterparty under such ISDA Master Agreement.
Security Loans – Under its Securities Lending Agency Agreement with the fund, State Street Bank and Trust Company (“State Street”), as lending agent, loans the securities of the fund to certain qualified institutions (the “Borrowers”) approved by the fund. The loans are collateralized by cash and/or U.S. Treasury and federal agency obligations in an amount typically at least equal to the market value of the securities loaned. The market value of the loaned securities is determined at the close of business of the fund and any additional required collateral is delivered to the fund on the next business day. State Street provides the fund with indemnification against Borrower default. In the event of Borrower default, State Street will for the benefit of the fund either purchase securities identical to those loaned or, when such purchase is commercially impracticable, pay the fund the market value of the loaned securities. In return, State Street assumes the fund’s rights to the related collateral. If the collateral value is less than the cost to purchase identical securities, State Street is responsible for the shortfall, but only to the extent that such shortfall is not due to a decline in collateral value resulting from collateral reinvestment for which the fund bears the risk of loss. On loans collateralized by cash, the cash collateral is invested in a money market fund or short-term securities. At period end, the fund had investment securities on loan with a fair value of $2,710,134 and a related liability of $2,812,072 for collateral received on securities loaned, both of which are presented gross on the Statement of Assets and Liabilities. The carrying value of the collateral for securities loaned approximates fair value which would have been considered level 2 under the fair value hierarchy if the collateral for securities loaned were carried at fair value. The collateral received on securities loaned exceeded the value of securities on loan at period end. A portion of the income generated upon investment of the collateral is remitted to the Borrowers, and the remainder is allocated between the fund and the lending agent. On loans collateralized by U.S. Treasury and/or federal agency obligations, a fee is received from the Borrower, and is allocated between the fund and the lending agent. Income from securities lending is included in “Interest” income in the Statement of Operations. The dividend and interest income earned on the securities loaned is accounted for in the same manner as other dividend and interest income.
Indemnifications – Under the fund’s organizational documents, its officers and Trustees may be indemnified against certain liabilities and expenses arising out of the performance of their duties to the fund. Additionally, in the normal course of business, the fund enters into agreements with service providers that may contain indemnification clauses. The fund’s maximum exposure under these agreements is unknown as this would involve future claims that may be made against the fund that have not yet occurred.
Investment Transactions and Income – Investment transactions are recorded on the trade date. Interest income is recorded on the accrual basis. All premium and discount is amortized or accreted for financial statement purposes in accordance with U.S. generally accepted accounting principles. Dividends received in cash are recorded on the ex-dividend date. Certain dividends from foreign securities will be recorded when the fund is informed of the dividend if such information is obtained subsequent to the ex-dividend date. Dividend and interest payments received in additional securities are recorded on the ex-dividend or ex-interest date in an amount equal to the value of the security on such date.
The fund may receive proceeds from litigation settlements. Any proceeds received from litigation involving portfolio holdings are reflected in the Statement of Operations in realized gain/loss if the security has been disposed of by the fund or in unrealized gain/loss if the security is still held by the fund. Any other proceeds from litigation not related to portfolio holdings are reflected as other income in the Statement of Operations.
Fees Paid Indirectly – The fund’s custody fee may be reduced according to an arrangement that measures the value of cash deposited with the custodian by the fund. This amount, for the six months ended June 30, 2013, is shown as a reduction of total expenses in the Statement of Operations.
15
MFS Utilities Portfolio
Notes to Financial Statements (unaudited) – continued
Tax Matters and Distributions – The fund intends to qualify as a regulated investment company, as defined under Subchapter M of the Internal Revenue Code, and to distribute all of its taxable income, including realized capital gains. As a result, no provision for federal income tax is required. The fund’s federal tax returns, when filed, will remain subject to examination by the Internal Revenue Service for a three year period. Foreign taxes have been accrued by the fund in the accompanying financial statements in accordance with the applicable foreign tax law. Foreign income taxes may be withheld by certain countries in which the fund invests. Additionally, capital gains realized by the fund on securities issued in or by certain foreign countries may be subject to capital gains tax imposed by those countries.
Distributions to shareholders are recorded on the ex-dividend date. Income and capital gain distributions are determined in accordance with income tax regulations, which may differ from U.S. generally accepted accounting principles. Certain capital accounts in the financial statements are periodically adjusted for permanent differences in order to reflect their tax character. These adjustments have no impact on net assets or net asset value per share. Temporary differences which arise from recognizing certain items of income, expense, gain or loss in different periods for financial statement and tax purposes will reverse at some time in the future. Distributions in excess of net investment income or net realized gains are temporary overdistributions for financial statement purposes resulting from differences in the recognition or classification of income or distributions for financial statement and tax purposes.
Book/tax differences primarily relate to amortization and accretion of debt securities, wash sale loss deferrals, and derivative transactions.
The tax character of distributions declared to shareholders for the last fiscal year is as follows:
| | | | |
| | | 12/31/12 | |
| Ordinary income (including any short-term capital gains) | | | $13,720,002 | |
The federal tax cost and the tax basis components of distributable earnings were as follows:
| | | | |
| As of 6/30/13 | | | | |
| Cost of investments | | | $290,468,381 | |
| Gross appreciation | | | 36,965,111 | |
| Gross depreciation | | | (25,091,318 | ) |
| Net unrealized appreciation (depreciation) | | | $11,873,793 | |
| |
| As of 12/31/12 | | | | |
| Undistributed ordinary income | | | 8,453,195 | |
| Undistributed long-term capital gain | | | 21,843,113 | |
| Other temporary differences | | | (160,590 | ) |
| Net unrealized appreciation (depreciation) | | | 7,909,868 | |
The aggregate cost above includes prior fiscal year end tax adjustments, if applicable.
Multiple Classes of Shares of Beneficial Interest – The fund offers multiple classes of shares, which differ in their respective distribution and/or service fees. The fund’s income, realized and unrealized gain (loss), and common expenses are allocated to shareholders based on the daily net assets of each class. Dividends are declared separately for each class. Differences in per share dividend rates are generally due to differences in separate class expenses. The fund’s distributions declared to shareholders as reported in the Statements of Changes in Net Assets are presented by class as follows:
| | | | | | | | |
| | | From net investment
income | |
| | | Six months ended
6/30/13 | | | Year ended
12/31/12 | |
| Initial Class | | | $— | | | | $8,178,600 | |
| Service Class | | | — | | | | 5,541,402 | |
| Total | | | $— | | | | $13,720,002 | |
| (3) | | Transactions with Affiliates |
Investment Adviser – The fund has an investment advisory agreement with MFS to provide overall investment management and related administrative services and facilities to the fund.
The management fee is computed daily and paid monthly at the following annual rates:
| | | | |
| First $300 million of average daily net assets | | | 0.75% | |
| Average daily net assets in excess of $300 million | | | 0.675% | |
Effective April 1, 2013, MFS has agreed in writing to reduce its management fee by a specified amount if certain MFS mutual fund assets exceed thresholds agreed to by MFS and the fund’s Board of Trustees. For the period April 1, 2013 through June 30, 2013,
16
MFS Utilities Portfolio
Notes to Financial Statements (unaudited) – continued
this management fee reduction amounted to $421, which is shown as a reduction of total expenses in the Statement of Operations. The management fee incurred for the six months ended June 30, 2013 was equivalent to an annual effective rate of 0.75% of the fund’s average daily net assets.
Distributor – MFS Fund Distributors, Inc. (MFD), a wholly-owned subsidiary of MFS, is the distributor of shares of the fund. The Trustees have adopted a distribution plan for the Service Class shares pursuant to Rule 12b-1 under the Investment Company Act of 1940.
The fund’s distribution plan provides that the fund will pay MFD distribution and/or service fees equal to 0.25% per annum of its average daily net assets attributable to Service Class shares as partial consideration for services performed and expenses incurred by MFD and financial intermediaries (including participating insurance companies that invest in the fund to fund variable annuity and variable life insurance contracts, sponsors of qualified retirement and pension plans that invest in the fund, and affiliates of these participating insurance companies and plan sponsors) in connection with the sale and distribution of the Service Class shares. MFD may subsequently pay all, or a portion, of the distribution and/or service fees to financial intermediaries.
Shareholder Servicing Agent – Effective April 1, 2013, MFS Service Center, Inc. (MFSC), a wholly-owned subsidiary of MFS, receives a fee from the fund for its services as shareholder servicing agent. For the period from April 1, 2013 through June 30, 2013, the fee was $2,183, which equated to 0.0014% annually of the fund’s average daily net assets. MFSC also receives payment from the fund for out-of-pocket expenses paid by MFSC on behalf of the fund. For the period from April 1, 2013 through June 30, 2013, these costs amounted to $9.
Administrator – MFS provides certain financial, legal, shareholder communications, compliance, and other administrative services to the fund. Under an administrative services agreement, the fund partially reimburses MFS the costs incurred to provide these services. The fund is charged an annual fixed amount of $17,500 plus a fee based on average daily net assets. The administrative services fee incurred for the six months ended June 30, 2013 was equivalent to an annual effective rate of 0.0161% of the fund’s average daily net assets.
Trustees’ and Officers’ Compensation – The fund pays compensation to independent Trustees in the form of a retainer, attendance fees, and additional compensation to Board and Committee chairpersons. The fund does not pay compensation directly to Trustees or officers of the fund who are also officers of the investment adviser, all of whom receive remuneration for their services to the fund from MFS. Certain officers and Trustees of the fund are officers or directors of MFS, MFD, and MFSC.
Other – This fund and certain other funds managed by MFS (the funds) have entered into services agreements (the Agreements) which provide for payment of fees by the funds to Tarantino LLC and Griffin Compliance LLC in return for the provision of services of an Independent Chief Compliance Officer (ICCO) and Assistant ICCO, respectively, for the funds. The ICCO and Assistant ICCO are officers of the funds and the sole members of Tarantino LLC and Griffin Compliance LLC, respectively. The funds can terminate the Agreements with Tarantino LLC and Griffin Compliance LLC at any time under the terms of the Agreements. For the six months ended June 30, 2013, the aggregate fees paid by the fund to Tarantino LLC and Griffin Compliance LLC were $1,172 and are included in “Miscellaneous” expense in the Statement of Operations. MFS has agreed to reimburse the fund for a portion of the payments made by the fund in the amount of $581, which is shown as a reduction of total expenses in the Statement of Operations. Additionally, MFS has agreed to bear all expenses associated with office space, other administrative support, and supplies provided to the ICCO and Assistant ICCO.
The fund invests in the MFS Institutional Money Market Portfolio which is managed by MFS and seeks current income consistent with preservation of capital and liquidity. Income earned on this investment is included in “Dividends from underlying affiliated funds” in the Statement of Operations. This money market fund does not pay a management fee to MFS.
Purchases and sales of investments, other than short-term obligations, aggregated $ 83,510,001 and $105,102,809, respectively.
| (5) | | Shares of Beneficial Interest |
The fund’s Declaration of Trust permits the Trustees to issue an unlimited number of full and fractional shares of beneficial interest. Transactions in fund shares were as follows:
| | | | | | | | | | | | | | | | |
| | | Six months ended 6/30/13 | | | Year ended 12/31/12 | |
| | | Shares | | | Amount | | | Shares | | | Amount | |
| Shares sold | | | | | | | | | | | | | | | | |
Initial Class | | | 48,393 | | | | $1,295,454 | | | | 133,109 | | | | $3,107,251 | |
Service Class | | | 244,282 | | | | 6,390,017 | | | | 318,047 | | | | 7,418,784 | |
| | | 292,675 | | | | $7,685,471 | | | | 451,156 | | | | $10,526,035 | |
17
MFS Utilities Portfolio
Notes to Financial Statements (unaudited) – continued
| | | | | | | | | | | | | | | | |
| | | Six months ended 6/30/13 | | | Year ended 12/31/12 | |
| | | Shares | | | Amount | | | Shares | | | Amount | |
| Shares issued to shareholders in reinvestment of distributions | | | | | | | | | | | | | | | | |
Initial Class | | | — | | | | $— | | | | 351,919 | | | | $8,178,600 | |
Service Class | | | — | | | | — | | | | 240,826 | | | | 5,541,402 | |
| | | — | | | | $— | | | | 592,745 | | | | $13,720,002 | |
| Shares reacquired | | | | | | | | | | | | | | | | |
Initial Class | | | (551,399 | ) | | | $(14,558,603 | ) | | | (1,241,888 | ) | | | $(29,070,845 | ) |
Service Class | | | (574,711 | ) | | | (14,834,582 | ) | | | (1,513,922 | ) | | | (35,115,297 | ) |
| | | (1,126,110 | ) | | | $(29,393,185 | ) | | | (2,755,810 | ) | | | $(64,186,142 | ) |
| Net change | | | | | | | | | | | | | | | | |
Initial Class | | | (503,006 | ) | | | $(13,263,149 | ) | | | (756,860 | ) | | | $(17,784,994 | ) |
Service Class | | | (330,429 | ) | | | (8,444,565 | ) | | | (955,049 | ) | | | (22,155,111 | ) |
| | | (833,435 | ) | | | $(21,707,714 | ) | | | (1,711,909 | ) | | | $(39,940,105 | ) |
The fund and certain other funds managed by MFS participate in a $1.1 billion unsecured committed line of credit, subject to a $1 billion sublimit, provided by a syndication of banks under a credit agreement. Borrowings may be made for temporary financing needs. Interest is charged to each fund, based on its borrowings, generally at a rate equal to the higher of the Federal Reserve funds rate or one month LIBOR plus an agreed upon spread. A commitment fee, based on the average daily, unused portion of the committed line of credit, is allocated among the participating funds at the end of each calendar quarter. In addition, the fund and other funds managed by MFS have established unsecured uncommitted borrowing arrangements with certain banks for temporary financing needs. Interest is charged to each fund, based on its borrowings, at a rate equal to the Federal Reserve funds rate plus an agreed upon spread. For the six months ended June 30, 2013, the fund’s commitment fee and interest expense were $768 and $0, respectively, and are included in “Miscellaneous” expense in the Statement of Operations.
| (7) | | Transactions in Underlying Affiliated Funds – Affiliated Issuers |
An affiliated issuer may be considered one in which the fund owns 5% or more of the outstanding voting securities, or a company which is under common control. For the purposes of this report, the fund assumes the following to be an affiliated issuer:
| | | | | | | | | | | | | | | | |
| Underlying Affiliated Fund | | Beginning Shares/Par Amount | | | Acquisitions Shares/Par Amount | | | Dispositions Shares/Par Amount | | | Ending Shares/Par Amount | |
| MFS Institutional Money Market Portfolio | | | 1,415,228 | | | | 44,419,507 | | | | (41,183,791 | ) | | | 4,650,944 | |
| | | | |
| Underlying Affiliated Fund | | Realized Gain (Loss) | | | Capital Gain Distributions | | | Dividend Income | | | Ending Value | |
| MFS Institutional Money Market Portfolio | | | $— | | | | $— | | | | $4,914 | | | | $4,650,944 | |
18
MFS Utilities Portfolio
BOARD REVIEW OF INVESTMENT ADVISORY AGREEMENT
A discussion regarding the Board’s most recent review and renewal of the fund’s Investment Advisory Agreement with MFS will be available on or about November 1, 2013 by clicking on the fund’s name under “Variable Insurance Portfolios — VIT II” in the “Products” section of the MFS Web site (mfs.com).
PROXY VOTING POLICIES AND INFORMATION
A general description of the MFS funds’ proxy voting policies and procedures is available without charge, upon request, by calling 1-800-225-2606, by visiting the Proxy Voting section of mfs.com or by visiting the SEC’s Web site at http://www.sec.gov.
Information regarding how the fund voted proxies relating to portfolio securities during the most recent twelve-month period ended June 30 is available without charge by visiting the Proxy Voting section of mfs.com or by visiting the SEC’s Web site at http://www.sec.gov.
QUARTERLY PORTFOLIO DISCLOSURE
The fund will file a complete schedule of portfolio holdings with the Securities and Exchange Commission (the Commission) for the first and third quarters of each fiscal year on Form N-Q. The fund’s Form N-Q is available on the EDGAR database on the Commission’s Internet Web site at http://www.sec.gov, and may be reviewed and copied at the:
Public Reference Room
Securities and Exchange Commission
100 F Street, NE, Room 1580
Washington, D.C. 20549
Information on the operation of the Public Reference Room may be obtained by calling the Commission at 1-800-SEC-0330. Copies of the fund’s Form N-Q also may be obtained, upon payment of a duplicating fee, by electronic request at the following e-mail address: publicinfo@sec.gov or by writing the Public Reference Section at the above address.
FURTHER INFORMATION
From time to time, MFS may post important information about the fund or the MFS funds on the MFS web site (mfs.com). This information is available by visiting the “News & Commentary” section of mfs.com or by clicking on the fund’s name under “Variable Insurance Portfolios — VIT II” in the “Products” section of mfs.com.
19
SEMIANNUAL REPORT
June 30, 2013

MFS® EMERGING MARKETS EQUITY PORTFOLIO
MFS® Variable Insurance Trust II

FCE-SEM
MFS® EMERGING MARKETS EQUITY PORTFOLIO
CONTENTS
The report is prepared for the general information of contract owners. It is authorized for distribution to prospective investors only when preceded or accompanied by a current prospectus.
NOT FDIC INSURED Ÿ MAY LOSE VALUE Ÿ NO BANK OR CREDIT UNION GUARANTEE Ÿ NOT A DEPOSIT Ÿ NOT INSURED BY ANY FEDERAL GOVERNMENT AGENCY OR NCUA/NCUSIF
MFS Emerging Markets Equity Portfolio
LETTER FROM THE CHAIRMAN AND CEO

Dear Contract Owners:
As the year progresses, the global economy continues to grind ahead slowly, held back by broad austerity measures. The U.S. economy remains a steadying force, driven by resilient consumers, who have taken the payroll tax increase and the sequestration’s early impact in stride. With U.S. housing and jobs showing steady expansion, domestic consumer-driven growth has offset weaker exports and the U.S. government’s spending constraints. In response to these developments, the U.S. Federal Reserve has begun to brace investors for an eventual shift in its monetary policy, causing global market tremors.
Japan has been another bright spot, with government and central bank stimulus policies leading to increased exports, a resurgent stock market and improved economic sentiment. After a six-month rally, Japan’s stocks slipped late in the second quarter, then picked up momentum on fresh signs that the country could soon break free of its chronic deflation. The major deterrent to global growth remains the eurozone, still in the grip of persistent recession. China has seen its pace of economic growth decelerate, a troubling turn for the country’s trading partners, who have come to rely on it as an engine for global growth.
As always, managing risk in the face of uncertainty remains a top priority for investors. At MFS®, our uniquely collaborative investment process employs integrated, global research and active risk management. Our global team of investment professionals shares ideas and evaluates opportunities across continents, investment disciplines and asset classes — all with a goal of building better insights, and ultimately better results, for our clients.
We are mindful of the many economic challenges investors face, and believe it is more important than ever to maintain a long-term view and employ time-tested principles, such as asset allocation and diversification. We remain confident that our unique approach can serve investors well as they work with their financial advisors to identify and pursue the most suitable opportunities.
Respectfully,

Robert J. Manning
Chairman and Chief Executive Officer
MFS Investment Management®
August 16, 2013
The opinions expressed in this letter are subject to change, may not be relied upon for investment advice, and no forecasts can be guaranteed.
1
MFS Emerging Markets Equity Portfolio
PORTFOLIO COMPOSITION
Portfolio structure
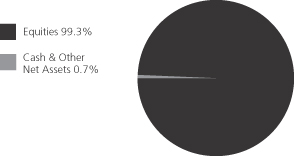
| | | | |
| Top ten holdings | | | | |
| Taiwan Semiconductor Manufacturing Co. Ltd. | | | 4.2% | |
| Samsung Electronics Co. Ltd. | | | 3.7% | |
| Kia Motors Corp. | | | 2.2% | |
| Naspers Ltd. | | | 2.1% | |
| Siliconware Precision Industries Co. Ltd. | | | 1.9% | |
| China Construction Bank | | | 1.7% | |
| Komercni Banka A.S. | | | 1.7% | |
| Hon Hai Precision Industry Co. Ltd. | | | 1.7% | |
| Sberbank of Russia | | | 1.6% | |
| Petroleo Brasileiro S.A., ADR | | | 1.6% | |
| |
| Equity sectors | | | | |
| Financial Services | | | 24.4% | |
| Technology | | | 15.5% | |
| Retailing | | | 10.9% | |
| Utilities & Communications | | | 9.1% | |
| Energy | | | 7.7% | |
| Leisure | | | 5.8% | |
| Autos & Housing | | | 5.3% | |
| Basic Materials | | | 5.3% | |
| Consumer Staples | | | 4.8% | |
| Special Products & Services | | | 4.8% | |
| Industrial Goods & Services | | | 2.9% | |
| Health Care | | | 1.8% | |
| Transportation | | | 1.0% | |
| | | | |
| Issuer country weightings (x) | | | | |
| Brazil | | | 18.7% | |
| China | | | 10.9% | |
| South Korea | | | 10.0% | |
| Taiwan | | | 8.9% | |
| India | | | 8.8% | |
| Russia | | | 7.1% | |
| Hong Kong | | | 6.8% | |
| Mexico | | | 4.8% | |
| South Africa | | | 4.1% | |
| Other Countries | | | 19.9% | |
| |
| Currency exposure weightings (y) | | | | |
| Brazilian Real | | | 18.7% | |
| Hong Kong Dollar | | | 18.3% | |
| South Korean Won | | | 10.0% | |
| United States Dollar | | | 9.2% | |
| Taiwan Dollar | | | 8.9% | |
| Indian Rupee | | | 8.8% | |
| Mexican Peso | | | 4.8% | |
| South African Rand | | | 4.1% | |
| Malaysian Ringgit | | | 2.3% | |
| Other Currencies | | | 14.9% | |
| (x) | Represents the portfolio’s exposure to issuer countries as a percentage of a portfolio’s net assets. |
| (y) | Represents the portfolio’s exposure to a particular currency as a percentage of a portfolio’s net assets. |
Percentages are based on net assets as of 6/30/13.
The portfolio is actively managed and current holdings may be different.
2
MFS Emerging Markets Equity Portfolio
EXPENSE TABLE
Fund Expenses Borne by the Contract Holders During the Period,
January 1, 2013 through June 30, 2013
As a contract holder of the fund, you incur ongoing costs, including management fees; distribution and/or service (12b-1) fees; and other fund expenses. This example is intended to help you understand your ongoing costs (in dollars) of investing in the fund and to compare these costs with the ongoing costs of investing in other mutual funds.
The example is based on an investment of $1,000 invested at the beginning of the period and held for the entire period January 1, 2013 through June 30, 2013.
Actual Expenses
The first line for each share class in the following table provides information about actual account values and actual expenses. You may use the information in this line, together with the amount you invested, to estimate the expenses that you paid over the period. Simply divide your account value by $1,000 (for example, an $8,600 account value divided by $1,000 = 8.6), then multiply the result by the number in the first line under the heading entitled “Expenses Paid During Period” to estimate the expenses you paid on your account during this period.
Hypothetical Example for Comparison Purposes
The second line for each share class in the following table provides information about hypothetical account values and hypothetical expenses based on the fund’s actual expense ratio and an assumed rate of return of 5% per year before expenses, which is not the fund’s actual return. The hypothetical account values and expenses may not be used to estimate the actual ending account balance or expenses you paid for the period. You may use this information to compare the ongoing costs of investing in the fund and other funds. To do so, compare this 5% hypothetical example with the 5% hypothetical examples that appear in the shareholder reports of the other funds.
Please note that the expenses shown in the table are meant to highlight the fund’s ongoing costs only and do not take into account the fees and expenses imposed under the variable contracts through which your investment in the fund is made. Therefore, the second line for each share class in the table is useful in comparing ongoing costs associated with an investment in vehicles (such as the fund) which fund benefits under variable annuity and variable life insurance contracts and to qualified pension and retirement plans only, and will not help you determine the relative total costs of investing in the fund through variable annuity and variable life insurance contracts. If the fees and expenses imposed under the variable contracts were included, your costs would have been higher.
| | | | | | | | | | | | | | | | | | |
| Share Class | | | | Annualized
Expense Ratio | | | Beginning
Account Value
1/01/13 | | | Ending Account Value
6/30/13 | | | Expenses Paid
During Period (p)
1/01/13-6/30/13 | |
| Initial Class | | Actual | | | 1.40% | | | | $1,000.00 | | | | $896.09 | | | | $6.58 | |
| | Hypothetical (h) | | | 1.40% | | | | $1,000.00 | | | | $1,017.85 | | | | $7.00 | |
| Service Class | | Actual | | | 1.65% | | | | $1,000.00 | | | | $895.05 | | | | $7.75 | |
| | Hypothetical (h) | | | 1.65% | | | | $1,000.00 | | | | $1,016.61 | | | | $8.25 | |
| (h) | 5% class return per year before expenses. |
| (p) | Expenses paid are equal to each class’s annualized expense ratio, as shown above, multiplied by the average account value over the period, multiplied by the number of days in the period, divided by the number of days in the year. |
3
MFS Emerging Markets Equity Portfolio
PORTFOLIO OF INVESTMENTS – 6/30/13 (unaudited)
The Portfolio of Investments is a complete list of all securities owned by your fund. It is categorized by broad-based asset classes.
| | | | | | | | |
| Issuer | | Shares/Par | | | Value ($) | |
| | | | | | | | |
| COMMON STOCKS – 99.3% | | | | | | | | |
| Aerospace – 0.4% | | | | | | | | |
| Embraer S.A., ADR | | | 8,670 | | | $ | 319,836 | |
| | | | | | | | |
| Airlines – 0.3% | | | | | | | | |
| Copa Holdings S.A., “A” | | | 2,156 | | | $ | 282,695 | |
| | | | | | | | |
| Alcoholic Beverages – 1.9% | | | | | | | | |
| Companhia de Bebidas das Americas, ADR | | | 22,635 | | | $ | 845,417 | |
| SABMiller PLC | | | 15,780 | | | | 759,313 | |
| | | | | | | | |
| | | | | | $ | 1,604,730 | |
| | | | | | | | |
| Apparel Manufacturers – 3.4% | | | | | | | | |
| Cia.Hering S.A. | | | 25,900 | | | $ | 363,309 | |
| Li & Fung Ltd. | | | 946,000 | | | | 1,290,024 | |
| Stella International Holdings | | | 438,500 | | | | 1,209,881 | |
| | | | | | | | |
| | | | | | $ | 2,863,214 | |
| | | | | | | | |
| Automotive – 4.5% | | | | | | | | |
| Exide Industries Ltd. | | | 339,835 | | | $ | 691,679 | |
| Geely Automobile Holdings Ltd. | | | 1,295,000 | | | | 554,193 | |
| Guangzhou Automobile Group Co. Ltd., “H” | | | 798,000 | | | | 750,825 | |
| Kia Motors Corp. | | | 34,510 | | | | 1,865,681 | |
| | | | | | | | |
| | | | | | $ | 3,862,378 | |
| | | | | | | | |
| Brokerage & Asset Managers – 1.7% | | | | | | | | |
| BM&F Bovespa S.A. | | | 139,700 | | | $ | 773,833 | |
| Bolsa Mexicana de Valores S.A. de C.V. | | | 108,900 | | | | 270,118 | |
| CETIP S.A. – Balcao Organizado de Ativos e Derivativos | | | 38,027 | | | | 389,243 | |
| | | | | | | | |
| | | | | | $ | 1,433,194 | |
| | | | | | | | |
| Business Services – 2.1% | | | | | | | | |
| Cognizant Technology Solutions Corp., “A” (a) | | | 17,290 | | | $ | 1,082,527 | |
| LPS Brasil – Consultoria de Imoveis S.A. | | | 57,600 | | | | 467,233 | |
| Multiplus S.A. | | | 18,600 | | | | 271,412 | |
| | | | | | | | |
| | | | | | $ | 1,821,172 | |
| | | | | | | | |
| Cable TV – 4.0% | | | | | | | | |
| Astro Malaysia Holdings Berhad | | | 1,029,000 | | | $ | 986,824 | |
| Dish TV India Ltd. (a) | | | 619,962 | | | | 632,120 | |
| Naspers Ltd. | | | 24,936 | | | | 1,833,325 | |
| | | | | | | | |
| | | | | | $ | 3,452,269 | |
| | | | | | | | |
| Computer Software – 0.3% | | | | | | | | |
| Totvs S.A. | | | 17,300 | | | $ | 271,283 | |
| | | | | | | | |
| Computer Software – Systems – 2.4% | | | | | | | | |
| Asustek Computer, Inc. | | | 74,000 | | | $ | 633,092 | |
| Hon Hai Precision Industry Co. Ltd. | | | 573,281 | | | | 1,409,252 | |
| | | | | | | | |
| | | | | | $ | 2,042,344 | |
| | | | | | | | |
| Conglomerates – 0.6% | | | | | | | | |
| First Pacific Co. Ltd. | | | 462,800 | | | $ | 493,898 | |
| | | | | | | | |
| Construction – 0.8% | | | | | | | | |
| Anhui Conch Cement Co. Ltd. | | | 257,000 | | | $ | 689,271 | |
| | | | | | | | |
| | | | | | | | |
| Issuer | | Shares/Par | | | Value ($) | |
| | | | | | | | |
| COMMON STOCKS – continued | |
| Consumer Products – 1.8% | | | | | | | | |
| Dabur India Ltd. | | | 474,671 | | | $ | 1,244,686 | |
| Kimberly-Clark de Mexico S.A. de C.V., “A” | | | 94,910 | | | | 306,687 | |
| | | | | | | | |
| | | | | | $ | 1,551,373 | |
| | | | | | | | |
| Consumer Services – 2.1% | | | | | | | | |
| Abril Educacao S.A., IEU | | | 21,130 | | | $ | 369,315 | |
| Anhanguera Educacional Participacoes S.A. | | | 72,300 | | | | 417,985 | |
| Estacio Participacoes S.A. | | | 60,590 | | | | 434,463 | |
| Kroton Educacional S.A. | | | 40,016 | | | | 554,146 | |
| | | | | | | | |
| | | | | | $ | 1,775,909 | |
| | | | | | | | |
| Electronics – 10.7% | | | | | | | | |
| Samsung Electronics Co. Ltd. | | | 2,718 | | | $ | 3,193,867 | |
| Seoul Semiconductor Co. Ltd. | | | 23,832 | | | | 699,146 | |
| Siliconware Precision Industries Co. Ltd. | | | 1,297,000 | | | | 1,624,088 | |
| Taiwan Semiconductor Manufacturing Co. Ltd. | | | 995,258 | | | | 3,601,836 | |
| | | | | | | | |
| | | | | | $ | 9,118,937 | |
| | | | | | | | |
| Energy – Independent – 2.9% | | | | | | | | |
| China Shenhua Energy Co. Ltd. | | | 279,500 | | | $ | 705,946 | |
| INPEX Corp. | | | 114 | | | | 476,585 | |
| Reliance Industries Ltd. | | | 90,094 | | | | 1,307,784 | |
| | | | | | | | |
| | | | | | $ | 2,490,315 | |
| | | | | | | | |
| Energy – Integrated – 3.1% | | | | | | | | |
| OAO Gazprom, ADR | | | 120,854 | | | $ | 795,219 | |
| OAO NOVATEK, GDR | | | 4,100 | | | | 487,185 | |
| Petroleo Brasileiro S.A., ADR | | | 99,982 | | | | 1,341,758 | |
| | | | | | | | |
| | | | | | $ | 2,624,162 | |
| | | | | | | | |
| Engineering – Construction – 0.4% | | | | | | | | |
| Promotora y Operadora de Infraestructura S.A.B. de C.V. (a) | | | 35,400 | | | $ | 325,083 | |
| | | | | | | | |
| Food & Beverages – 1.1% | | | | | | | | |
| Arca Continental S.A.B de C.V. | | | 42,976 | | | $ | 329,249 | |
| M. Dias Branco S.A. Industria e Comercio de Alimentos | | | 17,300 | | | | 647,388 | |
| | | | | | | | |
| | | | | | $ | 976,637 | |
| | | | | | | | |
| Food & Drug Stores – 4.7% | | | | | | | | |
| Brazil Pharma S.A. (a) | | | 72,700 | | | $ | 334,283 | |
| Dairy Farm International Holdings Ltd. | | | 50,400 | | | | 606,288 | |
| E-Mart Co. Ltd. | | | 4,112 | | | | 721,699 | |
| Magnit OJSC | | | 2,380 | | | | 544,435 | |
| O’Key Group S.A., GDR | | | 89,180 | | | | 1,002,391 | |
| Raia Drogasil S.A. | | | 25,000 | | | | 242,566 | |
| Wumart Stores, Inc., “H” | | | 318,000 | | | | 586,304 | |
| | | | | | | | |
| | | | | | $ | 4,037,966 | |
| | | | | | | | |
| Gaming & Lodging – 1.0% | | | | | | | | |
| Minor International PLC | | | 456,930 | | | $ | 365,367 | |
| Shangri-La Asia Ltd. | | | 268,000 | | | | 459,263 | |
| | | | | | | | |
| | | | | | $ | 824,630 | |
| | | | | | | | |
4
MFS Emerging Markets Equity Portfolio
Portfolio of Investments (unaudited) – continued
| | | | | | | | |
| Issuer | | Shares/Par | | | Value ($) | |
| | | | | | | | |
| COMMON STOCKS – continued | |
| General Merchandise – 2.1% | | | | | | | | |
| Bim Birlesik Magazalar A.S. | | | 13,013 | | | $ | 282,026 | |
| Clicks Group Ltd. | | | 111,790 | | | | 632,027 | |
| Lojas Renner S.A. | | | 7,700 | | | | 220,680 | |
| Mr. Price Group Ltd. | | | 30,432 | | | | 413,861 | |
| PT Mitra Adiperkasa Tbk | | | 345,000 | | | | 242,661 | |
| | | | | | | | |
| | | | | | $ | 1,791,255 | |
| | | | | | | | |
| Health Maintenance Organizations – 0.3% | | | | | |
| OdontoPrev S.A. | | | 60,400 | | | $ | 249,033 | |
| | | | | | | | |
| Insurance – 2.0% | | | | | | | | |
| Brasil Insurance Participacoes e Administracao S.A. | | | 68,800 | | | $ | 675,250 | |
| China Pacific Insurance Co. Ltd. | | | 314,600 | | | | 996,080 | |
| | | | | | | | |
| | | | | | $ | 1,671,330 | |
| | | | | | | | |
| Internet – 1.1% | | | | | | | | |
| 51job, Inc., ADR (a) | | | 3,340 | | | $ | 225,483 | |
| NHN Corp. | | | 2,761 | | | | 703,542 | |
| | | | | | | | |
| | | | | | $ | 929,025 | |
| | | | | | | | |
| Machinery & Tools – 2.1% | | | | | | | | |
| Glory Ltd. | | | 27,300 | | | $ | 640,248 | |
| Sinotruk Hong Kong Ltd. | | | 772,000 | | | | 375,717 | |
| Thermax Ltd. | | | 32,197 | | | | 324,110 | |
| TK Corp. (a) | | | 24,162 | | | | 479,957 | |
| | | | | | | | |
| | | | | | $ | 1,820,032 | |
| | | | | | | | |
| Major Banks – 2.5% | | | | | | | | |
| Bank of China Ltd. | | | 2,188,000 | | | $ | 893,176 | |
| Standard Chartered PLC | | | 57,293 | | | | 1,248,673 | |
| | | | | | | | |
| | | | | | $ | 2,141,849 | |
| | | | | | | | |
| Medical & Health Technology & Services – 0.5% | | | | | |
| Fleury S.A. | | | 46,900 | | | $ | 382,540 | |
| | | | | | | | |
| Medical Equipment – 0.7% | | | | | | | | |
| Top Glove Corp. | | | 290,200 | | | $ | 573,144 | |
| | | | | | | | |
| Metals & Mining – 4.7% | | | | | | | | |
| Gerdau S.A., ADR | | | 99,780 | | | $ | 569,744 | |
| Grupo Mexico S.A.B. de C.V., “B” | | | 87,117 | | | | 251,990 | |
| Iluka Resources Ltd. | | | 119,100 | | | | 1,075,290 | |
| Steel Authority of India Ltd. | | | 452,413 | | | | 385,569 | |
| Usinas Siderurgicas de Minas Gerais S.A., IPS (a) | | | 120,300 | | | | 400,578 | |
| Vale S.A., ADR | | | 98,208 | | | | 1,291,435 | |
| | | | | | | | |
| | | | | | $ | 3,974,606 | |
| | | | | | | | |
| Network & Telecom – 1.0% | | | | | | | | |
| VTech Holdings Ltd. | | | 57,600 | | | $ | 880,036 | |
| | | | | | | | |
| Oil Services – 1.7% | | | | | | | | |
| Global Ports Investments PLC, GDR | | | 29,800 | | | $ | 396,638 | |
| Lamprell PLC (a) | | | 204,260 | | | | 435,713 | |
| Tenaris S.A., ADR | | | 14,339 | | | | 577,432 | |
| | | | | | | | |
| | | | | | $ | 1,409,783 | |
| | | | | | | | |
| | | | | | | | |
| Issuer | | Shares/Par | | | Value ($) | |
| | | | | | | | |
| COMMON STOCKS – continued | |
| Other Banks & Diversified Financials – 15.5% | | | | | |
| Banco Santander S.A., IEU | | | 68,300 | | | $ | 414,756 | |
| Bangkok Bank Public Co. Ltd. | | | 176,400 | | | | 1,172,937 | |
| Bank Negara Indonesia PT | | | 1,908,000 | | | | 821,669 | |
| China Construction Bank | | | 2,044,670 | | | | 1,436,224 | |
| CIMB Group Holdings Berhad | | | 157,400 | | | | 412,493 | |
| Compartamos S.A.B. de C.V. | | | 186,950 | | | | 322,033 | |
| Credicorp Ltd. | | | 2,686 | | | | 343,701 | |
| Grupo Financiero Banorte S.A. de C.V. | | | 38,100 | | | | 225,587 | |
| Grupo Financiero Santander Mexico S.A.B. de C.V., ADR (a) | | | 17,030 | | | | 241,996 | |
| Hana Financial Group, Inc. | | | 29,860 | | | | 863,736 | |
| Housing Development Finance Corp. Ltd. | | | 89,254 | | | | 1,313,876 | |
| ICICI Bank Ltd. | | | 65,518 | | | | 1,180,537 | |
| Itau Unibanco Holding S.A., ADR | | | 48,227 | | | | 623,093 | |
| Komercni Banka A.S. | | | 7,663 | | | | 1,422,496 | |
| Sberbank of Russia | | | 486,930 | | | | 1,385,671 | |
| Turkiye Garanti Bankasi A.S. | | | 242,156 | | | | 1,054,145 | |
| | | | | | | | |
| | | | | | $ | 13,234,950 | |
| | | | | | | | |
| Pharmaceuticals – 0.3% | | | | | | | | |
| Genomma Lab Internacional S.A., “B” (a) | | | 147,100 | | | $ | 289,149 | |
| | | | | | | | |
| Railroad & Shipping – 0.7% | | | | | | | | |
| All America Latina Logistica S.A., IEU | | | 73,800 | | | $ | 312,881 | |
| CCR S.A. | | | 35,930 | | | | 285,012 | |
| | | | | | | | |
| | | | | | $ | 597,893 | |
| | | | | | | | |
| Real Estate – 2.7% | | | | | | | | |
| Brasil Brokers Participacoes | | | 145,900 | | | $ | 428,281 | |
| Concentradora Fibra Hotelera Mexicana S.A. de C.V., REIT | | | 106,400 | | | | 209,147 | |
| Hang Lung Properties Ltd. | | | 247,000 | | | | 857,535 | |
| Macquarie Mexico Real Estate S.A. de C.V., REIT | | | 209,800 | | | | 451,742 | |
| Multiplan Empreendimentos Imobiliarios S.A. | | | 16,915 | | | | 392,600 | |
| | | | | | | | |
| | | | | | $ | 2,339,305 | |
| | | | | | | | |
| Restaurants – 0.8% | | | | | | | | |
| Ajisen China Holdings Ltd. | | | 513,000 | | | $ | 398,500 | |
| Arcos Dorados Holdings, Inc. | | | 23,360 | | | | 272,845 | |
| | | | | | | | |
| | | | | | $ | 671,345 | |
| | | | | | | | |
| Specialty Chemicals – 0.6% | | | | | | | | |
| Chugoku Marine Paints Ltd. | | | 40,000 | | | $ | 198,024 | |
| Formosa Plastics Corp. | | | 138,000 | | | | 332,740 | |
| | | | | | | | |
| | | | | | $ | 530,764 | |
| | | | | | | | |
| Specialty Stores – 0.7% | | | | | | | | |
| M.Video | | | 77,960 | | | $ | 564,337 | |
| | | | | | | | |
| Telecommunications – Wireless – 4.4% | |
| America Movil S.A.B. de C.V., “L”, ADR | | | 40,134 | | | $ | 872,915 | |
| China Mobile Ltd. | | | 47,500 | | | | 493,664 | |
| Mobile TeleSystems OJSC, ADR | | | 45,952 | | | | 870,331 | |
| MTN Group Ltd. | | | 31,630 | | | | 586,709 | |
| TIM Participacoes S.A., ADR | | | 23,317 | | | | 433,696 | |
| Turkcell Iletisim Hizmetleri A.S. (a) | | | 88,680 | | | | 514,967 | |
| | | | | | | | |
| | | | | | $ | 3,772,282 | |
| | | | | | | | |
5
MFS Emerging Markets Equity Portfolio
Portfolio of Investments (unaudited) – continued
| | | | | | | | |
| Issuer | | Shares/Par | | | Value ($) | |
| | | | | | | | |
| COMMON STOCKS – continued | |
| Telephone Services – 2.4% | | | | | | | | |
| China Unicom (Hong Kong) Ltd. | | | 924,000 | | | $ | 1,216,402 | |
| PT XL Axiata Tbk | | | 1,730,000 | | | | 839,205 | |
| | | | | | | | |
| | | | | | $ | 2,055,607 | |
| | | | | | | | |
| Utilities – Electric Power – 2.0% | | | | | | | | |
| Alupar Investimento S.A. (a) | | | 41,800 | | | $ | 353,680 | |
| CESC Ltd. | | | 79,739 | | | | 452,727 | |
| Energias do Brasil S.A. | | | 61,600 | | | | 312,783 | |
| Terna Participacoes S.A., IEU | | | 31,550 | | | | 302,164 | |
| Tractebel Energia S.A. | | | 18,600 | | | | 289,001 | |
| | | | | | | | |
| | | | | | $ | 1,710,355 | |
| | | | | | | | |
| Utilities – Water – 0.3% | | | | | | | | |
| Aguas Andinas S.A. | | | 315,468 | | | $ | 224,718 | |
| | | | | | | | |
Total Common Stocks
(Identified Cost, $76,457,663) | | | | | | $ | 84,674,634 | |
| | | | | | | | |
| | | | | | | | | | | | | | | | |
| | | Strike
Price | | | First
Exercise | | | | | | | |
| | | | | | | | | | | | | | | | |
| RIGHTS – 0.0% | | | | | | | | | |
| Conglomerates – 0.0% | | | | | | | | | |
First Pacific Co. Ltd./Hong Kong (1 share for 1 right)
(Identified Cost, $0) (a) | | | 8.1HKD | | | | 6/14/13 | | | | 56,600 | | | $ | 1,293 | |
| | | | | | | | | | | | | | | | |
| | | | | | | | |
| Issuer | | Shares/Par | | | Value ($) | |
| | | | | | | | |
| MONEY MARKET FUNDS – 0.1% | |
| MFS Institutional Money Market Portfolio, 0.11%, at Cost and Net Asset Value (v) | | | 67,947 | | | $ | 67,947 | |
| | | | | | | | |
Total Investments
(Identified Cost, $76,525,610) | | | $ | 84,743,874 | |
| | | | | | | | |
OTHER ASSETS, LESS
LIABILITIES – 0.6% | | | | 539,109 | |
| | | | | | | | |
| Net Assets – 100.0% | | | $ | 85,282,983 | |
| | | | | | | | |
| (a) | | Non-income producing security. |
| (v) | | Underlying affiliated fund that is available only to investment companies managed by MFS. The rate quoted for the MFS Institutional Money Market Portfolio is the annualized seven-day yield of the fund at period end. |
The following abbreviations are used in this report and are defined:
| ADR | | American Depositary Receipt |
| GDR | | Global Depositary Receipt |
| IEU | | International Equity Unit |
| IPS | | International Preference Stock |
| PLC | | Public Limited Company |
| REIT | | Real Estate Investment Trust |
See Notes to Financial Statements
6
MFS Emerging Markets Equity Portfolio
FINANCIAL STATEMENTS | STATEMENT OF ASSETS AND LIABILITIES (unaudited)
This statement represents your fund’s balance sheet, which details the assets and liabilities comprising the total value of the fund.
| | | | | | | | |
At 6/30/13 | | | | | | | | |
Assets | | | | | | | | |
Investments – | | | | | | | | |
Non-affiliated issuers, at value (identified cost, $76,457,663) | | | $84,675,927 | | | | | |
Underlying affiliated funds, at cost and value | | | 67,947 | | | | | |
Total investments, at value (identified cost, $76,525,610) | | | $84,743,874 | | | | | |
Foreign currency, at value (identified cost, $3,564) | | | 3,507 | | | | | |
Receivables for | | | | | | | | |
Investments sold | | | 10 | | | | | |
Fund shares sold | | | 694,882 | | | | | |
Interest and dividends | | | 353,341 | | | | | |
Other assets | | | 889 | | | | | |
Total assets | | | | | | | $85,796,503 | |
Liabilities | | | | | | | | |
Payables for | | | | | | | | |
Investments purchased | | | $190,235 | | | | | |
Fund shares reacquired | | | 35,035 | | | | | |
Payable to affiliates | | | | | | | | |
Investment adviser | | | 10,378 | | | | | |
Shareholder servicing costs | | | 85 | | | | | |
Distribution and/or service fees | | | 1,124 | | | | | |
Payable for independent Trustees’ compensation | | | 511 | | | | | |
Deferred country tax expense payable | | | 233,142 | | | | | |
Accrued expenses and other liabilities | | | 43,010 | | | | | |
Total liabilities | | | | | | | $513,520 | |
Net assets | | | | | | | $85,282,983 | |
Net assets consist of | | | | | | | | |
Paid-in capital | | | $78,838,476 | | | | | |
Unrealized appreciation (depreciation) on investments and translation of assets and liabilities in foreign currencies
(net of $83,364 deferred country tax) | | | 8,133,538 | | | | | |
Accumulated net realized gain (loss) on investments and foreign currency | | | (3,533,906 | ) | | | | |
Undistributed net investment income | | | 1,844,875 | | | | | |
Net assets | | | | | | | $85,282,983 | |
Shares of beneficial interest outstanding | | | | | | | 6,170,622 | |
| | | | | | | | | | | | |
| | | Net assets | | | Shares
outstanding | | | Net asset value
per share | |
Initial Class | | | $43,910,558 | | | | 3,152,362 | | | | $13.93 | |
Service Class | | | 41,372,425 | | | | 3,018,260 | | | | 13.71 | |
See Notes to Financial Statements
7
MFS Emerging Markets Equity Portfolio
FINANCIAL STATEMENTS | STATEMENT OF OPERATIONS (unaudited)
This statement describes how much your fund earned in investment income and accrued in expenses. It also describes any gains and/or losses generated by fund operations.
| | | | | | | | |
| Six months ended 6/30/13 | | | | | | | | |
| Net investment income | | | | | | | | |
Income | | | | | | | | |
Dividends | | | $1,280,190 | | | | | |
Interest | | | 94 | | | | | |
Dividends from underlying affiliated funds | | | 336 | | | | | |
Foreign taxes withheld | | | (94,767 | ) | | | | |
Total investment income | | | | | | | $1,185,853 | |
Expenses | | | | | | | | |
Management fee | | | $467,520 | | | | | |
Distribution and/or service fees | | | 51,786 | | | | | |
Shareholder servicing costs | | | 3,432 | | | | | |
Administrative services fee | | | 11,134 | | | | | |
Independent Trustees’ compensation | | | 1,520 | | | | | |
Custodian fee | | | 84,065 | | | | | |
Shareholder communications | | | 6,199 | | | | | |
Audit and tax fees | | | 38,238 | | | | | |
Legal fees | | | 755 | | | | | |
Miscellaneous | | | 9,947 | | | | | |
Total expenses | | | | | | | $674,596 | |
Fees paid indirectly | | | (3 | ) | | | | |
Reduction of expenses by investment adviser | | | (291 | ) | | | | |
Net expenses | | | | | | | $674,302 | |
Net investment income | | | | | | | $511,551 | |
Realized and unrealized gain (loss) on investments and foreign currency | | | | | | | | |
Realized gain (loss) (identified cost basis) | | | | | | | | |
Investments (net of $159,609 country tax) | | | $1,216,017 | | | | | |
Foreign currency | | | (51,501 | ) | | | | |
Net realized gain (loss) on investments and foreign currency | | | | | | | $1,164,516 | |
Change in unrealized appreciation (depreciation) | | | | | | | | |
Investments (net of $162,975 decrease in deferral country tax) | | | $(11,266,589 | ) | | | | |
Translation of assets and liabilities in foreign currencies | | | (1,450 | ) | | | | |
Net unrealized gain (loss) on investments and foreign currency translation | | | | | | | $(11,268,039 | ) |
Net realized and unrealized gain (loss) on investments and foreign currency | | | | | | | $(10,103,523 | ) |
Change in net assets from operations | | | | | | | $(9,591,972 | ) |
See Notes to Financial Statements
8
MFS Emerging Markets Equity Portfolio
FINANCIAL STATEMENTS | STATEMENTS OF CHANGES IN NET ASSETS
These statements describe the increases and/or decreases in net assets resulting from operations, any distributions, and any shareholder transactions.
| | | | | | | | |
| |
| Six months ended
6/30/13
(unaudited |
) | |
| Year ended
12/31/12 |
|
Change in net assets | | | | | | | | |
| From operations | | | | | | | | |
Net investment income | | | $511,551 | | | | $1,453,605 | |
Net realized gain (loss) on investments and foreign currency | | | 1,164,516 | | | | (4,436,311 | ) |
Net unrealized gain (loss) on investments and foreign currency translation | | | (11,268,039 | ) | | | 22,746,262 | |
Change in net assets from operations | | | $(9,591,972 | ) | | | $19,763,556 | |
| Distributions declared to shareholders | | | | | | | | |
From net investment income | | | $— | | | | $(1,400,009 | ) |
From net realized gain on investments | | | — | | | | (5,621,397 | ) |
Total distributions declared to shareholders | | | $— | | | | $(7,021,406 | ) |
Change in net assets from fund share transactions | | | $5,209,366 | | | | $(48,622,791 | ) |
Total change in net assets | | | $(4,382,606 | ) | | | $(35,880,641 | ) |
| Net assets | | | | | | | | |
At beginning of period | | | 89,665,589 | | | | 125,546,230 | |
At end of period (including undistributed net investment income of $1,844,875 and
$1,333,324, respectively) | | | $85,282,983 | | | | $89,665,589 | |
See Notes to Financial Statements
9
MFS Emerging Markets Equity Portfolio
FINANCIAL STATEMENTS | FINANCIAL HIGHLIGHTS
The financial highlights table is intended to help you understand the fund’s financial performance for the semiannual period and the past 5 fiscal years. Certain information reflects financial results for a single fund share. The total returns in the table represent the rate by which an investor would have earned (or lost) on an investment in the fund share class (assuming reinvestment of all distributions) held for the entire period.
| | | | | | | | | | | | | | | | | | | | | | | | |
| Initial Class | | Six months
ended
6/30/13 | | | Years ended 12/31 | |
| | | | 2012 | | | 2011 | | | 2010 | | | 2009 | | | 2008 | |
| | | (unaudited) | | | | | | | | | | | | | | | | |
Net asset value, beginning of period | | | $15.56 | | | | $13.84 | | | | $17.88 | | | | $14.54 | | | | $8.88 | | | | $26.15 | |
| Income (loss) from investment operations | | | | | | | | | | | | | | | | | | | | | | | | |
Net investment income (d) | | | $0.09 | | | | $0.18 | | | | $0.21 | | | | $0.13 | | | | $0.14 | | | | $0.33 | |
Net realized and unrealized gain (loss) on investments
and foreign currency | | | (1.72 | ) | | | 2.35 | | | | (3.46 | ) | | | 3.31 | | | | 5.80 | | | | (11.19 | ) |
Total from investment operations | | | $(1.63 | ) | | | $2.53 | | | | $(3.25 | ) | | | $3.44 | | | | $5.94 | | | | $(10.86 | ) |
| Less distributions declared to shareholders | | | | | | | | | | | | | | | | | | | | | | | | |
From net investment income | | | $— | | | | $(0.17 | ) | | | $(0.09 | ) | | | $(0.10 | ) | | | $(0.28 | ) | | | $(0.27 | ) |
From net realized gain on investments | | | — | | | | (0.64 | ) | | | (0.70 | ) | | | — | | | | — | | | | (6.14 | ) |
Total distributions declared to shareholders | | | $— | | | | $(0.81 | ) | | | $(0.79 | ) | | | $(0.10 | ) | | | $(0.28 | ) | | | $(6.41 | ) |
Net asset value, end of period (x) | | | $13.93 | | | | $15.56 | | | | $13.84 | | | | $17.88 | | | | $14.54 | | | | $8.88 | |
Total return (%) (k)(r)(s)(x) | | | (10.48 | )(n) | | | 18.76 | | | | (18.58 | ) | | | 23.82 | | | | 68.58 | | | | (55.11 | ) |
Ratios (%) (to average net assets)
and Supplemental data: | | | | | | | | | | | | | | | | | | | | | | | | |
Expenses before expense reductions (f) | | | 1.40 | (a) | | | 1.35 | | | | 1.36 | | | | 1.55 | | | | 1.71 | | | | 1.85 | |
Expenses after expense reductions (f) | | | 1.40 | (a) | | | 1.35 | | | | 1.36 | | | | 1.40 | | | | 1.40 | | | | 1.61 | |
Net investment income | | | 1.24 | (a) | | | 1.23 | | | | 1.28 | | | | 0.86 | | | | 1.24 | | | | 1.94 | |
Portfolio turnover | | | 15 | (n) | | | 33 | | | | 34 | | | | 39 | | | | 66 | | | | 93 | |
Net assets at end of period (000 omitted) | | | $43,911 | | | | $48,803 | | | | $88,928 | | | | $99,316 | | | | $71,026 | | | | $33,411 | |
| | |
| Service Class | | Six months
ended 6/30/13 | | | Years ended 12/31 | |
| | | | 2012 | | | 2011 | | | 2010 | | | 2009 | | | 2008 | |
| | | (unaudited) | | | | | | | | | | | | | | | | |
Net asset value, beginning of period | | | $15.32 | | | | $13.64 | | | | $17.64 | | | | $14.36 | | | | $8.76 | | | | $25.88 | |
| Income (loss) from investment operations | | | | | | | | | | | | | | | | | | | | | | | | |
Net investment income (d) | | | $0.08 | | | | $0.13 | | | | $0.16 | | | | $0.09 | | | | $0.11 | | | | $0.29 | |
Net realized and unrealized gain (loss) on investments
and foreign currency | | | (1.69 | ) | | | 2.32 | | | | (3.40 | ) | | | 3.28 | | | | 5.73 | | | | (11.06 | ) |
Total from investment operations | | | $(1.61 | ) | | | $2.45 | | | | $(3.24 | ) | | | $3.37 | | | | $5.84 | | | | $(10.77 | ) |
| Less distributions declared to shareholders | | | | | | | | | | | | | | | | | | | | | | | | |
From net investment income | | | $— | | | | $(0.13 | ) | | | $(0.06 | ) | | | $(0.09 | ) | | | $(0.24 | ) | | | $(0.21 | ) |
From net realized gain on investments | | | — | | | | (0.64 | ) | | | (0.70 | ) | | | — | | | | — | | | | (6.14 | ) |
Total distributions declared to shareholders | | | $— | | | | $(0.77 | ) | | | $(0.76 | ) | | | $(0.09 | ) | | | $(0.24 | ) | | | $(6.35 | ) |
Net asset value, end of period (x) | | | $13.71 | | | | $15.32 | | | | $13.64 | | | | $17.64 | | | | $14.36 | | | | $8.76 | |
Total return (%) (k)(r)(s)(x) | | | (10.51 | )(n) | | | 18.45 | | | | (18.77 | ) | | | 23.54 | | | | 68.13 | | | | (55.23 | ) |
Ratios (%) (to average net assets)
and Supplemental data: | | | | | | | | | | | | | | | | | | | | | | | | |
Expenses before expense reductions (f) | | | 1.65 | (a) | | | 1.60 | | | | 1.61 | | | | 1.80 | | | | 1.95 | | | | 2.10 | |
Expenses after expense reductions (f) | | | 1.65 | (a) | | | 1.60 | | | | 1.61 | | | | 1.65 | | | | 1.65 | | | | 1.86 | |
Net investment income | | | 1.04 | (a) | | | 0.90 | | | | 1.02 | | | | 0.62 | | | | 0.93 | | | | 1.70 | |
Portfolio turnover | | | 15 | (n) | | | 33 | | | | 34 | | | | 39 | | | | 66 | | | | 93 | |
Net assets at end of period (000 omitted) | | | $41,372 | | | | $40,863 | | | | $36,618 | | | | $37,146 | | | | $25,363 | | | | $9,342 | |
See Notes to Financial Statements
10
MFS Emerging Markets Equity Portfolio
Financial Highlights – continued
| (d) | Per share data is based on average shares outstanding. |
| (f) | Ratios do not reflect reductions from fees paid indirectly, if applicable. |
| (k) | The total return does not reflect expenses that apply to separate accounts. Inclusion of these charges would reduce the total return figures for all periods shown. |
| (r) | Certain expenses have been reduced without which performance would have been lower. |
| (s) | From time to time the fund may receive proceeds from litigation settlements, without which performance would be lower. |
| (x) | The net asset values per share and total returns have been calculated on net assets which include adjustments made in accordance with U.S. generally accepted accounting principles required at period end for financial reporting purposes. |
See Notes to Financial Statements
11
MFS Emerging Markets Equity Portfolio
NOTES TO FINANCIAL STATEMENTS (unaudited)
| (1) | | Business and Organization |
MFS Emerging Markets Equity Portfolio (the fund) is a series of MFS Variable Insurance Trust II (the trust). The trust is organized as a Massachusetts business trust and is registered under the Investment Company Act of 1940, as amended, as an open-end management investment company. The shareholders of each series of the trust are separate accounts of insurance companies, which offer variable annuity and/or life insurance products, and qualified retirement and pension plans.
| (2) | | Significant Accounting Policies |
General – The preparation of financial statements in conformity with U.S. generally accepted accounting principles requires management to make estimates and assumptions that affect the reported amounts of assets and liabilities, and disclosure of contingent assets and liabilities at the date of the financial statements and the reported amounts of revenues and expenses during the reporting period. Actual results could differ from those estimates. In the preparation of these financial statements, management has evaluated subsequent events occurring after the date of the fund’s Statement of Assets and Liabilities through the date that the financial statements were issued. The fund invests in foreign securities, including securities of emerging market issuers. Investments in foreign securities are vulnerable to the effects of changes in the relative values of the local currency and the U.S. dollar and to the effects of changes in each country’s legal, political, and economic environment. The markets of emerging markets countries are generally more volatile than the markets of developed countries with more mature economies. All of the risks of investing in foreign securities previously described are heightened when investing in emerging markets countries.
In this reporting period, the fund adopted the disclosure provisions of the Financial Accounting Standards Board (FASB) Accounting Standards Update 2011-11 (“ASU 2011-11”), Balance Sheet (Topic 210) – Disclosures about Offsetting Assets and Liabilities along with the related scope clarification provisions of FASB Accounting Standards Update 2013-01 (“ASU 2013-01”) entitled Balance Sheet (Topic 210) – Clarifying the Scope of Disclosures about Offsetting Assets and Liabilities. ASU 2011-11 is intended to enhance disclosures on the offsetting of financial assets and liabilities by requiring entities to disclose both gross and net information about financial instruments and transactions that are either offset in the statement of financial position or subject to a Master Netting Agreement or similar arrangement. ASU 2013-01 limits the scope of ASU 2011-11’s disclosure requirements on offsetting to financial assets and financial liabilities related to derivatives, repurchase and reverse repurchase agreements, and securities lending and securities borrowing transactions. The disclosures required by ASU 2011-11, to the extent applicable to the fund, have been included in the fund’s Significant Accounting Policies note under the captions for each of the fund’s in-scope financial instruments and transactions.
In June 2013, FASB issued Accounting Standards Update 2013-08 Financial Services – Investment Companies (Topic 946) – Amendments to the Scope, Measurement, and Disclosure Requirements (“ASU 2013-08”) which is effective for interim and annual reporting periods in fiscal years that begin after December 15, 2013. ASU 2013-08 sets forth a methodology for determining whether an entity should be characterized as an investment company and prescribes fair value accounting for an investment company’s non-controlling ownership interest in another investment company. FASB has determined that a fund registered under the Investment Company Act of 1940 automatically meets ASU 2013-08’s criteria for an investment company. Although still evaluating the potential impacts of ASU 2013-08 to the fund, management expects that the impact of the fund’s adoption will be limited to additional financial statement disclosures.
Investment Valuations – Equity securities, including restricted equity securities, are generally valued at the last sale or official closing price as provided by a third-party pricing service on the market or exchange on which they are primarily traded. Equity securities, for which there were no sales reported that day, are generally valued at the last quoted daily bid quotation as provided by a third-party pricing service on the market or exchange on which such securities are primarily traded. Short-term instruments with a maturity at issuance of 60 days or less generally are valued at amortized cost, which approximates market value. Open-end investment companies are generally valued at net asset value per share. Securities and other assets generally valued on the basis of information from a third-party pricing service may also be valued at a broker/dealer bid quotation. Values obtained from third-party pricing services can utilize both transaction data and market information such as yield, quality, coupon rate, maturity, type of issue, trading characteristics, and other market data. The values of foreign securities and other assets and liabilities expressed in foreign currencies are converted to U.S. dollars using the mean of bid and asked prices for rates provided by a third-party pricing service.
The Board of Trustees has delegated primary responsibility for determining or causing to be determined the value of the fund’s investments (including any fair valuation) to the adviser pursuant to valuation policies and procedures approved by the Board. If the adviser determines that reliable market quotations are not readily available, investments are valued at fair value as determined in good faith by the adviser in accordance with such procedures under the oversight of the Board of Trustees. Under the fund’s valuation policies and procedures, market quotations are not considered to be readily available for most types of debt instruments and floating rate loans and many types of derivatives. These investments are generally valued at fair value based on information from third-party pricing services. In addition, investments may be valued at fair value if the adviser determines that an investment’s value has been materially affected by events occurring after the close of the exchange or market on which the investment is principally traded (such as foreign exchange or market) and prior to the determination of the fund’s net asset value, or after the halting of
12
MFS Emerging Markets Equity Portfolio
Notes to Financial Statements (unaudited) – continued
trading of a specific security where trading does not resume prior to the close of the exchange or market on which the security is principally traded. Events that occur on a frequent basis after foreign markets close (such as developments in foreign markets and significant movements in the U.S. markets) and prior to the determination of the fund’s net asset value may be deemed to have a material effect on the value of securities traded in foreign markets. Accordingly, the fund’s foreign equity securities may often be valued at fair value. The adviser generally relies on third-party pricing services or other information (such as the correlation with price movements of similar securities in the same or other markets; the type, cost and investment characteristics of the security; the business and financial condition of the issuer; and trading and other market data) to assist in determining whether to fair value and at what value to fair value an investment. The value of an investment for purposes of calculating the fund’s net asset value can differ depending on the source and method used to determine value. When fair valuation is used, the value of an investment used to determine the fund’s net asset value may differ from quoted or published prices for the same investment. There can be no assurance that the fund could obtain the fair value assigned to an investment if it were to sell the investment at the same time at which the fund determines its net asset value per share.
Various inputs are used in determining the value of the fund’s assets or liabilities. These inputs are categorized into three broad levels. In certain cases, the inputs used to measure fair value may fall into different levels of the fair value hierarchy. In such cases, an investment’s level within the fair value hierarchy is based on the lowest level of input that is significant to the fair value measurement. The fund’s assessment of the significance of a particular input to the fair value measurement in its entirety requires judgment, and considers factors specific to the investment. Level 1 includes unadjusted quoted prices in active markets for identical assets or liabilities. Level 2 includes other significant observable market-based inputs (including quoted prices for similar securities, interest rates, prepayment speed, and credit risk). Level 3 includes unobservable inputs, which may include the adviser’s own assumptions in determining the fair value of investments. The following is a summary of the levels used as of June 30, 2013 in valuing the fund’s assets or liabilities:
| | | | | | | | | | | | | | | | |
| Investments at Value | | Level 1 | | | Level 2 | | | Level 3 | | | Total | |
| Equity Securities: | | | | | | | | | | | | | | | | |
Brazil | | | $15,980,673 | | | | $— | | | | $— | | | | $15,980,673 | |
China | | | 811,787 | | | | 8,509,999 | | | | — | | | | 9,321,786 | |
South Korea | | | 3,193,867 | | | | 5,333,762 | | | | — | | | | 8,527,629 | |
Taiwan | | | — | | | | 7,601,009 | | | | — | | | | 7,601,009 | |
India | | | 3,504,111 | | | | 4,028,978 | | | | — | | | | 7,533,089 | |
Russia | | | 3,447,860 | | | | 2,598,348 | | | | — | | | | 6,046,208 | |
Hong Kong | | | 2,089,917 | | | | 3,708,301 | | | | — | | | | 5,798,218 | |
Mexico | | | 4,095,695 | | | | — | | | | — | | | | 4,095,695 | |
South Africa | | | — | | | | 3,465,922 | | | | — | | | | 3,465,922 | |
Other Countries | | | 8,249,851 | | | | 8,055,847 | | | | — | | | | 16,305,698 | |
| Mutual Funds | | | 67,947 | | | | — | | | | — | | | | 67,947 | |
| Total Investments | | | $41,441,708 | | | | $43,302,166 | | | | $— | | | | $84,743,874 | |
For further information regarding security characteristics, see the Portfolio of Investments.
Of the level 2 investments presented above, equity investments amounting to $1,966,385 would have been considered level 1 investments at the beginning of the period. Of the level 1 investments presented above, equity investments amounting to $18,605,342 would have been considered level 2 investments at the beginning of the period. The primary reason for changes in the classifications between levels 1 and 2 occurs when foreign equity securities are fair valued using other observable market-based inputs in place of the closing exchange price due to events occurring after the close of the exchange or market on which the investment is principally traded. The fund’s foreign equity securities may often be valued at fair value. The fund’s policy is to recognize transfers between the levels as of the end of the period.
Foreign Currency Translation – Purchases and sales of foreign investments, income, and expenses are converted into U.S. dollars based upon currency exchange rates prevailing on the respective dates of such transactions or on the reporting date for foreign denominated receivables and payables. Gains and losses attributable to foreign currency exchange rates on sales of securities are recorded for financial statement purposes as net realized gains and losses on investments. Gains and losses attributable to foreign exchange rate movements on receivables, payables, income and expenses are recorded for financial statement purposes as foreign currency transaction gains and losses. That portion of both realized and unrealized gains and losses on investments that results from fluctuations in foreign currency exchange rates is not separately disclosed.
Indemnifications – Under the fund’s organizational documents, its officers and Trustees may be indemnified against certain liabilities and expenses arising out of the performance of their duties to the fund. Additionally, in the normal course of business, the fund enters into agreements with service providers that may contain indemnification clauses. The fund’s maximum exposure under these agreements is unknown as this would involve future claims that may be made against the fund that have not yet occurred.
13
MFS Emerging Markets Equity Portfolio
Notes to Financial Statements (unaudited) – continued
Investment Transactions and Income – Investment transactions are recorded on the trade date. Interest income is recorded on the accrual basis. Dividends received in cash are recorded on the ex-dividend date. Certain dividends from foreign securities will be recorded when the fund is informed of the dividend if such information is obtained subsequent to the ex-dividend date. Dividend and interest payments received in additional securities are recorded on the ex-dividend or ex-interest date in an amount equal to the value of the security on such date.
The fund may receive proceeds from litigation settlements. Any proceeds received from litigation involving portfolio holdings are reflected in the Statement of Operations in realized gain/loss if the security has been disposed of by the fund or in unrealized gain/loss if the security is still held by the fund. Any other proceeds from litigation not related to portfolio holdings are reflected as other income in the Statement of Operations.
Fees Paid Indirectly – The fund’s custody fee may be reduced according to an arrangement that measures the value of cash deposited with the custodian by the fund. This amount, for the six months ended June 30, 2013, is shown as a reduction of total expenses in the Statement of Operations.
Tax Matters and Distributions – The fund intends to qualify as a regulated investment company, as defined under Subchapter M of the Internal Revenue Code, and to distribute all of its taxable income, including realized capital gains. As a result, no provision for federal income tax is required. The fund’s federal tax returns, when filed, will remain subject to examination by the Internal Revenue Service for a three year period. Foreign taxes have been accrued by the fund in the accompanying financial statements in accordance with the applicable foreign tax law. Foreign income taxes may be withheld by certain countries in which the fund invests. Additionally, capital gains realized by the fund on securities issued in or by certain foreign countries may be subject to capital gains tax imposed by those countries.
Distributions to shareholders are recorded on the ex-dividend date. Income and capital gain distributions are determined in accordance with income tax regulations, which may differ from U.S. generally accepted accounting principles. Certain capital accounts in the financial statements are periodically adjusted for permanent differences in order to reflect their tax character. These adjustments have no impact on net assets or net asset value per share. Temporary differences which arise from recognizing certain items of income, expense, gain or loss in different periods for financial statement and tax purposes will reverse at some time in the future. Distributions in excess of net investment income or net realized gains are temporary overdistributions for financial statement purposes resulting from differences in the recognition or classification of income or distributions for financial statement and tax purposes.
Book/tax differences primarily relate to wash sale loss deferrals and passive foreign investment companies.
The tax character of distributions declared to shareholders for the last fiscal year is as follows:
| | | | |
| | | 12/31/12 | |
| Ordinary income (including any short-term capital gains) | | | $2,236,279 | |
| Long-term capital gains | | | 4,785,127 | |
| Total distributions | | | $7,021,406 | |
The federal tax cost and the tax basis components of distributable earnings were as follows:
| | | | |
| As of 6/30/13 | | | | |
| Cost of investments | | | $77,931,493 | |
| Gross appreciation | | | 13,062,646 | |
| Gross depreciation | | | (6,250,265 | ) |
| Net unrealized appreciation (depreciation) | | | $6,812,381 | |
| |
| As of 12/31/12 | | | | |
| Undistributed ordinary income | | | 1,337,813 | |
| Capital loss carryforwards | | | (3,203,727 | ) |
| Other temporary differences | | | (339,552 | ) |
| Net unrealized appreciation (depreciation) | | | 18,241,945 | |
The aggregate cost above includes prior fiscal year end tax adjustments, if applicable.
Under the Regulated Investment Company Modernization Act of 2010 (the “Act”), net capital losses recognized for fund fiscal years beginning after December 31, 2010 may be carried forward indefinitely, and their character is retained as short-term and/or long-term losses (“post-enactment losses”). Previously, net capital losses were carried forward for eight years and treated as short-term losses (“pre-enactment losses”). As a transition rule, the Act requires that all post-enactment net capital losses be used before pre-enactment net capital losses.
14
MFS Emerging Markets Equity Portfolio
Notes to Financial Statements (unaudited) – continued
As of December 31, 2012 the fund had capital loss carryforwards available to offset future realized gains. Such post-enactment losses are characterized as follows:
| | | | |
| Short term | | | $(419,668 | ) |
| Long-term | | | (2,784,059 | ) |
| Total | | | $(3,203,727 | ) |
Multiple Classes of Shares of Beneficial Interest – The fund offers multiple classes of shares, which differ in their respective distribution and/or service fees. The fund’s income, realized and unrealized gain (loss), and common expenses are allocated to shareholders based on the daily net assets of each class. Dividends are declared separately for each class. Differences in per share dividend rates are generally due to differences in separate class expenses. The fund’s distributions declared to shareholders as reported in the Statements of Changes in Net Assets are presented by class as follows:
| | | | | | | | | | | | | | | | |
| | | From net investment
income | | | From net realized gain on
investments | |
| | | Six months ended
6/30/13 | | | Year ended
12/31/12 | | | Six months ended
6/30/13 | | | Year ended
12/31/12 | |
| Initial Class | | | $— | | | | $1,051,896 | | | | $— | | | | $3,957,778 | |
| Service Class | | | — | | | | 348,113 | | | | — | | | | 1,663,619 | |
| Total | | | $— | | | | $1,400,009 | | | | $— | | | | $5,621,397 | |
| (3) | | Transactions with Affiliates |
The fund has an investment advisory agreement with MFS to provide overall investment management and related administrative services and facilities to the fund. The management fee is computed daily and paid monthly at the following annual rates:
| | | | |
| First $500 million of average daily net assets | | | 1.05% | |
| Average daily net assets in excess of $500 million | | | 1.00% | |
Effective April 1, 2013, MFS has agreed in writing to reduce its management fee by a specified amount if certain MFS mutual fund assets exceed thresholds agreed to by MFS and the fund’s Board of Trustees. For the period April 1, 2013 through June 30, 2013, this management fee reduction amounted to $120, which is shown as a reduction of total expenses in the Statement of Operations. The management fee incurred for the six months ended June 30, 2013 was equivalent to an annual effective rate of 1.05% of the fund’s average daily net assets.
The investment adviser has agreed in writing to pay a portion of the fund’s total annual operating expenses, exclusive of interest, taxes, extraordinary expenses, brokerage and transaction costs, and investment-related expenses, such that total annual operating expenses do not exceed 1.40% of average daily net assets for the Initial Class shares and 1.65% of average daily net assets for the Service Class shares. This written agreement will continue until modified by the fund’s Board of Trustees, but such agreement will continue at least until April 30, 2015. For the six months ended June 30, 2013, the fund’s actual operating expenses did not exceed the limit and therefore, the investment adviser did not pay any portion of the fund’s expenses related to this agreement.
Distributor – MFS Fund Distributors, Inc. (MFD), a wholly-owned subsidiary of MFS, is the distributor of shares of the fund. The Trustees have adopted a distribution plan for the Service Class shares pursuant to Rule 12b-1 under the Investment Company Act of 1940.
The fund’s distribution plan provides that the fund will pay MFD distribution and/or service fees equal to 0.25% per annum of its average daily net assets attributable to Service Class shares as partial consideration for services performed and expenses incurred by MFD and financial intermediaries (including participating insurance companies that invest in the fund to fund variable annuity and variable life insurance contracts, sponsors of qualified retirement and pension plans that invest in the fund, and affiliates of these participating insurance companies and plan sponsors) in connection with the sale and distribution of the Service Class shares. MFD may subsequently pay all, or a portion, of the distribution and/or service fees to financial intermediaries.
Shareholder Servicing Agent – MFS Service Center, Inc. (MFSC), a wholly-owned subsidiary of MFS, receives a fee from the fund for its services as shareholder servicing agent. For the six months ended June 30, 2013, the fee was $3,426, which equated to 0.0077% annually of the fund’s average daily net assets. MFSC also receives payment from the fund for out-of-pocket expenses paid by MFSC on behalf of the fund. For the six months ended June 30, 2013, these costs amounted to $6.
Administrator – MFS provides certain financial, legal, shareholder communications, compliance, and other administrative services to the fund. Under an administrative services agreement, the fund partially reimburses MFS the costs incurred to provide these services. The fund is charged an annual fixed amount of $17,500 plus a fee based on average daily net assets. The administrative services fee incurred for the six months ended June 30, 2013 was equivalent to an annual effective rate of 0.0250% of the fund’s average daily net assets.
15
MFS Emerging Markets Equity Portfolio
Notes to Financial Statements (unaudited) – continued
Trustees’ and Officers’ Compensation – The fund pays compensation to independent Trustees in the form of a retainer, attendance fees, and additional compensation to Board and Committee chairpersons. The fund does not pay compensation directly to Trustees or officers of the fund who are also officers of the investment adviser, all of whom receive remuneration for their services to the fund from MFS. Certain officers and Trustees of the fund are officers or directors of MFS, MFD, and MFSC.
Other – This fund and certain other funds managed by MFS (the funds) have entered into services agreements (the Agreements) which provide for payment of fees by the funds to Tarantino LLC and Griffin Compliance LLC in return for the provision of services of an Independent Chief Compliance Officer (ICCO) and Assistant ICCO, respectively, for the funds. The ICCO and Assistant ICCO are officers of the funds and the sole members of Tarantino LLC and Griffin Compliance LLC, respectively. The funds can terminate the Agreements with Tarantino LLC and Griffin Compliance LLC at any time under the terms of the Agreements. For the six months ended June 30, 2013, the aggregate fees paid by the fund to Tarantino LLC and Griffin Compliance LLC were $338 and are included in “Miscellaneous” expense in the Statement of Operations. MFS has agreed to reimburse the fund for a portion of the payments made by the fund in the amount of $171, which is shown as a reduction of total expenses in the Statement of Operations. Additionally, MFS has agreed to bear all expenses associated with office space, other administrative support, and supplies provided to the ICCO and Assistant ICCO.
The fund invests in the MFS Institutional Money Market Portfolio which is managed by MFS and seeks current income consistent with preservation of capital and liquidity. Income earned on this investment is included in “Dividends from underlying affiliated funds” in the Statement of Operations. This money market fund does not pay a management fee to MFS.
Purchases and sales of investments, other than short-term obligations, aggregated $18,728,658 and $13,583,605, respectively.
| (5) | | Shares of Beneficial Interest |
The fund’s Declaration of Trust permits the Trustees to issue an unlimited number of full and fractional shares of beneficial interest. Transactions in fund shares were as follows:
| | | | | | | | | | | | | | | | |
| | | Six months ended 6/30/13 | | | Year ended 12/31/12 | |
| | | Shares | | | Amount | | | Shares | | | Amount | |
| Shares sold | | | | | | | | | | | | | | | | |
Initial Class | | | 224,914 | | | | $3,334,193 | | | | 512,045 | | | | $7,556,283 | |
Service Class | | | 586,406 | | | | 8,527,344 | | | | 620,853 | | | | 9,211,261 | |
| | | 811,320 | | | | $11,861,537 | | | | 1,132,898 | | | | $16,767,544 | |
| Shares issued to shareholders in reinvestment of distributions | | | | | | | | | | | | | | | | |
Initial Class | | | — | | | | $— | | | | 349,593 | | | | $5,009,674 | |
Service Class | | | — | | | | — | | | | 142,474 | | | | 2,011,732 | |
| | | — | | | | $— | | | | 492,067 | | | | $7,021,406 | |
| Shares reacquired | | | | | | | | | | | | | | | | |
Initial Class | | | (208,889 | ) | | | $(3,148,114 | ) | | | (4,148,462 | ) | | | $(60,765,216 | ) |
Service Class | | | (235,585 | ) | | | (3,504,057 | ) | | | (780,281 | ) | | | (11,646,525 | ) |
| | | (444,474 | ) | | | $(6,652,171 | ) | | | (4,928,743 | ) | | | $(72,411,741 | ) |
| Net change | | | | | | | | | | | | | | | | |
Initial Class | | | 16,025 | | | | $186,079 | | | | (3,286,824 | ) | | | $(48,199,259 | ) |
Service Class | | | 350,821 | | | | 5,023,287 | | | | (16,954 | ) | | | (423,532 | ) |
| | | 366,846 | | | | $5,209,366 | | | | (3,303,778 | ) | | | $(48,622,791 | ) |
The fund is one of several mutual funds in which the MFS funds-of-funds may invest. The MFS funds-of-funds do not invest in the underlying MFS funds for the purpose of exercising management or control. At the end of the period, the MFS Growth Allocation Portfolio was the owner of record of approximately 7% of the value of outstanding voting shares of the fund.
The fund and certain other funds managed by MFS participate in a $1.1 billion unsecured committed line of credit, subject to a $1 billion sublimit, provided by a syndication of banks under a credit agreement. Borrowings may be made for temporary financing needs. Interest is charged to each fund, based on its borrowings, generally at a rate equal to the higher of the Federal Reserve funds rate or one month LIBOR plus an agreed upon spread. A commitment fee, based on the average daily, unused portion of the committed line of credit, is allocated among the participating funds at the end of each calendar quarter. In addition, the fund and other funds managed by MFS have established unsecured uncommitted borrowing arrangements with certain banks for temporary financing needs. Interest is charged to each fund, based on its borrowings, at a rate equal to the Federal Reserve funds rate plus an agreed upon spread. For the six months ended June 30, 2013, the fund’s commitment fee and interest expense were $221 and $0, respectively, and are included in “Miscellaneous” expense in the Statement of Operations.
16
MFS Emerging Markets Equity Portfolio
Notes to Financial Statements (unaudited) – continued
| (7) | | Transactions in Underlying Affiliated Funds – Affiliated Issuers |
An affiliated issuer may be considered one in which the fund owns 5% or more of the outstanding voting securities, or a company which is under common control. For the purposes of this report, the fund assumes the following to be an affiliated issuer:
| | | | | | | | | | | | | | | | |
| Underlying Affiliated Fund | | Beginning
Shares/Par
Amount | | | Acquisitions
Shares/Par
Amount | | | Dispositions
Shares/Par
Amount | | | Ending
Shares/Par
Amount | |
| MFS Institutional Money Market Portfolio | | | 25 | | | | 9,280,358 | | | | (9,212,436 | ) | | | 67,947 | |
| | | | |
| Underlying Affiliated Fund | | Realized
Gain (Loss) | | | Capital Gain
Distributions | | | Dividend
Income | | | Ending
Value | |
| MFS Institutional Money Market Portfolio | | | $— | | | | $— | | | | $336 | | | | $67,947 | |
17
MFS Emerging Markets Equity Portfolio
BOARD REVIEW OF INVESTMENT ADVISORY AGREEMENT
A discussion regarding the Board’s most recent review and renewal of the fund’s Investment Advisory Agreement with MFS will be available on or about November 1, 2013 by clicking on the fund’s name under “Variable Insurance Portfolios — VIT II” in the “Products” section of the MFS Web site (mfs.com).
PROXY VOTING POLICIES AND INFORMATION
A general description of the MFS funds’ proxy voting policies and procedures is available without charge, upon request, by calling 1-800-225-2606, by visiting the Proxy Voting section of mfs.com or by visiting the SEC’s Web site at http://www.sec.gov.
Information regarding how the fund voted proxies relating to portfolio securities during the most recent twelve-month period ended June 30 is available without charge by visiting the Proxy Voting section of mfs.com or by visiting the SEC’s Web site at http://www.sec.gov.
QUARTERLY PORTFOLIO DISCLOSURE
The fund will file a complete schedule of portfolio holdings with the Securities and Exchange Commission (the Commission) for the first and third quarters of each fiscal year on Form N-Q. The fund’s Form N-Q is available on the EDGAR database on the Commission’s Internet Web site at http://www.sec.gov, and may be reviewed and copied at the:
Public Reference Room
Securities and Exchange Commission
100 F Street, NE, Room 1580
Washington, D.C. 20549
Information on the operation of the Public Reference Room may be obtained by calling the Commission at 1-800-SEC-0330. Copies of the fund’s Form N-Q also may be obtained, upon payment of a duplicating fee, by electronic request at the following e-mail address: publicinfo@sec.gov or by writing the Public Reference Section at the above address.
FURTHER INFORMATION
From time to time, MFS may post important information about the fund or the MFS funds on the MFS web site (mfs.com). This information is available by visiting the “News & Commentary” section of mfs.com or by clicking on the fund’s name under “Variable Insurance Portfolios — VIT II” in the “Products” section of mfs.com.
18
SEMIANNUAL REPORT
June 30, 2013

MFS® STRATEGIC
INCOME PORTFOLIO
MFS® Variable Insurance Trust II

SIS-SEM
MFS® STRATEGIC INCOME PORTFOLIO
CONTENTS
The report is prepared for the general information of contract owners. It is authorized for distribution to prospective investors only when preceded or accompanied by a current prospectus.
NOT FDIC INSURED Ÿ MAY LOSE VALUE Ÿ NO BANK OR CREDIT UNION GUARANTEE Ÿ NOT A DEPOSIT Ÿ NOT INSURED BY ANY FEDERAL GOVERNMENT AGENCY OR NCUA/NCUSIF
MFS Strategic Income Portfolio
LETTER FROM THE CHAIRMAN AND CEO

Dear Contract Owners:
As the year progresses, the global economy continues to grind ahead slowly, held back by broad austerity measures. The U.S. economy remains a steadying force, driven by resilient consumers, who have taken the payroll tax increase and the sequestration’s early impact in stride. With U.S. housing and jobs showing steady expansion, domestic consumer-driven growth has offset weaker exports and the U.S. government’s spending constraints. In response to these developments, the U.S. Federal Reserve has begun to brace investors for an eventual shift in its monetary policy, causing global market tremors.
Japan has been another bright spot, with government and central bank stimulus policies leading to increased exports, a resurgent stock market and improved economic sentiment. After a six-month rally, Japan’s stocks slipped late in the second quarter, then picked up momentum on fresh signs that the country could soon break free of its chronic deflation. The major deterrent to global growth remains the eurozone, still in the grip of persistent recession. China has seen its pace of economic growth decelerate, a troubling turn for the country’s trading partners, who have come to rely on it as an engine for global growth.
As always, managing risk in the face of uncertainty remains a top priority for investors. At MFS®, our uniquely collaborative investment process employs integrated, global research and active risk management. Our global team of investment professionals shares ideas and evaluates opportunities across continents, investment disciplines and asset classes — all with a goal of building better insights, and ultimately better results, for our clients.
We are mindful of the many economic challenges investors face, and believe it is more important than ever to maintain a long-term view and employ time-tested principles, such as asset allocation and diversification. We remain confident that our unique approach can serve investors well as they work with their financial advisors to identify and pursue the most suitable opportunities.
Respectfully,

Robert J. Manning
Chairman and Chief Executive Officer
MFS Investment Management®
August 16, 2013
The opinions expressed in this letter are subject to change, may not be relied upon for investment advice, and no forecasts can be guaranteed.
1
MFS Strategic Income Portfolio
PORTFOLIO COMPOSITION
Portfolio structure (i)
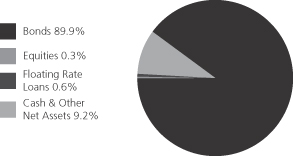
| | | | |
| Fixed income sectors (i) | | | | |
| High Grade Corporates | | | 51.0% | |
| High Yield Corporates | | | 30.5% | |
| Non-U.S. Government Bonds | | | 8.4% | |
| Emerging Markets Bonds | | | 5.1% | |
| U.S. Government Agencies | | | 1.0% | |
Floating Rate Loans | | | 0.6% | |
| Mortgage-Backed Securities | | | 0.5% | |
Asset-Backed Securities | | | 0.5% | |
| Municipal Bonds | | | 0.4% | |
| Commercial Mortgage-Backed Securities | | | 0.1% | |
| Collateralized Debt Obligations | | | 0.1% | |
| U.S. Treasury Securities | | | (7.7)% | |
| | | | |
Composition including fixed income credit
quality (a)(i) | |
| AAA | | | 1.9% | |
| AA | | | 5.7% | |
| A | | | 19.4% | |
| BBB | | | 36.8% | |
| BB | | | 13.6% | |
| B | | | 14.1% | |
| CCC | | | 4.4% | |
| C | | | 0.2% | |
| Federal Agencies | | | 1.5% | |
| Not Rated | | | (7.1)% | |
| Non-Fixed Income | | | 0.3% | |
| Cash & Other | | | 9.2% | |
| |
| Portfolio facts (i) | | | | |
| Average Duration (d) | | | 4.7 | |
| Average Effective Maturity (m) | | | 7.5 yrs. | |
| |
| Issuer country weightings (i)(x) | | | | |
| United States | | | 67.5% | |
| United Kingdom | | | 5.2% | |
| France | | | 3.4% | |
| Canada | | | 2.5% | |
| Netherlands | | | 2.4% | |
| Italy | | | 2.2% | |
| Australia | | | 2.2% | |
| Germany | | | 1.9% | |
| Sweden | | | 1.6% | |
| Other Countries | | | 11.1% | |
| (a) | | For all securities other than those specifically described below, ratings are assigned to underlying securities utilizing ratings from Moody’s, Fitch, and Standard & Poor’s rating agencies and applying the following hierarchy: If all three agencies provide a rating, the middle rating (after dropping the highest and lowest ratings) is assigned; if two of the three agencies rate a security, the lower of the two is assigned. Ratings are shown in the S&P and Fitch scale (e.g., AAA). Securities rated BBB or higher are considered investment grade. All ratings are subject to change. Federal Agencies includes rated and unrated U.S. Agency fixed-income securities, U.S. Agency mortgage-backed securities, and collateralized mortgage obligations of U.S. Agency mortgage-backed securities. Not Rated includes fixed income securities, including fixed income futures contracts, which have not been rated by any rating agency. Non-Fixed Income includes equity securities (including convertible bonds and equity derivatives) and commodities. Cash & Other includes cash, other assets less liabilities, offsets to derivative positions, and short-term securities. The fund may not hold all of these instruments. The fund is not rated by these agencies. |
| (d) | | Duration is a measure of how much a bond’s price is likely to fluctuate with general changes in interest rates, e.g., if rates rise 1.00%, a bond with a 5-year duration is likely to lose about 5.00% of its value due to the interest rate move. |
| (i) | | For purposes of this presentation, the components include the market value of securities, and reflect the impact of the equivalent exposure of derivative positions, if any. These amounts may be negative from time to time. Equivalent exposure is a calculated amount that translates the derivative position into a reasonable approximation of the amount of the underlying asset that the portfolio would have to hold at a given point in time to have the same price sensitivity that results from the portfolio’s ownership of the derivative contract. When dealing with derivatives, equivalent exposure is a more representative measure of the potential impact of a position on portfolio performance than market value. The bond component will include any accrued interest amounts. |
| (m) | | In determining an instrument’s effective maturity for purposes of calculating the fund’s dollar-weighted average effective maturity, MFS uses the instrument’s stated maturity or, if applicable, an earlier date on which MFS believes it is probable that a maturity-shortening device (such as a put, pre-refunding or prepayment) will cause the instrument to be repaid. Such an earlier date can be substantially shorter than the instrument’s stated maturity. |
| (x) | | Represents the portfolio’s exposure to issuer countries as a percentage of a portfolio’s net assets. |
Where the fund holds convertible bonds, these are treated as part of the equity portion of the portfolio.
The fund invests a portion of its assets in the MFS High Yield Pooled Portfolio. Percentages reflect exposure to the underlying holdings of the MFS High Yield Pooled Portfolio and not to the exposure from investing directly in the MFS High Yield Pooled Portfolio itself.
Percentages are based on net assets as of 6/30/13.
The portfolio is actively managed and current holdings may be different.
2
MFS Strategic Income Portfolio
EXPENSE TABLE
Fund Expenses Borne by the Contract Holders During the Period,
January 1, 2013 through June 30, 2013
As a contract holder of the fund, you incur ongoing costs, including management fees; distribution and/or service (12b-1) fees; and other fund expenses. This example is intended to help you understand your ongoing costs (in dollars) of investing in the fund and to compare these costs with the ongoing costs of investing in other mutual funds.
In addition to the fees and expenses which the fund bears directly, the fund indirectly bears a pro rata share of the fees and expenses of the underlying MFS Pooled Portfolio in which the fund invests. MFS Pooled Portfolios are mutual funds advised by MFS that do not pay management fees to MFS but do incur investment and operating costs. If these transactional and indirect costs were included, your costs would have been higher.
The example is based on an investment of $1,000 invested at the beginning of the period and held for the entire period January 1, 2013 through June 30, 2013.
Actual Expenses
The first line for each share class in the following table provides information about actual account values and actual expenses. You may use the information in this line, together with the amount you invested, to estimate the expenses that you paid over the period. Simply divide your account value by $1,000 (for example, an $8,600 account value divided by $1,000 = 8.6), then multiply the result by the number in the first line under the heading entitled “Expenses Paid During Period” to estimate the expenses you paid on your account during this period.
Hypothetical Example for Comparison Purposes
The second line for each share class in the following table provides information about hypothetical account values and hypothetical expenses based on the fund’s actual expense ratio and an assumed rate of return of 5% per year before expenses, which is not the fund’s actual return. The hypothetical account values and expenses may not be used to estimate the actual ending account balance or expenses you paid for the period. You may use this information to compare the ongoing costs of investing in the fund and other funds. To do so, compare this 5% hypothetical example with the 5% hypothetical examples that appear in the shareholder reports of the other funds.
Please note that the expenses shown in the table are meant to highlight the fund’s ongoing costs only and do not take into account the fees and expenses imposed under the variable contracts through which your investment in the fund is made. Therefore, the second line for each share class in the table is useful in comparing ongoing costs associated with an investment in vehicles (such as the fund) which fund benefits under variable annuity and variable life insurance contracts and to qualified pension and retirement plans only, and will not help you determine the relative total costs of investing in the fund through variable annuity and variable life insurance contracts. If the fees and expenses imposed under the variable contracts were included, your costs would have been higher.
| | | | | | | | | | | | | | | | | | |
| Share Class | | | | Annualized
Expense Ratio | | | Beginning
Account Value
1/01/13 | | | Ending
Account Value
6/30/13 | | | Expenses Paid
During Period (p)
1/01/13-6/30/13 | |
| Initial Class | | Actual | | | 0.90% | | | | $1,000.00 | | | | $982.34 | | | | $4.42 | |
| | Hypothetical (h) | | | 0.90% | | | | $1,000.00 | | | | $1,020.33 | | | | $4.51 | |
| Service Class | | Actual | | | 1.15% | | | | $1,000.00 | | | | $981.24 | | | | $5.65 | |
| | Hypothetical (h) | | | 1.15% | | | | $1,000.00 | | | | $1,019.09 | | | | $5.76 | |
| (h) | 5% class return per year before expenses. |
| (p) | Expenses paid are equal to each class’s annualized expense ratio, as shown above, multiplied by the average account value over the period, multiplied by the number of days in the period, divided by the number of days in the year. In addition to the fees and expenses which the fund bears directly, the fund indirectly bears a pro rata share of the fees and expenses of the underlying funds in which the fund invests. If these indirect costs were included, your costs would have been higher. |
3
MFS Strategic Income Portfolio
PORTFOLIO OF INVESTMENTS – 6/30/13 (unaudited)
The Portfolio of Investments is a complete list of all securities owned by your fund. It is categorized by broad-based asset classes.
| | | | | | | | |
| Issuer | | Shares/Par | | | Value ($) | |
| | | | | | | | |
| BONDS – 65.7% | | | | | | | | |
| Asset-Backed & Securitized – 0.7% | | | | | |
| Bayview Financial Revolving Mortgage Loan Trust, FRN, 1.795%, 2040 (z) | | $ | 157,298 | | | $ | 75,958 | |
Capital Trust Realty Ltd., CDO,
5.16%, 2035 (n) | | | 33,419 | | | | 33,439 | |
| Crest Ltd., CDO, 7%, 2040 (a)(p) | | | 332,489 | | | | 16,624 | |
| Falcon Franchise Loan LLC, FRN, 7.269%, 2023 (i)(z) | | | 112,750 | | | | 13,530 | |
| Falcon Franchise Loan LLC, FRN, 11.363%, 2025 (i)(z) | | | 62,783 | | | | 9,417 | |
| First Union-Lehman Brothers Bank of America, FRN, 0.686%, 2035 (i) | | | 970,884 | | | | 19,099 | |
| HLSS Servicer Advance Receivables Trust, 2013-T1, “A2”, 1.495%, 2046 (n) | | | 150,000 | | | | 148,035 | |
| Morgan Stanley Capital I, Inc., FRN, 1.384%, 2039 (i)(z) | | | 715,961 | | | | 15,214 | |
| | | | | | | | |
| | | $ | 331,316 | |
| | | | | | | | |
| Automotive – 0.8% | | | | | | | | |
| Daimler Finance North America LLC, 1.875%, 2018 (n) | | $ | 212,000 | | | $ | 206,877 | |
| Harley-Davidson Financial Services, 3.875%, 2016 (n) | | | 190,000 | | | | 201,456 | |
| | | | | | | | |
| | | $ | 408,333 | |
| | | | | | | | |
| Biotechnology – 0.3% | | | | | | | | |
| Life Technologies Corp., 6%, 2020 | | $ | 150,000 | | | $ | 168,982 | |
| | | | | | | | |
| Broadcasting – 0.9% | | | | | | | | |
| CBS Corp., 5.75%, 2020 | | $ | 40,000 | | | $ | 45,369 | |
| CBS Corp., 3.375%, 2022 | | | 148,000 | | | | 142,666 | |
| News America, Inc., 8.5%, 2025 | | | 75,000 | | | | 95,428 | |
| Vivendi S.A., 4.75%, 2022 (n) | | | 160,000 | | | | 160,027 | |
| | | | | | | | |
| | | $ | 443,490 | |
| | | | | | | | |
| Brokerage & Asset Managers – 1.0% | | | | | |
| Blackstone Holdings Finance Co. LLC, 4.75%, 2023 (n) | | $ | 153,000 | | | $ | 161,852 | |
| Invesco Finance PLC, 3.125%, 2022 | | | 108,000 | | | | 100,743 | |
| TD Ameritrade Holding Corp., 5.6%, 2019 | | | 175,000 | | | | 203,428 | |
| | | | | | | | |
| | | $ | 466,023 | |
| | | | | | | | |
| Building – 0.4% | | | | | | | | |
| CRH PLC, 8.125%, 2018 | | $ | 120,000 | | | $ | 146,009 | |
| Owens Corning, Inc., 4.2%, 2022 | | | 65,000 | | | | 62,984 | |
| | | | | | | | |
| | | $ | 208,993 | |
| | | | | | | | |
| Cable TV – 1.9% | | | | | | | | |
Cox Communications, Inc.,
3.25%, 2022 (n) | | $ | 193,000 | | | $ | 181,579 | |
| DIRECTV Holdings LLC, 5.875%, 2019 | | | 70,000 | | | | 78,778 | |
| Myriad International Holdings B.V., 6.375%, 2017 (n) | | | 128,000 | | | | 140,160 | |
NBCUniversal Enterprise, Inc.,
1.974%, 2019 (n) | | | 104,000 | | | | 101,219 | |
| | | | | | | | |
| Issuer | | Shares/Par | | | Value ($) | |
| | | | | | | | |
| BONDS – continued | | | | | | | | |
| Cable TV – continued | | | | | | | | |
| NBCUniversal Media LLC, 5.95%, 2041 | | $ | 161,000 | | | $ | 183,882 | |
| Time Warner Cable, Inc., 8.25%, 2019 | | | 190,000 | | | | 228,759 | |
| | | | | | | | |
| | | $ | 914,377 | |
| | | | | | | | |
| Chemicals – 1.0% | | | | | | | | |
| CF Industries, Inc., 3.45%, 2023 | | $ | 74,000 | | | $ | 71,115 | |
| Dow Chemical Co., 8.55%, 2019 | | | 260,000 | | | | 331,728 | |
| Sociedad Quimica y Minera de Chile S.A., 5.5%, 2020 (n) | | | 100,000 | | | | 106,227 | |
| | | | | | | | |
| | | $ | 509,070 | |
| | | | | | | | |
| Computer Software – 0.2% | | | | | | | | |
| Oracle Corp., 5.375%, 2040 | | $ | 103,000 | | | $ | 114,813 | |
| | | | | | | | |
| Conglomerates – 0.4% | | | | | | | | |
| Ingersoll-Rand Global Holding Co. Ltd., 9.5%, 2014 | | $ | 61,000 | | | $ | 65,103 | |
Votorantim Participacoes S.A.,
6.75%, 2021 (n) | | | 100,000 | | | | 106,500 | |
| | | | | | | | |
| | | $ | 171,603 | |
| | | | | | | | |
| Consumer Products – 0.9% | | | | | |
| Avon Products, Inc., 4.6%, 2020 | | $ | 121,000 | | | $ | 122,338 | |
| Mattel, Inc., 5.45%, 2041 | | | 83,000 | | | | 85,444 | |
| Newell Rubbermaid, Inc., 2.05%, 2017 | | | 74,000 | | | | 72,517 | |
| Newell Rubbermaid, Inc., 4.7%, 2020 | | | 90,000 | | | | 96,116 | |
| Tupperware Brands Corp., 4.75%, 2021 | | | 81,000 | | | | 82,153 | |
| | | | | | | | |
| | | $ | 458,568 | |
| | | | | | | | |
| Consumer Services – 0.4% | | | | | |
| Experian Finance PLC, 2.375%, 2017 (n) | | $ | 200,000 | | | $ | 198,152 | |
| | | | | | | | |
| Defense Electronics – 0.6% | | | | | |
BAE Systems Holdings, Inc.,
5.2%, 2015 (n) | | $ | 212,000 | | | $ | 228,130 | |
BAE Systems Holdings, Inc.,
6.375%, 2019 (n) | | | 60,000 | | | | 69,474 | |
| | | | | | | | |
| | | $ | 297,604 | |
| | | | | | | | |
| Electrical Equipment – 0.3% | | | | | | | | |
| Arrow Electronics, Inc., 3%, 2018 | | $ | 53,000 | | | $ | 52,924 | |
| Ericsson, Inc., 4.125%, 2022 | | | 115,000 | | | | 112,461 | |
| | | | | | | | |
| | | $ | 165,385 | |
| | | | | | | | |
| Electronics – 0.1% | | | | | | | | |
| Tyco Electronics Group S.A., 3.5%, 2022 | | $ | 48,000 | | | $ | 46,513 | |
| | | | | | | | |
| Emerging Market Quasi-Sovereign – 2.5% | |
| Gaz Capital S.A., 3.85%, 2020 (n) | | $ | 200,000 | | | $ | 186,000 | |
| Gaz Capital S.A., 4.95%, 2028 (n) | | | 200,000 | | | | 172,000 | |
| IIRSA Norte Finance Ltd., 8.75%, 2024 | | | 114,329 | | | | 133,765 | |
Petrobras Global Finance Co.,
4.375%, 2023 | | | 6,000 | | | | 5,504 | |
| Petrobras International Finance Co., 7.875%, 2019 | | | 81,000 | | | | 93,665 | |
4
MFS Strategic Income Portfolio
Portfolio of Investments (unaudited) – continued
| | | | | | | | |
| Issuer | | Shares/Par | | | Value ($) | |
| | | | | | | | |
| BONDS – continued | | | | | | | | |
| Emerging Market Quasi-Sovereign – continued | |
| Petrobras International Finance Co., 6.75%, 2041 | | $ | 73,000 | | | $ | 72,931 | |
| Petroleos Mexicanos, 5.5%, 2021 | | | 116,000 | | | | 123,540 | |
| Petroleos Mexicanos, 4.875%, 2022 | | | 54,000 | | | | 55,080 | |
| Petroleos Mexicanos, 6.5%, 2041 | | | 49,000 | | | | 50,593 | |
| Ras Laffan Liquefied Natural Gas Co. Ltd., 5.832%, 2016 (n) | | | 145,425 | | | | 154,514 | |
| Rosneft, 4.199%, 2022 (n) | | | 200,000 | | | | 185,300 | |
| | | | | | | | |
| | | $ | 1,232,892 | |
| | | | | | | | |
| Emerging Market Sovereign – 0.3% | | | | | | | | |
| Republic of Hungary, 5.375%, 2023 | | $ | 10,000 | | | $ | 9,625 | |
| Republic of Philippines, 6.375%, 2034 | | | 100,000 | | | | 120,000 | |
| Republic of Poland, 5%, 2022 | | | 23,000 | | | | 24,725 | |
| Republic of Romania, 4.375%, 2023 (n) | | | 6,000 | | | | 5,700 | |
| United Mexican States, 5.95%, 2019 | | | 6,000 | | | | 6,867 | |
| | | | | | | | |
| | | $ | 166,917 | |
| | | | | | | | |
| Energy – Independent – 0.3% | | | | | | | | |
| EQT Corp., 4.875%, 2021 | | $ | 74,000 | | | $ | 76,130 | |
| Hess Corp., 8.125%, 2019 | | | 60,000 | | | | 75,209 | |
| | | | | | | | |
| | | $ | 151,339 | |
| | | | | | | | |
| Energy – Integrated – 1.5% | | | | | | | | |
| BP Capital Markets PLC, 4.5%, 2020 | | $ | 46,000 | | | $ | 49,905 | |
| BP Capital Markets PLC, 4.742%, 2021 | | | 130,000 | | | | 141,452 | |
| Cenovus Energy, Inc., 4.5%, 2014 | | | 60,000 | | | | 62,644 | |
| Chevron Corp., 2.427%, 2020 | | | 170,000 | | | | 169,031 | |
| Pacific Rubiales Energy Corp., 7.25%, 2021 (n) | | | 115,000 | | | | 121,613 | |
Petro-Canada Financial Partnership,
5%, 2014 | | | 170,000 | | | | 179,272 | |
| | | | | | | | |
| | | $ | 723,917 | |
| | | | | | | | |
| Financial Institutions – 1.4% | | | | | | | | |
| General Electric Capital Corp., 6%, 2019 | | $ | 50,000 | | | $ | 58,047 | |
| General Electric Capital Corp., 5.5%, 2020 | | | 110,000 | | | | 124,023 | |
| General Electric Capital Corp., 3.15%, 2022 | | | 138,000 | | | | 130,399 | |
| General Electric Capital Corp., 3.1%, 2023 | | | 79,000 | | | | 74,629 | |
| LeasePlan Corp. N.V., 3%, 2017 (n) | | | 200,000 | | | | 200,640 | |
| NYSE Euronext, 2%, 2017 | | | 86,000 | | | | 85,537 | |
| | | | | | | | |
| | | $ | 673,275 | |
| | | | | | | | |
| Food & Beverages – 2.7% | | | | | | | | |
| Anheuser-Busch InBev S.A., 7.75%, 2019 | | $ | 220,000 | | | $ | 278,263 | |
| Campbell Soup Co., 2.5%, 2022 | | | 61,000 | | | | 55,626 | |
| Conagra Foods, Inc., 3.2%, 2023 | | | 120,000 | | | | 114,753 | |
| Kraft Foods Group, Inc., 6.125%, 2018 | | | 170,000 | | | | 199,605 | |
Mead Johnson Nutrition Co., “A”,
4.9%, 2019 | | | 43,000 | | | | 47,200 | |
| Pernod-Ricard S.A., 2.95%, 2017 (n) | | | 200,000 | | | | 204,642 | |
| SABMiller Holdings, Inc., 3.75%, 2022 (n) | | | 205,000 | | | | 208,626 | |
| Tyson Foods, Inc., 6.6%, 2016 | | | 120,000 | | | | 135,544 | |
| Tyson Foods, Inc., 4.5%, 2022 | | | 75,000 | | | | 76,637 | |
| | | | | | | | |
| | | $ | 1,320,896 | |
| | | | | | | | |
| | | | | | | | |
| Issuer | | Shares/Par | | | Value ($) | |
| | | | | | | | |
| BONDS – continued | | | | | | | | |
| Food & Drug Stores – 0.4% | | | | | | | | |
| CVS Caremark Corp., 5.75%, 2041 | | $ | 180,000 | | | $ | 202,901 | |
| | | | | | | | |
| Forest & Paper Products – 0.3% | | | | | | | | |
| Georgia-Pacific LLC, 3.734%, 2023 (n) | | $ | 166,000 | | | $ | 161,460 | |
| | | | | | | | |
| Gaming & Lodging – 0.1% | | | | | | | | |
| Hyatt Hotels Corp., 3.375%, 2023 | | $ | 62,000 | | | $ | 57,800 | |
| | | | | | | | |
| Insurance – 2.3% | | | | | | | | |
| Allianz AG, 5.5% to 2014, FRN to 2049 | | EUR | 248,000 | | | $ | 323,093 | |
American International Group, Inc.,
3%, 2015 | | $ | 50,000 | | | | 51,528 | |
American International Group, Inc.,
5.85%, 2018 | | | 92,000 | | | | 103,446 | |
| ING U.S., Inc., 2.9%, 2018 (n) | | | 67,000 | | | | 67,337 | |
| MetLife, Inc., 1.756%, 2017 | | | 31,000 | | | | 30,519 | |
| Metropolitan Life Global Funding I, 5.125%, 2014 (n) | | | 80,000 | | | | 83,446 | |
Principal Financial Group, Inc.,
8.875%, 2019 | | | 130,000 | | | | 168,259 | |
| Prudential Financial, Inc., 6.2%, 2015 | | | 130,000 | | | | 140,069 | |
| Unum Group, 7.125%, 2016 | | | 160,000 | | | | 185,038 | |
| | | | | | | | |
| | | $ | 1,152,735 | |
| | | | | | | | |
| Insurance – Property & Casualty – 2.1% | | | | | |
| Aon Corp., 3.5%, 2015 | | $ | 140,000 | | | $ | 146,806 | |
| AXIS Capital Holdings Ltd., 5.75%, 2014 | | | 205,000 | | | | 217,289 | |
| AXIS Capital Holdings Ltd., 5.875%, 2020 | | | 50,000 | | | | 55,457 | |
| CNA Financial Corp., 5.875%, 2020 | | | 160,000 | | | | 181,076 | |
Liberty Mutual Group, Inc.,
4.95%, 2022 (n) | | | 114,000 | | | | 117,042 | |
| PartnerRe Ltd., 5.5%, 2020 | | | 107,000 | | | | 117,768 | |
| QBE Capital Funding III Ltd., FRN, 7.25%, 2041 (n) | | | 200,000 | | | | 211,200 | |
| | | | | | | | |
| | | $ | 1,046,638 | |
| | | | | | | | |
| International Market Quasi-Sovereign – 0.9% | |
| EDF Energies Nouvelles S.A., 6.5%, 2019 (n) | | $ | 230,000 | | | $ | 272,522 | |
| Eksportfinans A.S.A., 5.5%, 2016 | | | 150,000 | | | | 156,263 | |
| | | | | | | | |
| | | $ | 428,785 | |
| | | | | | | | |
| International Market Sovereign – 7.3% | | | | | |
Commonwealth of Australia,
5.75%, 2021 | | AUD | 48,000 | | | $ | 50,366 | |
Federal Republic of Germany,
4.25%, 2018 | | EUR | 92,000 | | | | 140,325 | |
Federal Republic of Germany,
6.25%, 2030 | | EUR | 77,000 | | | | 154,670 | |
| Government of Canada, 4.5%, 2015 | | CAD | 86,000 | | | | 86,837 | |
| Government of Canada, 4.25%, 2018 | | CAD | 66,000 | | | | 69,885 | |
| Government of Canada, 5.75%, 2033 | | CAD | 17,000 | | | | 23,206 | |
| Government of Japan, 1.1%, 2020 | | JPY | 15,800,000 | | | | 164,980 | |
| Government of Japan, 2.1%, 2024 | | JPY | 7,500,000 | | | | 84,726 | |
| Government of Japan, 2.2%, 2027 | | JPY | 18,050,000 | | | | 204,711 | |
| Government of Japan, 2.4%, 2037 | | JPY | 18,650,000 | | | | 211,543 | |
| Government of Japan, 1.8%, 2043 | | JPY | 6,000,000 | | | | 59,969 | |
5
MFS Strategic Income Portfolio
Portfolio of Investments (unaudited) – continued
| | | | | | | | |
| Issuer | | Shares/Par | | | Value ($) | |
| | | | | | | | |
| BONDS – continued | | | | | | | | |
| International Market Sovereign – continued | | | | | |
| Kingdom of Belgium, 5.5%, 2017 | | EUR | 118,000 | | | $ | 180,742 | |
| Kingdom of Denmark, 3%, 2021 | | DKK | 218,000 | | | | 42,491 | |
| Kingdom of Spain, 4.6%, 2019 | | EUR | 192,000 | | | | 258,489 | |
| Kingdom of Sweden, 5%, 2020 | | SEK | 155,000 | | | | 27,941 | |
| Kingdom of the Netherlands, 5.5%, 2028 | | EUR | 22,000 | | | | 39,360 | |
| Republic of Austria, 4.65%, 2018 | | EUR | 78,000 | | | | 117,743 | |
| Republic of Finland, 3.875%, 2017 | | EUR | 22,000 | | | | 32,196 | |
| Republic of France, 6%, 2025 | | EUR | 44,000 | | | | 77,423 | |
| Republic of France, 4.75%, 2035 | | EUR | 104,000 | | | | 168,053 | |
| Republic of Ireland, 4.6%, 2016 | | EUR | 67,000 | | | | 93,415 | |
| Republic of Ireland, 4.5%, 2020 | | EUR | 34,000 | | | | 46,204 | |
| Republic of Italy, 4.25%, 2015 | | EUR | 89,000 | | | | 120,188 | |
| Republic of Italy, 5.25%, 2017 | | EUR | 269,000 | | | | 377,016 | |
| Republic of Italy, 3.75%, 2021 | | EUR | 154,000 | | | | 197,768 | |
| Republic of Portugal, 4.8%, 2020 | | EUR | 18,000 | | | | 21,626 | |
| State of Israel, 4%, 2022 | | $ | 248,000 | | | | 252,340 | |
| United Kingdom Treasury, 8%, 2021 | | GBP | 79,000 | | | | 171,798 | |
| United Kingdom Treasury, 4.25%, 2036 | | GBP | 73,000 | | | | 126,366 | |
| | | | | | | | |
| | | $ | 3,602,377 | |
| | | | | | | | |
| Local Authorities – 0.7% | | | | | |
| Louisiana Gas & Fuels Tax Rev. (Build America Bonds), FRN, 3%, 2043 | | $ | 160,000 | | | $ | 160,354 | |
| State of Illinois (Build America Bonds), 6.725%, 2035 | | | 175,000 | | | | 182,161 | |
| | | | | | | | |
| | | $ | 342,515 | |
| | | | | | | | |
| Machinery & Tools – 0.5% | | | | | |
| Atlas Copco AB, 5.6%, 2017 (n) | | $ | 214,000 | | | $ | 240,845 | |
| | | | | | | | |
| Major Banks – 7.1% | | | | | | | | |
| ABN AMRO Bank N.V., 4.25%, 2017 (n) | | $ | 200,000 | | | $ | 213,228 | |
| Bank of America Corp., 7.375%, 2014 | | | 65,000 | | | | 68,386 | |
| Bank of America Corp., 6.5%, 2016 | | | 125,000 | | | | 140,931 | |
| Bank of America Corp., 3.3%, 2023 | | | 113,000 | | | | 106,802 | |
| Barclays Bank PLC, 5.125%, 2020 | | | 130,000 | | | | 143,818 | |
BNP Paribas, 7.195% to 2037,
FRN to 2049 (n) | | | 100,000 | | | | 96,750 | |
| BNP Paribas, FRN, 3.022%, 2014 | | | 78,000 | | | | 80,461 | |
| Commonwealth Bank of Australia, 5%, 2019 (n) | | | 140,000 | | | | 156,663 | |
| DBS Bank Ltd., 2.35%, 2017 (n) | | | 200,000 | | | | 202,507 | |
Goldman Sachs Group, Inc.,
5.125%, 2015 | | | 90,000 | | | | 94,938 | |
| Goldman Sachs Group, Inc., 5.75%, 2022 | | | 201,000 | | | | 221,706 | |
| HSBC Holdings PLC, 4%, 2022 | | | 323,000 | | | | 330,695 | |
| JPMorgan Chase & Co., 2%, 2017 | | | 55,000 | | | | 54,585 | |
| JPMorgan Chase & Co., 4.625%, 2021 | | | 140,000 | | | | 147,984 | |
| Macquarie Bank Ltd., 5%, 2017 (n) | | | 111,000 | | | | 118,935 | |
| Macquarie Group Ltd., 6%, 2020 (n) | | | 86,000 | | | | 89,301 | |
| Merrill Lynch & Co., Inc., 6.4%, 2017 | | | 90,000 | | | | 101,625 | |
| Morgan Stanley, 6%, 2014 | | | 100,000 | | | | 104,005 | |
| Morgan Stanley, 7.3%, 2019 | | | 100,000 | | | | 116,161 | |
| Morgan Stanley, 5.625%, 2019 | | | 100,000 | | | | 107,483 | |
| Morgan Stanley, FRN, 1.522%, 2016 | | | 140,000 | | | | 139,605 | |
| Royal Bank of Scotland PLC, 2.55%, 2015 | | | 87,000 | | | | 88,458 | |
| | | | | | | | |
| Issuer | | Shares/Par | | | Value ($) | |
| | | | | | | | |
| BONDS – continued | | | | | | | | |
| Major Banks – continued | | | | | | | | |
| Santander International Debt S.A., 2.991%, 2013 (n) | | $ | 100,000 | | | $ | 100,570 | |
| Standard Chartered PLC, 3.85%, 2015 (n) | | | 150,000 | | | | 156,257 | |
| Wells Fargo & Co., 7.98% to 2018, FRN to 2049 | | | 78,000 | | | | 88,140 | |
| Westpac Banking Corp., 2%, 2017 | | | 240,000 | | | | 240,824 | |
| | | | | | | | |
| | | $ | 3,510,818 | |
| | | | | | | | |
| Medical & Health Technology & Services – 1.1% | |
| Cardinal Health, Inc., 5.8%, 2016 | | $ | 201,000 | | | $ | 228,139 | |
| McKesson Corp., 5.7%, 2017 | | | 90,000 | | | | 101,654 | |
| Owens & Minor, Inc., 6.35%, 2016 | | | 170,000 | | | | 184,405 | |
| | | | | | | | |
| | | $ | 514,198 | |
| | | | | | | | |
| Metals & Mining – 1.1% | |
| Barrick Gold Corp., 4.1%, 2023 (n) | | $ | 209,000 | | | $ | 174,610 | |
| Freeport-McMoRan Copper & Gold, Inc., 2.375%, 2018 (n) | | | 80,000 | | | | 76,086 | |
| Freeport-McMoRan Copper & Gold, Inc., 3.1%, 2020 (n) | | | 130,000 | | | | 120,161 | |
Glencore Funding LLC, FRN,
1.431%, 2016 (z) | | | 120,000 | | | | 116,847 | |
| Vale Overseas Ltd., 4.375%, 2022 | | | 70,000 | | | | 66,488 | |
| | | | | | | | |
| | | $ | 554,192 | |
| | | | | | | | |
| Miscellaneous Revenue – Other – 0.3% | |
| Florida Hurricane Catastrophe Fund Finance Corp. Rev, “A”, 2.107%, 2018 | | $ | 155,000 | | | $ | 149,941 | |
| | | | | | | | |
| Mortgage-Backed – 0.5% | | | | | | | | |
| Fannie Mae, 6.5%, 2032 | | $ | 65,679 | | | $ | 72,303 | |
| Freddie Mac, 4.224%, 2020 | | | 146,497 | | | | 160,418 | |
| | | | | | | | |
| | | $ | 232,721 | |
| | | | | | | | |
| Natural Gas – Distribution – 0.4% | | | | | |
| GDF Suez, 1.625%, 2017 (n) | | $ | 190,000 | | | $ | 187,116 | |
| | | | | | | | |
| Natural Gas – Pipeline – 2.2% | | | | | | | | |
| DCP Midstream LLC, 3.875%, 2023 | | $ | 105,000 | | | $ | 98,478 | |
Energy Transfer Partners LP,
3.6%, 2023 | | | 120,000 | | | | 112,307 | |
Energy Transfer Partners LP,
6.5%, 2042 | | | 135,000 | | | | 143,968 | |
Enterprise Products Partners LP,
6.3%, 2017 | | | 140,000 | | | | 163,744 | |
| Kinder Morgan Energy Partners LP, 6.375%, 2041 | | | 190,000 | | | | 212,099 | |
| Spectra Energy Capital LLC, 8%, 2019 | | | 164,000 | | | | 207,559 | |
Sunoco Logistics Partner LP,
3.45%, 2023 | | | 100,000 | | | | 92,901 | |
| Williams Cos., Inc., 3.7%, 2023 | | | 47,000 | | | | 43,667 | |
| | | | | | | | |
| | | $ | 1,074,723 | |
| | | | | | | | |
| Network & Telecom – 1.3% | | | | | | | | |
| AT&T, Inc., 5.5%, 2018 | | $ | 150,000 | | | $ | 171,563 | |
| AT&T, Inc., 3.875%, 2021 | | | 70,000 | | | | 72,197 | |
| Centurylink, Inc., 7.65%, 2042 | | | 134,000 | | | | 127,300 | |
6
MFS Strategic Income Portfolio
Portfolio of Investments (unaudited) – continued
| | | | | | | | |
| Issuer | | Shares/Par | | | Value ($) | |
| | | | | | | | |
| BONDS – continued | | | | | | | | |
| Network & Telecom – continued | | | | | |
| France Telecom, 4.375%, 2014 | | $ | 120,000 | | | $ | 123,586 | |
Verizon Communications, Inc.,
8.75%, 2018 | | | 91,000 | | | | 118,604 | |
| | | | | | | | |
| | | $ | 613,250 | |
| | | | | | | | |
| Oil Services – 0.4% | | | | | | | | |
| Transocean, Inc., 2.5%, 2017 | | $ | 53,000 | | | $ | 52,377 | |
| Transocean, Inc., 6%, 2018 | | | 110,000 | | | | 123,271 | |
| | | | | | | | |
| | | $ | 175,648 | |
| | | | | | | | |
| Other Banks & Diversified Financials – 3.9% | |
Banco GNB Sudameris S.A.,
3.875%, 2018 (n) | | $ | 18,000 | | | $ | 17,100 | |
| Bancolombia S.A., 5.125%, 2022 | | | 5,000 | | | | 4,763 | |
| Citigroup, Inc., 6.375%, 2014 | | | 120,000 | | | | 126,634 | |
| Citigroup, Inc., 6.01%, 2015 | | | 100,000 | | | | 106,793 | |
| Citigroup, Inc., 8.5%, 2019 | | | 145,000 | | | | 182,704 | |
| Deutsche Bank Capital Funding Trust, FRN, 5.33%, 2049 | | EUR | 125,000 | | | | 132,606 | |
| Groupe BPCE S.A., 12.5% to 2019, FRN to 2049 (n) | | | 157,000 | | | | 190,363 | |
| Intesa Sanpaolo S.p.A., FRN, 2.673%, 2014 (n) | | | 100,000 | | | | 100,367 | |
| Lloyds TSB Bank PLC, 5.8%, 2020 (n) | | | 100,000 | | | | 112,521 | |
| Rabobank Nederland N.V., 3.375%, 2017 | | | 92,000 | | | | 96,621 | |
| Rabobank Nederland N.V., 3.95%, 2022 | | | 250,000 | | | | 239,068 | |
Santander Holdings USA, Inc.,
4.625%, 2016 | | | 20,000 | | | | 21,098 | |
| SunTrust Banks, Inc., 3.5%, 2017 | | | 107,000 | | | | 111,972 | |
Svenska Handelsbanken AB,
4.875%, 2014 (n) | | | 180,000 | | | | 186,811 | |
| Swedbank AB, 2.125%, 2017 (n) | | | 200,000 | | | | 198,778 | |
| U.S. Bancorp, 2.95%, 2022 | | | 70,000 | | | | 64,935 | |
| | | | | | | | |
| | | $ | 1,893,134 | |
| | | | | | | | |
| Personal Computers & Peripherals – 0.4% | | | | | |
| Equifax, Inc., 3.3%, 2022 | | $ | 105,000 | | | $ | 98,565 | |
| Motorola Solutions, Inc., 3.5%, 2023 | | | 77,000 | | | | 72,587 | |
| | | | | | | | |
| | | $ | 171,152 | |
| | | | | | | | |
| Pharmaceuticals – 0.6% | | | | | | | | |
| Celgene Corp., 3.95%, 2020 | | $ | 160,000 | | | $ | 165,752 | |
| Hospira, Inc., 6.05%, 2017 | | | 100,000 | | | | 107,006 | |
| | | | | | | | |
| | | $ | 272,758 | |
| | | | | | | | |
| Pollution Control – 0.3% | | | | | | | | |
| Republic Services, Inc., 5.25%, 2021 | | $ | 130,000 | | | $ | 142,729 | |
| | | | | | | | |
| Printing & Publishing – 0.4% | | | | | | | | |
Pearson Funding Five PLC,
3.25%, 2023 (z) | | $ | 200,000 | | | $ | 184,367 | |
| | | | | | | | |
| Railroad & Shipping – 0.7% | | | | | | | | |
| CSX Corp., 4.1%, 2044 | | $ | 304,000 | | | $ | 263,973 | |
| Panama Canal Railway Co., 7%, 2026 (n) | | | 87,600 | | | | 84,096 | |
| | | | | | | | |
| | | $ | 348,069 | |
| | | | | | | | |
| | | | | | | | |
| Issuer | | Shares/Par | | | Value ($) | |
| | | | | | | | |
| BONDS – continued | | | | | | | | |
| Real Estate – 2.3% | | | | | | | | |
| Boston Properties LP, REIT, 3.7%, 2018 | | $ | 73,000 | | | $ | 76,672 | |
| DDR Corp., REIT, 4.625%, 2022 | | | 148,000 | | | | 149,567 | |
| DDR Corp., REIT, 3.375%, 2023 | | | 210,000 | | | | 192,469 | |
| ERP Operating LP, REIT, 3%, 2023 | | | 107,000 | | | | 98,335 | |
| HCP, Inc., REIT, 5.375%, 2021 | | | 141,000 | | | | 152,948 | |
| Health Care, Inc., REIT, 2.25%, 2018 | | | 51,000 | | | | 50,073 | |
| Kimco Realty Corp., REIT, 6.875%, 2019 | | | 36,000 | | | | 43,517 | |
Simon Property Group, Inc., REIT,
6.1%, 2016 | | | 230,000 | | | | 257,934 | |
| WEA Finance LLC, 6.75%, 2019 (n) | | | 110,000 | | | | 129,910 | |
| | | | | | | | |
| | | | | | $ | 1,151,425 | |
| | | | | | | | |
| Retailers – 2.0% | | | | | | | | |
| AutoZone, Inc., 6.5%, 2014 | | $ | 230,000 | | | $ | 236,922 | |
| Dollar General Corp., 4.125%, 2017 | | | 113,000 | | | | 119,190 | |
| Gap, Inc., 5.95%, 2021 | | | 189,000 | | | | 209,039 | |
| Kohl’s Corp., 3.25%, 2023 | | | 162,000 | | | | 149,863 | |
| Limited Brands, Inc., 5.25%, 2014 | | | 59,000 | | | | 61,213 | |
| Macy’s, Inc., 7.875%, 2015 | | | 200,000 | | | | 226,770 | |
| | | | | | | | |
| | | | | | $ | 1,002,997 | |
| | | | | | | | |
| Supranational – 0.4% | | | | | | | | |
Corporacion Andina de Fomento,
4.375%, 2022 | | $ | 210,000 | | | $ | 213,841 | |
| | | | | | | | |
| Telecommunications – Wireless – 1.1% | | | | | |
American Tower Corp., REIT,
4.625%, 2015 | | $ | 80,000 | | | $ | 84,540 | |
| American Tower Corp., REIT, 4.7%, 2022 | | | 126,000 | | | | 127,083 | |
Crown Castle Towers LLC,
6.113%, 2020 (n) | | | 157,000 | | | | 180,154 | |
| Rogers Cable, Inc., 5.5%, 2014 | | | 164,000 | | | | 169,336 | |
| | | | | | | | |
| | | | | | $ | 561,113 | |
| | | | | | | | |
| Tobacco – 1.6% | | | | | | | | |
| Altria Group, Inc., 9.25%, 2019 | | $ | 71,000 | | | $ | 94,032 | |
| Lorillard Tobacco Co., 8.125%, 2019 | | | 112,000 | | | | 137,243 | |
| Lorillard Tobacco Co., 6.875%, 2020 | | | 70,000 | | | | 80,436 | |
| Reynolds American, Inc., 6.75%, 2017 | | | 240,000 | | | | 278,108 | |
| Reynolds American, Inc., 4.75%, 2042 | | | 203,000 | | | | 181,292 | |
| | | | | | | | |
| | | | | | $ | 771,111 | |
| | | | | | | | |
| Transportation – Services – 0.4% | | | | | | | | |
| ERAC USA Finance Co., 6.375%, 2017 (n) | | $ | 180,000 | | | $ | 209,010 | |
| | | | | | | | |
| U.S. Government Agencies and Equivalents – 1.0% | |
| National Credit Union Administration Guaranteed Note, 2.9%, 2020 | | $ | 50,000 | | | $ | 52,188 | |
Small Business Administration,
4.34%, 2024 | | | 143,503 | | | | 154,846 | |
Small Business Administration,
4.77%, 2024 | | | 103,911 | | | | 111,389 | |
Small Business Administration,
4.625%, 2025 | | | 91,267 | | | | 99,290 | |
Small Business Administration,
5.11%, 2025 | | | 84,371 | | | | 92,814 | |
| | | | | | | | |
| | | | | | $ | 510,527 | |
| | | | | | | | |
7
MFS Strategic Income Portfolio
Portfolio of Investments (unaudited) – continued
| | | | | | | | |
| Issuer | | Shares/Par | | | Value ($) | |
| | | | | | | | |
| BONDS – continued | | | | | | | | |
| Utilities – Electric Power – 3.0% | | | | | | | | |
| CMS Energy Corp., 4.25%, 2015 | | $ | 140,000 | | | $ | 148,478 | |
| CMS Energy Corp., 5.05%, 2022 | | | 99,000 | | | | 106,960 | |
| Duke Energy Corp., 3.35%, 2015 | | | 220,000 | | | | 229,142 | |
Enel Finance International S.A.,
6.25%, 2017 (n) | | | 140,000 | | | | 153,591 | |
| Exelon Generation Co. LLC, 5.2%, 2019 | | | 70,000 | | | | 76,979 | |
| Exelon Generation Co. LLC, 4.25%, 2022 | | | 54,000 | | | | 54,006 | |
| Oncor Electric Delivery Co., 4.1%, 2022 | | | 150,000 | | | | 154,766 | |
| Pacific Gas & Electric Co., 3.25%, 2023 | | | 162,000 | | | | 158,643 | |
| PPL WEM Holdings PLC, 3.9%, 2016 (n) | | | 200,000 | | | | 209,019 | |
| Progress Energy, Inc., 3.15%, 2022 | | | 196,000 | | | | 187,743 | |
| | | | | | | | |
| | | | | | $ | 1,479,327 | |
| | | | | | | | |
Total Bonds
(Identified Cost, $31,545,133) | | | | | | $ | 32,332,681 | |
| | | | | | | | |
| | | | | | | | | | | | | | | | |
| | | Strike
Price | | | First
Exercise | | | | | | | |
| | | | | | | | | | | | | | | | |
| WARRANTS – 0.1% | | | | | | | | | | | | | |
| Broadcasting – 0.1% | | | | | | | | | | | | | |
| New Young Broadcasting Holding Co., Inc. (1 share for 1 warrant) (a) (Identified Cost, $13,572) | | $ | 0.01 | | | | 7/14/10 | | | | 6 | | | $ | 40,200 | |
| | | | | | | | | | | | | | | | |
| | | | | | | | |
| Issuer | | Shares/Par | | | Value ($) | |
| | | | | | | | |
| COMMON STOCKS – 0.0% | | | | | | | | |
| Printing & Publishing – 0.0% | | | | | | | | |
| American Media Operations, Inc. (a) (Identified Cost, $24,730) | | | 1,733 | | | $ | 9,098 | |
| | | | | | | | |
|
| UNDERLYING AFFILIATED FUNDS – 32.2% | |
MFS High Yield Pooled Portfolio (v)
(Identified Cost, $15,656,247) | | | 1,637,178 | | | $ | 15,880,626 | |
| | | | | | | | |
|
| MONEY MARKET FUNDS – 0.7% | |
| MFS Institutional Money Market Portfolio, 0.11%, at Cost and Net Asset Value (v) | | | 339,506 | | | $ | 339,506 | |
| | | | | | | | |
Total Investments
(Identified Cost, $47,579,188) | | | | | | $ | 48,602,111 | |
| | | | | | | | |
OTHER ASSETS, LESS
LIABILITIES – 1.3% | | | | | | | 644,030 | |
| | | | | | | | |
| Net Assets – 100.0% | | | | | | $ | 49,246,141 | |
| | | | | | | | |
| (a) | | Non-income producing security. |
| (i) | | Interest only security for which the fund receives interest on notional principal (Par amount). Par amount shown is the notional principal and does not reflect the cost of the security. |
| (n) | | Securities exempt from registration under Rule 144A of the Securities Act of 1933. These securities may be sold in the ordinary course of business in transactions exempt from registration, normally to qualified institutional buyers. At period end, the aggregate value of these securities was $8,099,918, representing 16.4% of net assets. |
| (p) | | Payment-in-kind security. |
| (v) | | Underlying affiliated fund that is available only to investment companies managed by MFS. The rate quoted for the MFS Institutional Money Market Portfolio is the annualized seven-day yield of the fund at period end. |
| (z) | | Restricted securities are not registered under the Securities Act of 1933 and are subject to legal restrictions on resale. These securities generally may be resold in transactions exempt from registration or to the public if the securities are subsequently registered. Disposal of these securities may involve time-consuming negotiations and prompt sale at an acceptable price may be difficult. The fund holds the following restricted securities: |
| | | | | | | | | | |
| Restricted Securities | | Acquisition
Date | | Cost | | | Value | |
| Bayview Financial Revolving Mortgage Loan Trust, FRN, 1.795%, 2040 | | 3/01/06 | | | $157,298 | | | | $75,958 | |
| Falcon Franchise Loan LLC, FRN, 7.269%, 2023 | | 1/18/02 | | | 3,427 | | | | 13,530 | |
| Falcon Franchise Loan LLC, FRN, 11.363%, 2025 | | 1/29/03 | | | 5,051 | | | | 9,417 | |
| Glencore Funding LLC, FRN, 1.431%, 2016 | | 5/22/13 | | | 120,000 | | | | 116,847 | |
| Morgan Stanley Capital I, Inc., FRN, 1.384%, 2039 | | 7/20/04 | | | 11,290 | | | | 15,214 | |
| Pearson Funding Five PLC, 3.25%, 2023 | | 5/01/13 | | | 199,749 | | | | 184,367 | |
| Total Restricted Securities | | | | | | | | | $415,333 | |
| % of Net assets | | | | | | | | | 0.8% | |
The following abbreviations are used in this report and are defined:
| CDO | | Collateralized Debt Obligation |
| FRN | | Floating Rate Note. Interest rate resets periodically and may not be the rate reported at period end. |
| PLC | | Public Limited Company |
| REIT | | Real Estate Investment Trust |
8
MFS Strategic Income Portfolio
Portfolio of Investments (unaudited) – continued
Abbreviations indicate amounts shown in currencies other than the U.S. dollar. All amounts are stated in U.S. dollars unless otherwise indicated. A list of abbreviations is shown below:
CAD Canadian Dollar
Derivative Contracts at 6/30/13
Forward Foreign Currency Exchange Contracts at 6/30/13
| | | | | | | | | | | | | | | | | | | | | | | | |
| Type | | | | Currency | | | Counterparty | | Contracts to
Deliver/Receive | | Settlement Date
Range | | In Exchange For | | | Contracts
at Value | | | Net Unrealized
Appreciation
(Depreciation) | |
| Asset Derivatives | | | | | | | | | | | | | | | | |
| SELL | | | | | AUD | | | Goldman Sachs International | | 11,921 | | 7/16/13 | | $ | 12,157 | | | $ | 10,892 | | | $ | 1,265 | |
| SELL | | | | | AUD | | | Westpac Banking Corp. | | 43,432 | | 7/16/13 | | | 45,187 | | | | 39,680 | | | | 5,507 | |
| SELL | | | | | CAD | | | Goldman Sachs International | | 24,464 | | 7/16/13 | | | 24,245 | | | | 23,253 | | | | 992 | |
| SELL | | | | | CAD | | | Merrill Lynch International Bank | | 168,695 | | 7/16/13 | | | 165,539 | | | | 160,349 | | | | 5,190 | |
| SELL | | | | | DKK | | | Deutsche Bank AG | | 242,054 | | 7/16/13 | | | 42,440 | | | | 42,248 | | | | 192 | |
| SELL | | | | | EUR | | | Citibank N.A. | | 166,421 | | 7/16/13 | | | 217,870 | | | | 216,633 | | | | 1,237 | |
| SELL | | | | | EUR | | | Deutsche Bank AG | | 311,647 | | 7/16/13 | | | 407,578 | | | | 405,678 | | | | 1,900 | |
| SELL | | | | | EUR | | | Goldman Sachs International | | 33,770 | | 7/16/13 | | | 44,212 | | | | 43,959 | | | | 253 | |
| SELL | | | | | EUR | | | JPMorgan Chase Bank N.A. | | 265,169 | | 7/16/13 | | | 346,624 | | | | 345,176 | | | | 1,448 | |
| SELL | | | | | GBP | | | Credit Suisse Group | | 175,962 | | 7/16/13 | | | 269,642 | | | | 267,603 | | | | 2,039 | |
| SELL | | | | | GBP | | | Deutsche Bank AG | | 175,962 | | 7/16/13 | | | 269,649 | | | | 267,603 | | | | 2,046 | |
| BUY | | | | | JPY | | | Credit Suisse Group | | 16,922,260 | | 7/16/13 | | | 170,000 | | | | 170,630 | | | | 630 | |
| BUY | | | | | JPY | | | Merrill Lynch International Bank | | 16,922,260 | | 7/16/13 | | | 169,958 | | | | 170,631 | | | | 673 | |
| SELL | | | | | SEK | | | Deutsche Bank AG | | 132,906 | | 7/16/13 | | | 20,730 | | | | 19,812 | | | | 918 | |
| | | | | | | | | | | | | | | | | | | | | | | | |
| | | | | | | | | | | | | | | | | | | | | | $ | 24,290 | |
| | | | | | | | | | | | | | | | | | | | | | | | |
| Liability Derivatives | | | | | | | | | | | | | | | | |
| BUY | | | | | EUR | | | Deutsche Bank AG | | 457,997 | | 7/16/13 | | $ | 600,709 | | | $ | 596,182 | | | $ | (4,527 | ) |
| BUY | | | | | GBP | | | Barclays Bank PLC | | 131,921 | | 7/16/13 | | | 205,208 | | | | 200,626 | | | | (4,582 | ) |
| BUY | | | | | JPY | | | Citibank N.A. | | 28,755,616 | | 7/16/13 | | | 290,984 | | | | 289,949 | | | | (1,035 | ) |
| BUY | | | | | JPY | | | Goldman Sachs International | | 4,744,370 | | 7/16/13 | | | 47,958 | | | | 47,838 | | | | (120 | ) |
| | | | | | | | | | | | | | | | | | | | | | | | |
| | | | | | | | | | | | | | | | | | | | | | $ | (10,264 | ) |
| | | | | | | | | | | | | | | | | | | | | | | | |
Futures Contracts Outstanding at 6/30/13
| | | | | | | | | | | | | | | | | | |
| Description | | Currency | | | Contracts | | | Value | | Expiration
Date | | | Unrealized
Appreciation
(Depreciation) | |
| Asset Derivatives | | | | | | | | | | | | | | | | | | |
| Interest Rate Futures | | | | | | | | | | | | | | | | | | |
| U.S. Treasury Note 10 yr (Short) | | | USD | | | | 30 | | | $3,796,875 | | | September - 2013 | | | | $85,442 | |
| | | | | | | | | | | | | | | | | | |
At June 30, 2013, the fund had cash collateral of $33,000 to cover any commitments for certain derivative contracts. Cash collateral includes “Restricted cash” in the Statement of Assets and Liabilities.
See Notes to Financial Statements
9
MFS Strategic Income Portfolio
FINANCIAL STATEMENTS | STATEMENT OF ASSETS AND LIABILITIES (unaudited)
This statement represents your fund’s balance sheet, which details the assets and liabilities comprising the total value of the fund.
| | | | | | | | |
At 6/30/13 | | | | | | | | |
Assets | | | | | | | | |
Investments – | | | | | | | | |
Non-affiliated issuers, at value (identified cost, $31,583,435) | | | $32,381,979 | | | | | |
Underlying affiliated funds, at value (identified cost, $15,995,753) | | | 16,220,132 | | | | | |
Total investments, at value (identified cost, $47,579,188) | | | $48,602,111 | | | | | |
Restricted cash | | | 33,000 | | | | | |
Receivables for | | | | | | | | |
Forward foreign currency exchange contracts | | | 24,290 | | | | | |
Daily variation margin on open futures contracts | | | 2,344 | | | | | |
Investments sold | | | 229,201 | | | | | |
Fund shares sold | | | 45,676 | | | | | |
Interest | | | 415,244 | | | | | |
Receivable from investment adviser | | | 2,646 | | | | | |
Other assets | | | 460 | | | | | |
Total assets | | | | | | | $49,354,972 | |
Liabilities | | | | | | | | |
Payable to custodian | | | $17,940 | | | | | |
Payables for | | | | | | | | |
Forward foreign currency exchange contracts | | | 10,264 | | | | | |
Investments purchased | | | 2,346 | | | | | |
Fund shares reacquired | | | 44,281 | | | | | |
Payable to affiliates | | | | | | | | |
Shareholder servicing costs | | | 24 | | | | | |
Distribution and/or service fees | | | 217 | | | | | |
Payable for independent Trustees’ compensation | | | 539 | | | | | |
Accrued expenses and other liabilities | | | 33,220 | | | | | |
Total liabilities | | | | | | | $108,831 | |
Net assets | | | | | | | $49,246,141 | |
Net assets consist of | | | | | | | | |
Paid-in capital | | | $48,471,004 | | | | | |
Unrealized appreciation (depreciation) on investments and translation of assets and liabilities in foreign currencies | | | 1,122,059 | | | | | |
Accumulated net realized gain (loss) on investments and foreign currency | | | (3,556,209 | ) | | | | |
Undistributed net investment income | | | 3,209,287 | | | | | |
Net assets | | | | | | | $49,246,141 | |
Shares of beneficial interest outstanding | | | | | | | 4,924,907 | |
| | | | | | | | | | | | |
| | | Net assets | | | Shares
outstanding | | | Net asset value
per share | |
Initial Class | | | $41,253,091 | | | | 4,120,411 | | | | $10.01 | |
Service Class | | | 7,993,050 | | | | 804,496 | | | | 9.94 | |
See Notes to Financial Statements
10
MFS Strategic Income Portfolio
FINANCIAL STATEMENTS | STATEMENT OF OPERATIONS (unaudited)
This statement describes how much your fund earned in investment income and accrued in expenses. It also describes any gains and/or losses generated by fund operations.
| | | | | | | | |
Six months ended 6/30/13 | | | | | |
Net investment income | | | | | |
Income | | | | | | | | |
Interest | | | $975,982 | | | | | |
Dividends | | | 1,836 | | | | | |
Dividends from underlying affiliated funds | | | 304,584 | | | | | |
Total investment income | | | | | | | $1,282,402 | |
Expenses | | | | | | | | |
Management fee | | | $178,839 | | | | | |
Distribution and/or service fees | | | 10,478 | | | | | |
Shareholder servicing costs | | | 575 | | | | | |
Administrative services fee | | | 8,774 | | | | | |
Independent Trustees’ compensation | | | 1,455 | | | | | |
Custodian fee | | | 10,942 | | | | | |
Shareholder communications | | | 3,604 | | | | | |
Audit and tax fees | | | 35,596 | | | | | |
Legal fees | | | 8,941 | | | | | |
Miscellaneous | | | 10,525 | | | | | |
Total expenses | | | | | | | $269,729 | |
Fees paid indirectly | | | (23 | ) | | | | |
Reduction of expenses by investment adviser | | | (29,127 | ) | | | | |
Net expenses | | | | | | | $240,579 | |
Net investment income | | | | | | | $1,041,823 | |
Realized and unrealized gain (loss) on investments and foreign currency | | | | | | | | |
Realized gain (loss) (identified cost basis) | | | | | | | | |
Investments: | | | | | | | | |
Non-affiliated issuers | | | $338,800 | | | | | |
Underlying affiliated funds | | | 86,014 | | | | | |
Futures contracts | | | 28,372 | | | | | |
Foreign currency | | | (75,836 | ) | | | | |
Net realized gain (loss) on investments and foreign currency | | | | | | | $377,350 | |
Change in unrealized appreciation (depreciation) | | | | | | | | |
Investments | | | $(2,453,888 | ) | | | | |
Futures contracts | | | 75,090 | | | | | |
Translation of assets and liabilities in foreign currencies | | | 78,927 | | | | | |
Net unrealized gain (loss) on investments and foreign currency translation | | | | | | | $(2,299,871 | ) |
Net realized and unrealized gain (loss) on investments and foreign currency | | | | | | | $(1,922,521 | ) |
Change in net assets from operations | | | | | | | $(880,698 | ) |
See Notes to Financial Statements
11
MFS Strategic Income Portfolio
FINANCIAL STATEMENTS | STATEMENTS OF CHANGES IN NET ASSETS
These statements describe the increases and/or decreases in net assets resulting from operations, any distributions, and any shareholder transactions.
| | | | | | | | |
| |
| Six months ended
6/30/13
(unaudited |
) | |
| Year ended
12/31/12 |
|
Change in net assets | | | | | | | | |
| From operations | | | | | | | | |
Net investment income | | | $1,041,823 | | | | $2,187,433 | |
Net realized gain (loss) on investments and foreign currency | | | 377,350 | | | | 768,318 | |
Net unrealized gain (loss) on investments and foreign currency translation | | | (2,299,871 | ) | | | 2,064,536 | |
Change in net assets from operations | | | $(880,698 | ) | | | $5,020,287 | |
| Distributions declared to shareholders | | | | | | | | |
From net investment income | | | $— | | | | $(2,700,006 | ) |
Change in net assets from fund share transactions | | | $(2,304,594 | ) | | | $1,180,839 | |
Total change in net assets | | | $(3,185,292 | ) | | | $3,501,120 | |
| Net assets | | | | | | | | |
At beginning of period | | | 52,431,433 | | | | 48,930,313 | |
At end of period (including undistributed net investment income of $3,209,287 and
$2,167,464, respectively) | | | $49,246,141 | | | | $52,431,433 | |
See Notes to Financial Statements
12
MFS Strategic Income Portfolio
FINANCIAL STATEMENTS | FINANCIAL HIGHLIGHTS
The financial highlights table is intended to help you understand the fund’s financial performance for the semiannual period and the past 5 fiscal years. Certain information reflects financial results for a single fund share. The total returns in the table represent the rate by which an investor would have earned (or lost) on an investment in the fund share class (assuming reinvestment of all distributions) held for the entire period.
| | | | | | | | | | | | | | | | | | | | | | | | |
| Initial Class | | Six months
ended
6/30/13 | | | Years ended 12/31 | |
| | | | 2012 | | | 2011 | | | 2010 | | | 2009 | | | 2008 | |
| | | (unaudited) | | | | | | | | | | | | | | | | |
Net asset value, beginning of period | | | $10.19 | | | | $9.74 | | | | $9.87 | | | | $9.46 | | | | $8.36 | | | | $10.40 | |
| Income (loss) from investment operations | | | | | | | | | | | | | | | | | | | | | | | | |
Net investment income (d) | | | $0.21 | | | | $0.44 | | | | $0.48 | | | | $0.49 | | | | $0.55 | | | | $0.58 | |
Net realized and unrealized gain (loss) on investments
and foreign currency | | | (0.39 | ) | | | 0.56 | | | | (0.02 | ) | | | 0.45 | | | | 1.54 | | | | (1.82 | ) |
Total from investment operations | | | $(0.18 | ) | | | $1.00 | | | | $0.46 | | | | $0.94 | | | | $2.09 | | | | $(1.24 | ) |
| Less distributions declared to shareholders | | | | | | | | | | | | | | | | | | | | | | | | |
From net investment income | | | $— | | | | $(0.55 | ) | | | $(0.59 | ) | | | $(0.53 | ) | | | $(0.99 | ) | | | $(0.80 | ) |
Net asset value, end of period (x) | | | $10.01 | | | | $10.19 | | | | $9.74 | | | | $9.87 | | | | $9.46 | | | | $8.36 | |
Total return (%) (k)(r)(s)(x) | | | (1.77 | )(n) | | | 10.42 | | | | 4.67 | | | | 10.27 | | | | 27.52 | | | | (12.94 | ) |
Ratios (%) (to average net assets)
and Supplemental data: | | | | | | | | | | | | | | | | | | | | | | | | |
Expenses before expense reductions (f)(h) | | | 1.01 | (a) | | | 1.02 | | | | 1.05 | | | | 1.06 | | | | 1.03 | | | | 1.02 | |
Expenses after expense reductions (f)(h) | | | 0.90 | (a) | | | 0.90 | | | | 0.90 | | | | 0.90 | | | | 0.90 | | | | 0.90 | |
Net investment income | | | 4.12 | (a) | | | 4.35 | | | | 4.79 | | | | 5.11 | | | | 6.23 | | | | 6.07 | |
| Portfolio turnover | | | 15 | (n) | | | 40 | | | | 29 | | | | 48 | | | | 63 | | | | 38 | |
Net assets at end of period (000 omitted) | | | $41,253 | | | | $43,564 | | | | $38,563 | | | | $40,927 | | | | $40,221 | | | | $31,159 | |
| | |
| Service Class | | Six months
ended
6/30/13 | | | Years ended 12/31 | |
| | | | 2012 | | | 2011 | | | 2010 | | | 2009 | | | 2008 | |
| | | (unaudited) | | | | | | | | | | | | | | | | |
Net asset value, beginning of period | | | $10.12 | | | | $9.67 | | | | $9.81 | | | | $9.40 | | | | $8.30 | | | | $10.33 | |
| Income (loss) from investment operations | | | | | | | | | | | | | | | | | | | | | | | | |
Net investment income (d) | | | $0.20 | | | | $0.41 | | | | $0.45 | | | | $0.47 | | | | $0.52 | | | | $0.55 | |
Net realized and unrealized gain (loss) on investments
and foreign currency | | | (0.38 | ) | | | 0.56 | | | | (0.03 | ) | | | 0.45 | | | | 1.54 | | | | (1.80 | ) |
Total from investment operations | | | $(0.18 | ) | | | $0.97 | | | | $0.42 | | | | $0.92 | | | | $2.06 | | | | $(1.25 | ) |
| Less distributions declared to shareholders | | | | | | | | | | | | | | | | | | | | | | | | |
From net investment income | | | $— | | | | $(0.52 | ) | | | $(0.56 | ) | | | $(0.51 | ) | | | $(0.96 | ) | | | $(0.78 | ) |
Net asset value, end of period (x) | | | $9.94 | | | | $10.12 | | | | $9.67 | | | | $9.81 | | | | $9.40 | | | | $8.30 | |
Total return (%) (k)(r)(s)(x) | | | (1.78 | )(n) | | | 10.18 | | | | 4.31 | | | | 10.05 | | | | 27.24 | | | | (13.21 | ) |
Ratios (%) (to average net assets)
and Supplemental data: | | | | | | | | | | | | | | | | | | | | | | | | |
Expenses before expense reductions (f)(h) | | | 1.26 | (a) | | | 1.27 | | | | 1.30 | | | | 1.31 | | | | 1.28 | | | | 1.26 | |
Expenses after expense reductions (f)(h) | | | 1.15 | (a) | | | 1.15 | | | | 1.15 | | | | 1.15 | | | | 1.15 | | | | 1.15 | |
Net investment income | | | 3.87 | (a) | | | 4.11 | | | | 4.54 | | | | 4.87 | | | | 6.02 | | | | 5.82 | |
| Portfolio turnover | | | 15 | (n) | | | 40 | | | | 29 | | | | 48 | | | | 63 | | | | 38 | |
Net assets at end of period (000 omitted) | | | $7,993 | | | | $8,867 | | | | $10,368 | | | | $10,942 | | | | $11,644 | | | | $11,192 | |
See Notes to Financial Statements
13
MFS Strategic Income Portfolio
Financial Highlights – continued
| (d) | Per share data is based on average shares outstanding. |
| (f) | Ratios do not reflect reductions from fees paid indirectly, if applicable. |
| (h) | For the six months ended June 30, 2013, in addition to the fees and expenses which the fund bears directly, the fund indirectly bears a pro rata share of the fees and expenses of the underlying affiliated funds in which the fund invests. Accordingly, the expense ratio for the fund reflects only those fees and expenses borne directly by the fund. Because the underlying affiliated funds have varied expense and fee levels and the fund may own different proportions of the underlying affiliated funds at different times, the amount of fees and expenses incurred indirectly by the fund will vary. |
| (k) | The total return does not reflect expenses that apply to separate accounts. Inclusion of these charges would reduce the total return figures for all periods shown. |
| (r) | Certain expenses have been reduced without which performance would have been lower. |
| (s) | From time to time the fund may receive proceeds from litigation settlements, without which performance would be lower. |
| (x) | The net asset values per share and total returns have been calculated on net assets which include adjustments made in accordance with U.S. generally accepted accounting principles required at period end for financial reporting purposes. |
See Notes to Financial Statements
14
MFS Strategic Income Portfolio
NOTES TO FINANCIAL STATEMENTS (unaudited)
| (1) | | Business and Organization |
MFS Strategic Income Portfolio (the fund) is a series of MFS Variable Insurance Trust II (the trust). The trust is organized as a Massachusetts business trust and is registered under the Investment Company Act of 1940, as amended, as an open-end management investment company. The shareholders of each series of the trust are separate accounts of insurance companies, which offer variable annuity and/or life insurance products, and qualified retirement and pension plans.
| (2) | | Significant Accounting Policies |
General – The preparation of financial statements in conformity with U.S. generally accepted accounting principles requires management to make estimates and assumptions that affect the reported amounts of assets and liabilities, and disclosure of contingent assets and liabilities at the date of the financial statements and the reported amounts of revenues and expenses during the reporting period. Actual results could differ from those estimates. In the preparation of these financial statements, management has evaluated subsequent events occurring after the date of the fund’s Statement of Assets and Liabilities through the date that the financial statements were issued. The accounting policies of the underlying funds in which the fund invests are outlined in the underlying funds’ shareholder reports, which are available without charge by calling 1-800-225-2606, at mfs.com and on the Securities and Exchange Commission (SEC) web site at http://www.sec.gov or at the SEC’s public reference room in Washington, D.C. The underlying funds’ shareholder reports are not covered by this report. The fund invests in high-yield securities rated below investment grade. Investments in high-yield securities involve greater degrees of credit and market risk than investments in higher-rated securities and tend to be more sensitive to economic conditions. The fund invests in foreign securities. Investments in foreign securities are vulnerable to the effects of changes in the relative values of the local currency and the U.S. dollar and to the effects of changes in each country’s legal, political, and economic environment.
In this reporting period, the fund adopted the disclosure provisions of the Financial Accounting Standards Board (FASB) Accounting Standards Update 2011-11 (“ASU 2011-11”), Balance Sheet (Topic 210) – Disclosures about Offsetting Assets and Liabilities along with the related scope clarification provisions of FASB Accounting Standards Update 2013-01 (“ASU 2013-01”) entitled Balance Sheet (Topic 210) – Clarifying the Scope of Disclosures about Offsetting Assets and Liabilities. ASU 2011-11 is intended to enhance disclosures on the offsetting of financial assets and liabilities by requiring entities to disclose both gross and net information about financial instruments and transactions that are either offset in the statement of financial position or subject to a Master Netting Agreement or similar arrangement. ASU 2013-01 limits the scope of ASU 2011-11’s disclosure requirements on offsetting to financial assets and financial liabilities related to derivatives, repurchase and reverse repurchase agreements, and securities lending and securities borrowing transactions. The disclosures required by ASU 2011-11, to the extent applicable to the fund, have been included in the fund’s Significant Accounting Policies note under the captions for each of the fund’s in-scope financial instruments and transactions.
In June 2013, FASB issued Accounting Standards Update 2013-08 Financial Services – Investment Companies (Topic 946) – Amendments to the Scope, Measurement, and Disclosure Requirements (“ASU 2013-08”) which is effective for interim and annual reporting periods in fiscal years that begin after December 15, 2013. ASU 2013-08 sets forth a methodology for determining whether an entity should be characterized as an investment company and prescribes fair value accounting for an investment company’s non-controlling ownership interest in another investment company. FASB has determined that a fund registered under the Investment Company Act of 1940 automatically meets ASU 2013-08’s criteria for an investment company. Although still evaluating the potential impacts of ASU 2013-08 to the fund, management expects that the impact of the fund’s adoption will be limited to additional financial statement disclosures.
Investment Valuations – Debt instruments and floating rate loans (other than short-term instruments), including restricted debt instruments, are generally valued at an evaluated or composite bid as provided by a third-party pricing service. Equity securities, including restricted equity securities, are generally valued at the last sale or official closing price as provided by a third-party pricing service on the market or exchange on which they are primarily traded. Equity securities, for which there were no sales reported that day, are generally valued at the last quoted daily bid quotation as provided by a third-party pricing service on the market or exchange on which such securities are primarily traded. Short-term instruments with a maturity at issuance of 60 days or less generally are valued at amortized cost, which approximates market value. Exchange-traded options are generally valued at the last sale or official closing price as provided by a third-party pricing service on the exchange on which such options are primarily traded. Exchange-traded options for which there were no sales reported that day are generally valued at the last daily bid quotation as provided by a third-party pricing service on the exchange on which such options are primarily traded. Options not traded on an exchange are generally valued at a broker/dealer bid quotation. Foreign currency options are generally valued at valuations provided by a third-party pricing service. Futures contracts are generally valued at last posted settlement price as provided by a third-party pricing service on the market on which they are primarily traded. Futures contracts for which there were no trades that day for a particular position are generally valued at the closing bid quotation as provided by a third-party pricing service on the market on which such futures contracts are primarily traded. Forward foreign currency exchange contracts are generally valued at the mean of bid and asked prices for the time period interpolated from rates provided by a third-party pricing service for proximate time periods. Swap agreements are generally valued at valuations provided by a third-party pricing service, which for cleared swaps includes an
15
MFS Strategic Income Portfolio
Notes to Financial Statements (unaudited) – continued
evaluation of any trading activity at the clearinghouses. Open-end investment companies are generally valued at net asset value per share. Securities and other assets generally valued on the basis of information from a third-party pricing service may also be valued at a broker/dealer bid quotation. Values obtained from third-party pricing services can utilize both transaction data and market information such as yield, quality, coupon rate, maturity, type of issue, trading characteristics, and other market data. The values of foreign securities and other assets and liabilities expressed in foreign currencies are converted to U.S. dollars using the mean of bid and asked prices for rates provided by a third-party pricing service.
The Board of Trustees has delegated primary responsibility for determining or causing to be determined the value of the fund’s investments (including any fair valuation) to the adviser pursuant to valuation policies and procedures approved by the Board. If the adviser determines that reliable market quotations are not readily available, investments are valued at fair value as determined in good faith by the adviser in accordance with such procedures under the oversight of the Board of Trustees. Under the fund’s valuation policies and procedures, market quotations are not considered to be readily available for most types of debt instruments and floating rate loans and many types of derivatives. These investments are generally valued at fair value based on information from third-party pricing services. In addition, investments may be valued at fair value if the adviser determines that an investment’s value has been materially affected by events occurring after the close of the exchange or market on which the investment is principally traded (such as foreign exchange or market) and prior to the determination of the fund’s net asset value, or after the halting of trading of a specific security where trading does not resume prior to the close of the exchange or market on which the security is principally traded. The adviser generally relies on third-party pricing services or other information (such as the correlation with price movements of similar securities in the same or other markets; the type, cost and investment characteristics of the security; the business and financial condition of the issuer; and trading and other market data) to assist in determining whether to fair value and at what value to fair value an investment. The value of an investment for purposes of calculating the fund’s net asset value can differ depending on the source and method used to determine value. When fair valuation is used, the value of an investment used to determine the fund’s net asset value may differ from quoted or published prices for the same investment. There can be no assurance that the fund could obtain the fair value assigned to an investment if it were to sell the investment at the same time at which the fund determines its net asset value per share.
Various inputs are used in determining the value of the fund’s assets or liabilities. These inputs are categorized into three broad levels. In certain cases, the inputs used to measure fair value may fall into different levels of the fair value hierarchy. In such cases, an investment’s level within the fair value hierarchy is based on the lowest level of input that is significant to the fair value measurement. The fund’s assessment of the significance of a particular input to the fair value measurement in its entirety requires judgment, and considers factors specific to the investment. Level 1 includes unadjusted quoted prices in active markets for identical assets or liabilities. Level 2 includes other significant observable market-based inputs (including quoted prices for similar securities, interest rates, prepayment speed, and credit risk). Level 3 includes unobservable inputs, which may include the adviser’s own assumptions in determining the fair value of investments. Other financial instruments are derivative instruments not reflected in total investments, such as futures contracts and forward foreign currency exchange contracts. The following is a summary of the levels used as of June 30, 2013 in valuing the fund’s assets or liabilities:
| | | | | | | | | | | | | | | | |
| Investments at Value | | Level 1 | | | Level 2 | | | Level 3 | | | Total | |
| Equity Securities | | | $— | | | | $40,200 | | | | $9,098 | | | | $49,298 | |
| U.S. Treasury Bonds & U.S. Government Agency & Equivalents | | | — | | | | 510,527 | | | | — | | | | 510,527 | |
| Non-U.S. Sovereign Debt | | | — | | | | 5,644,812 | | | | — | | | | 5,644,812 | |
| Municipal Bonds | | | — | | | | 149,941 | | | | — | | | | 149,941 | |
| U.S. Corporate Bonds | | | — | | | | 17,983,735 | | | | — | | | | 17,983,735 | |
| Residential Mortgage-Backed Securities | | | — | | | | 232,721 | | | | — | | | | 232,721 | |
| Commercial Mortgage-Backed Securities | | | — | | | | 57,260 | | | | — | | | | 57,260 | |
| Asset-Backed Securities (including CDOs) | | | — | | | | 274,056 | | | | — | | | | 274,056 | |
| Foreign Bonds | | | — | | | | 7,479,629 | | | | — | | | | 7,479,629 | |
| Mutual Funds | | | 16,220,132 | | | | — | | | | — | | | | 16,220,132 | |
| Total Investments | | | $16,220,132 | | | | $32,372,881 | | | | $9,098 | | | | $48,602,111 | |
| | | | |
| Other Financial Instruments | | | | | | | | | | | | |
| Futures Contracts | | | $85,442 | | | | $— | | | | $— | | | | $85,442 | |
| Forward Foreign Currency Exchange Contracts | | | — | | | | 14,026 | | | | — | | | | 14,026 | |
For further information regarding security characteristics, see the Portfolio of Investments.
16
MFS Strategic Income Portfolio
Notes to Financial Statements (unaudited) – continued
The following is a reconciliation of level 3 assets for which significant unobservable inputs were used to determine fair value. The fund’s policy is to recognize transfers between the levels as of the end of the period. The table presents the activity of level 3 securities held at the beginning and the end of the period.
| | | | |
| | | Equity Securities | |
| Balance as of 12/31/12 | | | $8,232 | |
Change in unrealized appreciation (depreciation) | | | 866 | |
| Balance as of 6/30/13 | | | $9,098 | |
The net change in unrealized appreciation (depreciation) from investments still held as level 3 at June 30, 2013 is $866.
Foreign Currency Translation – Purchases and sales of foreign investments, income, and expenses are converted into U.S. dollars based upon currency exchange rates prevailing on the respective dates of such transactions or on the reporting date for foreign denominated receivables and payables. Gains and losses attributable to foreign currency exchange rates on sales of securities are recorded for financial statement purposes as net realized gains and losses on investments. Gains and losses attributable to foreign exchange rate movements on receivables, payables, income and expenses are recorded for financial statement purposes as foreign currency transaction gains and losses. That portion of both realized and unrealized gains and losses on investments that results from fluctuations in foreign currency exchange rates is not separately disclosed.
Derivatives – The fund uses derivatives for different purposes, primarily to increase or decrease exposure to a particular market or segment of the market, or security, to increase or decrease interest rate or currency exposure, or as alternatives to direct investments. Derivatives are used for hedging or non-hedging purposes. While hedging can reduce or eliminate losses, it can also reduce or eliminate gains. When the fund uses derivatives as an investment to increase market exposure, or for hedging purposes, gains and losses from derivative instruments may be substantially greater than the derivative’s original cost.
The derivative instruments used by the fund were futures contracts and forward foreign currency exchange contracts. The fund’s period end derivatives, as presented in the Portfolio of Investments and the associated Derivative Contract tables, generally are indicative of the volume of its derivative activity during the period.
The following table presents, by major type of derivative contract, the fair value, on a gross basis, of the asset and liability components of derivatives held by the fund at June 30, 2013 as reported in the Statement of Assets and Liabilities:
| | | | | | | | | | |
| | | | | Fair Value (a) | |
| Risk | | Derivative Contracts | | Asset Derivatives | | | Liability Derivatives | |
| Interest Rate | | Interest Rate Futures | | | $85,442 | | | | $— | |
| Foreign Exchange | | Forward Foreign Currency Exchange | | | 24,290 | | | | (10,264 | ) |
| Total | | | | | $109,732 | | | | $(10,264 | ) |
| (a) | The value of futures contracts outstanding includes cumulative appreciation (depreciation) as reported in the fund’s Portfolio of Investments. Only the current day variation margin for futures contracts is separately reported within the fund’s Statement of Assets and Liabilities. |
The following table presents, by major type of derivative contract, the realized gain (loss) on derivatives held by the fund for the six months ended June 30, 2013 as reported in the Statement of Operations:
| | | | | | | | |
| Risk | | Futures Contracts | | | Foreign Currency | |
| Interest Rate | | | $28,372 | | | | $— | |
| Foreign Exchange | | | — | | | | (75,708 | ) |
| Total | | | $28,372 | | | | $(75,708 | ) |
The following table presents, by major type of derivative contract, the change in unrealized appreciation (depreciation) on derivatives held by the fund for the six months ended June 30, 2013 as reported in the Statement of Operations:
| | | | | | | | |
| Risk | | Futures Contracts | | | Translation of Assets and Liabilities in Foreign Currencies | |
| Interest Rate | | | $75,090 | | | | $— | |
| Foreign Exchange | | | — | | | | 80,917 | |
| Total | | | $75,090 | | | | $80,917 | |
Derivative counterparty credit risk is managed through formal evaluation of the creditworthiness of all potential counterparties. On certain, but not all, over-the-counter derivatives, the fund attempts to reduce its exposure to counterparty credit risk whenever possible by entering into an International Swaps and Derivatives Association (ISDA) Master Agreement on a bilateral basis with each of the counterparties with whom it undertakes a significant volume of transactions. The ISDA Master Agreement gives each party to
17
MFS Strategic Income Portfolio
Notes to Financial Statements (unaudited) – continued
the agreement the right to terminate all transactions traded under such agreement if there is a certain deterioration in the credit quality of the other party. Upon an event of default or a termination of the ISDA Master Agreement, the non-defaulting party has the right to close out all transactions traded under such agreement and to net amounts owed under each transaction to one net amount payable by one party to the other. This right to close out and net payments across all transactions traded under the ISDA Master Agreement could result in a reduction of the fund’s credit risk to such counterparty equal to any amounts payable by the fund under the applicable transactions, if any.
Collateral and margin requirements differ by type of derivative. Margin requirements are set by the broker or clearing house for cleared derivatives (i.e., futures contracts, cleared swaps, and exchange-traded options) while collateral terms are contract specific for over-the-counter traded derivatives (i.e., forward foreign currency exchange contracts, uncleared swap agreements, and over-the-counter options). For derivatives traded under an ISDA Master Agreement, the collateral requirements are netted across all transactions traded under such agreement and one amount is posted from one party to the other to collateralize such obligations. Cash that has been segregated to cover the fund’s collateral or margin obligations under derivative contracts, if any, will be reported separately in the Statement of Assets and Liabilities as “Restricted cash”. Securities pledged as collateral or margin for the same purpose, if any, is noted in the Portfolio of Investments.
The fund’s accounting policy with respect to balance sheet offsetting is that, absent an event of default by the counterparty or a termination of the agreement, the ISDA Master Agreement does not result in an offset of reported amounts of financial assets and financial liabilities in the Statement of Assets and Liabilities across transactions between the fund and the applicable counterparty.
Futures Contracts – The fund entered into futures contracts which may be used to hedge against or obtain broad market exposure, interest rate exposure, currency exposure, or to manage duration. A futures contract represents a commitment for the future purchase or sale of an asset at a specified price on a specified date.
Upon entering into a futures contract, the fund is required to deposit with the broker, either in cash or securities, an initial margin in an amount equal to a certain percentage of the notional amount of the contract. Subsequent payments (variation margin) are made or received by the fund each day, depending on the daily fluctuations in the value of the contract, and are recorded for financial statement purposes as unrealized gain or loss by the fund until the contract is closed or expires at which point the gain or loss on futures contracts is realized.
The fund bears the risk of interest rates, exchange rates or securities prices moving unexpectedly, in which case, the fund may not achieve the anticipated benefits of the futures contracts and may realize a loss. While futures contracts may present less counterparty risk to the fund since the contracts are exchange traded and the exchange’s clearinghouse guarantees payments to the broker, there is still counterparty credit risk due to the insolvency of the broker. The fund’s maximum risk of loss due to counterparty credit risk is equal to the margin posted by the fund to the broker plus any gains or minus any losses on the outstanding futures contracts.
Forward Foreign Currency Exchange Contracts – The fund entered into forward foreign currency exchange contracts for the purchase or sale of a specific foreign currency at a fixed price on a future date. These contracts may be used to hedge the fund’s currency risk or for non-hedging purposes. For hedging purposes, the fund may enter into contracts to deliver or receive foreign currency that the fund will receive from or use in its normal investment activities. The fund may also use contracts to hedge against declines in the value of foreign currency denominated securities due to unfavorable exchange rate movements. For non-hedging purposes, the fund may enter into contracts with the intent of changing the relative exposure of the fund’s portfolio of securities to different currencies to take advantage of anticipated exchange rate changes.
Forward foreign currency exchange contracts are adjusted by the daily exchange rate of the underlying currency and any unrealized gains or losses are recorded as a receivable or payable for forward foreign currency exchange contracts until the contract settlement date. On contract settlement date, any gain or loss on the contract is recorded as realized gains or losses on foreign currency.
Risks may arise upon entering into these contracts from unanticipated movements in the value of the contract and from the potential inability of counterparties to meet the terms of their contracts. Generally, the fund’s maximum risk due to counterparty credit risk is the unrealized gain on the contract due to the use of Continuous Linked Settlement, an industry accepted settlement system. This risk is mitigated in cases where there is an ISDA Master Agreement between the fund and the counterparty providing for netting as described above and for posting of collateral by the counterparty to the fund to cover the fund’s exposure to the counterparty under such ISDA Master Agreement.
Indemnifications – Under the fund’s organizational documents, its officers and Trustees may be indemnified against certain liabilities and expenses arising out of the performance of their duties to the fund. Additionally, in the normal course of business, the fund enters into agreements with service providers that may contain indemnification clauses. The fund’s maximum exposure under these agreements is unknown as this would involve future claims that may be made against the fund that have not yet occurred.
Investment Transactions and Income – Investment transactions are recorded on the trade date. Interest income is recorded on the accrual basis. All premium and discount is amortized or accreted for financial statement purposes in accordance with U.S. generally accepted accounting principles. Dividends received in cash are recorded on the ex-dividend date. Certain dividends from foreign
18
MFS Strategic Income Portfolio
Notes to Financial Statements (unaudited) – continued
securities will be recorded when the fund is informed of the dividend if such information is obtained subsequent to the ex-dividend date. Dividend and interest payments received in additional securities are recorded on the ex-dividend or ex-interest date in an amount equal to the value of the security on such date. Debt obligations may be placed on non-accrual status or set to accrue at a rate of interest less than the contractual coupon when the collection of all or a portion of interest has become doubtful. Interest income for those debt obligations may be further reduced by the write-off of the related interest receivables when deemed uncollectible.
The fund may receive proceeds from litigation settlements. Any proceeds received from litigation involving portfolio holdings are reflected in the Statement of Operations in realized gain/loss if the security has been disposed of by the fund or in unrealized gain/loss if the security is still held by the fund. Any other proceeds from litigation not related to portfolio holdings are reflected as other income in the Statement of Operations.
Fees Paid Indirectly – The fund’s custody fee may be reduced according to an arrangement that measures the value of cash deposited with the custodian by the fund. This amount, for the six months ended June 30, 2013, is shown as a reduction of total expenses in the Statement of Operations.
Tax Matters and Distributions – The fund intends to qualify as a regulated investment company, as defined under Subchapter M of the Internal Revenue Code, and to distribute all of its taxable income, including realized capital gains. As a result, no provision for federal income tax is required. The fund’s federal tax returns, when filed, will remain subject to examination by the Internal Revenue Service for a three year period.
Distributions to shareholders are recorded on the ex-dividend date. Income and capital gain distributions are determined in accordance with income tax regulations, which may differ from U.S. generally accepted accounting principles. Certain capital accounts in the financial statements are periodically adjusted for permanent differences in order to reflect their tax character. These adjustments have no impact on net assets or net asset value per share. Temporary differences which arise from recognizing certain items of income, expense, gain or loss in different periods for financial statement and tax purposes will reverse at some time in the future. Distributions in excess of net investment income or net realized gains are temporary overdistributions for financial statement purposes resulting from differences in the recognition or classification of income or distributions for financial statement and tax purposes.
Book/tax differences primarily relate to amortization and accretion of debt securities, straddle loss deferrals, and derivative transactions.
The tax character of distributions declared to shareholders for the last fiscal year is as follows:
| | | | |
| | | 12/31/12 | |
| Ordinary income (including any short-term capital gains) | | | $2,700,006 | |
The federal tax cost and the tax basis components of distributable earnings were as follows:
| | | | |
| As of 6/30/13 | | | | |
| Cost of investments | | | $47,859,154 | |
| Gross appreciation | | | 1,858,274 | |
| Gross depreciation | | | (1,115,317 | ) |
| Net unrealized appreciation (depreciation) | | | $742,957 | |
| |
| As of 12/31/12 | | | | |
| Undistributed ordinary income | | | 2,369,780 | |
| Capital loss carryforwards | | | (3,537,974 | ) |
| Other temporary differences | | | (290,067 | ) |
| Net unrealized appreciation (depreciation) | | | 3,114,096 | |
The aggregate cost above includes prior fiscal year end tax adjustments, if applicable.
Under the Regulated Investment Company Modernization Act of 2010 (the “Act”), net capital losses recognized for fund fiscal years beginning after December 31, 2010 may be carried forward indefinitely, and their character is retained as short-term and/or long-term losses (“post-enactment losses”). Previously, net capital losses were carried forward for eight years and treated as short-term losses (“pre-enactment losses”). As a transition rule, the Act requires that all post-enactment net capital losses be used before pre-enactment net capital losses.
As of December 31, 2012, the fund had capital loss carryforwards available to offset future realized gains. Such pre-enactment losses expire as follows:
| | | | |
| 12/31/16 | | | $(1,895,956 | ) |
| 12/31/17 | | | (1,642,018 | ) |
| Total | | | $(3,537,974 | ) |
19
MFS Strategic Income Portfolio
Notes to Financial Statements (unaudited) – continued
Multiple Classes of Shares of Beneficial Interest – The fund offers multiple classes of shares, which differ in their respective distribution and/or service fees. The fund’s income, realized and unrealized gain (loss), and common expenses are allocated to shareholders based on the daily net assets of each class. Dividends are declared separately for each class. Differences in per share dividend rates are generally due to differences in separate class expenses. The fund’s distributions declared to shareholders as reported in the Statements of Changes in Net Assets are presented by class as follows:
| | | | | | | | |
| | | From net investment
income | |
| | | Six months ended
6/30/13 | | | Year ended
12/31/12 | |
| Initial Class | | | $— | | | | $2,206,430 | |
| Service Class | | | — | | | | 493,576 | |
| Total | | | $— | | | | $2,700,006 | |
| (3) | | Transactions with Affiliates |
Investment Adviser – The fund has an investment advisory agreement with MFS to provide overall investment management and related administrative services and facilities to the fund. The management fee is computed daily and paid monthly at the following annual rates:
| | | | |
| First $1 billion of average daily net assets | | | 0.70% | |
| Average daily net assets in excess of $1 billion | | | 0.65% | |
Effective April 1, 2013, MFS has agreed in writing to reduce its management fee by a specified amount if certain MFS mutual fund assets exceed thresholds agreed to by MFS and the fund’s Board of Trustees. For the period April 1, 2013 through June 30, 2013, this management fee reduction amounted to $69, which is shown as a reduction of total expenses in the Statement of Operations. The management fee incurred for the six months ended June 30, 2013 was equivalent to an annual effective rate of 0.70% of the fund’s average daily net assets.
The investment adviser has agreed in writing to pay a portion of the fund’s total annual operating expenses, exclusive of interest, taxes, extraordinary expenses, brokerage and transaction costs, and investment-related expenses (including fees and expenses associated with investments in investment companies and other similar investment vehicles), such that total annual operating expenses do not exceed 0.90% of average daily net assets for the Initial Class shares and 1.15% of average daily net assets for the Service Class shares. This written agreement will continue until modified by the fund’s Board of Trustees, but such agreement will continue at least until April 30, 2014. For the six months ended June 30, 2013, this reduction amounted to $28,960 and is reflected as a reduction of total expenses in the Statement of Operations.
Distributor – MFS Fund Distributors, Inc. (MFD), a wholly-owned subsidiary of MFS, is the distributor of shares of the fund. The Trustees have adopted a distribution plan for the Service Class shares pursuant to Rule 12b-1 under the Investment Company Act of 1940.
The fund’s distribution plan provides that the fund will pay MFD distribution and/or service fees equal to 0.25% per annum of its average daily net assets attributable to Service Class shares as partial consideration for services performed and expenses incurred by MFD and financial intermediaries (including participating insurance companies that invest in the fund to fund variable annuity and variable life insurance contracts, sponsors of qualified retirement and pension plans that invest in the fund, and affiliates of these participating insurance companies and plan sponsors) in connection with the sale and distribution of the Service Class shares. MFD may subsequently pay all, or a portion, of the distribution and/or service fees to financial intermediaries.
Shareholder Servicing Agent – Effective April 1, 2013, MFS Service Center, Inc. (MFSC), a wholly-owned subsidiary of MFS, receives a fee from the fund for its services as shareholder servicing agent. For the period from April 1, 2013 through June 30, 2013, the fee was $574, which equated to 0.0022% annually of the fund’s average daily net assets. MFSC also receives payment from the fund for out-of-pocket expenses paid by MFSC on behalf of the fund. For the period from April 1, 2013 through June 30, 2013, these costs amounted to $1.
Administrator – MFS provides certain financial, legal, shareholder communications, compliance, and other administrative services to the fund. Under an administrative services agreement, the fund partially reimburses MFS the costs incurred to provide these services. The fund is charged an annual fixed amount of $17,500 plus a fee based on average daily net assets. The administrative services fee incurred for the six months ended June 30, 2013 was equivalent to an annual effective rate of 0.0343% of the fund’s average daily net assets.
Trustees’ and Officers’ Compensation – The fund pays compensation to independent Trustees in the form of a retainer, attendance fees, and additional compensation to Board and Committee chairpersons. The fund does not pay compensation directly to Trustees or officers of the fund who are also officers of the investment adviser, all of whom receive remuneration for their services to the fund from MFS. Certain officers and Trustees of the fund are officers or directors of MFS, MFD, and MFSC.
20
MFS Strategic Income Portfolio
Notes to Financial Statements (unaudited) – continued
Other – This fund and certain other funds managed by MFS (the funds) have entered into services agreements (the Agreements) which provide for payment of fees by the funds to Tarantino LLC and Griffin Compliance LLC in return for the provision of services of an Independent Chief Compliance Officer (ICCO) and Assistant ICCO, respectively, for the funds. The ICCO and Assistant ICCO are officers of the funds and the sole members of Tarantino LLC and Griffin Compliance LLC, respectively. The funds can terminate the Agreements with Tarantino LLC and Griffin Compliance LLC at any time under the terms of the Agreements. For the six months ended June 30, 2013, the aggregate fees paid by the fund to Tarantino LLC and Griffin Compliance LLC were $197 and are included in “Miscellaneous” expense in the Statement of Operations. MFS has agreed to reimburse the fund for a portion of the payments made by the fund in the amount of $98, which is shown as a reduction of total expenses in the Statement of Operations. Additionally, MFS has agreed to bear all expenses associated with office space, other administrative support, and supplies provided to the ICCO and Assistant ICCO.
The fund invests in the MFS Institutional Money Market Portfolio which is managed by MFS and seeks current income consistent with preservation of capital and liquidity. Income earned on this investment is included in “Dividends from underlying affiliated funds” in the Statement of Operations. This money market fund does not pay a management fee to MFS.
The fund invests in the MFS High Yield Pooled Portfolio (the “High Yield Pooled Portfolio”). MFS Pooled Portfolios are mutual funds advised by MFS that do not pay management fees to MFS but do incur investment and operating costs. MFS Pooled Portfolios are designed to be used by MFS funds to invest in a particular security type rather than invest in the security type directly. The fund invests in the High Yield Pooled Portfolio to gain exposure to high income debt instruments, rather than investing in high income debt instruments directly.
At close of business on March 22, 2013, the fund and certain other MFS funds transferred high income debt instruments, accrued interest and cash to the High Yield Pooled Portfolio, a series of MFS Series Trust III, in exchange for shares of the High Yield Pooled Portfolio. The purpose of the transaction was to pool the portion of the assets of the fund and certain other MFS funds invested in high income debt instruments in the High Yield Pooled Portfolio. The transfer was accomplished by a tax-free exchange by the fund of investments valued at approximately $16,047,838 with a cost basis of approximately $15,247,550, accrued interest of approximately $311,800 and cash of approximately $105,160 for approximately 1,646,480 shares of the High Yield Pooled Portfolio (valued at approximately $16,464,798). For financial reporting purposes, investments transferred and shares received by the fund were recorded at fair value; however, the cost basis of the investments delivered to the High Yield Pooled Portfolio was carried forward to the shares received. Income earned on this investment is included in “Dividends from underlying affiliated funds” in the Statement of Operations. The High Yield Pooled Portfolio does not charge a management fee, distribution and/or service fee, or sales charge.
Purchases and sales of investments, other than short-term obligations, were as follows:
| | | | | | | | |
| | | Purchases | | | Sales | |
| U.S. Government securities | | | $— | | | | $9,394 | |
| Investments (non-U.S. Government securities) | | | $7,686,515 | | | | $8,449,127 | |
| (5) | | Shares of Beneficial Interest |
The fund’s Declaration of Trust permits the Trustees to issue an unlimited number of full and fractional shares of beneficial interest. Transactions in fund shares were as follows:
| | | | | | | | | | | | | | | | |
| | | Six months ended 6/30/13 | | | Year ended 12/31/12 | |
| | | Shares | | | Amount | | | Shares | | | Amount | |
| Shares sold | | | | | | | | | | | | | | | | |
Initial Class | | | 166,832 | | | | $1,710,424 | | | | 526,863 | | | | $5,329,625 | |
Service Class | | | 42,395 | | | | 428,650 | | | | 92,471 | | | | 932,095 | |
| | | 209,227 | | | | $2,139,074 | | | | 619,334 | | | | $6,261,720 | |
| Shares issued to shareholders in reinvestment of distributions | | | | | | | | | | | | | | | | |
Initial Class | | | — | | | | $— | | | | 223,776 | | | | $2,206,430 | |
Service Class | | | — | | | | — | | | | 50,314 | | | | 493,576 | |
| | | — | | | | $— | | | | 274,090 | | | | $2,700,006 | |
| Shares reacquired | | | | | | | | | | | | | | | | |
Initial Class | | | (321,458 | ) | | | $(3,286,379 | ) | | | (436,307 | ) | | | $(4,403,488 | ) |
Service Class | | | (113,672 | ) | | | (1,157,289 | ) | | | (338,688 | ) | | | (3,377,399 | ) |
| | | (435,130 | ) | | | $(4,443,668 | ) | | | (774,995 | ) | | | $(7,780,887 | ) |
21
MFS Strategic Income Portfolio
Notes to Financial Statements (unaudited) – continued
| | | | | | | | | | | | | | | | |
| | | Six months ended 6/30/13 | | | Year ended 12/31/12 | |
| | | Shares | | | Amount | | | Shares | | | Amount | |
| Net change | | | | | | | | | | | | | | | | |
Initial Class | | | (154,626 | ) | | | $(1,575,955 | ) | | | 314,332 | | | | $3,132,567 | |
Service Class | | | (71,277 | ) | | | (728,639 | ) | | | (195,903 | ) | | | (1,951,728 | ) |
| | | (225,903 | ) | | | $(2,304,594 | ) | | | 118,429 | | | | $1,180,839 | |
The fund and certain other funds managed by MFS participate in a $1.1 billion unsecured committed line of credit, subject to a $1 billion sublimit, provided by a syndication of banks under a credit agreement. Borrowings may be made for temporary financing needs. Interest is charged to each fund, based on its borrowings, generally at a rate equal to the higher of the Federal Reserve funds rate or one month LIBOR plus an agreed upon spread. A commitment fee, based on the average daily, unused portion of the committed line of credit, is allocated among the participating funds at the end of each calendar quarter. In addition, the fund and other funds managed by MFS have established unsecured uncommitted borrowing arrangements with certain banks for temporary financing needs. Interest is charged to each fund, based on its borrowings, at a rate equal to the Federal Reserve funds rate plus an agreed upon spread. For the six months ended June 30, 2013, the fund’s commitment fee and interest expense were $131 and $0, respectively, and are included in “Miscellaneous” expense in the Statement of Operations.
| (7) | | Transactions in Underlying Affiliated Funds – Affiliated Issuers |
An affiliated issuer may be considered one in which the fund owns 5% or more of the outstanding voting securities, or a company which is under common control. For the purposes of this report, the fund assumes the following to be affiliated issuers:
| | | | | | | | | | | | | | | | |
| Underlying Affiliated Funds | | Beginning Shares/Par Amount | | | Acquisitions Shares/Par Amount | | | Dispositions Shares/Par Amount | | | Ending Shares/Par Amount | |
| MFS High Yield Pooled Portfolio | | | — | | | | 1,711,326 | | | | (74,148 | ) | | | 1,637,178 | |
| MFS Institutional Money Market Portfolio | | | 897,164 | | | | 5,997,815 | | | | (6,555,473 | ) | | | 339,506 | |
| | | | |
| Underlying Affiliated Funds | | Realized Gain (Loss) | | | Capital Gain Distributions | | | Dividend Income | | | Ending Value | |
| MFS High Yield Pooled Portfolio | | | $86,014 | | | | $— | | | | $304,334 | | | | $15,880,626 | |
| MFS Institutional Money Market Portfolio | | | — | | | | — | | | | 250 | | | | 339,506 | |
| | | | | | | | | | | | | | | | |
| | | $86,014 | | | | $— | | | | $304,584 | | | | $16,220,132 | |
| | | | | | | | | | | | | | | | |
22
MFS Strategic Income Portfolio
BOARD REVIEW OF INVESTMENT ADVISORY AGREEMENT
A discussion regarding the Board’s most recent review and renewal of the fund’s Investment Advisory Agreement with MFS will be available on or about November 1, 2013 by clicking on the fund’s name under “Variable Insurance Portfolios — VIT II” in the “Products” section of the MFS Web site (mfs.com).
PROXY VOTING POLICIES AND INFORMATION
A general description of the MFS funds’ proxy voting policies and procedures is available without charge, upon request, by calling 1-800-225-2606, by visiting the Proxy Voting section of mfs.com or by visiting the SEC’s Web site at http://www.sec.gov.
Information regarding how the fund voted proxies relating to portfolio securities during the most recent twelve-month period ended June 30 is available without charge by visiting the Proxy Voting section of mfs.com or by visiting the SEC’s Web site at http://www.sec.gov.
QUARTERLY PORTFOLIO DISCLOSURE
The fund will file a complete schedule of portfolio holdings with the Securities and Exchange Commission (the Commission) for the first and third quarters of each fiscal year on Form N-Q. The fund’s Form N-Q is available on the EDGAR database on the Commission’s Internet Web site at http://www.sec.gov, and may be reviewed and copied at the:
Public Reference Room
Securities and Exchange Commission
100 F Street, NE, Room 1580
Washington, D.C. 20549
Information on the operation of the Public Reference Room may be obtained by calling the Commission at 1-800-SEC-0330. Copies of the fund’s Form N-Q also may be obtained, upon payment of a duplicating fee, by electronic request at the following e-mail address: publicinfo@sec.gov or by writing the Public Reference Section at the above address.
FURTHER INFORMATION
From time to time, MFS may post important information about the fund or the MFS funds on the MFS web site (mfs.com). This information is available by visiting the “News & Commentary” section of mfs.com or by clicking on the fund’s name under “Variable Insurance Portfolios — VIT II” in the “Products” section of mfs.com.
23
During the period covered by this report, the Registrant has not amended any provision in its Code of Ethics (the “Code”) that relates to an element of the Code’s definitions enumerated in paragraph (b) of Item 2 of this Form N-CSR. During the period covered by this report, the Registrant did not grant a waiver, including an implicit waiver, from any provision of the Code.
| ITEM 3. | AUDIT COMMITTEE FINANCIAL EXPERT. |
Not applicable for semi-annual reports.
| ITEM 4. | PRINCIPAL ACCOUNTANT FEES AND SERVICES. |
Not applicable for semi-annual reports.
| ITEM 5. | AUDIT COMMITTEE OF LISTED REGISTRANTS. |
Not applicable to the Registrant.
A schedule of investments for each series of the Registrant is included as part of the report to shareholders of such series under Item 1 of this Form N-CSR.
| ITEM 7. | DISCLOSURE OF PROXY VOTING POLICIES AND PROCEDURES FOR CLOSED-END MANAGEMENT INVESTMENT COMPANIES. |
Not applicable to the Registrant.
| ITEM 8. | PORTFOLIO MANAGERS OF CLOSED-END MANAGEMENT INVESTMENT COMPANIES. |
Not applicable to the Registrant.
| ITEM 9. | PURCHASES OF EQUITY SECURITIES BY CLOSED-END MANAGEMENT INVESTMENT COMPANY AND AFFILIATED PURCHASERS. |
Not applicable to the Registrant.
| ITEM 10. | SUBMISSION OF MATTERS TO A VOTE OF SECURITY HOLDERS. |
There were no material changes to the procedures by which shareholders may send recommendations to the Board for nominees to the Registrant’s Board since the Registrant last provided disclosure as to such procedures in response to the requirements of Item 407 (c)(2)(iv) of Regulation S-K or this Item.
| ITEM 11. | CONTROLS AND PROCEDURES. |
| (a) | Based upon their evaluation of the effectiveness of the registrant’s disclosure controls and procedures (as defined in Rule 30a-3(c) under the Investment Company Act of 1940 (the “Act”)) as conducted within 90 days of the filing date of this report on Form N-CSR, the registrant’s principal financial officer and principal executive officer have concluded that those disclosure controls and procedures provide reasonable assurance that the material information required to be disclosed by the registrant on this report is recorded, processed, summarized and reported within the time periods specified in the Securities and Exchange Commission’s rules and forms. |
| (b) | There were no changes in the registrant’s internal controls over financial reporting (as defined in Rule 30a-3(d) under the Act) that occurred during the second fiscal quarter of the period covered by the report that have materially affected, or are reasonably likely to materially affect, the registrant’s internal control over financial reporting. |
| (a) | File the exhibits listed below as part of this form. Letter or number the exhibits in the sequence indicated. |
| | (1) | Any code of ethics, or amendment thereto, that is the subject of the disclosure required by Item 2, to the extent that the registrant intends to satisfy the Item 2 requirements through filing of an exhibit. |
| | (2) | A separate certification for each principal executive officer and principal financial officer of the registrant as required by Rule 30a-2(a) under the Act (17 CFR 270.30a-2): Attached hereto. |
| (b) | If the report is filed under Section 13(a) or 15(d) of the Exchange Act, provide the certifications required by Rule 30a-2(b) under the Act (17 CFR 270.30a-2(b)), Rule 13a-14(b) or Rule 15d-14(b) under the Exchange Act (17 CFR 240.13a-14(b) or 240.15d-14(b)) and Section 1350 of Chapter 63 of Title 18 of the United States Code (18 U.S.C. 1350) as an exhibit. A certification furnished pursuant to this paragraph will not be deemed “filed” for the purposes of Section 18 of the Exchange Act (15 U.S.C. 78r), or otherwise subject to the liability of that section. Such certification will not be deemed to be incorporated by reference into any filing under the Securities Act of 1933 or the Exchange Act, except to the extent that the registrant specifically incorporates it by reference: Attached hereto. |
Notice
A copy of the Amended and Restated Declaration of Trust, as amended, of the Registrant is on file with the Secretary of State of The Commonwealth of Massachusetts and notice is hereby given that this instrument is executed on behalf of the Registrant by an officer of the Registrant as an officer and not individually and the obligations of or arising out of this instrument are not binding upon any of the Trustees or shareholders individually, but are binding only upon the assets and property of the respective constituent series of the Registrant.
SIGNATURES
Pursuant to the requirements of the Securities Exchange Act of 1934 and the Investment Company Act of 1940, the registrant has duly caused this report to be signed on its behalf by the undersigned, thereunto duly authorized.
(Registrant) MFS VARIABLE INSURANCE TRUST II
| | |
| By (Signature and Title)* | | JOHN M. CORCORAN |
| | John M. Corcoran, President |
Date: August 16, 2013
Pursuant to the requirements of the Securities Exchange Act of 1934 and the Investment Company Act of 1940, this report has been signed below by the following persons on behalf of the registrant and in the capacities and on the dates indicated.
| | |
| By (Signature and Title)* | | JOHN M. CORCORAN |
| | John M. Corcoran, President (Principal Executive Officer) |
Date: August 16, 2013
| | |
| By (Signature and Title)* | | DAVID L. DILORENZO |
| | David L. DiLorenzo, Treasurer (Principal Financial Officer and Accounting Officer) |
Date: August 16, 2013
| * | Print name and title of each signing officer under his or her signature. |