The table below sets forth our assets and liabilities that were accounted for at fair value as of March 31, 2009, and the fair value calculation input hierarchy level that we have determined applies to each asset and liability category.
On March 9, 2009, we completed the sale of our processing facility located in Velardeña, Mexico to ECU Silver Mining Inc. (“ECU”) for $8 million in cash and 750,000 shares of ECU common stock, valued at $0.3 million at the time of the transaction. Ore produced from the San Sebastian and Don Sergio mines at our San Sebastian unit was processed at the Velardeña mill. Processing of economic ore was completed during the fourth quarter of 2005, and the mill was placed on care and maintenance at that time. The mill had a book value of approximately $3 million at the time of the sale. We recognized a pre-tax gain of approximately $6.2 million during the first quarter of 2009 as a result of the sale. The gain includes $1.0 million related to the elimination of the asset retirement obligation associated with the mill.
| |
Item 2. | Management’s Discussion and Analysis of Financial Condition and Results of Operations |
Certain statements contained in this Form 10-Q, including in Management’s Discussion and Analysis of Financial Condition and Results of Operations and Quantitative and Qualitative Disclosure About Market Risk, are intended to be covered by the safe harbor provided for under Section 27A of the Securities Act of 1933, as amended, and Section 21E of the Securities Exchange Act of 1934, as amended. Our forward-looking statements include our current expectations and projections about future results, performance, results of litigation, prospects and opportunities. We have tried to identify these forward-looking statements by using words such as “may,” “will,” “expect,” “anticipate,” “believe,” “intend,” “feel,” “plan,” “estimate,” “project,” “forecast” and similar expressions. These forward-looking statements are based on information currently available to us and are expressed in good faith and believed to have a reasonable basis. However, our forward-looking statements are subject to a number of risks, uncertainties and other factors that could cause our actual results, performance, prospects or opportunities to differ materially from those expressed in, or implied by, these forward-looking statements.
These risks, uncertainties and other factors include, but are not limited to, those set forth under Part I, Item 1A – Business – Risk Factors in our annual report filed on Form 10-K for the year ended December 31, 2008. Given these risks and uncertainties, readers are cautioned not to place undue reliance on our forward-looking statements. All subsequent written and oral forward-looking statements attributable to Hecla Mining Company or to persons acting on our behalf are expressly qualified in their entirety by these cautionary statements. Except as required by federal securities laws, we do not intend to update or revise any forward-looking statements, whether as a result of new information, future events or otherwise.
Overview
Hecla Mining Company has provided precious and base metals to the U.S. economy and worldwide since its incorporation in 1891. We discover, acquire, develop, produce, and market silver, gold, lead and zinc. In doing so, we intend to manage our business activities in a safe, environmentally responsible and cost-effective manner.
We produce both metal concentrates, which we sell to custom smelters, and unrefined gold and silver bullion bars, which may be sold as doré or further refined before sale to precious metals traders. We are organized and managed into two segments that encompass our operating units and significant exploration interests:
| | |
| • | The Greens Creek unit; and |
| • | The Lucky Friday unit. |
Prior to the first quarter of 2009, we reported an additional segment, the San Sebastian unit, for our various properties and exploration activities in Mexico. However, as a result of a recent work force reduction and decrease in exploration activity there resulting from a company-wide cash conservation effort, and our ownership of 100% of Greens Creek (discussed further below), we have determined that the San Sebastian unit no longer meets the criteria for consideration as a reportable segment as of and for the three-month period ended March 31, 2009. The corresponding information for all periods presented have been restated.
Prior to the second quarter of 2008, we also reported a fourth segment, the La Camorra unit, representing our operations and various exploration activities in Venezuela. On June 19, 2008, we entered into an agreement to sell our wholly-owned subsidiaries holding our business and operations in Venezuela, the transaction closing on July 8, 2008. Our Venezuelan activities are reported as discontinued operations on the Condensed Consolidated Statement of Income for all periods presented (seeNote 5 ofNotes to Condensed Consolidated Financial Statements (Unaudited) for more information). As a result, we have determined that it is no longer appropriate to present a separate segment representing our operations in Venezuela, and have restated the corresponding information for all periods presented.
-27-
Metals prices represent one of our greatest opportunities, and risks, as well as the basis for some of our most significant estimates. In the first quarter of 2009, the average prices of silver, gold, zinc and lead all were lower than their levels from the same period last year. However, prices for all four metals improved during the first quarter of 2009 from their levels at December 31, 2008.
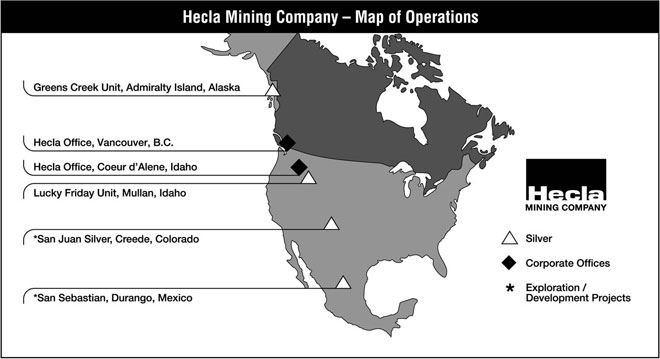
The map below shows the locations of our operating units and our exploration projects, as well as our corporate offices located in Coeur d’Alene, Idaho and Vancouver, British Columbia.
Our current business strategy is to focus our financial and human resources in the following areas:
| |
• | expanding our proven and probable reserves and production capacity at our operating properties; |
• | maintaining and investing in exploration projects in the vicinities of four mining districts we believe to be under-explored and under-invested: North Idaho’s Silver Valley in the historic Coeur d’Alene Mining District; the prolific silver-producing district near Durango, Mexico; at our Greens Creek unit on Alaska’s Admiralty Island located offshore of Juneau; and the Creede district of Southwestern Colorado; |
• | continuing to seek opportunities to acquire and invest in mining properties and companies; |
• | seeking opportunities for growth both internally and through acquisitions (see theResults of Operations andFinancial Liquidity and Capital Resources sections below); and |
• | managing our operations to maximize cash flow that will be applied to repay our credit facility (seeNote 11 toNotes to Condensed Consolidated Financial Statements (Unaudited) for further discussion). |
Our estimate for 2009 silver production is between 10 and 11 million ounces.
Results of Operations
For the first quarter of 2009, we recorded income applicable to common shareholders of $3.9 million ($0.02 per common share), compared to $12.1 million during the first quarter of 2008 ($0.10 per common share). The following factors led to the reduced results for the first three months of 2009 compared to the same period in 2008:
| |
• | decreased gross profit at our Lucky Friday unit by $9.6 million (seeThe Lucky Friday Segment section below); |
• | interest expense, net of interest capitalized, of $4.6 million for the quarter ended March 31, 2009 in connection with debt incurred for the purchase of the remaining 70.3% interest in the Greens Creek joint venture (seeNote 11 ofNotes to Condensed Consolidated Financial Statements (Unaudited) for more information on our debt facilities); |
• | $4.3 million in expense recognized in the first quarter of 2009 for preferred shares issued for debt-related fees pursuant to our amended and restated credit agreement (seeNote 10 andNote 11 ofNotes to Condensed Consolidated Financial Statements (Unaudited) for more information); |
-28-
| |
• | income from our discontinued Venezuelan operations of $1.9 million during the first quarter of 2008; and |
• | decreased average prices for silver, gold, zinc and lead for the first quarter of 2009 compared to the same 2008 period, as illustrated by the following table: |
| | | | | | | | |
| | | Three months ended March 31, | |
| | | 2009 | | 2008 | |
Silver — | London PM Fix ($/ounce) | | $ | 12.61 | | $ | 17.68 | |
| Realized price per ounce | | $ | 13.92 | | $ | 19.77 | |
Gold — | London PM Fix ($/ounce) | | $ | 909 | | $ | 927 | |
| Realized price per ounce | | $ | 938 | | $ | 864 | |
Lead — | LME Final Cash Buyer ($/pound) | | $ | 0.52 | | $ | 1.31 | |
| Realized price per pound | | $ | 0.61 | | $ | 1.48 | |
Zinc — | LME Final Cash Buyer ($/pound) | | $ | 0.53 | | $ | 1.10 | |
| Realized price per pound | | $ | 0.63 | | $ | 1.34 | |
The differences between realized metal prices and average market prices are due to the difference between metal prices upon transfer of title of concentrates to the buyer and final settlement. For the first quarter of 2009, we reported positive adjustments to provisional settlements of $5.4 million compared to positive adjustments to provisional settlements of $1.2 million in the first quarter of 2008.
The factors discussed above were partially offset by the following other significant items affecting the comparison of our first quarter 2009 operating results to the results for the same 2008 period:
| |
• | increased gross profit at our Greens Creek unit of only $0.8 million despite the significant increase in our ownership percentage (see theGreens Creek Segmentsection below); |
• | the termination of an employee benefit plan, resulting in a non-cash gain of $9.0 million (seeNote 9 ofNotes to Condensed Consolidated Financial Statements (Unaudited) for more information); |
• | the sale of our Velardeña mill in Mexico, generating a pre-tax gain of $6.2 million (seeNote 15 ofNotes to Condensed Consolidated Financial Statements (Unaudited) for more information); and |
• | decrease of $4.5 million in exploration expense in the 2009 period due to a reduction in exploration activity in North Idaho’s Silver Valley, at our San Sebastian unit in Mexico, and at the San Juan Silver project in Colorado as a part of an overall cash conservation effort. |
The Greens Creek Segment
Below is a comparison of the operating results and key production statistics of our Greens Creek segment, which reflects our 29.7% ownership share through April 16, 2008 and our 100% ownership thereafter, as we completed the acquisition of the companies holding the remaining 70.3% ownership of the Greens Creek mine on April 16, 2008 (dollars are in thousands, except for per ounce amounts).
| | | | | | | |
| | Three Months Ended March 31, | |
| | 2009 | | 2008 | |
Sales | | $ | 40,013 | | $ | 13,634 | |
Cost of sales and other direct production costs | | | (19,787 | ) | | (5,342 | ) |
Depreciation, depletion and amortization | | | (12,931 | ) | | (1,836 | ) |
Gross Profit | | $ | 7,295 | | $ | 6,456 | |
| | | | | | | |
Tons of ore milled | | | 191,484 | | | 50,050 | |
Production: | | | | | | | |
Silver (ounces) | | | 1,996,853 | | | 495,853 | |
Gold (ounces) | | | 18,049 | | | 4,851 | |
Zinc (tons) | | | 16,121 | | | 4,474 | |
Lead (tons) | | | 5,186 | | | 1,438 | |
Payable metal quantities sold: | | | | | | | |
Silver (ounces) | | | 1,495,381 | | | 283,448 | |
Gold (ounces) | | | 13,130 | | | 3,008 | |
Zinc (tons) | | | 10,336 | | | 2,200 | |
Lead (tons) | | | 3,533 | | | 891 | |
Ore grades: | | | | | | | |
Silver ounces per ton | | | 14.12 | | | 13.57 | |
Gold ounces per ton | | | 0.14 | | | 0.15 | |
Zinc percent | | | 9.60 | | | 10.32 | |
Lead percent | | | 3.53 | | | 3.69 | |
Total cash cost per silver ounce(1) | | $ | 3.21 | | $ | (5.10 | ) |
-29-
| | |
| (1) | A reconciliation of this non-GAAP measure to cost of sales and other direct production costs and depreciation, depletion and amortization, the most comparable GAAP measure, can be found below inReconciliation of Total Cash Costs (non-GAAP) to Costs of Sales and Other Direct Production Costs and Depreciation, Depletion and Amortization (GAAP). |
The 13% increase in gross profit during the first quarter of 2009 compared to the same 2008 period was primarily the result of the following factors:
| |
• | An increase in our share of production due to our acquisition of the remaining 70.3% of Greens Creek in April 2008. |
• | Improved production costs, which decreased by 19% per ton milled in the 2009 period due to lower diesel prices and improved ore production. |
• | Positive price adjustments to revenues during the first quarter of 2009 of $4.5 million as a result of increases in metal prices between transfer of title of concentrates to buyers and final settlements during the quarter, compared to positive price adjustments of $1.0 million during the first quarter of 2008. |
• | The timing of the arrival of ships to load concentrates at the end of the first quarter of 2008, as March 2008 saw no shipments due to port congestion in Asia. |
• | The impact of lower equipment availability and staffing during the first quarter of 2008, which resulted in lower ore production. |
These factors were partially offset by:
| |
• | Lower average prices in the first quarter of 2009 for all metals produced at Greens Creek. |
• | Higher depreciation, depletion and amortization expense in 2009 as a result of the fair market valuation of the acquired 70.3% share of property, plant, equipment and mineral interests at the acquisition date. |
The Greens Creek operation is partially powered by diesel generators, and production costs are significantly affected by fluctuations in fuel prices. Infrastructure has been installed that allows hydroelectric power to be supplied to Greens Creek by Alaska Electric Light and Power Company (“AEL&P”), via a submarine cable from North Douglas Island, near Juneau, to Admiralty Island, where Greens Creek is located. It is anticipated that this project will reduce production costs at Greens Creek. AEL&P had agreed to supply surplus power to Greens Creek; however, supply has been limited by low reservoir water supplies and high power demand in the Juneau vicinity.
-30-
Despite higher production, lower costs, and improved silver ore grades, cash cost per ounce increased by $8.31 due to lower by-product metal prices. While value from zinc, lead and gold by-products is significant, we believe that identification of silver as the primary product is appropriate because:
| |
• | silver has historically accounted for a higher proportion of revenue than any other metal and is expected to do so in the future; |
• | we have historically presented Greens Creek as a producer primarily of silver, based on the original analysis that justified putting the project into production, and believe that consistency in disclosure is important to our investors regardless of the relationships of metals prices and production from year to year; |
• | metallurgical treatment maximizes silver recovery; |
• | the Greens Creek deposit is a massive sulfide deposit containing an unusually high proportion of silver; and |
• | in most of its working areas, Greens Creek utilizes selective mining methods in which silver is the metal targeted for highest recovery. |
We periodically review our proven and probable reserves to ensure that reporting of primary products and by-products is appropriate. Within our cost per ounce calculations, because we consider zinc, lead and gold to be by-products of our silver production, the values of these metals offset operating costs.
The Lucky Friday Segment
The following is a comparison of the operating results and key production statistics of our Lucky Friday segment (dollars are in thousands, except for per ounce amounts):
| | | | | | | |
| | Three Months Ended March 31, | |
| | 2009 | | 2008 | |
Sales | | $ | 14,708 | | $ | 23,835 | |
Cost of sales and other direct production costs | | | (9,848 | ) | | (10,562 | ) |
Depreciation, depletion and amortization | | | (2,287 | ) | | (1,077 | ) |
Gross profit | | $ | 2,573 | | $ | 12,196 | |
| | | | | | | |
Tons of ore milled | | | 86,446 | | | 80,367 | |
Production: | | | | | | | |
Silver (ounces) | | | 866,298 | | | 759,303 | |
Lead (tons) | | | 5,639 | | | 4,709 | |
Zinc (tons) | | | 2,591 | | | 2,547 | |
Payable metal quantities sold: | | | | | | | |
Silver (ounces) | | | 777,281 | | | 720,003 | |
Lead (tons) | | | 4,940 | | | 4,393 | |
Zinc (tons) | | | 1,833 | | | 1,700 | |
Ore grades: | | | | | | | |
Silver ounces per ton | | | 10.66 | | | 10.03 | |
Lead percent | | | 6.99 | | | 6.25 | |
Zinc percent | | | 3.49 | | | 3.52 | |
Total cash cost per silver ounce(1) | | $ | 8.03 | | $ | 0.98 | |
| | |
| (1) | A reconciliation of this non-GAAP measure to cost of sales and other direct production costs and depreciation, depletion and amortization, the most comparable GAAP measure, can be found below inReconciliation of Total Cash Costs (non-GAAP) to Costs of Sales and Other Direct Production Costs and Depreciation, Depletion and Amortization (GAAP). |
-31-
The $9.6 million decrease in gross profit for the first quarter of 2009 compared to the same 2008 period resulted primarily from lower average silver, lead and zinc prices, partially offset by improved production and a 7% decrease in production costs per ton milled.
The $7.05 increase in total cash costs per silver ounce in the first quarter of 2009 compared to the 2008 period is attributed to lower lead and zinc by-product credits resulting from decreased average prices for those metals. While value from lead and zinc is significant at the Lucky Friday, we believe that identification of silver as the primary product, with zinc and lead as by-products, is appropriate because:
| |
• | silver has historically accounted for a higher proportion of revenue than any other metal and is expected to do so in the future; |
• | the Lucky Friday unit is situated in a mining district long associated with silver production; and |
• | the Lucky Friday unit generally utilizes selective mining methods to target silver production. |
We periodically review our proven and probable reserves to ensure that reporting of primary products and by-products is appropriate. Within our cost per ounce calculations, because we consider zinc and lead to be by-products of our silver production, the values of these metals offset operating costs.
Discontinued Operations - The La Camorra Unit
During the second quarter of 2008, we committed to a plan to sell all of the outstanding capital stock of El Callao Gold Mining Company (“El Callao”) and Drake-Bering Holdings B.V. (“Drake-Bering”), our wholly-owned subsidiaries holding our business and operations of the La Camorra Unit to Rusoro Mining, Ltd. (“Rusoro”) for $20 million in cash and 4,273,504 shares of Rusoro common stock valued at $5.4 million at the time of the transaction. The transaction closed on July 8, 2008. Pursuant to SFAS No. 144, “Accounting for the Impairment or Disposal of Long-Lived Assets,” the results of our Venezuelan operations have been reported in discontinued operations for all periods presented. SeeNote 5 ofNotes to Condensed Consolidated Financial Statements (Unaudited) for more information.
The following is a summary of the operating results and key production statistics of our discontinued Venezuelan operations prior to sale, which included the La Camorra mine, a custom milling business and Mina Isidora (dollars are in thousands, except for per ounce amounts):
| | | | |
| | Three months
ended March 31,
2008 | |
Sales | | $ | 9,334 | |
Cost of sales and other direct production costs | | | (3,096 | ) |
Depreciation, depletion and amortization | | | (3,109 | ) |
Gross profit | | $ | 3,129 | |
| | | | |
Tons of ore milled | | | 20,904 | |
Gold ounces produced | | | 17,089 | |
Gold ounces per ton | | | 0.875 | |
Total cash cost per gold ounce (1) | | $ | 642 | |
Corporate Matters
Other significant variances affecting the results of our first quarter 2009 operations as compared to the first quarter 2008 results were as follows:
-32-
| |
• | Lower general and administrative expense in the first quarter of 2009 of $0.2 million which was primarily the result of decreased staffing and incentive compensation expense, partially offset by costs incurred for work force reductions. |
• | $1.8 million increase in other operating expense primarily as a result of professional fees incurred related to compliance with our amended and restated credit agreement. |
• | $2.3 million decrease in interest income due to lower cash balances and interest rates. |
• | Interest expense, net of interest capitalized, of $4.6 million for the quarter ended March 31, 2009 in connection with debt incurred for the purchase of the remaining 70.3% interest in the Greens Creek joint venture (seeNote 11of Notes to Condensed Consolidated Financial Statements (Unaudited) for more information on our debt facilities). |
• | $4.3 million in expense recognized in the first quarter of 2009 for preferred shares issued for debt-related fees pursuant to our amended and restated credit agreement (seeNote 10 andNote 11 ofNotes to Condensed Consolidated Financial Statements (Unaudited) for more information). |
• | An income tax provision of $0.1 million for the first quarter of 2009, compared to an income tax benefit of $3.9 million for the first quarter of 2008. SeeNote 3 ofNotes to Condensed Consolidated Financial Statements (Unaudited) for more information. |
Reconciliation of Total Cash Costs (non-GAAP) to Cost of Sales and Other Direct Production Costs and Depreciation, Depletion and Amortization (GAAP)
The tables below present reconciliations between non-GAAP total cash costs to cost of sales and other direct production costs and depreciation, depletion and amortization (GAAP) for our operations at the Greens Creek and Lucky Friday units for the three months ended March 31, 2009 and 2008 (in thousands, except costs per ounce). Tables in previous periods have presented gold cost per ounce, however as a result of our sale of all of the outstanding capital stock of El Callao and Drake-Bering in July 2008, our gold operations have been reclassified as discontinued operations for all periods presented.
Total cash costs include all direct and indirect operating cash costs related directly to the physical activities of producing metals, including mining, processing and other plant costs, third-party refining and marketing expense, on-site general and administrative costs, royalties, and mining production taxes, net of by-product revenues earned from all metals other than the primary metal produced at each unit. Total cash costs provide management and investors an indication of net cash flow, after consideration of the realized price received for production sold. Management also uses this measurement for the comparative monitoring of performance of our mining operations period-to-period from a cash flow perspective. “Total cash cost per ounce” is a measure developed by gold companies in an effort to provide a comparable standard; however, there can be no assurance that our reporting of this non-GAAP measure is similar to that reported by other mining companies.
Cost of sales and other direct production costs and depreciation, depletion and amortization, is the most comparable financial measure calculated in accordance with GAAP to total cash costs. The sum of the cost of sales and other direct production costs and depreciation, depletion and amortization for our operating units in the tables below is presented in our Condensed Consolidated Statement of Income and Comprehensive Income (Loss) (Unaudited) (in thousands).
-33-
| | | | | | | |
| | Total, All Properties | |
| | | |
| | Three Months Ended
March 31, | |
| | 2009 | | 2008 | |
Total cash costs(1) | | $ | 13,368 | | $ | (1,785 | ) |
Divided by ounces produced | | | 2,863 | | | 1,255 | |
Total cash cost per ounce produced | | $ | 4.67 | | $ | (1.42 | ) |
Reconciliation to GAAP: | | | | | | | |
Total cash costs | | $ | 13,368 | | $ | (1,785 | ) |
Depreciation, depletion and amortization | | | 15,218 | | | 2,913 | |
Treatment costs | | | (17,530 | ) | | (10,011 | ) |
By-product credits | | | 37,875 | | | 29,582 | |
Change in product inventory | | | (4,324 | ) | | (1,929 | ) |
Reclamation and other costs | | | 246 | | | 47 | |
Cost of sales and other direct production costs and depreciation, depletion and amortization (GAAP) | | $ | 44,853 | | $ | 18,817 | |
| | | | | | | |
| | Greens Creek unit | |
| | | |
| | Three Months Ended March 31, | |
| | 2009 | | 2008 | |
Total cash costs(1) | | $ | 6,411 | | $ | (2,531 | ) |
Divided by silver ounces produced | | | 1,997 | | | 496 | |
Total cash cost per silver ounce produced | | $ | 3.21 | | $ | (5.10 | ) |
Reconciliation to GAAP: | | | | | | | |
Total cash costs | | $ | 6,411 | | $ | (2,531 | ) |
Depreciation, depletion and amortization | | | 12,932 | | | 1,836 | |
Treatment costs | | | (13,304 | ) | | (4,434 | ) |
By-product credits | | | 30,526 | | | 14,222 | |
Change in product inventory | | | (4,086 | ) | | (1,957 | ) |
Reclamation and other costs | | | 239 | | | 42 | |
Cost of sales and other direct production costs and depreciation, depletion and amortization (GAAP) | | $ | 32,718 | | $ | 7,178 | |
-34-
| | | | | | | |
| | Lucky Friday unit | |
|
| | Three Months Ended March 31, | |
| | 2009 | | 2008 | |
Total cash costs(1) | | $ | 6,957 | | $ | 746 | |
Divided by silver ounces produced | | | 866 | | | 759 | |
Total cash cost per silver ounce produced | | $ | 8.03 | | $ | 0.98 | |
Reconciliation to GAAP: | | | | | | | |
Total cash costs | | $ | 6,957 | | $ | 746 | |
Depreciation, depletion and amortization | | | 2,286 | | | 1,077 | |
Treatment costs | | | (4,226 | ) | | (5,577 | ) |
By-product credits | | | 7,349 | | | 15,360 | |
Change in product inventory | | | (238 | ) | | 28 | |
Reclamation and other costs | | | 7 | | | 5 | |
Cost of sales and other direct production costs and depreciation, depletion and amortization (GAAP) | | $ | 12,135 | | $ | 11,639 | |
| | |
| (1) | Includes all direct and indirect operating cash costs related directly to the physical activities of producing metals, including mining, processing and other plant costs, third-party refining and marketing expense, on-site general and administrative costs, royalties and mining production taxes, net of by-product revenues earned from all metals other than the primary metal produced at each unit. |
Financial Liquidity and Capital Resources
Our liquid assets include (in millions):
| | | | | | | |
| | March 31,
2009 | | December 31,
2008 | |
Cash and cash equivalents | | $ | 62.6 | | $ | 36.5 | |
Marketable equity securities, non-current | | | 3.7 | | | 3.1 | |
Total cash, cash equivalents and investments | | $ | 66.3 | | $ | 39.6 | |
Cash and cash equivalents increased by $26.1 million in the first quarter of 2009, as discussed below, while the value of current marketable equity securities increased due to changes in market value and stock acquired upon sale of the Velardeña mill (seeNote 15 ofNotes to Condensed Consolidated Financial Statements (Unaudited) for more information).
As a result of our current cash balance, the performance of our operations, current metals prices, and the terms of our amended and restated credit agreement, we believe our cash, cash equivalents, investments, and cash from operations will be adequate to meet our obligations during the next twelve months. We estimate that approximately $25 to $28 million will be committed to sustaining capital expenditures through the end of this year. As described inNote 11 ofNotes to Condensed Consolidated Financial Statements (Unaudited), we entered into a $380 million credit facility in April of 2008 for the acquisition of the companies owning 70.3% of the joint venture operating the Greens Creek mine. We have since repaid $266.4 million of the debt through issuances of common stock, leaving a balance at March 31, 2009 of $113.6 million. Payments of $15.0 million are due at the end of each calendar quarter in 2010, with the remaining $53.7 million due on March 31, 2011, subject to certain covenants regarding prepayments if our cash balances exceed defined thresholds. We also may pursue additional acquisition opportunities or capital expansion projects, which would require additional equity issuances or financing. There can be no assurances that such financing will be available to us.
-35-
| | | | | | | |
| | March 31, 2009 | | March 31, 2008 | |
Cash provided by (used in) operating activities (in millions) | | $ | (0.5 | ) | $ | 11.6 | |
The lower cash provided by operating activities in the first quarter of 2009, compared to the same 2008 period, primarily resulted from higher accounts receivable balances in 2009 due to the timing of our shipments to smelters, and from payments of vendor invoices accrued at December 31, 2008 and paid in the first quarter of 2009. These cash requirements were partially offset by net income, adjusted for non-cash elements, that was higher in 2009 by $3.3 million.
| | | | | | | |
| | March 31, 2009 | | March 31, 2008 | |
Cash provided by (used in) investing activities (in millions) | | $ | 3.7 | | $ | (23.3 | ) |
Investing activities in 2009 included receipt of proceeds of $8.0 million from the sale of our Velardeña mill as described inNote 15 ofNotes to Condensed Consolidated Financial Statements (Unaudited), partially offset by an additional $0.7 million committed to restricted cash related to environmental bonds, and $3.6 million cash used for capital expenditures. An additional $2.5 million in capital was procured with capital leases. In the first quarter of 2008, cash requirements for investing activities included capitalized expenditures of $11.6 million related to projects at our Lucky Friday unit, a level higher than we have committed in 2009 due to our efforts to curtail cash requirements. Also in 2008, we advanced $16.3 million for acquisition of the companies then owning the remaining 70.3% of the Greens Creek Joint Venture, and we liquidated $4.0 million in short-term investments.
| | | | | | | |
| | March 31, 2009 | | March 31, 2008 | |
Cash provided by (used in) financing activities (in millions) | | $ | 22.9 | | $ | (3.8 | ) |
The source of cash in 2009 was $71 million from the issuance of our common stock as described inNote 10 ofNotes to Condensed Consolidated Financial Statements (Unaudited). We applied $48.0 million of the proceeds to our debt facility, with $40.0 million paying the bridge facility in full and the remaining $8.0 million as a prepayment on our term credit facility. The use of cash in 2008 was for payment of dividends to preferred shareholders. Dividends have not been paid to preferred shareholders since the second quarter of 2008.
Contractual Obligations, Contingent Liabilities and Commitments
The table below presents our fixed, non-cancelable contractual obligations and commitments primarily related to our outstanding purchase orders, certain capital expenditures, our credit facility (as modified by amendments) and lease arrangements as of March 31, 2009 (in thousands):
-36-
| | | | | | | | | | | | | | | | |
| | Payments Due By Period | |
| | Less than
1 year | | 1-3 years | | 4-5 years | | More than
5 years | | Total | |
| | | | | | | | | | | | | | | | |
Purchase obligations(1) | | $ | 4,135 | | $ | — | | $ | — | | $ | — | | $ | 4,135 | |
Long-term debt(2) | | | 25,132 | | | 105,263 | | | — | | | — | | | 130,395 | |
Contractual obligations (3) | | | 10,112 | | | — | | | — | | | — | | | 10,112 | |
Capital lease commitments(4) | | | 838 | | | 1,695 | | | 95 | | | — | | | 2,628 | |
Operating lease commitments (5) | | | 2,096 | | | 1,547 | | | 175 | | | — | | | 3,818 | |
Total contractual cash obligations | | $ | 42,313 | | $ | 108,505 | | $ | 270 | | $ | — | | $ | 151,088 | |
| | |
| (1) | Consists of open purchase orders of approximately $3.0 million at the Greens Creek unit and $1.1 million at the Lucky Friday unit. Included in these amounts are approximately $2.9 million and $0.9 million related to various capital projects at the Greens Creek and Lucky Friday units, respectively. |
| | |
| (2) | Obligations due in less than one year are comprised of $15.0 million in principal and $10.1 million in estimated interest on our term credit facility. Obligations due in one to three years include $98.7 million in scheduled term facility principal payments and $6.6 million in estimated interest. For more information on our credit facility, seeNote 11 ofNotes to Condensed Consolidated Financial Statements (Unaudited). |
| | |
| (3) | Includes approximately $3.2 million for various capital projects at the Greens Creek and Lucky Friday units. Total contractual obligations at March 31, 2009 also included approximately $6.9 million for commitments relating to non-capital items at Greens Creek. |
| | |
| (4) | Represents scheduled capital lease payments of $1.8 million and $0.8 million (including interest), respectively, for equipment at our Greens Creek and Lucky Friday units. These leases have fixed payment terms and contain bargain purchase options at the end of the lease periods (seeNote 11 ofNotes to Condensed Consolidated Financial Statements (Unaudited)for more information). |
| | |
| (5) | We enter into operating leases in the normal course of business. Substantially all lease agreements have fixed payment terms based on the passage of time. Some lease agreements provide us with the option to renew the lease or purchase the leased property. Our future operating lease obligations would change if we exercised these renewal options and if we entered into additional operating lease arrangements. |
We maintain reserves for costs associated with mine closure, land reclamation and other environmental matters. At March 31, 2009, our reserves for these matters totaled $120.6 million, for which no contractual or commitment obligations exist. Future expenditures related to closure, reclamation and environmental expenditures are difficult to estimate, although we anticipate we will make expenditures relating to these obligations over the next 30 years. For additional information relating to our environmental obligations, seeNote 6of Notes to Condensed Consolidated Financial Statements (Unaudited).
Off-Balance Sheet Arrangements
At March 31, 2009, we had no existing off-balance sheet arrangements, as defined under SEC regulations, that have or are reasonably likely to have a current or future effect on our financial condition, revenues or expenses, results of operations, liquidity, capital expenditures or capital resources that is material to investors.
-37-
Critical Accounting Estimates
Our significant accounting policies are described inNote 1ofNotes to Consolidated Financial Statementsin our annual report filed on Form 10-K for the year ended December 31, 2008. As described inNote 1, we are required to make estimates and assumptions that affect the reported amounts and related disclosures of assets, liabilities, revenue, and expenses. Our estimates are based on our experience and our interpretation of economic, political, regulatory, and other factors that affect our business prospects. Actual results may differ significantly from our estimates.
We believe that our most critical accounting estimates are related to future metals prices, obligations for environmental, reclamation, and closure matters, mineral reserves, and accounting for business combinations, as they require us to make assumptions that were highly uncertain at the time the accounting estimates were made, and changes in them are reasonably likely to occur from period to period. Management has discussed the development and selection of these critical accounting estimates with the Audit Committee of our board of directors, and the Audit Committee has reviewed the disclosures presented below. In addition, there are other items within our financial statements that require estimation, but are not deemed to be critical. However, changes in estimates used in these and other items could have a material impact on our financial statements.
Future Metals Prices
Metals prices are key components in estimates that determine the valuation of some of our significant assets and liabilities, including properties, plants and equipment, deferred tax assets, and certain accounts receivable. As shown underItem 1A.— Risk Factorsin our annual report filed on Form 10-K for the year ended December 31, 2008, metals prices have been historically volatile (seePart II Item 1A. Risk Factors below). While average prices for all four metals we produce performed favorably for the five consecutive years prior to 2008, there was a reduction in the average prices for zinc and lead in 2008 compared to 2007, and average prices for all four metals were lower for the first quarter of 2009 compared to the same 2008 period. We have recorded impairments to our asset carrying value because of low prices in the past, and we can offer no assurance that prices will either remain at their current levels or increase.
Processes supporting valuation of our assets and liabilities that are most significantly affected by prices include analyses of asset carrying values, depreciation, and deferred income taxes. On at least an annual basis – and more frequently if circumstances warrant – we examine the carrying values of our assets, our depreciation rates, and the valuation allowances on our deferred tax assets. In our analyses of carrying values and deferred taxes, we apply several pricing views to our forecasting model, including current prices, analyst price estimates, forward-curve prices, and historical prices (seeMineral Reserves, below, regarding prices used for reserve estimates). Using applicable accounting guidance and our view of metals markets, we use the average of the various methods to determine whether the values of our assets are fairly stated, and to determine the level of valuation allowances on our deferred tax assets. In addition, estimates of future metals prices are used in the valuation of certain assets in the determination of the purchase price allocations for our acquisitions (seeBusiness Combinations below).
Sales of all metals products sold directly to smelters are recorded as revenues when title and risk of loss transfer to the smelter (generally at the time of shipment) at estimated forward metals prices for the estimated month of settlement. Due to the time elapsed from shipment to the smelter and the final settlement with the smelter, we must estimate the prices at which sales of our metals will be settled. Previously recorded sales and trade accounts receivable are adjusted to estimated settlement metals prices until final settlement by the smelter. Changes in metals prices between shipment and final settlement will result in changes to revenues and accounts receivable previously recorded upon shipment. As a result, our trade accounts receivable balances are subject to changes in metals prices until final settlement occurs. For more information, see partO. Revenue RecognitionofNote 1 ofNotes to Consolidated Financial Statementsin our annual report filed on Form 10-K for the year ended December 31, 2008.
-38-
Obligations for Environmental, Reclamation and Closure Matters
The most significant liability on our balance sheet is for accrued reclamation and closure costs. We have conducted considerable remediation work at sites in the United States for which remediation requirements have not been fully determined, nor have they been agreed between us and various regulatory agencies with oversight over the properties. We have estimated our liabilities with counsel and in accordance with appropriate accounting guidance. On at least an annual basis – and more frequently if warranted – management reviews our liabilities with our Audit Committee. However, the range of liability proposed by the plaintiffs in environmental proceedings considerably exceeds the liabilities we have recognized. If substantial damages were awarded or remediation costs incurred in excess of our accruals, our financial results or condition could be materially adversely affected.
Mineral Reserves
Critical estimates are inherent in the process of determining our reserves. Our reserves are affected largely by our assessment of future metals prices, as well as by engineering and geological estimates of ore grade, accessibility and production cost. Metals prices are estimated at long-term averages, as described inItem 2. — Property Descriptionsin our annual report on Form 10-K filed for the year ended December 31, 2008. Our assessment of reserves occurs at least annually, and periodically utilizes external audits.
Reserves are a key component in valuation of our properties, plants and equipment. Reserve estimates are used in determining appropriate rates of units-of-production depreciation, with net book value of many assets depreciated over remaining estimated reserves. Reserves are also a key component in forecasts, with which we compare future cash flows to current asset values to ensure that carrying values are reported appropriately. Reserves also play a role in the valuation of certain assets in the determination of the purchase price allocations for our acquisitions (seeBusiness Combinations below). Reserves represent a culmination of many estimates, and are not guarantees that we will recover the indicated quantities of metals.
Business Combinations
In accordance with SFAS 141(R), “Business Combinations,” we are required to allocate the purchase price of acquired companies to the tangible and intangible assets acquired and liabilities assumed based on their estimated fair values at acquisition date. We would recognize the excess of an acquired business’s cost over the fair value of acquired assets, less liabilities, as goodwill. The valuation of assets acquired and liabilities assumed requires management to make significant estimates and assumptions, especially with respect to long-lived assets, including estimates of future metals prices and mineral reserves, as discussed above. In some cases, we use third-party appraisers to determine the fair values and lives of property and other identifiable assets.
-39-
| |
Item 3. | Quantitative and Qualitative Disclosures About Market Risk |
The following discussion about our risk management activities includes forward-looking statements that involve risk and uncertainties, as well as summarizes the financial instruments held by us at March 31, 2009, which are sensitive to changes in interest rates and commodity prices and are not held for trading purposes. Actual results could differ materially from those projected in the forward-looking statements. In the normal course of business, we also face risks that are either nonfinancial or nonquantifiable (seeItem 1A. – Risk Factorsin our annual reported filed on Form 10-K for the year ended December 31, 2008).
Short-term Investments
From time to time we hold various types of short-term investments that are subject to changes in market interest rates and are sensitive to those changes. We did not carry any such short-term investments as of March 31, 2009.
Commodity-Price Risk Management
At times, we use commodity forward sales commitments, commodity swap contracts and commodity put and call option contracts to manage our exposure to fluctuation in the prices of certain metals which we produce. Contract positions are designed to ensure that we will receive a defined minimum price for certain quantities of our production. We use these instruments to reduce risk by offsetting market exposures. We had no commodity-related derivative positions at March 31, 2009.
Interest-Rate Risk Management
At March 31, 2009, we had $113.7 million in debt associated with a three-year amortizing term facility maturing on March 31, 2011 utilized in the acquisition of the remaining 70.3% of the Greens Creek mine.
On May 5, 2008, we entered into an interest rate swap agreement that had the economic effect of modifying the LIBOR-based variable interest obligations associated with our term facility. As a result, the interest payable related to $95.4 million if the $113.7 million term facility balance at March 31, 2009 is fixed at a rate of 9.38% until maturity on March 31, 2011, in accordance with the amortization schedule of the amended and restated credit agreement dated April 16, 2008. As a result of an amendment to the facility in December 2008 to defer the $18.3 million principal payment originally due on December 31, 2008 to February 13, 2009, the terms of the interest rate swap agreement and the note that the swap agreement pertains to did not match at March 31, 2009 with respect to the maturity date of the $18.3 million payment. This caused the hedge to be slightly ineffective at that time as a result. The hedge was 100% effective as of March 31, 2009. The fair value of the swap at March 31, 2009 was a liability of $2.1 million. The accumulated unrealized loss at March 31, 2009 related to the swap was $1.6 million. We are accounting for this swap as a hedge pursuant to FASB Statement No. 133, Accounting for Derivative Instruments and Hedging Activities. The unrealized loss is included in accumulated other comprehensive loss in our consolidated balance, with the fair value payable included in other non-current liabilities in our consolidated balance sheet. For additional information regarding our credit facilities, seeNote 11of Notes to Condensed Consolidated Financial Statements (Unaudited).
-40-
On February 3, 2009, we reached an agreement to amend the terms of our credit facility to defer all scheduled principal payments due on our term facility in 2009, totaling $66.7 million, to 2010 and 2011. As a result of the amendment, the original hedging relationship was de-designated, and a new hedging relationship was designated. A retrospective hedge effectiveness test was performed on the original hedging relationship at the date of de-designation, and the original hedging relationship was determined to be ineffective. Consequently, the change in fair value of the swap of $0.2 million between December 31, 2008 and February 3, 2009 was recorded as a gain on the income statement. The amount of unrealized loss included in accumulated other comprehensive loss relating to the original hedge will be recognized in the income statement when the hedged interest payments occur.
Provisional Sales
Sales of all metals products sold directly to smelters, including by-product metals, are recorded as revenues when title and risk of loss transfer to the smelter (generally at the time of shipment) at estimated forward prices for the estimated month of settlement. Due to the time elapsed from shipment to the smelter and the final settlement with the smelter, we must estimate the prices at which sales of our metals will be settled. Previously recorded sales are adjusted to estimated settlement metals prices until final settlement by the smelter. Changes in metals prices between shipment and final settlement will result in changes to revenues previously recorded upon shipment. Our concentrate sales are based on a provisional sales price containing an embedded derivative that is required to be separated from the host contract for accounting purposes. The host contract is the receivable from the sale of the concentrates at the forward price at the time of the sale. The embedded derivative, which does not qualify for hedge accounting, is adjusted to market through earnings each period prior to final settlement. Metals prices can and often do fluctuate widely and are affected by numerous factors beyond our control (seeItem 1A – Risk Factors –A substantial or extended decline in metals prices would have a material adverse effect on us in our annual report filed on Form 10-K for the year ended December 31, 2008 for more information). At March 31, 2009, metals contained in concentrates and exposed to future price changes totaled 1,044,645 ounces of silver, 4,969 ounces of gold, 8,755 tons of zinc, and 3,392 tons of lead.
| |
Item 4. | Controls and Procedures |
An evaluation was performed under the supervision and with the participation of our management, including the Chief Executive Officer (“CEO”) and Chief Financial Officer (“CFO”), of the effectiveness of the design and operation of our disclosure controls and procedures as required by Securities Exchange Act Rules 13a-15(e) and 15d-15(e) as of the end of the period covered by this report. Based on that evaluation, our CEO and CFO concluded that our disclosure controls and procedures were effective as of March 31, 2009, in ensuring them that material information required to be disclosed in this report has been properly recorded, processed, summarized and reported in a timely manner. There were no changes in our internal control over financial reporting during the quarter ended March 31, 2009, that have materially affected, or are reasonably likely to materially affect, our internal control over financial reporting.
Internal control systems, no matter how well designed and operated, have inherent limitations. Therefore, even a system which is determined to be effective cannot provide absolute assurance that all control issues have been detected or prevented. Our systems of internal controls are designed to provide reasonable assurance with respect to financial statement preparation and presentation.
-41-
Part II - Other Information
Hecla Mining Company and Subsidiaries
For information concerning legal proceedings, refer toNote 6 ofNotes to Condensed Consolidated Financial Statements (Unaudited), which is incorporated by reference into this Item 1.
Item 1A – Risk Factors of the Company’s annual report filed on Form 10-K for the year ended December 31, 2008 sets forth information relating to important risks and uncertainties that could materially adversely affect the Company’s business, financial condition or operating results. Those risk factors continue to be relevant to an understanding of the Company’s business, financial condition and operating results. There are no material changes to the Risk Factors set forth inItem 1A in our annual report on Form 10-K for the year ended December 31, 2008.
| |
Item 2. | Unregistered Shares of Equity Securities and Use of Proceeds |
As previously disclosed in our Current Report on Form 8-K filed on February 12, 2009, on February 10, 2009, we issued 42,621unregistered shares of our 12% Convertible Preferred Stock to our various lenders listed in the Fourth Amendment to our Credit Agreement filed as exhibit 10.5 to our Current Report on Form 8-K filed on February 4, 2009 (File No. 1-8491). The shares were not registered under the Securities Act of 1933 in reliance on Section 4(2) of such Act and Regulation D thereunder and issued as a fee to the lenders for the deferral of principal payments under the Fourth Amendment.
See the exhibit index to this Form 10-Q for the list of exhibits.
Items 3, 4 and 5 of Part II are not applicable and are omitted from this report.
-42-
Hecla Mining Company and Subsidiaries
SIGNATURES
Pursuant to the requirements of the Securities Exchange Act of 1934, the registrant has duly caused this report to be signed on its behalf by the undersigned thereunto duly authorized.
| | |
| HECLA MINING COMPANY | |
| (Registrant) | |
| |
Date: April 28, 2009 | /s/ Phillips S. Baker, Jr. | |
| Phillips S. Baker, Jr., President,
Chief Executive Officer and Director | |
| | |
Date: April 28, 2009 | /s/ James A. Sabala | |
| James A. Sabala, Senior Vice President and
Chief Financial Officer | |
-43-
Hecla Mining Company and Wholly Owned Subsidiaries
Form 10-Q – March 31, 2009
Index to Exhibits
| | | |
| 3.1 | | Certificate of Incorporation of the Registrant as amended to date. Filed as exhibit 3.1 to Registrant’s Form 10-K for the year ended December 31, 2008 and incorporated herein by reference. |
| | | |
| 3.2 | | Bylaws of the Registrant as amended to date. Filed as exhibit 3.1 to Registrant’s Current Report on Form 8-K filed on December 6, 2007 (File No. 1-8491), and incorporated herein by reference. |
| | | |
| 3.3 | | Form of Certificate of Designations for 12% Convertible Preferred Stock. Filed as exhibit 3.1 to Registrant’s Current Report on Form 8-K filed on February 4, 2009 (File No. 1-8491), and incorporated herein by reference. |
| | | |
| 4.1(a) | | Form of Series 1 Common Stock Purchase Warrant. Filed as exhibit 4.1 to Registrant’s Current Report on Form 8-K filed on December 11, 2008 (File No. 1-8491), and incorporated herein by reference. |
| | | |
| 4.1(b) | | Form of Series 2 Common Stock Purchase Warrant. Filed as exhibit 4.2 to Registrant’s Current Report on Form 8-K filed on December 11, 2008 (File No. 1-8491), and incorporated herein by reference. |
| | | |
| 4.1(c) | | Form of Series 3 Common Stock Purchase Warrant. Filed as exhibit 4.1 to Registrant’s Current Report on Form 8-K filed on February 9, 2009 (File No. 1-8491), and incorporated herein by reference. |
| | | |
| 4.2(a) | | Certificate of Designations of 6.5% Mandatory Convertible Preferred Stock of the Registrant. Filed as part of exhibit 3.1 hereto and incorporated herein by reference. |
| | | |
| 4.2(b) | | Form of 6.5% Mandatory Convertible Preferred Stock Certificate. Filed as exhibit 4.1 to Registrant’s Current Report on Form 8-K filed December 14, 2007 (File No. 1-8491), and incorporated herein by reference. |
| | | |
| 4.2(c) | | Certificate of Designations, Preferences and Rights of Series A Junior Participating Preferred Stock of the Registrant. Filed as exhibit 4.1(a) to Registrant’s Quarterly Report on Form 10-Q for the quarter ended September 30, 2006 (File No. 1-8491), and incorporated herein by reference. |
| | | |
| 4.2(d) | | Certificate of Designations, Preferences and Rights of Series B Cumulative Convertible Preferred Stock of the Registrant. Filed as part of Exhibit 3.1 hereto and incorporated herein by reference. |
| | | |
| 4.2(e) | | Certificate of Designations, Preferences and Rights of 12% Convertible Preferred Stock of the Registrant. Filed as part of Exhibit 3.1 hereto and incorporated herein by reference. |
-44-
| | | |
| 10.1(a) | | Third Amendment to Credit Agreement, effective December 30, 2008, by and among Hecla Mining Company, The Bank of Nova Scotia, as the Administrative Agent for the Lenders, and various Lenders. Filed as exhibit 10.4 to Registrant’s Current Report on Form 8-K filed on January 2, 2009 (File No. 1-8491), and incorporated herein by reference. |
| | | |
| 10.1(b) | | Fourth Amendment to Credit Agreement, effective February 3, 2009, by and among Hecla Mining Company, The Bank of Nova Scotia, as the Administrative Agent for the Lenders, and various Lenders. Filed as exhibit 10.5 to Registrant’s Current Report on Form 8-K filed on February 4, 2009 (File No. 1-8491), and incorporated herein by reference. (Exhibit A to Fourth Amendment to Credit Agreement, effective February 3, 2009, is filed as Exhibit 3.1 to Registrant’s Form 10-K for the year ended December 31, 2008 and incorporated herein by reference). |
| | | |
| 10.2 | | Asset Purchase Agreement with Minera William S.A. de C.V., Minera Hecla S.A. de C.V. and BLM Minera Mexicana, S.A. de C.V., dated March 6, 2009. Filed as exhibit 10.1 to Registrant’s Current Report on Form 8-K filed on March 11, 2009 (File No. 1-8491), and incorporated herein by reference. |
| | | |
| 31.1 | | Certification pursuant to Section 302 of the Sarbanes-Oxley Act of 2002. * |
| | | |
| 31.2 | | Certification pursuant to Section 302 of the Sarbanes-Oxley Act of 2002. * |
| | | |
| 32.1 | | Certification pursuant to Section 906 of the Sarbanes-Oxley Act of 2002. * |
| | | |
| 32.2 | | Certification pursuant to Section 906 of the Sarbanes-Oxley Act of 2002. * |
-45-