Our three defined benefit pension plans (the “DB plans”) provide a significant benefit to our employees, but represent a liability to us. The liability recorded for the underfunded status of our plans was $4.8 million and $6.0 million as of September 30, 2022 and December 31, 2021, respectively. During May 2022, we contributed an aggregate of $5.6 million in shares of our common stock to two of our DB plans. We contributed an additional $4.2 million in shares of our common stock to one of our DB plans in October 2022 and do not expect to make additional contributions to our DB plans in 2022, but may choose to do so. While the economic variables which will determine future funding requirements are uncertain, we expect contributions to continue to be required in future years under the provisions of two DB plans, and we periodically examine the plans for affordability and competitiveness. See
of
Notes to Consolidated Financial Statements
in our 2021 Form
10-K
for more information.
During the third quarter and first nine months of 2022, an income and mining tax benefit of approximately $9.5 million and $3.6 million resulted in an effective tax rate of 29% and 10% for the respective periods. This compares to an income and mining tax benefit of $4.5 million and $3.9 million for the third quarter and first nine months of 2021, or an effective tax rate of 82.2% and (20.3)% for the respective periods. The comparability of our income and mining tax (provision) benefit and effective tax rate for the reported periods was impacted by multiple factors, primarily: (i) mining taxes; (ii) variations in our income before income taxes; (iii) geographic distribution of that income; (iv) foreign exchange rates including
non-recognition
of foreign exchange gains and losses; (v) percentage depletion; and (vi) the
non-recognition
of tax assets. The effective tax rate will fluctuate, sometimes significantly, period to period. Beginning with the period ended March 31, 2022 and including the period September 30, 2022, we used the annual effective tax rate method to calculate the quarterly tax provision, a change from the discrete method used for the period ended September 30, 2021, due to reversal of valuation allowance in the fourth quarter of 2021.
Each reporting period we assess our deferred tax balances based on a review of long-range forecasts and quarterly activity. A valuation allowance is provided for deferred tax assets for which it is more likely than not the related tax benefits will not be realized. We analyze our deferred tax assets and, if it is determined that we will not realize all or a portion of our deferred tax assets, we will record or increase a valuation allowance. Conversely, if it is determined we will ultimately more likely than not be able to realize all or a portion of the related benefits for which a valuation allowance has been provided, all or a portion of the related valuation allowance will be reduced. There are a number of factors that impact our ability to realize our deferred tax assets. Valuation allowances are provided on deferred tax assets in Nevada, Mexico, and certain Canadian jurisdictions. For additional information, please see
in our 2021 Form
10-K.
Reconciliation of Total Cost of Sales to Cash Cost, Before
By-product
Credits and Cash Cost, After
By-product
Credits
(non-GAAP)
and
All-In
Sustaining Cost, Before
By-product
Credits and
All-In
Sustaining Cost, After
By-product
Credits
(non-GAAP)
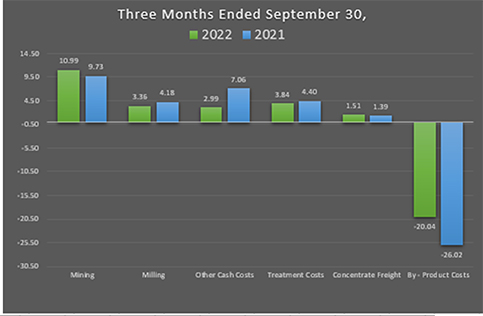
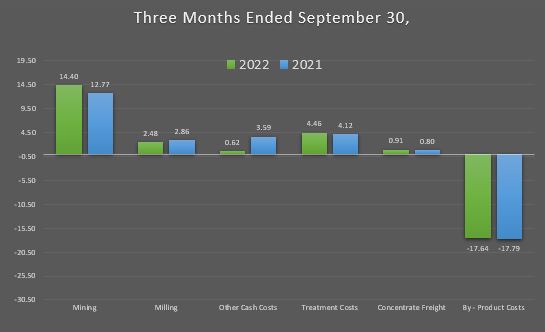
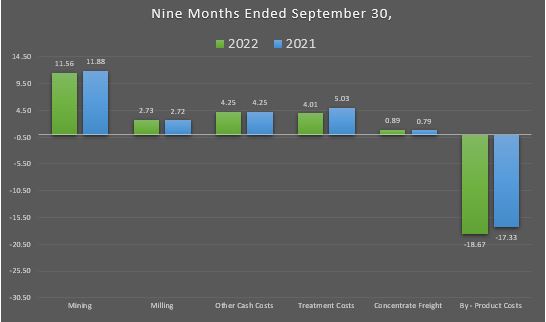
The tables below present reconciliations between the most comparable GAAP measure of total cost of sales to the
non-GAAP
measures of (i) Cash Cost, Before
By-product
Credits, (ii) Cash Cost, After
By-product
Credits, (iii) AISC, Before
By-product
Credits and (iv) AISC, After
By-product
Credits for our operations and for the Company for the three- and nine-month periods ended September 30, 2022 and 2021.
Cash Cost, After
By-product
Credits, per Ounce and AISC, After
By-product
Credits, per Ounce are measures developed by precious metals companies (including the Silver Institute and the World Gold Council) in an effort to provide a uniform standard for comparison purposes. There can be no assurance, however, that these
non-GAAP
measures as we report them are the same as those reported by other mining companies.
Cash Cost, After
By-product
Credits, per Ounce is an important operating statistic that we utilize to measure each mine’s operating performance. We use AISC, After
By-product
Credits, per Ounce as a measure of our mines’ net cash flow after costs for exploration,
pre-development,
reclamation, and sustaining capital. This is similar to the Cash Cost, After
By-product
Credits, per Ounce
non-GAAP
measure we report, but also includes
on-site
exploration, reclamation, and sustaining capital costs. Current GAAP measures used in the mining industry, such as cost of goods sold, do not capture all the expenditures incurred to discover, develop and sustain silver and gold production. Cash Cost, After
By-product
Credits, per