UNITED STATES
SECURITIES AND EXCHANGE COMMISSION
Washington, D.C. 20549
FORM N-CSR
CERTIFIED SHAREHOLDER REPORT OF REGISTERED
MANAGEMENT INVESTMENT COMPANIES
Investment Company Act file number 811-3737
Fidelity Advisor Series IV
(Exact name of registrant as specified in charter)
245 Summer St., Boston, Massachusetts 02210
(Address of principal executive offices) (Zip code)
Scott C. Goebel, Secretary
245 Summer St.
Boston, Massachusetts 02210
(Name and address of agent for service)
Registrant's telephone number, including area code: 617-563-7000
Date of fiscal year end: | November 30 |
| |
Date of reporting period: | November 30, 2013 |
Item 1. Reports to Stockholders
Fidelity ®
Limited Term
Government Fund
(formerly Fidelity Institutional
Short-Intermediate Government
Fund)
Annual Report
November 30, 2013
(Fidelity Cover Art)
Contents
Note to shareholders | (Click Here) | Important information about the fund. |
Performance | (Click Here) | How the fund has done over time. |
Management's Discussion of Fund Performance | (Click Here) | The Portfolio Managers' review of fund performance and strategy. |
Shareholder Expense Example | (Click Here) | An example of shareholder expenses. |
Investment Changes | (Click Here) | A summary of major shifts in the fund's investments over the past six months. |
Investments | (Click Here) | A complete list of the fund's investments with their market values. |
Financial Statements | (Click Here) | Statements of assets and liabilities, operations, and changes in net assets, as well as financial highlights. |
Notes | (Click Here) | Notes to the financial statements. |
Report of Independent Registered Public Accounting Firm | (Click Here) | |
Trustees and Officers | (Click Here) | |
Distributions | (Click Here) | |
Board Approval of Investment Advisory Contracts and Management Fees | (Click Here) | |
To view a fund's proxy voting guidelines and proxy voting record for the 12-month period ended June 30, visit http://www.fidelity.com/proxyvotingresults or visit the Securities and Exchange Commission's (SEC) web site at http://www.sec.gov. You may also call 1-800-544-8544 to request a free copy of the proxy voting guidelines.
Standard & Poor's, S&P and S&P 500 are registered service marks of The McGraw-Hill Companies, Inc. and have been licensed for use by Fidelity Distributors Corporation.
Other third-party marks appearing herein are the property of their respective owners.
All other marks appearing herein are registered or unregistered trademarks or service marks of FMR LLC or an affiliated company. © 2014 FMR LLC. All rights reserved.
Annual Report
This report and the financial statements contained herein are submitted for the general information of the shareholders of the fund. This report is not authorized for distribution to prospective investors in the fund unless preceded or accompanied by an effective prospectus.
A fund files its complete schedule of portfolio holdings with the SEC for the first and third quarters of each fiscal year on Form N-Q. Forms N-Q are available on the SEC's web site at http://www.sec.gov. A fund's Forms N-Q may be reviewed and copied at the SEC's Public Reference Room in Washington, DC. Information regarding the operation of the SEC's Public Reference Room may be obtained by calling 1-800-SEC-0330. For a complete list of a fund's portfolio holdings, view the most recent holdings listing, semiannual report, or annual report on Fidelity's web site at http://www.fidelity.com, http://www.advisor.fidelity.com, or http://www.401k.com, as applicable.
NOT FDIC INSURED • MAY LOSE VALUE • NO BANK GUARANTEE
Neither the fund nor Fidelity Distributors Corporation is a bank.
Annual Report
Note to shareholders
On May 15, 2013, the Board of Trustees approved a proposal to rename Fidelity® Institutional Short-Intermediate Government Fund to Fidelity® Limited Term Government Fund to better reflect the fund's position within the Morningstar® Short-Term Government Category. This change was effective on August 1, 2013. In connection with the name change, the Board also approved a proposal allowing the fund to adopt standard retail investment minimums, as well as standard retail policies related to the purchase and sale of shares, exchange privileges, small balance fees and directed dividend options. These changes were effective on July 1, 2013.
Annual Report
Average annual total return reflects the change in the value of an investment, assuming reinvestment of the fund's distributions from dividend income and capital gains (the profits earned upon the sale of securities that have grown in value, if any) and assuming a constant rate of performance each year. The $10,000 table and the fund's returns do not reflect the deduction of taxes that a shareholder would pay on fund distributions or the redemption of fund shares. During periods of reimbursement by Fidelity, a fund's total return will be greater than it would be had the reimbursement not occurred. How a fund did yesterday is no guarantee of how it will do tomorrow.
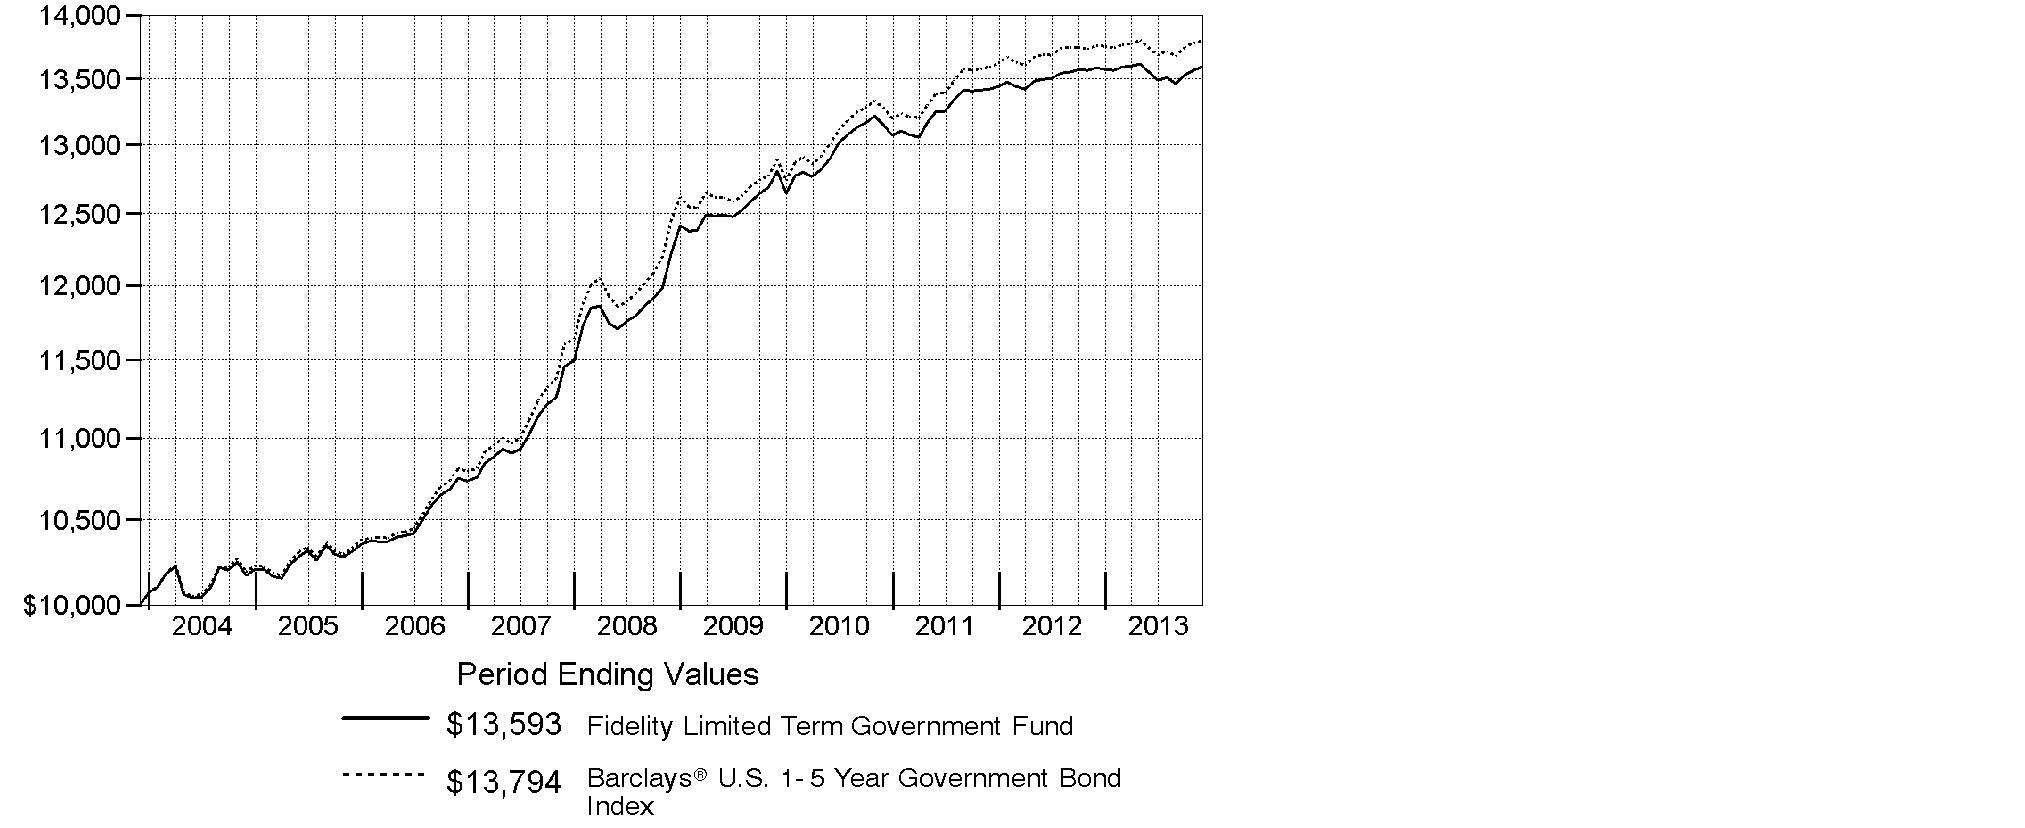
Average Annual Total Returns
Periods ended November 30, 2013 | Past 1
year | Past 5
years | Past 10
years |
Fidelity Limited Term Government Fund | 0.07% | 2.15% | 3.12% |
$10,000 Over 10 Years
Let's say hypothetically that $10,000 was invested in Fidelity Limited Term Government Fund on November 30, 2003. The chart shows how the value of your investment would have changed, and also shows how the Barclays® U.S. 1-5 Year Government Bond Index performed over the same period.
Annual Report
Market Recap: The prospect of tighter monetary policy resulted in U.S. taxable investment-grade bonds finishing in the red for the 12 months ending November 30, 2013, with the Barclays® U.S. Aggregate Bond Index returning -1.61% for the period. Most of the damage occurred from May through August, as interest rates spiked higher amid signals from the U.S. Federal Reserve that it could begin tapering its stimulative bond-buying programs prior to year end, prompting waves of investor outflows. Surprisingly strong global economic data also tempered demand for bonds. U.S. taxable investment-grade bonds staged a bit of rebound in September and October because the Fed refrained from tapering. But the period ended on a weak note, when a better-than-expected employment report revived the specter of tapering. Among sectors that compose the index, U.S. Treasuries and mortgage-backed securities - widely viewed as most vulnerable to a cessation of government-bond-buying - returned -2.28% and -0.81%, respectively, while government-agency securities returned -0.98%. Investment-grade credit also lost ground, returning -1.85%, due to rising interest rates and investors' intermittent aversion to riskier assets. Thanks largely to their higher yields, commercial mortgage-backed securities fared best, advancing 0.87%.
Comments from Franco Castagliuolo and William Irving, Lead Portfolio Manager and Co-Portfolio Manager, respectively of Fidelity® Limited Term Government Fund: For the year, the fund gained 0.07%, while the Barclays® U.S. 1-5 Year Government Bond Index returned 0.27%. We kept the fund's risk profile close to that of the Barclays benchmark by maintaining similar interest rate sensitivity. Doing so meant the fund's relative performance didn't suffer as rates oscillated. Overweighting mortgage securities that offered high credit quality, a yield advantage over U.S. Treasuries and insulation from prepayment risk was beneficial. In this category, our larger-than-benchmark stake in reverse-mortgage securities was a plus. Likewise, larger-than-index exposure to premium-coupon Ginnie Mae residential mortgage-backed pass-through securities, multifamily Freddie Mac K Certificates and 15-year mortgage securities provided a boost. Our sector selection was mixed. Although larger-than-index exposure to mortgage securities was a plus, underexposure to agency securities detracted, as this sector outpaced the index. We were rewarded for our stake in securities guaranteed by the National Credit Union Administration and to add securities backed by the U.S. Agency for International Development.
The views expressed above reflect those of the portfolio manager(s) only through the end of the period as stated on the cover of this report and do not necessarily represent the views of Fidelity or any other person in the Fidelity organization. Any such views are subject to change at any time based upon market or other conditions and Fidelity disclaims any responsibility to update such views. These views may not be relied on as investment advice and, because investment decisions for a Fidelity fund are based on numerous factors, may not be relied on as an indication of trading intent on behalf of any Fidelity fund.
Annual Report
Shareholder Expense Example
As a shareholder of the Fund, you incur two types of costs: (1) transaction costs, and (2) ongoing costs, including management fees and other Fund expenses. This Example is intended to help you understand your ongoing costs (in dollars) of investing in the Fund and to compare these costs with the ongoing costs of investing in other mutual funds.
The Example is based on an investment of $1,000 invested at the beginning of the period and held for the entire period (June 1, 2013 to November 30, 2013).
Actual Expenses
The first line of the accompanying table provides information about actual account values and actual expenses. You may use the information in this line, together with the amount you invested, to estimate the expenses that you paid over the period. Simply divide your account value by $1,000.00 (for example, an $8,600 account value divided by $1,000.00 = 8.6), then multiply the result by the number in the first line under the heading entitled "Expenses Paid During Period" to estimate the expenses you paid on your account during this period. A small balance maintenance fee of $12.00 that is charged once a year may apply for certain accounts with a value of less than $2,000. This fee is not included in the table below. If it was, the estimate of expenses you paid during the period would be higher, and your ending account value lower, by this amount.
Hypothetical Example for Comparison Purposes
The second line of the accompanying table provides information about hypothetical account values and hypothetical expenses based on the Fund's actual expense ratio and an assumed rate of return of 5% per year before expenses, which is not the Fund's actual return. The hypothetical account values and expenses may not be used to estimate the actual ending account balance or expenses you paid for the period. You may use this information to compare the ongoing costs of investing in the Fund and other funds. To do so, compare this 5% hypothetical example with the 5% hypothetical examples that appear in the shareholder reports of the other funds. A small balance maintenance fee of $12.00 that is charged once a year may apply for certain accounts with a value of less than $2,000. This fee is not included in the table below. If it was, the estimate of expenses you paid during the period would be higher, and your ending account value lower, by this amount.
Please note that the expenses shown in the table are meant to highlight your ongoing costs only and do not reflect any transaction costs. Therefore, the second line of the table is useful in comparing ongoing costs only, and will not help you determine the relative total costs of owning different funds.
Annual Report
| Annualized Expense RatioB | Beginning
Account Value
June 1, 2013 | Ending
Account Value
November 30, 2013 | Expenses Paid
During Period*
June 1, 2013 to
November 30, 2013 |
Actual | .45% | $ 1,000.00 | $ 1,003.00 | $ 2.26 |
HypotheticalA | | $ 1,000.00 | $ 1,022.81 | $ 2.28 |
A 5% return per year before expenses
B Annualized expense ratio reflects expenses net of applicable fee waivers.
* Expenses are equal to the Fund's annualized expense ratio, multiplied by the average account value over the period, multiplied by 183/365 (to reflect the one-half year period).
Annual Report
Investment Changes (Unaudited)
Coupon Distribution as of November 30, 2013 |
| % of fund's investments | % of fund's investments
6 months ago |
0.01 - 0.99% | 51.5 | 54.9 |
1 - 1.99% | 17.6 | 17.1 |
2 - 2.99% | 6.6 | 7.6 |
3 - 3.99% | 4.5 | 3.3 |
4 - 4.99% | 7.2 | 6.6 |
5 - 5.99% | 8.1 | 5.3 |
6% and above | 3.8 | 3.9 |
Coupon distribution shows the range of stated interest rates on the fund's investments, excluding short-term investments. |
Weighted Average Maturity as of November 30, 2013 |
| | 6 months ago |
Years | 3.4 | 3.2 |
This is a weighted average of all the maturities of the securities held in a fund. Weighted Average Maturity (WAM) can be used as a measure of sensitivity to interest rate changes and market changes. Generally, the longer the maturity, the greater the sensitivity to such changes. WAM is based on the dollar-weighted average length of time until principal payments must be paid. Depending on the types of securities held in a fund, certain maturity shortening devices (e.g., demand features, interest rate resets, and call options) may be taken into account when calculating the WAM. |
Duration as of November 30, 2013 |
| | 6 months ago |
Years | 2.5 | 2.6 |
Duration is a measure of a security's price sensitivity to changes in interest rates. Duration differs from maturity in that it considers a security's interest payments in addition to the amount of time until the security reaches maturity, and also takes into account certain maturity shortening features (e.g., demand features, interest rate resets, and call options) when applicable. Securities with longer durations generally tend to be more sensitive to interest rate changes than securities with shorter durations. A fund with a longer average duration generally can be expected to be more sensitive to interest rate changes than a fund with a shorter average duration. |
Asset Allocation (% of fund's net assets) |
As of November 30, 2013* | As of May 31, 2013** |
 | Mortgage
Securities 13.4% | | | Mortgage
Securities 12.5% | |
 | CMOs and
Other Mortgage
Related Securities 17.5% | | | CMOs and
Other Mortgage
Related Securities 13.5% | |
 | U.S. Treasury
Obligations 62.3% | | | U.S. Treasury
Obligations 62.9% | |
 | U.S. Government
Agency Obligations † 5.4% | | | U.S. Government
Agency Obligations † 10.8% | |
 | Foreign Government
& Government
Agency Obligations 0.9% | |  | Foreign Government
& Government
Agency Obligations 0.0% | |
 | Short-Term
Investments and
Net Other Assets
(Liabilities) 0.5% | | | Short-Term
Investments and
Net Other Assets
(Liabilities) 0.3% | |
* Foreign investments | 0.9% | | ** Foreign investments | 0.0% | |

* Futures and Swaps | 3.4% | | ** Futures and Swaps | 4.1% | |
† Includes NCUA Guaranteed Notes |
Annual Report
Investments November 30, 2013
Showing Percentage of Net Assets
U.S. Government and Government Agency Obligations - 67.7% |
| Principal Amount | | Value |
U.S. Government Agency Obligations - 0.9% |
Federal Home Loan Bank 1% 6/21/17 | | $ 1,410,000 | | $ 1,416,242 |
Tennessee Valley Authority 1.75% 10/15/18 | | 2,144,000 | | 2,158,232 |
TOTAL U.S. GOVERNMENT AGENCY OBLIGATIONS | | 3,574,474 |
U.S. Treasury Obligations - 62.3% |
U.S. Treasury Notes: | | | | |
0.25% 7/15/15 | | 22,026,000 | | 22,031,154 |
0.25% 10/15/15 | | 10,475,000 | | 10,471,732 |
0.25% 10/31/15 | | 6,638,000 | | 6,635,663 |
0.25% 4/15/16 | | 598,000 | | 596,318 |
0.25% 5/15/16 (a) | | 22,000,000 | | 21,924,364 |
0.375% 1/15/16 | | 5,000,000 | | 5,006,640 |
0.375% 2/15/16 (b) | | 25,000,000 | | 25,023,450 |
0.375% 3/15/16 | | 3,000,000 | | 3,001,875 |
0.625% 7/15/16 | | 7,763,000 | | 7,799,393 |
0.625% 8/15/16 | | 17,377,000 | | 17,448,958 |
0.625% 10/15/16 | | 7,000,000 | | 7,020,237 |
0.625% 11/15/16 | | 8,407,000 | | 8,427,362 |
0.625% 4/30/18 | | 3,690,000 | | 3,606,687 |
0.75% 6/30/17 | | 5,245,000 | | 5,233,524 |
0.875% 11/30/16 | | 5,318,000 | | 5,364,947 |
0.875% 1/31/17 | | 812,000 | | 817,837 |
0.875% 4/30/17 | | 14,887,000 | | 14,952,131 |
0.875% 1/31/18 | | 7,994,000 | | 7,934,669 |
1% 9/30/16 | | 19,685,000 | | 19,954,133 |
1.25% 10/31/15 | | 5,500,000 | | 5,602,482 |
1.25% 10/31/18 | | 13,806,000 | | 13,748,829 |
1.25% 11/30/18 | | 4,500,000 | | 4,474,688 |
1.375% 11/30/15 | | 11,293,000 | | 11,536,500 |
1.375% 9/30/18 | | 553,000 | | 554,728 |
1.75% 7/31/15 | | 3,788,000 | | 3,882,848 |
3.5% 2/15/18 | | 8,513,000 | | 9,362,308 |
TOTAL U.S. TREASURY OBLIGATIONS | | 242,413,457 |
Other Government Related - 4.5% |
National Credit Union Administration Guaranteed Notes: | | | | |
Series 2010-A1 Class A, 0.5185% 12/7/20 (NCUA Guaranteed) (c) | | 617,485 | | 619,179 |
U.S. Government and Government Agency Obligations - continued |
| Principal Amount | | Value |
Other Government Related - continued |
National Credit Union Administration Guaranteed Notes: - continued | | | | |
Series 2010-R2 Class 1A, 0.5385% 11/6/17 (NCUA Guaranteed) (c) | | $ 3,976,551 | | $ 3,984,783 |
Series 2011-C1 Class 1A, 0.5002% 2/28/20 (NCUA Guaranteed) (c) | | 1,019,402 | | 1,019,402 |
Series 2011-R1 Class 1A, 0.6243% 1/8/20 (NCUA Guaranteed) (c) | | 1,154,010 | | 1,160,276 |
Series 2011-R4 Class 1A, 0.5485% 3/6/20 (NCUA Guaranteed) (c) | | 515,859 | | 516,927 |
National Credit Union Administration Guaranteed Notes Master Trust: | | | | |
1.4% 6/12/15 (NCUA Guaranteed) | | 640,000 | | 650,829 |
2.35% 6/12/17 (NCUA Guaranteed) | | 9,140,000 | | 9,578,720 |
TOTAL OTHER GOVERNMENT RELATED | | 17,530,116 |
TOTAL U.S. GOVERNMENT AND GOVERNMENT AGENCY OBLIGATIONS (Cost $262,231,815) | 263,518,047 |
U.S. Government Agency - Mortgage Securities - 13.4% |
|
Fannie Mae - 2.8% |
1.89% 2/1/33 (c) | | 12,096 | | 12,572 |
1.91% 12/1/34 (c) | | 13,858 | | 14,436 |
1.949% 7/1/35 (c) | | 5,037 | | 5,247 |
1.962% 10/1/33 (c) | | 14,813 | | 15,403 |
1.965% 3/1/35 (c) | | 12,653 | | 13,208 |
2.011% 4/1/33 (c) | | 109,016 | | 112,753 |
2.048% 10/1/35 (c) | | 8,457 | | 8,875 |
2.05% 3/1/35 (c) | | 2,075 | | 2,139 |
2.23% 7/1/34 (c) | | 7,662 | | 7,978 |
2.303% 6/1/36 (c) | | 9,612 | | 10,195 |
2.311% 7/1/36 (c) | | 47,176 | | 49,279 |
2.332% 3/1/35 (c) | | 7,583 | | 8,021 |
2.337% 9/1/36 (c) | | 30,886 | | 32,932 |
2.356% 1/1/35 (c) | | 57,674 | | 60,147 |
2.362% 2/1/36 (c) | | 21,879 | | 23,224 |
2.415% 11/1/33 (c) | | 30,700 | | 31,884 |
2.422% 10/1/33 (c) | | 12,120 | | 12,701 |
2.428% 12/1/32 (c) | | 61,146 | | 64,753 |
U.S. Government Agency - Mortgage Securities - continued |
| Principal Amount | | Value |
Fannie Mae - continued |
2.446% 3/1/33 (c) | | $ 28,924 | | $ 30,550 |
2.5% 10/1/22 | | 442,193 | | 453,456 |
2.542% 11/1/36 (c) | | 74,720 | | 79,670 |
2.573% 5/1/36 (c) | | 12,143 | | 12,947 |
2.604% 7/1/35 (c) | | 13,450 | | 14,295 |
2.614% 6/1/47 (c) | | 35,145 | | 36,953 |
2.641% 2/1/37 (c) | | 121,199 | | 129,229 |
2.724% 12/1/32 (c) | | 419,524 | | 445,869 |
2.769% 4/1/36 (c) | | 83,833 | | 89,387 |
2.918% 8/1/35 (c) | | 172,869 | | 184,321 |
3.175% 3/1/42 (c) | | 2,069,943 | | 2,175,519 |
5% 9/1/22 to 12/1/22 | | 1,590,777 | | 1,703,592 |
5.5% 10/1/20 to 11/1/34 | | 3,414,802 | | 3,708,050 |
6% 6/1/16 to 10/1/16 | | 10,757 | | 11,193 |
6.19% 3/1/37 (c) | | 5,384 | | 5,614 |
6.5% 6/1/15 to 8/1/36 | | 1,049,046 | | 1,175,684 |
7% 11/1/14 | | 3,978 | | 4,049 |
9% 5/1/15 to 2/1/20 | | 24,718 | | 26,905 |
9.5% 11/1/21 | | 130 | | 141 |
10.5% 8/1/20 | | 8,187 | | 9,434 |
11.5% 7/15/19 | | 7,350 | | 8,418 |
12% 4/1/15 | | 2,233 | | 2,322 |
12.5% 3/1/16 | | 143 | | 150 |
| | 10,793,495 |
Freddie Mac - 1.4% |
1.82% 3/1/35 (c) | | 32,750 | | 33,910 |
2.019% 2/1/37 (c) | | 11,609 | | 12,067 |
2.057% 7/1/35 (c) | | 298,972 | | 312,509 |
2.095% 8/1/37 (c) | | 18,969 | | 19,996 |
2.137% 5/1/37 (c) | | 21,034 | | 22,083 |
2.166% 6/1/33 (c) | | 68,634 | | 71,912 |
2.175% 6/1/37 (c) | | 6,519 | | 6,828 |
2.2% 3/1/37 (c) | | 7,788 | | 8,063 |
2.35% 7/1/35 (c) | | 36,820 | | 38,504 |
2.355% 4/1/34 (c) | | 279,035 | | 295,005 |
2.375% 5/1/37 (c) | | 17,095 | | 18,125 |
2.377% 10/1/35 (c) | | 54,361 | | 56,735 |
2.412% 10/1/36 (c) | | 86,098 | | 91,245 |
2.437% 6/1/37 (c) | | 60,964 | | 65,003 |
2.465% 5/1/37 (c) | | 222,322 | | 234,937 |
2.469% 11/1/35 (c) | | 56,337 | | 59,696 |
U.S. Government Agency - Mortgage Securities - continued |
| Principal Amount | | Value |
Freddie Mac - continued |
2.471% 5/1/37 (c) | | $ 120,183 | | $ 125,936 |
2.5% 9/1/22 to 6/1/23 | | 525,864 | | 531,118 |
2.548% 2/1/36 (c) | | 2,329 | | 2,482 |
2.595% 4/1/37 (c) | | 1,662 | | 1,772 |
2.673% 7/1/35 (c) | | 70,026 | | 74,665 |
2.699% 4/1/37 (c) | | 25,711 | | 27,414 |
2.795% 7/1/36 (c) | | 28,557 | | 30,448 |
3.036% 3/1/33 (c) | | 1,364 | | 1,446 |
3.064% 10/1/35 (c) | | 12,814 | | 13,663 |
3.089% 9/1/41 (c) | | 441,885 | | 463,468 |
5% 9/1/35 | | 2,804 | | 3,031 |
5.5% 11/1/18 to 7/1/35 | | 2,355,651 | | 2,531,503 |
6% 1/1/24 | | 274,787 | | 302,543 |
6.5% 12/1/21 | | 76,514 | | 84,902 |
9% 10/1/16 to 12/1/18 | | 7,390 | | 8,025 |
9.5% 2/1/17 to 12/1/22 | | 13,435 | | 15,010 |
10% 6/1/18 to 6/1/20 | | 3,623 | | 4,228 |
10.5% 9/1/20 | | 36 | | 41 |
12% 11/1/19 | | 242 | | 247 |
12.5% 11/1/14 to 6/1/19 | | 4,653 | | 5,048 |
| | 5,573,608 |
Ginnie Mae - 9.2% |
4% 10/15/24 to 9/15/25 | | 1,149,808 | | 1,225,264 |
4.3% 8/20/61 (e) | | 476,302 | | 517,721 |
4.5% 3/15/25 to 6/15/25 | | 988,438 | | 1,060,061 |
4.515% 3/20/62 (e) | | 1,779,883 | | 1,964,548 |
4.53% 10/20/62 (e) | | 488,358 | | 541,697 |
4.55% 5/20/62 (e) | | 3,713,203 | | 4,106,405 |
4.556% 12/20/61 (e) | | 1,937,540 | | 2,137,423 |
4.604% 3/20/62 (e) | | 1,079,458 | | 1,195,531 |
4.616% 1/20/62 (e) | | 636,228 | | 697,359 |
4.626% 3/20/62 (e) | | 796,507 | | 881,002 |
4.649% 2/20/62 (e) | | 311,204 | | 344,623 |
4.65% 3/20/62 (e) | | 1,019,384 | | 1,129,680 |
4.682% 2/20/62 (e) | | 412,102 | | 456,211 |
4.684% 1/20/62 (e) | | 2,530,404 | | 2,799,652 |
4.764% 2/20/61 (e) | | 646,256 | | 708,795 |
4.804% 3/20/61 (e) | | 1,316,949 | | 1,447,921 |
4.834% 3/20/61 (e) | | 2,377,611 | | 2,616,076 |
5.47% 8/20/59 (e) | | 284,234 | | 305,009 |
5.5% 11/15/35 | | 369,621 | | 407,073 |
U.S. Government Agency - Mortgage Securities - continued |
| Principal Amount | | Value |
Ginnie Mae - continued |
5.612% 4/20/58 (e) | | $ 612,127 | | $ 640,209 |
6% 6/15/36 to 9/15/40 | | 4,148,785 | | 4,618,242 |
6.5% 8/20/38 to 9/20/38 | | 5,147,802 | | 5,806,916 |
8% 12/15/23 | | 67,903 | | 79,968 |
8.5% 1/15/17 to 3/15/17 | | 12,802 | | 13,951 |
10.5% 1/15/16 to 1/15/18 | | 5,178 | | 5,709 |
| | 35,707,046 |
TOTAL U.S. GOVERNMENT AGENCY - MORTGAGE SECURITIES (Cost $51,574,566) | 52,074,149 |
Collateralized Mortgage Obligations - 14.1% |
|
U.S. Government Agency - 14.1% |
Fannie Mae: | | | | |
floater: | | | | |
Series 1994-42 Class FK, 2.05% 4/25/24 (c) | | 409,206 | | 412,595 |
Series 2001-38 Class QF, 1.146% 8/25/31 (c) | | 88,658 | | 90,465 |
Series 2002-49 Class FB, 0.7675% 11/18/31 (c) | | 91,689 | | 92,491 |
Series 2002-60 Class FV, 1.166% 4/25/32 (c) | | 20,670 | | 21,184 |
Series 2002-74 Class FV, 0.616% 11/25/32 (c) | | 692,731 | | 697,898 |
Series 2002-75 Class FA, 1.166% 11/25/32 (c) | | 42,342 | | 43,395 |
Series 2008-76 Class EF, 0.666% 9/25/23 (c) | | 189,778 | | 190,851 |
Series 2010-15 Class FJ, 1.096% 6/25/36 (c) | | 1,255,121 | | 1,286,922 |
Series 2010-86 Class FE, 0.616% 8/25/25 (c) | | 184,205 | | 185,632 |
pass-thru certificates Series 2012-127 Class DH, 4% 11/25/27 | | 559,415 | | 600,177 |
planned amortization class: | | | | |
Series 2002-16 Class PG, 6% 4/25/17 | | 87,805 | | 92,496 |
Series 2002-9 Class PC, 6% 3/25/17 | | 133,489 | | 140,794 |
Series 2003-74 Class PG, 4.5% 8/25/18 | | 169,610 | | 179,438 |
Series 2005-19 Class PA, 5.5% 7/25/34 | | 476,633 | | 518,809 |
Series 2005-27 Class NE, 5.5% 5/25/34 | | 481,576 | | 510,100 |
Series 2005-52 Class PB, 6.5% 12/25/34 | | 47,850 | | 49,859 |
Series 2005-64 Class PX, 5.5% 6/25/35 | | 457,419 | | 504,923 |
sequential payer: | | | | |
Series 2002-56 Class MC, 5.5% 9/25/17 | | 19,793 | | 20,730 |
Series 2002-57 Class BD, 5.5% 9/25/17 | | 22,221 | | 23,570 |
Series 2003-117 Class MD, 5% 12/25/23 | | 204,390 | | 223,223 |
Series 2004-52 Class KZ, 5.5% 7/25/34 | | 2,193,441 | | 2,414,974 |
Series 2004-95 Class AN, 5.5% 1/25/25 | | 68,254 | | 69,733 |
Series 2005-47 Class HK, 4.5% 6/25/20 | | 680,000 | | 718,484 |
Collateralized Mortgage Obligations - continued |
| Principal Amount | | Value |
U.S. Government Agency - continued |
Fannie Mae: - continued | | | | |
sequential payer: | | | | |
Series 2009-14 Class EB, 4.5% 3/25/24 | | $ 666,488 | | $ 706,188 |
Series 2010-139 Class NI, 4.5% 2/25/40 (d) | | 732,378 | | 124,484 |
Series 2010-39 Class FG, 1.086% 3/25/36 (c) | | 775,651 | | 795,184 |
Series 2011-67 Class AI, 4% 7/25/26 (d) | | 203,050 | | 23,479 |
Series 2013-40 Class PV, 2% 1/25/26 | | 695,874 | | 708,618 |
Freddie Mac: | | | | |
floater: | | | | |
Series 2448 Class FT, 1.1677% 3/15/32 (c) | | 116,076 | | 118,765 |
Series 2526 Class FC, 0.5677% 11/15/32 (c) | | 118,975 | | 119,676 |
Series 2530 Class FE, 0.7677% 2/15/32 (c) | | 55,101 | | 55,873 |
Series 2630 Class FL, 0.6677% 6/15/18 (c) | | 6,505 | | 6,532 |
Series 2711 Class FC, 1.0677% 2/15/33 (c) | | 456,753 | | 464,293 |
floater planned amortization class Series 2770 Class FH, 0.5677% 3/15/34 (c) | | 368,523 | | 370,972 |
planned amortization class: | | | | |
Series 2006-3245 Class ME, 5.5% 6/15/35 | | 371,714 | | 383,623 |
Series 2356 Class GD, 6% 9/15/16 | | 21,282 | | 22,341 |
Series 2363 Class PF, 6% 9/15/16 | | 25,295 | | 26,500 |
Series 2376 Class JE, 5.5% 11/15/16 | | 21,071 | | 22,097 |
Series 2381 Class OG, 5.5% 11/15/16 | | 12,156 | | 12,692 |
Series 2425 Class JH, 6% 3/15/17 | | 29,172 | | 30,822 |
Series 2695 Class DG, 4% 10/15/18 | | 476,860 | | 501,347 |
Series 3415 Class PC, 5% 12/15/37 | | 179,809 | | 193,620 |
Series 3763 Class QA, 4% 4/15/34 | | 380,511 | | 400,508 |
planned amortization class sequential payer Series 2005-2963 Class VB, 5% 11/15/34 | | 480,000 | | 515,849 |
sequential payer: | | | | |
Series 1929 Class EZ, 7.5% 2/17/27 | | 433,392 | | 494,806 |
Series 2004-2802 Class ZG, 5.5% 5/15/34 | | 976,499 | | 1,105,716 |
Series 2004-2862 Class NE, 5% 9/15/24 | | 3,729,023 | | 4,049,457 |
Series 2145 Class MZ, 6.5% 4/15/29 | | 544,709 | | 613,733 |
Series 2357 Class ZB, 6.5% 9/15/31 | | 279,746 | | 316,592 |
Series 2582 Class CG, 4% 11/15/17 | | 16,208 | | 16,210 |
Series 3013 Class VJ, 5% 1/15/14 | | 30,977 | | 31,029 |
Series 3578 Class B, 4.5% 9/15/24 | | 700,000 | | 743,733 |
Series 3659 Class EJ 3% 6/15/18 | | 369,132 | | 379,737 |
Ginnie Mae guaranteed REMIC pass-thru certificates: | | | | |
floater: | | | | |
Series 2007-59 Class FC, 0.6725% 7/20/37 (c) | | 220,371 | | 221,743 |
Series 2008-2 Class FD, 0.6525% 1/20/38 (c) | | 56,093 | | 56,417 |
Collateralized Mortgage Obligations - continued |
| | Principal Amount | | Value |
U.S. Government Agency - continued |
Ginnie Mae guaranteed REMIC pass-thru certificates: - continued | | | | |
floater: | | | | |
Series 2008-73 Class FA, 1.0325% 8/20/38 (c) | | $ 400,177 | | $ 407,395 |
Series 2008-83 Class FB, 1.0725% 9/20/38 (c) | | 414,949 | | 422,715 |
Series 2009-108 Class CF, 0.7755% 11/16/39 (c) | | 256,004 | | 258,439 |
Series 2009-116 Class KF, 0.7055% 12/16/39 (c) | | 222,695 | | 224,354 |
Series 2010-9 Class FA, 0.6955% 1/16/40 (c) | | 353,805 | | 356,318 |
Series 2010-H17 Class FA, 0.4986% 7/20/60 (c)(e) | | 1,262,087 | | 1,244,350 |
Series 2010-H18 Class AF, 0.478% 9/20/60 (c)(e) | | 1,345,384 | | 1,327,238 |
Series 2010-H19 Class FG, 0.478% 8/20/60 (c)(e) | | 1,718,478 | | 1,695,763 |
Series 2010-H27 Series FA, 0.558% 12/20/60 (c)(e) | | 467,290 | | 462,566 |
Series 2011-H05 Class FA, 0.678% 12/20/60 (c)(e) | | 844,926 | | 841,345 |
Series 2011-H07 Class FA, 0.678% 2/20/61 (c)(e) | | 1,436,489 | | 1,430,504 |
Series 2011-H12 Class FA, 0.668% 2/20/61 (c)(e) | | 1,794,808 | | 1,786,507 |
Series 2011-H13 Class FA, 0.678% 4/20/61 (c)(e) | | 728,461 | | 725,457 |
Series 2011-H14: | | | | |
Class FB, 0.678% 5/20/61 (c)(e) | | 815,779 | | 812,006 |
Class FC, 0.678% 5/20/61 (c)(e) | | 765,462 | | 762,115 |
Series 2011-H17 Class FA, 0.708% 6/20/61 (c)(e) | | 1,001,197 | | 998,404 |
Series 2011-H21 Class FA, 0.778% 10/20/61 (c)(e) | | 1,039,363 | | 1,039,363 |
Series 2012-H01 Class FA, 0.878% 11/20/61 (c)(e) | | 881,738 | | 885,605 |
Series 2012-H03 Class FA, 0.878% 1/20/62 (c)(e) | | 583,396 | | 585,981 |
Series 2012-H06 Class FA, 0.808% 1/20/62 (c)(e) | | 883,913 | | 885,060 |
Series 2012-H07 Class FA, 0.808% 3/20/62 (c)(e) | | 522,172 | | 522,698 |
floater sequential payer Series 2011-150 Class D, 3% 4/20/37 | | 146,377 | | 148,550 |
planned amortization class: | | | | |
Series 2010-112 Class PM, 3.25% 9/20/33 | | 101,337 | | 102,326 |
Series 2010-99 Class PT, 3.5% 8/20/33 | | 130,018 | | 131,662 |
Series 2011-68 Class EC, 3.5% 4/20/41 | | 857,629 | | 901,230 |
Series 1999-18 Class Z, 6.25% 5/16/29 | | 914,852 | | 1,035,819 |
Series 2010-H13 Class JA, 5.46% 10/20/59 (e) | | 4,221,436 | | 4,517,151 |
Series 2010-H15 Class TP, 5.15% 8/20/60 (e) | | 1,973,907 | | 2,197,395 |
Series 2010-H17 Class XP, 5.3019% 7/20/60 (c)(e) | | 2,618,727 | | 2,911,432 |
Collateralized Mortgage Obligations - continued |
| Principal Amount | | Value |
U.S. Government Agency - continued |
Ginnie Mae guaranteed REMIC pass-thru certificates: - continued | | | | |
Series 2010-H18 Class PL, 5.01% 9/20/60 (c)(e) | | $ 1,901,638 | | $ 2,107,846 |
Series 2012-64 Class KB, 3.6878% 5/20/41 (c) | | 295,027 | | 332,082 |
TOTAL COLLATERALIZED MORTGAGE OBLIGATIONS (Cost $54,534,792) | 54,781,055 |
Commercial Mortgage Securities - 3.4% |
|
Freddie Mac: | | | | |
pass thru-certificates floater Series KF01 Class A, 0.5321% 4/25/19 (c) | | 1,068,695 | | 1,069,008 |
sequential payer: | | | | |
Series K009 Class A2, 3.808% 8/25/20 | | 800,000 | | 860,900 |
Series KO34 Class A1, 2.669% 2/25/23 | | 7,300,000 | | 7,434,597 |
Series K032 Class A1, 3.016% 2/25/23 | | 2,678,837 | | 2,803,470 |
Series K501 Class A2, 1.655% 11/25/16 | | 930,000 | | 948,236 |
TOTAL COMMERCIAL MORTGAGE SECURITIES (Cost $13,057,967) | 13,116,211 |
Foreign Government and Government Agency Obligations - 0.9% |
|
Israeli State (guaranteed by U.S. Government through Agency for International Development) 5.5% 12/4/23 | | 4,000 | | 4,718 |
Jordanian Kingdom 2.503% 10/30/20 | | 3,752,000 | | 3,740,800 |
TOTAL FOREIGN GOVERNMENT AND GOVERNMENT AGENCY OBLIGATIONS (Cost $3,756,730) | 3,745,518 |
Cash Equivalents - 0.5% |
| Maturity Amount | | Value |
Investments in repurchase agreements in a joint trading account at 0.08%, dated 11/29/13 due 12/2/13 (Collateralized by U.S. Government Obligations) #
(Cost $2,032,000) | $ 2,032,013 | | $ 2,032,000 |
TOTAL INVESTMENT PORTFOLIO - 100.0% (Cost $387,187,870) | 389,266,980 |
NET OTHER ASSETS (LIABILITIES) - 0.0% | (67,719) |
NET ASSETS - 100% | $ 389,199,261 |
Futures Contracts |
| Expiration Date | | Underlying Face Amount at Value | | Unrealized Appreciation/
(Depreciation) |
Purchased |
Treasury Contracts |
75 CBOT 2 Year U.S. Treasury Note Contracts | March 2014 | | $ 16,522,266 | | $ 10,385 |
64 CBOT 5 Year U.S. Treasury Note Contracts | March 2014 | | 7,739,000 | | 6,377 |
TOTAL PURCHASED | | $ 24,261,266 | | $ 16,762 |
Sold |
Treasury Contracts |
20 CBOT 10 Year U.S. Treasury Note Contracts | March 2014 | | 2,507,500 | | 1,362 |
TOTAL TREASURY CONTRACTS | | $ 26,768,766 | | $ 18,124 |
|
The face value of futures purchased as a percentage of net assets is 6.2% |
|
The face value of futures sold as a percentage of net assets is 0.6% |
|
For the period, the average monthly underlying face amount at value for futures contracts in the aggregate was $25,960,469. |
Swaps |
Interest Rate Swaps |
Clearinghouse/
Counterparty(1) | Expiration Date | Notional Amount | Payment Received | Payment Paid | Value | Upfront Premium Received/
(Paid)(2) | Unrealized Appreciation/(Depreciation) |
CME | Nov. 2020 | $ 8,464,000 | 3-month LIBOR | 2.17% | $ (1,898) | $ 0 | $ (1,898) |
|
(1) Swaps with CME Group (CME) are centrally cleared over-the-counter (OTC) swaps. |
(2) Any premiums for centrally cleared OTC swaps are recorded periodically throughout the term of the swap to variation margin and included in unrealized appreciation (depreciation). |
|
Legend |
(a) Security or a portion of the security was pledged to cover margin requirements for futures contracts. At period end, the value of securities pledged amounted to $84,708. |
(b) Security or a portion of the security was pledged to cover margin requirements for centrally cleared OTC swaps. At period end, the value of securities pledged amounted to $162,152. |
(c) Coupon rates for floating and adjustable rate securities reflect the rates in effect at period end. |
(d) Security represents right to receive monthly interest payments on an underlying pool of mortgages or assets. Principal shown is the outstanding par amount of the pool as of the end of the period. |
(e) Represents an investment in an underlying pool of reverse mortgages which typically do not require regular principal and interest payments as repayment is deferred until a maturity event. |
# Additional information on each counterparty to the repurchase agreement is as follows: |
Repurchase Agreement / Counterparty | Value |
$2,032,000 due 12/02/13 at 0.08% |
Credit Agricole CIB New York Branch | $ 1,554,299 |
Mizuho Securities USA, Inc. | 477,701 |
| $ 2,032,000 |
Other Information |
The following is a summary of the inputs used, as of November 30, 2013, involving the Fund's assets and liabilities carried at fair value. The inputs or methodology used for valuing securities may not be an indication of the risk associated with investing in those securities. For more information on valuation inputs, and their aggregation into the levels used in the table below, please refer to the Investment Valuation section in the accompanying Notes to Financial Statements. |
Valuation Inputs at Reporting Date: |
Description | Total | Level 1 | Level 2 | Level 3 |
Investments in Securities: | | | | |
U.S. Government and Government Agency Obligations | $ 263,518,047 | $ - | $ 263,518,047 | $ - |
U.S. Government Agency - Mortgage Securities | 52,074,149 | - | 52,074,149 | - |
Collateralized Mortgage Obligations | 54,781,055 | - | 54,781,055 | - |
Commercial Mortgage Securities | 13,116,211 | - | 13,116,211 | - |
Foreign Government and Government Agency Obligations | 3,745,518 | - | 3,745,518 | - |
Cash Equivalents | 2,032,000 | - | 2,032,000 | - |
Total Investments in Securities: | $ 389,266,980 | $ - | $ 389,266,980 | $ - |
Derivative Instruments: | | | | |
Assets | | | | |
Futures Contracts | $ 18,124 | $ 18,124 | $ - | $ - |
Liabilities | | | | |
Swaps | $ (1,898) | $ - | $ (1,898) | $ - |
Total Derivative Instruments: | $ 16,226 | $ 18,124 | $ (1,898) | $ - |
Value of Derivative Instruments |
The following table is a summary of the Fund's value of derivative instruments by primary risk exposure as of November 30, 2013. For additional information on derivative instruments, please refer to the Derivative Instruments section in the accompanying Notes to Financial Statements. |
Primary Risk Exposure /
Derivative Type | Value |
| Asset | Liability |
Interest Rate Risk | | |
Futures Contracts (a) | $ 18,124 | $ - |
Swaps (b) | - | (1,898) |
Total Value of Derivatives | $ 18,124 | $ (1,898) |
(a) Reflects gross cumulative appreciation (depreciation) on futures contracts as presented in the Schedule of Investments. Only the period end receivable or payable for daily variation margin and net unrealized appreciation (depreciation) are presented in the Statement of Assets and Liabilities. |
(b) For centrally cleared OTC swaps, reflects gross cumulative appreciation (depreciation) as presented in the Schedule of Investments. For centrally cleared OTC swaps, only the period end receivable or payable for daily variation margin and net unrealized appreciation (depreciation) are presented in the Statement of Assets and Liabilities. |
See accompanying notes which are an integral part of the financial statements.
Annual Report
Statement of Assets and Liabilities
| November 30, 2013 |
| | |
Assets | | |
Investment in securities, at value (including repurchase agreements of $2,032,000) - See accompanying schedule: Unaffiliated issuers (cost $387,187,870) | | $ 389,266,980 |
Cash | | 1,571 |
Receivable for investments sold | | 7,894,997 |
Receivable for fund shares sold | | 184,527 |
Interest receivable | | 966,536 |
Receivable for daily variation margin for derivative instruments | | 8,365 |
Other receivables | | 18 |
Total assets | | 398,322,994 |
| | |
Liabilities | | |
Payable for investments purchased | $ 8,387,241 | |
Payable for fund shares redeemed | 588,373 | |
Distributions payable | 1,518 | |
Accrued management fee | 146,303 | |
Other affiliated payables | 298 | |
Total liabilities | | 9,123,733 |
| | |
Net Assets | | $ 389,199,261 |
Net Assets consist of: | | |
Paid in capital | | $ 386,144,175 |
Distributions in excess of net investment income | | (76,972) |
Accumulated undistributed net realized gain (loss) on investments | | 1,036,722 |
Net unrealized appreciation (depreciation) on investments | | 2,095,336 |
Net Assets, for 38,616,748 shares outstanding | | $ 389,199,261 |
Net Asset Value, offering price and redemption price per share ($389,199,261 ÷ 38,616,748 shares) | | $ 10.08 |
See accompanying notes which are an integral part of the financial statements.
Annual Report
Statement of Operations
| Year ended November 30, 2013 |
| | |
Investment Income | | |
Interest | | $ 3,916,115 |
| | |
Expenses | | |
Management fee | $ 1,964,446 | |
Independent trustees' compensation | 1,726 | |
Miscellaneous | 1,005 | |
Total expenses before reductions | 1,967,177 | |
Expense reductions | (4,493) | 1,962,684 |
Net investment income (loss) | | 1,953,431 |
Realized and Unrealized Gain (Loss) Net realized gain (loss) on: | | |
Investment securities: | | |
Unaffiliated issuers | 807,353 | |
Futures contracts | 309,109 | |
Total net realized gain (loss) | | 1,116,462 |
Change in net unrealized appreciation (depreciation) on: Investment securities | (3,143,013) | |
Futures contracts | 18,375 | |
Swaps | (1,898) | |
Total change in net unrealized appreciation (depreciation) | | (3,126,536) |
Net gain (loss) | | (2,010,074) |
Net increase (decrease) in net assets resulting from operations | | $ (56,643) |
See accompanying notes which are an integral part of the financial statements.
Annual Report
Financial Statements - continued
Statement of Changes in Net Assets
| Year ended
November 30,
2013 | Year ended
November 30,
2012 |
Increase (Decrease) in Net Assets | | |
Operations | | |
Net investment income (loss) | $ 1,953,431 | $ 2,370,511 |
Net realized gain (loss) | 1,116,462 | 3,056,973 |
Change in net unrealized appreciation (depreciation) | (3,126,536) | 662,684 |
Net increase (decrease) in net assets resulting
from operations | (56,643) | 6,090,168 |
Distributions to shareholders from net investment income | (1,811,476) | (2,462,634) |
Distributions to shareholders from net realized gain | (2,669,599) | (7,924,811) |
Total distributions | (4,481,075) | (10,387,445) |
Share transactions
Proceeds from sales of shares | 97,528,072 | 195,350,049 |
Reinvestment of distributions | 4,365,108 | 10,081,022 |
Cost of shares redeemed | (206,136,012) | (175,539,569) |
Net increase (decrease) in net assets resulting from share transactions | (104,242,832) | 29,891,502 |
Total increase (decrease) in net assets | (108,780,550) | 25,594,225 |
| | |
Net Assets | | |
Beginning of period | 497,979,811 | 472,385,586 |
End of period (including distributions in excess of net investment income of $76,972 and distributions in excess of net investment income of $5,403, respectively) | $ 389,199,261 | $ 497,979,811 |
Other Information Shares | | |
Sold | 9,682,066 | 19,289,157 |
Issued in reinvestment of distributions | 432,697 | 997,299 |
Redeemed | (20,473,821) | (17,324,063) |
Net increase (decrease) | (10,359,058) | 2,962,393 |
See accompanying notes which are an integral part of the financial statements.
Annual Report
Financial Highlights
Years ended November 30, | 2013 | 2012 | 2011 | 2010 | 2009 |
Selected Per-Share Data | | | | | |
Net asset value, beginning of period | $ 10.17 | $ 10.27 | $ 10.31 | $ 10.31 | $ 10.04 |
Income from Investment Operations | | | | | |
Net investment income (loss) B | .045 | .048 | .092 | .135 | .199 |
Net realized and unrealized gain (loss) | (.038) | .075 | .115 | .136 | .274 |
Total from investment operations | .007 | .123 | .207 | .271 | .473 |
Distributions from net investment income | (.042) | (.050) | (.090) | (.131) | (.203) |
Distributions from net realized gain | (.055) | (.173) | (.157) | (.140) | - |
Total distributions | (.097) | (.223) | (.247) | (.271) | (.203) |
Net asset value, end of period | $ 10.08 | $ 10.17 | $ 10.27 | $ 10.31 | $ 10.31 |
Total Return A | .07% | 1.22% | 2.06% | 2.70% | 4.76% |
Ratios to Average Net Assets C | | | | | |
Expenses before reductions | .45% | .45% | .45% | .45% | .45% |
Expenses net of fee waivers, if any | .45% | .45% | .45% | .45% | .45% |
Expenses net of all reductions | .45% | .45% | .45% | .45% | .45% |
Net investment income (loss) | .45% | .47% | .90% | 1.33% | 1.96% |
Supplemental Data | | | | | |
Net assets, end of period (000 omitted) | $ 389,199 | $ 497,980 | $ 472,386 | $ 511,849 | $ 538,834 |
Portfolio turnover rate | 89% | 138% | 315% | 221% | 347% |
A Total returns would have been lower if certain expenses had not been reduced during the applicable periods shown.
B Calculated based on average shares outstanding during the period.
C Expense ratios reflect operating expenses of the Fund. Expenses before reductions do not reflect amounts reimbursed by the investment adviser or reductions from expense offset arrangements and do not represent the amount paid by the Fund during periods when reimbursements or reductions occur. Expenses net of fee waivers reflect expenses after reimbursement by the investment adviser but prior to reductions from expense offset arrangements. Expenses net of all reductions represent the net expenses paid by the Fund.
See accompanying notes which are an integral part of the financial statements.
Annual Report
Notes to Financial Statements
For the period ended November 30, 2013
1. Organization.
Fidelity Limited Term Government Fund (formerly Fidelity Institutional Short-Intermediate Government Fund) (the Fund) is a fund of Fidelity Advisor Series IV (the Trust) and is authorized to issue an unlimited number of shares. The Trust is registered under the Investment Company Act of 1940, as amended (the 1940 Act), as an open-end management investment company organized as a Massachusetts business trust.
2. Significant Accounting Policies.
The financial statements have been prepared in conformity with accounting principles generally accepted in the United States of America (GAAP), which require management to make certain estimates and assumptions at the date of the financial statements. Actual results could differ from those estimates. Subsequent events, if any, through the date that the financial statements were issued have been evaluated in the preparation of the financial statements. The following summarizes the significant accounting policies of the Fund:
Investment Valuation. Investments are valued as of 4:00 p.m. Eastern time on the last calendar day of the period. In accordance with valuation policies and procedures approved by the Board of Trustees (the Board), the Fund attempts to obtain prices from one or more third party pricing vendors or brokers to value its investments. When current market prices, quotations or currency exchange rates are not readily available or reliable, investments will be fair valued in good faith by the Fidelity Management & Research Company (FMR) Fair Value Committee (the Committee), in accordance with procedures adopted by the Board. Factors used in determining fair value vary by investment type and may include market or investment specific events, changes in interest rates and credit quality. The frequency with which these procedures are used cannot be predicted and they may be utilized to a significant extent. The Committee oversees the Fund's valuation policies and procedures and is responsible for approving and reporting to the Board all fair value determinations.
The Fund categorizes the inputs to valuation techniques used to value its investments into a disclosure hierarchy consisting of three levels as shown below:
Level 1 - quoted prices in active markets for identical investments
Level 2 - other significant observable inputs (including quoted prices for similar investments, interest rates, prepayment speeds, etc.)
Level 3 - unobservable inputs (including the Fund's own assumptions based on the best information available)
Annual Report
Notes to Financial Statements - continued
2. Significant Accounting Policies - continued
Investment Valuation - continued
Valuation techniques used to value the Fund's investments by major category are as follows:
Debt securities, including restricted securities, are valued based on evaluated prices received from third party pricing vendors or from brokers who make markets in such securities. For foreign government and government agency obligations and U.S. government and government agency obligations, pricing vendors utilize matrix pricing which considers yield or price of bonds of comparable quality, coupon, maturity and type as well as broker-supplied prices. For collateralized mortgage obligations, commercial mortgage securities and U.S. government agency mortgage securities, pricing vendors utilize matrix pricing which considers prepayment speed assumptions, attributes of the collateral, yield or price of bonds of comparable quality, coupon, maturity and type as well as broker-supplied prices. Swaps are marked-to-market daily based on valuations from third party pricing vendors, registered derivatives clearing organizations (clearinghouses) or broker-supplied valuations. These pricing sources may utilize inputs such as interest rate curves, credit spread curves, default possibilities and recovery rates. When independent prices are unavailable or unreliable, debt securities and swaps may be valued utilizing pricing methodologies which consider similar factors that would be used by third party pricing vendors. Debt securities and swaps are generally categorized as Level 2 in the hierarchy but may be Level 3 depending on the circumstances.
Futures contracts are valued at the settlement price established each day by the board of trade or exchange on which they are traded and are categorized as Level 1 in the hierarchy. Short-term securities with remaining maturities of sixty days or less may be valued at amortized cost, which approximates fair value, and are categorized as Level 2 in the hierarchy.
Changes in valuation techniques may result in transfers in or out of an assigned level within the disclosure hierarchy. The aggregate value of investments by input level, as of November 30, 2013, is included at the end of the Fund's Schedule of Investments.
Investment Transactions and Income. For financial reporting purposes, the Fund's investment holdings and net asset value (NAV) include trades executed through the end of the last business day of the period. The NAV per share for processing shareholder transactions is calculated as of the close of business of the New York Stock Exchange (NYSE), normally 4:00 p.m. Eastern time and includes trades executed through the end of the prior business day. Gains and losses on securities sold are determined on the basis of identified cost. Interest income is accrued as earned. Interest income includes coupon interest and amortization of premium and accretion of discount on debt securities. The
Annual Report
2. Significant Accounting Policies - continued
Investment Transactions and Income - continued
principal amount on inflation-indexed securities is periodically adjusted to the rate of inflation and interest is accrued based on the principal amount. The adjustments to principal due to inflation are reflected as increases or decreases to Interest in the accompanying Statement of Operations.
Expenses. Expenses directly attributable to a fund are charged to that fund. Expenses attributable to more than one fund are allocated among the respective funds on the basis of relative net assets or other appropriate methods. Expense estimates are accrued in the period to which they relate and adjustments are made when actual amounts are known.
Income Tax Information and Distributions to Shareholders. Each year, the Fund intends to qualify as a regulated investment company under Subchapter M of the Internal Revenue Code, including distributing substantially all of its taxable income and realized gains. As a result, no provision for U.S. Federal income taxes is required. As of November 30, 2013, the Fund did not have any unrecognized tax benefits in the financial statements; nor is the Fund aware of any tax positions for which it is reasonably possible that the total amounts of unrecognized tax benefits will significantly change in the next twelve months. The Fund files a U.S. federal tax return, in addition to state and local tax returns as required. The Fund's federal income tax returns are subject to examination by the Internal Revenue Service (IRS) for a period of three fiscal years after they are filed. State and local tax returns may be subject to examination for an additional fiscal year depending on the jurisdiction.
Dividends are declared and recorded daily and paid monthly from net investment income. Distributions from realized gains, if any, are declared and recorded on the ex-dividend date. Income and capital gain distributions are determined in accordance with income tax regulations, which may differ from GAAP. In addition, the Fund claimed a portion of the payment made to redeeming shareholders as a distribution for income tax purposes.
Capital accounts within the financial statements are adjusted for permanent book-tax differences. These adjustments have no impact on net assets or the results of operations. Temporary book-tax differences will reverse in a subsequent period.
Book-tax differences are primarily due to futures contracts, prior period premium and discount on debt securities, market discount, deferred trustees compensation, financing transactions and losses deferred due to wash sales.
Annual Report
Notes to Financial Statements - continued
2. Significant Accounting Policies - continued
Income Tax Information and Distributions to Shareholders - continued
The federal tax cost of investment securities and unrealized appreciation (depreciation) as of period end were as follows:
Gross unrealized appreciation | $ 2,506,508 |
Gross unrealized depreciation | (707,410) |
Net unrealized appreciation (depreciation) on securities and other investments | $ 1,799,098 |
| |
Tax Cost | $ 387,467,882 |
The tax-based components of distributable earnings as of period end were as follows:
Undistributed ordinary income | $ 146,032 |
Undistributed long-term capital gain | $ 1,112,158 |
Net unrealized appreciation (depreciation) | $ 1,797,200 |
The tax character of distributions paid was as follows:
| November 30, 2013 | November 30, 2012 |
Ordinary Income | $ 2,976,392 | $ 5,027,891 |
Long-term Capital Gains | 1,504,683 | 5,359,554 |
Total | $ 4,481,075 | $ 10,387,445 |
Repurchase Agreements. Pursuant to an Exemptive Order issued by the Securities and Exchange Commission (the SEC), the Fund along with other registered investment companies having management contracts with FMR, or other affiliated entities of FMR, are permitted to transfer uninvested cash balances into joint trading accounts which are then invested in repurchase agreements. The Fund may also invest directly with institutions in repurchase agreements. Repurchase agreements may be collateralized by government or non-government securities. Upon settlement date, collateral is held in segregated accounts with custodian banks and may be obtained in the event of a default of the counterparty. The Fund monitors, on a daily basis, the value of the collateral to ensure it is at least equal to the principal amount of the repurchase agreement (including accrued interest). In the event of a default by the counterparty, realization of the collateral proceeds could be delayed, during which time the value of the collateral may decline.
Annual Report
2. Significant Accounting Policies - continued
New Accounting Pronouncement. The Financial Accounting Standards Board issued in December 2011, Accounting Standard Update No. 2011-11, Disclosures about Offsetting Assets and Liabilities, and in January 2013, Accounting Standards Update No. 2013-1 Clarifying the Scope of Disclosures about Offsetting Assets and Liabilities. These updates create new disclosure requirements requiring entities to disclose both gross and net information for derivatives and other financial instruments that are either offset in the Statement of Assets and Liabilities or subject to an enforceable master netting arrangement or similar agreement. The disclosure requirements are effective for annual reporting periods beginning on or after January 1, 2013, and interim periods within those annual periods. Management expects that the impact of the updates' adoption will be limited to additional financial statement disclosures as applicable.
3. Derivative Instruments.
Risk Exposures and the Use of Derivative Instruments. The Fund's investment objective allows the Fund to enter into various types of derivative contracts, including futures contracts and swaps. Derivatives are investments whose value is primarily derived from underlying assets, indices or reference rates and may be transacted on an exchange or over-the-counter (OTC). Derivatives may involve a future commitment to buy or sell a specified asset based on specified terms, to exchange future cash flows at periodic intervals based on a notional principal amount, or for one party to make one or more payments upon the occurrence of specified events in exchange for periodic payments from the other party.
The Fund used derivatives to increase returns, to gain exposure to certain types of assets and to manage exposure to certain risks as defined below. The success of any strategy involving derivatives depends on analysis of numerous economic factors, and if the strategies for investment do not work as intended, the Fund may not achieve its objectives.
The Fund's use of derivatives increased or decreased its exposure to the following risk:
Interest Rate Risk | Interest rate risk relates to the fluctuations in the value of interest-bearing securities due to changes in the prevailing levels of market interest rates. |
The Fund is also exposed to additional risks from investing in derivatives, such as liquidity risk and counterparty credit risk. Liquidity risk is the risk that the Fund will be unable to close out the derivative in the open market in a timely manner. Counterparty credit risk is the risk that the counterparty will not be able to fulfill its obligation to the Fund. Derivative counterparty credit risk is managed through formal evaluation of the
Annual Report
Notes to Financial Statements - continued
3. Derivative Instruments - continued
Risk Exposures and the Use of Derivative Instruments - continued
creditworthiness of all potential counterparties. Exchange-traded futures contracts are not covered by the ISDA Master Agreement; however counterparty credit risk related to exchange-traded futures contracts may be mitigated by the protection provided by the exchange on which they trade. Counterparty credit risk related to centrally cleared OTC swaps may be mitigated by the protection provided by the clearinghouse.
Investing in derivatives may involve greater risks than investing in the underlying assets directly and, to varying degrees, may involve risk of loss in excess of any initial investment and collateral received and amounts recognized in the Statement of Assets and Liabilities. In addition, there may be the risk that the change in value of the derivative contract does not correspond to the change in value of the underlying instrument.
Net Realized Gain (Loss) and Change in Net Unrealized Appreciation (Depreciation) on Derivatives. The table below, which reflects the impacts of derivatives on the financial performance of the Fund, summarizes the net realized gain (loss) and change in net unrealized appreciation (depreciation) for derivatives during the period as presented in the Statement of Operations.
Primary Risk Exposure /
Derivative Type | Net Realized Gain
(Loss) | Change in Net
Unrealized Appreciation
(Depreciation) |
Interest Rate Risk | | |
Futures Contracts | $ 309,109 | $ 18,375 |
Swaps | - | (1,898) |
Totals (a) | $ 309,109 | $ 16,477 |
(a) A summary of the value of derivatives by primary risk exposure as of period end is included at the end of the Schedule of Investments.
Futures Contracts. A futures contract is an agreement between two parties to buy or sell a specified underlying instrument for a fixed price at a specified future date. The Fund used futures contracts to manage its exposure to the bond market, and to fluctuations in interest rates.
Upon entering into a futures contract, a fund is required to deposit either cash or securities (initial margin) with a clearing broker in an amount equal to a certain percentage of the face value of the contract. Futures contracts are marked-to-market daily and subsequent daily payments (variation margin) are made or received by a fund depending on the daily fluctuations in the value of the futures contracts and are recorded as unrealized appreciation or (depreciation). This receivable and/or payable, if any, is included in daily variation margin for derivative instruments in the Statement of Assets and Liabilities.
Annual Report
3. Derivative Instruments - continued
Futures Contracts - continued
Realized gain or (loss) is recorded upon the expiration or closing of a futures contract. The net realized gain (loss) and change in net unrealized appreciation (depreciation) on futures contracts during the period is included in the Statement of Operations.
Any open futures contracts at period end are presented in the Schedule of Investments under the caption "Futures Contracts." The underlying face amount at value reflects each contract's exposure to the underlying instrument or index at period end and is representative of volume of activity during the period. Securities deposited to meet initial margin requirements are identified in the Schedule of Investments.
Swaps. A swap is a contract between two parties to exchange future cash flows at periodic intervals based on a notional principal amount. A centrally cleared OTC swap is a transaction executed between a fund and a dealer counterparty, then cleared by a futures commission merchant (FCM) through a clearinghouse. Once cleared, the clearinghouse serves as a central counterparty, with whom a fund exchanges cash flows for the life of the transaction, similar to transactions in futures contracts.
Centrally cleared OTC swaps require a fund to deposit either cash or securities (initial margin) with the FCM, at the instruction of and for the benefit of the clearinghouse. Securities deposited to meet initial margin requirements are identified in the Schedule of Investments. Centrally cleared OTC swaps are marked-to-market daily and subsequent payments (variation margin) are made or received depending on the daily fluctuations in the value of the swaps and are recorded as unrealized appreciation or (depreciation). These daily payments, if any, are included in receivable or payable for daily variation margin for derivative instruments in the Statement of Assets and Liabilities. Any premiums for centrally cleared OTC swaps are recorded periodically throughout the term of the swap to variation margin and included in unrealized appreciation (depreciation) in the Statement of Assets and Liabilities. Any premiums are recognized as realized gain (loss) upon termination or maturity of the swap.
Payments are exchanged at specified intervals, accrued daily commencing with the effective date of the contract and recorded as realized gain or (loss). Realized gain or (loss) is also recorded in the event of an early termination of a swap. The net realized gain (loss) and change in net unrealized appreciation (depreciation) on swaps during the period is included in the Statement of Operations.
Any open swaps at period end are included in the Schedule of Investments under the caption "Swaps" and are representative of volume of activity during the period.
Annual Report
Notes to Financial Statements - continued
3. Derivative Instruments - continued
Interest Rate Swaps. Interest rate swaps are agreements between counterparties to exchange cash flows, one based on a fixed rate, and the other on a floating rate. The Fund entered into interest rate swaps to manage its exposure to interest rate changes. Changes in interest rates can have an effect on both the value of bond holdings as well as the amount of interest income earned. In general, the value of bonds can fall when interest rates rise and can rise when interest rates fall.
4. Purchases and Sales of Investments.
Purchases and sales of securities, other than short-term securities and U.S. government securities, aggregated $3,776,183 and $1,677,293, respectively.
5. Fees and Other Transactions with Affiliates.
Management Fee. Fidelity Management & Research Company (the investment adviser) and its affiliates provide the Fund with investment management related services for which the Fund pays a monthly management fee that is based on an annual rate of .45% of the Fund's average net assets. Under the management contract, the investment adviser pays all other expenses, except the compensation of the independent Trustees and certain other expenses such as interest expense, including commitment fees. The management fee paid to the investment adviser by the Fund is reduced by an amount equal to the fees and expenses paid by the Fund to the independent Trustees.
6. Committed Line of Credit.
The Fund participates with other funds managed by the investment adviser or an affiliate in a $4.25 billion credit facility (the "line of credit") to be utilized for temporary or emergency purposes to fund shareholder redemptions or for other short-term liquidity purposes. The Fund has agreed to pay commitment fees on its pro-rata portion of the line of credit, which amounted to $1,005 and is reflected in Miscellaneous expenses on the Statement of Operations. During the period, there were no borrowings on this line of credit.
7. Security Lending.
The Fund lends portfolio securities from time to time in order to earn additional income. On the settlement date of the loan, the Fund receives collateral (in the form of U.S. Treasury obligations, letters of credit and/or cash) against the loaned securities and maintains collateral in an amount not less than 100% of the market value of the loaned securities during the period of the loan. The market value of the loaned securities is determined at the close of business of the Fund and any additional required collateral is delivered to the Fund on the next business day. If the borrower defaults on its obligation
Annual Report
7. Security Lending - continued
to return the securities loaned because of insolvency or other reasons, the Fund may apply collateral received from the borrower against the obligation. The Fund may experience delays and costs in recovering the securities loaned. Any cash collateral received is maintained at the Fund's custodian and/or invested in cash equivalents. At period end, there were no security loans outstanding. Security lending income represents the income earned on investing cash collateral, less rebates paid to borrowers, plus any premium payments received for lending certain types of securities. Security lending income is presented in the Statement of Operations as a component of interest income. Total security lending income during the period amounted to $4,128.
8. Expense Reductions.
Through arrangements with the Fund's custodian, credits realized as a result of uninvested cash balances were used to reduce the Fund's management fee. During the period, these credits reduced the Fund's management fee by $496.
In addition, the investment adviser reimbursed a portion of the Fund's operating expenses during the period in the amount of $3,997.
9. Other.
The Fund's organizational documents provide former and current trustees and officers with a limited indemnification against liabilities arising in connection with the performance of their duties to the Fund. In the normal course of business, the Fund may also enter into contracts that provide general indemnifications. The Fund's maximum exposure under these arrangements is unknown as this would be dependent on future claims that may be made against the Fund. The risk of material loss from such claims is considered remote.
Annual Report
To the Trustees of Fidelity Advisor Series IV and the Shareholders of Fidelity Limited Term Government Fund (formerly Fidelity Institutional Short-Intermediate Government Fund):
In our opinion, the accompanying statement of assets and liabilities, including the schedule of investments, and the related statements of operations and of changes in net assets and the financial highlights present fairly, in all material respects, the financial position of Fidelity Limited Term Government Fund (a fund of Fidelity Advisor Series IV) at November 30, 2013, the results of its operations for the year then ended, the changes in its net assets for each of the two years in the period then ended and the financial highlights for each of the five years in the period then ended, in conformity with accounting principles generally accepted in the United States of America. These financial statements and financial highlights (hereafter referred to as "financial statements") are the responsibility of the Fidelity Limited Term Government Fund's management. Our responsibility is to express an opinion on these financial statements based on our audits. We conducted our audits of these financial statements in accordance with the standards of the Public Company Accounting Oversight Board (United States). Those standards require that we plan and perform the audit to obtain reasonable assurance about whether the financial statements are free of material misstatement. An audit includes examining, on a test basis, evidence supporting the amounts and disclosures in the financial statements, assessing the accounting principles used and significant estimates made by management, and evaluating the overall financial statement presentation. We believe that our audits, which included confirmation of securities at November 30, 2013 by correspondence with the custodian and brokers, provide a reasonable basis for our opinion.
PricewaterhouseCoopers LLP
Boston, Massachusetts
January 13, 2014
Annual Report
The Trustees and officers of the trust and fund, as applicable, are listed below. The Board of Trustees governs the fund and is responsible for protecting the interests of shareholders. The Trustees are experienced executives who meet periodically throughout the year to oversee the fund's activities, review contractual arrangements with companies that provide services to the fund, oversee management of the risks associated with such activities and contractual arrangements, and review the fund's performance. Except for Elizabeth S. Acton and James C. Curvey, each of the Trustees oversees 223 funds. Ms. Acton oversees 205 funds. Mr. Curvey oversees 396 funds.
The Trustees hold office without limit in time except that (a) any Trustee may resign; (b) any Trustee may be removed by written instrument, signed by at least two-thirds of the number of Trustees prior to such removal; (c) any Trustee who requests to be retired or who has become incapacitated by illness or injury may be retired by written instrument signed by a majority of the other Trustees; and (d) any Trustee may be removed at any special meeting of shareholders by a two-thirds vote of the outstanding voting securities of the trust. Each Trustee who is not an interested person (as defined in the 1940 Act) of the trust and the fund (Independent Trustee), shall retire not later than the last day of the month in which his or her 75th birthday occurs. The Independent Trustees may waive this mandatory retirement age policy with respect to individual Trustees. The officers hold office without limit in time, except that any officer may resign or may be removed by a vote of a majority of the Trustees at any regular meeting or any special meeting of the Trustees. Except as indicated, each individual has held the office shown or other offices in the same company for the past five years.
Experience, Skills, Attributes, and Qualifications of the Fund's Trustees. The Governance and Nominating Committee has adopted a statement of policy that describes the experience, qualifications, attributes, and skills that are necessary and desirable for potential Independent Trustee candidates (Statement of Policy). The Board believes that each Trustee satisfied at the time he or she was initially elected or appointed a Trustee, and continues to satisfy, the standards contemplated by the Statement of Policy. The Governance and Nominating Committee also engages professional search firms to help identify potential Independent Trustee candidates who have the experience, qualifications, attributes, and skills consistent with the Statement of Policy. From time to time, additional criteria based on the composition and skills of the current Independent Trustees, as well as experience or skills that may be appropriate in light of future changes to board composition, business conditions, and regulatory or other developments, have also been considered by the professional search firms and the Governance and Nominating Committee. In addition, the Board takes into account the Trustees' commitment and participation in Board and committee meetings, as well as their leadership of standing and ad hoc committees throughout their tenure.
In determining that a particular Trustee was and continues to be qualified to serve as a Trustee, the Board has considered a variety of criteria, none of which, in isolation, was controlling. The Board believes that, collectively, the Trustees have balanced and diverse experience, qualifications, attributes, and skills, which allow the Board to operate effectively in governing the fund and protecting the interests of shareholders. Information about the specific experience, skills, attributes, and qualifications of each Trustee, which in each case led to the Board's conclusion that the Trustee should serve (or continue to serve) as a trustee of the fund, is provided below.
Annual Report
Board Structure and Oversight Function. Abigail P. Johnson is an interested person (as defined in the 1940 Act) and currently serves as Chairman. The Trustees have determined that an interested Chairman is appropriate and benefits shareholders because an interested Chairman has a personal and professional stake in the quality and continuity of services provided to the fund. Independent Trustees exercise their informed business judgment to appoint an individual of their choosing to serve as Chairman, regardless of whether the Trustee happens to be independent or a member of management. The Independent Trustees have determined that they can act independently and effectively without having an Independent Trustee serve as Chairman and that a key structural component for assuring that they are in a position to do so is for the Independent Trustees to constitute a substantial majority for the Board. The Independent Trustees also regularly meet in executive session. Albert R. Gamper, Jr. serves as Chairman of the Independent Trustees and as such (i) acts as a liaison between the Independent Trustees and management with respect to matters important to the Independent Trustees and (ii) with management prepares agendas for Board meetings.
Fidelity funds are overseen by different Boards of Trustees. The fund's Board oversees Fidelity's investment-grade bond, money market, and asset allocation funds and another Board oversees Fidelity's equity and high income funds. The asset allocation funds may invest in Fidelity funds that are overseen by such other Board. The use of separate Boards, each with its own committee structure, allows the Trustees of each group of Fidelity funds to focus on the unique issues of the funds they oversee, including common research, investment, and operational issues. On occasion, the separate Boards establish joint committees to address issues of overlapping consequences for the Fidelity funds overseen by each Board.
The Trustees operate using a system of committees to facilitate the timely and efficient consideration of all matters of importance to the Trustees, the fund, and fund shareholders and to facilitate compliance with legal and regulatory requirements and oversight of the fund's activities and associated risks. The Board, acting through its committees, has charged FMR and its affiliates with (i) identifying events or circumstances the occurrence of which could have demonstrably adverse effects on the fund's business and/or reputation; (ii) implementing processes and controls to lessen the possibility that such events or circumstances occur or to mitigate the effects of such events or circumstances if they do occur; and (iii) creating and maintaining a system designed to evaluate continuously business and market conditions in order to facilitate the identification and implementation processes described in (i) and (ii) above. Because the day-to-day operations and activities of the fund are carried out by or through FMR, its affiliates, and other service providers, the fund's exposure to risks is mitigated but not eliminated by the processes overseen by the Trustees. While each of the Board's committees has responsibility for overseeing different aspects of the fund's activities, oversight is exercised primarily through the Operations and Audit Committees. In addition, an ad hoc Board committee of Independent Trustees has worked with FMR to enhance the Board's oversight of investment and financial risks, legal and regulatory risks, technology risks, and operational risks, including the development of additional risk reporting to the Board. Appropriate personnel, including but not limited to the fund's Chief Compliance Officer (CCO), FMR's internal auditor, the independent accountants, the fund's Treasurer and portfolio management personnel, make periodic reports to the Board's committees, as appropriate, including an annual review of FMR's risk management program for the Fidelity funds. The responsibilities of each standing committee, including their oversight responsibilities, are described further under "Standing Committees of the Fund's Trustees."
Annual Report
Trustees and Officers - continued
The fund's Statement of Additional Information (SAI) includes more information about the Trustees. To request a free copy, call Fidelity at 1-800-544-8544.
Interested Trustees*:
Correspondence intended for each Trustee who is an interested person may be sent to Fidelity Investments, 245 Summer Street, Boston, Massachusetts 02210.
Name, Year of Birth; Principal Occupations and Other Relevant Experience+ |
James C. Curvey (1935) |
Year of Election or Appointment: 2007 Trustee |
| Mr. Curvey also serves as Trustee of other Fidelity funds. Mr. Curvey is a Director of Fidelity Investments Money Management, Inc. (2009-present), Director of Fidelity Research & Analysis Co. (2009-present) and Director of FMR and FMR Co., Inc. (2007-present). Mr. Curvey is also Vice Chairman (2007-present) and Director of FMR LLC. In addition, Mr. Curvey serves as an Overseer for the Boston Symphony Orchestra and a member of the Trustees of Villanova University. Previously, Mr. Curvey was the Vice Chairman (2006-2007) and Director (2000-2007) of FMR Corp. |
Abigail P. Johnson (1961) |
Year of Election or Appointment: 2009 Trustee Chairman of the Board of Trustees |
| Ms. Johnson also serves as Trustee of other Fidelity funds. Ms. Johnson serves as President of FMR LLC (2013-present), President of Fidelity Financial Services (2012-present) and President of Personal, Workplace and Institutional Services (2005-present). Ms. Johnson is Chairman and Director of FMR Co., Inc. (2011-present), Chairman and Director of FMR (2011-present), and the Vice Chairman and Director (2007-present) of FMR LLC. Previously, Ms. Johnson served as President and a Director of FMR (2001-2005), a Trustee of other investment companies advised by FMR, Fidelity Investments Money Management, Inc., and FMR Co., Inc. (2001-2005), Senior Vice President of the Fidelity funds (2001-2005), and managed a number of Fidelity funds. Ms. Abigail P. Johnson and Mr. Arthur E. Johnson are not related. |
* Trustees have been determined to be "Interested Trustees" by virtue of, among other things, their affiliation with the trust or various entities under common control with FMR.
+ The information above includes each Trustee's principal occupation during the last five years and other information relating to the experience, attributes, and skills relevant to each Trustee's qualifications to serve as a Trustee, which led to the conclusion that each Trustee should serve as a Trustee for the fund.
Annual Report
Trustees and Officers - continued
Independent Trustees:
Correspondence intended for each Independent Trustee (that is, the Trustees other than the Interested Trustees) may be sent to Fidelity Investments, P.O. Box 55235, Boston, Massachusetts 02205-5235.
Name, Year of Birth; Principal Occupations and Other Relevant Experience+ |
Elizabeth S. Acton (1951) |
Year of Election or Appointment: 2013 Trustee |
| Ms. Acton also serves as Trustee or Member of the Advisory Board of other Fidelity funds. Prior to her retirement in April 2012, Ms. Acton was Executive Vice President, Finance (2011-2012), Executive Vice President, Chief Financial Officer (2002-2011), and Treasurer (2004-2005) of Comerica Incorporated (financial services). Prior to joining Comerica, Ms. Acton held a variety of positions at Ford Motor Company (1983-2002), including Vice President and Treasurer (2000-2002) and Executive Vice President and Chief Financial Officer of Ford Motor Credit Company (1998-2000). Ms. Acton currently serves as a member of the Board of Directors and Audit and Finance Committees of Beazer Homes USA, Inc. (homebuilding, 2012-present). |
Albert R. Gamper, Jr. (1942) |
Year of Election or Appointment: 2006 Trustee Chairman of the Independent Trustees |
| Mr. Gamper also serves as Trustee of other Fidelity funds. Prior to his retirement in December 2004, Mr. Gamper served as Chairman of the Board of CIT Group Inc. (commercial finance). During his tenure with CIT Group Inc. Mr. Gamper served in numerous senior management positions, including Chairman (1987-1989; 1999-2001; 2002-2004), Chief Executive Officer (1987-2004), and President (2002-2003). Mr. Gamper currently serves as a member of the Board of Directors of Public Service Enterprise Group (utilities, 2000-present), a member of the Board of Trustees, Rutgers University (2004-present), and Chairman of the Board of Barnabas Health Care System. Previously, Mr. Gamper served as Vice Chairman of the Independent Trustees of certain Fidelity funds (2011-2012) and as Chairman of the Board of Governors, Rutgers University (2004-2007). |
Robert F. Gartland (1951) |
Year of Election or Appointment: 2010 Trustee |
| Mr. Gartland also serves as Trustee of other Fidelity funds. Mr. Gartland is Chairman and an investor in Gartland and Mellina Group Corp. (consulting, 2009-present). Previously, Mr. Gartland served as a partner and investor of Vietnam Partners LLC (investments and consulting, 2008-2011). Prior to his retirement, Mr. Gartland held a variety of positions at Morgan Stanley (financial services, 1979-2007) including Managing Director (1987-2007). |
Arthur E. Johnson (1947) |
Year of Election or Appointment: 2008 Trustee |
| Mr. Johnson also serves as Trustee of other Fidelity funds. Mr. Johnson serves as a member of the Board of Directors of Eaton Corporation (diversified power management, 2009-present), AGL Resources, Inc. (holding company, 2002-present) and Booz Allen Hamilton (management consulting, 2011-present). Prior to his retirement, Mr. Johnson served as Senior Vice President of Corporate Strategic Development of Lockheed Martin Corporation (defense contractor, 1999-2009). He previously served on the Board of Directors of IKON Office Solutions, Inc. (1999-2008) and Delta Airlines (2005-2007). Mr. Arthur E. Johnson is not related to Ms. Abigail P. Johnson. |
Michael E. Kenneally (1954) |
Year of Election or Appointment: 2009 Trustee |
| Mr. Kenneally also serves as Trustee of other Fidelity funds. Mr. Kenneally served as a Member of the Advisory Board for certain Fidelity funds before joining the Board of Trustees (2008-2009). Prior to his retirement, Mr. Kenneally served as Chairman and Global Chief Executive Officer of Credit Suisse Asset Management. Before joining Credit Suisse, he was an Executive Vice President and Chief Investment Officer for Bank of America Corporation. Earlier roles at Bank of America included Director of Research, Senior Portfolio Manager and Research Analyst, and Mr. Kenneally was awarded the Chartered Financial Analyst (CFA) designation in 1991. |
James H. Keyes (1940) |
Year of Election or Appointment: 2007 Trustee |
| Mr. Keyes also serves as Trustee of other Fidelity funds. Mr. Keyes serves as a member of the Board and Non-Executive Chairman of Navistar International Corporation (manufacture and sale of trucks, buses, and diesel engines, since 2002). Previously, Mr. Keyes served as a member of the Board of Pitney Bowes, Inc. (integrated mail, messaging, and document management solutions, 1998-2013). Prior to his retirement, Mr. Keyes served as Chairman (1993-2002) and Chief Executive Officer (1988-2002) of Johnson Controls (automotive, building, and energy) and as a member of the Board of LSI Logic Corporation (semiconductor technologies, 1984-2008). |
Marie L. Knowles (1946) |
Year of Election or Appointment: 2001 Trustee Vice Chairman of the Independent Trustees |
| Ms. Knowles also serves as Trustee of other Fidelity funds. Prior to Ms. Knowles' retirement in June 2000, she served as Executive Vice President and Chief Financial Officer of Atlantic Richfield Company (ARCO) (diversified energy, 1996-2000). From 1993 to 1996, she was a Senior Vice President of ARCO and President of ARCO Transportation Company. She served as a Director of ARCO from 1996 to 1998. Ms. Knowles currently serves as a Director and Chairman of the Audit Committee of McKesson Corporation (healthcare service, since 2002). Ms. Knowles is a member of the Board of the Catalina Island Conservancy and of the Santa Catalina Island Company (2009-present). She also serves as a member of the Advisory Board for the School of Engineering of the University of Southern California. Previously, Ms. Knowles served as a Director of Phelps Dodge Corporation (copper mining and manufacturing, 1994-2007), URS Corporation (engineering and construction, 2000-2003) and America West (airline, 1999-2002). |
Kenneth L. Wolfe (1939) |
Year of Election or Appointment: 2005 Trustee |
| Mr. Wolfe also serves as Trustee of other Fidelity funds. Prior to his retirement, Mr. Wolfe served as Chairman and a Director (2007-2009) and Chairman and Chief Executive Officer (1994-2001) of Hershey Foods Corporation. He also served as a member of the Boards of Adelphia Communications Corporation (telecommunications, 2003-2006), Bausch & Lomb, Inc. (medical/pharmaceutical, 1993-2007), and Revlon, Inc. (personal care products, 2004-2009). Mr. Wolfe previously served as Chairman of the Independent Trustees of other Fidelity funds (2008-2012). |
+ The information above includes each Trustee's principal occupation during the last five years and other information relating to the experience, attributes, and skills relevant to each Trustee's qualifications to serve as a Trustee, which led to the conclusion that each Trustee should serve as a Trustee for the fund.
Officers:
Correspondence intended for each officer may be sent to Fidelity Investments, 245 Summer Street, Boston, Massachusetts 02210. Officers appear below in alphabetical order.
Name, Year of Birth; Principal Occupation |
Elizabeth Paige Baumann (1968) |
Year of Election or Appointment: 2012 Anti-Money Laundering (AML) Officer |
| Ms. Baumann also serves as AML Officer of other funds. She is Chief AML Officer of FMR LLC (2012-present) and is an employee of Fidelity Investments. Previously, Ms. Baumann served as Vice President and Deputy Anti-Money Laundering Officer (2007-2012). |
Robert P. Brown (1963) |
Year of Election or Appointment: 2012 Vice President of Fidelity's Bond Funds |
| Mr. Brown also serves as Vice President of other funds. Mr. Brown serves as Executive Vice President of Fidelity Investments Money Management, Inc. (FIMM) (2010-present), President, Bond Group of FMR (2011-present), Director and Managing Director, Research of Fidelity Management & Research (U.K.) Inc. (2008-present), and is an employee of Fidelity Investments. Previously, Mr. Brown served as President, Money Market Group of FMR (2010-2011) and Vice President of Fidelity's Money Market Funds (2010-2012). |
Marc Bryant (1966) |
Year of Election or Appointment: 2013 Assistant Secretary |
| Mr. Bryant also serves as an officer of other funds. He is Senior Vice President and Deputy General Counsel of FMR LLC. Prior to joining Fidelity Investments, Mr. Bryant served as a Senior Vice President and the Head of Global Retail Legal for AllianceBernstein L.P. (2006-2010), and as the General Counsel for ProFund Advisors LLC (2001-2006). |
Jonathan Davis (1968) |
Year of Election or Appointment: 2010 Assistant Treasurer |
| Mr. Davis also serves as Assistant Treasurer of other funds. Mr. Davis is an employee of Fidelity Investments. Previously, Mr. Davis served as Vice President and Associate General Counsel of FMR LLC (2003-2010). |
Adrien E. Deberghes (1967) |
Year of Election or Appointment: 2010 Assistant Treasurer |
| Mr. Deberghes also serves as an officer of other funds. He is an employee of Fidelity Investments (2008-present). Prior to joining Fidelity Investments, Mr. Deberghes was Senior Vice President of Mutual Fund Administration at State Street Corporation (2007-2008), Senior Director of Mutual Fund Administration at Investors Bank & Trust (2005-2007), and Director of Finance for Dunkin' Brands (2000-2005). |
Stephanie J. Dorsey (1969) |
Year of Election or Appointment: 2013 President and Treasurer |
| Ms. Dorsey also serves as an officer of other funds. She is an employee of Fidelity Investments (2008-present) and has served in other fund officer roles. Prior to joining Fidelity Investments, Ms. Dorsey served as Treasurer (2004-2008) of the JPMorgan Mutual Funds and Vice President (2004-2008) of JPMorgan Chase Bank. |
Scott C. Goebel (1968) |
Year of Election or Appointment: 2008 Secretary and Chief Legal Officer (CLO) |
| Mr. Goebel serves as Secretary and CLO of other funds. Mr. Goebel also serves as Secretary of Fidelity Investments Money Management, Inc. (FIMM) (2010-present) and Fidelity Research and Analysis Company (FRAC) (2010-present); General Counsel, Secretary, and Senior Vice President of FMR (2008-present) and FMR Co., Inc. (2008-present); Chief Legal Officer of Fidelity Management & Research (Hong Kong) Limited (2008-present) and Assistant Secretary of Fidelity Management & Research (Japan) Inc. (2008-present), and Fidelity Management & Research (U.K.) Inc. (2008-present). Previously, Mr. Goebel served as Secretary and CLO of other Fidelity funds (2008-2013), Assistant Secretary of FIMM (2008-2010), FRAC (2008-2010), and certain funds (2007-2008); and as Vice President and Secretary of Fidelity Distributors Corporation (FDC) (2005-2007). Mr. Goebel has been employed by FMR LLC or an affiliate since 2001. |
Chris Maher (1972) |
Year of Election or Appointment: 2013 Assistant Treasurer |
| Mr. Maher serves as Assistant Treasurer of other funds. Mr. Maher is Vice President of Valuation Oversight and is an employee of Fidelity Investments. Previously, Mr. Maher served as Vice President of Asset Management Compliance (2013), Vice President of FMR's Program Management Group (2010-2013), and Vice President of Valuation Oversight (2008-2010). |
Charles S. Morrison (1960) |
Year of Election or Appointment: 2012 Vice President |
| Mr. Morrison also serves as Vice President of other funds. He serves as President, Fixed Income and is an employee of Fidelity Investments. Previously, Mr. Morrison served as Vice President of Fidelity's Money Market Funds (2005-2009), President, Money Market Group Leader of FMR (2009), and Senior Vice President, Money Market Group of FMR (2004-2009). Mr. Morrison also served as Vice President of Fidelity's Bond Funds (2002-2005), certain Balanced Funds (2002-2005), and certain Asset Allocation Funds (2002-2007), and as Senior Vice President (2002-2005) of Fidelity's Fixed Income Division. |
Christine Reynolds (1958) |
Year of Election or Appointment: 2008 Chief Financial Officer |
| Ms. Reynolds also serves as Chief Financial Officer of other funds. Ms. Reynolds became President of Fidelity Pricing and Cash Management Services (FPCMS) in August 2008. Ms. Reynolds served as Chief Operating Officer of FPCMS (2007-2008). Previously, Ms. Reynolds served as President, Treasurer, and Anti-Money Laundering officer of the Fidelity funds (2004-2007). |
Kenneth B. Robins (1969) |
Year of Election or Appointment: 2009 Assistant Treasurer |
| Mr. Robins also serves as an officer of other funds. Mr. Robins serves as Executive Vice President of Fidelity Investments Money Management, Inc. (FIMM) (2013-present) and is an employee of Fidelity Investments (2004-present). Previously, Mr. Robins served in other fund officer roles. |
Gary W. Ryan (1958) |
Year of Election or Appointment: 2005 Assistant Treasurer |
| Mr. Ryan also serves as Assistant Treasurer of other funds. Mr. Ryan is an employee of Fidelity Investments and has served in other fund officer roles. Previously, Mr. Ryan served as Vice President of Fund Reporting in Fidelity Pricing and Cash Management Services (FPCMS) (1999-2005). |
Stephen Sadoski (1971) |
Year of Election or Appointment: 2013 Deputy Treasurer |
| Mr. Sadoski also serves as Deputy Treasurer of other funds. He is an employee of Fidelity Investments (2012-present) and has served in another fund officer role. Prior to joining Fidelity Investments, Mr. Sadoski served as an assistant chief accountant in the Division of Investment Management of the Securities and Exchange Commission (SEC) (2009-2012) and as a senior manager at Deloitte & Touche LLP (1997-2009). |
Stacie M. Smith (1974) |
Year of Election or Appointment: 2013 Assistant Treasurer |
| Ms. Smith also serves as an officer of other funds. She is an employee of Fidelity Investments (2009-present) and has served in other fund officer roles. Prior to joining Fidelity Investments, Ms. Smith served as Senior Audit Manager of Ernst & Young LLP (1996-2009). |
Renee Stagnone (1975) |
Year of Election or Appointment: 2013 Deputy Treasurer |
| Ms. Stagnone also serves as Deputy Treasurer of other funds. Ms. Stagnone is an employee of Fidelity Investments. |
Michael H. Whitaker (1967) |
Year of Election or Appointment: 2008 Chief Compliance Officer |
| Mr. Whitaker also serves as Chief Compliance Officer of other funds. Mr. Whitaker is an employee of Fidelity Investments (2007-present). Prior to joining Fidelity Investments, Mr. Whitaker worked at MFS Investment Management where he served as Senior Vice President and Chief Compliance Officer (2004-2006), and Assistant General Counsel. |
Joseph F. Zambello (1957) |
Year of Election or Appointment: 2011 Deputy Treasurer |
| Mr. Zambello also serves as Deputy Treasurer of other funds. Mr. Zambello is an employee of Fidelity Investments. Previously, Mr. Zambello served as Vice President of FMR's Program Management Group (2009-2011) and Vice President of the Transfer Agent Oversight Group (2005-2009). |
Annual Report
The Board of Trustees of Fidelity Limited Term Government Fund voted to pay shareholders of record at the opening of business on record date, the following distributions per share derived from capital gains realized from sales of portfolio securities:
Pay Date | Record Date | Capital Gains |
12/23/2013 | 12/20/2013 | $0.036 |
The fund hereby designates a capital gain with respect to the taxable year ended November 30, 2013 $1,192,846, or, if subsequently determined to be different, the net capital gain of such year.
A total of 43.51% of the dividends distributed during the fiscal year was derived from interest on U.S. Government securities which is generally exempt from state income tax.
The fund designates $1,659,691 of distributions paid during the period January 1, 2013 to November 30, 2013, as qualifying to be taxed as interest-related dividends for nonresident alien shareholders.
The fund will notify shareholders in January 2014 of amounts for use in preparing 2013 income tax returns.
Annual Report
Board Approval of Investment Advisory Contracts and Management Fees
Fidelity Limited Term Government Fund (formerly known as Institutional Short-Intermediate Government Fund)
Each year, the Board of Trustees, including the Independent Trustees (together, the Board), votes on the renewal of the management contract with Fidelity Management & Research Company (FMR) and the sub-advisory agreements (together, the Advisory Contracts) for the fund. The Board, assisted by the advice of fund counsel and Independent Trustees' counsel, requests and considers a broad range of information relevant to the renewal of the Advisory Contracts throughout the year.
The Board meets regularly and, at each of its meetings, covers an extensive agenda of topics and materials and considers factors that are relevant to its annual consideration of the renewal of the fund's Advisory Contracts, including the services and support provided to the fund and its shareholders. The Board has established four standing committees, Operations, Audit, Fair Valuation, and Governance and Nominating, each composed of and chaired by Independent Trustees with varying backgrounds, to which the Board has assigned specific subject matter responsibilities in order to enhance effective decision-making by the Board. The Operations Committee, of which all of the Independent Trustees are members, meets regularly throughout the year and, among other matters, considers matters specifically related to the annual consideration of the renewal of the fund's Advisory Contracts. The Board, acting directly and through its Committees, requests and receives information concerning the annual consideration of the renewal of the fund's Advisory Contracts. The Board also meets as needed to consider matters specifically related to the Board's annual consideration of the renewal of Advisory Contracts. Members of the Board may also meet with trustees of other Fidelity funds through ad hoc joint committees to discuss certain matters relevant to the Fidelity funds.
At its September 2013 meeting, the Board, including the Independent Trustees, unanimously determined to renew the fund's Advisory Contracts. In reaching its determination, the Board considered all factors it believed relevant, including (i) the nature, extent, and quality of the services to be provided to the fund and its shareholders (including the investment performance of the fund); (ii) the competitiveness of the fund's management fee and total expense ratio relative to peer funds; (iii) the total costs of the services to be provided by and the profits to be realized by Fidelity from its relationship with the fund; (iv) the extent to which economies of scale exist and would be realized as the fund grows; and (v) whether fee levels reflect these economies of scale, if any, for the benefit of fund shareholders.
In considering whether to renew the Advisory Contracts for the fund, the Board reached a determination, with the assistance of fund counsel and Independent Trustees' counsel and through the exercise of its business judgment, that the renewal of the Advisory Contracts was in the best interests of the fund and its shareholders and that the compensation payable under the Advisory Contracts was fair and reasonable. The Board's decision to renew the Advisory Contracts was not based on any single factor, but rather was based on a comprehensive consideration of all the information provided to the Board at its meetings throughout the year. The Board, in reaching its determination to renew the Advisory Contracts, was aware that shareholders in the fund have a broad range of investment choices available to them, including a wide choice among mutual funds offered by Fidelity's competitors, and that the fund's shareholders, who have the opportunity to review and weigh the disclosure provided by the fund in its prospectus and other public disclosures, have chosen to invest in this fund, which is part of the Fidelity family of funds.
Annual Report
Board Approval of Investment Advisory Contracts and
Management Fees - continued
Nature, Extent, and Quality of Services Provided. The Board considered Fidelity's staffing as it relates to the fund, including the backgrounds of investment personnel of FMR and the sub-advisers (together, the Investment Advisers), and also considered the fund's investment objective, strategies, and related investment philosophy. The Independent Trustees also had discussions with senior management of Fidelity's investment operations and investment groups. The Board considered the structure of the portfolio manager compensation program and whether this structure provides appropriate incentives to act in the best interests of the fund.
Resources Dedicated to Investment Management and Support Services. The Board reviewed the general qualifications and capabilities of Fidelity's investment staff, including its size, education, experience, and resources, as well as Fidelity's approach to recruiting, managing, and compensating investment personnel. The Board noted that Fidelity has continued to increase the resources devoted to non-U.S. offices, including expansion of Fidelity's global investment organization. The Board also noted that Fidelity's analysts have extensive resources, tools and capabilities that allow them to conduct sophisticated quantitative and fundamental analysis, as well as credit analysis of issuers, counterparties and guarantors. Further, the Board believes that Fidelity's investment professionals have sufficient access to global information and data so as to provide competitive investment results over time, and that those professionals also have access to sophisticated tools that permit them to assess portfolio construction and risk and performance attribution characteristics continuously, as well as to transmit new information and research conclusions rapidly around the world. Additionally, in its deliberations, the Board considered Fidelity's trading and risk management capabilities and resources, which are an integral part of the investment management process.
Shareholder and Administrative Services. The Board considered (i) the nature, extent, quality, and cost of advisory, administrative, and shareholder services performed by the Investment Advisers and their affiliates under the Advisory Contracts and under separate agreements covering transfer agency, pricing and bookkeeping, and securities lending services for the fund; (ii) the nature and extent of the supervision of third party service providers, principally custodians and subcustodians; and (iii) the resources devoted to, and the record of compliance with, the fund's compliance policies and procedures.
Annual Report
The Board noted that the growth of fund assets over time across the complex allows Fidelity to reinvest in the development of services designed to enhance the value or convenience of the Fidelity funds as investment vehicles. These services include 24-hour access to account information and market information through telephone representatives and over the Internet, investor education materials and asset allocation tools, and the expanded availability of Fidelity Investor Centers.
Investment in a Large Fund Family. The Board considered the benefits to shareholders of investing in a Fidelity fund, including the benefits of investing in a fund that is part of a large family of funds offering a variety of investment disciplines and providing a large variety of mutual fund investor services. The Board noted that Fidelity had taken, or had made recommendations that resulted in the Fidelity funds taking, a number of actions over the previous year that benefited particular funds, including (i) continuing to dedicate additional resources to investment research and to the support of the senior management team that oversees asset management; (ii) persisting in efforts to enhance Fidelity's global research capabilities; (iii) launching new funds and making other enhancements to meet client needs for global and income-oriented solutions; (iv) continuing to launch dedicated lower cost underlying funds to meet portfolio construction needs related to expanding underlying fund options for Fidelity funds of funds, specifically for the Freedom Fund product lines; (v) rationalizing product lines and gaining increased efficiencies through the combination of several funds with other funds; (vi) strengthening Fidelity's index fund offerings by reducing investment minimums and adopting or lowering existing expense caps for certain funds and classes; (vii) enhancing Global Asset Allocation product offerings by launching new funds and strategies, including "open architecture" target date funds that utilize affiliated and unaffiliated sub-advisers; (viii) modifying the eligibility criteria for Institutional Class shares of Advisor funds to increase their marketability to a portion of the defined contribution plan market; (ix) creating a new low-cost retirement share class for certain Advisor funds to appeal to large retirement plans; (x) transitioning the management of certain Fidelity commodity funds to Geode Capital Management LLC, a registered commodity pool operator, while retaining administrative responsibilities for the funds; and (xi) taking steps toward establishing a new Fidelity adviser to manage sector-based funds and products.
Investment Performance. The Board considered whether the fund has operated in accordance with its investment objective, as well as its record of compliance with its investment restrictions and its performance history.
The Board took into account discussions with the Investment Advisers about fund investment performance that occur at Board meetings throughout the year. In this regard the Board noted that as part of regularly scheduled fund reviews and other reports to the Board on fund performance, the Board periodically considers annualized return information for the fund for different time periods, measured against a securities market index ("benchmark index") and a peer group of mutual funds with similar objectives ("peer group"). In its evaluation of fund investment performance at meetings throughout the year, the Board gave particular attention to information indicating underperformance of certain Fidelity funds for specific time periods and the Investment Advisers' explanations for such underperformance.
Annual Report
Board Approval of Investment Advisory Contracts and
Management Fees - continued
In addition to reviewing absolute and relative fund performance, the Independent Trustees periodically consider the appropriateness of fund performance metrics in evaluating the results achieved. In general, the Independent Trustees believe that fund performance should be evaluated based on gross performance (before fees and expenses but after transaction costs) compared to appropriate benchmark indices, over appropriate time periods that may include full market cycles, and on net performance (after fees and expenses) compared to peer groups, as applicable, over the same periods, taking into account relevant factors including the following: general market conditions; expectations for interest rate levels and credit conditions; issuer-specific information including credit quality; tactical opportunities for investment; the potential for incremental return versus the fund's benchmark index weighed against the risks involved in obtaining that incremental return, including the risk of diminished or negative total returns; and fund cash flows and other factors. Depending on the circumstances, the Independent Trustees may be satisfied with a fund's performance notwithstanding that it lags its benchmark index or peer group for certain periods.
The Independent Trustees recognize that shareholders evaluate performance on a net basis over their own holding periods, for which one-, three-, and five-year periods are often used as a proxy. For this reason, the performance information reviewed by the Board also included net cumulative calendar year total return information for the fund and an appropriate benchmark index and peer group for the most recent one-, three-, and five-year periods.
Based on its review, the Board concluded that the nature, extent, and quality of services provided to the fund under the Advisory Contracts should benefit the fund's shareholders.
Competitiveness of Management Fee and Total Expense Ratio. The Board considered the fund's management fee and total expense ratio compared to "mapped groups" of competitive funds and classes. Fidelity creates "mapped groups" by combining similar Lipper investment objective categories that have comparable investment mandates. Combining Lipper investment objective categories aids the Board's management fee and total expense ratio comparisons by broadening the competitive group used for comparison and by reducing the number of universes to which various Fidelity funds are compared.
Annual Report
Management Fee. The Board considered two proprietary management fee comparisons for the 12-month periods shown in the chart below. The group of Lipper funds used by the Board for management fee comparisons is referred to below as the "Total Mapped Group" and, for the reasons explained above, is broader than the Lipper peer group used by the Board for performance comparisons. The Total Mapped Group comparison focuses on a fund's standing in terms of gross management fees before expense reimbursements or caps relative to the total universe of funds with comparable investment mandates, regardless of whether their management fee structures also are comparable. "TMG %" represents the percentage of funds in the Total Mapped Group that had management fees that were lower than the fund's. For example, a hypothetical TMG % of 50% would mean that half of the funds in the Total Mapped Group had higher, and half had lower, management fees than the fund. The fund's actual TMG %s are in the chart below. The "Asset-Size Peer Group" (ASPG) comparison focuses on a fund's standing relative to a subset of non-Fidelity funds within the Total Mapped Group that are similar in size and management fee structure. For example, if a fund is in the first quartile of the ASPG, the fund's management fee ranks in the least expensive or lowest 25% of funds in the ASPG. The ASPG represents at least 15% of the funds in the Total Mapped Group with comparable asset size and management fee structures, subject to a minimum of 50 funds (or all funds in the Total Mapped Group if fewer than 50). Additional information, such as the ASPG quartile in which the fund's management fee rate ranked, is also included in the chart and considered by the Board. Because the vast majority of competitor funds' management fees do not cover non-management expenses, for a more meaningful comparison of management fees, the fund is compared on the basis of a hypothetical "net management fee," which is derived by subtracting payments made by FMR for non-management expenses (including transfer agent fees, pricing and bookkeeping fees, and fees paid to non-affiliated custodians) from the fund's all-inclusive fee. In this regard, the Board considered that net management fees can vary from year to year because of differences in non-management expenses.
Annual Report
Board Approval of Investment Advisory Contracts and
Management Fees - continued
Fidelity Limited Term Government Fund
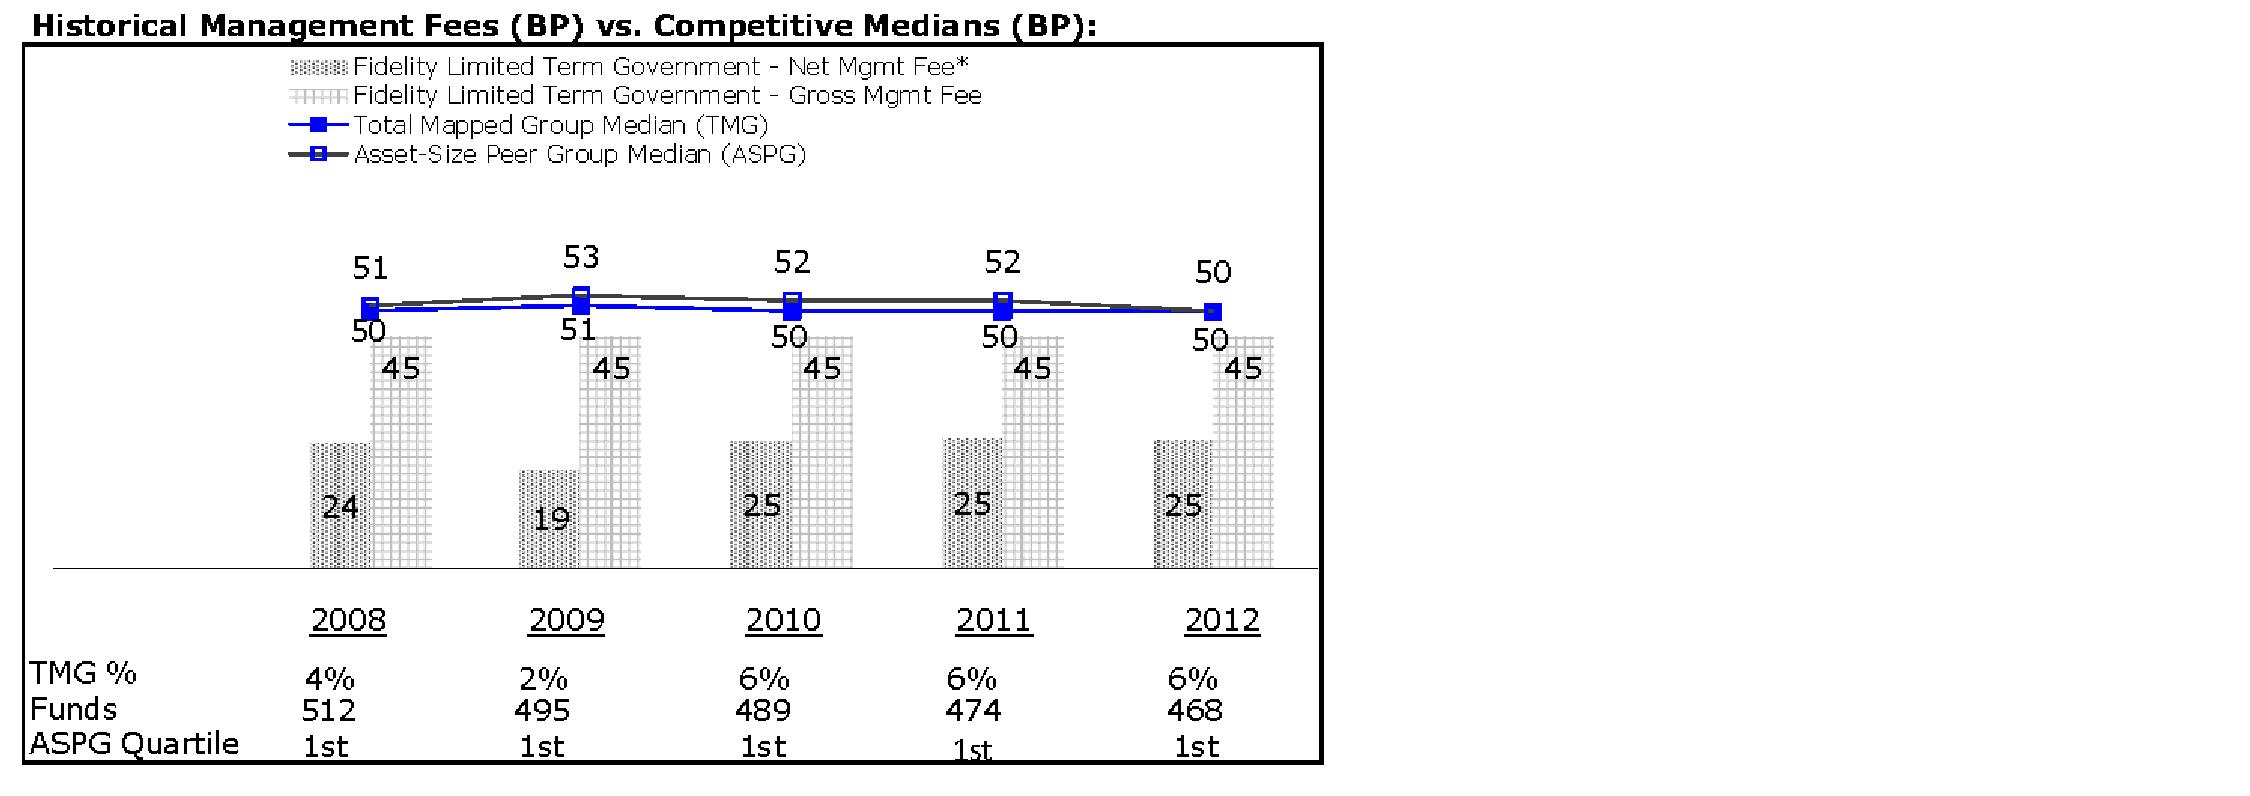
The Board noted that the fund's hypothetical net management fee rate ranked below the median of its Total Mapped Group and below the median of its ASPG for 2012.
Based on its review, the Board concluded that the fund's management fee is fair and reasonable in light of the services that the fund receives and the other factors considered.
Total Expense Ratio. In its review of the fund's total expense ratio, the Board considered the fund's hypothetical net management fee as well as the fund's all-inclusive fee. The Board also considered other expenses, such as transfer agent fees, pricing and bookkeeping fees, and custodial, legal, and audit fees, paid by FMR under the all-inclusive arrangement. The Board also noted the effects of any waivers and reimbursements on fees and expenses. As part of its review, the Board also considered the current and historical total expense ratios of the fund compared to competitive fund median expenses. The fund is compared to those funds and classes in the Total Mapped Group (used by the Board for management fee comparisons) that have a similar sales load structure.
The Board noted that the fund's total expense ratio ranked below its competitive median for 2012.
Fees Charged to Other Fidelity Clients. The Board also considered Fidelity fee structures and other information with respect to clients of Fidelity, such as other mutual funds advised or subadvised by Fidelity, pension plan clients, and other institutional clients. The Board noted the findings of the 2013 ad hoc joint committee (created with the board of other Fidelity funds), which reviewed and compared Fidelity's institutional investment advisory business with its business of providing services to the Fidelity funds, including the differences in services provided, fees charged, and costs incurred, as well as competition in their respective marketplaces.
Annual Report
Based on its review of total expense ratios and fees charged to other Fidelity clients, the Board concluded that the fund's total expense ratio was reasonable in light of the services that the fund and its shareholders receive and the other factors considered.
Costs of the Services and Profitability. The Board considered the revenues earned and the expenses incurred by Fidelity in conducting the business of developing, marketing, distributing, managing, administering and servicing the fund and servicing the fund's shareholders. The Board also considered the level of Fidelity's profits in respect of all the Fidelity funds.
On an annual basis, Fidelity presents to the Board Fidelity's profitability for the fund. Fidelity calculates the profitability for each fund, as well as aggregate profitability for groups of Fidelity funds and all Fidelity funds, using a series of detailed revenue and cost allocation methodologies which originate with the books and records of Fidelity on which Fidelity's audited financial statements are based. The Audit Committee of the Board reviews any significant changes from the prior year's methodologies.
PricewaterhouseCoopers LLP (PwC), independent registered public accounting firm and auditor to Fidelity and certain Fidelity funds, has been engaged annually by the Board as part of the Board's assessment of Fidelity's profitability analysis. PwC's engagement includes the review and assessment of the methodologies used by Fidelity in determining the revenues and expenses attributable to Fidelity's mutual fund business, and completion of agreed-upon procedures surrounding the mathematical accuracy of fund profitability and its conformity to allocation methodologies. After considering PwC's reports issued under the engagement and information provided by Fidelity, the Board concluded that while other allocation methods may also be reasonable, Fidelity's profitability methodologies are reasonable in all material respects.
The Board also reviewed Fidelity's non-fund businesses and fall-out benefits related to the mutual fund business as well as cases where Fidelity's affiliates may benefit from or be related to the fund's business.
The Board considered the costs of the services provided by and the profits realized by Fidelity in connection with the operation of the fund and was satisfied that the profitability was not excessive in the circumstances.
Economies of Scale. The Board considered whether there have been economies of scale in respect of the management of the Fidelity funds, whether the Fidelity funds (including the fund) have appropriately benefited from any such economies of scale, and whether there is potential for realization of any further economies of scale. The Board considered the extent to which the fund will benefit from economies of scale through increased services to the fund, through waivers or reimbursements, or through fee or expense reductions. The Board also noted that in 2009, it and the board of other Fidelity funds created an ad hoc committee (the Economies of Scale Committee) to analyze whether Fidelity attains economies of scale in respect of the management and servicing of the Fidelity funds, whether the Fidelity funds have appropriately benefited from such economies of scale, and whether there is potential for realization of any further economies of scale.
Annual Report
Board Approval of Investment Advisory Contracts and
Management Fees - continued
The Board concluded, taking into account the analysis of the Economies of Scale Committee, that economies of scale, if any, are being appropriately shared between fund shareholders and Fidelity.
Additional Information Requested by the Board. In order to develop fully the factual basis for consideration of the Fidelity funds' Advisory Contracts, the Board requested and received additional information on certain topics, including: (i) Fidelity's fund profitability methodology, profitability trends for certain funds, and the impact of certain factors on fund profitability results; (ii) portfolio manager changes that have occurred during the past year and the amount of the investment that each portfolio manager has made in the Fidelity fund(s) that he or she manages; (iii) Fidelity's compensation structure for portfolio managers, research analysts, and other key personnel, including its effects on fund profitability, the rationale for the compensation structure, and the extent to which current market conditions have affected retention and recruitment; (iv) the arrangements with and compensation paid to certain fund sub-advisers on behalf of the Fidelity funds; (v) Fidelity's fee structures, including the group fee structure and definition of group assets, and the rationale for recommending different fees among different categories of funds and classes; (vi) Fidelity's voluntary waiver of its fees to maintain minimum yields for certain money market funds and classes as well as contractual waivers in place for certain funds; (vii) the methodology with respect to competitive fund data and peer group classifications; (viii) Fidelity's transfer agent fee, expense, and service structures for different funds and classes, and the impact of the increased use of omnibus accounts; and (ix) explanations regarding the relative total expense ratios of certain funds and classes, total expense competitive trends and methodologies for total expense competitive comparisons, and actions that might be taken by Fidelity to reduce total expense ratios for certain funds and classes or to achieve further economies of scale.
Based on its evaluation of all of the conclusions noted above, and after considering all factors it believed relevant, the Board ultimately concluded that the advisory fee structures are fair and reasonable, and that the fund's Advisory Contracts should be renewed.
Annual Report
Investment Adviser
Fidelity Management & Research Company
Boston, MA
Investment Sub-Advisers
Fidelity Investments Money
Management, Inc.
Fidelity Management & Research
(U.K.) Inc.
Fidelity Management & Research
(Hong Kong) Limited
Fidelity Management & Research
(Japan) Inc.
General Distributor
Fidelity Distributors Corporation
Smithfield, RI
Transfer and Service Agents
Fidelity Investments Institutional Operations Company, Inc.
Boston, MA
Fidelity Service Company, Inc.
Boston, MA
Custodian
The Bank of New York Mellon
New York, NY
The Fidelity Telephone Connection
Mutual Fund 24-Hour Service
Exchanges/Redemptions
and Account Assistance 1-800-544-6666
Product Information 1-800-544-6666
Retirement Accounts 1-800-544-4774
(8 a.m. - 9 p.m.)
TDD Service 1-800-544-0118
for the deaf and hearing impaired
(9 a.m. - 9 p.m. Eastern time)
Fidelity Automated Service
Telephone (FAST®) 1-800-544-5555
Automated line for quickest service
(Fidelity Investment logo)(registered trademark)
Corporate Headquarters
245 Summer St., Boston, MA 02210
www.fidelity.com
ISG-UANN-0114
1.968334.100
Item 2. Code of Ethics
As of the end of the period, November 30, 2013, Fidelity Advisor Series IV (the trust) has adopted a code of ethics, as defined in Item 2 of Form N-CSR, that applies to its President and Treasurer and its Chief Financial Officer. A copy of the code of ethics is filed as an exhibit to this Form N-CSR.
Item 3. Audit Committee Financial Expert
The Board of Trustees of the trust has determined that James H. Keyes is an audit committee financial expert, as defined in Item 3 of Form N-CSR. Mr. Keyes is independent for purposes of Item 3 of Form N-CSR.
Item 4. Principal Accountant Fees and Services
Fees and Services
The following table presents fees billed by PricewaterhouseCoopers LLP ("PwC") in each of the last two fiscal years for services rendered to Fidelity Limited Term Government Fund (the "Fund"):
Services Billed by PwC
November 30, 2013 FeesA
| Audit Fees | Audit-Related Fees | Tax Fees | All Other Fees |
Fidelity Limited Term Government Fund | $59,000 | $- | $3,300 | $1,600 |
November 30, 2012 FeesA
| Audit Fees | Audit-Related Fees | Tax Fees | All Other Fees |
Fidelity Limited Term Government Fund | $57,000 | $- | $3,300 | $1,700 |
A Amounts may reflect rounding.
The following table presents fees billed by PwC that were required to be approved by the Audit Committee for services that relate directly to the operations and financial reporting of the Fund and that are rendered on behalf of Fidelity Management & Research Company ("FMR") and entities controlling, controlled by, or under common control with FMR (not including any sub-adviser whose role is primarily portfolio management and is subcontracted with or overseen by another investment adviser) that provide ongoing services to the Fund ("Fund Service Providers"):
Services Billed by PwC
| November 30, 2013A | November 30, 2012A |
Audit-Related Fees | $4,860,000 | $5,130,000 |
Tax Fees | $- | $- |
All Other Fees | $50,000 | $- |
A Amounts may reflect rounding.
"Audit-Related Fees" represent fees billed for assurance and related services that are reasonably related to the performance of the fund audit or the review of the fund's financial statements and that are not reported under Audit Fees.
"Tax Fees" represent fees billed for tax compliance, tax advice or tax planning that relate directly to the operations and financial reporting of the fund.
"All Other Fees" represent fees billed for services provided to the fund or Fund Service Provider, a significant portion of which are assurance related, that relate directly to the operations and financial reporting of the fund, excluding those services that are reported under Audit Fees, Audit-Related Fees or Tax Fees.
Assurance services must be performed by an independent public accountant.
* * *
The aggregate non-audit fees billed by PwC for services rendered to the Fund, FMR (not including any sub-adviser whose role is primarily portfolio management and is subcontracted with or overseen by another investment adviser), and any Fund Service Provider for each of the last two fiscal years of the Fund are as follows:
Billed By | November 30, 2013 A | November 30, 2012 A |
PwC | $5,445,000 | $6,045,000 |
A Amounts may reflect rounding.
The trust's Audit Committee has considered non-audit services that were not pre-approved that were provided by PwC to Fund Service Providers to be compatible with maintaining the independence of PwC in its audit of the Fund, taking into account representations from PwC, in accordance with Public Company Accounting Oversight Board rules, regarding its independence from the Fund and its related entities and FMR's review of the appropriateness and permissibility under applicable law of such non-audit services prior to their provision to the Fund Service Providers.
Audit Committee Pre-Approval Policies and Procedures
The trust's Audit Committee must pre-approve all audit and non-audit services provided by a fund's independent registered public accounting firm relating to the operations or financial reporting of the fund. Prior to the commencement of any audit or non-audit services to a fund, the Audit Committee reviews the services to determine whether they are appropriate and permissible under applicable law.
The Audit Committee has adopted policies and procedures to, among other purposes, provide a framework for the Committee's consideration of non-audit services by the audit firms that audit the Fidelity funds. The policies and procedures require that any non-audit service provided by a fund audit firm to a Fidelity fund and any non-audit service provided by a fund auditor to a Fund Service Provider that relates directly to the operations and financial reporting of a Fidelity fund ("Covered Service") are subject to approval by the Audit Committee before such service is provided.
All Covered Services must be approved in advance of provision of the service either: (i) by formal resolution of the Audit Committee, or (ii) by oral or written approval of the service by the Chair of the Audit Committee (or if the Chair is unavailable, such other member of the Audit Committee as may be designated by the Chair to act in the Chair's absence). The approval contemplated by (ii) above is permitted where the Treasurer determines that action on such an engagement is necessary before the next meeting of the Audit Committee.
Non-audit services provided by a fund audit firm to a Fund Service Provider that do not relate directly to the operations and financial reporting of a Fidelity fund are reported to the Audit Committee on a periodic basis.
Non-Audit Services Approved Pursuant to Rule 2-01(c)(7)(i)(C) and (ii) of Regulation S-X ("De Minimis Exception")
There were no non-audit services approved or required to be approved by the Audit Committee pursuant to the De Minimis Exception during the Fund's last two fiscal years relating to services provided to (i) the Fund or (ii) any Fund Service Provider that relate directly to the operations and financial reporting of the Fund.
Item 5. Audit Committee of Listed Registrants
Not applicable.
Item 6. Investments
(a) Not applicable.
(b) Not applicable
Item 7. Disclosure of Proxy Voting Policies and Procedures for Closed-End Management Investment Companies
Not applicable.
Item 8. Portfolio Managers of Closed-End Management Investment Companies
Not applicable.
Item 9. Purchase of Equity Securities by Closed-End Management Investment Company and Affiliated Purchasers
Not applicable.
Item 10. Submission of Matters to a Vote of Security Holders
There were no material changes to the procedures by which shareholders may recommend nominees to the trust's Board of Trustees.
Item 11. Controls and Procedures
(a)(i) The President and Treasurer and the Chief Financial Officer have concluded that the trust's disclosure controls and procedures (as defined in Rule 30a-3(c) under the Investment Company Act) provide reasonable assurances that material information relating to the trust is made known to them by the appropriate persons, based on their evaluation of these controls and procedures as of a date within 90 days of the filing date of this report.
(a)(ii) There was no change in the trust's internal control over financial reporting (as defined in Rule 30a-3(d) under the Investment Company Act) that occurred during the second fiscal quarter of the period covered by this report that has materially affected, or is reasonably likely to materially affect, the trust's internal control over financial reporting.
Item 12. Exhibits
(a) | (1) | Code of Ethics pursuant to Item 2 of Form N-CSR is filed and attached hereto as EX-99.CODE ETH. |
(a) | (2) | Certification pursuant to Rule 30a-2(a) under the Investment Company Act of 1940 (17 CFR 270.30a-2(a)) is filed and attached hereto as Exhibit 99.CERT. |
(a) | (3) | Not applicable. |
(b) | | Certification pursuant to Rule 30a-2(b) under the Investment Company Act of 1940 (17 CFR 270.30a-2(b)) is furnished and attached hereto as Exhibit 99.906CERT. |
SIGNATURES
Pursuant to the requirements of the Securities Exchange Act of 1934 and the Investment Company Act of 1940, the registrant has duly caused this report to be signed on its behalf by the undersigned, thereunto duly authorized.
Fidelity Advisor Series IV
By: | /s/ Stephanie J/ Dorsey |
| Stephanie J. Dorsey |
| President and Treasurer |
| |
Date: | January 27, 2014 |
Pursuant to the requirements of the Securities Exchange Act of 1934 and the Investment Company Act of 1940, this report has been signed below by the following persons on behalf of the registrant and in the capacities and on the dates indicated.
By: | /s/Stephanie J/ Dorsey |
| Stephanie J. Dorsey |
| President and Treasurer |
| |
Date: | January 27, 2014 |
By: | /s/Christine Reynolds |
| Christine Reynolds |
| Chief Financial Officer |
| |
Date: | January 27, 2014 |