UNITED STATES
SECURITIES AND EXCHANGE COMMISSION
Washington, D.C. 20549
FORM N-CSR
CERTIFIED SHAREHOLDER REPORT OF REGISTERED
MANAGEMENT INVESTMENT COMPANIES
Investment Company Act file number 811-03737
Fidelity Advisor Series IV
(Exact name of registrant as specified in charter)
245 Summer St., Boston, Massachusetts 02210
(Address of principal executive offices) (Zip code)
Cynthia Lo Bessette, Secretary
245 Summer St.
Boston, Massachusetts 02210
(Name and address of agent for service)
Registrant's telephone number, including area code:
617-563-7000
| |
Date of fiscal year end: | November 30 |
|
|
Date of reporting period: | November 30, 2022 |
Item 1.
Reports to Stockholders
Fidelity® Limited Term Government Fund
Annual Report
November 30, 2022
Contents
To view a fund's proxy voting guidelines and proxy voting record for the 12-month period ended June 30, visit http://www.fidelity.com/proxyvotingresults or visit the Securities and Exchange Commission's (SEC) web site at http://www.sec.gov.
You may also call 1-800-544-8544 to request a free copy of the proxy voting guidelines.
Standard & Poor's, S&P and S&P 500 are registered service marks of The McGraw-Hill Companies, Inc. and have been licensed for use by Fidelity Distributors Corporation.
Other third-party marks appearing herein are the property of their respective owners.
All other marks appearing herein are registered or unregistered trademarks or service marks of FMR LLC or an affiliated company. © 2023 FMR LLC. All rights reserved.
This report and the financial statements contained herein are submitted for the general information of the shareholders of the Fund. This report is not authorized for distribution to prospective investors in the Fund unless preceded or accompanied by an effective prospectus.
A fund files its complete schedule of portfolio holdings with the SEC for the first and third quarters of each fiscal year on Form N-PORT. Forms N-PORT are available on the SEC's web site at http://www.sec.gov. A fund's Forms N-PORT may be reviewed and copied at the SEC's Public Reference Room in Washington, DC. Information regarding the operation of the SEC's Public Reference Room may be obtained by calling 1-800-SEC-0330.
For a complete list of a fund's portfolio holdings, view the most recent holdings listing, semiannual report, or annual report on Fidelity's web site at http://www.fidelity.com, http://www.institutional.fidelity.com, or http://www.401k.com, as applicable.
NOT FDIC INSURED •MAY LOSE VALUE •NO BANK GUARANTEE
Neither the Fund nor Fidelity Distributors Corporation is a bank.
Average annual total return reflects the change in the value of an investment, assuming reinvestment of distributions from dividend income and capital gains (the profits earned upon the sale of securities that have grown in value, if any) and assuming a constant rate of performance each year. The hypothetical investment and the average annual total returns do not reflect the deduction of taxes that a shareholder would pay on fund distributions or the redemption of fund shares. During periods of reimbursement by Fidelity, a fund's total return will be greater than it would be had the reimbursement not occurred. How a fund did yesterday is no guarantee of how it will do tomorrow.
| Average Annual Total Returns |
| | | | |
Periods ended November 30, 2022 | Past 1 year | Past 5 years | Past 10 years |
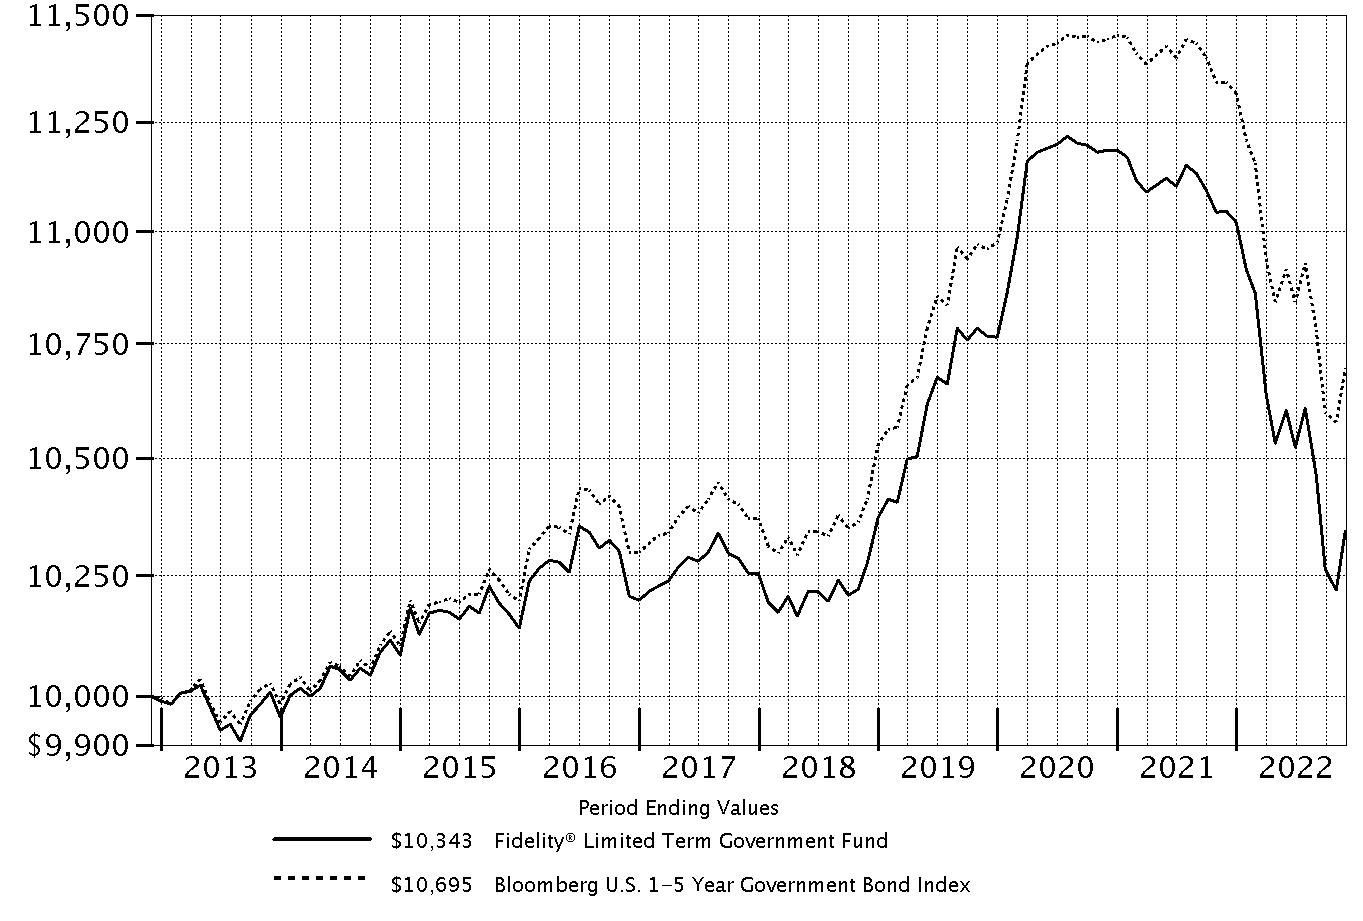
| Fidelity® Limited Term Government Fund | -6.37% | 0.17% | 0.34% |
| $10,000 Over 10 Years |
| |
Let's say hypothetically that $10,000 was invested in Fidelity® Limited Term Government Fund on November 30, 2012. The chart shows how the value of your investment would have changed, and also shows how the Bloomberg U.S. 1-5 Year Government Bond Index performed over the same period. |
|
|
Market Recap:
U.S. taxable investment-grade bonds notably declined for the 12 months ending November 30, 2022, as a multitude of crosscurrents challenged the global economy and financial markets. The Bloomberg U.S. Aggregate Bond Index returned -12.84%. In late 2021, the Federal Reserve began its pivot to a tighter monetary policy, tapering the large-scale asset purchases it initially started in 2008, at the heart of the financial crisis, and dramatically expanded in 2020 amid the COVID-19 pandemic. By early 2022, the Fed, faced with persistent inflationary pressure, implemented an aggressive series of policy rate hikes, raising its benchmark interest rate six times, by a total of 3.75%, between March and November. This represented the fastest-ever pace of monetary tightening and helped push nominal and real (inflation-adjusted) U.S. bond yields to their highest level in more than a decade. Bond prices, which move inversely to yields, fell sharply. Credit spreads significantly widened, as investors demanded more yield for buying corporate debt and other credit-sensitive assets. For much of the past year, short-term Treasuries outperformed, but late in the period the yield curve meaningfully inverted, with longer Treasury yields dropping below short rates, reflecting investor expectations of an economic slowdown that would eventually drive yields lower. All major market segments lost ground for the 12 months, with higher-quality, shorter-term bonds holding up best. Spread sectors broadly trailed Treasuries on a duration-adjusted basis.
Comments from Co-Managers Franco Castagliuolo and Sean Corcoran:
For the fiscal year ending November 30, 2022, the fund had a return of -6.37%, lagging, net of fees, the -5.71% result of the benchmark, the Bloomberg US 1-5 Year Government Bond Index. In managing the fund, we attempted to exploit market inefficiencies and identify attractively valued securities, in accordance with our longer-term strategy. During the 12-month period, the fund's duration (interest rate) positioning was a notable detractor from performance versus the benchmark. The fund had somewhat more interest rate sensitivity, as measured by its longer duration, than the benchmark during the reporting period, based on our view that the Fed would take a more measured pace to raising interest rates. But our longer duration put the fund at a relative disadvantage when inflation surged, and the Fed raised interest rates more aggressively than we anticipated. Out-of-index exposure to mortgages was another drag on relative performance, as spreads between these securities and U.S. Treasuries widened to compensate investors for elevated prepayment activity. In contrast, yield-curve positioning among Treasuries added value this period, with the fund's overweighting in shorter-term securities in this segment boosting the relative result. Likewise, a larger-than-benchmark exposure to shorter-term agency debentures also helped versus the benchmark, given their outperformance.
The views expressed above reflect those of the portfolio manager(s) only through the end of the period as stated on the cover of this report and do not necessarily represent the views of Fidelity or any other person in the Fidelity organization. Any such views are subject to change at any time based upon market or other conditions and Fidelity disclaims any responsibility to update such views. These views may not be relied on as investment advice and, because investment decisions for a Fidelity fund are based on numerous factors, may not be relied on as an indication of trading intent on behalf of any Fidelity fund.
| Coupon Distribution (% of Fund's Investments) |
| |
| 0.01 - 0.99% | 28.3 | |
| 1 - 1.99% | 17.2 | |
| 2 - 2.99% | 16.8 | |
| 3 - 3.99% | 10.1 | |
| 4 - 4.99% | 5.0 | |
| 5 - 5.99% | 4.5 | |
| 6 - 6.99% | 0.1 | |
| 7 - 7.99% | 0.0 | |
| 8 - 8.99% | 0.0 | |
| Coupon distribution shows the range of stated interest rates on the fund's investments, excluding short-term investments. |
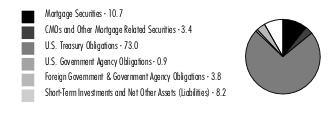
Asset Allocation (% of Fund's net assets) |
|
Foreign investments - 3.8% |
Futures and Swaps - 29.8% |
Percentages in the above tables are adjusted for the effect of TBA Sale Commitments. |
|
Percentages shown as 0.0% may reflect amounts less than 0.05%.
Showing Percentage of Net Assets
| U.S. Government and Government Agency Obligations - 73.9% |
| | | Principal Amount (a) | Value ($) |
| U.S. Government Agency Obligations - 0.6% | | | |
| Fannie Mae 0.625% 4/22/25 | | 319,000 | 292,149 |
| Freddie Mac 4% 11/25/24 | | 1,500,000 | 1,478,978 |
TOTAL U.S. GOVERNMENT AGENCY OBLIGATIONS | | | 1,771,127 |
| U.S. Treasury Obligations - 73.0% | | | |
| U.S. Treasury Bonds: | | | |
| 2.875% 5/15/52 | | 520,000 | 432,250 |
| 3% 8/15/52 | | 620,000 | 530,875 |
| 3.25% 5/15/42 (b) | | 800,000 | 718,625 |
| 3.375% 8/15/42 | | 200,000 | 182,969 |
| U.S. Treasury Notes: | | | |
| 0.125% 10/15/23 | | 574,000 | 551,309 |
| 0.25% 5/15/24 | | 258,000 | 242,308 |
| 0.25% 7/31/25 | | 17,354,000 | 15,671,476 |
| 0.25% 9/30/25 | | 14,373,000 | 12,931,770 |
| 0.25% 10/31/25 | | 5,600,000 | 5,019,000 |
| 0.375% 10/31/23 | | 6,000,000 | 5,765,391 |
| 0.375% 4/30/25 | | 18,223,000 | 16,635,606 |
| 0.375% 12/31/25 | | 1,226,000 | 1,097,605 |
| 0.5% 11/30/23 | | 22,700,000 | 21,762,739 |
| 0.75% 3/31/26 | | 939,000 | 844,403 |
| 0.75% 8/31/26 | | 1,200,000 | 1,065,750 |
| 0.875% 9/30/26 | | 6,500,000 | 5,790,332 |
| 1.125% 10/31/26 | | 800,000 | 718,375 |
| 1.125% 8/31/28 | | 2,368,000 | 2,041,938 |
| 1.25% 12/31/26 | | 7,902,000 | 7,108,096 |
| 1.375% 1/31/25 | | 2,300,000 | 2,162,898 |
| 1.5% 2/29/24 | | 18,000,000 | 17,320,781 |
| 1.5% 9/30/24 | | 7,921,000 | 7,514,120 |
| 1.5% 10/31/24 | | 3,410,000 | 3,230,709 |
| 1.5% 1/31/27 | | 1,144,000 | 1,038,180 |
| 1.5% 11/30/28 | | 125,000 | 109,624 |
| 1.625% 9/30/26 | | 552,000 | 506,783 |
| 1.75% 7/31/24 | | 7,660,000 | 7,320,985 |
| 2% 5/31/24 | | 4,240,000 | 4,081,994 |
| 2.25% 4/30/24 | | 3,560,000 | 3,444,717 |
| 2.375% 3/31/29 (b)(c) | | 1,300,000 | 1,196,355 |
| 2.5% 3/31/27 | | 15,200,000 | 14,353,906 |
| 2.75% 2/15/24 | | 18,612,000 | 18,199,046 |
| 2.75% 4/30/27 | | 2,200,000 | 2,098,938 |
| 2.75% 7/31/27 | | 3,100,000 | 2,953,719 |
| 3% 6/30/24 | | 15,800,000 | 15,427,219 |
| 3.875% 11/30/27 | | 2,830,000 | 2,840,613 |
| 3.875% 11/30/29 | | 500,000 | 504,375 |
| 4.125% 10/31/27 | | 6,500,000 | 6,582,773 |
| 4.375% 10/31/24 | | 1,300,000 | 1,299,695 |
TOTAL U.S. TREASURY OBLIGATIONS | | | 211,298,247 |
| Other Government Related - 0.3% | | | |
| Private Export Funding Corp. Secured 1.75% 11/15/24 | | 1,050,000 | 988,180 |
| TOTAL U.S. GOVERNMENT AND GOVERNMENT AGENCY OBLIGATIONS (Cost $226,904,691) | | | 214,057,554 |
| | | | |
| U.S. Government Agency - Mortgage Securities - 10.7% |
| | | Principal Amount (a) | Value ($) |
| Fannie Mae - 2.5% | | | |
| 12 month U.S. LIBOR + 1.360% 3.615% 10/1/35 (d)(e) | | 2,517 | 2,511 |
| 12 month U.S. LIBOR + 1.460% 3.148% 1/1/35 (d)(e) | | 3,962 | 3,952 |
| 12 month U.S. LIBOR + 1.480% 3.787% 7/1/34 (d)(e) | | 1,261 | 1,266 |
| 12 month U.S. LIBOR + 1.550% 1.986% 2/1/44 (d)(e) | | 2,723 | 2,717 |
| 12 month U.S. LIBOR + 1.550% 3.183% 5/1/44 (d)(e) | | 4,206 | 4,234 |
| 12 month U.S. LIBOR + 1.550% 3.803% 6/1/36 (d)(e) | | 765 | 773 |
| 12 month U.S. LIBOR + 1.560% 2.065% 3/1/37 (d)(e) | | 4,236 | 4,236 |
| 12 month U.S. LIBOR + 1.560% 2.42% 2/1/44 (d)(e) | | 6,093 | 6,093 |
| 12 month U.S. LIBOR + 1.570% 2.145% 4/1/44 (d)(e) | | 13,096 | 13,083 |
| 12 month U.S. LIBOR + 1.570% 3.32% 5/1/44 (d)(e) | | 48 | 48 |
| 12 month U.S. LIBOR + 1.580% 1.83% 1/1/44 (d)(e) | | 6,271 | 6,278 |
| 12 month U.S. LIBOR + 1.580% 2.08% 4/1/44 (d)(e) | | 4,513 | 4,503 |
| 12 month U.S. LIBOR + 1.620% 3.212% 3/1/33 (d)(e) | | 3,712 | 3,702 |
| 12 month U.S. LIBOR + 1.630% 2.987% 11/1/36 (d)(e) | | 5,912 | 5,942 |
| 12 month U.S. LIBOR + 1.640% 1.895% 6/1/47 (d)(e) | | 5,857 | 5,926 |
| 12 month U.S. LIBOR + 1.730% 3.442% 5/1/36 (d)(e) | | 1,394 | 1,410 |
| 12 month U.S. LIBOR + 1.750% 2.607% 7/1/35 (d)(e) | | 1,003 | 1,005 |
| 12 month U.S. LIBOR + 1.770% 2.071% 2/1/37 (d)(e) | | 16,464 | 16,544 |
| 12 month U.S. LIBOR + 1.800% 2.055% 1/1/42 (d)(e) | | 14,957 | 15,057 |
| 12 month U.S. LIBOR + 1.810% 2.304% 2/1/42 (d)(e) | | 8,834 | 8,885 |
| 12 month U.S. LIBOR + 1.850% 2.429% 4/1/36 (d)(e) | | 8,738 | 8,772 |
| 12 month U.S. LIBOR + 1.890% 3.222% 8/1/35 (d)(e) | | 8,262 | 8,337 |
| 6 month U.S. LIBOR + 1.510% 3.523% 2/1/33 (d)(e) | | 910 | 923 |
| 6 month U.S. LIBOR + 1.530% 2.785% 12/1/34 (d)(e) | | 1,555 | 1,552 |
| 6 month U.S. LIBOR + 1.530% 2.835% 3/1/35 (d)(e) | | 2,463 | 2,459 |
| 6 month U.S. LIBOR + 1.540% 4.295% 4/1/33 (d)(e) | | 13,688 | 13,842 |
| 6 month U.S. LIBOR + 1.550% 4.011% 10/1/33 (d)(e) | | 1,464 | 1,484 |
| 6 month U.S. LIBOR + 1.560% 3.64% 7/1/35 (d)(e) | | 1,230 | 1,255 |
| U.S. TREASURY 1 YEAR INDEX + 2.180% 3.646% 7/1/36 (d)(e) | | 7,211 | 7,284 |
| U.S. TREASURY 1 YEAR INDEX + 2.200% 2.583% 3/1/35 (d)(e) | | 915 | 929 |
| U.S. TREASURY 1 YEAR INDEX + 2.280% 4.408% 10/1/33 (d)(e) | | 1,971 | 2,008 |
| U.S. TREASURY 1 YEAR INDEX + 2.300% 4.303% 12/1/32 (d)(e) | | 36,789 | 37,412 |
| U.S. TREASURY 1 YEAR INDEX + 2.460% 4.163% 12/1/32 (d)(e) | | 73,613 | 74,692 |
| 1.5% 11/1/40 to 11/1/41 | | 3,091,519 | 2,523,366 |
| 2.5% 11/1/36 | | 416,548 | 386,557 |
| 3% 11/1/34 to 2/1/52 | | 1,191,629 | 1,107,314 |
| 3.5% 11/1/51 to 3/1/52 | | 1,221,678 | 1,124,068 |
| 4% 7/1/46 to 10/1/46 | | 911,274 | 888,921 |
| 4.5% 11/1/25 to 6/1/41 | | 234,318 | 233,002 |
| 5% 11/1/52 | | 349,545 | 352,970 |
| 5.5% 8/1/25 | | 4,030 | 4,020 |
| 6% to 6% 1/1/34 to 6/1/36 | | 141,848 | 147,649 |
| 6.5% 5/1/27 to 8/1/36 | | 139,300 | 146,021 |
TOTAL FANNIE MAE | | | 7,183,002 |
| Freddie Mac - 1.7% | | | |
| 12 month U.S. LIBOR + 1.750% 4% 9/1/41 (d)(e) | | 28,866 | 28,970 |
| 12 month U.S. LIBOR + 1.880% 4.13% 10/1/41 (d)(e) | | 36,250 | 36,548 |
| 12 month U.S. LIBOR + 1.900% 3.709% 10/1/42 (d)(e) | | 12,076 | 12,149 |
| 12 month U.S. LIBOR + 2.030% 4.158% 3/1/33 (d)(e) | | 104 | 103 |
| 12 month U.S. LIBOR + 2.040% 4.265% 7/1/36 (d)(e) | | 7,706 | 7,799 |
| 6 month U.S. LIBOR + 1.660% 3.54% 7/1/35 (d)(e) | | 9,030 | 9,171 |
| 6 month U.S. LIBOR + 1.880% 3.369% 10/1/36 (d)(e) | | 13,612 | 13,605 |
| 6 month U.S. LIBOR + 1.990% 3.437% 10/1/35 (d)(e) | | 7,147 | 7,164 |
| 6 month U.S. LIBOR + 2.010% 4.76% 5/1/37 (d)(e) | | 2,595 | 2,663 |
| 6 month U.S. LIBOR + 2.680% 4.983% 10/1/35 (d)(e) | | 688 | 708 |
| U.S. TREASURY 1 YEAR INDEX + 2.030% 2.947% 6/1/33 (d)(e) | | 10,698 | 10,775 |
| U.S. TREASURY 1 YEAR INDEX + 2.230% 3.068% 4/1/34 (d)(e) | | 21,079 | 21,371 |
| U.S. TREASURY 1 YEAR INDEX + 2.540% 4.046% 7/1/35 (d)(e) | | 11,983 | 12,240 |
| 1.5% 12/1/40 to 4/1/41 | | 847,367 | 694,039 |
| 2.5% 5/1/41 | | 1,113,404 | 987,904 |
| 3% 9/1/34 to 3/1/52 | | 492,203 | 459,115 |
| 3.5% 7/1/32 to 3/1/52 | | 2,208,678 | 2,041,686 |
| 5% 9/1/35 to 12/1/52 | | 700,630 | 706,747 |
| 6% 1/1/24 | | 3,174 | 3,177 |
TOTAL FREDDIE MAC | | | 5,055,934 |
| Ginnie Mae - 2.3% | | | |
| 6% 6/15/36 | | 125,544 | 130,785 |
| 8% 12/15/23 | | 407 | 409 |
| 2% 12/1/52 (f) | | 2,800,000 | 2,377,502 |
| 2% 12/1/52 (f) | | 1,400,000 | 1,188,751 |
| 2% 1/1/53 (f) | | 1,050,000 | 892,383 |
| 2% 1/1/53 (f) | | 350,000 | 297,461 |
| 2% 1/1/53 (f) | | 350,000 | 297,461 |
| 2% 1/1/53 (f) | | 400,000 | 339,956 |
| 2% 1/1/53 (f) | | 300,000 | 254,967 |
| 2% 1/1/53 (f) | | 250,000 | 212,472 |
| 3% 9/20/51 to 10/20/51 | | 133,129 | 120,829 |
| 3.5% 2/20/50 to 11/20/50 | | 274,252 | 256,983 |
| 4% 7/20/47 | | 260,088 | 251,982 |
| 5.47% 8/20/59 (d)(g) | | 98 | 91 |
TOTAL GINNIE MAE | | | 6,622,032 |
| Uniform Mortgage Backed Securities - 4.2% | | | |
| 2.5% 12/1/37 (f) | | 500,000 | 461,797 |
| 2.5% 12/1/37 (f) | | 500,000 | 461,797 |
| 3% 12/1/52 (f) | | 1,650,000 | 1,460,637 |
| 3% 12/1/52 (f) | | 1,200,000 | 1,062,281 |
| 3.5% 12/1/52 (f) | | 450,000 | 412,313 |
| 3.5% 12/1/52 (f) | | 300,000 | 274,875 |
| 3.5% 12/1/52 (f) | | 150,000 | 137,438 |
| 3.5% 1/1/53 (f) | | 100,000 | 91,672 |
| 4% 12/1/52 (f) | | 850,000 | 804,313 |
| 4.5% 12/1/52 (f) | | 1,200,000 | 1,168,126 |
| 4.5% 12/1/52 (f) | | 1,300,000 | 1,265,469 |
| 4.5% 1/1/53 (f) | | 1,100,000 | 1,070,782 |
| 5% 12/1/52 (f) | | 2,300,000 | 2,289,936 |
| 5% 12/1/52 (f) | | 500,000 | 497,812 |
| 5% 12/1/52 (f) | | 200,000 | 199,125 |
| 5% 12/1/52 (f) | | 500,000 | 497,812 |
TOTAL UNIFORM MORTGAGE BACKED SECURITIES | | | 12,156,185 |
| TOTAL U.S. GOVERNMENT AGENCY - MORTGAGE SECURITIES (Cost $31,696,326) | | | 31,017,153 |
| | | | |
| Collateralized Mortgage Obligations - 2.8% |
| | | Principal Amount (a) | Value ($) |
| U.S. Government Agency - 2.8% | | | |
| Fannie Mae: | | | |
| floater: | | | |
Series 1994-42 Class FK, 10-Year Treasury Constant Maturity Rate - 0.500% 3.62% 4/25/24 (d)(e) | | 12,611 | 12,510 |
Series 2001-38 Class QF, 1 month U.S. LIBOR + 0.980% 4.9961% 8/25/31 (d)(e) | | 13,690 | 13,858 |
Series 2002-49 Class FB, 1 month U.S. LIBOR + 0.600% 4.5107% 11/18/31 (d)(e) | | 13,949 | 13,948 |
Series 2002-60 Class FV, 1 month U.S. LIBOR + 1.000% 5.0161% 4/25/32 (d)(e) | | 3,076 | 3,112 |
Series 2002-74 Class FV, 1 month U.S. LIBOR + 0.450% 4.4661% 11/25/32 (d)(e) | | 65,069 | 64,989 |
Series 2002-75 Class FA, 1 month U.S. LIBOR + 1.000% 5.0161% 11/25/32 (d)(e) | | 6,302 | 6,375 |
Series 2010-15 Class FJ, 1 month U.S. LIBOR + 0.930% 4.9461% 6/25/36 (d)(e) | | 171,770 | 172,767 |
| planned amortization class Series 2005-64 Class PX, 5.5% 6/25/35 | | 15,650 | 15,936 |
| sequential payer: | | | |
Series 2003-117 Class MD, 5% 12/25/23 | | 3,181 | 3,198 |
Series 2004-52 Class KZ, 5.5% 7/25/34 | | 281,141 | 283,423 |
| Series 2010-139 Class NI, 4.5% 2/25/40 (h) | | 29,337 | 812 |
| Series 2010-39 Class FG, 1 month U.S. LIBOR + 0.920% 4.9361% 3/25/36 (d)(e) | | 115,178 | 116,523 |
| Series 2011-67 Class AI, 4% 7/25/26 (h) | | 8,272 | 239 |
| Freddie Mac: | | | |
| floater: | | | |
Series 2448 Class FT, 1 month U.S. LIBOR + 1.000% 4.8731% 3/15/32 (d)(e) | | 14,494 | 14,657 |
Series 2526 Class FC, 1 month U.S. LIBOR + 0.400% 4.2731% 11/15/32 (d)(e) | | 14,382 | 14,323 |
Series 2530 Class FE, 1 month U.S. LIBOR + 0.600% 4.4731% 2/15/32 (d)(e) | | 7,731 | 7,752 |
Series 2711 Class FC, 1 month U.S. LIBOR + 0.900% 4.7731% 2/15/33 (d)(e) | | 41,590 | 41,971 |
| floater planned amortization class Series 2770 Class FH, 1 month U.S. LIBOR + 0.400% 4.2731% 3/15/34 (d)(e) | | 52,350 | 52,074 |
| planned amortization class Series 3415 Class PC, 5% 12/15/37 | | 20,685 | 20,612 |
| sequential payer: | | | |
Series 1929 Class EZ, 7.5% 2/17/27 | | 22,367 | 23,137 |
Series 2004-2802 Class ZG, 5.5% 5/15/34 | | 245,272 | 252,813 |
Series 2004-2862 Class NE, 5% 9/15/24 | | 44,313 | 44,541 |
Series 2145 Class MZ, 6.5% 4/15/29 | | 51,295 | 52,142 |
Series 2357 Class ZB, 6.5% 9/15/31 | | 44,113 | 45,300 |
Series 3859 Class JZ, 5% 5/15/41 | | 303,277 | 307,893 |
| Ginnie Mae guaranteed REMIC pass-thru certificates: | | | |
| floater: | | | |
Series 2007-59 Class FC, 1 month U.S. LIBOR + 0.500% 4.4386% 7/20/37 (d)(e) | | 30,907 | 30,766 |
Series 2008-2 Class FD, 1 month U.S. LIBOR + 0.480% 4.4186% 1/20/38 (d)(e) | | 8,082 | 8,037 |
Series 2008-73 Class FA, 1 month U.S. LIBOR + 0.860% 4.7986% 8/20/38 (d)(e) | | 64,712 | 65,375 |
Series 2008-83 Class FB, 1 month U.S. LIBOR + 0.900% 4.8386% 9/20/38 (d)(e) | | 47,123 | 47,679 |
Series 2009-108 Class CF, 1 month U.S. LIBOR + 0.600% 4.4866% 11/16/39 (d)(e) | | 37,451 | 37,382 |
Series 2009-116 Class KF, 1 month U.S. LIBOR + 0.530% 4.4166% 12/16/39 (d)(e) | | 23,515 | 23,417 |
Series 2010-H17 Class FA, 1 month U.S. LIBOR + 0.330% 3.9264% 7/20/60 (d)(e)(g) | | 421,646 | 415,939 |
Series 2010-H18 Class AF, 1 month U.S. LIBOR + 0.300% 3.4427% 9/20/60 (d)(e)(g) | | 531,362 | 524,534 |
Series 2010-H19 Class FG, 1 month U.S. LIBOR + 0.300% 3.4427% 8/20/60 (d)(e)(g) | | 410,298 | 404,963 |
Series 2010-H27 Class FA, 1 month U.S. LIBOR + 0.380% 3.5227% 12/20/60 (d)(e)(g) | | 186,411 | 184,190 |
Series 2011-H05 Class FA, 1 month U.S. LIBOR + 0.500% 3.6427% 12/20/60 (d)(e)(g) | | 188,426 | 186,783 |
Series 2011-H07 Class FA, 1 month U.S. LIBOR + 0.500% 3.6427% 2/20/61 (d)(e)(g) | | 160,012 | 158,476 |
Series 2011-H12 Class FA, 1 month U.S. LIBOR + 0.490% 3.6327% 2/20/61 (d)(e)(g) | | 211,769 | 209,760 |
Series 2011-H13 Class FA, 1 month U.S. LIBOR + 0.500% 3.6427% 4/20/61 (d)(e)(g) | | 151,138 | 149,686 |
Series 2011-H14: | | | |
Class FB, 1 month U.S. LIBOR + 0.500% 3.6427% 5/20/61 (d)(e)(g) | | 237,173 | 235,050 |
Class FC, 1 month U.S. LIBOR + 0.500% 3.6427% 5/20/61 (d)(e)(g) | | 175,368 | 173,730 |
Series 2011-H17 Class FA, 1 month U.S. LIBOR + 0.530% 3.6727% 6/20/61 (d)(e)(g) | | 201,672 | 199,995 |
Series 2011-H21 Class FA, 1 month U.S. LIBOR + 0.600% 3.7427% 10/20/61 (d)(e)(g) | | 212,861 | 211,286 |
Series 2012-H01 Class FA, 1 month U.S. LIBOR + 0.700% 3.8427% 11/20/61 (d)(e)(g) | | 213,186 | 211,850 |
Series 2012-H03 Class FA, 1 month U.S. LIBOR + 0.700% 3.8427% 1/20/62 (d)(e)(g) | | 134,294 | 133,507 |
Series 2012-H06 Class FA, 1 month U.S. LIBOR + 0.630% 3.7727% 1/20/62 (d)(e)(g) | | 203,424 | 201,892 |
Series 2012-H07 Class FA, 1 month U.S. LIBOR + 0.630% 3.7727% 3/20/62 (d)(e)(g) | | 98,006 | 97,105 |
Series 2012-H21 Class DF, 1 month U.S. LIBOR + 0.650% 3.7927% 5/20/61 (d)(e)(g) | | 1,988 | 1,963 |
Series 2015-H13 Class FL, 1 month U.S. LIBOR + 0.280% 3.4227% 5/20/63 (d)(e)(g) | | 2,410 | 2,355 |
Series 2015-H19 Class FA, 1 month U.S. LIBOR + 0.200% 3.3427% 4/20/63 (d)(e)(g) | | 3,511 | 3,446 |
Series 2016-H20 Class FM, 1 month U.S. LIBOR + 0.400% 3.5427% 12/20/62 (d)(e)(g) | | 4,278 | 4,190 |
| planned amortization class: | | | |
Series 2011-68 Class EC, 3.5% 4/20/41 | | 129,677 | 125,604 |
Series 2017-134 Class BA, 2.5% 11/20/46 | | 34,394 | 31,098 |
| sequential payer: | | | |
Series 2014-H04 Class HA, 2.75% 2/20/64 (g) | | 325,503 | 318,199 |
Series 2014-H12 Class KA, 2.75% 5/20/64 (g) | | 18,361 | 18,305 |
Series 2018-H12 Class HA, 3.25% 8/20/68 (g) | | 762,998 | 735,648 |
| Series 2010-H18 Class PL, 5.01% 9/20/60 (d)(g) | | 5,070 | 5,035 |
| Series 2013-H08 Class MA, 3% 3/20/63 (g) | | 2,320 | 2,169 |
| Series 2015-H30 Class HA, 1.75% 9/20/62 (d)(g) | | 13,482 | 12,921 |
| Series 2016-H13 Class FB, U.S. TREASURY 1 YEAR INDEX + 0.500% 4.317% 5/20/66 (d)(e)(g) | | 602,538 | 600,598 |
| Series 2017-H06 Class FA, U.S. TREASURY 1 YEAR INDEX + 0.350% 4.42% 8/20/66 (d)(e)(g) | | 712,696 | 708,970 |
| | | | |
| TOTAL COLLATERALIZED MORTGAGE OBLIGATIONS (Cost $8,206,361) | | | 8,066,808 |
| | | | |
| Commercial Mortgage Securities - 0.6% |
| | | Principal Amount (a) | Value ($) |
| Freddie Mac: | | | |
| sequential payer: | | | |
Series 2021-K136 Class A2, 2.127% 11/25/31 | | 840,000 | 697,377 |
Series 2022-K142 Class A2, 2.4% 3/25/32 | | 650,000 | 552,260 |
| Series 2022-K150 Class A2, 3.71% 11/25/32 | | 400,000 | 376,926 |
| TOTAL COMMERCIAL MORTGAGE SECURITIES (Cost $1,799,127) | | | 1,626,563 |
| | | | |
| Foreign Government and Government Agency Obligations - 3.8% |
| | | Principal Amount (a) | Value ($) |
| Israeli State (guaranteed by U.S. Government through Agency for International Development): | | | |
| 5.5% 9/18/23 | | 11,058,000 | 11,096,963 |
| 5.5% 12/4/23 | | 4,000 | 4,024 |
| TOTAL FOREIGN GOVERNMENT AND GOVERNMENT AGENCY OBLIGATIONS (Cost $11,325,038) | | | 11,100,987 |
| | | | |
| Money Market Funds - 15.3% |
| | | Shares | Value ($) |
Fidelity Cash Central Fund 3.86% (i) (Cost $44,236,071) | | 44,227,226 | 44,236,072 |
| | | | |
| TOTAL INVESTMENT IN SECURITIES - 107.1% (Cost $324,167,614) | 310,105,137 |
NET OTHER ASSETS (LIABILITIES) - (7.1)% | (20,589,486) |
| NET ASSETS - 100.0% | 289,515,651 |
| | |
| TBA Sale Commitments |
| | Principal Amount (a) | Value ($) |
| Ginnie Mae | | |
| 2% 12/1/52 | (1,050,000) | (891,563) |
| 2% 12/1/52 | (350,000) | (297,188) |
| 2% 12/1/52 | (350,000) | (297,188) |
| 2% 12/1/52 | (400,000) | (339,643) |
| 2% 12/1/52 | (1,400,000) | (1,188,751) |
| 2% 12/1/52 | (300,000) | (254,732) |
| 2% 12/1/52 | (250,000) | (212,277) |
| | | |
| TOTAL GINNIE MAE | | (3,481,342) |
| | | |
| Uniform Mortgage Backed Securities | | |
| 2.5% 12/1/37 | (500,000) | (461,797) |
| 2.5% 12/1/37 | (500,000) | (461,797) |
| 3% 12/1/52 | (2,850,000) | (2,522,917) |
| 3.5% 12/1/52 | (100,000) | (91,625) |
| 4% 12/1/52 | (850,000) | (804,313) |
| 4.5% 12/1/52 | (1,100,000) | (1,070,782) |
| 5% 12/1/52 | (500,000) | (497,812) |
| 5% 12/1/52 | (200,000) | (199,125) |
| 5% 12/1/52 | (500,000) | (497,812) |
| 5% 12/1/52 | (350,000) | (348,469) |
| 5% 12/1/52 | (500,000) | (497,812) |
| 5% 12/1/52 | (500,000) | (497,812) |
| 5% 12/1/52 | (200,000) | (199,125) |
| | | |
| TOTAL UNIFORM MORTGAGE BACKED SECURITIES | | (8,151,198) |
| | | |
TOTAL TBA SALE COMMITMENTS (Proceeds $11,377,344) | | (11,632,540) |
| Futures Contracts |
| | Number of contracts | Expiration Date | Notional Amount ($) | Value ($) | Unrealized Appreciation/ (Depreciation) ($) |
| Purchased | | | | | |
| | | | | | |
| Treasury Contracts | | | | | |
| CBOT 2-Year U.S. Treasury Note Contracts (United States) | 322 | Mar 2023 | 66,125,719 | 162,310 | 162,310 |
| CBOT 5-Year U.S. Treasury Note Contracts (United States) | 196 | Mar 2023 | 21,279,781 | 128,232 | 128,232 |
| | | | | | |
| TOTAL PURCHASED | | | | | 290,542 |
| | | | | | |
| Sold | | | | | |
| | | | | | |
| Treasury Contracts | | | | | |
| CBOT Long Term U.S. Treasury Bond Contracts (United States) | 43 | Mar 2023 | 5,461,000 | (70,761) | (70,761) |
| | | | | | |
| TOTAL FUTURES CONTRACTS | | | | | 219,781 |
| The notional amount of futures purchased as a percentage of Net Assets is 30.2% |
| The notional amount of futures sold as a percentage of Net Assets is 1.9% |
For the period, the average monthly notional amount at value for futures contracts in the aggregate was $121,356,217.
| Interest Rate Swaps |
| Payment Received | Payment Frequency | Payment Paid | Payment Frequency | Clearinghouse / Counterparty (1) | Maturity Date | Notional Amount (2) | Value ($) | Upfront Premium Received/ (Paid) ($) (3) | Unrealized Appreciation/ (Depreciation) ($) |
| 3.25% | Annual | U.S. Secured Overnight Fin. Rate (SOFR) Index (4) | Annual | LCH | Dec 2024 | | 3,244,000 | (29,473) | 0 | (29,473) |
| 2.75% | Annual | U.S. Secured Overnight Fin. Rate (SOFR) Index (4) | Annual | LCH | Dec 2027 | | 392,000 | (3,233) | 0 | (3,233) |
| 2.5% | Annual | U.S. Secured Overnight Fin. Rate (SOFR) Index (4) | Annual | LCH | Dec 2029 | | 699,000 | (6,418) | 0 | (6,418) |
| 2.5% | Annual | U.S. Secured Overnight Fin. Rate (SOFR) Index (4) | Annual | LCH | Dec 2052 | | 179,000 | (5,386) | 0 | (5,386) |
| TOTAL INTEREST RATE SWAPS | | | | | | | | (44,510) | 0 | (44,510) |
(1)Swaps with LCH Clearnet Group (LCH) are centrally cleared over-the-counter (OTC) swaps.
(2)Notional amount is stated in U.S. Dollars unless otherwise noted.
(3)Any premiums for centrally cleared over-the-counter (OTC) swaps are recorded periodically throughout the term of the swap to variation margin and included in unrealized appreciation (depreciation).
(4)Represents floating rate.
Legend
| (a) | Amount is stated in United States dollars unless otherwise noted. |
| (b) | Security or a portion of the security was pledged to cover margin requirements for futures contracts. At period end, the value of securities pledged amounted to $593,307. |
| (c) | Security or a portion of the security was pledged to cover margin requirements for centrally cleared OTC swaps. At period end, the value of securities pledged amounted to $126,998. |
| (d) | Coupon rates for floating and adjustable rate securities reflect the rates in effect at period end. |
| (e) | Coupon is indexed to a floating interest rate which may be multiplied by a specified factor and/or subject to caps or floors. |
| (f) | Security or a portion of the security purchased on a delayed delivery or when-issued basis. |
| (g) | Represents an investment in an underlying pool of reverse mortgages which typically do not require regular principal and interest payments as repayment is deferred until a maturity event. |
| (h) | Interest Only (IO) security represents the right to receive only monthly interest payments on an underlying pool of mortgages or assets. Principal shown is the outstanding par amount of the pool as of the end of the period. |
| (i) | Affiliated fund that is generally available only to investment companies and other accounts managed by Fidelity Investments. The rate quoted is the annualized seven-day yield of the fund at period end. A complete unaudited listing of the fund's holdings as of its most recent quarter end is available upon request. In addition, each Fidelity Central Fund's financial statements, which are not covered by the Fund's Report of Independent Registered Public Accounting Firm, are available on the SEC's website or upon request. |
Affiliated Central Funds
Fiscal year to date information regarding the Fund's investments in Fidelity Central Funds, including the ownership percentage, is presented below.
| Affiliate | Value, beginning of period ($) | Purchases ($) | Sales Proceeds ($) | Dividend Income ($) | Realized Gain (loss) ($) | Change in Unrealized appreciation (depreciation) ($) | Value, end of period ($) | % ownership, end of period |
| Fidelity Cash Central Fund 3.86% | 10,968,112 | 210,712,031 | 177,444,071 | 422,427 | - | - | 44,236,072 | 0.1% |
| Fidelity Securities Lending Cash Central Fund 3.86% | 1,018,756 | 142,531,166 | 143,549,922 | 36,512 | - | - | - | 0.0% |
| Total | 11,986,868 | 353,243,197 | 320,993,993 | 458,939 | - | - | 44,236,072 | |
| | | | | | | | | |
Amounts in the income column in the above table include any capital gain distributions from underlying funds, which are presented in the corresponding line item in the Statement of Operations, if applicable.
Amount for Fidelity Securities Lending Cash Central Fund represents the income earned on investing cash collateral, less rebates paid to borrowers and any lending agent fees associated with the loan, plus any premium payments received for lending certain types of securities.
Amounts included in the purchases and sales proceeds columns may include in-kind transactions, if applicable.
Investment Valuation
The following is a summary of the inputs used, as of November 30, 2022, involving the Fund's assets and liabilities carried at fair value. The inputs or methodology used for valuing securities may not be an indication of the risk associated with investing in those securities. For more information on valuation inputs, and their aggregation into the levels used below, please refer to the Investment Valuation section in the accompanying Notes to Financial Statements.
| Valuation Inputs at Reporting Date: |
| Description | Total ($) | Level 1 ($) | Level 2 ($) | Level 3 ($) |
Investments in Securities: | | | | |
|
| U.S. Government and Government Agency Obligations | 214,057,554 | - | 214,057,554 | - |
|
| U.S. Government Agency - Mortgage Securities | 31,017,153 | - | 31,017,153 | - |
|
| Collateralized Mortgage Obligations | 8,066,808 | - | 8,066,808 | - |
|
| Commercial Mortgage Securities | 1,626,563 | - | 1,626,563 | - |
|
| Foreign Government and Government Agency Obligations | 11,100,987 | - | 11,100,987 | - |
|
| Money Market Funds | 44,236,072 | 44,236,072 | - | - |
| Total Investments in Securities: | 310,105,137 | 44,236,072 | 265,869,065 | - |
Derivative Instruments: | | | | |
|
| Assets | | | | |
Futures Contracts | 290,542 | 290,542 | - | - |
| Total Assets | 290,542 | 290,542 | - | - |
|
| Liabilities | | | | |
Futures Contracts | (70,761) | (70,761) | - | - |
Swaps | (44,510) | - | (44,510) | - |
| Total Liabilities | (115,271) | (70,761) | (44,510) | - |
| Total Derivative Instruments: | 175,271 | 219,781 | (44,510) | - |
Other Financial Instruments: | | | | |
|
| TBA Sale Commitments | (11,632,540) | - | (11,632,540) | - |
| Total Other Financial Instruments: | (11,632,540) | - | (11,632,540) | - |
Value of Derivative Instruments
The following table is a summary of the Fund's value of derivative instruments by primary risk exposure as of November 30, 2022. For additional information on derivative instruments, please refer to the Derivative Instruments section in the accompanying Notes to Financial Statements.
Primary Risk Exposure / Derivative Type | Value |
| Asset ($) | Liability ($) |
| Interest Rate Risk | | |
Futures Contracts (a) | 290,542 | (70,761) |
Swaps (b) | 0 | (44,510) |
| Total Interest Rate Risk | 290,542 | (115,271) |
| Total Value of Derivatives | 290,542 | (115,271) |
(a)Reflects gross cumulative appreciation (depreciation) on futures contracts as presented in the Schedule of Investments. In the Statement of Assets and Liabilities, the period end daily variation margin is included in receivable or payable for daily variation margin on futures contracts, and the net cumulative appreciation (depreciation) is included in Total accumulated earnings (loss).
(b)For centrally cleared over-the-counter (OTC) swaps, reflects gross cumulative appreciation (depreciation) as presented in the Schedule of Investments. In the Statement of Assets and Liabilities, the period end daily variation margin for centrally cleared OTC swaps is included in receivable or payable for daily variation margin on centrally cleared OTC swaps, and the net cumulative appreciation (depreciation) for centrally cleared OTC swaps is included in Total accumulated earnings (loss).
| Statement of Assets and Liabilities |
| | | | November 30, 2022 |
| | | | | |
| Assets | | | | |
| Investment in securities, at value - See accompanying schedule: | | | | |
Unaffiliated issuers (cost $279,931,543) | | $265,869,065 | | |
Fidelity Central Funds (cost $44,236,071) | | 44,236,072 | | |
| | | | | |
| Total Investment in Securities (cost $324,167,614) | | | $ | 310,105,137 |
| Receivable for investments sold | | | | 983 |
| Receivable for TBA sale commitments | | | | 11,377,344 |
| Receivable for fund shares sold | | | | 497,472 |
| Interest receivable | | | | 931,773 |
| Distributions receivable from Fidelity Central Funds | | | | 146,221 |
| Receivable for daily variation margin on futures contracts | | | | 184,241 |
| Receivable for daily variation margin on centrally cleared OTC swaps | | | | 22,515 |
Total assets | | | | 323,265,686 |
| Liabilities | | | | |
| Payable for investments purchased | | | | |
Regular delivery | | $4,384,375 | | |
Delayed delivery | | 17,528,225 | | |
| TBA sale commitments, at value | | 11,632,540 | | |
| Payable for fund shares redeemed | | 74,027 | | |
| Distributions payable | | 22,496 | | |
| Accrued management fee | | 108,372 | | |
| Total Liabilities | | | | 33,750,035 |
| Net Assets | | | $ | 289,515,651 |
| Net Assets consist of: | | | | |
| Paid in capital | | | $ | 316,111,847 |
| Total accumulated earnings (loss) | | | | (26,596,196) |
| Net Assets | | | $ | 289,515,651 |
Net Asset Value , offering price and redemption price per share ($289,515,651 ÷ 30,803,754 shares) | | | $ | 9.40 |
| | | | | |
| Statement of Operations |
| | | | Year ended November 30, 2022 |
| Investment Income | | | | |
| Interest | | | $ | 3,696,447 |
| Income from Fidelity Central Funds (including $36,512 from security lending) | | | | 458,939 |
| Total Income | | | | 4,155,386 |
| Expenses | | | | |
| Management fee | $ | 1,503,428 | | |
| Independent trustees' fees and expenses | | 1,150 | | |
| Total expenses before reductions | | 1,504,578 | | |
| Expense reductions | | (50) | | |
| Total expenses after reductions | | | | 1,504,528 |
| Net Investment income (loss) | | | | 2,650,858 |
| Realized and Unrealized Gain (Loss) | | | | |
| Net realized gain (loss) on: | | | | |
| Investment Securities: | | | | |
| Unaffiliated issuers | | (1,601,919) | | |
| Futures contracts | | (8,800,147) | | |
| Swaps | | (463,828) | | |
| Total net realized gain (loss) | | | | (10,865,894) |
| Change in net unrealized appreciation (depreciation) on: | | | | |
| Investment Securities: | | | | |
| Unaffiliated issuers | | (14,605,599) | | |
| Futures contracts | | (23,627) | | |
| Swaps | | 13,238 | | |
| TBA Sale commitments | | (257,472) | | |
| Total change in net unrealized appreciation (depreciation) | | | | (14,873,460) |
| Net gain (loss) | | | | (25,739,354) |
| Net increase (decrease) in net assets resulting from operations | | | $ | (23,088,496) |
| Statement of Changes in Net Assets |
| |
| | Year ended November 30, 2022 | | Year ended November 30, 2021 |
| Increase (Decrease) in Net Assets | | | | |
| Operations | | | | |
| Net investment income (loss) | $ | 2,650,858 | $ | 2,219,871 |
| Net realized gain (loss) | | (10,865,894) | | (1,901,148) |
| Change in net unrealized appreciation (depreciation) | | (14,873,460) | | (5,667,395) |
| Net increase (decrease) in net assets resulting from operations | | (23,088,496) | | (5,348,672) |
| Distributions to shareholders | | (2,577,273) | | (3,765,135) |
| Share transactions | | | | |
| Proceeds from sales of shares | | 68,978,006 | | 103,415,466 |
| Reinvestment of distributions | | 2,416,577 | | 3,583,964 |
| Cost of shares redeemed | | (143,021,563) | | (226,556,376) |
Net increase (decrease) in net assets resulting from share transactions | | (71,626,980) | | (119,556,946) |
| Total increase (decrease) in net assets | | (97,292,749) | | (128,670,753) |
| | | | | |
| Net Assets | | | | |
| Beginning of period | | 386,808,400 | | 515,479,153 |
| End of period | $ | 289,515,651 | $ | 386,808,400 |
| | | | | |
| Other Information | | | | |
| Shares | | | | |
| Sold | | 7,058,756 | | 10,102,865 |
| Issued in reinvestment of distributions | | 252,526 | | 349,780 |
| Redeemed | | (14,732,576) | | (22,152,400) |
| Net increase (decrease) | | (7,421,294) | | (11,699,755) |
| | | | | |
Financial Highlights
| Fidelity® Limited Term Government Fund |
| |
| Years ended November 30, | | 2022 | | 2021 | | 2020 | | 2019 | | 2018 |
Selected Per-Share Data | | | | | | | | | | |
| Net asset value, beginning of period | $ | 10.12 | $ | 10.33 | $ | 10.05 | $ | 9.77 | $ | 9.88 |
| Income from Investment Operations | | | | | | | | | | |
Net investment income (loss) A,B | | .077 | | .052 | | .108 | | .188 | | .142 |
| Net realized and unrealized gain (loss) | | (.720) | | (.179) | | .279 | | .276 | | (.123) |
| Total from investment operations | | (.643) | | (.127) | | .387 | | .464 | | .019 |
| Distributions from net investment income | | (.077) | | (.049) | | (.107) | | (.184) | | (.129) |
| Distributions from net realized gain | | - | | (.034) | | - | | - | | - |
| Total distributions | | (.077) | | (.083) | | (.107) | | (.184) | | (.129) |
| Net asset value, end of period | $ | 9.40 | $ | 10.12 | $ | 10.33 | $ | 10.05 | $ | 9.77 |
Total Return C | | (6.37)% | | (1.24)% | | 3.89% | | 4.78% | | .20% |
Ratios to Average Net Assets B,D,E | | | | | | | | | | |
| Expenses before reductions | | .45% | | .45% | | .45% | | .45% | | .45% |
| Expenses net of fee waivers, if any | | .45% | | .45% | | .45% | | .45% | | .45% |
| Expenses net of all reductions | | .45% | | .45% | | .45% | | .45% | | .45% |
| Net investment income (loss) | | .79% | | .51% | | 1.05% | | 1.88% | | 1.45% |
| Supplemental Data | | | | | | | | | | |
| Net assets, end of period (000 omitted) | $ | 289,516 | $ | 386,808 | $ | 515,479 | $ | 325,273 | $ | 313,739 |
Portfolio turnover rate F | | 132% | | 91% | | 110% | | 160% | | 124% |
A Calculated based on average shares outstanding during the period.
B Net investment income (loss) is affected by the timing of the declaration of dividends by any underlying mutual funds or exchange-traded funds (ETFs). Net investment income (loss) of any mutual funds or ETFs is not included in the Fund's net investment income (loss) ratio.
C Total returns would have been lower if certain expenses had not been reduced during the applicable periods shown.
D Fees and expenses of any underlying mutual funds or exchange-traded funds (ETFs) are not included in the Fund's expense ratio. The Fund indirectly bears its proportionate share of these expenses. For additional expense information related to investments in Fidelity Central Funds, please refer to the "Investments in Fidelity Central Funds" note found in the Notes to Financial Statements section of the most recent Annual or Semi-Annual report.
E Expense ratios reflect operating expenses of the class. Expenses before reductions do not reflect amounts reimbursed, waived, or reduced through arrangements with the investment adviser, brokerage services, or other offset arrangements, if applicable, and do not represent the amount paid by the class during periods when reimbursements, waivers or reductions occur.
F Amount does not include the portfolio activity of any underlying mutual funds or exchange-traded funds (ETFs).
For the period ended November 30, 2022
1. Organization.
Fidelity Limited Term Government Fund (the Fund) is a fund of Fidelity Advisor Series IV (the Trust) and is authorized to issue an unlimited number of shares. Share transactions on the Statement of Changes in Net Assets may contain exchanges between affiliated funds. The Trust is registered under the Investment Company Act of 1940, as amended (the 1940 Act), as an open-end management investment company organized as a Massachusetts business trust.
2. Investments in Fidelity Central Funds.
Funds may invest in Fidelity Central Funds, which are open-end investment companies generally available only to other investment companies and accounts managed by the investment adviser and its affiliates. The Schedule of Investments lists any Fidelity Central Funds held as an investment as of period end, but does not include the underlying holdings of each Fidelity Central Fund. An investing fund indirectly bears its proportionate share of the expenses of the underlying Fidelity Central Funds.
Based on its investment objective, each Fidelity Central Fund may invest or participate in various investment vehicles or strategies that are similar to those of the investing fund. These strategies are consistent with the investment objectives of the investing fund and may involve certain economic risks which may cause a decline in value of each of the Fidelity Central Funds and thus a decline in the value of the investing fund.
| Fidelity Central Fund | Investment Manager | Investment Objective | Investment Practices | Expense Ratio A |
| Fidelity Money Market Central Funds | Fidelity Management & Research Company LLC (FMR) | Each fund seeks to obtain a high level of current income consistent with the preservation of capital and liquidity. | Short-term Investments | Less than .005% |
A Expenses expressed as a percentage of average net assets and are as of each underlying Central Fund's most recent annual or semi-annual shareholder report.
A complete unaudited list of holdings for each Fidelity Central Fund is available upon request or at the Securities and Exchange Commission website at www.sec.gov. In addition, the financial statements of the Fidelity Central Funds which contain the significant accounting policies (including investment valuation policies) of those funds, and are not covered by the Report of Independent Registered Public Accounting Firm, are available on the Securities and Exchange Commission website or upon request.
3. Significant Accounting Policies.
The Fund is an investment company and applies the accounting and reporting guidance of the Financial Accounting Standards Board (FASB) Accounting Standards Codification Topic 946 Financial Services - Investment Companies . The financial statements have been prepared in conformity with accounting principles generally accepted in the United States of America (GAAP), which require management to make certain estimates and assumptions at the date of the financial statements. Actual results could differ from those estimates. Subsequent events, if any, through the date that the financial statements were issued have been evaluated in the preparation of the financial statements. The Fund's Schedule of Investments lists any underlying mutual funds or exchange-traded funds (ETFs) but does not include the underlying holdings of these funds. The following summarizes the significant accounting policies of the Fund:
Investment Valuation. Investments are valued as of 4:00 p.m. Eastern time on the last calendar day of the period. The Board of Trustees (the Board) has designated the Fund's investment adviser as the valuation designee responsible for the fair valuation function and performing fair value determinations as needed. The investment adviser has established a Fair Value Committee (the Committee) to carry out the day-to-day fair valuation responsibilities and has adopted policies and procedures to govern the fair valuation process and the activities of the Committee. In accordance with these fair valuation policies and procedures, which have been approved by the Board, the Fund attempts to obtain prices from one or more third party pricing services or brokers to value its investments. When current market prices, quotations or currency exchange rates are not readily available or reliable, investments will be fair valued in good faith by the Committee, in accordance with the policies and procedures. Factors used in determining fair value vary by investment type and may include market or investment specific events, transaction data, estimated cash flows, and market observations of comparable investments. The frequency that the fair valuation procedures are used cannot be predicted and they may be utilized to a significant extent. The Committee manages the Fund's fair valuation practices and maintains the fair valuation policies and procedures. The Fund's investment adviser reports to the Board information regarding the fair valuation process and related material matters.
��
The Fund categorizes the inputs to valuation techniques used to value its investments into a disclosure hierarchy consisting of three levels as shown below:
Level 1 - unadjusted quoted prices in active markets for identical investments
Level 2 - other significant observable inputs (including quoted prices for similar investments, interest rates, prepayment speeds, etc.)
Level 3 - unobservable inputs (including the Fund's own assumptions based on the best information available)
Valuation techniques used to value the Fund's investments by major category are as follows:
Debt securities, including restricted securities, are valued based on evaluated prices received from third party pricing services or from brokers who make markets in such securities. Foreign government and government agency obligations and U.S. government and government agency obligations are valued by pricing services who utilize matrix pricing which considers yield or price of bonds of comparable quality, coupon, maturity and type or by broker-supplied prices. Collateralized mortgage obligations, commercial mortgage securities and U.S. government agency mortgage securities are valued by pricing services who utilize matrix pricing which considers prepayment speed assumptions, attributes of the collateral, yield or price of bonds of comparable quality, coupon, maturity and type or by broker-supplied prices. Swaps are marked-to-market daily based on valuations from third party pricing services, registered derivatives clearing organizations (clearinghouses) or broker-supplied valuations. These pricing sources may utilize inputs such as interest rate curves, credit spread curves, default possibilities and recovery rates. When independent prices are unavailable or unreliable, debt securities and swaps may be valued utilizing pricing methodologies which consider similar factors that would be used by third party pricing services. Debt securities and swaps are generally categorized as Level 2 in the hierarchy but may be Level 3 depending on the circumstances.
Futures contracts are valued at the settlement price established each day by the board of trade or exchange on which they are traded and are categorized as Level 1 in the hierarchy. Investments in open-end mutual funds, including the Fidelity Central Funds, are valued at their closing net asset value (NAV) each business day and are categorized as Level 1 in the hierarchy.
Changes in valuation techniques may result in transfers in or out of an assigned level within the disclosure hierarchy. The aggregate value of investments by input level as of November 30, 2022 is included at the end of the Fund's Schedule of Investments.
Investment Transactions and Income. For financial reporting purposes, the Fund's investment holdings and NAV include trades executed through the end of the last business day of the period. The NAV per share for processing shareholder transactions is calculated as of the close of business of the New York Stock Exchange (NYSE), normally 4:00 p.m. Eastern time and includes trades executed through the end of the prior business day. Gains and losses on securities sold are determined on the basis of identified cost and include proceeds received from litigation. Income and capital gain distributions from Fidelity Central Funds, if any, are recorded on the ex-dividend date. Interest income is accrued as earned and includes coupon interest and amortization of premium and accretion of discount on debt securities as applicable.
Expenses. Expenses directly attributable to a fund are charged to that fund. Expenses attributable to more than one fund are allocated among the respective funds on the basis of relative net assets or other appropriate methods. Expenses included in the accompanying financial statements reflect the expenses of that fund and do not include any expenses associated with any underlying mutual funds or exchange-traded funds. Although not included in a fund's expenses, a fund indirectly bears its proportionate share of these expenses through the net asset value of each underlying mutual fund or exchange-traded fund. Expense estimates are accrued in the period to which they relate and adjustments are made when actual amounts are known.
Income Tax Information and Distributions to Shareholders. Each year, the Fund intends to qualify as a regulated investment company under Subchapter M of the Internal Revenue Code, including distributing substantially all of its taxable income and realized gains. As a result, no provision for U.S. Federal income taxes is required. As of November 30, 2022, the Fund did not have any unrecognized tax benefits in the financial statements; nor is the Fund aware of any tax positions for which it is reasonably possible that the total amounts of unrecognized tax benefits will significantly change in the next twelve months. The Fund files a U.S. federal tax return, in addition to state and local tax returns as required. The Fund's federal income tax returns are subject to examination by the Internal Revenue Service (IRS) for a period of three fiscal years after they are filed. State and local tax returns may be subject to examination for an additional fiscal year depending on the jurisdiction.
Distributions are declared and recorded daily and paid monthly from net investment income. Distributions from realized gains, if any, are declared and recorded on the ex-dividend date. Income and capital gain distributions are determined in accordance with income tax regulations, which may differ from GAAP.
Capital accounts within the financial statements are adjusted for permanent book-tax differences. These adjustments have no impact on net assets or the results of operations. Capital accounts are not adjusted for temporary book-tax differences which will reverse in a subsequent period.
Book-tax differences are primarily due to futures contracts, swaps, market discount, capital loss carryforwards, and losses deferred due to wash sales and futures transactions.
As of period end, the cost and unrealized appreciation (depreciation) in securities, and derivatives if applicable, for federal income tax purposes were as follows:
| Gross unrealized appreciation | $705,790 |
| Gross unrealized depreciation | (14,854,272) |
| Net unrealized appreciation (depreciation) | $(14,148,482) |
| Tax Cost | $323,946,423 |
The tax-based components of distributable earnings as of period end were as follows:
| Undistributed ordinary income | $171,339 |
| Capital loss carryforward | $(12,617,250) |
| Net unrealized appreciation (depreciation) on securities and other investments | $(14,150,286) |
Capital loss carryforwards are only available to offset future capital gains of the Fund to the extent provided by regulations and may be limited. The capital loss carryforward information presented below, including any applicable limitation, is estimated as of fiscal period end and is subject to adjustment.
Short-term | $(6,878,397) |
Long-term | (5,738,853) |
| Total capital loss carryforward | $(12,617,250) |
The tax character of distributions paid was as follows:
| | November 30, 2022 | November 30, 2021 |
| Ordinary Income | $2,577,273 | $3,765,135 |
Delayed Delivery Transactions and When-Issued Securities. During the period, certain Funds transacted in securities on a delayed delivery or when-issued basis. Payment and delivery may take place after the customary settlement period for that security. The price of the underlying securities and the date when the securities will be delivered and paid for are fixed at the time the transaction is negotiated. Securities purchased on a delayed delivery or when-issued basis are identified as such in the Schedule of Investments. Compensation for interest forgone in the purchase of a delayed delivery or when-issued debt security may be received. With respect to purchase commitments, each applicable Fund identifies securities as segregated in its records with a value at least equal to the amount of the commitment. Payables and receivables associated with the purchases and sales of delayed delivery securities having the same coupon, settlement date and broker are offset. Delayed delivery or when-issued securities that have been purchased from and sold to different brokers are reflected as both payables and receivables in the Statement of Assets and Liabilities under the caption "Delayed delivery", as applicable. Losses may arise due to changes in the value of the underlying securities or if the counterparty does not perform under the contract's terms, or if the issuer does not issue the securities due to political, economic, or other factors.
To-Be-Announced (TBA) Securities and Mortgage Dollar Rolls. TBA securities involve buying or selling mortgage-backed securities (MBS) on a forward commitment basis. A TBA transaction typically does not designate the actual security to be delivered and only includes an approximate principal amount; however delivered securities must meet specified terms defined by industry guidelines, including issuer, rate and current principal amount outstanding on underlying mortgage pools. Funds may enter into a TBA transaction with the intent to take possession of or deliver the underlying MBS, or a fund may elect to extend the settlement by entering into either a mortgage or reverse mortgage dollar roll. Mortgage dollar rolls are transactions where a fund sells TBA securities and simultaneously agrees to repurchase MBS on a later date at a lower price and with the same counterparty. Reverse mortgage dollar rolls involve the purchase and simultaneous agreement to sell TBA securities on a later date at a lower price. Transactions in mortgage dollar rolls and reverse mortgage dollar rolls are accounted for as purchases and sales and may result in an increase to a fund's portfolio turnover rate.
Purchases and sales of TBA securities involve risks similar to those discussed above for delayed delivery and when-issued securities. Also, if the counterparty in a mortgage dollar roll or a reverse mortgage dollar roll transaction files for bankruptcy or becomes insolvent, a fund's right to repurchase or sell securities may be limited. Additionally, when a fund sells TBA securities without already owning or having the right to obtain the deliverable securities (an uncovered forward commitment to sell), it incurs a risk of loss because it could have to purchase the securities at a price that is higher than the price at which it sold them. A fund may be unable to purchase the deliverable securities if the corresponding market is illiquid.
TBA securities subject to a forward commitment to sell at period end are included at the end of the Schedule of Investments under the caption "TBA Sale Commitments." The proceeds and value of these commitments are reflected in the Statement of Assets and Liabilities as "Receivable for TBA sale commitments" and "TBA sale commitments, at value," respectively.
4. Derivative Instruments.
Risk Exposures and the Use of Derivative Instruments. The Fund's investment objectives allow for various types of derivative instruments, including futures contracts and swaps. Derivatives are investments whose value is primarily derived from underlying assets, indices or reference rates and may be transacted on an exchange or over-the-counter (OTC). Derivatives may involve a future commitment to buy or sell a specified asset based on specified terms, to exchange future cash flows at periodic intervals based on a notional principal amount, or for one party to make one or more payments upon the occurrence of specified events in exchange for periodic payments from the other party.
Derivatives were used to increase returns, to gain exposure to certain types of assets and to manage exposure to certain risks as defined below. The success of any strategy involving derivatives depends on analysis of numerous economic factors, and if the strategies for investment do not work as intended, the objectives may not be achieved.
Derivatives were used to increase or decrease exposure to the following risk(s):
| | |
| Interest Rate Risk | Interest rate risk relates to the fluctuations in the value of interest-bearing securities due to changes in the prevailing levels of market interest rates. |
Funds are also exposed to additional risks from investing in derivatives, such as liquidity risk and counterparty credit risk. Liquidity risk is the risk that a fund will be unable to close out the derivative in the open market in a timely manner. Counterparty credit risk is the risk that the counterparty will not be able to fulfill its obligation to a fund. Exchange-traded contracts are not covered by the ISDA Master Agreement; however counterparty credit risk related to these contracts may be mitigated by the protection provided by the exchange on which they trade. Counterparty credit risk related to centrally cleared OTC swaps may be mitigated by the protection provided by the clearinghouse.
Investing in derivatives may involve greater risks than investing in the underlying assets directly and, to varying degrees, may involve risk of loss in excess of any initial investment and collateral received and amounts recognized in the Statement of Assets and Liabilities. In addition, there may be the risk that the change in value of the derivative contract does not correspond to the change in value of the underlying instrument.
Net Realized Gain (Loss) and Change in Net Unrealized Appreciation (Depreciation) on Derivatives. The table below, which reflects the impacts of derivatives on the financial performance, summarizes the net realized gain (loss) and change in net unrealized appreciation (depreciation) for derivatives during the period as presented in the Statement of Operations.
| Primary Risk Exposure / Derivative Type | Net Realized Gain (Loss) | Change in Net Unrealized Appreciation (Depreciation) |
| Fidelity Limited Term Government Fund | | |
| Interest Rate Risk | | |
| Futures Contracts | $(8,800,147) | $(23,627) |
| Swaps | (463,828) | 13,238 |
| Total Interest Rate Risk | (9,263,975) | (10,389) |
| Totals | $(9,263,975) | $(10,389) |
If there are any open positions at period end, a summary of the value of derivatives by primary risk exposure is included at the end of the Schedule of Investments.
Futures Contracts. A futures contract is an agreement between two parties to buy or sell a specified underlying instrument for a fixed price at a specified future date. Futures contracts were used to manage exposure to the bond market and fluctuations in interest rates.
Upon entering into a futures contract, a fund is required to deposit either cash or securities (initial margin) with a clearing broker in an amount equal to a certain percentage of the face value of the contract. Futures contracts are marked-to-market daily and subsequent daily payments are made or received by a fund depending on the daily fluctuations in the value of the futures contracts and are recorded as unrealized appreciation or (depreciation). This receivable and/or payable, if any, is included in daily variation margin on futures contracts in the Statement of Assets and Liabilities. Realized gain or (loss) is recorded upon the expiration or closing of a futures contract. The net realized gain (loss) and change in net unrealized appreciation (depreciation) on futures contracts during the period is presented in the Statement of Operations.
Any open futures contracts at period end are presented in the Schedule of Investments under the caption "Futures Contracts". The notional amount at value reflects each contract's exposure to the underlying instrument or index at period end, and is representative of volume of activity during the period unless an average notional amount is presented. Any securities deposited to meet initial margin requirements are identified in the Schedule of Investments. Any cash deposited to meet initial margin requirements is presented as segregated cash with brokers for derivative instruments in the Statement of Assets and Liabilities.
Swaps. A swap is a contract between two parties to exchange future cash flows at periodic intervals based on a notional principal amount. A centrally cleared OTC swap is a transaction executed between a fund and a dealer counterparty, then cleared by a futures commission merchant (FCM) through a clearinghouse. Once cleared, the clearinghouse serves as a central counterparty, with whom a fund exchanges cash flows for the life of the transaction, similar to transactions in futures contracts.
Centrally cleared OTC swaps require a fund to deposit either cash or securities (initial margin) with the FCM, at the instruction of and for the benefit of the clearinghouse. Any securities deposited to meet initial margin requirements are identified in the Schedule of Investments. Any cash deposited to meet initial margin requirements is presented in segregated cash with brokers for derivative instruments in the Statement of Assets and Liabilities. Centrally cleared OTC swaps are marked-to-market daily and subsequent payments (variation margin) are made or received depending on the daily fluctuations in the value of the swaps and are recorded as unrealized appreciation or (depreciation). These daily payments, if any, are included in receivable or payable for daily variation margin on centrally cleared OTC swaps in the Statement of Assets and Liabilities. Any premiums for centrally cleared OTC swaps are recorded periodically throughout the term of the swap to variation margin and included in Total accumulated earnings (loss) in the Statement of Assets and Liabilities. Any premiums are recognized as realized gain (loss) upon termination or maturity of the swap.
Payments are exchanged at specified intervals, accrued daily commencing with the effective date of the contract and recorded as realized gain or (loss). Some swaps may be terminated prior to the effective date and realize a gain or loss upon termination. The net realized gain (loss) and change in net unrealized appreciation (depreciation) on swaps during the period is presented in the Statement of Operations.
Any open swaps at period end are included in the Schedule of Investments under the caption "Swaps", and are representative of volume of activity during the period unless an average notional amount is presented.
Interest Rate Swaps. Interest rate swaps are agreements between counterparties to exchange cash flows, one based on a fixed rate, and the other on a floating rate. A fund enters into interest rate swaps to manage its exposure to interest rate changes. Changes in interest rates can have an effect on both the value of bond holdings as well as the amount of interest income earned. In general, the value of bonds can fall when interest rates rise and can rise when interest rates fall.
5. Purchases and Sales of Investments.
Purchases and sales of securities, other than short-term securities, U.S. government securities and in-kind transactions, as applicable, are noted in the table below.
| | Purchases ($) | Sales ($) |
| Fidelity Limited Term Government Fund | 145,527,129 | 141,693,899 |
6. Fees and Other Transactions with Affiliates.
Management Fee. Fidelity Management & Research Company LLC (the investment adviser) and its affiliates provide the Fund with investment management related services for which the Fund pays a monthly management fee that is based on an annual rate of .45% of the Fund's average net assets. Under the management contract, the investment adviser pays all other expenses, except the compensation of the independent Trustees and certain other expenses such as taxes. The management fee is reduced by an amount equal to the fees and expenses paid by the Fund to the independent Trustees.
Interfund Trades. Funds may purchase from or sell securities to other Fidelity Funds under procedures adopted by the Board. The procedures have been designed to ensure these interfund trades are executed in accordance with Rule 17a-7 of the 1940 Act. Any interfund trades are included within the respective purchases and sales amounts shown in the Purchases and Sales of Investments note. During the period, there were no interfund trades.
Other. During the period, the investment adviser reimbursed the Fund for certain losses as follows:
| | Amount ($) |
| Fidelity Limited Term Government Fund | 2,039 |
7. Committed Line of Credit.
Certain Funds participate with other funds managed by the investment adviser or an affiliate in a $4.25 billion credit facility (the "line of credit") to be utilized for temporary or emergency purposes to fund shareholder redemptions or for other short-term liquidity purposes. The commitment fees on the pro-rata portion of the line of credit are borne by the investment adviser. During the period, there were no borrowings on this line of credit.
8. Security Lending.
Funds lend portfolio securities from time to time in order to earn additional income. Lending agents are used, including National Financial Services (NFS), an affiliate of the investment adviser. Pursuant to a securities lending agreement, NFS will receive a fee, which is capped at 9.9% of a fund's daily lending revenue, for its services as lending agent. A fund may lend securities to certain qualified borrowers, including NFS. On the settlement date of the loan, a fund receives collateral (in the form of U.S. Treasury obligations, letters of credit and/or cash) against the loaned securities and maintains collateral in an amount not less than 100% of the market value of the loaned securities during the period of the loan. The market value of the loaned securities is determined at the close of business of a fund and any additional required collateral is delivered to a fund on the next business day. A fund or borrower may terminate the loan at any time, and if the borrower defaults on its obligation to return the securities loaned because of insolvency or other reasons, a fund may apply collateral received from the borrower against the obligation. A fund may experience delays and costs in recovering the securities loaned. Any cash collateral received is invested in the Fidelity Securities Lending Cash Central Fund. Any loaned securities are identified as such in the Schedule of Investments, and the value of loaned securities and cash collateral at period end, as applicable, are presented in the Statement of Assets and Liabilities. Security lending income represents the income earned on investing cash collateral, less rebates paid to borrowers and any lending agent fees associated with the loan, plus any premium payments received for lending certain types of securities. Security lending income is presented in the Statement of Operations as a component of income from Fidelity Central Funds. Affiliated security lending activity, if any, was as follows:
| | Total Security Lending Fees Paid to NFS | Security Lending Income From Securities Loaned to NFS | Value of Securities Loaned to NFS at Period End |
| Fidelity Limited Term Government Fund | $3,946 | $- | $- |
9. Expense Reductions.
Through arrangements with the Fund's custodian, credits realized as a result of certain uninvested cash balances were used to reduce the Fund's expenses by $50.
10. Other.
A fund's organizational documents provide former and current trustees and officers with a limited indemnification against liabilities arising in connection with the performance of their duties to the fund. In the normal course of business, a fund may also enter into contracts that provide general indemnifications. A fund's maximum exposure under these arrangements is unknown as this would be dependent on future claims that may be made against a fund. The risk of material loss from such claims is considered remote.
11. Risk and Uncertainties.
Many factors affect a fund's performance. Developments that disrupt global economies and financial markets, such as pandemics, epidemics, outbreaks of infectious diseases, war, terrorism, and environmental disasters, may significantly affect a fund's investment performance. The effects of these developments to a fund will be impacted by the types of securities in which a fund invests, the financial condition, industry, economic sector, and geographic location of an issuer, and a fund's level of investment in the securities of that issuer.
To the Board of Trustees of Fidelity Advisor Series IV and Shareholders of Fidelity Limited Term Government Fund
Opinion on the Financial Statements
We have audited the accompanying statement of assets and liabilities, including the schedule of investments, of Fidelity Limited Term Government Fund (the "Fund") as of November 30, 2022, the related statement of operations for the year ended November 30, 2022, the statement of changes in net assets for each of the two years in the period ended November 30, 2022, including the related notes, and the financial highlights for each of the five years in the period ended November 30, 2022 (collectively referred to as the "financial statements"). In our opinion, the financial statements present fairly, in all material respects, the financial position of the Fund as of November 30, 2022, the results of its operations for the year then ended, the changes in its net assets for each of the two years in the period ended November 30, 2022 and the financial highlights for each of the five years in the period ended November 30, 2022 in conformity with accounting principles generally accepted in the United States of America.
Basis for Opinion
These financial statements are the responsibility of the Fund's management. Our responsibility is to express an opinion on the Fund's financial statements based on our audits. We are a public accounting firm registered with the Public Company Accounting Oversight Board (United States) (PCAOB) and are required to be independent with respect to the Fund in accordance with the U.S. federal securities laws and the applicable rules and regulations of the Securities and Exchange Commission and the PCAOB.
We conducted our audits of these financial statements in accordance with the standards of the PCAOB. Those standards require that we plan and perform the audit to obtain reasonable assurance about whether the financial statements are free of material misstatement, whether due to error or fraud.
Our audits included performing procedures to assess the risks of material misstatement of the financial statements, whether due to error or fraud, and performing procedures that respond to those risks. Such procedures included examining, on a test basis, evidence regarding the amounts and disclosures in the financial statements. Our audits also included evaluating the accounting principles used and significant estimates made by management, as well as evaluating the overall presentation of the financial statements. Our procedures included confirmation of securities owned as of November 30, 2022 by correspondence with the custodian and brokers; when replies were not received from brokers, we performed other auditing procedures. We believe that our audits provide a reasonable basis for our opinion.
/s/ PricewaterhouseCoopers LLP
Boston, Massachusetts
January 13, 2023
We have served as the auditor of one or more investment companies in the Fidelity group of funds since 1932.
The Trustees, Members of the Advisory Board (if any), and officers of the trust and fund, as applicable, are listed below. The Board of Trustees governs the fund and is responsible for protecting the interests of shareholders. The Trustees are experienced executives who meet periodically throughout the year to oversee the fund's activities, review contractual arrangements with companies that provide services to the fund, oversee management of the risks associated with such activities and contractual arrangements, and review the fund's performance. Each of the Trustees oversees 293 funds.
The Trustees hold office without limit in time except that (a) any Trustee may resign; (b) any Trustee may be removed by written instrument, signed by at least two-thirds of the number of Trustees prior to such removal; (c) any Trustee who requests to be retired or who has become incapacitated by illness or injury may be retired by written instrument signed by a majority of the other Trustees; and (d) any Trustee may be removed at any special meeting of shareholders by a two-thirds vote of the outstanding voting securities of the trust. Each Trustee who is not an interested person (as defined in the 1940 Act) of the trust and the fund is referred to herein as an Independent Trustee. Each Independent Trustee shall retire not later than the last day of the calendar year in which his or her 75th birthday occurs. The Independent Trustees may waive this mandatory retirement age policy with respect to individual Trustees. Officers and Advisory Board Members hold office without limit in time, except that any officer or Advisory Board Member may resign or may be removed by a vote of a majority of the Trustees at any regular meeting or any special meeting of the Trustees. Except as indicated, each individual has held the office shown or other offices in the same company for the past five years.
The fund's Statement of Additional Information (SAI) includes more information about the Trustees. To request a free copy, call Fidelity at 1-800-544-8544.
Experience, Skills, Attributes, and Qualifications of the Trustees. The Governance and Nominating Committee has adopted a statement of policy that describes the experience, qualifications, attributes, and skills that are necessary and desirable for potential Independent Trustee candidates (Statement of Policy). The Board believes that each Trustee satisfied at the time he or she was initially elected or appointed a Trustee, and continues to satisfy, the standards contemplated by the Statement of Policy. The Governance and Nominating Committee also engages professional search firms to help identify potential Independent Trustee candidates who have the experience, qualifications, attributes, and skills consistent with the Statement of Policy. From time to time, additional criteria based on the composition and skills of the current Independent Trustees, as well as experience or skills that may be appropriate in light of future changes to board composition, business conditions, and regulatory or other developments, have also been considered by the professional search firms and the Governance and Nominating Committee. In addition, the Board takes into account the Trustees' commitment and participation in Board and committee meetings, as well as their leadership of standing and ad hoc committees throughout their tenure.
In determining that a particular Trustee was and continues to be qualified to serve as a Trustee, the Board has considered a variety of criteria, none of which, in isolation, was controlling. The Board believes that, collectively, the Trustees have balanced and diverse experience, qualifications, attributes, and skills, which allow the Board to operate effectively in governing the fund and protecting the interests of shareholders. Information about the specific experience, skills, attributes, and qualifications of each Trustee, which in each case led to the Board's conclusion that the Trustee should serve (or continue to serve) as a trustee of the fund, is provided below.
Board Structure and Oversight Function. Abigail P. Johnson is an interested person and currently serves as Chairman. The Trustees have determined that an interested Chairman is appropriate and benefits shareholders because an interested Chairman has a personal and professional stake in the quality and continuity of services provided to the fund. Independent Trustees exercise their informed business judgment to appoint an individual of their choosing to serve as Chairman, regardless of whether the Trustee happens to be independent or a member of management. The Independent Trustees have determined that they can act independently and effectively without having an Independent Trustee serve as Chairman and that a key structural component for assuring that they are in a position to do so is for the Independent Trustees to constitute a substantial majority for the Board. The Independent Trustees also regularly meet in executive session. Michael E. Kenneally serves as Chairman of the Independent Trustees and as such (i) acts as a liaison between the Independent Trustees and management with respect to matters important to the Independent Trustees and (ii) with management prepares agendas for Board meetings.
Fidelity ® funds are overseen by different Boards of Trustees. The fund's Board oversees Fidelity's investment-grade bond, money market, asset allocation and certain equity funds, and other Boards oversee Fidelity's high income and other equity funds. The asset allocation funds may invest in Fidelity ® funds that are overseen by such other Boards. The use of separate Boards, each with its own committee structure, allows the Trustees of each group of Fidelity ® funds to focus on the unique issues of the funds they oversee, including common research, investment, and operational issues. On occasion, the separate Boards establish joint committees to address issues of overlapping consequences for the Fidelity ® funds overseen by each Board.
The Trustees operate using a system of committees to facilitate the timely and efficient consideration of all matters of importance to the Trustees, the fund, and fund shareholders and to facilitate compliance with legal and regulatory requirements and oversight of the fund's activities and associated risks. The Board, acting through its committees, has charged FMR and its affiliates with (i) identifying events or circumstances the occurrence of which could have demonstrably adverse effects on the fund's business and/or reputation; (ii) implementing processes and controls to lessen the possibility that such events or circumstances occur or to mitigate the effects of such events or circumstances if they do occur; and (iii) creating and maintaining a system designed to evaluate continuously business and market conditions in order to facilitate the identification and implementation processes described in (i) and (ii) above. Because the day-to-day operations and activities of the fund are carried out by or through FMR, its affiliates, and other service providers, the fund's exposure to risks is mitigated but not eliminated by the processes overseen by the Trustees. While each of the Board's committees has responsibility for overseeing different aspects of the fund's activities, oversight is exercised primarily through the Operations and Audit Committees. In addition, an ad hoc Board committee of Independent Trustees has worked with FMR to enhance the Board's oversight of investment and financial risks, legal and regulatory risks, technology risks, and operational risks, including the development of additional risk reporting to the Board. Appropriate personnel, including but not limited to the fund's Chief Compliance Officer (CCO), FMR's internal auditor, the independent accountants, the fund's Treasurer and portfolio management personnel, make periodic reports to the Board's committees, as appropriate, including an annual review of Fidelity's risk management program for the Fidelity ® funds. The responsibilities of each standing committee, including their oversight responsibilities, are described further under "Standing Committees of the Trustees."
Interested Trustees*:
Correspondence intended for a Trustee who is an interested person may be sent to Fidelity Investments, 245 Summer Street, Boston, Massachusetts 02210.
Name, Year of Birth; Principal Occupations and Other Relevant Experience+
Abigail P. Johnson (1961)
Year of Election or Appointment: 2009
Trustee
Chairman of the Board of Trustees
Ms. Johnson also serves as Trustee of other Fidelity ® funds. Ms. Johnson serves as Chairman (2016-present), Chief Executive Officer (2014-present), and Director (2007-present) of FMR LLC (diversified financial services company), President of Fidelity Financial Services (2012-present) and President of Personal, Workplace and Institutional Services (2005-present). Ms. Johnson is Chairman and Director of Fidelity Management & Research Company LLC (investment adviser firm, 2011-present). Previously, Ms. Johnson served as Chairman and Director of FMR Co., Inc. (investment adviser firm, 2011-2019), Vice Chairman (2007-2016) and President (2013-2016) of FMR LLC, President and a Director of Fidelity Management & Research Company (2001-2005), a Trustee of other investment companies advised by Fidelity Management & Research Company, Fidelity Investments Money Management, Inc. (investment adviser firm), and FMR Co., Inc. (2001-2005), Senior Vice President of the Fidelity ® funds (2001-2005), and managed a number of Fidelity ® funds. Ms. Abigail P. Johnson and Mr. Arthur E. Johnson are not related.
Jennifer Toolin McAuliffe (1959)
Year of Election or Appointment: 2016
Trustee
Ms. McAuliffe also serves as Trustee of other Fidelity ® funds and as Trustee of Fidelity Charitable (2020-present). Previously, Ms. McAuliffe served as Co-Head of Fixed Income of Fidelity Investments Limited (now known as FIL Limited (FIL)) (diversified financial services company), Director of Research for FIL's credit and quantitative teams in London, Hong Kong and Tokyo and Director of Research for taxable and municipal bonds at Fidelity Investments Money Management, Inc. Ms. McAuliffe previously served as a member of the Advisory Board of certain Fidelity ® funds (2016). Ms. McAuliffe was previously a lawyer at Ropes & Gray LLP and currently serves as director or trustee of several not-for-profit entities.
* Determined to be an "Interested Trustee" by virtue of, among other things, his or her affiliation with the trust or various entities under common control with FMR.
+ The information includes the Trustee's principal occupation during the last five years and other information relating to the experience, attributes, and skills relevant to the Trustee's qualifications to serve as a Trustee, which led to the conclusion that the Trustee should serve as a Trustee for the fund.
Independent Trustees:
Correspondence intended for an Independent Trustee may be sent to Fidelity Investments, P.O. Box 55235, Boston, Massachusetts 02205-5235.
Name, Year of Birth; Principal Occupations and Other Relevant Experience+
Elizabeth S. Acton (1951)
Year of Election or Appointment: 2013
Trustee
Ms. Acton also serves as Trustee of other Fidelity ® funds. Prior to her retirement, Ms. Acton served as Executive Vice President, Finance (2011-2012), Executive Vice President, Chief Financial Officer (2002-2011) and Treasurer (2004-2005) of Comerica Incorporated (financial services). Prior to joining Comerica, Ms. Acton held a variety of positions at Ford Motor Company (1983-2002), including Vice President and Treasurer (2000-2002) and Executive Vice President and Chief Financial Officer of Ford Motor Credit Company (1998-2000). Ms. Acton currently serves as a member of the Board and Audit and Finance Committees of Beazer Homes USA, Inc. (homebuilding, 2012-present). Ms. Acton previously served as a member of the Advisory Board of certain Fidelity ® funds (2013-2016).
Ann E. Dunwoody (1953)
Year of Election or Appointment: 2018
Trustee
General Dunwoody also serves as Trustee of other Fidelity ® funds. General Dunwoody (United States Army, Retired) was the first woman in U.S. military history to achieve the rank of four-star general and prior to her retirement in 2012 held a variety of positions within the U.S. Army, including Commanding General, U.S. Army Material Command (2008-2012). General Dunwoody currently serves as President of First to Four LLC (leadership and mentoring services, 2012-present), a member of the Board and Nomination and Corporate Governance Committees of Kforce Inc. (professional staffing services, 2016-present) and a member of the Board of Automattic Inc. (software engineering, 2018-present). Previously, General Dunwoody served as a member of the Advisory Board and Nominating and Corporate Governance Committee of L3 Technologies, Inc. (communication, electronic, sensor and aerospace systems, 2013-2019) and a member of the Board and Audit and Sustainability and Corporate Responsibility Committees of Republic Services, Inc. (waste collection, disposal and recycling, 2013-2016). Ms. Dunwoody also serves on several boards for non-profit organizations, including as a member of the Board, Chair of the Nomination and Governance Committee and a member of the Audit Committee of Logistics Management Institute (consulting non-profit, 2012-present), a member of the Council of Trustees for the Association of the United States Army (advocacy non-profit, 2013-present), a member of the Board of Florida Institute of Technology (2015-present) and a member of the Board of ThanksUSA (military family education non-profit, 2014-present). General Dunwoody previously served as a member of the Advisory Board of certain Fidelity ® funds (2018).
John Engler (1948)
Year of Election or Appointment: 2014
Trustee
Mr. Engler also serves as Trustee of other Fidelity ® funds. Previously, Mr. Engler served as Governor of Michigan (1991-2003), President of the Business Roundtable (2011-2017) and interim President of Michigan State University (2018-2019). Mr. Engler currently serves as a member of the Board of Stride, Inc. (formerly K12 Inc.) (technology-based education company, 2012-present). Previously, Mr. Engler served as a member of the Board of Universal Forest Products (manufacturer and distributor of wood and wood-alternative products, 2003-2019) and Trustee of The Munder Funds (2003-2014). Mr. Engler previously served as a member of the Advisory Board of certain Fidelity ® funds (2014-2016).
Robert F. Gartland (1951)
Year of Election or Appointment: 2010
Trustee
Mr. Gartland also serves as Trustee of other Fidelity ® funds. Prior to his retirement, Mr. Gartland held a variety of positions at Morgan Stanley (financial services, 1979-2007), including Managing Director (1987-2007) and Chase Manhattan Bank (1975-1978). Mr. Gartland previously served as Chairman and an investor in Gartland & Mellina Group Corp. (consulting, 2009-2019), as a member of the Board of National Securities Clearing Corporation (1993-1996) and as Chairman of TradeWeb (2003-2004).
Arthur E. Johnson (1947)
Year of Election or Appointment: 2008
Trustee
Mr. Johnson also serves as Trustee of other Fidelity ® funds. Prior to his retirement, Mr. Johnson served as Senior Vice President of Corporate Strategic Development of Lockheed Martin Corporation (defense contractor, 1999-2009). Mr. Johnson currently serves as a member of the Board of Booz Allen Hamilton (management consulting, 2011-present). Mr. Johnson previously served as a member of the Board of Eaton Corporation plc (diversified power management, 2009-2019) and a member of the Board of AGL Resources, Inc. (holding company, 2002-2016). Mr. Johnson previously served as Chairman (2018-2021) and Vice Chairman (2015-2018) of the Independent Trustees of certain Fidelity® funds. Mr. Arthur E. Johnson is not related to Ms. Abigail P. Johnson.
Michael E. Kenneally (1954)
Year of Election or Appointment: 2009
Trustee
Chairman of the Independent Trustees
Mr. Kenneally also serves as Trustee of other Fidelity ® funds and was Vice Chairman (2018-2021) of the Independent Trustees of certain Fidelity ® funds. Prior to retirement in 2005, he was Chairman and Global Chief Executive Officer of Credit Suisse Asset Management, the worldwide fund management and institutional investment business of Credit Suisse Group. Previously, Mr. Kenneally was an Executive Vice President and the Chief Investment Officer for Bank of America. In this role, he was responsible for the investment management, strategy and products delivered to the bank's institutional, high-net-worth and retail clients. Earlier, Mr. Kenneally directed the organization's equity and quantitative research groups. He began his career as a research analyst and then spent more than a dozen years as a portfolio manager for endowments, pension plans and mutual funds. He earned the Chartered Financial Analyst (CFA) designation in 1991.
Mark A. Murray (1954)
Year of Election or Appointment: 2016
Trustee
Mr. Murray also serves as Trustee of other Fidelity ® funds. Previously, Mr. Murray served as Co-Chief Executive Officer (2013-2016), President (2006-2013) and Vice Chairman (2013-2020) of Meijer, Inc. Mr. Murray serves as a member of the Board (2009-present) and Public Policy and Responsibility Committee (2009-present) and Chair of the Nuclear Review Committee (2019-present) of DTE Energy Company (diversified energy company). Mr. Murray previously served as a member of the Board of Spectrum Health (not-for-profit health system, 2015-2019) and as a member of the Board and Audit Committee and Chairman of the Nominating and Corporate Governance Committee of Universal Forest Products, Inc. (manufacturer and distributor of wood and wood-alternative products, 2004-2016). Mr. Murray also serves as a member of the Board of many community and professional organizations. Mr. Murray previously served as a member of the Advisory Board of certain Fidelity ® funds (2016).
+ The information includes the Trustee's principal occupation during the last five years and other information relating to the experience, attributes, and skills relevant to the Trustee's qualifications to serve as a Trustee, which led to the conclusion that the Trustee should serve as a Trustee for the fund.
Advisory Board Members and Officers:
Correspondence intended for a Member of the Advisory Board (if any) may be sent to Fidelity Investments, P.O. Box 55235, Boston, Massachusetts 02205-5235. Correspondence intended for an officer may be sent to Fidelity Investments, 245 Summer Street, Boston, Massachusetts 02210. Officers appear below in alphabetical order.
Name, Year of Birth; Principal Occupation
Laura M. Bishop (1961)
Year of Election or Appointment: 2022
Member of the Advisory Board
Ms. Bishop also serves as a Member of the Advisory Board of other funds. Prior to her retirement, Ms. Bishop held a variety of positions at United Services Automobile Association (2001-2020), including Executive Vice President and Chief Financial Officer (2014-2020) and Senior Vice President and Deputy Chief Financial Officer (2012-2014). Ms. Bishop currently serves as a member of the Audit Committee and Compensation and Personnel Committee (2021-present) of the Board of Directors of Korn Ferry (global organizational consulting).
Robert W. Helm (1957)
Year of Election or Appointment: 2021
Member of the Advisory Board
Mr. Helm also serves as a Member of the Advisory Board of other Fidelity® funds. Mr. Helm was formerly Deputy Chairman (2003-2020), partner (1991-2020) and an associate (1984-1991) of Dechert LLP (formerly Dechert Price & Rhoads). Mr. Helm currently serves on boards and committees of several not-for-profit organizations.
Craig S. Brown (1977)
Year of Election or Appointment: 2019
Assistant Treasurer
Mr. Brown also serves as an officer of other funds. Mr. Brown serves as Assistant Treasurer of FIMM, LLC (2021-present) and is an employee of Fidelity Investments (2013-present). Previously, Mr. Brown served as Assistant Treasurer of certain Fidelity ® funds (2019-2022).
John J. Burke III (1964)
Year of Election or Appointment: 2018
Chief Financial Officer
Mr. Burke also serves as Chief Financial Officer of other funds. Mr. Burke serves as Head of Investment Operations for Fidelity Fund and Investment Operations (2018-present) and is an employee of Fidelity Investments (1998-present). Previously Mr. Burke served as head of Asset Management Investment Operations (2012-2018).
David J. Carter (1973)
Year of Election or Appointment: 2020
Assistant Secretary
Mr. Carter also serves as Assistant Secretary of other funds. Mr. Carter serves as Senior Vice President, Deputy General Counsel (2022-present) and is an employee of Fidelity Investments (2005-present).
Jonathan Davis (1968)
Year of Election or Appointment: 2010
Assistant Treasurer
Mr. Davis also serves as an officer of other funds. Mr. Davis serves as Assistant Treasurer of FIMM, LLC (2021-present), FMR Capital, Inc. (2017-present), FD Funds GP LLC (2021-present), FD Funds Holding LLC (2021-present), and FD Funds Management LLC (2021-present); and is an employee of Fidelity Investments. Previously, Mr. Davis served as Vice President and Associate General Counsel of FMR LLC (diversified financial services company, 2003-2010).
Laura M. Del Prato (1964)
Year of Election or Appointment: 2018
President and Treasurer
Ms. Del Prato also serves as an officer of other funds. Ms. Del Prato serves as Assistant Treasurer of FIMM, LLC (2021-present) and is an employee of Fidelity Investments (2017-present). Previously, Ms. Del Prato served as President and Treasurer of The North Carolina Capital Management Trust: Cash Portfolio and Term Portfolio (2018-2020). Prior to joining Fidelity Investments, Ms. Del Prato served as a Managing Director and Treasurer of the JPMorgan Mutual Funds (2014-2017). Prior to JPMorgan, Ms. Del Prato served as a partner at Cohen Fund Audit Services (accounting firm, 2012-2013) and KPMG LLP (accounting firm, 2004-2012).
Colm A. Hogan (1973)
Year of Election or Appointment: 2016
Assistant Treasurer
Mr. Hogan also serves as an officer of other funds. Mr. Hogan serves as Assistant Treasurer of FIMM, LLC (2021-present) and FMR Capital, Inc. (2017-present) and is an employee of Fidelity Investments (2005-present). Previously, Mr. Hogan served as Deputy Treasurer of certain Fidelity ® funds (2016-2020) and Assistant Treasurer of certain Fidelity ® funds (2016-2018).
Cynthia Lo Bessette (1969)
Year of Election or Appointment: 2019
Secretary and Chief Legal Officer (CLO)
Ms. Lo Bessette also serves as an officer of other funds. Ms. Lo Bessette serves as CLO, Secretary, and Senior Vice President of Fidelity Management & Research Company LLC (investment adviser firm, 2019-present); CLO of Fidelity Management & Research (Hong Kong) Limited, FMR Investment Management (UK) Limited, and Fidelity Management & Research (Japan) Limited (investment adviser firms, 2019-present); Secretary of FD Funds GP LLC (2021-present), FD Funds Holding LLC (2021-present), FD Funds Management LLC (2021-present), and Fidelity Diversifying Solutions LLC (investment adviser firm, 2022-present); and Assistant Secretary of FIMM, LLC (2019-present). She is a Senior Vice President and Deputy General Counsel of FMR LLC (diversified financial services company, 2019-present), and is an employee of Fidelity Investments. Previously, Ms. Lo Bessette served as CLO, Secretary, and Senior Vice President of FMR Co., Inc. (investment adviser firm, 2019); Secretary of Fidelity SelectCo, LLC and Fidelity Investments Money Management, Inc. (investment adviser firms, 2019). Prior to joining Fidelity Investments, Ms. Lo Bessette was Executive Vice President, General Counsel (2016-2019) and Senior Vice President, Deputy General Counsel (2015-2016) of OppenheimerFunds (investment management company) and Deputy Chief Legal Officer (2013-2015) of Jennison Associates LLC (investment adviser firm).
Chris Maher (1972)
Year of Election or Appointment: 2013
Assistant Treasurer
Mr. Maher also serves as an officer of other funds. Mr. Maher serves as Assistant Treasurer of FIMM, LLC (2021-present) and FMR Capital, Inc. (2017-present), and is an employee of Fidelity Investments (2008-present). Previously, Mr. Maher served as Assistant Treasurer of certain funds (2013-2020); Vice President of Asset Management Compliance (2013), Vice President of the Program Management Group of FMR (investment adviser firm, 2010-2013), and Vice President of Valuation Oversight (2008-2010).
Jamie Pagliocco (1964)
Year of Election or Appointment: 2020
Vice President
Mr. Pagliocco also serves as Vice President of other funds. Mr. Pagliocco serves as President of Fixed Income (2020-present), and is an employee of Fidelity Investments (2001-present). Previously, Mr. Pagliocco served as Co-Chief Investment Officer - Bond (2017-2020), Global Head of Bond Trading (2016-2019), and as a portfolio manager.
Kenneth B. Robins (1969)
Year of Election or Appointment: 2020
Chief Compliance Officer
Mr. Robins also serves as an officer of other funds. Mr. Robins serves as Compliance Officer of Fidelity Management & Research Company LLC (investment adviser firm, 2016-present) and is an employee of Fidelity Investments (2004-present). Previously, Mr. Robins served as Compliance Officer of FMR Co., Inc. (investment adviser firm, 2016-2019), as Executive Vice President of Fidelity Investments Money Management, Inc. (investment adviser firm, 2013-2016) and served in other fund officer roles.
Brett Segaloff (1972)
Year of Election or Appointment: 2021
Anti-Money Laundering (AML) Officer
Mr. Segaloff also serves as an AML Officer of other funds and other related entities. He is Director, Anti-Money Laundering (2007-present) of FMR LLC (diversified financial services company) and is an employee of Fidelity Investments (1996-present).
Stacie M. Smith (1974)
Year of Election or Appointment: 2013
Assistant Treasurer
Ms. Smith also serves as an officer of other funds. Ms. Smith serves as Assistant Treasurer of FIMM, LLC (2021-present) and FMR Capital, Inc. (2017-present), is an employee of Fidelity Investments (2009-present), and has served in other fund officer roles. Prior to joining Fidelity Investments, Ms. Smith served as Senior Audit Manager of Ernst & Young LLP (accounting firm, 1996-2009). Previously, Ms. Smith served as Assistant Treasurer (2013-2019) and Deputy Treasurer (2013-2016) of certain Fidelity ® funds.
Jim Wegmann (1979)
Year of Election or Appointment: 2021
Deputy Treasurer
Mr. Wegmann also serves as an officer of other funds. Mr. Wegmann serves as Assistant Treasurer of FIMM, LLC (2021-present) and is an employee of Fidelity Investments (2011-present). Previously, Mr. Wegmann served as Assistant Treasurer of certain Fidelity ® funds (2019-2021).
As a shareholder, you incur two types of costs: (1) transaction costs, which may include sales charges (loads) on purchase payments or redemption proceeds, as applicable and (2) ongoing costs, which generally include management fees, distribution and/or service (12b-1) fees and other Fund expenses. This Example is intended to help you understand your ongoing costs (in dollars) of investing in a fund and to compare these costs with the ongoing costs of investing in other mutual funds.
| The Example is based on an investment of $1,000 invested at the beginning of the period and held for the entire period (June 1, 2022 to November 30, 2022). |
Actual Expenses
The first line of the accompanying table provides information about actual account values and actual expenses. You may use the information in this line, together with the amount you invested, to estimate the expenses that you paid over the period. Simply divide your account value by $1,000.00 (for example, an $8,600 account value divided by $1,000.00 = 8.6), then multiply the result by the number in the first line for a class/Fund under the heading entitled "Expenses Paid During Period" to estimate the expenses you paid on your account during this period. If any fund is a shareholder of any underlying mutual funds or exchange-traded funds (ETFs) (the Underlying Funds), such fund indirectly bears its proportional share of the expenses of the Underlying Funds in addition to the direct expenses incurred presented in the table. These fees and expenses are not included in the annualized expense ratio used to calculate the expense estimate in the table below.
Hypothetical Example for Comparison Purposes
The second line of the accompanying table provides information about hypothetical account values and hypothetical expenses based on the actual expense ratio and an assumed rate of return of 5% per year before expenses, which is not the actual return. The hypothetical account values and expenses may not be used to estimate the actual ending account balance or expenses you paid for the period. You may use this information to compare the ongoing costs of investing in the Fund and other funds. To do so, compare this 5% hypothetical example with the 5% hypothetical examples that appear in the shareholder reports of the other funds. If any fund is a shareholder of any Underlying Funds, such fund indirectly bears its proportional share of the expenses of the Underlying Funds in addition to the direct expenses as presented in the table. These fees and expenses are not included in the annualized expense ratio used to calculate the expense estimate in the table below.
Please note that the expenses shown in the table are meant to highlight your ongoing costs only and do not reflect any transaction costs. Therefore, the second line of the table is useful in comparing ongoing costs only, and will not help you determine the relative total costs of owning different funds. In addition, if these transactional costs were included, your costs would have been higher.
| | | | | Annualized Expense Ratio- A | | Beginning Account Value June 1, 2022 | | Ending Account Value November 30, 2022 | | Expenses Paid During Period- C June 1, 2022 to November 30, 2022 |
| | | | | | | | | | |
| Fidelity® Limited Term Government Fund | | | | .45% | | | | | | |
| Actual | | | | | | $ 1,000 | | $ 975.30 | | $ 2.23 |
Hypothetical- B | | | | | | $ 1,000 | | $ 1,022.81 | | $ 2.28 |
| |
A Annualized expense ratio reflects expenses net of applicable fee waivers.
B 5% return per year before expenses
C Expenses are equal to the annualized expense ratio, multiplied by the average account value over the period, multiplied by 183/ 365 (to reflect the one-half year period). The fees and expenses of any Underlying Funds are not included in each annualized expense ratio.
The dividend and capital gains distributions for the fund(s) are available on Fidelity.com or Institutional.Fidelity.com .
A total of 67.26% of the dividends distributed during the fiscal year was derived from interest on U.S. Government securities which is generally exempt from state income tax.
The fund designates $1,933,566 of distributions paid in the calendar year 2021 as qualifying to be taxed as interest-related dividends for nonresident alien shareholders.
The fund designates $2,093,275 of distributions paid in the calendar year 2021 as qualifying to be taxed as section 163(j) interest dividends.
The fund will notify shareholders in January 2023 of amounts for use in preparing 2022 income tax returns.
Fidelity Limited Term Government Fund
Each year, the Board of Trustees, including the Independent Trustees (together, the Board), votes on the renewal of the management contract with Fidelity Management & Research Company LLC (FMR) and the sub-advisory agreements (together, the Advisory Contracts) for the fund. FMR and the sub-advisers are referred to herein as the Investment Advisers. The Board, assisted by the advice of fund counsel and Independent Trustees' counsel, requests and considers a broad range of information relevant to the renewal of the Advisory Contracts throughout the year.
The Board meets regularly and, at each of its meetings, covers an extensive agenda of topics and materials and considers factors that are relevant to its annual consideration of the renewal of the fund's Advisory Contracts, including the services and support provided to the fund and its shareholders. The Board has established four standing committees (Committees) - Operations, Audit, Fair Valuation, and Governance and Nominating - each composed of and chaired by Independent Trustees with varying backgrounds, to which the Board has assigned specific subject matter responsibilities in order to enhance effective decision-making by the Board. The Operations Committee, of which all the Independent Trustees are members, meets regularly throughout the year and requests, receives and considers, among other matters, information related to the annual consideration of the renewal of the fund's Advisory Contracts before making its recommendation to the Board. The Board also meets as needed to review matters specifically related to the Board's annual consideration of the renewal of the Advisory Contracts. Members of the Board may also meet from time to time with trustees of other Fidelity funds through joint ad hoc committees to discuss certain matters relevant to all of the Fidelity funds.
At its September 2022 meeting, the Board unanimously determined to renew the fund's Advisory Contracts. In reaching its determination, the Board considered all factors it believed relevant, including (i) the nature, extent, and quality of the services provided to the fund and its shareholders (including the investment performance of the fund); (ii) the competitiveness relative to peer funds of the fund's management fee and the total expense ratio; (iii) the total costs of the services provided by and the profits realized by Fidelity from its relationships with the fund; and (iv) the extent to which, if any, economies of scale exist and are realized as the fund grows, and whether any economies of scale are appropriately shared with fund shareholders.
In considering whether to renew the Advisory Contracts for the fund, the Board reached a determination, with the assistance of fund counsel and Independent Trustees' counsel and through the exercise of its business judgment, that the renewal of the Advisory Contracts was in the best interests of the fund and its shareholders and that the compensation payable under the Advisory Contracts was fair and reasonable. The Board's decision to renew the Advisory Contracts was not based on any single factor, but rather was based on a comprehensive consideration of all the information provided to the Board at its meetings throughout the year. The Board, in reaching its determination to renew the Advisory Contracts, was aware that shareholders of the fund have a broad range of investment choices available to them, including a wide choice among funds offered by Fidelity's competitors, and that the fund's shareholders, who have the opportunity to review and weigh the disclosure provided by the fund in its prospectus and other public disclosures, have chosen to invest in this fund, which is part of the Fidelity family of funds.
Nature, Extent, and Quality of Services Provided . The Board considered Fidelity's staffing as it relates to the fund, including the backgrounds of investment personnel of Fidelity, and also considered the fund's investment objective, strategies, and related investment philosophy. The Independent Trustees also had discussions with senior management of Fidelity's investment operations and investment groups. The Board considered the structure of the investment personnel compensation program and whether this structure provides appropriate incentives to act in the best interests of the fund. Additionally, the Board considered the portfolio managers' investments, if any, in the funds that they manage. The Board also considered the steps Fidelity had taken to ensure the continued provision of high quality services to the Fidelity funds throughout the COVID-19 pandemic, including the expansion of staff in client facing positions to maintain service levels in periods of high volumes and volatility.
Resources Dedicated to Investment Management and Support Services . The Board reviewed the general qualifications and capabilities of Fidelity's investment staff, including its size, education, experience, and resources, as well as Fidelity's approach to recruiting, training, managing, and compensating investment personnel. The Board noted the resources devoted to Fidelity's global investment organization, and that Fidelity's analysts have extensive resources, tools and capabilities that allow them to conduct quantitative and fundamental analysis, as well as credit analysis of issuers, counterparties and guarantors. Further, the Board considered that Fidelity's investment professionals have sufficient access to global information and data so as to provide competitive investment results over time, and that those professionals also have access to sophisticated tools that permit them to assess portfolio construction and risk and performance attribution characteristics continuously, as well as to transmit new information and research conclusions rapidly around the world. Additionally, in its deliberations, the Board considered Fidelity's trading, risk management, compliance, cybersecurity, and technology and operations capabilities and resources, which are integral parts of the investment management process.
Shareholder and Administrative Services . The Board considered (i) the nature, extent, quality, and cost of advisory, administrative, and shareholder services performed by the Investment Advisers and their affiliates under the Advisory Contracts and under separate agreements covering transfer agency, pricing and bookkeeping, and securities lending services for the fund; (ii) the nature and extent of the supervision of third party service providers, principally custodians, subcustodians, and pricing vendors; and (iii) the resources devoted to, and the record of compliance with, the fund's compliance policies and procedures.
The Board noted that the growth of fund assets over time across the complex allows Fidelity to reinvest in the development of services designed to enhance the value and convenience of the Fidelity funds as investment vehicles. These services include 24-hour access to account information and market information over the Internet and through telephone representatives, investor education materials and asset allocation tools. The Board also considered that it reviews customer service metrics such as telephone response times, continuity of services on the website and metrics addressing services at Fidelity Investor Centers.
Investment in a Large Fund Family. The Board considered the benefits to shareholders of investing in a Fidelity fund, including the benefits of investing in a fund that is part of a large family of funds offering a variety of investment disciplines and providing a large variety of mutual fund investor services. The Board noted that Fidelity had taken, or had made recommendations to the Board that resulted in the Fidelity funds taking, a number of actions over the previous year that benefited particular funds, including: (i) continuing to dedicate additional resources to Fidelity's investment research process, which includes meetings with management of issuers of securities in which the funds invest; (ii) continuing efforts to enhance Fidelity's global research capabilities; (iii) launching new funds, ETFs, and share classes with innovative structures, strategies and pricing and making other enhancements to meet investor needs; (iv) broadening eligibility requirements for certain funds and share classes; (v) reducing management fees and total expenses for certain funds and classes; (vi) lowering expenses for certain existing funds and classes by implementing or lowering expense caps; (vii) rationalizing product lines and gaining increased efficiencies from fund mergers and liquidations; (viii) continuing to develop, acquire and implement systems and technology to improve services to the funds and shareholders, strengthen information security, and increase efficiency; and (ix) continuing to implement enhancements to further strengthen Fidelity's product line to increase investors' probability of success in achieving their investment goals, including their retirement income goals.
Investment Performance . The Board considered whether the fund has operated in accordance with its investment objective, as well as its record of compliance with its investment restrictions and its performance history.
The Board took into account discussions that occur at Board meetings throughout the year with representatives of the Investment Advisers about fund investment performance. In this regard the Board noted that as part of regularly scheduled fund reviews and other reports to the Board on fund performance, the Board considers annualized return information for the fund for different time periods, measured against an appropriate securities market index (benchmark index) and an appropriate peer group of funds with similar objectives (peer group). The Board also receives and considers information about performance attribution. In its evaluation of fund investment performance at meetings throughout the year, the Board gave particular attention to information indicating underperformance of certain Fidelity funds for specific time periods and discussed with the Investment Advisers the reasons for such underperformance.
In addition to reviewing absolute and relative fund performance, the Independent Trustees periodically consider the appropriateness of fund performance metrics in evaluating the results achieved. In general, the Independent Trustees believe that fund performance should be evaluated based on gross performance (before fees and expenses but after transaction costs) compared to appropriate benchmark indices, over appropriate time periods that may include full market cycles, and on net performance (after fees and expenses) compared to appropriate peer groups, as applicable, over the same periods, taking into account relevant factors including the following: general market conditions; expectations for interest rate levels and credit conditions; issuer-specific information including credit quality; the potential for incremental return versus the fund's benchmark index weighed against the risks involved in obtaining that incremental return, including the risk of diminished or negative total returns; and fund cash flows and other factors. The Independent Trustees generally give greater weight to fund performance over longer time periods than over shorter time periods. Depending on the circumstances, the Independent Trustees may be satisfied with a fund's performance notwithstanding that it lags its benchmark index or peer group for certain periods.
The Independent Trustees recognize that shareholders evaluate performance on a net basis over their own holding periods, for which one-, three-, and five-year periods are often used as a proxy. For this reason, the performance information reviewed by the Board also included net cumulative calendar year total return information for the fund and an appropriate benchmark index and peer group for the most recent one-, three-, and five-year periods. The Independent Trustees recognize that shareholders who are not investing through a tax-advantaged retirement account also consider tax consequences in evaluating performance.
Based on its review, the Board concluded that the nature, extent, and quality of services provided to the fund under the Advisory Contracts should continue to benefit the shareholders of the fund.
Competitiveness of Management Fee and Total Expense Ratio. The Board considered the fund's management fee and total expense ratio compared to selected groups of competitive funds and classes (referred to as "mapped groups" below) for the purpose of facilitating the Trustees' competitive analysis of management fees and total expenses. Fidelity creates "mapped groups" by combining similar investment objective categories (as classified by Lipper) that have comparable investment mandates. Combining funds with similar investment objective categories aids the Board's comparison of management fees and total expense ratios by broadening the competitive group used for such comparison.
Management Fee . The Board considered two proprietary management fee comparisons for the 12-month periods shown in basis points (BP) in the chart below. The group of Lipper funds used by the Board for management fee comparisons is referred to below as the "Total Mapped Group" and is broader than the Lipper peer group used by the Board for performance comparisons. The Total Mapped Group comparison focuses on a fund's standing in terms of gross management fees before expense reimbursements or caps relative to the total universe of funds with comparable investment mandates, regardless of whether their management fee structures also are comparable. Funds with comparable investment mandates offer exposure to similar types of securities. Funds with comparable management fee structures have similar management fee contractual arrangements (e.g., flat rate charged for advisory services, all-inclusive fee rate, etc.). "TMG %" represents the percentage of funds in the Total Mapped Group that had management fees that were lower than the fund's. For example, a hypothetical TMG % of 20% would mean that 80% of the funds in the Total Mapped Group had higher, and 20% had lower, management fees than the fund. The fund's actual TMG %s and the number of funds in the Total Mapped Group are in the chart below. The "Asset-Sized Peer Group" (ASPG) comparison focuses on a fund's standing relative to a subset of non-Fidelity funds within the Total Mapped Group that are similar in size and management fee structure. For example, if a fund is in the first quartile of the ASPG, the fund's management fee ranks in the least expensive or lowest 25% of funds in the ASPG. The ASPG represents at least 15% of the funds in the Total Mapped Group with comparable asset size and management fee structures, subject to a minimum of 50 funds (or all funds in the Total Mapped Group if fewer than 50). Additional information, such as the ASPG quartile in which the fund's management fee rate ranked, is also included in the chart and was considered by the Board.

The Board noted that the fund's management fee rate ranked above the median of its Total Mapped Group and equal to the median of its ASPG for 2021. The Board noted that the fund has an all-inclusive fee that covers expenses beyond the management fee, whereas the majority of funds within its Total Mapped Group do not have all-inclusive fees. As discussed below, when compared to the total expenses of its load-type competitors, the fund ranks below its load-type median.
Based on its review, the Board concluded that the fund's management fee is fair and reasonable in light of the services that the fund receives and the other factors considered.
Total Expense Ratio . In its review of the fund's total expense ratio, the Board considered the fund's all-inclusive (subject to certain limited exceptions) fee rate. The Board also considered other expenses, such as transfer agent fees, pricing and bookkeeping fees, and custodial, legal, and audit fees, paid by FMR under the all-inclusive arrangement. The Board also noted that Fidelity may agree to waive fees or reimburse expenses from time to time, and the extent to which, if any, it has done so for the fund. The fund is compared to those funds and classes in the Total Mapped Group (used by the Board for management fee comparisons) that have a similar sales load structure. The Board also considered a total expense ASPG comparison, which focuses on the total expenses of the fund relative to a subset of non-Fidelity funds within the similar sales load structure group that are similar in size and management fee structure. The total expense ASPG is limited to 15 larger and 15 smaller classes of different funds, where possible. The total expense ASPG comparison excludes performance adjustments and fund-paid 12b-1 fees to eliminate variability in expenses relating to these items.
The Board noted that the fund's total net expense ratio ranked below the similar sales load structure group competitive median for 2021 and below the ASPG competitive median for 2021.
Fees Charged to Other Fidelity Clients . The Board also considered Fidelity fee structures and other information with respect to clients of Fidelity, such as other funds advised or subadvised by Fidelity, pension plan clients, and other institutional clients with similar mandates. The Board noted that a joint ad hoc committee created by it and the boards of other Fidelity funds periodically reviews and compares Fidelity's institutional investment advisory business with its business of providing services to the Fidelity funds and also noted the most recent findings of the committee. The Board noted that the committee's review included a consideration of the differences in services provided, fees charged, and costs incurred, as well as competition in the markets serving the different categories of clients.
Based on its review of total expense ratios and fees charged to other Fidelity clients, the Board concluded that the fund's total expense ratio was reasonable in light of the services that the fund and its shareholders receive and the other factors considered.
Costs of the Services and Profitability . The Board considered the revenues earned and the expenses incurred by Fidelity in conducting the business of developing, marketing, distributing, managing, administering and servicing the fund and servicing the fund's shareholders. The Board also considered the level of Fidelity's profits in respect of all the Fidelity funds.
On an annual basis, Fidelity presents to the Board information about the profitability of its relationships with the fund. Fidelity calculates profitability information for each fund, as well as aggregate profitability information for groups of Fidelity funds and all Fidelity funds, using a series of detailed revenue and cost allocation methodologies which originate with the books and records of Fidelity on which Fidelity's audited financial statements are based. The Audit Committee of the Board reviews any significant changes from the prior year's methodologies and the full Board approves such changes.
A public accounting firm has been engaged annually by the Board as part of the Board's assessment of Fidelity's profitability analysis. The engagement includes the review and assessment of the methodologies used by Fidelity in determining the revenues and expenses attributable to Fidelity's mutual fund business, and completion of agreed-upon procedures in respect of the mathematical accuracy of certain fund profitability information and its conformity to established allocation methodologies. After considering the reports issued under the engagement and information provided by Fidelity, the Board concluded that while other allocation methods may also be reasonable, Fidelity's profitability methodologies are reasonable in all material respects.
The Board also reviewed Fidelity's non-fund businesses and potential indirect benefits such businesses may have received as a result of their association with Fidelity's mutual fund business (i.e., fall-out benefits) as well as cases where Fidelity's affiliates may benefit from the funds' business. The Board considered areas where potential indirect benefits to the Fidelity funds from their relationships with Fidelity may exist. The Board's consideration of these matters was informed by the findings of a joint ad hoc committee created by it and the boards of other Fidelity funds to evaluate potential fall-out benefits.
The Board considered the costs of the services provided by and the profits realized by Fidelity in connection with the operation of the fund and was satisfied that the profitability was not excessive.
Economies of Scale. The Board considered whether there have been economies of scale in respect of the management of the Fidelity funds, whether the Fidelity funds (including the fund) have appropriately benefited from any such economies of scale, and whether there is potential for realization of any further economies of scale. The Board considered the extent to which the fund will benefit from economies of scale as assets grow through increased services to the fund, through waivers or reimbursements, or through fee or expense ratio reductions. The Board recognized that, due to the fund's current contractual arrangements, its expense ratio will not decline if the fund's operating costs decrease as assets grow, or rise as assets decrease. The Board also noted that a committee (the Economies of Scale Committee) created by it and the boards of other Fidelity funds periodically analyzes whether Fidelity attains economies of scale in respect of the management and servicing of the Fidelity funds, whether the Fidelity funds have appropriately benefited from such economies of scale, and whether there is potential for realization of any further economies of scale.
The Board concluded, taking into account the analysis of the Economies of Scale Committee, that economies of scale, if any, are being appropriately shared between fund shareholders and Fidelity.
Additional Information Requested by the Board . In order to develop fully the factual basis for consideration of the Fidelity funds' advisory contracts, the Board requested and received additional information on certain topics, including: (i) Fidelity's fund profitability methodology, profitability trends for certain funds, the allocation of various costs to different funds, and the impact of certain factors on fund profitability results; (ii) portfolio manager changes that have occurred during the past year and the amount of the investment that each portfolio manager has made in the Fidelity fund(s) that he or she manages; (iii) the extent to which current market conditions have affected retention and recruitment of personnel; (iv) the arrangements with and compensation paid to certain fund sub-advisers on behalf of the Fidelity funds and the treatment of such compensation within Fidelity's fund profitability methodology; (v) the terms of the funds' various management fee structures, including the basic group fee and the terms of Fidelity's voluntary expense limitation arrangements; (vi) Fidelity's transfer agent, pricing and bookkeeping fees, expense and service structures for different funds and classes relative to competitive trends; (vii) the impact on fund profitability of recent industry trends, such as the growth in passively managed funds and the changes in flows for different types of funds; (viii) the types of management fee and total expense comparisons provided, and the challenges and limitations associated with such information; and (ix) explanations regarding the relative total expense ratios and management fees of certain funds and classes, total expense and management fee competitive trends, and methodologies for total expense and management fee competitive comparisons. In addition, the Board considered its discussions with Fidelity regarding Fidelity's efforts to maintain the continuous investment and shareholder services necessary for the funds during the current pandemic and economic circumstances.
Based on its evaluation of all of the conclusions noted above, and after considering all factors it believed relevant, the Board concluded that the advisory fee arrangements are fair and reasonable and that the fund's Advisory Contracts should be renewed.
1.968335.109
ISG-ANN-0123
Item 2.
Code of Ethics
As of the end of the period, November 30, 2022, Fidelity Advisor Series IV (the trust) has adopted a code of ethics, as defined in Item 2 of Form N-CSR, that applies to its President and Treasurer and its Chief Financial Officer. A copy of the code of ethics is filed as an exhibit to this Form N-CSR.
Item 3.
Audit Committee Financial Expert
The Board of Trustees of the trust has determined that Elizabeth S. Acton is an audit committee financial expert, as defined in Item 3 of Form N-CSR. Ms. Acton is independent for purposes of Item 3 of Form N-CSR.
Item 4.
Principal Accountant Fees and Services
Fees and Services
The following table presents fees billed by PricewaterhouseCoopers LLP (“PwC”) in each of the last two fiscal years for services rendered to Fidelity Limited Term Government Fund (the “Fund”):
Services Billed by PwC
November 30, 2022 FeesA
| | | | |
| Audit Fees | Audit-Related Fees | Tax Fees | All Other Fees |
Fidelity Limited Term Government Fund | $52,000 | $4,400 | $9,000 | $2,000 |
| | | | |
| Audit Fees | Audit-Related Fees | Tax Fees | All Other Fees |
Fidelity Limited Term Government Fund | $50,600 | $4,700 | $8,700 | $2,100 |
A Amounts may reflect rounding.
The following table(s) present(s) fees billed by PwC that were required to be approved by the Audit Committee for services that relate directly to the operations and financial reporting of the Fund(s) and that are rendered on behalf of Fidelity Management & Research Company LLC ("FMR") and entities controlling, controlled by, or under common control with FMR (not including any sub-adviser whose role is primarily portfolio management and is subcontracted with or overseen by another investment adviser) that provide ongoing services to the Fund(s) (“Fund Service Providers”):
Services Billed by PwC
| | |
| November 30, 2022A | November 30, 2021A |
Audit-Related Fees | $7,914,600 | $8,522,600 |
Tax Fees | $1,000 | $354,200 |
All Other Fees | $- | $- |
A Amounts may reflect rounding.
“Audit-Related Fees” represent fees billed for assurance and related services that are reasonably related to the performance of the fund audit or the review of the fund's financial statements and that are not reported under Audit Fees.
“Tax Fees” represent fees billed for tax compliance, tax advice or tax planning that relate directly to the operations and financial reporting of the fund.
“All Other Fees” represent fees billed for services provided to the fund or Fund Service Provider, a significant portion of which are assurance related, that relate directly to the operations and financial reporting of the fund, excluding those services that are reported under Audit Fees, Audit-Related Fees or Tax Fees.
Assurance services must be performed by an independent public accountant.
* * *
The aggregate non-audit fees billed by PwC for services rendered to the Fund(s), FMR (not including any sub-adviser whose role is primarily portfolio management and is subcontracted with or overseen by another investment adviser), and any Fund Service Provider for each of the last two fiscal years of the Fund(s) are as follows:
| | |
Billed By | November 30, 2022A | November 30, 2021A |
PwC | $12,898,400 | $14,135,000 |
A Amounts may reflect rounding.
The trust's Audit Committee has considered non-audit services that were not pre-approved that were provided by PwC to Fund Service Providers to be compatible with maintaining the independence of PwC in its(their) audit of the Fund(s), taking into account representations from PwC, in accordance with Public Company Accounting Oversight Board rules, regarding its independence from the Fund(s) and its(their) related entities and FMR’s review of the appropriateness and permissibility under applicable law of such non-audit services prior to their provision to the Fund(s) Service Providers.
Audit Committee Pre-Approval Policies and Procedures
The trust’s Audit Committee must pre-approve all audit and non-audit services provided by a fund’s independent registered public accounting firm relating to the operations or financial reporting of the fund. Prior to the commencement of any audit or non-audit services to a fund, the Audit Committee reviews the services to determine whether they are appropriate and permissible under applicable law.
The Audit Committee has adopted policies and procedures to, among other purposes, provide a framework for the Committee’s consideration of non-audit services by the audit firms that audit the Fidelity funds. The policies and procedures require that any non-audit service provided by a fund audit firm to a Fidelity fund and any non-audit service provided by a fund auditor to a Fund Service Provider that relates directly to the operations and financial reporting of a Fidelity fund (“Covered Service”) are subject to approval by the Audit Committee before such service is provided.
All Covered Services must be approved in advance of provision of the service either: (i) by formal resolution of the Audit Committee, or (ii) by oral or written approval of the service by the Chair of the Audit Committee (or if the Chair is unavailable, such other member of the Audit Committee as may be designated by the Chair to act in the Chair’s absence). The approval contemplated by (ii) above is permitted where the Treasurer determines that action on such an engagement is necessary before the next meeting of the Audit Committee.
Non-audit services provided by a fund audit firm to a Fund Service Provider that do not relate directly to the operations and financial reporting of a Fidelity fund are reported to the Audit Committee periodically.
Non-Audit Services Approved Pursuant to Rule 2-01(c)(7)(i)(C) and (ii) of Regulation S-X (“De Minimis Exception”)
There were no non-audit services approved or required to be approved by the Audit Committee pursuant to the De Minimis Exception during the Fund’s(s’) last two fiscal years relating to services provided to (i) the Fund(s) or (ii) any Fund Service Provider that relate directly to the operations and financial reporting of the Fund(s).
Item 5.
Audit Committee of Listed Registrants
Not applicable.
Item 6.
Investments
(a)
Not applicable.
(b)
Not applicable.
Item 7.
Disclosure of Proxy Voting Policies and Procedures for Closed-End Management Investment Companies
Not applicable.
Item 8.
Portfolio Managers of Closed-End Management Investment Companies
Not applicable.
Item 9.
Purchase of Equity Securities by Closed-End Management Investment Company and Affiliated Purchasers
Not applicable.
Item 10.
Submission of Matters to a Vote of Security Holders
There were no material changes to the procedures by which shareholders may recommend nominees to the trust’s Board of Trustees.
Item 11.
Controls and Procedures
(a)(i) The President and Treasurer and the Chief Financial Officer have concluded that the trust’s disclosure controls and procedures (as defined in Rule 30a-3(c) under the Investment Company Act) provide reasonable assurances that material information relating to the trust is made known to them by the appropriate persons, based on their evaluation of these controls and procedures as of a date within 90 days of the filing date of this report.
(a)(ii) There was no change in the trust’s internal control over financial reporting (as defined in Rule 30a-3(d) under the Investment Company Act) that occurred during the period covered by this report that has materially affected, or is reasonably likely to materially affect, the trust’s internal control over financial reporting.
Item 12.
Disclosure of Securities Lending Activities for Closed-End Management
Investment Companies
Not applicable.
Item 13.
Exhibits
SIGNATURES
Pursuant to the requirements of the Securities Exchange Act of 1934 and the Investment Company Act of 1940, the registrant has duly caused this report to be signed on its behalf by the undersigned, thereunto duly authorized.
Fidelity Advisor Series IV
| |
By: | /s/Laura M. Del Prato |
| Laura M. Del Prato |
| President and Treasurer |
|
|
Date: | January 19, 2023 |
Pursuant to the requirements of the Securities Exchange Act of 1934 and the Investment Company Act of 1940, this report has been signed below by the following persons on behalf of the registrant and in the capacities and on the dates indicated.
| |
By: | /s/Laura M. Del Prato |
| Laura M. Del Prato |
| President and Treasurer |
|
|
Date: | January 19, 2023 |
| |
By: | /s/John J. Burke III |
| John J. Burke III |
| Chief Financial Officer |
|
|
Date: | January 19, 2023 |