UNITED STATES
SECURITIES AND EXCHANGE COMMISSION
Washington, D.C. 20549
FORM N-CSR
Certified Shareholder Report of
Registered Management Investment Companies
Investment Company Act File Number: 811-03734
EuroPacific Growth Fund
(Exact Name of Registrant as Specified in Charter)
333 South Hope Street
Los Angeles, California 90071
(Address of Principal Executive Offices)
Registrant's telephone number, including area code: (213) 486-9200
Date of fiscal year end: March 31
Date of reporting period: March 31, 2010
Vincent P. Corti
Capital Research and Management Company
333 South Hope Street
Los Angeles, California 90071
(Name and Address of Agent for Service)
Copies to:
Mark D. Perlow
K&L Gates LLP
Four Embarcadero Center, Suite 1200
San Francisco, California 94111
(Counsel for the Registrant)
ITEM 1 – Reports to Stockholders
 |  |
EuroPacific Growth Fund
Lost in translation:
What does currency mean for investors?
[photo of currency in a person's hands]
Annual report for the year ended March 31, 2010
EuroPacific Growth Fund® seeks long-term capital appreciation by investing primarily in the securities of companies based in Europe and the Pacific Basin. More than half of the world’s investment opportunities can be found beyond the borders of our country. As a shareholder in the fund, you have access to what we believe are the best of those opportunities.
This fund is one of the 30 American Funds. American Funds is one of the nation’s largest mutual fund families. For nearly 80 years, Capital Research and Management Company,SM the American Funds adviser, has invested with a long-term focus based on thorough research and attention to risk.
Fund results shown in this report, unless otherwise indicated, are for Class A shares at net asset value. If a sales charge (maximum 5.75%) had been deducted, the results would have been lower. Results are for past periods and are not predictive of results for future periods. Current and future results may be lower or higher than those shown. Share prices and returns will vary, so investors may lose money. Investing for short periods makes losses more likely. Investments are not FDIC-insured, nor are they deposits of or guaranteed by a bank or any other entity, so they may lose value. For current information and month-end results, visit americanfunds.com.
Investment results assume all distributions are reinvested and reflect applicable fees and expenses. The fund’s investment adviser waived a portion of its management fees from September 1, 2004, through December 31, 2008. Fund results shown reflect the waiver, without which they would have been lower. See the Financial Highlights table on pages 27 and 28 for details.
See page 4 for Class A share results with relevant sales charges deducted. Results for other share classes can be found on page 33.
Equity investments are subject to market fluctuations. Investing outside the United States may be subject to risks, such as currency fluctuations, periods of illiquidity and price volatility. These risks may be heightened in connection with investments in developing countries. See the prospectus and the Risk Factors section of this report for more information on these and other risks associated with investing in the fund.
| In this report | |
| Special feature | |
| 6 | Lost in translation: What does currency mean for investors? |
| Currency movements can create both headwinds and tailwinds for U.S. investors, depending on | |
| the company and currency. The fund’s investment professionals discuss their views on foreign exchange and its impact on international investing. | |
| Contents | |
| 1 | Letter to shareholders |
| 4 | The value of a long-term perspective |
| 12 | Summary investment portfolio |
| 17 | Financial statements |
| 34 | Board of trustees and other officers |
Fellow shareholders:
[photo of currency in a person's hands]
EuroPacific Growth Fund’s fiscal year proved to be vastly different than the previous one. The fund reported a total return of 52.2%, with dividends reinvested, for the year ended March 31, 2010. That compares to the previous year’s decline of 40.5%. Although we do not often compare year-over-year changes, we think these results are noteworthy and underscore the dramatic volatility and resiliency of the world markets. The extent and speed of the rebound made it a remarkable period.
The fund’s year began on April 1, 2009, just a few weeks after markets around the world hit their crisis lows. The severe selloff had been global, beginning in the United States with mortgage loan troubles, followed by a sharp credit contraction and economic recessions around the world. By April, however, the tenor of the markets was uncertain but hopeful, as governments aggressively pulled the levers of fiscal and monetary policy to stabilize markets and reduce investor fears. The markets then started a recovery that in hindsight was truly striking. The developing markets, including China and India, surprised many with their rapid growth at a time when most of the developed nations were struggling.
During the year, governments responded swiftly and aggressively by injecting unprecedented cash into their economies to shore up growth and add to stability. The Chinese government launched the largest stimulus plan in its history, pledging US$586 billion to invest in housing, infrastructure, transportation, health care and education; China’s markets rose by 62.6%* in 2009. In addition, three other large developing-country stock markets — Russia, India and Brazil — rose more than 100% during the year. This underscores the increasing importance of these markets on the world stage. In the early stages of economic development, these countries have been generating tremendous demand for basic commodities, which in turn was a power ful boost for resource-rich countries in the developed world such as Australia, Canada and Norway.
*Unless otherwise indicated, country and region returns are based on MSCI indexes and measured in U.S. dollars with gross dividends reinvested.
Our long-term view
After the tumultuous 12 months that ended last March, we entered the new year conservatively in positioning the fund for an expected recovery. Partly because of that conservatism, EuroPacific’s strong 52.2% gain still lagged the 61.7% return of the unmanaged MSCI ACWI (All Country World Index) ex USA, which measures more than 40 country indexes in developed and developing countries. The fund’s return during the fiscal period also was behind the 54.6% return of the Lipper International Funds Average.
[Begin Sidebar]
| Results at a glance | ||||||||||||||||
| For periods ended March 31, 2010, with all distributions reinvested | ||||||||||||||||
| Total returns | Average annual total returns | |||||||||||||||
| 1 year | 5 years | 10 years | Lifetime1 | |||||||||||||
| EuroPacific Growth Fund (Class A shares) | 52.23 | % | 7.91 | % | 3.33 | % | 12.19 | % | ||||||||
MSCI ACWI (All Country World Index) ex USA2,3 | 61.67 | 6.59 | 3.20 | — | ||||||||||||
Lipper International Funds Average4 | 54.63 | 4.16 | 1.87 | 9.68 | ||||||||||||
MSCI EAFE (Europe, Australasia, Far East) Index2 | 55.20 | 4.24 | 1.68 | 9.57 | ||||||||||||
1 Since April 16, 1984. | ||||||||||||||||
2 The index is unmanaged and its return does not reflect the effect of sales charges, commissions or expenses. | ||||||||||||||||
3 The index did not exist prior to December 31, 1987. | ||||||||||||||||
4 Source: Lipper. Lipper averages do not reflect the effect of sales charges. | ||||||||||||||||
[End Sidebar]
[Begin Sidebar]
| Where the fund’s assets are invested | ||||||||||||
| (percent invested by country) | ||||||||||||
EuroPacific Growth Fund invests primarily in the stocks of companies based in Europe and the Pacific Basin.1 | ||||||||||||
| MSCI | ||||||||||||
| All Country | ||||||||||||
| EuroPacific | World Index | |||||||||||
| Growth Fund | ex USA2 | |||||||||||
| (3/31/10) | (3/31/09) | (3/31/10) | ||||||||||
| Europe | ||||||||||||
Euro zone3 | 30.0 | % | 30.0 | % | 22.2 | % | ||||||
| United Kingdom | 10.1 | 8.3 | 14.6 | |||||||||
| Switzerland | 8.0 | 8.3 | 5.5 | |||||||||
| Denmark | 2.0 | 2.4 | .7 | |||||||||
| Russia | 1.9 | 2.1 | 1.5 | |||||||||
| Sweden | 1.6 | 1.2 | 1.9 | |||||||||
| Norway | .8 | .7 | .5 | |||||||||
| Other Europe | .7 | .5 | .9 | |||||||||
| 55.1 | 53.5 | 47.8 | ||||||||||
| Pacific Basin | ||||||||||||
| Japan | 10.1 | 7.8 | 15.5 | |||||||||
| Mexico | 3.5 | 3.2 | 1.0 | |||||||||
| China | 3.5 | 3.0 | 4.0 | |||||||||
| Canada | 3.2 | 2.4 | 7.6 | |||||||||
| South Korea | 2.6 | 1.9 | 2.9 | |||||||||
| Australia | 2.4 | 1.9 | 6.0 | |||||||||
| Taiwan | 2.0 | 2.4 | 2.4 | |||||||||
| Hong Kong | 1.2 | 1.9 | 1.7 | |||||||||
| Indonesia | .6 | .3 | .5 | |||||||||
| Other Pacific Basin | 1.0 | 1.1 | 2.1 | |||||||||
| 30.1 | 25.9 | 43.7 | ||||||||||
| Other | ||||||||||||
| Brazil | 3.1 | 2.7 | 3.7 | |||||||||
| India | 3.0 | 2.8 | 1.7 | |||||||||
| South Africa | 1.6 | 1.2 | 1.6 | |||||||||
| Israel | 1.1 | 1.7 | .7 | |||||||||
| Other countries | .1 | .1 | .8 | |||||||||
| 8.9 | 8.5 | 8.5 | ||||||||||
| Short-term securities & | ||||||||||||
| other assets less liabilities | 5.9 | 12.1 | — | |||||||||
| Total | 100.0 | % | 100.0 | % | 100.0 | % | ||||||
1 A country is considered part of the Pacific Basin if any of its borders touches the Pacific Ocean. | ||||||||||||
2 Weighted by market capitalization. | ||||||||||||
3 Countries using the euro as a common currency: Austria, Belgium, Cyprus, Finland, France, Germany, Greece, Ireland, Italy, Luxembourg, Malta, the Netherlands, Portugal, Slovakia, Slovenia and Spain. | ||||||||||||
[End Sidebar]
However, over longer time periods, EuroPacific Growth Fund has had an advantage over its benchmark and its peers; as shown in the table on page 1, its results have been superior to those indexes on a five-year, 10-year and lifetime basis since it began operations on April 16, 1984. We focus on long-term investing and while we strive to surpass our benchmarks, we also seek to mitigate risks.
How the fund responded
Many of the fund’s holdings faced challenges during 2008–09, but we had conviction in the strength of their underlying businesses. The fund’s second-largest holding is an example: Anheuser-Busch InBev, a global beverage company headquartered in Belgium, had taken on a large amount of debt before the crisis and looked ready to stumble; however, it cleaned up its balance sheet and the stock rose 83.0% in the period. Other examples include metals and mining company Xstrata (+184.6%), global banks Banco Santander (+93.9%) and Barclays (+156.9%), semiconductor maker Samsung (+74.1%), and automakers Honda (+47.7%) and Daimler (+85.8%).
Despite volatility in western European markets — sparked by the general economic downturn and fears over Greek debt — the fund’s European holdings did well. The fund has maintained meaningful investments in Europe, particularly in Germany, Switzerland and France. About 55% of the fund’s net assets were invested there at the end of the fiscal year, roughly the same as a year earlier. In fact, eight out of the top 10 holdings were global companies based in Europe, and most of these stocks fared quite well, including the pharmaceutical makers Bayer (+41.7%), Novartis (+43.8%), Novo Nordisk (+62.3%) and, to a lesser extent, Roche (+18.7%). German business software maker SAP, the seventh-largest holding, gained 36.8%.
On an absolute basis, only 11 of the fund’s holdings — out of more than 260 stocks — fell during the year. These included U.K. building materials firm Wolseley (–26.8%), U.K.-based Lloyds Banking Group (–4.1%) and Hong Kong’s Cheung Kong Infrastructure (–3.3%). Many of the fund’s holdings showed large gains but on a relative basis were not as strong as others. Some energy and utility holdings detracted from results.
The fund’s overall holdings in Japan rose to 10.1% of the fund’s net assets, up from 7.8% a year ago; likewise, U.K. holdings made up a bigger percentage of the fund at 10.1%, up from 8.3% a year prior. Several developing markets that led the rebound in global equity markets continued to make up a large part of the fund, accounting for more than 15% of its assets.
After a steady weakening over the past several years, the U.S. dollar saw periods of strength this fiscal year as investors sought the relative safety of the world reserve currency. This impacted the results of a number of holdings. However, fundamental research and a long-term perspective drives our investment strategy, and we seek to avoid making short-term decisions based on volatile currency fluctuations. For more on how our investment professionals look at currency issues, please see the feature “Lost in translation: What does currency mean for investors?” beginning on page 6.
Looking ahead
While we are pleased that markets have rebounded, the global economy remains fragile, particularly for a number of countries in the developed world. This includes much of Europe, where the common currency, the euro, came under considerable strain during the crisis. And while developing countries’ economies are likely to prove robust on the whole, we caution that some divergence in growth rates is likely to occur as authorities unwind monetary stimulus. So far this year, central banks in India, Malaysia and Vietnam, as well as Australia, have increased their interest rates to resist inflationary pressures caused by high growth. We continue to monitor the countervailing pressures of threats to the euro and inflation in Asia, as well as other issues around the world.
We believe that stock valuations remain attractive, even in cases where share prices have rebounded strongly, because we think the earnings outlook has improved as much or more than the share prices. In addition, many companies have taken steps to strengthen their balance sheets and lower their level of financial risk so they are on more solid footing. It is worth noting that despite the strong gains last year, there are many international markets that are well below their peak levels. The brisk growth in China and India and the rest of the developing world has also opened up new markets and business opportunities. Risks do exist in the global economy, some of which could be significant down the road, and we continue to position the fund to he lp protect against these risks. Nonetheless, we remain confident in our ability to find companies that we think will do well over time, and we see encouraging signs of growth and recovery.
We thank all of EuroPacific’s shareholders for your confidence in us, and we look forward to serving you for many years to come.
Sincerely,
/s/ Gina H. Despres
Gina H. Despres
Vice Chairman of the Board
/s/ Carl Kawaja
Carl Kawaja
President
May 7, 2010
For current information about the fund, visit americanfunds.com.
The value of a long-term perspective
Fund results shown are for Class A shares and reflect deduction of the maximum sales charge of 5.75% on the $10,000 investment.1 Thus, the net amount invested was $9,425.2 Results are for past periods and are not predictive of results for future periods. Current and future results may be lower or higher than those shown. Share prices and returns will vary, so investors may lose money. For current information and month-end results, visit americanfunds.com.
How a $10,000 investment has grown
While notable for their volatility in recent years, financial markets have tended to reward investors over the long term. Active management — bolstered by experience and careful research — can add even more value. As the chart shows, over its lifetime, EuroPacific Growth Fund has done demonstrably better than its relevant benchmark.
| Average annual total returns based on a $1,000 investment | ||||||||||||
| (for periods ended March 31, 2010)* | ||||||||||||
| 1 year | 5 years | 10 years | ||||||||||
| Class A shares | 43.49 | % | 6.64 | % | 2.72 | % | ||||||
| * Assumes reinvestment of all distributions and payment of the maximum 5.75% sales charge. | ||||||||||||
The total annual fund operating expense ratio was 0.85% for Class A shares as of March 31, 2010. This figure does not reflect the fee waiver described below.
Investment results assume all distributions are reinvested and reflect applicable fees and expenses. The fund’s investment adviser waived a portion of its management fees from September 1, 2004, through December 31, 2008. Fund results shown reflect the waiver, without which they would have been lower. See the Financial Highlights table on pages 27 and 28 for details.
[begin mountain chart]
Year ended March 31 | EuroPacific Growth Fund, with dividends reinvested4 | MSCI ACWI ex USA Index, with dividends reinvested5,6 | Consumer Price Index (inflation)7 | |||||||||||||||
| Initial Investment | 04/16/84 | $ | 9,425 | $ | 10,000 | $ | 10,000 | |||||||||||
| 1985 | Low | 07/23/84 | 8,696 | Low | 07/23/84 | 8,155 | Low | 04/30/84 | $ | 10,000 | ||||||||
| Hi | 03/28/85 | 9,955 | Hi | 03/31/85 | 10,348 | Hi | 03/31/85 | 10,320 | ||||||||||
| Close | 03/31/85 | 9,941 | Close | 03/31/85 | 10,348 | Close | 03/31/85 | 10,320 | ||||||||||
| 1986 | Low | 04/08/85 | 9,775 | Low | 04/09/85 | 10,115 | Low | 04/30/85 | 10,369 | |||||||||
| Hi | 03/21/86 | 15,364 | Hi | 03/31/86 | 19,228 | Hi | 01/31/86 | 10,630 | ||||||||||
| Close | 03/31/86 | 15,357 | Close | 03/31/86 | 19,228 | Close | 03/31/86 | 10,553 | ||||||||||
| 1987 | Low | 07/22/86 | 15,634 | Low | 04/07/86 | 18,448 | Low | 04/30/86 | 10,533 | |||||||||
| Hi | 03/27/87 | 19,887 | Hi | 03/27/87 | 31,405 | Hi | 03/31/87 | 10,873 | ||||||||||
| Close | 03/31/87 | 19,813 | Close | 03/31/87 | 31,010 | Close | 03/31/87 | 10,873 | ||||||||||
| 1988 | Hi | 10/08/87 | 24,499 | Hi | 10/14/87 | 36,201 | Low | 04/30/87 | 10,931 | |||||||||
| Low | 12/11/87 | 17,992 | Low | 11/11/87 | 28,389 | Hi | 03/31/88 | 11,300 | ||||||||||
| Close | 03/31/88 | 21,422 | Close | 03/31/88 | 36,179 | Close | 03/31/88 | 11,300 | ||||||||||
| 1989 | Low | 09/01/88 | 21,189 | Low | 08/31/88 | 33,481 | Low | 04/30/88 | 11,358 | |||||||||
| Hi | 02/09/89 | 24,835 | Hi | 02/28/89 | 41,150 | Hi | 03/31/89 | 11,862 | ||||||||||
| Close | 03/31/89 | 24,569 | Close | 03/31/89 | 40,446 | Close | 03/31/89 | 11,862 | ||||||||||
| 1990 | Low | 06/13/89 | 24,282 | Hi | 12/31/89 | 45,003 | Low | 04/30/89 | 11,940 | |||||||||
| Hi | 12/06/89 | 28,391 | Low | 03/31/90 | 36,338 | Hi | 03/31/90 | 12,483 | ||||||||||
| Close | 03/31/90 | 28,742 | Close | 03/31/90 | 36,338 | Close | 03/31/90 | 12,483 | ||||||||||
| 1991 | Hi | 07/18/90 | 33,103 | Hi | 07/31/90 | 40,323 | Low | 04/30/90 | 12,502 | |||||||||
| Low | 01/16/91 | 27,795 | Low | 09/30/90 | 31,618 | Hi | 03/31/91 | 13,094 | ||||||||||
| Close | 03/31/91 | 31,359 | Close | 03/31/91 | 37,523 | Close | 03/31/91 | 13,094 | ||||||||||
| 1992 | Low | 08/19/91 | 30,061 | Hi | 12/31/91 | 39,623 | Low | 04/30/91 | 13,113 | |||||||||
| Hi | 02/28/92 | 36,033 | Low | 03/31/92 | 35,581 | Hi | 03/31/92 | 13,511 | ||||||||||
| Close | 03/31/92 | 35,033 | Close | 03/31/92 | 35,581 | Close | 03/31/92 | 13,511 | ||||||||||
| 1993 | Hi | 06/02/92 | 37,465 | Low | 10/31/92 | 34,792 | Low | 04/30/92 | 13,531 | |||||||||
| Low | 11/17/92 | 33,764 | Hi | 03/31/93 | 39,345 | Hi | 03/31/93 | 13,928 | ||||||||||
| Close | 03/31/93 | 37,728 | Close | 03/31/93 | 39,345 | Close | 03/31/93 | 13,928 | ||||||||||
| 1994 | Low | 04/02/93 | 37,813 | Low | 04/30/93 | 42,820 | Low | 04/30/93 | 13,967 | |||||||||
| Hi | 02/02/94 | 50,611 | Hi | 01/31/94 | 51,503 | Hi | 03/31/94 | 14,277 | ||||||||||
| Close | 03/31/94 | 47,638 | Close | 03/31/94 | 48,772 | Close | 03/31/94 | 14,277 | ||||||||||
| 1995 | Hi | 09/02/94 | 51,011 | Hi | 10/31/94 | 53,443 | Low | 04/30/94 | 14,297 | |||||||||
| Low | 01/31/95 | 46,642 | Low | 02/16/95 | 48,179 | Hi | 03/31/95 | 14,685 | ||||||||||
| Close | 03/31/95 | 47,974 | Close | 03/31/95 | 50,901 | Close | 03/31/95 | 14,685 | ||||||||||
| 1996 | Low | 04/03/95 | 47,928 | Low | 06/30/95 | 51,925 | Low | 04/30/95 | 14,733 | |||||||||
| Hi | 03/25/96 | 57,612 | Hi | 03/31/96 | 57,610 | Hi | 03/31/96 | 15,102 | ||||||||||
| Close | 03/31/96 | 57,494 | Close | 03/31/96 | 57,610 | Close | 03/31/96 | 15,102 | ||||||||||
| 1997 | Low | 07/24/96 | 57,229 | Low | 07/31/96 | 56,809 | Low | 04/30/96 | 15,160 | |||||||||
| Hi | 03/11/97 | 67,625 | Hi | 11/30/96 | 60,212 | Hi | 03/31/97 | 15,519 | ||||||||||
| Close | 03/31/97 | 66,627 | Close | 03/31/97 | 59,368 | Close | 03/31/97 | 15,519 | ||||||||||
| 1998 | Hi | 10/03/97 | 77,523 | Low | 04/30/97 | 59,868 | Low | 05/31/97 | 15,529 | |||||||||
| Low | 01/12/98 | 67,131 | Hi | 03/31/98 | 69,026 | Hi | 03/31/98 | 15,732 | ||||||||||
| Close | 03/31/98 | 80,601 | Close | 03/31/98 | 69,026 | Close | 03/31/98 | 15,732 | ||||||||||
| 1999 | Hi | 04/15/98 | 83,900 | Low | 09/30/98 | 57,722 | Low | 04/30/98 | 15,761 | |||||||||
| Low | 10/05/98 | 65,404 | Hi | 03/31/99 | 71,159 | Hi | 03/31/99 | 16,004 | ||||||||||
| Close | 03/31/99 | 87,198 | Close | 03/31/99 | 71,159 | Close | 03/31/99 | 16,004 | ||||||||||
| 2000 | Low | 04/01/99 | 87,833 | Low | 05/31/99 | 71,208 | Low | 06/30/99 | 16,120 | |||||||||
| Hi | 03/29/00 | 137,516 | Hi | 03/31/00 | 91,706 | Hi | 03/31/00 | 16,605 | ||||||||||
| Close | 03/31/00 | 134,560 | Close | 03/31/00 | 91,706 | Close | 03/31/00 | 16,605 | ||||||||||
| 2001 | Hi | 04/10/00 | 134,710 | Hi | 06/30/00 | 87,965 | Low | 04/30/00 | 16,615 | |||||||||
| Low | 03/22/01 | 94,189 | Low | 03/22/01 | 64,313 | Hi | 03/31/01 | 17,090 | ||||||||||
| Close | 03/31/01 | 96,853 | Close | 03/31/01 | 67,112 | Close | 03/31/01 | 17,090 | ||||||||||
| 2002 | Hi | 05/21/01 | 104,778 | Hi | 05/02/01 | 72,556 | Low | 12/31/01 | 17,139 | |||||||||
| Low | 09/21/01 | 79,958 | Low | 09/21/01 | 52,947 | Hi | 03/31/02 | 17,342 | ||||||||||
| Close | 03/31/02 | 94,302 | Close | 03/31/02 | 63,225.6 | Close | 03/31/02 | 17,342 | ||||||||||
| 2003 | Hi | 05/17/02 | 96,306 | Hi | 05/17/02 | 65,397 | Low | 04/30/02 | 17,439 | |||||||||
| Low | 03/12/03 | 69,809 | Low | 03/12/03 | 46,776 | Hi | 03/31/03 | 17,866 | ||||||||||
| Close | 03/31/03 | 72,463 | Close | 03/31/03 | 49,204 | Close | 03/31/03 | 17,866 | ||||||||||
| 2004 | Low | 04/01/03 | 73,091 | Low | 04/01/03 | 49,620 | Low | 05/31/03 | 17,798 | |||||||||
| High | 03/01/04 | 114,695 | High | 02/17/04 | 79,825 | Hi | 03/31/04 | 18,177 | ||||||||||
| Close | 03/31/04 | 113,848 | Close | 03/31/04 | 78,684 | Close | 03/31/04 | 18,177 | ||||||||||
| 2005 | Low | 05/17/04 | 103,225 | Low | 05/17/04 | 71,764 | Low | 04/30/04 | 18,235 | |||||||||
| High | 03/04/05 | 132,976 | High | 03/08/05 | 95,174 | Hi | 03/31/05 | 18,749 | ||||||||||
| Close | 03/31/05 | 127,604 | Close | 03/31/05 | 91,389 | Close | 03/31/05 | 18,749 | ||||||||||
| 2006 | Low | 04/28/05 | 123,628 | Low | 05/17/05 | 88,203 | Low | 05/31/05 | 18,855 | |||||||||
| High | 03/30/06 | 166,244 | High | 03/30/06 | 117,805 | Hi | 03/31/06 | 19,379 | ||||||||||
| Close | 03/31/06 | 166,207 | Close | 03/31/06 | 117,092 | Close | 03/31/06 | 19,379 | ||||||||||
| 2007 | Low | 06/13/06 | 150,639 | Low | 06/13/06 | 107,730 | Low | 04/30/06 | 19,544 | |||||||||
| High | 12/20/06 | 186,512 | High | 02/26/07 | 142,457 | Hi | 03/31/07 | 19,918 | ||||||||||
| Close | 03/31/07 | 193,850 | Close | 03/31/07 | 140,848 | Close | 03/31/07 | 19,918 | ||||||||||
| 2008 | High | 10/31/07 | 234,626 | High | 10/31/2007 | 168,788 | Low | 04/30/07 | 20,047 | |||||||||
| Low | 03/19/08 | 197,139 | Low | 1/23/2008 | 135,249 | Hi | 03/31/08 | 20,711 | ||||||||||
| Close | 03/31/08 | 206,256 | Close | 3/31/2008 | 144,476 | Close | 03/31/08 | 20,711 | ||||||||||
| 2009 | High | 05/19/08 | 222,332 | High | 05/19/08 | 160,099 | Hi | 07/31/08 | 21,335 | |||||||||
| Low | 03/09/09 | 107,894 | Low | 03/09/09 | 66,530 | Low | 12/31/08 | 20,391 | ||||||||||
| Close | 03/31/09 | 122,641 | Close | 03/31/09 | 77,762 | Close | 03/31/09 | 20,631 | ||||||||||
| 2010 | Low | 04/01/09 | 124,925 | Low | 04/01/09 | 78,971 | Low | 04/30/09 | 20,683 | |||||||||
| High | 11/16/09 | 188,719 | High | 01/11/10 | 128,321 | Hi | 03/31/10 | 21,109 | ||||||||||
| Close | 03/31/10 | 186,699 | Close | 03/31/10 | 125,715 | Close | 03/31/10 | 21,109 | ||||||||||
[end mountain chart]
| Year ended March 31 | 1985 | 3 | 1986 | 1987 | 1988 | 1989 | 1990 | 1991 | 1992 | |||||||||||||||||||||||
| TOTAL VALUE | ||||||||||||||||||||||||||||||||
| Dividends reinvested | $ | 69 | 35 | 118 | 491 | 316 | 527 | 656 | 611 | |||||||||||||||||||||||
| Value at year-end | $ | 9,941 | 15,357 | 19,813 | 21,422 | 24,569 | 28,742 | 31,359 | 35,033 | |||||||||||||||||||||||
| Total return | (0.6 | )% | 54.5 | 29.0 | 8.1 | 14.7 | 17.0 | 9.1 | 11.7 | |||||||||||||||||||||||
| Year ended March 31 | 1993 | 1994 | 1995 | 1996 | 1997 | 1998 | 1999 | 2000 | ||||||||||||||||||||||||
| TOTAL VALUE | ||||||||||||||||||||||||||||||||
| Dividends reinvested | 538 | 515 | 715 | 1,131 | 1,062 | 1,155 | 991 | 841 | ||||||||||||||||||||||||
| Value at year-end | 37,728 | 47,638 | 47,974 | 57,494 | 66,627 | 80,601 | 87,198 | 134,560 | ||||||||||||||||||||||||
| Total return | 7.7 | 26.3 | 0.7 | 19.8 | 15.9 | 21.0 | 8.2 | 54.3 | ||||||||||||||||||||||||
| Year ended March 31 | 2001 | 2002 | 2003 | 2004 | 2005 | 2006 | 2007 | 2008 | ||||||||||||||||||||||||
| TOTAL VALUE | ||||||||||||||||||||||||||||||||
| Dividends reinvested | 637 | 2,209 | 836 | 1,083 | 1,796 | 2,575 | 2,899 | 4,070 | ||||||||||||||||||||||||
| Value at year-end | 96,853 | 94,302 | 72,463 | 113,848 | 127,604 | 166,207 | 193,850 | 206,256 | ||||||||||||||||||||||||
| Total return | (28.0 | ) | (2.6 | ) | (23.2 | ) | 57.1 | 12.1 | 30.3 | 16.6 | 6.4 | |||||||||||||||||||||
| Year ended March 31 | 2009 | 2010 | Average | |||||||||||||||||||||||||||||
| TOTAL VALUE | annual total | |||||||||||||||||||||||||||||||
| Dividends reinvested | 3,422 | 2,959 | return for | |||||||||||||||||||||||||||||
| Value at year-end | 122,641 | 186,699 | fund’s lifetime: | |||||||||||||||||||||||||||||
| Total return | (40.5 | ) | 52.2 | 11.9 | %4 | |||||||||||||||||||||||||||
The results shown are before taxes on fund distributions and sale of fund shares.
1As outlined in the prospectus, the sales charge is reduced for accounts (and aggregated investments) of $25,000 or more and is eliminated for purchases of $1 million or more. There is no sales charge on dividends or capital gain distributions that are reinvested in additional shares. |
2The maximum initial sales charge was 8.5% prior to July 1, 1988. |
3For the period April 16, 1984 (commencement of operations), through March 31, 1985. |
4Includes reinvested dividends of $32,256 and reinvested capital gain distributions of $70,634. |
5The market indexes are unmanaged and their results include reinvested dividends and/or distributions, but do not reflect the effect of sales charges, commissions, expenses or taxes. |
6From April 16, 1984, through December 31, 1987, the MSCI EAFE Index was used because the MSCI ACWI ex USA Index did not yet exist. Since January 1, 1988, the MSCI ACWI ex USA Index has been used. |
7Computed from data supplied by the U.S. Department of Labor, Bureau of Labor Statistics. |
Lost in translation:
What does currency mean for investors?
[photo of a fruit and vegetable stand - signs posted with prices]
[photo of people buying and selling at a farmer's market]
[photo of shelves of candy]
[Begin Sidebar]
EuroPacific Growth Fund’s investment professionals keep a close watch on the complex factors involved in currency fluctuations. Here, they discuss some of their views on foreign exchange and its impact on international investing.
[End Sidebar]
On any given day, headlines call out the effects of the currency market’s volatility: “Dollar Retreats as Risk Appetite Returns,” “Euro Gains but Rally Fizzles,” “Dollar Revival Gains Pace,” and “Currency Markets Foxed by Greece” are a few recent Wall Street Journal headlines. These highlight the erratic and short-term nature of foreign exchange fluctuations, as well as the unpredictability.
So what does currency exchange mean for investments in EuroPacific Growth Fund? Currency movements can create both headwinds and tailwinds for U.S. investors, depending on the company and currency. Foreign exchange has always been a factor in international investing; however, in this interconnected world, currency issues now matter slightly less than they did in the past. The reason is that many multinational companies have operations and sales in many parts of the world, decreasing the potential for severe repercussions from foreign exchange volatility.
Looking for major trends
The fund’s investment professionals carefully monitor the macroeconomic and political issues that influence currency prices, but there’s no formula that can predict foreign exchange fluctuations. “Currencies are difficult to predict, but one of the things that we try to anticipate is major trend changes in currency movements,” says Philip Chitty, a London-based macroeconomist for the fund. “Currency plays an important role in determining economic growth and corporate profitability, so we always want to understand the currency aspects of investing.”
[Begin Pull Quote]
“Currency plays an important role in determining economic growth and corporate profitability, so we always want to understand the currency aspects of investing.”
Philip Chitty
Macroeconomist
[End Pull Quote]
Investment professionals for EuroPacific Growth Fund think deeply about these issues and realize the complexity of the factors involved in currency prices. These include trade deficits, interest rate differentials, fiscal policy, money supply and purchasing power parity, among other issues.
“In some instances, currency has provided a substantial tailwind to our investments in certain countries and, on the other side, a headwind in others,” says portfolio counselor Mark Denning, based in London, pointing to the resource-rich countries of Brazil, Canada and Australia and their relative strength against the U.S. dollar in the last few years. “And in some cases, currency has held back the returns of some companies, as we saw in South Korea and certainly the euro zone in 2008,” he adds.
Currency can also have an effect on the timing of a stock purchase when an investment analyst likes the fundamentals of a company. “We try to understand the currency as it relates to the historic cycle over time,” says Matt Wolf, an investment analyst based in Hong Kong. “I might wait to buy a stock that I found compelling if it didn’t look like a good time for foreign exchange or I could be aggressive if it appeared to be a favorable time. But foreign exchange wouldn’t change the nature of my fundamental investment thesis.”
Multinational smoothing effect
In the end, foreign exchange is just one of the many considerations that EuroPacific Growth Fund’s investment professionals think about when making investments.
“Even though sometimes I feel strongly about the direction of some of the various currencies, I have to temper that with the understanding that over the broad sweep of time, few people are consistently accurate about currency movements,” says Carl Kawaja, president of the fund and a portfolio counselor based in San Francisco. “We look at the fundamentals of the company first, and overlay that thesis with our expectations for currency, not the other way around.”
[Begin Sidebar]
The U.S. dollar as the world reserve currency
A short history
How did the U.S. dollar become the world’s reserve currency? The British pound sterling played this role in the 18th and 19th centuries. At the end of World War II, government leaders met at New Hampshire’s Bretton Woods and established the basic rules and regulations that govern international exchange today, including the International Monetary Fund. The Bretton Woods Accord fixed currencies to the U.S. dollar instead of gold; the dollar in turn was pegged to gold at $35 per ounce. The gold peg was maintained until 1971, when the U.S. dollar could no longer hold the value of the pegged rate. From then on, there has been a floating exchange rate system. Several attempts to move back to a global gold peg were unsuccessful.
Dollar under pressure
Recently, many have questioned whether the U.S. dollar can continue as the world reserve currency. China, in particular, has complained about the dollar’s limitations. However, it’s necessary to remember the aspects of a reserve currency: a store of value and a medium of exchange, in a country where the rule of law is strong and there is no risk of confiscation. And because the dollar is the denominator for almost all commodities, there is a bias for countries to hold significant reserves in dollars. “There is not yet any single currency, country or region that could reasonably replace the prominent role of the U.S. dollar as the world’s reserve currency,” says Tomonori Tani, an investment analyst for the fund bas ed in Tokyo. He says that if the U.S. current account deficit were to remain high for a prolonged time, the dollar’s status could be hurt. “At some point, we might need a comprehensive new world currency regime: A multi-polar currency block would be the most likely outcome.” Mark Brett, a London-based global currency analyst for the fund, points out that while the U.S. has fiscal problems, so do many other countries. “Central banks today are free to diversify away from the dollar, and while that is to be expected, history shows that these movements happen at a glacial pace,” he says. “Despite all the hype about the end of the dollar standard, the facts do not support the story.”
[End Sidebar]
Anheuser-Busch InBev, based in Belgium, is an example of how currency matters less for profitability in an increasingly interconnected global economy. It makes its beverage products in Europe, the U.S. and Brazil, and it sells its products in those countries and around the world, earning revenues in many currencies and often paying for its costs in those same various currencies. This tends to create an internal economy in which the home currency doesn’t need to be repatriated immediately and takes away some of the uncertainty of whether the company will be forced to lose or gain on the translation. So the price of beer in Belgium doesn’t necessarily impact the price of beer in Brazil.
“Fundamentally, if we invest in good companies with good management teams that handle their businesses well, over time the currency issues become far less important,” says investment analyst Julian Abdey, based in San Francisco. “In some years the currencies go against them and in some years they go in their favor, but we think company fundamentals over a long period of time will shine through the currency fluctuations.”
Matt echoes this sentiment, saying that the potential for strong gains or losses based on currency are often smoothed through international operations. He studies these issues carefully but says that they become less significant over the long term. “Most of the time, it doesn’t matter very much because of my three- to five-year investment horizon,” he says. For example, Softbank, a Japanese telecommunications company, has considerable investments in China. To the extent that the Chinese currency becomes stronger and the yen weakens, the value of those Chinese investments would increase. The more important questions, though, involve a company’s competitive position, product offerings and prospects for earnings growth. &# 8220;All of those questions don’t factor much into currencies.”
When London-based investment analyst Bruno Rodrigues looks at metals and mining companies, he analyzes them from a U.S. dollar perspective — regardless of the companies’ domestic currencies. That makes sense, because the dollar is used internationally for commodity prices and it is the financial reporting standard for most of the companies in the industry. However, understanding currency movements is important for a third and less obvious reason: “For companies operating in large commodity-producing countries, the local currency tends to provide some offset to commodity price movements. That’s because high commodity prices often translate into both higher exports and foreign investment inflows, which pressures the local currency to appreciate and vice-versa,” he says. “So when commodity prices rise, operating costs measured in U.S. dollars tend to also rise due to local currency appreciation.” That is the case, for example, when researching global natural resources producer BHP Billiton, which has more than 70% of its assets in countries that have currencies historically correlated to commodity prices: Australia, Chile and South Africa.
[photo of a currency exchange counter]
[photo of paper and coin currency in a dish]
[Begin Pull Quote]
“Fundamentally, if we invest in good companies with good management teams that handle their businesses well, over time the currency issues become far less important.”
Julian Abdey
Investment analyst
[End Pull Quote]
Strong currency, weak currency
Whether a currency is weak or strong does not necessarily guide the prospects of a particular company in that country. There are companies that get a boost when their home currency is strong and others that do better when it’s weak. A stronger currency can make exports more expensive for international customers and make imports cheaper within that country. Domestic industries that produce goods for export or have to compete with imports from other countries will face more difficult times when the domestic currency is strong, and better times when it is relatively weaker.
A weaker U.S. dollar environment in theory could have a positive effect on companies that have revenues in another currency and costs in U.S. dollars. Under those conditions, non-U.S. companies with local costs and U.S. sales, as well as companies with costs outside the U.S. that sell commodities priced in dollars, could be stung by a weakened dollar.
It is also important to remember that currencies can be volatile from year to year as well as within the same year. “Exchange rates are relative prices, not absolute. In fact, nine of the top 10 currencies of 2009 were featured in the bottom 17 currencies of 2008,” says Mark Brett, a global currency analyst for the fund who works out of London. “Last year, the big three currencies — U.S. dollar, euro and yen — all had their own particular and compelling negatives. Depending on which was least ugly at the time, they swung around through the year, but they ended close to unchanged.”
A strong currency could arise when a country is growing more slowly than its trading partners, with imports falling more than exports due to weak domestic income growth. With reduced imports, there could be lower demand for foreign currency and the domestic currency may appreciate. In this case, a strong currency could be a symptom of underlying weakness in the economy. On the flip side, a weak currency, like the dollar in recent years, could be a side effect of relatively strong growth compared with trading partners, which drives up the domestic demand for imports faster than the foreign demand for exports.
Clearly, the question of whether relative currency strength is a good or bad thing for a company is very complicated. It is critical for companies to operate their businesses seamlessly on a global scale so they can capture the benefits of global adjustment processes, says Tomonori Tani, an investment analyst for the fund based in Tokyo. “Investment opportunities are not restricted to wealthier countries, and there are companies outside those areas that are positioned to capture stronger economic growth by offering goods and services that are needed globally,” Tomonori says. “Understanding these intricacies is a way we excel as a truly global investment management company.”
Fundamental research on currency issues
Currency effects remain in sharp focus for the fund’s investment analysts — particularly in some of the countries with more volatile currency markets — and the analysts study these issues closely. Currency issues are complex, and company disclosures in the financial statements can be opaque. To understand the accounting behind currency exposures of revenues and costs in foreign countries, “we want to know what is unhedged versus hedged, and understand the geographical distribution of revenues and costs, and a host of other concerns,” says Elizabeth Mooney, a global accounting analyst based in San Francisco.
It’s easy to get lost in translation. Some of the more intricate accounting work the investment analysts dig into involves looking at currency from all angles in the financial statements. Some of the more technical questions that the fund’s investment analysts ask themselves are: “What are the currency exposures in core operations, net investments and within subsidiaries?” and “What is the potential for earnings growth if non-U.S. companies have taken advantage of a stronger dollar and entered hedges at more favorable rates?”
At the end of the day, headlines aside, currency effects can add or detract from a company’s earnings to various degrees. However, as Bruno adds, “The best companies are the ones that don’t have to rely on benefits of currency to be competitive and do well.” n
[Begin Pull Quote]
“From a long-term investment perspective, the best companies are the ones that don’t have to rely on benefits of currency to be competitive and do well.”
Bruno Rodrigues
Investment analyst
[End Pull Quote]
[photo of blocks of cheese]
[photo of a fruit and vegetable stand]
| Tapping global potential | ||||
| 1985 | 1986 | 1987 | 1988 | 1989 |
| MSCI ACWI | MSCI ACWI | MSCI ACWI | MSCI ACWI | MSCI |
| ex USA Index | ex USA Index | ex USA Index | ex USA Index | USA Index |
| +57%* (black) | +70%* (black) | +25%* (black) | +28% (black) | +31% (red) |
| +33% (red) | +18% (red) | +4% (red) | +16% (red) | +12% (black) |
| 1990 | 1991 | 1992 | 1993 | 1994 |
| MSCI | MSCI | MSCI | MSCI ACWI | MSCI ACWI |
| USA Index | USA Index | USA Index | ex USA Index | ex USA Index |
| –2% (red) | +31% (red) | +7% (red) | +35% (black) | +7% (black) |
| –23% (black) | +14% (black) | –11% (black) | +10% (red) | +2% (red) |
| 1995 | 1996 | 1997 | 1998 | 1999 |
| MSCI | MSCI | MSCI | MSCI | MSCI ACWI |
| USA Index | USA Index | USA Index | USA Index | ex USA Index |
| +38% (red) | +24% (red) | +34% (red) | +31% (red) | +31% (black) |
| +10% (black) | +7% (black) | +2% (black) | +14% (black) | +22% (red) |
| 2000 | 2001 | 2002 | 2003 | 2004 |
| MSCI | MSCI | MSCI ACWI | MSCI ACWI | MSCI ACWI |
| USA Index | USA Index | ex USA Index | ex USA Index | ex USA Index |
| –13% (red) | –12% (red) | –15% (black) | +41% (black) | +21% (black) |
| –15% (black) | –20% (black) | –23% (red) | +29% (red) | +11% (red) |
| 2005 | 2006 | 2007 | 2008 | 2009 |
| MSCI ACWI | MSCI ACWI | MSCI ACWI | MSCI | MSCI ACWI |
| ex USA Index | ex USA Index | ex USA Index | USA Index | ex USA Index |
| +17% (black) | +27% (black) | +17% (black) | –37% (red) | +42% (black) |
| +6% (red) | +15% (red) | +6% (red) | –45% (black) | +27% (red) |
| The table above compares total returns for the unmanaged MSCI ACWI (All Country World Index) ex USA (shown in black), and U.S. indexes (shown in red), over the past 25 calendar years. | ||||
| *Inception date of the MSCI ACWI ex USA Index is December 31, 1987; data prior to that is based on the MSCI EAFE (Europe, Australasia, Far East) Index. | ||||
A world of opportunity
With more than half of the world’s investment opportunities located beyond our shores, an international focus gives U.S. investors access to growth potential that would otherwise be out of reach. As the chart shows, international stocks have outpaced their U.S. counterparts in 14 of the past 25 calendar years.
Tempered volatility
Diversifying among many markets can also help investors mitigate fluctuations in the value of their investments. Over the past 30 calendar years, the least volatile equity portfolio would have been composed of approximately 65% U.S. stocks and 35% non-U.S. stocks (rebalanced monthly), and been nearly as rewarding as one invested entirely in U.S. stocks. (Volatility is measured by annualized standard deviation, based on monthly returns, or how returns have varied from the mean over time.)
Active management
Negotiating the unfamiliar terrain of international markets can be challenging. That is why so many people choose to invest overseas through professionally managed mutual funds. EuroPacific Growth Fund draws on the global research experience of its investment adviser, Capital Research and Management Company, to find attractive companies based chiefly in Europe and the Pacific Basin.
Summary investment portfolio, March 31, 2010
The following summary investment portfolio is designed to streamline the report and help investors better focus on a fund’s principal holdings. See the inside back cover for details on how to obtain a complete schedule of portfolio holdings.
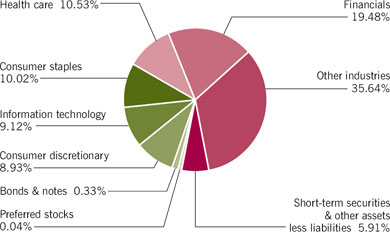
Industry sector diversification (percent of net assets)
Country diversification (percent of net assets) | ||||
| Euro zone* | 30.0 | % | ||
| Japan | 10.1 | |||
| United Kingdom | 10.1 | |||
| Switzerland | 8.0 | |||
| Mexico | 3.5 | |||
| China | 3.5 | |||
| Canada | 3.2 | |||
| Brazil | 3.1 | |||
| India | 3.0 | |||
| South Korea | 2.6 | |||
| Australia | 2.4 | |||
| Taiwan | 2.0 | |||
| Other countries | 12.6 | |||
| Short-term securities & other assets less liabilities | 5.9 | |||
| *Countries using the euro as a common currency; those represented in the fund's portfolio are Austria, Belgium, Finland, France, Germany, Greece, Ireland, Italy, the Netherlands, Portugal and Spain. | ||||
| Percent | ||||||||||||
| Value | of net | |||||||||||
| Common stocks - 93.72% | Shares | (000 | ) | assets | ||||||||
| Financials - 19.48% | ||||||||||||
| Banco Santander, SA | 96,355,254 | $ | 1,283,017 | 1.25 | % | |||||||
| A leading Spanish bank, with a strong franchise in Latin America and the U.K. | ||||||||||||
| Barclays PLC | 200,644,707 | 1,097,831 | ||||||||||
| Barclays PLC (1) | 6,192,900 | 33,885 | 1.10 | |||||||||
| One of the largest retail and commercial banking groups in the U.K. | ||||||||||||
| UBS AG (2) | 62,434,976 | 1,017,916 | .99 | |||||||||
| One of the world's largest financial services companies, providing wealth management, investment banking and asset management. | ||||||||||||
| Prudential PLC | 119,635,824 | 994,692 | .97 | |||||||||
| A leading life insurance and pension provider. Has significant operations in the U.S. and the U.K. and is growing in the Asia/Pacific region. | ||||||||||||
| Industrial and Commercial Bank of China Ltd., Class H | 1,139,854,000 | 869,131 | .85 | |||||||||
| A state-owned commercial bank in China and one of the world's largest banks. | ||||||||||||
| Société Générale | 13,111,355 | 826,170 | .81 | |||||||||
| Has retail, corporate and investment banking operations around the world, with particular strength in Europe. | ||||||||||||
| Housing Development Finance Corp. Ltd. | 12,702,073 | 770,060 | .75 | |||||||||
| Offers home loans and other financial services through a network of offices in India. | ||||||||||||
| Deutsche Bank AG | 9,193,504 | 709,490 | .69 | |||||||||
| Provides corporate banking, investment banking and worldwide asset management. | ||||||||||||
| Banco Bradesco SA, preferred nominative | 35,653,805 | 657,176 | .64 | |||||||||
| One of the largest private banks in Brazil. | ||||||||||||
| Itaú Unibanco Holding SA, preferred nominative | 17,739,630 | 388,786 | ||||||||||
| Itaú Unibanco Holding SA, preferred nominative (ADR) | 11,638,203 | 255,924 | .63 | |||||||||
| One of Brazil's leading private commercial banks. | ||||||||||||
| Bank of China Ltd., Class H | 1,181,106,000 | 629,801 | .62 | |||||||||
| One of China's largest commercial banks. | ||||||||||||
| AXA SA | 26,896,837 | 599,455 | .59 | |||||||||
| One of the world's largest insurance and financial services companies. | ||||||||||||
| Other securities | 9,824,209 | 9.59 | ||||||||||
| 19,957,543 | 19.48 | |||||||||||
| Health care - 10.53% | ||||||||||||
| Bayer AG | 29,735,750 | 2,015,140 | 1.97 | |||||||||
| Makes pharmaceuticals and over-the-counter medicines, and develops medical diagnostic equipment. | ||||||||||||
| Novartis AG | 34,611,325 | 1,874,931 | 1.83 | |||||||||
| One of the world's largest pharmaceutical companies. | ||||||||||||
| Novo Nordisk A/S, Class B | 22,139,400 | 1,721,703 | 1.68 | |||||||||
| A global leader in drugs to treat diabetes. | ||||||||||||
| Roche Holding AG | 10,065,636 | 1,637,234 | 1.60 | |||||||||
| A world leader in pharmaceuticals and diagnostic research. | ||||||||||||
| Teva Pharmaceutical Industries Ltd. (ADR) | 17,536,100 | 1,106,177 | 1.08 | |||||||||
| The leading drug company in Israel, and one of the largest generic drug companies in the U.S. | ||||||||||||
| CSL Ltd. | 19,767,862 | 660,659 | .64 | |||||||||
| Develops pharmaceuticals, including vaccines and products derived from human plasma. | ||||||||||||
| Other securities | 1,776,027 | 1.73 | ||||||||||
| 10,791,871 | 10.53 | |||||||||||
| Consumer staples - 10.02% | ||||||||||||
| Anheuser-Busch InBev NV | 41,213,464 | 2,079,944 | ||||||||||
| Anheuser-Busch InBev NV, VVPR STRIPS (2) | 10,093,238 | 96 | 2.03 | |||||||||
| One of the world's largest brewers. | ||||||||||||
| Nestlé SA | 23,552,000 | 1,209,748 | 1.18 | |||||||||
| Global packaged food and beverage company based in Switzerland. | ||||||||||||
| Pernod Ricard SA | 10,705,051 | 910,740 | .89 | |||||||||
| Produces wine, spirits and nonalcoholic beverages. | ||||||||||||
| Tesco PLC | 127,197,773 | 841,126 | .82 | |||||||||
| Major international retailer based in the United Kingdom. | ||||||||||||
| Danone SA | 12,511,168 | 755,083 | .74 | |||||||||
| One of the world's largest food manufacturers and a leader in dairy products, bottled water and biscuits. | ||||||||||||
| British American Tobacco PLC | 21,589,999 | 744,747 | .72 | |||||||||
| The world's second-largest tobacco company. | ||||||||||||
| Other securities | 3,728,453 | 3.64 | ||||||||||
| 10,269,937 | 10.02 | |||||||||||
| Information technology - 9.12% | ||||||||||||
| SAP AG | 24,000,795 | 1,164,657 | ||||||||||
| SAP AG (ADR) | 4,117,500 | 198,340 | 1.33 | |||||||||
| A leading developer of software for business applications. Also provides information technology services. | ||||||||||||
| Samsung Electronics Co. Ltd. | 1,665,659 | 1,204,481 | ||||||||||
| Samsung Electronics Co. Ltd., nonvoting preferred | 48,800 | 23,209 | 1.20 | |||||||||
| Korea's top electronics manufacturer and a global leader in semiconductor production. | ||||||||||||
| Canon, Inc. | 20,576,700 | 954,339 | .93 | |||||||||
| One of the world's premier manufacturers of cameras, copiers, printers and optical equipment. | ||||||||||||
| HOYA CORP. (3) | 23,734,700 | 653,111 | .64 | |||||||||
| A large manufacturer of specialty glass and crystal used in electronics and vision care. | ||||||||||||
| Taiwan Semiconductor Manufacturing Co. Ltd. | 295,735,170 | 573,202 | ||||||||||
| Taiwan Semiconductor Manufacturing Co. Ltd. (ADR) | 5,822,723 | 61,080 | .62 | |||||||||
| One of the world's largest semiconductor manufacturers. | ||||||||||||
| Telefonaktiebolaget LM Ericsson, Class B | 57,255,964 | 605,744 | .59 | |||||||||
| One of the world's largest suppliers of wired and wireless telephone infrastructure. | ||||||||||||
| Other securities | 3,907,838 | 3.81 | ||||||||||
| 9,346,001 | 9.12 | |||||||||||
| Consumer discretionary - 8.93% | ||||||||||||
| Honda Motor Co., Ltd. | 29,109,250 | 1,028,926 | 1.00 | |||||||||
| Develops, manufactures and sells automobiles, motorcycles and power equipment globally. | ||||||||||||
| Daimler AG | 17,128,778 | 807,892 | ||||||||||
| Daimler AG (New York registered) | 250,000 | 11,753 | .80 | |||||||||
| One of the world's largest automakers and heavy truck manufacturers. | ||||||||||||
| Industria de Diseño Textil, SA | 10,683,042 | 705,539 | .69 | |||||||||
| Designs and retails up-to-the-minute clothing. Most of its shops are in Europe. | ||||||||||||
| Toyota Motor Corp. | 14,438,300 | 579,171 | .56 | |||||||||
| One of the world's largest automotive manufacturers. | ||||||||||||
| Other securities | 6,022,366 | 5.88 | ||||||||||
| 9,155,647 | 8.93 | |||||||||||
| Materials - 8.73% | ||||||||||||
| Xstrata PLC (2) | 56,660,053 | 1,074,259 | 1.05 | |||||||||
| A global diversified metals and mining group. | ||||||||||||
| ArcelorMittal | 17,758,136 | 780,745 | .76 | |||||||||
| One of the world's largest steel producers. | ||||||||||||
| Linde AG | 5,178,200 | 619,011 | .61 | |||||||||
| Major industrial gas company headquartered in Germany. | ||||||||||||
| Impala Platinum Holdings Ltd. | 19,110,488 | 562,498 | .55 | |||||||||
| One of the world's largest platinum producers. | ||||||||||||
| Syngenta AG | 1,974,315 | 549,871 | .54 | |||||||||
| One of the world's largest agrochemical companies. Develops seeds and crop protection products. | ||||||||||||
| Holcim Ltd (2) | 7,314,544 | 546,869 | .53 | |||||||||
| One of the world's largest producers of cement, concrete products and mineral aggregates. | ||||||||||||
| Other securities | 4,809,102 | 4.69 | ||||||||||
| 8,942,355 | 8.73 | |||||||||||
| Telecommunication services - 8.63% | ||||||||||||
| América Móvil, SAB de CV, Series L (ADR) | 50,366,501 | 2,535,450 | ||||||||||
| América Móvil, SAB de CV, Series L | 74,020,000 | 186,420 | 2.66 | |||||||||
| Latin America's largest cellular communications provider. | ||||||||||||
| Telefónica, SA | 55,730,000 | 1,322,759 | 1.29 | |||||||||
| One of the premier providers of fixed and mobile telephone and Internet services in Spain and Latin America. | ||||||||||||
| SOFTBANK CORP. | 32,506,000 | 801,856 | .78 | |||||||||
| Internet and telecommunications conglomerate and distributor of digital media and software. | ||||||||||||
| Koninklijke KPN NV | 40,348,800 | 640,458 | .63 | |||||||||
| Global telecommunication services provider based in the Netherlands. | ||||||||||||
| Other securities | 3,352,692 | 3.27 | ||||||||||
| 8,839,635 | 8.63 | |||||||||||
| Energy - 7.01% | ||||||||||||
| OAO Gazprom (ADR) | 49,942,000 | 1,165,147 | 1.14 | |||||||||
| The largest natural gas producer and transporter in Russia. | ||||||||||||
| Petróleo Brasileiro SA - Petrobras, ordinary nominative (ADR) | 16,506,340 | 734,367 | .72 | |||||||||
| One of the world's largest oil companies. Engaged in exploration, production, refining, marketing and chemicals. | ||||||||||||
| Reliance Industries Ltd. | 29,630,000 | 710,175 | .69 | |||||||||
| Manufactures a wide range of synthetic textiles, petrochemicals and plastics. Also involved in oil exploration and production, and electricity generation and distribution. | ||||||||||||
| Other securities | 4,574,326 | 4.46 | ||||||||||
| 7,184,015 | 7.01 | |||||||||||
| Industrials - 6.05% | ||||||||||||
| Siemens AG | 6,787,900 | 681,096 | .66 | |||||||||
| A major worldwide producer of electrical and electronic equipment used in industrial and professional applications. | ||||||||||||
| Other securities | 5,519,085 | 5.39 | ||||||||||
| 6,200,181 | 6.05 | |||||||||||
| Utilities - 2.65% | ||||||||||||
| GDF SUEZ | 14,851,539 | 574,777 | .56 | |||||||||
| Major natural gas and electricity company based in France. | ||||||||||||
| Other securities | 2,144,281 | 2.09 | ||||||||||
| 2,719,058 | 2.65 | |||||||||||
| Miscellaneous - 2.57% | ||||||||||||
| Other common stocks in initial period of acquisition | 2,638,010 | 2.57 | ||||||||||
| Total common stocks (cost: $74,002,319,000) | 96,044,253 | 93.72 | ||||||||||
| Percent | ||||||||||||
| Value | of net | |||||||||||
| Preferred stocks - 0.04% | (000 | ) | assets | |||||||||
| Financials - 0.04% | ||||||||||||
| Other securities | 35,611 | .04 | ||||||||||
| Total preferred stocks (cost: $28,674,000) | 35,611 | .04 | ||||||||||
| Principal | Percent | |||||||||||
| amount | Value | of net | ||||||||||
| Bonds & notes - 0.33% | (000 | ) | (000 | ) | assets | |||||||
| Other - 0.33% | ||||||||||||
| Gazprom International SA 7.201% 2020 (4) | $ | 19,397 | 20,635 | |||||||||
| Open Joint Stock Co. Gazprom, Series 2, 8.625% 2034 | 5,875 | 6,874 | ||||||||||
| Gaz Capital SA 7.288%-8.146% 2013-2037 | 43,480 | 48,367 | .07 | |||||||||
| Other securities | 261,819 | .26 | ||||||||||
| Total bonds & notes (cost: $254,073,000) | 337,695 | .33 | ||||||||||
| Principal | Percent | |||||||||||
| amount | Value | of net | ||||||||||
| Short-term securities - 5.86% | (000 | ) | (000 | ) | assets | |||||||
| Freddie Mac 0.12%-0.435% due 4/6/2010-1/10/2011 | 2,486,060 | 2,485,097 | 2.42 | |||||||||
| Fannie Mae 0.15%-0.43% due 4/7/2010-1/18/2011 | 1,001,400 | 1,000,465 | .98 | |||||||||
| Barclays U.S. Funding Corp. 0.07% due 4/1/2010 | 98,550 | 98,550 | .10 | |||||||||
| Nestlé Capital Corp. 0.31% due 9/14/2010 (1) | 36,500 | 36,458 | .03 | |||||||||
| Other securities | 2,388,021 | 2.33 | ||||||||||
| Total short-term securities (cost: $6,008,158,000) | 6,008,591 | 5.86 | ||||||||||
| Total investment securities (cost: $80,293,224,000) | 102,426,150 | 99.95 | ||||||||||
| Other assets less liabilities | 53,245 | .05 | ||||||||||
| Net assets | $ | 102,479,395 | 100.00 | % | ||||||||
| "Miscellaneous" securities include holdings in their initial period of acquisition that have not previously been publicly disclosed. |
| "Other securities" includes all issues that are not disclosed separately in the summary investment portfolio, including securities which were valued under fair value procedures adopted by authority of the board of trustees. The total value of all such securities was $298,463,000, which represented .29% of the net assets of the fund. |
| Investments in affiliates | ||||||
| A company is considered to be an affiliate of the fund under the Investment Company Act of 1940 if the fund's holdings in that company represent 5% or more of the outstanding voting shares. The value of the fund's affiliated-company holdings is either shown in the summary investment portfolio or included in the value of "Other securities" under the respective industry sectors. Further details on such holdings and related transactions during the year ended March 31, 2010, appear below. |
| Dividend | Value of affiliates | |||||||||||||||||||||||
| Beginning | Ending | income | at 3/31/10 | |||||||||||||||||||||
| shares | Additions | Reductions | shares | (000 | ) | (000 | ) | |||||||||||||||||
| HOYA CORP. | 26,989,700 | - | 3,255,000 | 23,734,700 | $ | 16,794 | $ | 653,111 | ||||||||||||||||
| UCB SA | 10,179,479 | 718,329 | 147,877 | 10,749,931 | 10,656 | 459,897 | ||||||||||||||||||
| Hirose Electric Co., Ltd. | 2,547,000 | - | 144,500 | 2,402,500 | 2,914 | 277,409 | ||||||||||||||||||
| Techtronic Industries Co. Ltd. | 86,710,000 | - | - | 86,710,000 | 671 | 70,360 | ||||||||||||||||||
| adidas AG (5) | 6,843,000 | 4,530,000 | 1,550,000 | 9,823,000 | 5,344 | - | ||||||||||||||||||
| Housing Development Finance Corp. Ltd. (5) | 15,436,346 | 72,727 | 2,807,000 | 12,702,073 | 7,928 | - | ||||||||||||||||||
| HTC Corp. (5) | 38,751,100 | 3,292,555 | 18,225,500 | 23,818,155 | 22,319 | - | ||||||||||||||||||
| Qantas Airways Ltd. (2) (5) | 127,259,300 | - | 82,267,823 | 44,991,477 | - | - | ||||||||||||||||||
| $ | 66,626 | $ | 1,460,777 | |||||||||||||||||||||
| The following footnotes apply to either the individual securities noted or one or more of the securities aggregated and listed as a single line item. |
| (1) Purchased in a transaction exempt from registration under the Securities Act of 1933. May be resold in the U.S. in transactions exempt from registration, normally to qualified institutional buyers. The total value of all such securities, including those in "Other securities," was $916,682,000, which represented .89% of the net assets of the fund. |
| (2) Security did not produce income during the last 12 months. |
| (3) Represents an affiliated company as defined under the Investment Company Act of 1940. |
| (4) Principal payments may be made periodically. Therefore, the effective maturity date may be earlier than the stated maturity date. |
| (5) Unaffiliated issuer at 3/31/2010. |
| Key to abbreviation |
| ADR = American Depositary Receipts |
| The descriptions of the companies shown in the summary investment portfolio, which were obtained from published reports and other sources believed to be reliable, are supplemental and are not covered by the Report of Independent Registered Public Accounting Firm. |
| See Notes to Financial Statements |
Financial statements
| Statement of assets and liabilities | ||||||||
| at March 31, 2010 | (dollars in thousands) | |||||||
| Assets: | ||||||||
| Investment securities, at value: | ||||||||
| Unaffiliated issuers (cost: $78,928,280) | $ | 100,965,373 | ||||||
| Affiliated issuers (cost: $1,364,944) | 1,460,777 | $ | 102,426,150 | |||||
| Cash denominated in currencies other than U.S. dollars (cost: $39,028) | 39,227 | |||||||
| Cash | 53 | |||||||
| Unrealized appreciation on open forward currency contracts | 7,975 | |||||||
| Receivables for: | ||||||||
| Sales of investments | 293,418 | |||||||
| Sales of fund's shares | 937,547 | |||||||
| Dividends and interest | 265,610 | |||||||
| Other | 29,802 | 1,526,377 | ||||||
| 103,999,782 | ||||||||
| Liabilities: | ||||||||
| Unrealized depreciation on open forward currency contracts | 1,115 | |||||||
| Payables for: | ||||||||
| Purchases of investments | 610,676 | |||||||
| Repurchases of fund's shares | 784,566 | |||||||
| Investment advisory services | 36,074 | |||||||
| Services provided by affiliates | 32,780 | |||||||
| Trustees' deferred compensation | 2,726 | |||||||
| Non-U.S. taxes | 50,318 | |||||||
| Other | 2,132 | 1,519,272 | ||||||
| Net assets at March 31, 2010 | $ | 102,479,395 | ||||||
| Net assets consist of: | ||||||||
| Capital paid in on shares of beneficial interest | $ | 94,404,742 | ||||||
| Distributions in excess of net investment income | (119,556 | ) | ||||||
| Accumulated net realized loss | (13,899,074 | ) | ||||||
| Net unrealized appreciation | 22,093,283 | |||||||
| Net assets at March 31, 2010 | $ | 102,479,395 | ||||||
| (dollars and shares in thousands, except per-share amounts) | ||||||||||||
| Shares of beneficial interest issued and outstanding (no stated par value) - unlimited shares authorized (2,666,683 total shares outstanding) | ||||||||||||
| Net assets | Shares outstanding | Net asset value per share* | ||||||||||
| Class A | $ | 40,425,730 | 1,046,780 | $ | 38.62 | |||||||
| Class B | 923,417 | 24,165 | 38.21 | |||||||||
| Class C | 2,901,063 | 76,951 | 37.70 | |||||||||
| Class F-1 | 8,601,559 | 223,829 | 38.43 | |||||||||
| Class F-2 | 4,028,093 | 104,307 | 38.62 | |||||||||
| Class 529-A | 825,709 | 21,552 | 38.31 | |||||||||
| Class 529-B | 91,336 | 2,424 | 37.68 | |||||||||
| Class 529-C | 312,603 | 8,318 | 37.58 | |||||||||
| Class 529-E | 46,152 | 1,214 | 38.02 | |||||||||
| Class 529-F-1 | 56,423 | 1,473 | 38.30 | |||||||||
| Class R-1 | 279,104 | 7,471 | 37.36 | |||||||||
| Class R-2 | 1,302,671 | 34,678 | 37.56 | |||||||||
| Class R-3 | 7,130,564 | 188,004 | 37.93 | |||||||||
| Class R-4 | 11,204,126 | 294,867 | 38.00 | |||||||||
| Class R-5 | 16,716,168 | 433,132 | 38.59 | |||||||||
| Class R-6 | 7,634,677 | 197,518 | 38.65 | |||||||||
| (*) Maximum offering price and redemption price per share were equal to the net asset value per share for all share classes, except for Classes A and 529-A, for which the maximum offering prices per share were $40.98 and $40.65, respectively. | ||||||||||||
| See Notes to Financial Statements | ||||||||||||
| Statement of operations | ||||||||
| for the year ended March 31, 2010 | (dollars in thousands) | |||||||
| Investment income: | ||||||||
| Income: | ||||||||
| Dividends (net of non-U.S. taxes of $239,937; also includes $66,626 from affiliates) | $ | 1,954,763 | ||||||
| Interest | 78,320 | $ | 2,033,083 | |||||
| Fees and expenses*: | ||||||||
| Investment advisory services | 382,008 | |||||||
| Distribution services | 214,833 | |||||||
| Transfer agent services | 51,768 | |||||||
| Administrative services | 69,583 | |||||||
| Reports to shareholders | 3,609 | |||||||
| Registration statement and prospectus | 10,902 | |||||||
| Trustees' compensation | 1,234 | |||||||
| Auditing and legal | 306 | |||||||
| Custodian | 19,527 | |||||||
| State and local taxes | 1,098 | |||||||
| Other | 2,889 | 757,757 | ||||||
| Net investment income | 1,275,326 | |||||||
| Net realized loss and unrealized appreciation on investments, forward currency contracts and currency: | ||||||||
| Net realized (loss) gain on: | ||||||||
| Investments (including $9,364 net loss from affiliates) | (1,258,004 | ) | ||||||
| Currency transactions | 4,935 | (1,253,069 | ) | |||||
| Net unrealized appreciation on: | ||||||||
| Investments (net of non-U.S. taxes of $50,318) | 33,633,587 | |||||||
| Forward currency contracts | 6,860 | |||||||
| Currency translations | 5,527 | 33,645,974 | ||||||
| Net realized loss and unrealized appreciation on investments, forward currency contracts and currency | 32,392,905 | |||||||
| Net increase in net assets resulting from operations | $ | 33,668,231 | ||||||
| (*) Additional information related to class-specific fees and expenses is included in the Notes to Financial Statements. | ||||||||
| See Notes to Financial Statements | ||||||||
| Statements of changes in net assets | (dollars in thousands) | |||||||
| Year ended March 31 | ||||||||
| 2010 | 2009 | |||||||
| Operations: | ||||||||
| Net investment income | $ | 1,275,326 | $ | 2,108,347 | ||||
| Net realized loss on investments and currency transactions | (1,253,069 | ) | (12,486,045 | ) | ||||
| Net unrealized appreciation (depreciation) on investments, forward currency contracts and currency translations | 33,645,974 | (36,391,191 | ) | |||||
| Net increase (decrease) in net assets resulting from operations | 33,668,231 | (46,768,889 | ) | |||||
| Dividends and distributions paid to shareholders: | ||||||||
| Dividends from net investment income | (1,624,677 | ) | (1,815,409 | ) | ||||
| Distributions from net realized gain on investments | - | (3,253,052 | ) | |||||
| Total dividends and distributions paid to shareholders | (1,624,677 | ) | (5,068,461 | ) | ||||
| Net capital share transactions | 6,951,394 | 546,261 | ||||||
| Total increase (decrease) in net assets | 38,994,948 | (51,291,089 | ) | |||||
| Net assets: | ||||||||
| Beginning of year | 63,484,447 | 114,775,536 | ||||||
| End of year (including distributions in excess of and undistributed net investment income: $(119,556) and $166,473, respectively) | $ | 102,479,395 | $ | 63,484,447 | ||||
| See Notes to Financial Statements | ||||||||
Notes to financial statements
| 1. | Organization |
EuroPacific Growth Fund (the "fund") is registered under the Investment Company Act of 1940 as an open-end, diversified management investment company. The fund seeks long-term growth of capital by investing primarily in the securities of companies based in Europe and the Pacific Basin.
On November 24, 2009, shareholders approved amendments to the fund’s Investment Advisory and Service Agreement and amendments to and elimination of certain fundamental investment policies of the fund. On December 23, 2009, shareholders approved a proposal to reorganize the fund from a Massachusetts business trust to a Delaware statutory trust. The reorganization may be completed in 2010 or early 2011; however, the fund reserves the right to delay the implementation.
The fund has 16 share classes consisting of five retail share classes, five 529 college savings plan share classes and six retirement plan share classes. The 529 college savings plan share classes (529-A, 529-B, 529-C, 529-E and 529-F-1) can be used to save for college education. The six retirement plan share classes (R-1, R-2, R-3, R-4, R-5 and R-6) are generally offered only through eligible employer-sponsored retirement plans. The fund’s share classes are described below:
| Share class | Initial sales charge | Contingent deferred sales charge upon redemption | Conversion feature |
| Classes A and 529-A | Up to 5.75% | None (except 1% for certain redemptions within one year of purchase without an initial sales charge) | None |
| Classes B and 529-B* | None | Declines from 5% to 0% for redemptions within six years of purchase | Classes B and 529-B convert to Classes A and 529-A, respectively, after eight years |
| Class C | None | 1% for redemptions within one year of purchase | Class C converts to Class F-1 after 10 years |
| Class 529-C | None | 1% for redemptions within one year of purchase | None |
| Class 529-E | None | None | None |
| Classes F-1, F-2 and 529-F-1 | None | None | None |
| Classes R-1, R-2, R-3, R-4, R-5 and R-6 | None | None | None |
*Effective April 21, 2009, Class B and 529-B shares of the fund are not available for purchase.
On May 1, 2009, the fund made an additional retirement plan share class (Class R-6) available for sale pursuant to an amendment to its registration statement filed with the Securities and Exchange Commission (“SEC”). Refer to the fund’s retirement plan prospectus for more details.
Holders of all share classes have equal pro rata rights to assets, dividends and liquidation proceeds. Each share class has identical voting rights, except for the exclusive right to vote on matters affecting only its class. Share classes have different fees and expenses ("class-specific fees and expenses"), primarily due to different arrangements for distribution, administrative and shareholder services. Differences in class-specific fees and expenses will result in differences in net investment income and, therefore, the payment of different per-share dividends by each class.
| 2. | Significant accounting policies |
The financial statements have been prepared to comply with accounting principles generally accepted in the United States of America. These principles require management to make estimates and assumptions that affect reported amounts and disclosures. Actual results could differ from those estimates. The fund follows the significant accounting policies described below, as well as the valuation policies described in the next section on valuation.
Security transactions and related investment income – Security transactions are recorded by the fund as of the date the trades are executed with brokers. Realized gains and losses from security transactions are determined based on the specific identified cost of the securities. In the event a security is purchased with a delayed payment date, the fund will segregate liquid assets sufficient to meet its payment obligations. Dividend income is recognized on the ex-dividend date and interest income is recognized on an accrual basis. Market discounts, premiums and original issue discounts on fixed-income securities are amortized daily over the expected life of the security.
Class allocations – Income, fees and expenses (other than class-specific fees and expenses) and realized and unrealized gains and losses are allocated daily among the various share classes based on their relative net assets. Class-specific fees and expenses, such as distribution, administrative and shareholder services, are charged directly to the respective share class.
Dividends and distributions to shareholders – Dividends and distributions paid to shareholders are recorded on the ex-dividend date.
Currency translation – Assets and liabilities, including investment securities, denominated in currencies other than U.S. dollars are translated into U.S. dollars at the exchange rates in effect on the valuation date. Purchases and sales of investment securities and income and expenses are translated into U.S. dollars at the exchange rates on the dates of such transactions. On the accompanying financial statements, the effects of changes in exchange rates on investment securities are included with the net realized gain or loss and net unrealized appreciation or depreciation on investments. The realized gain or loss and unrealized appreciation or dep reciation resulting from all other transactions denominated in currencies other than U.S. dollars are disclosed separately.
| 3. | Valuation |
The fund’s investments are reported at fair value as defined by accounting principles generally accepted in the United States of America. The fund generally determines its net asset value as of approximately 4:00 p.m. New York time each day the New York Stock Exchange is open.
Methods and inputs – The fund uses the following methods and inputs to establish the fair value of its assets and liabilities. Use of particular methods and inputs may vary over time based on availability and relevance as market and economic conditions evolve.
Equity securities are generally valued at the official closing price of, or the last reported sale price on, the exchange or market on which such securities are traded, as of the close of business on the day the securities are being valued or, lacking any sales, at the last available bid price. Prices for each security are taken from the principal exchange or market in which the security trades.
Fixed-income securities, including short-term securities purchased with more than 60 days left to maturity, are generally valued at prices obtained as of approximately 3:00 p.m. New York time from one or more pricing vendors. Vendors value such securities based on one or more of the inputs described in the following table. The table provides examples of inputs that are commonly relevant for valuing particular classes of fixed-income securities in which the fund is authorized to invest. However, these classifications are not exclusive and any of the inputs may be used to value any other class of fixed-income security.
| Fixed-income class | Examples of standard inputs |
| All | Benchmark yields, transactions, bids, offers, quotations from dealers and trading systems, new issues, spreads and other relationships observed in the markets among comparable securities and proprietary pricing models such as yield measures calculated using factors such as cash flows, financial or collateral performance and other reference data (collectively referred to as “standard inputs”) |
| Corporate bonds & notes; convertible securities | Standard inputs and underlying equity of the issuer |
| Bonds & notes of governments & government agencies | Standard inputs and interest rate volatilities |
Where the investment adviser deems it appropriate to do so (such as when vendor prices are unavailable or not deemed to be representative), fixed-income securities will be valued in good faith at the mean quoted bid and asked prices that are reasonably and timely available (or bid prices, if asked prices are not available) or at prices for securities of comparable maturity, quality and type.
Securities with both fixed-income and equity characteristics, or equity securities traded principally among fixed-income dealers, are generally valued in the manner described above for either equity or fixed-income securities, depending on which method is deemed most appropriate by the investment adviser. Short-term securities purchased within 60 days to maturity are valued at amortized cost, which approximates fair value. The value of short-term securities originally purchased with maturities greater than 60 days is determined based on an amortized value to par when they reach 60 days or less remaining to maturity. Forward currency contracts are valued at the mean of representative quoted bid and asked prices.
Securities and other assets for which representative market quotations are not readily available or are considered unreliable by the investment adviser are fair valued as determined in good faith under guidelines adopted by authority of the fund's board of trustees. Market quotations may be considered unreliable if events occur that materially affect the value of securities (particularly equity securities trading outside the U.S.) between the close of trading in those securities and the close of regular trading on the New York Stock Exchange. Various inputs may be reviewed in order to make a good faith determination of a security’s fair value. These inputs include, but are not limited to, the type and cost of the security; contractual or legal restrictions on resale of the security; relevant financial or business developments of the issuer; actively traded similar or related securities; conversion or exchange rights on the security; related corporate actions; significant events occurring after the close of trading in the security; and changes in overall market conditions. Fair valuations and valuations of investments that are not actively trading involve judgment and may differ materially from valuations that would have been used had greater market activity occurred.
Classifications - The fund classifies its assets and liabilities into three levels based on the inputs used to value the assets or liabilities. Level 1 values are based on quoted prices in active markets for identical securities. Level 2 values are based on significant observable market inputs, such as quoted prices for similar securities and quoted prices in inactive markets. Level 3 values are based on significant unobservable inputs that reflect the fund’s determination of assumptions that market participants might reasonably use in valuing the securities. The valuati on levels are not necessarily an indication of the risk or liquidity associated with the underlying investment. For example, U.S. government securities are reflected as Level 2 because the inputs used to determine fair value may not always be quoted prices in an active market. The following table presents the fund’s valuation levels as of March 31, 2010 (dollars in thousands):
| Investment securities: | Level 1 | Level 2 | Level 3 | Total | ||||||||||||
| Common stocks: | ||||||||||||||||
| Financials | $ | 19,713,056 | $ | 244,487 | $ | - | $ | 19,957,543 | ||||||||
| Health care | 10,791,871 | - | - | 10,791,871 | ||||||||||||
| Consumer staples | 10,269,937 | - | - | 10,269,937 | ||||||||||||
| Information technology | 9,346,001 | - | - | 9,346,001 | ||||||||||||
| Consumer discretionary | 9,155,647 | - | - | 9,155,647 | ||||||||||||
| Materials | 8,942,355 | - | - | 8,942,355 | ||||||||||||
| Telecommunication services | 8,785,659 | 53,976 | - | 8,839,635 | ||||||||||||
| Energy | 7,184,015 | - | - | 7,184,015 | ||||||||||||
| Industrials | 6,200,181 | - | - | 6,200,181 | ||||||||||||
| Utilities | 2,719,058 | - | - | 2,719,058 | ||||||||||||
| Miscellaneous | 2,638,010 | - | - | 2,638,010 | ||||||||||||
| Preferred stocks | - | 35,611 | - | 35,611 | ||||||||||||
| Bonds & notes | - | 337,695 | - | 337,695 | ||||||||||||
| Short-term securities | - | 6,008,591 | - | 6,008,591 | ||||||||||||
| Total | $ | 95,745,790 | $ | 6,680,360 | $ | - | $ | 102,426,150 | ||||||||
| Forward currency contracts*: | Level 1 | Level 2 | Level 3 | Total | ||||||||||||
| Unrealized appreciation on open forward currency contracts | $ | - | $ | 7,975 | $ | - | $ | 7,975 | ||||||||
| Unrealized depreciation on open forward currency contracts | - | (1,115 | ) | - | (1,115 | ) | ||||||||||
| Total | $ | - | $ | 6,860 | $ | - | $ | 6,860 | ||||||||
| *Forward currency contracts are not included in the investment portfolio. | ||||||||||||||||
| The following table reconciles the valuation of the fund's Level 3 investment securities and related transactions for the year ended March 31, 2010 (dollars in thousands): | ||||||||||||||||||||
Beginning value at 4/1/2009 | Net unrealized appreciation† | Net sales | Net realized loss† | Ending value at 3/31/2010 | ||||||||||||||||
| Investment securities | $ | 47,255 | $ | 182,489 | $ | (85,796 | ) | $ | (143,948 | ) | $ | - | ||||||||
†Net realized loss and unrealized appreciation are included in the related amounts on investments in the statement of operations. | ||||||||||||||||||||
| 4. | Risk factors |
Investing in the fund may involve certain risks including, but not limited to, those described below.
The prices of the common stocks and other securities held by the fund may decline in response to certain events taking place around the world, including those directly involving the issuers whose securities are owned by the fund; conditions affecting the general economy; overall market changes; local, regional or global political, social or economic instability; governmental or governmental agency responses to economic conditions; and currency, interest rate and commodity price fluctuations. The growth-oriented common stocks and other equity-type securities, such as preferred stocks, convertible preferred stocks and convertible bonds, generally purchased by the fund may involve large price swings and potential for loss.
Investments in securities issued by entities based outside the U.S. may also be affected by currency controls; different accounting, auditing, financial reporting, disclosure, and regulatory and legal standards and practices; expropriation; changes in tax policy; greater market volatility; different securities market structures; higher transaction costs; and various administrative difficulties, such as delays in clearing and settling portfolio transactions or in receiving payment of dividends. These risks may be heightened in connection with investments in developing countries. Investments in securities issued by entities domiciled in the U.S. may also be subject to many of these risks.
Developing countries may have less developed legal and accounting systems. The governments of these countries may be more unstable and more likely to impose capital controls, nationalize a company or industry, place restrictions on foreign ownership and on withdrawing sale proceeds of securities from the country, and/or impose punitive taxes that could adversely affect security prices. In addition, the economies of these countries may be dependent on relatively few industries that are more susceptible to local and global changes. Securities markets in these countries are also relatively small and have substantially lower trading volumes. As a result, securities issued in these countries may be more volatile and less liquid than securities issu ed in countries with more developed economies or markets.
| 5. | Taxation and distributions |
Federal income taxation – The fund complies with the requirements under Subchapter M of the Internal Revenue Code applicable to mutual funds and intends to distribute substantially all of its net taxable income and net capital gains each year. The fund is not subject to income taxes to the extent such distributions are made. Therefore, no federal income tax provision is required.
As of and during the period ended March 31, 2010, the fund did not have a liability for any unrecognized tax benefits. The fund recognizes interest and penalties, if any, related to unrecognized tax benefits as income tax expense in the statement of operations. During the period, the fund did not incur any interest or penalties.
The fund is not subject to examination by U.S. federal tax authorities for tax years before 2006, by state tax authorities for tax years before 2005 and by tax authorities outside the U.S. for tax years before 2002.
Non-U.S. taxation – Dividend and interest income is recorded net of non-U.S. taxes paid. Gains realized by the fund on the sale of securities in certain countries are subject to non-U.S. taxes. The fund records a liability based on unrealized gains to provide for potential non-U.S. taxes payable upon the sale of these securities.
Distributions – Distributions paid to shareholders are based on net investment income and net realized gains determined on a tax basis, which may differ from net investment income and net realized gains for financial reporting purposes. These differences are due primarily to different treatment for items such as currency gains and losses; short-term capital gains and losses; capital losses related to sales of certain securities within 30 days of purchase; unrealized appreciation of certain investments in securities outside the U.S.; net capital losses; and income on certain investments. The fiscal year in which amounts are distributed may differ from the year in which the net investment income and net realized gains are recorded by the fund for financial reporting purposes.
During the year ended March 31, 2010, the fund reclassified $63,981,000 from accumulated net realized loss to distributions in excess of net investment income and $659,000 from distributions in excess of net investment income to capital paid in on shares of beneficial interest to align financial reporting with tax reporting.
As of March 31, 2010, the tax basis components of distributable earnings, unrealized appreciation (depreciation) and cost of investment securities were as follows:
| (dollars in thousands) | ||||||||
Undistributed ordinary income Capital loss carryforwards*: | $ | 303,813 | ||||||
| Expiring 2017 | $ | (4,409,277 | ) | |||||
| Expiring 2018 | (8,747,831 | ) | (13,157,108 | ) | ||||
Post-October capital loss deferrals (realized during the period November 1, 2009, through March 31, 2010)† | (536,617 | ) | ||||||
| Gross unrealized appreciation on investment securities | 24,620,543 | |||||||
| Gross unrealized depreciation on investment securities | (3,109,539 | ) | ||||||
| Net unrealized appreciation on investment securities | 21,511,004 | |||||||
| Cost of investment securities | 80,915,146 | |||||||
*The capital loss carryforwards will be used to offset any capital gains realized by the fund in future years through the expiration dates. The fund will not make distributions from capital gains while capital loss carryforwards remain. †These deferrals are considered incurred in the subsequent year. | ||||||||
The tax character of distributions paid to shareholders was as follows (dollars in thousands):
| Year ended March 31, 2010 | Year ended March 31, 2009 | |||||||||||||||||||||||
| Ordinary income | Long-term capital gains | Total distributions paid | Ordinary income | Long-term capital gains | Total distributions paid | |||||||||||||||||||
| Share class | ||||||||||||||||||||||||
| Class A | $ | 649,914 | $ | - | $ | 649,914 | $ | 839,399 | $ | 1,498,388 | $ | 2,337,787 | ||||||||||||
| Class B | 9,137 | - | 9,137 | 12,697 | 43,006 | 55,703 | ||||||||||||||||||
| Class C | 29,001 | - | 29,001 | 32,384 | 107,659 | 140,043 | ||||||||||||||||||
| Class F-1 | 136,586 | - | 136,586 | 149,238 | 270,367 | 419,605 | ||||||||||||||||||
| Class F-2* | 65,004 | - | 65,004 | 17,616 | 29,790 | 47,406 | ||||||||||||||||||
| Class 529-A | 12,741 | - | 12,741 | 14,222 | 25,098 | 39,320 | ||||||||||||||||||
| Class 529-B | 872 | - | 872 | 1,086 | 3,313 | 4,399 | ||||||||||||||||||
| Class 529-C | 2,992 | - | 2,992 | 3,327 | 9,999 | 13,326 | ||||||||||||||||||
| Class 529-E | 616 | - | 616 | 674 | 1,410 | 2,084 | ||||||||||||||||||
| Class 529-F-1 | 940 | - | 940 | 1,029 | 1,653 | 2,682 | ||||||||||||||||||
| Class R-1 | 2,833 | - | 2,833 | 2,511 | 6,888 | 9,399 | ||||||||||||||||||
| Class R-2 | 13,228 | - | 13,228 | 13,440 | 40,158 | 53,598 | ||||||||||||||||||
| Class R-3 | 99,779 | - | 99,779 | 98,652 | 208,012 | 306,664 | ||||||||||||||||||
| Class R-4 | 174,016 | - | 174,016 | 204,977 | 360,608 | 565,585 | ||||||||||||||||||
| Class R-5 | 329,541 | - | 329,541 | 424,157 | 646,703 | 1,070,860 | ||||||||||||||||||
Class R-6† | 97,477 | - | 97,477 | - | - | - | ||||||||||||||||||
| Total | $ | 1,624,677 | $ | - | $ | 1,624,677 | $ | 1,815,409 | $ | 3,253,052 | $ | 5,068,461 | ||||||||||||
| *Class F-2 was offered beginning August 1, 2008. | ||||||||||||||||||||||||
†Class R-6 was offered beginning May 1, 2009. | ||||||||||||||||||||||||
| 6. | Fees and transactions with related parties |
Capital Research and Management Company ("CRMC"), the fund’s investment adviser, is the parent company of American Funds Distributors,® Inc. ("AFD"), the principal underwriter of the fund’s shares, and American Funds Service Company® ("AFS"), the fund’s transfer agent.
Investment advisory services - The Investment Advisory and Service Agreement with CRMC provides for monthly fees accrued daily. These fees are based on a series of decreasing annual rates beginning with 0.690% on the first $500 million of daily net assets and decreasing to 0.397% on such assets in excess of $115 billion. For the year ended March 31, 2010, the investment advisory services fee was $382,008,000, which was equivalent to an annualized rate of 0.426% o f average daily net assets.
Class-specific fees and expenses – Expenses that are specific to individual share classes are accrued directly to the respective share class. The principal class-specific fees and expenses are described below:
Distribution services – The fund has adopted plans of distribution for all share classes, except Classes F-2, R-5 and R-6. Under the plans, the board of trustees approves certain categories of expenses that are used to finance activities primarily intended to sell fund shares and service existing accounts. The plans provide for payments, based on an annualized percentage of average daily net assets, ranging from 0.25% to 1.00% as noted below. In some cases, the board of trustees has limited the amounts that may be paid to less than the maximum allowed by the plans. All share classes with a plan may use up to 0.25% of average daily net assets to pay service fees, or to compensate AFD for paying service fees, to firms that have entered into agreements with AFD to provide certain shareholder services. The remaining amounts available to be paid under each plan are paid to dealers to compensate them for their sales activities.
For Classes A and 529-A, the board of trustees has also approved the reimbursement of dealer and wholesaler commissions paid by AFD for certain shares sold without a sales charge. These classes reimburse AFD for amounts billed within the prior 15 months but only to the extent that the overall annual expense limit of 0.25% is not exceeded. As of March 31, 2010, there were no unreimbursed expenses subject to reimbursement for Classes A or 529-A.
| Share class | Currently approved limits | Plan limits |
| Class A | 0.25% | 0.25% |
| Class 529-A | 0.25 | 0.50 |
| Classes B and 529-B | 1.00 | 1.00 |
| Classes C, 529-C and R-1 | 1.00 | 1.00 |
| Class R-2 | 0.75 | 1.00 |
| Classes 529-E and R-3 | 0.50 | 0.75 |
| Classes F-1, 529-F-1 and R-4 | 0.25 | 0.50 |
Transfer agent services – The fund has a transfer agent agreement with AFS for Classes A and B. Under this agreement, these share classes compensate AFS for transfer agent services including shareholder recordkeeping, communications and transaction processing. AFS is also compensated for certain transfer agent services provided to all other share classes from the administrative services fees paid to CRMC as described below.
Administrative services – The fund has an administrative services agreement with CRMC to provide transfer agent and other related shareholder services for all share classes other than Classes A and B. Each relevant share class pays CRMC annual fees up to 0.15% (0.10% for Class R-5 and 0.05% for Class R-6) based on its respective average daily net assets. Each relevant share class also pays AFS additional amounts for certain transfer agent services. CRMC and AFS may use these fees to compensate third parties for performing these services. Each 529 share class is subject to an additional administrative services fee payable to the Commonwealth of Virgi nia for the maintenance of the 529 college savings plan. The quarterly fee is based on a series of decreasing annual rates beginning with 0.10% on the first $30 billion of the net assets invested in Class 529 shares of the American Funds and decreasing to 0.06% on such assets between $120 billion and $150 billion. The fee for any given calendar quarter is accrued and calculated on the basis of the average net assets of Class 529 shares of the American Funds for the last month of the prior calendar quarter. Although these amounts are included with administrative services fees on the accompanying financial statements, the Commonwealth of Virginia is not considered a related party.
Expenses under the agreements described on the previous page for the year ended March 31, 2010, were as follows (dollars in thousands):
| Share class | Distribution services | Transfer agent services | Administrative services | ||
| CRMC administrative services | Transfer agent services | Commonwealth of Virginia administrative services | |||
| Class A | $90,661 | $50,707 | Not applicable | Not applicable | Not applicable |
| Class B | 9,310 | 1,061 | Not applicable | Not applicable | Not applicable |
| Class C | 26,080 | Included in administrative services | $3,645 | $547 | Not applicable |
| Class F-1 | 17,681 | 10,308 | 963 | Not applicable | |
| Class F-2 | Not applicable | 3,443 | 122 | Not applicable | |
| Class 529-A | 1,452 | 688 | 118 | $709 | |
| Class 529-B | 848 | 83 | 31 | 85 | |
| Class 529-C | 2,690 | 263 | 85 | 271 | |
| Class 529-E | 198 | 39 | 7 | 40 | |
| Class 529-F-1 | - | 46 | 8 | 47 | |
| Class R-1 | 2,190 | 309 | 69 | Not applicable | |
| Class R-2 | 8,534 | 1,680 | 3,358 | Not applicable | |
| Class R-3 | 30,502 | 8,699 | 2,262 | Not applicable | |
| Class R-4 | 24,687 | 14,502 | 158 | Not applicable | |
| Class R-5 | Not applicable | 14,918 | 77 | Not applicable | |
| Class R-6* | Not applicable | 1,994 | 9 | Not applicable | |
| Total | $214,833 | $51,768 | $60,617 | $7,814 | $1,152 |
*Class R-6 was offered beginning May 1, 2009.
Trustees’ deferred compensation – Since the adoption of the deferred compensation plan in 1993, trustees who are unaffiliated with CRMC may elect to defer the cash payment of part or all of their compensation. These deferred amounts, which remain as liabilities of the fund, are treated as if invested in shares of the fund or other American Funds. These amounts represent general, unsecured liabilities of the fund and vary according to the total returns of the selected funds. Trustees’ compensation of $1,234,000, shown on the accompanying financial statements, includes $406,000 in current fees (either paid in cash or deferred) and a net increase of $828,000 in the value of the deferred amounts.
Affiliated officers and trustees – Officers and certain trustees of the fund are or may be considered to be affiliated with CRMC, AFS and AFD. No affiliated officers or trustees received any compensation directly from the fund.
| 7. | Capital share transactions |
Capital share transactions in the fund were as follows (dollars and shares in thousands):
| Share class | Sales* | Reinvestments of dividends and distributions | Repurchases* | Net (decrease) increase | ||||||||||||||||||||||||||||
| Amount | Shares | Amount | Shares | Amount | Shares | Amount | Shares | |||||||||||||||||||||||||
| Year ended March 31, 2010 | ||||||||||||||||||||||||||||||||
| Class A | $ | 5,235,816 | 148,668 | $ | 616,303 | 16,041 | $ | (7,450,534 | ) | (211,572 | ) | $ | (1,598,415 | ) | (46,863 | ) | ||||||||||||||||
| Class B | 44,155 | 1,285 | 8,826 | 232 | (252,522 | ) | (7,319 | ) | (199,541 | ) | (5,802 | ) | ||||||||||||||||||||
| Class C | 475,194 | 13,632 | 27,520 | 733 | (474,519 | ) | (13,843 | ) | 28,195 | 522 | ||||||||||||||||||||||
| Class F-1 | 3,369,389 | 95,683 | 119,327 | 3,121 | (2,535,792 | ) | (73,594 | ) | 952,924 | 25,210 | ||||||||||||||||||||||
| Class F-2 | 3,000,616 | 86,582 | 43,156 | 1,125 | (520,364 | ) | (14,665 | ) | 2,523,408 | 73,042 | ||||||||||||||||||||||
| Class 529-A | 129,897 | 3,663 | 12,740 | 334 | (66,591 | ) | (1,891 | ) | 76,046 | 2,106 | ||||||||||||||||||||||
| Class 529-B | 3,672 | 107 | 872 | 23 | (7,787 | ) | (223 | ) | (3,243 | ) | (93 | ) | ||||||||||||||||||||
| Class 529-C | 54,225 | 1,567 | 2,990 | 80 | (32,334 | ) | (936 | ) | 24,881 | 711 | ||||||||||||||||||||||
| Class 529-E | 7,835 | 225 | 616 | 16 | (4,271 | ) | (125 | ) | 4,180 | 116 | ||||||||||||||||||||||
| Class 529-F-1 | 13,748 | 386 | 939 | 25 | (8,176 | ) | (232 | ) | 6,511 | 179 | ||||||||||||||||||||||
| Class R-1 | 107,453 | 3,109 | 2,809 | 75 | (48,624 | ) | (1,420 | ) | 61,638 | 1,764 | ||||||||||||||||||||||
| Class R-2 | 434,030 | 12,639 | 13,224 | 353 | (328,857 | ) | (9,505 | ) | 118,397 | 3,487 | ||||||||||||||||||||||
| Class R-3 | 2,395,619 | 68,862 | 99,730 | 2,641 | (1,641,141 | ) | (46,786 | ) | 854,208 | 24,717 | ||||||||||||||||||||||
| Class R-4 | 4,587,664 | 133,758 | 173,854 | 4,600 | (4,444,695 | ) | (130,781 | ) | 316,823 | 7,577 | ||||||||||||||||||||||
| Class R-5 | 5,457,232 | 154,407 | 327,906 | 8,548 | (8,657,627 | ) | (255,131 | ) | (2,872,489 | ) | (92,176 | ) | ||||||||||||||||||||
Class R-6† | 9,048,953 | 263,880 | 97,026 | 2,525 | (2,488,108 | ) | (68,887 | ) | 6,657,871 | 197,518 | ||||||||||||||||||||||
| Total net increase | ||||||||||||||||||||||||||||||||
| (decrease) | $ | 34,365,498 | 988,453 | $ | 1,547,838 | 40,472 | $ | (28,961,942 | ) | (836,910 | ) | $ | 6,951,394 | 192,015 | ||||||||||||||||||
| *Includes exchanges between share classes of the fund. | ||||||||||||||||||||||||||||||||
†Class R-6 was offered beginning May 1, 2009. | ||||||||||||||||||||||||||||||||
| Share class | Sales* | Reinvestments of dividends and distributions | Repurchases* | Net (decrease) increase | ||||||||||||||||||||||||||||
| Amount | Shares | Amount | Shares | Amount | Shares | Amount | Shares | |||||||||||||||||||||||||
| Year ended March 31, 2009 | ||||||||||||||||||||||||||||||||
| Class A | $ | 5,512,120 | 152,504 | $ | 2,228,985 | 82,524 | $ | (12,335,632 | ) | (368,178 | ) | $ | (4,594,527 | ) | (133,150 | ) | ||||||||||||||||
| Class B | 119,052 | 3,157 | 53,779 | 2,007 | (470,214 | ) | (13,667 | ) | (297,383 | ) | (8,503 | ) | ||||||||||||||||||||
| Class C | 418,358 | 11,281 | 134,244 | 5,072 | (945,447 | ) | (29,605 | ) | (392,845 | ) | (13,252 | ) | ||||||||||||||||||||
| Class F-1 | 3,099,787 | 85,692 | 367,327 | 13,660 | (3,997,425 | ) | (122,276 | ) | (530,311 | ) | (22,924 | ) | ||||||||||||||||||||
Class F-2† | 1,334,657 | 42,777 | 32,368 | 1,199 | (346,233 | ) | (12,711 | ) | 1,020,792 | 31,265 | ||||||||||||||||||||||
| Class 529-A | 122,309 | 3,338 | 39,278 | 1,465 | (73,674 | ) | (2,324 | ) | 87,913 | 2,479 | ||||||||||||||||||||||
| Class 529-B | 10,270 | 287 | 4,398 | 166 | (8,634 | ) | (274 | ) | 6,034 | 179 | ||||||||||||||||||||||
| Class 529-C | 49,756 | 1,390 | 13,323 | 504 | (38,798 | ) | (1,224 | ) | 24,281 | 670 | ||||||||||||||||||||||
| Class 529-E | 6,980 | 201 | 2,083 | 78 | (4,727 | ) | (150 | ) | 4,336 | 129 | ||||||||||||||||||||||
| Class 529-F-1 | 10,691 | 299 | 2,680 | 100 | (6,217 | ) | (197 | ) | 7,154 | 202 | ||||||||||||||||||||||
| Class R-1 | 97,696 | 2,669 | 9,316 | 355 | (50,695 | ) | (1,509 | ) | 56,317 | 1,515 | ||||||||||||||||||||||
| Class R-2 | 398,000 | 11,679 | 53,544 | 2,028 | (362,883 | ) | (10,918 | ) | 88,661 | 2,789 | ||||||||||||||||||||||
| Class R-3 | 2,123,255 | 60,014 | 306,427 | 11,529 | (2,736,039 | ) | (74,167 | ) | (306,357 | ) | (2,624 | ) | ||||||||||||||||||||
| Class R-4 | 4,277,350 | 123,309 | 565,339 | 21,262 | (3,104,211 | ) | (94,894 | ) | 1,738,478 | 49,677 | ||||||||||||||||||||||
| Class R-5 | 6,561,360 | 180,483 | 1,065,226 | 39,511 | (3,992,868 | ) | (115,763 | ) | 3,633,718 | 104,231 | ||||||||||||||||||||||
| Total net increase | ||||||||||||||||||||||||||||||||
| (decrease) | $ | 24,141,641 | 679,080 | $ | 4,878,317 | 181,460 | $ | (28,473,697 | ) | (847,857 | ) | $ | 546,261 | 12,683 | ||||||||||||||||||
| *Includes exchanges between share classes of the fund. | ||||||||||||||||||||||||||||||||
†Class F-2 was offered beginning August 1, 2008. | ||||||||||||||||||||||||||||||||
| 8. | Investment transactions |
The fund made purchases and sales of investment securities, excluding short-term securities and U.S. government obligations, if any, of $29,094,348,000 and $20,956,450,000, respectively, during the year ended March 31, 2010.
| 9. | Forward currency contracts |
The fund may enter into forward currency contracts, which represent agreements to exchange currencies on specific future dates at predetermined rates. The fund enters into these contracts to manage its exposure to changes in exchange rates. Upon entering into these contracts, risks may arise from the potential inability of counterparties to meet the terms of their contracts and from possible movements in exchange rates.
On a daily basis, the fund values forward currency contracts based on the applicable exchange rate and records unrealized appreciation or depreciation for open forward currency contracts in the statement of assets and liabilities. The fund records realized gains or losses at the time the forward contract is closed or offset by another contract with the same broker for the same settlement date and currency. Closed forward currency contracts that have not reached their expiration date are included in the respective receivables or payables for closed forward currency contracts in the statement of assets and liabilities. Net realized gains or losses from closed forward currency contracts and net unrealized appreciation or depreciation from open fo rward currency contracts are recorded in the statement of operations. As of March 31, 2010, the fund had open forward currency contracts to sell currencies as follows (amounts in thousands):
| Contract amount | Unrealized appreciation (depreciation) at | ||||||||||||
| Settlement date | Receive | Deliver | March 31, 2010 | ||||||||||
| Sales: | |||||||||||||
| Euros | 4/26/2010 | $ | 60,000 | € | 44,289 | $ | 56 | ||||||
| Euros | 4/29/2010 | $ | 59,792 | € | 45,000 | (1,115 | ) | ||||||
| Euros | 6/17/2010 | $ | 60,000 | € | 43,911 | 566 | |||||||
| Japanese yen | 4/30/2010 | $ | 51,782 | ¥ | 4,800,000 | 370 | |||||||
| Japanese yen | 6/16/2010 | $ | 186,823 | ¥ | 16,786,080 | 6,983 | |||||||
| Forward currency contracts - net | $ | 6,860 | |||||||||||
Financial highlights(1)
Income (loss) from investment operations(2) | Dividends and distributions | |||||||||||||||||||||||||||||||||||||||||||||||||||
| Net asset value, beginning of period | Net investment income | Net gains (losses) on securities (both realized and unrealized) | Total from investment operations | Dividends (from net investment income) | Distributions (from capital gains) | Total dividends and distributions | Net asset value, end of period | Total return(3) (4) | Net assets, end of period (in millions) | Ratio of expenses to average net assets before reimbursements/ waivers | Ratio of expenses to average net assets after reimbursements/ waivers(4) | Ratio of net income to average net assets(4) | ||||||||||||||||||||||||||||||||||||||||
| Class A: | ||||||||||||||||||||||||||||||||||||||||||||||||||||
| Year ended 3/31/2010 | $ | 25.78 | $ | .51 | $ | 12.95 | $ | 13.46 | $ | (.62 | ) | $ | - | $ | (.62 | ) | $ | 38.62 | 52.23 | % | $ | 40,426 | .85 | % | .85 | % | 1.45 | % | ||||||||||||||||||||||||
| Year ended 3/31/2009 | 46.83 | .88 | (19.76 | ) | (18.88 | ) | (.78 | ) | (1.39 | ) | (2.17 | ) | 25.78 | (40.54 | ) | 28,192 | .83 | .80 | 2.40 | |||||||||||||||||||||||||||||||||
| Year ended 3/31/2008 | 47.92 | .95 | 2.60 | 3.55 | (1.01 | ) | (3.63 | ) | (4.64 | ) | 46.83 | 6.40 | 57,445 | .79 | .74 | 1.87 | ||||||||||||||||||||||||||||||||||||
| Year ended 3/31/2007 | 44.20 | .71 | 6.49 | 7.20 | (.77 | ) | (2.71 | ) | (3.48 | ) | 47.92 | 16.63 | 57,407 | .79 | .75 | 1.54 | ||||||||||||||||||||||||||||||||||||
| Year ended 3/31/2006 | 35.63 | .62 | 9.99 | 10.61 | (.72 | ) | (1.32 | ) | (2.04 | ) | 44.20 | 30.25 | 50,209 | .81 | .76 | 1.58 | ||||||||||||||||||||||||||||||||||||
| Class B: | ||||||||||||||||||||||||||||||||||||||||||||||||||||
| Year ended 3/31/2010 | 25.52 | .26 | 12.79 | 13.05 | (.36 | ) | - | (.36 | ) | 38.21 | 51.12 | 923 | 1.59 | 1.59 | .77 | |||||||||||||||||||||||||||||||||||||
| Year ended 3/31/2009 | 46.14 | .62 | (19.44 | ) | (18.82 | ) | (.41 | ) | (1.39 | ) | (1.80 | ) | 25.52 | (40.98 | ) | 765 | 1.57 | 1.54 | 1.70 | |||||||||||||||||||||||||||||||||
| Year ended 3/31/2008 | 47.31 | .56 | 2.54 | 3.10 | (.64 | ) | (3.63 | ) | (4.27 | ) | 46.14 | 5.60 | 1,775 | 1.52 | 1.48 | 1.12 | ||||||||||||||||||||||||||||||||||||
| Year ended 3/31/2007 | 43.71 | .35 | 6.42 | 6.77 | (.46 | ) | (2.71 | ) | (3.17 | ) | 47.31 | 15.78 | 1,709 | 1.54 | 1.50 | .78 | ||||||||||||||||||||||||||||||||||||
| Year ended 3/31/2006 | 35.29 | .32 | 9.88 | 10.20 | (.46 | ) | (1.32 | ) | (1.78 | ) | 43.71 | 29.32 | 1,394 | 1.55 | 1.51 | .82 | ||||||||||||||||||||||||||||||||||||
| Class C: | ||||||||||||||||||||||||||||||||||||||||||||||||||||
| Year ended 3/31/2010 | 25.21 | .22 | 12.65 | 12.87 | (.38 | ) | - | (.38 | ) | 37.70 | 51.06 | 2,901 | 1.63 | 1.63 | .66 | |||||||||||||||||||||||||||||||||||||
| Year ended 3/31/2009 | 45.64 | .58 | (19.20 | ) | (18.62 | ) | (.42 | ) | (1.39 | ) | (1.81 | ) | 25.21 | (41.00 | ) | 1,927 | 1.62 | 1.58 | 1.63 | |||||||||||||||||||||||||||||||||
| Year ended 3/31/2008 | 46.85 | .53 | 2.53 | 3.06 | (.64 | ) | (3.63 | ) | (4.27 | ) | 45.64 | 5.57 | 4,093 | 1.57 | 1.53 | 1.06 | ||||||||||||||||||||||||||||||||||||
| Year ended 3/31/2007 | 43.35 | .31 | 6.35 | 6.66 | (.45 | ) | (2.71 | ) | (3.16 | ) | 46.85 | 15.65 | 3,640 | 1.62 | 1.58 | .69 | ||||||||||||||||||||||||||||||||||||
| Year ended 3/31/2006 | 35.04 | .27 | 9.82 | 10.09 | (.46 | ) | (1.32 | ) | (1.78 | ) | 43.35 | 29.21 | 2,697 | 1.64 | 1.60 | .71 | ||||||||||||||||||||||||||||||||||||
| Class F-1: | ||||||||||||||||||||||||||||||||||||||||||||||||||||
| Year ended 3/31/2010 | 25.66 | .49 | 12.91 | 13.40 | (.63 | ) | - | (.63 | ) | 38.43 | 52.24 | 8,601 | .86 | .86 | 1.39 | |||||||||||||||||||||||||||||||||||||
| Year ended 3/31/2009 | 46.62 | .87 | (19.68 | ) | (18.81 | ) | (.76 | ) | (1.39 | ) | (2.15 | ) | 25.66 | (40.55 | ) | 5,097 | .84 | .81 | 2.38 | |||||||||||||||||||||||||||||||||
| Year ended 3/31/2008 | 47.73 | .92 | 2.60 | 3.52 | (1.00 | ) | (3.63 | ) | (4.63 | ) | 46.62 | 6.38 | 10,328 | .81 | .77 | 1.81 | ||||||||||||||||||||||||||||||||||||
| Year ended 3/31/2007 | 44.05 | .69 | 6.47 | 7.16 | (.77 | ) | (2.71 | ) | (3.48 | ) | 47.73 | 16.59 | 8,639 | .82 | .78 | 1.50 | ||||||||||||||||||||||||||||||||||||
| Year ended 3/31/2006 | 35.52 | .59 | 9.97 | 10.56 | (.71 | ) | (1.32 | ) | (2.03 | ) | 44.05 | 30.22 | 6,686 | .84 | .80 | 1.50 | ||||||||||||||||||||||||||||||||||||
| Class F-2: | ||||||||||||||||||||||||||||||||||||||||||||||||||||
| Year ended 3/31/2010 | 25.78 | .47 | 13.10 | 13.57 | (.73 | ) | - | (.73 | ) | 38.62 | 52.65 | 4,028 | .60 | .60 | 1.31 | |||||||||||||||||||||||||||||||||||||
| Period from 8/1/2008 to 3/31/2009 | 43.75 | .29 | (16.05 | ) | (15.76 | ) | (.82 | ) | (1.39 | ) | (2.21 | ) | 25.78 | (36.26 | ) | 806 | .63 | (5) | .61 | (5) | 1.59 | (5) | ||||||||||||||||||||||||||||||
| Class 529-A: | ||||||||||||||||||||||||||||||||||||||||||||||||||||
| Year ended 3/31/2010 | 25.59 | .48 | 12.86 | 13.34 | (.62 | ) | - | (.62 | ) | 38.31 | 52.14 | 826 | .89 | .89 | 1.37 | |||||||||||||||||||||||||||||||||||||
| Year ended 3/31/2009 | 46.53 | .82 | (19.59 | ) | (18.77 | ) | (.78 | ) | (1.39 | ) | (2.17 | ) | 25.59 | (40.54 | ) | 497 | .87 | .83 | 2.30 | |||||||||||||||||||||||||||||||||
| Year ended 3/31/2008 | 47.66 | .90 | 2.60 | 3.50 | (1.00 | ) | (3.63 | ) | (4.63 | ) | 46.53 | 6.34 | 789 | .83 | .79 | 1.78 | ||||||||||||||||||||||||||||||||||||
| Year ended 3/31/2007 | 44.00 | .67 | 6.48 | 7.15 | (.78 | ) | (2.71 | ) | (3.49 | ) | 47.66 | 16.59 | 601 | .83 | .79 | 1.45 | ||||||||||||||||||||||||||||||||||||
| Year ended 3/31/2006 | 35.49 | .58 | 9.97 | 10.55 | (.72 | ) | (1.32 | ) | (2.04 | ) | 44.00 | 30.21 | 387 | .85 | .80 | 1.47 | ||||||||||||||||||||||||||||||||||||
| Class 529-B: | ||||||||||||||||||||||||||||||||||||||||||||||||||||
| Year ended 3/31/2010 | 25.20 | .20 | 12.63 | 12.83 | (.35 | ) | - | (.35 | ) | 37.68 | 50.94 | 91 | 1.71 | 1.71 | .59 | |||||||||||||||||||||||||||||||||||||
| Year ended 3/31/2009 | 45.71 | .53 | (19.20 | ) | (18.67 | ) | (.45 | ) | (1.39 | ) | (1.84 | ) | 25.20 | (41.03 | ) | 63 | 1.69 | 1.65 | 1.49 | |||||||||||||||||||||||||||||||||
| Year ended 3/31/2008 | 46.93 | .48 | 2.53 | 3.01 | (.60 | ) | (3.63 | ) | (4.23 | ) | 45.71 | 5.47 | 107 | 1.66 | 1.61 | .97 | ||||||||||||||||||||||||||||||||||||
| Year ended 3/31/2007 | 43.42 | .28 | 6.37 | 6.65 | (.43 | ) | (2.71 | ) | (3.14 | ) | 46.93 | 15.60 | 90 | 1.67 | 1.63 | .63 | ||||||||||||||||||||||||||||||||||||
| Year ended 3/31/2006 | 35.09 | .25 | 9.82 | 10.07 | (.42 | ) | (1.32 | ) | (1.74 | ) | 43.42 | 29.10 | 64 | 1.71 | 1.67 | .64 | ||||||||||||||||||||||||||||||||||||
| Class 529-C: | ||||||||||||||||||||||||||||||||||||||||||||||||||||
| Year ended 3/31/2010 | 25.14 | .20 | 12.62 | 12.82 | (.38 | ) | - | (.38 | ) | 37.58 | 50.98 | 313 | 1.70 | 1.70 | .57 | |||||||||||||||||||||||||||||||||||||
| Year ended 3/31/2009 | 45.63 | .53 | (19.17 | ) | (18.64 | ) | (.46 | ) | (1.39 | ) | (1.85 | ) | 25.14 | (41.05 | ) | 191 | 1.68 | 1.65 | 1.49 | |||||||||||||||||||||||||||||||||
| Year ended 3/31/2008 | 46.87 | .48 | 2.53 | 3.01 | (.62 | ) | (3.63 | ) | (4.25 | ) | 45.63 | 5.47 | 317 | 1.65 | 1.61 | .96 | ||||||||||||||||||||||||||||||||||||
| Year ended 3/31/2007 | 43.38 | .28 | 6.37 | 6.65 | (.45 | ) | (2.71 | ) | (3.16 | ) | 46.87 | 15.62 | 248 | 1.67 | 1.63 | .62 | ||||||||||||||||||||||||||||||||||||
| Year ended 3/31/2006 | 35.08 | .24 | 9.83 | 10.07 | (.45 | ) | (1.32 | ) | (1.77 | ) | 43.38 | 29.11 | 164 | 1.70 | 1.66 | .63 | ||||||||||||||||||||||||||||||||||||
| Class 529-E: | ||||||||||||||||||||||||||||||||||||||||||||||||||||
| Year ended 3/31/2010 | 25.41 | .37 | 12.77 | 13.14 | (.53 | ) | - | (.53 | ) | 38.02 | 51.73 | 46 | 1.19 | 1.19 | 1.08 | |||||||||||||||||||||||||||||||||||||
| Year ended 3/31/2009 | 46.17 | .71 | (19.42 | ) | (18.71 | ) | (.66 | ) | (1.39 | ) | (2.05 | ) | 25.41 | (40.73 | ) | 28 | 1.17 | 1.14 | 2.00 | |||||||||||||||||||||||||||||||||
| Year ended 3/31/2008 | 47.34 | .74 | 2.57 | 3.31 | (.85 | ) | (3.63 | ) | (4.48 | ) | 46.17 | 6.00 | 45 | 1.14 | 1.10 | 1.47 | ||||||||||||||||||||||||||||||||||||
| Year ended 3/31/2007 | 43.75 | .52 | 6.43 | 6.95 | (.65 | ) | (2.71 | ) | (3.36 | ) | 47.34 | 16.21 | 36 | 1.15 | 1.11 | 1.14 | ||||||||||||||||||||||||||||||||||||
| Year ended 3/31/2006 | 35.33 | .45 | 9.91 | 10.36 | (.62 | ) | (1.32 | ) | (1.94 | ) | 43.75 | 29.77 | 24 | 1.18 | 1.13 | 1.13 | ||||||||||||||||||||||||||||||||||||
| Class 529-F-1: | ||||||||||||||||||||||||||||||||||||||||||||||||||||
| Year ended 3/31/2010 | $ | 25.57 | $ | .55 | $ | 12.86 | $ | 13.41 | $ | (.68 | ) | $ | - | $ | (.68 | ) | $ | 38.30 | 52.47 | % | $ | 56 | .69 | % | .69 | % | 1.58 | % | ||||||||||||||||||||||||
| Year ended 3/31/2009 | 46.54 | .88 | (19.60 | ) | (18.72 | ) | (.86 | ) | (1.39 | ) | (2.25 | ) | 25.57 | (40.44 | ) | 33 | .67 | .64 | 2.48 | |||||||||||||||||||||||||||||||||
| Year ended 3/31/2008 | 47.65 | .99 | 2.62 | 3.61 | (1.09 | ) | (3.63 | ) | (4.72 | ) | 46.54 | 6.55 | 51 | .64 | .60 | 1.96 | ||||||||||||||||||||||||||||||||||||
| Year ended 3/31/2007 | 43.98 | .74 | 6.49 | 7.23 | (.85 | ) | (2.71 | ) | (3.56 | ) | 47.65 | 16.79 | 39 | .65 | .61 | 1.61 | ||||||||||||||||||||||||||||||||||||
| Year ended 3/31/2006 | 35.45 | .64 | 9.96 | 10.60 | (.75 | ) | (1.32 | ) | (2.07 | ) | 43.98 | 30.39 | 23 | .70 | .66 | 1.63 | ||||||||||||||||||||||||||||||||||||
| Class R-1: | ||||||||||||||||||||||||||||||||||||||||||||||||||||
| Year ended 3/31/2010 | 25.01 | .20 | 12.57 | 12.77 | (.42 | ) | - | (.42 | ) | 37.36 | 51.08 | 279 | 1.64 | 1.64 | .59 | |||||||||||||||||||||||||||||||||||||
| Year ended 3/31/2009 | 45.45 | .54 | (19.09 | ) | (18.55 | ) | (.50 | ) | (1.39 | ) | (1.89 | ) | 25.01 | (41.01 | ) | 143 | 1.61 | 1.57 | 1.55 | |||||||||||||||||||||||||||||||||
| Year ended 3/31/2008 | 46.71 | .49 | 2.54 | 3.03 | (.66 | ) | (3.63 | ) | (4.29 | ) | 45.45 | 5.52 | 190 | 1.61 | 1.57 | .99 | ||||||||||||||||||||||||||||||||||||
| Year ended 3/31/2007 | 43.29 | .28 | 6.38 | 6.66 | (.53 | ) | (2.71 | ) | (3.24 | ) | 46.71 | 15.68 | 136 | 1.62 | 1.58 | .61 | ||||||||||||||||||||||||||||||||||||
| Year ended 3/31/2006 | 35.04 | .26 | 9.82 | 10.08 | (.51 | ) | (1.32 | ) | (1.83 | ) | 43.29 | 29.16 | 66 | 1.65 | 1.61 | .66 | ||||||||||||||||||||||||||||||||||||
| Class R-2: | ||||||||||||||||||||||||||||||||||||||||||||||||||||
| Year ended 3/31/2010 | 25.13 | .20 | 12.62 | 12.82 | (.39 | ) | - | (.39 | ) | 37.56 | 51.02 | 1,303 | 1.66 | 1.66 | .60 | |||||||||||||||||||||||||||||||||||||
| Year ended 3/31/2009 | 45.62 | .53 | (19.17 | ) | (18.64 | ) | (.46 | ) | (1.39 | ) | (1.85 | ) | 25.13 | (41.05 | ) | 784 | 1.68 | 1.64 | 1.51 | |||||||||||||||||||||||||||||||||
| Year ended 3/31/2008 | 46.84 | .50 | 2.54 | 3.04 | (.63 | ) | (3.63 | ) | (4.26 | ) | 45.62 | 5.51 | 1,296 | 1.61 | 1.57 | 1.01 | ||||||||||||||||||||||||||||||||||||
| Year ended 3/31/2007 | 43.36 | .30 | 6.35 | 6.65 | (.46 | ) | (2.71 | ) | (3.17 | ) | 46.84 | 15.66 | 1,093 | 1.67 | 1.59 | .66 | ||||||||||||||||||||||||||||||||||||
| Year ended 3/31/2006 | 35.07 | .26 | 9.83 | 10.09 | (.48 | ) | (1.32 | ) | (1.80 | ) | 43.36 | 29.20 | 735 | 1.76 | 1.60 | .68 | ||||||||||||||||||||||||||||||||||||
| Class R-3: | ||||||||||||||||||||||||||||||||||||||||||||||||||||
| Year ended 3/31/2010 | 25.35 | .38 | 12.75 | 13.13 | (.55 | ) | - | (.55 | ) | 37.93 | 51.80 | 7,131 | 1.15 | 1.15 | 1.10 | |||||||||||||||||||||||||||||||||||||
| Year ended 3/31/2009 | 46.04 | .77 | (19.41 | ) | (18.64 | ) | (.66 | ) | (1.39 | ) | (2.05 | ) | 25.35 | (40.70 | ) | 4,139 | 1.11 | 1.08 | 2.14 | |||||||||||||||||||||||||||||||||
| Year ended 3/31/2008 | 47.20 | .78 | 2.54 | 3.32 | (.85 | ) | (3.63 | ) | (4.48 | ) | 46.04 | 6.05 | 7,639 | 1.11 | 1.07 | 1.55 | ||||||||||||||||||||||||||||||||||||
| Year ended 3/31/2007 | 43.64 | .52 | 6.41 | 6.93 | (.66 | ) | (2.71 | ) | (3.37 | ) | 47.20 | 16.20 | 6,918 | 1.15 | 1.10 | 1.14 | ||||||||||||||||||||||||||||||||||||
| Year ended 3/31/2006 | 35.23 | .46 | 9.89 | 10.35 | (.62 | ) | (1.32 | ) | (1.94 | ) | 43.64 | 29.85 | 4,336 | 1.15 | 1.11 | 1.18 | ||||||||||||||||||||||||||||||||||||
| Class R-4: | ||||||||||||||||||||||||||||||||||||||||||||||||||||
| Year ended 3/31/2010 | 25.37 | .50 | 12.76 | 13.26 | (.63 | ) | - | (.63 | ) | 38.00 | 52.21 | 11,204 | .86 | .86 | 1.43 | |||||||||||||||||||||||||||||||||||||
| Year ended 3/31/2009 | 46.17 | .81 | (19.43 | ) | (18.62 | ) | (.79 | ) | (1.39 | ) | (2.18 | ) | 25.37 | (40.53 | ) | 7,290 | .85 | .82 | 2.29 | |||||||||||||||||||||||||||||||||
| Year ended 3/31/2008 | 47.31 | .88 | 2.60 | 3.48 | (.99 | ) | (3.63 | ) | (4.62 | ) | 46.17 | 6.32 | 10,970 | .85 | .81 | 1.75 | ||||||||||||||||||||||||||||||||||||
| Year ended 3/31/2007 | 43.69 | .64 | 6.45 | 7.09 | (.76 | ) | (2.71 | ) | (3.47 | ) | 47.31 | 16.61 | 8,627 | .87 | .82 | 1.41 | ||||||||||||||||||||||||||||||||||||
| Year ended 3/31/2006 | 35.25 | .57 | 9.91 | 10.48 | (.72 | ) | (1.32 | ) | (2.04 | ) | 43.69 | 30.20 | 5,352 | .87 | .83 | 1.45 | ||||||||||||||||||||||||||||||||||||
| Class R-5: | ||||||||||||||||||||||||||||||||||||||||||||||||||||
| Year ended 3/31/2010 | 25.75 | .63 | 12.93 | 13.56 | (.72 | ) | - | (.72 | ) | 38.59 | 52.70 | 16,716 | .56 | .56 | 1.80 | |||||||||||||||||||||||||||||||||||||
| Year ended 3/31/2009 | 46.86 | .93 | (19.74 | ) | (18.81 | ) | (.91 | ) | (1.39 | ) | (2.30 | ) | 25.75 | (40.37 | ) | 13,529 | .54 | .51 | 2.60 | |||||||||||||||||||||||||||||||||
| Year ended 3/31/2008 | 47.94 | 1.05 | 2.63 | 3.68 | (1.13 | ) | (3.63 | ) | (4.76 | ) | 46.86 | 6.64 | 19,731 | .55 | .50 | 2.05 | ||||||||||||||||||||||||||||||||||||
| Year ended 3/31/2007 | 44.22 | .78 | 6.53 | 7.31 | (.88 | ) | (2.71 | ) | (3.59 | ) | 47.94 | 16.91 | 14,993 | .57 | .52 | 1.70 | ||||||||||||||||||||||||||||||||||||
| Year ended 3/31/2006 | 35.64 | .69 | 10.02 | 10.71 | (.81 | ) | (1.32 | ) | (2.13 | ) | 44.22 | 30.56 | 9,059 | .58 | .53 | 1.74 | ||||||||||||||||||||||||||||||||||||
| Class R-6: | ||||||||||||||||||||||||||||||||||||||||||||||||||||
| Period from 5/1/2009 to 3/31/2010 | 28.64 | .42 | 10.30 | 10.72 | (.71 | ) | - | (.71 | ) | 38.65 | 37.43 | 7,635 | .52 | (5) | .52 | (5) | 1.26 | (5) | ||||||||||||||||||||||||||||||||||
| Year ended March 31 | ||||||||||||||||||||
| 2010 | 2009 | 2008 | 2007 | 2006 | ||||||||||||||||
| Portfolio turnover rate for all classes of shares | 26 | % | 41 | % | 38 | % | 27 | % | 35 | % | ||||||||||
(1)Based on operations for the periods shown (unless otherwise noted) and, accordingly, may not be representative of a full year. | |||||||||||||
(2)Based on average shares outstanding. | |||||||||||||
(3)Total returns exclude any applicable sales charges, including contingent deferred sales charges. | |||||||||||||
(4)This column reflects the impact, if any, of certain reimbursements/waivers from CRMC. During some of the periods shown, CRMC reduced fees for investment advisory services. In addition, during some of the periods shown, CRMC paid a portion of the fund's transfer agent fees for certain retirement plan share classes. | |||||||||||||
(5)Annualized. | |||||||||||||
| See Notes to Financial Statements | |||||||||||||
Report of Independent Registered Public Accounting Firm
To the Shareholders and Board of Trustees of EuroPacific Growth Fund:
We have audited the accompanying statement of assets and liabilities, including the summary investment portfolio, of EuroPacific Growth Fund (the “Fund”), as of March 31, 2010, and the related statement of operations for the year then ended, the statements of changes in net assets for each of the two years in the period then ended, and the financial highlights for each of the periods presented. These financial statements and financial highlights are the responsibility of the Fund’s management. Our responsibility is to express an opinion on these financial statements and financial highlights based on our audits.
We conducted our audits in accordance with the standards of the Public Company Accounting Oversight Board (United States). Those standards require that we plan and perform the audit to obtain reasonable assurance about whether the financial statements and financial highlights are free of material misstatement. The Fund is not required to have, nor were we engaged to perform, an audit of its internal control over financial reporting. Our audits included consideration of internal control over financial reporting as a basis for designing audit procedures that are appropriate in the circumstances, but not for the purpose of expressing an opinion on the effectiveness of the Fund’s internal control over financial reporting. Accordingly, we ex press no such opinion. An audit also includes examining, on a test basis, evidence supporting the amounts and disclosures in the financial statements, assessing the accounting principles used and significant estimates made by management, as well as evaluating the overall financial statement presentation. Our procedures included confirmation of securities owned as of March 31, 2010, by correspondence with the custodian and brokers; where replies were not received from brokers, we performed other auditing procedures. We believe that our audits provide a reasonable basis for our opinion.
In our opinion, the financial statements and financial highlights referred to above present fairly, in all material respects, the financial position of EuroPacific Growth Fund as of March 31, 2010, the results of its operations for the year then ended, the changes in its net assets for each of the two years in the period then ended, and the financial highlights for each of the periods presented, in conformity with accounting principles generally accepted in the United States of America.
Deloitte & Touche LLP
Costa Mesa, California
May 7, 2010
Expense example
& #160; unaudited
As a shareholder of the fund, you incur two types of costs: (1) transaction costs, such as initial sales charges on purchase payments and contingent deferred sales charges on redemptions (loads), and (2) ongoing costs, including management fees, distribution and service (12b-1) fees, and other expenses. This example is intended to help you understand your ongoing costs (in dollars) of investing in the fund so you can compare these costs with the ongoing costs of investing in other mutual funds. The example is based on an investment of $1,000 invested at the beginning of the period and held for the entire period (October 1, 2009, through March 31, 2010).
Actual expenses:
The first line of each share class in the table on the next page provides information about actual account values and actual expenses. You may use the information in this line, together with the amount you invested, to estimate the expenses that you paid over the period. Simply divide your account value by $1,000 (for example, an $8,600 account value divided by $1,000 = 8.6), then multiply the result by the number in the first line under the heading entitled "Expenses paid during period" to estimate the expenses you paid on your account during this period.
Hypothetical example for comparison purposes:
The second line of each share class in the table on the next page provides information about hypothetical account values and hypothetical expenses based on the actual expense ratio for the share class and an assumed rate of return of 5.00% per year before expenses, which is not the actual return of the share class. The hypothetical account values and expenses may not be used to estimate the actual ending account balance or expenses you paid for the period. You may use this information to compare the ongoing costs of investing in the fund and other funds. To do so, compare this 5.00% hypothetical example with the 5.00% hypothetical examples that appear in the shareholder reports of the other funds.
Notes:
There are some account fees that are charged to certain types of accounts, such as individual retirement accounts and 529 college savings plan accounts (generally, a $10 fee is charged to set up the account and an additional $10 fee is charged to the account annually), that would increase the amount of expenses paid on your account. In addition, retirement plan participants may be subject to certain fees charged by the plan sponsor, and Class F-1, F-2 and 529-F-1 shareholders may be subject to fees charged by financial intermediaries, typically ranging from 0.75% to 1.50% of assets annually depending on services offered. You can estimate the impact of these fee s by adding the amount of the fees to the total estimated expenses you paid on your account during the period as calculated above. In addition, your ending account value would be lower by the amount of these fees.
Note that the expenses shown in the table are meant to highlight your ongoing costs only and do not reflect any transactional costs, such as sales charges (loads). Therefore, the second line of each share class in the table is useful in comparing ongoing costs only and will not help you determine the relative total costs of owning different funds. In addition, if these transactional costs were included, your costs would have been higher.
| Beginning account value 10/1/2009 | Ending account value 3/31/2010 | Expenses paid during period* | Annualized expense ratio | |||||||||||||
| Class A -- actual return | $ | 1,000.00 | $ | 1,041.54 | $ | 4.22 | .83 | % | ||||||||
| Class A -- assumed 5% return | 1,000.00 | 1,020.79 | 4.18 | .83 | ||||||||||||
| Class B -- actual return | 1,000.00 | 1,037.55 | 7.98 | 1.57 | ||||||||||||
| Class B -- assumed 5% return | 1,000.00 | 1,017.10 | 7.90 | 1.57 | ||||||||||||
| Class C -- actual return | 1,000.00 | 1,037.62 | 8.18 | 1.61 | ||||||||||||
| Class C -- assumed 5% return | 1,000.00 | 1,016.90 | 8.10 | 1.61 | ||||||||||||
| Class F-1 -- actual return | 1,000.00 | 1,041.49 | 4.38 | .86 | ||||||||||||
| Class F-1 -- assumed 5% return | 1,000.00 | 1,020.64 | 4.33 | .86 | ||||||||||||
| Class F-2 -- actual return | 1,000.00 | 1,042.97 | 3.01 | .59 | ||||||||||||
| Class F-2 -- assumed 5% return | 1,000.00 | 1,021.99 | 2.97 | .59 | ||||||||||||
| Class 529-A -- actual return | 1,000.00 | 1,041.27 | 4.48 | .88 | ||||||||||||
| Class 529-A -- assumed 5% return | 1,000.00 | 1,020.54 | 4.43 | .88 | ||||||||||||
| Class 529-B -- actual return | 1,000.00 | 1,037.26 | 8.53 | 1.68 | ||||||||||||
| Class 529-B -- assumed 5% return | 1,000.00 | 1,016.55 | 8.45 | 1.68 | ||||||||||||
| Class 529-C -- actual return | 1,000.00 | 1,037.02 | 8.48 | 1.67 | ||||||||||||
| Class 529-C -- assumed 5% return | 1,000.00 | 1,016.60 | 8.40 | 1.67 | ||||||||||||
| Class 529-E -- actual return | 1,000.00 | 1,039.73 | 5.95 | 1.17 | ||||||||||||
| Class 529-E -- assumed 5% return | 1,000.00 | 1,019.10 | 5.89 | 1.17 | ||||||||||||
| Class 529-F-1 -- actual return | 1,000.00 | 1,042.45 | 3.41 | .67 | ||||||||||||
| Class 529-F-1 -- assumed 5% return | 1,000.00 | 1,021.59 | 3.38 | .67 | ||||||||||||
| Class R-1 -- actual return | 1,000.00 | 1,037.45 | 8.28 | 1.63 | ||||||||||||
| Class R-1 -- assumed 5% return | 1,000.00 | 1,016.80 | 8.20 | 1.63 | ||||||||||||
| Class R-2 -- actual return | 1,000.00 | 1,037.18 | 8.28 | 1.63 | ||||||||||||
| Class R-2 -- assumed 5% return | 1,000.00 | 1,016.80 | 8.20 | 1.63 | ||||||||||||
| Class R-3 -- actual return | 1,000.00 | 1,040.08 | 5.80 | 1.14 | ||||||||||||
| Class R-3 -- assumed 5% return | 1,000.00 | 1,019.25 | 5.74 | 1.14 | ||||||||||||
| Class R-4 -- actual return | 1,000.00 | 1,041.50 | 4.33 | .85 | ||||||||||||
| Class R-4 -- assumed 5% return | 1,000.00 | 1,020.69 | 4.28 | .85 | ||||||||||||
| Class R-5 -- actual return | 1,000.00 | 1,042.93 | 2.80 | .55 | ||||||||||||
| Class R-5 -- assumed 5% return | 1,000.00 | 1,022.19 | 2.77 | .55 | ||||||||||||
| Class R-6 -- actual return | 1,000.00 | 1,043.20 | 2.60 | .51 | ||||||||||||
| Class R-6 -- assumed 5% return | 1,000.00 | 1,022.39 | 2.57 | .51 | ||||||||||||
*The “expenses paid during period” are equal to the “annualized expense ratio,” multiplied by the average account value over the period, multiplied by the number of days in the period, and divided by 365 (to reflect the one-half year period).
Tax information
unaudited
We are required to advise you within 60 days of the fund’s fiscal year-end regarding the federal tax status of certain distributions received by shareholders during such fiscal year. The fund hereby designates the following amounts for the fund’s fiscal year ended March 31, 2010:
| Foreign taxes | $0.09 per share |
| Foreign source income | $0.84 per share |
| Qualified dividend income | 100% |
| Corporate dividends received deduction | $1,231,000 |
| U.S. government income that may be exempt from state taxation | $3,958,000 |
Individual shareholders should refer to their Form 1099 or other tax information, which will be mailed in January 2011, to determine the calendar year amounts to be included on their 2010 tax returns. Shareholders should consult their tax advisers.
Approval of Investment Advisory and Service Agreement
The fund’s board has approved the fund’s Investment Advisory and Service Agreement (the “agreement”) with Capital Research and Management Company (“CRMC”) for an additional one-year term through December 31, 2010. The board approved the agreement following the recommendation of the fund’s Governance and Contracts Committee (the “committee”), which is composed of all of the fund’s independent board members. The board and the committee determined that the fund’s advisory fee structure was fair and reasonable in relation to the services provided and that approving the agreement was in the best interests of the fund and its shareholders.
In reaching this decision, the board and the committee took into account information furnished to them throughout the year, as well as information prepared specifically in connection with their review of the agreement, and were advised by their independent counsel. They considered the factors discussed below, among others, but did not identify any single issue or particular piece of information that, in isolation, was the controlling factor.
1. Nature, extent and quality of services
The board and the committee considered the depth and quality of CRMC’s investment management process, including its global research capabilities; the experience, capability and integrity of its senior management and other personnel; the low turnover rates of its key personnel; the overall financial strength and stability of its organization; and the ongoing evolution of CRMC’s organizational structure designed to maintain and strengthen these qualities. The board and the committee considered, among other things, the impact of current market conditions on the fund and CRMC. The board and the committee also considered the nature, extent and quality of administrative, compliance and shareholder services provided by CRMC to the fund un der the agreement and other agreements, as well as the benefits to fund shareholders from investing in a fund that is part of a large family of funds. The board and the committee concluded that the nature, extent and quality of the services provided by CRMC have benefited and should continue to benefit the fund and its shareholders.
2. Investment results
The board and the committee considered the investment results of the fund in light of its objective of providing long-term growth of capital. They compared the fund’s total returns with those of other relevant funds (including the other funds that are the basis of the Lipper index for the category in which the fund is included) and market data such as relevant market indices, in each case as available at the time of the related board and committee meetings. This report, including the letter to shareholders and related disclosures, contains certain information about the fund’s investment results. The board and the committee concluded that the fund’s long-term results have been satisfactory and that CRMC’s record in manag ing the fund indicated that its continued management should benefit the fund and its shareholders.
3. Advisory fees and total expenses
The board and the committee compared the advisory fees and total expense levels of the fund to those of other relevant funds. They observed that the fund’s advisory fees and expenses remain significantly below those of most other relevant funds. The board and the committee also noted the breakpoint discounts in the fund’s advisory fee structure that reduce the level of fees charged by CRMC to the fund as fund assets increase. In addition, they reviewed information regarding the advisory fees paid by clients of an affiliate of CRMC and fees received by that affiliate for subadvising other mutual funds, in each case with investment mandates similar to those of the fund. They noted that, although the fees paid by those clients general ly were lower than those paid by the fund, the differences appropriately reflected the significant investment, operational and regulatory differences between advising the fund and the other clients or subadvising mutual funds. The board and the committee concluded that the fund’s cost structure was fair and reasonable in relation to the services provided, and that the shareholders receive reasonable value in return for the advisory fees and other amounts paid to CRMC by the fund.
4. Ancillary benefits
The board and the committee considered a variety of other benefits received by CRMC and its affiliates as a result of CRMC’s relationship with the fund and the other American Funds, including fees for administrative services provided to certain share classes; fees paid to CRMC’s affiliated transfer agent; sales charges and distribution fees received and retained by the fund’s principal underwriter, an affiliate of CRMC; and possible ancillary benefits to CRMC’s institutional management affiliates. The board and the committee reviewed CRMC’s portfolio trading practices, noting that while CRMC receives the benefit of research provided by broker-dealers executing portfolio transactions on behalf of the fund, it does not obtain third-party research or other services in return for allocating brokerage to such broker-dealers. The board and the committee took these ancillary benefits into account in evaluating the reasonableness of the advisory fees and other amounts paid to CRMC by the fund.
5. Adviser financial information
The board and the committee reviewed information regarding CRMC’s costs of providing services to the American Funds, including personnel, systems and resources of investment, compliance, trading, accounting and other administrative operations. They considered CRMC’s costs and willingness to invest in technology, infrastructure and staff to maintain and expand services and capabilities, respond to industry and regulatory developments, and attract and retain qualified personnel. They noted information previously received regarding the compensation structure for CRMC’s investment professionals. The board and the committee also compared CRMC’s profitability to the reported results of several large, publicly held investment management companies. The board and the committee noted the competitiveness and cyclicality of both the mutual fund industry and the capital markets, and the importance in that environment of CRMC’s long-term profitability for maintaining its independence, company culture and management continuity. They further considered the breakpoint discounts in the fund’s advisory fee structure and noted the termination of CRMC’s 10% advisory fee waiver effective December 31, 2008. The board and the committee concluded that the fund’s advisory fee structure reflected a reasonable sharing of benefits between CRMC and the fund’s shareholders.
Other share class results
unaudited
Classes B, C, F and 529
Fund results shown are for past periods and are not predictive of results for future periods. Current and future results may be lower or higher than those shown. Share prices and returns will vary, so investors may lose money. For current information and month-end results, visit americanfunds.com.
| Average annual total returns for periods ended March 31, 2010: | ||||||||||||
10 years1/ | ||||||||||||
| 1 year | 5 years | Life of class | ||||||||||
Class B shares2 | ||||||||||||
| Reflecting applicable contingent deferred sales charge | ||||||||||||
| (CDSC), maximum of 5%, payable only if shares | ||||||||||||
| are sold within six years of purchase | 46.12 | % | 6.81 | % | 2.72 | % | ||||||
| Not reflecting CDSC | 51.12 | 7.12 | 2.72 | |||||||||
Class C shares — first sold 3/15/01 | ||||||||||||
| Reflecting CDSC, maximum of 1%, payable only | ||||||||||||
| if shares are sold within one year of purchase | 50.06 | 7.05 | 6.52 | |||||||||
| Not reflecting CDSC | 51.06 | 7.05 | 6.52 | |||||||||
Class F-1 shares3 — first sold 3/15/01 | ||||||||||||
| Not reflecting annual asset-based fee charged | ||||||||||||
| by sponsoring firm | 52.24 | 7.89 | 7.36 | |||||||||
Class F-2 shares3 — first sold 8/1/08 | ||||||||||||
| Not reflecting annual asset-based fee charged | ||||||||||||
| by sponsoring firm | 52.65 | — | –1.63 | |||||||||
Class 529-A shares4 — first sold 2/15/02 | ||||||||||||
| Reflecting 5.75% maximum sales charge | 43.40 | 6.59 | 8.57 | |||||||||
| Not reflecting maximum sales charge | 52.14 | 7.87 | 9.36 | |||||||||
Class 529-B shares2,4 — first sold 2/19/02 | ||||||||||||
| Reflecting applicable CDSC, maximum of 5%, payable | ||||||||||||
| only if shares are sold within six years of purchase | 45.94 | 6.67 | 8.70 | |||||||||
| Not reflecting CDSC | 50.94 | 6.98 | 8.70 | |||||||||
Class 529-C shares4 — first sold 2/15/02 | ||||||||||||
| Reflecting CDSC, maximum of 1%, payable only | ||||||||||||
| if shares are sold within one year of purchase | 49.98 | 6.98 | 8.44 | |||||||||
| Not reflecting CDSC | 50.98 | 6.98 | 8.44 | |||||||||
Class 529-E shares3,4 — first sold 3/7/02 | 51.73 | 7.53 | 8.38 | |||||||||
Class 529-F-1 shares3,4 — first sold 9/16/02 | ||||||||||||
| Not reflecting annual asset-based fee charged | ||||||||||||
| by sponsoring firm | 52.47 | 8.06 | 12.25 | |||||||||
1Applicable to Class B shares only. All other share classes reflect results for the life of the class. |
2These shares are not available for purchase. |
3These shares are sold without any initial or contingent deferred sales charge. |
4Results shown do not reflect the $10 account setup fee and an annual $10 account maintenance fee. |
Investment results assume all distributions are reinvested and reflect applicable fees and expenses. The fund’s investment adviser waived a portion of its management fees from September 1, 2004, through December 31, 2008. Fund results shown reflect the waiver, without which they would have been lower. See the Financial Highlights table on pages 27 and 28 for details that include expense ratios for all share classes.
For information regarding the differences among the various share classes, refer to the fund’s prospectus.
Board of trustees and other officers
| “Independent” trustees | ||
| Year first | ||
| elected a | ||
| trustee of | ||
| Name and age | the fund1 | Principal occupation(s) during past five years |
| Elisabeth Allison, 63 | 1991 | Partner, ANZI, Ltd. (transactional work specializing in |
| joint ventures and strategic alliances); Business | ||
| negotiator, Harvard Medical School | ||
| Vanessa C.L. Chang, 57 | 2005 | Director, EL & EL Investments (real estate); former |
| President and CEO, ResolveItNow.com (insurance- | ||
| related Internet company); former Senior Vice | ||
| President, Secured Capital Corporation (real estate | ||
| investment bank); former Partner, KPMG LLP | ||
| (independent registered public accounting firm) | ||
| Nicholas Donatiello, Jr., 49 | 2008 | President and CEO, Odyssey Ventures, Inc. |
| (business strategy and marketing consulting) | ||
| Robert A. Fox, 73 | 1984 | Managing General Partner, Fox Investments LP; |
| corporate director; retired President and CEO, Foster | ||
| Farms (poultry producer) | ||
| Koichi Itoh, 69 | 1994 | Executive Chairman of the Board, Itoh Building Co., |
| Chairman of the Board | Ltd. (building management); former President, | |
| (Independent and Non-Executive) | Autosplice KK (electronics) | |
| William H. Kling, 68 | 1987 | President and CEO, American Public Media Group |
| John G. McDonald, 73 | 1984 | Stanford Investors Professor, Graduate School of |
| Business, Stanford University | ||
| William I. Miller, 54 | 1992 | Chairman of the Board, Irwin Management Company; |
| former Chairman of the Board and CEO, Irwin | ||
| Financial Corporation | ||
| Alessandro Ovi, 66 | 2002 | Publisher and Editor, Technology Review; President, |
| TechRev.srl; former Special Advisor to the Italian | ||
| Prime Minister; former Special Advisor to the | ||
| President of the European Commission | ||
| Rozanne L. Ridgway, 74 | 2005 | Director of companies; Chair (non-executive), Baltic- |
| American Enterprise Fund; Chair (non-executive), | ||
| The CNA Corp. | ||
| “Independent” trustees | ||
| Number of | ||
| portfolios | ||
| in fund | ||
complex2 | ||
| overseen by | ||
| Name and age | trustee | Other directorships3 held by trustee |
| Elisabeth Allison, 63 | 3 | Helicos BioSciences Corporation |
| Vanessa C.L. Chang, 57 | 3 | Edison International |
| Nicholas Donatiello, Jr., 49 | 3 | Dolby Laboratories, Inc. |
| Robert A. Fox, 73 | 9 | None |
| Koichi Itoh, 69 | 6 | None |
| Chairman of the Board | ||
| (Independent and Non-Executive) | ||
| William H. Kling, 68 | 9 | None |
| John G. McDonald, 73 | 12 | iStar Financial, Inc.; Plum Creek Timber Co.; |
| Quinstreet, Inc.; Scholastic Corporation; Varian, Inc. | ||
| William I. Miller, 54 | 3 | Cummins, Inc. |
| Alessandro Ovi, 66 | 3 | Enia SpA; Guala Closures SpA; Landi Renzo SpA; |
| ST Microelectronics SNV; Telecom Italia Media SpA | ||
| Rozanne L. Ridgway, 74 | 3 | Emerson Electric |
Kirk P. Pendleton retired from the board in May 2009. The directors thank Mr. Pendleton for his dedication and service to the fund.
“Interested” trustees4 | ||
| Year first | ||
| elected a | ||
| trustee or | Principal occupation(s) during past five years and | |
| Name, age and | officer of | positions held with affiliated entities or the |
| position with fund | the fund1 | principal underwriter of the fund |
| Gina H. Despres, 68 | 1999 | Senior Vice President, Capital Research and |
| Vice Chairman of the Board | Management Company; Senior Vice President, Capital Strategy Research, Inc.5 | |
| Carl M. Kawaja, 45 | 2003 | Senior Vice President — Capital World Investors, |
| President | Capital Research and Management Company; | |
| Director, Capital Research and Management | ||
Company; Director, Capital International, Inc.;5 | ||
| Director, Capital International Asset Management, | ||
Inc.5 | ||
“Interested” trustees4 | ||
| Number of | ||
| portfolios | ||
| in fund | ||
complex2 | ||
| Name, age and | overseen by | |
| position with fund | trustee | Other directorships3 held by trustee |
| Gina H. Despres, 68 | 4 | None |
| Vice Chairman of the Board | ||
| Carl M. Kawaja, 45 | 1 | None |
| President |
The fund’s statement of additional information includes additional information about fund trustees and is available without charge upon request by calling American Funds Service Company at 800/421-0180. The address for all trustees and officers of the fund is 333 South Hope Street, Los Angeles, CA 90071, Attention: Secretary.
Other officers6 | ||
| Year first | ||
| elected | Principal occupation(s) during past five years | |
| Name, age and | an officer | and positions held with affiliated entities or the |
| position with fund | of the fund1 | principal underwriter of the fund |
| Stephen E. Bepler, 67 | 1984 | Senior Vice President — Capital Research Global |
| Executive Vice President | Investors, Capital Research Company5 | |
| Mark E. Denning, 52 | 1994 | Senior Vice President — Capital Research Global |
| Executive Vice President | Investors, Capital Research Company;5 Director, | |
| Capital Research and Management Company; | ||
Director, Capital International Limited5 | ||
| Sung Lee, 43 | 2003 | Senior Vice President — Capital Research Global |
| Senior Vice President | Investors, Capital Research Company;5 Director, The | |
Capital Group Companies, Inc.5 | ||
| Robert W. Lovelace, 47 | 1996 | Senior Vice President — Capital World Investors, |
| Senior Vice President | Capital Research and Management Company; | |
| Executive Vice President and Director, Capital | ||
| Research and Management Company; Director, The | ||
Capital Group Companies, Inc.5 | ||
| Michael J. Thawley, 60 | 2008 | Senior Vice President, Capital Research and |
| Senior Vice President | Management Company; Senior Vice President, | |
Capital Strategy Research, Inc.;5 former Australian | ||
| Ambassador to the United States | ||
| Michael J. Downer, 55 | 2004 | Director, Senior Vice President, Secretary and |
| Vice President | Coordinator of Legal and Compliance — Capital | |
| Research and Management Company; Director, | ||
American Funds Distributors, Inc.;5 Chairman of the | ||
Board, Capital Bank and Trust Company5 | ||
| Nicholas J. Grace, 44 | 2004 | Senior Vice President — Capital World Investors, |
| Vice President | Capital Research Company5 | |
| Jesper Lyckeus, 42 | 2010 | Senior Vice President — Capital Research Global |
| Vice President | Investors, Capital Research Company5 | |
| Vincent P. Corti, 53 | 1984 | Vice President — Fund Business Management |
| Secretary | Group, Capital Research and Management Company | |
| Bryan K. Nielsen, 37 | 2008 | Vice President, Capital Guardian Trust Company;5 |
| Treasurer | Vice President, Capital International, Inc.5 | |
| Tanya Schneider, 37 | 2007 | Assistant Vice President — Fund Business |
| Assistant Secretary | Management Group, Capital Research and | |
| Management Company | ||
| Jennifer M. Buchheim, 36 | 2008 | Vice President — Fund Business Management |
| Assistant Treasurer | Group, Capital Research and Management Company |
1Trustees and officers of the fund serve until their resignation, removal or retirement. |
2Capital Research and Management Company manages the American Funds, consisting of 30 funds. Capital Research and Management Company also manages American Funds Insurance Series,® which is composed of 16 funds and serves as the underlying investment vehicle for certain variable insurance contracts; American Funds Target Date Retirement Series,® Inc., which is composed of 10 funds and is available through tax-deferred retirement plans and IRAs; and Endowments, which is available to certain nonprofit organizations. |
3This includes all directorships (other than those in the American Funds or other funds managed by Capital Research and Management Company) that are held by each trustee as a director of a public company or a registered investment company. |
4“Interested persons” within the meaning of the 1940 Act, as amended, on the basis of their affiliation with the fund’s investment adviser, Capital Research and Management Company, or affiliated entities (including the fund’s principal underwriter). |
5Company affiliated with Capital Research and Management Company. |
6All of the officers listed are officers and/or directors/trustees of one or more of the other funds for which Capital Research and Management Company serves as investment adviser. |
Results of meeting of shareholdersheld November 24, 2009
(adjourned session December 23, 2009)1
| Shares outstanding (all classes) on record date (August 28, 2009): | 2,551,051,207 | ||||
Total shares voting on November 24, 2009 (all proposals except to approve an Agreement and Plan of Reorganization): | 1,430,233,522 | (56.1% of shares outstanding) | |||
Total shares voting on December 23, 2009 (proposal to approve an Agreement and Plan of Reorganization only): | 1,667,008,706 | (65.3% of shares outstanding) |
Election of board members
Trustee2 | Votes for | Percent of shares voting for | Votes withheld | Percent of shares withheld | ||||||||||||
| Elisabeth Allison | 1,392,146,589 | 97.3 | % | 38,086,933 | 2.7 | % | ||||||||||
| Vanessa C.L. Chang | 1,392,063,698 | 97.3 | 38,169,824 | 2.7 | ||||||||||||
| Gina H. Despres | 1,391,787,596 | 97.3 | 38,445,926 | 2.7 | ||||||||||||
| Nicholas Donatiello, Jr. | 1,391,869,975 | 97.3 | 38,363,547 | 2.7 | ||||||||||||
| Robert A. Fox | 1,391,611,947 | 97.3 | 38,621,575 | 2.7 | ||||||||||||
| Koichi Itoh | 1,391,986,847 | 97.3 | 38,246,675 | 2.7 | ||||||||||||
| Carl M. Kawaja | 1,392,070,680 | 97.3 | 38,162,842 | 2.7 | ||||||||||||
| William H. Kling | 1,391,072,381 | 97.3 | 39,161,141 | 2.7 | ||||||||||||
| John G. McDonald | 1,385,681,490 | 96.9 | 44,552,032 | 3.1 | ||||||||||||
| William I. Miller | 1,391,935,086 | 97.3 | 38,298,436 | 2.7 | ||||||||||||
| Allesandro Ovi | 1,385,911,248 | 96.9 | 44,322,274 | 3.1 | ||||||||||||
| Votes for | Percent of outstanding | Votes against | Percent of outstanding | Votes abstaining | Percent of outstanding | |||||||||||||||||||
To approve an Agreement and Plan of Reorganization | 1,288,187,497 | 50.5 | % | 74,641,659 | 2.9 | % | 304,179,550 | 3 | 11.9 | % | ||||||||||||||
| Votes for | Percent of shares voting for | Votes against | Percent of shares voting against | Votes abstaining | Percent of shares abstaining | |||||||||||||||||||
| To update the fund’s fundamental investment policies regarding: | ||||||||||||||||||||||||
| Borrowing | 1,077,289,408 | 75.3 | % | 29,216,509 | 2.1 | % | 323,727,605 | 3 | 22.6 | % | ||||||||||||||
| Issuance of senior securities | 1,076,919,441 | 75.2 | 29,326,980 | 2.1 | 323,987,101 | 3 | 22.7 | |||||||||||||||||
| Underwriting | 1,064,517,024 | 74.4 | 41,383,017 | 2.9 | 324,333,481 | 3 | 22.7 | |||||||||||||||||
| Investments in real estate or commodities | 1,060,781,895 | 74.2 | 47,366,190 | 3.3 | 322,085,437 | 3 | 22.5 | |||||||||||||||||
| Lending | 1,069,284,800 | 74.7 | 36,873,937 | 2.6 | 324,074,785 | 3 | 22.7 | |||||||||||||||||
| Industry concentration | 1,064,683,815 | 74.4 | 43,056,219 | 3.1 | 322,493,488 | 3 | 22.5 | |||||||||||||||||
| Elimination of certain policies | 1,056,156,585 | 73.8 | 48,757,791 | 3.5 | 325,319,146 | 3 | 22.7 | |||||||||||||||||
To approve a policy allowing CRMC to appoint subsidiary advisers for the fund’s day-to-day investment management without additional shareholder approval | 1,061,310,554 | 74.2 | 43,991,035 | 3.1 | 324,931,933 | 3 | 22.7 | |||||||||||||||||
To approve amendments to the fund’s Investment Advisory and Service Agreement with CRMC | 1,064,149,711 | 74.4 | 33,538,111 | 2.3 | 332,545,700 | 3 | 23.3 | |||||||||||||||||
To approve a form of Subsidiary Agreement and appointment of one or more subsidiary advisers for the fund | 1,069,369,232 | 74.8 | 28,470,211 | 2.0 | 332,394,079 | 3 | 23.2 | |||||||||||||||||
| To consider a shareholder proposal regarding genocide-free investing | 128,083,861 | 11.3 | 948,407,814 | 83.5 | 58,714,277 | 5.2 | ||||||||||||||||||
| (broker non-votes = 295,027,570) | ||||||||||||||||||||||||
1The meeting for the proposal to approve an Agreement and Plan of Reorganization only was held on December 23, 2009. The meeting for all other proposals was held on November 24, 2009. |
2Rozanne L. Ridgway did not stand for election at the Meeting of Shareholders because she plans to retire in December 2010. |
3Includes broker non-votes. |
Offices of the fund and of the
investment adviser
Capital Research and Management Company
333 South Hope Street
Los Angeles, CA 90071-1406
6455 Irvine Center Drive
Irvine, CA 92618
Custodian of assets
JPMorgan Chase Bank
270 Park Avenue
New York, NY 10017-2070
Transfer agent for shareholder accounts
American Funds Service Company
(Write to the address near you.)
P.O. Box 6007
Indianapolis, IN 46206-6007
P.O. Box 2280
Norfolk, VA 23501-2280
Counsel
K&L Gates LLP
Four Embarcadero Center, Suite 1200
San Francisco, CA 94111-5994
Independent registered public
accounting firm
Deloitte & Touche LLP
695 Town Center Drive
Suite 1200
Costa Mesa, CA 92626-7188
Principal underwriter
American Funds Distributors, Inc.
333 South Hope Street
Los Angeles, CA 90071-1406
Investors should carefully consider the investment objectives, risks, charges and expenses of the American Funds. This and other important information is contained in the fund’s summary prospectus and prospectus, which can be obtained from your financial professional and should be read carefully before investing. You may also call American Funds Service Company (AFS) at 800/421-0180 or visit the American Funds website at americanfunds.com.
“American Funds Proxy Voting Procedures and Principles” — which describes how we vote proxies relating to portfolio securities — is available on the American Funds website or upon request by calling AFS. The fund files its proxy voting record with the U.S. Securities and Exchange Commission (SEC) for the 12 months ended June 30 by August 31. The proxy voting record is available free of charge on the SEC website at sec.gov and on the American Funds website.
A complete March 31, 2010, portfolio of EuroPacific Growth Fund’s investments is available free of charge by calling AFS or visiting the SEC website (where it is part of Form N-CSR).
EuroPacific Growth Fund files a complete list of its portfolio holdings with the SEC for the first and third quarters of each fiscal year on Form N-Q. This filing is available free of charge on the SEC website. You may also review or, for a fee, copy this filing at the SEC’s Public Reference Room in Washington, D.C. Additional information regarding the operation of the Public Reference Room may be obtained by calling the SEC’s Office of Investor Education and Advocacy at 800/SEC-0330. Additionally, the list of portfolio holdings is available by calling AFS.
This report is for the information of shareholders of EuroPacific Growth Fund, but it also may be used as sales literature when preceded or accompanied by the current summary prospectus or prospectus, which gives details about charges, expenses, investment objectives and operating policies of the fund. If used as sales material after June 30, 2010, this report must be accompanied by an American Funds statistical update for the most recently completed calendar quarter.
| | |
What makes American Funds different?
For nearly 80 years, we have followed a consistent philosophy to benefit our investors. Our 30 carefully conceived, broadly diversified funds, in addition to the target date retirement series, offer opportunities that have attracted over 50 million shareholder accounts.
Our unique combination of strengths includes these five factors:
| •A long-term, value-oriented approach |
| We seek to buy securities at reasonable prices relative to their prospects and hold them for the long term. |
| •An extensive global research effort |
| Our investment professionals travel the world to find the best investment opportunities and gain a comprehensive understanding of companies and markets. |
| •The multiple portfolio counselor system |
| Our unique approach to portfolio management, developed more than 50 years ago, blends teamwork with individual accountability and has provided American Funds with a sustainable method of achieving fund objectives. |
| •Experienced investment professionals |
| American Funds portfolio counselors have an average of 26 years of investment experience, providing a depth of knowledge and broad perspective that few organizations have. |
| •A commitment to low management fees |
| The American Funds provide exceptional value for shareholders, with management fees that are among the lowest in the mutual fund industry. |
American Funds span a range of investment objectives
| •Growth funds |
| Emphasis on long-term growth through stocks |
AMCAP Fund® |
>EuroPacific Growth Fund® |
The Growth Fund of America® |
The New Economy Fund® |
New Perspective Fund® |
New World Fund® |
SMALLCAP World Fund® |
| •Growth-and-income funds |
| Emphasis on long-term growth and dividends through stocks |
American Mutual Fund® |
Capital World Growth and Income FundSM |
Fundamental InvestorsSM |
International Growth and Income FundSM |
The Investment Company of America® |
Washington Mutual Investors FundSM |
| •Equity-income funds |
| Emphasis on above-average income and growth through stocks and/or bonds |
Capital Income Builder® |
The Income Fund of America® |
| •Balanced fund |
| Emphasis on long-term growth and current income through stocks and bonds |
American Balanced Fund® |
| •Bond funds |
| Emphasis on current income through bonds |
American High-Income TrustSM |
The Bond Fund of AmericaSM |
Capital World Bond Fund® |
Intermediate Bond Fund of America® |
Short-Term Bond Fund of AmericaSM |
U.S. Government Securities FundSM |
| •Tax-exempt bond funds |
| Emphasis on tax-exempt current income through municipal bonds |
American Funds Short-Term Tax-Exempt Bond FundSM |
American High-Income Municipal Bond Fund® |
Limited Term Tax-Exempt Bond Fund of AmericaSM |
The Tax-Exempt Bond Fund of America® |
| State-specific tax-exempt funds |
The Tax-Exempt Fund of California® |
The Tax-Exempt Fund of Maryland® |
The Tax-Exempt Fund of Virginia® |
| •Money market fund |
American Funds Money Market Fund® |
•American Funds Target Date Retirement Series® |
The Capital Group Companies
American Funds Capital Research and Management Capital International Capital Guardian Capital Bank and Trust
Lit. No. MFGEAR-916-0510P
Litho in USA BG/Q/8055-S20667
Printed on paper containing 10% post-consumer waste
Printed with inks containing soy and/or vegetable oil
ITEM 2 – Code of Ethics
The Registrant has adopted a Code of Ethics that applies to its Principal Executive Officer and Principal Financial Officer. The Registrant undertakes to provide to any person without charge, upon request, a copy of the Code of Ethics. Such request can be made to American Funds Service Company at 800/421-0180 or to the Secretary of the Registrant, 333 South Hope Street, Los Angeles, California 90071.
ITEM 3 – Audit Committee Financial Expert
The Registrant’s board has determined that Vanessa C. L. Chang, a member of the Registrant’s audit committee, is an “audit committee financial expert” and "independent," as such terms are defined in this Item. This designation will not increase the designee’s duties, obligations or liability as compared to his or her duties, obligations and liability as a member of the audit committee and of the board, nor will it reduce the responsibility of the other audit committee members. There may be other individuals who, through education or experience, would qualify as "audit committee financial experts" if the board had designated them as such. Most importantly, the board believes each member of the audit committee contributes significantly to the effective oversight of the Registrant’s financia l statements and condition.
ITEM 4 – Principal Accountant Fees and Services
| Registrant: | ||||
| a) Audit Fees: | ||||
| 2009 | $106,000 | |||
| 2010 | $111,000 | |||
| b) Audit-Related Fees: | ||||
| 2009 | $31,000 | |||
| 2010 | $29,000 | |||
| The audit-related fees consist of assurance and related services relating to the examination of the Registrant’s investment adviser conducted in accordance with Statement on Auditing Standards Number 70 issued by the American Institute of Certified Public Accountants. | ||||
| c) Tax Fees: | ||||
| 2009 | $27,000 | |||
| 2010 | $26,000 | |||
| The tax fees consist of professional services relating to the preparation of the Registrant’s tax returns including returns relating to the Registrant’s investments in non-U.S. jurisdictions. | ||||
| d) All Other Fees: | ||||
| 2009 | None | |||
| 2010 | None | |||
| Adviser and affiliates (includes only fees for non-audit services billed to the adviser and affiliates for engagements that relate directly to the operations and financial reporting of the Registrant and were subject to the pre-approval policies described below): | ||||
| a) Audit Fees: | ||||
| Not Applicable | ||||
| b) Audit-Related Fees: | ||||
| 2009 | $924,000 | |||
| 2010 | $1,010,000 | |||
| The audit-related fees consist of assurance and related services relating to the examination of the Registrant’s transfer agent, principal underwriter and investment adviser conducted in accordance with Statement on Auditing Standards Number 70 issued by the American Institute of Certified Public Accountants. | ||||
| c) Tax Fees: | ||||
| 2009 | $6,000 | |||
| 2010 | $6,000 | |||
| The tax fees consist of consulting services relating to the Registrant’s investments. | ||||
| d) All Other Fees: | ||||
| 2009 | $2,000 | |||
| 2010 | $2,000 | |||
| The other fees consist of subscription services related to an accounting research tool. | ||||
All audit and permissible non-audit services that the Registrant’s audit committee considers compatible with maintaining the independent registered public accounting firm’s independence are required to be pre-approved by the committee. The pre-approval requirement will extend to all non-audit services provided to the Registrant, the investment adviser, and any entity controlling, controlled by, or under common control with the investment adviser that provides ongoing services to the Registrant, if the engagement relates directly to the operations and financial reporting of the Registrant. The committee will not delegate its responsibility to pre-approve these services to the investment adviser. The committee may delegate to one or more committee members the authority to review and pre-approve audit and permissible non-audi t services. Actions taken under any such delegation will be reported to the full committee at its next meeting. The pre-approval requirement is waived with respect to non-audit services if certain conditions are met. The pre-approval requirement was not waived for any of the non-audit services listed above provided to the Registrant, adviser and affiliates.
Aggregate non-audit fees paid to the Registrant’s auditors, including fees for all services billed to the Registrant, adviser and affiliates that provide ongoing services to the Registrant, were $1,266,000 for fiscal year 2009 and $1,502,000 for fiscal year 2010. The non-audit services represented by these amounts were brought to the attention of the committee and considered to be compatible with maintaining the auditors’ independence.
ITEM 5 – Audit Committee of Listed Registrants
Not applicable to this Registrant, insofar as the Registrant is not a listed issuer as defined in Rule 10A-3 under the Securities Exchange Act of 1934.
ITEM 6 – Schedule of Investments
EuroPacific Growth Fund®
Investment portfolio
March 31, 2010
| Common stocks — 93.72% | Shares | Value (000) | ||||||
| FINANCIALS — 19.48% | ||||||||
| Banco Santander, SA | 96,355,254 | $ | 1,283,017 | |||||
| Barclays PLC | 200,644,707 | 1,097,831 | ||||||
Barclays PLC1 | 6,192,900 | 33,885 | ||||||
UBS AG2 | 62,434,976 | 1,017,916 | ||||||
| Prudential PLC | 119,635,824 | 994,692 | ||||||
| Industrial and Commercial Bank of China Ltd., Class H | 1,139,854,000 | 869,131 | ||||||
| Société Générale | 13,111,355 | 826,170 | ||||||
| Housing Development Finance Corp. Ltd. | 12,702,073 | 770,060 | ||||||
| Deutsche Bank AG | 9,193,504 | 709,490 | ||||||
| Banco Bradesco SA, preferred nominative | 35,653,805 | 657,176 | ||||||
| Itaú Unibanco Holding SA, preferred nominative | 17,739,630 | 388,786 | ||||||
| Itaú Unibanco Holding SA, preferred nominative (ADR) | 11,638,203 | 255,924 | ||||||
| Bank of China Ltd., Class H | 1,181,106,000 | 629,801 | ||||||
| AXA SA | 26,896,837 | 599,455 | ||||||
| Erste Bank der oesterreichischen Sparkassen AG | 11,943,297 | 502,628 | ||||||
| BNP Paribas SA | 6,442,835 | 495,731 | ||||||
| Credit Suisse Group AG | 9,490,327 | 490,630 | ||||||
| Fairfax Financial Holdings Ltd. | 774,114 | 290,324 | ||||||
| Fairfax Financial Holdings Ltd. (CAD denominated) | 500,000 | 188,110 | ||||||
| Nomura Holdings, Inc. | 61,989,800 | 457,487 | ||||||
| Sumitomo Mitsui Financial Group, Inc. | 12,546,000 | 415,244 | ||||||
| China Life Insurance Co. Ltd., Class H | 79,530,000 | 381,056 | ||||||
| Türkiye Garanti Bankasi AS | 80,820,000 | 378,087 | ||||||
| DLF Ltd. | 53,500,000 | 368,723 | ||||||
UniCredit SpA2 | 123,743,849 | 366,297 | ||||||
| HSBC Holdings PLC (Hong Kong) | 28,198,493 | 287,288 | ||||||
| HSBC Holdings PLC (United Kingdom) | 5,670,000 | 57,518 | ||||||
| PT Bank Central Asia Tbk | 550,000,000 | 332,966 | ||||||
| Sampo Oyj, Class A | 12,442,515 | 330,683 | ||||||
Royal Bank of Scotland Group PLC2 | 494,096,205 | 330,147 | ||||||
| Australia and New Zealand Banking Group Ltd. | 13,862,600 | 322,517 | ||||||
| Bank of Nova Scotia | 6,420,000 | 321,791 | ||||||
| HDFC Bank Ltd. | 6,786,258 | 292,754 | ||||||
| Sun Hung Kai Properties Ltd. | 18,466,000 | 277,798 | ||||||
DnB NOR ASA2 | 21,556,767 | 246,760 | ||||||
Sberbank (Savings Bank of the Russian Federation) (GDR)3 | 825,935 | 244,487 | ||||||
| State Bank of India | 4,906,336 | 227,495 | ||||||
| Hana Financial Holdings | 7,069,370 | 219,043 | ||||||
| China Construction Bank Corp., Class H | 238,800,000 | 195,617 | ||||||
| Ping An Insurance (Group) Co. of China, Ltd., Class H | 22,295,000 | 192,109 | ||||||
| Ayala Land, Inc. | 631,283,600 | 181,966 | ||||||
| Toronto-Dominion Bank | 2,065,000 | 153,995 | ||||||
| Banco do Brasil SA, ordinary nominative | 8,424,100 | 141,309 | ||||||
| Woori Finance Holdings Co., Ltd. | 9,351,530 | 137,231 | ||||||
| Swire Pacific Ltd., Class A | 10,270,000 | 123,547 | ||||||
| PartnerRe Holdings Ltd. | 1,395,000 | 111,209 | ||||||
Topdanmark A/S2 | 673,550 | 87,932 | ||||||
| QBE Insurance Group Ltd. | 4,540,000 | 86,757 | ||||||
| Macquarie Group Ltd. | 1,996,000 | 86,521 | ||||||
Lloyds Banking Group PLC2 | 87,359,895 | 83,274 | ||||||
ING Groep NV, depository receipts2 | 8,000,000 | 80,023 | ||||||
| Allianz SE | 626,500 | 78,699 | ||||||
| Daito Trust Construction Co., Ltd. | 1,315,000 | 63,524 | ||||||
| Shinhan Financial Group Co., Ltd. | 1,562,620 | 61,402 | ||||||
National Bank of Greece SA2 | 2,787,634 | 56,206 | ||||||
| Singapore Exchange Ltd. | 6,000,000 | 32,826 | ||||||
| Kerry Properties Ltd. | 4,420,730 | 23,715 | ||||||
| Grupo Financiero Banorte, SAB de CV, Series O | 2,364,100 | 10,437 | ||||||
| TrygVesta A/S | 156,404 | 10,346 | ||||||
| 19,957,543 | ||||||||
| HEALTH CARE — 10.53% | ||||||||
| Bayer AG | 29,735,750 | 2,015,140 | ||||||
| Novartis AG | 34,611,325 | 1,874,931 | ||||||
| Novo Nordisk A/S, Class B | 22,139,400 | 1,721,703 | ||||||
| Roche Holding AG | 10,065,636 | 1,637,234 | ||||||
| Teva Pharmaceutical Industries Ltd. (ADR) | 17,536,100 | 1,106,177 | ||||||
| CSL Ltd. | 19,767,862 | 660,659 | ||||||
UCB SA4 | 10,749,931 | 459,897 | ||||||
| Smith & Nephew PLC | 41,212,800 | 410,875 | ||||||
| Merck KGaA | 2,913,558 | 236,558 | ||||||
| Richter Gedeon NYRT | 849,000 | 184,094 | ||||||
| Shionogi & Co., Ltd. | 8,535,300 | 162,551 | ||||||
| Essilor International | 1,882,000 | 120,384 | ||||||
| Terumo Corp. | 2,175,000 | 116,019 | ||||||
| Lonza Group Ltd. | 1,047,012 | 85,649 | ||||||
| 10,791,871 | ||||||||
| CONSUMER STAPLES — 10.02% | ||||||||
| Anheuser-Busch InBev NV | 41,213,464 | 2,079,944 | ||||||
Anheuser-Busch InBev NV, VVPR STRIPS2 | 10,093,238 | 96 | ||||||
| Nestlé SA | 23,552,000 | 1,209,748 | ||||||
| Pernod Ricard SA | 10,705,051 | 910,740 | ||||||
| Tesco PLC | 127,197,773 | 841,126 | ||||||
| Danone SA | 12,511,168 | 755,083 | ||||||
| British American Tobacco PLC | 21,589,999 | 744,747 | ||||||
| L'Oréal SA | 4,688,600 | 493,992 | ||||||
| METRO AG | 5,793,269 | 344,309 | ||||||
| Unilever NV, depository receipts | 11,221,000 | 340,051 | ||||||
| Wal-Mart de México, SAB de CV, Series V | 64,835,718 | 331,089 | ||||||
| Koninklijke Ahold NV | 24,513,000 | 327,398 | ||||||
| SABMiller PLC | 9,683,000 | 284,093 | ||||||
| Beiersdorf AG | 3,887,000 | 232,934 | ||||||
| Asahi Breweries, Ltd. | 9,386,700 | 176,252 | ||||||
| Woolworths Ltd. | 6,090,626 | 156,451 | ||||||
| Shoprite Holdings Ltd. | 15,400,000 | 153,989 | ||||||
| Coca-Cola Amatil Ltd. | 13,964,067 | 144,120 | ||||||
| Wilmar International Ltd. | 28,384,000 | 136,003 | ||||||
| Coca-Cola Hellenic Bottling Co. SA | 4,598,562 | 124,207 | ||||||
| Heineken NV | 2,114,100 | 108,854 | ||||||
| Shoppers Drug Mart Corp. | 2,325,000 | 99,954 | ||||||
| Diageo PLC | 5,500,000 | 92,376 | ||||||
| Unilever PLC | 2,526,750 | 74,248 | ||||||
| Wesfarmers Ltd. | 1,872,650 | 54,614 | ||||||
| Foster's Group Ltd. | 11,028,000 | 53,519 | ||||||
| 10,269,937 | ||||||||
| INFORMATION TECHNOLOGY — 9.12% | ||||||||
| SAP AG | 24,000,795 | 1,164,657 | ||||||
| SAP AG (ADR) | 4,117,500 | 198,340 | ||||||
| Samsung Electronics Co. Ltd. | 1,665,659 | 1,204,481 | ||||||
| Samsung Electronics Co. Ltd., nonvoting preferred | 48,800 | 23,209 | ||||||
| Canon, Inc. | 20,576,700 | 954,339 | ||||||
HOYA CORP.4 | 23,734,700 | 653,111 | ||||||
| Taiwan Semiconductor Manufacturing Co. Ltd. | 295,735,170 | 573,202 | ||||||
| Taiwan Semiconductor Manufacturing Co. Ltd. (ADR) | 5,822,723 | 61,080 | ||||||
| Telefonaktiebolaget LM Ericsson, Class B | 57,255,964 | 605,744 | ||||||
| MediaTek Inc. | 30,536,986 | 530,283 | ||||||
| Nintendo Co., Ltd. | 1,083,400 | 363,222 | ||||||
| Murata Manufacturing Co., Ltd. | 6,381,900 | 362,981 | ||||||
| Nippon Electric Glass Co., Ltd. | 20,400,000 | 287,776 | ||||||
| HTC Corp. | 23,818,155 | 278,492 | ||||||
Hirose Electric Co., Ltd.4 | 2,402,500 | 277,409 | ||||||
| Nokia Corp. | 16,133,844 | 251,727 | ||||||
| Advanced Semiconductor Engineering, Inc. | 273,700,000 | 250,151 | ||||||
| Acer Inc. | 60,547,830 | 178,991 | ||||||
| Konica Minolta Holdings, Inc. | 14,585,000 | 170,440 | ||||||
| Redecard SA, ordinary nominative | 6,510,000 | 120,359 | ||||||
| Tokyo Electron Ltd. | 1,750,000 | 116,217 | ||||||
| Delta Electronics, Inc. | 36,386,563 | 115,249 | ||||||
| Rohm Co., Ltd. | 1,459,900 | 109,148 | ||||||
Autonomy Corp. PLC2 | 3,825,000 | 105,892 | ||||||
| ASML Holding NV | 2,699,126 | 96,644 | ||||||
| Ibiden Co., Ltd. | 2,695,200 | 92,958 | ||||||
| Hon Hai Precision Industry Co., Ltd. | 21,000,000 | 91,002 | ||||||
| Infosys Technologies Ltd. | 686,800 | 40,086 | ||||||
| Keyence Corp. | 145,000 | 34,697 | ||||||
| Tencent Holdings Ltd. | 1,700,000 | 34,114 | ||||||
| 9,346,001 | ||||||||
| CONSUMER DISCRETIONARY — 8.93% | ||||||||
| Honda Motor Co., Ltd. | 29,109,250 | 1,028,926 | ||||||
| Daimler AG | 17,128,778 | 807,892 | ||||||
| Daimler AG (New York registered) | 250,000 | 11,753 | ||||||
| Industria de Diseño Textil, SA | 10,683,042 | 705,539 | ||||||
| Toyota Motor Corp. | 14,438,300 | 579,171 | ||||||
| adidas AG | 9,823,000 | 526,382 | ||||||
| British Sky Broadcasting Group PLC | 53,512,805 | 489,213 | ||||||
| H & M Hennes & Mauritz AB, Class B | 6,101,000 | 397,878 | ||||||
| OPAP SA | 15,901,490 | 361,501 | ||||||
Nissan Motor Co., Ltd.2 | 33,972,800 | 291,476 | ||||||
| Cie. Générale des Établissements Michelin, Class B | 3,882,894 | 286,676 | ||||||
Peugeot SA2 | 9,361,900 | 276,174 | ||||||
| Yamada Denki Co., Ltd. | 3,442,150 | 254,401 | ||||||
| Sony Corp. | 6,450,000 | 247,333 | ||||||
| Mediaset SpA | 27,444,198 | 236,194 | ||||||
| Swatch Group Ltd, non-registered shares | 588,900 | 188,327 | ||||||
| Swatch Group Ltd | 646,484 | 38,557 | ||||||
Fiat SpA2 | 17,054,900 | 222,479 | ||||||
Renault SA2 | 4,677,765 | 219,649 | ||||||
| LG Electronics Inc. | 2,068,274 | 210,265 | ||||||
| Hyundai Motor Co. | 1,764,390 | 180,151 | ||||||
| Nikon Corp. | 8,220,000 | 179,702 | ||||||
| Porsche Automobil Holding SE, nonvoting preferred | 2,310,403 | 141,268 | ||||||
| Naspers Ltd., Class N | 3,146,908 | 136,992 | ||||||
| Hero Honda Motors Ltd. | 2,625,000 | 113,879 | ||||||
| Li & Fung Ltd. | 21,738,000 | 106,954 | ||||||
| Carnival PLC | 2,500,000 | 102,695 | ||||||
| LVMH Moët Hennessey-Louis Vuitton SA | 850,000 | 99,540 | ||||||
JCDecaux SA2 | 3,528,700 | 98,796 | ||||||
| Esprit Holdings Ltd. | 12,424,422 | 98,016 | ||||||
| Crown Ltd. | 12,550,000 | 94,179 | ||||||
| Suzuki Motor Corp. | 3,946,333 | 87,203 | ||||||
| Grupo Televisa, SAB de CV, ordinary participation certificates (ADR) | 4,000,000 | 84,080 | ||||||
| Marks and Spencer Group PLC | 13,900,000 | 78,123 | ||||||
Techtronic Industries Co. Ltd.4 | 86,710,000 | 70,360 | ||||||
| Belle International Holdings Ltd. | 26,700,000 | 35,903 | ||||||
| Kingfisher PLC | 9,259,650 | 30,148 | ||||||
DSG international PLC2 | 43,448,571 | 23,060 | ||||||
Carphone Warehouse Group PLC2 | 6,115,000 | 14,812 | ||||||
| 9,155,647 | ||||||||
| MATERIALS — 8.73% | ||||||||
Xstrata PLC2 | 56,660,053 | 1,074,259 | ||||||
| ArcelorMittal | 17,758,136 | 780,745 | ||||||
| Linde AG | 5,178,200 | 619,011 | ||||||
| Impala Platinum Holdings Ltd. | 19,110,488 | 562,498 | ||||||
| Syngenta AG | 1,974,315 | 549,871 | ||||||
Holcim Ltd2 | 7,314,544 | 546,869 | ||||||
| Shin-Etsu Chemical Co., Ltd. | 8,490,000 | 493,795 | ||||||
| Potash Corp. of Saskatchewan Inc. | 3,778,000 | 450,904 | ||||||
| POSCO | 957,890 | 447,106 | ||||||
| BHP Billiton PLC | 10,790,000 | 370,317 | ||||||
| CRH PLC | 13,315,101 | 333,153 | ||||||
| Vale SA, ordinary nominative (ADR) | 8,000,000 | 257,520 | ||||||
| JFE Holdings, Inc. | 5,730,000 | 231,078 | ||||||
| Rio Tinto PLC | 3,858,875 | 228,836 | ||||||
| BASF SE | 3,610,000 | 224,322 | ||||||
| Barrick Gold Corp. | 5,574,000 | 213,707 | ||||||
| Akzo Nobel NV | 3,607,000 | 205,953 | ||||||
| Orica Ltd. | 6,100,000 | 149,921 | ||||||
| First Quantum Minerals Ltd. | 1,740,000 | 143,249 | ||||||
| L'Air Liquide SA, non-registered shares | 1,186,000 | 142,643 | ||||||
| UltraTech Cement Ltd. | 5,021,432 | 129,384 | ||||||
| Nitto Denko Corp. | 2,971,400 | 115,533 | ||||||
| K+S AG | 1,838,000 | 111,749 | ||||||
| Rio Tinto Ltd. | 1,509,750 | 108,587 | ||||||
Anglo American PLC2 | 1,615,000 | 70,848 | ||||||
| Titan Cement Co. SA | 2,658,000 | 70,497 | ||||||
| Israel Chemicals Ltd. | 4,900,000 | 66,342 | ||||||
| Kumba Iron Ore Ltd. | 1,205,516 | 58,514 | ||||||
| BHP Billiton Ltd. | 1,360,000 | 54,386 | ||||||
CEMEX, SAB de CV, ordinary participation certificates, units (ADR)2 | 4,719,526 | 48,186 | ||||||
| Givaudan SA | 45,332 | 39,886 | ||||||
| Koninklijke DSM NV | 515,979 | 23,052 | ||||||
Rhodia SA2 | 945,833 | 19,634 | ||||||
| 8,942,355 | ||||||||
| TELECOMMUNICATION SERVICES — 8.63% | ||||||||
| América Móvil, SAB de CV, Series L (ADR) | 50,366,501 | 2,535,450 | ||||||
| América Móvil, SAB de CV, Series L | 74,020,000 | 186,420 | ||||||
| Telefónica, SA | 55,730,000 | 1,322,759 | ||||||
| SOFTBANK CORP. | 32,506,000 | 801,856 | ||||||
| Koninklijke KPN NV | 40,348,800 | 640,458 | ||||||
| MTN Group Ltd. | 33,224,200 | 511,809 | ||||||
| China Telecom Corp. Ltd., Class H | 577,442,000 | 284,854 | ||||||
| OJSC Mobile TeleSystems (ADR) | 4,789,800 | 265,834 | ||||||
| Bharti Airtel Ltd. | 37,560,000 | 261,923 | ||||||
| Telekom Austria AG, non-registered shares | 16,601,203 | 232,510 | ||||||
| Vodafone Group PLC | 94,944,919 | 219,159 | ||||||
| Telmex Internacional, SAB de CV, Class L (ADR) | 10,717,400 | 206,631 | ||||||
| China Mobile Ltd. | 19,730,000 | 189,829 | ||||||
| Portugal Telecom, SGPS, SA | 15,795,000 | 176,932 | ||||||
| Iliad SA | 1,611,000 | 166,443 | ||||||
| Philippine Long Distance Telephone Co. | 3,040,460 | 163,147 | ||||||
| Singapore Telecommunications Ltd. | 69,650,824 | 157,901 | ||||||
| Teléfonos de México, SAB de CV, Class L (ADR) | 9,701,700 | 151,347 | ||||||
| Perusahaan Perseroan (Persero) PT Telekomunikasi Indonesia Tbk, Class B | 157,269,200 | 139,352 | ||||||
| KDDI Corp. | 19,900 | 103,166 | ||||||
Orascom Telecom Holding SAE (GDR)3 | 10,542,105 | 53,976 | ||||||
| Orascom Telecom Holding SAE (GDR) | 2,151,450 | 11,015 | ||||||
| Telekomunikacja Polska SA | 10,001,227 | 56,864 | ||||||
| 8,839,635 | ||||||||
| ENERGY — 7.01% | ||||||||
| OAO Gazprom (ADR) | 49,942,000 | 1,165,147 | ||||||
| Petróleo Brasileiro SA – Petrobras, ordinary nominative (ADR) | 16,506,340 | 734,367 | ||||||
| Petróleo Brasileiro SA – Petrobras, preferred nominative (ADR) | 7,050,860 | 279,143 | ||||||
| Reliance Industries Ltd. | 29,630,000 | 710,175 | ||||||
| Royal Dutch Shell PLC, Class B | 13,930,000 | 384,053 | ||||||
| Royal Dutch Shell PLC, Class A | 3,195,000 | 92,587 | ||||||
| Royal Dutch Shell PLC, Class B (ADR) | 1,292,999 | 71,542 | ||||||
| Royal Dutch Shell PLC, Class A (ADR) | 1,000,000 | 57,860 | ||||||
| Canadian Natural Resources, Ltd. | 7,031,300 | 520,680 | ||||||
| Suncor Energy Inc. (CAD denominated) | 10,444,000 | 339,834 | ||||||
| Suncor Energy Inc. | 1,695,000 | 55,155 | ||||||
| China National Offshore Oil Corp. | 215,288,100 | 354,377 | ||||||
| Saipem SpA, Class S | 7,966,566 | 308,857 | ||||||
| Eni SpA | 12,857,000 | 302,205 | ||||||
| TOTAL SA | 4,968,000 | 288,941 | ||||||
| JSC KazMunaiGas Exploration Production (GDR) | 6,300,000 | 155,421 | ||||||
| Nexen Inc. | 6,170,323 | 152,754 | ||||||
| Sasol Ltd. | 3,518,000 | 146,483 | ||||||
| Cameco Corp. | 4,882,000 | 133,816 | ||||||
| SeaDrill Ltd. | 5,500,446 | 128,431 | ||||||
| BP PLC | 13,325,498 | 126,152 | ||||||
| Statoil ASA | 4,828,320 | 112,004 | ||||||
| Oil Search Ltd. | 18,840,206 | 103,013 | ||||||
| Woodside Petroleum Ltd. | 2,107,964 | 90,697 | ||||||
Cairn India Ltd.2 | 12,812,190 | 87,373 | ||||||
| Acergy SA | 3,910,000 | 71,652 | ||||||
| OAO LUKOIL (ADR) | 1,189,000 | 67,416 | ||||||
| OGX Petróleo e Gás Participações SA, ordinary nominative | 6,560,000 | 61,379 | ||||||
| Tenaris SA (ADR) | 1,040,000 | 44,658 | ||||||
| BG Group PLC | 2,185,000 | 37,843 | ||||||
| 7,184,015 | ||||||||
| INDUSTRIALS — 6.05% | ||||||||
| Siemens AG | 6,787,900 | 681,096 | ||||||
Ryanair Holdings PLC (ADR)2 | 19,373,900 | 526,389 | ||||||
| Schneider Electric SA | 3,725,563 | 437,798 | ||||||
| Capita Group PLC | 31,129,005 | 357,617 | ||||||
| FANUC LTD | 2,635,000 | 279,983 | ||||||
| BAE Systems PLC | 47,590,000 | 268,339 | ||||||
| AB Volvo, Class B | 25,000,000 | 252,499 | ||||||
| Asahi Glass Co., Ltd. | 21,615,000 | 243,794 | ||||||
| Alstom SA | 3,721,000 | 232,478 | ||||||
| Orkla AS | 25,491,400 | 225,833 | ||||||
| Geberit AG | 1,187,000 | 213,057 | ||||||
| G4S PLC | 52,637,466 | 209,031 | ||||||
| Scania AB, Class B | 12,546,800 | 199,197 | ||||||
| Scania AB, Class A | 449,780 | 7,078 | ||||||
| Legrand SA | 6,482,000 | 205,164 | ||||||
ABB Ltd2 | 9,150,000 | 200,442 | ||||||
Air France2 | 12,008,000 | 190,197 | ||||||
| Komatsu Ltd. | 9,050,000 | 189,996 | ||||||
| Vallourec SA | 937,000 | 189,305 | ||||||
Vestas Wind Systems A/S2 | 3,312,668 | 180,396 | ||||||
Wolseley PLC2 | 6,057,291 | 146,442 | ||||||
Qantas Airways Ltd.2 | 44,991,477 | 117,222 | ||||||
| Beijing Enterprises Holdings Ltd. | 15,000,000 | 104,231 | ||||||
British Airways PLC2 | 26,738,000 | 98,669 | ||||||
| Mitsubishi Corp. | 3,300,000 | 86,600 | ||||||
| Deutsche Lufthansa AG | 5,000,000 | 83,086 | ||||||
| VINCI SA | 1,240,833 | 73,267 | ||||||
| Sandvik AB | 4,394,000 | 55,130 | ||||||
| Metso Oyj | 1,250,000 | 40,444 | ||||||
| Finmeccanica SpA | 3,023,000 | 40,416 | ||||||
| SMC Corp. | 242,000 | 32,894 | ||||||
| KONE Oyj, Class B | 775,000 | 32,091 | ||||||
| 6,200,181 | ||||||||
| UTILITIES — 2.65% | ||||||||
| GDF SUEZ | 14,851,539 | 574,777 | ||||||
| E.ON AG | 7,505,000 | 277,608 | ||||||
| Hongkong Electric Holdings Ltd. | 43,010,000 | 255,102 | ||||||
| Electricité de France SA | 4,080,906 | 223,100 | ||||||
| Hong Kong and China Gas Co. Ltd. | 89,197,250 | 222,419 | ||||||
| SUEZ Environnement Co. | 8,921,425 | 205,715 | ||||||
| Fortum Oyj | 8,308,112 | 203,602 | ||||||
| RWE AG | 2,100,000 | 186,417 | ||||||
| Veolia Environnement | 5,226,164 | 181,610 | ||||||
| Red Eléctrica de Corporación, SA | 2,917,000 | 156,845 | ||||||
| AGL Energy Ltd. | 5,000,000 | 68,943 | ||||||
| China Resources Power Holdings Co. Ltd. | 22,110,000 | 47,330 | ||||||
| Cheung Kong Infrastructure Holdings Ltd. | 10,689,000 | 41,371 | ||||||
| Iberdrola Renovables, SA Unipersonal | 9,012,162 | 37,500 | ||||||
| Gas Natural SDG, SA | 1,985,000 | 36,719 | ||||||
| 2,719,058 | ||||||||
| MISCELLANEOUS — 2.57% | ||||||||
| Other common stocks in initial period of acquisition | 2,638,010 | |||||||
| Total common stocks (cost: $74,002,319,000) | 96,044,253 | |||||||
| Preferred stocks — 0.04% | Shares | |||||||
| FINANCIALS — 0.04% | ||||||||
SMFG Preferred Capital USD 3 Ltd. 9.50%1,5 | 31,375,000 | 35,611 | ||||||
| Total preferred stocks (cost: $28,674,000) | 35,611 | |||||||
| Principal amount | ||||||||
| Bonds & notes — 0.33% | (000 | ) | ||||||
| CONSUMER DISCRETIONARY — 0.10% | ||||||||
| DaimlerChrysler North America Holding Corp. 4.875% 2010 | $ | 4,250 | 4,281 | |||||
| DaimlerChrysler North America Holding Corp., Series E, 5.75% 2011 | 11,620 | 12,252 | ||||||
| DaimlerChrysler North America Holding Corp. 7.75% 2011 | 8,080 | 8,502 | ||||||
| DaimlerChrysler North America Holding Corp. 7.30% 2012 | 17,648 | 19,225 | ||||||
| DaimlerChrysler North America Holding Corp. 6.50% 2013 | 52,910 | 58,706 | ||||||
| 102,966 | ||||||||
| ENERGY — 0.07% | ||||||||
| Gaz Capital SA 7.343% 2013 | 1,900 | 2,073 | ||||||
| Gaz Capital SA 8.146% 2018 | 35,280 | 39,955 | ||||||
Gazprom International SA 7.201% 20206 | 19,397 | 20,635 | ||||||
| Open Joint Stock Co. Gazprom, Series 2, 8.625% 2034 | 5,875 | 6,874 | ||||||
| Gaz Capital SA 7.288% 2037 | 6,300 | 6,339 | ||||||
| 75,876 | ||||||||
| CONSUMER STAPLES — 0.07% | ||||||||
British American Tobacco International Finance PLC 9.50% 20181 | 54,775 | 71,046 | ||||||
| FINANCIALS — 0.05% | ||||||||
Westfield Group 7.125% 20181 | 42,735 | 46,304 | ||||||
| BONDS & NOTES OF GOVERNMENTS OUTSIDE THE U.S. — 0.04% | ||||||||
| Brazil (Federal Republic of) 10.00% 2012 | BRL50,000 | 27,396 | ||||||
| Brazil (Federal Republic of) Global 11.00% 2040 | $ | 10,500 | 14,107 | |||||
| 41,503 | ||||||||
| Total bonds & notes (cost: $254,073,000) | 337,695 | |||||||
| Short-term securities — 5.86% | ||||||||
| Freddie Mac 0.12%–0.435% due 4/6/2010–1/10/2011 | 2,486,060 | 2,485,097 | ||||||
| Fannie Mae 0.15%–0.43% due 4/7/2010–1/18/2011 | 1,001,400 | 1,000,465 | ||||||
| U.S. Treasury Bills 0.117%–0.40% due 4/29–10/21/2010 | 458,000 | 457,722 | ||||||
| International Bank for Reconstruction and Development 0.12%–0.19% due 4/20–7/9/2010 | 267,100 | 267,023 | ||||||
| Federal Home Loan Bank 0.09%–0.18% due 4/23–5/19/2010 | 244,881 | 244,851 | ||||||
| General Electric Capital Services, Inc. 0.20%–0.23% due 5/12–5/24/2010 | 160,000 | 159,955 | ||||||
Straight-A Funding LLC 0.17%–0.19% due 4/5–5/21/20101 | 135,000 | 134,985 | ||||||
| Bank of Nova Scotia 0.07%–0.17% due 4/1–4/12/2010 | 126,000 | 125,999 | ||||||
Jupiter Securitization Co., LLC 0.19%–0.20% due 4/19–5/19/20101 | 65,000 | 64,990 | ||||||
Park Avenue Receivables Co., LLC 0.18% due 5/17/20101 | 36,000 | 35,992 | ||||||
| BNP Paribas Finance Inc. 0.18%–0.215% due 4/13–6/22/2010 | 100,600 | 100,570 | ||||||
Coca-Cola Co. 0.17% due 5/13/20101 | 100,000 | 99,982 | ||||||
| Barclays U.S. Funding Corp. 0.07% due 4/1/2010 | 98,550 | 98,550 | ||||||
| Province of Ontario 0.13%–0.14% due 4/8–4/12/2010 | 85,000 | 84,996 | ||||||
| Export Development Canada 0.20% due 4/8–7/14/2010 | 85,000 | 84,973 | ||||||
Old Line Funding, LLC 0.18%–0.19% due 4/20–5/10/20101 | 80,000 | 79,984 | ||||||
Australia & New Zealand Banking Group, Ltd. 0.19% due 5/17/20101 | 65,200 | 65,184 | ||||||
| Credit Agricole North America, Inc. 0.205%–0.22% due 4/7–5/20/2010 | 60,400 | 60,389 | ||||||
| Rabobank USA Financial Corp. 0.19%–0.20% due 4/6–6/8/2010 | 58,200 | 58,189 | ||||||
KfW 0.19% due 6/4/20101 | 50,000 | 49,986 | ||||||
BNZ International Funding Ltd. 0.195% due 5/18/20101 | 42,700 | 42,689 | ||||||
GDF SUEZ 0.17%–0.195% due 4/8–4/22/20101 | 39,000 | 38,996 | ||||||
Nestlé Capital Corp. 0.31% due 9/14/20101 | 36,500 | 36,458 | ||||||
Société de Prise de Participation de l'Etat 0.24% due 5/24/20101 | 31,500 | 31,490 | ||||||
Electricité de France 0.17% due 5/26/20101 | 29,100 | 29,089 | ||||||
| Canada Bill 0.26% due 4/8/2010 | 25,000 | 24,999 | ||||||
| Federal Farm Credit Banks 0.23% due 8/23/2010 | 25,000 | 24,977 | ||||||
Barton Capital LLC 0.19% due 4/19/20101 | 20,013 | 20,011 | ||||||
| Total short-term securities (cost: $6,008,158,000) | 6,008,591 | |||||||
| Total investment securities (cost: $80,293,224,000) | 102,426,150 | |||||||
| Other assets less liabilities | 53,245 | |||||||
| Net assets | $ | 102,479,395 | ||||||
"Miscellaneous" securities include holdings in their initial period of acquisition that have not previously been publicly disclosed.
1Purchased in a transaction exempt from registration under the Securities Act of 1933. May be resold in the U.S. in transactions exempt from registration, normally to qualified institutional buyers. The total value of all such securities was $916,682,000, which represented .89% of the net assets of the fund.
2Security did not produce income during the last 12 months.
3Valued under fair value procedures adopted by authority of the board of trustees. The total value of all such securities was $298,463,000, which represented.29% of the net assets of the fund.
4Represents an affiliated company as defined under the Investment Company Act of 1940.
5Coupon rate may change periodically.
6Principal payments may be made periodically. Therefore, the effective maturity date may be earlier than the stated maturity date.
| Key to abbreviations | |
| ADR = American Depositary Receipts | BRL = Brazilian reais |
| GDR = Global Depositary Receipts | CAD = Canadian dollars |
Investments are not FDIC-insured, nor are they deposits of or guaranteed by a bank or any other entity, so you may lose money.
Investors should carefully consider the investment objectives, risks, charges and expenses of the American Funds. This and other important information is contained in the fund’s summary prospectus and prospectus, which can be obtained from your financial professional and should be read carefully before investing. You may also call American Funds Service Company (AFS) at 800/421-0180 or visit the American Funds website at americanfunds.com.
MFGEFP-916-0510O-S21516
REPORT OF INDEPENDENT REGISTERED PUBLIC ACCOUNTING FIRM ON INVESTMENT PORTFOLIO
To the Shareholders and Board of Trustees of
EuroPacific Growth Fund:
We have audited, in accordance with the standards of the Public Company Accounting Oversight Board (United States), the financial statements of EuroPacific Growth Fund (the “Fund”) as of March 31, 2010, and for the year then ended and have issued our report thereon dated May 7, 2010, which report and financial statements are included in Item 1 of this Certified Shareholder Report on Form N-CSR. Our audit also included the Fund’s investment portfolio (the “Schedule”) as of March 31, 2010, appearing in Item 6 of this Form N-CSR. This Schedule is the responsibility of the Fund’s management. Our responsibility is to express an opinion based on our audit. In our opinion, the Schedule referred to above, when considered in relation to the basic financial statements taken as a whole of the Fund referred to above, presents fairly, in all material respects, the information set forth therein.
DELOITTE & TOUCHE LLP
Costa Mesa, California
May 7, 2010
ITEM 7 – Disclosure of Proxy Voting Policies and Procedures for Closed-End Management Investment Companies
Not applicable to this Registrant, insofar as the Registrant is not a closed-end management investment company.
ITEM 8 – Portfolio Managers of Closed-End Management Investment Companies
Not applicable to this Registrant, insofar as the Registrant is not a closed-end management investment company.
ITEM 9 – Purchases of Equity Securities by Closed-End Management Investment Company and Affiliated Purchasers
Not applicable to this Registrant, insofar as the Registrant is not a closed-end management investment company.
ITEM 10 – Submission of Matters to a Vote of Security Holders
There have been no material changes to the procedures by which shareholders may recommend nominees to the Registrant’s board of trustees since the Registrant last submitted a proxy statement to its shareholders. The procedures are as follows. The Registrant has a nominating committee comprised solely of persons who are not considered ‘‘interested persons’’ of the Registrant within the meaning of the Investment Company Act of 1940, as amended. The committee periodically reviews such issues as the board’s composition, responsibilities, committees, compensation and other relevant issues, and recommends any appropriate changes to the full board of trustees. While the committee normally is able to identify from its own resources an ample number of qualified candidates, it will consider shareho lder suggestions of persons to be considered as nominees to fill future vacancies on the board. Such suggestions must be sent in writing to the nominating committee of the Registrant, c/o the Registrant’s Secretary, and must be accompanied by complete biographical and occupational data on the prospective nominee, along with a written consent of the prospective nominee for consideration of his or her name by the nominating committee.
ITEM 11 – Controls and Procedures
| (a) | The Registrant’s Principal Executive Officer and Principal Financial Officer have concluded, based on their evaluation of the Registrant’s disclosure controls and procedures (as such term is defined in Rule 30a-3 under the Investment Company Act of 1940), that such controls and procedures are adequate and reasonably designed to achieve the purposes described in paragraph (c) of such rule. |
| (b) | There were no changes in the Registrant’s internal controls over financial reporting (as defined in Rule 30a-3(d) under the Investment Company Act of 1940) that occurred during the Registrant’s second fiscal quarter of the period covered by this report that has materially affected, or is reasonably likely to materially affect, the Registrant’s internal control over financial reporting. |
ITEM 12 – Exhibits
| (a)(1) | The Code of Ethics that is the subject of the disclosure required by Item 2 is attached as an exhibit hereto. |
| (a)(2) | The certifications required by Rule 30a-2 of the Investment Company Act of 1940 and Sections 302 and 906 of the Sarbanes-Oxley Act of 2002 are attached as exhibits hereto. |
SIGNATURES
Pursuant to the requirements of the Securities Exchange Act of 1934 and the Investment Company Act of 1940, the Registrant has duly caused this report to be signed on its behalf by the undersigned, thereunto duly authorized.
| EUROPACIFIC GROWTH FUND | |
By /s/ Gina H. Despres | |
Gina H. Despres, Vice Chairman and Principal Executive Officer | |
| Date: May 28, 2010 |
Pursuant to the requirements of the Securities Exchange Act of 1934 and the Investment Company Act of 1940, this report has been signed below by the following persons on behalf of the Registrant and in the capacities and on the dates indicated.
By /s/ Gina H. Despres |
Gina H. Despres, Vice Chairman and Principal Executive Officer |
| Date: May 28, 2010 |
By /s/ Bryan K. Nielsen |
Bryan K. Nielsen, Treasurer and Principal Financial Officer |
| Date: May 28, 2010 |