UNITED STATES
SECURITIES AND EXCHANGE COMMISSION
Washington, D.C. 20549
FORM N-CSR
Certified Shareholder Report of
Registered Management Investment Companies
Investment Company Act File Number: 811-03734
EuroPacific Growth Fund
(Exact Name of Registrant as Specified in Charter)
333 South Hope Street
Los Angeles, California 90071
(Address of Principal Executive Offices)
Registrant's telephone number, including area code: (213) 486-9200
Date of fiscal year end: March 31
Date of reporting period: March 31, 2015
Michael W. Stockton
EuroPacific Growth Fund
333 South Hope Street
Los Angeles, California 90071
(Name and Address of Agent for Service)
Copies to:
Mark D. Perlow
K&L Gates LLP
Four Embarcadero Center, Suite 1200
San Francisco, California 94111
(Counsel for the Registrant)
ITEM 1 – Reports to Stockholders
![]()
A rising middle
class fuels growth in
emerging markets.
Special feature page 6
 | EuroPacific Growth Fund®
Annual report |
EuroPacific Growth Fund seeks to provide long-term growth of capital.
This fund is one of more than 40 offered by one of the nation’s largest mutual fund families, American Funds, from Capital Group. For more than 80 years, Capital has invested with a long-term focus based on thorough research and attention to risk.
Fund results shown in this report, unless otherwise indicated, are for Class A shares at net asset value. If a sales charge (maximum 5.75%) had been deducted, the results would have been lower. Results are for past periods and are not predictive of results for future periods. Current and future results may be lower or higher than those shown. Share prices and returns will vary, so investors may lose money. Investing for short periods makes losses more likely. Investments are not FDIC-insured, nor are they deposits of or guaranteed by a bank or any other entity, so they may lose value. For current information and month-end results, visit americanfunds.com.
See page 4 for Class A share results with relevant sales charges deducted. For other share class results, visit americanfunds.com and americanfundsretirement.com.
Investment results assume all distributions are reinvested and reflect applicable fees and expenses. When applicable, investment results reflect fee waivers, without which results would have been lower. Visit americanfunds.com for more information.
Investing outside the United States may be subject to risks, such as currency fluctuations, periods of illiquidity and price volatility. These risks may be heightened in connection with investments in developing countries. Refer to the fund prospectus and the Risk Factors section of this report for more information on these and other risks associated with investing in the fund.

Special feature
International markets declined during the fiscal year ended March 31, 2015, amid investor concerns about the slowing pace of worldwide economic growth — most notably in Europe. Market volatility was exacerbated by geopolitical conflicts in the Middle East and Ukraine as well as lower commodity prices. Meanwhile, Japan rebounded amid a weaker yen as the country exited recession and continued implementing economic reforms.
Despite many of these macroeconomic headwinds, EuroPacific Growth Fund realized a return of 2.48% for the period, compared with –1.01% for the MSCI ACWI (All Country World Index) ex USA, which reflects the returns of more than 40 developed and developing country stock markets. Likewise, the fund finished ahead of the Lipper International Funds Average, a peer group measure, which was down –1.19%. Lipper averages reflect the current composition of all eligible mutual funds (all share classes) within a given category. As shown in the table below, the fund has outpaced both measures over longer time periods.
The market environment
European stocks struggled amid ongoing concerns about the region’s weak economic recovery, mounting deflationary pressures and a rapidly depreciating euro. These conditions prompted the European Central Bank (ECB) to reduce its primary lending rate by 10 basis points to 0.05%. The ECB also cut its overnight bank deposit rate to –0.20% in an effort to encourage commercial banks to lend their surplus funds to other financial institutions. Despite these measures, officials in a number of large euro-zone countries did not appear to pursue reforms quickly or vigorously enough to help their struggling economies.
Fears that Europe might fall into another recession were heightened by stagnant economic growth and high unemployment. Seeking to reverse these trends, the ECB announced that it would begin purchasing bonds and expand its balance sheet to as much as €3 trillion in an attempt to encourage lending and stimulate economic activity. Despite Germany’s opposition to large-scale U.S.-style quantitative easing (QE), the €60-billion-a-month bond-buying initiative started on March 9. European equity and bond markets responded positively, even amid renewed fears that Greece might default on its debt and exit the euro zone after the election of a left-wing anti-austerity party in January.
Results at a glance
For periods ended March 31, 2015, with all distributions reinvested
| Cumulative | Average annual total returns | |||||||||||||||
| total returns | Lifetime | |||||||||||||||
| 1 year | 5 years | 10 years | (since 4/16/84) | |||||||||||||
| EuroPacific Growth Fund (Class A shares) | 2.48 | % | 6.75 | % | 7.33 | % | 11.30 | % | ||||||||
| MSCI ACWI ex USA1,2 | –1.01 | 4.82 | 5.46 | — | ||||||||||||
| MSCI EAFE Index1,3 | –0.92 | 6.16 | 4.95 | 8.70 | ||||||||||||
| Lipper International Funds Average | –1.19 | 5.82 | 5.01 | 8.99 | ||||||||||||
| 1 | The market indexes are unmanaged and, therefore, have no expenses. Investors cannot invest directly in an index. |
| 2 | The index did not exist prior to December 31, 1987. Results reflect dividends net of withholding taxes. |
| 3 | This was the fund’s primary benchmark until the fiscal year ended March 31, 2007. Results reflect dividends net of withholding taxes. |
| EuroPacific Growth Fund | 1 |
Where the fund’s assets are invested
(percent invested by country of domicile)
EuroPacific Growth Fund invests primarily in the stocks of companies domiciled in Europe and the Pacific Basin.1
| EuroPacific Growth Fund | MSCI ACWI ex USA2 | |||||||||||
| Europe | (3 /31/15) | (3 /31/14) | (3/31/15) | |||||||||
| Euro zone3 | 23.4 | % | 25.9 | % | 22.1 | % | ||||||
| United Kingdom | 11.6 | 12.3 | 14.2 | |||||||||
| Switzerland | 5.3 | 6.2 | 6.6 | |||||||||
| Denmark | 4.6 | 5.4 | 1.2 | |||||||||
| Sweden | 1.3 | 1.4 | 2.2 | |||||||||
| Russia | .6 | 1.2 | .8 | |||||||||
| Other Europe | .1 | .4 | 1.2 | |||||||||
| 46.9 | 52.8 | 48.3 | ||||||||||
| Pacific Basin | ||||||||||||
| Japan | 12.4 | % | 12.1 | % | 15.9 | % | ||||||
| Hong Kong | 4.9 | 4.5 | 2.3 | |||||||||
| China | 4.7 | 4.7 | 5.0 | |||||||||
| Canada | 2.5 | 2.3 | 6.8 | |||||||||
| South Korea | 2.4 | 3.9 | 3.2 | |||||||||
| Taiwan | 1.6 | 1.4 | 2.8 | |||||||||
| Australia | .6 | 1.0 | 5.2 | |||||||||
| Other Pacific Basin | 3.5 | 2.4 | 4.8 | |||||||||
| 32.6 | 32.3 | 46.0 | ||||||||||
| Other | ||||||||||||
| India | 7.5 | % | 5.1 | % | 1.6 | % | ||||||
| South Africa | 1.1 | 1.4 | 1.7 | |||||||||
| Brazil | .5 | .2 | 1.6 | |||||||||
| Israel | .1 | .7 | .4 | |||||||||
| Other countries | .2 | .1 | .4 | |||||||||
| 9.4 | 7.5 | 5.7 | ||||||||||
| Short-term securities & other assets less liabilities | 11.1 | 7.4 | — | |||||||||
| Total | 100.0 | % | 100.0 | % | 100.0 | % | ||||||
| 1 | A country is considered part of the Pacific Basin if any of its borders touches the Pacific Ocean. |
| 2 | Weighted by market capitalization. |
| 3 | Countries using the euro as a common currency: Austria, Belgium, Cyprus, Estonia, Finland, France, Germany, Greece, Ireland, Italy, Latvia, Lithuania, Luxembourg, Malta, the Netherlands, Portugal, Slovakia, Slovenia and Spain. |
After struggling at the start of the fiscal year, Japanese equities regained their footing and delivered strong gains. The yen depreciated in the second half of 2014, helping exporters, even as the economy continued to struggle in the wake of April’s sales tax increase. Weak economic data raised fears that it would be difficult for Japan to achieve its 2.0% inflation target, prompting Prime Minister Shinzo Abe to call for a snap election in December and postpone another sales tax increase by 18 months. The Bank of Japan also surprised market observers in October by announcing it would significantly expand its QE program.
Emerging markets remained volatile amid concerns about the completion of QE in the U.S., rising geopolitical risks and weak commodity prices. Russia faced its worst economic crisis since 1998, with the ruble tumbling as investors worried about the impact of lower oil prices as well as economic sanctions following its annexation of Crimea. To help stem the currency’s fall, the country’s central bank raised its key interest rate to 17% in December, but reduced it to 14% by March. It remains to be seen just how severely the crisis in Ukraine will affect Russia’s relationship with the West, but a sustainable settlement will likely be difficult and could take years.
In Brazil — another commodity exporter —stocks declined amid deteriorating economic and political conditions as well as the sharp depreciation of the real. Shares of Brazilian oil producer Petrobras sank as the company twice delayed its earnings report amid allegations of a corruption scandal involving political kickbacks to President Dilma Rousseff’s supporters. She was narrowly re-elected in October, dampening investor hopes for reform. Brazil’s central bank continued to increase interest rates to a six-year high of 12.75% in an effort to help rein in inflation.
| 2 | EuroPacific Growth Fund |
Most Asian markets gained, fueled by reform momentum and expectations that oil-importing countries might benefit from lower prices. Chinese stocks rose despite concerns about slowing economic growth. Investors seemed to take heart from targeted stimulus measures and indications of looser policies from China’s central bank, which surprised markets by cutting interest rates in November for the first time in more than two years, followed by another cut in February. Meanwhile, the much-anticipated Shanghai-Hong Kong Stock Connect launched last year, making a number of domestic companies available to foreign investors.
Several other Asian markets rebounded amid signs of political change and hopes for reform. Indian equities were fueled by optimism surrounding business-friendly Prime Minister Narendra Modi’s election in May. The central bank provided a further boost, cutting interest rates twice in the first quarter of 2015. Stocks in Indonesia also advanced, with Joko Widodo winning the presidential election there last July. Despite the numerous challenges they face, we are confident that both Modi and Widodo will lead their countries in the right direction.
Inside the portfolio
The fund’s investments in the health care and information technology sectors contributed to returns. Shares of pharmaceutical firms Novo Nordisk, Bayer and Novartis all posted gains and remain three of the fund’s largest holdings. Novo Nordisk continues to provide strong results due to its long-term prospects in the diabetes market. The company received U.S. regulatory approval for the use of a higher dose version of its diabetes drug Victoza to treat obesity and also resubmitted its long-acting insulin Tresiba for approval.
Bayer and Novartis benefited from mergers-and-acquisitions activity, with both companies adding to their portfolio of products.
Among the fund’s technology holdings, Chinese Internet giant Baidu recorded strong gains, helped by growth of its mobile platforms in areas such as online chat and video applications. However, shares weakened late in the period amid disappointing earnings. Japan’s Murata Manufacturing benefited from robust sales of LTE phones in China as well as the launch of the iPhone 6, for which it provides components. Shares of Nintendo jumped after the company announced that it would partner with a small mobile gaming firm to develop video games for smartphones.
Investments in the consumer discretionary sector were mixed. Shares of rapidly growing cable and telecom firm Altice rose sharply following a flurry of deal-making in France. Elsewhere, casino operator Sands China struggled amid a broader slowdown in the Macau gaming sector. With China’s anti-corruption campaign continuing, both the luxury and mass-market segments have declined.
Telecommunication services firm SoftBank experienced a drop in quarterly profits due to slowing customer growth and an accounting charge related to its stake in Chinese e-commerce company Alibaba, which went public in the U.S. The Japanese company also was hurt by the collapse of a proposed merger between its U.S. wireless unit Sprint and T-Mobile US. However, we continue to believe that SoftBank will benefit from its stakes in Alibaba and Sprint over the long term.
Looking ahead
While the global economic picture continues to improve moderately, the outlook remains mixed. Even with additional monetary stimulus, the European economy is unlikely to experience significant improvements in growth or inflation. Despite the efforts of the ECB to support lending, the availability and demand for credit diminished. In Japan, economic reforms should help sustain the recovery in the face of the recent sales tax increase. Although geopolitical troubles, lower commodity prices and a potential increase in U.S. interest rates could challenge some developing economies, rising consumer demand should continue to provide long-term investment opportunities in companies with exposure to emerging markets (see related feature starting on page 6).
The fund’s portfolio managers continue to find attractively valued, well-managed companies experiencing growing consumer and business demand. They also have focused on businesses that stand to benefit from technological innovations in areas such as health care and e-commerce. We continue to research and identify new investment opportunities in these areas while also intensifying our analysis of existing holdings. We thank you, our fellow investors, for your continued support of EuroPacific Growth Fund.
Sincerely,

Carl Kawaja
President
May 8, 2015
For current information about the fund, visit americanfunds.com.
| EuroPacific Growth Fund | 3 |
The value of a long-term perspective
Fund results shown are for Class A shares and reflect deduction of the maximum sales charge of 5.75% on the $10,000 investment.1 Thus, the net amount invested was $9,425.2 Results are for past periods and are not predictive of results for future periods. Current and future results may be lower or higher than those shown. Share prices and returns will vary, so investors may lose money. For current information and month-end results, visit americanfunds.com.
The results shown are before taxes on fund distributions and sale of fund shares.
| 1 | As outlined in the prospectus, the sales charge is reduced for accounts (and aggregated investments) of $25,000 or more and is eliminated for purchases of $1 million or more. There is no sales charge on dividends or capital gain distributions that are reinvested in additional shares. |
| 2 | The maximum initial sales charge was 8.5% prior to July 1, 1988. |
| 3 | For the period April 16, 1984, commencement of operations, through March 31, 1985. |
| 4 | Includes reinvested dividends of $46,952 and reinvested capital gain distributions of $70,634. |
| 5 | The index is unmanaged and, therefore, has no expenses. Investors cannot invest directly in an index. |
| 6 | From April 16, 1984, through December 31, 1987, the MSCI EAFE (Europe, Australasia, Far East) Index was used because the MSCI ACWI (All Country World Index) ex USA did not yet exist. Since January 1, 1988, the MSCI ACWI ex USA has been used. The MSCI EAFE Index reflects dividends net of withholding taxes. The MSCI ACWI ex USA reflects dividends gross of withholding taxes through December 31, 2000, and dividends net of withholding taxes thereafter. |
| 7 | Computed from data supplied by the U.S. Department of Labor, Bureau of Labor Statistics. |

| 4 | EuroPacific Growth Fund |
How a $10,000 investment has grown
While notable for their volatility in recent years, financial markets have tended to reward investors over the long term. Active management — bolstered by experience and careful research — can add even more value. As the chart shows, over its lifetime, EuroPacific Growth Fund has done demonstrably better than its relevant benchmark.

| EuroPacific Growth Fund | 5 |
Emerging markets provide attractive opportunities despite recent headwinds.
The weak returns of emerging markets over the past few years, especially as they compare to their developed market peers, have caused many investors to wonder whether or not now is the best time to invest in the developing world. But in today’s globalized markets, it is nearly impossible for investors to avoid emerging markets.
Many European and Japanese companies derive a significant amount of their revenue from the developing world, and it is often the fastest growing segment of their business. Companies in developed nations now generate nearly a third of their revenue from emerging markets — similar to the percentage generated from developed Europe and Asia combined. This is also true of the companies held in EuroPacific Growth Fund (see related chart on page 9).
Despite some near-term headwinds, such as higher interest rates in the U.S. and lower commodity prices globally, the fund’s investment professionals are still finding many attractive companies domiciled in emerging markets as well as those generating a significant amount of revenues there. Given emerging markets’ long-term growth prospects, investment opportunities are abundant — but an active, bottom-up approach is critical when company-specific factors are increasingly driving investor returns.
“There have been some fantastic investments in emerging markets over the last five years despite the asset class as a whole being challenged, and now with valuations lower there are quite a few attractive opportunities,” says London-based portfolio manager Nick Grace, who adds that he prefers not to think of emerging markets as a separate “asset class” from developed markets.
Carl Kawaja, a San Francisco-based portfolio manager and president of EuroPacific Growth Fund, says he too remains optimistic. “I am encouraged that after several years of lackluster returns, some emerging markets are showing signs of life again. Many investors had begun to ignore emerging markets, so it has been helpful to the fund that they are coming back.”
Rising consumer class in Asia
One area that many portfolio managers continue to find appealing is Asia, where the rise of the middle class consumer in countries such as China and India will drive global growth over the next decade. Emerging markets are expected to grow at a faster pace than developed economies, with a billion people estimated to be entering the middle and upper classes over the next 10 years — an environment that should provide a strong tailwind for long-term returns.
London-based portfolio manager Chris Thomsen, who grew up in Hong Kong, Manila and Tokyo, says he has always had a passion for investing in Asia. “Despite the recent economic slowdown in emerging markets, I continue to have strong conviction that the evolution of the middle class and the structural growth of Asian consumption — driven by wage inflation and the transition to service economies —is one of the most important investment themes of the decade.”
Rising living standards alter consumption patterns, driving up demand for higher value goods and services. In China, a rapid increase in per capita income over the last 20 years means consumers now spend less on basic needs and much more on discretionary services and activities such as travel, leisure and health care. For this reason, the slowdown in China’s growth rate has given many investors pause. But it is necessary to understand its policy in a longer term context. By cooling down the property market, reining in lending and curtailing infrastructure projects, the country is laying the foundation for more sustainable economic growth.
“My focus has been on finding companies with exposure to rising consumption as wages go up,” explains Chris, noting that salaries in China are rising 10% to 15% a year. “Many of the businesses benefiting from the growth of the middle class consumer are in the areas of e-commerce and gaming. As in the developed world, the Internet is an important form of leisure and utility in China. Online shopping, gaming and social media are a major part of daily life — and their importance is accelerating with the increased penetration of both smartphones and high-speed Internet.”
| 6 | EuroPacific Growth Fund |
Nick Grace Portfolio manager |
Carl Kawaja Portfolio manager |


“There have been some fantastic investments in emerging markets over the last five years despite the asset class as a whole being challenged, and now with valuations lower there are quite a few attractive opportunities.”
Nick Grace
| EuroPacific Growth Fund | 7 |
Chris Thomsen Portfolio manager |
Jonathan Knowles Portfolio manager |


The Chinese government has effectively blocked global Internet giants like Google, Yahoo and Facebook, giving rise to national players Baidu, Tencent and Alibaba. In turn, they have been buying smaller specialized Chinese Internet firms while also developing their own innovative services, such as Tencent’s messaging application WeChat. While a number of these companies have generated significant returns for investors in recent years, Chris says he is confident in their long-term potential, driven by innovation, consolidation and mobility.
In addition to the blue-chip domestic companies, he also likes to invest in multinational corporations with substantial exposure to emerging markets — and in particular, to Asian consumers. European automakers and luxury goods companies are just two examples of those benefiting from demand in China, where sales remain strong despite the slowdown in the economy. BMW, Daimler and Volkswagen generate more than 20% of their profits in China. The luxury goods brands are also seen as aspirational for Chinese consumers, who are becoming more sophisticated and discerning, although some brands have not done as well recently for a number of reasons.
“Some companies expanded in China too quickly — poor locations in too many cities — and that hurt their margins and brand image. The recent crackdown on corruption has also dented sales of items such as jewelry, watches and handbags,” adds Chris. “Nevertheless, the outlook for luxury goods spending remains strong over the long term given the cachet of these brands and the rising incomes of the middle class. These companies generate a high level of cash flow and have tremendous pricing power, increasing prices up to 10% in a year.”
London-based retail analyst Lara Pellini observes that China’s rising consumer class is not only boosting sales in their domestic market, but also abroad. “I just returned from a trip to Japan and was amazed by the number of Chinese tourists there following the relaxation of visa regulations,” states Lara, noting that they tend to be the highest spenders of any nationality. “The surge of travelers from China to Japan is a relatively new phenomenon, but it’s been happening in Hong Kong, Europe and more recently South Korea. We’ve been able to capture it through investments in companies that sell cosmetics and luxury goods to consumers while traveling, and then target those shoppers back home.”
Promising outlook in India
India exhibits many of the same long-term growth trends as China in terms of the rising middle class, but India’s demographics are actually more favorable than China, whose growth has been limited by the country’s one-child policy. While India is expanding at approximately the same rate, the country’s per-capita GDP is not even a quarter that of China’s, which means that its economic growth can continue or even accelerate for many years to come.
With a median age of 27 and roughly 10 million people entering the work-force every year, India’s sizable infrastructure needs should continue to drive investments and job creation. Likewise, the growing middle class will support companies like Maruti Suzuki — a subsidiary of Japan’s Suzuki and the most popular automaker in India — as more people can afford to buy cars and motorcycles, a common mode of transportation in India.
As the economy evolves and more people enter the middle class, they are also taking out loans for things like their first homes. Credit penetration remains low so this should help drive growth in private sector banks such as HDFC and Kotak Mahindra, both of which are holdings in EuroPacific Growth Fund. “These banks have been taking share from public banks in India year after year,” says Singapore-based portfolio manager Jonathan Knowles, adding that the country’s banking regulator also has helped guide the industry’s growth. “There was no banking crisis like in the U.S. He realized the banks were lending too much and moved to stop them.”
Likewise, the election of reform-minded and business-friendly Narendra Modi as prime minister in May 2014 has been a boon for India. He has implemented
| 8 | EuroPacific Growth Fund |
several reforms since taking office, such as increased accountability for civil servants and faster permitting for the construction of railroads and other infrastructure projects. “Spending has been stepped up dramatically as Modi implemented an automatic value-added tax collection for every business,” explains Jonathan. “India has always had strong potential, but with an incompetent or corrupt government. Modi is not interested in money but only in leaving a legacy and genuinely trying to do the right thing. He understands markets and the importance of bringing in foreign capital, and recognizes that the government needs the help of the private sector.”
Strong leaders have stepped up in other emerging markets as well, including Indonesia, where Joko Widodo was elected as the country’s president last July. These leaders can make a major difference in how a country is viewed on the world stage, including by potential investors. “Many of these new leaders in developing markets, such as Modi in India and Widodo in Indonesia, have demonstrated that they are not afraid to make tough decisions,” states Hong Kong-based analyst Leo Hee. “They have shown good judgment and hired outstanding technocrats to manage their economies. Such improvements in governance are critical pillars of economic development.”
![]()
The New Geography of Investing®
EuroPacific Growth Fund invests primarily in companies based in developed markets in Europe and the Pacific Basin. However, emerging markets also make up a sizable and important area of focus for the fund (22%), especially when looking at the companies in terms of where they generate revenue (34%). For this reason, it is important to have active management supported by a worldwide research operation when investing in today’s global markets.
Equity portion breakdown by domicile (%)
| Region | Fund | ||||
| ▀ | United States | 2 | % | ||
| ▀ | Canada | 3 | |||
| ▀ | Europe | 53 | |||
| ▀ | Japan | 14 | |||
| ▀ | Asia-Pacificex.Japan | 6 | |||
| ▀ | Emerging markets | 22 | |||
| Total | 100 | % | |||
Equity portion breakdown by revenue (%)
| Region | Fund | ||||
| ▀ | United States | 19 | % | ||
| ▀ | Canada | 2 | |||
| ▀ | Europe | 30 | |||
| ▀ | Japan | 10 | |||
| ▀ | Asia-Pacificex.Japan | 4 | |||
| ▀ | Emerging markets | 34 | |||
| Total | 100 | % | |||
Source: Capital Group (as of March 31, 2015).
Totals may not sum to 100 due to rounding.
| EuroPacific Growth Fund | 9 |
Companies in developed nations now generate nearly a third of their revenue from emerging markets.

“As a research-driven active investor, my focus is on the company, not the market. Even during a time of mixed near-term prospects for developing countries, exceptional companies can distinguish themselves.”
Mark Denning
| 10 | EuroPacific Growth Fund |
 Mark Denning Portfolio manager |
Looking past macro headwinds
While China and India benefit from lower commodity and oil prices, other developing economies have been negatively impacted, including resource-rich Brazil, Russia and South Africa. Though such macroeconomic trends are certainly worth considering when investing in emerging markets, there are a number of strong companies not directly affected by them.
“I personally like markets that benefit from lower import prices of global commodities that, at the same time, have a stable political environment, such as India,” explains London-based investment analyst Joerg Sponer, who estimates the country will save nearly 3% of its GDP annually due to lower oil prices, the second most after South Korea. On the other hand, Joerg estimates the drop in oil prices will cost Russia the equivalent of 8% of its annual GDP. Likewise, China will save the most money from lower iron ore prices while Brazil and South Africa will lose the most as a percentage of GDP, following Australia.
Despite these negative impacts, along with a number of geopolitical issues facing these countries, our portfolio managers continue to find attractive investment opportunities. “During a research trip to Brazil, I was struck by the number of meetings with company managements that left me with a positive outlook,” says Carl, citing education provider Kroton as an example of a company making an impact there. “While the macro environment is not great in Brazil, we’re finding areas of interest in the market. As a longer term investor, it is vitally important to look beyond the headwinds to find those individual company successes.”
Like Carl, other portfolio managers and analysts are distinguishing between macroeconomic factors that often trigger headlines and the specific factors that drive corporate success. And as more companies derive a part of their business from outside their country of domicile, headline risk is becoming less significant. Take for example Russia, where the focus has been on its tensions with Ukraine and President Vladimir Putin’s next move. However, several of our investment professionals remain optimistic about companies with exposure to Russia.
“Weak macroeconomic conditions and political uncertainties provide opportunities to invest in quality companies at attractive valuations,” notes Lara. “Russia is a good example of this right now, with rapidly growing food retailers trading at compelling prices. The same applies to Brazil, where politics and corruption get the headlines, drawing attention away from great companies that are growing steadily and gaining market share, such as consumer goods maker Hypermarcas.”
Portfolio managers also are finding investment opportunities in South Africa, despite problems ranging from political corruption to power shortages. Jonathan, who is from Kenya, points to his holding in Mr. Price, a clothing retailer targeting a younger demographic that has seen steady growth over the years and is now expanding into other African countries. “Despite the many macroeconomic challenges in South Africa, the company has done well,” he says. “Another is Naspers, a large holding that has proved beneficial to the fund in recent years. Our analyst identified the media company as it was making early investments in Facebook, Tencent and other Internet startups.”
Over the past 20 years, company-specific factors have gone from contributing about a third of the returns for firms based in emerging markets to nearly two-thirds of the returns — akin to the contribution such factors play in the returns of firms domiciled in developed markets. For this reason, retaining a focus on companies amid macroeconomic challenges remains essential, says Los Angeles-based portfolio manager Mark Denning. “As a research-driven active investor, my focus is on the company, not the market. Even during a time of mixed near-term prospects for developing countries, exceptional companies can distinguish themselves.” ■
| EuroPacific Growth Fund | 11 |
Tapping global potential

The table above compares total returns for the MSCI USA Index (shown in lavender) and the MSCI ACWI (All Country World Index) ex USA (shown in blue) over the past 25 calendar years.
Results for the MSCI USA Index reflect dividends gross of withholding taxes. Results for the MSCI ACWI (All Country World Index) ex USA reflect dividends gross of withholding taxes through December 31, 2000, and dividends net of withholding taxes thereafter.
 | MSCI USA Index |  | MSCI ACWI (All Country World Index) ex USA |
A world of opportunity
With many of the world’s investment opportunities located beyond our shores, an international focus gives U.S. investors access to growth potential that would otherwise be out of reach. As the chart shows, international stocks have outpaced their U.S. counterparts in 11 of the past 25 calendar years. Diversifying across U.S. and non-U.S. stock markets can also help investors mitigate fluctuations in the value of their investments.
Active management
Negotiating the unfamiliar terrain of international markets can be challenging. That is why so many people choose to invest overseas through professionally managed mutual funds. EuroPacific Growth Fund draws on the global research experience of its investment adviser, Capital Research and Management Company, to find attractive companies based chiefly in Europe and the Pacific Basin.
| 12 | EuroPacific Growth Fund |
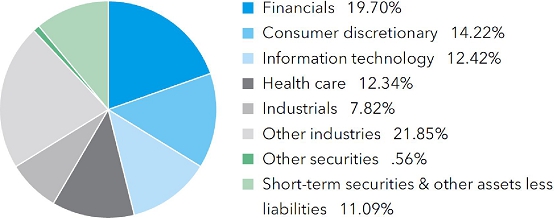
| Summary investment portfolio March 31, 2015 | |
| Industry sector diversification | Percent of net assets |
| Country diversification by domicile | Percent of net assets | |||
| Euro zone* | 23.38 | % | ||
| Japan | 12.36 | |||
| United Kingdom | 11.56 | |||
| India | 7.47 | |||
| Switzerland | 5.25 | |||
| Hong Kong | 4.91 | |||
| China | 4.67 | |||
| Denmark | 4.55 | |||
| Canada | 2.49 | |||
| Other countries | 12.27 | |||
| Short-term securities & other assets less liabilities | 11.09 | |||
| * | Countries using the euro as a common currency; those represented in the fund’s portfolio are Austria, Belgium, Finland, France, Germany, Greece, Ireland, Italy, the Netherlands, Portugal and Spain. |
| Common stocks 88.35% | Shares | Value (000) | ||||||
| Financials 19.70% | ||||||||
| HDFC Bank Ltd.1 | 96,247,659 | $ | 1,841,501 | |||||
| HDFC Bank Ltd. (ADR) | 8,482,300 | 499,523 | ||||||
| Prudential PLC1 | 89,873,984 | 2,225,299 | ||||||
| Barclays PLC1 | 594,827,410 | 2,134,352 | ||||||
| AIA Group Ltd.1 | 266,353,200 | 1,669,370 | ||||||
| Housing Development Finance Corp. Ltd.1 | 62,275,570 | 1,308,907 | ||||||
| Axis Bank Ltd.1 | 104,167,415 | 934,322 | ||||||
| Fairfax Financial Holdings Ltd.2 | 868,291 | 485,036 | ||||||
| Fairfax Financial Holdings Ltd. (CAD denominated)2 | 781,878 | 438,304 | ||||||
| Société Générale1 | 18,737,804 | 905,924 | ||||||
| ICICI Bank Ltd.1 | 164,528,802 | 828,863 | ||||||
| Kotak Mahindra Bank Ltd.1 | 38,186,776 | 800,281 | ||||||
| ORIX Corp.1 | 55,001,700 | 773,610 | ||||||
| AXA SA1 | 29,278,157 | 738,297 | ||||||
| Brookfield Asset Management Inc., Class A | 12,330,000 | 661,011 | ||||||
| Banco Santander, SA1,3 | 76,519,435 | 575,505 | ||||||
| Bank of Ireland1,3 | 1,492,838,553 | 564,912 | ||||||
| Sun Hung Kai Properties Ltd.1 | 36,030,101 | 554,669 | ||||||
| Other securities | 7,375,696 | |||||||
| 25,315,382 | ||||||||
| Consumer discretionary 14.22% | ||||||||
| Toyota Motor Corp.1 | 22,558,800 | 1,574,414 | ||||||
| Altice SA1,2,3 | 14,212,741 | 1,534,853 | ||||||
| Liberty Global PLC, Class C3 | 14,794,834 | 736,931 | ||||||
| Liberty Global PLC, Class A3 | 14,066,000 | 723,977 | ||||||
| Volkswagen AG, nonvoting preferred1 | 4,527,581 | 1,204,846 | ||||||
| Naspers Ltd., Class N1 | 6,593,200 | 1,012,314 | ||||||
| Rakuten, Inc.1 | 57,323,300 | 1,011,291 | ||||||
| Numericable-SFR, non-registered shares1,3 | 16,305,699 | 889,196 | ||||||
| EuroPacific Growth Fund | 13 |
| Common stocks (continued) | Shares | Value (000) | ||||||
| Consumer discretionary (continued) | ||||||||
| Industria de Diseño Textil, SA1 | 23,630,000 | $ | 757,628 | |||||
| Ctrip.com International, Ltd. (ADR)2,3 | 9,034,000 | 529,573 | ||||||
| Other securities | 8,305,738 | |||||||
| 18,280,761 | ||||||||
| Information technology 12.42% | ||||||||
| Murata Manufacturing Co., Ltd.1,2 | 12,427,300 | 1,712,107 | ||||||
| Nintendo Co., Ltd.1,2 | 11,332,600 | 1,667,784 | ||||||
| Baidu, Inc., Class A (ADR)3 | 8,002,400 | 1,667,700 | ||||||
| Taiwan Semiconductor Manufacturing Co., Ltd.1 | 303,242,649 | 1,406,840 | ||||||
| Taiwan Semiconductor Manufacturing Co., Ltd. (ADR) | 5,962,723 | 140,005 | ||||||
| Tencent Holdings Ltd.1 | 66,249,800 | 1,252,428 | ||||||
| Samsung Electronics Co., Ltd.1 | 826,927 | 1,071,948 | ||||||
| ASML Holding NV1 | 8,496,811 | 865,773 | ||||||
| Naver Corp.1 | 1,364,606 | 823,539 | ||||||
| Infineon Technologies AG1,2 | 56,918,948 | 681,523 | ||||||
| Alibaba Group Holding Ltd. (ADR)3 | 7,333,032 | 610,402 | ||||||
| Other securities | 4,056,021 | |||||||
| 15,956,070 | ||||||||
| Health care 12.34% | ||||||||
| Novo Nordisk A/S, Class B1 | 99,131,991 | 5,304,212 | ||||||
| Bayer AG1 | 21,295,666 | 3,199,785 | ||||||
| Novartis AG1 | 29,069,832 | 2,874,691 | ||||||
| UCB SA1,2 | 12,642,824 | 911,055 | ||||||
| Roche Holding AG1 | 2,623,000 | 723,273 | ||||||
| Fresenius SE & Co. KGaA1 | 9,725,727 | 580,785 | ||||||
| Other securities | 2,262,814 | |||||||
| 15,856,615 | ||||||||
| Industrials 7.82% | ||||||||
| International Consolidated Airlines Group, SA (CDI)1,2,3 | 163,039,440 | 1,457,487 | ||||||
| Airbus Group NV, non-registered shares1 | 21,831,000 | 1,418,588 | ||||||
| Ryanair Holdings PLC (ADR) | 16,365,482 | 1,092,723 | ||||||
| Rolls-Royce Holdings PLC1,3 | 53,494,535 | 755,216 | ||||||
| easyJet PLC1 | 19,262,836 | 537,544 | ||||||
| Jardine Matheson Holdings Ltd.1 | 8,328,700 | 525,700 | ||||||
| Other securities | 4,262,263 | |||||||
| 10,049,521 | ||||||||
| Consumer staples 6.82% | ||||||||
| Associated British Foods PLC1 | 39,095,838 | 1,633,353 | ||||||
| British American Tobacco PLC1 | 27,055,999 | 1,397,852 | ||||||
| Pernod Ricard SA1 | 8,832,975 | 1,042,327 | ||||||
| Nestlé SA1 | 12,040,799 | 909,074 | ||||||
| Alimentation Couche-Tard Inc., Class B | 16,281,800 | 648,804 | ||||||
| Other securities | 3,135,180 | |||||||
| 8,766,590 | ||||||||
| Telecommunication services 4.01% | ||||||||
| SoftBank Corp.1 | 50,923,600 | 2,960,164 | ||||||
| Other securities | 2,194,426 | |||||||
| 5,154,590 | ||||||||
| Materials 2.75% | ||||||||
| Syngenta AG1 | 2,060,815 | 700,951 | ||||||
| Other securities | 2,829,949 | |||||||
| 3,530,900 | ||||||||
| Energy 2.11% | ||||||||
| Other securities | 2,707,403 | |||||||
| Utilities 2.08% | ||||||||
| Power Grid Corp. of India Ltd.1,2 | 296,023,422 | 729,479 | ||||||
| Other securities | 1,946,930 | |||||||
| 2,676,409 | ||||||||
| 14 | EuroPacific Growth Fund |
| Value | ||||||||
| Shares | (000) | |||||||
| Miscellaneous 4.08% | ||||||||
| Other common stocks in initial period of acquisition | $ | 5,237,231 | ||||||
| Total common stocks (cost: $76,380,789,000) | 113,531,472 | |||||||
| Rights & warrants 0.00% | ||||||||
| Miscellaneous 0.00% | ||||||||
| Other rights & warrants in initial period of acquisition | 1,232 | |||||||
| Total rights & warrants (cost: $0) | 1,232 | |||||||
| Bonds, notes & other debt instruments 0.56% | Principal amount (000) | |||||||
| Other 0.56% | ||||||||
| Other securities | 721,197 | |||||||
| Total bonds, notes & other debt instruments (cost: $721,070,000) | 721,197 | |||||||
| Short-term securities 11.11% | ||||||||
| Fannie Mae 0.07%–0.18% due 4/1/2015–12/14/2015 | $ | 2,507,870 | 2,507,264 | |||||
| Federal Home Loan Bank 0.07%–0.21% due 4/1/2015–12/8/2015 | 3,523,507 | 3,522,209 | ||||||
| Freddie Mac 0.07%–0.24% due 4/2/2015–12/8/2015 | 2,968,873 | 2,967,582 | ||||||
| Toyota Credit Canada Inc. 0.18% due 4/15/2015 | 25,000 | 24,999 | ||||||
| Toyota Motor Credit Corp. 0.16% due 6/5/2015 | 50,000 | 49,991 | ||||||
| Other securities | 5,208,900 | |||||||
| Total short-term securities (cost: $14,280,040,000) | 14,280,945 | |||||||
| Total investment securities 100.02% (cost: $91,381,899,000) | 128,534,846 | |||||||
| Other assets less liabilities (0.02)% | (24,758 | ) | ||||||
| Net assets 100.00% | $ | 128,510,088 | ||||||
This summary investment portfolio is designed to streamline the report and help investors better focus on the fund’s principal holdings. See the inside back cover for details on how to obtain a complete schedule of portfolio holdings.
As permitted by U.S. Securities and Exchange Commission regulations, “Miscellaneous” securities include holdings in their first year of acquisition that have not previously been publicly disclosed.
“Other securities” includes all issues that are not disclosed separately in the summary investment portfolio. Some of these securities (with an aggregate value of $4,124,830,000, which represented 3.21% of the net assets of the fund) were acquired in transactions exempt from registration under Rule 144A or section 4(2) of the Securities Act of 1933 and may be resold in the U.S. in transactions exempt from registration, normally to qualified institutional buyers. “Other securities” also includes a portion of a security which was pledged as collateral. The total value of pledged collateral was $20,472,000, which represented .02% of the net assets of the fund.
| EuroPacific Growth Fund | 15 |
Forward currency contracts
The fund has entered into forward currency contracts as shown in the following table. The average notional amount of open forward currency contracts was $2,301,884,000 over the prior 12-month period.
| Contract amount | Unrealized appreciation (depreciation) | ||||||||||
| Receive | Deliver | at 3/31/2015 | |||||||||
| Settlement date | Counterparty | (000) | (000) | (000) | |||||||
| Sales: | |||||||||||
| Australian dollars | 5/28/2015 | UBS AG | $29,839 | A$39,300 | $ 6 | ||||||
| British pounds | 4/20/2015 | JPMorgan Chase | $85,484 | £58,000 | (541) | ||||||
| British pounds | 5/8/2015 | UBS AG | $407,881 | £275,000 | 56 | ||||||
| Euros | 4/9/2015 | HSBC Bank | $115,174 | €97,238 | 10,606 | ||||||
| Euros | 4/20/2015 | Citibank | $186,132 | €173,600 | (583) | ||||||
| Euros | 4/20/2015 | Bank of America, N.A. | $94,420 | €89,000 | (1,304) | ||||||
| Euros | 4/20/2015 | Bank of America, N.A. | $134,734 | €127,000 | (1,860) | ||||||
| Euros | 4/27/2015 | HSBC Bank | $54,723 | €50,000 | 940 | ||||||
| Euros | 4/27/2015 | UBS AG | $32,278 | €29,560 | 482 | ||||||
| Euros | 6/9/2015 | JPMorgan Chase | $121,978 | €110,600 | 2,941 | ||||||
| Japanese yen | 4/9/2015 | JPMorgan Chase | $38,587 | ¥4,604,000 | 194 | ||||||
| Japanese yen | 4/14/2015 | UBS AG | $142,583 | ¥17,308,000 | (1,760) | ||||||
| Japanese yen | 4/15/2015 | Barclays Bank PLC | $350,531 | ¥42,103,000 | (599) | ||||||
| Japanese yen | 4/16/2015 | Bank of America, N.A. | $15,251 | ¥1,850,000 | (177) | ||||||
| Japanese yen | 4/23/2015 | JPMorgan Chase | $29,554 | ¥3,570,000 | (223) | ||||||
| Japanese yen | 4/24/2015 | Bank of America, N.A. | $136,223 | ¥16,300,000 | 264 | ||||||
| Japanese yen | 4/24/2015 | Barclays Bank PLC | $132,569 | ¥16,080,000 | (1,554) | ||||||
| Japanese yen | 4/27/2015 | Bank of America, N.A. | $54,656 | ¥6,545,000 | 61 | ||||||
| Japanese yen | 4/27/2015 | UBS AG | $52,777 | ¥6,320,000 | 59 | ||||||
| Japanese yen | 4/28/2015 | Bank of America, N.A. | $29,564 | ¥3,575,000 | (257) | ||||||
| $ 6,751 | |||||||||||
| 16 | EuroPacific Growth Fund |
Investments in affiliates
A company is an affiliate of the fund under the Investment Company Act of 1940 if the fund’s holdings in that company represent 5% or more of the outstanding voting shares. The value of the fund’s affiliated-company holdings is either shown in the summary investment portfolio or included in the value of “Other securities” under the respective industry sectors. Further details on such holdings and related transactions during the year ended March 31, 2015, appear below.
| Beginning | Ending | Dividend | Value of | |||||||||||||
| shares or | shares or | or interest | affiliates at | |||||||||||||
| principal | principal | income | 3/31/2015 | |||||||||||||
| amount | Additions | Reductions | amount | (000) | (000) | |||||||||||
| Murata Manufacturing Co., Ltd.1 | 14,705,400 | 2,712,700 | 4,990,800 | 12,427,300 | $ | 19,972 | $ | 1,712,107 | ||||||||
| Nintendo Co., Ltd.1 | 10,185,600 | 1,147,000 | — | 11,332,600 | 11,121 | 1,667,784 | ||||||||||
| Altice SA1,3,4 | 4,021,465 | 10,191,276 | — | 14,212,741 | — | 1,534,853 | ||||||||||
| International Consolidated Airlines Group, SA (CDI)1,3 | 111,313,540 | 51,725,900 | — | 163,039,440 | — | 1,457,487 | ||||||||||
| Fairfax Financial Holdings Ltd. | 826,291 | 42,000 | — | 868,291 | 7,380 | 485,036 | ||||||||||
| Fairfax Financial Holdings Ltd. | ||||||||||||||||
| (CAD denominated) | 525,000 | 456,878 | 200,000 | 781,878 | 4,463 | 438,303 | ||||||||||
| UCB SA1 | 9,315,505 | 3,937,319 | 610,000 | 12,642,824 | 13,589 | 911,055 | ||||||||||
| Power Grid Corp. of India Ltd.1 | 296,023,422 | — | — | 296,023,422 | 9,696 | 729,479 | ||||||||||
| Infineon Technologies AG1 | 56,470,947 | 448,001 | — | 56,918,948 | 11,689 | 681,523 | ||||||||||
| Ctrip.com International, Ltd. (ADR)3 | 8,414,000 | 620,000 | — | 9,034,000 | — | 529,573 | ||||||||||
| Barratt Developments PLC1,4 | 23,110,000 | 35,212,000 | — | 58,322,000 | 4,825 | 456,697 | ||||||||||
| Chr. Hansen Holding A/S1 | 7,573,000 | 1,170,000 | — | 8,743,000 | 4,695 | 401,579 | ||||||||||
| Gemalto NV1 | 4,804,745 | — | — | 4,804,745 | 2,119 | 383,130 | ||||||||||
| China Resources Gas Group Ltd.1 | 91,800,000 | 26,620,000 | — | 118,420,000 | 3,819 | 367,415 | ||||||||||
| ENN Energy Holdings Ltd.1,4 | 32,680,000 | 41,547,500 | 18,909,500 | 55,318,000 | 2,081 | 339,141 | ||||||||||
| Paddy Power PLC1 | 3,077,308 | 126,692 | — | 3,204,000 | 5,548 | 274,622 | ||||||||||
| Air France-KLM1,3 | 11,477,262 | 9,096,533 | — | 20,573,795 | — | 180,931 | ||||||||||
| Global Brands Group Holding Ltd.1,3 | — | 543,368,100 | — | 543,368,100 | — | 106,211 | ||||||||||
| Bank of Ireland1,3,5 | 1,871,511,153 | 406,763,800 | 785,436,400 | 1,492,838,553 | — | — | ||||||||||
| Bank of Ireland 10.24% (undated)5 | €5,190,000 | — | €5,190,000 | — | 122 | — | ||||||||||
| Carnival PLC1,5 | 9,745,000 | — | 5,915,000 | 3,830,000 | 7,616 | — | ||||||||||
| Deutsche Lufthansa AG1,5 | 27,172,815 | 1,500,000 | 23,122,815 | 5,550,000 | 14,354 | — | ||||||||||
| easyJet PLC1,5 | 8,867,574 | 11,145,262 | 750,000 | 19,262,836 | 14,113 | — | ||||||||||
| Eurobank Ergasias SA1,3,5 | — | 800,389,651 | 687,888,777 | 112,500,874 | — | — | ||||||||||
| First Quantum Minerals Ltd.5 | 29,232,081 | 740,100 | 17,031,180 | 12,941,001 | 3,307 | — | ||||||||||
| Fuji Media Holdings, Inc.1,4,5 | 6,769,000 | 8,585,000 | 12,329,000 | 3,025,000 | 2,758 | — | ||||||||||
| NetEase, Inc. (ADR)5 | 6,959,167 | — | 4,993,567 | 1,965,600 | 4,970 | — | ||||||||||
| Nokian Renkaat Oyj1,5 | 6,677,000 | — | 1,759,000 | 4,918,000 | 11,355 | — | ||||||||||
| Sysmex Corp.1,5 | 13,183,600 | 598,600 | 4,760,000 | 9,022,200 | 2,894 | — | ||||||||||
| Trend Micro Inc.1,4,5 | 3,070,000 | 5,000,000 | 5,570,000 | 2,500,000 | 6,891 | — | ||||||||||
| $ | 169,377 | $ | 12,656,926 | |||||||||||||
The following footnotes apply to either the individual securities noted or one or more of the securities aggregated and listed as a single line item.
| 1 | Valued under fair value procedures adopted by authority of the board of trustees. The total value of all such securities, including those in “Miscellaneous” and “Other securities,” was $102,118,392,000, which represented 79.46% of the net assets of the fund. This amount includes $101,062,089,000 related to certain securities trading outside the U.S. whose values were adjusted as a result of significant market movements following the close of local trading. |
| 2 | Represents an affiliated company as defined under the Investment Company Act of 1940. |
| 3 | Security did not produce income during the last 12 months. |
| 4 | This security was an unaffiliated issuer in its initial period of acquisition at 3/31/2014; it was not publicly disclosed. |
| 5 | Unaffiliated issuer at 3/31/2015. |
Key to abbreviations and symbols
ADR = American Depositary Receipts
CDI = CREST Depository Interest
A$ = Australian dollars
CAD = Canadian dollars
€ = Euros
£ = British pounds
¥ = Japanese yen
See Notes to Financial Statements
| EuroPacific Growth Fund | 17 |
| Statement of assets and liabilities | ||||||||
| at March 31, 2015 | (dollars in thousands) | |||||||
| Assets: | ||||||||
| Investment securities, at value: | ||||||||
| Unaffiliated issuers (cost: $82,417,340) | $ | 115,877,920 | ||||||
| Affiliated issuers (cost: $8,964,559) | 12,656,926 | $ | 128,534,846 | |||||
| Cash denominated in currencies other than U.S. dollars (cost: $9,301) | 9,306 | |||||||
| Cash | 2,547 | |||||||
| Unrealized appreciation on open forward currency contracts | 15,609 | |||||||
| Receivables for: | ||||||||
| Sales of investments | 144,385 | |||||||
| Sales of fund’s shares | 363,578 | |||||||
| Dividends and interest | 438,076 | 946,039 | ||||||
| 129,508,347 | ||||||||
| Liabilities: | ||||||||
| Unrealized depreciation on open forward currency contracts | 8,858 | |||||||
| Payables for: | ||||||||
| Purchases of investments | 503,162 | |||||||
| Repurchases of fund’s shares | 328,491 | |||||||
| Investment advisory services | 45,484 | |||||||
| Services provided by related parties | 29,138 | |||||||
| Trustees’ deferred compensation | 3,840 | |||||||
| Other | 79,286 | 989,401 | ||||||
| Net assets at March 31, 2015 | $ | 128,510,088 | ||||||
| Net assets consist of: | ||||||||
| Capital paid in on shares of beneficial interest | $ | 92,390,427 | ||||||
| Undistributed net investment income | 164,877 | |||||||
| Accumulated net realized loss | (1,144,771 | ) | ||||||
| Net unrealized appreciation | 37,099,555 | |||||||
| Net assets at March 31, 2015 | $ | 128,510,088 | ||||||
(dollars and shares in thousands, except per-share amounts)
Shares of beneficial interest issued and outstanding (no stated par value) —
unlimited shares authorized (2,586,360 total shares outstanding)
| Shares | Net asset value | |||||||||||
| Net assets | outstanding | per share | ||||||||||
| Class A | $ | 30,769,816 | 616,555 | $ | 49.91 | |||||||
| Class B | 140,519 | 2,817 | 49.89 | |||||||||
| Class C | 1,802,789 | 36,979 | 48.75 | |||||||||
| Class F-1 | 6,773,360 | 136,369 | 49.67 | |||||||||
| Class F-2 | 16,273,014 | 326,615 | 49.82 | |||||||||
| Class 529-A | 1,205,294 | 24,396 | 49.41 | |||||||||
| Class 529-B | 18,749 | 382 | 49.07 | |||||||||
| Class 529-C | 374,330 | 7,738 | 48.38 | |||||||||
| Class 529-E | 62,132 | 1,268 | 49.00 | |||||||||
| Class 529-F-1 | 96,465 | 1,953 | 49.40 | |||||||||
| Class R-1 | 285,284 | 5,926 | 48.14 | |||||||||
| Class R-2 | 974,875 | 20,103 | 48.49 | |||||||||
| Class R-2E | 204 | 4 | 49.67 | |||||||||
| Class R-3 | 6,481,610 | 132,473 | 48.93 | |||||||||
| Class R-4 | 13,487,674 | 275,318 | 48.99 | |||||||||
| Class R-5 | 11,417,746 | 229,048 | 49.85 | |||||||||
| Class R-6 | 38,346,227 | 768,416 | 49.90 | |||||||||
See Notes to Financial Statements
| 18 | EuroPacific Growth Fund |
| Statement of operations | ||||||||
| for the year ended March 31, 2015 | (dollars in thousands) | |||||||
| Investment income: | ||||||||
| Income: | ||||||||
| Dividends (net of non-U.S. taxes of $197,252; also includes $169,255 from affiliates) | $ | 2,112,879 | ||||||
| Interest (includes $122 from affiliates) | 17,805 | $ | 2,130,684 | |||||
| Fees and expenses*: | ||||||||
| Investment advisory services | 522,677 | |||||||
| Distribution services | 199,716 | |||||||
| Transfer agent services | 101,469 | |||||||
| Administrative services | 49,884 | |||||||
| Reports to shareholders | 3,775 | |||||||
| Registration statement and prospectus | 2,488 | |||||||
| Trustees’ compensation | 560 | |||||||
| Auditing and legal | 336 | |||||||
| Custodian | 20,376 | |||||||
| Other | 1,924 | 903,205 | ||||||
| Net investment income | 1,227,479 | |||||||
| Net realized gain and unrealized depreciation on investments, forward currency contracts and currency: | ||||||||
| Net realized gain (loss) on: | ||||||||
| Investments (net of non-U.S. taxes of $105; also includes $56,747 net loss from affiliates) | 6,132,634 | |||||||
| Forward currency contracts | 373,495 | |||||||
| Currency transactions | (30,502 | ) | 6,475,627 | |||||
| Net unrealized depreciation on: | ||||||||
| Investments (net of non-U.S. taxes of $46,364) | (4,474,933 | ) | ||||||
| Forward currency contracts | (6,964 | ) | ||||||
| Currency translations | (14,867 | ) | (4,496,764 | ) | ||||
| Net realized gain and unrealized depreciation on investments, forward currency contracts and currency | 1,978,863 | |||||||
| Net increase in net assets resulting from operations | $ | 3,206,342 | ||||||
| * | Additional information related to class-specific fees and expenses is included in the Notes to Financial Statements. |
Statements of changes in net assets
(dollars in thousands)
| Year ended March 31 | ||||||||
| 2015 | 2014 | |||||||
| Operations: | ||||||||
| Net investment income | $ | 1,227,479 | $ | 1,831,644 | ||||
| Net realized gain on investments, forward currency contracts and currency transactions | 6,475,627 | 6,602,715 | ||||||
| Net unrealized (depreciation) appreciation on investments, forward currency contracts and currency translations | (4,496,764 | ) | 10,328,126 | |||||
| Net increase in net assets resulting from operations | 3,206,342 | 18,762,485 | ||||||
| Dividends paid to shareholders from net investment income | (1,802,210 | ) | (1,238,841 | ) | ||||
| Net capital share transactions | 2,917,122 | (851,469 | ) | |||||
| Total increase in net assets | 4,321,254 | 16,672,175 | ||||||
| Net assets: | ||||||||
| Beginning of year | 124,188,834 | 107,516,659 | ||||||
| End of year (including undistributed net investment income: $164,877 and $398,318, respectively) | $ | 128,510,088 | $ | 124,188,834 | ||||
See Notes to Financial Statements
| EuroPacific Growth Fund | 19 |
Notes to financial statements
1. Organization
EuroPacific Growth Fund (the “fund”) is registered under the Investment Company Act of 1940 as an open-end, diversified investment company. The fund seeks to provide long-term growth of capital. Shareholders approved a proposal to reorganize the fund from a Massachusetts business trust to a Delaware statutory trust. The reorganization may be completed in the next 12 months; however, the fund reserves the right to delay the implementation.
The fund has 17 share classes consisting of five retail share classes (Classes A, B and C, as well as two F share classes, F-1 and F-2), five 529 college savings plan share classes (Classes 529-A, 529-B, 529-C, 529-E and 529-F-1) and seven retirement plan share classes (Classes R-1, R-2, R-2E, R-3, R-4, R-5 and R-6). The 529 college savings plan share classes can be used to save for college education. The retirement plan share classes are generally offered only through eligible employer-sponsored retirement plans. The fund’s share classes are further described in the following table:
| Share class | Initial sales charge | Contingent deferred sales charge upon redemption | Conversion feature | |||
| Classes A and 529-A | Up to 5.75% | None (except 1% for certain redemptions within one year of purchase without an initial sales charge) | None | |||
| Classes B and 529-B* | None | Declines from 5% to 0% for redemptions within six years of purchase | Classes B and 529-B convert to Classes A and 529-A, respectively, after eight years | |||
| Class C | None | 1% for redemptions within one year of purchase | Class C converts to Class F-1 after 10 years | |||
| Class 529-C | None | 1% for redemptions within one year of purchase | None | |||
| Class 529-E | None | None | None | |||
| Classes F-1, F-2 and 529-F-1 | None | None | None | |||
| Classes R-1, R-2, R-2E, R-3, R-4, R-5 and R-6 | None | None | None |
| * | Class B and 529-B shares of the fund are not available for purchase. |
On August 29, 2014, the fund made an additional retirement plan share class (Class R-2E) available for sale pursuant to an amendment to its registration statement filed with the U.S. Securities and Exchange Commission. Refer to the fund’s prospectus for more details.
Holders of all share classes have equal pro rata rights to the assets, dividends and liquidation proceeds of the fund. Each share class has identical voting rights, except for the exclusive right to vote on matters affecting only its class. Share classes have different fees and expenses (“class-specific fees and expenses”), primarily due to different arrangements for distribution, transfer agent and administrative services. Differences in class-specific fees and expenses will result in differences in net investment income and, therefore, the payment of different per-share dividends by each share class.
2. Significant accounting policies
The fund is an investment company that applies the accounting and reporting guidance issued in Topic 946 by the U.S. Financial Accounting Standards Board. The fund’s financial statements have been prepared to comply with U.S. generally accepted accounting principles (“U.S. GAAP”). These principles require the fund’s investment adviser to make estimates and assumptions that affect reported amounts and disclosures. Actual results could differ from those estimates. The fund follows the significant accounting policies described in this section, as well as the valuation policies described in the next section on valuation.
Security transactions and related investment income — Security transactions are recorded by the fund as of the date the trades are executed with brokers. Realized gains and losses from security transactions are determined based on the specific identified cost of the securities. In the event a security is purchased with a delayed payment date, the fund will segregate liquid assets sufficient to meet its payment obligations. Dividend income is recognized on the ex-dividend date and interest income is recognized on an accrual basis. Market discounts, premiums and original issue discounts on fixed-income securities are amortized daily over the expected life of the security.
| 20 | EuroPacific Growth Fund |
Class allocations — Income, fees and expenses (other than class-specific fees and expenses) and realized and unrealized gains and losses are allocated daily among the various share classes based on their relative net assets. Class-specific fees and expenses, such as distribution, transfer agent and administrative services, are charged directly to the respective share class.
Dividends and distributions to shareholders — Dividends and distributions to shareholders are recorded on the ex-dividend date.
Currency translation — Assets and liabilities, including investment securities, denominated in currencies other than U.S. dollars are translated into U.S. dollars at the exchange rates supplied by one or more pricing vendors on the valuation date. Purchases and sales of investment securities and income and expenses are translated into U.S. dollars at the exchange rates on the dates of such transactions. The effects of changes in exchange rates on investment securities are included with the net realized gain or loss and net unrealized appreciation or depreciation on investments in the fund’s statement of operations. The realized gain or loss and unrealized appreciation or depreciation resulting from all other transactions denominated in currencies other than U.S. dollars are disclosed separately.
3. Valuation
Capital Research and Management Company (“CRMC”), the fund’s investment adviser, values the fund’s investments at fair value as defined by U.S. GAAP. The net asset value of each share class of the fund is generally determined as of approximately 4:00 p.m. New York time each day the New York Stock Exchange is open.
Methods and inputs — The fund’s investment adviser uses the following methods and inputs to establish the fair value of the fund’s assets and liabilities. Use of particular methods and inputs may vary over time based on availability and relevance as market and economic conditions evolve.
Equity securities are generally valued at the official closing price of, or the last reported sale price on, the exchange or market on which such securities are traded, as of the close of business on the day the securities are being valued or, lacking any sales, at the last available bid price. Prices for each security are taken from the principal exchange or market on which the security trades.
Fixed-income securities, including short-term securities, are generally valued at prices obtained from one or more pricing vendors. Vendors value such securities based on one or more of the inputs described in the following table. The table provides examples of inputs that are commonly relevant for valuing particular classes of fixed-income securities in which the fund is authorized to invest. However, these classifications are not exclusive, and any of the inputs may be used to value any other class of fixed-income security.
| Fixed-income class | Examples of standard inputs |
| All | Benchmark yields, transactions, bids, offers, quotations from dealers and trading systems, new issues, spreads and other relationships observed in the markets among comparable securities; and proprietary pricing models such as yield measures calculated using factors such as cash flows, financial or collateral performance and other reference data (collectively referred to as “standard inputs”) |
| Corporate bonds & notes; convertible securities | Standard inputs and underlying equity of the issuer |
| Bonds & notes of governments & government agencies | Standard inputs and interest rate volatilities |
When the fund’s investment adviser deems it appropriate to do so (such as when vendor prices are unavailable or deemed to be not representative), fixed-income securities will be valued in good faith at the mean quoted bid and ask prices that are reasonably and timely available (or bid prices, if ask prices are not available) or at prices for securities of comparable maturity, quality and type.
Securities with both fixed-income and equity characteristics, or equity securities traded principally among fixed-income dealers, are generally valued in the manner described for either equity or fixed-income securities, depending on which method is deemed most appropriate by the fund’s investment adviser. Forward currency contracts are valued at the mean of representative quoted bid and ask prices, generally based on prices supplied by one or more pricing vendors.
Securities and other assets for which representative market quotations are not readily available or are considered unreliable by the fund’s investment adviser are fair valued as determined in good faith under fair valuation guidelines adopted by authority of the fund’s board of trustees as further described. The investment adviser follows fair valuation guidelines, consistent with U.S. Securities and Exchange Commission rules and guidance, to consider relevant principles and factors when making fair value determinations. The investment adviser considers relevant indications of value that are reasonably and timely available to it in determining the fair value to be assigned to a particular security, such as the type and cost of the security; contractual or legal restrictions on resale of the security; relevant financial or
| EuroPacific Growth Fund | 21 |
business developments of the issuer; actively traded similar or related securities; conversion or exchange rights on the security; related corporate actions; significant events occurring after the close of trading in the security; and changes in overall market conditions. In addition, the closing prices of equity securities that trade in markets outside U.S. time zones may be adjusted to reflect significant events that occur after the close of local trading but before the net asset value of each share class of the fund is determined. Fair valuations and valuations of investments that are not actively trading involve judgment and may differ materially from valuations that would have been used had greater market activity occurred.
Processes and structure — The fund’s board of trustees has delegated authority to the fund’s investment adviser to make fair value determinations, subject to board oversight. The investment adviser has established a Joint Fair Valuation Committee (the “Fair Valuation Committee”) to administer, implement and oversee the fair valuation process, and to make fair value decisions. The Fair Valuation Committee regularly reviews its own fair value decisions, as well as decisions made under its standing instructions to the investment adviser’s valuation teams. The Fair Valuation Committee reviews changes in fair value measurements from period to period and may, as deemed appropriate, update the fair valuation guidelines to better reflect the results of back testing and address new or evolving issues. The Fair Valuation Committee reports any changes to the fair valuation guidelines to the board of trustees with supplemental information to support the changes. The fund’s board and audit committee also regularly review reports that describe fair value determinations and methods.
The fund’s investment adviser has also established a Fixed-Income Pricing Review Group to administer and oversee the fixed-income valuation process, including the use of fixed-income pricing vendors. This group regularly reviews pricing vendor information and market data. Pricing decisions, processes and controls over security valuation are also subject to additional internal reviews, including an annual control self-evaluation program facilitated by the investment adviser’s compliance group.
Classifications — The fund’s investment adviser classifies the fund’s assets and liabilities into three levels based on the inputs used to value the assets or liabilities. Level 1 values are based on quoted prices in active markets for identical securities. Level 2 values are based on significant observable market inputs, such as quoted prices for similar securities and quoted prices in inactive markets. Certain securities trading outside the U.S. may transfer between Level 1 and Level 2 due to valuation adjustments resulting from significant market movements following the close of local trading. Level 3 values are based on significant unobservable inputs that reflect the investment adviser’s determination of assumptions that market participants might reasonably use in valuing the securities. The valuation levels are not necessarily an indication of the risk or liquidity associated with the underlying investment. For example, U.S. government securities are reflected as Level 2 because the inputs used to determine fair value may not always be quoted prices in an active market. The following table presents the fund’s valuation levels as of March 31, 2015 (dollars in thousands):
| Investment securities | ||||||||||||||||
| Level 1 | Level 2* | Level 3 | Total | |||||||||||||
| Assets: | ||||||||||||||||
| Common stocks: | ||||||||||||||||
| Financials | $ | 2,545,085 | $ | 22,769,220 | $ | 1,077 | $ | 25,315,382 | ||||||||
| Consumer discretionary | 2,147,439 | 15,825,217 | — | 17,972,656 | ||||||||||||
| Information technology | 2,812,367 | 13,143,703 | — | 15,956,070 | ||||||||||||
| Health care | 247,739 | 15,608,876 | — | 15,856,615 | ||||||||||||
| Industrials | 1,192,867 | 8,856,654 | — | 10,049,521 | ||||||||||||
| Consumer staples | 938,982 | 7,827,608 | — | 8,766,590 | ||||||||||||
| Telecommunication services | 25,855 | 5,128,736 | — | 5,154,591 | ||||||||||||
| Materials | 156,839 | 3,374,061 | — | 3,530,900 | ||||||||||||
| Energy | 753,240 | 1,954,163 | — | 2,707,403 | ||||||||||||
| Utilities | — | 2,676,409 | — | 2,676,409 | ||||||||||||
| Miscellaneous | 592,667 | 4,952,668 | — | 5,545,335 | ||||||||||||
| Rights & warrants | 1,232 | — | — | 1,232 | ||||||||||||
| Bonds, notes & other debt instruments | — | 721,197 | — | 721,197 | ||||||||||||
| Short-term securities | — | 14,280,945 | — | 14,280,945 | ||||||||||||
| Total | $ | 11,414,312 | $ | 117,119,457 | $ | 1,077 | $ | 128,534,846 | ||||||||
| 22 | EuroPacific Growth Fund |
| Other investments† | ||||||||||||||||
| Level 1 | Level 2 | Level 3 | Total | |||||||||||||
| Assets: | ||||||||||||||||
| Unrealized appreciation on open forward currency contracts | $ | — | $ | 15,609 | $ | — | $ | 15,609 | ||||||||
| Liabilities: | ||||||||||||||||
| Unrealized depreciation on open forward currency contracts | — | (8,858 | ) | — | (8,858 | ) | ||||||||||
| Total | $ | — | $ | 6,751 | $ | — | $ | 6,751 | ||||||||
| * | Securities with a value of $101,062,089,000, which represented 78.64% of the net assets of the fund, were classified as Level 2 due to significant market movements following the close of local trading. |
| † | Forward currency contracts are not included in the investment portfolio. |
4. Risk factors
Investing in the fund may involve certain risks including, but not limited to, those described below.
Market conditions — The prices of, and the income generated by, the common stocks and other securities held by the fund may decline —sometimes rapidly or unpredictably — due to various factors, including events or conditions affecting the general economy or particular industries; overall market changes; local, regional or global political, social or economic instability; governmental or governmental agency responses to economic conditions; and currency exchange rate, interest rate and commodity price fluctuations.
Issuer risks — The prices of, and the income generated by, securities held by the fund may decline in response to various factors directly related to the issuers of such securities, including reduced demand for an issuer’s goods or services, poor management performance and strategic initiatives such as mergers, acquisitions or dispositions, and the market response to any such initiatives.
Investing in growth-oriented stocks — Growth-oriented common stocks and other equity-type securities (such as preferred stocks, convertible preferred stocks and convertible bonds) may involve larger price swings and greater potential for loss than other types of investments. These risks may be even greater in the case of smaller capitalization stocks.
Investing outside the U.S. — Securities of issuers domiciled outside the U.S., or with significant operations or revenues outside the U.S., may lose value because of adverse political, social, economic or market developments (including social instability, regional conflicts, terrorism and war) in the countries or regions in which the issuers operate or generate revenue. These securities may also lose value due to changes in foreign currency exchange rates against the U.S. dollar and/or currencies of other countries. Issuers of these securities may be more susceptible to actions of foreign governments, such as the imposition of price controls or punitive taxes, that could adversely impact revenues. Securities markets in certain countries may be more volatile and/or less liquid than those in the U.S. Investments outside the U.S. may also be subject to different accounting practices and different regulatory, legal and reporting standards and practices, and may be more difficult to value, than those in the U.S. In addition, the value of investments outside the U.S. may be reduced by foreign taxes, including foreign withholding taxes on interest and dividends. Further, there may be increased risks of delayed settlement of securities purchased or sold by the fund. The risks of investing outside the U.S. may be heightened in connection with investments in emerging markets.
Investing in emerging markets — Investing in emerging markets may involve risks in addition to and greater than those generally associated with investing in the securities markets of developed countries. For instance, developing countries may have less developed legal and accounting systems than those in developed countries. The governments of these countries may be less stable and more likely to impose capital controls, nationalize a company or industry, place restrictions on foreign ownership and on withdrawing sale proceeds of securities from the country, and/or impose punitive taxes that could adversely affect the prices of securities. In addition, the economies of these countries may be dependent on relatively few industries that are more susceptible to local and global changes. Securities markets in these countries can also be relatively small and have substantially lower trading volumes. As a result, securities issued in these countries may be more volatile and less liquid, and may be more difficult to value, than securities issued in countries with more developed economies and/or markets. Less certainty with respect to security valuations may lead to additional challenges and risks in calculating the fund’s net asset value. Additionally, there may be increased settlement risks for transactions in local securities.
Management — The investment adviser to the fund actively manages the fund’s investments. Consequently, the fund is subject to the risk that the methods and analyses employed by the investment adviser in this process may not produce the desired results. This could cause the fund to lose value or its investment results to lag relevant benchmarks or other funds with similar objectives.
| EuroPacific Growth Fund | 23 |
5. Certain investment techniques
Forward currency contracts — The fund has entered into forward currency contracts, which represent agreements to exchange currencies on specific future dates at predetermined rates. The fund’s investment adviser uses forward currency contracts to manage the fund’s exposure to changes in exchange rates. Upon entering into these contracts, risks may arise from the potential inability of counterparties to meet the terms of their contracts and from possible movements in exchange rates.
On a daily basis, the fund’s investment adviser values forward currency contracts and records unrealized appreciation or depreciation for open forward currency contracts in the fund’s statement of assets and liabilities. Realized gains or losses are recorded at the time the forward currency contract is closed or offset by another contract with the same broker for the same settlement date and currency.
Closed forward currency contracts that have not reached their settlement date are included in the respective receivables or payables for closed forward currency contracts in the fund’s statement of assets and liabilities. Net realized gains or losses from closed forward currency contracts and net unrealized appreciation or depreciation from open forward currency contracts are recorded in the fund’s statement of operations.
The following tables present the financial statement impacts resulting from the fund’s use of forward currency contracts as of or for the year ended March 31, 2015 (dollars in thousands):
| Assets | Liabilities | |||||||||||
| Contract | Location on statement of assets and liabilities | Value | Location on statement of assets and liabilities | Value | ||||||||
| Forward currency | Unrealized appreciation on open forward currency contracts | $ | 15,609 | Unrealized depreciation on open forward currency contracts | $ | 8,858 | ||||||
| Net realized gain | Net unrealized depreciation | |||||||||||
| Contract | Location on statement of operations | Value | Location on statement of operations | Value | ||||||||
| Forward currency | Net realized gain on forward currency contracts | $ | 373,495 | Net unrealized depreciation on forward currency contracts | $ | (6,964 | ) | |||||
Collateral — The fund participates in a collateral program due to its use of forward currency contracts. The program calls for the fund to either receive or pledge collateral based on the net gain or loss on unsettled forward currency contracts by counterparty. The purpose of the collateral is to cover potential losses that could occur in the event that either party cannot meet its contractual obligations.
Rights of offset — The fund has entered into enforceable master netting agreements with certain counterparties for forward currency contracts, where on any date amounts payable by each party to the other (in the same currency with respect to the same transaction) may be closed or offset by each party’s payment obligation. If an early termination date occurs under these agreements following an event of default or termination event, all obligations of each party to its counterparty are settled net through a single payment in a single currency (“close-out netting”). For financial reporting purposes, the fund does not offset financial assets and financial liabilities that are subject to these master netting arrangements in the statement of assets and liabilities.
| 24 | EuroPacific Growth Fund |
The following table presents the fund’s forward currency contracts by counterparty that are subject to master netting agreements but that are not offset in the fund’s statement of assets and liabilities. The net amount column shows the impact of offsetting on the fund’s statement of assets and liabilities as of March 31, 2015 (dollars in thousands) if close-out netting was exercised:
| Gross amounts not offset in the | |||||||||||||||||||||
| Gross amounts | statement of assets and liabilities and | ||||||||||||||||||||
| recognized in the | subject to a master netting agreement | ||||||||||||||||||||
| statement of assets | Available | Non-cash | Cash | Net | |||||||||||||||||
| Counterparty | and liabilities | to offset | collateral* | collateral | amount | ||||||||||||||||
| Assets: | |||||||||||||||||||||
| Bank of America, N.A. | $ | 325 | $ | (325 | ) | $ | — | $ | — | $ | — | ||||||||||
| HSBC Bank | 11,546 | — | (9,590 | ) | — | 1,956 | |||||||||||||||
| JPMorgan Chase | 3,135 | (764 | ) | (22 | ) | — | 2,349 | ||||||||||||||
| UBS AG | 603 | (603 | ) | — | — | — | |||||||||||||||
| $ | 15,609 | $ | (1,692 | ) | $ | (9,612 | ) | $ | — | $ | 4,305 | ||||||||||
| Liabilities: | |||||||||||||||||||||
| Bank of America, N.A. | $ | 3,598 | $ | (325 | ) | $ | (3,273 | ) | $ | — | $ | — | |||||||||
| Barclays Bank PLC | 2,153 | — | (2,153 | ) | — | — | |||||||||||||||
| Citibank | 583 | — | (583 | ) | — | — | |||||||||||||||
| JPMorgan Chase | 764 | (764 | ) | — | — | — | |||||||||||||||
| UBS AG | 1,760 | (603 | ) | (1,157 | ) | — | — | ||||||||||||||
| $ | 8,858 | $ | (1,692 | ) | $ | (7,166 | ) | $ | — | $ | — | ||||||||||
| * | Non-cash collateral is shown on a settlement basis. |
6. Taxation and distributions
Federal income taxation — The fund complies with the requirements under Subchapter M of the Internal Revenue Code applicable to mutual funds and intends to distribute substantially all of its net taxable income and net capital gains each year. The fund is not subject to income taxes to the extent such distributions are made. Therefore, no federal income tax provision is required.
As of and during the period ended March 31, 2015, the fund did not have a liability for any unrecognized tax benefits. The fund recognizes interest and penalties, if any, related to unrecognized tax benefits as income tax expense in the statement of operations. During the period, the fund did not incur any interest or penalties.
The fund is not subject to examination by U.S. federal tax authorities for tax years before 2011, by state tax authorities for tax years before 2010 and by tax authorities outside the U.S. for tax years before 2007.
Non-U.S. taxation — Dividend and interest income are recorded net of non-U.S. taxes paid. Gains realized by the fund on the sale of securities in certain countries are subject to non-U.S. taxes. The fund records a liability based on unrealized gains to provide for potential non-U.S. taxes payable upon the sale of these securities.
Distributions — Distributions paid to shareholders are based on net investment income and net realized gains determined on a tax basis, which may differ from net investment income and net realized gains for financial reporting purposes. These differences are due primarily to different treatment for items such as currency gains and losses; short-term capital gains and losses; capital losses related to sales of certain securities within 30 days of purchase; unrealized appreciation of certain investments in securities outside the U.S.; and net capital losses. The fiscal year in which amounts are distributed may differ from the year in which the net investment income and net realized gains are recorded by the fund for financial reporting purposes.
During the year ended March 31, 2015, the fund reclassified $40,000 from undistributed net investment income to capital paid in on shares of beneficial interest and $341,330,000 from accumulated net realized loss to undistributed net investment income to align financial reporting with tax reporting.
Under the Regulated Investment Company Modernization Act of 2010 (the “Act”), net capital losses recognized after March 31, 2011, may be carried forward indefinitely, and their character is retained as short-term and/or long-term losses. Previously, net capital losses were carried forward for eight years and treated as short-term losses. As a transition rule, the Act requires that post-enactment net capital losses be used before pre-enactment net capital losses.
| EuroPacific Growth Fund | 25 |
As of March 31, 2015, the tax-basis components of distributable earnings, unrealized appreciation (depreciation) and cost of investment securities were as follows (dollars in thousands):
| Undistributed ordinary income | $ | 1,431,702 | ||
| Capital loss carryforward expiring 2018* | (13,451 | ) | ||
| Post-October capital loss deferral† | (901,173 | ) | ||
| Gross unrealized appreciation on investment securities | 39,576,738 | |||
| Gross unrealized depreciation on investment securities | (3,910,172 | ) | ||
| Net unrealized appreciation on investment securities | 35,666,566 | |||
| Cost of investment securities | 92,868,280 |
| * | Reflects the utilization of capital loss carryforward of $6,832,948,000. The capital loss carryforward will be used to offset any capital gains realized by the fund in future years through the expiration date. The fund will not make distributions from capital gains while a capital loss carryforward remains. |
| † | This deferral is considered incurred in the subsequent year. |
Tax-basis distributions paid to shareholders from ordinary income were as follows (dollars in thousands):
| Year ended March 31 | ||||||||
| Share class | 2015 | 2014 | ||||||
| Class A | $ | 401,070 | $ | 299,130 | ||||
| Class B | 409 | 199 | ||||||
| Class C | 9,565 | 4,118 | ||||||
| Class F-1 | 80,946 | 81,016 | ||||||
| Class F-2 | 246,323 | 118,419 | ||||||
| Class 529-A | 15,092 | 10,359 | ||||||
| Class 529-B | 37 | — | ||||||
| Class 529-C | 1,947 | 758 | ||||||
| Class 529-E | 646 | 416 | ||||||
| Class 529-F-1 | 1,394 | 972 | ||||||
| Class R-1 | 1,693 | 556 | ||||||
| Class R-2 | 5,619 | 2,853 | ||||||
| Class R-2E* | 3 | |||||||
| Class R-3 | 67,452 | 49,012 | ||||||
| Class R-4 | 182,048 | 135,957 | ||||||
| Class R-5 | 180,948 | 160,460 | ||||||
| Class R-6 | 607,018 | 374,616 | ||||||
| Total | $ | 1,802,210 | $ | 1,238,841 | ||||
| * | Class R-2E shares were offered beginning August 29, 2014. |
7. Fees and transactions with related parties
CRMC, the fund’s investment adviser, is the parent company of American Funds Distributors,® Inc. (“AFD”), the principal underwriter of the fund’s shares, and American Funds Service Company® (“AFS”), the fund’s transfer agent. CRMC, AFD and AFS are considered related parties to the fund.
Investment advisory services — The fund has an investment advisory and service agreement with CRMC that provides for monthly fees accrued daily. At the beginning of the year, these fees were based on a series of decreasing annual rates beginning with 0.690% on the first $500 million of daily net assets and decreasing to 0.397% on such assets in excess of $115 billion. On December 10, 2014, the fund’s board of trustees approved an amended investment advisory and service agreement effective February 1, 2015, decreasing the annual rates on daily net assets in excess of $144 billion to 0.394%. For the year ended March 31, 2015, the investment advisory services fee was $522,677,000, which was equivalent to an annualized rate of 0.419% of average daily net assets.
Class-specific fees and expenses — Expenses that are specific to individual share classes are accrued directly to the respective share class. The principal class-specific fees and expenses are further described below:
Distribution services — The fund has plans of distribution for all share classes, except Class F-2, R-5 and R-6 shares. Under the plans, the board of trustees approves certain categories of expenses that are used to finance activities primarily intended to sell fund shares and service existing accounts. The plans provide for payments, based on an annualized percentage of average daily net assets, ranging from 0.25% to 1.00% as noted in this section. In some cases, the board of trustees has limited the amounts that may be paid
| 26 | EuroPacific Growth Fund |
to less than the maximum allowed by the plans. All share classes with a plan may use up to 0.25% of average daily net assets to pay service fees, or to compensate AFD for paying service fees, to firms that have entered into agreements with AFD to provide certain shareholder services. The remaining amounts available to be paid under each plan are paid to dealers to compensate them for their sales activities.
For Class A and 529-A shares, distribution-related expenses include the reimbursement of dealer and wholesaler commissions paid by AFD for certain shares sold without a sales charge. These share classes reimburse AFD for amounts billed within the prior 15 months but only to the extent that the overall annual expense limit of 0.25% is not exceeded. As of March 31, 2015, there were no unreimbursed expenses subject to reimbursement for Class A or 529-A shares.
| Share class | Currently approved limits | Plan limits | |||||||
| Class A | 0.25 | % | 0.25 | % | |||||
| Class 529-A | 0.25 | 0.50 | |||||||
| Classes B and 529-B | 1.00 | 1.00 | |||||||
| Classes C, 529-C and R-1 | 1.00 | 1.00 | |||||||
| Class R-2 | 0.75 | 1.00 | |||||||
| Class R-2E | 0.60 | 0.85 | |||||||
| Classes 529-E and R-3 | 0.50 | 0.75 | |||||||
| Classes F-1, 529-F-1 and R-4 | 0.25 | 0.50 | |||||||
Transfer agent services — The fund has a shareholder services agreement with AFS under which the fund compensates AFS for providing transfer agent services to each of the fund’s share classes. These services include recordkeeping, shareholder communications and transaction processing. In addition, the fund reimburses AFS for amounts paid to third parties for performing transfer agent services on behalf of fund shareholders.
Administrative services — The fund has an administrative services agreement with CRMC under which the fund compensates CRMC for providing administrative services to Class A, C, F, 529 and R shares. These services include, but are not limited to, coordinating, monitoring, assisting and overseeing third parties that provide services to fund shareholders. Under the agreement, Class A shares pay an annual fee of 0.01% and Class C, F, 529 and R shares pay an annual fee of 0.05% of their respective average daily net assets.
529 plan services — Each 529 share class is subject to service fees to compensate the Virginia College Savings Plan (“Virginia529”) for its oversight and administration of the 529 college savings plan. The quarterly fee is based on a series of decreasing annual rates beginning with 0.10% on the first $30 billion of the net assets invested in Class 529 shares of the American Funds and decreasing to 0.05% on such assets in excess of $70 billion. The fee for any given calendar quarter is accrued and calculated on the basis of the average net assets of Class 529 shares of the American Funds for the last month of the prior calendar quarter. The fee is included in other expenses in the fund’s statement of operations. Virginia529 is not considered a related party to the fund.
| EuroPacific Growth Fund | 27 |
For the year ended March 31, 2015, class-specific expenses under the agreements were as follows (dollars in thousands):
| Distribution | Transfer agent | Administrative | 529 plan | ||||||||||||
| Share class | services | services | services | services | |||||||||||
| Class A | $74,584 | $43,326 | $3,100 | Not applicable | |||||||||||
| Class B | 1,884 | 242 | Not applicable | Not applicable | |||||||||||
| Class C | 18,639 | 2,272 | 935 | Not applicable | |||||||||||
| Class F-1 | 19,012 | 9,119 | 3,817 | Not applicable | |||||||||||
| Class F-2 | Not applicable | 13,456 | 6,863 | Not applicable | |||||||||||
| Class 529-A | 2,522 | 1,089 | 589 | $1,052 | |||||||||||
| Class 529-B | 243 | 29 | 12 | 22 | |||||||||||
| Class 529-C | 3,679 | 377 | 186 | 332 | |||||||||||
| Class 529-E | 308 | 39 | 31 | 55 | |||||||||||
| Class 529-F-1 | — | 84 | 46 | 82 | |||||||||||
| Class R-1 | 2,892 | 306 | 145 | Not applicable | |||||||||||
| Class R-2 | 7,549 | 3,444 | 508 | Not applicable | |||||||||||
| Class R-2E* | — | † | — | † | — | † | Not applicable | ||||||||
| Class R-3 | 33,878 | 9,334 | 3,406 | Not applicable | |||||||||||
| Class R-4 | 34,526 | 13,208 | 6,927 | Not applicable | |||||||||||
| Class R-5 | Not applicable | 5,038 | 5,751 | Not applicable | |||||||||||
| Class R-6 | Not applicable | 106 | 17,568 | Not applicable | |||||||||||
| Total class-specific expenses | $199,716 | $101,469 | $49,884 | $1,543 | |||||||||||
| * | Class R-2E shares were offered beginning August 29, 2014. |
| † | Amount less than one thousand. |
Trustees’ deferred compensation — Trustees who are unaffiliated with CRMC may elect to defer the cash payment of part or all of their compensation. These deferred amounts, which remain as liabilities of the fund, are treated as if invested in shares of the fund or other American Funds. These amounts represent general, unsecured liabilities of the fund and vary according to the total returns of the selected funds. Trustees’ compensation of $560,000 in the fund’s statement of operations includes $378,000 in current fees (either paid in cash or deferred) and a net increase of $182,000 in the value of the deferred amounts.
Affiliated officers and trustees — Officers and certain trustees of the fund are or may be considered to be affiliated with CRMC, AFD and AFS. No affiliated officers or trustees received any compensation directly from the fund.
8. Capital share transactions
Capital share transactions in the fund were as follows (dollars and shares in thousands):
| Sales1 | Reinvestments of dividends | Repurchases1 | Net (decrease) increase | |||||||||||||||||||||||||||||
| Share class | Amount | Shares | Amount | Shares | Amount | Shares | Amount | Shares | ||||||||||||||||||||||||
| Year ended March 31, 2015 | ||||||||||||||||||||||||||||||||
| Class A | $ | 2,878,795 | 58,692 | $ | 390,609 | 8,206 | $ | (5,119,031 | ) | (104,430 | ) | $ | (1,849,627 | ) | (37,532 | ) | ||||||||||||||||
| Class B | 2,355 | 48 | 404 | 9 | (115,899 | ) | (2,385 | ) | (113,140 | ) | (2,328 | ) | ||||||||||||||||||||
| Class C | 239,576 | 4,999 | 9,315 | 200 | (452,548 | ) | (9,501 | ) | (203,657 | ) | (4,302 | ) | ||||||||||||||||||||
| Class F-1 | 1,844,494 | 37,775 | 79,160 | 1,671 | (4,679,083 | ) | (95,040 | ) | (2,755,429 | ) | (55,594 | ) | ||||||||||||||||||||
| Class F-2 | 7,562,802 | 153,188 | 219,125 | 4,614 | (2,373,712 | ) | (48,427 | ) | 5,408,215 | 109,375 | ||||||||||||||||||||||
| Class 529-A | 125,527 | 2,587 | 15,087 | 320 | (135,291 | ) | (2,790 | ) | 5,323 | 117 | ||||||||||||||||||||||
| Class 529-B | 494 | 10 | 37 | 1 | (12,918 | ) | (271 | ) | (12,387 | ) | (260 | ) | ||||||||||||||||||||
| Class 529-C | 39,380 | 830 | 1,946 | 42 | (48,867 | ) | (1,030 | ) | (7,541 | ) | (158 | ) | ||||||||||||||||||||
| Class 529-E | 6,362 | 132 | 645 | 14 | (8,310 | ) | (173 | ) | (1,303 | ) | (27 | ) | ||||||||||||||||||||
| Class 529-F-1 | 17,412 | 359 | 1,394 | 29 | (13,622 | ) | (282 | ) | 5,184 | 106 | ||||||||||||||||||||||
| Class R-1 | 46,638 | 987 | 1,693 | 37 | (64,304 | ) | (1,366 | ) | (15,973 | ) | (342 | ) | ||||||||||||||||||||
| Class R-2 | 199,470 | 4,191 | 5,612 | 121 | (319,423 | ) | (6,713 | ) | (114,341 | ) | (2,401 | ) | ||||||||||||||||||||
| Class R-2E2 | 206 | 4 | 3 | — | 3 | (9 | ) | — | 3 | 200 | 4 | |||||||||||||||||||||
| Class R-3 | 1,363,609 | 28,339 | 67,413 | 1,443 | (2,233,391 | ) | (46,473 | ) | (802,369 | ) | (16,691 | ) | ||||||||||||||||||||
| Class R-4 | 3,122,477 | 64,944 | 181,977 | 3,894 | (4,357,631 | ) | (90,440 | ) | (1,053,177 | ) | (21,602 | ) | ||||||||||||||||||||
| Class R-5 | 2,383,491 | 48,632 | 180,529 | 3,800 | (3,485,329 | ) | (70,679 | ) | (921,309 | ) | (18,247 | ) | ||||||||||||||||||||
| Class R-6 | 10,233,780 | 208,078 | 605,212 | 12,725 | (5,490,539 | ) | (112,038 | ) | 5,348,453 | 108,765 | ||||||||||||||||||||||
| Total net increase (decrease) | $ | 30,066,868 | 613,795 | $ | 1,760,161 | 37,126 | $ | (28,909,907 | ) | (592,038 | ) | $ | 2,917,122 | 58,883 | ||||||||||||||||||
| 28 | EuroPacific Growth Fund |
| Sales1 | Reinvestments of dividends | Repurchases1 | Net (decrease) increase | |||||||||||||||||||||||||||||
| Share class | Amount | Shares | Amount | Shares | Amount | Shares | Amount | Shares | ||||||||||||||||||||||||
| Year ended March 31, 2014 | ||||||||||||||||||||||||||||||||
| Class A | $ | 3,117,893 | 67,652 | $ | 291,351 | 6,020 | $ | (5,795,209 | ) | (126,005 | ) | $ | (2,385,965 | ) | (52,333 | ) | ||||||||||||||||
| Class B | 5,483 | 119 | 197 | 4 | (128,445 | ) | (2,809 | ) | (122,765 | ) | (2,686 | ) | ||||||||||||||||||||
| Class C | 262,029 | 5,784 | 4,006 | 84 | (466,768 | ) | (10,381 | ) | (200,733 | ) | (4,513 | ) | ||||||||||||||||||||
| Class F-1 | 2,265,788 | 49,621 | 79,710 | 1,656 | (2,543,987 | ) | (55,945 | ) | (198,489 | ) | (4,668 | ) | ||||||||||||||||||||
| Class F-2 | 3,289,346 | 70,625 | 103,593 | 2,144 | (1,857,593 | ) | (40,436 | ) | 1,535,346 | 32,333 | ||||||||||||||||||||||
| Class 529-A | 132,482 | 2,892 | 10,357 | 216 | (118,339 | ) | (2,614 | ) | 24,500 | 494 | ||||||||||||||||||||||
| Class 529-B | 721 | 16 | — | — | (14,107 | ) | (313 | ) | (13,386 | ) | (297 | ) | ||||||||||||||||||||
| Class 529-C | 42,312 | 944 | 758 | 16 | (47,318 | ) | (1,066 | ) | (4,248 | ) | (106 | ) | ||||||||||||||||||||
| Class 529-E | 7,307 | 161 | 416 | 9 | (6,905 | ) | (153 | ) | 818 | 17 | ||||||||||||||||||||||
| Class 529-F-1 | 16,326 | 359 | 971 | 20 | (13,598 | ) | (295 | ) | 3,699 | 84 | ||||||||||||||||||||||
| Class R-1 | 52,278 | 1,177 | 555 | 12 | (86,297 | ) | (1,958 | ) | (33,464 | ) | (769 | ) | ||||||||||||||||||||
| Class R-2 | 223,949 | 5,023 | 2,850 | 61 | (348,879 | ) | (7,840 | ) | (122,080 | ) | (2,756 | ) | ||||||||||||||||||||
| Class R-3 | 1,453,227 | 32,318 | 48,991 | 1,032 | (2,324,885 | ) | (51,699 | ) | (822,667 | ) | (18,349 | ) | ||||||||||||||||||||
| Class R-4 | 3,210,218 | 71,249 | 135,938 | 2,861 | (3,965,194 | ) | (88,560 | ) | (619,038 | ) | (14,450 | ) | ||||||||||||||||||||
| Class R-5 | 2,523,579 | 55,341 | 160,113 | 3,314 | (6,193,730 | ) | (136,097 | ) | (3,510,038 | ) | (77,442 | ) | ||||||||||||||||||||
| Class R-6 | 10,409,982 | 227,020 | 373,366 | 7,719 | (5,166,307 | ) | (111,691 | ) | 5,617,041 | 123,048 | ||||||||||||||||||||||
| Total net increase (decrease) | $ | 27,012,920 | 590,301 | $ | 1,213,172 | 25,168 | $ | (29,077,561 | ) | (637,862 | ) | $ | (851,469 | ) | (22,393 | ) | ||||||||||||||||
| 1 | Includes exchanges between share classes of the fund. |
| 2 | Class R-2E shares were offered beginning August 29, 2014. |
| 3 | Amount less than one thousand. |
9. Investment transactions
The fund made purchases and sales of investment securities, excluding short-term securities and U.S. government obligations, if any, of $31,067,717,000 and $33,781,611,000, respectively, during the year ended March 31, 2015.
| EuroPacific Growth Fund | 29 |
Financial highlights
| Income (loss) from investment operations1 | ||||||||||||||||||||||||||||||||||||||||
| Net gains | ||||||||||||||||||||||||||||||||||||||||
| Net asset | (losses) on | Dividends | Net asset | Ratio of | Ratio of | |||||||||||||||||||||||||||||||||||
| value, | Net | securities (both | Total from | (from net | value, | Net assets, | expenses to | net income | ||||||||||||||||||||||||||||||||
| beginning | investment | realized and | investment | investment | end | Total | end of period | average | to average | |||||||||||||||||||||||||||||||
| of period | income2 | unrealized) | operations | income) | of period | return3,4 | (in millions) | net assets | net assets2 | |||||||||||||||||||||||||||||||
| Class A: | ||||||||||||||||||||||||||||||||||||||||
| Year ended 3/31/2015 | $ | 49.37 | $ | .43 | $ | .76 | $ | 1.19 | $ | (.65 | ) | $ | 49.91 | 2.48 | % | $ | 30,770 | .83 | % | .88 | % | |||||||||||||||||||
| Year ended 3/31/2014 | 42.38 | .69 | 6.75 | 7.44 | (.45 | ) | 49.37 | 17.57 | 32,295 | .84 | 1.50 | |||||||||||||||||||||||||||||
| Year ended 3/31/2013 | 39.47 | .58 | 3.02 | 3.60 | (.69 | ) | 42.38 | 9.19 | 29,939 | .86 | 1.48 | |||||||||||||||||||||||||||||
| Year ended 3/31/2012 | 42.81 | .65 | (3.40 | ) | (2.75 | ) | (.59 | ) | 39.47 | (6.25 | ) | 31,443 | .84 | 1.65 | ||||||||||||||||||||||||||
| Year ended 3/31/2011 | 38.62 | .54 | 4.22 | 4.76 | (.57 | ) | 42.81 | 12.39 | 39,417 | .82 | 1.39 | |||||||||||||||||||||||||||||
| Class B: | ||||||||||||||||||||||||||||||||||||||||
| Year ended 3/31/2015 | 49.17 | .09 | .75 | .84 | (.12 | ) | 49.89 | 1.73 | 141 | 1.56 | .19 | |||||||||||||||||||||||||||||
| Year ended 3/31/2014 | 42.16 | .33 | 6.71 | 7.04 | (.03 | ) | 49.17 | 16.70 | 253 | 1.58 | .73 | |||||||||||||||||||||||||||||
| Year ended 3/31/2013 | 39.20 | .32 | 2.96 | 3.28 | (.32 | ) | 42.16 | 8.39 | 330 | 1.59 | .81 | |||||||||||||||||||||||||||||
| Year ended 3/31/2012 | 42.39 | .37 | (3.34 | ) | (2.97 | ) | (.22 | ) | 39.20 | (6.95 | ) | 464 | 1.58 | .96 | ||||||||||||||||||||||||||
| Year ended 3/31/2011 | 38.21 | .26 | 4.15 | 4.41 | (.23 | ) | 42.39 | 11.57 | 741 | 1.57 | .69 | |||||||||||||||||||||||||||||
| Class C: | ||||||||||||||||||||||||||||||||||||||||
| Year ended 3/31/2015 | 48.22 | .05 | .73 | .78 | (.25 | ) | 48.75 | 1.65 | 1,803 | 1.61 | .11 | |||||||||||||||||||||||||||||
| Year ended 3/31/2014 | 41.41 | .32 | 6.59 | 6.91 | (.10 | ) | 48.22 | 16.69 | 1,990 | 1.62 | .72 | |||||||||||||||||||||||||||||
| Year ended 3/31/2013 | 38.57 | .28 | 2.92 | 3.20 | (.36 | ) | 41.41 | 8.34 | 1,896 | 1.63 | .73 | |||||||||||||||||||||||||||||
| Year ended 3/31/2012 | 41.76 | .34 | (3.28 | ) | (2.94 | ) | (.25 | ) | 38.57 | (6.97 | ) | 2,111 | 1.62 | .89 | ||||||||||||||||||||||||||
| Year ended 3/31/2011 | 37.70 | .23 | 4.10 | 4.33 | (.27 | ) | 41.76 | 11.51 | 2,851 | 1.61 | .60 | |||||||||||||||||||||||||||||
| Class F-1: | ||||||||||||||||||||||||||||||||||||||||
| Year ended 3/31/2015 | 49.10 | .45 | .71 | 1.16 | (.59 | ) | 49.67 | 2.43 | 6,773 | .86 | .93 | |||||||||||||||||||||||||||||
| Year ended 3/31/2014 | 42.15 | .67 | 6.72 | 7.39 | (.44 | ) | 49.10 | 17.55 | 9,425 | .87 | 1.47 | |||||||||||||||||||||||||||||
| Year ended 3/31/2013 | 39.27 | .57 | 3.01 | 3.58 | (.70 | ) | 42.15 | 9.19 | 8,288 | .85 | 1.45 | |||||||||||||||||||||||||||||
| Year ended 3/31/2012 | 42.59 | .63 | (3.37 | ) | (2.74 | ) | (.58 | ) | 39.27 | (6.25 | ) | 7,399 | .86 | 1.62 | ||||||||||||||||||||||||||
| Year ended 3/31/2011 | 38.43 | .52 | 4.20 | 4.72 | (.56 | ) | 42.59 | 12.36 | 8,868 | .85 | 1.35 | |||||||||||||||||||||||||||||
| Class F-2: | ||||||||||||||||||||||||||||||||||||||||
| Year ended 3/31/2015 | 49.32 | .53 | .76 | 1.29 | (.79 | ) | 49.82 | 2.69 | 16,273 | .59 | 1.06 | |||||||||||||||||||||||||||||
| Year ended 3/31/2014 | 42.33 | .82 | 6.74 | 7.56 | (.57 | ) | 49.32 | 17.90 | 10,714 | .59 | 1.78 | |||||||||||||||||||||||||||||
| Year ended 3/31/2013 | 39.44 | .66 | 3.05 | 3.71 | (.82 | ) | 42.33 | 9.47 | 7,828 | .59 | 1.67 | |||||||||||||||||||||||||||||
| Year ended 3/31/2012 | 42.80 | .73 | (3.39 | ) | (2.66 | ) | (.70 | ) | 39.44 | (6.02 | ) | 5,958 | .58 | 1.86 | ||||||||||||||||||||||||||
| Year ended 3/31/2011 | 38.62 | .61 | 4.25 | 4.86 | (.68 | ) | 42.80 | 12.65 | 6,216 | .59 | 1.54 | |||||||||||||||||||||||||||||
| Class 529-A: | ||||||||||||||||||||||||||||||||||||||||
| Year ended 3/31/2015 | 48.89 | .40 | .75 | 1.15 | (.63 | ) | 49.41 | 2.41 | 1,205 | .89 | .82 | |||||||||||||||||||||||||||||
| Year ended 3/31/2014 | 41.98 | .66 | 6.69 | 7.35 | (.44 | ) | 48.89 | 17.52 | 1,187 | .90 | 1.45 | |||||||||||||||||||||||||||||
| Year ended 3/31/2013 | 39.12 | .55 | 2.99 | 3.54 | (.68 | ) | 41.98 | 9.12 | 999 | .91 | 1.40 | |||||||||||||||||||||||||||||
| Year ended 3/31/2012 | 42.45 | .61 | (3.35 | ) | (2.74 | ) | (.59 | ) | 39.12 | (6.30 | ) | 928 | .89 | 1.56 | ||||||||||||||||||||||||||
| Year ended 3/31/2011 | 38.31 | .51 | 4.20 | 4.71 | (.57 | ) | 42.45 | 12.36 | 982 | .87 | 1.31 | |||||||||||||||||||||||||||||
| Class 529-B: | ||||||||||||||||||||||||||||||||||||||||
| Year ended 3/31/2015 | 48.39 | .03 | .73 | .76 | (.08 | ) | 49.07 | 1.58 | 19 | 1.69 | .06 | |||||||||||||||||||||||||||||
| Year ended 3/31/2014 | 41.51 | .28 | 6.60 | 6.88 | — | 48.39 | 16.58 | 31 | 1.70 | .62 | ||||||||||||||||||||||||||||||
| Year ended 3/31/2013 | 38.61 | .26 | 2.92 | 3.18 | (.28 | ) | 41.51 | 8.26 | 39 | 1.71 | .68 | |||||||||||||||||||||||||||||
| Year ended 3/31/2012 | 41.77 | �� | .32 | (3.29 | ) | (2.97 | ) | (.19 | ) | 38.61 | (7.05 | ) | 52 | 1.70 | .83 | |||||||||||||||||||||||||
| Year ended 3/31/2011 | 37.68 | .21 | 4.09 | 4.30 | (.21 | ) | 41.77 | 11.43 | 79 | 1.68 | .56 | |||||||||||||||||||||||||||||
| 30 | EuroPacific Growth Fund |
| Income (loss) from investment operations1 | ||||||||||||||||||||||||||||||||||||||||
| Net gains | ||||||||||||||||||||||||||||||||||||||||
| Net asset | (losses) on | Dividends | Net asset | Ratio of | Ratio of | |||||||||||||||||||||||||||||||||||
| value, | Net | securities (both | Total from | (from net | value, | Net assets, | expenses to | net income | ||||||||||||||||||||||||||||||||
| beginning | investment | realized and | investment | investment | end | Total | end of period | average | to average | |||||||||||||||||||||||||||||||
| of period | income2 | unrealized) | operations | income) | of period | return3,4 | (in millions) | net assets | net assets2 | |||||||||||||||||||||||||||||||
| Class 529-C: | ||||||||||||||||||||||||||||||||||||||||
| Year ended 3/31/2015 | $ | 47.88 | $ | .02 | $ | .73 | $ | .75 | $ | (.25 | ) | $ | 48.38 | 1.62 | % | $ | 374 | 1.67 | % | .04 | % | |||||||||||||||||||
| Year ended 3/31/2014 | 41.15 | .29 | 6.54 | 6.83 | (.10 | ) | 47.88 | 16.57 | 378 | 1.68 | .66 | |||||||||||||||||||||||||||||
| Year ended 3/31/2013 | 38.36 | .24 | 2.93 | 3.17 | (.38 | ) | 41.15 | 8.29 | 329 | 1.70 | .62 | |||||||||||||||||||||||||||||
| Year ended 3/31/2012 | 41.60 | .29 | (3.26 | ) | (2.97 | ) | (.27 | ) | 38.36 | (7.05 | ) | 321 | 1.68 | .77 | ||||||||||||||||||||||||||
| Year ended 3/31/2011 | 37.58 | .20 | 4.09 | 4.29 | (.27 | ) | 41.60 | 11.46 | 356 | 1.67 | .52 | |||||||||||||||||||||||||||||
| Class 529-E: | ||||||||||||||||||||||||||||||||||||||||
| Year ended 3/31/2015 | 48.49 | .27 | .75 | 1.02 | (.51 | ) | 49.00 | 2.15 | 62 | 1.14 | .57 | |||||||||||||||||||||||||||||
| Year ended 3/31/2014 | 41.65 | .54 | 6.63 | 7.17 | (.33 | ) | 48.49 | 17.22 | 63 | 1.15 | 1.19 | |||||||||||||||||||||||||||||
| Year ended 3/31/2013 | 38.82 | .44 | 2.97 | 3.41 | (.58 | ) | 41.65 | 8.86 | 53 | 1.17 | 1.14 | |||||||||||||||||||||||||||||
| Year ended 3/31/2012 | 42.11 | .50 | (3.32 | ) | (2.82 | ) | (.47 | ) | 38.82 | (6.58 | ) | 50 | 1.16 | 1.29 | ||||||||||||||||||||||||||
| Year ended 3/31/2011 | 38.02 | .39 | 4.16 | 4.55 | (.46 | ) | 42.11 | 12.03 | 55 | 1.16 | 1.02 | |||||||||||||||||||||||||||||
| Class 529-F-1: | ||||||||||||||||||||||||||||||||||||||||
| Year ended 3/31/2015 | 48.89 | .51 | .74 | 1.25 | (.74 | ) | 49.40 | 2.62 | 96 | .67 | 1.04 | |||||||||||||||||||||||||||||
| Year ended 3/31/2014 | 41.97 | .75 | 6.70 | 7.45 | (.53 | ) | 48.89 | 17.75 | 90 | .68 | 1.65 | |||||||||||||||||||||||||||||
| Year ended 3/31/2013 | 39.11 | .63 | 3.00 | 3.63 | (.77 | ) | 41.97 | 9.37 | 74 | .70 | 1.60 | |||||||||||||||||||||||||||||
| Year ended 3/31/2012 | 42.45 | .69 | (3.36 | ) | (2.67 | ) | (.67 | ) | 39.11 | (6.09 | ) | 65 | .68 | 1.78 | ||||||||||||||||||||||||||
| Year ended 3/31/2011 | 38.30 | .58 | 4.22 | 4.80 | (.65 | ) | 42.45 | 12.58 | 71 | .66 | 1.50 | |||||||||||||||||||||||||||||
| Class R-1: | ||||||||||||||||||||||||||||||||||||||||
| Year ended 3/31/2015 | 47.64 | .06 | .72 | .78 | (.28 | ) | 48.14 | 1.67 | 285 | 1.59 | .12 | |||||||||||||||||||||||||||||
| Year ended 3/31/2014 | 40.90 | .33 | 6.50 | 6.83 | (.09 | ) | 47.64 | 16.70 | 299 | 1.61 | .75 | |||||||||||||||||||||||||||||
| Year ended 3/31/2013 | 38.12 | .27 | 2.90 | 3.17 | (.39 | ) | 40.90 | 8.36 | 288 | 1.61 | .72 | |||||||||||||||||||||||||||||
| Year ended 3/31/2012 | 41.34 | .32 | (3.24 | ) | (2.92 | ) | (.30 | ) | 38.12 | (6.98 | ) | 300 | 1.61 | .85 | ||||||||||||||||||||||||||
| Year ended 3/31/2011 | 37.36 | .21 | 4.08 | 4.29 | (.31 | ) | 41.34 | 11.52 | 330 | 1.62 | .57 | |||||||||||||||||||||||||||||
| Class R-2: | ||||||||||||||||||||||||||||||||||||||||
| Year ended 3/31/2015 | 47.96 | .07 | .73 | .80 | (.27 | ) | 48.49 | 1.70 | 975 | 1.57 | .15 | |||||||||||||||||||||||||||||
| Year ended 3/31/2014 | 41.20 | .34 | 6.54 | 6.88 | (.12 | ) | 47.96 | 16.71 | 1,079 | 1.57 | .76 | |||||||||||||||||||||||||||||
| Year ended 3/31/2013 | 38.39 | .28 | 2.92 | 3.20 | (.39 | ) | 41.20 | 8.41 | 1,041 | 1.60 | .74 | |||||||||||||||||||||||||||||
| Year ended 3/31/2012 | 41.60 | .33 | (3.26 | ) | (2.93 | ) | (.28 | ) | 38.39 | (7.00 | ) | 1,098 | 1.62 | .87 | ||||||||||||||||||||||||||
| Year ended 3/31/2011 | 37.56 | .23 | 4.09 | 4.32 | (.28 | ) | 41.60 | 11.54 | 1,353 | 1.61 | .60 | |||||||||||||||||||||||||||||
| Class R-2E: | ||||||||||||||||||||||||||||||||||||||||
| Period from 8/29/2014 to 3/31/20155,6 | 50.08 | .10 | .27 | .37 | (.78 | ) | 49.67 | .82 | — | 7 | 1.26 | .28 | ||||||||||||||||||||||||||||
| Class R-3: | ||||||||||||||||||||||||||||||||||||||||
| Year ended 3/31/2015 | 48.40 | .28 | .74 | 1.02 | (.49 | ) | 48.93 | 2.16 | 6,482 | 1.13 | .59 | |||||||||||||||||||||||||||||
| Year ended 3/31/2014 | 41.56 | .54 | 6.62 | 7.16 | (.32 | ) | 48.40 | 17.24 | 7,219 | 1.14 | 1.20 | |||||||||||||||||||||||||||||
| Year ended 3/31/2013 | 38.73 | .46 | 2.96 | 3.42 | (.59 | ) | 41.56 | 8.87 | 6,962 | 1.14 | 1.18 | |||||||||||||||||||||||||||||
| Year ended 3/31/2012 | 42.01 | .51 | (3.31 | ) | (2.80 | ) | (.48 | ) | 38.73 | (6.52 | ) | 6,922 | 1.14 | 1.32 | ||||||||||||||||||||||||||
| Year ended 3/31/2011 | 37.93 | .41 | 4.13 | 4.54 | (.46 | ) | 42.01 | 12.03 | 7,810 | 1.13 | 1.06 | |||||||||||||||||||||||||||||
See page 32 for footnotes.
| EuroPacific Growth Fund | 31 |
Financial highlights (continued)
| Income (loss) from investment operations1 | ||||||||||||||||||||||||||||||||||||||||
| Net gains | ||||||||||||||||||||||||||||||||||||||||
| Net asset | (losses) on | Dividends | Net asset | Ratio of | Ratio of | |||||||||||||||||||||||||||||||||||
| value, | Net | securities (both | Total from | (from net | value, | Net assets, | expenses to | net income | ||||||||||||||||||||||||||||||||
| beginning | investment | realized and | investment | investment | end | Total | end of period | average | to average | |||||||||||||||||||||||||||||||
| of period | income2 | unrealized) | operations | income) | of period | return3,4 | (in millions) | net assets | net assets2 | |||||||||||||||||||||||||||||||
| Class R-4: | ||||||||||||||||||||||||||||||||||||||||
| Year ended 3/31/2015 | $ | 48.48 | $ | .42 | $ | .74 | $ | 1.16 | $ | (.65 | ) | $ | 48.99 | 2.45 | % | $ | 13,488 | .84 | % | .88 | % | |||||||||||||||||||
| Year ended 3/31/2014 | 41.63 | .67 | 6.64 | 7.31 | (.46 | ) | 48.48 | 17.57 | 14,394 | .84 | 1.50 | |||||||||||||||||||||||||||||
| Year ended 3/31/2013 | 38.79 | .57 | 2.98 | 3.55 | (.71 | ) | 41.63 | 9.20 | 12,961 | .85 | 1.47 | |||||||||||||||||||||||||||||
| Year ended 3/31/2012 | 42.09 | .62 | (3.33 | ) | (2.71 | ) | (.59 | ) | 38.79 | (6.25 | ) | 12,490 | .85 | 1.61 | ||||||||||||||||||||||||||
| Year ended 3/31/2011 | 38.00 | .51 | 4.16 | 4.67 | (.58 | ) | 42.09 | 12.35 | 13,775 | .85 | 1.32 | |||||||||||||||||||||||||||||
| Class R-5: | ||||||||||||||||||||||||||||||||||||||||
| Year ended 3/31/2015 | 49.32 | .59 | .74 | 1.33 | (.80 | ) | 49.85 | 2.77 | 11,418 | .53 | 1.19 | |||||||||||||||||||||||||||||
| Year ended 3/31/2014 | 42.33 | .82 | 6.76 | 7.58 | (.59 | ) | 49.32 | 17.93 | 12,197 | .54 | 1.79 | |||||||||||||||||||||||||||||
| Year ended 3/31/2013 | 39.43 | .70 | 3.02 | 3.72 | (.82 | ) | 42.33 | 9.54 | 13,746 | .55 | 1.78 | |||||||||||||||||||||||||||||
| Year ended 3/31/2012 | 42.78 | .76 | (3.40 | ) | (2.64 | ) | (.71 | ) | 39.43 | (5.99 | ) | 14,016 | .55 | 1.93 | ||||||||||||||||||||||||||
| Year ended 3/31/2011 | 38.59 | .65 | 4.22 | 4.87 | (.68 | ) | 42.78 | 12.70 | 16,572 | .55 | 1.65 | |||||||||||||||||||||||||||||
| Class R-6: | ||||||||||||||||||||||||||||||||||||||||
| Year ended 3/31/2015 | 49.38 | .60 | .74 | 1.34 | (.82 | ) | 49.90 | 2.80 | 38,346 | .49 | 1.20 | |||||||||||||||||||||||||||||
| Year ended 3/31/2014 | 42.38 | .85 | 6.76 | 7.61 | (.61 | ) | 49.38 | 17.97 | 32,575 | .49 | 1.85 | |||||||||||||||||||||||||||||
| Year ended 3/31/2013 | 39.48 | .70 | 3.04 | 3.74 | (.84 | ) | 42.38 | 9.58 | 22,744 | .50 | 1.76 | |||||||||||||||||||||||||||||
| Year ended 3/31/2012 | 42.85 | .73 | (3.36 | ) | (2.63 | ) | (.74 | ) | 39.48 | (5.94 | ) | 17,603 | .50 | 1.88 | ||||||||||||||||||||||||||
| Year ended 3/31/2011 | 38.65 | .63 | 4.28 | 4.91 | (.71 | ) | 42.85 | 12.78 | 13,786 | .50 | 1.61 | |||||||||||||||||||||||||||||
| Year ended March 31 | ||||||||||||||||||||
| 2015 | 2014 | 2013 | 2012 | 2011 | ||||||||||||||||
| Portfolio turnover rate for all share classes | 28 | % | 28 | % | 27 | % | 24 | % | 31 | % | ||||||||||
| 1 | Based on average shares outstanding. |
| 2 | For the year ended March 31, 2014, this column reflects the impact of a corporate action event that resulted in a one-time increase to net investment income. If the corporate action event had not occurred, the Class A net investment income per share and ratio of net income to average net assets would have been lower by $.19 and .40 percentage points, respectively. The impact to the other share classes would have been similar. |
| 3 | Total returns exclude any applicable sales charges, including contingent deferred sales charges. |
| 4 | Not annualized. |
| 5 | Based on operations for the period shown and, accordingly, is not representative of a full year. |
| 6 | Class R-2E shares were offered beginning August 29, 2014. |
| 7 | Amount less than $1 million. |
See Notes to Financial Statements
| 32 | EuroPacific Growth Fund |
Report of Independent Registered Public Accounting Firm
To the Shareholders and Board of Trustees of EuroPacific Growth Fund:
We have audited the accompanying statement of assets and liabilities of EuroPacific Growth Fund (the “Fund”), including the summary investment portfolio, as of March 31, 2015, and the related statement of operations for the year then ended, the statements of changes in net assets for each of the two years in the period then ended, and the financial highlights for each of the periods presented. These financial statements and financial highlights are the responsibility of the Fund’s management. Our responsibility is to express an opinion on these financial statements and financial highlights based on our audits.
We conducted our audits in accordance with the standards of the Public Company Accounting Oversight Board (United States). Those standards require that we plan and perform the audit to obtain reasonable assurance about whether the financial statements and financial highlights are free of material misstatement. The Fund is not required to have, nor were we engaged to perform, an audit of its internal control over financial reporting. Our audits included consideration of internal control over financial reporting as a basis for designing audit procedures that are appropriate in the circumstances, but not for the purpose of expressing an opinion on the effectiveness of the Fund’s internal control over financial reporting. Accordingly, we express no such opinion. An audit also includes examining, on a test basis, evidence supporting the amounts and disclosures in the financial statements, assessing the accounting principles used and significant estimates made by management, as well as evaluating the overall financial statement presentation. Our procedures included confirmation of securities owned as of March 31, 2015, by correspondence with the custodian and brokers; where replies were not received from brokers, we performed other auditing procedures. We believe that our audits provide a reasonable basis for our opinion.
In our opinion, such financial statements and financial highlights referred to above present fairly, in all material respects, the financial position of EuroPacific Growth Fund as of March 31, 2015, the results of its operations for the year then ended, the changes in its net assets for each of the two years in the period then ended, and the financial highlights for each of the periods presented, in conformity with accounting principles generally accepted in the United States of America.
Deloitte & Touche LLP
Costa Mesa, California
May 8, 2015
| EuroPacific Growth Fund | 33 |
| Expense example | unaudited |
As a fund shareholder, you incur two types of costs: (1) transaction costs, such as initial sales charges on purchase payments and contingent deferred sales charges on redemptions (loads), and (2) ongoing costs, including management fees, distribution and service (12b-1) fees, and other expenses. This example is intended to help you understand your ongoing costs (in dollars) of investing in the fund so you can compare these costs with the ongoing costs of investing in other mutual funds. The example is based on an investment of $1,000 invested at the beginning of the period and held for the entire six-month period (October 1, 2014, through March 31, 2015).
Actual expenses:
The first line of each share class in the table on the following page provides information about actual account values and actual expenses. You may use the information in this line, together with the amount you invested, to estimate the expenses that you paid over the period. Simply divide your account value by $1,000 (for example, an $8,600 account value divided by $1,000 = 8.6), then multiply the result by the number in the first line under the heading entitled “Expenses paid during period” to estimate the expenses you paid on your account during this period.
Hypothetical example for comparison purposes:
The second line of each share class in the table on the following page provides information about hypothetical account values and hypothetical expenses based on the actual expense ratio for the share class and an assumed rate of return of 5.00% per year before expenses, which is not the actual return of the share class. The hypothetical account values and expenses may not be used to estimate the actual ending account balance or expenses you paid for the period. You may use this information to compare the ongoing costs of investing in the fund and other funds. To do so, compare this 5.00% hypothetical example with the 5.00% hypothetical examples that appear in the shareholder reports of the other funds.
Notes:
Retirement plan participants may be subject to certain fees charged by the plan sponsor, and Class F-1, F-2 and 529-F-1 shareholders may be subject to fees charged by financial intermediaries, typically ranging from 0.75% to 1.50% of assets annually depending on services offered. You can estimate the impact of these fees by adding the amount of the fees to the total estimated expenses you paid on your account during the period as calculated above. In addition, your ending account value would be lower by the amount of these fees.
Note that the expenses shown in the table on the following page are meant to highlight your ongoing costs only and do not reflect any transactional costs, such as sales charges (loads). Therefore, the second line of each share class in the table is useful in comparing ongoing costs only and will not help you determine the relative total costs of owning different funds. In addition, if these transactional costs were included, your costs would have been higher.
| 34 | EuroPacific Growth Fund |
| Beginning account value 10/1/2014 | Ending account value 3/31/2015 | Expenses paid during period* | Annualized expense ratio | |||||||||||||
| Class A - actual return | $ | 1,000.00 | $ | 1,040.77 | $ | 4.32 | .85 | % | ||||||||
| Class A - assumed 5% return | 1,000.00 | 1,020.69 | 4.28 | .85 | ||||||||||||
| Class B - actual return | 1,000.00 | 1,036.86 | 8.02 | 1.58 | ||||||||||||
| Class B - assumed 5% return | 1,000.00 | 1,017.05 | 7.95 | 1.58 | ||||||||||||
| Class C - actual return | 1,000.00 | 1,036.47 | 8.23 | 1.62 | ||||||||||||
| Class C - assumed 5% return | 1,000.00 | 1,016.85 | 8.15 | 1.62 | ||||||||||||
| Class F-1 - actual return | 1,000.00 | 1,040.64 | 4.38 | .86 | ||||||||||||
| Class F-1 - assumed 5% return | 1,000.00 | 1,020.64 | 4.33 | .86 | ||||||||||||
| Class F-2 - actual return | 1,000.00 | 1,041.94 | 3.00 | .59 | ||||||||||||
| Class F-2 - assumed 5% return | 1,000.00 | 1,021.99 | 2.97 | .59 | ||||||||||||
| Class 529-A - actual return | 1,000.00 | 1,040.48 | 4.58 | .90 | ||||||||||||
| Class 529-A - assumed 5% return | 1,000.00 | 1,020.44 | 4.53 | .90 | ||||||||||||
| Class 529-B - actual return | 1,000.00 | 1,036.16 | 8.63 | 1.70 | ||||||||||||
| Class 529-B - assumed 5% return | 1,000.00 | 1,016.45 | 8.55 | 1.70 | ||||||||||||
| Class 529-C - actual return | 1,000.00 | 1,036.30 | 8.53 | 1.68 | ||||||||||||
| Class 529-C - assumed 5% return | 1,000.00 | 1,016.55 | 8.45 | 1.68 | ||||||||||||
| Class 529-E - actual return | 1,000.00 | 1,039.24 | 5.85 | 1.15 | ||||||||||||
| Class 529-E - assumed 5% return | 1,000.00 | 1,019.20 | 5.79 | 1.15 | ||||||||||||
| Class 529-F-1 - actual return | 1,000.00 | 1,041.55 | 3.46 | .68 | ||||||||||||
| Class 529-F-1 - assumed 5% return | 1,000.00 | 1,021.54 | 3.43 | .68 | ||||||||||||
| Class R-1 - actual return | 1,000.00 | 1,036.69 | 8.07 | 1.59 | ||||||||||||
| Class R-1 - assumed 5% return | 1,000.00 | 1,017.00 | 8.00 | 1.59 | ||||||||||||
| Class R-2 - actual return | 1,000.00 | 1,036.86 | 7.92 | 1.56 | ||||||||||||
| Class R-2 - assumed 5% return | 1,000.00 | 1,017.15 | 7.85 | 1.56 | ||||||||||||
| Class R-2E - actual return | 1,000.00 | 1,038.70 | 6.46 | 1.27 | ||||||||||||
| Class R-2E - assumed 5% return | 1,000.00 | 1,018.60 | 6.39 | 1.27 | ||||||||||||
| Class R-3 - actual return | 1,000.00 | 1,039.18 | 5.69 | 1.12 | ||||||||||||
| Class R-3 - assumed 5% return | 1,000.00 | 1,019.35 | 5.64 | 1.12 | ||||||||||||
| Class R-4 - actual return | 1,000.00 | 1,040.84 | 4.22 | .83 | ||||||||||||
| Class R-4 - assumed 5% return | 1,000.00 | 1,020.79 | 4.18 | .83 | ||||||||||||
| Class R-5 - actual return | 1,000.00 | 1,042.21 | 2.70 | .53 | ||||||||||||
| Class R-5 - assumed 5% return | 1,000.00 | 1,022.29 | 2.67 | .53 | ||||||||||||
| Class R-6 - actual return | 1,000.00 | 1,042.41 | 2.50 | .49 | ||||||||||||
| Class R-6 - assumed 5% return | 1,000.00 | 1,022.49 | 2.47 | .49 | ||||||||||||
| * | The “expenses paid during period” are equal to the “annualized expense ratio,” multiplied by the average account value over the period, multiplied by the number of days in the period, and divided by 365 (to reflect the one-half year period). |
| EuroPacific Growth Fund | 35 |
| Tax information | unaudited |
We are required to advise you of the federal tax status of certain distributions received by shareholders during the fiscal year. The fund hereby designates the following amounts for the fund’s fiscal year ended March 31, 2015:
| Foreign taxes | $0.08 per share | |||
| Foreign source income | $0.90 per share | |||
| Qualified dividend income | 100% | |||
| U.S. government income that may be exempt from state taxation | $4,044,000 |
Individual shareholders should refer to their Form 1099 or other tax information, which will be mailed in January 2016, to determine the calendar year amounts to be included on their 2015 tax returns. Shareholders should consult their tax advisors.
| 36 | EuroPacific Growth Fund |
Approval of Investment Advisory and Service Agreement
EuroPacific Growth Fund’s board has approved the fund’s Investment Advisory and Service Agreement (the “agreement”) with Capital Research and Management Company (“CRMC”) through January 31, 2016. The agreement was amended to add additional advisory fee breakpoints if and when the fund’s net assets exceed $144 billion. The board approved the agreement following the recommendation of the fund’s Contracts Committee (the “committee”), which is composed of all of the fund’s independent board members. The board and the committee determined that the fund’s advisory fee structure was fair and reasonable in relation to the services provided and that approving the agreement was in the best interests of the fund and its shareholders.
In reaching this decision, the board and the committee took into account information furnished to them throughout the year and otherwise provided to them, as well as information prepared specifically in connection with their review of the agreement, and were advised by their independent counsel. They considered the following factors, among others, but did not identify any single issue or particular piece of information that, in isolation, was the controlling factor, and each board and committee member did not necessarily attribute the same weight to each factor.
1. Nature, extent and quality of services
The board and the committee considered the depth and quality of CRMC’s investment management process, including its global research capabilities; the experience, capability and integrity of its senior management and other personnel; the low turnover rates of its key personnel; the overall financial strength and stability of CRMC and the Capital Group organization; and the ongoing evolution of CRMC’s organizational structure designed to maintain and strengthen these qualities. The board and the committee also considered the nature, extent and quality of administrative, compliance and shareholder services provided by CRMC to the fund under the agreement and other agreements, as well as the benefits to fund shareholders from investing in a fund that is part of a large family of funds. The board and the committee concluded that the nature, extent and quality of the services provided by CRMC have benefited and should continue to benefit the fund and its shareholders.
2. Investment results
The board and the committee considered the investment results of the fund in light of its objective of providing long-term growth of capital. They compared the fund’s investment results with those of other relevant funds (including funds that form the basis of the Lipper index for the category in which the fund is included), and data such as relevant market and fund indexes, over various periods through June 30, 2014. This report, including the letter to shareholders and related disclosures, contains certain information about the fund’s investment results. The board and the committee reviewed the fund’s investment results measured against various indexes, including the Lipper International Funds Index, the MSCI ACWI (All Country World Index) ex USA and the MSCI EAFE Index. They noted that the investment results of the fund generally compared favorably to those of these indexes for the 20-year period and 10-year period, and were mixed for shorter periods. The board and the committee concluded that the fund’s investment results have been satisfactory for renewal of the agreement, and that CRMC’s record in managing the fund indicated that its continued management should benefit the fund and its shareholders.
3. Advisory fees and total expenses
The board and the committee compared the advisory fees and total expense levels of the fund to those of other relevant funds. They observed that the fund’s advisory fees and expenses generally compared favorably to those of other similar funds included in the Lipper International Funds category. The board and the committee also considered the breakpoint discounts in the fund’s advisory fee structure that reduce the level of fees charged by CRMC to the fund as fund assets increase. In addition, they reviewed information regarding the effective advisory fees charged to non-mutual fund clients by CRMC and its affiliates. They noted that, to the extent there were differences between the advisory fees paid by the fund and the advisory fees paid by those clients, the differences appropriately reflected the investment, operational and regulatory differences between advising the fund and the other clients. The board and the committee concluded that the fund’s cost structure was fair and reasonable in relation to the services provided, and that the fund’s shareholders receive reasonable value in return for the advisory fees and other amounts paid to CRMC by the fund.
| EuroPacific Growth Fund | 37 |
4. Ancillary benefits
The board and the committee considered a variety of other benefits that CRMC and its affiliates receive as a result of CRMC’s relationship with the fund and the other American Funds, including fees for administrative services provided to certain share classes; fees paid to CRMC’s affiliated transfer agent; sales charges and distribution fees received and retained by the fund’s principal underwriter, an affiliate of CRMC; and possible ancillary benefits to CRMC and its institutional management affiliates in managing other investment vehicles. The board and the committee reviewed CRMC’s portfolio trading practices, noting that while CRMC received the benefit of research provided by broker-dealers executing portfolio transactions made on behalf of the fund, it did not obtain third-party research or other services in return for allocating brokerage to such broker-dealers. The board and the committee took these ancillary benefits into account in evaluating the reasonableness of the advisory fees and other amounts paid to CRMC by the fund.
5. Adviser financial information
The board and the committee reviewed information regarding CRMC’s costs of providing services to the American Funds, including personnel, systems and resources of investment, compliance, trading, accounting and other administrative operations. They considered CRMC’s costs and willingness to invest in technology, infrastructure and staff to maintain and expand services and capabilities, respond to industry and regulatory developments, and attract and retain qualified personnel. They noted information regarding the compensation structure for CRMC’s investment professionals. The board and the committee also compared CRMC’s profitability and compensation data to the reported results and data of several large, publicly held investment management companies. The board and the committee noted the competitiveness and cyclicality of both the mutual fund industry and the capital markets, and the importance in that environment of CRMC’s long-term profitability for maintaining its independence, company culture and management continuity. They further considered the breakpoint discounts in the fund’s advisory fee structure. The board and the committee concluded that the fund’s advisory fee structure reflected a reasonable sharing of benefits between CRMC and the fund’s shareholders.
| 38 | EuroPacific Growth Fund |
Board of trustees and other officers
Independent trustees1
| Name and year of birth | Year first elected a trustee of the fund2 | Principal occupation(s) during past five years | Number of portfolios in fund complex overseen by trustee | Other directorships3 held by trustee | ||||
| Elisabeth Allison, 1946 | 1991 | Trustee and Co-Director, The Stanton Foundation; former Senior Business Advisor, Harvard Medical School | 3 | None | ||||
| Vanessa C. L. Chang, 1952 | 2005 | Director, EL & EL Investments (real estate) | 7 | Edison International; Transocean Ltd. | ||||
| Nicholas Donatiello, Jr., 1960 | 2008 | President and CEO, Odyssey Ventures, Inc. (business strategy and marketing consulting); Lecturer, Graduate School of Business, Stanford University | 3 | Dolby Laboratories, Inc. | ||||
| Pablo R. González Guajardo, 1967 | 2014 | CEO, Kimberly-Clark de México, S.A.B. de C.V. | 3 | Kimberly-Clark de México, S.A.B. de C.V.; América Móvil, S.A.B. de C.V.; Grupo Sanborns, S.A.B. de C.V.; Grupo Lala, S.A.B. de C.V. | ||||
| Koichi Itoh, 1940 Chairman of the Board (Independent and Non-Executive) | 1994 | Chairman of the Board, Itoh Building Co., Ltd. (building management) | 6 | None | ||||
| William H. Kling, 1942 | 1987 | President Emeritus and former CEO, American Public Media | 10 | None | ||||
| William I. Miller, 1956 | 1992 | President, The Wallace Foundation; Chairman of the Board, Irwin Management Company | 3 | Cummins, Inc. | ||||
| Alessandro Ovi, 1944 | 2002 | Publisher and Editor, Technology Review; President, TechRev.srl; former Special Advisor to the Italian Prime Minister (2005–2008); former Special Advisor to the President of the European Commission (2001–2005) | 3 | Guala Closures SpA; Landi Renzo SpA; ST Microelectronics SNV |
Interested trustee4,5
| Name, year of birth and position with fund | Year first elected a trustee or officer of the fund2 | Principal occupation(s) during past five years and positions held with affiliated entities or the principal underwriter of the fund | Number of portfolios in fund complex overseen by trustee | Other directorships3 held by trustee | ||||
| Carl M. Kawaja, 1964 Vice Chairman of the Board and President | 2003 | Partner — Capital World Investors, Capital Research and Management Company; Director, Capital Research and Management Company; Chairman of the Board, Capital International Asset Management (Canada), Inc.6 | 1 | None |
The fund’s statement of additional information includes further details about fund trustees and is available without charge upon request by calling American Funds Service Company at (800) 421-4225 or by visiting the American Funds website at americanfunds.com. The address for all trustees and officers of the fund is 333 South Hope Street, Los Angeles, CA 90071, Attention: Secretary.
| EuroPacific Growth Fund | 39 |
Other officers5
| Name, year of birth and position with fund | Year first elected an officer of the fund2 | Principal occupation(s) during past five years and positions held with affiliated entities or the principal underwriter of the fund | ||
| Mark E. Denning, 1957 Executive Vice President | 1994 | Director, Capital Research and Management Company; Partner — Capital Research Global Investors, Capital Research Company;6 Partner — Capital Research Global Investors, Capital International, Inc.6 | ||
| Jonathan Knowles, PhD, 1961 Senior Vice President | 2012 | Partner — Capital World Investors, Capital International, Inc.;6 Director, The Capital Group Companies, Inc.6 | ||
| Sung Lee, 1966 Senior Vice President | 2003 | Partner — Capital Research Global Investors, Capital International, Inc.6 | ||
| Walter R. Burkley, 1966 Vice President | 2012 | Senior Vice President and Senior Counsel — Fund Business Management Group, Capital Research and Management Company; Director, Capital Research Company6 | ||
| Michael J. Downer, 1955 Vice President | 2004 | Director, Senior Vice President and Secretary, Capital Research and Management Company; Director, American Funds Distributors, Inc.;6 Chairman of the Board, Capital Bank and Trust Company6 | ||
| Nicholas J. Grace, 1966 Vice President | 2004 | Partner — Capital World Investors, Capital Research Company6 | ||
| Leo K. Hee, 1971 Vice President | 2015 | Partner — Capital World Investors, Capital International, Inc.6 | ||
| Jesper Lyckeus, 1967 Vice President | 2010 | Partner — Capital Research Global Investors, Capital Research Company6 | ||
| Joerg Sponer, 1972 Vice President | 2010 | Partner — Capital Research Global Investors, Capital Research Company6 | ||
| Michael W. Stockton, 1967 Secretary | 2013 | Vice President — Fund Business Management Group, Capital Research and Management Company | ||
| Brian C. Janssen, 1972 Treasurer | 2010 | Vice President — Investment Operations, Capital Research and Management Company | ||
| Jennifer L. Butler, 1966 Assistant Secretary | 2013 | Assistant Vice President — Fund Business Management Group, Capital Research and Management Company | ||
| Dori Laskin, 1951 Assistant Treasurer | 2010 | Vice President — Investment Operations, Capital Research and Management Company | ||
| Ari M. Vinocor, 1974 Assistant Treasurer | 2011 | Vice President — Investment Operations, Capital Research and Management Company | ||
| 1 | The term independent trustee refers to a trustee who is not an “interested person” of the fund within the meaning of the Investment Company Act of 1940. |
| 2 | Trustees and officers of the fund serve until their resignation, removal or retirement. |
| 3 | This includes all directorships/trusteeships (other than those in the American Funds or other funds managed by Capital Research and Management Company or its affiliates) that are held by each trustee as a trustee or director of a public company or a registered investment company. |
| 4 | The term interested trustee refers to a trustee who is an “interested person” within the meaning of the Investment Company Act of 1940, on the basis of their affiliation with the fund’s investment adviser, Capital Research and Management Company, or affiliated entities (including the fund’s principal underwriter). |
| 5 | All of the directors/trustees and/or officers listed, with the exception of Leo K. Hee and Joerg Sponer, are officers and/or directors/trustees of one or more of the other funds for which Capital Research and Management Company serves as investment adviser. |
| 6 | Company affiliated with Capital Research and Management Company. |
| 40 | EuroPacific Growth Fund |
Offices of the fund and of the
investment adviser
Capital Research and Management Company
333 South Hope Street
Los Angeles, CA 90071-1406
6455 Irvine Center Drive
Irvine, CA 92618-4518
Transfer agent for shareholder accounts
American Funds Service Company
(Write to the address near you.)
P.O. Box 6007
Indianapolis, IN 46206-6007
P.O. Box 2280
Norfolk, VA 23501-2280
Custodian of assets
JPMorgan Chase Bank
270 Park Avenue
New York, NY 10017-2070
Counsel
K&L Gates LLP
Four Embarcadero Center, Suite 1200
San Francisco, CA 94111-5994
Independent registered public
accounting firm
Deloitte & Touche LLP
695 Town Center Drive
Suite 1200
Costa Mesa, CA 92626-7188
Principal underwriter
American Funds Distributors, Inc.
333 South Hope Street
Los Angeles, CA 90071-1406
Investors should carefully consider investment objectives, risks, charges and expenses. This and other important information is contained in the fund prospectus and summary prospectus, which can be obtained from your financial professional and should be read carefully before investing. You may also call American Funds Service Company (AFS) at (800) 421-4225 or visit the American Funds website at americanfunds.com.
“American Funds Proxy Voting Procedures and Principles” — which describes how we vote proxies relating to portfolio securities — is available on the American Funds website or upon request by calling AFS. The fund files its proxy voting record with the U.S. Securities and Exchange Commission (SEC) for the 12 months ended June 30 by August 31. The proxy voting record is available free of charge on the SEC website at sec.gov and on the American Funds website.
A complete March 31, 2015, portfolio of EuroPacific Growth Fund’s investments is available free of charge by calling AFS or visiting the SEC website (where it is part of Form N-CSR).
EuroPacific Growth Fund files a complete list of its portfolio holdings with the SEC for the first and third quarters of each fiscal year on Form N-Q. This filing is available free of charge on the SEC website. You may also review or, for a fee, copy this filing at the SEC’s Public Reference Room in Washington, D.C. Additional information regarding the operation of the Public Reference Room may be obtained by calling the SEC’s Office of Investor Education and Advocacy at (800) SEC-0330. Additionally, the list of portfolio holdings is available by calling AFS.
This report is for the information of shareholders of EuroPacific Growth Fund, but it also may be used as sales literature when preceded or accompanied by the current prospectus or summary prospectus, which gives details about charges, expenses, investment objectives and operating policies of the fund. If used as sales material after June 30, 2015, this report must be accompanied by an American Funds statistical update for the most recently completed calendar quarter.
The American Funds Advantage
Since 1931, American Funds, part of Capital Group, has helped investors pursue long-term investment success. Our consistent approach — in combination with The Capital SystemSM — has resulted in a superior long-term track record.
| Aligned with investor success | |
| We base our decisions on a long-term perspective, which we believe aligns our goals with the interests of our clients. Our portfolio managers average 27 years of investment experience, including 22 years at our company, reflecting a career commitment to our long-term approach.1 | |
| The Capital SystemSM | |
| Our investment process, The Capital System, combines individual accountability with teamwork. Each fund is divided into portions that are managed independently by investment professionals with diverse backgrounds, ages and investment approaches. An extensive global research effort is the backbone of our system. | |
| Superior long-term track record | |
| Our equity funds have beaten their Lipper peer indexes in 91% of 10-year periods and 96% of 20-year periods. Our fixed-income funds have beaten their Lipper indexes in 54% of 10-year periods and 57% of 20-year periods.2 Our fund management fees have been among the lowest in the industry.3 | |
| 1 | Portfolio manager experience as of December 31, 2014. | |
| 2 | Based on Class A share results for rolling periods through December 31, 2014. Periods covered are the shorter of the fund’s lifetime or since the comparable Lipper index inception date (except SMALLCAP World Fund, for which the Lipper average was used). | |
| 3 | On average, our management fees were in the lowest quintile 70% of the time, based on the 20-year period ended December 31, 2014, versus comparable Lipper categories, excluding funds of funds. |

ITEM 2 – Code of Ethics
The Registrant has adopted a Code of Ethics that applies to its Principal Executive Officer and Principal Financial Officer. The Registrant undertakes to provide to any person without charge, upon request, a copy of the Code of Ethics. Such request can be made to American Funds Service Company at 800/421-9225 or to the Secretary of the Registrant, 333 South Hope Street, Los Angeles, California 90071.
ITEM 3 – Audit Committee Financial Expert
The Registrant’s board has determined that Elisabeth Allison, a member of the Registrant’s audit committee, is an “audit committee financial expert” and "independent," as such terms are defined in this Item. This designation will not increase the designee’s duties, obligations or liability as compared to his or her duties, obligations and liability as a member of the audit committee and of the board, nor will it reduce the responsibility of the other audit committee members. There may be other individuals who, through education or experience, would qualify as "audit committee financial experts" if the board had designated them as such. Most importantly, the board believes each member of the audit committee contributes significantly to the effective oversight of the Registrant’s financial statements and condition.
ITEM 4 – Principal Accountant Fees and Services
| Registrant: | ||||
| a) Audit Fees: | ||||
| 2014 | $120,000 | |||
| 2015 | $125,000 | |||
| b) Audit-Related Fees: | ||||
| 2014 | $36,000 | |||
| 2015 | $38,000 | |||
| The audit-related fees consist of assurance and related services relating to the examination of the Registrant’s investment adviser conducted in accordance with Statement on Standards for Attestation Engagements Number 16 issued by the American Institute of Certified Public Accountants. | ||||
| c) Tax Fees: | ||||
| 2014 | $45,000 | |||
| 2015 | $34,000 | |||
| The tax fees consist of professional services relating to the preparation of the Registrant’s tax returns including returns relating to the Registrant’s investments in non-U.S. jurisdictions. | ||||
| d) All Other Fees: | ||||
| 2014 | None | |||
| 2015 | None | |||
| Adviser and affiliates (includes only fees for non-audit services billed to the adviser and affiliates for engagements that relate directly to the operations and financial reporting of the Registrant and were subject to the pre-approval policies described below): | ||||
| a) Audit Fees: | ||||
| Not Applicable | ||||
| b) Audit-Related Fees: | ||||
| 2014 | $1,015,000 | |||
| 2015 | $1,027,000 | |||
| The audit-related fees consist of assurance and related services relating to the examination of the Registrant’s transfer agent, principal underwriter and investment adviser conducted in accordance with Statement on Standards for Attestation Engagements Number 16 issued by the American Institute of Certified Public Accountants. | ||||
| c) Tax Fees: | ||||
| 2014 | $43,000 | |||
| 2015 | None | |||
| The tax fees consist of consulting services relating to the Registrant’s investments. | ||||
| d) All Other Fees: | ||||
| 2014 | $3,000 | |||
| 2015 | $5,000 | |||
| The other fees consist of subscription services related to an accounting research tool. | ||||
All audit and permissible non-audit services that the Registrant’s audit committee considers compatible with maintaining the independent registered public accounting firm’s independence are required to be pre-approved by the committee. The pre-approval requirement will extend to all non-audit services provided to the Registrant, the investment adviser, and any entity controlling, controlled by, or under common control with the investment adviser that provides ongoing services to the Registrant, if the engagement relates directly to the operations and financial reporting of the Registrant. The committee will not delegate its responsibility to pre-approve these services to the investment adviser. The committee may delegate to one or more committee members the authority to review and pre-approve audit and permissible non-audit services. Actions taken under any such delegation will be reported to the full committee at its next meeting. The pre-approval
requirement is waived with respect to non-audit services if certain conditions are met. The pre-approval requirement was not waived for any of the non-audit services listed above provided to the Registrant, adviser and affiliates.
Aggregate non-audit fees paid to the Registrant’s auditors, including fees for all services billed to the Registrant, adviser and affiliates that provide ongoing services to the Registrant, were $1,432,000 for fiscal year 2014 and $1,538,000 for fiscal year 2015. The non-audit services represented by these amounts were brought to the attention of the committee and considered to be compatible with maintaining the auditors’ independence.
ITEM 5 – Audit Committee of Listed Registrants
Not applicable to this Registrant, insofar as the Registrant is not a listed issuer as defined in Rule 10A-3 under the Securities Exchange Act of 1934.
ITEM 6 – Schedule of Investments

| Common stocks 88.35% Financials 19.70% | Shares | Value (000) |
| HDFC Bank Ltd.1 | 96,247,659 | $1,841,501 |
| HDFC Bank Ltd. (ADR) | 8,482,300 | 499,523 |
| Prudential PLC1 | 89,873,984 | 2,225,299 |
| Barclays PLC1 | 594,827,410 | 2,134,352 |
| AIA Group Ltd.1 | 266,353,200 | 1,669,370 |
| Housing Development Finance Corp. Ltd.1 | 62,275,570 | 1,308,907 |
| Axis Bank Ltd.1 | 104,167,415 | 934,322 |
| Fairfax Financial Holdings Ltd.2 | 868,291 | 485,036 |
| Fairfax Financial Holdings Ltd. (CAD denominated)2 | 781,878 | 438,304 |
| Société Générale1 | 18,737,804 | 905,924 |
| ICICI Bank Ltd.1 | 164,528,802 | 828,863 |
| Kotak Mahindra Bank Ltd.1 | 38,186,776 | 800,281 |
| ORIX Corp.1 | 55,001,700 | 773,610 |
| AXA SA1 | 29,278,157 | 738,297 |
| Brookfield Asset Management Inc., Class A | 12,330,000 | 661,011 |
| Banco Santander, SA1,3 | 76,519,435 | 575,505 |
| Bank of Ireland1,3 | 1,492,838,553 | 564,912 |
| Sun Hung Kai Properties Ltd.1 | 36,030,101 | 554,669 |
| Sumitomo Mitsui Financial Group, Inc.1 | 13,215,000 | 506,389 |
| Investment AB Kinnevik, Class B1 | 14,450,461 | 481,763 |
| Credit Suisse Group AG1 | 16,284,374 | 438,404 |
| Commerzbank AG, non-registered shares1,3 | 30,509,327 | 420,661 |
| Henderson Land Development Co. Ltd.1 | 57,164,116 | 400,945 |
| Hana Financial Group Inc.1 | 13,624,630 | 352,244 |
| UniCredit SpA1 | 48,753,167 | 330,683 |
| ING Groep NV, depository receipts1,3 | 21,240,000 | 311,535 |
| Deutsche Bank AG1 | 8,318,333 | 289,412 |
| BNP Paribas SA1 | 4,273,981 | 259,934 |
| Link Real Estate Investment Trust1 | 41,391,971 | 254,716 |
| China Overseas Land & Investment Ltd.1 | 65,500,000 | 211,870 |
| Sberbank of Russia (ADR)1 | 19,940,000 | 87,511 |
| Sberbank of Russia (ADR) | 13,760,875 | 60,135 |
| Sberbank of Russia (GDR)1,4 | 11,167,686 | 49,012 |
| Aegon NV1 | 24,562,997 | 194,050 |
| Sampo Oyj, Class A1 | 3,840,000 | 194,037 |
| UBS Group AG1 | 10,049,020 | 188,596 |
| St. James’s Place PLC1 | 13,368,584 | 184,981 |
| Ayala Land, Inc.1 | 207,715,700 | 178,684 |
| Ayala Land, Inc., preference shares1,3 | 481,283,600 | 1,077 |
| Itaú Unibanco Holding SA, preferred nominative (ADR) | 15,590,000 | 172,425 |
| Bankia, SA1,3 | 122,014,203 | 169,868 |
| Svenska Handelsbanken AB, Class A1 | 3,269,000 | 147,542 |
| Resona Holdings, Inc.1 | 27,900,000 | 138,700 |
| Aberdeen Asset Management PLC1 | 19,101,195 | 130,147 |
| CK Hutchison Holdings Ltd.1 | 6,310,000 | 129,090 |
| Siam Commercial Bank PCL1 | 19,946,100 | 108,965 |
| Daito Trust Construction Co., Ltd.1 | 897,700 | 100,422 |
| Common stocks Financials (continued) | Shares | Value (000) |
| AEON Financial Service Co., Ltd.1 | 3,915,000 | $98,903 |
| Assicurazioni Generali SpA1 | 4,410,000 | 86,786 |
| Grupo Financiero Santander México, SAB de CV, Class B (ADR) | 7,913,300 | 86,413 |
| Shinsei Bank, Ltd.1 | 42,327,000 | 84,242 |
| Toronto-Dominion Bank | 1,917,313 | 82,063 |
| RSA Insurance Group PLC1 | 10,961,180 | 68,340 |
| Industrial and Commercial Bank of China Ltd., Class H1 | 87,810,255 | 64,820 |
| Bank of the Philippine Islands1 | 28,000,000 | 62,822 |
| Investor AB, Class B1 | 1,557,614 | 62,056 |
| Bancolombia SA (ADR) | 1,530,000 | 60,175 |
| Banca Monte dei Paschi di Siena SPA1,3 | 89,789,914 | 59,512 |
| HSBC Holdings PLC (HKD denominated)1 | 6,186,800 | 53,087 |
| Eurobank Ergasias SA1,3 | 112,500,874 | 12,679 |
| 25,315,382 | ||
| Consumer discretionary 14.22% | ||
| Toyota Motor Corp.1 | 22,558,800 | 1,574,414 |
| Altice SA1,2,3 | 14,212,741 | 1,534,853 |
| Liberty Global PLC, Class C3 | 14,794,834 | 736,931 |
| Liberty Global PLC, Class A3 | 14,066,000 | 723,977 |
| Volkswagen AG, nonvoting preferred1 | 4,527,581 | 1,204,846 |
| Naspers Ltd., Class N1 | 6,593,200 | 1,012,314 |
| Rakuten, Inc.1 | 57,323,300 | 1,011,291 |
| Numericable-SFR, non-registered shares1,3 | 16,305,699 | 889,196 |
| Industria de Diseño Textil, SA1 | 23,630,000 | 757,628 |
| Ctrip.com International, Ltd. (ADR)2,3 | 9,034,000 | 529,573 |
| Publicis Groupe SA1 | 6,615,858 | 510,807 |
| Barratt Developments PLC1,2 | 58,322,000 | 456,697 |
| Sands China Ltd.1 | 93,499,200 | 386,236 |
| Renault SA1 | 4,055,922 | 369,637 |
| Kering SA1 | 1,784,000 | 348,706 |
| Li & Fung Ltd.1 | 306,226,100 | 298,712 |
| adidas AG1 | 3,682,429 | 291,951 |
| Hyundai Mobis Co., Ltd.1 | 1,269,317 | 281,765 |
| Paddy Power PLC1,2 | 3,204,000 | 274,622 |
| H & M Hennes & Mauritz AB, Class B1 | 6,698,000 | 271,488 |
| Panasonic Corp.1 | 17,833,400 | 234,144 |
| Burberry Group PLC1 | 8,922,000 | 229,134 |
| ASOS PLC1,3 | 4,097,900 | 219,276 |
| Mr Price Group Ltd.1 | 10,047,345 | 214,886 |
| Suzuki Motor Corp.1 | 6,995,000 | 210,430 |
| Sports Direct International PLC1,3 | 22,985,000 | 206,917 |
| Mahindra & Mahindra Ltd.1 | 10,840,000 | 205,573 |
| Kroton Educacional SA, ordinary nominative | 63,262,000 | 203,965 |
| Galaxy Entertainment Group Ltd.1 | 44,110,000 | 200,003 |
| Hero MotoCorp Ltd.1 | 4,638,863 | 195,494 |
| Carnival PLC1 | 3,830,000 | 187,178 |
| Daimler AG1 | 1,910,000 | 183,959 |
| LVMH Moet Hennessy Vuitton SE1 | 980,000 | 172,952 |
| Schibsted ASA1 | 2,882,283 | 166,805 |
| Tata Motors Ltd.1 | 18,743,080 | 163,551 |
| Hyundai Motor Co.1 | 1,048,000 | 159,066 |
| Melco Crown Entertainment Ltd. (ADR) | 7,314,000 | 156,958 |
| Techtronic Industries Co. Ltd.1 | 43,815,000 | 147,577 |
| Nokian Renkaat Oyj1 | 4,918,000 | 146,596 |
| Common stocks Consumer discretionary (continued) | Shares | Value (000) |
| Astra International Tbk PT1 | 208,470,100 | $136,542 |
| Cie. Générale des Établissements Michelin1 | 1,291,975 | 128,639 |
| Shangri-La Asia Ltd.1 | 83,545,142 | 114,638 |
| TOD’S SpA1 | 1,224,376 | 111,110 |
| Global Brands Group Holding Ltd.1,2,3 | 543,368,100 | 106,211 |
| Maruti Suzuki India Ltd.1 | 1,680,000 | 104,139 |
| Accor SA1 | 1,852,000 | 96,730 |
| Ocado Group PLC1,3 | 11,490,000 | 59,925 |
| Kingfisher PLC1 | 10,220,270 | 57,675 |
| SEGA SAMMY HOLDINGS INC.1 | 3,820,000 | 55,834 |
| Genting Singapore PLC1 | 80,300,000 | 53,717 |
| Whitbread PLC1 | 655,225 | 50,922 |
| Fuji Media Holdings, Inc.1 | 3,025,000 | 42,948 |
| Kia Motors Corp.1 | 994,660 | 40,406 |
| MGM China Holdings Ltd.1 | 18,300,000 | 34,342 |
| Hermès International1 | 47,805 | 16,875 |
| 18,280,761 | ||
| Information technology 12.42% | ||
| Murata Manufacturing Co., Ltd.1,2 | 12,427,300 | 1,712,107 |
| Nintendo Co., Ltd.1,2 | 11,332,600 | 1,667,784 |
| Baidu, Inc., Class A (ADR)3 | 8,002,400 | 1,667,700 |
| Taiwan Semiconductor Manufacturing Co., Ltd.1 | 303,242,649 | 1,406,840 |
| Taiwan Semiconductor Manufacturing Co., Ltd. (ADR) | 5,962,723 | 140,005 |
| Tencent Holdings Ltd.1 | 66,249,800 | 1,252,428 |
| Samsung Electronics Co., Ltd.1 | 826,927 | 1,071,948 |
| Samsung Electronics Co., Ltd., nonvoting preferred1 | 48,800 | 48,446 |
| ASML Holding NV1 | 8,496,811 | 865,773 |
| Naver Corp.1 | 1,364,606 | 823,539 |
| Infineon Technologies AG1,2 | 56,918,948 | 681,523 |
| Alibaba Group Holding Ltd. (ADR)3 | 7,333,032 | 610,402 |
| Alcatel-Lucent1,3 | 133,730,799 | 506,093 |
| ARM Holdings PLC1 | 25,675,700 | 420,377 |
| Tech Mahindra Ltd.1 | 38,972,568 | 392,011 |
| Gemalto NV1,2 | 4,804,745 | 383,130 |
| Hexagon AB, Class B1 | 9,784,111 | 347,944 |
| Infosys Ltd.1 | 6,560,000 | 232,168 |
| AAC Technologies Holdings Inc.1 | 36,283,500 | 223,228 |
| TDK Corp.1 | 2,950,000 | 209,668 |
| NetEase, Inc. (ADR) | 1,965,600 | 206,978 |
| Yandex NV, Class A3 | 12,349,600 | 187,282 |
| Samsung SDI Co., Ltd.1 | 1,418,520 | 173,902 |
| Hitachi, Ltd.1 | 15,876,000 | 108,541 |
| Delta Electronics, Inc.1 | 16,275,603 | 102,456 |
| Keyence Corp.1 | 159,500 | 87,120 |
| STMicroelectronics NV1 | 9,187,000 | 85,630 |
| Wirecard AG1 | 1,998,643 | 84,585 |
| Trend Micro Inc.1 | 2,500,000 | 82,486 |
| Quanta Computer Inc.1 | 33,946,530 | 81,783 |
| Mail.Ru Group Ltd. (GDR)1,3 | 3,030,000 | 59,674 |
| ASM Pacific Technology Ltd.1 | 3,127,300 | 32,519 |
| 15,956,070 |
| Common stocks Health care 12.34% | Shares | Value (000) |
| Novo Nordisk A/S, Class B1 | 99,131,991 | $5,304,212 |
| Bayer AG1 | 21,295,666 | 3,199,785 |
| Novartis AG1 | 29,069,832 | 2,874,691 |
| UCB SA1,2 | 12,642,824 | 911,055 |
| Roche Holding AG1 | 2,623,000 | 723,273 |
| Fresenius SE & Co. KGaA1 | 9,725,727 | 580,785 |
| Sysmex Corp.1 | 9,022,200 | 501,485 |
| Grifols, SA, Class A, non-registered shares1 | 5,850,500 | 251,211 |
| Grifols SA, Class B, preferred nonvoting, non-registered shares1 | 5,627,050 | 188,333 |
| Grifols, SA, Class B (ADR) | 1,770,739 | 58,098 |
| Fresenius Medical Care AG & Co. KGaA1 | 3,322,000 | 276,482 |
| AstraZeneca PLC1 | 3,925,000 | 269,099 |
| Sonova Holding AG1 | 1,540,715 | 213,672 |
| Teva Pharmaceutical Industries Ltd. (ADR) | 3,044,000 | 189,641 |
| Merck KGaA1 | 1,545,500 | 173,452 |
| William Demant Holding A/S1,3 | 1,045,900 | 88,826 |
| Sonic Healthcare Ltd.1 | 2,948,000 | 45,799 |
| Lupin Ltd.1 | 208,575 | 6,716 |
| 15,856,615 | ||
| Industrials 7.82% | ||
| International Consolidated Airlines Group, SA (CDI)1,2,3 | 163,039,440 | 1,457,487 |
| Airbus Group NV, non-registered shares1 | 21,831,000 | 1,418,588 |
| Ryanair Holdings PLC (ADR) | 16,365,482 | 1,092,723 |
| Rolls-Royce Holdings PLC1,3 | 53,494,535 | 755,216 |
| easyJet PLC1 | 19,262,836 | 537,544 |
| Jardine Matheson Holdings Ltd.1 | 8,328,700 | 525,700 |
| KONE Oyj, Class B1 | 9,916,000 | 439,567 |
| SMC Corp.1 | 1,348,700 | 402,543 |
| Geberit AG1 | 1,055,000 | 396,042 |
| Babcock International Group PLC1 | 22,104,478 | 322,460 |
| ASSA ABLOY AB, Class B1 | 5,365,000 | 319,761 |
| Hutchison Whampoa Ltd.1 | 21,026,000 | 290,849 |
| Wolseley PLC1 | 4,104,904 | 242,796 |
| Edenred SA1 | 8,850,000 | 220,614 |
| Meggitt PLC1 | 25,818,247 | 209,760 |
| Air France-KLM1,2,3 | 20,573,795 | 180,931 |
| Bureau Veritas SA1 | 8,354,000 | 179,548 |
| Adecco SA1 | 2,120,000 | 176,609 |
| Toshiba Corp.1 | 34,363,000 | 144,259 |
| China State Construction International Holdings Ltd.1 | 96,638,000 | 134,378 |
| Komatsu Ltd.1 | 6,258,000 | 123,077 |
| Randstad Holding NV1 | 1,532,450 | 93,043 |
| DP World Ltd. | 3,935,184 | 85,000 |
| Deutsche Lufthansa AG1 | 5,550,000 | 78,049 |
| SGS SA1 | 38,834 | 74,291 |
| Abertis Infraestructuras, SA, Class A1 | 3,114,300 | 56,287 |
| VINCI SA1 | 770,000 | 44,066 |
| Andritz AG1 | 555,000 | 33,189 |
| ALFA, SAB de CV, Class A, ordinary participation certificates3 | 7,500,000 | 15,144 |
| 10,049,521 |
| Common stocks Consumer staples 6.82% | Shares | Value (000) |
| Associated British Foods PLC1 | 39,095,838 | $1,633,353 |
| British American Tobacco PLC1 | 27,055,999 | 1,397,852 |
| Pernod Ricard SA1 | 8,832,975 | 1,042,327 |
| Nestlé SA1 | 12,040,799 | 909,074 |
| Alimentation Couche-Tard Inc., Class B | 16,281,800 | 648,804 |
| Japan Tobacco Inc.1 | 16,361,000 | 516,941 |
| SABMiller PLC1 | 9,138,000 | 478,180 |
| Seven & i Holdings Co., Ltd.1 | 9,040,000 | 380,408 |
| Kao Corp.1 | 7,282,300 | 363,587 |
| Magnit PJSC (GDR)1 | 5,370,000 | 273,909 |
| Shiseido Co., Ltd.1 | 13,069,800 | 232,217 |
| Wal-Mart de México, SAB de CV, Series V | 65,671,436 | 164,076 |
| Hypermarcas SA, ordinary nominative3 | 20,429,500 | 126,102 |
| Asahi Group Holdings, Ltd.1 | 3,510,000 | 111,528 |
| Hengan International Group Co. Ltd.1 | 7,587,500 | 91,195 |
| Anheuser-Busch InBev NV1 | 670,000 | 81,958 |
| Thai Beverage PCL1 | 124,079,400 | 69,016 |
| Reckitt Benckiser Group PLC1 | 787,000 | 67,449 |
| Coca-Cola HBC AG (CDI)1 | 3,562,746 | 63,955 |
| Indofood Sukses Makmur Tbk PT1 | 87,140,000 | 49,562 |
| ITC Ltd.1 | 7,013,025 | 36,479 |
| Treasury Wine Estates Ltd.1 | 7,363,000 | 28,618 |
| 8,766,590 | ||
| Telecommunication services 4.01% | ||
| SoftBank Corp.1 | 50,923,600 | 2,960,164 |
| KDDI Corp.1 | 22,605,000 | 512,142 |
| China Mobile Ltd.1 | 39,065,000 | 509,211 |
| China Telecom Corp. Ltd., Class H1 | 653,110,000 | 419,654 |
| China Unicom (Hong Kong) Ltd.1 | 179,088,000 | 272,737 |
| TeliaSonera AB1 | 22,175,000 | 140,918 |
| Orange SA1 | 5,565,000 | 89,534 |
| Reliance Communications Ltd.1,3 | 91,597,000 | 86,701 |
| Intouch Holdings PCL1 | 23,435,603 | 55,622 |
| Intouch Holdings PCL, nonvoting depository receipts1 | 1,024,397 | 2,431 |
| MTN Group Ltd.1 | 3,117,886 | 52,546 |
| MegaFon OJSC (GDR)1 | 1,692,522 | 27,075 |
| TIM Participações SA, ordinary nominative | 7,755,400 | 25,855 |
| 5,154,590 | ||
| Materials 2.75% | ||
| Syngenta AG1 | 2,060,815 | 700,951 |
| Chr. Hansen Holding A/S1,2 | 8,743,000 | 401,579 |
| Linde AG1 | 1,799,000 | 366,761 |
| Amcor Ltd.1 | 28,815,000 | 307,447 |
| Rio Tinto PLC1 | 6,038,000 | 246,665 |
| Grasim Industries Ltd. (GDR)1 | 1,915,953 | 120,904 |
| Grasim Industries Ltd.1 | 1,544,513 | 97,464 |
| Glencore PLC1 | 40,505,000 | 170,525 |
| Lafarge SA, non-registered shares1 | 2,556,000 | 165,754 |
| BASF SE1 | 1,650,500 | 164,235 |
| First Quantum Minerals Ltd. | 12,941,001 | 156,839 |
| Fortescue Metals Group Ltd.1 | 101,071,218 | 149,761 |
| Anhui Conch Cement Co. Ltd., Class H1 | 33,941,000 | 128,558 |
| L’Air Liquide SA, non-registered shares1 | 668,000 | 85,925 |
| Common stocks Materials (continued) | Shares | Value (000) |
| Akzo Nobel NV1 | 1,091,000 | $82,594 |
| ArcelorMittal1 | 5,874,000 | 55,261 |
| Givaudan SA1 | 29,332 | 52,962 |
| LG Chem, Ltd.1 | 235,432 | 47,886 |
| Koninklijke DSM NV1 | 515,979 | 28,829 |
| 3,530,900 | ||
| Energy 2.11% | ||
| BG Group PLC1 | 37,501,000 | 460,686 |
| Tourmaline Oil Corp.3 | 9,908,200 | 299,855 |
| Reliance Industries Ltd.1 | 22,231,800 | 293,229 |
| Oil Search Ltd.1 | 48,335,452 | 264,848 |
| Canadian Natural Resources, Ltd. | 6,895,000 | 211,333 |
| Galp Energia, SGPS, SA, Class B1 | 18,856,072 | 203,670 |
| BP PLC1 | 26,929,164 | 173,989 |
| Royal Dutch Shell PLC, Class A (GBP denominated)1 | 2,262,000 | 67,224 |
| Royal Dutch Shell PLC, Class A (ADR) | 1,000,000 | 59,650 |
| Royal Dutch Shell PLC, Class A (EUR denominated)1 | 712,000 | 21,263 |
| Royal Dutch Shell PLC, Class B (ADR) | 303,000 | 18,998 |
| Enbridge Inc. | 3,390,000 | 163,404 |
| TOTAL SA1 | 2,812,000 | 139,901 |
| Gazprom OJSC (ADR)1 | 18,750,000 | 88,401 |
| Repsol, SA, non-registered shares1 | 3,728,000 | 69,331 |
| Coal India Ltd.1 | 11,504,763 | 66,625 |
| CNOOC Ltd.1 | 39,400,100 | 55,790 |
| Eni SpA1 | 2,843,000 | 49,206 |
| 2,707,403 | ||
| Utilities 2.08% | ||
| Power Grid Corp. of India Ltd.1,2 | 296,023,422 | 729,479 |
| Power Assets Holdings Ltd.1 | 48,296,500 | 493,257 |
| Cheung Kong Infrastructure Holdings Ltd.1 | 44,481,000 | 382,015 |
| China Resources Gas Group Ltd.1,2 | 118,420,000 | 367,415 |
| ENN Energy Holdings Ltd.1,2 | 55,318,000 | 339,141 |
| National Grid PLC1 | 10,100,000 | 129,129 |
| EDP - Energias de Portugal, SA1 | 29,694,335 | 111,207 |
| Hong Kong and China Gas Co. Ltd.1 | 31,986,963 | 73,950 |
| PT Perusahaan Gas Negara (Persero) Tbk1 | 138,700,000 | 50,816 |
| 2,676,409 | ||
| Miscellaneous 4.08% | ||
| Other common stocks in initial period of acquisition | 5,237,231 | |
| Total common stocks (cost: $76,380,789,000) | 113,531,472 | |
| Rights & warrants 0.00% Miscellaneous 0.00% | ||
| Other rights & warrants in initial period of acquisition | 1,232 | |
| Total rights & warrants (cost: $0) | 1,232 |
| Bonds, notes & other debt instruments 0.56% U.S. Treasury bonds & notes 0.52% U.S. Treasury 0.52% | Principal amount (000) | Value (000) |
| U.S. Treasury 0.25% 20155 | $392,300 | $392,422 |
| U.S. Treasury 0.25% 2015 | 145,000 | 145,090 |
| U.S. Treasury 0.25% 2015 | 135,000 | 135,036 |
| Total U.S. Treasury bonds & notes | 672,548 | |
| Bonds & notes of governments outside the U.S. 0.04% | ||
| Argentina (Republic of) 7.00% 2015 | 50,000 | 48,649 |
| Total bonds, notes & other debt instruments (cost: $721,070,000) | 721,197 | |
| Short-term securities 11.11% | ||
| Australia & New Zealand Banking Group, Ltd. 0.15% due 4/16/20154 | 40,000 | 39,998 |
| Bank of Montreal 0.00% due 5/19/2015 | 51,700 | 51,702 |
| Bank of Nova Scotia 0.17%–0.21% due 5/7/2015–7/23/20154 | 346,600 | 346,506 |
| Bank of Tokyo-Mitsubishi UFJ, Ltd. 0.16%–0.24% due 4/10/2015–6/22/2015 | 100,000 | 99,969 |
| BNP Paribas Finance Inc. 0.12%–0.13% due 4/7/2015–4/16/2015 | 79,700 | 79,697 |
| Caisse d’Amortissement de la Dette Sociale 0.25% due 5/14/20154 | 50,000 | 49,987 |
| Canadian Imperial Bank of Commerce 0.00% due 4/22/2015 | 50,000 | 50,002 |
| Chariot Funding, LLC 0.21% due 4/27/20154 | 50,000 | 49,994 |
| Ciesco LLC 0.21%–0.24% due 4/22/2015–5/4/2015 | 125,000 | 124,985 |
| Coca-Cola Co. 0.17%–0.21% due 4/9/2015–6/5/20154 | 173,000 | 172,987 |
| Commonwealth Bank of Australia 0.18% due 4/8/20154 | 109,600 | 109,598 |
| Electricité de France 0.17%–0.27% due 4/2/2015–7/13/20154 | 349,700 | 349,634 |
| Fannie Mae 0.07%–0.18% due 4/1/2015–12/14/2015 | 2,507,870 | 2,507,264 |
| Federal Farm Credit Banks 0.09%–0.15% due 5/11/2015–8/31/2015 | 438,000 | 437,914 |
| Federal Home Loan Bank 0.07%–0.21% due 4/1/2015–12/8/2015 | 3,523,507 | 3,522,209 |
| Freddie Mac 0.07%–0.24% due 4/2/2015–12/8/2015 | 2,968,873 | 2,967,582 |
| General Electric Capital Corp. 0.18%–0.24% due 4/21/2015–7/20/2015 | 100,000 | 99,969 |
| General Electric Co. 0.08% due 4/1/2015 | 1,000 | 1,000 |
| Jupiter Securitization Co., LLC 0.21%–0.25% due 5/21/2015–5/27/20154 | 150,000 | 149,956 |
| Kells Funding, LLC 0.21%–0.22% due 4/20/2015–7/24/20154 | 80,000 | 79,975 |
| KfW 0.12%–0.17% due 4/1/2015–7/20/20154 | 319,900 | 319,853 |
| Mitsubishi UFJ Trust and Banking Corp. 0.25% due 5/6/2015–6/1/20154 | 150,000 | 149,964 |
| Mizuho Funding LLC 0.00% due 5/15/2015 | 114,850 | 114,849 |
| National Australia Bank Ltd. 0.17%–0.19% due 4/8/2015–7/1/20154 | 257,800 | 257,754 |
| Nordea Bank AB 0.17%–0.23% due 4/7/2015–6/17/20154 | 294,200 | 294,129 |
| Old Line Funding, LLC 0.17%–0.27% due 4/9/2015–8/17/20154 | 103,500 | 103,429 |
| Province of Ontario 0.12% due 4/23/2015 | 23,000 | 22,998 |
| Rabobank USA Financial Corp. 0.21% due 4/13/2015 | 50,000 | 49,997 |
| Sumitomo Mitsui Banking Corp. 0.15%���0.24% due 4/9/2015–6/23/20154 | 266,900 | 266,803 |
| Svenska Handelsbanken Inc. 0.17%–0.25% due 4/17/2015–8/24/20154 | 340,600 | 340,441 |
| Thunder Bay Funding, LLC 0.22%–0.27% due 4/1/2015–7/29/20154 | 120,586 | 120,524 |
| Toronto-Dominion Holdings USA Inc. 0.14%–0.20% due 4/23/2015–7/23/20154 | 391,100 | 390,979 |
| Toyota Credit Canada Inc. 0.18% due 4/15/2015 | 25,000 | 24,999 |
| Toyota Motor Credit Corp. 0.16% due 6/5/2015 | 50,000 | 49,991 |
| Westpac Banking Corp. 0.22%–0.26% due 5/20/2015–6/19/20154 | 483,400 | 483,307 |
| Total short-term securities (cost: $14,280,040,000) | 14,280,945 | |
| Total investment securities 100.02% (cost: $91,381,899,000) | 128,534,846 | |
| Other assets less liabilities (0.02)% | (24,758) | |
| Net assets 100.00% | $128,510,088 |
| Settlement date | Counterparty | Contract amount | Unrealized appreciation (depreciation) at 3/31/2015 (000) | ||
| Receive (000) | Deliver (000) | ||||
| Sales: | |||||
| Australian dollars | 5/28/2015 | UBS AG | $29,839 | A$39,300 | $6 |
| British pounds | 4/20/2015 | JPMorgan Chase | $85,484 | £58,000 | (541) |
| British pounds | 5/8/2015 | UBS AG | $407,881 | £275,000 | 56 |
| Euros | 4/9/2015 | HSBC Bank | $115,174 | €97,238 | 10,606 |
| Euros | 4/20/2015 | Citibank | $186,132 | €173,600 | (583) |
| Euros | 4/20/2015 | Bank of America, N.A. | $94,420 | €89,000 | (1,304) |
| Euros | 4/20/2015 | Bank of America, N.A. | $134,734 | €127,000 | (1,860) |
| Euros | 4/27/2015 | HSBC Bank | $54,723 | €50,000 | 940 |
| Euros | 4/27/2015 | UBS AG | $32,278 | €29,560 | 482 |
| Euros | 6/9/2015 | JPMorgan Chase | $121,978 | €110,600 | 2,941 |
| Japanese yen | 4/9/2015 | JPMorgan Chase | $38,587 | ¥4,604,000 | 194 |
| Japanese yen | 4/14/2015 | UBS AG | $142,583 | ¥17,308,000 | (1,760) |
| Japanese yen | 4/15/2015 | Barclays Bank PLC | $350,531 | ¥42,103,000 | (599) |
| Japanese yen | 4/16/2015 | Bank of America, N.A. | $15,251 | ¥1,850,000 | (177) |
| Japanese yen | 4/23/2015 | JPMorgan Chase | $29,554 | ¥3,570,000 | (223) |
| Japanese yen | 4/24/2015 | Bank of America, N.A. | $136,223 | ¥16,300,000 | 264 |
| Japanese yen | 4/24/2015 | Barclays Bank PLC | $132,569 | ¥16,080,000 | (1,554) |
| Japanese yen | 4/27/2015 | Bank of America, N.A. | $54,656 | ¥6,545,000 | 61 |
| Japanese yen | 4/27/2015 | UBS AG | $52,777 | ¥6,320,000 | 59 |
| Japanese yen | 4/28/2015 | Bank of America, N.A. | $29,564 | ¥3,575,000 | (257) |
| $6,751 | |||||
| 1 | Valued under fair value procedures adopted by authority of the board of trustees. The total value of all such securities, including those in “Miscellaneous,“ was $102,118,392,000, which represented 79.46% of the net assets of the fund. This amount includes $101,062,089,000 related to certain securities trading outside the U.S. whose values were adjusted as a result of significant market movements following the close of local trading. |
| 2 | Represents an affiliated company as defined under the Investment Company Act of 1940. |
| 3 | Security did not produce income during the last 12 months. |
| 4 | Acquired in a transaction exempt from registration under Rule 144A or Section 4(2) of the Securities Act of 1933. May be resold in the U.S. in transactions exempt from registration, normally to qualified institutional buyers. The total value of all such securities was $4,124,830,000, which represented 3.21% of the net assets of the fund. |
| 5 | A portion of this security was pledged as collateral. The total value of pledged collateral was $20,472,000, which represented .02% of the net assets of the fund. |
| Key to abbreviations and symbols | ||
| ADR = American Depositary Receipts | ||
| CDI = CREST Depository Interest | ||
| GDR = Global Depositary Receipts | ||
| A$ = Australian dollars | ||
| CAD = Canadian dollars | ||
| EUR/€ = Euros | ||
| GBP/£ = British pounds | ||
| HKD = Hong Kong dollars | ||
| ¥ = Japanese yen |
| MFGEFPX-016-0515O-S42181 | EuroPacific Growth Fund — Page 9 of 9 |
REPORT OF INDEPENDENT REGISTERED PUBLIC ACCOUNTING FIRM
To the Shareholders and Board of Trustees of
EuroPacific Growth Fund:
We have audited the accompanying statement of assets and liabilities of EuroPacific Growth Fund (the “Fund”), including the summary schedule of investments, as of March 31, 2015, and the related statements of operations for the year then ended, the statements of changes in net assets for each of the two years in the period then ended (collectively, the “financial statements”), the financial highlights for each of the five years in the period then ended (the financial statements and financial highlights are included in Item 1 of this Form N-CSR), and the schedule of investments in securities as of March 31, 2015 (included in Item 6 of this Form N-CSR). These financial statements, financial highlights, and schedule of investments in securities are the responsibility of the Fund’s management. Our responsibility is to express an opinion on these financial statements, financial highlights, and schedule of investments in securities based on our audits.
We conducted our audits in accordance with the standards of the Public Company Accounting Oversight Board (United States). Those standards require that we plan and perform the audit to obtain reasonable assurance about whether the financial statements, financial highlights, and schedule of investments in securities are free of material misstatement. An audit includes examining, on a test basis, evidence supporting the amounts and disclosures in the financial statements and schedule of investments in securities. Our procedures included confirmation of securities owned as of March 31, 2015, by correspondence with the custodian and brokers; where replies were not received from brokers, we performed other auditing procedures. An audit also includes assessing the accounting principles used and significant estimates made by management, as well as evaluating the overall financial statement presentation. We believe that our audits provide a reasonable basis for our opinion.
In our opinion, the financial statements, financial highlights, and schedule of investments in securities referred to above present fairly, in all material respects, the financial position of EuroPacific Growth Fund as of March 31, 2015, and the results of its operations for the year then ended, the changes in its net assets for each of the two years in the period then ended, and the financial highlights for each of the five years in the period then ended, in conformity with accounting principles generally accepted in the United States of America.
DELOITTE & TOUCHE LLP
Costa Mesa, California
May 8, 2015
ITEM 7 – Disclosure of Proxy Voting Policies and Procedures for Closed-End Management Investment Companies
Not applicable to this Registrant, insofar as the Registrant is not a closed-end management investment company.
ITEM 8 – Portfolio Managers of Closed-End Management Investment Companies
Not applicable to this Registrant, insofar as the Registrant is not a closed-end management investment company.
ITEM 9 – Purchases of Equity Securities by Closed-End Management Investment Company and Affiliated Purchasers
Not applicable to this Registrant, insofar as the Registrant is not a closed-end management investment company.
ITEM 10 – Submission of Matters to a Vote of Security Holders
There have been no material changes to the procedures by which shareholders may recommend nominees to the Registrant’s board of trustees since the Registrant last submitted a proxy statement to its shareholders. The procedures are as follows. The Registrant has a nominating and governance committee comprised solely of persons who are not considered ‘‘interested persons’’ of the Registrant within the meaning of the Investment
Company Act of 1940, as amended. The committee periodically reviews such issues as the board’s composition, responsibilities, committees, compensation and other relevant issues, and recommends any appropriate changes to the full board of trustees. While the committee normally is able to identify from its own resources an ample number of qualified candidates, it will consider shareholder suggestions of persons to be considered as nominees to fill future vacancies on the board. Such suggestions must be sent in writing to the nominating and governance committee of the Registrant, c/o the Registrant’s Secretary, and must be accompanied by complete biographical and occupational data on the prospective nominee, along with a written consent of the prospective nominee for consideration of his or her name by the nominating and governance committee.
ITEM 11 – Controls and Procedures
| (a) | The Registrant’s Principal Executive Officer and Principal Financial Officer have concluded, based on their evaluation of the Registrant’s disclosure controls and procedures (as such term is defined in Rule 30a-3 under the Investment Company Act of 1940), that such controls and procedures are adequate and reasonably designed to achieve the purposes described in paragraph (c) of such rule. |
| (b) | There were no changes in our internal control over financial reporting during the quarter ended March 31, 2015, which were identified in connection with management's evaluation required by paragraph (d) of Rule 13a-15 and 15d-15 under the Exchange Act, that have materially affected, or are reasonably likely to materially affect, our internal control over financial reporting, other than as provided below.
Effective November 10, 2014, the EuroPacific Growth Fund’s investment adviser implemented a new accounting system. In connection with introducing this new system, additional automated and manual controls were implemented and some existing controls were modified. None of these changes were in response to any identified deficiency or weakness in the EuroPacific Growth Fund’s internal control over financial reporting. |
ITEM 12 – Exhibits
| (a)(1) | The Code of Ethics that is the subject of the disclosure required by Item 2 is attached as an exhibit hereto. |
| (a)(2) | The certifications required by Rule 30a-2 of the Investment Company Act of 1940 and Sections 302 and 906 of the Sarbanes-Oxley Act of 2002 are attached as exhibits hereto. |
SIGNATURES
Pursuant to the requirements of the Securities Exchange Act of 1934 and the Investment Company Act of 1940, the Registrant has duly caused this report to be signed on its behalf by the undersigned, thereunto duly authorized.
| EUROPACIFIC GROWTH FUND | |
| By /s/ Walter R. Burkley | |
Walter R. Burkley, Executive Vice President and Principal Executive Officer | |
| Date: May 29, 2015 |
Pursuant to the requirements of the Securities Exchange Act of 1934 and the Investment Company Act of 1940, this report has been signed below by the following persons on behalf of the Registrant and in the capacities and on the dates indicated.
| By /s/ Walter R. Burkley |
Walter R. Burkley, Executive Vice President and Principal Executive Officer |
| Date: May 29, 2015 |
| By /s/ Brian C. Janssen |
Brian C. Janssen, Treasurer and Principal Financial Officer |
| Date: May 29, 2015 |