UNITED STATES
SECURITIES AND EXCHANGE COMMISSION
Washington, D.C. 20549
FORM N-CSR
CERTIFIED SHAREHOLDER REPORT OF REGISTERED
MANAGEMENT INVESTMENT COMPANIES
Investment Company Act file number: (811- 03741 )
Exact name of registrant as specified in charter: Putnam New York Tax Exempt Income Fund
Address of principal executive offices: One Post Office Square, Boston, Massachusetts 02109
| Name and address of agent for service: | Beth S. Mazor, Vice President |
| | One Post Office Square |
| | Boston, Massachusetts 02109 |
| |
| Copy to: | John W. Gerstmayr, Esq. |
| | Ropes & Gray LLP |
| | One International Place |
| | Boston, Massachusetts 02110 |
Registrant’s telephone number, including area code: (617) 292-1000
Date of fiscal year end: November 30, 2006
Date of reporting period: December 1, 2005— May 31, 2006
Item 1. Report to Stockholders:
The following is a copy of the report transmitted to stockholders pursuant to Rule 30e-1 under the Investment Company Act of 1940:
What makes Putnam different?

In 1830, Massachusetts Supreme Judicial Court Justice Samuel Putnam established The Prudent Man Rule, a legal foundation for responsible money management.
THE PRUDENT MAN RULE
All that can be required of a trustee to invest is that he shall conduct himself faithfully and exercise a sound discretion. He is to observe how men of prudence, discretion, and intelligence manage their own affairs, not in regard to speculation, but in regard to the permanent disposition of their funds, considering the probable income, as well as the probable safety of the capital to be invested.

A time-honored tradition in money management
Since 1937, our values have been rooted in a profound sense of responsibility for the money entrusted to us.
A prudent approach to investing
We use a research-driven team approach to seek consistent, dependable, superior investment results over time, although there is no guarantee a fund will meet its objectives.
Funds for every investment goal
We offer a broad range of mutual funds and other financial products so investors and their financial representatives can build diversified portfolios.
A commitment to doing what’s right for investors
We have below-average expenses and stringent investor protections, and provide a wealth of information about the Putnam funds.
Industry-leading service
We help investors, along with their financial representatives, make informed investment decisions with confidence.
Putnam New York
Tax Exempt
Income Fund
|
5| 31| 06
Semiannual Report
|
| Message from the Trustees | 2 |
| About the fund | 4 |
| Report from the fund managers | 7 |
| Performance | 13 |
| Expenses | 15 |
| Portfolio turnover | 17 |
| Risk | 18 |
| Your fund’s management | 19 |
| Terms and definitions | 22 |
| Trustee approval of management contract | 24 |
| Other information for shareholders | 29 |
| Financial statements | 30 |
Cover photograph: © Richard H. Johnson
|
Message from the Trustees
|
Dear Fellow Shareholder
Investors continue to keep a close watch on the course of the economy. Globally, it appears that, assuming economic growth exceeds 4% in 2006, we will have seen the strongest economic performance over a four-year period in over thirty years. Corporate profits have boomed around the world, business capacity utilization rates have moved up, and unemployment rates have come down. Given such a sustained period of robust growth, it is not surprising that prices have begun to rise, inflation rates have crept up, and central banks in many countries, particularly the Federal Reserve (the Fed) in the United States, have pushed interest rates higher.
In recent weeks, investors have worried that these higher rates could threaten the fundamentals of the global economy, prompting a widespread sell-off. However, we believe that today’s higher interest rates, far from being a threat to global economic fundamentals, are in fact an integral part of them. Higher interest rates are bringing business borrowing costs closer to the rate of return available from investments. In our view, this should help provide the basis for a longer and more durable business expansion and a continued healthy investment environment.
You can be assured that the investment professionals managing your fund are closely monitoring the factors that influence the performance of the securities in which your fund invests. Moreover, Putnam Investments’ management team, under the leadership of Chief Executive Officer Ed Haldeman, continues to focus on investment performance and remains committed to putting the interests of shareholders first.
2
In the following pages, members of your fund’s management team discuss the fund’s performance and strategies for the fiscal period ended May 31, 2006, and provide their outlook for the months ahead. As always, we thank you for your support of the Putnam funds.
Putnam New York Tax Exempt Income Fund:
potential for tax-advantaged income
|
Municipal bonds finance important public projects such as schools, roads, and hospitals, and they can help investors keep more of their investment income. Typically issued by states and local municipalities to raise funds for building and maintaining public facilities, municipal bonds offer income that is generally exempt from federal income tax.
For residents of the state where the bond is issued, income is typically exempt from state and any local income taxes as well. While the stated yields on municipal bonds are usually lower than those on taxable bonds, in New York, this exemption is an especially powerful advantage because the state’s top income tax rate is among the highest in the United States, and New York City’s income tax can further erode investment income. And the sheer size of the New York municipal bond market provides a wide array of investment opportunities.
Putnam New York Tax Exempt Income Fund seeks to capitalize on investment opportunities in New York by investing in bonds across a range of market sectors. The fund also combines bonds of differing credit quality to increase income potential. In addition to investing in high-quality bonds, the fund’s management team allocates a smaller portion of the portfolio to lower-rated bonds, which may offer higher income in return for more risk.
When deciding whether to invest in a bond, the fund’s management team considers the risks involved — including credit risk, interest-rate risk, and the risk that the bond will be prepaid. The management team is backed by the resources of Putnam’s fixed-income organization, one of the largest in the investment industry, in which municipal bond analysts are grouped into sector teams and conduct ongoing, rigorous research. Once a bond has been purchased, the team continues to monitor developments that affect the bond market, the sector, and the issuer of the bond.
Municipal bonds may finance a range of projects in your
community and thus play a key role in its development.
|

The goal of the fund’s in-depth research and active management is to stay a step ahead of the industry and pinpoint opportunities to adjust the fund’s holdings for the benefit of the fund and its shareholders.
The fund concentrates its investments by region and involves more risk than a fund that invests more broadly. Capital gains, if any, are taxable for federal and, in most cases, state purposes. For some investors, investment income may be subject to the federal alternative minimum tax. Tax-free funds may not be suitable for IRAs and other non-taxable accounts. Please consult with your tax advisor for more information. Mutual funds that invest in bonds are subject to certain risks, including interest-rate risk, credit risk, and inflation risk. As interest rates rise, the prices of bonds fall. Long-term bonds are more exposed to interest-rate risk than short-term bonds. Unlike bonds, bond funds have ongoing fees and expenses.
Understanding
tax-equivalent yield
|
To understand the value of tax-free income, it is helpful to compare a municipal bond’s yield with the “tax-equivalent yield” — the before-tax yield that must be offered by a taxable bond in order to equal the municipal bond’s yield after taxes.
How to calculate tax-equivalent yield:
The tax-equivalent yield equals the municipal bond’s yield divided by “one minus the tax rate.” For example, if a municipal bond’s yield is 5%, then its tax-equivalent yield is 7.7%, assuming the maximum 35% federal tax rate for 2006.
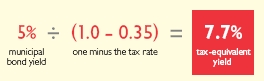
Results for investors subject to lower tax rates would not be as advantageous.

Putnam New York Tax Exempt Income Fund seeks to provide as high a level of current income free from federal, New York State, and New York City personal income tax as we believe is consistent with the preservation of capital. It may be suitable for New York investors seeking tax-free income through a diversified portfolio of municipal bonds primarily issued in New York.
* For the six months ended May 31, 2006, Putnam New York Tax Exempt Income Fund’s class A
shares returned 1.46% without sales charges.
* The fund’s benchmark, the Lehman Municipal Bond Index, returned 1.51% .
* The average return for the fund’s Lipper category, New York Municipal Debt Funds, was 1.53% .
* Additional fund performance, comparative performance, and Lipper data can be found in the
performance section beginning on page 13.
|
Performance
Total return for class A shares for periods ended 5/31/06
Since the fund's inception (9/2/83), average annual return is 7.51% at NAV and 7.33% at POP.
| | Average annual return | Cumulative return |
| | NAV | POP | NAV | POP |
|
| 10 years | 5.30% | 4.90% | 67.56% | 61.37% |
|
| 5 years | 4.50 | 3.71 | 24.64 | 20.00 |
|
| 3 years | 2.77 | 1.46 | 8.53 | 4.43 |
|
| 1 year | 1.64 | –2.22 | 1.64 | –2.22 |
|
| 6 months | — | — | 1.46 | –2.34 |
|
Data is historical. Past performance does not guarantee future results. More recent returns may be less or more than those shown. Investment return and principal value will fluctuate, and you may have a gain or a loss when you sell your shares. Performance assumes reinvestment of distributions and does not account for taxes. Returns at NAV do not reflect a sales charge of 3.75% . For the most recent month-end performance, visit www.putnam.com. For a portion of the period, this fund limited expenses, without which returns would have been lower. A short-term trading fee of up to 2% may apply.
6
Report from the fund managers
|
The period in review
During the first half of your fund’s 2006 fiscal year, which ended May 31, 2006, interest rates rose across the yield curve, although short-term interest rates rose more than long-term rates. This created a challenging environment for your fund, as bond prices move in a direction opposite to that of interest rates. However, our defensive positioning with respect to the fund’s interest-rate sensitivity, as well as strong performance from lower-rated bonds, enabled the fund to post results that were in line with results for both its benchmark and the average for its Lipper peer group, based on returns at net asset value (NAV, or without sales charges). The fund’s exposure to tobacco settlement bonds, as well as bonds issued by several industrial development authorities, also aided performance.
Market overview
Amid continuing signs of solid economic growth, and the potential for inflation that often accompanies such growth, the Fed increased the federal funds rate four times during the first half of the fund’s 2006 fiscal year, lifting this benchmark for overnight loans between banks from 4.00% to 5.00% . Bond yields rose across the maturity spectrum, leading to a convergence of shorter- and longer-term rates. As rates converged, the yield curve — a graphical representation of yields for bonds of comparable quality plotted from the shortest to the longest maturity — flattened.
During the period, tax-exempt bonds generally outperformed comparable Treasury bonds, as prices of tax-exempt bonds declined less than Treasury prices across all maturities. Municipal bonds typically perform better than Treasuries when interest rates are rising. However, the degree to which they outperformed Treasuries was greater than we expected during the period.
A robust economy and rising corporate earnings contributed to the strong relative performance of lower-rated bonds. Among uninsured bonds in general and especially bonds rated Baa and below, yield spreads tightened as lower-rated bonds performed better than
7
higher-rated bonds. The superior performance of lower-rated bonds resulted primarily from strong demand by buyers searching for higher yields. Non-rated bonds also rallied. In addition, as a result of favorable legal rulings, tobacco settlement bonds generally outperformed the broader market. Also, airline-related industrial development bonds (IDBs) performed exceptionally well, in our view.
Strategy overview
Given our expectation for rising interest rates, we maintained a short (defensive) portfolio duration relative to the fund’s Lipper peer group, a strategy that contributed positively to results for the period as rates rose. Duration is a measure of a fund’s sensitivity to changes in interest rates. Having a shorter-duration portfolio may help protect principal when interest rates rise, but it can reduce appreciation potential when rates fall.
The fund’s yield curve positioning, or the maturity profile of its holdings, detracted from performance during the period but did not negate the positive contribution provided by our duration strategy. In order to keep the fund’s duration short, we limited exposure to longer-maturity bonds, favoring intermediate-maturity securities instead. However, as the yield curve flat-tened and shorter- and longer-term yields converged, bonds with longer maturities performed better than their intermediate-maturity counterparts.
Market sector performance
These indexes provide an overview of performance in different market sectors for the six months ended 5/31/06.
| Bonds | |
| Lehman Municipal Bond Index (tax-exempt bonds) | 1.51% |
|
| Lehman Aggregate Bond Index (broad bond market) | 0.01% |
|
| Lehman Intermediate Government Bond Index | |
| (intermediate-maturity U.S. Treasury and agency securities) | 0.43% |
|
| JP Morgan Global High Yield Index (global high-yield corporate bonds) | 4.56% |
|
| Equities | |
| S&P 500 Index (broad stock market) | 2.60% |
|
| Russell 2000 Index (small-company stocks) | 7.03% |
|
| MSCI EAFE Index (international stocks) | 15.30% |
|
8
The fund’s overweight position in the lowest-rated bonds (i.e., those rated Ba and below), compared to other funds in its peer group, benefited performance as securities in this area of the market rallied. In addition, an overweight position in tobacco settlement bonds contributed positively to results, as these bonds continued to strengthen during the period. Finally, the fund’s underweight position in airline-related IDBs (industrial development bonds) modestly detracted from performance as this sector posted strong results for the period.
Your fund’s holdings
Continuing a trend from the prior fiscal period, tobacco settlement bonds — such as the New York Counties Tobacco Trust #4 owned by the fund —performed exceptionally well, responding to the market’s assessment that the litigation environment remains positive for tobacco companies. Payments from tobacco settlement bonds are secured by income promised to various states and municipalities through settlements negotiated by tobacco companies.
Another strong-performing security, from the lower-rated portion of the portfolio, was issued by the New York City Industrial Development Authority on behalf of Airis Corporation. Proceeds from this issue were used to build cargo and warehouse facilities at JFK International Airport. This bond issue is
Comparison of the fund's maturity and duration
This chart compares changes in the fund’s average effective maturity (a weighted average of
the holdings’ maturities) and its average effective duration (a measure of its sensitivity to
interest-rate changes).

Average effective duration and average effective maturity take into account put and call features, where applicable,
and reflect prepayments for mortgage-backed securities. Duration is usually shorter than maturity because it reflects
interest payments on a bond prior to its maturity.
9
a good example of a security that has performed well due to the combination of a strong economy and investor demand for higher-yielding municipal debt.
Fund results also benefited from the performance of bonds issued by the Suffolk County Industrial Development Authority for Jefferson Ferry, a retirement community. When originally issued, the Jefferson Ferry bonds were not rated. However, during the time that the community was being developed and housing units were being sold, financing rates on lower-quality bonds declined, enabling the issuer to refinance its outstanding debt at lower rates. Because of this, the issue held by the fund was pre-refunded during the period. Pre-refunding occurs when an issuer raises the money to refinance an older, higher-coupon bond by issuing new bonds at current lower interest rates. This money is then held in an escrow account and typically invested in U.S. Treasury securities that mature at the older bond’s first call date. When that date arrives, the money is used to retire the old bonds. Because U.S. government securities can be used as collateral in a pre-refunding, the overall credit quality of the bonds can improve, which frequently results in higher prices, as occurred in the case of this holding.
General obligation bonds issued by Puerto Rico were downgraded near the end of the period due to financial turmoil that led to a partial government shutdown. Prices of uninsured Puerto
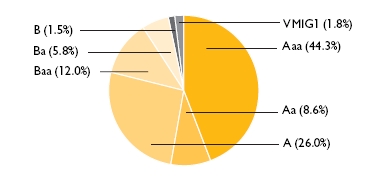
Credit qualities shown as a percentage of portfolio value as of 5/31/06. A bond rated Baa or higher is considered investment grade. The chart reflects Moody’s ratings; percentages may include bonds not rated by Moody’s but considered by Putnam Management to be of comparable quality. Ratings will vary over time.
10
Rico bonds declined, providing the fund with an opportunity to add to its holdings at favorable levels. By the end of the period, the fund had increased its Puerto Rico holdings from an underweight position relative to the Lipper peer group to an allocation that we believe is approximately equal to the peer group average.
An investment that detracted from the fund’s performance during the period was an issue from the Triborough Bridge and Tunnel Authority. The bond was issued with an active sinking fund, which entails the issuer setting aside some of the project’s earnings to retire a portion of the issue prior to its maturity date. Because bonds with active sinking funds cannot be priced to a definitive maturity date, they are often priced at a premium, i.e., above their par, or face value. This reflects the fact that the current price is a mathematical estimate of the life of the bond. In addition, bonds with sinking-fund call provisions frequently provide higher yields to compensate investors for the uncertainty involved in holding them. The securities held by the fund were priced at a premium to par, but part of the fund’s holding was called at par value at the beginning of January, producing a negative return.
Please note that the holdings discussed in this report may not have been held by the fund for the entire period. Portfolio composition is subject to review in accordance with the fund’s investment strategy and may vary in the future.
11
The outlook for your fund
|
The following commentary reflects anticipated developments that could affect your fund over the next six months, as well as your management team’s plans for responding to them.
We believe that the Fed’s tightening cycle is nearing an end but expect that rates will continue to rise over the near term. Consequently, we currently plan to maintain the fund’s defensive duration because we believe that the municipal bond market may be susceptible to weaker returns in the coming months. A key reason for this belief is the market’s unusually strong performance versus taxable equivalents for the fiscal period. In our view, the municipal market’s exceptional results can be attributed primarily to a combination of robust demand and limited new-issue supply.
It appears to us that the extended rally among lower-rated, higher-yielding bonds may be in its final stages. We base this view, in part, on the fact that the difference in yields between Aaa-rated bonds and Baa-rated bonds — the lowest investment-grade rating — is at its narrowest point since late 1999. In other words, the reward in terms of higher yields for assuming additional credit risk has diminished substantially. Therefore, we remain cautious with respect to securities at the lower end of the credit spectrum.
We continue to have a positive view of defensive sectors such as single-family housing bonds, which performed well over most of the fiscal period.
Finally, our view on tobacco settlement bonds remains positive as we believe that they represent good investment opportunities relative to the inherent risks associated with the sector.
The views expressed in this report are exclusively those of Putnam Management. They are not meant as investment advice.
This fund concentrates its investments by region and involves more risk than a fund that invests more broadly. Capital gains, if any, are taxable for federal and, in most cases, state purposes. For some investors, investment income may be subject to the federal alternative minimum tax. Mutual funds that invest in bonds are subject to certain risks, including interest-rate risk, credit risk, and inflation risk. As interest rates rise, the prices of bonds fall. Long-term bonds are more exposed to interest-rate risk than short-term bonds. Unlike bonds, bond funds have ongoing fees and expenses. Tax-free funds may not be suitable for IRAs and other non-taxable accounts.
12
This section shows your fund’s performance for periods ended May 31, 2006, the end of the first half of its current fiscal year. In accordance with regulatory requirements for mutual funds, we also include performance as of the most recent calendar quarter-end. Performance should always be considered in light of a fund’s investment strategy. Data represents past performance. Past performance does not guarantee future results. More recent returns may be less or more than those shown. Investment return and principal value will fluctuate, and you may have a gain or a loss when you sell your shares. For the most recent month-end performance, please visit www.putnam.com or call Putnam at 1-800-225-1581.
| Fund performance (Total return for periods ended 5/31/06) | | | |
|
| |
| | Class A | | Class B | | Class C | | Class M | |
| (inception dates) | (9/2/83) | | (1/4/93) | | (7/26/99) | | (4/10/95) | |
| | NAV | POP | NAV | CDSC | NAV | CDSC | NAV | POP |
|
| Annual average | | | | | | | | |
| (life of fund) | 7.51% | 7.33% | 6.72% | 6.72% | 6.64% | 6.64% | 7.10% | 6.94% |
|
| 10 years | 67.56 | 61.37 | 57.31 | 57.31 | 54.05 | 54.05 | 62.78 | 57.45 |
| Annual average | 5.30 | 4.90 | 4.63 | 4.63 | 4.42 | 4.42 | 4.99 | 4.64 |
|
| 5 years | 24.64 | 20.00 | 21.04 | 19.07 | 19.76 | 19.76 | 22.95 | 19.00 |
| Annual average | 4.50 | 3.71 | 3.89 | 3.55 | 3.67 | 3.67 | 4.22 | 3.54 |
|
| 3 years | 8.53 | 4.43 | 6.74 | 3.92 | 5.94 | 5.94 | 7.59 | 4.07 |
| Annual average | 2.77 | 1.46 | 2.20 | 1.29 | 1.94 | 1.94 | 2.47 | 1.34 |
|
| 1 year | 1.64 | -2.22 | 1.19 | -3.64 | 0.84 | -0.12 | 1.43 | -1.87 |
|
| 6 months | 1.46 | -2.34 | 1.12 | -3.80 | 1.08 | 0.10 | 1.29 | -1.95 |
|
Performance assumes reinvestment of distributions and does not account for taxes. Returns at public offering price (POP) for class A and M shares reflect a sales charge of 3.75% and 3.25%, respectively. Class B share returns reflect the applicable contingent deferred sales charge (CDSC), which is 5% in the first year, declining to 1% in the sixth year, and is eliminated thereafter. Class C shares reflect a 1% CDSC the first year that is eliminated thereafter. Performance for class B, C, and M before their inception is derived from the historical performance of class A shares, adjusted for the applicable sales charge (or CDSC). For a portion of the period, this fund limited expenses, without which returns would have been lower. A 2% short-term trading fee may be applied to shares exchanged or sold within 5 days of purchase.
| Quarter-end fund performance (Total return for periods ended 6/30/06) | |
|
| |
| | Class A | | Class B | | Class C | | Class M | |
| (inception dates) | (9/2/83) | | (1/4/93) | | (7/26/99) | | (4/10/95) | |
| | NAV | POP | NAV | CDSC | NAV | CDSC | NAV | POP |
|
| Annual average | | | | | | | | |
| (life of fund) | 7.47% | 7.29% | 6.67% | 6.67% | 6.59% | 6.59% | 7.05% | 6.90% |
|
| 10 years | 64.90 | 58.64 | 54.95 | 54.95 | 51.61 | 51.61 | 60.39 | 55.15 |
| Annual average | 5.13 | 4.72 | 4.48 | 4.48 | 4.25 | 4.25 | 4.84 | 4.49 |
|
| 5 years | 23.57 | 18.99 | 19.86 | 17.91 | 18.73 | 18.73 | 21.76 | 17.86 |
| Annual average | 4.32 | 3.54 | 3.69 | 3.35 | 3.49 | 3.49 | 4.02 | 3.34 |
|
| 3 years | 8.62 | 4.58 | 6.71 | 3.90 | 6.01 | 6.01 | 7.65 | 4.11 |
| Annual average | 2.79 | 1.50 | 2.19 | 1.28 | 1.96 | 1.96 | 2.49 | 1.35 |
|
| 1 year | 0.72 | -3.09 | 0.15 | -4.64 | -0.06 | -1.02 | 0.41 | -2.85 |
|
| 6 months | 0.30 | -3.46 | -0.02 | -4.93 | -0.07 | -1.05 | 0.15 | -3.07 |
|
13
Comparative index returns (For periods ended 5/31/06)
|
| | Lehman Municipal | Lipper New York Municipal |
| | Bond Index | Debt Funds category average* |
|
| Annual average | | |
| (life of fund) | 8.00% | 7.32% |
|
| 10 years | 78.16 | 65.46 |
| Annual average | 5.95 | 5.15 |
|
| 5 years | 29.26 | 24.87 |
| Annual average | 5.27 | 4.53 |
|
| 3 years | 9.97 | 8.41 |
| Annual average | 3.22 | 2.71 |
|
| 1 year | 1.88 | 1.57 |
|
| 6 months | 1.51 | 1.53 |
|
Index and Lipper results should be compared to fund performance at net asset value.
* Over the 6-month and 1-, 3-, 5-, and 10-year periods ended 5/31/06, there were 104, 104, 103, 89, and 64 funds, respectively,
in this Lipper category.
|
Price and distribution information (For the six-month period ended 5/31/06)
|
| Distributions* | Class A | | Class B | Class C | Class M | |
|
| Number | 6 | | 6 | 6 | 6 | |
|
| Income1 | $0.179881 | $0.151956 | $0.145335 | $0.167171 |
|
| Capital gains2 (long-term) | 0.070200 | 0.070200 | 0.070200 | 0.070200 |
|
| Capital gains2 (short-term) | 0.015700 | 0.015700 | 0.015700 | 0.015700 |
|
| Total | $0.265781 | $0.237856 | $0.231235 | $0.253071 |
|
| Share value: | NAV | POP | NAV | NAV | NAV | POP |
|
| 11/30/05 | $8.70 | $9.04 | $8.69 | $8.70 | $8.71 | $9.00 |
|
| 5/31/06 | 8.56 | 8.89 | 8.55 | 8.56 | 8.57 | 8.86 |
|
| Current yield (end of period) | | | | | | |
| Current dividend rate3 | 4.16% | 4.01% | 3.52% | 3.36% | 3.86% | 3.74% |
|
| Taxable equivalent4(a) | 6.93 | 6.68 | 5.87 | 5.60 | 6.43 | 6.23 |
|
| Taxable equivalent4(b) | 7.29 | 7.02 | 6.16 | 5.88 | 6.76 | 6.55 |
|
| Current 30-day SEC yield5 | 3.61 | 3.48 | 2.96 | 2.82 | 3.31 | 3.21 |
|
| Taxable equivalent4(a) | 6.02 | 5.80 | 4.93 | 4.70 | 5.52 | 5.35 |
|
| Taxable equivalent4(b) | 6.32 | 6.09 | 5.18 | 4.94 | 5.80 | 5.62 |
|
* Dividend sources are estimated and may vary based on final tax calculations after the fund's fiscal year-end.
1 For some investors, investment income may be subject to the federal alternative minimum tax.
2 Capital gains, if any, are taxable for federal and, in most cases, state purposes.
3 Most recent distribution, excluding capital gains, annualized and divided by NAV or POP at end of period.
4 Assumes (a) maximum 40.01% combined federal income tax and New York state 2006 personal income tax rates or (b) maximum 42.90% combined federal, New York state, and New York City 2006 tax rates. Results for investors subject to lower tax rates would not be as advantageous.
5 Based only on investment income, calculated using SEC guidelines.
14
As a mutual fund investor, you pay ongoing expenses, such as management fees, distribution fees (12b-1 fees), and other expenses. Using the information below, you can estimate how these expenses affect your investment and compare them with the expenses of other funds. You may also pay one-time transaction expenses, including sales charges (loads) and redemption fees, which are not shown in this section and would have resulted in higher total expenses. For more information, see your fund’s prospectus or talk to your financial advisor.
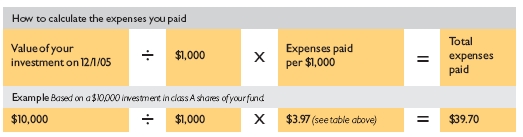
Review your fund’s expenses
The table below shows the expenses you would have paid on a $1,000 investment in Putnam New York Tax Exempt Income Fund from December 1, 2005, to May 31, 2006. It also shows how much a $1,000 investment would be worth at the close of the period, assuming actual returns and expenses.
| | Class A | Class B | Class C | Class M |
|
| Expenses paid per $1,000* | $ 3.97 | $ 7.22 | $ 7.97 | $ 5.47 |
|
| Ending value (after expenses) | $1,014.60 | $1,011.20 | $1,010.80 | $1,012.90 |
|
* Expenses for each share class are calculated using the fund’s annualized expense ratio for each class, which represents the
ongoing expenses as a percentage of net assets for the six months ended 5/31/06. The expense ratio may differ for each
share class (see the table at the bottom of the next page). Expenses are calculated by multiplying the expense ratio by the
average account value for the period; then multiplying the result by the number of days in the period; and then dividing that
result by the number of days in the year.
|
Estimate the expenses you paid
To estimate the ongoing expenses you paid for the six months ended May 31, 2006, use the calculation method below. To find the value of your investment on December 1, 2005, go to www.putnam.com and log on to your account. Click on the “Transaction History” tab in your Daily Statement and enter 12/01/2005 in both the “from” and “to” fields. Alternatively, call Putnam at 1-800-225-1581.
15
Compare expenses using the SEC’s method
The Securities and Exchange Commission (SEC) has established guidelines to help investors assess fund expenses. Per these guidelines, the table below shows your fund’s expenses based on a $1,000 investment, assuming a hypothetical 5% annualized return. You can use this information to compare the ongoing expenses (but not transaction expenses or total costs) of investing in the fund with those of other funds. All mutual fund shareholder reports will provide this information to help you make this comparison. Please note that you cannot use this information to estimate your actual ending account balance and expenses paid during the period.
| | Class A | Class B | Class C | Class M |
|
| Expenses paid per $1,000* | $ 3.98 | $ 7.24 | $ 8.00 | $ 5.49 |
|
| Ending value (after expenses) | $1,020.99 | $1,017.75 | $1,017.00 | $1,019.50 |
|
* Expenses for each share class are calculated using the fund’s annualized expense ratio for each class, which represents the
ongoing expenses as a percentage of net assets for the six months ended 5/31/06. The expense ratio may differ for each
share class (see the table at the bottom of this page). Expenses are calculated by multiplying the expense ratio by the
average account value for the period; then multiplying the result by the number of days in the period; and then dividing that
result by the number of days in the year.
|
Compare expenses using industry averages
You can also compare your fund’s expenses with the average of its peer group, as defined by Lipper, an independent fund-rating agency that ranks funds relative to others that Lipper considers to have similar investment styles or objectives. The expense ratio for each share class shown below indicates how much of your fund’s net assets have been used to pay ongoing expenses during the period.
| | Class A | Class B | Class C | Class M |
|
| Your fund's annualized | | | | |
| expense ratio | 0.79% | 1.44% | 1.59% | 1.09% |
|
| Average annualized expense | | | | |
| ratio for Lipper peer group† | 0.82% | 1.47% | 1.62% | 1.12% |
|
† Simple average of the expenses of all front-end load funds in the fund’s Lipper peer group, calculated in accordance with
Lipper’s standard method for comparing fund expenses (excluding 12b-1 fees and without giving effect to any expense offset
and brokerage service arrangements that may reduce fund expenses). This average reflects each fund’s expenses for its
most recent fiscal year available to Lipper as of 3/31/06. To facilitate comparison, Putnam has adjusted this average to
reflect the 12b-1 fees carried by each class of shares other than class Y shares, which do not incur 12b-1 fees. The peer group
may include funds that are significantly smaller or larger than the fund, which may limit the comparability of the fund’s
expenses to the simple average, which typically is higher than the asset-weighted average.
|
16
Your fund’s
portfolio turnover
|
Putnam funds are actively managed by teams of experts who buy and sell securities based on intensive analysis of companies, industries, economies, and markets. Portfolio turnover is a measure of how often a fund’s managers buy and sell securities for your fund. A portfolio turnover of 100%, for example, means that the managers sold and replaced securities valued at 100% of a fund’s assets within a one-year period. Funds with high turnover may be more likely to generate capital gains and dividends that must be distributed to shareholders as taxable income. High turnover may also cause a fund to pay more brokerage commissions and other transaction costs, which may detract from performance.
Funds that invest in bonds or other fixed-income instruments may have higher turnover than funds that invest only in stocks. Short-term bond funds tend to have higher turnover than longer-term bond funds, because shorter-term bonds will mature or be sold more frequently than longer-term bonds. You can use the table below to compare your fund’s turnover with the average turnover for funds in its Lipper category.
Turnover comparisons
Percentage of holdings that change every year
|
| | 2005 | 2004 | 2003 | 2002 | 2001 |
|
| Putnam New York Tax Exempt | | | | | |
| Income Fund | 13% | 23% | 8%* | 18% | 19% |
|
| Lipper New York Municipal | | | | | |
| Debt Funds category average | 26% | 32% | 41% | 35% | 79% |
|
Turnover data for the fund is calculated based on the fund's fiscal-year period, which ends on November 30. Turnover data
for the fund's Lipper category is calculated based on the average of the turnover of each fund in the category for its fiscal
year ended during the indicated year. Fiscal years vary across funds in the Lipper category, which may limit the compara-
bility of the fund's portfolio turnover rate to the Lipper average. Comparative data for 2005 is based on information
available as of 12/31/05.
* Portfolio turnover excludes the impact of assets received from the acquisition of Putnam New York Tax Exempt
Opportunities Fund.
|
17
This risk comparison is designed to help you understand how your fund compares with other funds. The comparison utilizes a risk measure developed by Morningstar, an independent fund-rating agency. This risk measure is referred to as the fund’s Overall Morningstar Risk.
Your fund’s Overall Morningstar® Risk
|
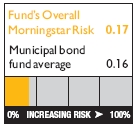
Your fund’s Overall Morningstar Risk is shown alongside that of the average fund in its broad asset class, as determined by Morningstar. The risk bar broadens the comparison by translating the fund’s Overall Morningstar Risk into a percentile, which is based on the fund’s ranking among all funds rated by Morningstar as of June 30, 2006. A higher Overall Morningstar Risk generally indicates that a fund’s monthly returns have varied more widely.
Morningstar determines a fund’s Overall Morningstar Risk by assessing variations in the fund’s monthly returns — with an emphasis on downside variations — over 3-, 5-, and 10-year periods, if available. Those measures are weighted and averaged to produce the fund’s Overall Morningstar Risk. The information shown is provided for the fund’s class A shares only; information for other classes may vary. Overall Morningstar Risk is based on historical data and does not indicate future results. Morningstar does not purport to measure the risk associated with a current investment in a fund, either on an absolute basis or on a relative basis. Low Overall Morningstar Risk does not mean that you cannot lose money on an investment in a fund. Copyright 2006 Morningstar, Inc. All Rights Reserved. The information contained herein (1) is proprietary to Morningstar and/or its content providers; (2) may not be copied or distributed; and (3) is not warranted to be accurate, complete, or timely. Neither Morningstar nor its content providers are responsible for any damages or losses arising from any use of this information.
18
Your fund is managed by the members of the Putnam Tax Exempt Fixed-Income Team. David Hamlin is the Portfolio Leader, and Paul Drury, Susan McCormack, and James St. John are Portfolio Members of your fund. The Portfolio Leader and Portfolio Members coordinate the team’s management of the fund.
For a complete listing of the members of the Putnam Tax Exempt Fixed-Income Team, including those who are not Portfolio Leaders or Portfolio Members of your fund, visit Putnam’s Individual Investor Web site at www.putnam.com.
Fund ownership by the Portfolio Leader and Portfolio Members
The table below shows how much the fund’s current Portfolio Leader and Portfolio Members have invested in the fund (in dollar ranges). Information shown is as of May 31, 2006, and May 31, 2005.
| | | | $1 – | $10,001 – | $50,001 – | $100,001 – | $500,001 – | $1,000,001 |
| | Year | $0 | $10,000 | $50,000 | $100,000 | $500,000 | $1,000,000 | and over |
|
| David Hamlin | 2006 | * | | | | | | |
|
|
| Portfolio Leader | 2005 | * | | | | | | |
|
| Paul Drury | 2006 | * | | | | | | |
|
|
| Portfolio Member | 2005 | * | | | | | | |
|
| Susan McCormack | 2006 | * | | | | | | |
|
|
| Portfolio Member | 2005 | * | | | | | | |
|
| James St. John | 2006 | * | | | | | | |
|
|
| Portfolio Member | 2005 | * | | | | | | |
|
19
Fund manager compensation
|
The total 2005 fund manager compensation that is attributable to your fund is approximately $560,000. This amount includes a portion of 2005 compensation paid by Putnam Management to the fund managers listed in this section for their portfolio management responsibilities, calculated based on the fund assets they manage taken as a percentage of the total assets they manage. The compensation amount also includes a portion of the 2005 compensation paid to the Chief Investment Officer of the team and the Group Chief Investment Officer of the fund’s broader investment category for their oversight responsibilities, calculated based on the fund assets they oversee taken as a percentage of the total assets they oversee. This amount does not include compensation of other personnel involved in research, trading, administration, systems, compliance, or fund operations; nor does it include non-compensation costs. These percentages are determined as of the fund’s fiscal period-end. For personnel who joined Putnam Management during or after 2005, the calculation reflects annualized 2005 compensation or an estimate of 2006 compensation, as applicable.
Other Putnam funds managed by the Portfolio Leader and Portfolio Members
David Hamlin is the Portfolio Leader and Paul Drury, Susan McCormack, and James St. John are Portfolio Members for Putnam’s tax-exempt funds for the following states: Arizona, California, Florida, Massachusetts, Michigan, Minnesota, New Jersey, Ohio, and Pennsylvania. The same group also manages Putnam AMT-Free Insured Municipal Fund, Putnam California Investment Grade Municipal Trust, Putnam High Yield Municipal Trust, Putnam Investment Grade Municipal Trust, Putnam Managed Municipal Income Trust, Putnam Municipal Bond Fund, Putnam Municipal Opportunities Trust, Putnam New York Investment Grade Municipal Trust, Putnam Tax Exempt Income Fund, Putnam Tax-Free Health Care Fund, and Putnam Tax-Free High Yield Fund.
David Hamlin, Paul Drury, Susan McCormack, and James St. John may also manage other accounts and variable trust funds advised by Putnam Management or an affiliate.
Changes in your fund’s Portfolio Leader and Portfolio Members
Your fund’s Portfolio Leader and Portfolio Members did not change during the year ended May 31, 2006.
20
Fund ownership by Putnam’s Executive Board
The table below shows how much the members of Putnam’s Executive Board have invested in the fund (in dollar ranges). Information shown is as of May 31, 2006, and May 31, 2005.
| | | | | $1 – | $10,001 – | $50,001– | $100,001 |
| | Year | | $0 | $10,000 | $50,000 | $100,000 | and over |
|
| Philippe Bibi | 2006 | | * | | | | |
|
|
| Chief Technology Officer | 2005 | | * | | | | |
|
| Joshua Brooks | 2006 | | * | | | | |
|
|
| Deputy Head of Investments | 2005 | | * | | | | |
|
| William Connolly | 2006 | | * | | | | |
|
|
| Head of Retail Management | N/A | | | | | | |
|
| Kevin Cronin | 2006 | | * | | | | |
|
|
| Head of Investments | 2005 | | * | | | | |
|
| Charles Haldeman, Jr. | 2006 | | | | * | | |
|
|
| President and CEO | 2005 | | | | * | | |
|
| Amrit Kanwal | 2006 | | * | | | | |
|
|
| Chief Financial Officer | 2005 | | * | | | | |
|
| Steven Krichmar | 2006 | | * | | | | |
|
|
| Chief of Operations | 2005 | | * | | | | |
|
| Francis McNamara, III | 2006 | | * | | | | |
|
|
| General Counsel | 2005 | | * | | | | |
|
| Richard Robie, III | 2006 | | * | | | | |
|
|
| Chief Administrative Officer | 2005 | | * | | | | |
|
| Edward Shadek | 2006 | | * | | | | |
|
|
| Deputy Head of Investments | 2005 | | * | | | | |
|
| Sandra Whiston | 2006 | | * | | | | |
|
|
| Head of Institutional Management | N/A | | | | | | |
|
N/A indicates the individual was not a member of Putnam's Executive Board as of 5/31/05.
21
Total return shows how the value of the fund’s shares changed over time, assuming you held the shares through the entire period and reinvested all distributions in the fund.
Net asset value (NAV) is the price, or value, of one share of a mutual fund, without a sales charge. NAVs fluctuate with market conditions. NAV is calculated by dividing the net assets of each class of shares by the number of outstanding shares in the class.
Public offering price (POP) is the price of a mutual fund share plus the maximum sales charge levied at the time of purchase. POP performance figures shown here assume the 3.75% maximum sales charge for class A shares and 3.25% for class M shares.
Contingent deferred sales charge (CDSC) is generally a charge applied at the time of the redemption of class B or C shares and assumes redemption at the end of the period. Your fund’s class B CDSC declines from a 5% maximum during the first year to 1% during the sixth year. After the sixth year, the CDSC no longer applies. The CDSC for class C shares is 1% for one year after purchase.
Class A shares are generally subject to an initial sales charge and no CDSC (except on certain redemptions of shares bought without an initial sales charge).
Class B shares are not subject to an initial sales charge. They may be subject to a CDSC.
Class C shares are not subject to an initial sales charge and are subject to a CDSC only if the shares are redeemed during the first year.
Class M shares have a lower initial sales charge and a higher 12b-1 fee than class A shares and no CDSC .
22
JP Morgan Global High Yield Index is an unmanaged index of global high-yield fixed-income securities.
Lehman Aggregate Bond Index is an unmanaged index of U.S. investment-grade fixed-income securities.
Lehman Intermediate Government Bond Index is an unmanaged index of U.S. Treasury and agency securities with maturities between 1 and 10 years.
Lehman Municipal Bond Index is an unmanaged index of long-term fixed-rate investment-grade tax-exempt bonds.
Morgan Stanley Capital International (MSCI) EAFE Index is an unmanaged index of equity securities from developed countries in Western Europe, the Far East, and Australasia.
Russell 2000 Index is an unmanaged index of the 2,000 smallest companies in the Russell 3000 Index.
S&P 500 Index is an unmanaged index of common stock performance.
Indexes assume reinvestment of all distributions and do not account for fees. Securities and performance of a fund and an index will differ. You cannot invest directly in an index.
Lipper is a third-party industry-ranking entity that ranks mutual funds. Its rankings do not reflect sales charges. Lipper rankings are based on total return at net asset value relative to other funds that have similar current investment styles or objectives as determined by Lipper. Lipper may change a fund’s category assignment at its discretion. Lipper category averages reflect performance trends for funds within a category.
23
Trustee approval of
management contract
|
The Board of Trustees of the Putnam funds oversees the management of each fund and, as required by law, determines annually whether to approve the continuance of your fund’s management contract with Putnam Management. In this regard, the Board of Trustees, with the assistance of its Contract Committee consisting solely of Trustees who are not “interested persons” (as such term is defined in the Investment Company Act of 1940, as amended) of the Putnam funds (the “Independent Trustees”), requests and evaluates all information it deems reasonably necessary under the circumstances. Over the course of several months beginning in March and ending in June 2005, the Contract Committee met five times to consider the information provided by Putnam Management and other information developed with the assistance of the Board’s independent counsel and independent staff. The Contract Committee reviewed and discussed key aspects of this information with all of the Independent Trustees. Upon completion of this review, the Contract Committee recommended and the Independent Trustees approved the continuance of your fund’s management contract, effective July 1, 2005.
This approval was based on the following conclusions:
* That the fee schedule currently in effect for your fund represents reasonable compensation in
light of the nature and quality of the services being provided to the fund, the fees paid by
competitive funds and the costs incurred by Putnam Management in providing such services, and
* That such fee schedule represents an appropriate sharing between fund shareholders and
Putnam Management of such economies of scale as may exist in the management of the fund
at current asset levels.
|
These conclusions were based on a comprehensive consideration of all information provided to the Trustees and were not the result of any single factor. Some of the factors that figured particularly in the Trustees’ deliberations and how the Trustees considered these factors are described below, although individual Trustees may have evaluated the information presented differently, giving different weights to various factors. It is also important to recognize that the fee arrangements for your fund and the other Putnam funds are the result of many years of review and discussion between the Independent Trustees and Putnam Management, that certain aspects of such arrangements may receive greater scrutiny in some years than others, and that the Trustees’ conclusions may be based, in part, on their consideration of these same arrangements in prior years.
24
Model fee schedules and categories; total expenses
|
The Trustees’ review of the management fees and total expenses of the Putnam funds focused on three major themes:
* Consistency. The Trustees, working in cooperation with Putnam Management, have devel-
oped and implemented a series of model fee schedules for the Putnam funds designed to
ensure that each fund’s management fee is consistent with the fees for similar funds in the
Putnam family of funds and compares favorably with fees paid by competitive funds spon-
sored by other investment advisors. Under this approach, each Putnam fund is assigned to
one of several fee categories based on a combination of factors, including competitive fees
and perceived difficulty of management, and a common fee schedule is implemented for all
funds in a given fee category. The Trustees reviewed the model fee schedule then in effect for
your fund, including fee levels and breakpoints, and the assignment of the fund to a particular
fee category under this structure. (“Breakpoints” refer to reductions in fee rates that apply to
additional assets once specified asset levels are reached.) The Trustees concluded that no
changes should be made in the fund’s current fee schedule at this time.
* Competitiveness. The Trustees also reviewed comparative fee and expense information for
competitive funds, which indicated that, in a custom peer group of competitive funds selected
by Lipper Inc., your fund ranked in the 62nd percentile in management fees and in the 38th
percentile in total expenses (less any applicable 12b-1 fees) as of December 31, 2004 (the first
percentile being the least expensive funds and the 100th percentile being the most expensive
funds). (Because the fund’s custom peer group is smaller than the fund’s broad Lipper Inc.
peer group, this expense comparison may differ from the Lipper peer expense information
found elsewhere in this report.) The Trustees noted that expense ratios for a number of
Putnam funds, which show the percentage of fund assets used to pay for management and
administrative services, distribution (12b-1) fees and other expenses, had been increasing
recently as a result of declining net assets and the natural operation of fee breakpoints. They
noted that such expense ratio increases were currently being controlled by expense limita-
tions implemented in January 2004 and which Putnam Management, in consultation with the
Contract Committee, had committed to maintain at least through 2006. The Trustees
expressed their intention to monitor this information closely to ensure that fees and
expenses of the Putnam funds continue to meet evolving competitive standards.
* Economies of scale. The Trustees concluded that the fee schedule currently in effect for your
fund represents an appropriate sharing of economies of scale at current asset levels. Your
fund currently has the benefit of breakpoints in its management fee that provide shareholders
with significant economies of scale, which means that the effective management fee rate of a
fund (as a percentage of fund assets) declines as a fund grows in size and crosses specified
asset thresholds. The Trustees examined the existing breakpoint structure of the Putnam
funds’ management fees in light of competitive industry practices. The Trustees considered
|
25
various possible modifications to the Putnam funds’ current breakpoint structure, but ultimately concluded that the current breakpoint structure continues to serve the interests of fund shareholders. Accordingly, the Trustees continue to believe that the fee schedules currently in effect for the funds represent an appropriate sharing of economies of scale at current asset levels. The Trustees noted that significant redemptions in many Putnam funds, together with significant changes in the cost structure of Putnam Management, have altered the economics of Putnam Management’s business in significant ways. In view of these changes, the Trustees intend to consider whether a greater sharing of the economies of scale by fund shareholders would be appropriate if and when aggregate assets in the Putnam funds begin to experience meaningful growth.
In connection with their review of the management fees and total expenses of the Putnam funds, the Trustees also reviewed the costs of the services to be provided and profits to be realized by Putnam Management and its affiliates from the relationship with the funds. This information included trends in revenues, expenses and profitability of Putnam Management and its affiliates relating to the investment management and distribution services provided to the funds. In this regard, the Trustees also reviewed an analysis of Putnam Management’s revenues, expenses and profitability with respect to the funds’ management contracts, allocated on a fund-by-fund basis.
The quality of the investment process provided by Putnam Management represented a major factor in the Trustees’ evaluation of the quality of services provided by Putnam Management under your fund’s management contract. The Trustees were assisted in their review of the funds’ investment process and performance by the work of the Investment Oversight Committees of the Trustees, which meet on a regular monthly basis with the funds’ portfolio teams throughout the year. The Trustees concluded that Putnam Management generally provides a high-quality investment process — as measured by the experience and skills of the individuals assigned to the management of fund portfolios, the resources made available to such personnel, and in general the ability of Putnam Management to attract and retain high-quality personnel — but also recognize that this does not guarantee favorable investment results for every fund in every time period. The Trustees considered the investment performance of each fund over multiple time periods and considered information comparing the fund’s performance with various benchmarks and with the performance of competitive funds. The Trustees noted the satisfactory investment performance of many Putnam funds. They also noted the disappointing investment performance of certain funds in recent years and continued to discuss with senior management of Putnam Management the factors contributing to such underperformance and actions being taken to improve performance. The Trustees recognized that, in recent years, Putnam Management has made significant changes in its investment personnel and processes and in the fund product line to address areas of underperformance. The Trustees indicated their intention to continue to
26
monitor performance trends to assess the effectiveness of these changes and to evaluate whether additional remedial changes are warranted.
In the case of your fund, the Trustees considered that your fund’s class A share cumulative total return performance at net asset value was in the following percentiles of its Lipper Inc. peer group (Lipper New York Municipal Debt Funds; compared using tax-adjusted performance to recognize the different federal income tax treatment for capital gains distributions and exempt-interest distributions) for the one-, three-, and five-year periods ended December 31, 2004 (the first percentile being the best-performing funds and the 100th percentile being the worst-performing funds):
| One-year period | Three-year period | Five-year period |
|
| 42nd | 37th | 35th |
(Because of the passage of time, these performance results may differ from the performance results for more recent periods shown elsewhere in this report. Over the one-, three-, and five-year periods ended December 31, 2004, there were 110, 97, and 87 funds, respectively, in your fund’s Lipper peer group.* Past performance is no guarantee of future performance.)
As a general matter, the Trustees believe that cooperative efforts between the Trustees and Putnam Management represent the most effective way to address investment performance problems. The Trustees believe that investors in the Putnam funds have, in effect, placed their trust in the Putnam organization, under the oversight of the funds’ Trustees, to make appropriate decisions regarding the management of the funds. Based on the responsiveness of Putnam Management in the recent past to Trustee concerns about investment performance, the Trustees believe that it is preferable to seek change within Putnam Management to address performance shortcomings. In the Trustees’ view, the alternative of terminating a management contract and engaging a new investment advisor for an underperforming fund would entail significant disruptions and would not provide any greater assurance of improved investment performance.
Brokerage and soft-dollar allocations; other benefits
|
The Trustees considered various potential benefits that Putnam Management may receive in connection with the services it provides under the management contract with your fund. These include principally benefits related to brokerage and soft-dollar allocations, whereby a portion of the commissions paid by a fund for brokerage is earmarked to pay for research services that may be utilized by a fund’s investment advisor, subject to the obligation to seek best execution. The Trustees believe that soft-dollar credits and other potential benefits associated with the
* The percentile rankings for your fund’s class A share annualized total return performance in the Lipper New York Municipal
Debt Funds category for the one-, five-, and ten-year periods ended June 30, 2006, were 31%, 44%, and 40%, respectively. Over
the one-, five-, and ten-year periods ended June 30, 2006, the fund ranked 32nd out of 104, 40th out of 90, and 26th out of 64
funds, respectively. Note that this more recent information was not available when the Trustees approved the continuance of
your fund’s management contract.
|
27
allocation of fund brokerage, which pertains mainly to funds investing in equity securities, represent assets of the funds that should be used for the benefit of fund shareholders. This area has been marked by significant change in recent years. In July 2003, acting upon the Contract Committee’s recommendation, the Trustees directed that allocations of brokerage to reward firms that sell fund shares be discontinued no later than December 31, 2003. In addition, commencing in 2004, the allocation of brokerage commissions by Putnam Management to acquire research services from third-party service providers has been significantly reduced, and continues at a modest level only to acquire research that is customarily not available for cash. The Trustees will continue to monitor the allocation of the funds’ brokerage to ensure that the principle of “best price and execution” remains paramount in the portfolio trading process.
The Trustees’ annual review of your fund’s management contract also included the review of its distributor’s contract and distribution plan with Putnam Retail Management Limited Partnership and the custodian agreement and investor servicing agreement with Putnam Fiduciary Trust Company, all of which provide benefits to affiliates of Putnam Management.
Comparison of retail and institutional fee schedules
The information examined by the Trustees as part of their annual contract review has included for many years information regarding fees charged by Putnam Management and its affiliates to institutional clients such as defined benefit pension plans, college endowments, etc. This information included comparison of such fees with fees charged to the funds, as well as a detailed assessment of the differences in the services provided to these two types of clients. The Trustees observed, in this regard, that the differences in fee rates between institutional clients and the mutual funds are by no means uniform when examined by individual asset sectors, suggesting that differences in the pricing of investment management services to these types of clients reflect to a substantial degree historical competitive forces operating in separate market places. The Trustees considered the fact that fee rates across all asset sectors are higher on average for mutual funds than for institutional clients, as well as the differences between the services that Putnam Management provides to the Putnam funds and those that it provides to institutional clients of the firm, but have not relied on such comparisons to any significant extent in concluding that the management fees paid by your fund are reasonable.
28
Other information
for shareholders
|
Important notice regarding delivery of shareholder documents
In accordance with SEC regulations, Putnam sends a single copy of annual and semiannual shareholder reports, prospectuses, and proxy statements to Putnam shareholders who share the same address, unless a shareholder requests otherwise. If you prefer to receive your own copy of these documents, please call Putnam at 1-800-225-1581, and Putnam will begin sending individual copies within 30 days.
Putnam is committed to managing our mutual funds in the best interests of our shareholders. The Putnam funds’ proxy voting guidelines and procedures, as well as information regarding how your fund voted proxies relating to portfolio securities during the 12-month period ended June 30, 2005, are available on the Putnam Individual Investor Web site, www.putnam.com/individual, and on the SEC’s Web site, www.sec.gov. If you have questions about finding forms on the SEC’s Web site, you may call the SEC at 1-800-SEC-0330. You may also obtain the Putnam funds’ proxy voting guidelines and procedures at no charge by calling Putnam’s Shareholder Services at 1-800-225-1581.
The fund will file a complete schedule of its portfolio holdings with the SEC for the first and third quarters of each fiscal year on Form N-Q. Shareholders may obtain the fund’s Forms N-Q on the SEC’s Web site at www.sec.gov. In addition, the fund’s Forms N-Q may be reviewed and copied at the SEC’s Public Reference Room in Washington, D.C. You may call the SEC at 1-800-SEC-0330 for information about the SEC’s Web site or the operation of the Public Reference Room.
29
A guide to financial statements
|
These sections of the report, as well as the accompanying Notes, constitute the fund’s financial statements.
The fund’s portfolio lists all the fund’s investments and their values as of the last day of the reporting period. Holdings are organized by asset type and industry sector, country, or state to show areas of concentration and diversification.
Statement of assets and liabilities shows how the fund’s net assets and share price are determined. All investment and noninvestment assets are added together. Any unpaid expenses and other liabilities are subtracted from this total. The result is divided by the number of shares to determine the net asset value per share, which is calculated separately for each class of shares. (For funds with preferred shares, the amount subtracted from total assets includes the liquidation preference of preferred shares.)
Statement of operations shows the fund’s net investment gain or loss. This is done by first adding up all the fund’s earnings — from dividends and interest income — and subtracting its operating expenses to determine net investment income (or loss). Then, any net gain or loss the fund realized on the sales of its holdings — as well as any unrealized gains or losses over the period — is added to or subtracted from the net investment result to determine the fund’s net gain or loss for the fiscal period.
Statement of changes in net assets shows how the fund’s net assets were affected by the fund’s net investment gain or loss, by distributions to shareholders, and by changes in the number of the fund’s shares. It lists distributions and their sources (net investment income or realized capital gains) over the current reporting period and the most recent fiscal year-end. The distributions listed here may not match the sources listed in the Statement of operations because the distributions are determined on a tax basis and may be paid in a different period from the one in which they were earned. Dividend sources are estimated at the time of declaration. Actual results may vary. Any non-taxable return of capital cannot be determined until final tax calculations are completed after the end of the fund’s fiscal year.
Financial highlights provide an overview of the fund’s investment results, per-share distributions, expense ratios, net investment income ratios, and portfolio turnover in one summary table, reflecting the five most recent reporting periods. In a semiannual report, the highlight table also includes the current reporting period.
30
| The fund’s portfolio 5/31/06 (Unaudited) | | | | |
|
| |
| |
| |
| |
| Key to abbreviations | | | | | |
| AMBAC AMBAC Indemnity Corporation | G.O. Bonds General Obligation Bonds | |
| COP Certificate of Participation | MBIA MBIA Insurance Company | |
| FGIC Financial Guaranty Insurance Company | U.S. Govt. Coll. U.S. Government Collateralized |
| FHA Insd. Federal Housing Administration Insured | VRDN Variable Rate Demand Notes | |
| FSA Financial Security Assurance | | | | | |
|
| |
| |
| MUNICIPAL BONDS AND NOTES (99.0%)* | | | | | |
|
| | Rating ** | | Principal amount | | Value |
|
| New York (91.6%) | | | | | |
| Albany Cnty., Indl. Dev. Agcy. Rev. Bonds | | | | | |
| (Albany College of Pharmacy), Ser. A, | | | | | |
| 5 3/8s, 12/1/24 | BBB- | $ | 1,000,000 | $ | 1,032,660 |
| Albany, Indl. Dev. Agcy. Civic Fac. Rev. Bonds | | | | | |
| (Albany Med. Ctr.), 6s, 5/1/29 | BBB+/P | | 1,460,000 | | 1,481,535 |
| (Charitable Leadership), Ser. A , 6s, 7/1/19 | Baa3 | | 2,750,000 | | 2,924,625 |
| Battery Park, City Auth. Rev. Bonds, | | | | | |
| Ser. A, AMBAC, U.S. Govt. Coll., 5 1/2s, | | | | | |
| 11/1/16 (Prerefunded) | Aaa | | 3,400,000 | | 3,493,976 |
| Chemung Cnty., Indl. Dev. Agcy. Civic Fac. | | | | | |
| Rev. Bonds (Arnot Ogden Med. Ctr.), | | | | | |
| 5s, 11/1/34 | A3 | | 800,000 | | 801,928 |
| Dutchess Cnty., Indl. Dev. Agcy. Civic | | | | | |
| Fac. Rev. Bonds | | | | | |
| (Bard College), 5 3/4s, 8/1/30 | A3 | | 13,500,000 | | 14,408,415 |
| (Vassar College), 5.35s, 9/1/40 | Aa2 | | 16,000,000 | | 16,872,640 |
| Erie Cnty., G.O. Bonds | | | | | |
| Ser. C, AMBAC, 5 1/2s, 7/1/29 (Prerefunded) | Aaa | | 2,470,000 | | 2,661,721 |
| Ser. B, AMBAC, 5 3/8s, 7/1/20 (Prerefunded) | Aaa | | 4,160,000 | | 4,463,430 |
| (Pub. Impt.), Ser. B, MBIA, 5 1/4s, 4/1/13 | Aaa | | 3,240,000 | | 3,489,545 |
| (Pub. Impt.), Ser. B, MBIA, 5s, 4/1/11 | Aaa | | 3,175,000 | | 3,346,990 |
| Essex Cnty., Indl. Dev. Agcy. Rev. Bonds | | | | | |
| (Intl. Paper Co.), Ser. A, 6.15s, 4/1/21 | BBB | | 2,250,000 | | 2,313,608 |
| Geneva, Indl. Dev. Agcy. Rev. Bonds | | | | | |
| (Hobart & William Smith), Ser. A, | | | | | |
| 5 3/8s, 2/1/33 | A | | 2,650,000 | | 2,778,817 |
| Hempstead, Indl. Dev. Agcy. Civic Fac. | | | | | |
| Rev. Bonds (Hofstra U.), 5 1/4s, 7/1/16 | A | | 2,200,000 | | 2,298,934 |
| Huntington, Hsg. Auth. Sr. Hsg. Fac. Rev. | | | | | |
| Bonds (Gurwin Jewish Sr. Residence), | | | | | |
| Ser. A, 6s, 5/1/29 | B+/P | | 1,250,000 | | 1,280,250 |
| Livingston Cnty., Indl. Dev. Agcy. Civic | | | | | |
| Fac. Rev. Bonds (Nicholas H. Noyes | | | | | |
| Memorial Hosp.) | | | | | |
| 5 3/4s, 7/1/15 | BB | | 1,330,000 | | 1,375,739 |
| 5s, 7/1/10 | BB | | 1,000,000 | | 1,002,520 |
31
| MUNICIPAL BONDS AND NOTES (99.0%)* continued | | | | |
|
| | Rating ** | | Principal amount | | Value |
|
| New York continued | | | | | |
| Long Island, Pwr. Auth. NY Elec. Syst. | | | | | |
| Rev. Bonds, Ser. A | | | | | |
| U.S. Govt. Coll., 5 3/4s, 12/1/24 | | | | | |
| (Prerefunded) | AAA | $ | 20,900,000 | $ | 21,953,778 |
| 5 1/8s, 9/1/29 | A3 | | 5,000,000 | | 5,162,900 |
| AMBAC, 5s, 9/1/29 | Aaa | | 5,500,000 | | 5,671,930 |
| Madison Cnty., Indl. Dev. Agcy. Rev. Bonds | | | | | |
| (Colgate U.), Ser. A, 5s, 7/1/23 | Aa3 | | 4,090,000 | | 4,257,813 |
| Metro. Trans. Auth. Rev. Bonds, Ser. A, | | | | | |
| AMBAC, 5 1/2s, 11/15/19 | Aaa | | 13,000,000 | | 14,067,170 |
| Metro. Trans. Auth. Commuter Fac. Rev. | | | | | |
| Bonds, Ser. A, 6s, 7/1/24 (Prerefunded) | AAA | | 5,550,000 | | 5,927,289 |
| Metro. Trans. Auth. Dedicated Tax Rev. | | | | | |
| Bonds, Ser. A, FSA, 5 1/4s, 11/15/24 | Aaa | | 10,000,000 | | 10,587,200 |
| Metro. Trans. Auth. Fac. Rev. Bonds | | | | | |
| (Trans. Fac.), Ser. A, 6s, 7/1/24 | | | | | |
| (Prerefunded) | AAA | | 11,020,000 | | 11,752,610 |
| Metro. Trans. Auth. Svc. Contract Rev. | | | | | |
| Bonds (Trans. Fac.) | | | | | |
| Ser. 3, U.S. Govt. Coll., 7 3/8s, 7/1/08 | | | | | |
| (Prerefunded) | AAA | | 2,060,000 | | 2,136,199 |
| Ser. O, 5 3/4s, 7/1/13 (Prerefunded) | AAA | | 15,820,000 | | 17,100,471 |
| Ser. O, 5 1/2s, 7/1/17 (Prerefunded) | AAA | | 24,345,000 | | 27,144,675 |
| Nassau Cnty., G.O. Bonds | | | | | |
| Ser. E, FSA, U.S. Govt. Coll., 6s, 3/1/20 | | | | | |
| (Prerefunded) | Aaa | | 1,125,000 | | 1,216,136 |
| Ser. E, FSA, U.S. Govt. Coll., 6s, 3/1/19 | | | | | |
| (Prerefunded) | Aaa | | 2,790,000 | | 3,016,018 |
| Ser. E, FSA, U.S. Govt. Coll., 6s, 3/1/18 | | | | | |
| (Prerefunded) | Aaa | | 2,735,000 | | 2,956,562 |
| Ser. E, FSA, U.S. Govt. Coll., 6s, 3/1/16 | | | | | |
| (Prerefunded) | Aaa | | 3,465,000 | | 3,745,700 |
| Ser. A, FGIC, 6s, 7/1/13 | Aaa | | 1,000,000 | | 1,122,110 |
| Ser. A, FGIC, 6s, 7/1/11 | Aaa | | 2,300,000 | | 2,530,253 |
| Ser. E, FSA, U.S. Govt. Coll., 5.9s, | | | | | |
| 3/1/15 (Prerefunded) | Aaa | | 2,580,000 | | 2,780,079 |
| Nassau Cnty., Indl. Dev. Agcy. Rev. Bonds | | | | | |
| (North Shore Hlth. Syst.) | | | | | |
| Ser. A, 6 1/4s, 11/1/21 | A3 | | 410,000 | | 436,383 |
| Ser. B, 5 7/8s, 11/1/11 | A3 | | 1,005,000 | | 1,051,793 |
| Ser. D, 5 5/8s, 11/1/09 | A3 | | 825,000 | | 861,911 |
| Nassau Cnty., Interim Fin. Auth. Rev. | | | | | |
| Bonds, Ser. A, MBIA, 5s, 11/15/15 | Aaa | | 6,500,000 | | 6,969,950 |
| Nassau, Cnty., Tobacco Settlement Corp. | | | | | |
| Rev. Bonds, Ser. A-2, zero %, 6/1/26 | BBB | | 2,250,000 | | 1,916,325 |
| Niagara Cnty., Indl. Dev. Agcy. Rev. | | | | | |
| Bonds, Ser. D, 5.55s, 11/15/24 | Baa3 | | 3,000,000 | | 3,128,430 |
32
| MUNICIPAL BONDS AND NOTES (99.0%)* continued | | | | | |
| |
| | Rating ** | | Principal amount | | Value | |
|
| New York continued | | | | | | |
| Niagara Falls, City School Dist. COP | | | | | | |
| (High School Fac.) | | | | | | |
| 5 7/8s, 6/15/19 (Prerefunded) | Baa3 | $ | 6,000,000 | $ | 6,309,540 | |
| FSA, 5s, 6/15/28 | AAA | | 1,800,000 | | 1,858,050 | |
| FSA, 5s, 6/15/24 | AAA | | 4,160,000 | | 4,297,280 | |
| FSA, 5s, 6/15/23 | AAA | | 3,965,000 | | 4,101,793 | |
| NY City, G.O. Bonds | | | | | | |
| Ser. B, MBIA, 6 1/2s, 8/15/11 | Aaa | | 18,675,000 | | 21,020,954 | |
| Ser. D, MBIA, 6 1/2s, 11/1/10 | Aaa | | 21,495,000 | | 23,855,581 | |
| Ser. I, U.S. Govt. Coll., 6 1/4s, 4/15/27 | | | | | | |
| (Prerefunded) | Aaa | | 945,000 | | 975,401 | |
| Ser. I, U.S. Govt. Coll., 6 1/4s, 4/15/17 | | | | | | |
| (Prerefunded) | Aaa | | 1,845,000 | | 1,904,354 | |
| AMBAC, 6.05s, 9/1/11 | Aaa | | 100,000 | | 100,237 | |
| Ser. B, 5 1/2s, 12/1/11 | AA- | | 23,525,000 | | 25,308,430 | |
| Ser. C, 5 1/4s, 8/1/11 | AA- | | 3,000,000 | | 3,187,350 | |
| Ser. J/J-1, 5s, 6/1/21 | AA- | | 6,250,000 | | 6,483,875 | |
| Ser. N, 5s, 8/1/20 | AA- | | 1,000,000 | | 1,037,120 | |
| Ser. M, 5s, 4/1/20 | AA- | | 6,775,000 | | 7,018,968 | |
| Ser. I-1, 5s, 4/1/19 | AA- | | 1,600,000 | | 1,668,016 | |
| NY City, City Transitional Fin. Auth. | | | | | | |
| Rev. Bonds | | | | | | |
| Ser. A, U.S. Govt. Coll., 5 3/4s, 8/15/24 | | | | | | |
| (Prerefunded) | AAA | | 6,500,000 | | 6,967,610 | |
| AMBAC, 5 1/4s, 8/1/15 | Aaa | | 2,000,000 | | 2,137,360 | |
| Ser. C, U.S. Govt. Coll., 5s, 5/1/26 | | | | | | |
| (Prerefunded) | AAA | | 80,000 | | 82,805 | |
| NY City, City Transitional Fin. Auth. VRDN | | | | | | |
| (NYC Recovery), Ser. 3, 3.59s, 11/1/22 | VMIG1 | | 20,790,000 | | 20,790,000 | |
| NY City, Hsg. Dev. Corp. Rev. Bonds, | | | | | | |
| Ser. A, FGIC, 5s, 7/1/25 | Aaa | | 2,600,000 | | 2,693,912 | |
| NY City, Indl. Dev. Agcy. Rev. Bonds | | | | | | |
| (Visy Paper, Inc.), 7.95s, 1/1/28 | B-/P | | 2,600,000 | | 2,658,396 | |
| (Liberty-7 World Trade Ctr.), Ser. A, | | | | | | |
| 6 1/4s, 3/1/15 | B-/P | | 2,050,000 | | 2,161,315 | |
| (Brooklyn Navy Yard Cogen. Partners), | | | | | | |
| 6.2s, 10/1/22 | BBB- | | 5,000,000 | | 5,262,300 | |
| (Brooklyn Navy Yard Cogen. Partners), | | | | | | |
| 5.65s, 10/1/28 | BBB- | | 1,440,000 | | 1,444,190 | |
| NY City, Indl. Dev. Agcy. Civic Fac. | | | | | | |
| Rev Bonds | | | | | | |
| (Parking Corp.), 8 1/2s, 12/30/22 | B-/P | | 6,970,000 | | 5,958,305 | |
| (Staten Island U. Hosp.), Ser. A, | | | | | | |
| 6 3/8s, 7/1/31 | B2 | | 3,280,000 | | 3,334,973 | |
| (Brooklyn Polytech. U. Project J), | | | | | | |
| 6 1/8s, 11/1/30 | BB+ | | 5,500,000 | | 5,482,345 | |
| (United Jewish Appeal), Ser. A, | | | | | | |
| 5 1/4s, 7/1/23 | Aa2 | | 2,545,000 | | 2,704,775 | |
| (St. Francis College), 5s, 10/1/34 | A- | | 750,000 | | 753,495 | |
| (Horace Mann School), MBIA, 5s, 7/1/28 | Aaa | | 7,000,000 | | 7,160,020 | |
33 | | | | | | |
| MUNICIPAL BONDS AND NOTES (99.0%)* continued | | | | |
|
| | Rating ** | | Principal amount | | Value |
|
| New York continued | | | | | |
| NY City, Indl. Dev. Agcy. Special Arpt. | | | | | |
| Fac. Rev. Bonds | | | | | |
| (Airis JFK I LLC), Ser. A, 6s, 7/1/27 | Baa3 | $ | 9,500,000 | $ | 9,809,890 |
| (Airis JFK I LLC), Ser. A, 5 1/2s, 7/1/28 | Baa3 | | 3,000,000 | | 3,060,960 |
| NY City, Indl. Dev. Agcy. Special Fac. | | | | | |
| Rev. Bonds | | | | | |
| (Terminal One Group Assn.), 5 1/2s, 1/1/17 | A3 | | 3,900,000 | | 4,153,617 |
| (British Airways PLC), 5 1/4s, 12/1/32 | Ba2 | | 3,650,000 | | 3,412,677 |
| NY City, Metro. Trans. Auth. Rev. Bonds, | | | | | |
| Ser. A, AMBAC, 5 1/4s, 1/1/29 | | | | | |
| (Prerefunded) | Aaa | | 5,000,000 | | 5,307,750 |
| NY City, Muni. Assistance Corp. Rev. | | | | | |
| Bonds, Ser. P, U.S. Govt. Coll., 5s, | | | | | |
| 7/1/08 (Prerefunded) | Aaa | | 10,000,000 | | 10,278,900 |
| NY City, Muni. Wtr. & Swr. Fin. Auth. | | | | | |
| Rev. Bonds | | | | | |
| AMBAC, 7 1/2s, 6/15/11 | Aaa | | 25,600,000 | | 29,175,296 |
| Ser. B, FGIC, U.S. Govt. Coll., 7 1/2s, | | | | | |
| 6/15/11 (Prerefunded) | Aaa | | 290,000 | | 328,364 |
| Ser. B , FGIC, U.S. Govt. Coll., 7 1/2s, | | | | | |
| 6/15/11 (Prerefunded) | Aaa | | 110,000 | | 124,561 |
| Ser. D, 5s, 6/15/37 | AA+ | | 8,500,000 | | 8,717,175 |
| Ser. B, AMBAC, 5s, 6/15/28 | Aaa | | 5,000,000 | | 5,189,700 |
| NY City, State Dorm. Auth. Lease Rev. Bonds | | | | | |
| (Court Fac.), 6s, 5/15/39 (Prerefunded) | A+ | | 5,600,000 | | 6,114,864 |
| (Westchester Cnty.), AMBAC, 5 1/4s, 8/1/18 | | | | | |
| (Prerefunded) | Aa1 | | 3,000,000 | | 3,144,420 |
| NY Cntys., Tobacco Trust II Rev. Bonds | | | | | |
| (Tobacco Settlement), 5 3/4s, 6/1/43 | BBB | | 6,000,000 | | 6,136,980 |
| NY Cntys., Tobacco Trust III Rev. Bonds | | | | | |
| (Tobacco Settlement) | | | | | |
| 6s, 6/1/43 | BBB | | 1,000,000 | | 1,046,370 |
| 5 3/4s, 6/1/33 | BBB | | 3,500,000 | | 3,624,005 |
| NY Cntys., Tobacco Trust IV Rev. Bonds, | | | | | |
| Ser. A, 5s, 6/1/38 | BBB | | 7,000,000 | | 6,740,650 |
| NY State Dorm. Auth. Rev. Bonds | | | | | |
| (State U. Edl. Fac.), Ser. A, 7 1/2s, 5/15/13 | AA- | | 5,000,000 | | 5,988,100 |
| (City U. Syst.), Ser. C, 7 1/2s, 7/1/10 | A1 | | 16,205,000 | | 17,383,104 |
| (Mount Sinai Hlth.), Ser. A, 6 1/2s, 7/1/25 | Ba1 | | 2,500,000 | | 2,668,950 |
| (State U. Edl. Fac.), Ser. A, FSA, | | | | | |
| 5 7/8s, 5/15/17 | Aaa | | 8,950,000 | | 10,288,204 |
| (State U. Edl. Fac.), Ser. A, 5 7/8s, 5/15/11 | AA- | | 11,200,000 | | 12,212,032 |
| (Winthrop Nassau U.), 5 3/4s, 7/1/28 | Baa1 | | 5,250,000 | | 5,497,853 |
| (Schools PG - Issue 2), Ser. E, AMBAC, | | | | | |
| 5 3/4s, 7/1/19 | Aaa | | 1,340,000 | | 1,428,199 |
| (U. Syst. Construction), Ser. A, | | | | | |
| 5 3/4s, 7/1/18 | AA- | | 35,385,000 | | 39,638,985 |
| (City U.), Ser. A, MBIA, 5 3/4s, 7/1/13 | Aaa | | 26,500,000 | | 28,745,610 |
34
| MUNICIPAL BONDS AND NOTES (99.0%)* continued | | | | |
|
| | Rating ** | | Principal amount | | Value |
|
| New York continued | | | | | |
| NY State Dorm. Auth. Rev. Bonds | | | | | |
| (U. Syst. Construction), Ser. A, | | | | | |
| 5 5/8s, 7/1/16 | AA- | $ | 15,600,000 | $ | 17,288,232 |
| (NYU), Ser. 1, AMBAC, 5 1/2s, 7/1/40 | Aaa | | 8,500,000 | | 9,979,595 |
| (North Shore Long Island Jewish Group), | | | | | |
| 5 1/2s, 5/1/33 | A3 | | 2,000,000 | | 2,096,940 |
| (Winthrop-U. Hosp. Assn.), Ser. A, | | | | | |
| 5 1/2s, 7/1/32 | Baa1 | | 1,150,000 | | 1,190,779 |
| (NYU), Ser. 1, AMBAC, 5 1/2s, 7/1/31 | Aaa | | 3,500,000 | | 3,999,975 |
| (Winthrop Nassau U.), 5 1/2s, 7/1/23 | Baa1 | | 2,750,000 | | 2,837,560 |
| (Mental Hlth.), Ser. D, FSA, | | | | | |
| 5 1/4s, 8/15/30 | Aaa | | 1,460,000 | | 1,522,868 |
| (Mental Hlth.), Ser. D, FSA, U.S. Govt. | | | | | |
| Coll., 5 1/4s, 8/15/30 (Prerefunded) | Aaa | | 690,000 | | 732,263 |
| (Mental Hlth. Svcs.), Ser. D, FSA, U.S. | | | | | |
| Govt. Coll., 5 1/4s, 8/15/30 | | | | | |
| (Prerefunded) | Aaa | | 17,810,000 | | 18,900,863 |
| (Rochester Inst. of Tech.), Ser. A, AMBAC, | | | | | |
| 5 1/4s, 7/1/19 | Aaa | | 4,150,000 | | 4,532,298 |
| (NY Methodist Hosp.), 5 1/4s, 7/1/18 | A3 | | 750,000 | | 785,625 |
| (NY Methodist Hosp.), 5 1/4s, 7/1/17 | A3 | | 1,865,000 | | 1,953,588 |
| (Rochester U.), Ser. A, 5 1/8s, 7/1/39 | A1 | | 6,405,000 | | 6,585,877 |
| (Memorial Sloan-Kettering Ctr.), Ser. 1, | | | | | |
| 5s, 7/1/34 | Aa2 | | 13,500,000 | | 13,732,740 |
| (Rochester U.), Ser. A, 5s, 7/1/34 | A1 | | 5,500,000 | | 5,631,835 |
| (Yeshiva U.), AMBAC, 5s, 7/1/30 | Aaa | | 3,000,000 | | 3,071,340 |
| (Montefiore Hosp.), FGIC, FHA Insd., | | | | | |
| 5s, 8/1/29 | Aaa | | 9,530,000 | | 9,812,850 |
| (NYU), Ser. A, FGIC, 5s, 7/1/29 | Aaa | | 5,705,000 | | 5,907,813 |
| (U. of Rochester), Ser. A, MBIA, 5s, 7/1/27 | Aaa | | 3,000,000 | | 3,062,580 |
| (Yeshiva U.), AMBAC, 5s, 7/1/26 | Aaa | | 2,700,000 | | 2,786,454 |
| (Albany), Ser. A-1, FSA, FHA Insd., | | | | | |
| 5s, 8/15/25 | Aaa | | 1,500,000 | | 1,564,410 |
| (Columbia U.), Ser. B, 5s, 7/1/24 | Aaa | | 2,000,000 | | 2,079,480 |
| (Columbia U.), Ser. B, 5s, 7/1/23 | Aaa | | 2,000,000 | | 2,082,740 |
| (Columbia U.), 5s, 7/1/22 (Prerefunded) | Aaa | | 7,500,000 | | 7,778,850 |
| (Columbia U.), Ser. B, 5s, 7/1/22 | Aaa | | 3,000,000 | | 3,129,000 |
| (Cornell U.), Ser. A, 5s, 7/1/22 | Aa1 | | 6,395,000 | | 6,736,237 |
| (Columbia U.), Ser. B, 5s, 7/1/21 | Aaa | | 2,000,000 | | 2,094,740 |
| Ser. A, MBIA, 5s, 3/15/19 | AAA | | 1,700,000 | | 1,778,999 |
| (Columbia U.), Ser. A, 5s, 7/1/17 | Aaa | | 7,660,000 | | 8,223,929 |
| (Columbia U.), 5s, 7/1/14 | Aaa | | 2,000,000 | | 2,148,180 |
| (Lutheran Med.), MBIA, FHA Insd., | | | | | |
| 5s, 8/1/12 | Aaa | | 2,505,000 | | 2,654,373 |
| (Mt. Sinai NYU Hlth.), Ser. C, 5s, 7/1/11 | Ba1 | | 2,250,000 | | 2,277,720 |
| (Colgate U.), MBIA, 4 3/4s, 7/1/28 | Aaa | | 10,000,000 | | 10,107,400 |
| (State U. Edl. Fac.), Ser. B, zero %, | | | | | |
| 5/15/09 | AA- | | 725,000 | | 640,929 |
35
| MUNICIPAL BONDS AND NOTES (99.0%)* continued | | | | |
|
| | Rating ** | | Principal amount | | Value |
|
| New York continued | | | | | |
| NY State Dorm. Auth. Lease Rev. Bonds | | | | | |
| (State U. Dorm Fac.), Ser. A, MBIA, | | | | | |
| 5s, 7/1/29 | Aaa | $ | 11,740,000 | $ | 12,199,504 |
| NY State Energy Research & Dev. Auth. Rev. | | | | | |
| Bonds, 6.368s, 4/1/20 | A+ | | 7,000,000 | | 7,441,280 |
| NY State Energy Research & Dev. Auth. Gas | | | | | |
| Fac. Rev. Bonds (Brooklyn Union Gas), | | | | | |
| 6.952s, 7/1/26 | A+ | | 12,000,000 | | 12,264,600 |
| NY State Env. Fac. Corp. Poll. Control | | | | | |
| Rev. Bonds | | | | | |
| (State Wtr. Revolving Fund), Ser. B, | | | | | |
| 6.65s, 9/15/13 | Aaa | | 3,425,000 | | 3,454,181 |
| (State Wtr. Revolving Fund), Ser. A, | | | | | |
| 6.55s, 9/15/10 | Aaa | | 1,735,000 | | 1,739,650 |
| (State Wtr.), 5 7/8s, 6/15/14 | Aaa | | 270,000 | | 270,502 |
| NY State Env. Fac. Corp. State Clean Wtr. | | | | | |
| & Drinking Rev. Bonds (NYC Muni. Wtr. | | | | | |
| Fin.), 5s, 6/15/29 # | Aaa | | 13,590,000 | | 14,108,323 |
| NY State Hsg. Fin. Agcy. Rev. Bonds | | | | | |
| (Multi-Fam. Hsg. Insd. Mtge. Program), | | | | | |
| Ser. A, FHA Insd., 7s, 8/15/22 | Aaa | | 835,000 | | 836,019 |
| NY State Hwy. & Bridge Auth. Rev. Bonds, | | | | | |
| Ser. A | | | | | |
| FSA, U.S. Govt. Coll., 6s, 4/1/16 | | | | | |
| (Prerefunded) | Aaa | | 1,000,000 | | 1,091,410 |
| FSA, 5.8s, 4/1/18 (Prerefunded) | Aaa | | 2,000,000 | | 2,168,660 |
| FSA, 5 3/4s, 4/1/17 (Prerefunded) | Aaa | | 2,000,000 | | 2,165,140 |
| NY State Mtge. Agcy. Rev. Bonds (Homeowner | | | | | |
| Mtge.), Ser. 124 | | | | | |
| 4.1s, 4/1/16 | Aa1 | | 1,000,000 | | 988,010 |
| 4s, 10/1/15 | Aa1 | | 550,000 | | 543,648 |
| 3.9s, 10/1/14 | Aa1 | | 520,000 | | 518,149 |
| NY State Pwr. Auth. Rev. Bonds | | | | | |
| 5s, 11/15/20 | Aa2 | | 4,250,000 | | 4,442,568 |
| 5s, 11/15/06 | Aa2 | | 31,135,000 | | 31,337,987 |
| NY State Thruway Auth. Rev. Bonds | | | | | |
| Ser. A, MBIA, 5 1/4s, 4/1/22 (Prerefunded) | Aaa | | 4,300,000 | | 4,660,641 |
| (Gen. Hwy. & Bridge Trust Fund), Ser. A, | | | | | |
| MBIA, 5s, 4/1/21 | Aaa | | 2,000,000 | | 2,086,640 |
| NY State Urban Dev. Corp. Rev. Bonds | | | | | |
| (Correctional Fac.), Ser. 7, U.S. Govt. | | | | | |
| Coll., 5.7s, 1/1/16 (Prerefunded) | AA- | | 5,830,000 | | 6,013,820 |
| (Clarkson Ctr.), 5 1/2s, 1/1/20 | AA- | | 1,685,000 | | 1,873,922 |
| (Personal Income Tax), Ser. C-1, FGIC, | | | | | |
| 5 1/2s, 3/15/19 (Prerefunded) | Aaa | | 4,000,000 | | 4,392,680 |
| (Clarkson Ctr.), 5 1/2s, 1/1/15 | AA- | | 3,345,000 | | 3,599,655 |
| (Syracuse U. ), 5 1/2s, 1/1/15 | AA- | | 2,000,000 | | 2,154,740 |
| (Correctional Fac.), Ser. A, 5 1/2s, 1/1/09 | AA- | | 7,710,000 | | 8,039,603 |
| Ser. A-1, FGIC, 5s, 3/15/29 | Aaa | | 6,565,000 | | 6,777,969 |
36
| MUNICIPAL BONDS AND NOTES (99.0%)* continued | | | | |
|
| | Rating ** | Principal amount | | Value |
|
| New York continued | | | | | |
| NY State Urban Dev. Corp. Rev. Bonds | | | | | |
| (Correctional Fac.), Ser. A, U.S. Govt. | | | | | |
| Coll., 5s, 1/1/28 (Prerefunded) | AA- | $ | 355,000 | $ | 369,289 |
| Oneida Cnty., Indl. Dev. Agcy. Rev. Bonds | | | | | |
| (St. Elizabeth Med.), Ser. A, 5 7/8s, 12/1/29 | BB+/P | | 1,000,000 | | 1,014,810 |
| Onondaga Cnty., Indl. Dev. Agcy. Rev. | | | | | |
| Bonds (Solvay Paperboard, LLC), 7s, | | | | | |
| 11/1/30 (acquired 12/9/98, | | | | | |
| cost $1,000,000) ‡�� | BB/P | | 1,000,000 | | 1,044,860 |
| Orange Cnty., Indl. Dev. Agcy. Rev. Bonds | | | | | |
| (Arden Hill Care Ctr. Newburgh), Ser. C | | | | | |
| 7s, 8/1/31 | BB-/P | | 3,200,000 | | 3,340,160 |
| 7s, 8/1/21 | BB-/P | | 2,300,000 | | 2,404,788 |
| Port Auth. NY & NJ Rev. Bonds | | | | | |
| (Kennedy Intl. Arpt. - 5th Installment), | | | | | |
| 6 3/4s, 10/1/19 | BB+/P | | 3,100,000 | | 3,156,730 |
| (Kennedy Intl. Arpt. - 4th Installment), | | | | | |
| 6 3/4s, 10/1/11 | BB+/P | | 1,000,000 | | 1,019,150 |
| Sales Tax Asset Receivable Corp. Rev. | | | | | |
| Bonds, Ser. A | | | | | |
| AMBAC, 5s, 10/15/29 | Aaa | | 18,000,000 | | 18,696,600 |
| MBIA, 5s, 10/15/26 | Aaa | | 20,000,000 | | 20,859,200 |
| MBIA, 5s, 10/15/25 | Aaa | | 15,000,000 | | 15,676,500 |
| St. Lawrence Cnty., Indl. Dev. Rev. Bonds | | | | | |
| (St. Lawrence U.), Ser. A, MBIA, 5s, 7/1/28 | Aaa | | 7,750,000 | | 7,906,938 |
| Suffolk Cnty., G.O. Bonds, FSA, 5s, 6/15/15 | Aaa | | 3,375,000 | | 3,618,034 |
| Suffolk Cnty., Indl. Dev. Agcy. Rev. Bonds | | | | | |
| (Peconic Landing), Ser. A, 8s, 10/1/30 | B+/P | | 4,200,000 | | 4,600,008 |
| (Nissequogue Cogen. Partners Fac.), | | | | | |
| 5 1/2s, 1/1/23 | BB+/P | | 2,000,000 | | 1,846,440 |
| Suffolk Cnty., Indl. Dev. Agcy. Civic Fac. | | | | | |
| Rev. Bonds | | | | | |
| (Southampton Hosp. Assn.), Ser. B, | | | | | |
| 7 5/8s, 1/1/30 | B-/P | | 490,000 | | 504,803 |
| (Southampton Hosp. Assn.), Ser. A, | | | | | |
| 7 1/4s, 1/1/30 | B-/P | | 500,000 | | 507,025 |
| (Huntington Hosp.), Ser. B, 5 7/8s, 11/1/32 | Baa1 | | 2,200,000 | | 2,292,048 |
| Suffolk Cnty., Indl. Dev. Agcy. Cont. Care | | | | | |
| Retirement Rev. Bonds (Jefferson’s | | | | | |
| Ferry), Ser. A | | | | | |
| 7 1/4s, 11/1/28 (Prerefunded) | BBB- | | 4,000,000 | | 4,515,360 |
| 7.2s, 11/1/19 (Prerefunded) | BBB- | | 4,000,000 | | 4,451,120 |
| Suffolk Cnty., Judicial Fac. Agcy. Rev. | | | | | |
| Bonds (John P. Cohalan Complex), AMBAC, | | | | | |
| 5s, 4/15/16 | Aaa | | 4,220,000 | | 4,408,550 |
| Syracuse, Indl. Dev. Agcy. Rev. Bonds (1st | | | | | |
| Mtge. - Jewish Home), Ser. A | | | | | |
| 7 3/8s, 3/1/31 | BB-/P | | 2,800,000 | | 2,911,496 |
| 7 3/8s, 3/1/21 | BB-/P | | 800,000 | | 834,896 |
37
| MUNICIPAL BONDS AND NOTES (99.0%)* continued | | | | |
|
| | Rating ** | | Principal amount | | Value |
|
| New York continued | | | | | |
| Tobacco Settlement Rev. Bonds | | | | | |
| (Asset Backed Bonds), Ser. 1, 5 3/4s, | | | | | |
| 7/15/32 (Prerefunded) | AAA | $ | 4,250,000 | $ | 4,697,993 |
| Ser. 1, 5s, 6/1/34 | BBB | | 3,500,000 | | 3,412,465 |
| Triborough Bridge & Tunnel Auth. Gen. | | | | | |
| Purpose Rev. Bonds (Convention Ctr.), | | | | | |
| Ser. E, 7 1/4s, 1/1/10 | AA- | | 24,405,000 | | 25,965,212 |
| Westchester Cnty., Indl Dev. Agcy. Civic | | | | | |
| Fac. Rev. Bonds (Guiding Eyes for the | | | | | |
| Blind), 5 3/8s, 8/1/24 | BBB | | 800,000 | | 826,824 |
| Westchester, Tobacco Asset | | | | | |
| Securitization Corp. Rev. Bonds | | | | | |
| 5 1/8s, 6/1/38 | BBB | | 2,500,000 | | 2,455,600 |
| 5s, 6/1/26 | BBB | | 2,000,000 | | 1,965,260 |
| Yonkers, Indl. Dev. Agcy. Civic Fac. Rev. | | | | | |
| Bonds (St. John’s Riverside Hosp.), | | | | | |
| Ser. A, 7 1/8s, 7/1/31 | BB | | 4,005,000 | | 4,168,925 |
| | | | | | 1,086,806,431 |
|
| |
| Puerto Rico (7.4%) | | | | | |
| Children’s Trust Fund Tobacco Settlement | | | | | |
| Rev. Bonds, 5 1/2s, 5/15/39 | BBB | | 8,000,000 | | 8,194,960 |
| Cmnwlth. of PR, G.O. Bonds (Pub. Impt.), | | | | | |
| MBIA, 5 1/4s, 7/1/18 | Aaa | | 4,750,000 | | 5,208,945 |
| Cmnwlth. of PR, Hwy. & Trans. Auth. Rev. | | | | | |
| Bonds | | | | | |
| Ser. B, MBIA, 5 7/8s, 7/1/35 (Prerefunded) | Aaa | | 2,275,000 | | 2,483,595 |
| Ser. AA, 5s, 7/1/35 | BBB+ | | 2,105,000 | | 2,107,400 |
| Ser. K, 5s, 7/1/21 | BBB+ | | 2,000,000 | | 2,037,920 |
| Ser. K, 5s, 7/1/18 | BBB+ | | 8,000,000 | | 8,216,960 |
| Ser. K, 5s, 7/1/17 | BBB+ | | 2,500,000 | | 2,575,275 |
| Ser. K, 5s, 7/1/16 | BBB+ | | 5,000,000 | | 5,169,300 |
| PR Elec. Pwr. Auth. Rev. Bonds | | | | | |
| Ser. W, MBIA, 7s, 7/1/07 | Aaa | | 20,000,000 | | 20,704,000 |
| Ser. AA, MBIA, 5 3/8s, 7/1/27 | Aaa | | 5,265,000 | | 5,434,902 |
| Ser. AA, MBIA, U.S. Govt. Coll., 5 3/8s, | | | | | |
| 7/1/27 (Prerefunded) | Aaa | | 4,735,000 | | 4,892,391 |
| Ser. RR, FGIC, 5s, 7/1/24 | Aaa | | 6,500,000 | | 6,783,985 |
| PR Indl. Tourist Edl. Med. & Env. Control | | | | | |
| Fac. Rev. Bonds (Cogen. Fac.-AES), | | | | | |
| 6 5/8s, 6/1/26 | Baa3 | | 6,000,000 | | 6,554,640 |
| U. of PR Rev. Bonds, Ser. O, MBIA, 5 3/8s, | | | | | |
| 6/1/30 | Aaa | | 7,000,000 | | 7,012,460 |
| | | | | | 87,376,733 |
|
| |
| TOTAL INVESTMENTS | | | | | |
| Total investments (cost $1,119,108,538) | | | | $ | 1,174,183,164 |
38
* Percentages indicated are based on net assets of $1,186,438,359.
** The Moody’s or Standard & Poor’s ratings indicated are believed to be the most recent ratings available at May 31, 2006 for
the securities listed. Ratings are generally ascribed to securities at the time of issuance. While the agencies may from time
to time revise such ratings, they undertake no obligation to do so, and the ratings do not necessarily represent what the
agencies would ascribe to these securities at May 31, 2006. Securities rated by Putnam are indicated by “/P”. Security ratings
are defined in the Statement of Additional Information.
‡ Restricted, excluding 144A securities, as to public resale. The total market value of restricted securities held at May 31, 2006,
was $1,044,860 or less than 0.1% of net assets.
# A portion of this security was pledged and segregated with the custodian to cover margin requirements for futures contracts
at May 31, 2006.
At May 31, 2006, liquid assets totaling $23,795,922 have been designated as collateral for open forward commitments and
futures contracts.
The rates shown on VRDN are the current interest rates at May 31, 2006.
The fund had the following industry group concentrations greater than 10% at May 31, 2006 (as a percentage of net assets):
Utilities and power 17.6%
Education 14.6
The fund had the following insurance concentrations greater than 10% at May 31, 2006 (as a percentage of net assets):
MBIA 18.7%
AMBAC 10.5
|
| FUTURES CONTRACTS OUTSTANDING at 5/31/06 (Unaudited) | | | |
|
| |
| | | Number of | | | Expiration | Unrealized |
| | | contracts | | Value | date | depreciation |
| U.S. Treasury Note 10 yr (Long) | 165 | | $17,312,109 | Sep-06 | $(95,886) |
|
| |
| INTEREST RATE SWAP CONTRACTS OUTSTANDING at 5/31/06 (Unaudited) | | |
|
| | | Payments | | Payments | | |
| Swap counterparty / | Termination | made by | | received by | | Unrealized |
| Notional amount | date | fund per annum | | fund per annum | depreciation |
|
| Merrill Lynch Capital Services, Inc. | | | | | |
| $28,400,000 | 11/22/16 | 4.1735% | | 3 month U.S. Bond | |
| | | | | Market Association | |
| | | | | Municipal Swap Index | $(84,078) |
|
| 20,200,000 | 11/22/16 | 3 month USD-LIBOR-BBA | 5.711% | | (3,434) |
|
| Total | | | | | | $(87,512) |
The accompanying notes are an integral part of these financial statements.
|
39
| Statement of assets and liabilities 5/31/06 (Unaudited) | |
|
| |
| ASSETS | |
| Investment in securities, at value (Note 1) | |
| Unaffiliated issuers (identified cost $1,119,108,538) | $1,174,183,164 |
|
| Cash | 4,595,669 |
|
| Interest and other receivables | 19,876,195 |
|
| Receivable for shares of the fund sold | 258,452 |
|
| Total assets | 1,198,913,480 |
|
| |
| LIABILITIES | |
| Payable for variation margin (Note 1) | 49,368 |
|
| Distributions payable to shareholders | 1,686,176 |
|
| Payable for securities purchased | 6,483,813 |
|
| Payable for shares of the fund repurchased | 1,829,682 |
|
| Payable for compensation of Manager (Note 2) | 1,515,004 |
|
| Payable for investor servicing and custodian fees (Note 2) | 97,726 |
|
| Payable for Trustee compensation and expenses (Note 2) | 192,043 |
|
| Payable for administrative services (Note 2) | 6,716 |
|
| Payable for distribution fees (Note 2) | 437,236 |
|
| Unrealized depreciation on swap contracts (Note 1) | 87,512 |
|
| Other accrued expenses | 89,845 |
|
| Total liabilities | 12,475,121 |
|
| Net assets | $1,186,438,359 |
|
| |
| REPRESENTED BY | |
| Paid-in capital (Unlimited shares authorized) (Notes 1 and 4) | $1,139,293,236 |
|
| Undistributed net investment income (Note 1) | 3,453,832 |
|
| Accumulated net realized loss on investments (Note 1) | (11,199,937) |
|
| Net unrealized appreciation of investments | 54,891,228 |
|
| Total — Representing net assets applicable to capital shares outstanding | $1,186,438,359 |
| |
| (Continued on next page) | |
40
| Statement of assets and liabilities (Continued) | |
|
| |
| COMPUTATION OF NET ASSET VALUE AND OFFERING PRICE | |
| Net asset value and redemption price per class A share | |
| ($1,102,904,653 divided by 128,787,844 shares) | $8.56 |
|
| Offering price per class A share | |
| (100/96.25 of $8.56)* | $8.89 |
|
| Net asset value and offering price per class B share | |
| ($70,377,265 divided by 8,233,634 shares)** | $8.55 |
|
| Net asset value and offering price per class C share | |
| ($10,536,216 divided by 1,230,552 shares)** | $8.56 |
|
| Net asset value and redemption price per class M share | |
| ($2,620,225 divided by 305,806 shares) | $8.57 |
|
| Offering price per class M share | |
| (100/96.75 of $8.57)*** | $8.86 |
* On single retail sales of less than $100,000. On sales of $100,000 or more and on group sales, the offering price is reduced.
** Redemption price per share is equal to net asset value less any applicable contingent deferred sales charge.
*** On single retail sales of less than $50,000. On sales of $50,000 or more and on group sales, the offering price is reduced.
|
The accompanying notes are an integral part of these financial statements.
41
| Statement of operations Six months ended 5/31/06 (Unaudited) | |
|
| |
| INTEREST INCOME | $30,116,028 |
|
| |
| EXPENSES | |
| Compensation of Manager (Note 2) | 3,036,622 |
|
| Investor servicing fees (Note 2) | 299,453 |
|
| Custodian fees (Note 2) | 73,861 |
|
| Trustee compensation and expenses (Note 2) | 39,587 |
|
| Administrative services (Note 2) | 20,871 |
|
| Distribution fees — Class A (Note 2) | 1,138,027 |
|
| Distribution fees — Class B (Note 2) | 327,140 |
|
| Distribution fees — Class C (Note 2) | 51,686 |
|
| Distribution fees — Class M (Note 2) | 6,647 |
|
| Other | 126,946 |
|
| Non-recurring costs (Notes 2 and 5) | 2,104 |
|
| Costs assumed by Manager (Notes 2 and 5) | (2,104) |
|
| Total expenses | 5,120,840 |
|
| Expense reduction (Note 2) | (35,230) |
|
| Net expenses | 5,085,610 |
|
| Net investment income | 25,030,418 |
|
| Net realized gain on investments (Notes 1 and 3) | 2,221,676 |
|
| Net realized loss on futures contracts (Note 1) | (437,355) |
|
| Net realized gain on swap contracts (Note 1) | 502,628 |
|
| Net unrealized depreciation of investments, swap contracts | |
| and futures contracts during the period | (9,893,396) |
|
| Net loss on investments | (7,606,447) |
|
| Net increase in net assets resulting from operations | $17,423,971 |
The accompanying notes are an integral part of these financial statements.
42
| Statement of changes in net assets | |
|
| |
| DECREASE IN NET ASSETS | | |
|
| | Six months ended | Year ended |
| | 5/31/06* | 11/30/05 |
|
| Operations: | | |
| Net investment income | $ 25,030,418 | $ 51,141,299 |
|
| Net realized gain on investments | 2,286,949 | 13,679,871 |
|
| Net unrealized depreciation of investments | (9,893,396) | (21,299,811) |
|
| Net increase in net assets resulting from operations | 17,423,971 | 43,521,359 |
|
| Distributions to shareholders: (Note 1) | | |
|
| From tax-exempt income | | |
|
| Class A | (23,317,255) | (46,726,578) |
|
| Class B | (1,347,764) | (3,189,657) |
|
| Class C | (172,809) | (321,212) |
|
| Class M | (51,173) | (114,647) |
|
| From ordinary income | | |
|
| Class A | (183,580) | (205,938) |
|
| Class B | (13,367) | (18,720) |
|
| Class C | (1,673) | (1,770) |
|
| Class M | (447) | (559) |
|
| From net realized short-term gain on investments | | |
|
| Class A | (2,059,223) | — |
|
| Class B | (150,089) | — |
|
| Class C | (18,809) | — |
|
| Class M | (5,010) | — |
|
| From net realized long-term gain on investments | | |
|
| Class A | (9,207,487) | (11,890,049) |
|
| Class B | (671,098) | (1,079,787) |
|
| Class C | (84,104) | (102,031) |
|
| Class M | (22,403) | (32,236) |
|
| Redemption fees (Note 1) | 48 | 53 |
|
| Decrease from capital share transactions (Note 4) | (38,567,072) | (82,445,773) |
|
| Total decrease in net assets | (58,449,344) | (102,607,545) |
|
| |
| NET ASSETS | | |
| Beginning of period | 1,244,887,703 | 1,347,495,248 |
|
| End of period (including undistributed net investment income | | |
| of $3,453,832 and $3,511,482, respectively) | $1,186,438,359 | $1,244,887,703 |
* Unaudited
The accompanying notes are an integral part of these financial statements.
43
| Financial highlights | (For a common share outstanding throughout the period) | | | | | | | | |
|
| |
| INVESTMENT OPERATIONS: | | | | LESS DISTRIBUTIONS: | | | | | RATIOS AND SUPPLEMENTAL DATA: | |
|
| | | | Net | | | | | | | Total | | | Ratio of net | |
| | Net asset | | realized and | Total | From | From | | | Net asset | return | Net | Ratio of | investment | |
| | value, | Net | unrealized | from | net | net realized | | | value, | at net | assets, | expenses to | income (loss) | Portfolio |
| | beginning | investment | gain (loss) on | investment | investment | gain on | Total | Redemption | end | asset | end of period | average net | to average | turnover |
| Period ended | of period | income (loss) | investments | operations | income | investments | distributions | fees | of period | value (%)(a) | (in thousands) | assets (%)(b) | net assets (%) | (%) |
|
| CLASS A | | | | | | | | | | | | | | |
| May 31, 2006** | $8.70 | .18 | (.05) | .13 | (.18) | (.09) | (.27) | —(d) | $8.56 | 1.46* | $1,102,905 | .40* | 2.08* | 3.48* |
| November 30, 2005 | 8.84 | .35 | (.05) | .30 | (.35) | (.09) | (.44) | —(d) | 8.70 | 3.36 | 1,148,135 | .79 | 3.98 | 12.91 |
| November 30, 2004 | 8.93 | .37(c) | (.10) | .27 | (.36) | — | (.36) | —(d) | 8.84 | 3.08 | 1,222,953 | .82(c) | 4.14(c) | 22.57 |
| November 30, 2003 | 8.87 | .38 | .16 | .54 | (.39) | (.09) | (.48) | — | 8.93 | 6.25 | 1,336,936 | .82 | 4.23 | 8.08(e) |
| November 30, 2002 | 8.79 | .40 | .07 | .47 | (.39) | — | (.39) | — | 8.87 | 5.44 | 1,322,541 | .82 | 4.50 | 17.90 |
| November 30, 2001 | 8.52 | .42 | .27 | .69 | (.42) | — | (.42) | — | 8.79 | 8.24 | 1,362,488 | .81 | 4.80 | 18.63 |
|
| |
| CLASS B | | | | | | | | | | | | | | |
| May 31, 2006** | $8.69 | .15 | (.05) | .10 | (.15) | (.09) | (.24) | —(d) | $8.55 | 1.12* | $70,377 | .72* | 1.76* | 3.48* |
| November 30, 2005 | 8.83 | .31 | (.06) | .25 | (.30) | (.09) | (.39) | —(d) | 8.69 | 2.85 | 83,500 | 1.44 | 3.33 | 12.91 |
| November 30, 2004 | 8.91 | .31(c) | (.09) | .22 | (.30) | — | (.30) | —(d) | 8.83 | 2.50 | 110,813 | 1.47(c) | 3.50(c) | 22.57 |
| November 30, 2003 | 8.85 | .32 | .17 | .49 | (.34) | (.09) | (.43) | — | 8.91 | 5.57 | 158,081 | 1.47 | 3.59 | 8.08(e) |
| November 30, 2002 | 8.77 | .34 | .07 | .41 | (.33) | — | (.33) | — | 8.85 | 4.75 | 119,251 | 1.47 | 3.84 | 17.90 |
| November 30, 2001 | 8.51 | .37 | .25 | .62 | (.36) | — | (.36) | — | 8.77 | 7.41 | 117,722 | 1.46 | 4.18 | 18.63 |
|
| |
| CLASS C | | | | | | | | | | | | | | |
| May 31, 2006** | $8.70 | .15 | (.05) | .10 | (.15) | (.09) | (.24) | —(d) | $8.56 | 1.08* | $10,536 | .79* | 1.68* | 3.48* |
| November 30, 2005 | 8.84 | .28 | (.06) | .22 | (.27) | (.09) | (.36) | —(d) | 8.70 | 2.54 | 10,472 | 1.59 | 3.18 | 12.91 |
| November 30, 2004 | 8.93 | .30(c) | (.10) | .20 | (.29) | — | (.29) | —(d) | 8.84 | 2.27 | 10,411 | 1.62(c) | 3.34(c) | 22.57 |
| November 30, 2003 | 8.86 | .31 | .17 | .48 | (.32) | (.09) | (.41) | — | 8.93 | 5.54 | 10,909 | 1.62 | 3.43 | 8.08(e) |
| November 30, 2002 | 8.79 | .33 | .06 | .39 | (.32) | — | (.32) | — | 8.86 | 4.48 | 5,885 | 1.62 | 3.69 | 17.90 |
| November 30, 2001 | 8.53 | .35 | .26 | .61 | (.35) | — | (.35) | — | 8.79 | 7.25 | 5,145 | 1.61 | 3.93 | 18.63 |
|
| |
| CLASS M | | | | | | | | | | | | | | |
| May 31, 2006** | $8.71 | .17 | (.05) | .12 | (.17) | (.09) | (.26) | —(d) | $8.57 | 1.29* | $2,620 | .54* | 1.93* | 3.48* |
| November 30, 2005 | 8.85 | .32 | (.05) | .27 | (.32) | (.09) | (.41) | —(d) | 8.71 | 3.06 | 2,780 | 1.09 | 3.68 | 12.91 |
| November 30, 2004 | 8.94 | .34(c) | (.10) | .24 | (.33) | — | (.33) | —(d) | 8.85 | 2.77 | 3,318 | 1.12(c) | 3.84(c) | 22.57 |
| November 30, 2003 | 8.87 | .35 | .18 | .53 | (.37) | (.09) | (.46) | — | 8.94 | 6.06 | 3,876 | 1.12 | 3.94 | 8.08(e) |
| November 30, 2002 | 8.79 | .37 | .07 | .44 | (.36) | — | (.36) | — | 8.87 | 5.12 | 2,343 | 1.12 | 4.17 | 17.90 |
| November 30, 2001 | 8.53 | .40 | .26 | .66 | (.40) | — | (.40) | — | 8.79 | 7.78 | 1,793 | 1.11 | 4.51 | 18.63 |
|
* Not annualized.
** Unaudited.
(a) Total return assumes dividend reinvestment and does not reflect the effect of sales charges.
(b) Includes amounts paid through expense offset arrangements (Note 2).
(c) Reflects an involuntary contractual expense limitation in effect during the period. As a result of such limitation, the expenses of each class, as a percentage of its net assets, reflect a reduction of the following amounts (Note 2):
| | 11/30/04 |
|
| Class A | 0.02% |
|
| Class B | 0.02 |
|
| Class C | 0.02 |
|
| Class M | 0.02 |
|
(d) Amount represents less than $0.01 per share.
(e) Portfolio turnover excludes the impact of assets received from the acquisition of Putnam New York Tax Exempt Opportunities Fund.
The accompanying notes are an integral part of these financial statements.
Notes to financial statements 5/31/06 (Unaudited)
Note 1: Significant accounting policies
Putnam New York Tax Exempt Income Fund (the “fund”), a Massachusetts business trust, is registered under the Investment Company Act of 1940, as amended, as a diversified, open-end management investment company. The fund seeks as high a level of current income exempt from federal income tax and New York State and City personal income tax as Putnam Investment Management, LLC (“Putnam Management”), the fund’s manager, an indirect wholly-owned subsidiary of Putnam, LLC, believes is consistent with preservation of capital by investing primarily in a portfolio of longer-term New York tax-exempt securities. The fund may be affected by economic and political developments in the state of New York.
The fund offers class A, class B, class C and class M shares. Class A and class M shares are sold with a maximum front-end sales charge of 3.75% and 3.25%, respectively, and generally do not pay contingent deferred sales charges. Class B shares, which convert to class A shares after approximately eight years, do not pay a front-end sales charge, and are subject to a contingent deferred sales charge, if those shares are redeemed within six years of purchase. Class C shares have a 1.00% contingent deferred sales charge and do not convert to class A shares. The expenses for class A, class B, class C and class M shares may differ based on the distribution fee of each class, which is identified in Note 2.
A 2.00% redemption fee may apply to any shares that are redeemed (either by selling or exchanging into another fund) within 5 days of purchase. The redemption fee is accounted for as an addition to paid-in-capital.
Investment income, realized and unrealized gains and losses and expenses of the fund are borne pro-rata based on the relative net assets of each class to the total net assets of the fund, except that each class bears expenses unique to that class (including the distribution fees applicable to such classes). Each class votes as a class only with respect to its own distribution plan or other matters on which a class vote is required by law or determined by the Trustees. Shares of each class would receive their pro-rata share of the net assets of the fund, if the fund were liquidated. In addition, the Trustees declare separate dividends on each class of shares.
In the normal course of business, the fund enters into contracts that may include agreements to indemnify another party under given circumstances. The fund’s maximum exposure under these arrangements is unknown as this would involve future claims that may be, but have not yet been, made against the fund. However, the fund expects the risk of material loss to be remote.
The following is a summary of significant accounting policies consistently followed by the fund in the preparation of its financial statements. The preparation of financial statements is in conformity with accounting principles generally accepted in the United States of America and requires management to make estimates and assumptions that affect the reported amounts of assets and liabilities in the financial statements and the reported amounts of increases and decreases in net assets from operations during the reporting period. Actual results could differ from those estimates.
A) Security valuation Tax-exempt bonds and notes are generally valued on the basis of valuations provided by an independent pricing service approved by the Trustees. Such services use information with respect to transactions in bonds, quotations from bond dealers, market transactions in comparable securities and various relationships between securities in determining value. Other investments are valued at fair value following procedures approved by the Trustees. Such valuations and procedures are reviewed periodically by the Trustees. The fair value of securities is generally determined as the amount that the fund could reasonably expect to realize from an orderly disposition of such securities over a reasonable period of time. By its nature, a fair value price is a good faith estimate of the value of
46
a security at a given point in time and does not reflect an actual market price.
B) Security transactions and related investment income Security transactions are recorded on the trade date (the date the order to buy or sell is executed). Gains or losses on securities sold are determined on the identified cost basis.
Interest income is recorded on the accrual basis. All premiums/discounts are amortized/accreted on a yield-to-maturity basis. The premium in excess of the call price, if any, is amortized to the call date; thereafter, any remaining premium is amortized to maturity.
Securities purchased or sold on a forward commitment basis may be settled a month or more after the trade date; interest income is accrued based on the terms of the securities. Losses may arise due to changes in the market value of the underlying securities or if the counterparty does not perform under the contract.
C) Futures and options contracts The fund may use futures and options contracts to hedge against changes in the values of securities the fund owns or expects to purchase, or for other investment purposes. The fund may also write options on swaps or securities it owns or in which it may invest to increase its current returns.
The potential risk to the fund is that the change in value of futures and options contracts may not correspond to the change in value of the hedged instruments. In addition, losses may arise from changes in the value of the underlying instruments, if there is an illiquid secondary market for the contracts, or if the counterparty to the contract is unable to perform. Risks may exceed amounts recognized on the statement of assets and liabilities. When the contract is closed, the fund records a realized gain or loss equal to the difference between the value of the contract at the time it was opened and the value at the time it was closed. Realized gains and losses on purchased options are included in realized gains and losses on investment securities. If a written call option is exercised, the premium originally received is recorded as an addition to sales proceeds. If a written put option is exercised, the premium originally received is recorded as a reduction to the cost of investments.
Futures contracts are valued at the quoted daily settlement prices established by the exchange on which they trade. The fund and the broker agree to exchange an amount of cash equal to the daily fluctuation in the value of the futures contract. Such receipts or payments are known as “variation margin.” Exchange traded options are valued at the last sale price or, if no sales are reported, the last bid price for purchased options and the last ask price for written options. Options traded over-the-counter are valued using prices supplied by dealers. Futures and written option contracts outstanding at period end, if any, are listed after the fund’s portfolio.
D) Interest rate swap contracts The fund may enter into interest rate swap contracts, which are arrangements between two parties to exchange cash flows based on a notional principal amount, to manage the fund’s exposure to interest rates. Interest rate swap contracts are marked to market daily based upon quotations from an independent pricing service or market makers and the change, if any, is recorded as unrealized gain or loss. Payments received or made are recorded as realized gains or loss. The fund could be exposed to credit or market risk due to unfavorable changes in the fluctuation of interest rates or if the counterparty defaults on its obligation to perform. Risk of loss may exceed amounts recognized on the statement of assets and liabilities. Interest rate swap contracts outstanding at period end, if any, are listed after the fund’s portfolio.
E) Federal taxes It is the policy of the fund to distribute all of its income within the prescribed time and otherwise comply with the provisions of the Internal Revenue Code of 1986 (the “Code”) applicable to regulated investment companies. It is also the intention of the fund to distribute an amount sufficient to avoid imposition of any excise
47
tax under Section 4982 of the Code, as amended. Therefore, no provision has been made for federal taxes on income, capital gains or unrealized appreciation on securities held nor for excise tax on income and capital gains.
The aggregate identified cost on a tax basis is $1,120,208,846, resulting in gross unrealized appreciation and depreciation of $58,847,447 and $4,873,129, respectively, or net unrealized appreciation of $53,974,318.
F) Distributions to shareholders Income dividends are recorded daily by the fund and are paid monthly. Distributions from capital gains, if any, are recorded on the ex-dividend date and paid at least annually. The amount and character of income and gains to be distributed are determined in accordance with income tax regulations which may differ from generally accepted accounting principles. Dividend sources are estimated at the time of declaration. Actual results may vary. Any non-taxable return of capital cannot be determined until final tax calculations are completed after the end of the fund’s fiscal year. Reclassifications are made to the fund’s capital accounts to reflect income and gains available for distribution (or available capital loss carryovers) under income tax regulations.
Note 2: Management fee, administrative
services and other transactions
|
Putnam Management is paid for management and investment advisory services quarterly based on the average net assets of the fund. Such fee is based on the annual rate equal to the lesser of (i) 0.50% of the average net assets of the fund or (ii) the following annual rates: 0.60% of the first $500 million, 0.50% of the next $500 million, 0.45% of the next $500 million, 0.40% of the next $5 billion, 0.375% of the next $5 billion, 0.355% of the next $5 billion, 0.34% of the next $5 billion, and 0.33% thereafter.
Putnam Management has agreed to waive fees and reimburse expenses of the fund through November 30, 2006 to the extent necessary to ensure that the fund’s expenses do not exceed the simple average of the expenses of all front-end load funds viewed by Lipper Inc. as having the same investment classification or objective as the fund. The expense reimbursement is based on a comparison of the fund’s expenses with the average annualized operating expenses of the funds in its Lipper peer group for each calendar quarter during the fund’s last fiscal year, excluding 12b-1 fees and without giving effect to any expense offset and brokerage service arrangements that may reduce fund expenses. For the period ended May 31, 2006, Putnam Management did not waive any of its management fee from the fund.
For the period ended May 31, 2006, Putnam Management has assumed $2,104 of legal, shareholder servicing and communication, audit and Trustee fees incurred by the fund in connection with certain legal and regulatory matters (including those described in Note 5).
The fund reimburses Putnam Management an allocated amount for the compensation and related expenses of certain officers of the fund and their staff who provide administrative services to the fund. The aggregate amount of all such reimbursements is determined annually by the Trustees.
Custodial functions for the fund’s assets are provided by Putnam Fiduciary Trust Company (“PFTC”), a subsidiary of Putnam, LLC. PFTC receives fees for custody services based on the fund’s asset level, the number of its security holdings and transaction volumes. Putnam Investor Services, a division of PFTC, provides investor servicing agent functions to the fund. Putnam Investor Services receives fees for investor servicing based on the number of shareholder accounts in the fund and the level of defined contribution plan assets in the fund. During the period ended May 31, 2006, the fund incurred $373,314 for these services.
The fund has entered into an arrangement with PFTC whereby credits realized as a result of uninvested cash balances are used to reduce a portion of the fund’s expenses. For the six months ended
48
May 31, 2006, the fund’s expenses were reduced by $35,230 under these arrangements.
Each independent Trustee of the fund receives an annual Trustee fee, of which $470, as a quarterly retainer, has been allocated to the fund, and an additional fee for each Trustees meeting attended. Trustees receive additional fees for attendance at certain committee meetings, industry seminars and for certain compliance-related matters. Trustees also are reimbursed for expenses they incur relating to their services as Trustees. George Putnam, III, who is not an independent Trustee, also receives the foregoing fees for his services as Trustee.
The fund has adopted a Trustee Fee Deferral Plan (the “Deferral Plan”) which allows the Trustees to defer the receipt of all or a portion of Trustees fees payable on or after July 1, 1995. The deferred fees remain invested in certain Putnam funds until distribution in accordance with the Deferral Plan.
The fund has adopted an unfunded noncontribu-tory defined benefit pension plan (the “Pension Plan”) covering all Trustees of the fund who have served as a Trustee for at least five years and were first elected prior to 2004. Benefits under the Pension Plan are equal to 50% of the Trustee’s average annual attendance and retainer fees for the three years ended December 31, 2005. Pension expense for the fund is included in Trustee compensation and expenses in the statement of operations. Accrued pension liability is included in Payable for Trustee compensation and expenses in the statement of assets and liabilities. The Trustees have terminated the Pension Plan with respect to any Trustee first elected after 2003.
The fund has adopted distribution plans (the “Plans”) with respect to its class A, class B, class C and class M shares pursuant to rule 12b-1 under the Investment Company Act of 1940. The purpose of the Plans is to compensate Putnam Retail Management, a wholly-owned subsidiary of Putnam, LLC and Putnam Retail Management GP, Inc., for services provided and expenses incurred in distributing shares of the fund. The Plans provide for payments by the fund to Putnam Retail Management at an annual rate of up to 0.35%, 1.00%, 1.00% and 1.00% of the average net assets attributable to class A, class B, class C and class M shares, respectively. The Trustees have approved payment by the fund at the annual rate of 0.85%, 1.00% and 0.50% for class B, class C and class M shares, respectively. For class A shares, the annual payment rate will equal the weighted average of (i) 0.20% on the net assets of the fund attributable to class A shares purchased and paid for prior to April 1, 2005 and (ii) 0.25% on all other net assets of the fund attributable to class A shares.
For the six months ended May 31, 2006, Putnam Retail Management, acting as underwriter, received net commissions of $24,758 and $37 from the sale of class A and class M shares, respectively, and received $53,435 and $1,205 in contingent deferred sales charges from redemptions of class B and class C shares, respectively. A deferred sales charge of up to 1.00% is assessed on certain redemptions of class A shares that were purchased without an initial sales charge as part of an investment of $1 million or more. For the six months ended May 31, 2006, Putnam Retail Management, acting as underwriter, received no monies on class A redemptions.
Note 3: Purchases and sales of securities
During the six months ended May 31, 2006, cost of purchases and proceeds from sales of investment securities other than short-term investments aggregated $40,713,639 and $63,214,112, respectively. There were no purchases or sales of U.S. government securities.
Note 4: Capital shares
At May 31, 2006, there was an unlimited number of shares of beneficial interest authorized. Transactions in capital shares were as follows:
49
| CLASS A | Shares | Amount |
| Six months ended 5/31/06: | |
| Shares sold | 2,763,349 | $ 23,848,302 |
|
| Shares issued | | |
| in connection | | |
| with reinvestment | | |
| of distributions | 2,786,977 | 24,021,433 |
|
| | 5,550,326 | 47,869,735 |
|
| Shares | | |
| repurchased | (8,660,562) | (74,702,757) |
|
| Net decrease | (3,110,236) | $ (26,833,022) |
| |
| Year ended 11/30/05: | |
| Shares sold | 4,994,206 | $ 44,012,651 |
|
| Shares issued | | |
| in connection | | |
| with reinvestment | | |
| of distributions | 4,494,487 | 39,608,616 |
|
| | 9,488,693 | 83,621,267 |
|
| Shares | | |
| repurchased | (15,876,482) | (139,930,137) |
|
| Net decrease | (6,387,789) | $ (56,308,870) |
|
| |
| CLASS B | Shares | Amount |
| Six months ended 5/31/06: | |
| Shares sold | 225,804 | $ 1,945,587 |
|
| Shares issued | | |
| in connection | | |
| with reinvestment | | |
| of distributions | 176,184 | 1,515,938 |
|
| | 401,988 | 3,461,525 |
|
| Shares | | |
| repurchased | (1,778,545) | (15,315,954) |
|
| Net decrease | (1,376,557) | $(11,854,429) |
| |
| Year ended 11/30/05: | |
| Shares sold | 386,640 | $ 3,405,136 |
|
| Shares issued | | |
| in connection | | |
| with reinvestment | | |
| of distributions | 341,949 | 3,008,763 |
|
| | 728,589 | 6,413,899 |
|
| Shares | | |
| repurchased | (3,668,495) | (32,283,698) |
|
| Net decrease | (2,939,906) | $(25,869,799) |
| CLASS C | Shares | Amount | |
| Six months ended 5/31/06: | | |
| Shares sold | 222,082 | $ 1,913,102 |
|
| Shares issued | | | |
| in connection | | | |
| with reinvestment | | | |
| of distributions | 23,474 | 202,326 | |
|
| | 245,556 | 2,115,428 |
|
| Shares | | | |
| repurchased | (218,252) | (1,878,614) |
|
| Net increase | 27,304 | $ 236,814 | |
| |
| Year ended 11/30/05: | | | |
| Shares sold | 188,370 | $ 1,660,287 |
|
| Shares issued | | | |
| in connection | | | |
| with reinvestment | | | |
| of distributions | 35,735 | 314,854 | |
|
| | 224,105 | 1,975,141 |
|
| Shares | | | |
| repurchased | (198,297) | (1,748,111) |
|
| Net increase | 25,808 | $ 227,030 | |
|
| |
| CLASS M | Shares | Amount | |
| Six months ended 5/31/06: | | |
| Shares sold | 3,372 | $ 28,980 | |
|
| Shares issued | | | |
| in connection | | | |
| with reinvestment | | | |
| of distributions | 7,010 | 60,458 | |
|
| | 10,382 | 89,438 | |
|
| Shares | | | |
| repurchased | (23,799) | (205,873) |
|
| Net decrease | (13,417) | $(116,435) |
| |
| Year ended 11/30/05: | | | |
| Shares sold | 9,188 | $ 80,024 | |
|
| Shares issued | | | |
| in connection | | | |
| with reinvestment | | | |
| of distributions | 12,920 | 114,938 | |
|
| | 22,108 | 194,962 | |
|
| Shares | | | |
| repurchased | (77,870) | (689,096) |
|
| Net decrease | (55,762) | $(494,134) |
50
Note 5: Regulatory matters and litigation
Putnam Management has entered into agreements with the Securities and Exchange Commission and the Massachusetts Securities Division settling charges connected with excessive short-term trading by Putnam employees and, in the case of the charges brought by the Massachusetts Securities Division, by participants in some Putnam-administered 401(k) plans. Pursuant to these settlement agreements, Putnam Management will pay a total of $193.5 million in penalties and restitution, with $153.5 million being paid to certain open-end funds and their shareholders. The amount will be allocated to shareholders and funds pursuant to a plan developed by an independent consultant, and will be paid following approval of the plan by the SEC and the Massachusetts Securities Division.
The Securities and Exchange Commission’s and Massachusetts Securities Division’s allegations and related matters also serve as the general basis for numerous lawsuits, including purported class action lawsuits filed against Putnam Management and certain related parties, including certain Putnam funds. Putnam Management will bear any costs incurred by Putnam funds in connection with these lawsuits. Putnam Management believes that the likelihood that the pending private lawsuits and purported class action lawsuits will have a material adverse financial impact on the fund is remote, and the pending actions are not likely to materially affect its ability to provide investment management services to its clients, including the Putnam funds.
Putnam Management and Putnam Retail Management are named as defendants in a civil suit in which the plaintiffs allege that the management and distribution fees paid by certain Putnam funds were excessive and seek recovery under the Investment Company Act of 1940. Putnam Management and Putnam Retail Management have contested the plaintiffs’ claims and the matter is currently pending in the U.S. District Court for the District of Massachusetts. Based on currently available information, Putnam Management believes that this action is without merit and that it is unlikely to have a material effect on Putnam Management’s and Putnam Retail Management’s ability to provide services to their clients, including the fund.
51
Founded over 65 years ago, Putnam Investments was built around the concept that a balance between risk and reward is the hallmark of a well-rounded financial program. We manage over 100 mutual funds in growth, value, blend, fixed income, and international.
| Investment Manager | Officers | Charles A. Ruys de Perez |
| Putnam Investment | George Putnam, III | Vice President and |
| Management, LLC | President | Chief Compliance Officer |
| One Post Office Square | | |
| Boston, MA 02109 | Charles E. Porter | Mark C. Trenchard |
| Executive Vice President, | Vice President and |
| Marketing Services | Associate Treasurer and | BSA Compliance Officer |
| Putnam Retail Management | Principal Executive Officer | |
| One Post Office Square | | Judith Cohen |
| Boston, MA 02109 | Jonathan S. Horwitz | Vice President, Clerk and |
| Senior Vice President | Assistant Treasurer |
| Custodian | and Treasurer | |
| Putnam Fiduciary | | Wanda M. McManus |
| Trust Company | Steven D. Krichmar | Vice President, Senior Associate |
| Vice President and | Treasurer and Assistant Clerk |
| Legal Counsel | Principal Financial Officer | |
| Ropes & Gray LLP | | Nancy E. Florek |
| Michael T. Healy | Vice President, Assistant Clerk, |
| Trustees | Assistant Treasurer and | Assistant Treasurer |
| John A. Hill, Chairman | Principal Accounting Officer | and Proxy Manager |
| Jameson Adkins Baxter, | | |
| Vice Chairman | Beth S. Mazor | |
| Charles B. Curtis | Vice President | |
| Myra R. Drucker | | |
| Charles E. Haldeman, Jr. | James P. Pappas | |
| Paul L. Joskow | Vice President | |
| Elizabeth T. Kennan | | |
| Robert E. Patterson | Richard S. Robie, III | |
| George Putnam, III | Vice President | |
| W. Thomas Stephens | | |
| Richard B. Worley | Francis J. McNamara, III | |
| Vice President and | |
| Chief Legal Officer | |
This report is for the information of shareholders of Putnam New York Tax Exempt Income Fund. It may also be used as sales literature when preceded or accompanied by the current prospectus, the most recent copy of Putnam’s Quarterly Performance Summary, and Putnam’s Quarterly Ranking Summary. For more recent performance, please visit www.putnam.com. Investors should carefully consider the investment objective, risks, charges, and expenses of a fund, which are described in its prospectus. For this and other information or to request a prospectus, call 1-800-225-1581 toll free. Please read the prospectus carefully before investing. The fund’s Statement of Additional Information contains additional information about the fund’s Trustees and is available without charge upon request by calling 1-800-225-1581.
52

Item 2. Code of Ethics:
Not applicable
Item 3. Audit Committee Financial Expert:
Not applicable
Item 4. Principal Accountant Fees and Services:
Not applicable
Item 5. Audit Committee of Listed Registrants
Not applicable
Item 6. Schedule of Investments:
The registrant’s schedule of investments in unaffiliated issuers is included in the report to shareholders in Item 1 above.
Item 7. Disclosure of Proxy Voting Policies and Procedures For Closed-End Management Investment Companies:
Not applicable
Item 8. Portfolio Managers of Closed-End Investment Companies
Not Applicable
Item 9. Purchases of Equity Securities by Closed-End Management Investment Companies and Affiliated Purchasers:
Not applicable
Item 10. Submission of Matters to a Vote of Security Holders:
Not applicable
Item 11. Controls and Procedures:
(a) The registrant's principal executive officer and principal financial officer have concluded, based on their evaluation of the effectiveness of the design and operation of the registrant's disclosure controls and procedures as of a date within 90 days of the filing date of this report, that the design and operation of such procedures are generally effective to provide reasonable assurance that information required to be disclosed by the registrant in this report is recorded, processed, summarized and reported within the time periods specified in the Commission's rules and forms.
(b) Changes in internal control over financial reporting: Not applicable
Item 12. Exhibits:
(a)(1) Not applicable
(a)(2) Separate certifications for the principal executive officer and principal financial officer of the registrant as required by Rule 30a-2(a) under the Investment Company Act of 1940, as amended, are filed herewith.
(b) The certifications required by Rule 30a-2(b) under the Investment Company Act of 1940, as amended, are filed herewith.
SIGNATURES
Pursuant to the requirements of the Securities Exchange Act of 1934 and the Investment Company Act of 1940, the registrant has duly caused this report to be signed on its behalf by the undersigned, thereunto duly authorized.
Putnam New York Tax Exempt Income Fund
By (Signature and Title):
/s/Michael T. Healy
Michael T. Healy
Principal Accounting Officer
Date: July 27, 2006
Pursuant to the requirements of the Securities Exchange Act of 1934 and the Investment Company Act of 1940, this report has been signed below by the following persons on behalf of the registrant and in the capacities and on the dates indicated.
By (Signature and Title):
/s/Charles E. Porter
Charles E. Porter
Principal Executive Officer
Date: July 27, 2006
By (Signature and Title):
/s/Steven D. Krichmar
Steven D. Krichmar
Principal Financial Officer
Date: July 27, 2006