| | |
| UNITED STATES
SECURITIES AND EXCHANGE COMMISSION |
| | |
| CERTIFIED SHAREHOLDER REPORT OF REGISTERED
MANAGEMENT INVESTMENT COMPANIES
|
| | |
| Investment Company Act file number: | (811-03741) |
| | |
| Exact name of registrant as specified in charter: | Putnam New York Tax Exempt Income Fund |
| | |
| Address of principal executive offices: | One Post Office Square, Boston, Massachusetts 02109 |
| | |
| Name and address of agent for service: | Robert T. Burns, Vice President
One Post Office Square
Boston, Massachusetts 02109 |
| | |
| Copy to: | John W. Gerstmayr, Esq.
Ropes & Gray LLP
800 Boylston Street
Boston, Massachusetts 02199-3600 |
| | |
| Registrant’s telephone number, including area code: | (617) 292-1000 |
| | |
| Date of fiscal year end: | November 30, 2012 |
| | |
| Date of reporting period: | December 1, 2011 — November 30, 2012 |
| | |
|
Item 1. Report to Stockholders: | |
| | |
| The following is a copy of the report transmitted to stockholders pursuant to Rule 30e-1 under the Investment Company Act of 1940: | |
Putnam New York
Tax Exempt
Income Fund
Annual report
11 | 30 | 12
| | |
| Message from the Trustees | 1 | |
| |
| About the fund | 2 | |
| |
| Performance snapshot | 4 | |
| |
| Interview with your fund’s portfolio manager | 5 | |
| |
| Your fund’s performance | 10 | |
| |
| Your fund’s expenses | 13 | |
| |
| Terms and definitions | 15 | |
| |
| Other information for shareholders | 16 | |
| |
| Trustee approval of management contract | 17 | |
| |
| Financial statements | 22 | |
| |
| Federal tax information | 46 | |
| |
| About the Trustees | 47 | |
| |
| Officers | 49 | |
| |
Consider these risks before investing: Investments in a single state carry risks of vulnerability to common economic forces and other factors affecting the state’s tax-exempt investments, which may result in greater losses and volatility. Capital gains, if any, are taxable for federal and, in most cases, state purposes. For some investors, investment income may be subject to the federal alternative minimum tax. Bond investments are subject to interest-rate risk, which means the prices of the fund’s bond investments are likely to fall if interest rates rise. Bond investments also are subject to credit risk, which is the risk that the issuer of the bond may default on payment of interest or principal. Interest-rate risk is generally greater for longer-term bonds, and credit risk is generally greater for below-investment-grade bonds, which may be considered speculative. Unlike bonds, funds that invest in bonds have ongoing fees and expenses. Since the fund invests in tax-exempt bonds, which, to be treated as tax-exempt under the Internal Revenue Code, may be issued only by limited types of issuers for limited types of projects, the fund’s investments may be focused in certain market segments. Consequently, the fund may be more vulnerable to fluctuations in the values of the securities it holds than a fund that invests more broadly. The prices of bonds in the fund’s portfolio may fall or fail to rise over extended periods of time for a variety of reasons, including both general financial market conditions and factors related to a specific issuer.
Message from the Trustees
Dear Fellow Shareholder:
In recent months, Europe’s sovereign debt crisis and the threat of the “fiscal cliff” in the United States have contributed to heightened market volatility and have curtailed economic growth.
Even with these challenges, the U.S. economy has exhibited resiliency, with employment, housing, and GDP data all improving. While most of Europe is mired in recession, slow but steady progress is being made to resolve the eurozone’s years-long debt crisis. Meanwhile, China, the world’s second-largest economy, is showing strength in its important manufacturing sector.
Putnam’s portfolio managers and analysts are trained to look for opportunities and manage downside risk in volatile market environments. We also believe in the importance of relying on the expertise of a financial advisor as you work toward your long-term financial goals.
We would like to take this opportunity to announce the arrival of two new Trustees, Liaquat Ahamed and Katinka Domotorffy, CFA, to your fund’s Board of Trustees. Mr. Ahamed, who in 2010 won the Pulitzer Prize for History with his book, Lords of Finance: The Bankers Who Broke the World, also serves on the Board of Aspen Insurance and the Board of the Rohatyn Group, an emerging-market fund complex that manages money for institutional investors.
Ms. Domotorffy, who until year-end 2011 was a Partner, Chief Investment Officer, and Global Head of Quantitative Investment Strategies at Goldman Sachs Asset Management, currently serves as a member of the Anne Ray Charitable Trust’s Investment Committee, Margaret A. Cargill Philanthropies, and director for Reach Out and Read of Greater New York, an organization dedicated to promoting early childhood literacy.
We would also like to extend a welcome to new shareholders of the fund and to thank all of our investors for your continued confidence in Putnam.

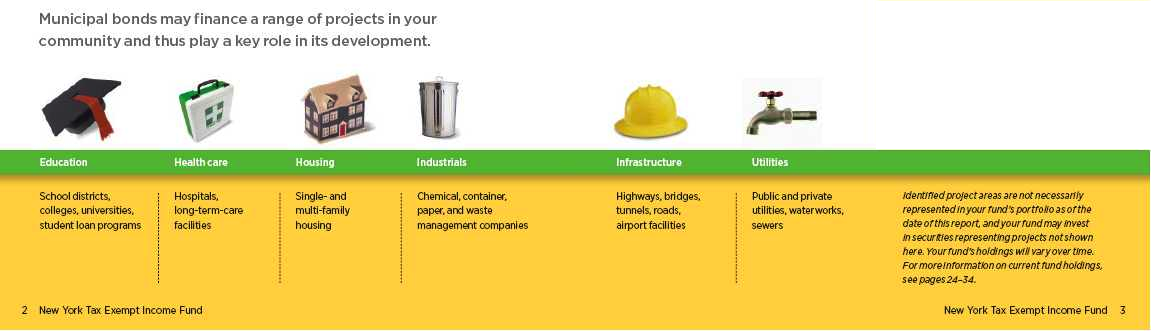
About the fund
Seeking a high level of tax-free income for New York investors

Municipal bonds can help investors keep more of their investment income while also financing important public projects such as schools, roads, and hospitals. Municipal bonds are typically issued by states and local municipalities to raise funds for building and maintaining public facilities, and they offer income that is generally exempt from federal, state, and local income tax.
Putnam New York Tax Exempt Income Fund seeks to capitalize on investment opportunities in New York by investing in bonds across a range of sectors. The fund also combines bonds of differing credit quality to increase income potential. In addition to investing in high-quality bonds, the fund’s managers allocate a smaller portion of the portfolio to lower-rated bonds, which may offer higher income in return for more risk.
When deciding whether to invest in a bond, the fund’s managers consider the risks involved — including credit risk, interest-rate risk, and the risk that the bond will be prepaid.
The managers are backed by the resources of Putnam’s fixed-income organization and by its analysts’ ongoing, rigorous research. Once a bond has been purchased, the managers continue to monitor developments that may affect the bond market, the sector, and the issuer of the bond.
The goal of this in-depth research and active management is to stay a step ahead of the industry and pinpoint opportunities for investors.
Understanding tax-equivalent yield
To understand the value of tax-free income, it is helpful to compare a municipal bond’s yield with the “tax-equivalent yield” — the before-tax yield that must be offered by a taxable bond in order to equal the municipal bond’s yield after taxes.
How to calculate tax-equivalent yield:
The tax-equivalent yield equals the municipal bond’s yield divided by “one minus the tax rate.” For example, if a municipal bond’s yield is 5%, then its tax-equivalent yield is 7.7%, assuming the maximum 35% federal tax rate for 2012.
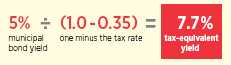
Results for investors subject to lower tax rates would not be as advantageous.
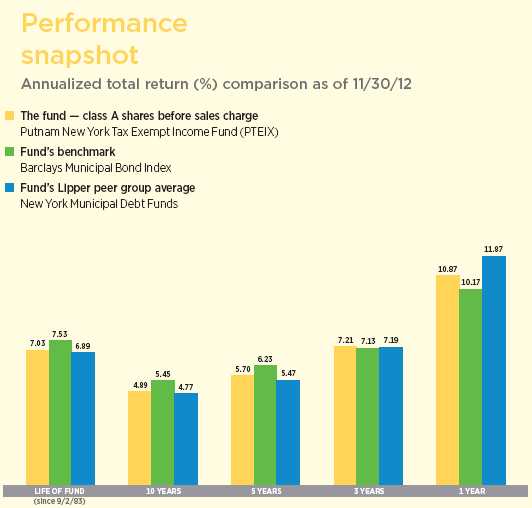
Current performance may be lower or higher than the quoted past performance, which cannot guarantee future results. Share price, principal value, and return will fluctuate, and you may have a gain or a loss when you sell your shares. Performance of class A shares assumes reinvestment of distributions and does not account for taxes. Fund returns in the bar chart do not reflect a sales charge of 4.00%; had they, returns would have been lower. See pages 5 and 10–13 for additional performance information. For a portion of the periods, the fund had expense limitations, without which returns would have been lower. To obtain the most recent month-end performance, visit putnam.com.
| |
| 4 New York Tax Exempt Income Fund |
Interview with your fund’s portfolio manager

Putnam New York Tax Exempt Income Fund posted gains during its fiscal year. How would you describe the investment environment?
The past 12 months marked a solid period for both municipal bonds and the fund. For much of the period, investors focused on the possibility of a deteriorating situation in the European sovereign debt markets and a slowing economy in the United States. As we approached the end of 2012, European debt concerns took a backseat to the approaching “fiscal cliff” in the United States: the $1.2 trillion in tax increases and spending cuts slated to begin taking effect in January. With potential changes to the tax treatment of municipal bonds a concern for many investors municipal bonds sold off in December, although performance for the period on the whole was solid.
Also affecting performance was the introduction in September 2012 of a third round of bond buying by the U.S. Federal Reserve —known as “QE3” — which kept downward pressure on longer-dated bonds, benefiting bond markets in general. Technical factors were also a tailwind for investors, as strong market demand continued to outpace supply, particularly since many municipal issuers have been taking advantage of today’s low prevailing interest rates by refunding existing debt.
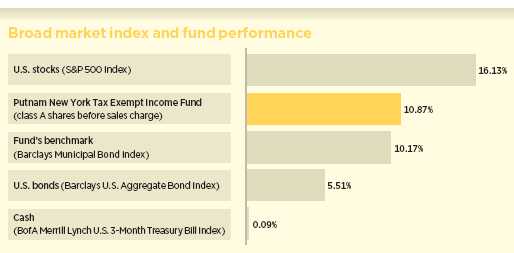
This comparison shows your fund’s performance in the context of broad market indexes for the 12 months ended 11/30/12. See pages 4 and 10–13 for additional fund performance information. Index descriptions can be found on page 15.
| |
| New York Tax Exempt Income Fund 5 |
Against this backdrop, tax-exempt bonds posted solid returns and outpaced the broad taxable bond market, as measured by the Barclays U.S. Aggregate Bond Index. Moreover, the fund outperformed its benchmark index, although it did trail the average return of its Lipper peer group.
What has the default picture looked like in the municipal bond market?
Bankruptcy filings continued to capture headlines during the past six months, with three California cities — Mammoth Lakes, San Bernardino, and Stockton — all filing for protection. While these developments captured national media attention, it’s important to put them in context for New York investors. Through the end of November 2012, $4.1 billion of the $3.7 trillion municipal bond market had defaulted, representing about 0.11% of the overall market. On an annualized basis, this figure is in line with the 10-year average annual default rate, and represents a marked decline from 2011’s annual cumulative default rate. Looking ahead, we believe defaults are likely to remain in line with historical averages. That said, we also believe it’s likely that certain cities or counties will continue to capture headlines as we begin 2013; some municipalities are continuing to work to find their fiscal footing, and additional bankruptcy filings are certainly a possibility.
What effect have tax policy changes had on the municipal bond market?
All eyes were on Washington, D.C., as we closed out 2012 and legislators attempted to craft a deal to avoid the automatic spending cuts and tax increases that represent the fiscal cliff. On January 1, Congress passed a bill that brought some temporary clarity to the tax landscape and delayed the automatic spending cuts for another two months.
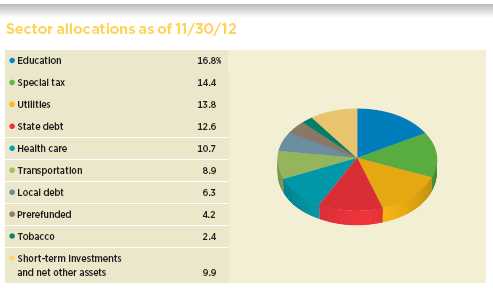
Allocations are represented as a percentage of the fund’s net assets. Summary information may differ from the information in the portfolio schedule notes included in the financial statements due to the inclusion of derivative securities, any interest accruals, the exclusion of as-of trades, if any, and the use of different classifications of securities for presentation purposes. Holdings and allocations may vary over time.
| |
| 6 New York Tax Exempt Income Fund |
On the revenue side, the top federal income tax rates for individuals earning more than $400,000 and couples earning more than $450,000 will rise to 39.6% for tax year 2013. The “payroll tax holiday,” which had been in effect for two years, will expire, and all workers subject to the tax will see payroll tax rates return to 6.2% from the current 4.2%. In addition, taxpayers with incomes above $400,000 — $450,000 for those married filing jointly — are subject to a 20% tax rate on long-term capital gains and qualified dividends, up from 15%. Once the new Medicare net investment income surtax is factored in, the effective tax rate is 23.8%. The Act also phases out certain itemized deductions and personal exemptions for taxpayers with incomes above $250,000, but these provisions do not limit the exemption on municipal bond interest. The top tax rate for upper-income municipal bond investors is expected to rise to 43.4%, from 35% last year, based on the new top income tax rate of 39.6% plus the 3.8% Medicare tax on net investment income and capital gains. For the time being, there are no changes planned for the tax treatment of municipal bonds, but changes could be part of a broader tax reform in the future.
The key takeaway is that higher income earners will face higher tax burdens next year, and while broader tax reform is still a possibility, for the time being tax rates are now a known entity. It’s hard to predict whether changes to the tax exemption of
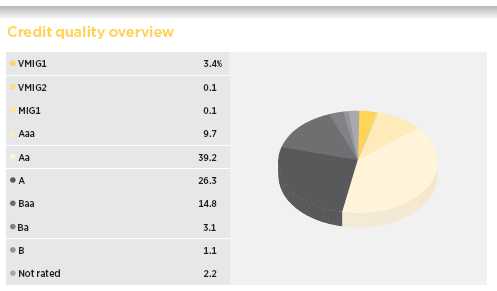
Credit qualities are shown as a percentage of the fund’s portfolio market value as of 11/30/12. A bond rated Baa or higher (MIG3/VMIG3 or higher, for short-term debt) is considered investment grade. The chart reflects Moody’s ratings; percentages may include bonds or derivatives not rated by Moody’s but rated by Standard & Poor’s (S&P) or, if unrated by S&P, by Fitch Ratings, and then included in the closest equivalent Moody’s rating. Ratings will vary over time. Credit qualities are included for portfolio securities and are not included for derivative instruments and cash. The fund itself has not been rated by an independent rating agency.
| |
| New York Tax Exempt Income Fund 7 |
municipal bonds will reenter negotiations over the coming months, but the current tax changes will likely make municipal bonds’ tax-free income attractive as part of a well-diversified portfolio.
How are states’ finances faring today?
We have seen improvement across the board. For fiscal year 2013, 48 states, including New York, are projecting increased tax revenues versus those of 2012 according to the National Conference of State Legislators, and certainly that is an encouraging trend. That said, stressors continue to exist at the local level, where many states have lowered expenses by reducing their financial support. Moreover, should the economy begin to decelerate and growth begin to stall, which is a distinct possibility in the first half of 2013, that would almost certainly negatively affect municipal finances, we believe. With this in mind, we maintain a cautious view on the outlook for local general obligation bonds [G.O.s] overall, and remain underweight.
How did you position the portfolio?
We sought to benefit from improving fundamentals in the municipal bond market. While we believed that the budget challenges faced by many municipalities were significant, we were confident that conditions would improve as long as the broad economy did not stall. Against this backdrop, we believed that essential service revenue bonds continued to be attractive, while we remained highly selective regarding the fund’s positioning in local G.O.s, which are securities issued at the city or county level. As the federal government looks to reduce transfer payments to the states, we believe that these types of bonds are at risk for downgrades or other headline-driven price volatility. And unlike state general obligation bonds, local G.O.s rely more on property tax revenue than on income or sales taxes. With real-estate prices still under pressure in many markets, property taxes have been slower to recover than other tax sources.
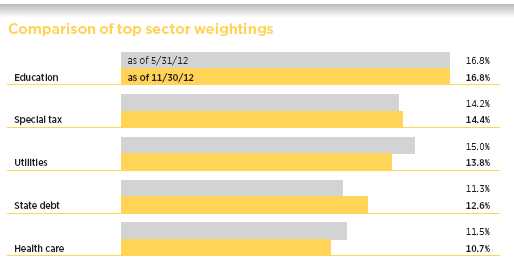
This chart shows how the fund’s top weightings have changed over the past six months. Allocations are represented as a percentage of the fund’s net assets. Current period summary information may differ from the information in the portfolio schedule notes included in the financial statements due to the inclusion of derivative securities, any interest accruals, the exclusion of as-of trades, if any, and the use of different classifications of securities for presentation purposes. Holdings and allocations may vary over time.
| |
| 8 New York Tax Exempt Income Fund |
From a credit perspective, we held overweight positions in Baa-rated securities versus the fund’s benchmark. In terms of sectors, relative to the benchmark index, we favored higher education, utility, and health-care bonds, including those of hospitals and continuing-care retirement communities. Overall, this positioning generally helped the fund’s relative performance during its reporting period. On the other hand, our slight short-duration positioning was an overall detractor from performance relative to our Lipper peers. Also, an underweight position in non-rated municipal bonds hampered relative performance for the fund.
What is your outlook for the months ahead?
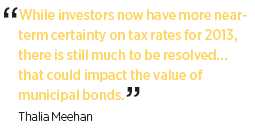
We continue to be optimistic on the outlook for municipal bonds, given solid market technicals, and maintain our overweight position in essential-service revenue bonds. While spreads — the difference in yield between municipal bonds and Treasuries — are much narrower than they were at their peak, they remain attractive, in our opinion. Technical factors in the market have been positive —specifically, higher refunding activity and strong investor demand. While investors now have more near-term certainty on tax rates for 2013, there is still much to be resolved, including sequestration, the debt ceiling, and the potential for broader tax reform during the year, all of which could impact the value of municipal bonds. As always, we are monitoring the situation closely and positioning the fund accordingly.
Thank you, Thalia, for your time and insights today.
The views expressed in this report are exclusively those of Putnam Management and are subject to change. They are not meant as investment advice.
Please note that the holdings discussed in this report may not have been held by the fund for the entire period. Portfolio composition is subject to review in accordance with the fund’s investment strategy and may vary in the future. Current and future portfolio holdings are subject to risk.
Portfolio Manager Thalia Meehan holds a B.A. from Williams College. A CFA charterholder, Thalia joined Putnam in 1989 and has been in the investment industry since 1983.
In addition to Thalia, your fund’s portfolio managers are Paul M. Drury, CFA, and Susan A. McCormack, CFA.
IN THE NEWS
While the U.S. economy continues to gather strength in several key areas, estimates for overall global economic growth in 2012 and 2013 have been downgraded. The Organisation for Economic Co-operation and Development (OECD) revised its global GDP projections from 3.4% to 2.9% for 2012 and from 4.2% to 3.4% for 2013. The primary barriers to growth include the eurozone’s debt crisis and, to a lesser degree, the impending U.S. “fiscal cliff.” For the euro-zone, the Paris-based think tank predicts negative growth of –0.4% in 2012 and –0.1% in 2013, before climbing to a tepid 1.3% in 2014. U.S. GDP growth may be significantly better, however: 2.2% for 2012, slowing to 2% in 2013, before increasing to 2.8% in 2014, according to the OECD.
| |
| New York Tax Exempt Income Fund 9 |
Your fund’s performance
This section shows your fund’s performance, price, and distribution information for periods ended November 30, 2012, the end of its most recent fiscal year. In accordance with regulatory requirements for mutual funds, we also include performance information as of the most recent calendar quarter-end and expense information taken from the fund’s current prospectus. Performance should always be considered in light of a fund’s investment strategy. Data represent past performance. Past performance does not guarantee future results. More recent returns may be less or more than those shown. Investment return and principal value will fluctuate, and you may have a gain or a loss when you sell your shares. Performance information does not reflect any deduction for taxes a shareholder may owe on fund distributions or on the redemption of fund shares. For the most recent month-end performance, please visit the Individual Investors section at putnam.com or call Putnam at 1-800-225-1581. Class Y shares are not available to all investors. See the Terms and Definitions section in this report for definitions of the share classes offered by your fund.
Fund performance Total return for periods ended 11/30/12
| | | | | | | | | |
| | Class A | Class B | Class C | Class M | Class Y |
| (inception dates) | (9/2/83) | (1/4/93) | (7/26/99) | (4/10/95) | (1/2/08) |
|
| | Before | After | | | | | Before | After | Net |
| | sales | sales | Before | After | Before | After | sales | sales | asset |
| charge | charge | CDSC | CDSC | CDSC | CDSC | charge | charge | value |
|
| Annual average | | | | | | | | | |
| (life of fund) | 7.03% | 6.88% | 6.26% | 6.26% | 6.16% | 6.16% | 6.63% | 6.51% | 7.07% |
|
| 10 years | 61.19 | 54.89 | 51.53 | 51.53 | 48.94 | 48.94 | 56.57 | 51.52 | 62.90 |
| Annual average | 4.89 | 4.47 | 4.24 | 4.24 | 4.06 | 4.06 | 4.59 | 4.24 | 5.00 |
|
| 5 years | 31.94 | 26.59 | 27.72 | 25.72 | 26.72 | 26.72 | 29.97 | 25.66 | 33.39 |
| Annual average | 5.70 | 4.83 | 5.02 | 4.68 | 4.85 | 4.85 | 5.38 | 4.67 | 5.93 |
|
| 3 years | 23.21 | 18.22 | 20.80 | 17.80 | 20.21 | 20.21 | 22.04 | 18.05 | 24.07 |
| Annual average | 7.21 | 5.74 | 6.50 | 5.61 | 6.33 | 6.33 | 6.86 | 5.69 | 7.45 |
|
| 1 year | 10.87 | 6.40 | 10.21 | 5.21 | 9.90 | 8.90 | 10.56 | 6.91 | 11.10 |
|
Current performance may be lower or higher than the quoted past performance, which cannot guarantee future results. After-sales-charge returns for class A and M shares reflect the deduction of the maximum 4.00% and 3.25% sales charge, respectively, levied at the time of purchase. Class B share returns after contingent deferred sales charge (CDSC) reflect the applicable CDSC, which is 5% in the first year, declining over time to 1% in the sixth year, and is eliminated thereafter. Class C share returns after CDSC reflect a 1% CDSC for the first year that is eliminated thereafter. Class Y shares have no initial sales charge or CDSC. Performance for class B, C, M, and Y shares before their inception is derived from the historical performance of class A shares, adjusted for the applicable sales charge (or CDSC) and the higher operating expenses for such shares, except for class Y shares, for which 12b-1 fees are not applicable.
For a portion of the periods, the fund had expense limitations, without which returns would have been lower.
Class B share performance does not reflect conversion to class A shares.
| |
| 10 New York Tax Exempt Income Fund |
Comparative index returns For periods ended 11/30/12
| | |
| | | Lipper New York |
| | Barclays Municipal | Municipal Debt Funds |
| | Bond Index | category average* |
|
| Annual average (life of fund) | 7.53% | 6.89% |
|
| 10 years | 70.06 | 59.64 |
| Annual average | 5.45 | 4.77 |
|
| 5 years | 35.31 | 30.57 |
| Annual average | 6.23 | 5.47 |
|
| 3 years | 22.95 | 23.20 |
| Annual average | 7.13 | 7.19 |
|
| 1 year | 10.17 | 11.87 |
|
Index and Lipper results should be compared with fund performance before sales charge, before CDSC, or at net asset value.
* Over the 1-year, 3-year, 5-year, 10-year, and life-of-fund periods ended 11/30/12, there were 102, 90, 82, 75, and 3 funds, respectively, in this Lipper category.
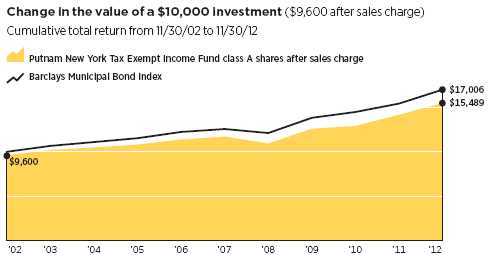
Past performance does not indicate future results. At the end of the same time period, a $10,000 investment in the fund’s class B and class C shares would have been valued at $15,153 and $14,894, respectively, and no contingent deferred sales charges would apply. A $10,000 investment in the fund’s class M shares ($9,675 after sales charge) would have been valued at $15,152. A $10,000 investment in the fund’s class Y shares would have been valued at $16,290.
| |
| New York Tax Exempt Income Fund 11 |
Fund price and distribution information For the 12-month period ended 11/30/12
| | | | | | | |
| Distributions | Class A | Class B | Class C | Class M | Class Y |
|
| Number | 12 | 12 | 12 | 12 | 12 |
|
| Income 1 | $0.333638 | $0.277763 | $0.264367 | $0.308801 | $0.353213 |
|
| Capital gains 2 | — | — | — | — | — |
|
| Total | $0.333638 | $0.277763 | $0.264367 | $0.308801 | $0.353213 |
|
| | Before | After | Net | Net | Before | After | Net |
| | sales | sales | asset | asset | sales | sales | asset |
| Share value | charge | charge | value | value | charge | charge | value |
|
| 11/30/11 | $8.54 | $8.90 | $8.52 | $8.54 | $8.54 | $8.83 | $8.54 |
|
| 11/30/12 | 9.12 | 9.50 | 9.10 | 9.11 | 9.12 | 9.43 | 9.12 |
|
| | Before | After | Net | Net | Before | After | Net |
| | sales | sales | asset | asset | sales | sales | asset |
| Current yield (end of period) | charge | charge | value | value | charge | charge | value |
|
| Current dividend rate 3 | 3.62% | 3.48% | 3.01% | 2.86% | 3.35% | 3.24% | 3.84% |
|
| Taxable equivalent 4(a) | 6.11 | 5.87 | 5.08 | 4.83 | 5.65 | 5.47 | 6.48 |
|
| Taxable equivalent 4(b) | 6.38 | 6.13 | 5.30 | 5.04 | 5.90 | 5.71 | 6.77 |
|
| Current 30-day SEC yield 5 | N/A | 1.87 | 1.33 | 1.19 | N/A | 1.62 | 2.17 |
|
| Taxable equivalent 4(a) | N/A | 3.16 | 2.24 | 2.01 | N/A | 2.73 | 3.66 |
|
| Taxable equivalent 4(b) | N/A | 3.30 | 2.34 | 2.10 | N/A | 2.85 | 3.82 |
|
The classification of distributions, if any, is an estimate. Before-sales-charge share value and current dividend rate for class A and M shares, if applicable, do not take into account any sales charge levied at the time of purchase. After-sales-charge share value, current dividend rate, and current 30-day SEC yield, if applicable, are calculated assuming that the maximum sales charge (4.00% for class A shares and 3.25% for class M shares) was levied at the time of purchase. Final distribution information will appear on your year-end tax forms.
1 For some investors, investment income may be subject to the federal alternative minimum tax.
2 Capital gains, if any, are taxable for federal and, in most cases, state purposes.
3 Most recent distribution, excluding capital gains, annualized and divided by share price before or after sales charge at period-end.
4 Assumes (a) maximum 40.73% combined federal income tax and New York state 2012 personal income tax or (b) maximum 43.25% combined federal, New York state, and New York City 2012 personal income tax rates. Results for investors subject to lower tax rates would not be as advantageous.
5 Based only on investment income and calculated using the maximum offering price for each share class, in accordance with SEC guidelines.
| |
| 12 New York Tax Exempt Income Fund |
Fund performance as of most recent calendar quarter
Total return for periods ended 12/31/12
| | | | | | | | | |
| | Class A | Class B | Class C | Class M | Class Y |
| (inception dates) | (9/2/83) | (1/4/93) | (7/26/99) | (4/10/95) | (1/2/08) |
|
| | Before | After | | | | | Before | After | Net |
| | sales | sales | Before | After | Before | After | sales | sales | asset |
| charge | charge | CDSC | CDSC | CDSC | CDSC | charge | charge | value |
|
|
| Annual average | | | | | | | | | |
| (life of fund) | 6.95% | 6.80% | 6.19% | 6.19% | 6.09% | 6.09% | 6.56% | 6.44% | 7.00% |
|
| 10 years | 55.14 | 48.98 | 45.83 | 45.83 | 43.38 | 43.38 | 50.77 | 45.86 | 57.00 |
| Annual average | 4.49 | 4.07 | 3.84 | 3.84 | 3.67 | 3.67 | 4.19 | 3.85 | 4.61 |
|
| 5 years | 29.63 | 24.52 | 25.79 | 23.79 | 24.66 | 24.66 | 28.00 | 23.76 | 31.25 |
| Annual average | 5.33 | 4.48 | 4.70 | 4.36 | 4.51 | 4.51 | 5.06 | 4.36 | 5.59 |
|
| 3 years | 20.58 | 15.68 | 18.31 | 15.31 | 17.75 | 17.75 | 19.56 | 15.64 | 21.52 |
| Annual average | 6.44 | 4.98 | 5.76 | 4.86 | 5.60 | 5.60 | 6.14 | 4.96 | 6.71 |
|
| 1 year | 7.25 | 3.00 | 6.70 | 1.70 | 6.58 | 5.58 | 7.08 | 3.63 | 7.63 |
|
Your fund’s expenses
As a mutual fund investor, you pay ongoing expenses, such as management fees, distribution fees (12b-1 fees), and other expenses. Using the following information, you can estimate how these expenses affect your investment and compare them with the expenses of other funds. You may also pay one-time transaction expenses, including sales charges (loads) and redemption fees, which are not shown in this section and would have resulted in higher total expenses. For more information, see your fund’s prospectus or talk to your financial representative.
Expense ratios
| | | | | |
| | Class A | Class B | Class C | Class M | Class Y |
|
| Total annual operating expenses for the fiscal | | | | | |
| year ended 11/30/11 | 0.75% | 1.38% | 1.53% | 1.03% | 0.53% |
|
| Annualized expense ratio for the six-month | | | | | |
| period ended 11/30/12* | 0.74% | 1.37% | 1.52% | 1.02% | 0.52% |
|
Fiscal-year expense information in this table is taken from the most recent prospectus, is subject to change, and may differ from that shown for the annualized expense ratio and in the financial highlights of this report. Expenses are shown as a percentage of average net assets.
* For the fund’s most recent fiscal half year; may differ from expense ratios based on one-year data in the financial highlights.
| |
| New York Tax Exempt Income Fund 13 |
Expenses per $1,000
The following table shows the expenses you would have paid on a $1,000 investment in the fund from June 1, 2012, to November 30, 2012. It also shows how much a $1,000 investment would be worth at the close of the period, assuming actual returns and expenses.
| | | | | |
| | Class A | Class B | Class C | Class M | Class Y |
|
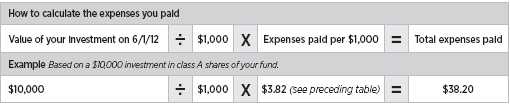
| Expenses paid per $1,000*† | $3.82 | $7.06 | $7.83 | $5.26 | $2.69 |
|
| Ending value (after expenses) | $1,065.80 | $1,061.50 | $1,060.30 | $1,063.70 | $1,067.40 |
|
* Expenses for each share class are calculated using the fund’s annualized expense ratio for each class, which represents the ongoing expenses as a percentage of average net assets for the six months ended 11/30/12. The expense ratio may differ for each share class.
† Expenses are calculated by multiplying the expense ratio by the average account value for the period; then multiplying the result by the number of days in the period; and then dividing that result by the number of days in the year.
Estimate the expenses you paid
To estimate the ongoing expenses you paid for the six months ended November 30, 2012, use the following calculation method. To find the value of your investment on June 1, 2012, call Putnam at 1-800-225-1581.
Compare expenses using the SEC’s method
The Securities and Exchange Commission (SEC) has established guidelines to help investors assess fund expenses. Per these guidelines, the following table shows your fund’s expenses based on a $1,000 investment, assuming a hypothetical 5% annualized return. You can use this information to compare the ongoing expenses (but not transaction expenses or total costs) of investing in the fund with those of other funds. All mutual fund shareholder reports will provide this information to help you make this comparison. Please note that you cannot use this information to estimate your actual ending account balance and expenses paid during the period.
| | | | | |
| | Class A | Class B | Class C | Class M | Class Y |
|
| Expenses paid per $1,000*† | $3.74 | $6.91 | $7.67 | $5.15 | $2.63 |
|
| Ending value (after expenses) | $1,021.30 | $1,018.15 | $1,017.40 | $1,019.90 | $1,022.40 |
|
* Expenses for each share class are calculated using the fund’s annualized expense ratio for each class, which represents the ongoing expenses as a percentage of average net assets for the six months ended 11/30/12. The expense ratio may differ for each share class.
† Expenses are calculated by multiplying the expense ratio by the average account value for the period; then multiplying the result by the number of days in the period; and then dividing that result by the number of days in the year.
| |
| 14 New York Tax Exempt Income Fund |
Terms and definitions
Important terms
Total return shows how the value of the fund’s shares changed over time, assuming you held the shares through the entire period and reinvested all distributions in the fund.
Before sales charge, or net asset value, is the price, or value, of one share of a mutual fund, without a sales charge. Before-sales-charge figures fluctuate with market conditions, and are calculated by dividing the net assets of each class of shares by the number of outstanding shares in the class.
After sales charge is the price of a mutual fund share plus the maximum sales charge levied at the time of purchase. After-sales-charge performance figures shown here assume the 4.00% maximum sales charge for class A shares and 3.25% for class M shares.
Contingent deferred sales charge (CDSC) is generally a charge applied at the time of the redemption of class B or C shares and assumes redemption at the end of the period. Your fund’s class B CDSC declines over time from a 5% maximum during the first year to 1% during the sixth year. After the sixth year, the CDSC no longer applies. The CDSC for class C shares is 1% for one year after purchase.
Share classes
Class A shares are generally subject to an initial sales charge and no CDSC (except on certain redemptions of shares bought without an initial sales charge).
Class B shares are not subject to an initial sales charge. They may be subject to a CDSC.
Class C shares are not subject to an initial sales charge and are subject to a CDSC only if the shares are redeemed during the first year.
Class M shares have a lower initial sales charge and a higher 12b-1 fee than class A shares and no CDSC.
Class Y shares are not subject to an initial sales charge or CDSC, and carry no 12b-1 fee. They are generally only available to corporate and institutional clients and clients in other approved programs.
Fixed-income terms
Current yield is the annual rate of return earned from dividends or interest of an investment. Current yield is expressed as a percentage of the price of a security, fund share, or principal investment.
Yield curve is a graph that plots the yields of bonds with equal credit quality against their differing maturity dates, ranging from shortest to longest. It is used as a benchmark for other debt, such as mortgage or bank lending rates.
Comparative indexes
Barclays Municipal Bond Index is an unmanaged index of long-term fixed-rate investment-grade tax-exempt bonds.
Barclays U.S. Aggregate Bond Index is an unmanaged index of U.S. investment-grade fixed-income securities.
BofA (Bank of America) Merrill Lynch U.S. 3-Month Treasury Bill Index is an unmanaged index that seeks to measure the performance of U.S. Treasury bills available in the marketplace.
S&P 500 Index is an unmanaged index of common stock performance.
Indexes assume reinvestment of all distributions and do not account for fees. Securities and performance of a fund and an index will differ. You cannot invest directly in an index.
Lipper is a third-party industry-ranking entity that ranks mutual funds. Its rankings do not reflect sales charges. Lipper rankings are based on total return at net asset value relative to other funds that have similar current investment styles or objectives as determined by Lipper. Lipper may change a fund’s category assignment at its discretion. Lipper category averages reflect performance trends for funds within a category.
| |
| New York Tax Exempt Income Fund 15 |
Other information for shareholders
Important notice regarding Putnam’s privacy policy
In order to conduct business with our shareholders, we must obtain certain personal information such as account holders’ names, addresses, Social Security numbers, and dates of birth. Using this information, we are able to maintain accurate records of accounts and transactions.
It is our policy to protect the confidentiality of our shareholder information, whether or not a shareholder currently owns shares of our funds. In particular, it is our policy not to sell information about you or your accounts to outside marketing firms. We have safeguards in place designed to prevent unauthorized access to our computer systems and procedures to protect personal information from unauthorized use.
Under certain circumstances, we must share account information with outside vendors who provide services to us, such as mailings and proxy solicitations. In these cases, the service providers enter into confidentiality agreements with us, and we provide only the information necessary to process transactions and perform other services related to your account. Finally, it is our policy to share account information with your financial representative, if you’ve listed one on your Putnam account.
Proxy voting
Putnam is committed to managing our mutual funds in the best interests of our shareholders. The Putnam funds’ proxy voting guidelines and procedures, as well as information regarding how your fund voted proxies relating to portfolio securities during the 12-month period ended June 30, 2012, are available in the Individual Investors section at putnam.com, and on the Securities and Exchange Commission (SEC) website, www.sec.gov. If you have questions about finding forms on the SEC’s website, you may call the SEC at 1-800-SEC-0330. You may also obtain the Putnam funds’ proxy voting guidelines and procedures at no charge by calling Putnam’s Shareholder Services at 1-800-225-1581.
Fund portfolio holdings
The fund will file a complete schedule of its portfolio holdings with the SEC for the first and third quarters of each fiscal year on Form N-Q. Shareholders may obtain the fund’s Forms N-Q on the SEC’s website at www.sec.gov. In addition, the fund’s Forms N-Q may be reviewed and copied at the SEC’s Public Reference Room in Washington, D.C. You may call the SEC at 1-800-SEC-0330 for information about the SEC’s website or the operation of the Public Reference Room.
Trustee and employee fund ownership
Putnam employees and members of the Board of Trustees place their faith, confidence, and, most importantly, investment dollars in Putnam mutual funds. As of November 30, 2012, Putnam employees had approximately $340,000,000 and the Trustees had approximately $83,000,000 invested in Putnam mutual funds. These amounts include investments by the Trustees’ and employees’ immediate family members as well as investments through retirement and deferred compensation plans.
| |
| 16 New York Tax Exempt Income Fund |
Trustee approval of management contract
General conclusions
The Board of Trustees of the Putnam funds oversees the management of each fund and, as required by law, determines annually whether to approve the continuance of your fund’s management contract with Putnam Investment Management (“Putnam Management”) and the sub-management contract with respect to your fund between Putnam Management and its affiliate, Putnam Investments Limited (“PIL”).
The Board of Trustees, with the assistance of its Contract Committee, requests and evaluates all information it deems reasonably necessary under the circumstances in connection with its annual contract review. The Contract Committee consists solely of Trustees who are not “interested persons” (as this term is defined in the Investment Company Act of 1940, as amended (the “1940 Act”)) of the Putnam funds (“Independent Trustees”).
At the outset of the review process, members of the Board’s independent staff and independent legal counsel met with representatives of Putnam Management to review the annual contract review materials furnished to the Contract Committee during the course of the previous year’s review and to discuss possible changes in these materials that might be necessary or desirable for the coming year. Following these discussions and in consultation with the Contract Committee, the Independent Trustees’ independent legal counsel requested that Putnam Management furnish specified information, together with any additional information that Putnam Management considered relevant, to the Contract Committee. Over the course of several months ending in June 2012, the Contract Committee met on a number of occasions with representatives of Putnam Management, and separately in executive session, to consider the information that Putnam Management provided. Throughout this process, the Contract Committee was assisted by the members of the Board’s independent staff and by independent legal counsel for the Putnam funds and the Independent Trustees.
In May 2012, the Contract Committee met in executive session with the other Independent Trustees to discuss the Contract Committee’s preliminary recommendations with respect to the continuance of the contracts. At the Trustees’ June 22, 2012 meeting, the Contract Committee met in executive session with the other Independent Trustees to review a summary of the key financial data that the Contract Committee considered in the course of its review. The Contract Committee then presented its written report, which summarized the key factors that the Committee had considered and set forth its final recommendations. The Contract Committee then recommended, and the Independent Trustees approved, the continuance of your fund’s management and sub-management contracts, effective July 1, 2012. (Because PIL is an affiliate of Putnam Management and Putnam Management remains fully responsible for all services provided by PIL, the Trustees have not evaluated PIL as a separate entity, and all subsequent references to Putnam Management below should be deemed to include reference to PIL as necessary or appropriate in the context.)
The Independent Trustees’ approval was based on the following conclusions:
• That the fee schedule in effect for your fund represented reasonable compensation in light of the nature and quality of the services being provided to the fund, the fees paid by competitive funds, and the costs incurred by Putnam Management in providing services, and
• That the fee schedule represented an appropriate sharing between fund shareholders and Putnam Management of such economies of
| |
| New York Tax Exempt Income Fund 17 |
scale as may exist in the management of the fund at current asset levels.
These conclusions were based on a comprehensive consideration of all information provided to the Trustees and were not the result of any single factor. Some of the factors that figured particularly in the Trustees’ deliberations and how the Trustees considered these factors are described below, although individual Trustees may have evaluated the information presented differently, giving different weights to various factors. It is also important to recognize that the management arrangements for your fund and the other Putnam funds are the result of many years of review and discussion between the Independent Trustees and Putnam Management, that some aspects of the arrangements may receive greater scrutiny in some years than others, and that the Trustees’ conclusions may be based, in part, on their consideration of fee arrangements in previous years.
Management fee schedules and total expenses
The Trustees reviewed the management fee schedules in effect for all Putnam funds, including fee levels and breakpoints. In reviewing management fees, the Trustees generally focus their attention on material changes in circumstances — for example, changes in assets under management, changes in a fund’s investment style, changes in Putnam Management’s operating costs, or changes in competitive practices in the mutual fund industry — that suggest that consideration of fee changes might be warranted. The Trustees concluded that the circumstances did not warrant changes to the management fee structure of your fund.
Most of the open-end Putnam funds, including your fund, have relatively new management contracts, which introduced fee schedules that reflect more competitive fee levels for many funds, complex-wide breakpoints for the open-end funds, and performance fees for some funds. These new management contracts have been in effect for two years — since January or, for a few funds, February 2010. The Trustees approved the new management contracts on July 10, 2009, and fund shareholders subsequently approved the contracts by overwhelming majorities of the shares voted.
Under its management contract, your fund has the benefit of breakpoints in its management fee that provide shareholders with significant economies of scale in the form of reduced fee levels as assets under management in the Putnam family of funds increase. The Contract Committee observed that the complex-wide breakpoints of the open-end funds had only been in place for two years, and the Trustees will continue to examine the operation of this new breakpoint structure in future years in light of further experience.
As in the past, the Trustees also focused on the competitiveness of each fund’s total expense ratio. In order to ensure that expenses of the Putnam funds continue to meet evolving competitive standards, the Trustees and Putnam Management agreed in 2009 to implement certain expense limitations. These expense limitations serve in particular to maintain competitive expense levels for funds with large numbers of small shareholder accounts and funds with relatively small net assets. Most funds, including your fund, had sufficiently low expenses that these expense limitations did not apply. The expense limitations were: (i) a contractual expense limitation applicable to all retail open-end funds of 37.5 basis points (effective March 1, 2012, this expense limitation was reduced to 32 basis points) on investor servicing fees and expenses and (ii) a contractual expense limitation applicable to all open-end funds of 20 basis points on so-called “other expenses” (i.e., all expenses exclusive of management fees, investor servicing fees, distribution fees, investment-related expenses, interest, taxes, brokerage commissions,
| |
| 18 New York Tax Exempt Income Fund |
extraordinary expenses and acquired fund fees and expenses). Putnam Management’s support for these expense limitations, including its agreement to reduce the expense limitation applicable to the open-end funds’ investor servicing fees and expenses as noted above, was an important factor in the Trustees’ decision to approve the continuance of your fund’s management and sub-management contracts.
The Trustees reviewed comparative fee and expense information for a custom group of competitive funds selected by Lipper Inc. This comparative information included your fund’s percentile ranking for effective management fees and total expenses (excluding any applicable 12b-1 fee), which provides a general indication of your fund’s relative standing. In the custom peer group, your fund ranked in the 2nd quintile in effective management fees (determined for your fund and the other funds in the custom peer group based on fund asset size and the applicable contractual management fee schedule) and in the 2nd quintile in total expenses (excluding any applicable 12b-1 fees) as of December 31, 2011 (the first quintile representing the least expensive funds and the fifth quintile the most expensive funds). The fee and expense data reported by Lipper as of December 31, 2011 reflected the most recent fiscal year-end data available in Lipper’s database at that time.
In connection with their review of the management fees and total expenses of the Putnam funds, the Trustees also reviewed the costs of the services provided and the profits realized by Putnam Management and its affiliates from their contractual relationships with the funds. This information included trends in revenues, expenses and profitability of Putnam Management and its affiliates relating to the investment management, investor servicing and distribution services provided to the funds. In this regard, the Trustees also reviewed an analysis of Putnam Management’s revenues, expenses and profitability, allocated on a fund-by-fund basis, with respect to the funds’ management, distribution, and investor servicing contracts. For each fund, the analysis presented information about revenues, expenses and profitability for each of the agreements separately and for the agreements taken together on a combined basis. The Trustees concluded that, at current asset levels, the fee schedules in place represented reasonable compensation for the services being provided and represented an appropriate sharing of such economies of scale as may exist in the management of the funds at that time.
The information examined by the Trustees as part of their annual contract review for the Putnam funds has included for many years information regarding fees charged by Putnam Management and its affiliates to institutional clients such as defined benefit pension plans, college endowments, and the like. This information included comparisons of those fees with fees charged to the funds, as well as an assessment of the differences in the services provided to these different types of clients. The Trustees observed that the differences in fee rates between institutional clients and mutual funds are by no means uniform when examined by individual asset sectors, suggesting that differences in the pricing of investment management services to these types of clients may reflect historical competitive forces operating in separate markets. The Trustees considered the fact that in many cases fee rates across different asset classes are higher on average for mutual funds than for institutional clients, as well as the differences between the services that Putnam Management provides to the Putnam funds and those that it provides to its institutional clients. The Trustees did not rely on these comparisons to any significant extent in concluding that the management fees paid by your fund are reasonable.
| |
| New York Tax Exempt Income Fund 19 |
Investment performance
The quality of the investment process provided by Putnam Management represented a major factor in the Trustees’ evaluation of the quality of services provided by Putnam Management under your fund’s management contract. The Trustees were assisted in their review of the Putnam funds’ investment process and performance by the work of the investment oversight committees of the Trustees, which meet on a regular basis with the funds’ portfolio teams and with the Chief Investment Officer and other members of Putnam Management’s Investment Division throughout the year. The Trustees concluded that Putnam Management generally provides a high-quality investment process — based on the experience and skills of the individuals assigned to the management of fund portfolios, the resources made available to them, and in general Putnam Management’s ability to attract and retain high-quality personnel — but also recognized that this does not guarantee favorable investment results for every fund in every time period.
The Trustees considered the investment performance of each fund over multiple time periods and considered information comparing each fund’s performance with various benchmarks and, where applicable, with the performance of competitive funds or targeted annualized return. They noted that since 2009, when Putnam Management began implementing major changes to strengthen its investment personnel and processes, there has been a steady improvement in the number of Putnam funds showing above-median three-year performance results. They also noted the disappointing investment performance of some funds for periods ended December 31, 2011 and considered information provided by Putnam Management regarding the factors contributing to the underperformance and actions being taken to improve the performance of these particular funds. The Trustees indicated their intention to continue to monitor performance trends to assess the effectiveness of these efforts and to evaluate whether additional actions to address areas of underperformance are warranted.
In the case of your fund, the Trustees considered that its class A share cumulative total return performance at net asset value was in the following quartiles of its Lipper Inc. peer group (Lipper New York Municipal Debt Funds) for the one-year, three-year and five-year periods ended December 31, 2011 (the first quartile representing the best-performing funds and the fourth quartile the worst-performing funds):
| | | |
| One-year period | 2nd | | |
| | |
| Three-year period | 2nd | | |
| | |
| Five-year period | 2nd | | |
| | |
Over the one-year, three-year and five-year periods ended December 31, 2011, there were 98, 85 and 78 funds, respectively, in your fund’s Lipper peer group. (When considering performance information, shareholders should be mindful that past performance is not a guarantee of future results.)
Brokerage and soft-dollar allocations; investor servicing
The Trustees considered various potential benefits that Putnam Management may receive in connection with the services it provides under the management contract with your fund. These include benefits related to brokerage allocation and the use of soft dollars, whereby a portion of the commissions paid by a fund for brokerage may be used to acquire research services that are expected to be useful to Putnam Management in managing the assets of the fund and of other clients. Subject to policies established by the Trustees, soft-dollar credits acquired through these means are used primarily to acquire research services that supplement Putnam Management’s internal research efforts. However, the Trustees noted that a portion of available soft-dollar credits
|
| 20 New York Tax Exempt Income Fund |
continues to be allocated to the payment of fund expenses. The Trustees indicated their continued intent to monitor regulatory developments in this area with the assistance of their Brokerage Committee and also indicated their continued intent to monitor the potential benefits associated with fund brokerage and soft-dollar allocations and trends in industry practices to ensure that the principle of seeking best price and execution remains paramount in the portfolio trading process.
Putnam Management may also receive benefits from payments that the funds make to Putnam Management’s affiliates for investor or distribution services. In conjunction with the annual review of your fund’s management and sub-management contracts, the Trustees reviewed your fund’s investor servicing agreement with Putnam Investor Services, Inc. (“PSERV”) and its distributor’s contracts and distribution plans with Putnam Retail Management Limited Partnership (“PRM”), both of which are affiliates of Putnam Management. The Trustees concluded that the fees payable by the funds to PSERV and PRM, as applicable, for such services are reasonable in relation to the nature and quality of such services.
| |
| New York Tax Exempt Income Fund 21 |
Financial statements
These sections of the report, as well as the accompanying Notes, preceded by the Report of Independent Registered Public Accounting Firm, constitute the fund’s financial statements.
The fund’s portfolio lists all the fund’s investments and their values as of the last day of the reporting period. Holdings are organized by asset type and industry sector, country, or state to show areas of concentration and diversification.
Statement of assets and liabilities shows how the fund’s net assets and share price are determined. All investment and non-investment assets are added together. Any unpaid expenses and other liabilities are subtracted from this total. The result is divided by the number of shares to determine the net asset value per share, which is calculated separately for each class of shares. (For funds with preferred shares, the amount subtracted from total assets includes the liquidation preference of preferred shares.)
Statement of operations shows the fund’s net investment gain or loss. This is done by first adding up all the fund’s earnings — from dividends and interest income — and subtracting its operating expenses to determine net investment income (or loss). Then, any net gain or loss the fund realized on the sales of its holdings — as well as any unrealized gains or losses over the period — is added to or subtracted from the net investment result to determine the fund’s net gain or loss for the fiscal year.
Statement of changes in net assets shows how the fund’s net assets were affected by the fund’s net investment gain or loss, by distributions to shareholders, and by changes in the number of the fund’s shares. It lists distributions and their sources (net investment income or realized capital gains) over the current reporting period and the most recent fiscal year-end. The distributions listed here may not match the sources listed in the Statement of operations because the distributions are determined on a tax basis and may be paid in a different period from the one in which they were earned.
Financial highlights provide an overview of the fund’s investment results, per-share distributions, expense ratios, net investment income ratios, and portfolio turnover in one summary table, reflecting the five most recent reporting periods. In a semiannual report, the highlights table also includes the current reporting period.
|
| 22 New York Tax Exempt Income Fund |
Report of Independent Registered Public Accounting Firm
The Board of Trustees and Shareholders
Putnam New York Tax Exempt Income Fund:
We have audited the accompanying statement of assets and liabilities of Putnam New York Tax Exempt Income Fund (the fund), including the fund’s portfolio, as of November 30, 2012, and the related statement of operations for the year then ended, the statements of changes in net assets for each of the years in the two-year period then ended, and the financial highlights for each of the years or periods in the five-year period then ended. These financial statements and financial highlights are the responsibility of the fund’s management. Our responsibility is to express an opinion on these financial statements and financial highlights based on our audits.
We conducted our audits in accordance with the standards of the Public Company Accounting Oversight Board (United States). Those standards require that we plan and perform the audit to obtain reasonable assurance about whether the financial statements and financial highlights are free of material misstatement. An audit includes examining, on a test basis, evidence supporting the amounts and disclosures in the financial statements. Our procedures included confirmation of securities owned as of November 30, 2012, by correspondence with the custodian and brokers or by other appropriate auditing procedures. An audit also includes assessing the accounting principles used and significant estimates made by management, as well as evaluating the overall financial statement presentation. We believe that our audits provide a reasonable basis for our opinion.
In our opinion, the financial statements and financial highlights referred to above present fairly, in all material respects, the financial position of Putnam New York Tax Exempt Income Fund as of November 30, 2012, the results of its operations for the year then ended, the changes in its net assets for each of the years in the two-year period then ended, and the financial highlights for each of the years or periods in the five-year period then ended, in conformity with U.S. generally accepted accounting principles.

Boston, Massachusetts
January 11, 2013
| |
| New York Tax Exempt Income Fund 23 |
The fund’s portfolio 11/30/12
| |
| Key to holding’s abbreviations | |
| AGM Assured Guaranty Municipal Corporation | G.O. Bonds General Obligation Bonds |
| AGO Assured Guaranty, Ltd. | NATL National Public Finance Guarantee Corp. |
| AMBAC AMBAC Indemnity Corporation | Radian Insd. Radian Group Insured |
| Cmnwlth. of PR Gtd. Commonwealth of | SGI Syncora Guarantee, Inc. |
| Puerto Rico Guaranteed | VRDN Variable Rate Demand Notes, which are |
| COP Certificates of Participation | floating-rate securities with long-term maturities, |
| FGIC Financial Guaranty Insurance Company | that carry coupons that reset every one or seven |
| FHA Insd. Federal Housing Administration Insured | days. The rate shown is the current interest rate at the |
| FRN Floating Rate Notes: the rate shown is | close of the reporting period. |
| the current interest rate at the close of the | |
| reporting period | |
| | | |
| MUNICIPAL BONDS AND NOTES (98.9%)* | Rating** | Principal amount | Value |
|
| California (0.6%) | | | |
| CA State G.O. Bonds | | | |
| 5 1/4s, 4/1/35 | A1 | $3,000,000 | $3,610,200 |
| 5s, 4/1/42 | A1 | 4,000,000 | 4,635,640 |
|
| | | | 8,245,840 |
| Guam (0.8%) | | | |
| Territory of GU, Rev. Bonds (Section 30), Ser. A, | | | |
| 5 5/8s, 12/1/29 | BBB+ | 3,850,000 | 4,373,754 |
|
| Territory of GU, Bus. Privilege Tax Rev. Bonds, | | | |
| Ser. A, 5s, 1/1/31 | A | 1,000,000 | 1,162,970 |
|
| Territory of GU, Dept. of Ed. COP (John F. Kennedy | | | |
| High School), Ser. A, 6 7/8s, 12/1/40 | B | 500,000 | 561,120 |
|
| Territory of GU, Govt. Wtr. Wks. Auth. Wtr. & Waste | | | |
| Wtr. Syst. Rev. Bonds, 5 5/8s, 7/1/40 | Ba2 | 2,100,000 | 2,271,087 |
|
| Territory of GU, Pwr. Auth. Rev. Bonds, Ser. A | | | |
| 5 1/2s, 10/1/40 | BBB | 1,300,000 | 1,462,305 |
| 5s, 10/1/34 | BBB | 700,000 | 778,603 |
|
| | | | 10,609,839 |
| New York (88.4%) | | | |
| Albany, Cap. Resource Corp. Rev. Bonds | | | |
| (St. Peter’s Hosp.), 6 1/4s, 11/15/38 | A3 | 4,110,000 | 5,028,380 |
|
| Albany, Indl. Dev. Agcy. Civic Fac. Rev. Bonds | | | |
| (Albany College of Pharmacy), Ser. A, | | | |
| 5 5/8s, 12/1/34 | BBB– | 700,000 | 722,890 |
| (St. Peters Hosp.), Ser. E, 5 1/2s, 11/15/27 | A3 | 1,000,000 | 1,138,200 |
| (St. Peter’s Hosp.), Ser. D, 5 3/8s, 11/15/32 | A3 | 4,205,000 | 4,658,635 |
| (Albany College of Pharmacy), Ser. A, | | | |
| 5 3/8s, 12/1/24 | BBB– | 1,800,000 | 1,864,638 |
| (St. Peters Hosp.), Ser. A, 5 1/4s, 11/15/32 | A3 | 2,100,000 | 2,321,676 |
| (St. Peters Hosp.), Ser. E, 5 1/4s, 11/15/32 | A3 | 1,000,000 | 1,105,560 |
| (St. Peter’s Hosp.), Ser. A, 5 1/4s, 11/15/27 | A3 | 3,000,000 | 3,381,420 |
| (Albany Law School), Ser. A, 5s, 7/1/31 | BBB | 3,000,000 | 3,210,780 |
|
| Brooklyn Arena Local Dev. Corp. Rev. Bonds | | | |
| (Barclays Ctr.), 6 3/8s, 7/15/43 | Baa3 | 2,000,000 | 2,364,640 |
|
|
| 24 New York Tax Exempt Income Fund |
| | | |
| MUNICIPAL BONDS AND NOTES (98.9%)* cont. | Rating** | Principal amount | Value |
|
| New York cont. | | | |
| Broome Cnty., Indl. Dev. Agcy. Continuing Care | | | |
| Retirement Rev. Bonds (Good Shepard Village), | | | |
| Ser. A, 6 7/8s, 7/1/40 | B/P | $715,000 | $767,417 |
|
| Build NYC City Resource Corp., Rev. Bonds (YMCA | | | |
| of Greater NY), 5s, 8/1/32 | A– | 1,740,000 | 2,086,277 |
|
| Canton, Cap. Resource Corp., Student Hsg. Fac. | | | |
| Rev. Bonds (Grasse River — SUNY Canton), Ser. A, | | | |
| AGM, 5s, 5/1/40 | Aa3 | 1,000,000 | 1,083,500 |
|
| Chautauqua Cnty., Indl. Dev. Agcy. Rev. Bonds | | | |
| (Dunkirk Pwr.), 5 7/8s, 4/1/42 | Baa3 | 4,000,000 | 4,553,120 |
|
| Chemung Cnty., Indl. Dev. Agcy. Civic Fac. Rev. Bonds | | | |
| (Arnot Ogden Med. Ctr.) | | | |
| 5s, 11/1/34 | A– | 1,300,000 | 1,332,318 |
| Ser. A, 5s, 11/1/29 | A– | 3,250,000 | 3,326,050 |
|
| Dutchess Cnty., Local Dev. Corp. Rev. Bonds | | | |
| (Anderson Ctr. Svcs., Inc.), 6s, 10/1/30 | BB+ | 3,815,000 | 4,151,826 |
|
| Erie Cnty., Indl. Dev. Agcy. School Fac. Rev. Bonds | | | |
| (City School Dist. Buffalo), Ser. A, AGM | | | |
| 5 3/4s, 5/1/28 | Aa3 | 5,000,000 | 5,967,350 |
| 5 3/4s, 5/1/25 | Aa3 | 10,330,000 | 12,703,731 |
|
| Essex Cnty., Indl. Dev. Agcy. Rev. Bonds | | | |
| (Intl. Paper Co.), Ser. A, 6.15s, 4/1/21 | BBB | 1,065,000 | 1,066,832 |
|
| Geneva, Dev. Corp. Rev. Bonds (Hobart & William | | | |
| Smith Colleges), 5s, 9/1/32 | A | 3,935,000 | 4,724,007 |
|
| Hempstead Town, Local Dev. Corp. Rev. Bonds | | | |
| (Molloy College), 5 3/4s, 7/1/39 | BBB+ | 2,500,000 | 2,871,900 |
| (Adelphi U.), Ser. B, 5 1/4s, 2/1/39 | A | 1,500,000 | 1,661,670 |
| (Adelphi U.), Ser. B, 5s, 2/1/34 | A | 3,000,000 | 3,285,390 |
| (Hofstra U.), 5s, 7/1/28 | A | 650,000 | 757,757 |
|
| Hempstead, Indl. Dev. Agcy. Civic Fac. Rev. Bonds | | | |
| (Adelphi U.), 5s, 10/1/35 | A | 1,500,000 | 1,550,505 |
|
| Hudson Yards, Infrastructure Corp. Rev. Bonds, | | | |
| Ser. A | | | |
| 5 3/4s, 2/15/47 | A2 | 3,000,000 | 3,626,790 |
| AMBAC, 5s, 2/15/47 | A2 | 2,500,000 | 2,724,400 |
|
| Huntington, Hsg. Auth. Sr. Hsg. Fac. Rev. Bonds | | | |
| (Gurwin Jewish Sr. Residence), Ser. A, 6s, 5/1/29 | B+/P | 1,250,000 | 1,250,700 |
|
| Liberty, Dev. Corp. Rev. Bonds | | | |
| (Goldman Sachs Headquarters), 5 1/2s, 10/1/37 | A3 | 4,010,000 | 5,198,564 |
| (Goldman Sachs Headquarters, LLC), | | | |
| 5 1/4s, 10/1/35 | A3 | 5,000,000 | 6,231,500 |
|
| Long Island, Pwr. Auth. NY Elec. Syst. Rev. Bonds | | | |
| Ser. A, 6s, 5/1/33 | A3 | 3,500,000 | 4,359,145 |
| Ser. C, 5s, 9/1/35 | A3 | 2,380,000 | 2,573,327 |
| Ser. A, AMBAC, 5s, 9/1/29 | A3 | 7,500,000 | 8,006,325 |
| AGM, zero %, 6/1/28 | Aa3 | 2,510,000 | 1,525,729 |
|
| Metro. Trans. Auth. Rev. Bonds | | | |
| Ser. C, 5s, 11/15/41 | A2 | 6,000,000 | 6,963,480 |
| Ser. A, 5s, 11/15/37 | A2 | 15,000,000 | 16,318,500 |
| Ser. D, 5s, 11/15/29 | A2 | 6,000,000 | 7,272,180 |
| |
| New York Tax Exempt Income Fund 25 |
| | | |
| MUNICIPAL BONDS AND NOTES (98.9%)* cont. | Rating** | Principal amount | Value |
|
| New York cont. | | | |
| Metro. Trans. Auth. Rev. Bonds | | | |
| Ser. D-1, 5s, 11/1/28 | A2 | $2,500,000 | $3,042,900 |
| Ser. D-1, 5s, 11/1/27 | A2 | 2,500,000 | 3,045,350 |
| Ser. A, FGIC, NATL, 5s, 11/15/26 | A2 | 5,000,000 | 5,642,450 |
| Ser. A, 5s, 11/15/22 | A2 | 6,000,000 | 6,858,300 |
|
| Metro. Trans. Auth. Dedicated Tax Rev. Bonds | | | |
| Ser. A, 5 1/2s, 11/15/39 | AA | 9,000,000 | 10,327,320 |
| Ser. B, NATL, 5s, 11/15/25 | AA | 2,600,000 | 2,970,864 |
| Ser. B, NATL, 5s, 11/15/24 | AA | 3,000,000 | 3,490,800 |
|
| Metro. Trans. Auth. Svc. Contract Rev. Bonds | | | |
| (Trans. Fac.), Ser. O | | | |
| 5 3/4s, 7/1/13 (Escrowed to maturity) | AA+ | 435,000 | 448,798 |
| 5 1/2s, 7/1/17 (Escrowed to maturity) | AA+ | 24,345,000 | 28,840,791 |
|
| Monroe Cnty., Indl. Dev. Agcy. Civic Fac. Rev. | | | |
| Bonds (Highland Hosp. Rochester), 5s, 8/1/25 | A2 | 495,000 | 538,441 |
|
| Nassau Cnty., G.O. Bonds, Ser. A, FGIC, NATL, | | | |
| 6s, 7/1/13 | A+ | 1,000,000 | 1,029,910 |
|
| Nassau Cnty., Econ. Assistance Corp. Rev. Bonds | | | |
| (South Nassau Cmntys. Hosp.), 5s, 7/1/27 | A3 | 1,255,000 | 1,464,183 |
|
| Nassau Cnty., Indl. Dev. Agcy. Rev. Bonds | | | |
| (Inst. of Tech.), Ser. A, 4 3/4s, 3/1/26 | BBB+ | 1,710,000 | 1,881,137 |
|
| Nassau Cnty., Local Econ. Assistance Corp. Rev. Bonds | | | |
| (South Nassau Cmntys. Hosp.), 5s, 7/1/37 | A3 | 500,000 | 562,710 |
| (Winthrop U. Hosp. Assn.), 5s, 7/1/37 | Baa1 | 1,000,000 | 1,109,920 |
|
| Nassau Cnty., Tobacco Settlement Corp. Rev. Bonds, | | | |
| Ser. A-2, 5 1/4s, 6/1/26 | B– | 6,640,000 | 6,458,662 |
|
| Niagara Area Dev. Corp. Rev. Bonds (Niagara U.), | | | |
| Ser. A | | | |
| 5s, 5/1/42 | BBB+ | 1,000,000 | 1,112,520 |
| 5s, 5/1/35 | BBB+ | 1,170,000 | 1,311,570 |
| 5s, 5/1/30 | BBB+ | 1,500,000 | 1,700,820 |
|
| Niagara Falls, City School Dist. COP (High School | | | |
| Fac.), AGM | | | |
| 5s, 6/15/28 | Aa3 | 1,490,000 | 1,572,814 |
| 5s, 6/15/23 | Aa3 | 3,965,000 | 4,203,336 |
|
| Niagara, Area Dev. Corp. Solid Waste Disp. Fac. | | | |
| Rev. Bonds (Covanta Holding Corp.), Ser. A, | | | |
| 5 1/4s, 11/1/42 | Ba2 | 2,450,000 | 2,499,711 |
|
| NY City, G.O. Bonds | | | |
| Ser. A-1, 5s, 10/1/32 | Aa2 | 2,710,000 | 3,296,715 |
| Ser. F, 5s, 8/1/31 | Aa2 | 9,000,000 | 10,879,920 |
| Ser. I, 5s, 8/1/31 | Aa2 | 1,335,000 | 1,627,378 |
| Ser. C, AGM, 5s, 1/1/23 | Aa2 | 10,000,000 | 11,688,200 |
| Ser. N, 5s, 8/1/20 | Aa2 | 1,000,000 | 1,120,530 |
| Ser. M, 5s, 4/1/20 | Aa2 | 6,775,000 | 7,489,627 |
| Ser. I-1, 5s, 4/1/19 | Aa2 | 1,215,000 | 1,397,517 |
|
| NY City, City Muni. Fin. Auth. Rev. Bonds (Wtr. & | | | |
| Swr. Syst.), Ser. A, 4 3/4s, 6/15/30 | AAA | 5,815,000 | 6,644,742 |
|
|
| 26 New York Tax Exempt Income Fund |
| | | |
| MUNICIPAL BONDS AND NOTES (98.9%)* cont. | Rating** | Principal amount | Value |
|
| New York cont. | | | |
| NY City, City Transitional Fin. Auth. Rev. Bonds | | | |
| (Bldg. Aid Fiscal 2008), Ser. S-1, 5s, 1/15/29 | Aa3 | $5,000,000 | $5,706,950 |
| Ser. E, 5s, 2/1/28 | Aaa | 8,885,000 | 8,948,172 |
| (Bldg. Aid Fiscal 2008), Ser. S-1, 5s, 1/15/25 | Aa3 | 3,000,000 | 3,550,410 |
|
| NY City, City Transitional Fin. Auth. VRDN | | | |
| (New York City Recovery), Ser. 1-1C, | | | |
| 0.19s, 11/1/22 | VMIG1 | 13,810,000 | 13,810,000 |
| (NYC Recovery), Ser. 3, 0.17s, 11/1/22 | VMIG1 | 9,000,000 | 9,000,000 |
|
| NY City, Cultural Resource Rev. Bonds (Museum | | | |
| of Modern Art), Ser. 1A, 5s, 4/1/31 | Aa2 | 3,500,000 | 4,107,915 |
|
| NY City, Cultural Resource VRDN | | | |
| (Lincoln Ctr.), Ser. A-1, 0.2s, 12/1/35 | VMIG1 | 10,000,000 | 10,000,000 |
| (Alvin Ailey Dance Foundation), 0.18s, 7/1/33 | VMIG2 | 900,000 | 900,000 |
| (Lincoln Ctr. Perform Arts), Ser. A-2, | | | |
| 0.17s, 12/1/35 | VMIG1 | 950,000 | 950,000 |
|
| NY City, Hsg. Dev. Corp. Rev. Bonds | | | |
| (Multi-Fam. Hsg.), Ser. A-1-A, 5.45s, 11/1/46 | Aa2 | 2,670,000 | 2,785,184 |
| (Multi-Fam. Hsg.), Ser. H-2-A, 5.35s, 5/1/41 | Aa2 | 1,200,000 | 1,262,412 |
| (Multi-Fam. Hsg.), Ser. H-2-A, 5.2s, 11/1/35 | Aa2 | 1,675,000 | 1,758,248 |
| Ser. H-2-A, 4.4s, 5/1/31 | Aa2 | 4,000,000 | 4,248,120 |
|
| NY City, Indl. Dev. Agcy. Rev. Bonds | | | |
| (Visy Paper, Inc.), 7.95s, 1/1/28 | B–/P | 2,600,000 | 2,613,078 |
| (Yankee Stadium — Pilot), AGO, 7s, 3/1/49 | Aa3 | 1,000,000 | 1,229,190 |
| (Queens Baseball Stadium — Pilot), AMBAC, | | | |
| 5s, 1/1/24 | Ba1 | 3,500,000 | 3,689,385 |
|
| NY City, Indl. Dev. Agcy. Arpt. Facs. Rev. Bonds | | | |
| (Sr. Trips), Ser. A, 5s, 7/1/28 | BBB– | 1,500,000 | 1,613,340 |
|
| NY City, Indl. Dev. Agcy. Civic Fac. Rev. Bonds | | | |
| (United Jewish Appeal), Ser. A, 5 1/4s, 7/1/23 | Aa1 | 2,545,000 | 2,717,831 |
| (St. Francis College), 5s, 10/1/34 | A– | 1,000,000 | 1,023,360 |
| (Horace Mann School), NATL, 5s, 7/1/28 | Baa2 | 7,000,000 | 7,008,960 |
|
| NY City, Indl. Dev. Agcy. Civic Fac. VRDN (CASA), | | | |
| 0.17s, 3/1/20 | A–1 | 1,155,000 | 1,155,000 |
|
| NY City, Indl. Dev. Agcy. Special Fac. FRN | | | |
| (Terminal One Group Assn.), 5 1/2s, 1/1/17 | A3 | 4,500,000 | 4,961,295 |
|
| NY City, Indl. Dev. Agcy. Special Fac. Rev. Bonds | | | |
| (British Airways PLC), 5 1/4s, 12/1/32 | BB | 2,050,000 | 2,052,747 |
|
| NY City, Muni. Wtr. & Swr. Fin. Auth. Rev. Bonds | | | |
| Ser. EE, 5 1/4s, 6/15/40 | AA+ | 10,000,000 | 11,845,100 |
| (Second Generation Resolution), Ser. GG-1, | | | |
| 5 1/4s, 6/15/32 | AA+ | 6,000,000 | 7,147,260 |
| Ser. GG, 5s, 6/15/43 | AA+ | 9,760,000 | 11,362,690 |
| Ser. D, 5s, 6/15/37 | AAA | 6,000,000 | 6,573,840 |
| Ser. AA, 5s, 6/15/34 | AA+ | 5,000,000 | 5,920,900 |
|
| NY City, Transitional Fin. Auth. Rev. Bonds | | | |
| Ser. E-1, 5s, 2/1/42 | AAA | 7,500,000 | 8,910,825 |
| (Future Tax), Ser. D-1, 5s, 11/1/32 | AAA | 5,000,000 | 6,103,950 |
| Ser. E-1, 5s, 2/1/26 | AAA | 2,000,000 | 2,501,540 |
|
| |
| New York Tax Exempt Income Fund 27 |
| | | |
| MUNICIPAL BONDS AND NOTES (98.9%)* cont. | Rating** | Principal amount | Value |
|
| New York cont. | | | |
| NY City, Transitional Fin. Auth. Bldg. Aid Rev. Bonds | | | |
| Ser. S-1, 5s, 7/15/37 | Aa3 | $7,500,000 | $8,840,175 |
| Ser. S-1, 5s, 7/15/33 | Aa3 | 7,020,000 | 8,444,498 |
| Ser. S-1, FGIC, NATL, 5s, 7/15/31 | Aa3 | 10,500,000 | 11,807,775 |
| Ser. S-5, 5s, 1/15/30 | Aa3 | 3,375,000 | 3,937,714 |
|
| NY City, Trust for Cultural Resources Rev. Bonds | | | |
| (Whitney Museum of American Art), 5s, 7/1/31 | A | 2,000,000 | 2,294,100 |
|
| NY Cntys., Tobacco Trust II Rev. Bonds | | | |
| (Tobacco Settlement), 5 3/4s, 6/1/43 | Baa2 | 7,000,000 | 6,198,010 |
|
| NY Cntys., Tobacco Trust III Rev. Bonds | | | |
| (Tobacco Settlement), 6s, 6/1/43 | A3 | 1,300,000 | 1,305,499 |
|
| NY Cntys., Tobacco Trust IV Rev. Bonds, Ser. A, | | | |
| 5s, 6/1/38 | BB | 7,250,000 | 5,798,043 |
|
| NY Liberty Dev. Corp. Rev. Bonds (Bank of America | | | |
| Tower), Ser. CL1, 5 5/8s, 1/15/46 | AA+ | 2,000,000 | 2,332,500 |
|
| NY State Dorm. Auth. Rev. Bonds | | | |
| (NYU Hosp. Ctr.), Ser. A, 6s, 7/1/40 | A3 | 1,500,000 | 1,848,465 |
| (State U. Edl. Fac.), Ser. A, AGM, 5 7/8s, 5/15/17 | Aa3 | 8,950,000 | 10,565,386 |
| (Brooklyn Law School), 5 3/4s, 7/1/33 | Baa1 | 1,000,000 | 1,135,450 |
| (Winthrop Nassau U.), 5 3/4s, 7/1/28 | | | |
| (Prerefunded 7/1/13) | Baa1 | 3,250,000 | 3,351,953 |
| (Schools PG — Issue 2), Ser. E, AMBAC, | | | |
| 5 3/4s, 7/1/19 | A/P | 1,095,000 | 1,099,468 |
| (City U.), Ser. A, 5 3/4s, 7/1/18 | Aa3 | 10,000,000 | 11,618,700 |
| (City U.), Ser. A, 5 5/8s, 7/1/16 | Aa3 | 9,930,000 | 11,151,390 |
| (Skidmore College), Ser. A, 5 1/2s, 7/1/41 | A1 | 3,000,000 | 3,523,470 |
| (NYU), Ser. 1, AMBAC, 5 1/2s, 7/1/40 | Aa3 | 8,500,000 | 12,163,755 |
| (North Shore Long Island Jewish Group), Ser. A, | | | |
| 5 1/2s, 5/1/37 | A3 | 11,500,000 | 13,323,555 |
| (Fordham U.), Ser. A, 5 1/2s, 7/1/36 | A2 | 1,800,000 | 2,149,884 |
| (North Shore Long Island Jewish Group), Ser. E, | | | |
| 5 1/2s, 5/1/33 | A3 | 2,000,000 | 2,322,220 |
| (Winthrop-U. Hosp. Assn.), Ser. A, 5 1/2s, 7/1/32 | | | |
| (Prerefunded 7/1/13) | Baa1 | 1,600,000 | 1,647,904 |
| (NYU), Ser. 1, AMBAC, 5 1/2s, 7/1/31 | Aa3 | 3,500,000 | 4,836,265 |
| (Winthrop Nassau U.), 5 1/2s, 7/1/23 | | | |
| (Prerefunded 7/1/13) | Baa1 | 2,750,000 | 2,832,335 |
| (St. Joseph College), 5 1/4s, 7/1/35 | Baa1 | 2,000,000 | 2,249,400 |
| (Manhattan Marymount), 5 1/4s, 7/1/29 | Baa2 | 2,000,000 | 2,192,780 |
| (Rochester Inst. of Tech.), Ser. A, AMBAC, | | | |
| 5 1/4s, 7/1/19 | A1 | 4,300,000 | 5,415,979 |
| (Highland Hosp. Rochester), 5.2s, 7/1/32 | A2 | 1,000,000 | 1,153,130 |
| (Mount Sinai School of Medicine), 5 1/8s, 7/1/39 | A3 | 15,000,000 | 16,670,700 |
| (Siena College), 5 1/8s, 7/1/39 | A3 | 6,000,000 | 6,657,060 |
| (School Dist. Fin. Program), Ser. C, AGO, | | | |
| 5 1/8s, 10/1/36 | Aa3 | 3,380,000 | 3,804,460 |
| (St. Francis College), 5s, 10/1/40 | A– | 3,000,000 | 3,273,270 |
| (Yeshiva U.), 5s, 9/1/38 | A+ | 2,500,000 | 2,798,050 |
| (Mental Hlth.), Ser. E, NATL, 5s, 2/15/35 | Aa3 | 2,510,000 | 2,701,714 |
| (L I Jewish), Ser. A, 5s, 11/1/34 | A3 | 1,800,000 | 1,941,336 |
| (Memorial Sloan-Kettering Ctr.), Ser. 1, 5s, | | | |
| 7/1/34 (Prerefunded 7/1/13) | AA– | 5,000,000 | 5,136,900 |
|
| 28 New York Tax Exempt Income Fund |
| | | |
| MUNICIPAL BONDS AND NOTES (98.9%)* cont. | Rating** | Principal amount | Value |
|
| New York cont. | | | |
| NY State Dorm. Auth. Rev. Bonds | | | |
| (Rochester U.), Ser. A, 5s, 7/1/34 | Aa3 | $6,000,000 | $6,385,080 |
| (St. Francis College), 5s, 10/1/32 | A– | 2,360,000 | 2,695,663 |
| (School Dist. Fin. Program), Ser. C, AGO, | | | |
| 5s, 10/1/31 | Aa3 | 2,000,000 | 2,279,440 |
| (Yeshiva U.), AMBAC, 5s, 7/1/30 | A2 | 190,000 | 190,230 |
| (Mental Hlth. Svcs. Fac. Impt.), Ser. B, AMBAC, | | | |
| 5s, 2/15/30 | AA– | 9,665,000 | 10,418,483 |
| (Montefiore Hosp.), FGIC, FHA Insd., NATL, | | | |
| 5s, 8/1/29 | BBB | 9,510,000 | 10,034,381 |
| (NYU), Ser. A, FGIC, NATL, 5s, 7/1/29 | Aa3 | 6,705,000 | 7,101,668 |
| (Yeshiva U.), AMBAC, 5s, 7/1/26 | A2 | 170,000 | 170,206 |
| Ser. A, NATL, 5s, 10/1/25 | Aa3 | 750,000 | 823,380 |
| (Cornell U.), Ser. A, 5s, 7/1/22 | Aa1 | 6,395,000 | 7,251,802 |
| (NY U. Hosp. Ctr.), Ser. A, 5s, 7/1/20 | A3 | 4,000,000 | 4,517,920 |
|
| NY State Dorm. Auth. Non-State Supported Debt | | | |
| Rev. Bonds | | | |
| (Orange Regl. Med. Ctr.), 6 1/4s, 12/1/37 | Ba1 | 11,000,000 | 12,263,130 |
| (NYU Hosp. Ctr.), Ser. B, 5 1/4s, 7/1/24 | A3 | 3,520,000 | 3,901,181 |
| (Teachers College), 5s, 7/1/42 | A1 | 6,475,000 | 7,504,525 |
| (Memorial Sloan-Kettering Cancer Ctr.), 5s, 7/1/41 | Aa3 | 2,000,000 | 2,324,220 |
| (Memorial Sloan-Kettering Cancer Ctr.), 5s, 7/1/36 | Aa3 | 1,125,000 | 1,305,428 |
| (Memorial Sloan-Kettering Ctr.), Ser. A1, 5s, 7/1/36 | Aa3 | 5,690,000 | 6,409,785 |
| (Teachers College), 5s, 7/1/34 | A1 | 2,750,000 | 3,259,933 |
| (Memorial Sloan-Kettering Cancer Ctr.), 5s, 7/1/32 | Aa3 | 1,500,000 | 1,795,950 |
| (NY U.), Ser. A, AMBAC, 5s, 7/1/32 | Aa3 | 3,000,000 | 3,363,420 |
| (U. of Rochester), Ser. A-1, 5s, 7/1/32 | Aa3 | 8,000,000 | 8,934,000 |
| (Teachers College), Ser. A, 5s, 7/1/31 | A1 | 1,750,000 | 2,097,288 |
| (The New School), 5s, 7/1/31 | A3 | 5,000,000 | 5,714,250 |
| (Brooklyn Law School), Ser. A, 5s, 7/1/29 | Baa1 | 1,000,000 | 1,146,490 |
| (NYU), Ser. B, 5s, 7/1/29 | Aa3 | 6,530,000 | 7,458,044 |
| (St. John’s U.), Ser. A, 5s, 7/1/28 | A3 | 500,000 | 605,345 |
| (Brooklyn Law School), Ser. A, 5s, 7/1/27 | Baa1 | 1,000,000 | 1,163,510 |
| (St. John’s U.), Ser. A, 5s, 7/1/27 | A3 | 2,250,000 | 2,736,878 |
| (U. of Rochester), Ser. A-1, 5s, 7/1/27 | Aa3 | 1,900,000 | 2,177,932 |
| (Brooklyn Law School), Ser. A, 5s, 7/1/26 | Baa1 | 1,000,000 | 1,172,590 |
| (Columbia U.), Ser. C, 5s, 7/1/26 | Aaa | 6,980,000 | 8,228,164 |
| (NYU Hosp. Ctr.), Ser. A, 5s, 7/1/26 | A3 | 1,000,000 | 1,110,100 |
| (Teachers College), Ser. A, 5s, 7/1/26 | A1 | 1,000,000 | 1,222,120 |
| (St. Johns U.), Ser. A, NATL, 5s, 7/1/23 | A3 | 3,935,000 | 4,442,772 |
| (NYU Hosp. Ctr.), Ser. A, 5s, 7/1/22 | A3 | 1,000,000 | 1,142,200 |
|
| NY State Dorm. Auth. Non-Supported Debt Rev. Bonds | | | |
| (Rochester Inst. of Tech.), 5s, 7/1/42 Δ | A1 | 1,500,000 | 1,772,625 |
| (Rochester Inst. of Tech.), 5s, 7/1/38 Δ | A1 | 1,000,000 | 1,185,430 |
| (Culinary Inst. of America), 5s, 7/1/34 | Baa2 | 350,000 | 396,032 |
| (Rochester Inst. of Tech.), 5s, 7/1/34 Δ | A1 | 500,000 | 602,040 |
|
| NY State Dorm. Auth. Personal Income Tax Rev. Bonds | | | |
| (Ed.), Ser. B, 5 3/4s, 3/15/36 | AAA | 5,000,000 | 6,227,750 |
| Ser. A, 5s, 3/15/28 | AAA | 10,000,000 | 12,250,400 |
| Ser. A, 5s, 3/15/28 | AAA | 3,325,000 | 3,967,357 |
|
|
| New York Tax Exempt Income Fund 29 |
| | | |
| MUNICIPAL BONDS AND NOTES (98.9%)* cont. | Rating** | Principal amount | Value |
|
| New York cont. | | | |
| NY State Dorm. Auth. Personal Income Tax Gen. | | | |
| Purpose Rev. Bonds, Ser. D | | | |
| 5s, 2/15/40 | AAA | $10,000,000 | $11,816,600 |
| 5s, 2/15/37 | AAA | 5,570,000 | 6,621,672 |
|
| NY State Dorm. Auth. State Supported Debt | | | |
| Rev. Bonds | | | |
| (City U.), Ser. B, 5s, 7/1/26 | AA– | 5,000,000 | 5,761,500 |
| (State U. Dorm Fac.), Ser. E, 5s, 7/1/23 | Aa2 | 3,000,000 | 3,484,320 |
|
| NY State Dorm. Auth. Supported Debt Rev. Bonds | | | |
| (State U. of NY), Ser. A, 5s, 7/1/37 | Aa2 | 7,250,000 | 8,601,110 |
|
| NY State Energy Research & Dev. Auth. Gas Fac. | | | |
| Rev. Bonds (Brooklyn Union Gas), 6.952s, 7/1/26 | A3 | 12,400,000 | 12,437,944 |
|
| NY State Env. Fac. Corp. Rev. Bonds | | | |
| (Clean Wtr. and Drinking), Ser. A, 5s, 6/15/34 | Aaa | 10,000,000 | 12,010,200 |
| (State Clean Wtr. & Drinking Revolving Fund), | | | |
| Ser. A, 5s, 6/15/29 | Aaa | 2,500,000 | 2,974,200 |
| Ser. A, 5s, 6/15/28 | Aaa | 3,095,000 | 3,924,460 |
| (State Clean Wtr. & Drinking Revolving Fund), | | | |
| Ser. C, 5s, 10/15/26 | Aaa | 5,000,000 | 5,696,400 |
| (United Wtr. New Rochelle), Ser. A, 4 7/8s, 9/1/40 | A– | 5,000,000 | 5,480,050 |
|
| NY State Env. Fac. Corp. State Clean Wtr. & Drinking | | | |
| Rev. Bonds | | | |
| Ser. C, 5s, 10/15/35 | Aaa | 5,000,000 | 5,600,050 |
| (NYC Muni. Wtr. Fin.), 5s, 6/15/29 | Aaa | 13,590,000 | 14,435,706 |
|
| NY State Hsg. Fin. Agcy. Rev. Bonds (Affordable Hsg.) | | | |
| Ser. A, 5s, 11/1/42 | Aa2 | 4,660,000 | 4,947,056 |
| Ser. B, 4.85s, 11/1/41 | Aa2 | 2,600,000 | 2,819,960 |
|
| NY State Liberty Dev. Corp. Rev. Bonds | | | |
| (4 World Trade Ctr., LLC), 5s, 11/15/44 | A+ | 1,500,000 | 1,731,255 |
| (7 World Trade Ctr.), Class 3, 5s, 3/15/44 | Baa2 | 1,000,000 | 1,107,880 |
| (7 World Trade Ctr.), Ser. 2, 5s, 9/15/43 | A2 | 4,000,000 | 4,601,560 |
| (1 WTC Port Auth. Construction), 5s, 12/15/41 | Aa3 | 10,000,000 | 11,692,000 |
| (4 World Trade Ctr.), 5s, 11/15/31 | A+ | 2,500,000 | 2,956,350 |
|
| NY State Pwr. Auth. Rev. Bonds, Ser. A, 5s, 11/15/38 | Aa2 | 2,000,000 | 2,375,580 |
|
| NY State Thruway Auth. Rev. Bonds | | | |
| Ser. F, AMBAC, 5s, 1/1/30 | A1 | 11,740,000 | 12,630,127 |
| (Second Generation Hwy. & Bridge Trust Fund), | | | |
| Ser. B, 5s, 4/1/28 | AA | 3,000,000 | 3,454,830 |
| Ser. H, FGIC, NATL, 5s, 1/1/28 | A1 | 1,235,000 | 1,415,409 |
| (Second Generation Hwy. & Bridge Trust Fund), | | | |
| Ser. B, 5s, 4/1/27 | AA | 4,000,000 | 4,620,640 |
| (Second Generation Hwy. & Bridge Trust Fund), | | | |
| Ser. A, 5s, 4/1/25 | AA | 4,000,000 | 4,651,160 |
| (Gen. Hwy. & Bridge Trust Fund), Ser. A, NATL, | | | |
| 5s, 4/1/22 | Aa2 | 2,000,000 | 2,122,300 |
|
| NY State Urban Dev. Corp. Rev. Bonds | | | |
| Ser. D, 5 5/8s, 1/1/28 | AA– | 9,500,000 | 11,186,155 |
| (Clarkson Ctr.), 5 1/2s, 1/1/20 | Aa3 | 1,685,000 | 2,022,320 |
| (Clarkson Ctr.), 5 1/2s, 1/1/15 | Aa3 | 2,110,000 | 2,172,076 |
| (Syracuse U.), 5 1/2s, 1/1/15 | Aa3 | 1,265,000 | 1,329,743 |
| Ser. B-1, 5s, 3/15/36 | AAA | 9,000,000 | 10,749,330 |
|
| 30 New York Tax Exempt Income Fund |
| | | |
| MUNICIPAL BONDS AND NOTES (98.9%)* cont. | Rating** | Principal amount | Value |
|
| New York cont. | | | |
| NY State Urban Dev. Corp. Rev. Bonds | | | |
| Ser. A-1, FGIC, NATL, 5s, 3/15/29 | | | |
| (Prerefunded 3/15/14) | AAA | $6,565,000 | $6,964,283 |
| Ser. A-1, 5s, 12/15/28 | AAA | 5,000,000 | 6,098,400 |
| Ser. B, 5s, 1/1/27 | AA– | 7,000,000 | 8,122,030 |
|
| Oneida Cnty., Indl. Dev. Agcy. Rev. Bonds | | | |
| (St. Elizabeth Med.), Ser. A, 5 7/8s, 12/1/29 | BB+/P | 1,000,000 | 1,000,750 |
|
| Onodaga Cnty., Trust For Cultural Resources Rev. | | | |
| Bonds (Syracuse U.), 5s, 12/1/36 | Aa3 | 2,000,000 | 2,351,000 |
|
| Onondaga Civic Dev. Corp. Rev. Bonds | | | |
| (Le Moyne College), 5 3/8s, 7/1/40 | Baa2 | 3,900,000 | 4,322,448 |
| (St. Joseph’s Hosp. Hlth. Ctr.), 5s, 7/1/42 | Ba1 | 1,000,000 | 1,043,250 |
| (Le Moyne College), 5s, 7/1/32 | Baa2 | 1,635,000 | 1,837,233 |
|
| Orange Cnty., Indl. Dev. Agcy. Rev. Bonds (Arden | | | |
| Hill Care Ctr. Newburgh), Ser. C | | | |
| 7s, 8/1/31 | B/P | 3,200,000 | 3,200,800 |
| 7s, 8/1/21 | B/P | 2,130,000 | 2,136,475 |
|
| Port Auth. NY & NJ Rev. Bonds | | | |
| Ser. 124, 5s, 8/1/31 | Aa3 | 1,000,000 | 1,002,350 |
| FGIC, NATL, 4 3/4s, 10/15/28 | Aa3 | 7,000,000 | 7,765,940 |
|
| Port Auth. NY & NJ Special Oblig. Rev. Bonds | | | |
| (Kennedy Intl. Arpt. — 5th Installment), | | | |
| 6 3/4s, 10/1/19 | BB+/P | 2,785,000 | 2,785,418 |
| (JFK Intl. Air Term.), 6s, 12/1/42 | Baa3 | 3,500,000 | 4,148,060 |
|
| Port Auth. of NY & NJ Rev. Bonds, 5s, 7/15/30 | Aa3 | 3,000,000 | 3,667,830 |
|
| Rensselaer, City School Dist. COP, SGI | | | |
| 5s, 6/1/21 | A–/P | 2,010,000 | 2,077,496 |
| 5s, 6/1/20 | A–/P | 1,150,000 | 1,192,792 |
| 5s, 6/1/19 | A–/P | 1,345,000 | 1,404,422 |
| 5s, 6/1/18 | A–/P | 1,180,000 | 1,238,445 |
|
| Sales Tax Asset Receivable Corp. Rev. Bonds, | | | |
| Ser. A, NATL | | | |
| 5s, 10/15/26 | AAA | 7,000,000 | 7,559,580 |
| 5s, 10/15/25 | AAA | 16,425,000 | 17,744,420 |
|
| Saratoga Cnty., Indl. Dev. Agcy. Civic Fac. Rev. Bonds | | | |
| (Saratoga Hosp.), Ser. B, 5 1/4s, 12/1/32 | A– | 1,500,000 | 1,618,485 |
| (The Saratoga Hosp.), Ser. A, Radian Insd., | | | |
| 5 1/8s, 12/1/33 | A– | 3,090,000 | 3,136,566 |
| (Saratoga Hosp.), Ser. B, 5 1/8s, 12/1/27 | A– | 1,000,000 | 1,093,420 |
|
| Schenectady Cnty., Cap. Resource Corp. Rev. Bonds | | | |
| (Union College), 5s, 7/1/32 | A1 | 3,430,000 | 4,091,476 |
|
| Seneca Cnty., Indl. Dev. Agcy. Civic Fac. Rev. | | | |
| Bonds (NY Chiropractic College), 5s, 10/1/27 | BBB | 1,995,000 | 2,153,283 |
|
| Seneca Cnty., Indl. Dev. Agcy. Solid Waste Disp. | | | |
| 144A Mandatory Put Bonds (10/1/13) (IESI Corp.), | | | |
| 6 5/8s, 10/1/35 | BB– | 2,000,000 | 2,017,900 |
|
| St. Lawrence Cnty., Indl. Agcy. Rev. Bonds | | | |
| (Clarkson U.), Ser. A, 5 1/4s, 9/1/33 | A3 | 1,050,000 | 1,247,747 |
|
| St. Lawrence Cnty., Indl. Dev. Agcy. Rev. Bonds | | | |
| (Clarkson U.), Ser. A, 5s, 9/1/41 | A3 | 1,750,000 | 1,991,150 |
|
| |
| New York Tax Exempt Income Fund 31 |
| | | |
| MUNICIPAL BONDS AND NOTES (98.9%)* cont. | Rating** | Principal amount | Value |
|
| New York cont. | | | |
| Suffolk Cnty., Econ. Dev. Corp. Rev. Bonds | | | |
| (Peconic Landing Southold), 6s, 12/1/40 | BBB–/F | $1,225,000 | $1,387,545 |
|
| Suffolk Cnty., Indl. Dev. Agcy. Rev. Bonds | | | |
| (Nissequogue Cogen. Partners Fac.), 5 1/2s, 1/1/23 | BBB–/P | 2,000,000 | 2,001,000 |
|
| Suffolk Cnty., Indl. Dev. Agcy. Civic Fac. Rev. Bonds | | | |
| (Southampton Hosp. Assn.), Ser. B, 7 5/8s, 1/1/30 | B–/P | 440,000 | 440,656 |
| (Southampton Hosp. Assn.), Ser. A, 7 1/4s, 1/1/30 | B–/P | 2,050,000 | 2,052,501 |
| (Inst. of Tech.), 5s, 3/1/26 | BBB+ | 3,300,000 | 3,427,908 |
|
| Suffolk Cnty., Indl. Dev. Agcy. Cont. Care Retirement | | | |
| Rev. Bonds (Jefferson’s Ferry) | | | |
| 5s, 11/1/15 | BBB– | 975,000 | 1,066,114 |
| 4 5/8s, 11/1/16 | BBB– | 1,000,000 | 1,098,130 |
|
| Syracuse, Indl. Dev. Agcy. Rev. Bonds | | | |
| (1st Mtge. — Jewish Home), Ser. A | | | |
| 7 3/8s, 3/1/31 | B+/P | 2,800,000 | 2,800,840 |
| 7 3/8s, 3/1/21 | B+/P | 745,000 | 746,103 |
|
| Syracuse, Indl. Dev. Agcy. Civic Fac. VRDN | | | |
| (Syracuse U.) | | | |
| Ser. A-2, 0.16s, 12/1/37 | VMIG1 | 5,960,000 | 5,960,000 |
| Ser. A-1, 0.16s, 7/1/37 | VMIG1 | 4,730,000 | 4,730,000 |
|
| Tobacco Settlement Rev. Bonds, Ser. 1, 5s, 6/1/34 | B | 3,500,000 | 3,004,960 |
|
| Tobacco Settlement Fin. Auth. Rev. Bonds, | | | |
| Ser. A-1, 5 1/2s, 6/1/18 | Aa3 | 70,000 | 70,272 |
|
| Tompkins Cnty., Dev. Corp. Rev. Bonds | | | |
| (Ithaca College), AGM, 5 3/8s, 7/1/41 | Aa3 | 1,000,000 | 1,156,710 |
|
| Triborough, Bridge & Tunnel Auth. Rev. Bonds | | | |
| Ser. A, 5s, 11/15/36 | Aa3 | 1,000,000 | 1,197,470 |
| Ser. C, 5s, 11/15/29 | Aa3 | 5,000,000 | 5,891,950 |
| AMBAC, 5s, 11/15/28 | A1 | 13,000,000 | 13,472,420 |
| Ser. A, 5s, 11/15/23 (Prerefunded 11/15/16) | Aa3 | 1,000,000 | 1,175,970 |
| (Gen. Cabs), Ser. B, zero %, 11/15/32 | Aa3 | 3,900,000 | 2,078,661 |
|
| Troy, Cap. Res. Corp. Rev. Bonds | | | |
| (Rensselaer Polytechnic), Ser. A, 5 1/8s, 9/1/40 | A3 | 7,500,000 | 8,482,425 |
|
| Westchester Cnty., Hlth. Care Corp. Rev. Bonds, | | | |
| Ser. C-2, 6 1/8s, 11/1/37 | A3 | 3,385,000 | 4,019,620 |
|
| Westchester Cnty., Indl Dev. Agcy. Civic Fac. | | | |
| Rev. Bonds (Guiding Eyes for the Blind), 5 3/8s, | | | |
| 8/1/24 | BBB+ | 965,000 | 1,011,397 |
|
| Westchester, Tobacco Asset Securitization Corp. | | | |
| Rev. Bonds, 5 1/8s, 6/1/38 | BBB | 5,060,000 | 4,633,341 |
|
| Yonkers, Indl. Dev. Agcy. Civic Fac. Rev. Bonds | | | |
| (St. John’s Riverside Hosp.), Ser. A, 7 1/8s, 7/1/31 | B+ | 2,000,000 | 2,000,880 |
| (Sarah Lawrence College), Ser. A, 6s, 6/1/41 | BBB | 2,500,000 | 2,875,625 |
|
| | | | 1,160,951,072 |
| Puerto Rico (7.6%) | | | |
| Children’s Trust Fund Tobacco Settlement Rev. | | | |
| Bonds, 5 1/2s, 5/15/39 | Baa3 | 3,750,000 | 3,755,813 |
|
| Cmnwlth. of PR, G.O. Bonds | | | |
| Ser. C, 6 1/2s, 7/1/40 | Baa1 | 4,750,000 | 5,383,175 |
| Ser. A, 5 1/4s, 7/1/34 | Baa1 | 1,000,000 | 1,031,480 |
|
|
| 32 New York Tax Exempt Income Fund |
| | | |
| MUNICIPAL BONDS AND NOTES (98.9%)* cont. | Rating** | Principal amount | Value |
|
| Puerto Rico cont. | | | |
| Cmnwlth. of PR, Aqueduct & Swr. Auth. Rev. Bonds, | | | |
| Ser. A | | | |
| 6s, 7/1/44 | Baa2 | $13,500,000 | $14,269,770 |
| 6s, 7/1/38 | Baa2 | 3,750,000 | 3,999,638 |
|
| Cmnwlth. of PR, Elec. Pwr. Auth. Rev. Bonds | | | |
| Ser. XX, 5 1/4s, 7/1/40 | Baa1 | 3,000,000 | 3,104,010 |
| Ser. A, 5s, 7/1/42 | Baa1 | 5,000,000 | 5,106,650 |
|
| Cmnwlth. of PR, Hwy. & Trans. Auth. Rev. Bonds | | | |
| Ser. AA, NATL, 5 1/2s, 7/1/20 | A3 | 365,000 | 407,523 |
| Ser. AA, NATL, 5 1/2s, 7/1/20 (Escrowed | | | |
| to maturity) | A3 | 635,000 | 844,518 |
| Ser. AA, NATL, 5 1/2s, 7/1/19 | A3 | 540,000 | 608,305 |
| Ser. AA, NATL, 5 1/2s, 7/1/19 (Escrowed | | | |
| to maturity) | A3 | 2,460,000 | 3,195,146 |
| Ser. AA-2, FRN 5.3s, 7/1/35 | A3 | 1,750,000 | 1,850,433 |
| Ser. AA, 5s, 7/1/35 | BBB+ | 2,105,000 | 2,109,631 |
|
| Cmnwlth. of PR, Indl. Tourist Edl. Med. & Env. | | | |
| Control Facs. Rev. Bonds (Cogen. Fac.-AES), | | | |
| 6 5/8s, 6/1/26 | Ba1 | 6,250,000 | 6,254,438 |
|
| Cmnwlth. of PR, Infrastructure Fin. Auth. Rev. Bonds, | | | |
| Ser. C, AMBAC | | | |
| 5 1/2s, 7/1/25 | Baa1 | 2,225,000 | 2,441,270 |
| 5 1/2s, 7/1/23 | Baa1 | 3,000,000 | 3,321,990 |
|
| Cmnwlth. of PR, Pub. Bldg. Auth. Rev. Bonds | | | |
| (Govt. Fac.), Ser. M, Cmnwlth. of PR Gtd., | | | |
| 6 1/4s, 7/1/23 | Baa1 | 3,425,000 | 4,009,750 |
| (Govt. Fac.), Ser. P, Cmnwlth. of PR Gtd., | | | |
| 6 1/8s, 7/1/23 | Baa1 | 6,500,000 | 7,460,960 |
| Ser. Q, Cmnwlth. of PR Gtd., 5 5/8s, 7/1/39 | Baa1 | 3,000,000 | 3,139,710 |
| (Govt. Fac.), Ser. N, Cmnwlth. of PR Gtd., | | | |
| 5 1/2s, 7/1/20 | Baa1 | 2,250,000 | 2,416,905 |
|
| Cmnwlth. of PR, Sales Tax Fin. Corp. Rev. Bonds | | | |
| Ser. A, 6s, 8/1/42 | A+ | 8,000,000 | 9,071,200 |
| Ser. C, 5 1/4s, 8/1/41 | A+ | 4,500,000 | 4,849,110 |
| Ser. A, AMBAC, zero %, 8/1/47 | Aa3 | 20,000,000 | 2,979,600 |
| Ser. A, NATL, zero %, 8/1/43 | Aa3 | 8,000,000 | 1,538,880 |
| Ser. A, zero %, 8/1/31 | A+ | 8,500,000 | 3,220,820 |
| Ser. A, zero %, 8/1/30 | A+ | 8,500,000 | 3,457,630 |
|
| | | | 99,828,355 |
| Texas (0.8%) | | | |
| U. of Houston Rev. Bonds, Ser. A, 5s, 2/15/31 | Aa2 | 8,050,000 | 9,591,736 |
|
| | | | 9,591,736 |
| Virgin Islands (0.7%) | | | |
| VI Pub. Fin. Auth. Rev. Bonds | | | |
| Ser. A, 6s, 10/1/39 | Baa3 | 3,000,000 | 3,424,140 |
| Ser. A-1, 5s, 10/1/39 | Baa2 | 3,325,000 | 3,533,877 |
| Ser. A, 5s, 10/1/25 | Baa2 | 2,000,000 | 2,272,471 |
|
| | | | 9,230,488 |
| | | | |
| Total municipal bonds and notes (cost $1,176,281,520) | | | $1,298,457,330 |
| |
| New York Tax Exempt Income Fund 33 |
| | |
| UNITIZED TRUST (0.1%)* | Units | Value |
|
| CMS Liquidating Trust 144A † | 600 | $1,920,000 |
|
| Total unitized trust (cost $1,816,443) | | $1,920,000 |
| |
|
| TOTAL INVESTMENTS | | |
|
| Total investments (cost $1,178,097,963) | | $1,300,377,330 |
Unless noted otherwise, the notes to the fund’s portfolio are for the close of the fund’s reporting period, which ran from December 1, 2011 through November 30, 2012 (the reporting period). Within the following notes to the portfolio, references to “ASC 820” represent Accounting Standards Codification ASC 820 Fair Value Measurements and Disclosures.
* Percentages indicated are based on net assets of $1,313,387,219.
** The Moody’s, Standard & Poor’s or Fitch ratings indicated are believed to be the most recent ratings available at the close of the reporting period for the securities listed. Ratings are generally ascribed to securities at the time of issuance. While the agencies may from time to time revise such ratings, they undertake no obligation to do so, and the ratings do not necessarily represent what the agencies would ascribe to these securities at the close of the reporting period. Securities rated by Putnam are indicated by “/P.” Securities rated by Fitch are indicated by “/F.” The rating of an insured security represents what is believed to be the most recent rating of the insurer’s claims-paying ability available at the close of the reporting period, if higher than the rating of the direct issuer of the bond, and does not reflect any subsequent changes. Ratings are not covered by the Report of Independent Registered Public Accounting Firm. Security ratings are defined in the Statement of Additional Information.
† Non-income-producing security.
Δ Forward commitment, in part or in entirety (Note 1).
144A after the name of an issuer represents securities exempt from registration under Rule 144A under the Securities Act of 1933, as amended. These securities may be resold in transactions exempt from registration, normally to qualified institutional buyers.
The rates shown on Mandatory Put Bonds are the current interest rates at the close of the reporting period.
The dates shown parenthetically on Mandatory Put Bonds represent the next mandatory put dates.
The dates shown parenthetically on prerefunded bonds represent the next prerefunding dates.
The dates shown on debt obligations are the original maturity dates.
The fund had the following sector concentrations greater than 10% at the close of the reporting period (as a percentage of net assets):
| | | |
| Education | 17.2% | | |
| Tax bonds | 14.9 | | |
| Utilities | 13.5 | | |
| State government | 12.4 | | |
| Health care | 10.6 | | |
ASC 820 establishes a three-level hierarchy for disclosure of fair value measurements. The valuation hierarchy is based upon the transparency of inputs to the valuation of the fund’s investments. The three levels are defined as follows:
Level 1: Valuations based on quoted prices for identical securities in active markets.
Level 2: Valuations based on quoted prices in markets that are not active or for which all significant inputs are observable, either directly or indirectly.
Level 3: Valuations based on inputs that are unobservable and significant to the fair value measurement.
The following is a summary of the inputs used to value the fund’s net assets as of the close of the reporting period:
| | | |
| | | Valuation inputs | |
|
| Investments in securities: | Level 1 | Level 2 | Level 3 |
|
| Unitized trust | $— | $1,920,000 | $— |
|
| Municipal bonds and notes | — | 1,298,457,330 | — |
|
| Totals by level | $— | $1,300,377,330 | $— |
The accompanying notes are an integral part of these financial statements.
|
| 34 New York Tax Exempt Income Fund |
Statement of assets and liabilities 11/30/12
| |
| ASSETS | |
|
| Investment in securities, at value (Note 1): | |
| Unaffiliated issuers (identified cost $1,178,097,963) | $1,300,377,330 |
|
| Cash | 157,173 |
|
| Interest and other receivables | 17,830,220 |
|
| Receivable for shares of the fund sold | 2,704,376 |
|
| Total assets | 1,321,069,099 |
| |
| LIABILITIES | |
|
| Payable for purchases of delayed delivery securities (Note 1) | 3,527,390 |
|
| Payable for shares of the fund repurchased | 1,760,231 |
|
| Payable for compensation of Manager (Note 2) | 472,592 |
|
| Payable for custodian fees (Note 2) | 4,271 |
|
| Payable for investor servicing fees (Note 2) | 95,139 |
|
| Payable for Trustee compensation and expenses (Note 2) | 309,097 |
|
| Payable for administrative services (Note 2) | 2,539 |
|
| Payable for distribution fees (Note 2) | 502,806 |
|
| Distributions payable to shareholders | 875,691 |
|
| Other accrued expenses | 132,124 |
|
| Total liabilities | 7,681,880 |
| | |
| Net assets | $1,313,387,219 |
|
| |
| REPRESENTED BY | |
|
| Paid-in capital (Unlimited shares authorized) (Notes 1 and 4) | $1,197,691,187 |
|
| Undistributed net investment income (Note 1) | 1,338,455 |
|
| Accumulated net realized loss on investments (Note 1) | (7,921,790) |
|
| Net unrealized appreciation of investments | 122,279,367 |
|
| Total — Representing net assets applicable to capital shares outstanding | $1,313,387,219 |
| |
| COMPUTATION OF NET ASSET VALUE AND OFFERING PRICE | |
|
| Net asset value and redemption price per class A share | |
| ($1,206,508,713 divided by 132,339,368 shares) | $9.12 |
|
| Offering price per class A share (100/96.00 of $9.12)* | $9.50 |
|
| Net asset value and offering price per class B share ($15,437,728 divided by 1,696,532 shares)** | $9.10 |
|
| Net asset value and offering price per class C share ($70,435,131 divided by 7,728,468 shares)** | $9.11 |
|
| Net asset value and redemption price per class M share ($1,658,828 divided by 181,833 shares) | $9.12 |
|
| Offering price per class M share (100/96.75 of $9.12)† | $9.43 |
|
| Net asset value, offering price and redemption price per class Y share | |
| ($19,346,819 divided by 2,121,687 shares) | $9.12 |
|
* On single retail sales of less than $100,000. On sales of $100,000 or more the offering price is reduced.
** Redemption price per share is equal to net asset value less any applicable contingent deferred sales charge.
† On single retail sales of less than $50,000. On sales of $50,000 or more the offering price is reduced.
The accompanying notes are an integral part of these financial statements.
| |
| New York Tax Exempt Income Fund 35 |
Statement of operations Year ended 11/30/12
| |
| INTEREST INCOME | $56,011,243 |
|
| |
| EXPENSES | |
|
| Compensation of Manager (Note 2) | 5,479,662 |
|
| Investor servicing fees (Note 2) | 559,525 |
|
| Custodian fees (Note 2) | 15,237 |
|
| Trustee compensation and expenses (Note 2) | 113,552 |
|
| Distribution fees (Note 2) | 3,228,628 |
|
| Administrative services (Note 2) | 34,637 |
|
| Other | 278,060 |
|
| Total expenses | 9,709,301 |
| | |
| Expense reduction (Note 2) | (6,181) |
|
| Net expenses | 9,703,120 |
| | |
| Net investment income | 46,308,123 |
|
| |
| Net realized gain on investments (Notes 1 and 3) | 3,652,292 |
|
| Net unrealized appreciation of investments during the year | 75,316,750 |
|
| Net gain on investments | 78,969,042 |
| | |
| Net increase in net assets resulting from operations | $125,277,165 |
|
The accompanying notes are an integral part of these financial statements.
|
| 36 New York Tax Exempt Income Fund |
Statement of changes in net assets
| | |
| INCREASE (DECREASE) IN NET ASSETS | Year ended 11/30/12 | Year ended 11/30/11 |
|
| Operations: | | |
| Net investment income | $46,308,123 | $47,116,598 |
|
| Net realized gain on investments | 3,652,292 | 136,762 |
|
| Net unrealized appreciation of investments | 75,316,750 | 10,227,938 |
|
| Net increase in net assets resulting from operations | 125,277,165 | 57,481,298 |
|
| Distributions to shareholders (Note 1): | | |
| From ordinary income | | |
| Taxable net investment income | | |
|
| Class A | — | (38,950) |
|
| Class B | — | (549) |
|
| Class C | — | (1,675) |
|
| Class M | — | (59) |
|
| Class Y | — | (196) |
|
| From tax-exempt net investment income | | |
| Class A | (42,966,369) | (44,464,950) |
|
| Class B | (430,962) | (467,647) |
|
| Class C | (1,723,056) | (1,561,356) |
|
| Class M | (53,785) | (57,835) |
|
| Class Y | (527,860) | (310,464) |
|
| Increase in capital from settlement payments (Note 6) | — | 1,115 |
|
| Increase (decrease) from capital share transactions (Note 4) | 82,197,242 | (35,092,175) |
|
| Total increase (decrease) in net assets | 161,772,375 | (24,513,443) |
| |
| NET ASSETS | | |
|
| Beginning of year | 1,151,614,844 | 1,176,128,287 |
|
| End of year (including undistributed net investment income | | |
| of $1,338,455 and $1,315,516, respectively) | $1,313,387,219 | $1,151,614,844 |
|
The accompanying notes are an integral part of these financial statements.
| |
| New York Tax Exempt Income Fund 37 |
Financial highlights (For a common share outstanding throughout the period)
| | | | | | | | | | | | | | | |
| INVESTMENT OPERATIONS: | | | | LESS DISTRIBUTIONS: | | | | | | RATIOS AND SUPPLEMENTAL DATA: | |
|
| | | | | | | | | | | | | | | Ratio | |
| | Net asset | | Net realized | | | | | | | | | | Ratio | of net investment | |
| | value, | | and unrealized | Total from | From | From | | | | | Total return | Net assets, | of expenses | income (loss) | |
| | beginning | Net investment | gain (loss) | investment | net investment | net realized gain | Total | Redemption | Non-recurring | Net asset value, | at net asset | end of period | to average | to average | Portfolio |
| Period ended | of period | income (loss) | on investments | operations | income | on investments | distributions | fees | reimbursements | end of period | value (%) a | (in thousands) | net assets (%) b | net assets (%) | turnover (%) |
|
| Class A | | | | | | | | | | | | | | | |
| November 30, 2012 | $8.54 | .34 | .57 | .91 | (.33) | — | (.33) | — | — | $9.12 | 10.87 | $1,206,509 | .75 | 3.81 | 11 |
| November 30, 2011 | 8.44 | .35 | .10 | .45 | (.35) | — | (.35) | — | — c,d | 8.54 | 5.55 | 1,081,992 | .75 | 4.25 | 6 |
| November 30, 2010 | 8.36 | .36 | .08 | .44 | (.36) | — | (.36) | — d | — | 8.44 | 5.27 | 1,105,169 | .75 e | 4.18 e | 6 |
| November 30, 2009 | 7.60 | .35 | .77 | 1.12 | (.36) | — | (.36) | — d | — | 8.36 | 14.96 | 1,051,532 | .80 e | 4.35 e | 18 |
| November 30, 2008 | 8.53 | .36 | (.93) | (.57) | (.36) | — d | (.36) | — d | — | 7.60 | (6.85) | 977,845 | .80 | 4.31 | 31 |
|
| Class B | | | | | | | | | | | | | | | |
| November 30, 2012 | $8.52 | .28 | .58 | .86 | (.28) | — | (.28) | — | — | $9.10 | 10.21 | $15,438 | 1.38 | 3.17 | 11 |
| November 30, 2011 | 8.43 | .30 | .09 | .39 | (.30) | — | (.30) | — | — c,d | 8.52 | 4.75 | 12,561 | 1.38 | 3.63 | 6 |
| November 30, 2010 | 8.35 | .30 | .08 | .38 | (.30) | — | (.30) | — d | — | 8.43 | 4.61 | 16,090 | 1.38 e | 3.57 e | 6 |
| November 30, 2009 | 7.59 | .30 | .76 | 1.06 | (.30) | — | (.30) | — d | — | 8.35 | 14.26 | 22,589 | 1.44 e | 3.74 e | 18 |
| November 30, 2008 | 8.52 | .30 | (.92) | (.62) | (.31) | — d | (.31) | — d | — | 7.59 | (7.46) | 30,751 | 1.44 | 3.66 | 31 |
|
| Class C | | | | | | | | | | | | | | | |
| November 30, 2012 | $8.54 | .27 | .56 | .83 | (.26) | — | (.26) | — | — | $9.11 | 9.90 | $70,435 | 1.53 | 3.01 | 11 |
| November 30, 2011 | 8.44 | .29 | .10 | .39 | (.29) | — | (.29) | — | — c,d | 8.54 | 4.75 | 47,182 | 1.53 | 3.47 | 6 |
| November 30, 2010 | 8.36 | .29 | .08 | .37 | (.29) | — | (.29) | — d | — | 8.44 | 4.45 | 47,564 | 1.53 e | 3.39 e | 6 |
| November 30, 2009 | 7.60 | .28 | .77 | 1.05 | (.29) | — | (.29) | — d | — | 8.36 | 14.08 | 36,839 | 1.59 e | 3.55 e | 18 |
| November 30, 2008 | 8.53 | .29 | (.92) | (.63) | (.30) | — d | (.30) | — d | — | 7.60 | (7.60) | 28,618 | 1.59 | 3.52 | 31 |
|
| Class M | | | | | | | | | | | | | | | |
| November 30, 2012 | $8.54 | .31 | .58 | .89 | (.31) | — | (.31) | — | — | $9.12 | 10.56 | $1,659 | 1.03 | 3.52 | 11 |
| November 30, 2011 | 8.45 | .33 | .09 | .42 | (.33) | — | (.33) | — | — c,d | 8.54 | 5.14 | 1,435 | 1.03 | 3.97 | 6 |
| November 30, 2010 | 8.37 | .33 | .08 | .41 | (.33) | — | (.33) | — d | — | 8.45 | 4.96 | 1,694 | 1.03 e | 3.91 e | 6 |
| November 30, 2009 | 7.60 | .32 | .78 | 1.10 | (.33) | — | (.33) | — d | — | 8.37 | 14.77 | 1,875 | 1.09 e | 4.06 e | 18 |
| November 30, 2008 | 8.54 | .33 | (.93) | (.60) | (.34) | — d | (.34) | — d | — | 7.60 | (7.23) | 1,719 | 1.09 | 4.01 | 31 |
|
| Class Y | | | | | | | | | | | | | | | |
| November 30, 2012 | $8.54 | .36 | .57 | .93 | (.35) | — | (.35) | — | — | $9.12 | 11.10 | $19,347 | .53 | 4.00 | 11 |
| November 30, 2011 | 8.45 | .37 | .09 | .46 | (.37) | — | (.37) | — | — c,d | 8.54 | 5.66 | 8,444 | .53 | 4.45 | 6 |
| November 30, 2010 | 8.36 | .37 | .10 | .47 | (.38) | — | (.38) | — d | — | 8.45 | 5.65 | 5,613 | .53 e | 4.38 e | 6 |
| November 30, 2009 | 7.60 | .36 | .77 | 1.13 | (.37) | — | (.37) | — d | — | 8.36 | 15.20 | 3,083 | .59 e | 4.49 e | 18 |
| November 30, 2008† | 8.51 | .34 | (.90) | (.56) | (.35) | — | (.35) | — d | — | 7.60 | (6.82)* | 888 | .54* | 4.37* | 31 |
|
* Not annualized.
† For the period January 2, 2008 (commencement of operations) to November 30, 2008.
a Total return assumes dividend reinvestment and does not reflect the effect of sales charges.
b Includes amounts paid through expense offset arrangements (Note 2).
c Reflects a non-recurring reimbursement related to restitution amounts in connection with a distribution plan approved by the Securities and Exchange Commission (the SEC) which amounted to less than $0.01 per share outstanding on July 21, 2011. Also reflects a non-recurring reimbursement related to short-term trading related lawsuits, which amounted to less than $0.01 per share outstanding on May 11, 2011 (Note 6).
d Amount represents less than $0.01 per share.
e Reflects an involuntary contractual expense limitation in effect during the period. As a result of such limitation, the expenses of each class reflect a reduction of the following amounts:
| |
| | Percentage of |
| | average net assets |
|
| November 30, 2010 | <0.01% |
|
| November 30, 2009 | 0.02 |
|
The accompanying notes are an integral part of these financial statements.
| |
| 38 New York Tax Exempt Income Fund | New York Tax Exempt Income Fund 39 |
Notes to financial statements 11/30/12
Within the following Notes to financial statements, references to “State Street” represent State Street Bank and Trust Company, references to “the SEC” represent the Securities and Exchange Commission and references to “Putnam Management” represent Putnam Investment Management, LLC, the fund’s manager, an indirect wholly-owned subsidiary of Putnam Investments, LLC. Unless otherwise noted, the “reporting period” represents the period from December 1, 2011 through November 30, 2012.
Putnam New York Tax Exempt Income Fund (the fund) is a Massachusetts business trust, which is registered under the Investment Company Act of 1940, as amended, as a diversified open-end management investment company. The investment objective of the fund is to seek as high a level of current income exempt from federal income tax and New York State and City personal income taxes as Putnam Management believes is consistent with preservation of capital. The fund invests mainly in bonds that pay interest that is exempt from federal income tax and New York State and City personal income taxes (but that may be subject to federal alternative minimum tax (AMT)), are investment grade in quality, and have intermediate- to long-term maturities (three years or longer).
The fund offers class A, class B, class C, class M and class Y shares. Class A and class M shares are sold with a maximum front-end sales charge of 4.00% and 3.25%, respectively, and generally do not pay a contingent deferred sales charge. Class B shares, which convert to class A shares after approximately eight years, do not pay a front-end sales charge and are subject to a contingent deferred sales charge if those shares are redeemed within six years of purchase. Class C shares have a one-year 1.00% contingent deferred sales charge and do not convert to class A shares. The expenses for class A, class B, class C, and class M shares may differ based on the distribution fee of each class, which is identified in Note 2. Class Y shares, which are sold at net asset value, are generally subject to the same expenses as class A, class B, class C, and class M shares, but do not bear a distribution fee. Class Y shares are not available to all investors.
In the normal course of business, the fund enters into contracts that may include agreements to indemnify another party under given circumstances. The fund’s maximum exposure under these arrangements is unknown as this would involve future claims that may be, but have not yet been, made against the fund. However, the fund’s management team expects the risk of material loss to be remote.
Note 1: Significant accounting policies
The following is a summary of significant accounting policies consistently followed by the fund in the preparation of its financial statements. The preparation of financial statements is in conformity with accounting principles generally accepted in the United States of America and requires management to make estimates and assumptions that affect the reported amounts of assets and liabilities in the financial statements and the reported amounts of increases and decreases in net assets from operations. Actual results could differ from those estimates. Subsequent events after the Statement of assets and liabilities date through the date that the financial statements were issued have been evaluated in the preparation of the financial statements.
Investment income, realized and unrealized gains and losses and expenses of the fund are borne pro-rata based on the relative net assets of each class to the total net assets of the fund, except that each class bears expenses unique to that class (including the distribution fees applicable to such classes). Each class votes as a class only with respect to its own distribution plan or other matters on which a class vote is required by law or determined by the Trustees. If the fund were liquidated, shares of each class would receive their pro-rata share of the net assets of the fund. In addition, the Trustees declare separate dividends on each class of shares.
Security valuation Tax-exempt bonds and notes are generally valued on the basis of valuations provided by an independent pricing service approved by the Trustees. Such services use information with respect to transactions in bonds, quotations from bond dealers, market transactions in comparable securities and various relationships between securities in determining value. These securities will generally be categorized as Level 2.
Certain investments, including certain restricted and illiquid securities and derivatives, are also valued at fair value following procedures approved by the Trustees. Such valuations and procedures are reviewed periodically by the Trustees. These valuations consider such factors as significant market or specific security events such as interest rate or credit quality changes, various relationships with other securities, discount rates, U.S. Treasury, U.S. swap and credit yields, index levels, convexity exposures and recovery rates. These securities are classified as Level 2 or as Level 3 depending on the priority of the significant inputs. The fair value of securities is generally determined as the amount that the fund could reasonably expect to realize from an orderly disposition of such securities over
|
| 40 New York Tax Exempt Income Fund |
a reasonable period of time. By its nature, a fair value price is a good faith estimate of the value of a security in a current sale and does not reflect an actual market price, which may be different by a material amount.
Security transactions and related investment income Security transactions are recorded on the trade date (the date the order to buy or sell is executed). Gains or losses on securities sold are determined on the identified cost basis.
Interest income is recorded on the accrual basis. All premiums/discounts are amortized/accreted on a yield-to-maturity basis. The premium in excess of the call price, if any, is amortized to the call date; thereafter, any remaining premium is amortized to maturity.
Securities purchased or sold on a delayed delivery basis may be settled a month or more after the trade date; interest income is accrued based on the terms of the securities. Losses may arise due to changes in the market value of the underlying securities or if the counterparty does not perform under the contract.
Interfund lending The fund, along with other Putnam funds, may participate in an interfund lending program pursuant to an exemptive order issued by the SEC. This program allows the fund to borrow from other Putnam funds that permit such transactions. Interfund lending transactions are subject to each fund’s investment policies and borrowing and lending limits. Interest earned or paid on the interfund lending transaction will be based on the average of certain current market rates. During the reporting period, the fund did not utilize the program.
Line of credit The fund participates, along with other Putnam funds, in a $315 million unsecured committed line of credit and a $185 million unsecured uncommitted line of credit, both provided by State Street. Borrowings may be made for temporary or emergency purposes, including the funding of shareholder redemption requests and trade settlements. Interest is charged to the fund based on the fund’s borrowing at a rate equal to the Federal Funds rate plus 1.25% for the committed line of credit and the Federal Funds rate plus 1.30% for the uncommitted line of credit. A closing fee equal to 0.02% of the committed line of credit and $50,000 for the uncommitted line of credit has been paid by the participating funds. In addition, a commitment fee of 0.11% per annum on any unutilized portion of the committed line of credit is allocated to the participating funds based on their relative net assets and paid quarterly. During the reporting period, the fund had no borrowings against these arrangements.
Federal taxes It is the policy of the fund to distribute all of its income within the prescribed time period and otherwise comply with the provisions of the Internal Revenue Code of 1986, as amended (the Code), applicable to regulated investment companies. It is also the intention of the fund to distribute an amount sufficient to avoid imposition of any excise tax under Section 4982 of the Code.
The fund is subject to the provisions of Accounting Standards Codification ASC 740 Income Taxes (ASC 740). ASC 740 sets forth a minimum threshold for financial statement recognition of the benefit of a tax position taken or expected to be taken in a tax return. The fund did not have a liability to record for any unrecognized tax benefits in the accompanying financial statements. No provision has been made for federal taxes on income, capital gains or unrealized appreciation on securities held nor for excise tax on income and capital gains. Each of the fund’s federal tax returns for the prior three fiscal years remains subject to examination by the Internal Revenue Service.
At November 30, 2012, the fund had a capital loss carryover of $5,798,160 available to the extent allowed by the Code to offset future net capital gain, if any. The amounts of the carryovers and the expiration dates are:
| | | |
| | Loss carryover | |
|
| Short-term | Long-term | Total | Expiration |
|
| $4,276,078 | N/A | $4,276,078 | November 30, 2016 |
|
| 1,012,732 | N/A | 1,012,732 | November 30, 2017 |
|
| 509,350 | N/A | 509,350 | November 30, 2019 |
|
Under the Regulated Investment Company Modernization Act of 2010, the fund will be permitted to carry forward capital losses incurred in taxable years beginning after December 22, 2010 for an unlimited period. However, any losses incurred will be required to be utilized prior to the losses incurred in pre-enactment tax years. As a result of this ordering rule, pre-enactment capital loss carryforwards may be more likely to expire unused. Additionally, post-enactment capital losses that are carried forward will retain their character as either short-term or long-term capital losses rather than being considered all short-term as under previous law.
Distributions to shareholders Distributions to shareholders from net investment income are recorded by the fund on the ex-dividend date. Distributions from capital gains, if any, are recorded on the ex-dividend date and paid at least annually. The amount and character of income and gains to be distributed are determined in accordance with
| | |
| New York Tax Exempt Income Fund 41 |
income tax regulations, which may differ from generally accepted accounting principles. These differences include temporary and/or permanent differences of losses on wash sale transactions, dividends payable and straddle loss deferrals. Reclassifications are made to the fund’s capital accounts to reflect income and gains available for distribution (or available capital loss carryovers) under income tax regulations. For the reporting period ended, the fund reclassified $583,152 to decrease undistributed net investment income and $583,152 to decrease accumulated net realized losses.
The tax basis components of distributable earnings and the federal tax cost as of the close of the reporting period were as follows:
| |
| Unrealized appreciation | $124,280,831 |
| Unrealized depreciation | (3,101,772) |
|
| Net unrealized appreciation | 121,179,059 |
| Undistributed tax-exempt income | 2,194,409 |
| Undistributed ordinary income | 19,737 |
| Capital loss carryforward | (5,798,160) |
| Cost for federal income tax purposes | $1,179,198,271 |
Note 2: Management fee, administrative services and other transactions
The fund pays Putnam Management a management fee (based on the fund’s average net assets and computed and paid monthly) at annual rates that may vary based on the average of the aggregate net assets of most open-end funds, as defined in the fund’s management contract, sponsored by Putnam Management. Such annual rates may vary as follows:
| | | | |
| 0.590% | of the first $5 billion, | | 0.390% | of the next $50 billion, |
| |
|
| 0.540% | of the next $5 billion, | | 0.370% | of the next $50 billion, |
| |
|
| 0.490% | of the next $10 billion, | | 0.360% | of the next $100 billion and |
| |
|
| 0.440% | of the next $10 billion, | | 0.355% | of any excess thereafter. |
| |
|
Putnam Management has contractually agreed, through June 30, 2013, to waive fees or reimburse the fund’s expenses to the extent necessary to limit the cumulative expenses of the fund, exclusive of brokerage, interest, taxes, investment-related expenses, extraordinary expenses, acquired fund fees and expenses and payments under the fund’s investor servicing contract, investment management contract and distribution plans, on a fiscal year-to-date basis to an annual rate of 0.20% of the fund’s average net assets over such fiscal year-to-date period. During the reporting period, the fund’s expenses were not reduced as a result of this limit.
Putnam Investments Limited (PIL), an affiliate of Putnam Management, is authorized by the Trustees to manage a separate portion of the assets of the fund as determined by Putnam Management from time to time. Putnam Management pays a quarterly sub-management fee to PIL for its services at an annual rate of 0.40% of the average net assets of the portion of the fund managed by PIL.
The fund reimburses Putnam Management an allocated amount for the compensation and related expenses of certain officers of the fund and their staff who provide administrative services to the fund. The aggregate amount of all such reimbursements is determined annually by the Trustees.
Custodial functions for the fund’s assets are provided by State Street. Custody fees are based on the fund’s asset level, the number of its security holdings and transaction volumes.
Putnam Investor Services, Inc., an affiliate of Putnam Management, provides investor servicing agent functions to the fund. Putnam Investor Services, Inc. received fees for investor servicing based on the fund’s retail asset level, the number of shareholder accounts in the fund and the level of defined contribution plan assets in the fund. Investor servicing fees will not exceed an annual rate of 0.32% of the fund’s average net assets. Prior to March 1, 2012, investor servicing fees could not exceed an annual rate of 0.375% of the fund’s average net assets. During the reporting period, the class specific expenses related to investor servicing fees were as follows:
| | | | |
| Class A | $520,277 | | Class M | 704 |
| |
|
| Class B | 6,254 | | Class Y | 6,003 |
| |
|
| Class C | 26,287 | | Total | $559,525 |
| |
|
|
| 42 New York Tax Exempt Income Fund |
The fund has entered into expense offset arrangements with Putnam Investor Services, Inc. and State Street whereby Putnam Investor Services, Inc.’s and State Street’s fees are reduced by credits allowed on cash balances. For the reporting period, the fund’s expenses were reduced by $6,181 under the expense offset arrangements.
Each independent Trustee of the fund receives an annual Trustee fee, of which $995, as a quarterly retainer, has been allocated to the fund, and an additional fee for each Trustees meeting attended. Trustees also are reimbursed for expenses they incur relating to their services as Trustees.
The fund has adopted a Trustee Fee Deferral Plan (the Deferral Plan) which allows the Trustees to defer the receipt of all or a portion of Trustees fees payable on or after July 1, 1995. The deferred fees remain invested in certain Putnam funds until distribution in accordance with the Deferral Plan.
The fund has adopted an unfunded noncontributory defined benefit pension plan (the Pension Plan) covering all Trustees of the fund who have served as a Trustee for at least five years and were first elected prior to 2004. Benefits under the Pension Plan are equal to 50% of the Trustee’s average annual attendance and retainer fees for the three years ended December 31, 2005. The retirement benefit is payable during a Trustee’s lifetime, beginning the year following retirement, for the number of years of service through December 31, 2006. Pension expense for the fund is included in Trustee compensation and expenses in the Statement of operations. Accrued pension liability is included in Payable for Trustee compensation and expenses in the Statement of assets and liabilities. The Trustees have terminated the Pension Plan with respect to any Trustee first elected after 2003.
The fund has adopted distribution plans (the Plans) with respect to its class A, class B, class C and class M shares pursuant to Rule 12b–1 under the Investment Company Act of 1940. The purpose of the Plans is to compensate Putnam Retail Management Limited Partnership, an indirect wholly-owned subsidiary of Putnam Investments, LLC, for services provided and expenses incurred in distributing shares of the fund. The Plans provide for payments by the fund to Putnam Retail Management Limited Partnership at an annual rate of up to 0.35%, 1.00%, 1.00% and 1.00% of the average net assets attributable to class A, class B, class C and class M shares, respectively. The Trustees have approved payment by the fund at the annual rate of 0.85%, 1.00% and 0.50% of the average net assets for class B, class C and class M shares, respectively. For class A shares, the annual payment rate will equal the weighted average of (i) 0.20% on the net assets of the fund attributable to class A shares purchased and paid for prior to April 1, 2005 and (ii) 0.25% on all other net assets of the fund attributable to class A shares. During the reporting period, the class specific expenses related to distribution fees were as follows:
| | | | |
| Class A | $2,521,320 | | Class M | 7,746 |
| |
|
| Class B | 117,298 | | Total | $3,228,628 |
| |
|
| Class C | 582,264 | | | |
| | |
For the reporting period, Putnam Retail Management Limited Partnership, acting as underwriter, received net commissions of $179,080 and $147 from the sale of class A and class M shares, respectively, and received $9,756 and $614 in contingent deferred sales charges from redemptions of class B and class C shares, respectively.
A deferred sales charge of up to 1.00% is assessed on certain redemptions of class A shares. For the reporting period, Putnam Retail Management Limited Partnership, acting as underwriter, received $3,500 on class A redemptions.
Note 3: Purchases and sales of securities
During the reporting period, cost of purchases and proceeds from sales of investment securities other than short-term investments aggregated $222,643,134 and $132,551,026, respectively. There were no purchases or proceeds from sales of long-term U.S. government securities.
|
| New York Tax Exempt Income Fund 43 |
Note 4: Capital shares
At the close of the reporting period, there was an unlimited number of shares of beneficial interest authorized. Transactions in capital shares were as follows:
| | | | |
| | Year ended 11/30/12 | Year ended 11/30/11 |
|
| Class A | Shares | Amount | Shares | Amount |
|
| Shares sold | 17,689,294 | $157,228,270 | 9,798,283 | $82,142,578 |
|
| Shares issued in connection with | | | | |
| reinvestment of distributions | 3,581,018 | 31,874,180 | 3,770,180 | 31,444,220 |
|
| | 21,270,312 | 189,102,450 | 13,568,463 | 113,586,798 |
|
| Shares repurchased | (15,635,968) | (138,646,350) | (17,747,975) | (146,743,288) |
|
| Net increase (decrease) | 5,634,344 | $50,456,100 | (4,179,512) | $(33,156,490) |
|
| |
| | Year ended 11/30/12 | Year ended 11/30/11 |
|
| Class B | Shares | Amount | Shares | Amount |
|
| Shares sold | 529,375 | $4,695,739 | 319,505 | $2,676,387 |
|
| Shares issued in connection with | | | | |
| reinvestment of distributions | 37,229 | 330,897 | 40,325 | 335,324 |
|
| | 566,604 | 5,026,636 | 359,830 | 3,011,711 |
|
| Shares repurchased | (343,807) | (3,043,688) | (795,185) | (6,559,248) |
|
| Net increase (decrease) | 222,797 | $1,982,948 | (435,355) | $(3,547,537) |
|
| |
| | Year ended 11/30/12 | Year ended 11/30/11 |
|
| Class C | Shares | Amount | Shares | Amount |
|
| Shares sold | 2,722,767 | $24,204,543 | 1,091,249 | $9,129,537 |
|
| Shares issued in connection with | | | | |
| reinvestment of distributions | 157,505 | 1,402,360 | 144,193 | 1,202,093 |
|
| | 2,880,272 | 25,606,903 | 1,235,442 | 10,331,630 |
|
| Shares repurchased | (679,130) | (6,036,207) | (1,343,094) | (11,136,723) |
|
| Net increase (decrease) | 2,201,142 | $19,570,696 | (107,652) | $(805,093) |
|
| |
| | Year ended 11/30/12 | Year ended 11/30/11 |
|
| Class M | Shares | Amount | Shares | Amount |
|
| Shares sold | 15,082 | $134,378 | 11,769 | $97,651 |
|
| Shares issued in connection with | | | | |
| reinvestment of distributions | 4,568 | 40,764 | 3,989 | 33,282 |
|
| | 19,650 | 175,142 | 15,758 | 130,933 |
|
| Shares repurchased | (5,804) | (52,128) | (48,212) | (397,597) |
|
| Net increase (decrease) | 13,846 | $123,014 | (32,454) | $(266,664) |
|
|
| 44 New York Tax Exempt Income Fund |
| | | | |
| | Year ended 11/30/12 | Year ended 11/30/11 |
|
| Class Y | Shares | Amount | Shares | Amount |
|
| Shares sold | 1,358,384 | $12,062,629 | 738,450 | $6,107,015 |
|
| Shares issued in connection with | | | | |
| reinvestment of distributions | 35,991 | 321,057 | 20,320 | 170,141 |
|
| | 1,394,375 | 12,383,686 | 758,770 | 6,277,156 |
|
| Shares repurchased | (261,398) | (2,319,202) | (434,432) | (3,593,547) |
|
| Net increase | 1,132,977 | $10,064,484 | 324,338 | $2,683,609 |
|
Note 5: Market, credit and other risks
In the normal course of business, the fund trades financial instruments and enters into financial transactions where risk of potential loss exists due to changes in the market (market risk) or failure of the contracting party to the transaction to perform (credit risk). The fund may be exposed to additional credit risk that an institution or other entity with which the fund has unsettled or open transactions will default. The fund may be affected by economic and political developments in the state of New York.
Note 6: Regulatory matters and litigation
In late 2003 and 2004, Putnam Management settled charges brought by the SEC and the Massachusetts Securities Division in connection with excessive short-term trading in Putnam funds. In July 2011, the fund recorded a receivable of $1,103 related to restitution amounts in connection with a distribution plan approved by the SEC. This amount, which was received by the fund in December 2011, is reported as part of Increase in capital from settlement payments on the Statement of changes in net assets. These allegations and related matters have served as the general basis for certain lawsuits, including purported class action lawsuits against Putnam Management and, in a limited number of cases, some Putnam funds. In May 2011, the fund received a payment of $12 related to settlement of those lawsuits. This amount is reported as a part of Increase in capital from settlement payments on the Statement of changes in net assets. Putnam Management has agreed to bear any costs incurred by the Putnam funds as a result of these matters.
Note 7: New accounting pronouncements
In May 2011, the Financial Accounting Standards Board (FASB) issued Accounting Standards Update (ASU) 2011–04 “Fair Value Measurements and Disclosures (Topic 820) — Amendments to Achieve Common Fair Value Measurement and Disclosure Requirements in U.S. GAAP and IFRS”. ASU 2011–04 amends FASB Topic 820 “Fair Value Measurement” and seeks to develop common requirements for measuring fair value and for disclosing information about fair value measurements in accordance with GAAP. ASU 2011–04 is effective for fiscal years and interim periods beginning after December 15, 2011. The application of ASU 2011–04 did not have a material impact on the fund’s financial statements.
In December 2011, the FASB issued ASU No. 2011–11 “Disclosures about Offsetting Assets and Liabilities”. The update creates new disclosure requirements requiring entities to disclose both gross and net information for derivatives and other financial instruments that are either offset in the Statement of assets and liabilities or subject to an enforceable master netting arrangement or similar agreement. The disclosure requirements are effective for annual reporting periods beginning on or after January 1, 2013 and interim periods within those annual periods. Putnam Management is currently evaluating the application of ASU 2011–11 and its impact, if any, on the fund’s financial statements.
|
| New York Tax Exempt Income Fund 45 |
Federal tax information (Unaudited)
The fund has designated 100% of dividends paid from net investment income during the reporting period as tax exempt for Federal income tax purposes.
The Form 1099 that will be mailed to you in January 2013 will show the tax status of all distributions paid to your account in calendar 2012.
|
| 46 New York Tax Exempt Income Fund |
About the Trustees
Independent Trustees
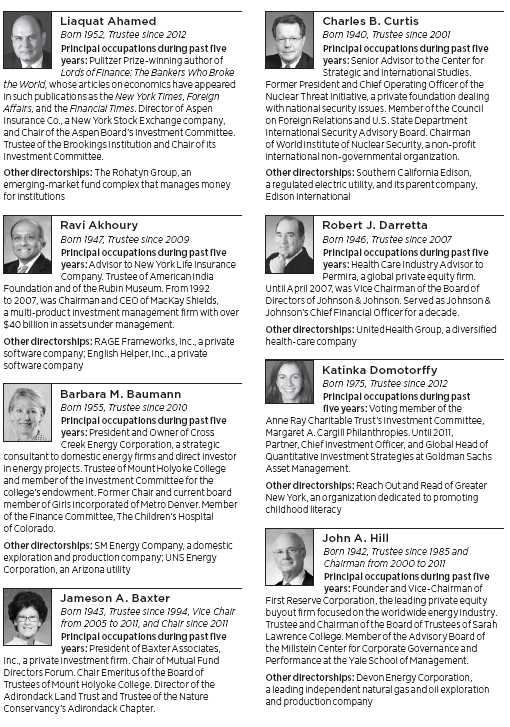
|
| New York Tax Exempt Income Fund 47 |

* Mr. Reynolds is an “interested person” (as defined in the Investment Company Act of 1940) of the fund, Putnam Management, and Putnam Retail Management. He is President and Chief Executive Officer of Putnam Investments, as well as the President of your fund and each of the other Putnam funds.
The address of each Trustee is One Post Office Square, Boston, MA 02109.
As of November 30, 2012, there were 109 Putnam funds. All Trustees serve as Trustees of all Putnam funds.
Each Trustee serves for an indefinite term, until his or her resignation, retirement at age 75, removal, or death.
|
| 48 New York Tax Exempt Income Fund |
Officers
In addition to Robert L. Reynolds, the other officers of the fund are shown below:
| |
| Jonathan S. Horwitz (Born 1955) | Janet C. Smith (Born 1965) |
| Executive Vice President, Principal Executive | Vice President, Principal Accounting Officer, |
| Officer, and Compliance Liaison | and Assistant Treasurer |
| Since 2004 | Since 2007 |
| | Director of Fund Administration Services, |
| Steven D. Krichmar (Born 1958) | Putnam Investments and Putnam Management |
| Vice President and Principal Financial Officer | |
| Since 2002 | Susan G. Malloy (Born 1957) |
| Chief of Operations, Putnam Investments and | Vice President and Assistant Treasurer |
| Putnam Management | Since 2007 |
| | Director of Accounting & Control Services, |
| Robert T. Burns (Born 1961) | Putnam Management |
| Vice President and Chief Legal Officer | |
| Since 2011 | James P. Pappas (Born 1953) |
| General Counsel, Putnam Investments and | Vice President |
| Putnam Management | Since 2004 |
| | Director of Trustee Relations, |
| Robert R. Leveille (Born 1969) | Putnam Investments and Putnam Management |
| Vice President and Chief Compliance Officer | |
| Since 2007 | Mark C. Trenchard (Born 1962) |
| Chief Compliance Officer, Putnam Investments, | Vice President and BSA Compliance Officer |
| Putnam Management, and Putnam Retail | Since 2002 |
| Management | Director of Operational Compliance, |
| | Putnam Investments and Putnam |
| Michael J. Higgins (Born 1976) | Retail Management |
| Vice President and Treasurer | |
| Since 2010 | Judith Cohen (Born 1945) |
| Manager of Finance, Dunkin’ Brands (2008– | Vice President, Clerk, and Associate Treasurer |
| 2010); Senior Financial Analyst, Old Mutual Asset | Since 1993 |
| Management (2007–2008); Senior Financial | |
| Analyst, Putnam Investments (1999–2007) | Nancy E. Florek (Born 1957) |
| Vice President, Proxy Manager, Assistant Clerk, |
| | and Associate Treasurer |
| | Since 2000 |
The principal occupations of the officers for the past five years have been with the employers as shown above although in some cases, they have held different positions with such employers. The address of each Officer is One Post Office Square, Boston, MA 02109.
|
| New York Tax Exempt Income Fund 49 |
The Putnam family of funds
The following is a list of Putnam’s open-end mutual funds offered to the public. Investors should carefully consider the investment objective, risks, charges, and expenses of a fund before investing. For a prospectus, or a summary prospectus if available, containing this and other information for any Putnam fund or product, call your financial advisor at 1-800-225-1581 and ask for a prospectus. Please read the prospectus carefully before investing.
| |
| Growth | Income |
| Growth Opportunities Fund | American Government Income Fund |
| International Growth Fund | Diversified Income Trust |
| Multi-Cap Growth Fund | Floating Rate Income Fund |
| Small Cap Growth Fund | Global Income Trust |
| Voyager Fund | High Yield Advantage Fund |
| | High Yield Trust |
| Blend | Income Fund |
| Asia Pacific Equity Fund | Money Market Fund* |
| Capital Opportunities Fund | Short Duration Income Fund |
| Capital Spectrum Fund | U.S. Government Income Trust |
| Emerging Markets Equity Fund | |
| Equity Spectrum Fund | Tax-free income |
| Europe Equity Fund | AMT-Free Municipal Fund |
| Global Equity Fund | Tax Exempt Income Fund |
| International Capital Opportunities Fund | Tax Exempt Money Market Fund* |
| International Equity Fund | Tax-Free High Yield Fund |
| Investors Fund | |
| Multi-Cap Core Fund | State tax-free income funds: |
| Research Fund | Arizona, California, Massachusetts, Michigan, |
| | Minnesota, New Jersey, New York, Ohio, |
| Value | and Pennsylvania. |
| Convertible Securities Fund | |
| Equity Income Fund | Absolute Return |
| George Putnam Balanced Fund | Absolute Return 100 Fund® |
| The Putnam Fund for Growth and Income | Absolute Return 300 Fund® |
| International Value Fund | Absolute Return 500 Fund® |
| Multi-Cap Value Fund | Absolute Return 700 Fund® |
| Small Cap Value Fund | |
* An investment in a money market fund is not insured or guaranteed by the Federal Deposit Insurance Corporation or any other government agency. Although the fund seeks to preserve the value of your investment at $1.00 per share, it is possible to lose money by investing in the fund.
|
| 50 New York Tax Exempt Income Fund |
| |
| Global Sector | Putnam RetirementReady® Funds — portfolios |
| Global Consumer Fund | with automatically adjusting allocations to |
| Global Energy Fund | stocks, bonds, and money market instruments, |
| Global Financials Fund | becoming more conservative over time. |
| Global Health Care Fund | |
| Global Industrials Fund | RetirementReady 2055 Fund |
| Global Natural Resources Fund | RetirementReady 2050 Fund |
| Global Sector Fund | RetirementReady 2045 Fund |
| Global Technology Fund | RetirementReady 2040 Fund |
| Global Telecommunications Fund | RetirementReady 2035 Fund |
| Global Utilities Fund | RetirementReady 2030 Fund |
| | RetirementReady 2025 Fund |
| Asset Allocation | RetirementReady 2020 Fund |
| Putnam Global Asset Allocation Funds — | RetirementReady 2015 Fund |
| portfolios with allocations to stocks, bonds, | |
| and money market instruments that are | Putnam Retirement Income Lifestyle |
| adjusted dynamically within specified ranges | Funds — portfolios with managed |
| as market conditions change. | allocations to stocks, bonds, and money |
| | market investments to generate |
| Dynamic Asset Allocation Balanced Fund | retirement income. |
| Dynamic Asset Allocation | |
| Conservative Fund | Retirement Income Fund Lifestyle 1 |
| Dynamic Asset Allocation Growth Fund | Retirement Income Fund Lifestyle 2 |
| Dynamic Risk Allocation Fund | Retirement Income Fund Lifestyle 3 |
| |
A short-term trading fee of 1% may apply to redemptions or exchanges from certain funds within the time period specified in the fund's prospectus.
Check your account balances and the most recent month-end performance in the Individual Investors section at putnam.com.
|
| New York Tax Exempt Income Fund 51 |
Services for shareholders
Investor services
Systematic investment plan Tell us how much you wish to invest regularly — weekly, semimonthly, or monthly — and the amount you choose will be transferred automatically from your checking or savings account. There’s no additional fee for this service, and you can suspend it at any time. This plan may be a great way to save for college expenses or to plan for your retirement.
Please note that regular investing does not guarantee a profit or protect against loss in a declining market. Before arranging a systematic investment plan, consider your financial ability to continue making purchases in periods when prices are low.
Systematic exchange You can make regular transfers from one Putnam fund to another Putnam fund. There are no additional fees for this service, and you can cancel or change your options at any time.
Dividends PLUS You can choose to have the dividend distributions from one of your Putnam funds automatically reinvested in another Putnam fund at no additional charge.
Free exchange privilege You can exchange money between Putnam funds free of charge, as long as they are the same class of shares. A signature guarantee is required if you are exchanging more than $500,000. The fund reserves the right to revise or terminate the exchange privilege.
Reinstatement privilege If you’ve sold Putnam shares or received a check for a dividend or capital gain, you may reinvest the proceeds with Putnam within 90 days of the transaction and they will be reinvested at the fund’s current net asset value — with no sales charge. However, reinstatement of class B shares may have special tax consequences. Ask your financial or tax representative for details.
Check-writing service You have ready access to many Putnam accounts. It’s as simple as writing a check, and there are no special fees or service charges. For more information about the check-writing service, call Putnam or visit our website.
Dollar cost averaging When you’re investing for long-term goals, it’s time, not timing, that counts. Investing on a systematic basis is a better strategy than trying to figure out when the markets will go up or down. This means investing the same amount of money regularly over a long period. This method of investing is called dollar cost averaging. When a fund’s share price declines, your investment dollars buy more shares at lower prices. When it increases, they buy fewer shares. Over time, you will pay a lower average price per share.
For more information
Visit the Individual Investors section at putnam.com A secure section of our website contains complete information on your account, including balances and transactions, updated daily. You may also conduct transactions, such as exchanges, additional investments, and address changes. Log on today to get your password.
Call us toll free at 1-800-225-1581 Ask a helpful Putnam representative or your financial advisor for details about any of these or other services, or see your prospectus.
|
52 New York Tax Exempt Income Fund |
Fund information
Founded 75 years ago, Putnam Investments was built around the concept that a balance between risk and reward is the hallmark of a well-rounded financial program. We manage over 100 funds across income, value, blend, growth, asset allocation, absolute return, and global sector categories.
| | |
| Investment Manager | Trustees | Robert R. Leveille |
| Putnam Investment | Jameson A. Baxter, Chair | Vice President and |
| Management, LLC | Liaquat Ahamed | Chief Compliance Officer |
| One Post Office Square | Ravi Akhoury | |
| Boston, MA 02109 | Barbara M. Baumann | Michael J. Higgins |
| | Charles B. Curtis | Vice President and Treasurer |
| Investment Sub-Manager | Robert J. Darretta | |
| Putnam Investments Limited | Katinka Domotorffy | Janet C. Smith |
| 57–59 St James’s Street | John A. Hill | Vice President, |
| London, England SW1A 1LD | Paul L. Joskow | Principal Accounting Officer, |
| | Elizabeth T. Kennan | and Assistant Treasurer |
| Marketing Services | Kenneth R. Leibler | |
| Putnam Retail Management | Robert E. Patterson | Susan G. Malloy |
| One Post Office Square | George Putnam, III | Vice President and |
| Boston, MA 02109 | Robert L. Reynolds | Assistant Treasurer |
| W. Thomas Stephens | |
| Custodian | | James P. Pappas |
| State Street Bank | Officers | Vice President |
| and Trust Company | Robert L. Reynolds | |
| President | Mark C. Trenchard |
| Legal Counsel | | Vice President and |
| Ropes & Gray LLP | Jonathan S. Horwitz | BSA Compliance Officer |
| | Executive Vice President, | |
| Independent Registered | Principal Executive Officer, and | Judith Cohen |
| Public Accounting Firm | Compliance Liaison | Vice President, Clerk, and |
| KPMG LLP | | Associate Treasurer |
| Steven D. Krichmar | |
| Vice President and | Nancy E. Florek |
| Principal Financial Officer | Vice President, Proxy |
| | | Manager, Assistant Clerk, and |
| | Robert T. Burns | Associate Treasurer |
| | Vice President and | |
| | Chief Legal Officer | |
| | | |
This report is for the information of shareholders of Putnam New York Tax Exempt Income Fund. It may also be used as sales literature when preceded or accompanied by the current prospectus, the most recent copy of Putnam’s Quarterly Performance Summary, and Putnam’s Quarterly Ranking Summary. For more recent performance, please visit putnam.com. Investors should carefully consider the investment objectives, risks, charges, and expenses of a fund, which are described in its prospectus. For this and other information or to request a prospectus or summary prospectus, call 1-800-225-1581 toll free. Please read the prospectus carefully before investing. The fund’s Statement of Additional Information contains additional information about the fund’s Trustees and is available without charge upon request by calling 1-800-225-1581.
| |
| (a) The fund’s principal executive, financial and accounting officers are employees of Putnam Investment Management, LLC, the Fund’s investment manager. As such they are subject to a comprehensive Code of Ethics adopted and administered by Putnam Investments which is designed to protect the interests of the firm and its clients. The Fund has adopted a Code of Ethics which incorporates the Code of Ethics of Putnam Investments with respect to all of its officers and Trustees who are employees of Putnam Investment Management, LLC. For this reason, the Fund has not adopted a separate code of ethics governing its principal executive, financial and accounting officers. |
| |
| (c) In May 2008, the Code of Ethics of Putnam Investment Management, LLC was updated in its entirety to include the amendments adopted in August 2007 as well as a several additional technical, administrative and non-substantive changes. In May of 2009, the Code of Ethics of Putnam Investment Management, LLC was amended to reflect that all employees will now be subject to a 90-day blackout restriction on holding Putnam open-end funds, except for portfolio managers and their supervisors (and each of their immediate family members), who will be subject to a one-year blackout restriction on the funds that they manage or supervise. In June 2010, the Code of Ethics of Putnam Investments was updated in its entirety to include the amendments adopted in May of 2009 and to change certain rules and limits contained in the Code of Ethics. In addition, the updated Code of Ethics included numerous technical, administrative and non-substantive changes, which were intended primarily to make the document easier to navigate and understand. In July 2011, the Code of Ethics of Putnam Investments was updated to reflect several technical, administrative and non-substantive changes resulting from changes in employee titles. |
| |
| Item 3. Audit Committee Financial Expert: |
| |
| The Funds’ Audit and Compliance Committee is comprised solely of Trustees who are “independent” (as such term has been defined by the Securities and Exchange Commission (“SEC”) in regulations implementing Section 407 of the Sarbanes-Oxley Act (the “Regulations”)). The Trustees believe that each of the members of the Audit and Compliance Committee also possess a combination of knowledge and experience with respect to financial accounting matters, as well as other attributes, that qualify them for service on the Committee. In addition, the Trustees have determined that each of Mr. Leibler, Mr. Hill, Mr. Darretta and Ms. Baumann qualifies as an “audit committee financial expert” (as such term has been defined by the Regulations) based on their review of his or her pertinent experience and education. The SEC has stated that the designation or identification of a person as an audit committee financial expert pursuant to this Item 3 of Form N-CSR does not impose on such person any duties, obligations or liability that are greater than the duties, obligations and liability imposed on such person as a member of the Audit and Compliance Committee and the Board of Trustees in the absence of such designation or identification. |
| |
| Item 4. Principal Accountant Fees and Services: |
| |
| The following table presents fees billed in each of the last two fiscal years for services rendered to the fund by the fund’s independent auditor: |
| | | | | |
| Fiscal year ended | Audit Fees | Audit-Related Fees | Tax Fees | All Other Fees |
|
|
| | | | | |
| November 30, 2012 | $56,439 | $-- | $6,300 | $ — |
| November 30, 2011 | $56,941 | $-- | $6,100 | $ — |
| |
| For the fiscal years ended November 30, 2012 and November 30, 2011, the fund’s independent auditor billed aggregate non-audit fees in the amounts of $6,300 and $6,100 respectively, to the fund, Putnam Management and any entity controlling, controlled by or under common control with Putnam Management that provides ongoing services to the fund. |
| |
| Audit Fees represent fees billed for the fund’s last two fiscal years relating to the audit and review of the financial statements included in annual reports and registration statements, and other services that are normally provided in connection with statutory and regulatory filings or engagements. |
| |
| Audit-Related Fees represent fees billed in the fund’s last two fiscal years for services traditionally performed by the fund’s auditor, including accounting consultation for proposed transactions or concerning financial accounting and reporting standards and other audit or attest services not required by statute or regulation. |
| |
| Tax Fees represent fees billed in the fund’s last two fiscal years for tax compliance, tax planning and tax advice services. Tax planning and tax advice services include assistance with tax audits, employee benefit plans and requests for rulings or technical advice from taxing authorities. |
| |
| Pre-Approval Policies of the Audit and Compliance Committee. The Audit and Compliance Committee of the Putnam funds has determined that, as a matter of policy, all work performed for the funds by the funds’ independent auditors will be pre-approved by the Committee itself and thus will generally not be subject to pre-approval procedures. |
| |
| The Audit and Compliance Committee also has adopted a policy to pre-approve the engagement by Putnam Management and certain of its affiliates of the funds’ independent auditors, even in circumstances where pre-approval is not required by applicable law. Any such requests by Putnam Management or certain of its affiliates are typically submitted in writing to the Committee and explain, among other things, the nature of the proposed engagement, the estimated fees, and why this work should be performed by that particular audit firm as opposed to another one. In reviewing such requests, the Committee considers, among other things, whether the provision of such services by the audit firm are compatible with the independence of the audit firm. |
| |
| The following table presents fees billed by the fund’s independent auditor for services required to be approved pursuant to paragraph (c)(7)(ii) of Rule 2-01 of Regulation S-X. |
| | | | | |
| Fiscal year ended | Audit-Related Fees | Tax Fees | All Other Fees | Total Non-Audit Fees |
|
|
| | | | | |
| November 30, 2012 | $ — | $ — | $ — | $ — |
| | | | | |
| November 30, 2011 | $ — | $ — | $ — | $ — |
| |
| Item 5. Audit Committee of Listed Registrants |
| |
| Item 6. Schedule of Investments: |
| |
| The registrant’s schedule of investments in unaffiliated issuers is included in the report to shareholders in Item 1 above. |
| |
| Item 7. Disclosure of Proxy Voting Policies and Procedures For Closed-End Management Investment Companies: |
| |
| Item 8. Portfolio Managers of Closed-End Investment Companies |
| |
| Item 9. Purchases of Equity Securities by Closed-End Management Investment Companies and Affiliated Purchasers: |
| |
| Item 10. Submission of Matters to a Vote of Security Holders: |
| |
| Item 11. Controls and Procedures: |
| |
| (a) The registrant’s principal executive officer and principal financial officer have concluded, based on their evaluation of the effectiveness of the design and operation of the registrant’s disclosure controls and procedures as of a date within 90 days of the filing date of this report, that the design and operation of such procedures are generally effective to provide reasonable assurance that information required to be disclosed by the registrant in this report is recorded, processed, summarized and reported within the time periods specified in the Commission’s rules and forms. |
| |
| (b) Changes in internal control over financial reporting: Not applicable |
| |
| (a)(1) The Code of Ethics of The Putnam Funds, which incorporates the Code of Ethics of Putnam Investments, is filed herewith. |
| |
| (a)(2) Separate certifications for the principal executive officer and principal financial officer of the registrant as required by Rule 30a-2(a) under the Investment Company Act of 1940, as amended, are filed herewith. |
| |
| (b) The certifications required by Rule 30a-2(b) under the Investment Company Act of 1940, as amended, are filed herewith. |
| |
| Pursuant to the requirements of the Securities Exchange Act of 1934 and the Investment Company Act of 1940, the registrant has duly caused this report to be signed on its behalf by the undersigned, thereunto duly authorized. |
| |
| Putnam New York Tax Exempt Income Fund |
| |
| By (Signature and Title): |
| |
| /s/Janet C. Smith
Janet C. Smith
Principal Accounting Officer
|
| |
| Pursuant to the requirements of the Securities Exchange Act of 1934 and the Investment Company Act of 1940, this report has been signed below by the following persons on behalf of the registrant and in the capacities and on the dates indicated. |
| |
| By (Signature and Title): |
| |
| /s/Jonathan S. Horwitz
Jonathan S. Horwitz
Principal Executive Officer
|
| |
| By (Signature and Title): |
| |
| /s/Steven D. Krichmar
Steven D. Krichmar
Principal Financial Officer
|