Putnam New York
Tax Exempt
Income Fund
Semiannual report
5 | 31 | 14
Message from the Trustees | 1 |
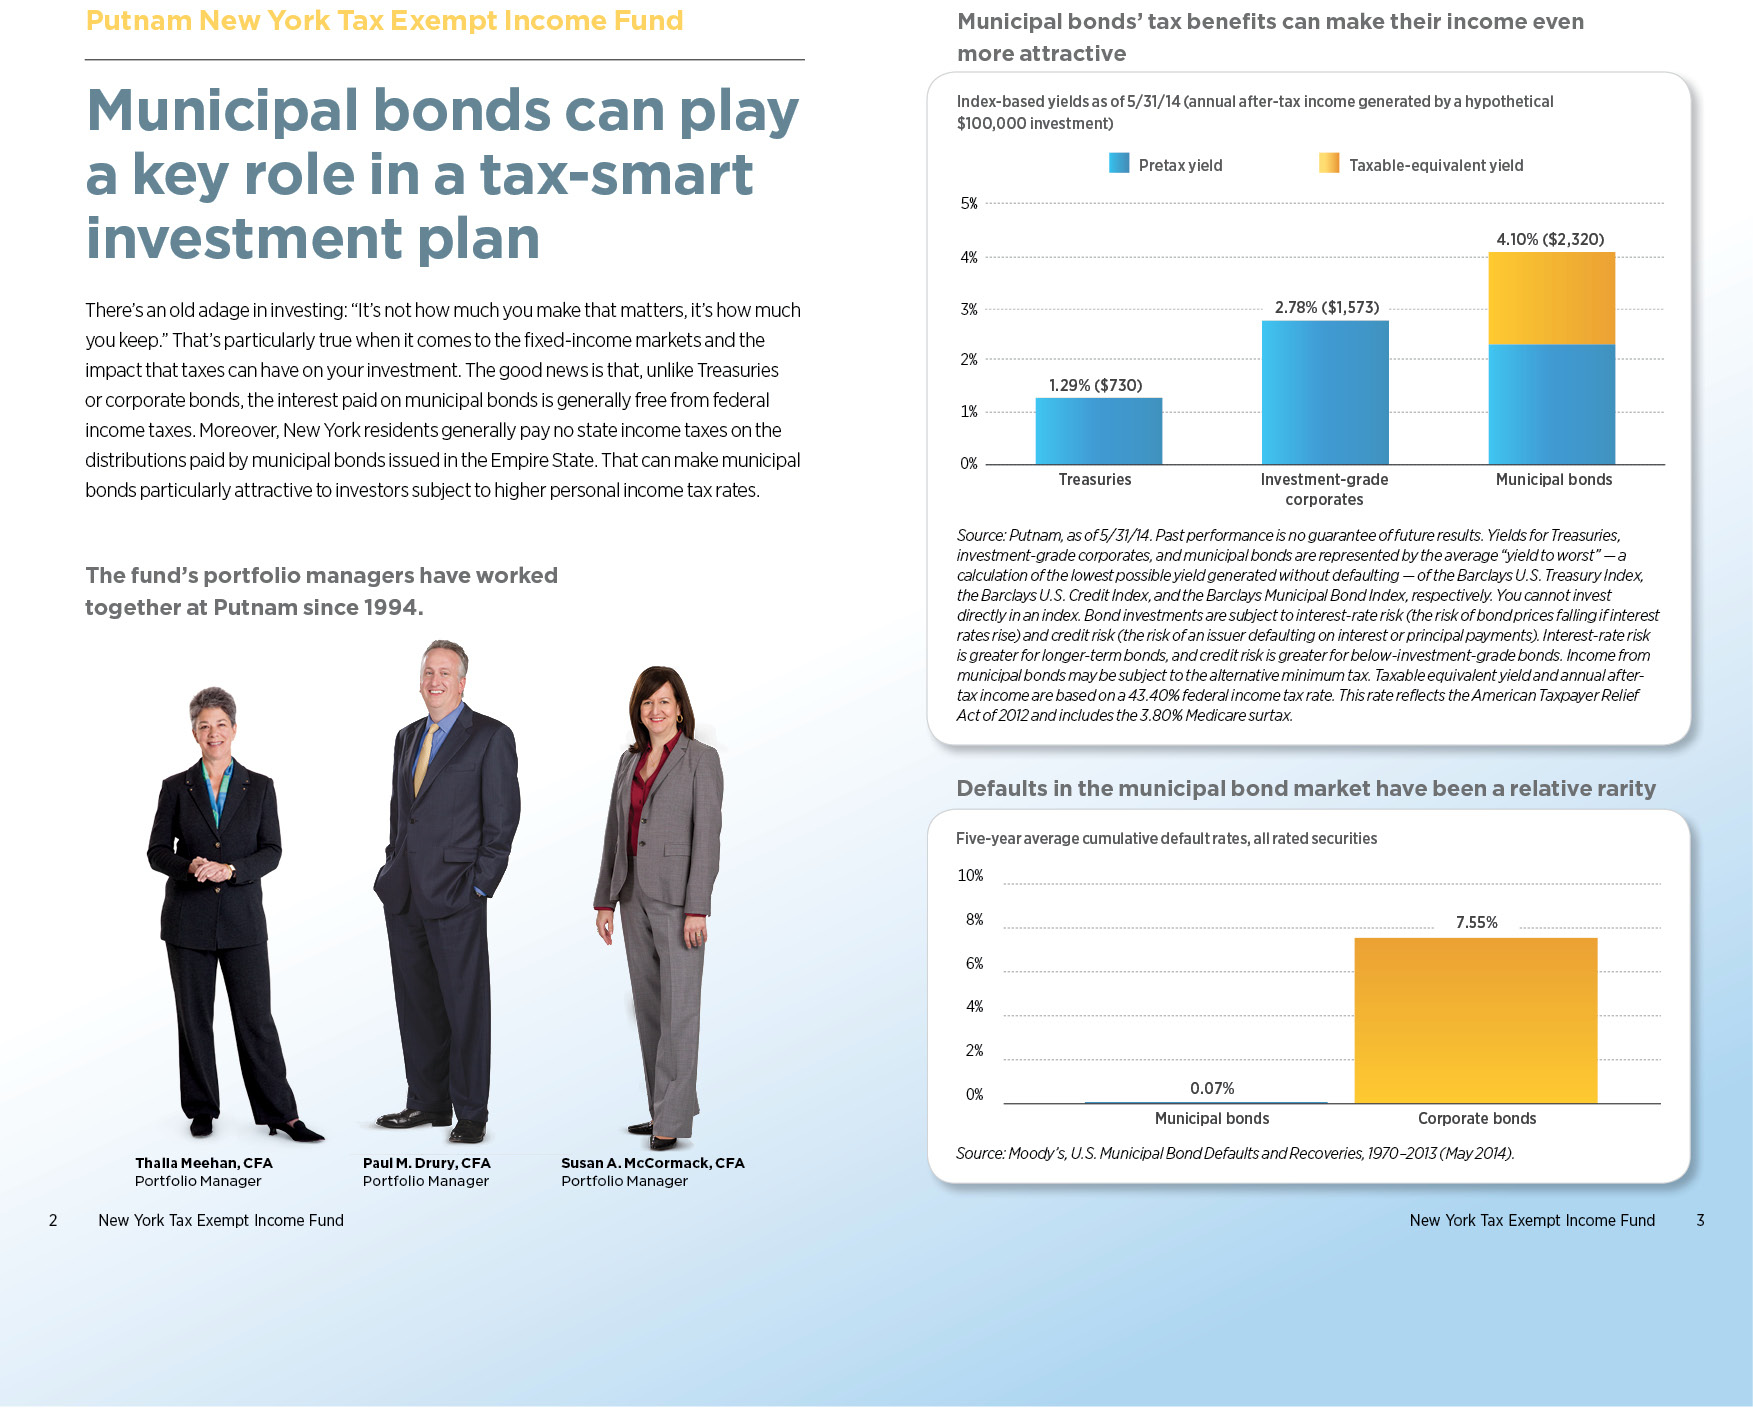
About the fund | 2 |
Performance snapshot | 4 |
Interview with your fund’s portfolio manager | 5 |
Your fund’s performance | 11 |
Your fund’s expenses | 14 |
Terms and definitions | 16 |
Other information for shareholders | 17 |
Financial statements | 18 |
Shareholder meeting results | 43 |
Consider these risks before investing: The value of bonds in the fund’s portfolio may fall or fail to rise over extended periods of time for a variety of reasons, including general financial market conditions, changing market perceptions of the risk of default, changes in government intervention, and factors related to a specific issuer. These factors may also lead to periods of high volatility and reduced liquidity in the bond markets. Single-state investments are at risk of common economic forces and other factors affecting a state’s tax-exempt investments. This may result in greater losses and volatility. Capital gains, if any, are taxed at the federal and, in most cases, state levels. For some investors, investment income may be subject to the federal alternative minimum tax. Bond investments are subject to interest-rate risk (the risk of bond prices falling if interest rates rise) and credit risk (the risk of an issuer defaulting on interest or principal payments). Interest-rate risk is greater for longer-term bonds, and credit risk is greater for below-investment-grade bonds. Unlike bonds, funds that invest in bonds have fees and expenses. Tax-exempt bonds may be issued under the Internal Revenue Code only by limited types of issuers for limited types of projects. As a result, the fund’s investments may be focused in certain market segments and be more vulnerable to fluctuations in the values of the securities it holds than a more broadly invested fund. Interest the fund receives might be taxable. You can lose money by investing in the fund.
Message from the Trustees
Dear Fellow Shareholder:
The performance of financial markets in the first half of 2014 has been marked by a significant degree of stability. Investors have regained a positive outlook as economic growth has improved after the setbacks of a harsh winter. The S&P 500 Index and the Dow Jones Industrial Average have risen to record highs, while Treasury yields have gradually sunk lower. Meanwhile, accommodative central bank policies in the United States and elsewhere continue to foster positive sentiment, notwithstanding the fact that the U.S. Federal Reserve has gradually begun to taper its monthly bond purchases.
The relative calm in financial markets contrasts with new disruptions in global affairs. The outbreaks of violent conflict in Ukraine and Iraq have contributed new uncertainties, particularly with regard to energy prices. Markets have generally taken the initial phases of these events in stride, but the risks that these events pose warrant monitoring.
Complex market conditions reinforce why investors can benefit from seeking advice and maintaining a long-term perspective for their financial programs, rather than responding to short-term market movements. Putnam is prepared to serve investors’ goals through a commitment to ongoing fundamental research and a willingness to incorporate new ways of thinking in its investment strategies. This stance has had a positive impact on performance: Barron’s ranked Putnam second among 55 fund families based on total return across asset classes for the five years ending December 2013.
We encourage you to periodically meet with your financial advisor to discuss the range of investment strategies that Putnam offers. Your advisor can help you assess your individual needs, time horizon, and risk tolerance — important considerations as you work toward your investment goals.
As always, thank you for investing with Putnam.
Respectfully yours,

Robert L. Reynolds
President and Chief Executive Officer
Putnam Investments

Jameson A. Baxter
Chair, Board of Trustees
July 10, 2014
How Barron’s ranked the fund families:
The Barron’s/Lipper Fund Family Ranking published February 8, 2014, ranked Putnam 1 out of 61 for 2009, 14 out of 57 for 2010, 57 out of 58 for 2011, 1 out of 62 for 2012, and 2 out of 64 for 2013 for the 1-year period with funds in five categories: U.S. equity, world equity, mixed asset, taxable bond, and tax-exempt bond. Putnam ranked 43 out of 54 and 46 out of 48 for the 5- and 10-year periods ending 2009, 41 out of 53 and 38 out of 46 for the 5- and 10-year periods ending 2010, 49 out of 53 and 41 out of 45 for the 5- and 10-year periods ending 2011, 27 out of 53 and 36 out of 46 for the 5- and 10-year periods ending 2012, and 2 out of 55 and 32 out of 48 for the 5- and 10-year periods ending 2013, respectively. Only funds with at least one year of performance were included. Returns were calculated minus the effects of sales charges and 12b-1 fees. Rankings were asset weighted, so larger funds had a greater impact on a fund family’s overall ranking, and then weighted by category, with each category assigned a percentage. Past performance is not indicative of future results. Barron’s is a registered trademark of Dow Jones & Company. Lipper ranked Putnam New York Tax Exempt Income Fund 70% (71/101), 49% (40/81), and 48% (34/71) for the 1-, 5-, and 10-year periods, respectively, as of 6/30/14, in the New York Municipal Debt Funds category. Lipper rankings for class A shares are based on total return without sales charge relative to all share classes of funds with similar objectives as determined by Lipper.
Performance
snapshot
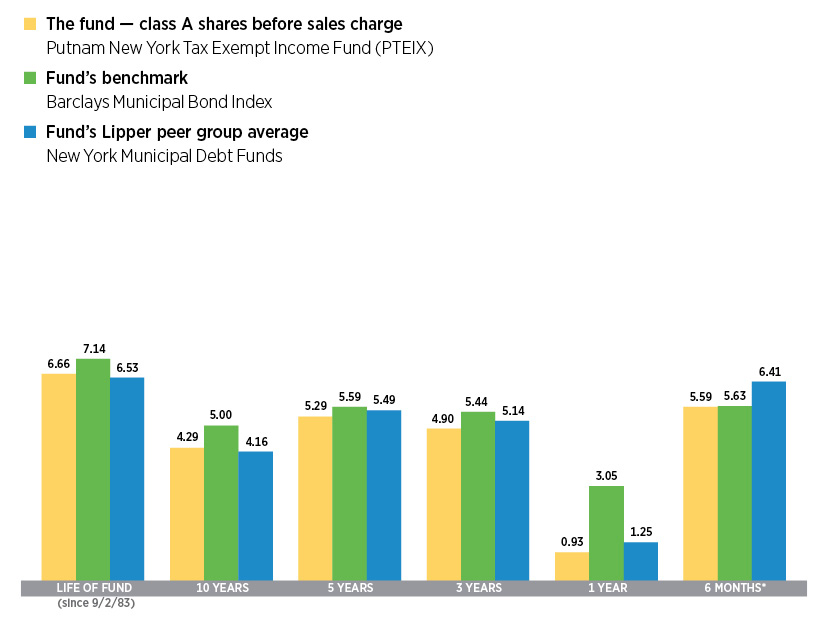
Annualized total return (%) comparison as of 5/31/14
Current performance may be lower or higher than the quoted past performance, which cannot guarantee future results. Share price, principal value, and return will fluctuate, and you may have a gain or a loss when you sell your shares. Performance of class A shares assumes reinvestment of distributions and does not account for taxes. Fund returns in the bar chart do not reflect a sales charge of 4.00%; had they, returns would have been lower. See pages 5 and 11–13 for additional performance information. For a portion of the periods, the fund had expense limitations, without which returns would have been lower. To obtain the most recent month-end performance, visit putnam.com.
* Returns for the six-month period are not annualized, but cumulative.
4 New York Tax Exempt Income Fund
Interview with your fund’s portfolio manager

|
Thalia Meehan, CFA |
Thalia, what was the municipal bond market environment like during the six months ended May 31, 2014?
The reporting period proved to be a favorable environment for municipal bonds, which were supported by low supply, strong demand, and, in general, falling interest rates. The asset class lost ground slightly in December as questions about the Federal Reserve’s monetary policy and isolated credit situations in the municipal market — most notably Detroit’s bankruptcy and Puerto Rico’s credit challenges — distracted investors from what we believed were improving underlying fundamentals in the asset class. The municipal markets reversed course in January, posting a gain of almost 2% for the month, as measured by the Barclays Municipal Bond Index. This strong monthly return was sparked by a rally in interest rates, as investors moved to a risk-off mode around fears surrounding weaker-than-anticipated economic data and developing stress in emerging markets.
In February, with the U.S. debt ceiling debate settled until March 2015, the environment for the credit markets continued to improve. The positive momentum flowed into March, making the first quarter of 2014 one of the three best for the asset class in the past 20 years. March also saw fiscally strained Puerto Rico come to market with its $3.5 billion in G.O. [general obligation] bonds — the largest bond issuance on record, which was met with solid demand. In April and May,

Broad market index and fund performance
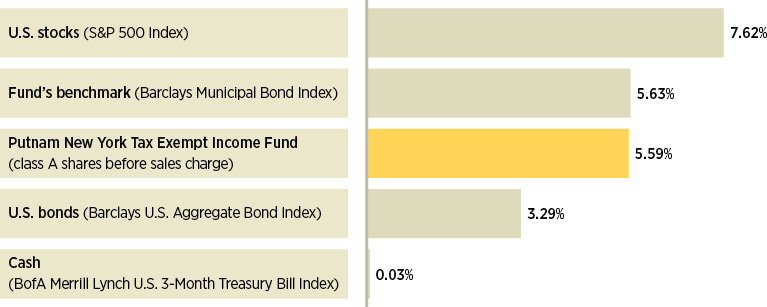
This comparison shows your fund’s performance in the context of broad market indexes for the six months ended 5/31/14. See pages 4 and 11–13 for additional fund performance information. Index descriptions can be found on page 16.
New York Tax Exempt Income Fund 5
municipal bond prices climbed higher as broader economic data started to pick up and market technicals [supply/demand factors] continued to be a tailwind and helped support bond prices.
Given the favorable market conditions during the reporting period, municipal bonds outperformed Treasuries, longer-maturity bonds led shorter-term bonds, and higher-risk assets outperformed lower-risk assets.
What contributed to the favorable technicals in the municipal bond market?
Municipal bond issuance, which has been trending down in recent years, continued at a modest pace, and this was beneficial for municipal bond prices. The modest level of new supply has not kept pace with the solid demand from traditional tax-sensitive retail investors as well as from crossover taxable buyers drawn to the competitive yields and attractive relative value offered by this asset class rather than by its tax benefit.
Meanwhile, inflows to tax-free mutual funds, an important measure of demand, turned slightly positive in the first quarter of 2014 — primarily in tax-free high-yield bond funds. April and May saw a continuation of strong investor interest. All told, with interest rates still low and fundamental credit quality improving during the period, there was greater investor appetite for the yields offered by the relatively riskier municipal bonds further out on the maturity spectrum compared with those with shorter-term maturities, such as the securities held by your fund, as well as for those in the lower-rated, higher-yielding sectors.
Sector allocations
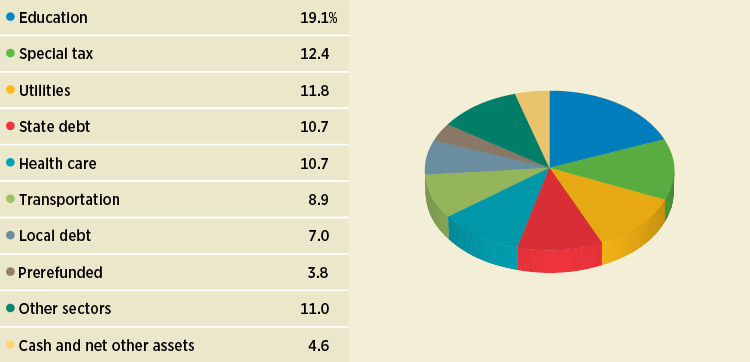
Allocations are shown as a percentage of the fund’s net assets as of 5/31/14. Cash and net other assets, if any, represent the market value weights of cash, derivatives, short-term securities, and other unclassified assets in the portfolio. Summary information may differ from the information in the portfolio schedule notes included in the financial statements due to the inclusion of derivative securities, any interest accruals, and the use of different classifications of securities for presentation purposes. Holdings and allocations may vary over time.
6 New York Tax Exempt Income Fund
“Our defensive strategies remained in
place, since we expected continued
pressure on interest rates over the
longer term.”
Thalia Meehan
How did Putnam New York Tax Exempt Income Fund perform against this backdrop?
Municipal bonds were one of the best-performing fixed-income asset classes for the reporting period. For the six months ended May 31, 2014, the fund generated positive returns but just fell short of its benchmark, the Barclays Municipal Bond Index, which is invested in municipal bonds from around the country rather than just one state. The fund lagged the average return of its Lipper peer group due to the portfolio’s relatively shorter-duration positioning, which limited its interest-rate sensitivity and, thus, held back its participation during the municipal bond rally.
What were your key investment themes?
Our defensive strategies remained in place, since we expected continued pressure on interest rates over the longer term as the Fed unwinds its economic stimulus program and investors adjust their expectations about the central bank’s monetary policy.
Ten-year U.S. Treasury yields were especially volatile in January 2014, initially falling from a high of 3.03% to a low of 2.58% before trading in a defined range for the remainder of the first quarter. The release of some weaker-than-expected economic data, coupled with the Fed’s announcement that it would taper bond purchases by an additional $10 billion
Credit quality overview
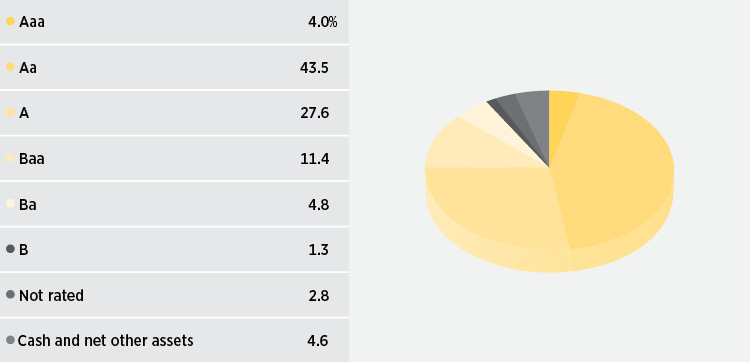
Credit qualities are shown as a percentage of the fund’s net assets as of 5/31/14. A bond rated Baa or higher (MIG3/VMIG3 or higher, for short-term debt) is considered investment grade. The chart reflects Moody’s ratings; percentages may include bonds or derivatives not rated by Moody’s but rated by Standard & Poor’s (S&P) or, if unrated by S&P, by Fitch ratings, and then included in the closest equivalent Moody’s rating. Ratings may vary over time.
Cash and net other assets, if any, represent the market value weights of cash, derivatives, short-term securities, and other unclassified assets in the portfolio. The fund itself has not been rated by an independent rating agency.
New York Tax Exempt Income Fund 7
per month in February, fueled concern over the pace of economic growth in the United States. Higher-risk assets sold off as investors moved into safe-haven U.S. Treasuries. Comments by Fed Chair Janet Yellen following the central bank’s March meeting seemed to come as somewhat of a surprise to the market, as she implied that interest-rate hikes could begin as early as the first quarter of 2015 if the pace of tapering bond purchases continued on its current path. However, those fears generally had eased by the end of the reporting period.
Amid this volatility, we kept the fund’s duration positioning, or interest-rate sensitivity, below that of its Lipper peer group. This included maintaining a slightly higher cash position in the portfolio to help shelter it from price pressures in an interest-rate environment that might be trending higher. We believe carrying slightly higher-than-average cash balances affords the fund greater flexibility to purchase what we consider to be attractively valued bonds even in a rising-rate environment. We continued to emphasize essential service revenue bonds, which are typically issued by state and local government entities to finance specific revenue-generating projects. While we believe that conditions are improving at the state and local levels, we continued to underweight local G.O. bonds relative to the Lipper peer group. These securities rely on the taxing power of the issuer and the health of the local economy to make payments on these bonds.
What did this cautious undertone mean for the fund’s positioning during the reporting period?
The fund’s shorter-duration interest-rate positioning detracted from returns relative
Comparison of top sector weightings
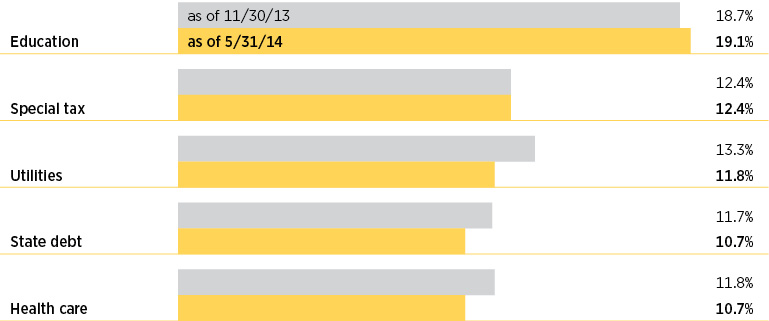
This chart shows how the fund’s top weightings have changed over the past six months. Allocations are shown as a percentage of the fund’s net assets. Current period summary information may differ from the information in the portfolio schedule notes included in the financial statements due to the inclusion of derivative securities, any interest accruals, and the use of different classifications of securities for presentation purposes. Holdings and allocations may vary over time.
8 New York Tax Exempt Income Fund
to its Lipper peer group as rates moved lower during the second half of the period. In terms of sectors, relative to the fund’s Lipper peer universe, we favored higher education, utility, and continuing-care retirement community bonds. This credit positioning contributed to the fund’s performance. The portfolio’s exposure to Puerto Rico detracted from returns over the period. After Puerto Rico issued new bonds in March 2014, there was short-term improvement in the country’s outlook, and Puerto Rico bonds rallied accordingly. Thus, our underweight positioning detracted from performance relative to the fund’s Lipper peer group for the period.
What is your outlook for the municipal bond market, and how are you positioning the fund?
Over the course of the reporting period, interest rates and bond yields fell, bond prices rose, and investors appeared more willing to take on risk — suggesting, in our view, that investors believe Fed policy is going to remain accommodative for some time. In the closing weeks of the period, the markets were encouraged by Yellen’s May 7 testimony to lawmakers. Yellen suggested that the central bank would probably end its bond-buying stimulus program in the fall of 2014, if the labor market continued to improve. She noted that “a high degree of monetary accommodation remains warranted” with inflation and employment still far from the central bank’s goals.
Despite the strong start for municipal bonds in 2014 and our belief that the credit outlook for municipal bonds appears solid given improvement in U.S. growth, we still remain cautious and believe that there could be some volatility surrounding supply/demand factors and interest rates in the coming months. With regard to tax policy, we think comprehensive tax reform is unlikely at least until after the 2014 mid-term elections. Over the longer term, we believe federal deficits and pressures around social programs will likely contribute to the ongoing debate for broader tax reform, which could affect the value of municipal bonds.
Against this backdrop, we plan to maintain the fund’s defensive duration because we believe that the municipal bond market’s attractive returns thus far in 2014 can be attributed primarily to a combination of robust demand and limited supply of new bond issuance. We also remain cautious with respect to municipal securities at the lower end of the credit spectrum.
Thank you, Thalia, for your time and insights today.
The views expressed in this report are exclusively those of Putnam Management and are subject to change. They are not meant as investment advice.
Please note that the holdings discussed in this report may not have been held by the fund for the entire period. Portfolio composition is subject to review in accordance with the fund’s investment strategy and may vary in the future. Current and future portfolio holdings are subject to risk.
Portfolio Manager Thalia Meehan holds a B.A. from Williams College. Thalia joined Putnam in 1989 and has been in the investment industry since 1983.
In addition to Thalia, your fund’s portfolio managers are Paul M. Drury and Susan A. McCormack.
New York Tax Exempt Income Fund 9
IN THE NEWS
The unusually harsh winter in the United States and the Ukraine conflict led the World Bank to cut its outlook for global economic growth for 2014. In its June “Global Economic Prospects” report, the bank reduced its global growth forecast to 2.8% from the 3.2% projection it issued in January. Fortunately, the reduction reflects the slowdown that occurred during the winter, and developed economies appear poised to bounce back. Growth in the United States and Europe is expected to quicken as the effects of government spending cuts diminish, more people find jobs, and consumer and corporate demand rebounds, the bank reported. Meanwhile, many emerging-market economies continue to face headwinds. The bank also warned of a “hard landing” in China that could weigh down East Asian countries and hurt commodity exporters.
10 New York Tax Exempt Income Fund
Your fund’s performance |
This section shows your fund’s performance, price, and distribution information for periods ended May 31, 2014, the end of the first half of its current fiscal year. In accordance with regulatory requirements for mutual funds, we also include performance information as of the most recent calendar quarter-end and expense information taken from the fund’s current prospectus. Performance should always be considered in light of a fund’s investment strategy. Data represent past performance. Past performance does not guarantee future results. More recent returns may be less or more than those shown. Investment return and principal value will fluctuate, and you may have a gain or a loss when you sell your shares. Performance information does not reflect any deduction for taxes a shareholder may owe on fund distributions or on the redemption of fund shares. For the most recent month-end performance, please visit the Individual Investors section at putnam.com or call Putnam at 1-800-225-1581. Class Y shares are not available to all investors. See the Terms and Definitions section in this report for definitions of the share classes offered by your fund. |
Fund performance Total return for periods ended 5/31/14
| Class A | Class B | Class C | Class M | Class Y |
(inception dates) | (9/2/83) | (1/4/93) | (7/26/99) | (4/10/95) | (1/2/08) |
| Before sales charge | After sales charge | Before CDSC | After CDSC | Before CDSC | After CDSC | Before sales charge | After sales charge | Net
asset value |
Annual average | | | | | | | | | |
(life of fund) | 6.66% | 6.52% | 6.42% | 6.42% | 5.80% | 5.80% | 6.27% | 6.16% | 6.71% |
10 years | 52.15 | 46.06 | 44.81 | 44.81 | 40.59 | 40.59 | 47.81 | 43.01 | 54.28 |
Annual average | 4.29 | 3.86 | 3.77 | 3.77 | 3.47 | 3.47 | 3.98 | 3.64 | 4.43 |
5 years | 29.37 | 24.20 | 25.24 | 23.24 | 24.27 | 24.27 | 27.40 | 23.26 | 30.62 |
Annual average | 5.29 | 4.43 | 4.60 | 4.27 | 4.44 | 4.44 | 4.96 | 4.27 | 5.49 |
3 years | 15.43 | 10.81 | 13.30 | 10.30 | 12.63 | 12.63 | 14.32 | 10.60 | 16.19 |
Annual average | 4.90 | 3.48 | 4.25 | 3.32 | 4.05 | 4.05 | 4.56 | 3.42 | 5.13 |
1 year | 0.93 | –3.10 | 0.30 | –4.56 | 0.04 | –0.93 | 0.54 | –2.73 | 1.16 |
6 months | 5.59 | 1.36 | 5.27 | 0.27 | 5.06 | 4.06 | 5.31 | 1.89 | 5.70 |
Current performance may be lower or higher than the quoted past performance, which cannot guarantee future results. After-sales-charge returns for class A and M shares reflect the deduction of the maximum 4.00% and 3.25% sales charge, respectively, levied at the time of purchase. Class B share returns after contingent deferred sales charge (CDSC) reflect the applicable CDSC, which is 5% in the first year, declining over time to 1% in the sixth year, and is eliminated thereafter. Class C share returns after CDSC reflect a 1% CDSC for the first year that is eliminated thereafter. Class Y shares have no initial sales charge or CDSC. Performance for class B, C, M, and Y shares before their inception is derived from the historical performance of class A shares, adjusted for the applicable sales charge (or CDSC) and the higher operating expenses for such shares, except for class Y shares, for which 12b-1 fees are not applicable.
For a portion of the periods, the fund had expense limitations, without which returns would have been lower.
Class B share performance reflects conversion to class A shares after eight years.
New York Tax Exempt Income Fund 11
Fund price and distribution information For the six-month period ended 5/31/14
Distributions | Class A | Class B | Class C | Class M | Class Y |
Number | 6 | 6 | 6 | 6 | 6 |
Income 1 | $0.158342 | $0.132039 | $0.125722 | $0.146626 | $0.167559 |
Capital gains 2 | — | — | — | — | — |
Total | $0.158342 | $0.132039 | $0.125722 | $0.146626 | $0.167559 |
Share value | Before
sales charge | After
sales charge | Net asset
value | Net asset
value | Before
sales charge | After
sales charge | Net asset
value |
11/30/13 | $8.29 | $8.64 | $8.27 | $8.29 | $8.30 | $8.58 | $8.29 |
5/31/14 | 8.59 | 8.95 | 8.57 | 8.58 | 8.59 | 8.88 | 8.59 |
Current rate (end of period) | Before
sales charge | After
sales charge | Net asset
value | Net asset
value | Before
sales charge | After
sales charge | Net asset
value |
Current dividend rate 3 | 3.58% | 3.43% | 2.96% | 2.80% | 3.30% | 3.19% | 3.80% |
Taxable equivalent 4(a) | 6.94 | 6.65 | 5.74 | 5.43 | 6.39 | 6.18 | 7.36 |
Taxable equivalent 4(b) | 7.25 | 6.94 | 5.99 | 5.67 | 6.68 | 6.46 | 7.69 |
Current 30-day SEC yield 5 | N/A | 2.24 | 1.72 | 1.57 | N/A | 2.00 | 2.56 |
Taxable equivalent 4(a) | N/A | 4.34 | 3.33 | 3.04 | N/A | 3.88 | 4.96 |
Taxable equivalent 4(b) | N/A | 4.53 | 3.48 | 3.18 | N/A | 4.05 | 5.18 |
The classification of distributions, if any, is an estimate. Before-sales-charge share value and current dividend rate for class A and M shares, if applicable, do not take into account any sales charge levied at the time of purchase. After-sales-charge share value, current dividend rate, and current 30-day SEC yield, if applicable, are calculated assuming that the maximum sales charge (4.00% for class A shares and 3.25% for class M shares) was levied at the time of purchase. Final distribution information will appear on your year-end tax forms.
1 For some investors, investment income may be subject to the federal alternative minimum tax.
2 Capital gains, if any, are taxable for federal and, in most cases, state purposes.
3 Most recent distribution, including any return of capital and excluding capital gains, annualized and divided by share price before or after sales charge at period-end.
4 Assumes (a) maximum 48.39% combined federal income tax and New York state 2014 personal income tax or (b) maximum 50.59% combined federal, New York state, and New York City 2014 personal income tax rates. Results for investors subject to lower tax rates would not be as advantageous.
5 Based only on investment income and calculated using the maximum offering price for each share class, in accordance with SEC guidelines.
12 New York Tax Exempt Income Fund
Comparative index returns For periods ended 5/31/14
| Barclays Municipal Bond Index | Lipper New York Municipal Debt Funds category average* |
Annual average (life of fund) | 7.14% | 6.53% |
10 years | 62.87 | 50.52 |
Annual average | 5.00 | 4.16 |
5 years | 31.26 | 30.78 |
Annual average | 5.59 | 5.49 |
3 years | 17.23 | 16.26 |
Annual average | 5.44 | 5.14 |
1 year | 3.05 | 1.25 |
6 months | 5.63 | 6.41 |
Index and Lipper results should be compared with fund performance before sales charge, before CDSC, or at net asset value.
*Over the 6-month, 1-year, 3-year, 5-year, 10-year, and life-of-fund periods ended 5/31/14, there were 102, 101, 92, 81, 71, and 3 funds, respectively, in this Lipper category.
Fund performance as of most recent calendar quarter Total return for periods ended 6/30/14
| Class A | Class B | Class C | Class M | Class Y |
(inception dates) | (9/2/83) | (1/4/93) | (7/26/99) | (4/10/95) | (1/2/08) |
| Before sales charge | After sales charge | Before CDSC | After CDSC | Before CDSC | After CDSC | Before sales charge | After sales charge | Net
asset value |
Annual average | | | | | | | | | |
(life of fund) | 6.65% | 6.51% | 6.41% | 6.41% | 5.78% | 5.78% | 6.26% | 6.14% | 6.70% |
10 years | 51.93 | 45.85 | 44.60 | 44.60 | 40.22 | 40.22 | 47.43 | 42.64 | 54.08 |
Annual average | 4.27 | 3.85 | 3.76 | 3.76 | 3.44 | 3.44 | 3.96 | 3.62 | 4.42 |
5 years | 30.46 | 25.24 | 26.45 | 24.45 | 25.32 | 25.32 | 28.63 | 24.45 | 31.89 |
Annual average | 5.46 | 4.60 | 4.81 | 4.47 | 4.62 | 4.62 | 5.16 | 4.47 | 5.69 |
3 years | 14.98 | 10.38 | 12.86 | 9.86 | 12.20 | 12.20 | 14.01 | 10.31 | 15.74 |
Annual average | 4.76 | 3.35 | 4.12 | 3.19 | 3.91 | 3.91 | 4.47 | 3.32 | 4.99 |
1 year | 4.51 | 0.33 | 3.74 | –1.26 | 3.57 | 2.57 | 4.09 | 0.71 | 4.74 |
6 months | 6.08 | 1.84 | 5.64 | 0.64 | 5.55 | 4.55 | 5.80 | 2.36 | 6.07 |
See the discussion following the fund performance table on page 11 for information about the calculation of fund performance.
New York Tax Exempt Income Fund 13
Your fund’s expenses |
As a mutual fund investor, you pay ongoing expenses, such as management fees, distribution fees (12b-1 fees), and other expenses. Using the following information, you can estimate how these expenses affect your investment and compare them with the expenses of other funds. You may also pay one-time transaction expenses, including sales charges (loads) and redemption fees, which are not shown in this section and would have resulted in higher total expenses. For more information, see your fund’s prospectus or talk to your financial representative. |
Expense ratios
| Class A | Class B | Class C | Class M | Class Y |
Total annual operating expenses for the fiscal year ended 11/30/13 | 0.75% | 1.38% | 1.53% | 1.03% | 0.53% |
Annualized expense ratio for the six-month period ended 5/31/14 | 0.74% | 1.37% | 1.52% | 1.02% | 0.52% |
Fiscal-year expense information in this table is taken from the most recent prospectus, is subject to change, and may differ from that shown for the annualized expense ratio and in the financial highlights of this report.
Expenses are shown as a percentage of average net assets.
Expenses per $1,000
The following table shows the expenses you would have paid on a $1,000 investment in the fund from December 1, 2013, to May 31, 2014. It also shows how much a $1,000 investment would be worth at the close of the period, assuming actual returns and expenses.
| Class A | Class B | Class C | Class M | Class Y |
Expenses paid per $1,000*† | $3.79 | $7.01 | $7.77 | $5.22 | $2.67 |
Ending value (after expenses) | $1,055.90 | $1,052.70 | $1,050.60 | $1,053.10 | $1,057.00 |
*Expenses for each share class are calculated using the fund’s annualized expense ratio for each class, which represents the ongoing expenses as a percentage of average net assets for the six months ended 5/31/14. The expense ratio may differ for each share class.
†Expenses are calculated by multiplying the expense ratio by the average account value for the period; then multiplying the result by the number of days in the period; and then dividing that result by the number of days in the year.
14 New York Tax Exempt Income Fund
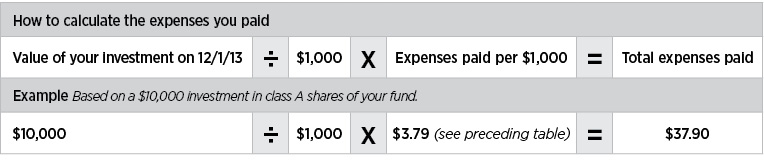
Estimate the expenses you paid |
To estimate the ongoing expenses you paid for the six months ended May 31, 2014, use the following calculation method. To find the value of your investment on December 1, 2013, call Putnam at 1-800-225-1581. |
|
Compare expenses using the SEC’s method
The Securities and Exchange Commission (SEC) has established guidelines to help investors assess fund expenses. Per these guidelines, the following table shows your fund’s expenses based on a $1,000 investment, assuming a hypothetical 5% annualized return. You can use this information to compare the ongoing expenses (but not transaction expenses or total costs) of investing in the fund with those of other funds. All mutual fund shareholder reports will provide this information to help you make this comparison. Please note that you cannot use this information to estimate your actual ending account balance and expenses paid during the period.
| Class A | Class B | Class C | Class M | Class Y |
Expenses paid per $1,000*† | $3.73 | $6.89 | $7.64 | $5.14 | $2.62 |
Ending value (after expenses) | $1,021.24 | $1,018.10 | $1,017.35 | $1,019.85 | $1,022.34 |
*Expenses for each share class are calculated using the fund’s annualized expense ratio for each class, which represents the ongoing expenses as a percentage of average net assets for the six months ended 5/31/14. The expense ratio may differ for each share class.
†Expenses are calculated by multiplying the expense ratio by the average account value for the six-month period; then multiplying the result by the number of days in the six-month period; and then dividing that result by the number of days in the year.
New York Tax Exempt Income Fund 15
Terms and definitions
Important terms
Total return shows how the value of the fund’s shares changed over time, assuming you held the shares through the entire period and reinvested all distributions in the fund.
Before sales charge, or net asset value, is the price, or value, of one share of a mutual fund, without a sales charge. Before-sales-charge figures fluctuate with market conditions, and are calculated by dividing the net assets of each class of shares by the number of outstanding shares in the class.
After sales charge is the price of a mutual fund share plus the maximum sales charge levied at the time of purchase. After-sales-charge performance figures shown here assume the 4.00% maximum sales charge for class A shares and 3.25% for class M shares.
Contingent deferred sales charge (CDSC) is generally a charge applied at the time of the redemption of class B or C shares and assumes redemption at the end of the period. Your fund’s class B CDSC declines over time from a 5.00% maximum during the first year to 1.00% during the sixth year. After the sixth year, the CDSC no longer applies. The CDSC for class C shares is 1.00% for one year after purchase.
Share classes
Class A shares are generally subject to an initial sales charge and no CDSC (except on certain redemptions of shares bought without an initial sales charge).
Class B shares are not subject to an initial sales charge. They may be subject to a CDSC.
Class C shares are not subject to an initial sales charge and are subject to a CDSC only if the shares are redeemed during the first year.
Class M shares have a lower initial sales charge and a higher 12b-1 fee than class A shares and no CDSC.
Class Y shares are not subject to an initial sales charge or CDSC, and carry no 12b-1 fee. They are generally only available to corporate and institutional clients and clients in other approved programs.
Fixed-income terms
Current rate is the annual rate of return earned from dividends or interest of an investment. Current rate is expressed as a percentage of the price of a security, fund share, or principal investment.
Yield curve is a graph that plots the yields of bonds with equal credit quality against their differing maturity dates, ranging from shortest to longest. It is used as a benchmark for other debt, such as mortgage or bank lending rates.
Comparative indexes
Barclays Municipal Bond Index is an unmanaged index of long-term fixed-rate investment-grade tax-exempt bonds.
Barclays U.S. Aggregate Bond Index is an unmanaged index of U.S. investment-grade fixed-income securities.
BofA Merrill Lynch U.S. 3-Month Treasury Bill Index is an unmanaged index that seeks to measure the performance of U.S. Treasury bills available in the marketplace.
S&P 500 Index is an unmanaged index of common stock performance.
Indexes assume reinvestment of all distributions and do not account for fees. Securities and performance of a fund and an index will differ. You cannot invest directly in an index.
Lipper is a third-party industry-ranking entity that ranks mutual funds. Its rankings do not reflect sales charges. Lipper rankings are based on total return at net asset value relative to other funds that have similar current investment styles or objectives as determined by Lipper. Lipper may change a fund’s category assignment at its discretion. Lipper category averages reflect performance trends for funds within a category.
16 New York Tax Exempt Income Fund
Other information for shareholders
Important notice regarding delivery of shareholder documents
In accordance with Securities and Exchange Commission (SEC) regulations, Putnam sends a single copy of annual and semiannual shareholder reports, prospectuses, and proxy statements to Putnam shareholders who share the same address, unless a shareholder requests otherwise. If you prefer to receive your own copy of these documents, please call Putnam at 1-800-225-1581, and Putnam will begin sending individual copies within 30 days.
Proxy voting
Putnam is committed to managing our mutual funds in the best interests of our shareholders. The Putnam funds’ proxy voting guidelines and procedures, as well as information regarding how your fund voted proxies relating to portfolio securities during the 12-month period ended June 30, 2013, are available in the Individual Investors section of putnam.com, and on the SEC’s website, www.sec.gov. If you have questions about finding forms on the SEC’s website, you may call the SEC at 1-800-SEC-0330. You may also obtain the Putnam funds’ proxy voting guidelines and procedures at no charge by calling Putnam’s Shareholder Services at 1-800-225-1581.
Fund portfolio holdings
The fund will file a complete schedule of its portfolio holdings with the SEC for the first and third quarters of each fiscal year on Form N-Q. Shareholders may obtain the fund’s Forms N-Q on the SEC’s website at www.sec.gov. In addition, the fund’s Forms N-Q may be reviewed and copied at the SEC’s Public Reference Room in Washington, D.C. You may call the SEC at 1-800-SEC-0330 for information about the SEC’s website or the operation of the Public Reference Room.
Trustee and employee fund ownership
Putnam employees and members of the Board of Trustees place their faith, confidence, and, most importantly, investment dollars in Putnam mutual funds. As of May 31, 2014, Putnam employees had approximately $466,000,000 and the Trustees had approximately $113,000,000 invested in Putnam mutual funds. These amounts include investments by the Trustees’ and employees’ immediate family members as well as investments through retirement and deferred compensation plans.
New York Tax Exempt Income Fund 17
A guide to financial statements
These sections of the report, as well as the accompanying Notes, constitute the fund’s financial statements.
The fund’s portfolio lists all the fund’s investments and their values as of the last day of the reporting period. Holdings are organized by asset type and industry sector, country, or state to show areas of concentration and diversification.
Statement of assets and liabilities shows how the fund’s net assets and share price are determined. All investment and non-investment assets are added together. Any unpaid expenses and other liabilities are subtracted from this total. The result is divided by the number of shares to determine the net asset value per share, which is calculated separately for each class of shares. (For funds with preferred shares, the amount subtracted from total assets includes the liquidation preference of preferred shares.)
Statement of operations shows the fund’s net investment gain or loss. This is done by first adding up all the fund’s earnings — from dividends and interest income — and subtracting its operating expenses to determine net investment income (or loss). Then, any net gain or loss the fund realized on the sales of its holdings — as well as any unrealized gains or losses over the period — is added to or subtracted from the net investment result to determine the fund’s net gain or loss for the fiscal period.
Statement of changes in net assets shows how the fund’s net assets were affected by the fund’s net investment gain or loss, by distributions to shareholders, and by changes in the number of the fund’s shares. It lists distributions and their sources (net investment income or realized capital gains) over the current reporting period and the most recent fiscal year-end. The distributions listed here may not match the sources listed in the Statement of operations because the distributions are determined on a tax basis and may be paid in a different period from the one in which they were earned. Dividend sources are estimated at the time of declaration. Actual results may vary. Any non-taxable return of capital cannot be determined until final tax calculations are completed after the end of the fund’s fiscal year.
Financial highlights provide an overview of the fund’s investment results, per-share distributions, expense ratios, net investment income ratios, and portfolio turnover in one summary table, reflecting the five most recent reporting periods. In a semiannual report, the highlights table also includes the current reporting period.
18 New York Tax Exempt Income Fund
The fund’s portfolio 5/31/14 (Unaudited)
Key to holding’s abbreviations
AGM Assured Guaranty Municipal Corporation
AGO Assured Guaranty, Ltd.
AMBAC AMBAC Indemnity Corporation
CIFG CIFG Assurance North America, Inc.
Cmnwlth. of PR Gtd. Commonwealth of Puerto Rico Guaranteed
COP Certificates of Participation
FHA Insd. Federal Housing Administration Insured
FRN Floating Rate Notes: the rate shown is the current interest rate at the close of the reporting period
G.O. Bonds General Obligation Bonds
NATL National Public Finance Guarantee Corp.
SGI Syncora Guarantee, Inc.
U.S. Govt. Coll. U.S. Government Collateralized
VRDN Variable Rate Demand Notes, which are floating-rate securities with long-term maturities that carry coupons that reset and are payable upon demand either daily, weekly or monthly. The rate shown is the current interest rate at the close of the reporting period.
| MUNICIPAL BONDS AND NOTES (98.7%)* | Rating** | | Principal
amount | Value |
| Guam (0.9%) | | | | |
| Territory of GU, Rev. Bonds (Section 30), Ser. A, 5 5/8s, 12/1/29 | BBB+ | | $3,850,000 | $4,191,303 |
| Territory of GU, Bus. Privilege Tax Rev. Bonds, Ser. A, 5s, 1/1/31 | A | | 1,000,000 | 1,046,790 |
| Territory of GU, Dept. of Ed. COP (John F. Kennedy High School), Ser. A, 6 7/8s, 12/1/40 | B+ | | 500,000 | 553,175 |
| Territory of GU, Govt. Wtr. Wks. Auth. Wtr. & Waste Wtr. Syst. Rev. Bonds, 5 5/8s, 7/1/40 | A– | | 2,100,000 | 2,201,535 |
| Territory of GU, Pwr. Auth. Rev. Bonds, Ser. A | | | | |
| 5 1/2s, 10/1/40 | BBB | | 1,300,000 | 1,406,431 |
| 5s, 10/1/34 | BBB | | 700,000 | 738,962 |
| | | | | 10,138,196 |
| Massachusetts (0.3%) | | | | |
| MA State VRDN (Construction Loan), Ser. A, 0.07s, 3/1/26 | VMIG1 | | 3,000,000 | 3,000,000 |
| | | | | 3,000,000 |
| Mississippi (0.7%) | | | | |
| MS State Bus. Fin. Commission Gulf Opportunity Zone VRDN (Chevron USA, Inc.), Ser. E, 0.06s, 12/1/30 | VMIG1 | | 7,000,000 | 7,000,000 |
| | | | | 7,000,000 |
| New York (93.0%) | | | | |
| Albany, Cap. Resource Corp. Rev. Bonds (St. Peter’s Hosp.), 6 1/4s, 11/15/38 | A+ | | 4,110,000 | 4,653,301 |
| Albany, Indl. Dev. Agcy. Civic Fac. Rev. Bonds | | | | |
| (Albany College of Pharmacy), Ser. A, 5 5/8s, 12/1/34 | BBB | | 700,000 | 704,494 |
| (St. Peters Hosp.), Ser. E, 5 1/2s, 11/15/27 | A+ | | 1,000,000 | 1,107,210 |
| (Albany College of Pharmacy), Ser. A, 5 3/8s, 12/1/24 | BBB | | 1,800,000 | 1,813,140 |
| (St. Peters Hosp.), Ser. A, 5 1/4s, 11/15/32 | A+ | | 2,100,000 | 2,242,254 |
| (St. Peter’s Hosp.), Ser. A, 5 1/4s, 11/15/27 | A+ | | 3,000,000 | 3,229,650 |
| (Albany Law School), Ser. A, 5s, 7/1/31 | BBB | | 3,000,000 | 3,110,520 |
| Battery Park, Rev. Bonds, Ser. A, 5s, 11/1/30 | Aaa | | 5,235,000 | 6,162,694 |
New York Tax Exempt Income Fund 19
| MUNICIPAL BONDS AND NOTES (98.7%)* cont. | Rating** | | Principal
amount | Value |
| New York cont. | | | | |
| Brooklyn Arena Local Dev. Corp. Rev. Bonds (Barclays Ctr.), 6 3/8s, 7/15/43 | Baa3 | | $2,000,000 | $2,221,760 |
| Broome Cnty., Indl. Dev. Agcy. Continuing Care Retirement Rev. Bonds (Good Shepard Village), Ser. A, 6 7/8s, 7/1/40 | B/P | | 715,000 | 739,088 |
| Buffalo & Fort Erie, Pub. Bridge Auth. Rev. Bonds (Toll Bridge Syst.) | | | | |
| 5s, 1/1/25 ## | A+ | | 400,000 | 481,276 |
| 5s, 1/1/24 ## | A+ | | 250,000 | 300,328 |
| Build NYC City Resource Corp., Rev. Bonds | | | | |
| (South Bronx Charter School for Intl. Cultures), Ser. A, 5s, 4/15/33 | BB+ | | 2,000,000 | 1,856,780 |
| (Bronx Charter School for Excellence), 5s, 4/1/33 | BBB– | | 500,000 | 508,895 |
| (YMCA of Greater NY), 5s, 8/1/32 | A– | | 1,740,000 | 1,875,076 |
| Canton, Cap. Resource Corp., Student Hsg. Fac. Rev. Bonds (Grasse River — SUNY Canton), Ser. A, AGM, 5s, 5/1/40 | AA | | 1,000,000 | 1,067,300 |
| Chautauqua Cnty., Indl. Dev. Agcy. Rev. Bonds (Dunkirk Pwr.), 5 7/8s, 4/1/42 | Baa3 | | 4,000,000 | 4,342,440 |
| Chemung Cnty., Indl. Dev. Agcy. Civic Fac. Rev. Bonds (Arnot Ogden Med. Ctr.) | | | | |
| 5s, 11/1/34 | A– | | 1,300,000 | 1,300,286 |
| Ser. A, 5s, 11/1/29 | A– | | 3,250,000 | 3,251,398 |
| Dutchess Cnty., Local Dev. Corp. Rev. Bonds (Anderson Ctr. Svcs., Inc.), 6s, 10/1/30 | BB+ | | 3,815,000 | 3,940,056 |
| Erie Cnty., Indl. Dev. Agcy. School Fac. Rev. Bonds (City School Dist. Buffalo), Ser. A, AGM | | | | |
| 5 3/4s, 5/1/28 | AA | | 5,000,000 | 5,697,400 |
| 5 3/4s, 5/1/25 | AA | | 10,330,000 | 11,804,298 |
| Essex Cnty., Indl. Dev. Agcy. Rev. Bonds (Intl. Paper Co.), Ser. A, 6.15s, 4/1/21 | Baa2 | | 1,065,000 | 1,066,725 |
| Geneva, Dev. Corp. Rev. Bonds (Hobart & William Smith Colleges) | | | | |
| 5 1/4s, 9/1/44 | A | | 2,000,000 | 2,214,240 |
| 5s, 9/1/32 | A | | 2,000,000 | 2,193,560 |
| Hempstead Town, Local Dev. Corp. Rev. Bonds | | | | |
| (Molloy College), 5 3/4s, 7/1/39 | BBB+ | | 2,500,000 | 2,726,625 |
| (Adelphi U.), Ser. B, 5 1/4s, 2/1/39 | A | | 1,500,000 | 1,591,980 |
| (Adelphi U.), Ser. B, 5s, 2/1/34 | A | | 3,000,000 | 3,178,500 |
| (Hofstra U.), 5s, 7/1/28 | A | | 650,000 | 720,499 |
| Hempstead, Indl. Dev. Agcy. Civic Fac. Rev. Bonds (Adelphi U.), 5s, 10/1/35 | A | | 1,500,000 | 1,545,735 |
| Hudson Yards, Infrastructure Corp. Rev. Bonds, Ser. A | | | | |
| 5 3/4s, 2/15/47 | A2 | | 3,000,000 | 3,430,500 |
| AMBAC, 5s, 2/15/47 | A2 | | 2,500,000 | 2,589,725 |
| Liberty, Dev. Corp. Rev. Bonds (Goldman Sachs Headquarters), 5 1/2s, 10/1/37 | A– | | 4,010,000 | 4,854,506 |
20 New York Tax Exempt Income Fund
| MUNICIPAL BONDS AND NOTES (98.7%)* cont. | Rating** | | Principal
amount | Value |
| New York cont. | | | | |
| Long Island, Pwr. Auth. Rev. Bonds, Ser. B, 5s, 9/1/25 | A– | | $1,000,000 | $1,131,770 |
| Long Island, Pwr. Auth. NY Elec. Syst. Rev. Bonds | | | | |
| Ser. A, 6s, 5/1/33 | A– | | 3,500,000 | 4,071,235 |
| Ser. C, CIFG, 5 1/4s, 9/1/29 | Baa1 | | 3,600,000 | 4,382,064 |
| Ser. C, 5s, 9/1/35 | A– | | 2,380,000 | 2,511,495 |
| AGM, zero %, 6/1/28 | AA | | 2,510,000 | 1,494,554 |
| Metro. Trans. Auth. Rev. Bonds | | | | |
| Ser. C, 5s, 11/15/41 | A+ | | 6,000,000 | 6,497,940 |
| Ser. D, 5s, 11/15/38 | A+ | | 4,070,000 | 4,447,777 |
| Ser. A, 5s, 11/15/37 | A+ | | 15,000,000 | 15,879,450 |
| Ser. D, 5s, 11/15/29 | A+ | | 6,000,000 | 6,765,360 |
| Ser. D-1, 5s, 11/1/28 | A+ | | 2,500,000 | 2,845,175 |
| Ser. A, NATL, 5s, 11/15/26 | AA– | | 5,000,000 | 5,578,600 |
| Ser. A, 5s, 11/15/22 | A+ | | 6,000,000 | 6,575,700 |
| Metro. Trans. Auth. Dedicated Tax Rev. Bonds | | | | |
| Ser. A, 5 1/2s, 11/15/39 | AA | | 9,000,000 | 10,089,360 |
| Ser. B, NATL, 5s, 11/15/25 | AA | | 2,600,000 | 2,859,428 |
| Ser. B, NATL, 5s, 11/15/24 | AA | | 3,000,000 | 3,300,120 |
| Metro. Trans. Auth. Svc. Contract Rev. Bonds (Trans. Fac.), Ser. O, 5 1/2s, 7/1/17 (Escrowed to maturity) | AA+ | | 15,000,000 | 16,871,400 |
| Monroe Cnty., Indl. Dev. Agcy. Civic Fac. Rev. Bonds (Highland Hosp. Rochester), 5s, 8/1/25 | A2 | | 495,000 | 510,291 |
| Monroe Cnty., Indl. Dev. Corp. Rev. Bonds | | | | |
| (Rochester Gen. Hosp.), Ser. A, 5s, 12/1/37 | A– | | 2,000,000 | 2,138,340 |
| (U. of Rochester), Ser. B, 5s, 7/1/33 | Aa3 | | 2,795,000 | 3,130,037 |
| (Rochester Gen. Hosp.), Ser. A, 5s, 12/1/32 | A– | | 1,250,000 | 1,361,788 |
| (U. of Rochester), Ser. B, 5s, 7/1/32 | Aa3 | | 3,040,000 | 3,422,037 |
| (St. John Fisher College), Ser. A, 5s, 6/1/29 | BBB+ | | 800,000 | 876,408 |
| Nassau Cnty., Econ. Assistance Corp. Rev. Bonds (South Nassau Cmntys. Hosp.), 5s, 7/1/27 | A3 | | 1,255,000 | 1,383,612 |
| Nassau Cnty., Indl. Dev. Agcy. Rev. Bonds (Inst. of Tech.), Ser. A, 4 3/4s, 3/1/26 | BBB+ | | 1,710,000 | 1,791,208 |
| Nassau Cnty., Local Econ. Assistance Corp. Rev. Bonds | | | | |
| (South Nassau Cmntys. Hosp.), 5s, 7/1/37 | A3 | | 500,000 | 518,125 |
| (Winthrop U. Hosp. Assn.), 5s, 7/1/37 | Baa1 | | 1,000,000 | 1,064,140 |
| (Catholic Hlth. Svcs. Of Long Island Oblig. Group), 5s, 7/1/33 | Baa1 | | 625,000 | 684,538 |
| (Catholic Hlth. Svcs. Of Long Island Oblig. Group), 5s, 7/1/32 | Baa1 | | 1,000,000 | 1,101,400 |
| Nassau Cnty., Tobacco Settlement Corp. Rev. Bonds, Ser. A-2, 5 1/4s, 6/1/26 | B– | | 6,640,000 | 6,180,844 |
| New York, G.O. Bonds, Ser. 1-I, 5s, 3/1/36 | Aa2 | | 5,000,000 | 5,570,600 |
| Niagara Area Dev. Corp. Rev. Bonds (Niagara U.), Ser. A | | | | |
| 5s, 5/1/42 | BBB+ | | 1,000,000 | 1,034,940 |
| 5s, 5/1/35 | BBB+ | | 1,670,000 | 1,751,028 |
| 5s, 5/1/30 | BBB+ | | 2,230,000 | 2,390,761 |
New York Tax Exempt Income Fund 21
| MUNICIPAL BONDS AND NOTES (98.7%)* cont. | Rating** | | Principal
amount | Value |
| New York cont. | | | | |
| Niagara Falls, City School Dist. COP (High School Fac.), AGM | | | | |
| 5s, 6/15/28 | AA | | $1,490,000 | $1,518,936 |
| 5s, 6/15/23 | AA | | 3,965,000 | 4,096,004 |
| Niagara, Area Dev. Corp. Solid Waste Disp. Fac. Rev. Bonds (Covanta Holding Corp.), Ser. A, 5 1/4s, 11/1/42 | Ba2 | | 2,450,000 | 2,491,111 |
| NY City, G.O. Bonds | | | | |
| Ser. F-1, 5s, 3/1/37 | Aa2 | | 5,000,000 | 5,524,700 |
| Ser. A-1, 5s, 8/1/32 | Aa2 | | 5,000,000 | 5,612,300 |
| Ser. C, AGM, 5s, 1/1/23 | Aa2 | | 10,000,000 | 11,014,300 |
| Ser. N, 5s, 8/1/20 | Aa2 | | 240,000 | 253,003 |
| Ser. N, U.S. Govt. Coll., 5s, 8/1/20 (Prerefunded 8/1/15) | Aa2 | | 760,000 | 802,461 |
| Ser. M, 5s, 4/1/20 | Aa2 | | 1,600,000 | 1,661,776 |
| Ser. M, U.S. Govt. Coll., 5s, 4/1/20 (Prerefunded 4/1/15) | AAA/P | | 15,000 | 15,600 |
| NY City, City Muni. Fin. Auth. Rev. Bonds (Wtr. & Swr. Syst.), Ser. A, 4 3/4s, 6/15/30 | AAA | | 5,815,000 | 6,275,781 |
| NY City, City Transitional Fin. Auth. Rev. Bonds (Bldg. Aid Fiscal 2008), Ser. S-1 | | | | |
| 5s, 1/15/29 | Aa3 | | 5,000,000 | 5,553,600 |
| 5s, 1/15/25 | Aa3 | | 3,000,000 | 3,374,730 |
| NY City, City Transitional Fin. Auth. VRDN (NYC Recovery), Ser. 3 | | | | |
| 0.07s, 11/1/22 | VMIG1 | | 1,535,000 | 1,535,000 |
| 0.06s, 11/1/22 | VMIG1 | | 10,785,000 | 10,785,000 |
| NY City, Cultural Resource Rev. Bonds | | | | |
| (Wildlife Conservation Society), 5s, 8/1/33 | Aa3 | | 2,500,000 | 2,812,400 |
| (Museum of Modern Art), Ser. 1A, 5s, 4/1/31 | Aa2 | | 3,500,000 | 3,928,225 |
| NY City, Cultural Resource VRDN | | | | |
| (Lincoln Ctr.), Ser. A-1, 0.08s, 12/1/35 (JPMorgan Chase Bank, N.A.) | VMIG1 | | 6,875,000 | 6,875,000 |
| (Lincoln Ctr. Perform Arts), Ser. A-2, 0.06s, 12/1/35 (Bank of New York Mellon) | VMIG1 | | 7,950,000 | 7,950,000 |
| NY City, Hsg. Dev. Corp. Rev. Bonds | | | | |
| (Multi-Fam. Hsg.), Ser. A-1-A, 5.45s, 11/1/46 | Aa2 | | 2,670,000 | 2,754,078 |
| (Multi-Fam. Hsg.), Ser. H-2-A, 5.35s, 5/1/41 | AA | | 1,200,000 | 1,234,392 |
| (Multi-Fam. Hsg.), Ser. H-2-A, 5.2s, 11/1/35 | AA | | 1,675,000 | 1,716,272 |
| Ser. H-2-A, 4.4s, 5/1/31 | Aa2 | | 4,000,000 | 4,151,880 |
| NY City, Indl. Dev. Agcy. Rev. Bonds | | | | |
| (Visy Paper, Inc.), 7.95s, 1/1/28 | B/P | | 2,600,000 | 2,612,506 |
| (Yankee Stadium — Pilot), AGO, 7s, 3/1/49 | AA | | 1,000,000 | 1,211,950 |
| (Queens Baseball Stadium — Pilot), AMBAC, 5s, 1/1/24 | Ba1 | | 3,500,000 | 3,638,600 |
| NY City, Indl. Dev. Agcy. Arpt. Facs. Rev. Bonds (Sr. Trips), Ser. A, 5s, 7/1/28 | BBB– | | 1,500,000 | 1,603,665 |
22 New York Tax Exempt Income Fund
| MUNICIPAL BONDS AND NOTES (98.7%)* cont. | Rating** | | Principal
amount | Value |
| New York cont. | | | | |
| NY City, Indl. Dev. Agcy. Civic Fac. Rev. Bonds | | | | |
| (United Jewish Appeal), Ser. A, 5 1/4s, 7/1/23 | Aa1 | | $2,545,000 | $2,552,915 |
| (St. Francis College), 5s, 10/1/34 | A– | | 1,000,000 | 1,003,290 |
| (Horace Mann School), NATL, 5s, 7/1/28 | AA– | | 7,000,000 | 7,006,160 |
| NY City, Indl. Dev. Agcy. Special Fac. FRN (Terminal One Group Assn.), 5 1/2s, 1/1/17 | A3 | | 4,500,000 | 4,800,240 |
| NY City, Indl. Dev. Agcy. Special Fac. Rev. Bonds (British Airways PLC), 5 1/4s, 12/1/32 | BB | | 2,050,000 | 2,049,877 |
| NY City, Muni. Wtr. & Swr. Fin. Auth. Rev. Bonds | | | | |
| Ser. EE, 5 1/4s, 6/15/40 | AA+ | | 10,000,000 | 11,077,700 |
| (Second Generation Resolution), Ser. GG-1, 5 1/4s, 6/15/32 | AA+ | | 6,000,000 | 6,748,200 |
| 5s, 6/15/46 | AA+ | | 2,500,000 | 2,741,500 |
| Ser. GG, 5s, 6/15/43 | AA+ | | 4,760,000 | 5,167,551 |
| Ser. D, 5s, 6/15/37 | AAA | | 6,000,000 | 6,215,820 |
| Ser. AA, 5s, 6/15/34 | AA+ | | 5,000,000 | 5,529,400 |
| NY City, Transitional Fin. Auth. Rev. Bonds | | | | |
| Ser. F-1, 5s, 5/1/39 | AAA | | 7,500,000 | 8,298,375 |
| Ser. A-1, 5s, 11/1/38 | AAA | | 2,500,000 | 2,804,725 |
| (Future Tax), Ser. D-1, 5s, 11/1/32 | AAA | | 5,000,000 | 5,666,850 |
| Ser. B-1, 5s, 11/1/30 | AAA | | 3,000,000 | 3,499,710 |
| NY City, Transitional Fin. Auth. Bldg. Aid Rev. Bonds | | | | |
| Ser. S-1, 5s, 7/15/37 | Aa3 | | 7,500,000 | 8,266,125 |
| Ser. S-1, NATL, 5s, 7/15/31 | Aa3 | | 10,500,000 | 11,328,765 |
| Ser. S-5, 5s, 1/15/30 | Aa3 | | 3,375,000 | 3,779,494 |
| NY City, Trust for Cultural Resource Rev. Bonds (Wildlife Conservation Society), Ser. A | | | | |
| 5s, 8/1/42 | Aa3 | | 1,915,000 | 2,099,012 |
| 5s, 8/1/38 | Aa3 | | 1,250,000 | 1,378,263 |
| NY City, Trust for Cultural Resources Rev. Bonds (Whitney Museum of American Art), 5s, 7/1/31 | A | | 2,000,000 | 2,174,780 |
| NY Cntys., Tobacco Trust II Rev. Bonds (Tobacco Settlement), 5 3/4s, 6/1/43 | Baa2 | | 5,000,000 | 5,000,400 |
| NY Cntys., Tobacco Trust III Rev. Bonds (Tobacco Settlement), 6s, 6/1/43 | A3 | | 1,300,000 | 1,301,820 |
| NY Cntys., Tobacco Trust IV Rev. Bonds, Ser. A, 5s, 6/1/38 | BB | | 7,250,000 | 6,301,048 |
| NY Liberty Dev. Corp. Rev. Bonds (Bank of America Tower), Ser. CL1, 5 5/8s, 1/15/46 | AA+ | | 2,000,000 | 2,211,620 |
| NY State Dorm. Auth. Rev. Bonds | | | | |
| (NYU Hosp. Ctr.), Ser. A, 6s, 7/1/40 | A3 | | 1,500,000 | 1,707,090 |
| (State U. Edl. Fac.), Ser. A, AGM, 5 7/8s, 5/15/17 | AA | | 8,950,000 | 9,955,891 |
| (Brooklyn Law School), 5 3/4s, 7/1/33 | Baa1 | | 1,000,000 | 1,078,200 |
| (City U.), Ser. A, 5 3/4s, 7/1/18 | Aa3 | | 10,000,000 | 10,996,400 |
| (City U.), Ser. A, 5 5/8s, 7/1/16 | Aa3 | | 9,860,000 | 10,427,640 |
| (Skidmore College), Ser. A, 5 1/2s, 7/1/41 | A1 | | 3,000,000 | 3,305,880 |
| (NYU), Ser. 1, AMBAC, 5 1/2s, 7/1/40 | Aa3 | | 8,500,000 | 10,564,225 |
New York Tax Exempt Income Fund 23
| MUNICIPAL BONDS AND NOTES (98.7%)* cont. | Rating** | | Principal
amount | Value |
| New York cont. | | | | |
| NY State Dorm. Auth. Rev. Bonds | | | | |
| (North Shore Long Island Jewish Group), Ser. A, 5 1/2s, 5/1/37 | A3 | | $11,500,000 | $12,453,120 |
| (Fordham U.), Ser. A, 5 1/2s, 7/1/36 | A2 | | 1,800,000 | 2,011,878 |
| (North Shore Long Island Jewish Group), Ser. E, 5 1/2s, 5/1/33 | A3 | | 2,000,000 | 2,196,860 |
| (NYU), Ser. 1, AMBAC, 5 1/2s, 7/1/31 | Aa3 | | 3,500,000 | 4,336,500 |
| (St. Joseph College), 5 1/4s, 7/1/35 | Baa3 | | 2,000,000 | 2,059,600 |
| (Manhattan Marymount), 5 1/4s, 7/1/29 | Baa2 | | 2,000,000 | 2,099,680 |
| (Rochester Inst. of Tech.), Ser. A, AMBAC, 5 1/4s, 7/1/19 | A1 | | 4,300,000 | 5,011,822 |
| (Highland Hosp. Rochester), 5.2s, 7/1/32 | A2 | | 1,000,000 | 1,082,040 |
| (Mount Sinai School of Medicine), 5 1/8s, 7/1/39 | A3 | | 15,000,000 | 15,838,200 |
| (Siena College), 5 1/8s, 7/1/39 | A3 | | 6,000,000 | 6,321,180 |
| (School Dist. Fin. Program), Ser. C, AGO, 5 1/8s, 10/1/36 | AA | | 3,380,000 | 3,713,437 |
| (St. Francis College), 5s, 10/1/40 | A– | | 3,000,000 | 3,197,100 |
| (Mental Hlth.), Ser. E, NATL, 5s, 2/15/35 | Aa3 | | 2,510,000 | 2,567,981 |
| (L I Jewish), Ser. A, 5s, 11/1/34 | A3 | | 1,800,000 | 1,884,096 |
| (Rochester U.), Ser. A, 5s, 7/1/34 | Aa3 | | 6,000,000 | 6,014,520 |
| (St. Francis College), 5s, 10/1/32 | A– | | 2,360,000 | 2,561,969 |
| (School Dist. Fin. Program), Ser. C, AGO, 5s, 10/1/31 | AA | | 2,000,000 | 2,215,140 |
| (Montefiore Hosp.), FHA Insd., NATL, 5s, 8/1/29 | AA– | | 4,000,000 | 4,091,040 |
| (NYU), Ser. A, NATL, 5s, 7/1/29 | Aa3 | | 6,705,000 | 6,726,322 |
| Ser. A, NATL, 5s, 10/1/25 | AA– | | 750,000 | 817,493 |
| (Cornell U.), Ser. A, 5s, 7/1/22 | Aa1 | | 6,395,000 | 6,972,980 |
| (NY U. Hosp. Ctr.), Ser. A, 5s, 7/1/20 | A3 | | 4,000,000 | 4,345,880 |
| NY State Dorm. Auth. Non-State Supported Debt Rev. Bonds | | | | |
| (Orange Regl. Med. Ctr.), 6 1/4s, 12/1/37 | Ba1 | | 7,500,000 | 7,685,250 |
| (NYU Hosp. Ctr.), Ser. B, 5 1/4s, 7/1/24 | A3 | | 3,315,000 | 3,588,255 |
| (Teachers College), 5s, 7/1/42 | A1 | | 3,000,000 | 3,218,040 |
| (Memorial Sloan-Kettering Cancer Ctr.), 5s, 7/1/36 | Aa3 | | 1,125,000 | 1,249,841 |
| (Memorial Sloan-Kettering Ctr.), Ser. A1, 5s, 7/1/36 | Aa3 | | 5,690,000 | 6,134,674 |
| (Teachers College), 5s, 7/1/34 | A1 | | 2,750,000 | 3,027,750 |
| (NY U.), Ser. A, AMBAC, 5s, 7/1/32 | Aa3 | | 3,000,000 | 3,274,590 |
| (U. of Rochester), Ser. A-1, 5s, 7/1/32 | Aa3 | | 8,000,000 | 8,616,080 |
| (Teachers College), Ser. A, 5s, 7/1/31 | A1 | | 1,750,000 | 1,944,915 |
| (The New School), 5s, 7/1/31 | A3 | | 5,000,000 | 5,446,700 |
| (Brooklyn Law School), Ser. A, 5s, 7/1/29 | Baa1 | | 1,000,000 | 1,079,860 |
| (NYU), Ser. B, 5s, 7/1/29 | Aa3 | | 6,530,000 | 7,355,588 |
| (St. John’s U.), Ser. A, 5s, 7/1/28 | A3 | | 500,000 | 560,940 |
| (Brooklyn Law School), Ser. A, 5s, 7/1/27 | Baa1 | | 1,000,000 | 1,095,850 |
| (U. of Rochester), Ser. A-1, 5s, 7/1/27 | Aa3 | | 1,900,000 | 2,074,401 |
24 New York Tax Exempt Income Fund
| MUNICIPAL BONDS AND NOTES (98.7%)* cont. | Rating** | | Principal
amount | Value |
| New York cont. | | | | |
| NY State Dorm. Auth. Non-State Supported Debt Rev. Bonds | | | | |
| (Brooklyn Law School), Ser. A, 5s, 7/1/26 | Baa1 | | $1,000,000 | $1,104,690 |
| (Columbia U.), Ser. C, 5s, 7/1/26 | Aaa | | 6,980,000 | 7,807,549 |
| (NYU Hosp. Ctr.), Ser. A, 5s, 7/1/26 | A3 | | 1,000,000 | 1,068,020 |
| (Teachers College), Ser. A, 5s, 7/1/26 | A1 | | 1,000,000 | 1,143,230 |
| (St. Johns U.), Ser. A, NATL, 5s, 7/1/23 | AA– | | 3,935,000 | 4,334,835 |
| (NYU Hosp. Ctr.), Ser. A, 5s, 7/1/22 | A3 | | 1,000,000 | 1,084,040 |
| NY State Dorm. Auth. Non-Supported Debt Rev. Bonds | | | | |
| (Culinary Inst. of America), 5 1/2s, 7/1/33 | Baa2 | | 735,000 | 803,561 |
| (Rochester Inst. of Tech.), 5s, 7/1/38 | A1 | | 2,000,000 | 2,184,380 |
| (Culinary Inst. of America), 5s, 7/1/34 | Baa2 | | 350,000 | 371,704 |
| NY State Dorm. Auth. Personal Income Tax Rev. Bonds | | | | |
| (Ed.), Ser. B, 5 3/4s, 3/15/36 | AAA | | 5,000,000 | 5,835,700 |
| Ser. C, 5s, 3/15/41 | AAA | | 10,000,000 | 10,904,200 |
| Ser. A, 5s, 3/15/28 | AAA | | 10,000,000 | 11,439,500 |
| Ser. A, 5s, 3/15/28 | AAA | | 3,325,000 | 3,741,955 |
| NY State Dorm. Auth. Personal Income Tax Gen. Purpose Rev. Bonds, Ser. D, 5s, 2/15/37 | AAA | | 3,070,000 | 3,402,235 |
| NY State Dorm. Auth. State Supported Debt Rev. Bonds | | | | |
| (City U.), Ser. B, 5s, 7/1/26 | AA– | | 5,000,000 | 5,596,600 |
| (State U. Dorm Fac.), Ser. E, 5s, 7/1/23 | Aa2 | | 3,000,000 | 3,388,140 |
| NY State Dorm. Auth. Supported Debt Rev. Bonds | | | | |
| (State U. of NY), Ser. A, 5s, 7/1/42 | Aa2 | | 2,000,000 | 2,187,300 |
| (State U. of NY), Ser. A, 5s, 7/1/41 | Aa2 | | 5,250,000 | 5,777,625 |
| (Mental Hlth. Svcs. Facs. Impt.), Ser. B, AMBAC, 5s, 2/15/30 | AA– | | 675,000 | 694,710 |
| (Mental Hlth. Svcs. Facs. Impt.), Ser. B, AMBAC, 5s, 2/15/30 (Prerefunded 2/15/15) | AAA/P | | 8,990,000 | 9,290,446 |
| NY State Energy Research & Dev. Auth. Gas Fac. Rev. Bonds (Brooklyn Union Gas), 6.952s, 7/1/26 | A2 | | 12,400,000 | 12,437,944 |
| NY State Env. Fac. Corp. Rev. Bonds | | | | |
| (Clean Wtr. and Drinking), Ser. A, 5s, 6/15/34 | Aaa | | 10,000,000 | 11,290,800 |
| (NY City Muni. Wtr. Fin. 2nd Resolution), 5s, 6/15/29 | Aaa | | 3,290,000 | 3,300,067 |
| (State Clean Wtr. & Drinking Revolving Fund), Ser. A, 5s, 6/15/29 | Aaa | | 2,500,000 | 2,822,150 |
| (State Clean Wtr. & Drinking Revolving Fund), Ser. C, 5s, 10/15/26 | Aaa | | 5,000,000 | 5,489,500 |
| (United Wtr. New Rochelle), Ser. A, 4 7/8s, 9/1/40 | A– | | 5,000,000 | 5,205,600 |
| NY State Env. Fac. Corp. State Clean Wtr. & Drinking Rev. Bonds, Ser. C, 5s, 10/15/35 | Aaa | | 5,000,000 | 5,372,150 |
| NY State Hsg. Fin. Agcy. Rev. Bonds (Affordable Hsg.) | | | | |
| Ser. A, 5s, 11/1/42 | Aa2 | | 4,660,000 | 4,933,076 |
| Ser. B, 4.85s, 11/1/41 | Aa2 | | 2,600,000 | 2,723,474 |
New York Tax Exempt Income Fund 25
| MUNICIPAL BONDS AND NOTES (98.7%)* cont. | Rating** | | Principal
amount | Value |
| New York cont. | | | | |
| NY State Liberty Dev. Corp. Rev. Bonds | | | | |
| (7 World Trade Ctr.), Class 3, 5s, 3/15/44 | Baa2 | | $1,000,000 | $1,038,440 |
| (7 World Trade Ctr.), Ser. 2, 5s, 9/15/43 | A2 | | 4,000,000 | 4,251,200 |
| (1 WTC Port Auth. Construction), 5s, 12/15/41 | Aa3 | | 10,000,000 | 10,725,200 |
| (4 World Trade Ctr.), 5s, 11/15/31 | A+ | | 2,500,000 | 2,759,450 |
| NY State Pwr. Auth. Rev. Bonds, Ser. A, 5s, 11/15/38 | Aa2 | | 2,000,000 | 2,213,100 |
| NY State Thruway Auth. Rev. Bonds | | | | |
| Ser. F, AMBAC, 5s, 1/1/30 | A2 | | 3,790,000 | 3,869,135 |
| Ser. F, AMBAC, U.S. Govt. Coll., 5s, 1/1/30 (Prerefunded 1/1/15) | A2 | | 7,950,000 | 8,171,487 |
| (Second Generation Hwy. & Bridge Trust Fund), Ser. B, 5s, 4/1/28 | AA | | 3,000,000 | 3,415,080 |
| Ser. H, NATL, 5s, 1/1/28 | AA– | | 1,235,000 | 1,356,820 |
| (Second Generation Hwy. & Bridge Trust Fund), Ser. B, 5s, 4/1/27 | AA | | 4,000,000 | 4,569,640 |
| (Second Generation Hwy. & Bridge Trust Fund), Ser. A, 5s, 4/1/25 | AA | | 4,000,000 | 4,407,960 |
| NY State Urban Dev. Corp. Rev. Bonds | | | | |
| Ser. D, 5 5/8s, 1/1/28 | AA– | | 9,500,000 | 11,011,830 |
| (Clarkson Ctr.), 5 1/2s, 1/1/20 | Aa3 | | 1,685,000 | 1,915,053 |
| (Clarkson Ctr.), 5 1/2s, 1/1/15 | Aa3 | | 740,000 | 743,419 |
| (Syracuse U.), 5 1/2s, 1/1/15 | Aa3 | | 445,000 | 446,842 |
| Ser. B-1, 5s, 3/15/36 | AAA | | 9,000,000 | 9,939,150 |
| Ser. A-1, 5s, 12/15/28 | AAA | | 5,000,000 | 5,747,150 |
| Ser. B, 5s, 1/1/27 | AA– | | 7,000,000 | 7,794,570 |
| Oneida Cnty., Indl. Dev. Agcy. Rev. Bonds (St. Elizabeth Med.), Ser. A, 5 7/8s, 12/1/29 | BB–/P | | 1,000,000 | 1,000,470 |
| Onodaga Cnty., Trust For Cultural Resources Rev. Bonds (Syracuse U.) | | | | |
| 5s, 12/1/36 | Aa3 | | 2,000,000 | 2,182,420 |
| 5s, 12/1/31 | Aa3 | | 2,000,000 | 2,290,920 |
| Onondaga Civic Dev. Corp. Rev. Bonds | | | | |
| (Le Moyne College), 5 3/8s, 7/1/40 | Baa2 | | 3,900,000 | 4,136,886 |
| (St. Joseph’s Hosp. Hlth. Ctr.), 5 1/8s, 7/1/31 | Ba2 | | 2,315,000 | 2,340,141 |
| (St. Joseph’s Hosp. Hlth. Ctr.), 5s, 7/1/42 | Ba2 | | 1,000,000 | 972,040 |
| (Le Moyne College), 5s, 7/1/32 | Baa2 | | 1,635,000 | 1,749,156 |
| Port Auth. NY & NJ Rev. Bonds, NATL, 4 3/4s, 10/15/28 | Aa3 | | 7,000,000 | 7,339,430 |
| Port Auth. NY & NJ Special Oblig. Rev. Bonds (JFK Intl. Air Term.), 6s, 12/1/42 | Baa3 | | 3,500,000 | 3,909,430 |
| Port Auth. of NY & NJ Rev. Bonds (Kennedy Intl. Arpt. — 5th Installment), 6 3/4s, 10/1/19 | BB+/P | | 2,485,000 | 2,484,752 |
| Rensselaer, City School Dist. COP, SGI | | | | |
| 5s, 6/1/21 | A–/P | | 2,010,000 | 2,041,557 |
| 5s, 6/1/20 | A–/P | | 1,150,000 | 1,169,815 |
| 5s, 6/1/19 | A–/P | | 1,345,000 | 1,372,828 |
| 5s, 6/1/18 | A–/P | | 1,180,000 | 1,214,904 |
26 New York Tax Exempt Income Fund
| MUNICIPAL BONDS AND NOTES (98.7%)* cont. | Rating** | | Principal
amount | Value |
| New York cont. | | | | |
| Rockland Cnty., G.O. Bonds, Ser. A, AGM, 5s, 3/1/24 | AA | | $1,600,000 | $1,881,824 |
| Sales Tax Asset Receivable Corp. Rev. Bonds, Ser. A, NATL, 5s, 10/15/26 | AAA | | 5,000,000 | 5,088,350 |
| Saratoga Cnty., Indl. Dev. Agcy. Civic Fac. Rev. Bonds (Saratoga Hosp.), Ser. B | | | | |
| 5 1/4s, 12/1/32 | A– | | 1,500,000 | 1,564,500 |
| 5 1/8s, 12/1/27 | A– | | 1,000,000 | 1,053,640 |
| Schenectady Cnty., Cap. Resource Corp. Rev. Bonds (Union College), 5s, 7/1/32 | A1 | | 3,430,000 | 3,809,495 |
| Seneca Cnty., Indl. Dev. Agcy. Civic Fac. Rev. Bonds (NY Chiropractic College), 5s, 10/1/27 | BBB | | 1,995,000 | 2,110,550 |
| St. Lawrence Cnty., Indl. Agcy. Rev. Bonds (Clarkson U.), Ser. A, 5 1/4s, 9/1/33 | A3 | | 1,050,000 | 1,160,114 |
| St. Lawrence Cnty., Indl. Dev. Agcy. Rev. Bonds (Clarkson U.), Ser. A, 5s, 9/1/41 | A3 | | 1,750,000 | 1,849,890 |
| St. Lawrence Cnty., Indl. Dev. Agcy. Civic Dev. Corp. Rev. Bonds (St. Lawrence U.), 5s, 7/1/43 | A2 | | 2,500,000 | 2,678,025 |
| Suffolk Cnty., Econ. Dev. Corp. Rev. Bonds (Peconic Landing Southold), 6s, 12/1/40 | BBB–/F | | 1,225,000 | 1,350,612 |
| Suffolk Cnty., Indl. Dev. Agcy. Rev. Bonds (Nissequogue Cogen. Partners Fac.), 5 1/2s, 1/1/23 | BBB–/P | | 1,860,000 | 1,860,502 |
| Suffolk Cnty., Indl. Dev. Agcy. Civic Fac. Rev. Bonds | | | | |
| (Southampton Hosp. Assn.), Ser. B, 7 5/8s, 1/1/30 | B–/P | | 420,000 | 420,218 |
| (Southampton Hosp. Assn.), Ser. A, 7 1/4s, 1/1/30 | B–/P | | 2,050,000 | 2,050,533 |
| (Inst. of Tech.), 5s, 3/1/26 | BBB+ | | 3,300,000 | 3,371,181 |
| Suffolk Cnty., Indl. Dev. Agcy. Cont. Care Retirement Rev. Bonds (Jefferson’s Ferry) | | | | |
| 5s, 11/1/15 | BBB– | | 975,000 | 1,013,045 |
| 4 5/8s, 11/1/16 | BBB– | | 1,000,000 | 1,048,870 |
| Syracuse, Indl. Dev. Agcy. Rev. Bonds (1st Mtge. — Jewish Home), Ser. A | | | | |
| 7 3/8s, 3/1/31 | B/P | | 2,800,000 | 2,782,276 |
| 7 3/8s, 3/1/21 | B/P | | 620,000 | 620,062 |
| Syracuse, Indl. Dev. Agcy. Civic Fac. VRDN (Syracuse U.) | | | | |
| Ser. A-2, 0.06s, 12/1/37 (JPMorgan Chase Bank, N.A.) | VMIG1 | | 8,535,000 | 8,535,000 |
| Ser. A-1, 0.06s, 7/1/37 (JPMorgan Chase Bank, N.A.) | VMIG1 | | 6,000,000 | 6,000,000 |
| Tobacco Settlement Rev. Bonds, Ser. 1, 5s, 6/1/34 | B | | 3,500,000 | 2,965,620 |
| Tobacco Settlement Fin. Corp. Rev. Bonds, Ser. B, 5s, 6/1/22 | AA– | | 1,500,000 | 1,680,180 |
| Tompkins Cnty., Dev. Corp. Rev. Bonds (Ithaca College), AGM, 5 3/8s, 7/1/41 | A2 | | 1,000,000 | 1,083,580 |
New York Tax Exempt Income Fund 27
| MUNICIPAL BONDS AND NOTES (98.7%)* cont. | Rating** | | Principal
amount | Value |
| New York cont. | | | | |
| Triborough, Bridge & Tunnel Auth. Rev. Bonds | | | | |
| Ser. A, 5s, 11/15/39 | Aa3 | | $3,500,000 | $3,906,595 |
| Ser. A, 5s, 11/15/36 | Aa3 | | 1,000,000 | 1,116,610 |
| Ser. C, 5s, 11/15/29 | Aa3 | | 5,000,000 | 5,664,800 |
| Ser. A, 5s, 11/15/23 (Prerefunded 11/15/16) | Aa3 | | 1,000,000 | 1,114,510 |
| (Gen. Cabs), Ser. B, zero %, 11/15/32 | Aa3 | | 3,900,000 | 1,874,925 |
| Ser. A, zero %, 11/15/30 | A1 | | 7,000,000 | 3,696,630 |
| Troy, Cap. Res. Corp. Rev. Bonds (Rensselaer Polytechnic), Ser. A, 5 1/8s, 9/1/40 | A3 | | 5,000,000 | 5,344,700 |
| Westchester Cnty., Hlth. Care Corp. Rev. Bonds, Ser. C-2, 6 1/8s, 11/1/37 | A3 | | 3,385,000 | 3,812,390 |
| Westchester Cnty., Indl Dev. Agcy. Civic Fac. Rev. Bonds | | | | |
| (Pace U.), Ser. A, 5 1/2s, 5/1/42 | BB+ | | 2,750,000 | 2,954,105 |
| (Guiding Eyes for the Blind), 5 3/8s, 8/1/24 | A– | | 905,000 | 924,747 |
| Westchester, Tobacco Asset Securitization Corp. Rev. Bonds, 5 1/8s, 6/1/38 | BBB | | 5,060,000 | 4,675,845 |
| Yonkers, Indl. Dev. Agcy. Civic Fac. Rev. Bonds | | | | |
| (St. John’s Riverside Hosp.), Ser. A, 7 1/8s, 7/1/31 | B+ | | 2,000,000 | 2,000,340 |
| (Sarah Lawrence College), Ser. A, 6s, 6/1/41 | BBB | | 2,500,000 | 2,757,475 |
| | | | | 991,784,767 |
| Puerto Rico (3.0%) | | | | |
| Children’s Trust Fund Tobacco Settlement (The) Rev. Bonds, 5 1/2s, 5/15/39 | Ba1 | | 3,750,000 | 3,472,425 |
| Cmnwlth. of PR, Aqueduct & Swr. Auth. Rev. Bonds, Ser. A, 6s, 7/1/38 | BB+ | | 4,345,000 | 3,461,488 |
| Cmnwlth. of PR, Elec. Pwr. Auth. Rev. Bonds, Ser. A, 5s, 7/1/42 | BBB | | 2,500,000 | 1,492,600 |
| Cmnwlth. of PR, Hwy. & Trans. Auth. Rev. Bonds, Ser. AA | | | | |
| NATL, 5 1/2s, 7/1/20 | AA– | | 365,000 | 387,984 |
| NATL, U.S. Govt. Coll., 5 1/2s, 7/1/20 (Escrowed to maturity) | A3 | | 635,000 | 784,441 |
| NATL, 5 1/2s, 7/1/19 | AA– | | 540,000 | 571,261 |
| NATL, U.S. Govt. Coll., 5 1/2s, 7/1/19 (Escrowed to maturity) | A3 | | 2,460,000 | 2,981,987 |
| 5s, 7/1/35 | BB+ | | 2,105,000 | 1,571,614 |
| Cmnwlth. of PR, Hwy. & Trans. Auth. Rev. Bonds FRN, Ser. AA-2, 5.3s, 7/1/35 | Ba1 | | 1,750,000 | 1,357,563 |
| Cmnwlth. of PR, Pub. Bldg. Auth. Rev. Bonds (Govt. Fac.) | | | | |
| Ser. M, Cmnwlth. of PR Gtd., 6 1/4s, 7/1/23 | BB+ | | 3,425,000 | 2,757,673 |
| Ser. N, Cmnwlth. of PR Gtd., 5 1/2s, 7/1/20 | BB+ | | 2,250,000 | 1,836,113 |
| Cmnwlth. of PR, Sales Tax Fin. Corp. Rev. Bonds | | | | |
| Ser. A, 5 1/2s, 8/1/37 | A+ | | 1,050,000 | 859,278 |
| Ser. C, 5 1/4s, 8/1/41 | A+ | | 5,050,000 | 3,901,731 |
| Ser. C, 5 1/4s, 8/1/40 | AA– | | 2,250,000 | 2,014,853 |
| Ser. A, AMBAC, zero %, 8/1/47 | AA– | | 20,000,000 | 2,390,600 |
28 New York Tax Exempt Income Fund
| MUNICIPAL BONDS AND NOTES (98.7%)* cont. | Rating** | | Principal
amount | Value |
| Puerto Rico cont. | | | | |
| Cmnwlth. of PR, Sales Tax Fin. Corp. Rev. Bonds | | | | |
| Ser. A, NATL, zero %, 8/1/43 | AA– | | $8,000,000 | $1,235,520 |
| Ser. A, zero %, 8/1/30 | A+ | | 4,250,000 | 1,165,350 |
| | | | | 32,242,481 |
| Virgin Islands (0.8%) | | | | |
| VI Pub. Fin. Auth. Rev. Bonds | | | | |
| Ser. A, 6s, 10/1/39 | Baa3 | | 3,000,000 | 3,131,370 |
| Ser. A-1, 5s, 10/1/39 | Baa2 | | 3,325,000 | 3,410,652 |
| Ser. A, 5s, 10/1/25 | Baa2 | | 2,000,000 | 2,222,713 |
| | | | | 8,764,735 |
| Total municipal bonds and notes (cost $995,127,339) |
$1,052,930,179
|
| UNITIZED TRUST (0.2%)* | Shares | Value |
| CMS Liquidating Trust 144A † | 600 | $2,071,200 |
| Total unitized trust (cost $1,816,443) |
$2,071,200
|
| TOTAL INVESTMENTS | |
| Total investments (cost $996,943,782) | $1,055,001,379 |
| Notes to the fund’s portfolio |
| Unless noted otherwise, the notes to the fund’s portfolio are for the close of the fund’s reporting period, which ran from December 1, 2013 through May 31, 2014 (the reporting period). Within the following notes to the portfolio, references to “ASC 820” represent Accounting Standards Codification 820 Fair Value Measurements and Disclosures and references to “OTC”, if any, represent over-the-counter. |
* | Percentages indicated are based on net assets of $1,066,945,024. |
** | The Moody’s, Standard & Poor’s or Fitch ratings indicated are believed to be the most recent ratings available at the close of the reporting period for the securities listed. Ratings are generally ascribed to securities at the time of issuance. While the agencies may from time to time revise such ratings, they undertake no obligation to do so, and the ratings do not necessarily represent what the agencies would ascribe to these securities at the close of the reporting period. Securities rated by Putnam are indicated by “/P.” Securities rated by Fitch are indicated by “/F.” The rating of an insured security represents what is believed to be the most recent rating of the insurer’s claims-paying ability available at the close of the reporting period, if higher than the rating of the direct issuer of the bond, and does not reflect any subsequent changes. Security ratings are defined in the Statement of Additional Information. |
† | Non-income-producing security. |
## | Forward commitment, in part or in entirety (Note 1). |
| 144A after the name of an issuer represents securities exempt from registration under Rule 144A under the Securities Act of 1933, as amended. These securities may be resold in transactions exempt from registration, normally to qualified institutional buyers. |
| The dates shown parenthetically on prerefunded bonds represent the next prerefunding dates. |
| The dates shown on debt obligations are the original maturity dates. |
| The fund had the following sector concentrations greater than 10% at the close of the reporting period (as a percentage of net assets): |
| Education | 20.1% |
| Tax bonds | 13.4 |
| Utilities | 11.6 |
| State debt | 10.8 |
| Health care | 10.5 |
New York Tax Exempt Income Fund 29
| ASC 820 establishes a three-level hierarchy for disclosure of fair value measurements. The valuation hierarchy is based upon the transparency of inputs to the valuation of the fund’s investments. The three levels are defined as follows: |
| Level 1: Valuations based on quoted prices for identical securities in active markets. |
| Level 2: Valuations based on quoted prices in markets that are not active or for which all significant inputs are observable, either directly or indirectly. |
| Level 3: Valuations based on inputs that are unobservable and significant to the fair value measurement. |
| The following is a summary of the inputs used to value the fund’s net assets as of the close of the reporting period: |
| | Valuation inputs |
| Investments in securities: | Level 1 | Level 2 | Level 3 |
| Municipal bonds and notes | $— | $1,052,930,179 | $— |
| Unitized trust | — | 2,071,200 | — |
| Totals by level | $— | $1,055,001,379 | $— |
The accompanying notes are an integral part of these financial statements.
30 New York Tax Exempt Income Fund
| Statement of assets and liabilities 5/31/14 (Unaudited) | |
| ASSETS | |
| Investment in securities, at value (Note 1): | |
| Unaffiliated issuers (identified cost $996,943,782) | $1,055,001,379 |
| Cash | 1,254,453 |
| Interest and other receivables | 14,628,767 |
| Receivable for shares of the fund sold | 367,090 |
| Prepaid assets | 8,979 |
| Total assets | 1,071,260,668 |
| LIABILITIES | |
| Payable for purchases of delayed delivery securities (Note 1) | 779,226 |
| Payable for shares of the fund repurchased | 1,372,247 |
| Payable for compensation of Manager (Note 2) | 388,914 |
| Payable for custodian fees (Note 2) | 6,441 |
| Payable for investor servicing fees (Note 2) | 86,517 |
| Payable for Trustee compensation and expenses (Note 2) | 372,844 |
| Payable for administrative services (Note 2) | 3,106 |
| Payable for distribution fees (Note 2) | 413,256 |
| Distributions payable to shareholders | 767,135 |
| Other accrued expenses | 125,958 |
| Total liabilities | 4,315,644 |
| Net assets | $1,066,945,024 |
| | |
| REPRESENTED BY | |
| Paid-in capital (Unlimited shares authorized) (Notes 1 and 4) | $1,032,658,958 |
| Undistributed net investment income (Note 1) | 1,524,700 |
| Accumulated net realized loss on investments (Note 1) | (25,296,231) |
| Net unrealized appreciation of investments | 58,057,597 |
| Total — Representing net assets applicable to capital shares outstanding | $1,066,945,024 |
| COMPUTATION OF NET ASSET VALUE AND OFFERING PRICE | |
| Net asset value and redemption price per class A share ($977,342,187 divided by 113,841,789 shares) | $8.59 |
| Offering price per class A share (100/96.00 of $8.59)* | $8.95 |
| Net asset value and offering price per class B share ($11,972,377 divided by 1,397,283 shares)** | $8.57 |
| Net asset value and offering price per class C share ($55,974,977 divided by 6,522,050 shares)** | $8.58 |
| Net asset value and redemption price per class M share ($1,485,551 divided by 172,905 shares) | $8.59 |
| Offering price per class M share (100/96.75 of $8.59)† | $8.88 |
| Net asset value, offering price and redemption price per class Y share ($20,169,932 divided by 2,348,668 shares) | $8.59 |
* | On single retail sales of less than $100,000. On sales of $100,000 or more the offering price is reduced. |
** | Redemption price per share is equal to net asset value less any applicable contingent deferred sales charge. |
† | On single retail sales of less than $50,000. On sales of $50,000 or more the offering price is reduced. |
The accompanying notes are an integral part of these financial statements.
New York Tax Exempt Income Fund 31
| Statement of operations Six months ended 5/31/14 (Unaudited) | |
| INTEREST INCOME | $23,869,407 |
| | |
| EXPENSES | |
| Compensation of Manager (Note 2) | 2,273,281 |
| Investor servicing fees (Note 2) | 263,072 |
| Custodian fees (Note 2) | 7,659 |
| Trustee compensation and expenses (Note 2) | 35,713 |
| Distribution fees (Note 2) | 1,395,373 |
| Administrative services (Note 2) | 13,792 |
| Other | 160,638 |
| Total expenses | 4,149,528 |
| Expense reduction (Note 2) | (817) |
| Net expenses | 4,148,711 |
| Net investment income | 19,720,696 |
| | |
| Net realized loss on investments (Notes 1 and 3) | (6,687,625) |
| Net unrealized appreciation of investments during the period | 43,453,943 |
| Net gain on investments | 36,766,318 |
| Net increase in net assets resulting from operations | $56,487,014 |
The accompanying notes are an integral part of these financial statements.
32 New York Tax Exempt Income Fund
| Statement of changes in net assets | | |
| INCREASE (DECREASE) IN NET ASSETS | Six months ended 5/31/14* | Year ended 11/30/13 |
| Operations: | | |
| Net investment income | $19,720,696 | $44,873,747 |
| Net realized loss on investments | (6,687,625) | (11,017,415) |
| Net unrealized appreciation (depreciation) of investments | 43,453,943 | (107,675,713) |
| Net increase (decrease) in net assets resulting from operations | 56,487,014 | (73,819,381) |
| Distributions to shareholders (Note 1): | | |
| From ordinary income | | |
| Taxable net investment income | | |
| Class A | (139,101) | (26,406) |
| Class B | (1,755) | (342) |
| Class C | (8,272) | (1,559) |
| Class M | (210) | (37) |
| Class Y | (2,694) | (428) |
| From tax-exempt net investment income | | |
| Class A | (18,055,933) | (41,138,809) |
| Class B | (186,831) | (441,706) |
| Class C | (836,703) | (1,986,715) |
| Class M | (25,366) | (56,352) |
| Class Y | (381,459) | (786,921) |
| Decrease from capital share transactions (Note 4) | (35,598,059) | (129,434,170) |
| Total increase (decrease) in net assets | 1,250,631 | (247,692,826) |
| NET ASSETS | | |
| Beginning of period | 1,065,694,393 | 1,313,387,219 |
| End of period (including undistributed net investment income of $1,524,700 and $1,442,328, respectively) | $1,066,945,024 | $1,065,694,393 |
* | Unaudited. |
The accompanying notes are an integral part of these financial statements.
New York Tax Exempt Income Fund 33
Financial highlights (For a common share outstanding throughout the period)
INVESTMENT OPERATIONS: | LESS DISTRIBUTIONS: | | RATIOS AND SUPPLEMENTAL DATA: |
Period ended | Net asset value, beginning of period | Net investment income (loss) | Net realized and unrealized gain (loss) on investments | Total from investment operations | From
net investment income | Total
distributions | Redemption
fees | Non-recurring reimbursements | Net asset value, end of period | Total return at net asset value (%)a | Net assets, end of period (in thousands) | Ratio of expenses to average net assets (%)b | Ratio of net investment income (loss) to average net assets (%) | Portfolio turnover (%) |
Class A | | | | | | | | | | | | | | |
May 31, 2014** | $8.29 | .16 | .30 | .46 | (.16) | (.16) | — | — | $8.59 | 5.59* | $977,342 | .37* | 1.89* | 4* |
November 30, 2013 | 9.12 | .32 | (.83) | (.51) | (.32) | (.32) | — | — | 8.29 | (5.67) | 974,711 | .75 | 3.73 | 11 |
November 30, 2012 | 8.54 | .34 | .57 | .91 | (.33) | (.33) | — | — | 9.12 | 10.87 | 1,206,509 | .75 | 3.81 | 11 |
November 30, 2011 | 8.44 | .35 | .10 | .45 | (.35) | (.35) | — | —c,d | 8.54 | 5.55 | 1,081,992 | .75 | 4.25 | 6 |
November 30, 2010 | 8.36 | .36 | .08 | .44 | (.36) | (.36) | —d | — | 8.44 | 5.27 | 1,105,169 | .75e | 4.18e | 6 |
November 30, 2009 | 7.60 | .35 | .77 | 1.12 | (.36) | (.36) | —d | — | 8.36 | 14.96 | 1,051,532 | .80e | 4.35e | 18 |
Class B | | | | | | | | | | | | | | |
May 31, 2014** | $8.27 | .13 | .30 | .43 | (.13) | (.13) | — | — | $8.57 | 5.27* | $11,972 | .69* | 1.58* | 4* |
November 30, 2013 | 9.10 | .27 | (.84) | (.57) | (.26) | (.26) | — | — | 8.27 | (6.28) | 12,322 | 1.38 | 3.10 | 11 |
November 30, 2012 | 8.52 | .28 | .58 | .86 | (.28) | (.28) | — | — | 9.10 | 10.21 | 15,438 | 1.38 | 3.17 | 11 |
November 30, 2011 | 8.43 | .30 | .09 | .39 | (.30) | (.30) | — | —c,d | 8.52 | 4.75 | 12,561 | 1.38 | 3.63 | 6 |
November 30, 2010 | 8.35 | .30 | .08 | .38 | (.30) | (.30) | —d | — | 8.43 | 4.61 | 16,090 | 1.38e | 3.57e | 6 |
November 30, 2009 | 7.59 | .30 | .76 | 1.06 | (.30) | (.30) | —d | — | 8.35 | 14.26 | 22,589 | 1.44e | 3.74e | 18 |
Class C | | | | | | | | | | | | | | |
May 31, 2014** | $8.29 | .13 | .29 | .42 | (.13) | (.13) | — | — | $8.58 | 5.06* | $55,975 | .76* | 1.51* | 4* |
November 30, 2013 | 9.11 | .26 | (.83) | (.57) | (.25) | (.25) | — | — | 8.29 | (6.30) | 58,449 | 1.53 | 2.95 | 11 |
November 30, 2012 | 8.54 | .27 | .56 | .83 | (.26) | (.26) | — | — | 9.11 | 9.90 | 70,435 | 1.53 | 3.01 | 11 |
November 30, 2011 | 8.44 | .29 | .10 | .39 | (.29) | (.29) | — | —c,d | 8.54 | 4.75 | 47,182 | 1.53 | 3.47 | 6 |
November 30, 2010 | 8.36 | .29 | .08 | .37 | (.29) | (.29) | —d | — | 8.44 | 4.45 | 47,564 | 1.53e | 3.39e | 6 |
November 30, 2009 | 7.60 | .28 | .77 | 1.05 | (.29) | (.29) | —d | — | 8.36 | 14.08 | 36,839 | 1.59e | 3.55e | 18 |
Class M | | | | | | | | | | | | | | |
May 31, 2014** | $8.30 | .15 | .29 | .44 | (.15) | (.15) | — | — | $8.59 | 5.31* | $1,486 | .51* | 1.75* | 4* |
November 30, 2013 | 9.12 | .30 | (.83) | (.53) | (.29) | (.29) | — | — | 8.30 | (5.83) | 1,451 | 1.03 | 3.45 | 11 |
November 30, 2012 | 8.54 | .31 | .58 | .89 | (.31) | (.31) | — | — | 9.12 | 10.56 | 1,659 | 1.03 | 3.52 | 11 |
November 30, 2011 | 8.45 | .33 | .09 | .42 | (.33) | (.33) | — | —c,d | 8.54 | 5.14 | 1,435 | 1.03 | 3.97 | 6 |
November 30, 2010 | 8.37 | .33 | .08 | .41 | (.33) | (.33) | —d | — | 8.45 | 4.96 | 1,694 | 1.03e | 3.91e | 6 |
November 30, 2009 | 7.60 | .32 | .78 | 1.10 | (.33) | (.33) | —d | — | 8.37 | 14.77 | 1,875 | 1.09e | 4.06e | 18 |
Class Y | | | | | | | | | | | | | | |
May 31, 2014** | $8.29 | .17 | .30 | .47 | (.17) | (.17) | — | — | $8.59 | 5.70* | $20,170 | .26* | 2.00* | 4* |
November 30, 2013 | 9.12 | .34 | (.83) | (.49) | (.34) | (.34) | — | — | 8.29 | (5.47) | 18,762 | .53 | 3.95 | 11 |
November 30, 2012 | 8.54 | .36 | .57 | .93 | (.35) | (.35) | — | — | 9.12 | 11.10 | 19,347 | .53 | 4.00 | 11 |
November 30, 2011 | 8.45 | .37 | .09 | .46 | (.37) | (.37) | — | —c,d | 8.54 | 5.66 | 8,444 | .53 | 4.45 | 6 |
November 30, 2010 | 8.36 | .37 | .10 | .47 | (.38) | (.38) | —d | — | 8.45 | 5.65 | 5,613 | .53e | 4.38e | 6 |
November 30, 2009 | 7.60 | .36 | .77 | 1.13 | (.37) | (.37) | —d | — | 8.36 | 15.20 | 3,083 | .59e | 4.49e | 18 |
See notes to financial highlights at the end of this section.
The accompanying notes are an integral part of these financial statements.
34 | New York Tax Exempt Income Fund | New York Tax Exempt Income Fund | 35 |
Financial highlights (Continued)
* Not annualized.
** Unaudited.
a Total return assumes dividend reinvestment and does not reflect the effect of sales charges.
b Includes amounts paid through expense offset arrangements (Note 2). Also excludes acquired fund fees and expenses, if any.
c Reflects a non-recurring reimbursement related to restitution amounts in connection with a distribution plan approved by the Securities and Exchange Commission (the SEC) which amounted to less than $0.01 per share outstanding on July 21, 2011. Also reflects a non-recurring reimbursement related to short-term trading related lawsuits, which amounted to less than $0.01 per share outstanding on May 11, 2011.
d Amount represents less than $0.01 per share.
e Reflects an involuntary contractual expense limitation in effect during the period. As a result of such limitation, the expenses of each class reflect a reduction of the following amounts:
| Percentage of
average net assets |
November 30, 2010 | <0.01% |
November 30, 2009 | 0.02 |
The accompanying notes are an integral part of these financial statements.
36 New York Tax Exempt Income Fund
Notes to financial statements 5/31/14 (Unaudited)
Within the following Notes to financial statements, references to “State Street” represent State Street Bank and Trust Company, references to “the SEC” represent the Securities and Exchange Commission, references to “Putnam Management” represent Putnam Investment Management, LLC, the fund’s manager, an indirect wholly-owned subsidiary of Putnam Investments, LLC and references to “OTC”, if any, represent over-the-counter. Unless otherwise noted, the “reporting period” represents the period from December 1, 2013 through May 31, 2014.
Putnam New York Tax Exempt Income Fund (the fund) is a Massachusetts business trust, which is registered under the Investment Company Act of 1940, as amended, as a diversified open-end management investment company. The investment objective of the fund is to seek as high a level of current income exempt from federal income tax and New York State and City personal income taxes as Putnam Management believes is consistent with preservation of capital. The fund invests mainly in bonds that pay interest that is exempt from federal income tax and New York State and City personal income taxes (but that may be subject to federal alternative minimum tax (AMT)), are investment grade in quality, and have intermediate- to long-term maturities (three years or longer). Putnam Management may consider, among other factors, credit, interest rate and prepayment risks, as well as general market conditions, when deciding whether to buy or sell investments.
The fund offers class A, class B, class C, class M and class Y shares. Class A and class M shares are sold with a maximum front-end sales charge of 4.00% and 3.25%, respectively, and generally do not pay a contingent deferred sales charge. Class B shares, which convert to class A shares after approximately eight years, do not pay a front-end sales charge and are subject to a contingent deferred sales charge if those shares are redeemed within six years of purchase. Class C shares have a one-year 1.00% contingent deferred sales charge and do not convert to class A shares. The expenses for class A, class B, class C, and class M shares may differ based on the distribution fee of each class, which is identified in Note 2. Class Y shares, which are sold at net asset value, are generally subject to the same expenses as class A, class B, class C, and class M shares, but do not bear a distribution fee. Class Y shares are not available to all investors.
In the normal course of business, the fund enters into contracts that may include agreements to indemnify another party under given circumstances. The fund’s maximum exposure under these arrangements is unknown as this would involve future claims that may be, but have not yet been, made against the fund. However, the fund’s management team expects the risk of material loss to be remote.
Note 1: Significant accounting policies
The following is a summary of significant accounting policies consistently followed by the fund in the preparation of its financial statements. The preparation of financial statements is in conformity with accounting principles generally accepted in the United States of America and requires management to make estimates and assumptions that affect the reported amounts of assets and liabilities in the financial statements and the reported amounts of increases and decreases in net assets from operations. Actual results could differ from those estimates. Subsequent events after the Statement of assets and liabilities date through the date that the financial statements were issued have been evaluated in the preparation of the financial statements.
Investment income, realized and unrealized gains and losses and expenses of the fund are borne pro-rata based on the relative net assets of each class to the total net assets of the fund, except that each class bears expenses unique to that class (including the distribution fees applicable to such classes). Each class votes as a class only with respect to its own distribution plan or other matters on which a class vote is required by law or determined by the Trustees. If the fund were liquidated, shares of each class would receive their pro-rata share of the net assets of the fund. In addition, the Trustees declare separate dividends on each class of shares.
Security valuation Tax-exempt bonds and notes are generally valued on the basis of valuations provided by an independent pricing service approved by the Trustees. Such services use information with respect to transactions in bonds, quotations from bond dealers, market transactions in comparable securities and various relationships between securities in determining value. These securities will generally be categorized as Level 2.
Investments for which market quotations are readily available are valued at the last reported sales price on their principal exchange, or official closing price for certain markets, and are classified as Level 1 securities under Accounting Standards Codification 820 Fair Value Measurements and Disclosures (ASC 820). If no sales are
New York Tax Exempt Income Fund 37
reported, as in the case of some securities that are traded OTC, a security is valued at its last reported bid price and is generally categorized as a Level 2 security.
Certain investments, including certain restricted and illiquid securities and derivatives, are also valued at fair value following procedures approved by the Trustees. Such valuations and procedures are reviewed periodically by the Trustees. These valuations consider such factors as significant market or specific security events such as interest rate or credit quality changes, various relationships with other securities, discount rates, U.S. Treasury, U.S. swap and credit yields, index levels, convexity exposures and recovery rates. These securities are classified as Level 2 or as Level 3 depending on the priority of the significant inputs. The fair value of securities is generally determined as the amount that the fund could reasonably expect to realize from an orderly disposition of such securities over a reasonable period of time. By its nature, a fair value price is a good faith estimate of the value of a security in a current sale and does not reflect an actual market price, which may be different by a material amount.
Security transactions and related investment income Security transactions are recorded on the trade date (the date the order to buy or sell is executed). Gains or losses on securities sold are determined on the identified cost basis.
Interest income is recorded on the accrual basis. All premiums/discounts are amortized/accreted on a yield-to-maturity basis. The premium in excess of the call price, if any, is amortized to the call date; thereafter, any remaining premium is amortized to maturity.
Securities purchased or sold on a forward commitment basis may be settled at a future date beyond customary settlement time; interest income is accrued based on the terms of the securities. Losses may arise due to changes in the fair value of the underlying securities or if the counterparty does not perform under the contract.
Interfund lending The fund, along with other Putnam funds, may participate in an interfund lending program pursuant to an exemptive order issued by the SEC. This program allows the fund to borrow from other Putnam funds that permit such transactions. Interfund lending transactions are subject to each fund’s investment policies and borrowing and lending limits. Interest earned or paid on the interfund lending transaction will be based on the average of certain current market rates. During the reporting period, the fund did not utilize the program.
Lines of credit The fund participates, along with other Putnam funds, in a $392.5 million ($315 million prior to June 27, 2014) unsecured committed line of credit and a $235.5 million ($185 million prior to June 27, 2014) unsecured uncommitted line of credit, both provided by State Street. Borrowings may be made for temporary or emergency purposes, including the funding of shareholder redemption requests and trade settlements. Interest is charged to the fund based on the fund’s borrowing at a rate equal to the Federal Funds rate plus 1.25% for the committed line of credit and the Federal Funds rate plus 1.30% for the uncommitted line of credit. A closing fee equal to 0.04% (0.02% prior to June 27, 2014) of the committed line of credit and 0.04% ($50,000 prior to June 27, 2014) of the uncommitted line of credit has been paid by the participating funds. In addition, a commitment fee of 0.11% per annum on any unutilized portion of the committed line of credit is allocated to the participating funds based on their relative net assets and paid quarterly. During the reporting period, the fund had no borrowings against these arrangements.
Federal taxes It is the policy of the fund to distribute all of its income within the prescribed time period and otherwise comply with the provisions of the Internal Revenue Code of 1986, as amended (the Code), applicable to regulated investment companies. It is also the intention of the fund to distribute an amount sufficient to avoid imposition of any excise tax under Section 4982 of the Code.
The fund is subject to the provisions of Accounting Standards Codification 740 Income Taxes (ASC 740). ASC 740 sets forth a minimum threshold for financial statement recognition of the benefit of a tax position taken or expected to be taken in a tax return. The fund did not have a liability to record for any unrecognized tax benefits in the accompanying financial statements. No provision has been made for federal taxes on income, capital gains or unrealized appreciation on securities held nor for excise tax on income and capital gains. Each of the fund’s federal tax returns for the prior three fiscal years remains subject to examination by the Internal Revenue Service.
38 New York Tax Exempt Income Fund
At November 30, 2013, the fund had a capital loss carryover of $16,450,685 available to the extent allowed by the Code to offset future net capital gain, if any. The amounts of the carryovers and the expiration dates are:
Loss carryover |
Short-term | Long-term | Total | Expiration |
$5,382,679 | $5,269,846 | $10,652,525 | * |
4,276,078 | N/A | 4,276,078 | November 30, 2016 |
1,012,732 | N/A | 1,012,732 | November 30, 2017 |
509,350 | N/A | 509,350 | November 30, 2019 |
*Under the Regulated Investment Company Modernization Act of 2010, the fund will be permitted to carry forward capital losses incurred in taxable years beginning after December 22, 2010 for an unlimited period. However, any losses incurred will be required to be utilized prior to the losses incurred in pre-enactment tax years. As a result of this ordering rule, pre-enactment capital loss carryforwards may be more likely to expire unused. Additionally, post-enactment capital losses that are carried forward will retain their character as either short-term or long-term capital losses rather than being considered all short-term as under previous law.
The aggregate identified cost on a tax basis is $997,585,511, resulting in gross unrealized appreciation and depreciation of $66,716,318 and $9,300,450, respectively, or net unrealized appreciation of $57,415,868.
Distributions to shareholders Income dividends are recorded daily by the fund and are paid monthly. Distributions from capital gains, if any, are recorded on the ex-dividend date and paid at least annually. The amount and character of income and gains to be distributed are determined in accordance with income tax regulations which may differ from generally accepted accounting principles. Dividend sources are estimated at the time of declaration. Actual results may vary. Any non-taxable return of capital cannot be determined until final tax calculations are completed after the end of the fund’s fiscal year. Reclassifications are made to the fund’s capital accounts to reflect income and gains available for distribution (or available capital loss carryovers) under income tax regulations.
Note 2: Management fee, administrative services and other transactions
The fund pays Putnam Management a management fee (based on the fund’s average net assets and computed and paid monthly) at annual rates that may vary based on the average of the aggregate net assets of most open-end funds, as defined in the fund’s management contract, sponsored by Putnam Management. Such annual rates may vary as follows:
0.590% | of the first $5 billion, |
0.540% | of the next $5 billion, |
0.490% | of the next $10 billion, |
0.440% | of the next $10 billion, |
0.390% | of the next $50 billion, |
0.370% | of the next $50 billion, |
0.360% | of the next $100 billion and |
0.355% | of any excess thereafter. |
The fund’s shareholders approved the fund’s current management contract with Putnam Management effective February 27, 2014. Shareholders were asked to approve the fund’s management contract following the death on October 8, 2013 of The Honourable Paul G. Desmarais, who had controlled directly and indirectly a majority of the voting shares of Power Corporation of Canada, the ultimate parent company of Putnam Management. The substantive terms of the management contract, including terms relating to fees, are identical to the terms of the fund’s previous management contract and reflect the rates provided in the table above.
Putnam Management has contractually agreed, through June 30, 2015, to waive fees or reimburse the fund’s expenses to the extent necessary to limit the cumulative expenses of the fund, exclusive of brokerage, interest, taxes, investment-related expenses, extraordinary expenses, acquired fund fees and expenses and payments under the fund’s investor servicing contract, investment management contract and distribution plans, on a fiscal year-to-date basis to an annual rate of 0.20% of the fund’s average net assets over such fiscal year-to-date period. During the reporting period, the fund’s expenses were not reduced as a result of this limit.
Putnam Investments Limited (PIL), an affiliate of Putnam Management, is authorized by the Trustees to manage a separate portion of the assets of the fund as determined by Putnam Management from time to time. Putnam Management pays a quarterly sub-management fee to PIL for its services at an annual rate of 0.40% of the average net assets of the portion of the fund managed by PIL.
New York Tax Exempt Income Fund 39
The fund reimburses Putnam Management an allocated amount for the compensation and related expenses of certain officers of the fund and their staff who provide administrative services to the fund. The aggregate amount of all such reimbursements is determined annually by the Trustees.
Custodial functions for the fund’s assets are provided by State Street. Custody fees are based on the fund’s asset level, the number of its security holdings and transaction volumes.
Putnam Investor Services, Inc., an affiliate of Putnam Management, provides investor servicing agent functions to the fund. Putnam Investor Services, Inc. received fees for investor servicing based on the fund’s retail asset level, the number of shareholder accounts in the fund and the level of defined contribution plan assets in the fund. Investor servicing fees will not exceed an annual rate of 0.32% of the fund’s average net assets. During the reporting period, the expenses for each class of shares related to investor servicing fees were as follows:
Class A | $240,827 |
Class B | 2,988 |
Class C | 14,078 |
Class M | 366 |
Class Y | 4,813 |
Total | $263,072 |
The fund has entered into expense offset arrangements with Putnam Investor Services, Inc. and State Street whereby Putnam Investor Services, Inc.’s and State Street’s fees are reduced by credits allowed on cash balances. For the reporting period, the fund’s expenses were reduced by $817 under the expense offset arrangements.
Each independent Trustee of the fund receives an annual Trustee fee, of which $638, as a quarterly retainer, has been allocated to the fund, and an additional fee for each Trustees meeting attended. Trustees also are reimbursed for expenses they incur relating to their services as Trustees.
The fund has adopted a Trustee Fee Deferral Plan (the Deferral Plan) which allows the Trustees to defer the receipt of all or a portion of Trustees fees payable on or after July 1, 1995. The deferred fees remain invested in certain Putnam funds until distribution in accordance with the Deferral Plan.
The fund has adopted an unfunded noncontributory defined benefit pension plan (the Pension Plan) covering all Trustees of the fund who have served as a Trustee for at least five years and were first elected prior to 2004. Benefits under the Pension Plan are equal to 50% of the Trustee’s average annual attendance and retainer fees for the three years ended December 31, 2005. The retirement benefit is payable during a Trustee’s lifetime, beginning the year following retirement, for the number of years of service through December 31, 2006. Pension expense for the fund is included in Trustee compensation and expenses in the Statement of operations. Accrued pension liability is included in Payable for Trustee compensation and expenses in the Statement of assets and liabilities. The Trustees have terminated the Pension Plan with respect to any Trustee first elected after 2003.
The fund has adopted distribution plans (the Plans) with respect to its class A, class B, class C and class M shares pursuant to Rule 12b–1 under the Investment Company Act of 1940. The purpose of the Plans is to compensate Putnam Retail Management Limited Partnership, an indirect wholly-owned subsidiary of Putnam Investments, LLC, for services provided and expenses incurred in distributing shares of the fund. The Plans provide for payments by the fund to Putnam Retail Management Limited Partnership at an annual rate of up to 0.35%, 1.00%, 1.00% and 1.00% of the average net assets attributable to class A, class B, class C and class M shares, respectively. The Trustees have approved payment by the fund at the annual rate of 0.85%, 1.00% and 0.50% of the average net assets for class B, class C and class M shares, respectively. For class A shares, the annual payment rate will equal the weighted average of (i) 0.20% on the net assets of the fund attributable to class A shares purchased and paid for prior to April 1, 2005 and (ii) 0.25% on all other net assets of the fund attributable to class A shares. During the reporting period, the class specific expenses related to distribution fees were as follows:
Class A | $1,059,859 |
Class B | 50,726 |
Class C | 281,134 |
Class M | 3,654 |
Total | $1,395,373 |
For the reporting period, Putnam Retail Management Limited Partnership, acting as underwriter, received net commissions of $28,191 and $10 from the sale of class A and class M shares, respectively, and received $1,929 and $360 in contingent deferred sales charges from redemptions of class B and class C shares, respectively.
40 New York Tax Exempt Income Fund
A deferred sales charge of up to 1.00% is assessed on certain redemptions of class A shares. For the reporting period, Putnam Retail Management Limited Partnership, acting as underwriter, received $8 on class A redemptions.
Note 3: Purchases and sales of securities
During the reporting period, cost of purchases and proceeds from sales of investment securities other than short-term investments aggregated $35,577,790 and $73,820,058, respectively. There were no purchases or proceeds from sales of long-term U.S. government securities.
Note 4: Capital shares
At the close of the reporting period, there was an unlimited number of shares of beneficial interest authorized. Transactions in capital shares were as follows:
| Six months ended 5/31/14 | Year ended 11/30/13 |
Class A | Shares | Amount | Shares | Amount |
Shares sold | 4,239,643 | $35,654,256 | 11,720,891 | $103,748,392 |
Shares issued in connection with reinvestment of distributions | 1,696,449 | 14,270,670 | 3,715,058 | 32,080,082 |
| 5,936,092 | 49,924,926 | 15,435,949 | 135,828,474 |
Shares repurchased | (9,676,625) | (81,042,588) | (30,192,995) | (259,654,274) |
Net decrease | (3,740,533) | $(31,117,662) | (14,757,046) | $(123,825,800) |
| Six months ended 5/31/14 | Year ended 11/30/13 |
Class B | Shares | Amount | Shares | Amount |
Shares sold | 67,545 | $568,111 | 204,150 | $1,796,521 |
Shares issued in connection with reinvestment of distributions | 19,225 | 161,338 | 43,131 | 371,400 |
| 86,770 | 729,449 | 247,281 | 2,167,921 |
Shares repurchased | (178,755) | (1,493,592) | (454,545) | (3,872,517) |
Net decrease | (91,985) | $(764,143) | (207,264) | $(1,704,596) |
| Six months ended 5/31/14 | Year ended 11/30/13 |
Class C | Shares | Amount | Shares | Amount |
Shares sold | 349,845 | $2,944,605 | 1,554,932 | $13,768,202 |
Shares issued in connection with reinvestment of distributions | 86,793 | 729,677 | 195,698 | 1,688,078 |
| 436,638 | 3,674,282 | 1,750,630 | 15,456,280 |
Shares repurchased | (967,495) | (8,103,314) | (2,426,191) | (20,660,040) |
Net decrease | (530,857) | $(4,429,032) | (675,561) | $(5,203,760) |
| Six months ended 5/31/14 | Year ended 11/30/13 |
Class M | Shares | Amount | Shares | Amount |
Shares sold | 428 | $3,581 | 27,544 | $246,526 |
Shares issued in connection with reinvestment of distributions | 3,011 | 25,343 | 6,148 | 53,086 |
| 3,439 | 28,924 | 33,692 | 299,612 |
Shares repurchased | (5,417) | (45,738) | (40,642) | (344,161) |
Net decrease | (1,978) | $(16,814) | (6,950) | $(44,549) |
New York Tax Exempt Income Fund 41
| Six months ended 5/31/14 | Year ended 11/30/13 |
Class Y | Shares | Amount | Shares | Amount |
Shares sold | 363,150 | $3,058,110 | 1,438,916 | $12,501,990 |
Shares issued in connection with reinvestment of distributions | 27,893 | 234,757 | 56,194 | 484,552 |
| 391,043 | 3,292,867 | 1,495,110 | 12,986,542 |
Shares repurchased | (305,075) | (2,563,275) | (1,354,097) | (11,642,007) |
Net increase | 85,968 | $729,592 | 141,013 | $1,344,535 |
Note 5: Market, credit and other risks
In the normal course of business, the fund trades financial instruments and enters into financial transactions where risk of potential loss exists due to changes in the market (market risk) or failure of the contracting party to the transaction to perform (credit risk). The fund may be exposed to additional credit risk that an institution or other entity with which the fund has unsettled or open transactions will default. The fund concentrates a majority of its investments in the state of New York and may be affected by economic and political developments in that state.
42 New York Tax Exempt Income Fund
Shareholder meeting results (Unaudited)
February 27, 2014 special meeting
At the meeting, each of the nominees for Trustees was elected as follows:
| Votes for | Votes withheld |
Liaquat Ahamed | 81,255,335 | 4,611,857 |
Ravi Akhoury | 81,441,527 | 4,425,666 |
Barbara M. Baumann | 81,776,929 | 4,090,263 |
Jameson A. Baxter | 81,909,555 | 3,957,637 |
Charles B. Curtis | 81,544,552 | 4,322,640 |
Robert J. Darretta | 81,948,556 | 3,918,637 |
Katinka Domotorffy | 81,726,724 | 4,140,468 |
John A. Hill | 81,599,657 | 4,267,536 |
Paul L. Joskow | 81,871,581 | 3,995,611 |
Kenneth R. Leibler | 81,814,107 | 4,053,085 |
Robert E. Patterson | 81,952,977 | 3,914,216 |
George Putnam, III | 81,920,389 | 3,946,803 |
Robert L. Reynolds | 81,594,001 | 4,273,191 |
W. Thomas Stephens | 81,888,445 | 3,978,748 |
A proposal to approve a new management contract between the fund and Putnam Management was approved as follows:
Votes
for | Votes
against |
Abstentions
| Broker
non-votes |
64,799,299 | 2,709,452 | 4,256,133 | 14,102,308 |
March 7, 2014 special meeting
A proposal to adopt an Amended and Restated Declaration of Trust, with respect to which the February 27, 2014 meeting had been adjourned, was approved as follows:
Votes
for | Votes
against |
Abstentions
| Broker
non-votes |
65,969,447 | 3,142,787 | 4,868,123 | 13,218,748 |
All tabulations are rounded to the nearest whole number.
New York Tax Exempt Income Fund 43
Services for shareholders
Investor services
Systematic investment plan Tell us how much you wish to invest regularly — weekly, semimonthly, or monthly — and the amount you choose will be transferred automatically from your checking or savings account. There’s no additional fee for this service, and you can suspend it at any time. This plan may be a great way to save for college expenses or to plan for your retirement.
Please note that regular investing does not guarantee a profit or protect against loss in a declining market. Before arranging a systematic investment plan, consider your financial ability to continue making purchases in periods when prices are low.
Systematic exchange You can make regular transfers from one Putnam fund to another Putnam fund. There are no additional fees for this service, and you can cancel or change your options at any time.
Dividends PLUS You can choose to have the dividend distributions from one of your Putnam funds automatically reinvested in another Putnam fund at no additional charge.
Free exchange privilege You can exchange money between Putnam funds free of charge, as long as they are the same class of shares. A signature guarantee is required if you are exchanging more than $500,000. The fund reserves the right to revise or terminate the exchange privilege.
Reinstatement privilege If you’ve sold Putnam shares or received a check for a dividend or capital gain, you may reinvest the proceeds with Putnam within 90 days of the transaction and they will be reinvested at the fund’s current net asset value — with no sales charge. However, reinstatement of class B shares may have special tax consequences. Ask your financial or tax representative for details.
Check-writing service You have ready access to many Putnam accounts. It’s as simple as writing a check, and there are no special fees or service charges. For more information about the check-writing service, call Putnam or visit our website.
Dollar cost averaging When you’re investing for long-term goals, it’s time, not timing, that counts. Investing on a systematic basis is a better strategy than trying to figure out when the markets will go up or down. This means investing the same amount of money regularly over a long period. This method of investing is called dollar cost averaging. When a fund’s share price declines, your investment dollars buy more shares at lower prices. When it increases, they buy fewer shares. Over time, you will pay a lower average price per share.
For more information
Visit the Individual Investors section at putnam.com A secure section of our website contains complete information on your account, including balances and transactions, updated daily. You may also conduct transactions, such as exchanges, additional investments, and address changes. Log on today to get your password.
Call us toll free at 1-800-225-1581 Ask a helpful Putnam representative or your financial advisor for details about any of these or other services, or see your prospectus.
44 New York Tax Exempt Income Fund
Founded over 75 years ago, Putnam Investments was built around the concept that a balance between risk and reward is the hallmark of a well-rounded financial program. We manage over 100 funds across income, value, blend, growth, asset allocation, absolute return, and global sector categories.
Investment Manager
Putnam Investment
Management, LLC
One Post Office Square
Boston, MA 02109
Investment Sub-Manager
Putnam Investments Limited
57–59 St James’s Street
London, England SW1A 1LD
Marketing Services
Putnam Retail Management
One Post Office Square
Boston, MA 02109
Custodian
State Street Bank
and Trust Company
Legal Counsel
Ropes & Gray LLP
Trustees
Jameson A. Baxter, Chair
Liaquat Ahamed
Ravi Akhoury
Barbara M. Baumann
Charles B. Curtis
Robert J. Darretta
Katinka Domotorffy
John A. Hill
Paul L. Joskow
Kenneth R. Leibler
Robert E. Patterson
George Putnam, III
Robert L. Reynolds
W. Thomas Stephens
Officers
Robert L. Reynolds
President
Jonathan S. Horwitz
Executive Vice President,
Principal Executive Officer, and
Compliance Liaison
Steven D. Krichmar
Vice President and
Principal Financial Officer
Robert T. Burns
Vice President and
Chief Legal Officer
Robert R. Leveille
Vice President and
Chief Compliance Officer
Michael J. Higgins
Vice President, Treasurer,
and Clerk
Janet C. Smith
Vice President,
Principal Accounting Officer,
and Assistant Treasurer
Susan G. Malloy
Vice President and
Assistant Treasurer
James P. Pappas
Vice President
Mark C. Trenchard
Vice President and
BSA Compliance Officer
Nancy E. Florek
Vice President, Director of
Proxy Voting and Corporate
Governance, Assistant Clerk,
and Associate Treasurer
This report is for the information of shareholders of Putnam New York Tax Exempt Income Fund. It may also be used as sales literature when preceded or accompanied by the current prospectus, the most recent copy of Putnam’s Quarterly Performance Summary, and Putnam’s Quarterly Ranking Summary. For more recent performance, please visit putnam.com. Investors should carefully consider the investment objectives, risks, charges, and expenses of a fund, which are described in its prospectus. For this and other information or to request a prospectus or summary prospectus, call 1-800-225-1581 toll free. Please read the prospectus carefully before investing. The fund’s Statement of Additional Information contains additional information about the fund’s Trustees and is available without charge upon request by calling 1-800-225-1581.
| |
| Item 3. Audit Committee Financial Expert: |
| |
| Item 4. Principal Accountant Fees and Services: |
| |
| Item 5. Audit Committee of Listed Registrants |
| |
| Item 6. Schedule of Investments: |
| |
| The registrant’s schedule of investments in unaffiliated issuers is included in the report to shareholders in Item 1 above. |
| |
| Item 7. Disclosure of Proxy Voting Policies and Procedures For Closed-End Management Investment Companies: |
| |
| Item 8. Portfolio Managers of Closed-End Investment Companies |
| |
| Item 9. Purchases of Equity Securities by Closed-End Management Investment Companies and Affiliated Purchasers: |
| |
| Item 10. Submission of Matters to a Vote of Security Holders: |
| |
| Item 11. Controls and Procedures: |
| |
| (a) The registrant’s principal executive officer and principal financial officer have concluded, based on their evaluation of the effectiveness of the design and operation of the registrant’s disclosure controls and procedures as of a date within 90 days of the filing date of this report, that the design and operation of such procedures are generally effective to provide reasonable assurance that information required to be disclosed by the registrant in this report is recorded, processed, summarized and reported within the time periods specified in the Commission’s rules and forms. |
| |
| (b) Changes in internal control over financial reporting: Not applicable |
| |
| (a)(2) Separate certifications for the principal executive officer and principal financial officer of the registrant as required by Rule 30a-2(a) under the Investment Company Act of 1940, as amended, are filed herewith. |
| |
| (b) The certifications required by Rule 30a-2(b) under the Investment Company Act of 1940, as amended, are filed herewith. |
| |
| Putnam New York Tax Exempt Income Fund |
| |
| By (Signature and Title): |
| |
| /s/Janet C. Smith
Janet C. Smith
Principal Accounting Officer
|
| |
| Pursuant to the requirements of the Securities Exchange Act of 1934 and the Investment Company Act of 1940, this report has been signed below by the following persons on behalf of the registrant and in the capacities and on the dates indicated. |
| |
| By (Signature and Title): |
| |
| /s/Jonathan S. Horwitz
Jonathan S. Horwitz
Principal Executive Officer
|
| |
| By (Signature and Title): |
| |
| /s/Steven D. Krichmar
Steven D. Krichmar
Principal Financial Officer
|