| | |
| UNITED STATES
SECURITIES AND EXCHANGE COMMISSION |
| | |
| CERTIFIED SHAREHOLDER REPORT OF REGISTERED
MANAGEMENT INVESTMENT COMPANIES
|
| | |
| Investment Company Act file number: | (811-03741) |
| | |
| Exact name of registrant as specified in charter: | Putnam New York Tax Exempt Income Fund |
| | |
| Address of principal executive offices: | One Post Office Square, Boston, Massachusetts 02109 |
| | |
| Name and address of agent for service: | Robert T. Burns, Vice President
One Post Office Square
Boston, Massachusetts 02109 |
| | |
| Copy to: | Bryan Chegwidden, Esq.
Ropes & Gray LLP
1211 Avenue of the Americas
New York, New York 10036 |
| | |
| Registrant's telephone number, including area code: | (617) 292-1000 |
| | |
| Date of fiscal year end: | November 30, 2017 |
| | |
| Date of reporting period : | December 1, 2016 — November 30, 2017 |
| | |
|
Item 1. Report to Stockholders: | |
| | |
| The following is a copy of the report transmitted to stockholders pursuant to Rule 30e-1 under the Investment Company Act of 1940: | |
Putnam New York
Tax Exempt
Income Fund
Annual report
11 | 30 | 17
Consider these risks before investing: Bond prices may fall or fail to rise over time for several reasons, including general financial market conditions, changing market perceptions (including perceptions about the risk of default and expectations about monetary policy or interest rates), changes in government intervention in the financial markets, and factors related to a specific issuer. These and other factors may also lead to increased volatility and reduced liquidity in the fund’s portfolio holdings. The fund’s performance will be closely tied to the economic and political conditions in New York State, and can be more volatile than the performance of a more geographically diversified fund. Capital gains, if any, are taxed at the federal and, in most cases, state levels. For some investors, investment income may be subject to the federal alternative minimum tax. Bond investments are subject to interest-rate risk (the risk of bond prices falling if interest rates rise) and credit risk (the risk of an issuer defaulting on interest or principal payments). Interest-rate risk is greater for longer-term bonds, and credit risk is greater for below-investment-grade bonds. Unlike bonds, funds that invest in bonds have fees and expenses. Tax-exempt bonds may be issued under the Internal Revenue Code only by limited types of issuers for limited types of projects. As a result, the fund’s investments may be focused in certain market segments and be more vulnerable to fluctuations in the values of the securities it holds than a more broadly invested fund. Interest the fund receives might be taxable. You can lose money by investing in the fund.
Message from the Trustees
January 10, 2018
Dear Fellow Shareholder:
Investor sentiment remained positive through most of 2017, helping to keep financial markets on a steady course. While bond market performance was a bit uneven, global stock markets generally made solid advances with low volatility. However, we enter the new year mindful of a number of risks that could disrupt the positive momentum.
Although no one can predict the direction of the markets in the months ahead, Putnam’s experienced investment professionals actively seek to position their fund portfolios for all types of conditions. They take a research-intensive approach to investing that includes risk management strategies designed to serve investors through changing markets.
In all environments, we believe investors should remain focused on time-tested strategies: maintain a well-diversified portfolio, think about long-term goals, and speak regularly with your financial advisor. In the following pages, you will find an overview of your fund’s performance for the reporting period as well as an outlook for the coming months.
Thank you for investing with Putnam.

About the fund
Municipal bonds finance important public projects, such as schools, roads, and hospitals. The bonds are backed by either the issuing city, town, or other government entity or by revenues collected from usage fees.
However, unlike U.S. Treasuries or corporate bonds, the interest paid on municipal bonds is generally free from federal income taxes. Moreover, New York residents generally pay no state income taxes on distributions paid from municipal bonds issued in the Empire State. That can make municipal bonds particularly attractive to investors subject to higher personal income tax rates.
| |
| 2 New York Tax Exempt Income Fund |
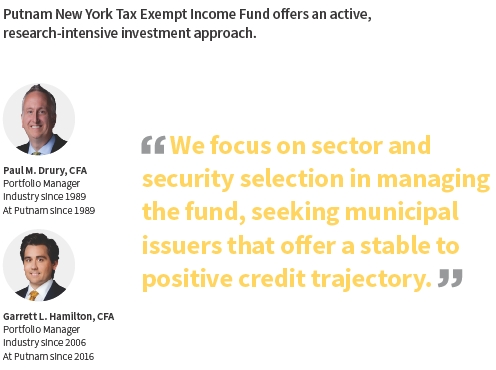
Municipal bonds’ tax benefits can make their income even more attractive
Source: Putnam, as of 11/30/17. Past performance is no guarantee of future results. Yields for U.S. Treasuries, investment-grade corporates, and municipal bonds are represented by the average “yield to worst” — a calculation of the lowest possible yield generated without defaulting — of the Bloomberg Barclays U.S. Treasury Index, the Bloomberg Barclays U.S. Credit Index, and the Bloomberg Barclays Municipal Bond Index, respectively. You cannot invest directly in an index. Bond investments are subject to interest-rate risk (the risk of bond prices falling if interest rates rise) and credit risk (the risk of an issuer defaulting on interest or principal payments). Interest-rate risk is greater for longer-term bonds, and credit risk is greater for below-investment-grade bonds. Income from municipal bonds may be subject to the alternative minimum tax. Taxable equivalent yield and annual after-tax income are based on a 43.40% federal income tax rate, which reflects the American Taxpayer Relief Act of 2012 and includes the 3.80% Medicare surtax. Tax rates are as of November 30, 2017, and do not reflect the recent changes to the Tax Cuts and Jobs Act of 2017.
Defaults in the municipal bond market have been a relative rarity
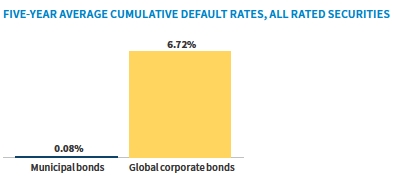
Source: Moody’s Investor Services, Annual U.S. Municipal Bond Defaults and Recoveries, 1970–2016 (June 2017).
|
| New York Tax Exempt Income Fund 3 |
Performance history as of 11/30/17
Annualized total return (%) comparison

Current performance may be lower or higher than the quoted past performance, which cannot guarantee future results. Share price, principal value, and return will fluctuate, and you may have a gain or a loss when you sell your shares. Performance of class A shares assumes reinvestment of distributions and does not account for taxes. Fund returns in the bar chart do not reflect a sales charge of 4.00%; had they, returns would have been lower. See below and pages 9–12 for additional performance information. For a portion of the periods, the fund had expense limitations, without which returns would have been lower. To obtain the most recent month-end performance, visit putnam.com.
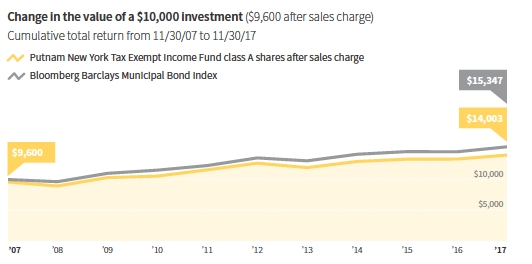
Recent broad market index and fund performance
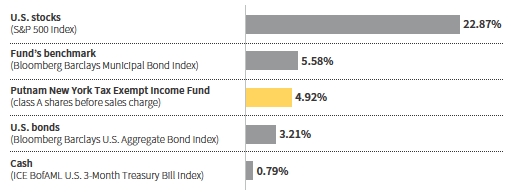
This comparison shows your fund’s performance in the context of broad market indexes for the 12 months ended 11/30/17. See above and pages 9–12 for additional fund performance information. Index descriptions can be found on pages 14–15.
| |
| 4 New York Tax Exempt Income Fund |
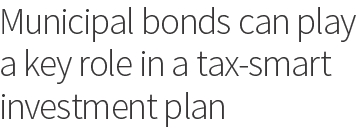
Interview with your fund’s portfolio manager
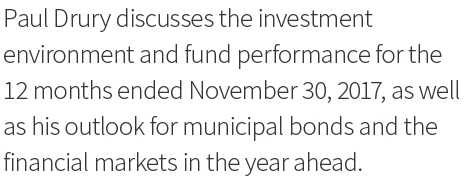

Paul M. Drury, CFA
Portfolio Manager
Paul has a B.A. from Suffolk University. Paul has been in the investment industry since he joined Putnam in 1989.
In addition to Paul, your fund is managed by Garrett L. Hamilton, CFA. Garrett has an M.S. in Investment Management from Boston University and a B.S. in International Business Administration from Southern New Hampshire University. He joined Putnam in 2016 and has been in the investment industry since 2006.
Paul, how was the market environment for municipal bonds during the reporting period?
Municipal bonds posted solid gains during the period, outperforming U.S. Treasury bonds and the broader U.S. fixed-income markets as U.S. interest rates fell. Even as the Federal Reserve announced its second interest-rate hike of 2017 on June 14, 2017, it revised its inflation expectations downward, adding that it believed inflation would “remain somewhat below 2% in the near term.” Municipal bonds, along with other rate-sensitive investments, rallied following these more dovish statements.
In September 2017, Fed chair Janet Yellen’s comments at the Fed’s policy meeting were somewhat more hawkish, although the Fed left interest rates unchanged. The central bank signaled that, despite recent low levels of inflation, it expected one more rate increase by year-end and envisioned three more increases in 2018. The Fed also reaffirmed its commitment to begin reducing its balance sheet in October 2017, which included over $4 trillion in U.S. Treasury bonds and mortgage-backed securities that it purchased in the years following the 2008 financial crisis.
|
| New York Tax Exempt Income Fund 5 |
Sector allocations
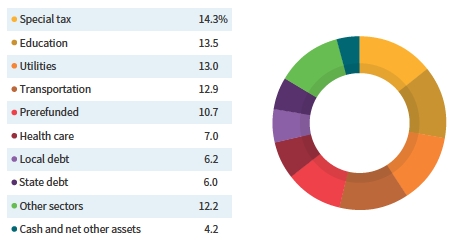
Allocations are shown as a percentage of the fund’s net assets as of 11/30/17. Cash and net other assets, if any, represent the market value weights of cash, derivatives, short-term securities, and other unclassified assets in the portfolio. Summary information may differ from the information in the portfolio schedule notes included in the financial statements due to the inclusion of derivative securities, any interest accruals, the use of different classifications of securities for presentation purposes, and rounding. Holdings and allocations may vary over time.

Credit quality overview
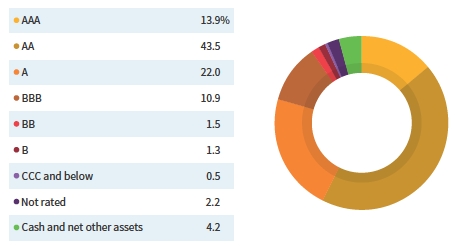
Credit qualities are shown as a percentage of the fund’s net assets as of 11/30/17. A bond rated BBB or higher (SP-3 or higher, for short-term debt) is considered investment grade. This chart reflects the highest security rating provided by one or more of Standard & Poor’s, Moody’s, and Fitch. Ratings may vary over time.
Cash and net other assets, if any, represent the market value weights of cash, derivatives, and short-term securities in the portfolio. The fund itself has not been rated by an independent rating agency.
| |
| 6 New York Tax Exempt Income Fund |
The Fed once again maintained its target range of 1% to 1.25% for the federal funds rate at its October 2017 meeting. The central bank acknowledged that U.S. economic growth remained solid despite hurricane-related disruptions, and the labor market continued to strengthen. As widely expected, the Fed announced a rate hike of a quarter percentage point at its December 2017 meeting, after the close of the reporting period.
Were supply/demand dynamics supportive of municipal bond prices?
Favorable supply/demand dynamics created a tailwind for the asset class. The pace of new issuance was generally light, especially during the third quarter of 2017. As such, demand outpaced supply — contributing to rising prices and a narrowing of credit spreads of lower investment-grade as well as high-yield municipal bonds. [Credit spreads reflect the difference in yield between higher- and lower-quality municipal bonds.] Viewed in a longer-term context, spreads were at or close to the narrowest point since the beginning of the 2008 credit crisis during much of the period. That said, overall credit fundamentals remained stable, supply/demand dynamics were favorable, and defaults remained low and isolated. Given the favorable economic climate, lower-investment-grade and high-yielding non-investment-grade municipal bonds outperformed higher-quality municipal bonds given investor preferences for higher risk strategies.
How did the fund perform?
For the 12 months ended November 30, 2017, the fund underperformed its benchmark, the Bloomberg Barclays Municipal Bond Index, but outperformed the average return of its Lipper peer group, New York Municipal Debt Funds.
What was your investment approach in this environment?
Given our outlook for interest rates trending higher, we employed a barbell approach to structuring the portfolio — overweighting short-term bonds, underweighting intermediate-term bonds with maturities of 5 to 12 years, and overweighting longer-term bonds with maturities of greater than 12 to 20 years. Duration positioning, which affects the portfolio’s sensitivity to interest rates, was generally neutral. From a credit-quality standpoint, the fund held an overweight exposure to higher-quality bonds rated Aa and A. From a sector positioning perspective, we placed greater focus on higher education, essential service utilities, and tobacco bonds rated BBB relative to the fund’s Lipper group. These strategies were positive for performance results.
Additionally, we maintained an underweight position in Puerto Rico-based issuers relative to the fund’s Lipper peers. This underweight exposure added to performance during the period. Puerto Rico was devastated by the recent hurricanes, which made its economic and financial situation even more difficult and could further challenge the debt restructuring process, in our view.
What is your outlook as we look into 2018?
We expect that moderate, trend-like economic growth will facilitate the continued gradual normalization of short-term interest rates. From a fiscal policy perspective, the market appears to be focused on how much stimulus might come from Washington, and how those initiatives may affect the pulse of the U.S.
|
| New York Tax Exempt Income Fund 7 |
economy. Should additional stimulus augment U.S. growth, we believe the Fed might be inclined to tighten a little faster, or conversely, tighten more slowly if fiscal policy proves less stimulative.
Just after period-end, the Republican House and Senate versions of a tax reform plan were sent into a reconciliation process with the goal of many of the proposed changes going into effect on January 1, 2018. President Trump signed the legislation in late December.
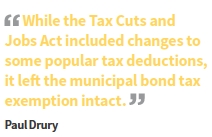
While the Tax Cuts and Jobs Act included tax cuts for individuals and corporations, the elimination of certain taxes, and changes to some popular tax deductions, it left the municipal bond tax exemption intact. We do not believe the changes in tax rates will materially affect demand for municipal bonds from individuals. Overall, the tax bill appears constructive for the municipal bond market, in our view.
Looking ahead, we will be closely monitoring the debt ceiling debate; a budget resolution for the next fiscal year; and the confirmation of President Trump’s nomination of Jerome Powell as the next Federal Reserve chair, as Janet Yellen’s current term is due to expire in February 2018. As always, we will continue to rely on in-depth research and our experienced market insights to evaluate new and existing holdings for attractive income and return potential.
Thank you, Paul, for your time and insights today.
The views expressed in this report are exclusively those of Putnam Management and are subject to change. They are not meant as investment advice.
Please note that the holdings discussed in this report may not have been held by the fund for the entire period. Portfolio composition is subject to review in accordance with the fund’s investment strategy and may vary in the future. Current and future portfolio holdings are subject to risk. Statements in the Q&A concerning the fund’s performance or portfolio composition relative to those of the fund’s Lipper peer group may reference information produced by Lipper Inc. or through a third party.

Comparison of top sector weightings
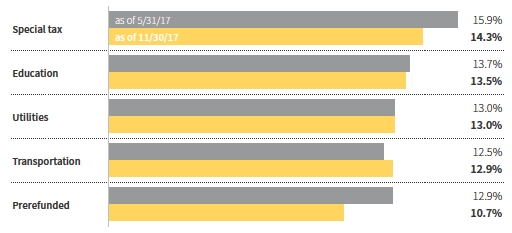
This chart shows how the fund’s top weightings have changed over the past six months. Allocations are shown as a percentage of the fund’s net assets. Current period summary information may differ from the information in the portfolio schedule notes included in the financial statements due to the inclusion of derivative securities, any interest accruals, the use of different classifications of securities for presentation purposes, and rounding. Holdings and allocations may vary over time.
|
| 8 New York Tax Exempt Income Fund |
Your fund’s performance
This section shows your fund’s performance, price, and distribution information for periods ended November 30, 2017, the end of its most recent fiscal year. In accordance with regulatory requirements for mutual funds, we also include performance information as of the most recent calendar quarter-end and expense information taken from the fund’s current prospectus. Performance should always be considered in light of a fund’s investment strategy. Data represent past performance. Past performance does not guarantee future results. More recent returns may be less or more than those shown. Investment return and principal value will fluctuate, and you may have a gain or a loss when you sell your shares. Performance information does not reflect any deduction for taxes a shareholder may owe on fund distributions or on the redemption of fund shares. For the most recent month-end performance, please visit the Individual Investors section at putnam.com or call Putnam at 1-800-225-1581. Class Y shares are not available to all investors. See the Terms and definitions section in this report for definitions of the share classes offered by your fund.
Fund performance Total return for periods ended 11/30/17
| | | | | | | | |
| | Annual | | | | | | | |
| | average | | Annual | | Annual | | Annual | |
| | (life of fund) | 10 years | average | 5 years | average | 3 years | average | 1 year |
| Class A (9/2/83) | | | | | | | | |
| Before sales charge | 6.29% | 45.86% | 3.85% | 10.54% | 2.02% | 8.12% | 2.64% | 4.92% |
| After sales charge | 6.16 | 40.03 | 3.42 | 6.12 | 1.20 | 3.80 | 1.25 | 0.72 |
| Class B (1/4/93) | | | | | | | | |
| Before CDSC | 6.07 | 38.54 | 3.31 | 7.14 | 1.39 | 6.11 | 2.00 | 4.27 |
| After CDSC | 6.07 | 38.54 | 3.31 | 5.28 | 1.03 | 3.17 | 1.05 | –0.73 |
| Class C (7/26/99) | | | | | | | | |
| Before CDSC | 5.43 | 34.88 | 3.04 | 6.44 | 1.26 | 5.62 | 1.84 | 4.11 |
| After CDSC | 5.43 | 34.88 | 3.04 | 6.44 | 1.26 | 5.62 | 1.84 | 3.11 |
| Class M (4/10/95) | | | | | | | | |
| Before sales charge | 5.91 | 41.77 | 3.55 | 9.11 | 1.76 | 7.21 | 2.35 | 4.62 |
| After sales charge | 5.81 | 37.17 | 3.21 | 5.57 | 1.09 | 3.72 | 1.23 | 1.22 |
| Class Y (1/2/08) | | | | | | | | |
| Net asset value | 6.35 | 49.04 | 4.07 | 11.76 | 2.25 | 8.84 | 2.86 | 5.03 |
Current performance may be lower or higher than the quoted past performance, which cannot guarantee future results. After-sales-charge returns for class A and M shares reflect the deduction of the maximum 4.00% and 3.25% sales charge, respectively, levied at the time of purchase. Class B share returns after contingent deferred sales charge (CDSC) reflect the applicable CDSC, which is 5% in the first year, declining over time to 1% in the sixth year, and is eliminated thereafter. Class C share returns after CDSC reflect a 1% CDSC for the first year that is eliminated thereafter. Class Y shares have no initial sales charge or CDSC. Performance for class B, C, M, and Y shares before their inception is derived from the historical performance of class A shares, adjusted for the applicable sales charge (or CDSC) and the higher operating expenses for such shares, except for class Y shares, for which 12b-1 fees are not applicable.
For a portion of the periods, the fund had expense limitations, without which returns would have been lower.
Class B share performance reflects conversion to class A shares after eight years.
|
| New York Tax Exempt Income Fund 9 |
| | | | | | | | |
| Comparative index returns For periods ended 11/30/17 | | | | |
| |
| | Annual | | | | | | | |
| | average | | Annual | | Annual | | Annual | |
| | (life of fund) | 10 years | average | 5 years | average | 3 years | average | 1 year |
| Bloomberg Barclays | | | | | | | | |
| Municipal Bond Index | 6.72% | 53.47% | 4.38% | 13.42% | 2.55% | 8.61% | 2.79% | 5.58% |
| Lipper New York Municipal | | | | | | | | |
| Debt Funds category | 6.12 | 43.51 | 3.67 | 10.31 | 1.97 | 7.93 | 2.57 | 4.43 |
| average* | | | | | | | | |
Index and Lipper results should be compared with fund performance before sales charge, before CDSC, or at net asset value.
* Over the 1-year, 3-year, 5-year, 10-year, and life-of-fund periods ended 11/30/17, there were 90, 89, 83, 63, and 3 funds, respectively, in this Lipper category.
Past performance does not indicate future results. At the end of the same time period, a $10,000 investment in the fund’s class B and C shares would have been valued at $13,854 and $13,488, respectively, and no contingent deferred sales charges would apply. A $10,000 investment in the fund’s class M shares ($9,675 after sales charge) would have been valued at $13,717. A $10,000 investment in the fund’s class Y shares would have been valued at $14,904.
| |
| 10 New York Tax Exempt Income Fund |
Fund price and distribution information For the 12-month period ended 11/30/17
| | | | | | | |
| Distributions | Class A | Class B | Class C | Class M | Class Y |
| Number | 12 | 12 | 12 | 12 | 12 |
| Income1 | $0.266560 | $0.213200 | $0.200365 | $0.242279 | $0.285250 |
| Capital gains2 | — | — | — | — | — |
| Total | $0.266560 | $0.213200 | $0.200365 | $0.242279 | $0.285250 |
| | Before | After | Net | Net | Before | After | Net |
| | sales | sales | asset | asset | sales | sales | asset |
| Share value | charge | charge | value | value | charge | charge | value |
| 11/30/16 | $8.35 | $8.70 | $8.33 | $8.35 | $8.36 | $8.64 | $8.36 |
| 11/30/17 | 8.49 | 8.84 | 8.47 | 8.49 | 8.50 | 8.79 | 8.49 |
| | Before | After | Net | Net | Before | After | Net |
| Current rate | sales | sales | asset | asset | sales | sales | asset |
| (end of period) | charge | charge | value | value | charge | charge | value |
| Current dividend rate3 | 2.89% | 2.78% | 2.26% | 2.11% | 2.60% | 2.51% | 3.11% |
| Taxable equivalent4(a) | 5.60 | 5.39 | 4.38 | 4.09 | 5.04 | 4.86 | 6.03 |
| Taxable equivalent4(b) | 5.85 | 5.63 | 4.57 | 4.27 | 5.26 | 5.08 | 6.29 |
| Current 30-day | | | | | | | |
| SEC yield5 | N/A | 1.67 | 1.11 | 0.95 | N/A | 1.41 | 1.96 |
| Taxable equivalent4(a) | N/A | 3.24 | 2.15 | 1.84 | N/A | 2.73 | 3.80 |
| Taxable equivalent4(b) | N/A | 3.38 | 2.25 | 1.92 | N/A | 2.85 | 3.97 |
The classification of distributions, if any, is an estimate. Before-sales-charge share value and current dividend rate for class A and M shares, if applicable, do not take into account any sales charge levied at the time of purchase. After-sales-charge share value, current dividend rate, and current 30-day SEC yield, if applicable, are calculated assuming that the maximum sales charge (4.00% for class A shares and 3.25% for class M shares) was levied at the time of purchase. Final distribution information will appear on your year-end tax forms.
1 For some investors, investment income may be subject to the federal alternative minimum tax.
2 Capital gains, if any, are taxable for federal and, in most cases, state purposes.
3 Most recent distribution, including any return of capital and excluding capital gains, annualized and divided by share price before or after sales charge at period-end.
4 Assumes (a) maximum 48.39% federal and state combined tax rate for 2017 or (b) maximum 50.59% federal, state and New York City combined tax rate for 2017. Results for investors subject to lower tax rates would not be as advantageous. Tax rates are as of November 30, 2017, and do not reflect the recent changes to the Tax Cuts and Jobs Act of 2017.
5 Based only on investment income and calculated using the maximum offering price for each share class, in accordance with SEC guidelines.
|
| New York Tax Exempt Income Fund 11 |
Fund performance as of most recent calendar quarter Total return for periods ended 12/31/17
| | | | | | | | |
| | Annual average | | Annual | | Annual | | Annual | |
| | (life of fund) | 10 years | average | 5 years | average | 3 years | average | 1 year |
| Class A (9/2/83) | | | | | | | | |
| Before sales charge | 6.30% | 47.06% | 3.93% | 13.42% | 2.55% | 8.48% | 2.75% | 5.02% |
| After sales charge | 6.17 | 41.17 | 3.51 | 8.88 | 1.72 | 4.14 | 1.36 | 0.82 |
| Class B (1/4/93) | | | | | | | | |
| Before CDSC | 6.09 | 39.84 | 3.41 | 9.81 | 1.89 | 6.46 | 2.11 | 4.37 |
| After CDSC | 6.09 | 39.84 | 3.41 | 7.90 | 1.53 | 3.51 | 1.16 | –0.63 |
| Class C (7/26/99) | | | | | | | | |
| Before CDSC | 5.44 | 35.99 | 3.12 | 9.08 | 1.75 | 6.09 | 1.99 | 4.33 |
| After CDSC | 5.44 | 35.99 | 3.12 | 9.08 | 1.75 | 6.09 | 1.99 | 3.33 |
| Class M (4/10/95) | | | | | | | | |
| Before sales charge | 5.92 | 43.10 | 3.65 | 11.82 | 2.26 | 7.68 | 2.50 | 4.84 |
| After sales charge | 5.82 | 38.45 | 3.31 | 8.19 | 1.59 | 4.18 | 1.37 | 1.43 |
| Class Y (1/2/08) | | | | | | | | |
| Net asset value | 6.37 | 50.29 | 4.16 | 14.54 | 2.75 | 9.19 | 2.97 | 5.25 |
See the discussion following the fund performance table on page 9 for information about the calculation of fund performance.
Your fund’s expenses
As a mutual fund investor, you pay ongoing expenses, such as management fees, distribution fees (12b-1 fees), and other expenses. Using the following information, you can estimate how these expenses affect your investment and compare them with the expenses of other funds. You may also pay one-time transaction expenses, including sales charges (loads) and redemption fees, which are not shown in this section and would have resulted in higher total expenses. For more information, see your fund’s prospectus or talk to your financial representative.
Expense ratios
| | | | | |
| | Class A | Class B | Class C | Class M | Class Y |
| Total annual operating expenses for the fiscal | | | | | |
| year ended 11/30/16* | 0.75% | 1.38% | 1.53% | 1.03% | 0.53% |
| Annualized expense ratio for the six-month | | | | | |
| period ended 11/30/17† | 0.75% | 1.38% | 1.53% | 1.03% | 0.53% |
Fiscal-year expense information in this table is taken from the most recent prospectus, is subject to change, and may differ from that shown for the annualized expense ratio and in the financial highlights of this report.
Expenses are shown as a percentage of average net assets.
* Restated to reflect current fees resulting from a change to the fund’s investor servicing arrangements effective 9/1/16.
† Expense ratios for each class are for the fund’s most recent fiscal half year. As a result of this, ratios may differ from expense ratios based on one-year data in the financial highlights.
|
| 12 New York Tax Exempt Income Fund |
Expenses per $1,000
The following table shows the expenses you would have paid on a $1,000 investment in each class of the fund from 6/1/17 to 11/30/17. It also shows how much a $1,000 investment would be worth at the close of the period, assuming actual returns and expenses.
| | | | | |
| | Class A | Class B | Class C | Class M | Class Y |
| Expenses paid per $1,000 *† | $3.77 | $6.93 | $7.68 | $5.18 | $2.67 |
| Ending value (after expenses) | $1,006.30 | $1,003.10 | $1,002.30 | $1,004.80 | $1,007.40 |
* Expenses for each share class are calculated using the fund’s annualized expense ratio for each class, which represents the ongoing expenses as a percentage of average net assets for the six months ended 11/30/17. The expense ratio may differ for each share class.
† Expenses are calculated by multiplying the expense ratio by the average account value for the period; then multiplying the result by the number of days in the period; and then dividing that result by the number of days in the year.
Estimate the expenses you paid
To estimate the ongoing expenses you paid for the six months ended 11/30/17, use the following calculation method. To find the value of your investment on 6/1/17, call Putnam at 1-800-225-1581.

Compare expenses using the SEC’s method
The Securities and Exchange Commission (SEC) has established guidelines to help investors assess fund expenses. Per these guidelines, the following table shows your fund’s expenses based on a $1,000 investment, assuming a hypothetical 5% annualized return. You can use this information to compare the ongoing expenses (but not transaction expenses or total costs) of investing in the fund with those of other funds. All mutual fund shareholder reports will provide this information to help you make this comparison. Please note that you cannot use this information to estimate your actual ending account balance and expenses paid during the period.
| | | | | |
| | Class A | Class B | Class C | Class M | Class Y |
| Expenses paid per $1,000 *† | $3.80 | $6.98 | $7.74 | $5.22 | $2.69 |
| Ending value (after expenses) | $1,021.31 | $1,018.15 | $1,017.40 | $1,019.90 | $1,022.41 |
* Expenses for each share class are calculated using the fund’s annualized expense ratio for each class, which represents the ongoing expenses as a percentage of average net assets for the six months ended 11/30/17. The expense ratio may differ for each share class.
† Expenses are calculated by multiplying the expense ratio by the average account value for the six-month period; then multiplying the result by the number of days in the six-month period; and then dividing that result by the number of days in the year.
|
| New York Tax Exempt Income Fund 13 |
Terms and definitions
Important terms
Total return shows how the value of the fund’s shares changed over time, assuming you held the shares through the entire period and reinvested all distributions in the fund.
Before sales charge, or net asset value, is the price, or value, of one share of a mutual fund, without a sales charge. Before-sales-charge figures fluctuate with market conditions, and are calculated by dividing the net assets of each class of shares by the number of outstanding shares in the class.
After sales charge is the price of a mutual fund share plus the maximum sales charge levied at the time of purchase. After-sales-charge performance figures shown here assume the 4.00% maximum sales charge for class A shares and 3.25% for class M shares.
Contingent deferred sales charge (CDSC) is generally a charge applied at the time of the redemption of class B or C shares and assumes redemption at the end of the period. Your fund’s class B CDSC declines over time from a 5% maximum during the first year to 1% during the sixth year. After the sixth year, the CDSC no longer applies. The CDSC for class C shares is 1% for one year after purchase.
Share classes
Class A shares are generally subject to an initial sales charge and no CDSC (except on certain redemptions of shares bought without an initial sales charge).
Class B shares are closed to new investments and are only available by exchange from another Putnam fund or through dividend and/ or capital gains reinvestment. They are not subject to an initial sales charge and may be subject to a CDSC.
Class C shares are not subject to an initial sales charge and are subject to a CDSC only if the shares are redeemed during the first year.
Class M shares have a lower initial sales charge and a higher 12b-1 fee than class A shares and no CDSC.
Class Y shares are not subject to an initial sales charge or CDSC, and carry no 12b-1 fee. They are generally only available to corporate and institutional clients and clients in other approved programs.
Fixed-income terms
Current rate is the annual rate of return earned from dividends or interest of an investment. Current rate is expressed as a percentage of the price of a security, fund share, or principal investment.
Yield curve is a graph that plots the yields of bonds with equal credit quality against their differing maturity dates, ranging from shortest to longest. It is used as a benchmark for other debt, such as mortgage or bank lending rates.
Comparative indexes
Bloomberg Barclays Municipal Bond Index is an unmanaged index of long-term fixed-rate investment-grade tax-exempt bonds.
Bloomberg Barclays U.S. Aggregate Bond Index is an unmanaged index of U.S. investment-grade fixed-income securities.
ICE BofAML U.S. 3-Month Treasury Bill Index is an unmanaged index that seeks to measure the performance of U.S. Treasury bills available in the marketplace.
S&P 500 Index is an unmanaged index of common stock performance.
ICE Data Indices, LLC (“ICE BofAML”), used with permission. ICE BofAML permits use of the ICE BofAML indices and related data on an “as is” basis; makes no warranties regarding same; does not guarantee the suitability, quality, accuracy, timeliness, and/or completeness of the ICE BofAML indices or any data included in, related to, or derived therefrom; assumes no liability in connection with the use of the foregoing; and does not sponsor, endorse, or recommend Putnam Investments, or any of its products or services.
|
| 14 New York Tax Exempt Income Fund |
Indexes assume reinvestment of all distributions and do not account for fees. Securities and performance of a fund and an index will differ. You cannot invest directly in an index.
Lipper is a third-party industry-ranking entity that ranks mutual funds. Its rankings do not reflect sales charges. Lipper rankings are based on total return at net asset value relative to other funds that have similar current investment styles or objectives as determined by Lipper. Lipper may change a fund’s category assignment at its discretion. Lipper category averages reflect performance trends for funds within a category.
Other information for shareholders
Proxy voting
Putnam is committed to managing our mutual funds in the best interests of our shareholders. The Putnam funds’ proxy voting guidelines and procedures, as well as information regarding how your fund voted proxies relating to portfolio securities during the 12-month period ended June 30, 2017, are available in the Individual Investors section of putnam.com, and on the Securities and Exchange Commission (SEC) website, www.sec.gov. If you have questions about finding forms on the SEC’s website, you may call the SEC at 1-800-SEC-0330. You may also obtain the Putnam funds’ proxy voting guidelines and procedures at no charge by calling Putnam’s Shareholder Services at 1-800-225-1581.
Fund portfolio holdings
The fund will file a complete schedule of its portfolio holdings with the SEC for the first and third quarters of each fiscal year on Form N-Q. Shareholders may obtain the fund’s Form N-Q on the SEC’s website at www.sec.gov. In addition, the fund’s Form N-Q may be reviewed and copied at the SEC’s Public Reference Room in Washington, D.C. You may call the SEC at 1-800-SEC-0330 for information about the SEC’s website or the operation of the Public Reference Room.
Trustee and employee fund ownership
Putnam employees and members of the Board of Trustees place their faith, confidence, and, most importantly, investment dollars in Putnam mutual funds. As of November 30, 2017, Putnam employees had approximately $524,000,000 and the Trustees had approximately $91,000,000 invested in Putnam mutual funds. These amounts include investments by the Trustees’ and employees’ immediate family members as well as investments through retirement and deferred compensation plans.
|
| New York Tax Exempt Income Fund 15 |
Important notice regarding Putnam’s privacy policy
In order to conduct business with our shareholders, we must obtain certain personal information such as account holders’ names, addresses, Social Security numbers, and dates of birth. Using this information, we are able to maintain accurate records of accounts and transactions.
It is our policy to protect the confidentiality of our shareholder information, whether or not a shareholder currently owns shares of our funds. In particular, it is our policy not to sell information about you or your accounts to outside marketing firms. We have safeguards in place designed to prevent unauthorized access to our computer systems and procedures to protect personal information from unauthorized use.
Under certain circumstances, we must share account information with outside vendors who provide services to us, such as mailings and proxy solicitations. In these cases, the service providers enter into confidentiality agreements with us, and we provide only the information necessary to process transactions and perform other services related to your account. Finally, it is our policy to share account information with your financial representative, if you’ve listed one on your Putnam account.
|
| 16 New York Tax Exempt Income Fund |
Trustee approval of management contract
General conclusions
The Board of Trustees of The Putnam Funds oversees the management of each fund and, as required by law, determines annually whether to approve the continuance of your fund’s management contract with Putnam Investment Management, LLC (“Putnam Management”) and the sub-management contract with respect to your fund between Putnam Management and its affiliate, Putnam Investments Limited (“PIL”). The Board, with the assistance of its Contract Committee, requests and evaluates all information it deems reasonably necessary under the circumstances in connection with its annual contract review. The Contract Committee consists solely of Trustees who are not “interested persons” (as this term is defined in the Investment Company Act of 1940, as amended (the “1940 Act”)) of The Putnam Funds (“Independent Trustees”).
At the outset of the review process, members of the Board’s independent staff and independent legal counsel discussed with representatives of Putnam Management the annual contract review materials furnished to the Contract Committee during the course of the previous year’s review, identifying possible changes in these materials that might be necessary or desirable for the coming year. Following these discussions and in consultation with the Contract Committee, the Independent Trustees’ independent legal counsel requested that Putnam Management and its affiliates furnish specified information, together with any additional information that Putnam Management considered relevant, to the Contract Committee. Over the course of several months ending in June 2017, the Contract Committee met on a number of occasions with representatives of Putnam Management, and separately in executive session, to consider the information that Putnam Management provided. Throughout this process, the Contract Committee was assisted by the members of the Board’s independent staff and by independent legal counsel for The Putnam Funds and the Independent Trustees.
In May 2017, the Contract Committee met in executive session to discuss and consider its recommendations with respect to the continuance of the contracts. At the Trustees’ June 2017 meeting, the Contract Committee met in executive session with the other Independent Trustees to review a summary of the key financial, performance and other data that the Contract Committee considered in the course of its review. The Contract Committee then presented its written report, which summarized the key factors that the Committee had considered and set forth its recommendations. The Contract Committee recommended, and the Independent Trustees approved, the continuance of your fund’s management and sub-management contracts, effective July 1, 2017. (Because PIL is an affiliate of Putnam Management and Putnam Management remains fully responsible for all services provided by PIL, the Trustees have not attempted to evaluate PIL as a separate entity, and all subsequent references to Putnam Management below should be deemed to include reference to PIL as necessary or appropriate in the context.)
The Independent Trustees’ approval was based on the following conclusions:
• That the fee schedule in effect for your fund represented reasonable compensation in light of the nature and quality of the services being provided to the fund, the fees paid by competitive funds, the costs incurred by Putnam Management in providing services to the fund, and the continued application of certain reductions and waivers noted below; and
• That the fee schedule in effect for your fund represented an appropriate sharing between fund shareholders and Putnam Management of such economies of scale as may exist in the management of the fund at current asset levels.
These conclusions were based on a comprehensive consideration of all information provided to the Trustees and were not the result of any single factor. Some of the factors that figured particularly in the Trustees’ deliberations and how the Trustees considered these factors are described below, although individual Trustees may have evaluated the information presented differently, giving different weights to various factors. It is also important to recognize that the management arrangements for your fund and the other Putnam funds are the result of many years of review and discussion between the Independent Trustees and Putnam Management, that some aspects of the arrangements may receive greater scrutiny in some years than others, and that the Trustees’ conclusions may be based, in part, on their consideration of fee arrangements in previous years. For example, with some minor exceptions, the funds’ current fee arrangements under the
|
| New York Tax Exempt Income Fund 17 |
management contracts were first implemented at the beginning of 2010 following extensive review by the Contract Committee and discussions with representatives of Putnam Management, as well as approval by shareholders.
Management fee schedules and total expenses
The Trustees reviewed the management fee schedules in effect for all Putnam funds, including fee levels and breakpoints. The Trustees also reviewed the total expenses of each Putnam fund, recognizing that in most cases management fees represented the major, but not the sole, determinant of total costs to fund shareholders. (In a few instances, funds have implemented so-called “all-in” management fees covering substantially all routine fund operating costs.)
In reviewing fees and expenses, the Trustees generally focus their attention on material changes in circumstances — for example, changes in assets under management, changes in a fund’s investment strategy, changes in Putnam Management’s operating costs or profitability, or changes in competitive practices in the mutual fund industry — that suggest that consideration of fee changes might be warranted. The Trustees concluded that the circumstances did not indicate that changes to the management fee structure for your fund would be appropriate at this time.
Under its management contract, your fund has the benefit of breakpoints in its management fee schedule that provide shareholders with economies of scale in the form of reduced fee rates as assets under management in the Putnam family of funds increase. The Trustees concluded that the fee schedule in effect for your fund represented an appropriate sharing of economies of scale between fund shareholders and Putnam Management.
As in the past, the Trustees also focused on the competitiveness of each fund’s total expense ratio. In order to support the effort to have fund expenses meet competitive standards, the Trustees and Putnam Management have implemented certain expense limitations that were in effect during your fund’s fiscal year ending in 2016. These expense limitations were: (i) a contractual expense limitation applicable to specified retail open-end funds, including your fund, of 25 basis points (until September 1, 2016, this limitation was 32 basis points) on investor servicing fees and expenses and (ii) a contractual expense limitation applicable to specified open-end funds, including your fund, of 20 basis points on so-called “other expenses” (i.e., all expenses exclusive of management fees, distribution fees, investor servicing fees, investment-related expenses, interest, taxes, brokerage commissions, acquired fund fees and expenses and extraordinary expenses). These expense limitations attempt to maintain competitive expense levels for the funds. Most funds, including your fund, had sufficiently low expenses that these expense limitations were not operative during their fiscal years ending in 2016. Putnam Management has agreed to maintain these expense limitations until at least March 30, 2019. Putnam Management’s support for these expense limitation arrangements was an important factor in the Trustees’ decision to approve the continuance of your fund’s management and sub-management contracts.
The Trustees reviewed comparative fee and expense information for a custom group of competitive funds selected by Broadridge Financial Solutions, Inc. (“Broadridge”). This comparative information included your fund’s percentile ranking for effective management fees and total expenses (excluding any applicable 12b-1 fee), which provides a general indication of your fund’s relative standing. In the custom peer group, your fund ranked in the first quintile in effective management fees (determined for your fund and the other funds in the custom peer group based on fund asset size and the applicable contractual management fee schedule) and in the second quintile in total expenses (excluding any applicable 12b-1 fees) as of December 31, 2016. The first quintile represents the least expensive funds and the fifth quintile the most expensive funds. The fee and expense data reported by Broadridge as of December 31, 2016 reflected the most recent fiscal year-end data available in Broadridge’s database at that time.
In connection with their review of fund management fees and total expenses, the Trustees also reviewed the costs of the services provided and the profits realized by Putnam Management and its affiliates from their contractual relationships with the funds. This information included trends in revenues, expenses and profitability of Putnam Management and its affiliates relating to the investment management, investor servicing and distribution services provided to the funds. In this regard, the Trustees also reviewed an analysis of Putnam Management’s revenues, expenses and profitability, allocated on a fund-by-fund basis, with respect to the funds’ management, distribution, and investor servicing contracts.
|
| 18 New York Tax Exempt Income Fund |
For each fund, the analysis presented information about revenues, expenses and profitability for each of the agreements separately and for the agreements taken together on a combined basis. The Trustees concluded that, at current asset levels, the fee schedules in place represented reasonable compensation for the services being provided and represented an appropriate sharing between fund shareholders and Putnam Management of such economies of scale as may exist in the management of the Putnam funds at that time.
The information examined by the Trustees in connection with their annual contract review for the Putnam funds included information regarding fees charged by Putnam Management and its affiliates to institutional clients, including defined benefit pension and profit-sharing plans, charities, college endowments, foundations, sub-advised third-party mutual funds, state, local and non-U.S. government entities, and corporations. This information included, in cases where an institutional product’s investment strategy corresponds with a fund’s strategy, comparisons of those fees with fees charged to the Putnam funds, as well as an assessment of the differences in the services provided to these different types of clients as compared to the services provided to the Putnam Funds. The Trustees observed that the differences in fee rates between these clients and the Putnam funds are by no means uniform when examined by individual asset sectors, suggesting that differences in the pricing of investment management services to these types of clients may reflect, among other things, historical competitive forces operating in separate markets. The Trustees considered the fact that in many cases fee rates across different asset classes are higher on average for mutual funds than for institutional clients, as well as the differences between the services that Putnam Management provides to the Putnam funds and those that it provides to its other clients. The Trustees did not rely on these comparisons to any significant extent in concluding that the management fees paid by your fund are reasonable.
Investment performance
The quality of the investment process provided by Putnam Management represented a major factor in the Trustees’ evaluation of the quality of services provided by Putnam Management under your fund’s management contract. The Trustees were assisted in their review of the Putnam funds’ investment process and performance by the work of the investment oversight committees of the Trustees, which meet on a regular basis with the funds’ portfolio teams and with the Chief Investment Officers and other senior members of Putnam Management’s Investment Division throughout the year. In addition, in response to a request from the Independent Trustees, Putnam Management provided the Trustees with in-depth presentations regarding each of the equity and fixed income investment teams, including the operation of the teams and their investment approaches. The Trustees concluded that Putnam Management generally provides a high-quality investment process — based on the experience and skills of the individuals assigned to the management of fund portfolios, the resources made available to them, and in general Putnam Management’s ability to attract and retain high-quality personnel — but also recognized that this does not guarantee favorable investment results for every fund in every time period.
The Trustees considered that 2016 was a challenging year for the performance of the Putnam funds, with generally disappointing results for the international and global equity funds and taxable fixed income funds, mixed results for small-cap equity, Spectrum, global asset allocation, equity research and tax exempt fixed income funds, but generally strong results for U.S. equity funds. The Trustees noted, however, that they were encouraged by the positive performance trend since mid-year 2016 across most Putnam Funds. In particular, from May 1, 2016 through April 30, 2017, 51% of Putnam Fund assets were in the top quartile and 87% were above the median of the Putnam Funds’ competitive industry rankings. They noted that the longer-term performance of the Putnam funds generally continued to be strong, exemplified by the fact that the Putnam funds were ranked by the Barron’s/Lipper Fund Families survey as the 5th-best performing mutual fund complex out of 54 complexes for the five-year period ended December 31, 2016. In addition, while the survey ranked the Putnam Funds 52nd out of 61 mutual fund complexes for the one-year period ended 2016, the Putnam Funds have ranked 1st or 2nd in the survey for the one-year period three times since 2009 (most recently in 2013). They also noted, however, the disappointing investment performance of some funds for periods ended December 31, 2016 and considered information provided by Putnam Management regarding the factors contributing to the underperformance and actions being taken to improve the performance of these particular funds. The Trustees indicated
|
| New York Tax Exempt Income Fund 19 |
their intention to continue to monitor closely the performance of those funds, including the effectiveness of any efforts Putnam Management has undertaken to address underperformance and whether additional actions to address areas of underperformance are warranted.
For purposes of the Trustees’ evaluation of the Putnam Funds’ investment performance, the Trustees generally focus on a competitive industry ranking of each fund’s total net return over a one-year, three-year and five-year period. For a number of Putnam funds with relatively unique investment mandates for which Putnam Management informed the Trustees that meaningful competitive performance rankings are not considered to be available, the Trustees evaluated performance based on their total gross and net returns and, in most cases, comparisons of those returns with the returns of selected investment benchmarks. In the case of your fund, the Trustees considered that its class A share cumulative total return performance at net asset value was in the following quartiles of its Lipper Inc. (“Lipper”) peer group (Lipper New York Municipal Debt Funds) for the one-year, three-year and five-year periods ended December 31, 2016 (the first quartile representing the best-performing funds and the fourth quartile the worst-performing funds):
| |
| One-year period | 2nd |
| Three-year period | 3rd |
| Five-year period | 3rd |
Over the one-year, three-year and five-year periods ended December 31, 2016, there were 96, 95 and 85 funds, respectively, in your fund’s Lipper peer group. (When considering performance information, shareholders should be mindful that past performance is not a guarantee of future results.)
The Trustees also considered Putnam Management’s continued efforts to support fund performance through initiatives including structuring compensation for portfolio managers and research analysts to enhance accountability for fund performance, emphasizing accountability in the portfolio management process, and affirming its commitment to a fundamental-driven approach to investing. The Trustees noted further that Putnam Management continued to strengthen its fundamental research capabilities by adding new investment personnel.
Brokerage and soft-dollar allocations; investor servicing
The Trustees considered various potential benefits that Putnam Management may receive in connection with the services it provides under the management contract with your fund. These include benefits related to brokerage allocation and the use of soft dollars, whereby a portion of the commissions paid by a fund for brokerage may be used to acquire research services that are expected to be useful to Putnam Management in managing the assets of the fund and of other clients. Subject to policies established by the Trustees, soft dollars generated by these means are used predominantly to acquire brokerage and research services (including third-party research and market data) that enhance Putnam Management’s investment capabilities and supplement Putnam Management’s internal research efforts. However, the Trustees noted that a portion of available soft dollars continues to be used to pay fund expenses. The Trustees indicated their continued intent to monitor regulatory and industry developments in this area with the assistance of their Brokerage Committee, including any developments with respect to the European Union’s updated Markets in Financial Instruments Directive and its potential impact on PIL’s use of client commissions to obtain investment research. The Trustees also indicated their continued intent to monitor the allocation of the Putnam funds’ brokerage in order to ensure that the principle of seeking best price and execution remains paramount in the portfolio trading process.
Putnam Management may also receive benefits from payments that the funds make to Putnam Management’s affiliates for investor or distribution services. In conjunction with the annual review of your fund’s management and sub-management contracts, the Trustees reviewed your fund’s investor servicing agreement with Putnam Investor Services, Inc. (“PSERV”) and its distributor’s contracts and distribution plans with Putnam Retail Management Limited Partnership (“PRM”), both of which are affiliates of Putnam Management. The Trustees concluded that the fees payable by the funds to PSERV and PRM, as applicable, for such services are fair and reasonable in relation to the nature and quality of such services, the fees paid by competitive funds, and the costs incurred by PSERV and PRM, as applicable, in providing such services. Furthermore, the Trustees were of the view that the services provided were required for the operation of the funds, and that they were of a quality at least equal to those provided by other providers.
| |
| 20 New York Tax Exempt Income Fund |
Financial statements
These sections of the report, as well as the accompanying Notes, preceded by the Report of Independent Registered Public Accounting Firm, constitute the fund’s financial statements.
The fund’s portfolio lists all the fund’s investments and their values as of the last day of the reporting period. Holdings are organized by asset type and industry sector, country, or state to show areas of concentration and diversification.
Statement of assets and liabilities shows how the fund’s net assets and share price are determined. All investment and non-investment assets are added together. Any unpaid expenses and other liabilities are subtracted from this total. The result is divided by the number of shares to determine the net asset value per share, which is calculated separately for each class of shares. (For funds with preferred shares, the amount subtracted from total assets includes the liquidation preference of preferred shares.)
Statement of operations shows the fund’s net investment gain or loss. This is done by first adding up all the fund’s earnings — from dividends and interest income — and subtracting its operating expenses to determine net investment income (or loss). Then, any net gain or loss the fund realized on the sales of its holdings — as well as any unrealized gains or losses over the period — is added to or subtracted from the net investment result to determine the fund’s net gain or loss for the fiscal year.
Statement of changes in net assets shows how the fund’s net assets were affected by the fund’s net investment gain or loss, by distributions to shareholders, and by changes in the number of the fund’s shares. It lists distributions and their sources (net investment income or realized capital gains) over the current reporting period and the most recent fiscal year-end. The distributions listed here may not match the sources listed in the Statement of operations because the distributions are determined on a tax basis and may be paid in a different period from the one in which they were earned.
Financial highlights provide an overview of the fund’s investment results, per-share distributions, expense ratios, net investment income ratios, and portfolio turnover in one summary table, reflecting the five most recent reporting periods. In a semian-nual report, the highlights table also includes the current reporting period.
|
| New York Tax Exempt Income Fund 21 |
Report of Independent Registered Public Accounting Firm
The Board of Trustees and Shareholders
Putnam New York Tax Exempt Income Fund:
We have audited the accompanying statement of assets and liabilities of Putnam New York Tax Exempt Income Fund (the fund), including the fund’s portfolio, as of November 30, 2017, and the related statement of operations for the year then ended, the statements of changes in net assets for each of the years in the two-year period then ended, and the financial highlights for each of the years in the five-year period then ended. These financial statements and financial highlights are the responsibility of the fund’s management. Our responsibility is to express an opinion on these financial statements and financial highlights based on our audits.
We conducted our audits in accordance with the standards of the Public Company Accounting Oversight Board (United States). Those standards require that we plan and perform the audit to obtain reasonable assurance about whether the financial statements and financial highlights are free of material misstatement. An audit includes examining, on a test basis, evidence supporting the amounts and disclosures in the financial statements. Our procedures included confirmation of securities owned as of November 30, 2017, by correspondence with the custodian and brokers or by other appropriate auditing procedures. An audit also includes assessing the accounting principles used and significant estimates made by management, as well as evaluating the overall financial statement presentation. We believe that our audits provide a reasonable basis for our opinion.
In our opinion, the financial statements and financial highlights referred to above present fairly, in all material respects, the financial position of Putnam New York Tax Exempt Income Fund as of November 30, 2017, the results of its operations for the year then ended, the changes in its net assets for each of the years in the two-year period then ended, and the financial highlights for each of the years in the five-year period then ended, in conformity with U.S. generally accepted accounting principles.

Boston, Massachusetts
January 10, 2018
| |
| 22 New York Tax Exempt Income Fund |
| |
| The fund’s portfolio 11/30/17 | |
| |
| Key to holding’s abbreviations | |
| |
| AGC Assured Guaranty Corp. | G.O. Bonds General Obligation Bonds |
| |
| AGM Assured Guaranty Municipal Corporation | NATL National Public Finance Guarantee Corp. |
| |
| AMBAC AMBAC Indemnity Corporation | U.S. Govt. Coll. U.S. Government Collateralized |
| |
| BAM Build America Mutual | VRDN Variable Rate Demand Notes, which are floating- |
| rate securities with long-term maturities that carry |
| COP Certificates of Participation | coupons that reset and are payable upon demand |
| | either daily, weekly or monthly. The rate shown is the |
| FCS Farm Credit System | current interest rate at the close of the reporting |
| | period. Rates are set by remarketing agents and may |
| FHL Banks Coll. Federal Home Loan Banks | take into consideration market supply and demand, |
| System Collateralized | credit quality and the current SIFMA Municipal Swap |
| | Index rate, which was 0.97% as of the close of the |
| FHLMC Coll. Federal Home Loan Mortgage | reporting period. |
| Corporation Collateralized | |
| | |
| FNMA Coll. Federal National Mortgage | |
| Association Collateralized | |
| | |
| FRN Floating Rate Notes: the rate shown is the current | |
| interest rate or yield at the close of the reporting period. | |
| Rates may be subject to a cap or floor. For certain | |
| securities, the rate may represent a fixed rate currently | |
| in place at the close of the reporting period. | |
| | | |
| MUNICIPAL BONDS AND NOTES (97.4%)* | Rating** | Principal amount | Value |
| California (0.2%) | | | |
| CA State Muni Fin. Auth. Solid Waste Mandatory Put | | | |
| Bonds (1/2/18) (Republic Svcs., Inc.), 1.10%, 9/1/21 | A–2 | $2,200,000 | $2,199,736 |
| | | | 2,199,736 |
| Guam (0.8%) | | | |
| Territory of GU, Rev. Bonds (Section 30), Ser. A, | | | |
| 5.625%, 12/1/29 (Prerefunded 12/1/19) | BBB+ | 3,000,000 | 3,235,770 |
| Territory of GU, Dept. of Ed. COP (John F. Kennedy | | | |
| High School), Ser. A, 6.875%, 12/1/40 | B+ | 500,000 | 525,000 |
| Territory of GU, Govt. Wtr. Wks. Auth. Wtr. & Waste | | | |
| Wtr. Syst. Rev. Bonds, U.S. Govt. Coll., 5.625%, | | | |
| 7/1/40 (Prerefunded 7/1/20) | A– | 2,100,000 | 2,298,744 |
| Territory of GU, Pwr. Auth. Rev. Bonds, Ser. A | | | |
| U.S. Govt. Coll., 5.50%, 10/1/40 | | | |
| (Prerefunded 10/1/20) | Baa2 | 1,300,000 | 1,373,190 |
| 5.00%, 10/1/34 | Baa2 | 700,000 | 740,292 |
| | | | 8,172,996 |
| Mississippi (0.5%) | | | |
| MS State Bus. Fin. Commission Gulf Opportunity | | | |
| Zone VRDN (Chevron USA, Inc.), Ser. E, | | | |
| 1.02%, 12/1/30 | VMIG1 | 5,500,000 | 5,500,000 |
| | | | 5,500,000 |
| Nevada (0.4%) | | | |
| Reno, Sales Tax VRDN (Reno Trans. Rail Access | | | |
| Corridor (ReTRAC)), 1.01%, 6/1/42 | VMIG1 | 4,000,000 | 4,000,000 |
| | | | 4,000,000 |
| New York (93.5%) | | | |
| Albany, Cap. Resource Corp. Rev. Bonds | | | |
| (St. Peter’s Hosp.), U.S. Govt. Coll., 6.25%, | | | |
| 11/15/38 (Prerefunded 11/15/20) | AAA/P | 4,110,000 | 4,651,657 |
|
| New York Tax Exempt Income Fund 23 |
| | | |
| MUNICIPAL BONDS AND NOTES (97.4%)* cont. | Rating** | Principal amount | Value |
| New York cont. | | | |
| Albany, Cap. Resource Corp. Rev. Bonds | | | |
| (Albany College of Pharmacy), 5.00%, 12/1/33 | BBB | $325,000 | $362,252 |
| (Albany College of Pharmacy), 5.00%, 12/1/32 | BBB | 495,000 | 554,039 |
| (Empire Commons Student Hsg.), 5.00%, 5/1/31 | A | 700,000 | 809,536 |
| (Albany College of Pharmacy), 5.00%, 12/1/30 | BBB | 250,000 | 281,158 |
| (Empire Commons Student Hsg.), 5.00%, 5/1/30 | A | 350,000 | 406,753 |
| Brookhaven, Local Dev. Corp. Rev. Bonds | | | |
| (Jeffersons Ferry), 5.25%, 11/1/36 | BBB+/F | 1,200,000 | 1,367,376 |
| Brooklyn Arena Local Dev. Corp. Rev. Bonds | | | |
| (Brooklyn Events Ctr., LLC (Pilot Bonds)), Ser. A, | | | |
| 5.00%, 7/15/42 | Baa3 | 2,000,000 | 2,222,400 |
| Broome Cnty., Indl. Dev. Agcy. Continuing | | | |
| Care Retirement Rev. Bonds (Good Shepard | | | |
| Village), Ser. A, U.S. Govt. Coll., 6.875%, 7/1/40 | | | |
| (Prerefunded 7/1/18) | AAA/P | 715,000 | 737,708 |
| Buffalo & Erie Cnty., Indl. Land Dev. Corp. Rev. Bonds | | | |
| (Catholic Hlth. Syst. Oblig. Group), 5.25%, 7/1/35 | Baa1 | 1,000,000 | 1,125,450 |
| (Orchard Park), 5.00%, 11/15/37 | BBB–/F | 4,470,000 | 4,921,828 |
| (Charter School for Applied Tech.), Ser. A, | | | |
| 5.00%, 6/1/35 | BBB– | 1,000,000 | 1,077,510 |
| (Orchard Park), 5.00%, 11/15/30 | BBB–/F | 500,000 | 563,080 |
| Buffalo & Fort Erie, Pub. Bridge Auth. Rev. Bonds | | | |
| 5.00%, 1/1/42 | A+ | 2,250,000 | 2,601,270 |
| (Toll Bridge Syst.), 5.00%, 1/1/25 | A+ | 400,000 | 478,504 |
| (Toll Bridge Syst.), 5.00%, 1/1/24 | A+ | 250,000 | 293,950 |
| Build NY City Resource Corp. Rev. Bonds | | | |
| (Manhattan College), 5.00%, 8/1/47 | A– | 1,000,000 | 1,146,710 |
| (YMCA of Greater NY), 5.00%, 8/1/40 | A– | 2,050,000 | 2,285,525 |
| 5.00%, 7/1/40 | A+ | 3,175,000 | 3,600,037 |
| (Queens College), Ser. A, 5.00%, 6/1/38 | Aa2 | 2,850,000 | 3,225,231 |
| (Pratt Paper, LLC), 5.00%, 1/1/35 | B+/P | 1,750,000 | 2,008,825 |
| (South Bronx Charter School for Intl. Cultures), | | | |
| Ser. A, 5.00%, 4/15/33 | BB+ | 2,000,000 | 2,065,360 |
| (Bronx Charter School for Excellence), | | | |
| 5.00%, 4/1/33 | BBB– | 500,000 | 530,635 |
| (YMCA of Greater NY), 5.00%, 8/1/32 | A– | 1,740,000 | 1,883,098 |
| Chautauqua Cnty., Indl. Dev. Agcy. Rev. Bonds | | | |
| (Dunkirk Pwr.), 5.875%, 4/1/42 | Baa3 | 2,000,000 | 2,094,840 |
| Dutchess Cnty., Local Dev. Corp. Rev. Bonds | | | |
| (Anderson Ctr. Svcs., Inc.), 6.00%, 10/1/30 | BB+ | 3,315,000 | 3,394,925 |
| (Culinary Inst. of America (The)), 5.00%, 7/1/32 | Baa2 | 300,000 | 342,384 |
| Erie Cnty., Fiscal Stability Auth. Rev. Bonds (Sales | | | |
| Tax & State Aid), Ser. D | | | |
| 5.00%, 9/1/39 | Aa1 | 515,000 | 613,417 |
| 5.00%, 9/1/38 | Aa1 | 1,500,000 | 1,788,060 |
| 5.00%, 9/1/37 | Aa1 | 1,000,000 | 1,193,930 |
| 5.00%, 9/1/36 | Aa1 | 1,500,000 | 1,796,565 |
| 5.00%, 9/1/35 | Aa1 | 1,250,000 | 1,500,700 |
| |
| 24 New York Tax Exempt Income Fund |
| | | |
| MUNICIPAL BONDS AND NOTES (97.4%)* cont. | Rating** | Principal amount | Value |
| New York cont. | | | |
| Erie Cnty., Indl. Dev. Agcy. School Fac. Rev. Bonds | | | |
| (City School Dist. Buffalo), Ser. A, AGM, U.S. | | | |
| Govt. Coll. | | | |
| 5.75%, 5/1/28 (Prerefunded 5/1/18) | Aa2 | $5,000,000 | $5,092,500 |
| 5.75%, 5/1/25 (Prerefunded 5/1/18) | Aa2 | 7,500,000 | 7,638,750 |
| Geneva, Dev. Corp. Rev. Bonds (Hobart & William | | | |
| Smith Colleges) | | | |
| 5.25%, 9/1/44 | A | 2,000,000 | 2,271,760 |
| 5.00%, 9/1/32 | A | 2,000,000 | 2,241,200 |
| Glen Cove, Local Econ. Assistance Corp. Rev. Bonds | | | |
| (Garvies Point Pub. Impt.), Ser. C, stepped-coupon | | | |
| zero % (5.625%, 1/1/24), 1/1/55 †† | B/P | 600,000 | 491,550 |
| Hempstead Town, Local Dev. Corp. Rev. Bonds | | | |
| (Adelphi U.), Ser. B, 5.25%, 2/1/39 | A– | 1,500,000 | 1,556,205 |
| (Hofstra U.), 5.00%, 7/1/47 | A2 | 1,000,000 | 1,149,200 |
| (Molloy College), 5.00%, 7/1/44 | BBB | 2,300,000 | 2,471,649 |
| (Hofstra U.), 5.00%, 7/1/42 | A2 | 1,200,000 | 1,386,540 |
| (Molloy College), 5.00%, 7/1/38 | BBB | 480,000 | 547,786 |
| (Molloy College), 5.00%, 7/1/37 | BBB | 315,000 | 359,762 |
| (Adelphi U.), Ser. B, 5.00%, 2/1/34 | A– | 3,000,000 | 3,101,400 |
| (Hofstra U.), 5.00%, 7/1/28 | A2 | 650,000 | 715,059 |
| Hudson Yards Infrastructure Corp. Rev. Bonds, Ser. A | | | |
| FHLMC Coll., U.S. Govt. Coll., 5.75%, 2/15/47 | | | |
| (Prerefunded 2/15/21) | Aa3 | 1,865,000 | 2,101,519 |
| 5.75%, 2/15/47 | Aa3 | 1,235,000 | 1,386,275 |
| 5.00%, 2/15/42 | Aa3 | 7,000,000 | 8,129,870 |
| 5.00%, 2/15/38 | Aa3 | 11,000,000 | 12,804,440 |
| Liberty, Dev. Corp. Rev. Bonds (Goldman | | | |
| Sachs Headquarters) | | | |
| 5.50%, 10/1/37 | A3 | 4,010,000 | 5,272,107 |
| 5.25%, 10/1/35 | A3 | 4,000,000 | 5,063,240 |
| Long Island, Pwr. Auth. NY Elec. Syst. Rev. Bonds | | | |
| Ser. C, AGC, 5.25%, 9/1/29 | AA | 3,835,000 | 4,715,286 |
| Ser. B, 5.00%, 9/1/46 | A3 | 2,500,000 | 2,869,425 |
| Ser. B, 5.00%, 9/1/45 | A3 | 2,000,000 | 2,236,320 |
| Ser. A, 5.00%, 9/1/44 | A3 | 8,500,000 | 9,480,815 |
| Ser. B, 5.00%, 9/1/41 | A3 | 5,250,000 | 6,069,368 |
| Ser. A, 5.00%, 9/1/39 | A3 | 8,800,000 | 9,849,488 |
| Ser. B, 5.00%, 9/1/36 | A3 | 1,500,000 | 1,732,860 |
| AGM, zero %, 6/1/28 | AA | 2,510,000 | 1,869,097 |
| Metro. Trans. Auth. Rev. Bonds | | | |
| Ser. C, 5.00%, 11/15/41 (Prerefunded 11/15/22) | AA– | 6,000,000 | 6,711,660 |
| Ser. D, 5.00%, 11/15/38 | AA– | 4,070,000 | 4,629,015 |
| Ser. B, 5.00%, 11/15/37 | AA– | 2,500,000 | 2,891,900 |
| Ser. B, 5.00%, 11/15/33 | AA– | 5,220,000 | 6,109,749 |
| Ser. D-1, 5.00%, 11/15/33 | AA– | 960,000 | 1,114,166 |
| (Green Bonds), Ser. C-1, 4.00%, 11/15/35 ## | AA– | 21,000,000 | 22,478,173 |
| Metro. Trans. Auth. Dedicated Tax Fund Mandatory | | | |
| Put Bonds (6/1/22), Ser. A-2A, 1.42%, 11/1/26 | AA | 5,175,000 | 5,161,028 |
|
| New York Tax Exempt Income Fund 25 |
| | | |
| MUNICIPAL BONDS AND NOTES (97.4%)* cont. | Rating** | Principal amount | Value |
| New York cont. | | | |
| Metro. Trans. Auth. Dedicated Tax Fund Rev. Bonds | | | |
| Ser. A, 5.50%, 11/15/39 (Prerefunded 11/15/18) | AA | $8,200,000 | $8,524,720 |
| Ser. A, 5.50%, 11/15/39 (Prerefunded 11/15/18) | AAA/P | 800,000 | 831,680 |
| Ser. A, 5.25%, 11/15/34 | AA | 5,600,000 | 6,762,840 |
| (Climate Board Certified-Green Bond), Ser. B-1, | | | |
| 5.00%, 11/15/47 | AA | 2,500,000 | 2,915,525 |
| (Green Bond), Ser. B-1, 5.00%, 11/15/36 | AA | 7,000,000 | 8,205,260 |
| Monroe Cnty., Indl. Dev. Corp. Rev. Bonds | | | |
| (Rochester Gen. Hosp.), 5.00%, 12/1/46 | A– | 3,000,000 | 3,357,330 |
| (Rochester Gen. Hosp.), Ser. A, 5.00%, 12/1/37 | A– | 2,000,000 | 2,179,780 |
| (Rochester Gen. Hosp.), 5.00%, 12/1/35 | A– | 600,000 | 682,416 |
| (U. of Rochester), Ser. A, 5.00%, 7/1/33 | Aa3 | 1,000,000 | 1,161,050 |
| (U. of Rochester), Ser. B, 5.00%, 7/1/33 | Aa3 | 2,795,000 | 3,195,551 |
| (Rochester Gen. Hosp.), Ser. A, 5.00%, 12/1/32 | A– | 1,250,000 | 1,374,550 |
| (U. of Rochester), Ser. B, 5.00%, 7/1/32 | Aa3 | 3,040,000 | 3,479,098 |
| (St. John Fisher College), Ser. A, 5.00%, 6/1/29 | A– | 800,000 | 912,472 |
| MTA Hudson Rail Yards Trust Oblig. Rev. Bonds, | | | |
| Ser. A, 5.00%, 11/15/51 | A2 | 9,500,000 | 10,246,225 |
| Nassau Cnty., G.O. Bonds, Ser. A, AGM, 5.00%, 4/1/30 | AA | 8,680,000 | 9,898,325 |
| Nassau Cnty., Local Econ. Assistance | | | |
| Corp. Rev. Bonds | | | |
| (South Nassau Cmntys. Hosp.), 5.00%, 7/1/37 | A3 | 2,050,000 | 2,213,549 |
| (Winthrop U. Hosp. Assn.), 5.00%, 7/1/37 | Baa2 | 1,000,000 | 1,074,690 |
| (Catholic Hlth. Svcs. Of Long Island Oblig. Group), | | | |
| 5.00%, 7/1/33 | A– | 1,355,000 | 1,500,242 |
| (Catholic Hlth. Svcs. Of Long Island Oblig. Group), | | | |
| 5.00%, 7/1/32 | A– | 1,500,000 | 1,668,315 |
| (South Nassau Cmntys. Hosp.), 5.00%, 7/1/27 | A3 | 1,255,000 | 1,392,523 |
| Nassau Cnty., Tobacco Settlement Corp. Rev. | | | |
| Bonds, Ser. A-2, 5.25%, 6/1/26 | B– | 5,640,000 | 5,640,677 |
| New Rochelle, Corp. Local Dev. Rev. Bonds (Iona | | | |
| College), Ser. A, 5.00%, 7/1/40 | Baa2 | 350,000 | 379,327 |
| New York, G.O. Bonds, Ser. 1-I, 5.00%, 3/1/36 | Aa2 | 5,000,000 | 5,668,600 |
| Niagara Area Dev. Corp. Rev. Bonds (Niagara | | | |
| U.), Ser. A | | | |
| 5.00%, 5/1/42 | BBB+ | 1,000,000 | 1,095,830 |
| 5.00%, 5/1/35 | BBB+ | 1,670,000 | 1,842,478 |
| 5.00%, 5/1/30 | BBB+ | 2,230,000 | 2,488,925 |
| Niagara Area Dev. Corp. Solid Waste Disp. Fac. | | | |
| Rev. Bonds (Covanta Holding Corp.), Ser. A, | | | |
| 5.25%, 11/1/42 | Ba3 | 2,450,000 | 2,451,617 |
| Niagara Falls, Rev. Bonds, Ser. A, BAM, | | | |
| 4.00%, 10/1/44 | AA | 500,000 | 517,500 |
| Niagara Frontier Trans. Auth. Rev. Bonds (Buffalo | | | |
| Niagara Intl. Arpt.) | | | |
| Ser. A, 5.00%, 4/1/28 | Baa1 | 2,560,000 | 2,874,829 |
| Ser. A, 5.00%, 4/1/27 | Baa1 | 875,000 | 989,091 |
| Ser. A, 5.00%, 4/1/24 | Baa1 | 2,000,000 | 2,297,080 |
| NY City, G.O. Bonds | | | |
| Ser. F-1, 5.00%, 3/1/37 | Aa2 | 2,000,000 | 2,254,620 |
| Ser. B-1, 5.00%, 10/1/37 | Aa2 | 3,000,000 | 3,526,710 |
| Ser. B-1, 5.00%, 12/1/35 | Aa2 | 2,000,000 | 2,342,420 |
| |
| 26 New York Tax Exempt Income Fund |
| | | |
| MUNICIPAL BONDS AND NOTES (97.4%)* cont. | Rating** | Principal amount | Value |
| New York cont. | | | |
| NY City, G.O. Bonds | | | |
| Ser. E, 5.00%, 8/1/34 | Aa2 | $6,360,000 | $7,439,610 |
| Ser. A-1, 5.00%, 8/1/32 | Aa2 | 5,000,000 | 5,524,600 |
| NY City, Cultural Resource Rev. Bonds | | | |
| (Museum of Modern Art), Ser. 1A, 5.00%, 4/1/31 | | | |
| (Prerefunded 10/1/18) | Aa2 | 3,500,000 | 3,607,905 |
| NY City, Hsg. Dev. Corp. Rev. Bonds | | | |
| (Multi-Fam. Hsg.) | | | |
| Ser. A-1-A, 5.45%, 11/1/46 | AA+ | 2,670,000 | 2,692,588 |
| Ser. H-2-A, 5.35%, 5/1/41 | AA+ | 1,200,000 | 1,213,464 |
| Ser. H-2-A, 5.20%, 11/1/35 | AA+ | 1,675,000 | 1,686,089 |
| Ser. H-2-A, 4.40%, 5/1/31 | AA+ | 4,000,000 | 4,202,680 |
| NY City, Indl. Dev. Agcy. Rev. Bonds | | | |
| (Yankee Stadium — Pilot), AGC, 7.00%, 3/1/49 | AA | 1,000,000 | 1,064,420 |
| (Queens Baseball Stadium — Pilot), AMBAC, | | | |
| 5.00%, 1/1/24 | BBB | 3,500,000 | 3,541,195 |
| NY City, Indl. Dev. Agcy. Arpt. Facs. Rev. Bonds (Sr. | | | |
| Trips), Ser. A, 5.00%, 7/1/28 | BBB | 1,500,000 | 1,616,670 |
| NY City, Muni. Wtr. & Swr. Syst. Fin. Auth. Rev. Bonds | | | |
| Ser. EE, 5.25%, 6/15/40 | Aa1 | 10,000,000 | 10,537,200 |
| Ser. EE, 5.00%, 6/15/47 | Aa1 | 5,365,000 | 6,030,153 |
| (2nd Gen. Resolution), Ser. BB, 5.00%, 6/15/47 | Aa1 | 5,000,000 | 5,569,900 |
| (2nd Gen. Resolution), Ser. BB, 5.00%, 6/15/46 | Aa1 | 2,500,000 | 2,812,700 |
| (2nd Gen. Resolution), 5.00%, 6/15/46 | Aa1 | 12,460,000 | 14,155,432 |
| (2nd Gen. Resolution), Ser. HH, 5.00%, 6/15/39 | Aa1 | 9,000,000 | 10,435,230 |
| Ser. AA, 5.00%, 6/15/34 | Aa1 | 5,000,000 | 5,508,850 |
| NY City, Transitional Fin. Auth. Rev. Bonds | | | |
| Ser. E-1, 5.00%, 2/1/41 | AAA | 5,200,000 | 5,922,748 |
| Ser. F-1, 5.00%, 5/1/39 | AAA | 7,500,000 | 8,377,500 |
| Ser. E-1, 5.00%, 2/1/39 | AAA | 9,000,000 | 10,399,320 |
| Ser. A-1, 5.00%, 11/1/38 | AAA | 2,500,000 | 2,853,050 |
| Ser. B-1, 5.00%, 8/1/38 | AAA | 5,000,000 | 5,832,000 |
| Ser. A-1, 5.00%, 5/1/32 | AAA | 4,780,000 | 5,661,145 |
| Ser. E-1, 5.00%, 2/1/31 | AAA | 2,600,000 | 3,070,626 |
| Ser. B-1, 5.00%, 11/1/30 | AAA | 3,000,000 | 3,483,900 |
| NY City, Transitional Fin. Auth. Bldg. Aid Rev. Bonds | | | |
| Ser. S-1, 5.00%, 7/15/43 | Aa2 | 6,500,000 | 7,485,465 |
| Ser. S-1, 5.00%, 7/15/40 | Aa2 | 4,550,000 | 5,242,192 |
| Ser. S-1, 5.00%, 7/15/37 | Aa2 | 7,500,000 | 8,419,875 |
| Ser. S-5, 5.00%, 1/15/30 | Aa2 | 3,375,000 | 3,498,086 |
| Ser. S-1, 5.00%, 1/15/29 | Aa2 | 5,000,000 | 5,021,850 |
| Ser. S-1, 5.00%, 1/15/25 | Aa2 | 3,000,000 | 3,013,230 |
| NY City, Transitional Fin. Auth. VRDN (NYC Recovery), | | | |
| Ser. 3, 0.94%, 11/1/22 | VMIG1 | 8,060,000 | 8,060,000 |
| NY City, Trust for Cultural Resources Rev. Bonds | | | |
| (Wildlife Conservation Society), Ser. A, | | | |
| 5.00%, 8/1/42 | Aa3 | 1,915,000 | 2,144,609 |
| (Wildlife Conservation Society), Ser. A, | | | |
| 5.00%, 8/1/38 | Aa3 | 1,250,000 | 1,404,763 |
| (Whitney Museum of American Art), 5.00%, 7/1/31 | A | 2,000,000 | 2,181,800 |
|
| New York Tax Exempt Income Fund 27 |
| | | |
| MUNICIPAL BONDS AND NOTES (97.4%)* cont. | Rating** | Principal amount | Value |
| New York cont. | | | |
| NY Counties, Tobacco Trust II Rev. Bonds (Tobacco | | | |
| Settlement), 5.75%, 6/1/43 | BBB | $840,000 | $852,020 |
| NY Counties, Tobacco Trust III Rev. Bonds (Tobacco | | | |
| Settlement), 6.00%, 6/1/43 | A3 | 100,000 | 100,149 |
| NY Counties, Tobacco Trust IV Rev. Bonds (Tobacco | | | |
| Settlement), Ser. A, 5.00%, 6/1/38 | B– | 7,250,000 | 7,041,853 |
| NY Counties, Tobacco Trust VI Rev. Bonds | | | |
| (Tobacco Settlement) | | | |
| Ser A-2B, 5.00%, 6/1/51 | BBB | 3,300,000 | 3,394,710 |
| Ser B, 5.00%, 6/1/41 | BBB+ | 250,000 | 267,850 |
| Ser B, 5.00%, 6/1/36 | A– | 265,000 | 288,095 |
| NY Liberty Dev. Corp. Rev. Bonds (Bank of America | | | |
| Tower), Ser. CL1, 5.625%, 1/15/46 | AA+ | 2,000,000 | 2,153,180 |
| NY State Convention Ctr. Dev. Corp. Rev. Bonds | | | |
| (Hotel Unit Fee) | | | |
| 5.00%, 11/15/45 | Aa3 | 3,000,000 | 3,394,230 |
| zero %, 11/15/50 | Aa3 | 7,000,000 | 1,960,770 |
| NY State Dorm Auth. Personal Income Tax Rev. | | | |
| Bonds (Bidding Group 3 Bonds), Ser. B | | | |
| 5.00%, 2/15/42 | AAA | 3,500,000 | 4,104,345 |
| 5.00%, 2/15/40 | AAA | 5,000,000 | 5,872,600 |
| NY State Dorm. Auth. Rev. Bonds | | | |
| (City U.), Ser. A, 5.75%, 7/1/18 | Aa2 | 2,230,000 | 2,289,385 |
| (NYU), Ser. 1, AMBAC, 5.50%, 7/1/40 | Aa2 | 6,000,000 | 8,164,860 |
| (NYU), Ser. 1, AMBAC, 5.50%, 7/1/31 | Aa2 | 3,500,000 | 4,506,810 |
| Ser. A, 5.00%, 3/15/44 | AAA | 5,500,000 | 6,266,975 |
| Ser. 15B-B, 5.00%, 3/15/35 | AAA | 5,000,000 | 5,828,700 |
| Ser. A, 5.00%, 3/15/32 | AAA | 2,905,000 | 3,479,319 |
| NY State Dorm. Auth. Non-State Supported | | | |
| Debt Rev. Bonds | | | |
| (Orange Regl. Med. Ctr.), FHL Banks Coll., U.S. | | | |
| Govt. Coll., 6.25%, 12/1/37 (Prerefunded 12/1/18) | Baa3 | 7,500,000 | 7,862,325 |
| (NYU Hosp. Ctr.), Ser. A, 6.00%, 7/1/40 | | | |
| (Prerefunded 7/1/20) | A3 | 1,500,000 | 1,664,220 |
| (Brooklyn Law School), 5.75%, 7/1/33 | Baa1 | 1,000,000 | 1,059,930 |
| (Skidmore College), Ser. A, 5.50%, 7/1/41 | A1 | 3,000,000 | 3,347,280 |
| (North Shore Long Island Jewish Oblig. | | | |
| Group), Ser. A, U.S. Govt. Coll., 5.50%, 5/1/37 | | | |
| (Prerefunded 5/1/19) | A3 | 11,500,000 | 12,133,535 |
| (Fordham U.), Ser. A, 5.50%, 7/1/36 | A2 | 1,800,000 | 2,017,620 |
| (Culinary Inst. of America), 5.50%, 7/1/33 | Baa2 | 735,000 | 857,811 |
| (North Shore Long Island Jewish Oblig. Group), | | | |
| Ser. E, 5.50%, 5/1/33 | A3 | 2,000,000 | 2,096,720 |
| (St. Joseph’s College), 5.25%, 7/1/35 | Ba1 | 2,000,000 | 2,074,980 |
| (Manhattan Marymount), 5.25%, 7/1/29 | Baa2 | 2,000,000 | 2,091,020 |
| (Highland Hosp. Rochester), 5.20%, 7/1/32 | A2 | 1,000,000 | 1,068,510 |
| (Mount Sinai School of Medicine), FNMA Coll., FHL | | | |
| Banks Coll., 5.125%, 7/1/39 (Prerefunded 7/1/19) | A3 | 5,000,000 | 5,277,800 |
| (School Dist. Fin. Program), Ser. C, AGC, | | | |
| 5.125%, 10/1/36 | AA | 40,000 | 42,391 |
| |
| 28 New York Tax Exempt Income Fund |
| | | |
| MUNICIPAL BONDS AND NOTES (97.4%)* cont. | Rating** | Principal amount | Value |
| New York cont. | | | |
| NY State Dorm. Auth. Non-State Supported | | | |
| Debt Rev. Bonds | | | |
| (North Shore Long Island Jewish Oblig. Group), | | | |
| Ser. A, 5.00%, 5/1/43 | A3 | $2,500,000 | $2,814,425 |
| (Teachers College), 5.00%, 7/1/42 | A1 | 3,000,000 | 3,303,180 |
| (St. Francis College), 5.00%, 10/1/40 | A– | 3,000,000 | 3,238,200 |
| (Pratt Institute), 5.00%, 7/1/39 | A3 | 2,750,000 | 3,129,638 |
| (Pratt Institute), Ser. A, 5.00%, 7/1/39 | A3 | 1,000,000 | 1,103,450 |
| (Rochester Inst. of Tech.), 5.00%, 7/1/38 | A1 | 2,000,000 | 2,208,480 |
| (St. John’s U.), Ser. A, 5.00%, 7/1/37 | A3 | 1,400,000 | 1,585,402 |
| (North Shore Long Island Jewish Oblig. Group), | | | |
| Ser. A, 5.00%, 5/1/37 | A3 | 3,000,000 | 3,407,130 |
| (Memorial Sloan-Kettering Cancer Ctr.), | | | |
| 5.00%, 7/1/36 | Aa3 | 1,125,000 | 1,248,908 |
| (Memorial Sloan-Kettering Cancer Ctr.), Ser. A1, | | | |
| 5.00%, 7/1/36 | Aa3 | 5,690,000 | 5,805,507 |
| (Culinary Inst. of America), 5.00%, 7/1/34 | Baa2 | 350,000 | 383,313 |
| (NYU), Ser. A, 5.00%, 7/1/34 | Aa2 | 10,000,000 | 11,882,600 |
| (Pratt Institute), Ser. A, 5.00%, 7/1/34 | A3 | 1,000,000 | 1,113,470 |
| (Teachers College), 5.00%, 7/1/34 | A1 | 2,750,000 | 3,051,703 |
| (NYU Hosp. Ctr.), 5.00%, 7/1/33 | A3 | 360,000 | 414,958 |
| (North Shore Long Island Jewish Oblig. Group), | | | |
| Ser. A, 5.00%, 5/1/33 | A3 | 5,000,000 | 5,732,400 |
| (St. Francis College), 5.00%, 10/1/32 | A– | 2,360,000 | 2,559,562 |
| (School Dist. Fin. Program), Ser. C, AGC, | | | |
| 5.00%, 10/1/31 | AA | 20,000 | 21,088 |
| (New School (The)), 5.00%, 7/1/31 | A3 | 5,000,000 | 5,466,100 |
| (NYU Hosp. Ctr.), 5.00%, 7/1/31 | A3 | 1,320,000 | 1,527,583 |
| (NYU Hosp. Ctr.), 5.00%, 7/1/30 | A3 | 1,000,000 | 1,171,150 |
| (NYU Hosp. Ctr.), 5.00%, 7/1/30 | A3 | 1,000,000 | 1,160,550 |
| (Brooklyn Law School), Ser. A, 5.00%, 7/1/29 | Baa1 | 1,000,000 | 1,107,880 |
| (NYU), Ser. A, 5.00%, 7/1/29 | Aa2 | 1,500,000 | 1,796,745 |
| (NYU), Ser. B, FHLMC Coll., FNMA Coll., FHL Banks | | | |
| Coll., 5.00%, 7/1/29 (Prerefunded 7/1/18) | Aa2 | 5,000,000 | 5,108,200 |
| (Brooklyn Law School), Ser. A, 5.00%, 7/1/27 | Baa1 | 1,000,000 | 1,110,170 |
| (Brooklyn Law School), Ser. A, 5.00%, 7/1/26 | Baa1 | 1,000,000 | 1,111,080 |
| (Teachers College), Ser. A, 5.00%, 7/1/26 | A1 | 1,000,000 | 1,120,290 |
| NY State Dorm. Auth. Non-State Supported Debt | | | |
| 144A Rev. Bonds (Orange Regl. Med. Ctr.) | | | |
| 5.00%, 12/1/37 | Baa3 | 4,300,000 | 4,704,372 |
| 5.00%, 12/1/36 | Baa3 | 700,000 | 767,578 |
| NY State Dorm. Auth. Non-State Supported Debt | | | |
| Rev. Bonds FRN (NYU), Ser. A, 5.00%, 7/1/35 | Aa2 | 2,000,000 | 2,307,260 |
| NY State Dorm. Auth. Personal Income | | | |
| Tax Rev. Bonds | | | |
| (Gen. Purpose), Ser. C, 5.00%, 3/15/41 | AAA | 10,000,000 | 10,911,100 |
| (Group C), Ser. B, 5.00%, 2/15/41 | AAA | 5,000,000 | 5,708,800 |
| (Group B), Ser. B, 5.00%, 2/15/34 | AAA | 1,000,000 | 1,157,280 |
| (Gen. Purpose), Ser. D, 5.00%, 2/15/33 | AAA | 5,000,000 | 5,898,650 |
|
| New York Tax Exempt Income Fund 29 |
| | | |
| MUNICIPAL BONDS AND NOTES (97.4%)* cont. | Rating** | Principal amount | Value |
| New York cont. | | | |
| NY State Dorm. Auth. State Supported | | | |
| Debt Rev. Bonds | | | |
| (State U. of NY), Ser. A, 5.00%, 7/1/42 | Aa2 | $2,000,000 | $2,211,200 |
| (State U. of NY), Ser. A, 5.00%, 7/1/41 | Aa2 | 5,250,000 | 5,739,405 |
| (City U. of NY), Ser. B, 5.00%, 7/1/26 | AA | 5,000,000 | 5,107,650 |
| NY State Energy Research & Dev. Auth. Gas Fac. FRN | | | |
| (Brooklyn Union Gas), Ser. A-1, NATL, 1.68%, 12/1/20 | A2 | 5,000,000 | 4,939,950 |
| NY State Env. Fac. Corp. Rev. Bonds | | | |
| (Clean Wtr. and Drinking), Ser. A, 5.00%, 6/15/34 | Aaa | 10,000,000 | 10,501,100 |
| (State Clean Wtr. & Drinking Revolving Fund), | | | |
| Ser. A, 5.00%, 6/15/29 | Aaa | 2,500,000 | 2,550,475 |
| (United Wtr. New Rochelle), Ser. A, 4.875%, 9/1/40 | A– | 5,000,000 | 5,313,950 |
| NY State Env. Fac. Corp. Solid Waste Disp. 144A | | | |
| Mandatory Put Bonds (12/2/19) (Casella Waste | | | |
| Syst., Inc.), 3.75%, 12/1/44 | Caa1 | 2,000,000 | 1,997,400 |
| NY State Hsg. Fin. Agcy. Rev. Bonds (Affordable Hsg.) | | | |
| Ser. A, 5.00%, 11/1/42 | Aa2 | 4,660,000 | 4,815,271 |
| Ser. B, 4.85%, 11/1/41 | Aa2 | 2,600,000 | 2,656,134 |
| NY State Liberty Dev. Corp. Rev. Bonds | | | |
| (7 World Trade Ctr.), Class 3, 5.00%, 3/15/44 | A2 | 1,000,000 | 1,077,240 |
| (7 World Trade Ctr.), Class 2, 5.00%, 9/15/43 | A1 | 4,000,000 | 4,371,080 |
| (1 WTC Port Auth. Construction), 5.00%, 12/15/41 | Aa3 | 7,500,000 | 8,296,500 |
| (7 World Trade Ctr.), Class 1, 5.00%, 9/15/40 | Aaa | 4,815,000 | 5,356,495 |
| (4 World Trade Ctr.), 5.00%, 11/15/31 | A+ | 2,500,000 | 2,777,250 |
| NY State Liberty Dev. Corp. 144A Rev. Bonds (World | | | |
| Trade Ctr.), Class 1-3, 5.00%, 11/15/44 | BB–/P | 3,000,000 | 3,227,430 |
| NY State Mtge. Agcy. Rev. Bonds | | | |
| Ser. 189, 3.85%, 10/1/34 | Aa1 | 1,935,000 | 1,971,959 |
| Ser. 186, 2.00%, 4/1/19 | Aa1 | 2,090,000 | 2,092,675 |
| NY State Pwr. Auth. Rev. Bonds, Ser. A, | | | |
| 5.00%, 11/15/38 | Aa1 | 2,000,000 | 2,209,780 |
| NY State Thruway Auth. Rev. Bonds | | | |
| Ser. A, 5.00%, 1/1/46 | A3 | 2,000,000 | 2,278,760 |
| (Second Generation Hwy. & Bridge Trust Fund), | | | |
| Ser. B, FHLMC Coll., FCS, U.S. Govt. Coll., 5.00%, | | | |
| 4/1/28 (Prerefunded 10/1/18) | AA | 3,000,000 | 3,091,230 |
| Ser. H, NATL, 5.00%, 1/1/28 | A2 | 1,235,000 | 1,238,223 |
| (Second Generation Hwy. & Bridge Trust Fund), | | | |
| Ser. B, FHLMC Coll., FCS, U.S. Govt. Coll., 5.00%, | | | |
| 4/1/27 (Prerefunded 10/1/18) | AA | 4,000,000 | 4,121,640 |
| 5.00%, 1/1/24 | A2 | 1,250,000 | 1,461,938 |
| NY State Trans. Special Fac. Dev. Corp. Rev. Bonds | | | |
| (Laguardia Arpt. Term. B Redev. Program), Ser. A, | | | |
| 5.25%, 1/1/50 | Baa3 | 1,000,000 | 1,109,710 |
| (Laguardia Arpt. Term. B Redev. Program), Ser. A, | | | |
| 5.00%, 7/1/46 | Baa3 | 2,500,000 | 2,736,925 |
| (Laguardia Arpt. Term. B Redev. Program), Ser. A, | | | |
| 5.00%, 7/1/41 | Baa3 | 1,000,000 | 1,099,720 |
| (American Airlines, Inc.-John F. Kennedy Intl. | | | |
| Arpt.), 5.00%, 8/1/31 | BB– | 1,500,000 | 1,597,260 |
| (Terminal One Group Assn.), 5.00%, 1/1/23 | Baa1 | 1,500,000 | 1,680,705 |
| |
| 30 New York Tax Exempt Income Fund |
| | | |
| MUNICIPAL BONDS AND NOTES (97.4%)* cont. | Rating** | Principal amount | Value |
| New York cont. | | | |
| NY State Urban Dev. Corp. Rev. Bonds | | | |
| (Clarkson Ctr.), 5.50%, 1/1/20 | Aa2 | $1,065,000 | $1,110,167 |
| Ser. B-1, U.S. Govt. Coll., 5.00%, 3/15/36 | | | |
| (Prerefunded 3/15/19) | AAA | 9,000,000 | 9,388,440 |
| Ser. A-1, U.S. Govt. Coll., 5.00%, 12/15/28 | | | |
| (Prerefunded 12/15/18) | AAA | 5,000,000 | 5,187,200 |
| Ser. B, 5.00%, 1/1/27 | AA | 7,000,000 | 7,144,130 |
| NY State Urban Dev. Corp. Personal Income Tax Rev. | | | |
| Bonds (Group C), Ser. A , 5.00%, 3/15/38 | AAA | 6,515,000 | 7,530,298 |
| Oneida Cnty., Indl. Dev. Agcy. Rev. Bonds (St. | | | |
| Elizabeth Med.), Ser. A, 5.875%, 12/1/29 | BB–/P | 1,000,000 | 1,002,640 |
| Onondaga Cnty., Trust For Cultural Resources Rev. | | | |
| Bonds (Syracuse U.) | | | |
| 5.00%, 12/1/36 | Aa3 | 2,000,000 | 2,215,300 |
| 5.00%, 12/1/31 | Aa3 | 2,000,000 | 2,317,620 |
| Onondaga Cnty., Resource Recvy. Agcy. Rev. Bonds, | | | |
| Ser. A, AGM, 5.00%, 5/1/29 | AA | 3,120,000 | 3,485,539 |
| Onondaga, Civic Dev. Corp. Rev. Bonds | | | |
| (Le Moyne College), 5.375%, 7/1/40 | Baa2 | 3,900,000 | 4,143,750 |
| (Jewish Home of Central NY Oblig. Group), | | | |
| 5.25%, 3/1/31 | B/P | 2,035,000 | 1,913,653 |
| (Le Moyne College), 5.00%, 7/1/32 | Baa2 | 1,635,000 | 1,754,960 |
| Port Auth. of NY & NJ Rev. Bonds | | | |
| (Kennedy Intl. Arpt. — 5th Installment), | | | |
| 6.75%, 10/1/19 | BBB–/P | 1,000,000 | 1,039,740 |
| 5.375%, 3/1/28 | Aa3 | 1,000,000 | 1,210,950 |
| Ser. 186, 5.00%, 10/15/44 | Aa3 | 8,000,000 | 9,001,440 |
| Ser. 206th, 5.00%, 11/15/42 | Aa3 | 5,000,000 | 5,784,550 |
| Ser. 194th, 5.00%, 10/15/41 | Aa3 | 5,450,000 | 6,353,610 |
| Ser. 197, 5.00%, 11/15/34 | Aa3 | 2,500,000 | 2,900,400 |
| Ser. 185th, 5.00%, 9/1/30 | Aa3 | 2,000,000 | 2,308,360 |
| Port Auth. of NY & NJ Special Oblig. Rev. Bonds (JFK | | | |
| Intl. Air Term.), 6.00%, 12/1/42 | Baa1 | 3,500,000 | 3,887,345 |
| Rockland Cnty., G.O. Bonds, Ser. A, AGM, | | | |
| 5.00%, 3/1/24 | AA | 1,600,000 | 1,844,768 |
| Saratoga Cnty., Indl. Dev. Agcy. Civic Fac. Rev. Bonds | | | |
| (Saratoga Hosp.), Ser. B | | | |
| 5.25%, 12/1/32 (Prerefunded 12/1/17) | A– | 1,500,000 | 1,500,000 |
| 5.125%, 12/1/27 (Prerefunded 12/1/17) | A– | 1,000,000 | 1,000,000 |
| Schenectady Cnty., Cap. Resource Corp. Rev. Bonds | | | |
| (Union College), 5.00%, 7/1/32 | A1 | 3,430,000 | 3,828,326 |
| Southold, Local Dev. Corp. Rev. Bonds (Peconic | | | |
| Landing at Southold, Inc.), 5.00%, 12/1/45 | BBB–/F | 2,250,000 | 2,345,603 |
| St. Lawrence Cnty., Indl. Dev. Agcy. Civic Dev. Corp. | | | |
| Rev. Bonds (Clarkson U.), Ser. A | | | |
| 5.25%, 9/1/33 | A3 | 1,050,000 | 1,162,361 |
| 5.00%, 9/1/41 | A3 | 1,750,000 | 1,898,523 |
| Suffolk Cnty., G.O. Bonds, Ser. B, AGM, | | | |
| 5.00%, 10/15/26 | AA | 4,000,000 | 4,865,040 |
| Suffolk Cnty., Econ. Dev. Corp. Rev. Bonds (Peconic | | | |
| Landing Southold), 6.00%, 12/1/40 | BBB–/F | 1,225,000 | 1,334,540 |
|
| New York Tax Exempt Income Fund 31 |
| | | |
| MUNICIPAL BONDS AND NOTES (97.4%)* cont. | Rating** | Principal amount | Value |
| New York cont. | | | |
| Suffolk Cnty., Indl. Dev. Agcy. Rev. Bonds | | | |
| (Nissequogue Cogen. Partners Fac.), 5.50%, 1/1/23 | BBB–/P | $1,385,000 | $1,385,526 |
| Syracuse, Indl. Dev. Agcy. Rev. Bonds (Carousel | | | |
| Ctr.), Ser. A | | | |
| 5.00%, 1/1/36 | Baa1 | 2,750,000 | 3,085,170 |
| 5.00%, 1/1/35 | Baa1 | 1,525,000 | 1,714,329 |
| Syracuse, Indl. Dev. Agcy. Civic Fac. VRDN | | | |
| (Syracuse U.) | | | |
| Ser. A-2, 0.92%, 12/1/37 | VMIG1 | 7,535,000 | 7,535,000 |
| Ser. A-1, 0.92%, 7/1/37 | VMIG1 | 5,780,000 | 5,780,000 |
| Tompkins Cnty., Dev. Corp. Rev. Bonds | | | |
| (Ithaca College), AGM, 5.375%, 7/1/41 | | | |
| (Prerefunded 1/1/21) | A2 | 1,000,000 | 1,111,230 |
| (Kendal at Ithaca, Inc.), 5.00%, 7/1/44 | BBB | 2,800,000 | 2,970,352 |
| (Ithaca College), 5.00%, 7/1/41 ## | A2 | 715,000 | 834,055 |
| (Ithaca College), 5.00%, 7/1/37 ## | A2 | 250,000 | 291,863 |
| (Ithaca College), 5.00%, 7/1/35 ## | A2 | 150,000 | 175,967 |
| (Ithaca College), 5.00%, 7/1/34 ## | A2 | 150,000 | 176,679 |
| Triborough, Bridge & Tunnel Auth. Rev. Bonds | | | |
| Ser. A, 5.00%, 11/15/44 | Aa3 | 2,340,000 | 2,634,349 |
| Ser. A, 5.00%, 11/15/41 | Aa3 | 3,750,000 | 4,345,350 |
| Ser. A, 5.00%, 11/15/39 | Aa3 | 3,500,000 | 3,997,840 |
| Ser. B, 5.00%, 11/15/38 | Aa3 | 1,000,000 | 1,175,140 |
| Ser. C, 5.00%, 11/15/29 | Aa3 | 955,000 | 987,594 |
| Ser. C, 5.00%, 11/15/29 (Prerefunded 11/15/18) | AAA/P | 1,545,000 | 1,599,678 |
| Ser. B, zero %, 11/15/32 | Aa3 | 3,900,000 | 2,448,030 |
| Ser. A, zero %, 11/15/30 | A1 | 7,000,000 | 4,730,390 |
| TSASC, Inc. Rev. Bonds, Ser. A, 5.00%, 6/1/41 | BBB+ | 8,285,000 | 9,252,937 |
| Westchester Cnty., Hlth. Care Corp. Rev. | | | |
| Bonds, Ser. C-2 | | | |
| 6.125%, 11/1/37 | Baa2 | 380,000 | 419,300 |
| U.S. Govt. Coll., 6.125%, 11/1/37 | | | |
| (Prerefunded 11/1/20) | AAA/P | 3,005,000 | 3,385,283 |
| Westchester Cnty., Indl Dev. Agcy. Civic Fac. Rev. | | | |
| Bonds (Pace U.), Ser. A, 5.50%, 5/1/42 | BBB– | 2,750,000 | 3,098,480 |
| Westchester Cnty., Local Dev. Corp. Rev. Bonds | | | |
| (Westchester Med. Ctr.), 5.00%, 11/1/46 | Baa2 | 3,500,000 | 3,808,630 |
| Westchester Tobacco Asset Securitization Corp. | | | |
| Rev. Bonds, Ser. B, 5.00%, 6/1/41 | BBB+ | 1,250,000 | 1,353,050 |
| Western Nassau Cnty., Wtr. Auth. Rev. Bonds, Ser. A, | | | |
| 5.00%, 4/1/40 | A1 | 2,150,000 | 2,421,760 |
| Yonkers, G.O. Bonds | | | |
| Ser. A, AGM, 5.00%, 11/15/31 | AA | 2,200,000 | 2,574,990 |
| Ser. E, AGM, 5.00%, 9/1/23 | AA | 3,135,000 | 3,635,283 |
| Yonkers, Indl. Dev. Agcy. Civic Fac. Rev. Bonds (St. | | | |
| John’s Riverside Hosp.), Ser. A, 7.125%, 7/1/31 | BB– | 1,920,000 | 1,921,229 |
| | | | 971,916,552 |
| |
| 32 New York Tax Exempt Income Fund |
| | | |
| MUNICIPAL BONDS AND NOTES (97.4%)* cont. | Rating** | Principal amount | Value |
| Puerto Rico (0.7%) | | | |
| Children’s Trust Fund Tobacco Settlement (The) | | | |
| Rev. Bonds, 5.50%, 5/15/39 | Ba1 | $2,250,000 | $2,189,205 |
| Cmnwlth. of PR, Hwy. & Trans. Auth. Rev. | | | |
| Bonds, Ser. AA | | | |
| NATL, 5.50%, 7/1/20 | A | 365,000 | 378,892 |
| NATL, U.S. Govt. Coll., 5.50%, 7/1/20 (Escrowed | | | |
| to maturity) | A3 | 635,000 | 695,700 |
| NATL, 5.50%, 7/1/19 | A | 540,000 | 555,309 |
| Cmnwlth. of PR, Sales Tax Fin. Corp. Rev. | | | |
| Bonds, Ser. A | | | |
| AMBAC, zero %, 8/1/47 | Ca | 15,000,000 | 2,676,150 |
| NATL, zero %, 8/1/43 | A | 5,000,000 | 1,011,750 |
| | | | 7,507,006 |
| Texas (0.2%) | | | |
| Mission, Econ. Dev. Corp. Solid Waste Disp. | | | |
| Mandatory Put Bonds (1/2/18) (Republic Svcs., Inc.), | | | |
| Ser. A, 1.10%, 1/1/20 | A–2 | 2,100,000 | 2,099,748 |
| | | | 2,099,748 |
| Utah (0.6%) | | | |
| Murray City, Hosp. VRDN (IHC Hlth. Svcs., Inc.), Ser. A, | | | |
| 0.92%, 5/15/37 | VMIG1 | 6,300,000 | 6,300,000 |
| | | | 6,300,000 |
| Wisconsin (0.5%) | | | |
| Pub. Fin. Auth. Solid Waste Disp. Mandatory | | | |
| Put Bonds (2/1/18) (Waste Mgt., Inc.), Ser. A-2, | | | |
| 1.25%, 10/1/25 | A–2 | 5,500,000 | 5,497,305 |
| | | | 5,497,305 |
| Total municipal bonds and notes (cost $977,000,305) | | $1,013,193,343 |
| |
| UNITIZED TRUST (0.1%)* | | Shares | Value |
| CMS Liquidating Trust 144A † F | | 600 | $1,357,806 |
| Total Unitized trust (cost $1,816,443) | | | $1,357,806 |
| |
| TOTAL INVESTMENTS | | | |
| Total investments (cost $978,816,748) | | | $1,014,551,149 |
Notes to the fund’s portfolio
Unless noted otherwise, the notes to the fund’s portfolio are for the close of the fund’s reporting period, which ran from December 1, 2016 through November 30, 2017 (the reporting period). Within the following notes to the portfolio, references to “ASC 820” represent Accounting Standards Codification 820 Fair Value Measurements and Disclosures and references to “Putnam Management” represent Putnam Investment Management, LLC, the fund’s manager, an indirect wholly-owned subsidiary of Putnam Investments, LLC.
* Percentages indicated are based on net assets of $1,040,114,920.
|
| New York Tax Exempt Income Fund 33 |
** The Moody’s, Standard & Poor’s or Fitch ratings indicated are believed to be the most recent ratings available at the close of the reporting period for the securities listed. Ratings are generally ascribed to securities at the time of issuance. While the agencies may from time to time revise such ratings, they undertake no obligation to do so, and the ratings do not necessarily represent what the agencies would ascribe to these securities at the close of the reporting period. Securities rated by Fitch are indicated by “/F.” Securities rated by Putnam are indicated by “/P.” The Putnam rating categories are comparable to the Standard & Poor’s classifications. If a security is insured, it will usually be rated by the ratings organizations based on the financial strength of the insurer. Ratings are not covered by the Report of Independent Registered Public Accounting Firm. For further details regarding security ratings, please see the Statement of Additional Information.
† This security is non-income-producing.
†† The interest rate and date shown parenthetically represent the new interest rate to be paid and the date the fund will begin accruing interest at this rate.
## Forward commitment, in part or in entirety (Note 1).
F This security is valued by Putnam Management at fair value following procedures approved by the Trustees. Securities are classified as Level 3 for ASC 820 based on the securities’ valuation inputs (Note 1).
144A after the name of an issuer represents securities exempt from registration under Rule 144A of the Securities Act of 1933, as amended. These securities may be resold in transactions exempt from registration, normally to qualified institutional buyers.
On Mandatory Put Bonds, the rates shown are the current interest rates at the close of the reporting period and the dates shown represent the next mandatory put dates.
The dates shown parenthetically on prerefunded bonds represent the next prerefunding dates.
The dates shown on debt obligations are the original maturity dates.
The fund had the following sector concentrations greater than 10% at the close of the reporting period (as a percentage of net assets):
| | | |
| Tax bonds | 15.2% | | |
| Education | 14.5 | | |
| Transportation | 12.7 | | |
| Utilities | 12.7 | | |
| Prerefunded | 10.5 | | |
ASC 820 establishes a three-level hierarchy for disclosure of fair value measurements. The valuation hierarchy is based upon the transparency of inputs to the valuation of the fund’s investments. The three levels are defined as follows:
Level 1: Valuations based on quoted prices for identical securities in active markets.
Level 2: Valuations based on quoted prices in markets that are not active or for which all significant inputs are observable, either directly or indirectly.
Level 3: Valuations based on inputs that are unobservable and significant to the fair value measurement.
The following is a summary of the inputs used to value the fund’s net assets as of the close of the reporting period:
| | | |
| | | Valuation inputs |
| Investments in securities: | Level 1 | Level 2 | Level 3 |
| Municipal bonds and notes | $— | $1,013,193,343 | $— |
| Unitized trust | — | — | 1,357,806 |
| Totals by level | $— | $1,013,193,343 | $1,357,806 |
During the reporting period, transfers within the fair value hierarchy, if any, did not represent, in the aggregate, more than 1% of the fund’s net assets measured as of the end of the period. Transfers are accounted for using the end of period pricing valuation method.
At the start and close of the reporting period, Level 3 investments in securities represented less than 1% of the fund’s net assets and were not considered a significant portion of the fund’s portfolio.
The accompanying notes are an integral part of these financial statements.
| |
| 34 New York Tax Exempt Income Fund |
Statement of assets and liabilities 11/30/17
| |
| ASSETS | |
| Investment in securities, at value (Note 1): | |
| Unaffiliated issuers (identified cost $978,816,748) | $1,014,551,149 |
| Cash | 45,047,777 |
| Interest and other receivables | 12,349,036 |
| Receivable for shares of the fund sold | 351,811 |
| Receivable for investments sold | 161,369 |
| Receivable for sales of delayed delivery securities (Note 1) | 724,073 |
| Receivable for custodian fees (Note 2) | 5,410 |
| Prepaid assets | 9,296 |
| Total assets | 1,073,199,921 |
| |
| LIABILITIES | |
| Payable for investments purchased | 5,500,000 |
| Payable for purchases of delayed delivery securities (Note 1) | 24,664,856 |
| Payable for shares of the fund repurchased | 1,054,698 |
| Payable for compensation of Manager (Note 2) | 372,779 |
| Payable for investor servicing fees (Note 2) | 103,053 |
| Payable for Trustee compensation and expenses (Note 2) | 428,594 |
| Payable for administrative services (Note 2) | 4,247 |
| Payable for distribution fees (Note 2) | 377,686 |
| Distributions payable to shareholders | 455,562 |
| Other accrued expenses | 123,526 |
| Total liabilities | 33,085,001 |
| | |
| Net assets | $1,040,114,920 |
| |
| REPRESENTED BY | |
| Paid-in capital (Unlimited shares authorized) (Notes 1 and 4) | $1,014,978,546 |
| Undistributed net investment income (Note 1) | 1,635,331 |
| Accumulated net realized loss on investments | (12,233,358) |
| Net unrealized appreciation of investments | 35,734,401 |
| Total — Representing net assets applicable to capital shares outstanding | $1,040,114,920 |
(Continued on next page)
|
| New York Tax Exempt Income Fund 35 |
Statement of assets and liabilities cont.
| |
| COMPUTATION OF NET ASSET VALUE AND OFFERING PRICE | |
| Net asset value and redemption price per class A share | |
| ($862,926,349 divided by 101,663,331 shares) | $8.49 |
| Offering price per class A share (100/96.00 of $8.49)* | $8.84 |
| Net asset value and offering price per class B share ($8,094,034 divided by 955,708 shares)** | $8.47 |
| Net asset value and offering price per class C share ($60,890,720 divided by 7,175,825 shares)** | $8.49 |
| Net asset value and redemption price per class M share ($1,220,089 divided by 143,603 shares) | $8.50 |
| Offering price per class M share (100/96.75 of $8.50)† | $8.79 |
| Net asset value, offering price and redemption price per class Y share | |
| ($106,983,728 divided by 12,599,193 shares) | $8.49 |
* On single retail sales of less than $100,000. On sales of $100,000 or more the offering price is reduced.
** Redemption price per share is equal to net asset value less any applicable contingent deferred sales charge.
† On single retail sales of less than $50,000. On sales of $50,000 or more the offering price is reduced.
The accompanying notes are an integral part of these financial statements.
|
| 36 New York Tax Exempt Income Fund |
Statement of operations Year ended 11/30/17
| |
| INVESTMENT INCOME | |
| Interest income | $39,553,621 |
| Total investment income | 39,553,621 |
| |
| EXPENSES | |
| Compensation of Manager (Note 2) | 4,584,536 |
| Investor servicing fees (Note 2) | 631,220 |
| Custodian fees (Note 2) | 13,912 |
| Trustee compensation and expenses (Note 2) | 54,417 |
| Distribution fees (Note 2) | 2,663,043 |
| Administrative services (Note 2) | 32,461 |
| Other | 294,938 |
| Total expenses | 8,274,527 |
| | |
| Expense reduction (Note 2) | (36,590) |
| Net expenses | 8,237,937 |
| |
| Net investment income | 31,315,684 |
| |
| Net realized gain on securities from unaffiliated issuers (Notes 1 and 3) | 9,804,612 |
| Net unrealized appreciation of securities in unaffiliated issuers during the year | 8,740,888 |
| Net gain on investments | 18,545,500 |
| |
| Net increase in net assets resulting from operations | $49,861,184 |
The accompanying notes are an integral part of these financial statements.
|
| New York Tax Exempt Income Fund 37 |
Statement of changes in net assets
| | |
| INCREASE (DECREASE) IN NET ASSETS | Year ended 11/30/17 | Year ended 11/30/16 |
| Operations | | |
| Net investment income | $31,315,684 | $34,156,276 |
| Net realized gain on investments | 9,804,612 | 1,868,089 |
| Net unrealized appreciation (depreciation) of investments | 8,740,888 | (36,044,150) |
| Net increase (decrease) in net assets resulting | | |
| from operations | 49,861,184 | (19,785) |
| Distributions to shareholders (Note 1): | | |
| From ordinary income | | |
| Taxable net investment income | | |
| Class A | (1,341,677) | (234,270) |
| Class B | (14,855) | (2,725) |
| Class C | (97,896) | (15,051) |
| Class M | (2,232) | (358) |
| Class Y | (126,264) | (11,904) |
| From tax-exempt net investment income | | |
| Class A | (26,512,444) | (29,776,255) |
| Class B | (214,902) | (268,290) |
| Class C | (1,396,009) | (1,515,035) |
| Class M | (36,822) | (42,334) |
| Class Y | (3,054,338) | (2,159,969) |
| Increase (decrease) from capital share transactions (Note 4) | (45,647,333) | 66,648,403 |
| Total increase (decrease) in net assets | (28,583,588) | 32,602,427 |
| |
| NET ASSETS | | |
| Beginning of year | 1,068,698,508 | 1,036,096,081 |
| End of year (including undistributed net investment | | |
| income of $1,635,331 and $3,305,144, respectively) | $1,040,114,920 | $1,068,698,508 |
The accompanying notes are an integral part of these financial statements.
|
| 38 New York Tax Exempt Income Fund |
|
| This page left blank intentionally. |
|
| New York Tax Exempt Income Fund 39 |
Financial highlights (For a common share outstanding throughout the period)
| | | | | | | | | | | | |
| | INVESTMENT OPERATIONS | | | LESS DISTRIBUTIONS | | | | RATIOS AND SUPPLEMENTAL DATA | | |
| | | | | | | | | | | | Ratio | |
| | | | Net realized | | | | | | | | of net investment | |
| | Net asset value, | | and unrealized | Total from | From | | | Total return | Net assets, | Ratio of expenses | income (loss) | |
| | beginning | Net investment | gain (loss) | investment | net investment | Total | Net asset value, | at net asset | end of period | to average | to average | Portfolio |
| Period ended | of period | income (loss) | on investments | operations | income | distributions | end of period | value (%) a | (in thousands) | net assets (%) b | net assets (%) | turnover (%) |
| Class A | | | | | | | | | | | | |
| November 30, 2017 | $8.35 | .26 | .15 | .41 | (.27) | (.27) | $8.49 | 4.92 | $862,926 | .75 | 3.00 | 24 |
| November 30, 2016 | 8.61 | .28 | (.26) | .02 | (.28) | (.28) | 8.35 | .11 | 910,466 | .76c | 3.18c | 22 |
| November 30, 2015 | 8.66 | .30 | (.05) | .25 | (.30) | (.30) | 8.61 | 2.94 | 920,148 | .75 | 3.51 | 15 |
| November 30, 2014 | 8.29 | .32 | .36 | .68 | (.31) | (.31) | 8.66 | 8.39 | 946,474 | .74 | 3.74 | 10 |
| November 30, 2013 | 9.12 | .32 | (.83) | (.51) | (.32) | (.32) | 8.29 | (5.67) | 974,711 | .75 | 3.73 | 11 |
| Class B | | | | | | | | | | | | |
| November 30, 2017 | $8.33 | .20 | .15 | .35 | (.21) | (.21) | $8.47 | 4.27 | $8,094 | 1.38 | 2.38 | 24 |
| November 30, 2016 | 8.59 | .22 | (.26) | (.04) | (.22) | (.22) | 8.33 | (.52) | 10,004 | 1.39c | 2.55c | 22 |
| November 30, 2015 | 8.64 | .25 | (.05) | .20 | (.25) | (.25) | 8.59 | 2.30 | 10,708 | 1.38 | 2.88 | 15 |
| November 30, 2014 | 8.27 | .26 | .37 | .63 | (.26) | (.26) | 8.64 | 7.73 | 11,438 | 1.37 | 3.11 | 10 |
| November 30, 2013 | 9.10 | .27 | (.84) | (.57) | (.26) | (.26) | 8.27 | (6.28) | 12,322 | 1.38 | 3.10 | 11 |
| Class C | | | | | | | | | | | | |
| November 30, 2017 | $8.35 | .19 | .15 | .34 | (.20) | (.20) | $8.49 | 4.11 | $60,891 | 1.53 | 2.23 | 24 |
| November 30, 2016 | 8.60 | .21 | (.25) | (.04) | (.21) | (.21) | 8.35 | (.55) | 65,903 | 1.54c | 2.39c | 22 |
| November 30, 2015 | 8.66 | .24 | (.07) | .17 | (.23) | (.23) | 8.60 | 2.02 | 57,709 | 1.53 | 2.72 | 15 |
| November 30, 2014 | 8.29 | .25 | .37 | .62 | (.25) | (.25) | 8.66 | 7.55 | 55,788 | 1.52 | 2.96 | 10 |
| November 30, 2013 | 9.11 | .26 | (.83) | (.57) | (.25) | (.25) | 8.29 | (6.30) | 58,449 | 1.53 | 2.95 | 11 |
| Class M | | | | | | | | | | | | |
| November 30, 2017 | $8.36 | .23 | .15 | .38 | (.24) | (.24) | $8.50 | 4.62 | $1,220 | 1.03 | 2.74 | 24 |
| November 30, 2016 | 8.61 | .25 | (.25) | —d | (.25) | (.25) | 8.36 | (.06) | 1,450 | 1.04c | 2.89c | 22 |
| November 30, 2015 | 8.67 | .28 | (.06) | .22 | (.28) | (.28) | 8.61 | 2.53 | 1,404 | 1.03 | 3.22 | 15 |
| November 30, 2014 | 8.30 | .29 | .37 | .66 | (.29) | (.29) | 8.67 | 8.08 | 1,410 | 1.02 | 3.46 | 10 |
| November 30, 2013 | 9.12 | .30 | (.83) | (.53) | (.29) | (.29) | 8.30 | (5.83) | 1,451 | 1.03 | 3.45 | 11 |
| Class Y | | | | | | | | | | | | |
| November 30, 2017 | $8.36 | .27 | .15 | .42 | (.29) | (.29) | $8.49 | 5.03 | $106,984 | .53 | 3.21 | 24 |
| November 30, 2016 | 8.61 | .30 | (.25) | .05 | (.30) | (.30) | 8.36 | .45 | 80,877 | .54c | 3.37c | 22 |
| November 30, 2015 | 8.66 | .32 | (.05) | .27 | (.32) | (.32) | 8.61 | 3.17 | 46,127 | .53 | 3.72 | 15 |
| November 30, 2014 | 8.29 | .34 | .36 | .70 | (.33) | (.33) | 8.66 | 8.62 | 39,211 | .52 | 3.96 | 10 |
| November 30, 2013 | 9.12 | .34 | (.83) | (.49) | (.34) | (.34) | 8.29 | (5.47) | 18,762 | .53 | 3.95 | 11 |
a Total return assumes dividend reinvestment and does not reflect the effect of sales charges.
b Includes amounts paid through expense offset and/or brokerage/service arrangements, if any (Note 2). Also excludes acquired fund fees and expenses, if any.
c Reflects a voluntary waiver of certain fund expenses in effect during the period. As a result of such waivers, the expenses of each class reflect a reduction of less than 0.01% as a percentage of average net assets.
d Amount represents less than $0.01 per share.
The accompanying notes are an integral part of these financial statements.
| |
| 40 New York Tax Exempt Income Fund | New York Tax Exempt Income Fund 41 |
Notes to financial statements 11/30/17
Within the following Notes to financial statements, references to “State Street” represent State Street Bank and Trust Company, references to “the SEC” represent the Securities and Exchange Commission, references to “Putnam Management” represent Putnam Investment Management, LLC, the fund’s manager, an indirect wholly-owned subsidiary of Putnam Investments, LLC and references to “OTC”, if any, represent over-the-counter. Unless otherwise noted, the “reporting period” represents the period from December 1, 2016 through November 30, 2017.
Putnam New York Tax Exempt Income Fund (the fund) is a Massachusetts business trust, which is registered under the Investment Company Act of 1940, as amended, as a diversified open-end management investment company. The goal of the fund is to seek as high a level of current income exempt from federal income tax and New York State and City personal income taxes as Putnam Management believes is consistent with preservation of capital. The fund invests mainly in bonds that pay interest that is exempt from federal income tax and New York State and City personal income taxes (but that may be subject to federal alternative minimum tax (AMT)), are investment-grade in quality, and have intermediate- to long-term maturities (i.e., three years or longer). Under normal circumstances, Putnam Management invests so that at least 90% of the fund’s income distributions are exempt from federal income tax and New York State and City personal income taxes, except during times of adverse market conditions, when more than 10% of the fund’s income distributions could be subject to these taxes. This investment policy cannot be changed without the approval of the fund’s shareholders. Putnam Management may consider, among other factors, credit, interest rate and prepayment risks, as well as general market conditions, when deciding whether to buy or sell investments.
The fund offers class A, class B, class C, class M and class Y shares. The fund registered class T shares in February 2017, however, as of the date of this report, class T shares had not commenced operations and are not available for purchase. Effective April 1, 2017, purchases of class B shares are closed to new and existing investors except by exchange from class B shares of another Putnam fund or through dividend and/or capital gains reinvestment. Class A and class M shares are sold with a maximum front-end sales charge of 4.00% and 3.25%, respectively. Class A shares generally are not subject to a contingent deferred sales charge, and class M and class Y shares are not subject to a contingent deferred sales charge. Class B shares, which convert to class A shares after approximately eight years, are not subject to a front-end sales charge and are subject to a contingent deferred sales charge if those shares are redeemed within six years of purchase. Class C shares are subject to a one-year 1.00% contingent deferred sales charge and do not convert to class A shares. The expenses for class A, class B, class C, and class M shares may differ based on the distribution fee of each class, which is identified in Note 2. Class Y shares, which are sold at net asset value, are generally subject to the same expenses as class A, class B, class C, and class M shares, but do not bear a distribution fee. Class Y shares are not available to all investors.
In the normal course of business, the fund enters into contracts that may include agreements to indemnify another party under given circumstances. The fund’s maximum exposure under these arrangements is unknown as this would involve future claims that may be, but have not yet been, made against the fund. However, the fund’s management team expects the risk of material loss to be remote.
The fund has entered into contractual arrangements with an investment adviser, administrator, distributor, shareholder servicing agent and custodian, who each provide services to the fund. Unless expressly stated otherwise, shareholders are not parties to, or intended beneficiaries of these contractual arrangements, and these contractual arrangements are not intended to create any shareholder right to enforce them against the service providers or to seek any remedy under them against the service providers, either directly or on behalf of the fund.
Under the fund’s Declaration of Trust, any claims asserted against or on behalf of the Putnam Funds, including claims against Trustees and Officers, must be brought in state and federal courts located within the Commonwealth of Massachusetts.
Note 1: Significant accounting policies
The following is a summary of significant accounting policies consistently followed by the fund in the preparation of its financial statements. The preparation of financial statements is in conformity with accounting principles generally accepted in the United States of America and requires management to make estimates and assumptions that affect the reported amounts of assets and liabilities in the financial statements and the reported amounts of increases and decreases in net assets from operations. Actual results could differ from those estimates. Subsequent events after the Statement of assets and liabilities date through the date that the financial statements were issued have been evaluated in the preparation of the financial statements.
|
| 42 New York Tax Exempt Income Fund |
Investment income, realized and unrealized gains and losses and expenses of the fund are borne pro-rata based on the relative net assets of each class to the total net assets of the fund, except that each class bears expenses unique to that class (including the distribution fees applicable to such classes). Each class votes as a class only with respect to its own distribution plan or other matters on which a class vote is required by law or determined by the Trustees. If the fund were liquidated, shares of each class would receive their pro-rata share of the net assets of the fund. In addition, the Trustees declare separate dividends on each class of shares.
Security valuation Portfolio securities and other investments are valued using policies and procedures adopted by the Board of Trustees. The Trustees have formed a Pricing Committee to oversee the implementation of these procedures and have delegated responsibility for valuing the fund’s assets in accordance with these procedures to Putnam Management. Putnam Management has established an internal Valuation Committee that is responsible for making fair value determinations, evaluating the effectiveness of the pricing policies of the fund and reporting to the Pricing Committee.
Tax-exempt bonds and notes are generally valued on the basis of valuations provided by an independent pricing service approved by the Trustees. Such services use information with respect to transactions in bonds, quotations from bond dealers, market transactions in comparable securities and various relationships between securities in determining value. These securities will generally be categorized as Level 2.
Certain investments, including certain restricted and illiquid securities and derivatives, are also valued at fair value following procedures approved by the Trustees. To assess the continuing appropriateness of fair valuations, the Valuation Committee reviews and affirms the reasonableness of such valuations on a regular basis after considering all relevant information that is reasonably available. Such valuations and procedures are reviewed periodically by the Trustees. These valuations consider such factors as significant market or specific security events such as interest rate or credit quality changes, various relationships with other securities, discount rates, U.S. Treasury, U.S. swap and credit yields, index levels, convexity exposures, recovery rates, sales and other multiples and resale restrictions. These securities are classified as Level 2 or as Level 3 depending on the priority of the significant inputs. The fair value of securities is generally determined as the amount that the fund could reasonably expect to realize from an orderly disposition of such securities over a reasonable period of time. By its nature, a fair value price is a good faith estimate of the value of a security in a current sale and does not reflect an actual market price, which may be different by a material amount.
Security transactions and related investment income Security transactions are recorded on the trade date (the date the order to buy or sell is executed). Gains or losses on securities sold are determined on the identified cost basis.
Interest income is recorded on the accrual basis. All premiums/discounts are amortized/accreted on a yield-to-maturity basis. The premium in excess of the call price, if any, is amortized to the call date; thereafter, any remaining premium is amortized to maturity.
Securities purchased or sold on a forward commitment or delayed delivery basis may be settled at a future date beyond customary settlement time; interest income is accrued based on the terms of the securities. Losses may arise due to changes in the fair value of the underlying securities or if the counterparty does not perform under the contract.
Interfund lending The fund, along with other Putnam funds, may participate in an interfund lending program pursuant to an exemptive order issued by the SEC. This program allows the fund to borrow from other Putnam funds that permit such transactions. Interfund lending transactions are subject to each fund’s investment policies and borrowing and lending limits. Interest earned or paid on the interfund lending transaction will be based on the average of certain current market rates. During the reporting period, the fund did not utilize the program.
Lines of credit The fund participates, along with other Putnam funds, in a $317.5 million unsecured committed line of credit and a $235.5 million unsecured uncommitted line of credit, both provided by State Street. Borrowings may be made for temporary or emergency purposes, including the funding of shareholder redemption requests and trade settlements. Interest is charged to the fund based on the fund’s borrowing at a rate equal to 1.25% plus the higher of (1) the Federal Funds rate and (2) the overnight LIBOR for the committed line of credit and the Federal Funds rate plus 1.30% for the uncommitted line of credit. A closing fee equal to 0.04% of the committed line of credit plus a $25,000 flat fee and 0.04% of the uncommitted line of credit has been paid by the participating funds. In addition, a commitment fee of 0.21% per annum on any unutilized portion of the committed line of credit is allocated to the participating funds based on their relative net assets and paid quarterly. During the reporting period, the fund had no borrowings against these arrangements.
|
| New York Tax Exempt Income Fund 43 |
Federal taxes It is the policy of the fund to distribute all of its income within the prescribed time period and otherwise comply with the provisions of the Internal Revenue Code of 1986, as amended (the Code), applicable to regulated investment companies. It is also the intention of the fund to distribute an amount sufficient to avoid imposition of any excise tax under Section 4982 of the Code.
The fund is subject to the provisions of Accounting Standards Codification 740 Income Taxes (ASC 740). ASC 740 sets forth a minimum threshold for financial statement recognition of the benefit of a tax position taken or expected to be taken in a tax return. The fund did not have a liability to record for any unrecognized tax benefits in the accompanying financial statements. No provision has been made for federal taxes on income, capital gains or unrealized appreciation on securities held nor for excise tax on income and capital gains. Each of the fund’s federal tax returns for the prior three fiscal years remains subject to examination by the Internal Revenue Service.
At November 30, 201 7, the fund had a capital loss carryover of $12,675,081 available to the extent allowed by the Code to offset future net capital gain, if any. For any carryover, the amount of the carryover and that carryover’s expiration date is:
| | | |
| | Loss carryover | | |
| Short-term | Long-term | Total | Expiration |
| $6,621,138 | $5,544,593 | $12,165,731 | * |
| 509,350 | N/A | 509,350 | November 30, 2019 |
* Under the Regulated Investment Company Modernization Act of 2010, the fund will be permitted to carry forward capital losses incurred in taxable years beginning after December 22, 2010 for an unlimited period. However, any losses incurred will be required to be utilized prior to the losses incurred in pre-enactment tax years. As a result of this ordering rule, pre-enactment capital loss carryforwards may be more likely to expire unused. Additionally, post-enactment capital losses that are carried forward will retain their character as either short-term or long-term capital losses rather than being considered all short-term as under previous law.
Distributions to shareholders Income dividends are recorded daily by the fund and are paid monthly. Distributions from capital gains, if any, are recorded on the ex-dividend date and paid at least annually. The amount and character of income and gains to be distributed are determined in accordance with income tax regulations, which may differ from generally accepted accounting principles. These differences include temporary and/or permanent differences from the expiration of a capital loss carryover and from amortization and accretion. Reclassifications are made to the fund’s capital accounts to reflect income and gains available for distribution (or available capital loss carryovers) under income tax regulations. At the close of the reporting period, the fund reclassified $188,058 to decrease undistributed net investment income, $1,012,734 to decrease paid-in capital and $1,200,792 to decrease accumulated net realized loss.
Tax cost of investments includes adjustments to net unrealized appreciation (depreciation) which may not necessarily be final tax cost basis adjustments, but closely approximate the tax basis unrealized gains and losses that may be realized and distributed to shareholders. The tax basis components of distributable earnings and the federal tax cost as of the close of the reporting period were as follows:
| |
| Unrealized appreciation | $39,324,770 |
| Unrealized depreciation | (3,678,402) |
| Net unrealized appreciation | 35,646,368 |
| Undistributed ordinary income | 425,833 |
| Undistributed tax-exempt income | 1,665,060 |
| Capital loss carryforward | (12,675,081) |
| Cost for federal income tax purposes | $978,904,781 |
Note 2: Management fee, administrative services and other transactions
The fund pays Putnam Management a management fee (based on the fund’s average net assets and computed and paid monthly) at annual rates that may vary based on the average of the aggregate net assets of all open-end mutual funds sponsored by Putnam Management (excluding net assets of funds that are invested in, or that are invested in by, other Putnam funds to the extent necessary to avoid “double counting” of those assets). Such annual rates may vary as follows:
| |
| 44 New York Tax Exempt Income Fund |
| | | | |
| 0.590% | of the first $5 billion, | | 0.390% | of the next $50 billion, |
| 0.540% | of the next $5 billion, | | 0.370% | of the next $50 billion, |
| 0.490% | of the next $10 billion, | | 0.360% | of the next $100 billion and |
| 0.440% | of the next $10 billion, | | 0.355% | of any excess thereafter. |
For the reporting period, the management fee represented an effective rate (excluding the impact from any expense waivers in effect) of 0.435% of the fund’s average net assets.
Putnam Management has contractually agreed, through March 30, 2019, to waive fees or reimburse the fund’s expenses to the extent necessary to limit the cumulative expenses of the fund, exclusive of brokerage, interest, taxes, investment-related expenses, extraordinary expenses, acquired fund fees and expenses and payments under the fund’s investor servicing contract, investment management contract and distribution plans, on a fiscal year-to-date basis to an annual rate of 0.20% of the fund’s average net assets over such fiscal year-to-date period. During the reporting period, the fund’s expenses were not reduced as a result of this limit.
Putnam Investments Limited (PIL), an affiliate of Putnam Management, is authorized by the Trustees to manage a separate portion of the assets of the fund as determined by Putnam Management from time to time. PIL did not manage any portion of the assets of the fund during the reporting period. If Putnam Management were to engage the services of PIL, Putnam Management would pay a quarterly sub-management fee to PIL for its services at an annual rate of 0.40% of the average net assets of the portion of the fund managed by PIL.
The fund reimburses Putnam Management an allocated amount for the compensation and related expenses of certain officers of the fund and their staff who provide administrative services to the fund. The aggregate amount of all such reimbursements is determined annually by the Trustees.
Custodial functions for the fund’s assets are provided by State Street. Custody fees are based on the fund’s asset level, the number of its security holdings and transaction volumes.
Putnam Investor Services, Inc., an affiliate of Putnam Management, provides investor servicing agent functions to the fund. Putnam Investor Services, Inc. received fees for investor servicing for class A, class B, class C, class M and class Y shares that included (1) a per account fee for each direct and underlying non-defined contribution account (“retail account”) of the fund; (2) a specified rate of the fund’s assets attributable to defined contribution plan accounts; and (3) a specified rate based on the average net assets in retail accounts. Putnam Investor Services, Inc. has agreed that the aggregate investor servicing fees for each fund’s retail and defined contribution accounts for these share classes will not exceed an annual rate of 0.25% of the fund’s average assets attributable to such accounts.
During the reporting period, the expenses for each class of shares related to investor servicing fees were as follows:
| | | | |
| Class A | $530,237 | | Class M | 812 |
| Class B | 5,419 | | Class Y | 57,026 |
| Class C | 37,726 | | Total | $631,220 |
The fund has entered into expense offset arrangements with Putnam Investor Services, Inc. and State Street whereby Putnam Investor Services, Inc.’s and State Street’s fees are reduced by credits allowed on cash balances. For the reporting period, the fund’s expenses were reduced by $36,590 under the expense offset arrangements.
Each Independent Trustee of the fund receives an annual Trustee fee, of which $771, as a quarterly retainer, has been allocated to the fund, and an additional fee for each Trustees meeting attended. Trustees also are reimbursed for expenses they incur relating to their services as Trustees.
The fund has adopted a Trustee Fee Deferral Plan (the Deferral Plan) which allows the Trustees to defer the receipt of all or a portion of Trustees fees payable on or after July 1, 1995. The deferred fees remain invested in certain Putnam funds until distribution in accordance with the Deferral Plan.
The fund has adopted an unfunded noncontributory defined benefit pension plan (the Pension Plan) covering all Trustees of the fund who have served as a Trustee for at least five years and were first elected prior to 2004. Benefits under the Pension Plan are equal to 50% of the Trustee’s average annual attendance and retainer fees for the three years ended December 31, 2005. The retirement benefit is payable during a Trustee’s lifetime, beginning the year following retirement, for the number of years of service through December 31, 2006. Pension expense
|
| New York Tax Exempt Income Fund 45 |
for the fund is included in Trustee compensation and expenses in the Statement of operations. Accrued pension liability is included in Payable for Trustee compensation and expenses in the Statement of assets and liabilities. The Trustees have terminated the Pension Plan with respect to any Trustee first elected after 2003.
The fund has adopted distribution plans (the Plans) with respect to the following share classes pursuant to Rule 12b–1 under the Investment Company Act of 1940. The purpose of the Plans is to compensate Putnam Retail Management Limited Partnership, an indirect wholly-owned subsidiary of Putnam Investments, LLC, for services provided and expenses incurred in distributing shares of the fund. The Plans provide payments by the fund to Putnam Retail Management Limited Partnership at an annual rate of up to the following amounts (“Maximum %”) of the average net assets attributable to each class. The Trustees have approved payment by the fund at the following annual rate (“Approved %”) of the average net assets attributable to each class. During the reporting period, the class-specific expenses related to distribution fees were as follows:
| | | |
| | Maximum % | Approved % | Amount |
| Class A | 0.35% | * | $1,949,479 |
| Class B | 1.00% | 0.85% | 76,827 |
| Class C | 1.00% | 1.00% | 629,967 |
| Class M | 1.00% | 0.50% | 6,770 |
| Total | | | $2,663,043 |
* Equals the weighted average of (i) 0.20% of the net assets of the fund attributable to class A shares purchased and paid for prior to April 1, 2005 and (ii) 0.25% of all other net assets of the fund attributable to class A shares.
For the reporting period, Putnam Retail Management Limited Partnership, acting as underwriter, received net commissions of $60,019 and $9 from the sale of class A and class M shares, respectively, and received $8,237 and $1,862 in contingent deferred sales charges from redemptions of class B and class C shares, respectively.
A deferred sales charge of up to 1.00% is assessed on certain redemptions of class A shares. For the reporting period, Putnam Retail Management Limited Partnership, acting as underwriter, received no monies on class A redemptions.
Note 3: Purchases and sales of securities
During the reporting period, the cost of purchases and the proceeds from sales, excluding short-term investments, were as follows:
| | |
| | Cost of purchases | Proceeds from sales |
| Investments in securities (Long-term) | $244,095,260 | $293,353,563 |
| U.S. government securities (Long-term) | — | — |
| Total | $244,095,260 | $293,353,563 |
The fund may purchase or sell investments from or to other Putnam funds in the ordinary course of business, which can reduce the fund’s transaction costs, at prices determined in accordance with SEC requirements and policies approved by the Trustees. During the reporting period, purchases or sales of long-term securities from or to other Putnam funds, if any, did not represent more than 5% of the fund’s total cost of purchases and/or total proceeds from sales.
| |
| 46 New York Tax Exempt Income Fund |
Note 4: Capital shares
At the close of the reporting period, there were an unlimited number of shares of beneficial interest authorized. Transactions in capital shares were as follows:
| | | | |
| | YEAR ENDED 11/30/17 | YEAR ENDED 11/30/16 |
| Class A | Shares | Amount | Shares | Amount |
| Shares sold | 8,926,938 | $75,811,493 | 13,767,567 | $120,435,498 |
| Shares issued in connection with | | | | |
| reinvestment of distributions | 2,616,851 | 22,201,888 | 2,724,022 | 23,726,393 |
| | 11,543,789 | 98,013,381 | 16,491,589 | 144,161,891 |
| Shares repurchased | (18,886,413) | (160,043,137) | (14,409,021) | (125,365,677) |
| Net increase (decrease) | (7,342,624) | $(62,029,756) | 2,082,568 | $18,796,214 |
| |
| | YEAR ENDED 11/30/17 | YEAR ENDED 11/30/16 |
| Class B | Shares | Amount | Shares | Amount |
| Shares sold | 13,409 | $112,949 | 116,207 | $1,013,090 |
| Shares issued in connection with | | | | |
| reinvestment of distributions | 23,066 | 195,115 | 27,508 | 239,065 |
| | 36,475 | 308,064 | 143,715 | 1,252,155 |
| Shares repurchased | (281,043) | (2,378,424) | (190,336) | (1,660,225) |
| Net decrease | (244,568) | $(2,070,360) | (46,621) | $(408,070) |
| |
| | YEAR ENDED 11/30/17 | YEAR ENDED 11/30/16 |
| Class C | Shares | Amount | Shares | Amount |
| Shares sold | 1,065,192 | $9,050,949 | 2,001,979 | $17,463,600 |
| Shares issued in connection with | | | | |
| reinvestment of distributions | 156,126 | 1,323,461 | 153,594 | 1,337,526 |
| | 1,221,318 | 10,374,410 | 2,155,573 | 18,801,126 |
| Shares repurchased | (1,938,025) | (16,431,734) | (970,889) | (8,461,483) |
| Net increase (decrease) | (716,707) | $(6,057,324) | 1,184,684 | $10,339,643 |
| |
| | YEAR ENDED 11/30/17 | YEAR ENDED 11/30/16 |
| Class M | Shares | Amount | Shares | Amount |
| Shares sold | 4,453 | $37,393 | 10,675 | $93,115 |
| Shares issued in connection with | | | | |
| reinvestment of distributions | 4,555 | 38,652 | 4,849 | 42,274 |
| | 9,008 | 76,045 | 15,524 | 135,389 |
| Shares repurchased | (38,811) | (332,263) | (5,119) | (44,662) |
| Net increase (decrease) | (29,803) | $(256,218) | 10,405 | $90,727 |
| |
| | YEAR ENDED 11/30/17 | YEAR ENDED 11/30/16 |
| Class Y | Shares | Amount | Shares | Amount |
| Shares sold | 5,887,679 | $49,907,817 | 5,488,414 | $47,988,686 |
| Shares issued in connection with | | | | |
| reinvestment of distributions | 326,084 | 2,768,609 | 206,405 | 1,797,723 |
| | 6,213,763 | 52,676,426 | 5,694,819 | 49,786,409 |
| Shares repurchased | (3,293,801) | (27,910,101) | (1,373,655) | (11,956,520) |
| Net increase | 2,919,962 | $24,766,325 | 4,321,164 | $37,829,889 |
|
| New York Tax Exempt Income Fund 47 |
Note 5: Market, credit and other risks
In the normal course of business, the fund trades financial instruments and enters into financial transactions where risk of potential loss exists due to changes in the market (market risk) or failure of the contracting party to the transaction to perform (credit risk). The fund may be exposed to additional credit risk that an institution or other entity with which the fund has unsettled or open transactions will default. The fund focuses a majority of its investments in the state of New York and may be affected by economic and political developments in that state.
| |
| 48 New York Tax Exempt Income Fund |
Federal tax information (Unaudited)
The fund has designated 95.19% of dividends paid from net investment income during the reporting period as tax exempt for Federal income tax purposes.
The Form 1099 that will be mailed to you in January 2018 will show the tax status of all distributions paid to your account in calendar 2017.
|
| New York Tax Exempt Income Fund 49 |
About the Trustees

| |
| 50 New York Tax Exempt Income Fund |

* Mr. Reynolds is an “interested person” (as defined in the Investment Company Act of 1940) of the fund and Putnam Investments. He is President and Chief Executive Officer of Putnam Investments, as well as the President of your fund and each of the other Putnam funds.
The address of each Trustee is One Post Office Square, Boston, MA 02109.
As of November 30, 2017, there were 106 Putnam funds. All Trustees serve as Trustees of all Putnam funds.
Each Trustee serves for an indefinite term, until his or her resignation, retirement at age 75, removal, or death.
|
| New York Tax Exempt Income Fund 51 |
Officers
In addition to Robert L. Reynolds, the other officers of the fund are shown below:
| |
| Jonathan S. Horwitz (Born 1955) | Susan G. Malloy (Born 1957) |
| Executive Vice President, Principal Executive Officer, | Vice President and Assistant Treasurer |
| and Compliance Liaison | Since 2007 |
| Since 2004 | Head of Accounting, Middle Office, & Control Services, |
| | Putnam Investments and Putnam Management | |
| Robert T. Burns (Born 1961) | |
| Vice President and Chief Legal Officer | Mark C. Trenchard (Born 1962) |
| Since 2011 | Vice President and BSA Compliance Officer |
| General Counsel, Putnam Investments, | Since 2002 |
| Putnam Management, and Putnam Retail Management | Director of Operational Compliance, Putnam |
| | Investments and Putnam Retail Management | |
| James F. Clark (Born 1974) | |
| Vice President and Chief Compliance Officer | Nancy E. Florek (Born 1957) |
| Since 2016 | Vice President, Director of Proxy Voting and Corporate |
| Chief Compliance Officer, Putnam Investments | Governance, Assistant Clerk, and Assistant Treasurer |
| and Putnam Management | Since 2000 |
| | | |
| Michael J. Higgins (Born 1976) | Denere P. Poulack (Born 1968) |
| Vice President, Treasurer, and Clerk | Assistant Vice President, Assistant Clerk, |
| Since 2010 | and Assistant Treasurer |
| | Since 2004 |
| Janet C. Smith (Born 1965) | |
| Vice President, Principal Financial Officer, Principal | |
| Accounting Officer, and Assistant Treasurer | |
| Since 2007 | |
| Head of Fund Administration Services, | |
| Putnam Investments and Putnam Management | |
The principal occupations of the officers for the past five years have been with the employers as shown above, although in some cases they have held different positions with such employers. The address of each officer is One Post Office Square, Boston, MA 02109.
| |
| 52 New York Tax Exempt Income Fund |
Fund information
Founded over 80 years ago, Putnam Investments was built around the concept that a balance between risk and reward is the hallmark of a well-rounded financial program. We manage over 100 funds across income, value, blend, growth, asset allocation, absolute return, and global sector categories.
| | |
| Investment Manager | Trustees | Michael J. Higgins |
| Putnam Investment | Jameson A. Baxter, Chair | Vice President, Treasurer, |
| Management, LLC | Kenneth R. Leibler, Vice Chair | and Clerk |
| One Post Office Square | Liaquat Ahamed | |
| Boston, MA 02109 | Ravi Akhoury | Janet C. Smith |
| | Barbara M. Baumann | Vice President, |
| Investment Sub-Advisor | Katinka Domotorffy | Principal Financial Officer, |
| Putnam Investments Limited | Catharine Bond Hill | Principal Accounting Officer, |
| 16 St James’s Street | Paul L. Joskow | and Assistant Treasurer |
| London, England SW1A 1ER | Robert E. Patterson | |
| | George Putnam, III | Susan G. Malloy |
| Marketing Services | Robert L. Reynolds | Vice President and |
| Putnam Retail Management | Manoj P. Singh | Assistant Treasurer |
| One Post Office Square | | |
| Boston, MA 02109 | Officers | Mark C. Trenchard |
| | Robert L. Reynolds | Vice President and |
| Custodian | President | BSA Compliance Officer |
| State Street Bank | | |
| and Trust Company | Jonathan S. Horwitz | Nancy E. Florek |
| | Executive Vice President, | Vice President, Director of |
| Legal Counsel | Principal Executive Officer, | Proxy Voting and Corporate |
| Ropes & Gray LLP | and Compliance Liaison | Governance, Assistant Clerk, |
| | | and Assistant Treasurer |
| Independent Registered | Robert T. Burns | |
| Public Accounting Firm | Vice President and | Denere P. Poulack |
| KPMG LLP | Chief Legal Officer | Assistant Vice President, Assistant |
| | | Clerk, and Assistant Treasurer |
| | James F. Clark | |
| | Vice President and | |
| | Chief Compliance Officer | |
This report is for the information of shareholders of Putnam New York Tax Exempt Income Fund. It may also be used as sales literature when preceded or accompanied by the current prospectus, the most recent copy of Putnam’s Quarterly Performance Summary, and Putnam’s Quarterly Ranking Summary. For more recent performance, please visit putnam.com. Investors should carefully consider the investment objectives, risks, charges, and expenses of a fund, which are described in its prospectus. For this and other information or to request a prospectus or summary prospectus, call 1-800-225-1581 toll free. Please read the prospectus carefully before investing. The fund’s Statement of Additional Information contains additional information about the fund’s Trustees and is available without charge upon request by calling 1-800-225-1581.

| |
| (a) The fund's principal executive, financial and accounting officers are employees of Putnam Investment Management, LLC, the Fund's investment manager. As such they are subject to a comprehensive Code of Ethics adopted and administered by Putnam Investments which is designed to protect the interests of the firm and its clients. The Fund has adopted a Code of Ethics which incorporates the Code of Ethics of Putnam Investments with respect to all of its officers and Trustees who are employees of Putnam Investment Management, LLC. For this reason, the Fund has not adopted a separate code of ethics governing its principal executive, financial and accounting officers. |
| |
| Item 3. Audit Committee Financial Expert: |
| |
| The Funds' Audit, Compliance and Distributions Committee is comprised solely of Trustees who are “independent” (as such term has been defined by the Securities and Exchange Commission (“SEC”) in regulations implementing Section 407 of the Sarbanes-Oxley Act (the “Regulations”)). The Trustees believe that each of the members of the Audit, Compliance and Distributions Committee also possess a combination of knowledge and experience with respect to financial accounting matters, as well as other attributes, that qualify them for service on the Committee. In addition, the Trustees have determined that each of Mr. Patterson, Ms. Baumann and Mr. Singh qualifies as an “audit committee financial expert” (as such term has been defined by the Regulations) based on their review of his or her pertinent experience and education. The SEC has stated, and the funds' amended and restated agreement and Declaration of Trust provides, that the designation or identification of a person as an audit committee financial expert pursuant to this Item 3 of Form N-CSR does not impose on such person any duties, obligations or liability that are greater than the duties, obligations and liability imposed on such person as a member of the Audit, Compliance and Distribution Committee and the Board of Trustees in the absence of such designation or identification. |
| |
| Item 4. Principal Accountant Fees and Services: |
| |
| The following table presents fees billed in each of the last two fiscal years for services rendered to the fund by the fund's independent auditor: |
| | | | | |
| Fiscal year ended | Audit Fees | Audit-Related Fees | Tax Fees | All Other Fees |
|
|
| | | | | |
| November 30, 2017 | $74,313 | $ — | $7,188 | $ — |
| November 30, 2016 | $64,529 | $ — | $7,000 | $ — |
| |
| For the fiscal years ended November 30, 2017 and November 30, 2016, the fund's independent auditor billed aggregate non-audit fees in the amounts of $7,188 and $7,000 respectively, to the fund, Putnam Management and any entity controlling, controlled by or under common control with Putnam Management that provides ongoing services to the fund. |
| |
| Audit Fees represent fees billed for the fund's last two fiscal years relating to the audit and review of the financial statements included in annual reports and registration statements, and other services that are normally provided in connection with statutory and regulatory filings or engagements. |
| |
| Audit-Related Fees represent fees billed in the fund's last two fiscal years for services traditionally performed by the fund's auditor, including accounting consultation for proposed transactions or concerning financial accounting and reporting standards and other audit or attest services not required by statute or regulation. |
| |
| Tax Fees represent fees billed in the fund's last two fiscal years for tax compliance, tax planning and tax advice services. Tax planning and tax advice services include assistance with tax audits, employee benefit plans and requests for rulings or technical advice from taxing authorities. |
| |
| Pre-Approval Policies of the Audit, Compliance and Distributions Committee. The Audit, Compliance and Distributions Committee of the Putnam funds has determined that, as a matter of policy, all work performed for the funds by the funds' independent auditors will be pre-approved by the Committee itself and thus will generally not be subject to pre-approval procedures. |
| |
| The Audit, Compliance and Distributions Committee also has adopted a policy to pre-approve the engagement by Putnam Management and certain of its affiliates of the funds' independent auditors, even in circumstances where pre-approval is not required by applicable law. Any such requests by Putnam Management or certain of its affiliates are typically submitted in writing to the Committee and explain, among other things, the nature of the proposed engagement, the estimated fees, and why this work should be performed by that particular audit firm as opposed to another one. In reviewing such requests, the Committee considers, among other things, whether the provision of such services by the audit firm are compatible with the independence of the audit firm. |
| |
| The following table presents fees billed by the fund's independent auditor for services required to be approved pursuant to paragraph (c)(7)(ii) of Rule 2-01 of Regulation S-X. |
| | | | | |
| Fiscal year ended | Audit-Related Fees | Tax Fees | All Other Fees | Total Non-Audit Fees |
|
|
| | | | | |
| November 30, 2017 | $ — | $ — | $ — | $ — |
| | | | | |
| November 30, 2016 | $ — | $ — | $ — | $ — |
| |
| Item 5. Audit Committee of Listed Registrants |
| |
|
Item 6. Schedule of Investments: |
| |
| The registrant's schedule of investments in unaffiliated issuers is included in the report to shareholders in Item 1 above. |
| |
| Item 7. Disclosure of Proxy Voting Policies and Procedures For Closed-End Management Investment Companies: |
| |
|
Item 8. Portfolio Managers of Closed-End Investment Companies |
| |
|
Item 9. Purchases of Equity Securities by Closed-End Management Investment Companies and Affiliated Purchasers: |
| |
|
Item 10. Submission of Matters to a Vote of Security Holders: |
| |
|
Item 11. Controls and Procedures: |
| |
| (a) The registrant's principal executive officer and principal financial officer have concluded, based on their evaluation of the effectiveness of the design and operation of the registrant's disclosure controls and procedures as of a date within 90 days of the filing date of this report, that the design and operation of such procedures are generally effective to provide reasonable assurance that information required to be disclosed by the registrant in this report is recorded, processed, summarized and reported within the time periods specified in the Commission's rules and forms. |
| |
| (b) Changes in internal control over financial reporting: Not applicable |
| |
| (a)(1) The Code of Ethics of The Putnam Funds, which incorporates the Code of Ethics of Putnam Investments, is filed herewith. |
| |
| (a)(2) Separate certifications for the principal executive officer and principal financial officer of the registrant as required by Rule 30a-2(a) under the Investment Company Act of 1940, as amended, are filed herewith. |
| |
| (b) The certifications required by Rule 30a-2(b) under the Investment Company Act of 1940, as amended, are filed herewith. |
| |
| Pursuant to the requirements of the Securities Exchange Act of 1934 and the Investment Company Act of 1940, the registrant has duly caused this report to be signed on its behalf by the undersigned, thereunto duly authorized. |
| |
| Putnam New York Tax Exempt Income Fund |
| |
| By (Signature and Title): |
| |
| /s/ Janet C. Smith
Janet C. Smith
Principal Accounting Officer
|
| |
| Pursuant to the requirements of the Securities Exchange Act of 1934 and the Investment Company Act of 1940, this report has been signed below by the following persons on behalf of the registrant and in the capacities and on the dates indicated. |
| |
| By (Signature and Title): |
| |
| /s/ Jonathan S. Horwitz
Jonathan S. Horwitz
Principal Executive Officer
|
| |
| By (Signature and Title): |
| |
| /s/ Janet C. Smith
Janet C. Smith
Principal Financial Officer
|