| | |
| UNITED STATES
SECURITIES AND EXCHANGE COMMISSION |
| | |
| CERTIFIED SHAREHOLDER REPORT OF REGISTERED
MANAGEMENT INVESTMENT COMPANIES
|
| | |
| Investment Company Act file number: | (811–03741) |
| | |
| Exact name of registrant as specified in charter: | Putnam New York Tax Exempt Income Fund |
| | |
| Address of principal executive offices: | 100 Federal Street, Boston, Massachusetts 02110 |
| | |
| Name and address of agent for service: | Robert T. Burns, Vice President
100 Federal Street
Boston, Massachusetts 02110 |
| | |
| Copy to: | Bryan Chegwidden, Esq.
Ropes & Gray LLP
1211 Avenue of the Americas
New York, New York 10036 |
| | |
| Registrant's telephone number, including area code: | (617) 292–1000 |
| | |
| Date of fiscal year end: | November 30, 2019 |
| | |
| Date of reporting period: | December 1, 2018 — May 31, 2019 |
| | |
|
Item 1. Report to Stockholders: | |
| | |
| The following is a copy of the report transmitted to stockholders pursuant to Rule 30e-1 under the Investment Company Act of 1940: | |
Putnam New York
Tax Exempt
Income Fund
Semiannual report
5|31|19
IMPORTANT NOTICE: Delivery of paper fund reports
In accordance with regulations adopted by the Securities and Exchange Commission, beginning on January 1, 2021, reports like this one will no longer be sent by mail unless you specifically request it. Instead, they will be on Putnam’s website, and you will be notified by mail whenever a new one is available, and provided with a website link to access the report.
If you wish to stop receiving paper reports sooner, or if you wish to continue to receive paper reports free of charge after January 1, 2021, please see the back cover or insert for instructions. If you invest through a bank or broker, your choice will apply to all funds held in your account. If you invest directly with Putnam, your choice will apply to all Putnam funds in your account.
If you already receive these reports electronically, no action is required.
Message from the Trustees
July 12, 2019
Dear Fellow Shareholder:
If there is any lesson to be learned from constantly changing financial markets, it is the importance of positioning your investment portfolio for your long-term goals. We believe that one strategy is to diversify across different asset classes and investment approaches.
We also believe your mutual fund investment offers a number of advantages, including constant monitoring by experienced investment professionals who maintain a long-term perspective. Putnam’s portfolio managers and analysts take a research-intensive approach that includes risk management strategies designed to serve you through changing conditions.
Another key strategy, in our view, is seeking the counsel of a financial advisor. For over 80 years, Putnam has recognized the importance of professional investment advice. Your financial advisor can help in many ways, including defining and planning for goals such as retirement, evaluating the level of risk appropriate for you, and reviewing your investments on a regular basis and making adjustments as necessary.
As always, your fund’s Board of Trustees remains committed to protecting the interests of Putnam shareholders like you, and we thank you for investing with Putnam.


Municipal bonds finance important public projects, such as schools, roads, and hospitals. The bonds are backed by either the issuing city, town, or other government entity or by revenues collected from usage fees.
However, unlike U.S. Treasuries or corporate bonds, the interest paid on municipal bonds is generally free from federal income taxes. Moreover, New York residents generally pay no state income taxes on distributions paid from municipal bonds issued in the Empire State. That can make municipal bonds particularly attractive to investors subject to higher personal income tax rates.

|
| 2 New York Tax Exempt Income Fund |

Source: Putnam, as of 5/31/19. Past performance is no guarantee of future results. Yields for U.S. Treasuries, investment-grade corporates, and municipal bonds are represented by the average “yield to worst” — a calculation of the lowest possible yield generated without defaulting — of the Bloomberg Barclays U.S. Treasury Index, an unmanaged index of U.S. dollar-denominated, fixed-rate, nominal debt issued by the U.S. Treasury; the Bloomberg Barclays U.S. Credit Index, an unmanaged index of U.S. dollar-denominated, investment-grade, fixed-rate, taxable corporate and government related bonds; and the Bloomberg Barclays Municipal Bond Index, an unmanaged index of long-term fixed-rate investment-grade tax-exempt bonds, respectively. You cannot invest directly in an index. Bond investments are subject to interest-rate risk (the risk of bond prices falling if interest rates rise) and credit risk (the risk of an issuer defaulting on interest or principal payments). Interest-rate risk is greater for longer-term bonds, and credit risk is greater for below-investment-grade bonds. Income from municipal bonds may be subject to the alternative minimum tax. Taxable equivalent yield and annual after-tax income are based on a 40.80% federal income tax rate. This rate reflects the Tax Cuts and Jobs Act of 2017 and includes the 3.80% Medicare surtax.
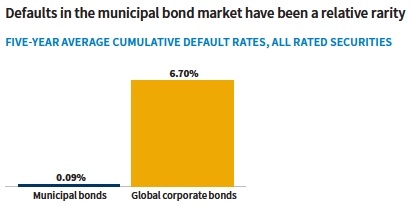
Source: Moody’s Investor Services, U.S. Municipal Bond Defaults and Recoveries, 1970–2017 (July 2018).Most recent data available.
|
| New York Tax Exempt Income Fund 3 |
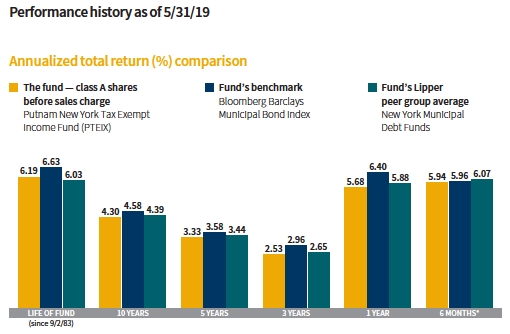
Current performance may be lower or higher than the quoted past performance, which cannot guarantee future results. Share price, principal value, and return will fluctuate, and you may have a gain or a loss when you sell your shares.Performance of class A shares assumes reinvestment of distributions and does not account for taxes. Fund returns in the bar chart do not reflect a sales charge of 4.00%; had they, returns would have been lower. See below and pages 9–11 for additional performance information. For a portion of the periods, the fund had expense limitations, without which returns would have been lower. To obtain the most recent month-end performance, visit putnam.com.
*Returns for the six-month period are not annualized, but cumulative.
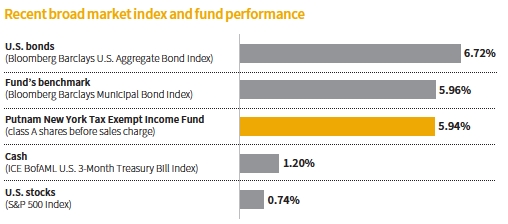
This comparison shows your fund’s performance in the context of broad market indexes for the six months ended 5/31/19. See above and pages 9–11 for additional fund performance information. Index descriptions can be found on pages 14–15.
|
| 4 New York Tax Exempt Income Fund |

Paul, how was the market for municipal bonds during the reporting period?
Municipal bonds enjoyed solid performance, outperforming U.S. stocks and Treasuries. The Federal Reserve raised interest rates on December 19, 2018, but its messaging became increasingly dovish as the period progressed. We attribute the Fed’s pivot to softening U.S. economic data, increased trade tensions, and the volatility in high-risk assets during the fourth quarter of 2018. Investors were encouraged by the Fed’s shift on rates, and benchmark U.S. fixed-income market indices rallied.
Falling U.S. Treasury yields during the fourth quarter of 2018 into 2019 and positive supply/ demand dynamics helped to support municipal bond prices as well. The Fed’s pivot increased the appeal of longer-duration fixed-income assets. [Duration is a measure of an investment’s sensitivity to interest rates.] Additionally, with the Tax Cuts and Jobs Act of 2017 capping the deductibility of state and local taxes at $10,000 per year, many Americans faced higher taxes for 2018. As a result, municipal bonds saw record inflows year to date through May 31, 2019, as investors sought their tax-free income and perceived lower volatility. On the other hand, the supply of municipal bonds has
|
| New York Tax Exempt Income Fund 5 |

Allocations are shown as a percentage of the fund’s net assets as of 5/31/19. Cash and net other assets, if any, represent the market value weights of cash, derivatives, short-term securities, and other unclassified assets in the portfolio. Summary information may differ from the information in the portfolio schedule notes included in the financial statements due to the inclusion of derivative securities, any interest accruals, the timing of matured security transactions, the use of different classifications of securities for presentation purposes, and rounding. Holdings and allocations may vary over time.

Credit qualities are shown as a percentage of the fund’s net assets as of 5/31/19. A bond rated BBB or higher (SP-3 or higher, for short-term debt) is considered investment grade. This chart reflects the highest security rating provided by one or more of Standard & Poor’s, Moody’s, and Fitch. Ratings may vary over time.
Cash and net other assets, if any, represent the market value weights of cash, derivatives, and short-term securities in the portfolio. The fund itself has not been rated by an independent rating agency.
|
| 6 New York Tax Exempt Income Fund |
underwhelmed year to date and was just 2.8% higher than the relatively low pace during the same period in 2018. The combination of record demand and relatively low supply helped to push municipal bond valuations to multi-year highs by the end of the period.
With investors positioning for a period of easing monetary policy, the municipal bond yield curve flattened during the period. The flattening was the result of increased demand for longer-maturity bonds, which pushed their prices higher and yields lower. Consequently, intermediate- and long-term municipals outperformed intermediate- and long-term Treasuries, as well as short-term municipals. From a credit-quality perspective, lower investment-grade municipals outperformed more highly rated bonds and lower-rated, high-yield municipals for the period.
How did the fund perform during the reporting period?
For the six months ended May 31, 2019, the fund was closely in line with the Bloomberg Barclays Municipal Bond Index [the fund’s benchmark] but underperformed the average return of its Lipper peer group, New York Municipal Debt Funds. After the strong performance of longer-maturity holdings during the first half of the period, we trimmed our exposure. The market continued to rally through the end of the period, and the fund lagged its benchmark and Lipper peer group average as a result.
How did the changing rate environment affect your strategy?
The flattening of the municipal yield curve and what we viewed as relatively rich valuations made us slightly more cautious in our positioning. That said, in our view, stable credit fundamentals and supply/demand technicals remained supportive of the asset class at period-end.
Given the changing landscape, we moved the fund to more of a defensive position in the final weeks of the period by reducing our yield curve exposure. The fund’s yield curve positioning continued to reflect a bulleted portfolio structure focused on longer intermediate-term maturities but to a lesser degree than at thebeginning of the period. That said, the fund still held an overweight position in bonds with longer intermediate maturities and an underweight exposure to long maturity holdings compared with the fund’s benchmark. With the municipal yield curve flat by historical standards, we reduced the fund’s exposure to long maturity bonds and redeployed the proceeds into shorter and intermediate maturity bonds. In our opinion, these bonds have a more favorable risk/return profile.
With municipal credit fundamentals stable, credit spreads remained at or near post-2008-crisis lows during the period. The fund held an overweight exposure to higher-quality bonds rated A and BBB relative to the fund’s Lipper peer group. We continued to look for what we viewed as attractively priced opportunities to move higher up the credit-quality spectrum. From a sector positioning perspective, we favored higher-education and essential service utility bonds relative to the fund’s Lipper peer group.
In February 2019, Puerto Rico reached an important milestone in its planned financial recovery. Federal bankruptcy Judge Laura Taylor Swain formally approved a major debt restructuring plan for Puerto Rico’s sales tax bonds known as “COFINA.” The restructured bonds were downsized — to about $12 billion — into one new single lien security. The ruling brings clarity, and the bond restructuring is a positive step in helping resolve Puerto Rico’s debt crisis, we believe. However, we remain cautious due to the Commonwealth’s uncertain economic recovery and a perceived lack of institutional credibility across Puerto Rico’s government. The fund remained underweight in its exposure to Puerto Rico’s municipal bonds during the period compared with its Lipper peer group.
|
| New York Tax Exempt Income Fund 7 |
What is your outlook for interest rates and the municipal bond market?
Given the prevailing crosscurrents at period-end, we believe the Fed will cut its benchmark federal funds rate twice during the second half of 2019 and possibly again in early 2020 if market conditions warrant it. The markets are pricing in even more accommodation over this time period. Historically, when the market anticipates interest-rate reductions, the Fed has followed through. In our view, the central bank will interpret continued softening in U.S. growth as further proof that lower inflation is not transitory. Should the Fed choose not to act, we believe increased volatility in higher-risk assets could push them to cut rates.
On the subject of risks, although unfunded pension liabilities remain a concern for some municipalities, defaults for investment-grade municipal bonds have been rare and remain relatively low for non-investment-grade municipal bonds. The asset class also has demonstrated a low correlation to equities in recent years, suggesting that they could help play a defensive role in a diversified investment portfolio during periods of equity market volatility.
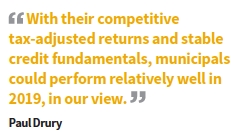
With their competitive tax-adjusted returns and stable credit fundamentals, municipals could perform relatively well in 2019, in our view. We’ll continue to monitor the market on a daily basis to capture opportunities that arise from supply and/or demand imbalances. We’ll also continue to adjust the portfolio to reflect the team’s best ideas to enhance income as well as total return prospects in an evolving interest-rate environment.
Thank you, Paul, for your time and insights today.
The views expressed in this report are exclusively those of Putnam Management and are subject to change. They are not meant as investment advice.
Please note that the holdings discussed in this report may not have been held by the fund for the entire period. Portfolio composition is subject to review in accordance with the fund’s investment strategy and may vary in the future. Current and future portfolio holdings are subject to risk. Statements in the Q&A concerning the fund’s performance or portfolio composition relative to those of the fund’s Lipper peer group may reference information produced by Lipper Inc. or through a third party.
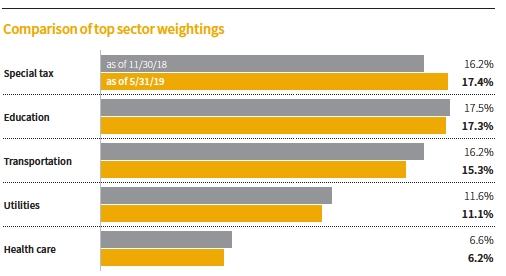
This chart shows how the fund’s top weightings have changed over the past six months. Allocations are shown as a percentage of the fund’s net assets. Current period summary information may differ from the information in the portfolio schedule notes included in the financial statements due to the inclusion of derivative securities, any interest accruals, the timing of matured security transactions, the use of different classifications of securities for presentation purposes, and rounding. Holdings and allocations may vary over time.
|
| 8 New York Tax Exempt Income Fund |
Your fund’s performance
This section shows your fund’s performance, price, and distribution information for periods ended May 31, 2019, the end of the first half of its current fiscal year. In accordance with regulatory requirements for mutual funds, we also include performance information as of the most recent calendar quarter-end and expense information taken from the fund’s current prospectus. Performance should always be considered in light of a fund’s investment strategy. Data represent past performance. Past performance does not guarantee future results. More recent returns may be less or more than those shown. Investment return and principal value will fluctuate, and you may have a gain or a loss when you sell your shares. Performance information does not reflect any deduction for taxes a shareholder may owe on fund distributions or on the redemption of fund shares. For the most recent month-end performance, please visit the Individual Investors section at putnam.com or call Putnam at 1-800-225-1581. Class R6 and Y shares are not available to all investors. See the Terms and definitions section in this report for definitions of the share classes offered by your fund.
Fund performanceTotal return for periods ended 5/31/19
| | | | | | | | | |
| | Annual | | | | | | | | |
| | average | | Annual | | Annual | | Annual | | |
| | (life of fund) | 10 years | average | 5 years | average | 3 years | average | 1 year | 6 months |
| Class A(9/2/83) | | | | | | | | | |
| Before sales charge | 6.19% | 52.40% | 4.30% | 17.80% | 3.33% | 7.78% | 2.53% | 5.68% | 5.94% |
| After sales charge | 6.07 | 46.30 | 3.88 | 13.09 | 2.49 | 3.47 | 1.14 | 1.46 | 1.70 |
| Class B(1/4/93) | | | | | | | | | |
| Before CDSC | 5.99 | 44.80 | 3.77 | 14.18 | 2.69 | 5.78 | 1.89 | 5.03 | 5.62 |
| After CDSC | 5.99 | 44.80 | 3.77 | 12.18 | 2.33 | 2.82 | 0.93 | 0.03 | 0.62 |
| Class C(7/26/99) | | | | | | | | | |
| Before CDSC | 5.95 | 40.95 | 3.49 | 13.42 | 2.55 | 5.41 | 1.77 | 4.86 | 5.53 |
| After CDSC | 5.95 | 40.95 | 3.49 | 13.42 | 2.55 | 5.41 | 1.77 | 3.86 | 4.53 |
| Class M(4/10/95) | | | | | | | | | |
| Before sales charge | 5.82 | 48.12 | 4.01 | 16.27 | 3.06 | 6.98 | 2.28 | 5.38 | 5.79 |
| After sales charge | 5.72 | 43.31 | 3.66 | 12.49 | 2.38 | 3.51 | 1.16 | 1.95 | 2.35 |
| Class R6(5/22/18) | | | | | | | | | |
| Net asset value | 6.26 | 55.54 | 4.52 | 19.07 | 3.55 | 8.47 | 2.75 | 5.80 | 6.06 |
| Class Y(1/2/08) | | | | | | | | | |
| Net asset value | 6.26 | 55.57 | 4.52 | 19.10 | 3.56 | 8.49 | 2.75 | 5.79 | 6.06 |
Current performance may be lower or higher than the quoted past performance, which cannot guarantee future results. After-sales-charge returns for class A and M shares reflect the deduction of the maximum 4.00% and 3.25% sales charge, respectively, levied at the time of purchase. Class B share returns after contingent deferred sales charge (CDSC) reflect the applicable CDSC, which is 5% in the first year, declining over time to 1% in the sixth year, and is eliminated thereafter. Class C share returns after CDSC reflect a 1% CDSC for the first year that is eliminated thereafter.Class R6 and Y shares have no initial sales charge or CDSC. Performance for class B, C, M, and Y shares before their inception is derived from the historical performance of class A shares, adjusted for the applicable sales charge (or CDSC) and the higher operating expenses for such shares, except for class Y shares, for which 12b-1 fees are not applicable. Performance for class R6 shares prior to their inception is derived from the historical performance of class Y shares and has not been adjusted for the lower investor servicing fees applicable to class R6 shares; had it, returns would have been higher.
For a portion of the periods, the fund had expense limitations, without which returns would have been lower.
Class B share performance reflects conversion to class A shares after eight years.
Class C share performance reflects conversion to class A shares after 10 years.
|
| New York Tax Exempt Income Fund 9 |
Comparative index returnsFor periods ended 5/31/19
| | | | | | | | | |
| | Annual | | | | | | | | |
| | average | | Annual | | Annual | | Annual | | |
| | (life of fund) | 10 years | average | 5 years | average | 3 years | average | 1 year | 6 months |
| Bloomberg Barclays | | | | | | | | | |
| Municipal Bond Index | 6.63% | 56.53% | 4.58% | 19.25% | 3.58% | 9.16% | 2.96% | 6.40% | 5.96% |
| Lipper New York | | | | | | | | | |
| Municipal Debt Funds | 6.03 | 54.33 | 4.39 | 18.50 | 3.44 | 8.21 | 2.65 | 5.88 | 6.07 |
| category average* | | | | | | | | | |
Index and Lipper results should be compared with fund performance before sales charge, before CDSC, or at net asset value.
*Over the 6-month, 1-year, 3-year, 5-year, 10-year, and life-of-fund periods ended 5/31/19, there were 94, 92, 84, 83, 61, and 3 funds, respectively, in this Lipper category.
Fund price and distribution informationFor the six-month period ended 5/31/19
| | | | | | | | |
| Distributions | Class A | Class B | Class C | Class M | Class R6 | Class Y |
| Number | 6 | 6 | 6 | 6 | 6 | 6 |
| Income1 | $0.117447 | $0.090834 | $0.084601 | $0.105698 | $0.127028 | $0.126713 |
| Capital gains2 | — | — | — | — | — | — |
| Total | $0.117447 | $0.090834 | $0.084601 | $0.105698 | $0.127028 | $0.126713 |
| | Before | After | Net | Net | Before | After | Net | Net |
| | sales | sales | asset | asset | sales | sales | asset | asset |
| Share value | charge | charge | value | value | charge | charge | value | value |
| 11/30/18 | $8.26 | $8.60 | $8.24 | $8.26 | $8.27 | $8.55 | $8.26 | $8.26 |
| 5/31/19 | 8.63 | 8.99 | 8.61 | 8.63 | 8.64 | 8.93 | 8.63 | 8.63 |
| | Before | After | Net | Net | Before | After | Net | Net |
| Current rate | sales | sales | asset | asset | sales | sales | asset | asset |
| (end of period) | charge | charge | value | value | charge | charge | value | value |
| Current dividend rate3 | 2.52% | 2.42% | 1.89% | 1.74% | 2.24% | 2.16% | 2.75% | 2.74% |
| Taxable equivalent4(a) | 5.00 | 4.80 | 3.75 | 3.45 | 4.45 | 4.29 | 5.46 | 5.44 |
| Taxable equivalent4(b) | 5.42 | 5.20 | 4.06 | 3.74 | 4.82 | 4.65 | 5.91 | 5.89 |
| Current 30-day | | | | | | | | |
| SEC yield5 | N/A | 1.61 | 1.06 | 0.91 | N/A | 1.35 | 1.88 | 1.91 |
| Taxable equivalent4(a) | N/A | 3.20 | 2.10 | 1.81 | N/A | 2.68 | 3.73 | 3.79 |
| Taxable equivalent4(b) | N/A | 3.46 | 2.28 | 1.96 | N/A | 2.90 | 4.04 | 4.11 |
The classification of distributions, if any, is an estimate. Before-sales-charge share value and current dividend rate for class A and M shares, if applicable, do not take into account any sales charge levied at the time of purchase. After-sales-charge share value, current dividend rate, and current 30-day SEC yield, if applicable, are calculated assuming that the maximum sales charge (4.00% for class A shares and 3.25% for class M shares) was levied at the time of purchase. Final distribution information will appear on your year-end tax forms.
1For some investors, investment income may be subject to the federal alternative minimum tax.
2Capital gains, if any, are taxable for federal and, in most cases, state purposes.
3Most recent distribution, including any return of capital and excluding capital gains, annualized and divided by share price before or after sales charge at period-end.
4Assumes (a) maximum 49.62% federal and state combined tax rate for 2019 or (b) maximum 53.50% federal, New York State, and New York City combined tax rate for 2019. Results for investors subject to lower tax rates would not be as advantageous.
5Based only on investment income and calculated using the maximum offering price for each share class, in accordance with SEC guidelines.
| |
| 10 New York Tax Exempt Income Fund |
Fund performance as of most recent calendar quarterTotal return for periods ended 6/30/19
| | | | | | | | | |
| | Annual | | | | | | | | |
| | average | | Annual | | Annual | | Annual | | |
| | (life of fund) | 10 years | average | 5 years | average | 3 years | average | 1 year | 6 months |
| Class A(9/2/83) | | | | | | | | | |
| Before sales charge | 6.19% | 54.04% | 4.41% | 18.07% | 3.38% | 6.51% | 2.12% | 5.87% | 5.12% |
| After sales charge | 6.06 | 47.88 | 3.99 | 13.35 | 2.54 | 2.25 | 0.74 | 1.64 | 0.91 |
| Class B(1/4/93) | | | | | | | | | |
| Before CDSC | 5.98 | 46.53 | 3.89 | 14.45 | 2.74 | 4.53 | 1.49 | 5.22 | 4.80 |
| After CDSC | 5.98 | 46.53 | 3.89 | 12.45 | 2.37 | 1.60 | 0.53 | 0.22 | –0.20 |
| Class C(7/26/99) | | | | | | | | | |
| Before CDSC | 5.95 | 42.48 | 3.60 | 13.70 | 2.60 | 4.05 | 1.33 | 5.18 | 4.72 |
| After CDSC | 5.95 | 42.48 | 3.60 | 13.70 | 2.60 | 4.05 | 1.33 | 4.18 | 3.72 |
| Class M(4/10/95) | | | | | | | | | |
| Before sales charge | 5.81 | 49.90 | 4.13 | 16.54 | 3.11 | 5.60 | 1.83 | 5.57 | 4.97 |
| After sales charge | 5.71 | 45.03 | 3.79 | 12.75 | 2.43 | 2.17 | 0.72 | 2.14 | 1.56 |
| Class R6(5/22/18) | | | | | | | | | |
| Net asset value | 6.26 | 57.59 | 4.65 | 19.48 | 3.62 | 7.31 | 2.38 | 6.23 | 5.36 |
| Class Y(1/2/08) | | | | | | | | | |
| Net asset value | 6.26 | 57.44 | 4.64 | 19.37 | 3.60 | 7.21 | 2.35 | 6.10 | 5.23 |
See the discussion following the fund performance table on page 9 for information about the calculation of fund performance.
Your fund’s expenses
As a mutual fund investor, you pay ongoing expenses, such as management fees, distribution fees (12b-1 fees), and other expenses. Using the following information, you can estimate how these expenses affect your investment and compare them with the expenses of other funds. You may also pay one-time transaction expenses, including sales charges (loads) and redemption fees, which are not shown in this section and would have resulted in higher total expenses. For more information, see your fund’s prospectus or talk to your financial representative.
Expense ratios
| | | | | | |
| | Class A | Class B | Class C | Class M | Class R6 | Class Y |
| Total annual operating expenses for the | | | | | | |
| fiscal year ended 11/30/18 | 0.75% | 1.38% | 1.53% | 1.03% | 0.52%* | 0.53% |
| Annualized expense ratio for the | | | | | | |
| six-month period ended 5/31/19 | 0.75% | 1.38% | 1.53% | 1.03% | 0.52% | 0.53% |
Fiscal-year expense information in this table is taken from the most recent prospectus, is subject to change, and may differ from that shown for the annualized expense ratio and in the financial highlights of this report.
Expenses are shown as a percentage of average net assets.
*Other expenses for class R6 shares have been annualized.
|
| New York Tax Exempt Income Fund 11 |
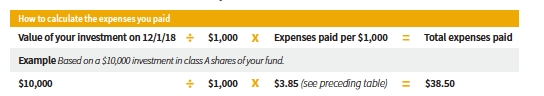
Expenses per $1,000
The following table shows the expenses you would have paid on a $1,000 investment in each class of the fund from 12/1/18 to 5/31/19. It also shows how much a $1,000 investment would be worth at the close of the period, assumingactual returnsand expenses.
| | | | | | |
| | Class A | Class B | Class C | Class M | Class R6 | Class Y |
| Expenses paid per $1,000*† | $3.85 | $7.07 | $7.84 | $5.28 | $2.67 | $2.72 |
| Ending value (after expenses) | $1,059.40 | $1,056.20 | $1,055.30 | $1,057.90 | $1,060.60 | $1,060.60 |
*Expenses for each share class are calculated using the fund’s annualized expense ratio for each class, which represents the ongoing expenses as a percentage of average net assets for the six months ended 5/31/19. The expense ratio may differ for each share class.
†Expenses are calculated by multiplying the expense ratio by the average account value for the period; then multiplying the result by the number of days in the period; and then dividing that result by the number of days in the year.
Estimate the expenses you paid
To estimate the ongoing expenses you paid for the six months ended 5/31/19, use the following calculation method. To find the value of your investment on 12/1/18, call Putnam at 1-800-225-1581.
Compare expenses using the SEC’s method
The Securities and Exchange Commission (SEC) has established guidelines to help investors assess fund expenses. Per these guidelines, the following table shows your fund’s expenses based on a $1,000 investment, assuming ahypothetical 5% annualized return. You can use this information to compare the ongoing expenses (but not transaction expenses or total costs) of investing in the fund with those of other funds. All mutual fund shareholder reports will provide this information to help you make this comparison. Please note that you cannot use this information to estimate your actual ending account balance and expenses paid during the period.
| | | | | | |
| | Class A | Class B | Class C | Class M | Class R6 | Class Y |
| Expenses paid per $1,000*† | $3.78 | $6.94 | $7.70 | $5.19 | $2.62 | $2.67 |
| Ending value (after expenses) | $1,021.19 | $1,018.05 | $1,017.30 | $1,019.80 | $1,022.34 | $1,022.29 |
*Expenses for each share class are calculated using the fund’s annualized expense ratio for each class, which represents the ongoing expenses as a percentage of average net assets for the six months ended 5/31/19. The expense ratio may differ for each share class.
†Expenses are calculated by multiplying the expense ratio by the average account value for the six-month period; then multiplying the result by the number of days in the six-month period; and then dividing that result by the number of days in the year.
| |
| 12 New York Tax Exempt Income Fund |
Consider these risks before investing
The value of investments in the fund’s portfolio may fall or fail to rise over extended periods of time for a variety of reasons, including general economic, political or financial market conditions, investor sentiment and market perceptions, government actions, geopolitical events or changes, and factors related to a specific issuer, geography, industry or sector. These and other factors may lead to increased volatility and reduced liquidity in the fund’s portfolio holdings. The fund’s performance will be closely tied to the economic and political conditions in New York State, and can be more volatile than the performance of a more geographically diversified fund. Capital gains, if any, are taxed at the federal and, in most cases, state levels. For some investors, investment income may be subject to the federal alternative minimum tax. Bond investments are subject to interest-rate risk (the risk of bond prices falling if interest rates rise) and credit risk (the risk of an issuer defaulting on interest or principal payments). Interest-rate risk is generally greater for longer-term bonds, and credit risk is generally greater for below-investment-grade bonds. Unlike bonds, funds that invest in bonds have fees and expenses. Tax-exempt bonds may be issued under the Internal Revenue Code only by limited types of issuers for limited types of projects. As a result, the fund’s investments may be focused in certain market segments and be more vulnerable to fluctuations in the values of the securities it holds than a more broadly invested fund. Interest the fund receives might be taxable. You can lose money by investing in the fund.
|
| New York Tax Exempt Income Fund 13 |
Terms and definitions
Important terms
Total returnshows how the value of the fund’s shares changed over time, assuming you held the shares through the entire period and reinvested all distributions in the fund.
Before sales charge, or net asset value, is the price, or value, of one share of a mutual fund, without a sales charge. Before-sales-charge figures fluctuate with market conditions, and are calculated by dividing the net assets of each class of shares by the number of outstanding shares in the class.
After sales chargeis the price of a mutual fund share plus the maximum sales charge levied at the time of purchase. After-sales-charge performance figures shown here assume the 4.00% maximum sales charge for class A shares and 3.25% for class M shares.
Contingent deferred sales charge (CDSC)is generally a charge applied at the time of the redemption of class B or C shares and assumes redemption at the end of the period. Your fund’s class B CDSC declines over time from a 5% maximum during the first year to 1% during the sixth year. After the sixth year, the CDSC no longer applies. The CDSC for class C shares is 1% for one year after purchase.
Share classes
Class A sharesare generally subject to an initial sales charge and no CDSC (except on certain redemptions of shares bought without an initial sales charge).
Class B sharesare closed to new investments and are only available by exchange from another Putnam fund or through dividend and/ or capital gains reinvestment. They are not subject to an initial sales charge and may be subject to a CDSC.
Class C sharesare not subject to an initial sales charge and are subject to a CDSC only if the shares are redeemed during the first year.
Class M shareshave a lower initial sales charge and a higher 12b-1 fee than class A shares and no CDSC.
Class R6 sharesare not subject to an initial sales charge or CDSC and carry no 12b-1 fee. They are generally only available to employer-sponsored retirement plans, corporate and institutional clients, and clients in other approved programs.
Class Y sharesare not subject to an initial sales charge or CDSC and carry no 12b-1 fee. They are generally only available to corporate and institutional clients and clients in other approved programs.
Fixed-income terms
Current rateis the annual rate of return earned from dividends or interest of an investment. Current rate is expressed as a percentage of the price of a security, fund share, or principal investment.
Yield curveis a graph that plots the yields of bonds with equal credit quality against their differing maturity dates, ranging from shortest to longest. It is used as a benchmark for other debt, such as mortgage or bank lending rates.
Comparative indexes
Bloomberg Barclays Municipal Bond Indexis an unmanaged index of long-term fixed-rate investment-grade tax-exempt bonds.
Bloomberg Barclays U.S. Aggregate Bond Indexis an unmanaged index of U.S. investment-grade fixed-income securities.
ICE BofAML (Intercontinental Exchange Bank of America Merrill Lynch) U.S. 3-Month Treasury Bill Indexis an unmanaged index that seeks to measure the performance of U.S.Treasury bills available in the marketplace.
S&P 500 Indexis an unmanaged index of common stock performance.
| |
| 14 New York Tax Exempt Income Fund |
Indexes assume reinvestment of all distributions and do not account for fees. Securities and performance of a fund and an index will differ. You cannot invest directly in an index.
ICE Data Indices, LLC (“ICE BofAML”), used with permission. ICE BofAML permits use of the ICE BofAML indices and related data on an “as is” basis; makes no warranties regarding same; does not guarantee the suitability, quality, accuracy, timeliness, and/or completeness of the ICE BofAML indices or any data included in, related to, or derived therefrom; assumes no liability in connection with the use of the foregoing; and does not sponsor, endorse, or recommend Putnam Investments, or any of its products or services.
Lipperis a third-party industry-ranking entity that ranks mutual funds. Its rankings do not reflect sales charges. Lipper rankings are based on total return at net asset value relative to other funds that have similar current investment styles or objectives as determined by Lipper. Lipper may change a fund’s category assignment at its discretion. Lipper category averages reflect performance trends for funds within a category.
Other information for shareholders
Important notice regarding delivery of shareholder documents
In accordance with Securities and Exchange Commission (SEC) regulations, Putnam sends a single copy of annual and semiannual shareholder reports, prospectuses, and proxy statements to Putnam shareholders who share the same address, unless a shareholder requests otherwise. If you prefer to receive your own copy of these documents, please call Putnam at 1-800-225-1581, and Putnam will begin sending individual copies within 30 days.
Proxy voting
Putnam is committed to managing our mutual funds in the best interests of our shareholders. The Putnam funds’ proxy voting guidelines and procedures, as well as information regarding how your fund voted proxies relating to portfolio securities during the 12-month period ended June 30, 2018, are available in the Individual Investors section of putnam.com and on the SEC’s website, www.sec.gov. If you have questions about finding forms on the SEC’s website, you may call the SEC at 1-800-SEC-0330. You may also obtain the Putnam funds’ proxy voting guidelines andprocedures at no charge by calling Putnam’s Shareholder Services at 1-800-225-1581.
Fund portfolio holdings
The fund will file a complete schedule of its portfolio holdings with the SEC for the first and third quarters of each fiscal year on Form N-PORT within 60 days of the end of such fiscal quarter. Shareholders may obtain the fund’s Form N-PORT on the SEC’s website at www.sec.gov.
Prior to its use of Form N-PORT, the fund filed its complete schedule of its portfolio holdings with the SEC on Form N-Q, which is available online at www.sec.gov.
Trustee and employee fund ownership
Putnam employees and members of the Board of Trustees place their faith, confidence, and, most importantly, investment dollars in Putnam mutual funds. As of May 31, 2019, Putnam employees had approximately $488,000,000 and the Trustees had approximately $69,000,000 invested in Putnam mutual funds. These amounts include investments by the Trustees’ and employees’ immediate family members as well as investments through retirement and deferred compensation plans.
|
| New York Tax Exempt Income Fund 15 |
Financial statements
These sections of the report, as well as the accompanying Notes, constitute the fund’s financial statements.
The fund’s portfoliolists all the fund’s investments and their values as of the last day of the reporting period. Holdings are organized by asset type and industry sector, country, or state to show areas of concentration and diversification.
Statement of assets and liabilitiesshows how the fund’s net assets and share price are determined. All investment and non-investment assets are added together. Any unpaid expenses and other liabilities are subtracted from this total. The result is divided by the number of shares to determine the net asset value per share, which is calculated separately for each class of shares. (For funds with preferred shares, the amount subtracted from total assets includes the liquidation preference of preferred shares.)
Statement of operationsshows the fund’s net investment gain or loss. This is done by first adding up all the fund’s earnings — from dividends and interest income — and subtracting its operating expenses to determine net investment income (or loss). Then, any net gain or loss the fund realized on the sales of its holdings — as well as any unrealized gains or losses over the period — is added toor subtracted from the net investment result to determine the fund’s net gain or loss for the fiscal period.
Statement of changes in net assetsshows how the fund’s net assets were affected by the fund’s net investment gain or loss, by distributions to shareholders, and by changes in the number of the fund’s shares. It lists distributions and their sources (net investment income or realized capital gains) over the current reporting period and the most recent fiscal year-end. The distributions listed here may not match the sources listed in the Statement of operations because the distributions are determined on a tax basis and may be paid in a different period from the one in which they were earned. Dividend sources are estimated at the time of declaration. Actual results may vary. Any non-taxable return of capital cannot be determined until final tax calculations are completed after the end of the fund’s fiscal year.
Financial highlightsprovide an overview of the fund’s investment results, per-share distributions, expense ratios, net investment income ratios, and portfolio turnover in one summary table, reflecting the five most recent reporting periods. In a semiannual report, the highlights table also includes the current reporting period.
| |
| 16 New York Tax Exempt Income Fund |
| |
| The fund’s portfolio5/31/19 (Unaudited) | |
| |
| Key to holding’s abbreviations | |
| | |
| AGCAssured Guaranty Corp. | G.O. BondsGeneral Obligation Bonds |
| AGMAssured Guaranty Municipal Corporation | NATLNational Public Finance Guarantee Corp. |
| AMBACAMBAC Indemnity Corporation | OTCOver-the-counter |
| BAMBuild America Mutual | U.S. Govt. Coll.U.S. Government Collateralized |
| COPCertificates of Participation | VRDNVariable Rate Demand Notes, which are floating- |
| FCSFarm Credit System | rate securities with long-term maturities that carry |
| FHL Banks Coll.Federal Home Loan Banks | coupons that reset and are payable upon demand |
| System Collateralized | either daily, weekly or monthly. The rate shown is the |
| FHLMC Coll.Federal Home Loan Mortgage | current interest rate at the close of the reporting |
| Corporation Collateralized | period. Rates are set by remarketing agents and may |
| FNMA Coll.Federal National Mortgage | take into consideration market supply and demand, |
| Association Collateralized | credit quality and the current SIFMA Municipal Swap |
| Index rate, which was 1.42% as of the close of the |
| | reporting period. |
| | | |
| MUNICIPAL BONDS AND NOTES (98.8%)* | Rating** | Principal amount | Value |
| Guam (0.8%) | | | |
| Territory of GU, Dept. of Ed. COP, (John F. Kennedy | | | |
| High School), Ser. A, 6.875%, 12/1/40 | B+ | $500,000 | $515,905 |
| Territory of GU, Govt. Ltd. Oblig. Rev. | | | |
| Bonds, (Section 30), Ser. A, 5.625%, 12/1/29 | | | |
| (Prerefunded 12/1/19) | AAA/P | 3,000,000 | 3,063,090 |
| Territory of GU, Govt. Wtr. Wks. Auth. Wtr. & | | | |
| Waste Wtr. Syst. Rev. Bonds, 5.625%, 7/1/40 | | | |
| (Prerefunded 7/1/20) | A– | 2,100,000 | 2,193,156 |
| Territory of GU, Pwr. Auth. Rev. Bonds, Ser. A | | | |
| U.S. Govt. Coll., 5.50%, 10/1/40 | | | |
| (Prerefunded 10/1/20) | Baa2 | 1,300,000 | 1,368,822 |
| 5.00%, 10/1/34 | Baa2 | 700,000 | 746,403 |
| | | | 7,887,376 |
| Massachusetts (0.6%) | | | |
| MA State Trans. Fund Rev. Bonds, Ser. A, | | | |
| 5.00%, 6/1/43 | Aa1 | 5,000,000 | 5,988,650 |
| | | | 5,988,650 |
| New York (95.8%) | | | |
| Albany, Cap. Resource Corp. Rev. Bonds | | | |
| (St. Peter’s Hosp.), U.S. Govt. Coll., 6.25%, | | | |
| 11/15/38 (Prerefunded 11/15/20) | AAA/P | 4,110,000 | 4,394,535 |
| (Albany College of Pharmacy & Hlth. Sciences), | | | |
| 5.00%, 12/1/33 | BBB+ | 325,000 | 366,779 |
| (Albany College of Pharmacy & Hlth. Sciences), | | | |
| 5.00%, 12/1/32 | BBB+ | 495,000 | 559,340 |
| (Empire Commons Student Hsg., Inc.), | | | |
| 5.00%, 5/1/31 | A | 700,000 | 837,277 |
| (Albany College of Pharmacy & Hlth. Sciences), | | | |
| 5.00%, 12/1/30 | BBB+ | 250,000 | 285,230 |
| (Empire Commons Student Hsg., Inc.), | | | |
| 5.00%, 5/1/30 | A | 350,000 | 420,466 |
| Brookhaven, Local Dev. Corp. Rev. Bonds, | | | |
| (Jeffersons Ferry), 5.25%, 11/1/36 | BBB+/F | 1,200,000 | 1,382,808 |
|
| New York Tax Exempt Income Fund 17 |
| | | |
| MUNICIPAL BONDS AND NOTES (98.8%)*cont. | Rating** | Principal amount | Value |
| New Yorkcont. | | | |
| Buffalo & Erie Cnty., Indl. Land Dev. Corp. Rev. Bonds | | | |
| (Catholic Hlth. Syst. Oblig. Group), 5.25%, 7/1/35 | Baa1 | $1,000,000 | $1,165,270 |
| (Orchard Park), 5.00%, 11/15/37 | BBB–/F | 4,470,000 | 4,832,472 |
| (Charter School for Applied Tech.), Ser. A, | | | |
| 5.00%, 6/1/35 | BBB– | 2,000,000 | 2,191,220 |
| (Orchard Park), 5.00%, 11/15/30 | BBB–/F | 500,000 | 552,045 |
| Buffalo & Fort Erie, Pub. Bridge Auth. Rev. Bonds | | | |
| 5.00%, 1/1/42 | A+ | 2,250,000 | 2,615,040 |
| (Toll Bridge Syst.), 5.00%, 1/1/25 | A+ | 400,000 | 470,720 |
| (Toll Bridge Syst.), 5.00%, 1/1/24 | A+ | 250,000 | 287,290 |
| Build NY City Resource Corp. Rev. Bonds | | | |
| (Manhattan College), 5.00%, 8/1/47 | A– | 1,000,000 | 1,165,910 |
| (YMCA of Greater NY), 5.00%, 8/1/40 | A– | 2,050,000 | 2,320,026 |
| 5.00%, 7/1/40 | A+ | 3,175,000 | 3,647,853 |
| (Q Student Residences, LLC), Ser. A, 5.00%, 6/1/38 | Aa2 | 2,850,000 | 3,241,391 |
| (South Bronx Charter School for Intl. Cultures & | | | |
| the Arts), Ser. A, 5.00%, 4/15/33 | BB+ | 2,000,000 | 2,095,660 |
| (Bronx Charter School for Excellence), Ser. A, | | | |
| 5.00%, 4/1/33 | BBB– | 500,000 | 535,865 |
| (YMCA of Greater NY), 5.00%, 8/1/32 | A– | 1,740,000 | 1,873,336 |
| Build NY City Resource Corp. 144A Rev. Bonds, | | | |
| (Inwood Academy Leadership Charter School), | | | |
| Ser. A, 5.125%, 5/1/38 | BB/P | 1,100,000 | 1,152,426 |
| Build NY City Resource Corp. Solid Waste Disp. 144A | | | |
| Rev. Bonds, (Pratt Paper NY, Inc.), 5.00%, 1/1/35 | B+/P | 1,750,000 | 1,910,125 |
| Dutchess Cnty., Local Dev. Corp. Rev. Bonds | | | |
| (Anderson Ctr. Svcs., Inc.), 6.00%, 10/1/30 | BB+ | 3,160,000 | 3,231,100 |
| (Culinary Inst. of America (The)), 5.00%, 7/1/32 | Baa2 | 300,000 | 348,798 |
| Erie Cnty., Fiscal Stability Auth. Rev. Bonds, | | | |
| (Sales Tax & State Aid), Ser. D | | | |
| 5.00%, 9/1/39 | Aa1 | 515,000 | 618,870 |
| 5.00%, 9/1/38 | Aa1 | 1,500,000 | 1,806,585 |
| 5.00%, 9/1/37 | Aa1 | 1,000,000 | 1,207,270 |
| 5.00%, 9/1/36 | Aa1 | 1,500,000 | 1,816,515 |
| 5.00%, 9/1/35 | Aa1 | 1,250,000 | 1,519,350 |
| Geneva, Dev. Corp. Rev. Bonds, (Hobart & William | | | |
| Smith Colleges) | | | |
| 5.25%, 9/1/44 | A | 2,000,000 | 2,262,840 |
| 5.00%, 9/1/32 | A | 2,000,000 | 2,198,900 |
| Glen Cove, Local Econ. Assistance Corp. Rev. Bonds, | | | |
| (Garvies Point Pub. Impt.), Ser. C, stepped-coupon | | | |
| zero% (5.625%, 1/1/24), 1/1/55 †† | B/P | 600,000 | 548,622 |
| Hempstead Town, Local Dev. Corp. Rev. Bonds | | | |
| (Adelphi U.), Ser. B, 5.25%, 2/1/39 | A– | 1,500,000 | 1,500,000 |
| (Molloy College), 5.00%, 7/1/48 | BBB | 1,000,000 | 1,156,620 |
| (Hofstra U.), 5.00%, 7/1/47 | A2 | 1,000,000 | 1,171,640 |
| (Molloy College), 5.00%, 7/1/44 | BBB | 2,300,000 | 2,516,085 |
| (Molloy College), 5.00%, 7/1/43 | BBB | 1,025,000 | 1,188,395 |
| (Hofstra U.), 5.00%, 7/1/42 | A2 | 1,200,000 | 1,403,496 |
| (Molloy College), 5.00%, 7/1/38 | BBB | 865,000 | 1,010,415 |
| |
| 18 New York Tax Exempt Income Fund |
| | | |
| MUNICIPAL BONDS AND NOTES (98.8%)*cont. | Rating** | Principal amount | Value |
| New Yorkcont. | | | |
| Hempstead Town, Local Dev. Corp. Rev. Bonds | | | |
| (Molloy College), 5.00%, 7/1/38 | BBB | $480,000 | $552,792 |
| (Molloy College), 5.00%, 7/1/37 | BBB | 315,000 | 363,623 |
| (Adelphi U.), 5.00%, 2/1/34 | A– | 200,000 | 243,040 |
| (Adelphi U.), Ser. B, 5.00%, 2/1/34 | A– | 3,000,000 | 3,000,000 |
| (Adelphi U.), 5.00%, 2/1/33 | A– | 205,000 | 250,262 |
| (Adelphi U.), 5.00%, 2/1/32 | A– | 230,000 | 281,943 |
| (Adelphi U.), 5.00%, 2/1/31 | A– | 200,000 | 247,092 |
| (Adelphi U.), 5.00%, 2/1/30 | A– | 155,000 | 193,242 |
| (Hofstra U.), 5.00%, 7/1/28 | A2 | 650,000 | 693,134 |
| (Adelphi U.), 4.00%, 2/1/39 | A– | 1,000,000 | 1,103,540 |
| Hudson Yards Infrastructure Corp. Rev. Bonds, Ser. A | | | |
| 5.75%, 2/15/47 | Aa2 | 1,180,000 | 1,259,862 |
| FHLMC Coll., U.S. Govt. Coll., 5.75%, 2/15/47 | | | |
| (Prerefunded 2/15/21) | Aa2 | 1,920,000 | 2,062,925 |
| Liberty, Dev. Corp. Rev. Bonds, | | | |
| (Goldman Sachs Headquarters) | | | |
| 5.50%, 10/1/37 | A3 | 4,010,000 | 5,473,289 |
| 5.25%, 10/1/35 | A3 | 4,000,000 | 5,271,960 |
| Long Island, Pwr. Auth. Elec. Syst. Rev. Bonds | | | |
| Ser. C, AGC, 5.25%, 9/1/29 | AA | 3,835,000 | 4,944,581 |
| Ser. B, 5.00%, 9/1/46 | A3 | 2,500,000 | 2,912,575 |
| Ser. B, 5.00%, 9/1/45 | A3 | 2,000,000 | 2,290,760 |
| Ser. A, 5.00%, 9/1/44 | A3 | 8,500,000 | 9,585,705 |
| 5.00%, 9/1/42 | A3 | 2,000,000 | 2,379,380 |
| Ser. B, 5.00%, 9/1/41 | A3 | 5,250,000 | 6,149,325 |
| Ser. A, 5.00%, 9/1/39 | A3 | 8,800,000 | 9,967,056 |
| 5.00%, 9/1/37 | A3 | 1,000,000 | 1,201,430 |
| 5.00%, 9/1/36 | A3 | 1,000,000 | 1,205,150 |
| Ser. B, 5.00%, 9/1/36 | A3 | 1,500,000 | 1,775,535 |
| 5.00%, 9/1/35 | A3 | 1,000,000 | 1,208,760 |
| 5.00%, 9/1/34 | A3 | 1,000,000 | 1,214,230 |
| 5.00%, 9/1/33 | A3 | 500,000 | 609,680 |
| AGM, zero %, 6/1/28 | AA | 2,510,000 | 2,033,100 |
| Metro. Trans. Auth. Mandatory Put Bonds (11/15/19), | | | |
| Ser. D-2, 4.00%, 11/15/34 | A1 | 3,265,000 | 3,279,823 |
| Metro. Trans. Auth. Rev. Bonds | | | |
| Ser. C, 5.00%, 11/15/41 | A1 | 3,305,000 | 3,605,755 |
| Ser. D, 5.00%, 11/15/38 | A1 | 4,070,000 | 4,525,840 |
| Ser. B, 5.00%, 11/15/33 | A1 | 5,220,000 | 6,262,747 |
| Ser. D-1, 5.00%, 11/15/33 | A1 | 960,000 | 1,103,146 |
| Metro. Trans. Auth. Dedicated Tax Mandatory Put | | | |
| Bonds (6/1/22), Ser. A-2A, 1.87%, 11/1/26 | AA | 5,095,000 | 5,088,020 |
| Metro. Trans. Auth. Dedicated Tax Rev. Bonds | | | |
| Ser. A, 5.25%, 11/15/34 | AA | 5,600,000 | 6,879,936 |
| (Green Bonds), Ser. B-1, 5.00%, 11/15/36 | AA | 3,500,000 | 4,178,335 |
| (Green Bonds), Ser. B-1, 5.00%, 11/15/34 | AA | 3,500,000 | 4,207,315 |
| Monroe Cnty., Indl. Dev. Corp. Rev. Bonds | | | |
| (Rochester Gen. Hosp.), 5.00%, 12/1/46 | A– | 3,000,000 | 3,430,590 |
| (Rochester Gen. Hosp.), Ser. A, 5.00%, 12/1/37 | A– | 2,000,000 | 2,167,580 |
|
| New York Tax Exempt Income Fund 19 |
| | | |
| MUNICIPAL BONDS AND NOTES (98.8%)*cont. | Rating** | Principal amount | Value |
| New Yorkcont. | | | |
| Monroe Cnty., Indl. Dev. Corp. Rev. Bonds | | | |
| (Rochester Gen. Hosp.), 5.00%, 12/1/35 | A– | $600,000 | $701,238 |
| (U. of Rochester), Ser. A, 5.00%, 7/1/33 | Aa3 | 1,000,000 | 1,163,350 |
| (Rochester Gen. Hosp.), Ser. A, 5.00%, 12/1/32 | A– | 1,250,000 | 1,363,063 |
| (St. John Fisher College), Ser. A, 5.00%, 6/1/29 | A– | 800,000 | 910,352 |
| (U. of Rochester), Ser. C, 4.00%, 7/1/37 | Aa3 | 2,700,000 | 2,976,480 |
| (U. of Rochester), Ser. C, 4.00%, 7/1/36 | Aa3 | 850,000 | 940,746 |
| (U. of Rochester), Ser. D, 4.00%, 7/1/36 | Aa3 | 750,000 | 830,655 |
| (U. of Rochester), Ser. C, 4.00%, 7/1/35 | Aa3 | 1,000,000 | 1,111,560 |
| (U. of Rochester), Ser. D, 4.00%, 7/1/34 | Aa3 | 1,000,000 | 1,115,900 |
| (U. of Rochester), Ser. C, 4.00%, 7/1/33 | Aa3 | 1,500,000 | 1,682,250 |
| (U. of Rochester), Ser. C, 4.00%, 7/1/32 | Aa3 | 1,600,000 | 1,802,032 |
| (U. of Rochester), Ser. D, 4.00%, 7/1/32 | Aa3 | 1,000,000 | 1,126,270 |
| MTA Hudson Rail Yards Trust Oblig. Rev. Bonds, | | | |
| Ser. A, 5.00%, 11/15/51 | A2 | 9,500,000 | 10,108,285 |
| Nassau Cnty., G.O. Bonds, Ser. C, 5.00%, 10/1/31 | A+ | 5,000,000 | 6,108,900 |
| Nassau Cnty., Local Econ. Assistance | | | |
| Corp. Rev. Bonds | | | |
| (South Nassau Communities Hosp.), | | | |
| 5.00%, 7/1/37 | Baa1 | 2,050,000 | 2,201,229 |
| (Winthrop U. Hosp. Assn.), 5.00%, 7/1/37 | Baa2 | 1,000,000 | 1,070,880 |
| (Catholic Hlth. Svcs. of Long Island Oblig. Group), | | | |
| 5.00%, 7/1/33 | A– | 1,355,000 | 1,503,915 |
| (Catholic Hlth. Svcs. of Long Island Oblig. Group), | | | |
| 5.00%, 7/1/32 | A– | 1,500,000 | 1,667,910 |
| (South Nassau Communities Hosp.), | | | |
| 5.00%, 7/1/27 | Baa1 | 1,255,000 | 1,365,076 |
| Nassau Cnty., Tobacco Settlement Corp. Rev. | | | |
| Bonds, Ser. A-2, 5.25%, 6/1/26 | B– | 5,640,000 | 5,537,916 |
| New Rochelle, Corp. Local Dev. Rev. Bonds, | | | |
| (Iona College), Ser. A, 5.00%, 7/1/40 | Baa2 | 350,000 | 389,337 |
| Niagara Area Dev. Corp. Rev. Bonds, | | | |
| (Niagara U.), Ser. A | | | |
| 5.00%, 5/1/42 | BBB+ | 1,000,000 | 1,068,800 |
| 5.00%, 5/1/35 | BBB+ | 1,670,000 | 1,797,070 |
| 5.00%, 5/1/30 | BBB+ | 2,230,000 | 2,419,483 |
| Niagara Area Dev. Corp. Solid Waste Disp. Fac. | | | |
| 144A Rev. Bonds, (Covanta Holding Corp.), Ser. A, | | | |
| 4.75%, 11/1/42 | B1 | 5,000,000 | 5,160,450 |
| Niagara Falls, Rev. Bonds, Ser. A, BAM, | | | |
| 4.00%, 10/1/44 | AA | 500,000 | 526,875 |
| Niagara Frontier Trans. Auth. Rev. Bonds, | | | |
| (Buffalo Niagara Intl. Arpt.), Ser. A | | | |
| 5.00%, 4/1/39 | A3 | 1,040,000 | 1,226,888 |
| 5.00%, 4/1/37 | A3 | 1,000,000 | 1,187,260 |
| 5.00%, 4/1/35 | A3 | 200,000 | 239,146 |
| 5.00%, 4/1/28 | A3 | 2,560,000 | 2,889,139 |
| 5.00%, 4/1/27 | A3 | 875,000 | 990,500 |
| 5.00%, 4/1/24 | A3 | 2,000,000 | 2,271,860 |
| |
| 20 New York Tax Exempt Income Fund |
| | | |
| MUNICIPAL BONDS AND NOTES (98.8%)*cont. | Rating** | Principal amount | Value |
| New Yorkcont. | | | |
| NY City, G.O. Bonds | | | |
| Ser. F-1, 5.00%, 4/1/43 | Aa1 | $9,440,000 | $11,331,776 |
| Ser. E-1, 5.00%, 3/1/39 | Aa1 | 5,000,000 | 6,039,950 |
| Ser. B-1, 5.00%, 12/1/35 | Aa1 | 2,000,000 | 2,402,440 |
| Ser. E, 5.00%, 8/1/34 | Aa1 | 6,360,000 | 7,614,574 |
| Ser. A-1, 5.00%, 8/1/32 | Aa1 | 5,000,000 | 5,371,050 |
| NY City, VRDN | | | |
| Ser. I, 2.26%, 4/1/36 | VMIG 1 | 5,000,000 | 5,000,000 |
| Ser. 1, 2.25%, 3/1/40 | VMIG 1 | 5,000,000 | 5,000,000 |
| Ser. I, 2.10%, 4/1/36 | VMIG 1 | 6,655,000 | 6,655,000 |
| NY City, Hsg. Dev. Corp. Mandatory Put Bonds | | | |
| (1/15/20), Ser. C, 1.625%, 5/1/49 | VMIG 1 | 12,000,000 | 12,000,000 |
| NY City, Hsg. Dev. Corp. Rev. Bonds | | | |
| (Multi-Fam. Hsg.), Ser. H-2-A, 4.40%, 5/1/31 | AA+ | 4,000,000 | 4,160,320 |
| (Sustainable Neighborhood Bonds), Ser. C-1-A, | | | |
| 1.375%, 5/1/20 | AA+ | 1,105,000 | 1,104,348 |
| NY City, Indl. Dev. Agcy. Rev. Bonds | | | |
| (Yankee Stadium), AGC, 7.00%, 3/1/49 | AA | 1,000,000 | 1,004,790 |
| (Queens Baseball Stadium), AMBAC, | | | |
| 5.00%, 1/1/24 | Baa2 | 3,500,000 | 3,508,435 |
| NY City, Indl. Dev. Agcy. Arpt. Fac. Rev. Bonds, | | | |
| (Sr. Trips), Ser. A, 5.00%, 7/1/28 | BBB+ | 1,500,000 | 1,619,370 |
| NY City, Muni. Wtr. & Swr. Syst. Fin. Auth. Rev. Bonds | | | |
| Ser. EE, 5.25%, 6/15/40 | AAA/P | 8,735,000 | 8,745,307 |
| Ser. EE, 5.25%, 6/15/40 | Aa1 | 1,265,000 | 1,268,441 |
| Ser. EE, 5.00%, 6/15/47 | Aa1 | 5,365,000 | 5,970,709 |
| (2nd Gen. Resolution), 5.00%, 6/15/46 | Aa1 | 12,460,000 | 14,358,406 |
| (2nd Gen. Resolution), Ser. BB, 5.00%, 6/15/46 | Aa1 | 2,500,000 | 2,786,825 |
| (2nd Gen. Resolution), Ser. HH, 5.00%, 6/15/39 | Aa1 | 9,000,000 | 10,447,470 |
| NY City, Muni. Wtr. & Swr. Syst. Fin. Auth. VRDN, | | | |
| Ser. DD-1, 2.20%, 6/15/43 | VMIG 1 | 8,200,000 | 8,200,000 |
| NY City, Transitional Fin. Auth. Rev. Bonds | | | |
| Ser. E-1, 5.00%, 2/1/41 | AAA | 5,200,000 | 5,968,716 |
| Ser. B-1, 5.00%, 8/1/40 | AAA | 6,575,000 | 7,756,528 |
| Ser. E-1, 5.00%, 2/1/40 | AAA | 5,800,000 | 6,780,142 |
| Ser. B-1, 5.00%, 8/1/39 | AAA | 3,660,000 | 4,200,033 |
| Ser. E-1, 5.00%, 2/1/39 | AAA | 9,000,000 | 10,540,170 |
| Ser. B-1, 5.00%, 8/1/38 | AAA | 5,000,000 | 5,924,600 |
| Ser. A-1, 5.00%, 5/1/37 | AAA | 1,000,000 | 1,182,770 |
| Ser. A-1, 5.00%, 5/1/36 | AAA | 3,585,000 | 4,254,750 |
| Ser. E-1, 5.00%, 2/1/34 | AAA | 8,000,000 | 9,510,800 |
| Ser. A-1, 5.00%, 5/1/32 | AAA | 4,780,000 | 5,734,470 |
| Ser. E-1, 5.00%, 2/1/31 | AAA | 2,600,000 | 3,119,636 |
| NY City, Transitional Fin. Auth. Bldg. Aid Rev. Bonds | | | |
| Ser. S-1, 5.00%, 7/15/43 | Aa2 | 6,500,000 | 7,570,030 |
| Ser. S-1, 5.00%, 7/15/40 | Aa2 | 4,550,000 | 5,225,721 |
| Ser. S-2, 5.00%, 7/15/40 | Aa2 | 8,110,000 | 9,414,737 |
| Ser. S-1, 5.00%, 7/15/37 | Aa2 | 7,500,000 | 8,228,775 |
| Ser. S-2A, 5.00%, 7/15/36 | Aa2 | 3,250,000 | 3,970,200 |
| Ser. S-3A, 5.00%, 7/15/34 | Aa2 | 4,250,000 | 5,238,253 |
|
| New York Tax Exempt Income Fund 21 |
| | | |
| MUNICIPAL BONDS AND NOTES (98.8%)*cont. | Rating** | Principal amount | Value |
| New Yorkcont. | | | |
| NY City, Trust for Cultural Resources Rev. Bonds | | | |
| (Wildlife Conservation Society), Ser. A, | | | |
| 5.00%, 8/1/42 | AA– | $1,915,000 | $2,136,317 |
| (Wildlife Conservation Society), Ser. A, | | | |
| 5.00%, 8/1/38 | AA– | 1,250,000 | 1,397,613 |
| (Whitney Museum of American Art), 5.00%, 7/1/31 | A+ | 2,000,000 | 2,105,480 |
| NY Counties, Tobacco Trust II Rev. Bonds, | | | |
| (Tobacco Settlement Pass Through), 5.75%, 6/1/43 | BBB | 840,000 | 852,029 |
| NY Counties, Tobacco Trust III Rev. Bonds, | | | |
| (Tobacco Settlement Pass Through), 6.00%, 6/1/43 | A3 | 70,000 | 70,105 |
| NY Counties, Tobacco Trust IV Rev. Bonds, | | | |
| (Tobacco Settlement Pass Through), Ser. A, | | | |
| 5.00%, 6/1/38 | B– | 7,250,000 | 7,250,073 |
| NY Counties, Tobacco Trust VI Rev. Bonds, | | | |
| (Tobacco Settlement Pass Through) | | | |
| Ser. A-2B, 5.00%, 6/1/51 | BBB | 3,300,000 | 3,398,043 |
| Ser. B, 5.00%, 6/1/41 | BBB+ | 250,000 | 270,015 |
| Ser. B, 5.00%, 6/1/36 | A– | 265,000 | 290,202 |
| NY Liberty Dev. Corp. Rev. Bonds, (Bank of | | | |
| America Tower), Ser. CL1, 5.625%, 1/15/46 | AA+ | 2,000,000 | 2,050,180 |
| NY State Convention Ctr. Dev. Corp. Rev. Bonds, | | | |
| (Hotel Unit Fee) | | | |
| 5.00%, 11/15/45 | Aa3 | 3,000,000 | 3,474,150 |
| zero %, 11/15/50 | Aa3 | 7,000,000 | 2,362,500 |
| NY State Dorm. Auth. Rev. Bonds | | | |
| (NYU), Ser. 1, AMBAC, 5.50%, 7/1/40 | Aa2 | 6,000,000 | 8,401,020 |
| (NYU), Ser. 1, AMBAC, 5.50%, 7/1/31 | Aa2 | 6,170,000 | 8,025,381 |
| Ser. E, 5.00%, 3/15/38 | Aa1 | 10,000,000 | 12,280,900 |
| NY State Dorm. Auth. Non-State Supported | | | |
| Debt Rev. Bonds | | | |
| (NYU Hosp. Ctr.), Ser. A, 6.00%, 7/1/40 | | | |
| (Prerefunded 7/1/20) | A3 | 1,500,000 | 1,575,000 |
| (Brooklyn Law School), 5.75%, 7/1/33 | Baa1 | 1,000,000 | 1,003,260 |
| (Skidmore College), Ser. A, 5.50%, 7/1/41 | A1 | 3,000,000 | 3,233,700 |
| (Fordham U.), Ser. A, U.S. Govt. Coll., 5.50%, 7/1/36 | | | |
| (Prerefunded 7/1/21) | A2 | 1,800,000 | 1,955,808 |
| (Culinary Inst. of America), 5.50%, 7/1/33 | Baa2 | 735,000 | 834,570 |
| (North Shore Long Island Jewish Oblig. Group), | | | |
| Ser. E, 5.50%, 5/1/33 | A3 | 2,000,000 | 2,005,260 |
| (St. Joseph’s College), 5.25%, 7/1/35 | Ba1 | 2,000,000 | 2,036,160 |
| (Manhattan Marymount College), 5.25%, 7/1/29 | Baa2 | 2,000,000 | 2,005,300 |
| (Highland Hosp. Rochester), 5.20%, 7/1/32 | A2 | 1,000,000 | 1,032,650 |
| (Mount Sinai School of Medicine), FCS, U.S. Govt. | | | |
| Coll, FNMA Coll., FHL Banks Coll., 5.125%, 7/1/39 | | | |
| (Prerefunded 7/1/19) | A3 | 5,000,000 | 5,014,000 |
| (School Dist. Fin. Program), Ser. C, AGC, | | | |
| 5.125%, 10/1/36 | AA | 40,000 | 40,455 |
| (North Shore Long Island Jewish Oblig. Group), | | | |
| Ser. A, 5.00%, 5/1/43 | A3 | 2,500,000 | 2,825,100 |
| (NYU), Ser. A, 5.00%, 7/1/42 | Aa2 | 10,485,000 | 12,961,557 |
| (Teachers College), 5.00%, 7/1/42 | A1 | 3,000,000 | 3,268,680 |
| |
| 22 New York Tax Exempt Income Fund |
| | | |
| MUNICIPAL BONDS AND NOTES (98.8%)*cont. | Rating** | Principal amount | Value |
| New Yorkcont. | | | |
| NY State Dorm. Auth. Non-State Supported | | | |
| Debt Rev. Bonds | | | |
| (St. Francis College), 5.00%, 10/1/40 | BBB+ | $3,000,000 | $3,129,450 |
| (Pratt Institute), 5.00%, 7/1/39 | A2 | 2,750,000 | 3,180,898 |
| (Pratt Institute), Ser. A, 5.00%, 7/1/39 | A2 | 1,000,000 | 1,125,350 |
| (Rochester Inst. of Tech.), 5.00%, 7/1/38 | A1 | 2,000,000 | 2,172,360 |
| (St. John’s U.), Ser. A, 5.00%, 7/1/37 | A3 | 1,400,000 | 1,611,736 |
| (North Shore Long Island Jewish Oblig. Group), | | | |
| Ser. A, 5.00%, 5/1/37 | A3 | 3,000,000 | 3,418,440 |
| Ser. A, 5.00%, 7/1/36 | Aa2 | 1,000,000 | 1,241,300 |
| (Memorial Sloan-Kettering Cancer Ctr.), | | | |
| 5.00%, 7/1/36 | Aa3 | 1,125,000 | 1,215,889 |
| (NYU), Ser. A, 5.00%, 7/1/35 | Aa2 | 2,000,000 | 2,350,660 |
| (Culinary Inst. of America), 5.00%, 7/1/34 | Baa2 | 350,000 | 379,505 |
| (Pratt Institute), Ser. A, 5.00%, 7/1/34 | A2 | 1,000,000 | 1,133,660 |
| (Teachers College), 5.00%, 7/1/34 | A1 | 2,750,000 | 3,008,473 |
| Ser. A, 5.00%, 7/1/33 | Aa2 | 1,000,000 | 1,262,060 |
| (NYU Hosp. Ctr.), 5.00%, 7/1/33 | A3 | 360,000 | 424,418 |
| (North Shore Long Island Jewish Oblig. Group), | | | |
| Ser. A, 5.00%, 5/1/33 | A3 | 5,000,000 | 5,783,000 |
| (St. Francis College), 5.00%, 10/1/32 | BBB+ | 2,360,000 | 2,464,690 |
| (School Dist. Fin. Program), Ser. C, AGC, | | | |
| 5.00%, 10/1/31 | AA | 20,000 | 20,216 |
| (New School (The)), 5.00%, 7/1/31 | A3 | 5,000,000 | 5,321,000 |
| (NYU Hosp. Ctr.), 5.00%, 7/1/30 | A3 | 1,000,000 | 1,194,590 |
| (Brooklyn Law School), Ser. A, 5.00%, 7/1/29 | | | |
| (Prerefunded 7/1/22) | Baa1 | 1,000,000 | 1,109,570 |
| (Brooklyn Law School), Ser. A, 5.00%, 7/1/27 | | | |
| (Prerefunded 7/1/22) | Baa1 | 1,000,000 | 1,109,570 |
| (Brooklyn Law School), Ser. A, 5.00%, 7/1/26 | | | |
| (Prerefunded 7/1/22) | Baa1 | 1,000,000 | 1,109,570 |
| (Teachers College), Ser. A, 5.00%, 7/1/26 | A1 | 1,000,000 | 1,101,510 |
| Ser. A, 4.00%, 7/1/35 | Aa2 | 1,000,000 | 1,134,340 |
| Ser. A, 4.00%, 7/1/34 | Aa2 | 1,195,000 | 1,362,455 |
| NY State Dorm. Auth. Non-State Supported Debt | | | |
| 144A Rev. Bonds, (Orange Regl. Med. Ctr.) | | | |
| 5.00%, 12/1/37 | Baa3 | 4,300,000 | 4,936,357 |
| 5.00%, 12/1/36 | Baa3 | 700,000 | 805,826 |
| NY State Dorm. Auth. Personal Income | | | |
| Tax Rev. Bonds | | | |
| Ser. A, 5.25%, 3/15/37 | Aa1 | 7,105,000 | 8,912,512 |
| Ser. C, 5.00%, 3/15/41 | Aa1 | 10,000,000 | 10,574,600 |
| (Bidding Group No. 3 Bonds), Ser. B, | | | |
| 5.00%, 2/15/41 | Aa1 | 9,920,000 | 11,831,088 |
| (Group C), Ser. B, 5.00%, 2/15/41 | Aa1 | 5,000,000 | 5,752,300 |
| (Bidding Group No. 3 Bonds), Ser. B, | | | |
| 5.00%, 2/15/39 | Aa1 | 3,000,000 | 3,594,000 |
| (Group B), Ser. B, 5.00%, 2/15/34 | Aa1 | 1,000,000 | 1,167,050 |
| NY State Dorm. Auth. Sales Tax Rev. Bonds, Ser. A, | | | |
| 5.00%, 3/15/32 | Aa1 | 2,905,000 | 3,528,704 |
|
| New York Tax Exempt Income Fund 23 |
| | | |
| MUNICIPAL BONDS AND NOTES (98.8%)*cont. | Rating** | Principal amount | Value |
| New Yorkcont. | | | |
| NY State Dorm. Auth. State Supported Debt Rev. | | | |
| Bonds, (State U. of NY), Ser. A | | | |
| 5.00%, 7/1/42 | Aa2 | $2,000,000 | $2,180,380 |
| 5.00%, 7/1/41 | Aa2 | 5,250,000 | 5,598,968 |
| NY State Dorm. Auth. State Supported Debt Sales | | | |
| Tax Rev. Bonds, Ser. A, 5.00%, 3/15/44 | Aa1 | 5,500,000 | 6,206,255 |
| NY State Env. Fac. Corp. Rev. Bonds, (United Wtr. | | | |
| New Rochelle), Ser. A, 4.875%, 9/1/40 | A– | 5,000,000 | 5,170,400 |
| NY State Env. Fac. Corp. Solid Waste Disp. 144A | | | |
| Mandatory Put Bonds (12/2/19), (Casella Waste | | | |
| Syst., Inc.), 3.75%, 12/1/44 | B | 2,000,000 | 2,012,300 |
| NY State Hsg. Fin. Agcy. Rev. Bonds, | | | |
| (Affordable Hsg.), Ser. A, 5.00%, 11/1/42 | Aa2 | 4,660,000 | 4,742,948 |
| NY State Liberty Dev. Corp. Rev. Bonds | | | |
| (7 World Trade Ctr.), Class 3, 5.00%, 3/15/44 | A2 | 1,000,000 | 1,080,210 |
| (1 World Trade Ctr. Port Auth.), 5.00%, 12/15/41 | Aa3 | 7,500,000 | 8,100,150 |
| (7 World Trade Ctr.), Class 1, 5.00%, 9/15/40 | Aaa | 4,815,000 | 5,248,976 |
| (4 World Trade Ctr.), 5.00%, 11/15/31 | A+ | 2,500,000 | 2,706,950 |
| NY State Liberty Dev. Corp. 144A Rev. Bonds | | | |
| (3 World Trade Ctr., LLC), Class 2, 5.15%, 11/15/34 | BB/P | 515,000 | 576,295 |
| (3 World Trade Ctr., LLC), Class 1-3, | | | |
| 5.00%, 11/15/44 | BB–/P | 10,975,000 | 12,001,053 |
| NY State Mtge. Agcy. Rev. Bonds, Ser. 189, | | | |
| 3.85%, 10/1/34 | Aa1 | 1,505,000 | 1,547,035 |
| NY State Pwr. Auth. Rev. Bonds, Ser. A, | | | |
| 5.00%, 11/15/38 | Aa1 | 2,000,000 | 2,155,820 |
| NY State Thruway Auth. Rev. Bonds | | | |
| Ser. A, 5.00%, 1/1/46 | A2 | 2,000,000 | 2,312,460 |
| 4.00%, 2/1/20 | A2 | 16,500,000 | 16,614,180 |
| NY State Trans. Special Fac. Dev. Corp. Rev. Bonds | | | |
| (Laguardia Arpt. Term. B Redev. Program), Ser. A, | | | |
| 5.25%, 1/1/50 | Baa3 | 1,000,000 | 1,108,380 |
| (Laguardia Arpt. Term. B Redev. Program), Ser. A, | | | |
| 5.00%, 7/1/46 | Baa3 | 1,000,000 | 1,098,320 |
| (Laguardia Arpt. Term. B Redev. Program), Ser. A, | | | |
| 5.00%, 7/1/41 | Baa3 | 2,500,000 | 2,752,950 |
| (Delta Air Lines, Inc.-LaGuardia Arpt. Term. C&D), | | | |
| 5.00%, 1/1/34 | Baa3 | 2,000,000 | 2,354,020 |
| (Delta Air Lines, Inc.-LaGuardia Arpt. Term. C&D), | | | |
| 5.00%, 1/1/33 | Baa3 | 2,500,000 | 2,952,425 |
| (Delta Air Lines, Inc.-LaGuardia Arpt. Term. C&D), | | | |
| 5.00%, 1/1/32 | Baa3 | 6,000,000 | 7,107,480 |
| (American Airlines, Inc.-John F. Kennedy Intl. | | | |
| Arpt.), 5.00%, 8/1/31 | BB– | 1,500,000 | 1,577,415 |
| (Terminal One Group Assn.), 5.00%, 1/1/23 | Baa1 | 1,500,000 | 1,652,235 |
| NY State Urban Dev. Corp. Rev. Bonds, | | | |
| (Clarkson Ctr.), 5.50%, 1/1/20 | Aa2 | 375,000 | 383,659 |
| NY State Urban Dev. Corp. Personal Income Tax Rev. | | | |
| Bonds, (Group C), Ser. A , 5.00%, 3/15/38 | Aa1 | 6,515,000 | 7,620,596 |
| Onondaga Cnty., Resource Recvy. Agcy. Rev. Bonds, | | | |
| Ser. A, AGM, 5.00%, 5/1/29 | AA | 3,120,000 | 3,588,437 |
| |
| 24 New York Tax Exempt Income Fund |
| | | |
| MUNICIPAL BONDS AND NOTES (98.8%)*cont. | Rating** | Principal amount | Value |
| New Yorkcont. | | | |
| Onondaga Cnty., Trust For Cultural Resources Rev. | | | |
| Bonds, (Syracuse U.), 5.00%, 12/1/36 | Aa3 | $2,000,000 | $2,164,960 |
| Onondaga, Civic Dev. Corp. Rev. Bonds, | | | |
| (Le Moyne College) | | | |
| 5.375%, 7/1/40 | Baa2 | 3,900,000 | 4,030,182 |
| 5.00%, 7/1/34 | Baa2 | 445,000 | 502,472 |
| 5.00%, 7/1/32 | Baa2 | 1,635,000 | 1,758,295 |
| Oyster Bay, G.O. Bonds, (Pub. Impt.), 4.00%, 2/15/26 | Baa3 | 3,000,000 | 3,321,090 |
| Port Auth. of NY & NJ Rev. Bonds | | | |
| Ser. 186, 5.00%, 10/15/44 | Aa3 | 8,000,000 | 9,013,760 |
| Ser. 206, 5.00%, 11/15/42 | Aa3 | 5,000,000 | 5,885,600 |
| Ser. 194, 5.00%, 10/15/41 | Aa3 | 5,450,000 | 6,390,343 |
| Ser. 197, 5.00%, 11/15/34 | Aa3 | 2,500,000 | 2,963,500 |
| Ser. 185, 5.00%, 9/1/30 | Aa3 | 2,000,000 | 2,302,840 |
| Port Auth. of NY & NJ Special Oblig. Rev. Bonds, | | | |
| (KIAC Partners Special Project — 5th Installment), | | | |
| 6.75%, 10/1/19 | BBB–/P | 600,000 | 612,738 |
| Port Auth. of NY & NJ Special Oblig. Rev. Bonds, | | | |
| (John F. Kennedy Intl. Air Term.), 6.00%, 12/1/42 | Baa1 | 3,500,000 | 3,705,975 |
| Poughkeepsie City, G.O. Bonds | | | |
| 5.00%, 6/1/31 | Ba1 | 600,000 | 668,838 |
| 5.00%, 6/1/25 | Ba1 | 230,000 | 259,895 |
| 5.00%, 6/1/24 | Ba1 | 460,000 | 511,833 |
| 5.00%, 6/1/23 | Ba1 | 1,125,000 | 1,229,918 |
| 5.00%, 6/1/22 | Ba1 | 1,070,000 | 1,150,143 |
| Schenectady Cnty., Cap. Resource Corp. Rev. | | | |
| Bonds, (Union College), 5.00%, 7/1/32 | A1 | 3,430,000 | 3,753,758 |
| Southold, Local Dev. Corp. Rev. Bonds, | | | |
| (Peconic Landing at Southold, Inc.), 5.00%, 12/1/45 | BBB–/F | 2,250,000 | 2,363,333 |
| St. Lawrence Ctny., Indl. Dev. Agcy. Civic Dev. Corp. | | | |
| Rev. Bonds, (Clarkson U.), Ser. A | | | |
| 5.25%, 9/1/33 | Baa1 | 1,050,000 | 1,132,751 |
| 5.00%, 9/1/41 | Baa1 | 1,750,000 | 1,864,328 |
| Suffolk Cnty., G.O. Bonds, Ser. B, AGM, | | | |
| 5.00%, 10/15/26 | AA | 4,000,000 | 4,960,720 |
| Suffolk Cnty., Econ. Dev. Corp. Rev. Bonds, | | | |
| (Peconic Landing Southold), 6.00%, 12/1/40 | BBB–/F | 1,225,000 | 1,286,103 |
| Suffolk Cnty., Indl. Dev. Agcy. Rev. Bonds, | | | |
| (Nissequogue Cogen. Partners Fac.), 5.50%, 1/1/23 | BBB–/P | 1,025,000 | 1,025,605 |
| Syracuse, Indl. Dev. Agcy. Rev. Bonds, | | | |
| (Carousel Ctr.), Ser. A, 5.00%, 1/1/35 | Baa3 | 4,275,000 | 4,522,095 |
| Syracuse, Indl. Dev. Agcy. Civic Fac. VRDN, | | | |
| (Syracuse U.) | | | |
| Ser. A-2, 2.16%, 12/1/37 | VMIG 1 | 7,535,000 | 7,535,000 |
| Ser. A-1, 2.16%, 7/1/37 | VMIG 1 | 5,585,000 | 5,585,000 |
| Tompkins Cnty., Dev. Corp. Rev. Bonds | | | |
| (Ithaca College), AGM, 5.375%, 7/1/41 | | | |
| (Prerefunded 1/1/21) | AAA/P | 1,000,000 | 1,062,500 |
| (Kendal at Ithaca, Inc.), 5.00%, 7/1/44 | BBB | 2,570,000 | 2,782,488 |
| (Ithaca College), 5.00%, 7/1/41 | A2 | 715,000 | 846,467 |
| (Ithaca College), 5.00%, 7/1/37 | A2 | 250,000 | 297,828 |
|
| New York Tax Exempt Income Fund 25 |
| | | |
| MUNICIPAL BONDS AND NOTES (98.8%)*cont. | Rating** | Principal amount | Value |
| New Yorkcont. | | | |
| Tompkins Cnty., Dev. Corp. Rev. Bonds | | | |
| (Ithaca College), 5.00%, 7/1/35 | A2 | $150,000 | $179,964 |
| (Ithaca College), 5.00%, 7/1/34 | A2 | 150,000 | 180,426 |
| Triborough Bridge & Tunnel Auth. Mandatory Put | | | |
| Bonds (10/1/20), Ser. D, 2.108%, 11/15/38 | Aa3 | 10,000,000 | 10,007,600 |
| Triborough Bridge & Tunnel Auth. Rev. Bonds | | | |
| Ser. A, 5.00%, 11/15/44 | Aa3 | 2,340,000 | 2,646,236 |
| Ser. A, 5.00%, 11/15/41 | Aa3 | 3,750,000 | 4,409,363 |
| Ser. B, 5.00%, 11/15/38 | Aa3 | 1,000,000 | 1,201,220 |
| Ser. B, zero %, 11/15/32 | Aa3 | 3,900,000 | 2,696,265 |
| Ser. A, zero %, 11/15/30 | A1 | 7,000,000 | 5,194,070 |
| Triborough Bridge & Tunnel Auth. VRDN | | | |
| Ser. F, 2.12%, 11/1/32 | VMIG 1 | 12,765,000 | 12,765,000 |
| Ser. B-2, 2.12%, 1/1/32 | VMIG 1 | 5,625,000 | 5,625,000 |
| TSASC, Inc. Rev. Bonds, Ser. A, 5.00%, 6/1/41 | BBB+ | 15,490,000 | 16,856,515 |
| Westchester Cnty., Hlth. Care Corp. Rev. | | | |
| Bonds, Ser. C-2 | | | |
| 6.125%, 11/1/37 | Baa2 | 380,000 | 402,811 |
| U.S. Govt. Coll., 6.125%, 11/1/37 | | | |
| (Prerefunded 11/1/20) | AAA/P | 3,005,000 | 3,204,472 |
| Westchester Cnty., Indl Dev. Agcy. Civic Fac. Rev. | | | |
| Bonds, (Pace U.), Ser. A, 5.50%, 5/1/42 | BBB– | 2,750,000 | 3,045,653 |
| Westchester Cnty., Local Dev. Corp. Rev. Bonds | | | |
| (Purchase Hsg. Corp. II), 5.00%, 6/1/47 | BBB | 1,000,000 | 1,147,650 |
| (Westchester Med. Ctr.), 5.00%, 11/1/46 | Baa2 | 3,500,000 | 3,890,845 |
| (Purchase Hsg. Corp. II), 5.00%, 6/1/42 | BBB | 1,235,000 | 1,417,669 |
| Westchester Tobacco Asset Securitization Corp. | | | |
| Rev. Bonds, Ser. B, 5.00%, 6/1/41 | BBB+ | 1,250,000 | 1,347,188 |
| Western Nassau Cnty., Wtr. Auth. Rev. Bonds, Ser. A, | | | |
| 5.00%, 4/1/40 | A1 | 2,400,000 | 2,743,224 |
| Yonkers, G.O. Bonds | | | |
| Ser. A, AGM, 5.00%, 11/15/31 | AA | 2,200,000 | 2,631,002 |
| Ser. E, AGM, 5.00%, 9/1/23 | AA | 3,135,000 | 3,607,695 |
| Yonkers, Indl. Dev. Agcy. Civic Fac. Rev. Bonds, | | | |
| (St. John’s Riverside Hosp.), Ser. A, 7.125%, 7/1/31 | B– | 1,835,000 | 1,822,926 |
| | | | 947,262,104 |
| Ohio (0.9%) | | | |
| Lancaster, Port Auth. Mandatory Put Bonds | | | |
| (2/1/25), Ser. A, 5.00%, 8/1/49 | Aa2 | 8,000,000 | 9,308,160 |
| | | | 9,308,160 |
| Puerto Rico (0.7%) | | | |
| Cmnwlth. of PR, Hwy. & Trans. Auth. Rev. | | | |
| Bonds, Ser. AA | | | |
| NATL, 5.50%, 7/1/20 | Baa2 | 365,000 | 373,479 |
| NATL, U.S. Govt. Coll., 5.50%, 7/1/20 (Escrowed | | | |
| to maturity) | Baa2 | 635,000 | 661,835 |
| NATL, 5.50%, 7/1/19 | Baa2 | 540,000 | 540,929 |
| |
| 26 New York Tax Exempt Income Fund |
| | | |
| MUNICIPAL BONDS AND NOTES (98.8%)*cont. | Rating** | Principal amount | Value |
| Puerto Ricocont. | | | |
| Cmnwlth. of PR, Sales Tax Fin. Corp. | | | |
| (COFINA) Rev. Bonds | | | |
| Class 2, zero %, 8/1/47 | BBB/P | $13,735,691 | $3,611,800 |
| Ser. 07A, zero %, 8/1/43 | BBB/P | 1,120,732 | 983,442 |
| Ser. 07A, zero %, 8/1/43 | BBB/P | 369,044 | 304,000 |
| | | | 6,475,485 |
| Total municipal bonds and notes (cost $931,360,299) | | $976,921,775 |
| | |
| UNITIZED TRUST (0.1%)* | Shares | Value |
| CMS Liquidating Trust 144A †F | 600 | $1,350,048 |
| Total unitized trust (cost $1,816,443) | | $1,350,048 |
| |
| U.S. TREASURY OBLIGATIONS (—%)* | Principal amount | Value |
| U.S. Treasury Notes 1.75%, 9/30/22 i | $175,000 | $174,664 |
| Total U.S. treasury obligations (cost $174,664) | | $174,664 |
| |
| SHORT-TERM INVESTMENTS (—%)* | Principal amount | Value |
| U.S. Treasury Bills 2.528%, 6/20/19 | $150,000 | $149,840 |
| Total short-term investments (cost $149,805) | | $149,840 |
| |
| TOTAL INVESTMENTS | | |
| Total investments (cost $933,501,211) | | $978,596,327 |
Notes to the fund’s portfolio
Unless noted otherwise, the notes to the fund’s portfolio are for the close of the fund’s reporting period, which ran from December 1, 2018 through May 31, 2019 (the reporting period). Within the following notes to the portfolio, references to “Putnam Management” represent Putnam Investment Management, LLC, the fund’s manager, an indirect wholly-owned subsidiary of Putnam Investments, LLC and references to “ASC 820” represent Accounting Standards Codification 820Fair Value Measurements and Disclosures.
*Percentages indicated are based on net assets of $988,429,825.
**The Moody’s, Standard & Poor’s or Fitch ratings indicated are believed to be the most recent ratings available at the close of the reporting period for the securities listed. Ratings are generally ascribed to securities at the time of issuance. While the agencies may from time to time revise such ratings, they undertake no obligation to do so, and the ratings do not necessarily represent what the agencies would ascribe to these securities at the close of the reporting period. Securities rated by Fitch are indicated by “/F.” Securities rated by Putnam are indicated by “/P.” The Putnam rating categories are comparable to the Standard & Poor’s classifications. If a security is insured, it will usually be rated by the ratings organizations based on the financial strength of the insurer. For further details regarding security ratings, please see the Statement of Additional Information.
†This security is non-income-producing.
†† The interest rate and date shown parenthetically represent the new interest rate to be paid and the date the fund will begin accruing interest at this rate.FThis security is valued by Putnam Management at fair value following procedures approved by the Trustees. Securities are classified as Level 3 for ASC 820 based on the securities’ valuation inputs (Note 1).
iThis security was pledged, or purchased with cash that was pledged, to the fund for collateral on certain derivative contracts (Note 1).
Unless otherwise noted, the rates quoted in Short-term investments security descriptions represent the weighted average yield to maturity.
144A after the name of an issuer represents securities exempt from registration under Rule 144A of the Securities Act of 1933, as amended. These securities may be resold in transactions exempt from registration, normally to qualified institutional buyers.
|
| New York Tax Exempt Income Fund 27 |
On Mandatory Put Bonds, the rates shown are the current interest rates at the close of the reporting period and the dates shown represent the next mandatory put dates. Rates are set by remarketing agents and may take into consideration market supply and demand, credit quality and the current SIFMA Municipal Swap Index, 1 Month US LIBOR or 3 Month US LIBOR rates, which were 1.42%, 2.43% and 2.50%, respectively, as of the close of the reporting period.
The dates shown parenthetically on prerefunded bonds represent the next prerefunding dates.
The dates shown on debt obligations are the original maturity dates.
| | | |
| The fund had the following sector concentrations greater than 10% at the close of the reporting period (as a percentage of net assets): | | |
| | |
| Education | 18.1% | | |
| Tax bonds | 17.0 | | |
| Transportation | 16.9 | | |
| Utilities | 11.7 | | |
| | | | | | |
| OTC TOTAL RETURN SWAP CONTRACTS OUTSTANDING at 5/31/19 (Unaudited) | |
| | | Upfront | | Payments | | |
| | | premium | Termina- | received | Total return | Unrealized |
| Swap counterparty/ | | received | tion | (paid) | received by | appreciation/ |
| Notional amount | Value | (paid) | date | by fund | or paid by fund | (depreciation) |
| Bank of America N.A. | | | | | | |
| $20,000,000 | $351,400 | $— | 8/15/19 | — | 2.175% minus Municipal | $351,400 |
| | | | | | Market Data Index AAA | |
| | | | | | municipal yields 15 Year | |
| | | | | | rate — At maturity | |
| Upfront premium received | — | | Unrealized appreciation | 351,400 |
| Upfront premium (paid) | — | | Unrealized (depreciation) | — |
| Total | | $— | | Total | | $351,400 |
ASC 820 establishes a three-level hierarchy for disclosure of fair value measurements. The valuation hierarchy is based upon the transparency of inputs to the valuation of the fund’s investments. The three levels are defined as follows:
Level 1: Valuations based on quoted prices for identical securities in active markets.
Level 2: Valuations based on quoted prices in markets that are not active or for which all significant inputs are observable, either directly or indirectly.
Level 3: Valuations based on inputs that are unobservable and significant to the fair value measurement.
The following is a summary of the inputs used to value the fund’s net assets as of the close of the reporting period:
| | | |
| | | Valuation inputs |
| Investments in securities: | Level 1 | Level 2 | Level 3 |
| Municipal bonds and notes | $— | $976,921,775 | $— |
| Unitized trust | — | — | 1,350,048 |
| U.S. treasury obligations | — | 174,664 | — |
| Short-term investments | — | 149,840 | — |
| Totals by level | $— | $977,246,279 | $1,350,048 |
| | | |
| | | Valuation inputs |
| Other financial instruments: | Level 1 | Level 2 | Level 3 |
| Total return swap contracts | $— | $351,400 | $— |
| Totals by level | $— | $351,400 | $— |
At the start and close of the reporting period, Level 3 investments in securities represented less than 1% of the fund’s net assets and were not considered a significant portion of the fund’s portfolio.
The accompanying notes are an integral part of these financial statements.
|
| 28 New York Tax Exempt Income Fund |
Statement of assets and liabilities5/31/19 (Unaudited)
| |
| ASSETS | |
| Investment in securities, at value (Notes 1 and 7): | |
| Unaffiliated issuers (identified cost $933,501,211) | $978,596,327 |
| Cash | 33,617 |
| Interest and other receivables | 11,604,206 |
| Receivable for shares of the fund sold | 484,863 |
| Receivable for investments sold | 15,000 |
| Receivable for custodian fees (Note 2) | 26,122 |
| Unrealized appreciation on OTC swap contracts (Note 1) | 351,400 |
| Prepaid assets | 15,014 |
| Total assets | 991,126,549 |
| |
| LIABILITIES | |
| Payable for shares of the fund repurchased | 1,025,617 |
| Payable for compensation of Manager (Note 2) | 359,495 |
| Payable for investor servicing fees (Note 2) | 99,312 |
| Payable for Trustee compensation and expenses (Note 2) | 347,074 |
| Payable for administrative services (Note 2) | 3,914 |
| Payable for distribution fees (Note 2) | 331,719 |
| Distributions payable to shareholders | 241,570 |
| Collateral on certain derivative contracts, at value (Notes 1 and 7) | 174,664 |
| Other accrued expenses | 113,359 |
| Total liabilities | 2,696,724 |
| | |
| Net assets | $988,429,825 |
| |
| REPRESENTED BY | |
| Paid-in capital (Unlimited shares authorized) (Notes 1 and 4) | $948,617,738 |
| Total distributable earnings (Note 1) | 39,812,087 |
| Total — Representing net assets applicable to capital shares outstanding | $988,429,825 |
| |
| COMPUTATION OF NET ASSET VALUE AND OFFERING PRICE | |
| Net asset value and redemption price per class A share | |
| ($799,930,040 divided by 92,709,149 shares) | $8.63 |
| Offering price per class A share(100/96.00 of $8.63)* | $8.99 |
| Net asset value and offering price per class B share($4,925,720 divided by 572,166 shares)** | $8.61 |
| Net asset value and offering price per class C share($43,489,139 divided by 5,041,627 shares)** | $8.63 |
| Net asset value and redemption price per class M share($1,143,500 divided by 132,392 shares) | $8.64 |
| Offering price per class M share(100/96.75 of $8.64)† | $8.93 |
| Net asset value, offering price and redemption price per class R6 share | |
| ($86,064,113 divided by 9,970,230 shares) | $8.63 |
| Net asset value, offering price and redemption price per class Y share | |
| ($52,877,313 divided by 6,126,001 shares) | $8.63 |
*On single retail sales of less than $100,000. On sales of $100,000 or more the offering price is reduced.
**Redemption price per share is equal to net asset value less any applicable contingent deferred sales charge.
†On single retail sales of less than $50,000. On sales of $50,000 or more the offering price is reduced.
The accompanying notes are an integral part of these financial statements.
|
| New York Tax Exempt Income Fund 29 |
Statement of operationsSix months ended 5/31/19 (Unaudited)
| |
| INVESTMENT INCOME | |
| Interest income | $16,633,959 |
| Total investment income | 16,633,959 |
| |
| EXPENSES | |
| Compensation of Manager (Note 2) | 2,063,302 |
| Investor servicing fees (Note 2) | 300,503 |
| Custodian fees (Note 2) | 6,231 |
| Trustee compensation and expenses (Note 2) | 23,375 |
| Distribution fees (Note 2) | 1,096,308 |
| Administrative services (Note 2) | 18,439 |
| Other | 132,291 |
| Total expenses | 3,640,449 |
| | |
| Expense reduction (Note 2) | (46,376) |
| Net expenses | 3,594,073 |
| | |
| Net investment income | 13,039,886 |
| |
| REALIZED AND UNREALIZED GAIN (LOSS) | |
| Net realized gain (loss) on: | |
| Securities from unaffiliated issuers (Notes 1 and 3) | 4,258,746 |
| Futures contracts (Note 1) | 136,072 |
| Total net realized gain | 4,394,818 |
| Change in net unrealized appreciation (depreciation) on: | |
| Securities from unaffiliated issuers | 37,314,058 |
| Swap contracts | 351,400 |
| Total change in net unrealized appreciation | 37,665,458 |
| | |
| Net gain on investments | 42,060,276 |
| |
| Net increase in net assets resulting from operations | $55,100,162 |
The accompanying notes are an integral part of these financial statements.
| |
| 30 New York Tax Exempt Income Fund |
Statement of changes in net assets
| | |
| INCREASE (DECREASE) IN NET ASSETS | Six months ended 5/31/19* | Year ended 11/30/18 |
| Operations | | |
| Net investment income | $13,039,886 | $28,499,021 |
| Net realized gain on investments | 4,394,818 | 1,317,441 |
| Change in net unrealized appreciation (depreciation) | | |
| of investments | 37,665,458 | (27,953,343) |
| Net increase in net assets resulting from operations | 55,100,162 | 1,863,119 |
| Distributions to shareholders (Note 1): | | |
| From ordinary income | | |
| Taxable net investment income | | |
| Class A | (224,562) | (415,381) |
| Class B | (1,560) | (3,918) |
| Class C | (12,421) | (29,218) |
| Class M | (317) | (585) |
| Class R6 | (1,004) | — |
| Class Y | (32,858) | (53,072) |
| From tax-exempt net investment income | | |
| Class A | (10,718,030) | (23,649,720) |
| Class B | (55,165) | (154,854) |
| Class C | (420,495) | (1,071,519) |
| Class M | (13,667) | (31,358) |
| Class R6 | (186,076) | (15,549) |
| Class Y | (1,657,803) | (3,538,436) |
| Decrease from capital share transactions (Note 4) | (1,597,622) | (64,763,186) |
| Total increase (decrease) in net assets | 40,178,582 | (91,863,677) |
| |
| NET ASSETS | | |
| Beginning of period | 948,251,243 | 1,040,114,920 |
| End of period | $988,429,825 | $948,251,243 |
*Unaudited.
The accompanying notes are an integral part of these financial statements.
|
| New York Tax Exempt Income Fund 31 |
| | | | | | | | | | | | |
| Financial highlights(For a common share outstanding throughout the period) | | | | | | | | |
| |
| | INVESTMENT OPERATIONS | | | LESS DISTRIBUTIONS | | | | RATIOS AND SUPPLEMENTAL DATA | | |
| | | | | | | | | | | | Ratio | |
| | | | Net realized | | | | | | | | of net investment | |
| | Net asset value, | | and unrealized | Total from | From net | | | Total return | Net assets, | Ratio of expenses | income (loss) | |
| | beginning | Net investment | gain (loss) | investment | investment | Total | Net asset value, | at net asset value | end of period | to average | to average | Portfolio |
| Period ended | of period | income (loss) | on investments | operations | income | distributions | end of period | (%)a | (in thousands) | net assets (%)b | net assets (%) | turnover (%) |
| Class A | | | | | | | | | | | | |
| May 31, 2019** | $8.26 | .12 | .37 | .49 | (.12) | (.12) | $8.63 | 5.94* | $799,930 | .38* | 1.37* | 14* |
| November 30, 2018 | 8.49 | .24 | (.22) | .02 | (.25) | (.25) | 8.26 | .18 | 779,418 | .75 | 2.87 | 28 |
| November 30, 2017 | 8.35 | .26 | .15 | .41 | (.27) | (.27) | 8.49 | 4.92 | 862,926 | .75 | 3.00 | 24 |
| November 30, 2016 | 8.61 | .28 | (.26) | .02 | (.28) | (.28) | 8.35 | .11 | 910,466 | .76c | 3.18c | 22 |
| November 30, 2015 | 8.66 | .30 | (.05) | .25 | (.30) | (.30) | 8.61 | 2.94 | 920,148 | .75 | 3.51 | 15 |
| November 30, 2014 | 8.29 | .32 | .36 | .68 | (.31) | (.31) | 8.66 | 8.39 | 946,474 | .74 | 3.74 | 10 |
| Class B | | | | | | | | | | | | |
| May 31, 2019** | $8.24 | .09 | .37 | .46 | (.09) | (.09) | $8.61 | 5.62* | $4,926 | .69* | 1.06* | 14* |
| November 30, 2018 | 8.47 | .19 | (.23) | (.04) | (.19) | (.19) | 8.24 | (.45) | 5,507 | 1.38 | 2.25 | 28 |
| November 30, 2017 | 8.33 | .20 | .15 | .35 | (.21) | (.21) | 8.47 | 4.27 | 8,094 | 1.38 | 2.38 | 24 |
| November 30, 2016 | 8.59 | .22 | (.26) | (.04) | (.22) | (.22) | 8.33 | (.52) | 10,004 | 1.39c | 2.55c | 22 |
| November 30, 2015 | 8.64 | .25 | (.05) | .20 | (.25) | (.25) | 8.59 | 2.30 | 10,708 | 1.38 | 2.88 | 15 |
| November 30, 2014 | 8.27 | .26 | .37 | .63 | (.26) | (.26) | 8.64 | 7.73 | 11,438 | 1.37 | 3.11 | 10 |
| Class C | | | | | | | | | | | | |
| May 31, 2019** | $8.26 | .08 | .37 | .45 | (.08) | (.08) | $8.63 | 5.53* | $43,489 | .76* | .98* | 14* |
| November 30, 2018 | 8.49 | .18 | (.23) | (.05) | (.18) | (.18) | 8.26 | (.60) | 43,007 | 1.53 | 2.10 | 28 |
| November 30, 2017 | 8.35 | .19 | .15 | .34 | (.20) | (.20) | 8.49 | 4.11 | 60,891 | 1.53 | 2.23 | 24 |
| November 30, 2016 | 8.60 | .21 | (.25) | (.04) | (.21) | (.21) | 8.35 | (.55) | 65,903 | 1.54c | 2.39c | 22 |
| November 30, 2015 | 8.66 | .24 | (.07) | .17 | (.23) | (.23) | 8.60 | 2.02 | 57,709 | 1.53 | 2.72 | 15 |
| November 30, 2014 | 8.29 | .25 | .37 | .62 | (.25) | (.25) | 8.66 | 7.55 | 55,788 | 1.52 | 2.96 | 10 |
| Class M | | | | | | | | | | | | |
| May 31, 2019** | $8.27 | .10 | .38 | .48 | (.11) | (.11) | $8.64 | 5.79* | $1,144 | .51* | 1.22* | 14* |
| November 30, 2018 | 8.50 | .22 | (.23) | (.01) | (.22) | (.22) | 8.27 | (.10) | 1,091 | 1.03 | 2.59 | 28 |
| November 30, 2017 | 8.36 | .23 | .15 | .38 | (.24) | (.24) | 8.50 | 4.62 | 1,220 | 1.03 | 2.74 | 24 |
| November 30, 2016 | 8.61 | .25 | (.25) | —d | (.25) | (.25) | 8.36 | (.06) | 1,450 | 1.04c | 2.89c | 22 |
| November 30, 2015 | 8.67 | .28 | (.06) | .22 | (.28) | (.28) | 8.61 | 2.53 | 1,404 | 1.03 | 3.22 | 15 |
| November 30, 2014 | 8.30 | .29 | .37 | .66 | (.29) | (.29) | 8.67 | 8.08 | 1,410 | 1.02 | 3.46 | 10 |
| Class R6 | | | | | | | | | | | | |
| May 31, 2019** | $8.26 | .12 | .38 | .50 | (.13) | (.13) | $8.63 | 6.06* | $86,064 | .26* | 1.38* | 14* |
| November 30, 2018† | 8.35 | .13 | (.08) | .05 | (.14) | (.14) | 8.26 | .56* | 3,624 | .27* | 1.61* | 28 |
| Class Y | | | | | | | | | | | | |
| May 31, 2019** | $8.26 | .12 | .38 | .50 | (.13) | (.13) | $8.63 | 6.06* | $52,877 | .27* | 1.48* | 14* |
| November 30, 2018 | 8.49 | .26 | (.23) | .03 | (.26) | (.26) | 8.26 | .40 | 115,604 | .53 | 3.09 | 28 |
| November 30, 2017 | 8.36 | .27 | .15 | .42 | (.29) | (.29) | 8.49 | 5.03 | 106,984 | .53 | 3.21 | 24 |
| November 30, 2016 | 8.61 | .30 | (.25) | .05 | (.30) | (.30) | 8.36 | .45 | 80,877 | .54c | 3.37c | 22 |
| November 30, 2015 | 8.66 | .32 | (.05) | .27 | (.32) | (.32) | 8.61 | 3.17 | 46,127 | .53 | 3.72 | 15 |
| November 30, 2014 | 8.29 | .34 | .36 | .70 | (.33) | (.33) | 8.66 | 8.62 | 39,211 | .52 | 3.96 | 10 |
See notes to financial highlights at the end of this section.
The accompanying notes are an integral part of these financial statements.
| |
| 32 New York Tax Exempt Income Fund | New York Tax Exempt Income Fund 33 |
Financial highlightscont.
*Not annualized.
**Unaudited.
†For the period May 22, 2018 (commencement of operations) to November 30, 2018.
aTotal return assumes dividend reinvestment and does not reflect the effect of sales charges.
bIncludes amounts paid through expense offset and/or brokerage/service arrangements, if any (Note 2). Also excludes acquired fund fees and expenses, if any.
cReflects a voluntary waiver of certain fund expenses in effect during the period. As a result of such waivers, the expenses of each class reflect a reduction of less than 0.01% as a percentage of average net assets.
dAmount represents less than $0.01 per share.
The accompanying notes are an integral part of these financial statements.
| |
| 34 New York Tax Exempt Income Fund |
Notes to financial statements5/31/19 (Unaudited)
Within the following Notes to financial statements, references to “State Street” represent State Street Bank and Trust Company, references to “the SEC” represent the Securities and Exchange Commission, references to “Putnam Management” represent Putnam Investment Management, LLC, the fund’s manager, an indirect wholly-owned subsidiary of Putnam Investments, LLC and references to “OTC”, if any, represent over-the-counter. Unless otherwise noted, the “reporting period” represents the period from December 1, 2018 through May 31, 2019.
Putnam New York Tax Exempt Income Fund (the fund) is a Massachusetts business trust, which is registered under the Investment Company Act of 1940, as amended, as a diversified open-end management investment company. The goal of the fund is to seek as high a level of current income exempt from federal income tax and New York State and City personal income taxes as Putnam Management believes is consistent with preservation of capital. The fund invests mainly in bonds that pay interest that is exempt from federal income tax and New York State and City personal income taxes (but that may be subject to federal alternative minimum tax (AMT)), are investment-grade in quality, and have intermediate- to long-term maturities (i.e., three years or longer). Under normal circumstances, Putnam Management invests so that at least 90% of the fund’s income distributions are exempt from federal income tax and New York State and City personal income taxes, except during times of adverse market conditions, when more than 10% of the fund’s income distributions could be subject to these taxes. Such tax-exempt investments in which the fund invests are issued by or for states, territories or possessions of the United States or by their political subdivisions, agencies, authorities or other government entities, and the income from these investments is exempt from both federal and New York State personal income tax. This investment policy cannot be changed without the approval of the fund’s shareholders. Putnam Management may consider, among other factors, credit, interest rate and prepayment risks, as well as general market conditions, when deciding whether to buy or sell investments.
The fund offers class A, class B, class C, class M, class R6 and class Y shares. Purchases of class B shares are closed to new and existing investors except by exchange from class B shares of another Putnam fund or through dividend and/or capital gains reinvestment. Class A and class M shares are sold with a maximum front-end sales charge of 4.00% and 3.25%, respectively. Class A shares generally are not subject to a contingent deferred sales charge, and class M, class R6 and class Y shares are not subject to a contingent deferred sales charge. Class B shares, which convert to class A shares after approximately eight years, are not subject to a front-end sales charge and are subject to a contingent deferred sales charge if those shares are redeemed within six years of purchase. Class C shares are subject to a one-year 1.00% contingent deferred sales charge and generally convert to class A shares after approximately ten years. The expenses for class A, class B, class C and class M shares may differ based on the distribution fee of each class, which is identified in Note 2. Class R6 and class Y shares, which are sold at net asset value, are generally subject to the same expenses as class A, class B, class C and class M shares, but do not bear a distribution fee, and in the case of class R6 shares, bear a lower investor servicing fee, which is identified in Note 2. Class R6 and class Y shares are not available to all investors.
In the normal course of business, the fund enters into contracts that may include agreements to indemnify another party under given circumstances. The fund’s maximum exposure under these arrangements is unknown as this would involve future claims that may be, but have not yet been, made against the fund. However, the fund’s management team expects the risk of material loss to be remote.
The fund has entered into contractual arrangements with an investment adviser, administrator, distributor, shareholder servicing agent and custodian, who each provide services to the fund. Unless expressly stated otherwise, shareholders are not parties to, or intended beneficiaries of these contractual arrangements, and these contractual arrangements are not intended to create any shareholder right to enforce them against the service providers or to seek any remedy under them against the service providers, either directly or on behalf of the fund.
Under the fund’s Amended and Restated Agreement and Declaration of Trust, any claims asserted against or on behalf of the Putnam Funds, including claims against Trustees and Officers, must be brought in state and federal courts located within the Commonwealth of Massachusetts.
Note 1: Significant accounting policies
The following is a summary of significant accounting policies consistently followed by the fund in the preparation of its financial statements. The preparation of financial statements is in conformity with accounting principles generally accepted in the United States of America and requires management to make estimates and assumptions that affect the reported amounts of assets and liabilities in the financial statements and the reported amounts of increases and decreases in net assets from operations. Actual results could differ from those
|
| New York Tax Exempt Income Fund 35 |
estimates. Subsequent events after the Statement of assets and liabilities date through the date that the financial statements were issued have been evaluated in the preparation of the financial statements.
Investment income, realized and unrealized gains and losses and expenses of the fund are borne pro-rata based on the relative net assets of each class to the total net assets of the fund, except that each class bears expenses unique to that class (including the distribution fees applicable to such classes). Each class votes as a class only with respect to its own distribution plan or other matters on which a class vote is required by law or determined by the Trustees. If the fund were liquidated, shares of each class would receive their pro-rata share of the net assets of the fund. In addition, the Trustees declare separate dividends on each class of shares.
Security valuationPortfolio securities and other investments are valued using policies and procedures adopted by the Board of Trustees. The Trustees have formed a Pricing Committee to oversee the implementation of these procedures and have delegated responsibility for valuing the fund’s assets in accordance with these procedures to Putnam Management. Putnam Management has established an internal Valuation Committee that is responsible for making fair value determinations, evaluating the effectiveness of the pricing policies of the fund and reporting to the Pricing Committee.
Tax-exempt bonds and notes are generally valued on the basis of valuations provided by an independent pricing service approved by the Trustees. Such services use information with respect to transactions in bonds, quotations from bond dealers, market transactions in comparable securities and various relationships between securities in determining value. These securities will generally be categorized as Level 2.
Market quotations are not considered to be readily available for certain debt obligations (including short-term investments with remaining maturities of 60 days or less) and other investments; such investments are valued on the basis of valuations furnished by an independent pricing service approved by the Trustees or dealers selected by Putnam Management. Such services or dealers determine valuations for normal institutional-size trading units of such securities using methods based on market transactions for comparable securities and various relationships, generally recognized by institutional traders, between securities (which consider such factors as security prices, yields, maturities and ratings). These securities will generally be categorized as Level 2. Securities quoted in foreign currencies, if any, are translated into U.S. dollars at the current exchange rate.
To the extent a pricing service or dealer is unable to value a security or provides a valuation that Putnam Management does not believe accurately reflects the security’s fair value, the security will be valued at fair value by Putnam Management in accordance with policies and procedures approved by the Trustees. Certain investments, including certain restricted and illiquid securities and derivatives, are also valued at fair value following procedures approved by the Trustees. These valuations consider such factors as significant market or specific security events such as interest rate or credit quality changes, various relationships with other securities, discount rates, U.S. Treasury, U.S. swap and credit yields, index levels, convexity exposures, recovery rates, sales and other multiples and resale restrictions. These securities are classified as Level 2 or as Level 3 depending on the priority of the significant inputs.
To assess the continuing appropriateness of fair valuations, the Valuation Committee reviews and affirms the reasonableness of such valuations on a regular basis after considering all relevant information that is reasonably available. Such valuations and procedures are reviewed periodically by the Trustees. The fair value of securities is generally determined as the amount that the fund could reasonably expect to realize from an orderly disposition of such securities over a reasonable period of time. By its nature, a fair value price is a good faith estimate of the value of a security in a current sale and does not reflect an actual market price, which may be different by a material amount.
Security transactions and related investment incomeSecurity transactions are recorded on the trade date (the date the order to buy or sell is executed). Gains or losses on securities sold are determined on the identified cost basis.
Interest income is recorded on the accrual basis. All premiums/discounts are amortized/accreted on a yield-to-maturity basis. The premium in excess of the call price, if any, is amortized to the call date; thereafter, any remaining premium is amortized to maturity.
Futures contractsThe fund uses futures contracts for hedging treasury term structure risk and for yield curve positioning.
The potential risk to the fund is that the change in value of futures contracts may not correspond to the change in value of the hedged instruments. In addition, losses may arise from changes in the value of the underlying instruments, if there is an illiquid secondary market for the contracts, if interest or exchange rates move
| |
| 36 New York Tax Exempt Income Fund |
unexpectedly or if the counterparty to the contract is unable to perform. With futures, there is minimal counter-party credit risk to the fund since futures are exchange traded and the exchange’s clearinghouse, as counterparty to all exchange traded futures, guarantees the futures against default. Risks may exceed amounts recognized on the Statement of assets and liabilities. When the contract is closed, the fund records a realized gain or loss equal to the difference between the value of the contract at the time it was opened and the value at the time it was closed.
Futures contracts are valued at the quoted daily settlement prices established by the exchange on which they trade. The fund and the broker agree to exchange an amount of cash equal to the daily fluctuation in the value of the futures contract. Such receipts or payments are known as “variation margin.”
Futures contracts outstanding at period end, if any, are listed after the fund’s portfolio.
Total return swap contractsThe fund entered into OTC and/or centrally cleared total return swap contracts, which are arrangements to exchange a market-linked return for a periodic payment, both based on a notional principal amount, to hedge sector exposure, for gaining exposure to specific sectors and for hedging inflation.
To the extent that the total return of the security, index or other financial measure underlying the transaction exceeds or falls short of the offsetting interest rate obligation, the fund will receive a payment from or make a payment to the counterparty. OTC and/or centrally cleared total return swap contracts are marked to market daily based upon quotations from an independent pricing service or market maker. Any change is recorded as an unrealized gain or loss on OTC total return swaps. Daily fluctuations in the value of centrally cleared total return swaps are settled through a central clearing agent and are recorded in variation margin on the Statement of assets and liabilities and recorded as unrealized gain or loss. Payments received or made are recorded as realized gains or losses. Certain OTC and/or centrally cleared total return swap contracts may include extended effective dates. Payments related to these swap contracts are accrued based on the terms of the contract. The fund could be exposed to credit or market risk due to unfavorable changes in the fluctuation of interest rates or in the price of the underlying security or index, the possibility that there is no liquid market for these agreements or that the counterparty may default on its obligation to perform. The fund’s maximum risk of loss from counterparty risk or central clearing risk is the fair value of the contract. This risk may be mitigated for OTC total return swap contracts by having a master netting arrangement between the fund and the counterparty and for centrally cleared total return swap contracts through the daily exchange of variation margin. There is minimal counterparty risk with respect to centrally cleared total return swap contracts due to the clearinghouse guarantee fund and other resources that are available in the event of a clearing member default. Risk of loss may exceed amounts recognized on the Statement of assets and liabilities.
OTC and/or centrally cleared total return swap contracts outstanding, including their respective notional amounts at period end, if any, are listed after the fund’s portfolio.
Master agreementsThe fund is a party to ISDA (International Swaps and Derivatives Association, Inc.) Master Agreements (Master Agreements) with certain counterparties that govern OTC derivative and foreign exchange contracts entered into from time to time. The Master Agreements may contain provisions regarding, among other things, the parties’ general obligations, representations, agreements, collateral requirements, events of default and early termination. With respect to certain counterparties, in accordance with the terms of the Master Agreements, collateral posted to the fund is held in a segregated account by the fund’s custodian and, with respect to those amounts which can be sold or repledged, is presented in the fund’s portfolio.
Collateral pledged by the fund is segregated by the fund’s custodian and identified in the fund’s portfolio. Collateral can be in the form of cash or debt securities issued by the U.S. Government or related agencies or other securities as agreed to by the fund and the applicable counterparty. Collateral requirements are determined based on the fund’s net position with each counterparty.
Termination events applicable to the fund may occur upon a decline in the fund’s net assets below a specified threshold over a certain period of time. Termination events applicable to counterparties may occur upon a decline in the counterparty’s long-term and short-term credit ratings below a specified level. In each case, upon occurrence, the other party may elect to terminate early and cause settlement of all derivative and foreign exchange contracts outstanding, including the payment of any losses and costs resulting from such early termination, as reasonably determined by the terminating party. Any decision by one or more of the fund’s counterparties to elect early termination could impact the fund’s future derivative activity.
At the close of the reporting period, the fund did not have a net liability position on open derivative contracts subject to the Master Agreements.
|
| New York Tax Exempt Income Fund 37 |
Interfund lendingThe fund, along with other Putnam funds, may participate in an interfund lending program pursuant to an exemptive order issued by the SEC. This program allows the fund to borrow from other Putnam funds that permit such transactions. Interfund lending transactions are subject to each fund’s investment policies and borrowing and lending limits. Interest earned or paid on the interfund lending transaction will be based on the average of certain current market rates. During the reporting period, the fund did not utilize the program.
Lines of creditThe fund participates, along with other Putnam funds, in a $317.5 million unsecured committed line of credit and a $235.5 million unsecured uncommitted line of credit, both provided by State Street. Borrowings may be made for temporary or emergency purposes, including the funding of shareholder redemption requests and trade settlements. Interest is charged to the fund based on the fund’s borrowing at a rate equal to 1.25% plus the higher of (1) the Federal Funds rate and (2) the overnight LIBOR for the committed line of credit and the Federal Funds rate plus 1.30% for the uncommitted line of credit. A closing fee equal to 0.04% of the committed line of credit and 0.04% of the uncommitted line of credit has been paid by the participating funds. In addition, a commitment fee of 0.21% per annum on any unutilized portion of the committed line of credit is allocated to the participating funds based on their relative net assets and paid quarterly. During the reporting period, the fund had no borrowings against these arrangements.
Federal taxesIt is the policy of the fund to distribute all of its income within the prescribed time period and otherwise comply with the provisions of the Internal Revenue Code of 1986, as amended (the Code), applicable to regulated investment companies. It is also the intention of the fund to distribute an amount sufficient to avoid imposition of any excise tax under Section 4982 of the Code.
The fund is subject to the provisions of Accounting Standards Codification 740Income Taxes(ASC 740). ASC 740 sets forth a minimum threshold for financial statement recognition of the benefit of a tax position taken or expected to be taken in a tax return. The fund did not have a liability to record for any unrecognized tax benefits in the accompanying financial statements. No provision has been made for federal taxes on income, capital gains or unrealized appreciation on securities held nor for excise tax on income and capital gains. Each of the fund’s federal tax returns for the prior three fiscal years remains subject to examination by the Internal Revenue Service.
At November 30, 2018, the fund had a capital loss carryover of $11,679,775 available to the extent allowed by the Code to offset future net capital gain, if any. For any carryover, the amount of the carryover and that carryover’s expiration date is:
| | | |
| | Loss carryover | | |
| Short-term | Long-term | Total | Expiration |
| $8,607,759 | $2,562,666 | $11,170,425 | * |
| 509,350 | N/A | 509,350 | November 30, 2019 |
*Under the Regulated Investment Company Modernization Act of 2010, the fund will be permitted to carry forward capital losses incurred in taxable years beginning after December 22, 2010 for an unlimited period. However, any losses incurred will be required to be utilized prior to the losses incurred in pre-enactment tax years. As a result of this ordering rule, pre-enactment capital loss carryforwards may be more likely to expire unused. Additionally, post-enactment capital losses that are carried forward will retain their character as either short-term or long-term capital losses rather than being considered all short-term as under previous law.
Tax cost of investments includes adjustments to net unrealized appreciation (depreciation) which may not necessarily be final tax cost basis adjustments, but closely approximate the tax basis unrealized gains and losses that may be realized and distributed to shareholders. The aggregate identified cost on a tax basis is $933,586,483, resulting in gross unrealized appreciation and depreciation of $46,304,005 and $942,761, respectively, or net unrealized appreciation of $45,361,244.
Distributions to shareholdersIncome dividends are recorded daily by the fund and are paid monthly. Distributions from capital gains, if any, are recorded on the ex-dividend date and paid at least annually. The amount and character of income and gains to be distributed are determined in accordance with income tax regulations which may differ from generally accepted accounting principles. Dividend sources are estimated at the time of declaration. Actual results may vary. Any non-taxable return of capital cannot be determined until final tax calculations are completed after the end of the fund’s fiscal year. Reclassifications are made to the fund’s capital accounts to reflect income and gains available for distribution (or available capital loss carryovers) under income tax regulations.
| |
| 38 New York Tax Exempt Income Fund |
Note 2: Management fee, administrative services and other transactions
The fund pays Putnam Management a management fee (based on the fund’s average net assets and computed and paid monthly) at annual rates that may vary based on the average of the aggregate net assets of all open-end mutual funds sponsored by Putnam Management (excluding net assets of funds that are invested in, or that are invested in by, other Putnam funds to the extent necessary to avoid “double counting” of those assets). Such annual rates may vary as follows:
| | | | |
| 0.590% | of the first $5 billion, | | 0.390% | of the next $50 billion, |
| 0.540% | of the next $5 billion, | | 0.370% | of the next $50 billion, |
| 0.490% | of the next $10 billion, | | 0.360% | of the next $100 billion and |
| 0.440% | of the next $10 billion, | | 0.355% | of any excess thereafter. |
For the reporting period, the management fee represented an effective rate (excluding the impact from any expense waivers in effect) of 0.215% of the fund’s average net assets.
Putnam Management has contractually agreed, through March 30, 2021, to waive fees and/or reimburse the fund’s expenses to the extent necessary to limit the cumulative expenses of the fund, exclusive of brokerage, interest, taxes, investment-related expenses, extraordinary expenses, acquired fund fees and expenses and payments under the fund’s investor servicing contract, investment management contract and distribution plans, on a fiscal year-to-date basis to an annual rate of 0.20% of the fund’s average net assets over such fiscal year-to-date period. During the reporting period, the fund’s expenses were not reduced as a result of this limit.
Putnam Investments Limited (PIL), an affiliate of Putnam Management, is authorized by the Trustees to manage a separate portion of the assets of the fund as determined by Putnam Management from time to time. PIL did not manage any portion of the assets of the fund during the reporting period. If Putnam Management were to engage the services of PIL, Putnam Management would pay a quarterly sub-management fee to PIL for its services at an annual rate of 0.40% of the average net assets of the portion of the fund managed by PIL.
The fund reimburses Putnam Management an allocated amount for the compensation and related expenses of certain officers of the fund and their staff who provide administrative services to the fund. The aggregate amount of all such reimbursements is determined annually by the Trustees.
Custodial functions for the fund’s assets are provided by State Street. Custody fees are based on the fund’s asset level, the number of its security holdings and transaction volumes.
Putnam Investor Services, Inc., an affiliate of Putnam Management, provides investor servicing agent functions to the fund. Putnam Investor Services, Inc. received fees for investor servicing for class A, class B, class C, class M and class Y shares that included (1) a per account fee for each direct and underlying non-defined contribution account (retail account) of the fund; (2) a specified rate of the fund’s assets attributable to defined contribution plan accounts; and (3) a specified rate based on the average net assets in retail accounts. Putnam Investor Services, Inc. has agreed that the aggregate investor servicing fees for each fund’s retail and defined contribution accounts for these share classes will not exceed an annual rate of 0.25% of the fund’s average assets attributable to such accounts.
Class R6 shares paid a monthly fee based on the average net assets of class R6 shares at an annual rate of 0.05%.
During the reporting period, the expenses for each class of shares related to investor servicing fees were as follows:
| | | | |
| Class A | $246,528 | | Class R6 | 3,176 |
| Class B | 1,643 | | Class Y | 35,286 |
| Class C | 13,519 | | Total | $300,503 |
| Class M | 351 | | | |
The fund has entered into expense offset arrangements with Putnam Investor Services, Inc. and State Street whereby Putnam Investor Services, Inc.’s and State Street’s fees are reduced by credits allowed on cash balances. For the reporting period, the fund’s expenses were reduced by $46,376 under the expense offset arrangements.
Each Independent Trustee of the fund receives an annual Trustee fee, of which $695, as a quarterly retainer, has been allocated to the fund, and an additional fee for each Trustees meeting attended. Trustees also are reimbursed for expenses they incur relating to their services as Trustees.
|
| New York Tax Exempt Income Fund 39 |
The fund has adopted a Trustee Fee Deferral Plan (the Deferral Plan) which allows the Trustees to defer the receipt of all or a portion of Trustees fees payable on or after July 1, 1995. The deferred fees remain invested in certain Putnam funds until distribution in accordance with the Deferral Plan.
The fund has adopted an unfunded noncontributory defined benefit pension plan (the Pension Plan) covering all Trustees of the fund who have served as a Trustee for at least five years and were first elected prior to 2004. Benefits under the Pension Plan are equal to 50% of the Trustee’s average annual attendance and retainer fees for the three years ended December 31, 2005. The retirement benefit is payable during a Trustee’s lifetime, beginning the year following retirement, for the number of years of service through December 31, 2006. Pension expense for the fund is included in Trustee compensation and expenses in the Statement of operations. Accrued pension liability is included in Payable for Trustee compensation and expenses in the Statement of assets and liabilities. The Trustees have terminated the Pension Plan with respect to any Trustee first elected after 2003.
The fund has adopted distribution plans (the Plans) with respect to the following share classes pursuant to Rule 12b–1 under the Investment Company Act of 1940. The purpose of the Plans is to compensate Putnam Retail Management Limited Partnership, an indirect wholly-owned subsidiary of Putnam Investments, LLC, for services provided and expenses incurred in distributing shares of the fund. The Plans provide payments by the fund to Putnam Retail Management Limited Partnership at an annual rate of up to the following amounts (Maximum %) of the average net assets attributable to each class. The Trustees have approved payment by the fund at the following annual rate (Approved %) of the average net assets attributable to each class. During the reporting period, the class-specific expenses related to distribution fees were as follows:
| | | |
| | Maximum % | Approved % | Amount |
| Class A | 0.35% | * | $856,971 |
| Class B | 1.00% | 0.85% | 22,149 |
| Class C | 1.00% | 1.00% | 214,409 |
| Class M | 1.00% | 0.50% | 2,779 |
| Total | | | $1,096,308 |
*Equals the weighted average of (i) 0.20% of the net assets of the fund attributable to class A shares purchased and paid for prior to April 1, 2005 and (ii) 0.25% of all other net assets of the fund attributable to class A shares.
For the reporting period, Putnam Retail Management Limited Partnership, acting as underwriter, received net commissions of $19,736 and $4 from the sale of class A and class M shares, respectively, and received $697 and $28 in contingent deferred sales charges from redemptions of class B and class C shares, respectively.
A deferred sales charge of up to 1.00% is assessed on certain redemptions of class A shares. For the reporting period, Putnam Retail Management Limited Partnership, acting as underwriter, received $92 on class A redemptions.
Note 3: Purchases and sales of securities
During the reporting period, the cost of purchases and the proceeds from sales, excluding short-term investments, were as follows:
| | |
| | Cost of purchases | Proceeds from sales |
| Investments in securities (Long-term) | $127,105,117 | $153,771,719 |
| U.S. government securities (Long-term) | — | — |
| Total | $127,105,117 | $153,771,719 |
The fund may purchase or sell investments from or to other Putnam funds in the ordinary course of business, which can reduce the fund’s transaction costs, at prices determined in accordance with SEC requirements and policies approved by the Trustees. During the reporting period, purchases or sales of long-term securities from or to other Putnam funds, if any, did not represent more than 5% of the fund’s total cost of purchases and/or total proceeds from sales.
| |
| 40 New York Tax Exempt Income Fund |
Note 4: Capital shares
At the close of the reporting period, there were an unlimited number of shares of beneficial interest authorized. Transactions, including, if applicable, direct exchanges pursuant to share conversions, in capital shares were as follows:
| | | | |
| | SIX MONTHS ENDED 5/31/19 | YEAR ENDED 11/30/18 |
| Class A | Shares | Amount | Shares | Amount |
| Shares sold | 4,407,568 | $37,196,418 | 6,128,578 | $51,354,985 |
| Shares issued in connection with | | | | |
| reinvestment of distributions | 1,058,388 | 8,952,743 | 2,328,557 | 19,491,826 |
| | 5,465,956 | 46,149,161 | 8,457,135 | 70,846,811 |
| Shares repurchased | (7,102,344) | (59,760,968) | (15,774,929) | (131,995,058) |
| Net decrease | (1,636,388) | $(13,611,807) | (7,317,794) | $(61,148,247) |
| |
| | SIX MONTHS ENDED 5/31/19 | YEAR ENDED 11/30/18 |
| Class B | Shares | Amount | Shares | Amount |
| Shares sold | 209 | $1,763 | 13,693 | $116,831 |
| Shares issued in connection with | | | | |
| reinvestment of distributions | 5,911 | 49,853 | 16,358 | 136,715 |
| | 6,120 | 51,616 | 30,051 | 253,546 |
| Shares repurchased | (102,103) | (860,553) | (317,610) | (2,655,016) |
| Net decrease | (95,983) | $(808,937) | (287,559) | $(2,401,470) |
| |
| | SIX MONTHS ENDED 5/31/19 | YEAR ENDED 11/30/18 |
| Class C | Shares | Amount | Shares | Amount |
| Shares sold | 409,591 | $3,449,545 | 474,778 | $3,966,473 |
| Shares issued in connection with | | | | |
| reinvestment of distributions | 45,622 | 385,751 | 117,196 | 981,482 |
| | 455,213 | 3,835,296 | 591,974 | 4,947,955 |
| Shares repurchased | (620,843) | (5,226,958) | (2,560,542) | (21,438,507) |
| Net decrease | (165,630) | $(1,391,662) | (1,968,568) | $(16,490,552) |
| |
| | SIX MONTHS ENDED 5/31/19 | YEAR ENDED 11/30/18 |
| Class M | Shares | Amount | Shares | Amount |
| Shares sold | 208 | $1,760 | 12,244 | $102,723 |
| Shares issued in connection with | | | | |
| reinvestment of distributions | 1,628 | 13,786 | 3,783 | 31,703 |
| | 1,836 | 15,546 | 16,027 | 134,426 |
| Shares repurchased | (1,370) | (11,589) | (27,704) | (231,077) |
| Net increase (decrease) | 466 | $3,957 | (11,677) | $(96,651) |
|
| New York Tax Exempt Income Fund 41 |
| | | | |
| | | | FOR THE PERIOD 5/22/18 |
| | | | (COMMENCEMENT OF OPERATIONS) |
| | SIX MONTHS ENDED 5/31/19 | TO 11/30/18 |
| Class R6 | Shares | Amount | Shares | Amount |
| Shares sold | 9,659,202 | $82,880,160 | 439,318 | $3,615,295 |
| Shares issued in connection with | | | | |
| reinvestment of distributions | 23,133 | 198,587 | 1,959 | 16,145 |
| | 9,682,335 | 83,078,747 | 441,277 | 3,631,440 |
| Shares repurchased | (150,548) | (1,281,813) | (2,834) | (23,314) |
| Net increase | 9,531,787 | $81,796,934 | 438,443 | $3,608,126 |
| |
| | SIX MONTHS ENDED 5/31/19 | YEAR ENDED 11/30/18 |
| Class Y | Shares | Amount | Shares | Amount |
| Shares sold | 3,409,902 | $28,717,953 | 5,754,682 | $48,216,998 |
| Shares issued in connection with | | | | |
| reinvestment of distributions | 180,318 | 1,524,119 | 383,565 | 3,210,265 |
| | 3,590,220 | 30,242,072 | 6,138,247 | 51,427,263 |
| Shares repurchased | (11,452,337) | (97,828,179) | (4,749,322) | (39,661,655) |
| Net increase (decrease) | (7,862,117) | $(67,586,107) | 1,388,925 | $11,765,608 |
At the close of the reporting period, Putnam Investments, LLC owned 1,236 class R6 shares of the fund (0.01% of class R6 shares outstanding), valued at $10,667.
Note 5: Market, credit and other risks
In the normal course of business, the fund trades financial instruments and enters into financial transactions where risk of potential loss exists due to changes in the market (market risk) or failure of the contracting party to the transaction to perform (credit risk). The fund may be exposed to additional credit risk that an institution or other entity with which the fund has unsettled or open transactions will default. The fund focuses a majority of its investments in the state of New York and may be affected by economic and political developments in that state.
Note 6: Summary of derivative activity
The volume of activity for the reporting period for any derivative type that was held during the period is listed below and was based on an average of the holdings at the end of each fiscal quarter:
| |
| Futures contracts (number of contracts) | 20 |
| OTC total return swap contracts (notional) | $8,600,000 |
The following is a summary of the fair value of derivative instruments as of the close of the reporting period:
| | | | |
| Fair value of derivative instruments as of the close of the reporting period | |
| | ASSET DERIVATIVES | LIABILITY DERIVATIVES |
| Derivatives not | | | | |
| accounted for as | Statement of | | Statement of | |
| hedging instruments | assets and | | assets and | |
| under ASC 815 | liabilities location | Fair value | liabilities location | Fair value |
| Interest rate contracts | Receivables | $351,400 | Payables | $— |
| Total | | $351,400 | | $— |
| |
| 42 New York Tax Exempt Income Fund |
The following is a summary of realized and change in unrealized gains or losses of derivative instruments in the Statement of operations for the reporting period (Note 1):
| | |
| Amount of realized gain or (loss) on derivatives recognized in net gain or (loss) on investments | |
| Derivatives not accounted for as | | |
| hedging instruments under ASC 815 | Futures | Total |
| Interest rate contracts | $136,072 | $136,072 |
| Total | $136,072 | $136,072 |
| |
| Change in unrealized appreciation or (depreciation) on derivatives recognized in net gain or (loss) |
| on investments | | |
| Derivatives not accounted for as | | |
| hedging instruments under ASC 815 | Swaps | Total |
| Interest rate contracts | $351,400 | $351,400 |
| Total | $351,400 | $351,400 |
Note 7: Offsetting of financial and derivative assets and liabilities
The following table summarizes any derivatives, repurchase agreements and reverse repurchase agreements, at the end of the reporting period, that are subject to an enforceable master netting agreement or similar agreement. For securities lending transactions or borrowing transactions associated with securities sold short, if any, see Note 1. For financial reporting purposes, the fund does not offset financial assets and financial liabilities that are subject to the master netting agreements in the Statement of assets and liabilities.
| | |
| | Bank of
America N.A. | Total |
| Assets: | | |
| OTC Total return swap contracts*# | $351,400 | $351,400 |
| Total Assets | $351,400 | $351,400 |
| Liabilities: | | |
| OTC Total return swap contracts*# | $— | $— |
| Total Liabilities | $— | $— |
| Total Financial and Derivative Net Assets | $351,400 | $351,400 |
| Total collateral received (pledged)†## | $174,664 | |
| Net amount | $176,736 | |
| Controlled collateral received (including | | |
| TBA commitments)** | $174,664 | $174,664 |
| Uncontrolled collateral received | $— | $— |
| Collateral (pledged) (including TBA commitments)** | $— | $— |
*Excludes premiums, if any. Included in unrealized appreciation and depreciation on OTC swap contracts on the Statement of assets and liabilities.
**Included with Investments in securities on the Statement of assets and liabilities.
†Additional collateral may be required from certain brokers based on individual agreements.
#Covered by master netting agreement (Note 1).
##Any over-collateralization of total financial and derivative net assets is not shown. Collateral may include amounts related to unsettled agreements.
|
| New York Tax Exempt Income Fund 43 |
Services for shareholders
Investor services
Systematic investment planTell us how much you wish to invest regularly — weekly, semimonthly, or monthly — and the amount you choose will be transferred automatically from your checking or savings account. There’s no additional fee for this service, and you can suspend it at any time. This plan may be a great way to save for college expenses or to plan for your retirement.
Please note that regular investing does not guarantee a profit or protect against loss in a declining market. Before arranging a systematic investment plan, consider your financial ability to continue making purchases in periods when prices are low.
Systematic exchangeYou can make regular transfers from one Putnam fund to another Putnam fund. There are no additional fees for this service, and you can cancel or change your options at any time.
Dividends PLUSYou can choose to have the dividend distributions from one of your Putnam funds automatically reinvested in another Putnam fund at no additional charge.
Free exchange privilegeYou can exchange money between Putnam funds free of charge, as long as they are the same class of shares. A signature guarantee is required if you are exchanging more than $500,000. The fund reserves the right to revise or terminate the exchange privilege.
Reinstatement privilegeIf you’ve sold Putnam shares or received a check for a dividend or capital gain, you may reinvest the proceeds with Putnam within 90 days of thetransaction and they will be reinvested at the fund’s current net asset value — with no sales charge. However, reinstatement of class B shares may have special tax consequences. Ask your financial or tax representative for details.
Check-writing serviceYou have ready access to many Putnam accounts. It’s as simple as writing a check, and there are no special fees or service charges. For more information about the check-writing service, call Putnam or visit our website.
Dollar cost averagingWhen you’re investing for long-term goals, it’s time, not timing, that counts. Investing on a systematic basis is a better strategy than trying to figure out when the markets will go up or down. This means investing the same amount of money regularly over a long period. This method of investing is called dollar cost averaging. When a fund’s share price declines, your investment dollars buy more shares at lower prices. When it increases, they buy fewer shares. Over time, you will pay a lower average price per share.
For more information
Visit the Individual Investors section at putnam.comA secure section of our website contains complete information on your account, including balances and transactions, updated daily. You may also conduct transactions, such as exchanges, additional investments, and address changes. Log on today to get your password.
Call us toll free at 1-800-225-1581Ask a helpful Putnam representative or your financial advisor for details about any of these or other services, or see your prospectus.
| |
| 44 New York Tax Exempt Income Fund |
Fund information
Founded over 80 years ago, Putnam Investments was built around the concept that a balance between risk and reward is the hallmark of a well-rounded financial program. We manage funds across income, value, blend, growth, sustainable, asset allocation, absolute return, and global sector categories.
| | |
| Investment Manager | Trustees | Michael J. Higgins |
| Putnam Investment | Kenneth R. Leibler,Chair | Vice President, Treasurer, |
| Management, LLC | Liaquat Ahamed | and Clerk |
| 100 Federal Street | Ravi Akhoury | |
| Boston, MA 02110 | Barbara M. Baumann | Janet C. Smith |
| | Katinka Domotorffy | Vice President, |
| Investment Sub-Advisor | Catharine Bond Hill | Principal Financial Officer, |
| Putnam Investments Limited | Paul L. Joskow | Principal Accounting Officer, |
| 16 St James’s Street | Robert E. Patterson | and Assistant Treasurer |
| London, England SW1A 1ER | George Putnam, III | |
| | Robert L. Reynolds | Susan G. Malloy |
| Marketing Services | Manoj P. Singh | Vice President and |
| Putnam Retail Management | | Assistant Treasurer |
| 100 Federal Street | Officers | |
| Boston, MA 02110 | Robert L. Reynolds | Mark C. Trenchard |
| | President | Vice President and |
| Custodian | | BSA Compliance Officer |
| State Street Bank | Jonathan S. Horwitz | |
| and Trust Company | Executive Vice President, | Nancy E. Florek |
| | Principal Executive Officer, | Vice President, Director of |
| Legal Counsel | and Compliance Liaison | Proxy Voting and Corporate |
| Ropes & Gray LLP | | Governance, Assistant Clerk, |
| | Robert T. Burns | and Assistant Treasurer |
| Vice President and | |
| | Chief Legal Officer | Denere P. Poulack |
| | | Assistant Vice President, Assistant |
| | James F. Clark | Clerk, and Assistant Treasurer |
| | Vice President and | |
| | Chief Compliance Officer | |
This report is for the information of shareholders of Putnam New York Tax Exempt Income Fund. It may also be used as sales literature when preceded or accompanied by the current prospectus, the most recent copy of Putnam’s Quarterly Performance Summary, and Putnam’s Quarterly Ranking Summary. For more recent performance, please visit putnam.com. Investors should carefully consider the investment objectives, risks, charges, and expenses of a fund, which are described in its prospectus. For this and other information or to request a prospectus or summary prospectus, call 1-800-225-1581 toll free. Please read the prospectus carefully before investing. The fund’s Statement of Additional Information contains additional information about the fund’s Trustees and is available without charge upon request by calling 1-800-225-1581.

| |
| Item 3. Audit Committee Financial Expert: |
| |
| Item 4. Principal Accountant Fees and Services: |
| |
| Item 5. Audit Committee of Listed Registrants |
| |
| Item 6. Schedule of Investments: |
| |
| The registrant's schedule of investments in unaffiliated issuers is included in the report to shareholders in Item 1 above. |
| |
| Item 7. Disclosure of Proxy Voting Policies and Procedures For Closed-End Management Investment Companies: |
| |
| Item 8. Portfolio Managers of Closed-End Investment Companies |
| |
| Item 9. Purchases of Equity Securities by Closed-End Management Investment Companies and Affiliated Purchasers: |
| |
| Item 10. Submission of Matters to a Vote of Security Holders: |
| |
| Item 11. Controls and Procedures: |
| |
| (a) The registrant's principal executive officer and principal financial officer have concluded, based on their evaluation of the effectiveness of the design and operation of the registrant's disclosure controls and procedures as of a date within 90 days of the filing date of this report, that the design and operation of such procedures are generally effective to provide reasonable assurance that information required to be disclosed by the registrant in this report is recorded, processed, summarized and reported within the time periods specified in the Commission's rules and forms. |
| |
| (b) Changes in internal control over financial reporting: Not applicable |
| |
| Item 12. Disclosures of Securities Lending Activities for Closed-End Investment Companies: |
| |
| (a)(2) Separate certifications for the principal executive officer and principal financial officer of the registrant as required by Rule 30a-2(a) under the Investment Company Act of 1940, as amended, are filed herewith. |
| |
| (b) The certifications required by Rule 30a-2(b) under the Investment Company Act of 1940, as amended, are filed herewith. |
| |
| Pursuant to the requirements of the Securities Exchange Act of 1934 and the Investment Company Act of 1940, the registrant has duly caused this report to be signed on its behalf by the undersigned, thereunto duly authorized. |
| |
| Putnam New York Tax Exempt Income Fund |
| |
| By (Signature and Title): |
| |
| /s/ Janet C. Smith
Janet C. Smith
Principal Accounting Officer
|
| |
| Pursuant to the requirements of the Securities Exchange Act of 1934 and the Investment Company Act of 1940, this report has been signed below by the following persons on behalf of the registrant and in the capacities and on the dates indicated. |
| |
| By (Signature and Title): |
| |
| /s/ Jonathan S. Horwitz
Jonathan S. Horwitz
Principal Executive Officer
|
| |
| By (Signature and Title): |
| |
| /s/ Janet C. Smith
Janet C. Smith
Principal Financial Officer
|