
Corporate Overview and Q1 2014 Financial Results
Safe Harbor Disclosure The presentations made in this document, including our annual outlook, contain projections or other forward-looking statements regarding management’s expectations about future events or the future financial performance of SVB Financial Group (“the Company”), as well as future economic, market and tax conditions. Forward-looking statements are statements that are not historical facts. We wish to caution you that such statements are just predictions and actual events or results may differ materially, due to changes in economic, business and regulatory factors and trends. We refer you to the documents the Company files from time to time with the Securities and Exchange Commission, including: (i) our latest Annual Report on Form 10-K for the year ended December 31, 2013, which was filed on February 27, 2014; (ii) our latest Quarterly Report on Form 10-Q; and (iii) our most recent earnings release filed on Form 8-K. These documents contain and identify important risk factors that could cause the Company’s actual results to differ materially from those contained in our projections or other forward-looking statements. All subsequent written or oral forward-looking statements attributable to the Company or persons acting on its behalf are expressly qualified in their entirety by these cautionary statements. All forward-looking statements included in this presentation are made only as of the filing date of this document and the Company undertakes no obligation to update such forward-looking statements. 2
Overview ▶ SVB’s Unique Model ▶ Strong Performance ▶ Growth Initiatives ▶ Outlook 3

Our Mission ▶ Build Deep Relationships ▶ Give Advice ▶ Make It Easy To Do Business With Us ▶ Do Different To increase our clients’ probability of success 4

Differentiated Business Model ▶ Focus on “innovation” markets ▶ Balance sheet lender ▶ Strong deposit franchise ▶ Diversified revenue streams Leader ▶ Leading market share ▶ More than 600 venture firm clients ▶ The bank for innovation companies ▶ Global Established Company ▶ 28 U.S. and seven international offices ▶ $27.8 billion in total assets ▶ $50.8 billion in total client funds 1) Average balances as of 3/31/2014 2) Total client funds consists of on-balance-sheet deposits and off-balance-sheet client investment funds (1) A Unique Financial Services Company 5 (2) (1)
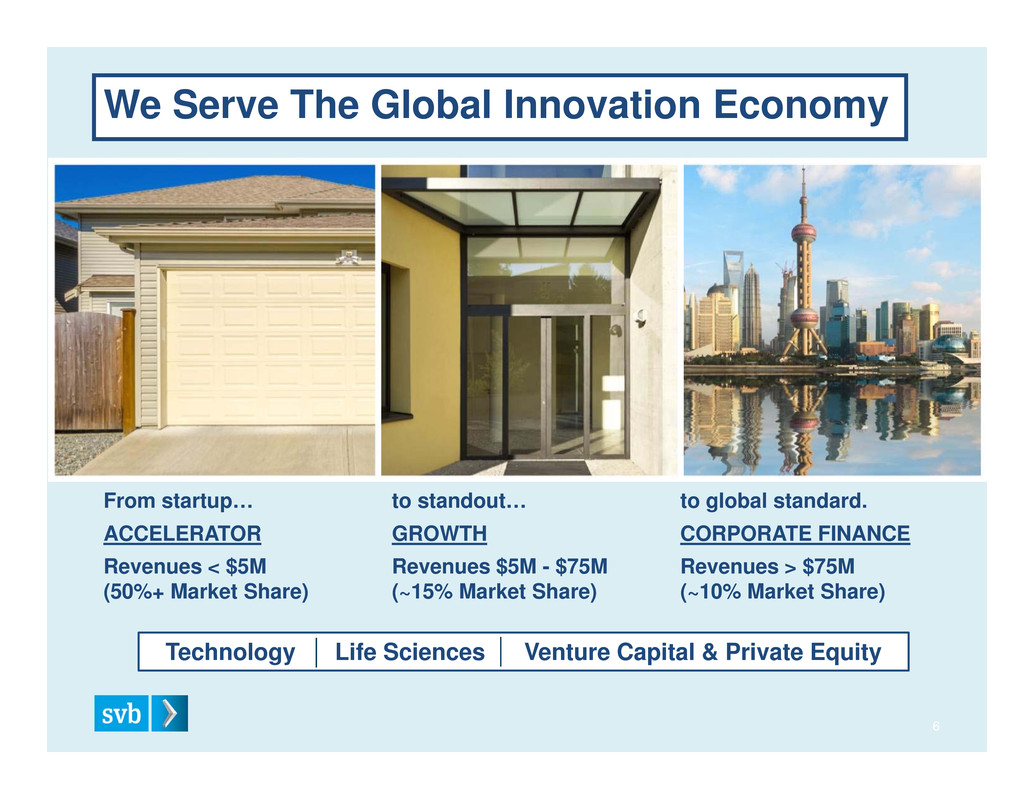
From startup… ACCELERATOR Revenues < $5M (50%+ Market Share) to standout… GROWTH Revenues $5M - $75M (~15% Market Share) to global standard. CORPORATE FINANCE Revenues > $75M (~10% Market Share) We Serve The Global Innovation Economy 6 Technology Life Sciences Venture Capital & Private Equity

We see continued momentum… ▶ Positive environment for our clients • Healthy funding environment for new companies • Strong exit markets; healthy buyout and acquisition activity ▶ Continued steady new client acquisition ▶ Strong competitive position ▶ Demonstrated ability to execute on our plans for growth, regardless of the interest rate environment ... and some challenges. ▶ Continued low interest rates ▶ Complex regulatory environment ▶ Competitive pressure on pricing ▶ Lingering macro-economic uncertainty 2014 Drivers 7

Diversified Growth Across the Business 8 GLOBAL MARKETS & REACH Israel GLOBAL PLATFORM Global Bank Platforms Ongoing IT Infrastructure Enhancements Enhanced Global Payment Capabilities Enhanced On-line/ Mobile Channels PRODUCT LINES Expanded Banking Network New Payment Solutions New Products & Services Enhanced Credit Solutions CLIENT FOCUS Client ExperienceCorporate Finance Segment Growth Segment Private Bank G r o w t h I n i t i a t i v e s G r o w t h I n i t i a t i v e s S o l u t i o n s S o l u t i o n s F o u n d a t i o n F o u n d a t i o n Global Market Development ChinaUK and Europe U.S.
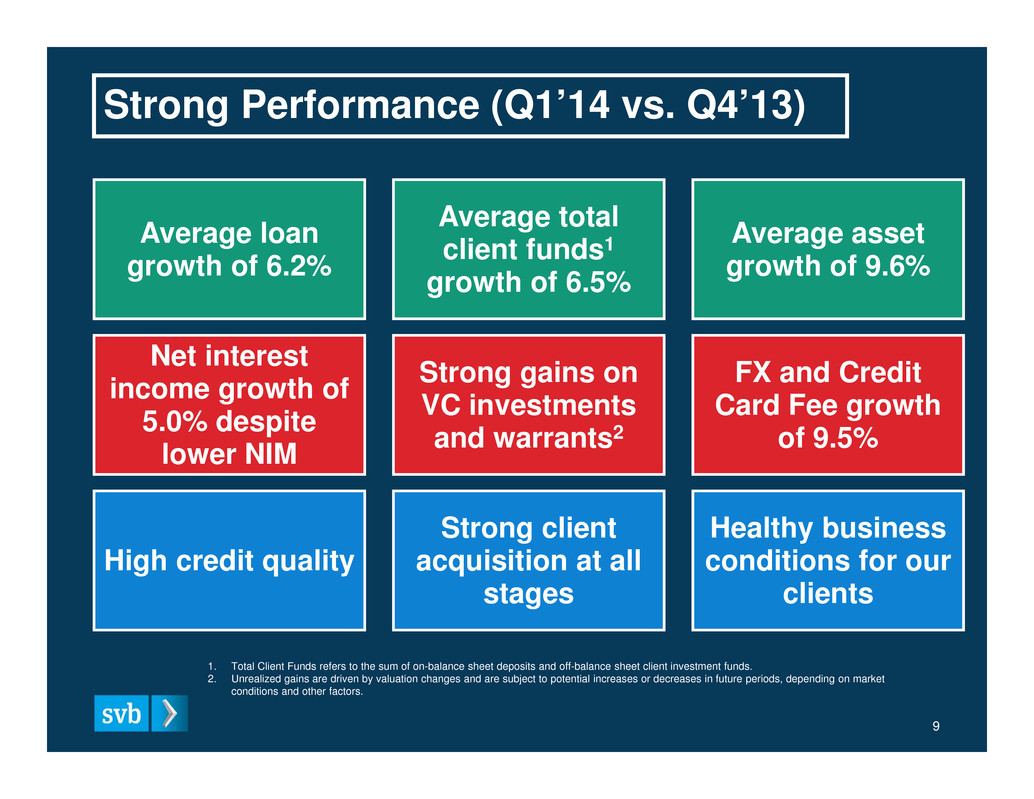
Strong Performance (Q1’14 vs. Q4’13) Average loan growth of 6.2% Strong client acquisition at all stages FX and Credit Card Fee growth of 9.5% Strong gains on VC investments and warrants2 Net interest income growth of 5.0% despite lower NIM High credit quality Average total client funds1 growth of 6.5% Healthy business conditions for our clients Average asset growth of 9.6% 9 1. Total Client Funds refers to the sum of on-balance sheet deposits and off-balance sheet client investment funds. 2. Unrealized gains are driven by valuation changes and are subject to potential increases or decreases in future periods, depending on market conditions and other factors.
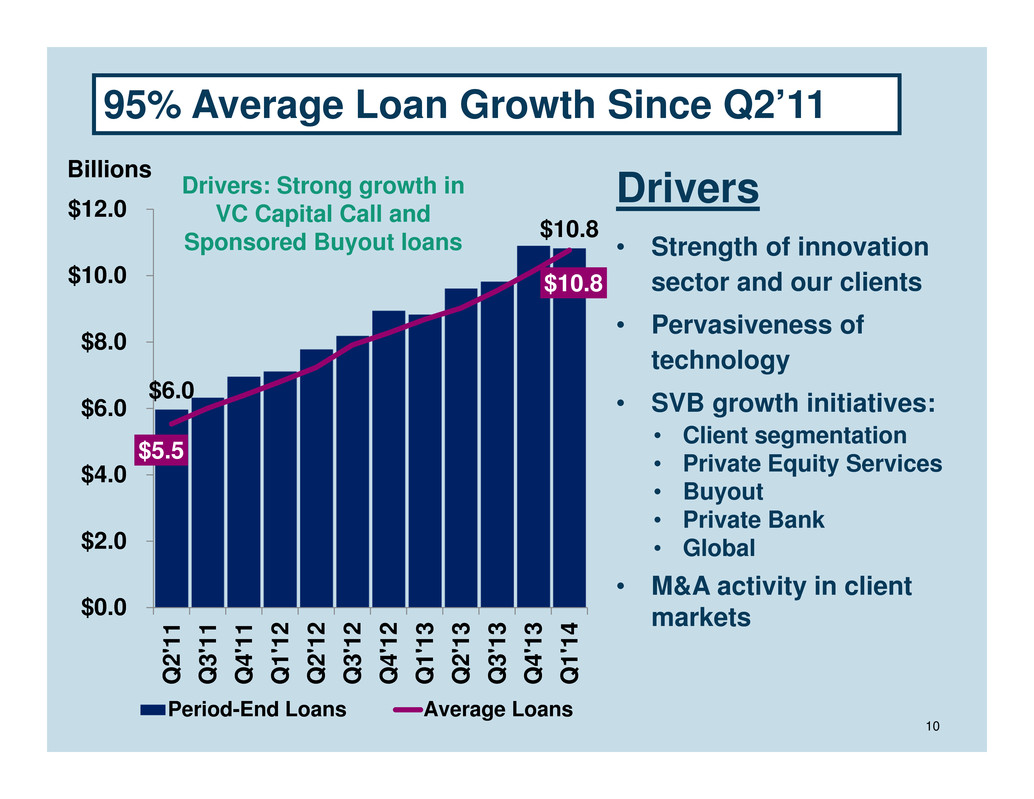
95% Average Loan Growth Since Q2’11 $6.0 $10.8 $5.5 $10.8 $0.0 $2.0 $4.0 $6.0 $8.0 $10.0 $12.0 Q 2 ' 1 1 Q 3 ' 1 1 Q 4 ' 1 1 Q 1 ' 1 2 Q 2 ' 1 2 Q 3 ' 1 2 Q 4 ' 1 2 Q 1 ' 1 3 Q 2 ' 1 3 Q 3 ' 1 3 Q 4 ' 1 3 Q 1 ' 1 4 Period-End Loans Average Loans Drivers • Strength of innovation sector and our clients • Pervasiveness of technology • SVB growth initiatives: • Client segmentation • Private Equity Services • Buyout • Private Bank • Global • M&A activity in client markets 10 Drivers: Strong growth in VC Capital Call and Sponsored Buyout loans Billions
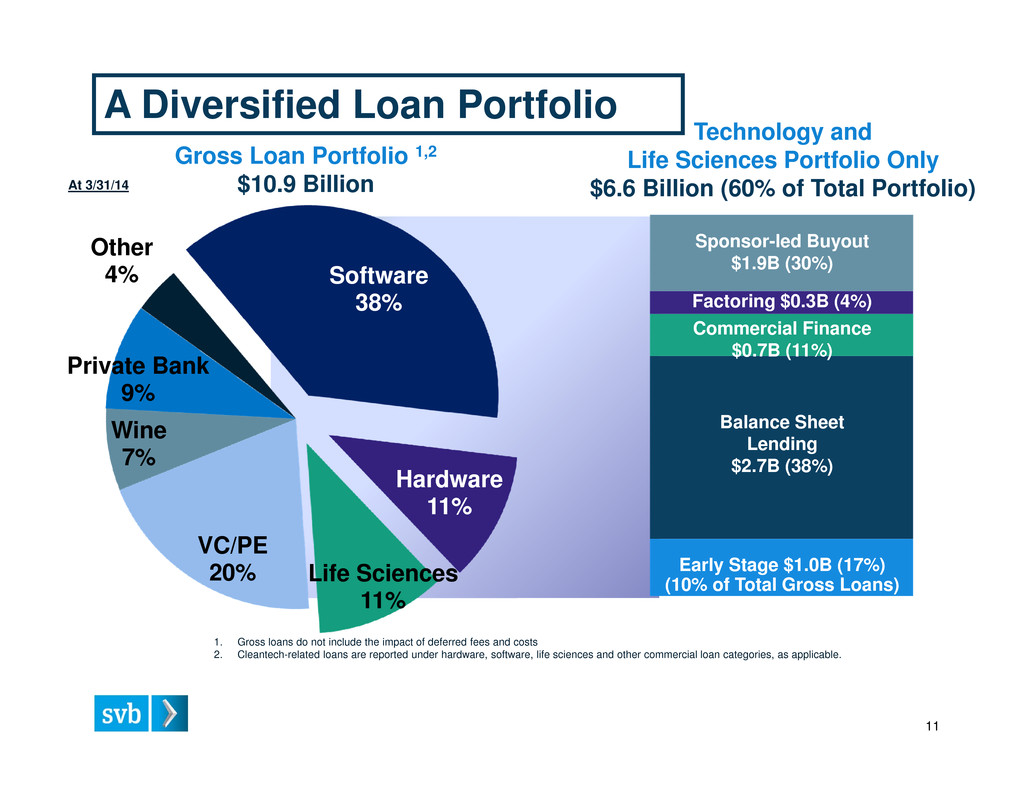
A Diversified Loan Portfolio Software 38% Hardware 11% Life Sciences 11% VC/PE 20% Wine 7% Private Bank 9% Other 4% Sponsor-led Buyout $1.9B (30%) Factoring $0.3B (4%) Commercial Finance $0.7B (11%) Balance Sheet Lending $2.7B (38%) Early Stage $1.0B (17%) (10% of Total Gross Loans) Technology and Life Sciences Portfolio Only $6.6 Billion (60% of Total Portfolio) Gross Loan Portfolio 1,2 $10.9 Billion 1. Gross loans do not include the impact of deferred fees and costs 2. Cleantech-related loans are reported under hardware, software, life sciences and other commercial loan categories, as applicable. 11 At 3/31/14
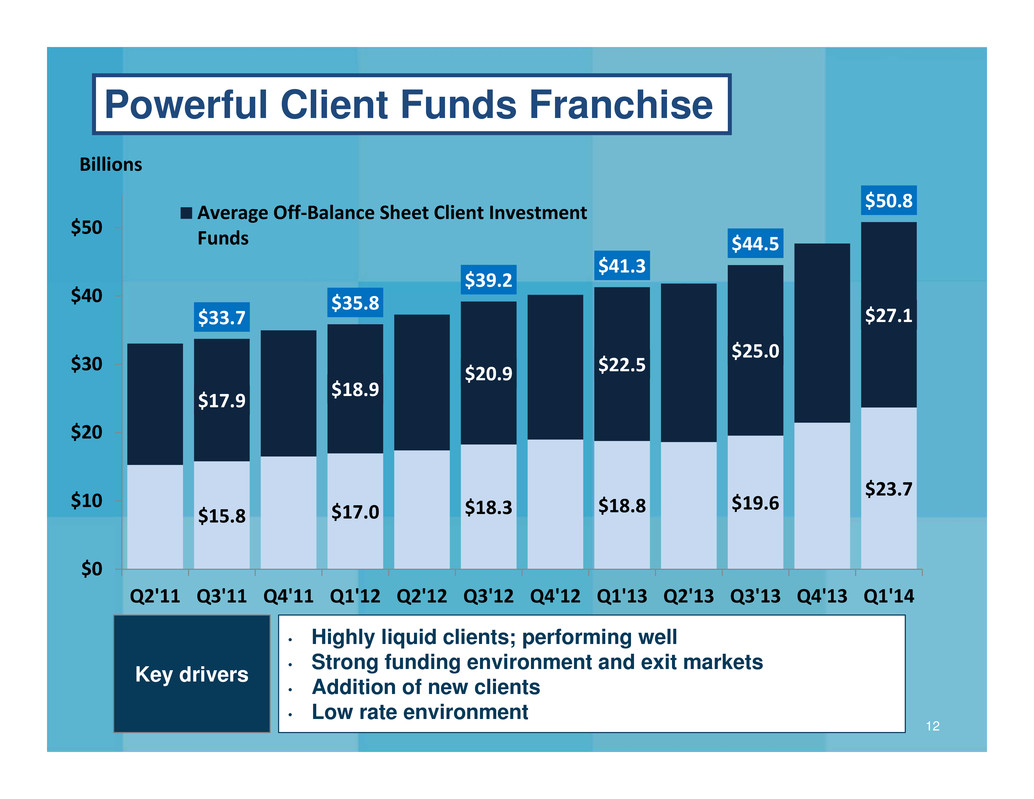
$15.8 $17.0 $18.3 $18.8 $19.6 $23.7 $17.9 $18.9 $20.9 $22.5 $25.0 $27.1$33.7 $35.8 $39.2 $41.3 $44.5 $50.8 $0 $10 $20 $30 $40 $50 Q2'11 Q3'11 Q4'11 Q1'12 Q2'12 Q3'12 Q4'12 Q1'13 Q2'13 Q3'13 Q4'13 Q1'14 Billions Average Off‐Balance Sheet Client Investment Funds Powerful Client Funds Franchise 12 • Highly liquid clients; performing well • Strong funding environment and exit markets • Addition of new clients • Low rate environment Key drivers
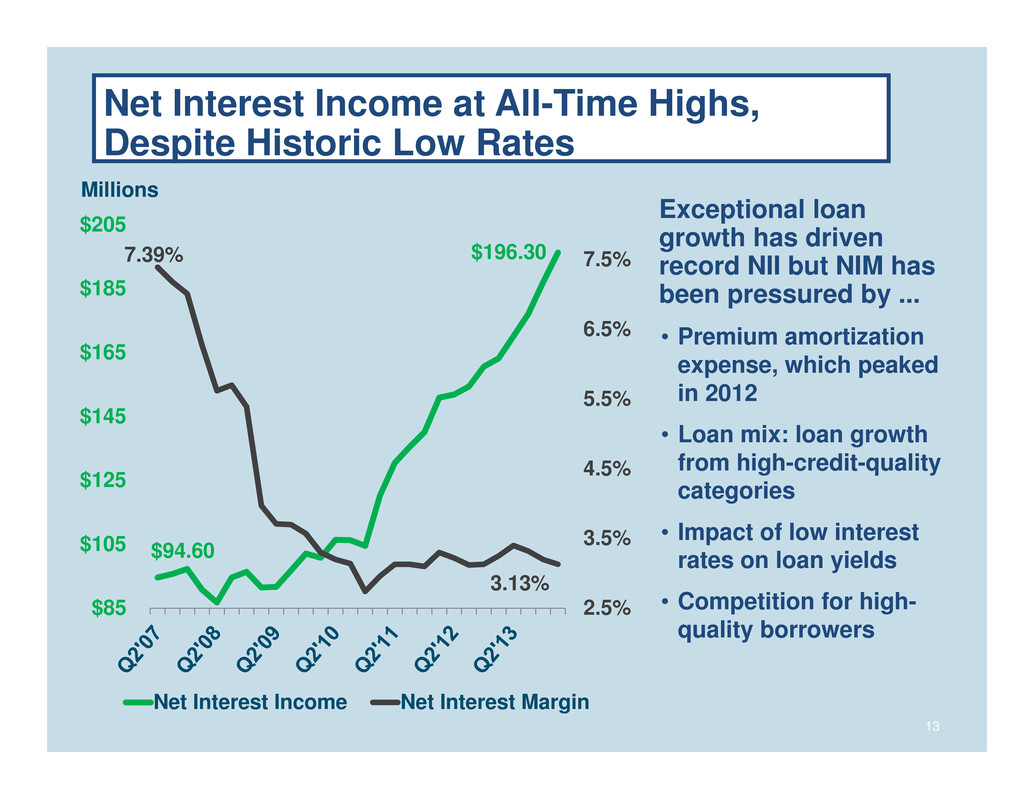
Net Interest Income at All-Time Highs, Despite Historic Low Rates Exceptional loan growth has driven record NII but NIM has been pressured by ... • Premium amortization expense, which peaked in 2012 • Loan mix: loan growth from high-credit-quality categories • Impact of low interest rates on loan yields • Competition for high- quality borrowers 13 Millions $94.60 $196.30 7.39% 3.13% 2.5% 3.5% 4.5% 5.5% 6.5% 7.5% $85 $105 $125 $145 $165 $185 $205 Net Interest Income Net Interest Margin
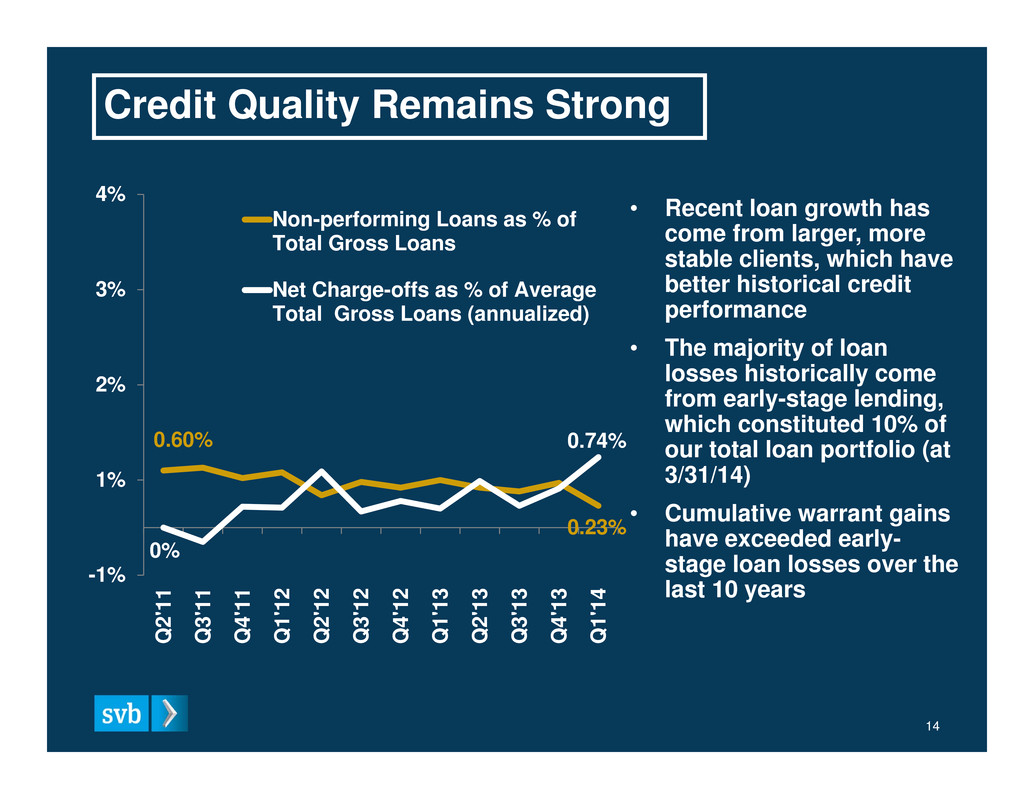
Credit Quality Remains Strong 14 0.60% 0.23% 0% 0.74% -1% 1% 2% 3% 4% Q 2 ' 1 1 Q 3 ' 1 1 Q 4 ' 1 1 Q 1 ' 1 2 Q 2 ' 1 2 Q 3 ' 1 2 Q 4 ' 1 2 Q 1 ' 1 3 Q 2 ' 1 3 Q 3 ' 1 3 Q 4 ' 1 3 Q 1 ' 1 4 Non-performing Loans as % of Total Gross Loans Net Charge-offs as % of Average Total Gross Loans (annualized) • Recent loan growth has come from larger, more stable clients, which have better historical credit performance • The majority of loan losses historically come from early-stage lending, which constituted 10% of our total loan portfolio (at 3/31/14) • Cumulative warrant gains have exceeded early- stage loan losses over the last 10 years
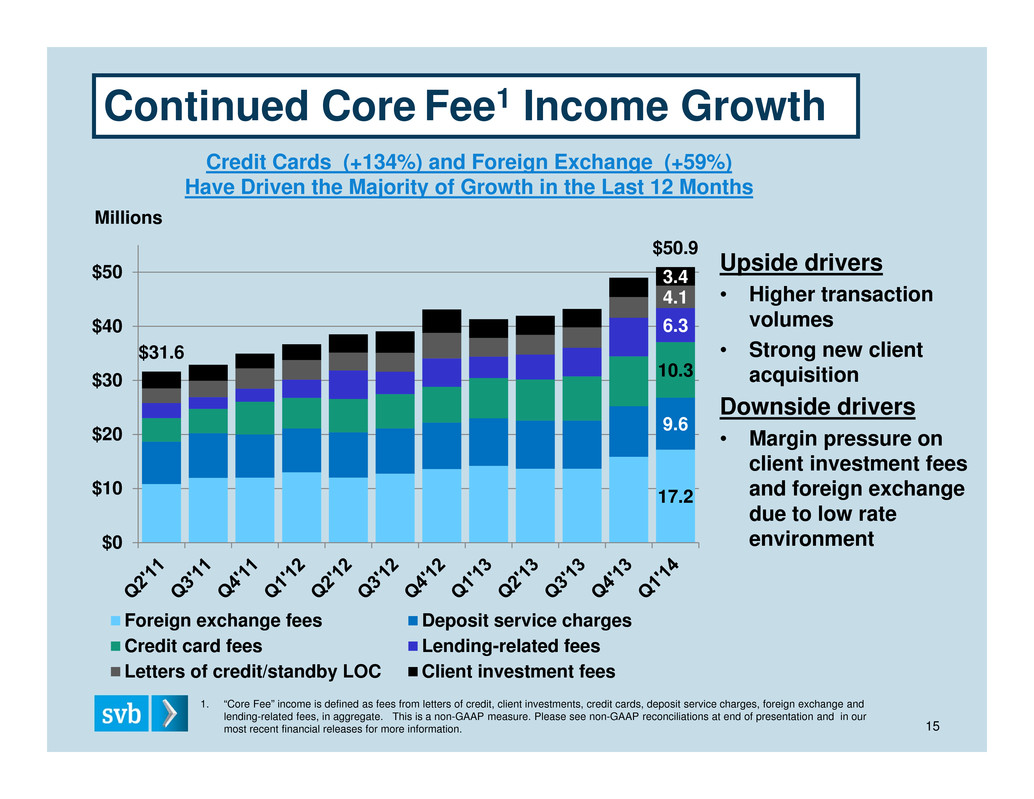
Continued Core Fee1 Income Growth 1. “Core Fee” income is defined as fees from letters of credit, client investments, credit cards, deposit service charges, foreign exchange and lending-related fees, in aggregate. This is a non-GAAP measure. Please see non-GAAP reconciliations at end of presentation and in our most recent financial releases for more information. Credit Cards (+134%) and Foreign Exchange (+59%) Have Driven the Majority of Growth in the Last 12 Months 15 Upside drivers • Higher transaction volumes • Strong new client acquisition Downside drivers • Margin pressure on client investment fees and foreign exchange due to low rate environment 17.2 9.6 10.3 6.3 4.1 3.4 $31.6 $50.9 $0 $10 $20 $30 $40 $50 Millions Foreign exchange fees Deposit service charges Credit card fees Lending-related fees Letters of credit/standby LOC Client investment fees

Appendix

Appendix 1) SVB Business Model 18 2) Financial Results •Highlights 20 •ROE 22 •Net Interest Income 23 •Loans 24 •Credit Quality 27 •Client Liquidity 28 •Balance Sheet 29 •Non-interest Income 31 •Interest Rate Sensitivity 33 •Capital Ratios 34 •Efficiency Ratio 36 3) Non-GAAP Reconciliations 38 17
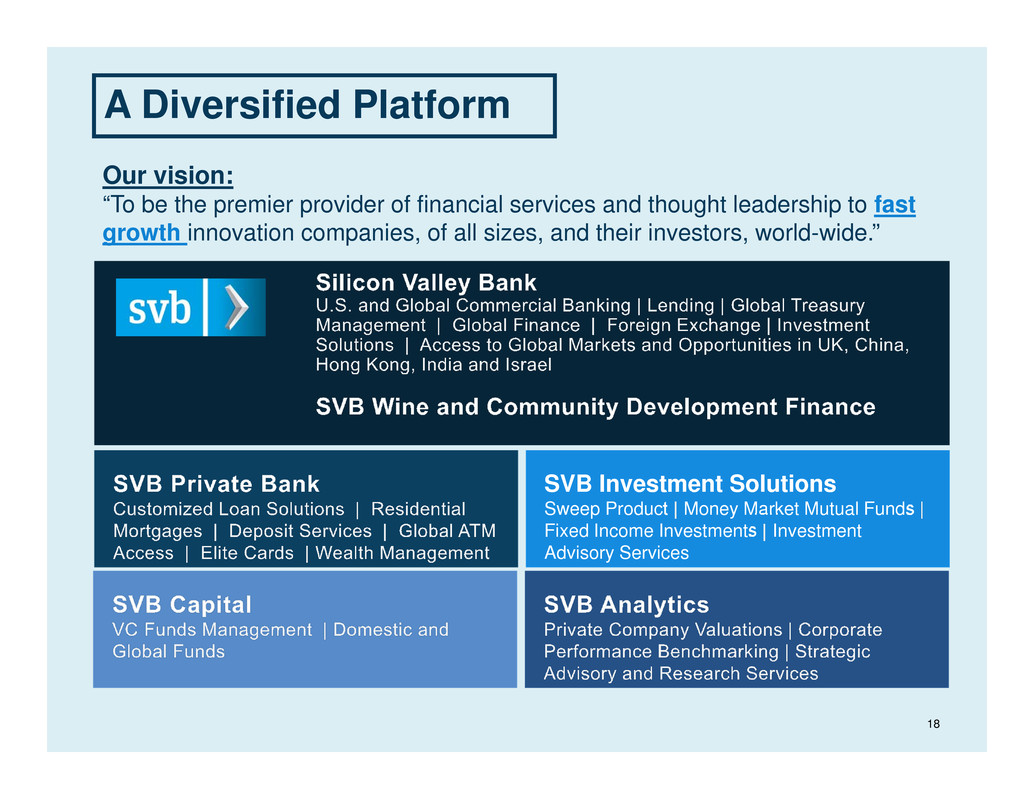
A Diversified Platform SVB Investment Solutions Sweep Product Money Market Mutual Funds Fixed Income Investments Investment Advisory Services 18 Our vision: “To be the premier provider of financial services and thought leadership to fast growth innovation companies, of all sizes, and their investors, world-wide.”

Across the Globe 19 U.S. HQ U.K. ISRAEL INDIA CHINA SVB Offices (28 US, 7 Global) SVB’s Banking Network
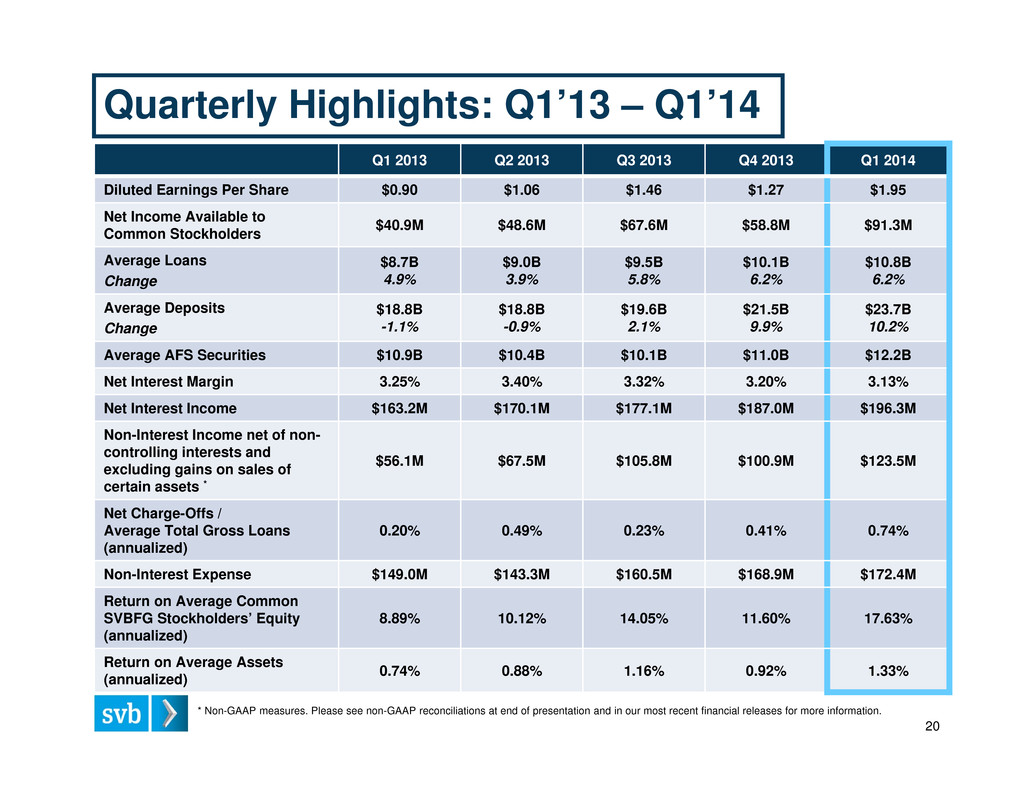
Q1 2013 Q2 2013 Q3 2013 Q4 2013 Q1 2014 Diluted Earnings Per Share $0.90 $1.06 $1.46 $1.27 $1.95 Net Income Available to Common Stockholders $40.9M $48.6M $67.6M $58.8M $91.3M Average Loans Change $8.7B 4.9% $9.0B 3.9% $9.5B 5.8% $10.1B 6.2% $10.8B 6.2% Average Deposits Change $18.8B -1.1% $18.8B -0.9% $19.6B 2.1% $21.5B 9.9% $23.7B 10.2% Average AFS Securities $10.9B $10.4B $10.1B $11.0B $12.2B Net Interest Margin 3.25% 3.40% 3.32% 3.20% 3.13% Net Interest Income $163.2M $170.1M $177.1M $187.0M $196.3M Non-Interest Income net of non- controlling interests and excluding gains on sales of certain assets * $56.1M $67.5M $105.8M $100.9M $123.5M Net Charge-Offs / Average Total Gross Loans (annualized) 0.20% 0.49% 0.23% 0.41% 0.74% Non-Interest Expense $149.0M $143.3M $160.5M $168.9M $172.4M Return on Average Common SVBFG Stockholders’ Equity (annualized) 8.89% 10.12% 14.05% 11.60% 17.63% Return on Average Assets (annualized) 0.74% 0.88% 1.16% 0.92% 1.33% Quarterly Highlights: Q1’13 – Q1’14 * Non-GAAP measures. Please see non-GAAP reconciliations at end of presentation and in our most recent financial releases for more information. 20
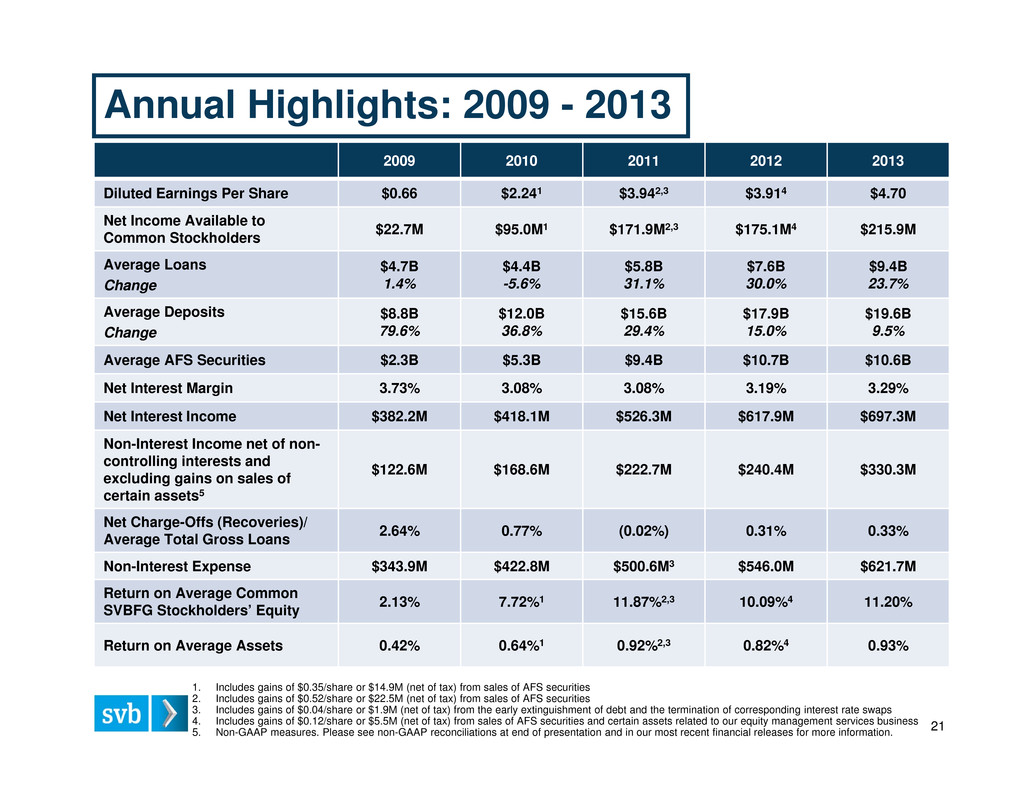
Annual Highlights: 2009 - 2013 2009 2010 2011 2012 2013 Diluted Earnings Per Share $0.66 $2.241 $3.942,3 $3.914 $4.70 Net Income Available to Common Stockholders $22.7M $95.0M 1 $171.9M2,3 $175.1M4 $215.9M Average Loans Change $4.7B 1.4% $4.4B -5.6% $5.8B 31.1% $7.6B 30.0% $9.4B 23.7% Average Deposits Change $8.8B 79.6% $12.0B 36.8% $15.6B 29.4% $17.9B 15.0% $19.6B 9.5% Average AFS Securities $2.3B $5.3B $9.4B $10.7B $10.6B Net Interest Margin 3.73% 3.08% 3.08% 3.19% 3.29% Net Interest Income $382.2M $418.1M $526.3M $617.9M $697.3M Non-Interest Income net of non- controlling interests and excluding gains on sales of certain assets5 $122.6M $168.6M $222.7M $240.4M $330.3M Net Charge-Offs (Recoveries)/ Average Total Gross Loans 2.64% 0.77% (0.02%) 0.31% 0.33% Non-Interest Expense $343.9M $422.8M $500.6M3 $546.0M $621.7M Return on Average Common SVBFG Stockholders’ Equity 2.13% 7.72% 1 11.87%2,3 10.09%4 11.20% Return on Average Assets 0.42% 0.64%1 0.92%2,3 0.82%4 0.93% 1. Includes gains of $0.35/share or $14.9M (net of tax) from sales of AFS securities 2. Includes gains of $0.52/share or $22.5M (net of tax) from sales of AFS securities 3. Includes gains of $0.04/share or $1.9M (net of tax) from the early extinguishment of debt and the termination of corresponding interest rate swaps 4. Includes gains of $0.12/share or $5.5M (net of tax) from sales of AFS securities and certain assets related to our equity management services business 5. Non-GAAP measures. Please see non-GAAP reconciliations at end of presentation and in our most recent financial releases for more information. 21

Return On Average Equity 22 2.58% 12.90% 17.09% 15.17% 17.98% 10.38% 2.68% 7.72% 11.87% 10.09% 11.20% 17.63% 0% 2% 4% 6% 8% 10% 12% 14% 16% 18% 20% * Annualized *

$229.5 $299.3 $352.5 $375.8 $368.6 $382.2 $418.1 $526.3 $617.9 $697.3 5.39% 6.46% 7.38% 7.19% 5.72% 3.73% 3.08% 3.08% 3.19% 3.29% 3.0% 4.0% 5.0% 6.0% 7.0% 8.0% $150 $250 $350 $450 $550 $650 $750 2004 2005 2006 2007 2008 2009 2010 2011 2012 2013 Net Interest Income Net Interest Margin Millions Net Interest Income Growth Despite Low Rates All-time High 23
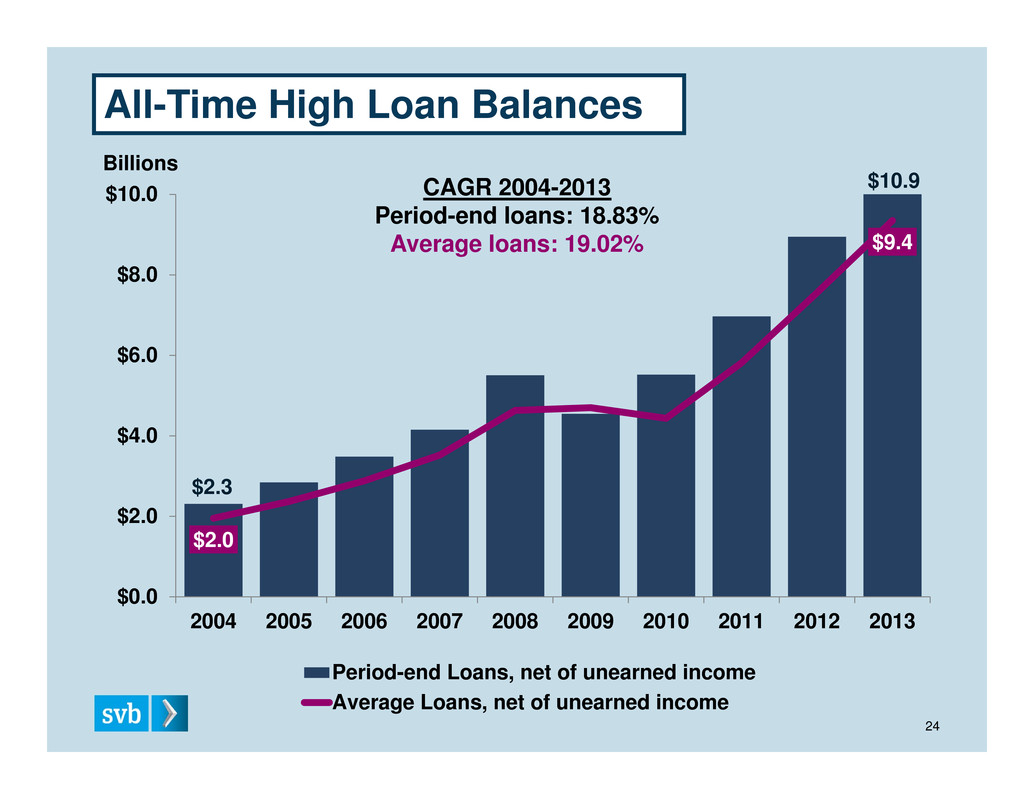
$2.3 $10.9 $2.0 $9.4 $0.0 $2.0 $4.0 $6.0 $8.0 $10.0 2004 2005 2006 2007 2008 2009 2010 2011 2012 2013 Period-end Loans, net of unearned income Average Loans, net of unearned income All-Time High Loan Balances Billions CAGR 2004-2013 Period-end loans: 18.83% Average loans: 19.02% 24

All-Time High Loan Balances 25 $2.0 $2.3 $2.5 $2.5 $2.8 $3.0 $3.3 $3.5 $3.6 $3.7 $4.1 $4.2$1.0 $1.1 $1.1 $1.1 $1.4 $1.4 $1.7 $1.3 $1.9 $2.0 $2.4 $2.2 $6.0 $6.4 $7.0 $7.2 $7.9 $8.3 $9.0 $8.9 $9.7 $9.9 $11.0 $10.9 10% 0% 25% 50% 75% 100% $0 $2 $4 $6 $8 $10 $12 Gross Loans By Category Software Hardware Life Sciences VC/PE Wine Other Private Bank Early Stage as % Gross Loans Billions T e c h n o l o g y & L i f e S c i e n c e s

$0.36 $0.49 $0.60 $0.68 $0.78 $0.83 $1.07 $1.16 $1.10 $1.15 $1.40 $1.96 $3.3 $3.5 $4.3 $4.5 $4.9 $5.2 $5.5 $5.8 $5.9 $6.0 $6.5 $6.6 60% 0% 25% 50% 75% 100% $0 $2 $4 $6 $8 Balance Sheet Lending Commercial Finance Factoring Sponsor-Led Buyout Early Stage Tech and LS Lending/Gross Loans Billions Technology and Life Sciences Lending 26

Credit Quality Has Remained Strong 27 $36.3 $25.0 0.00% 0.74% -0.5% 0.0% 0.5% 1.0% 1.5% 2.0% 2.5% 3.0% 3.5% $0 $40 $80 Non-Performing Loans Net Charge-Offs (annualized) Millions As a % of Average Total Gross Loans

$0.0 $10.0 $20.0 $30.0 $40.0 $50.0 2004 2005 2006 2007 2008 2009 2010 2011 2012 2013 Period-end Assets Period-end Total Client Funds Billions Strong Client Liquidity Asset Growth Since 2004 = 413% Total Client Funds* Growth Since 2004 = 216% * Total client funds consists of on-balance sheet deposits and off-balance sheet client investment funds. 28

Net Loans $10.7 AFS Securities (Primarily Agencies) $12.8 Cash $3.9 Other $0.5 Non- Interest- Bearing Deposits $18.3 Interest- Bearing Deposits $7.2 Other Liabilities $0.4 A Highly Liquid Balance Sheet (3/31/14) Assets: $29.7 Billion Liabilities: $26.3 Billion * Net of non-controlling interests, non-marketable securities were $493 million. Non-GAAP number. Please see non-GAAP reconciliations in our most recent financial releases for more information. 29 Borrowings $0.4 Non-Marketable Securities (VC Investments) $1.8B*

A Growing Balance Sheet Our balance sheet has grown by more than 400% since 2004 30 $4.5 $4.9 $5.3 $5.8 $8.7 $11.4 $15.8 $17.7 $20.2 $23.3 $0 $5 $10 $15 $20 $25 $30 Billions Noninterest-bearing deposits Interest bearing deposits Borrowings $5.1 $5.5 $6.1 $6.7 $10.0 $12.8 $17.5 $20.0 $22.8 $26.4 - 5 10 15 20 25 30 Billions Other assets Net loans Non-marketable securities Available-for-sale securities Cash and cash equivalents
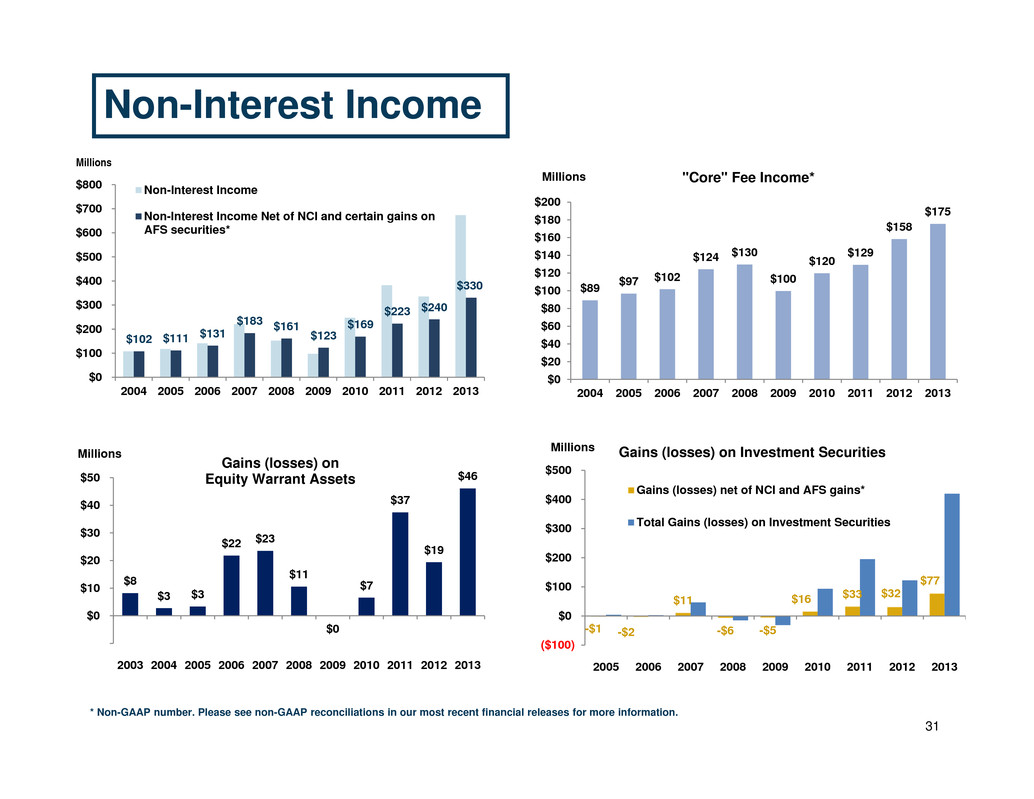
-$1 -$2 $11 -$6 -$5 $16 $33 $32 $77 ($100) $0 $100 $200 $300 $400 $500 2005 2006 2007 2008 2009 2010 2011 2012 2013 Millions Gains (losses) on Investment Securities Gains (losses) net of NCI and AFS gains* Total Gains (losses) on Investment Securities $102 $111 $131 $183 $161 $123 $169 $223 $240 $330 $0 $100 $200 $300 $400 $500 $600 $700 $800 2004 2005 2006 2007 2008 2009 2010 2011 2012 2013 Non-Interest Income Non-Interest Income Net of NCI and certain gains on AFS securities* Non-Interest Income 31 $8 $3 $3 $22 $23 $11 $0 $7 $37 $19 $46 ($10) $0 $10 $20 $30 $40 $50 2003 2004 2005 2006 2007 2008 2009 2010 2011 2012 2013 Millions Gains (losses) on Equity Warrant Assets Millions $89 $97 $102 $124 $130 $100 $120 $129 $158 $175 $0 $20 $40 $60 $80 $100 $120 $140 $160 $180 $200 2004 2005 2006 2007 2008 2009 2010 2011 2012 2013 Millions "Core" Fee Income* * Non-GAAP number. Please see non-GAAP reconciliations in our most recent financial releases for more information.

57.4 35.9 32.5 21.0 14.7 14.0 $89.2 $96.7 $101.8 $124.2 $129.6 $99.7 $119.7 $129.3 $158.4 $175.5 $0 $20 $40 $60 $80 $100 $120 $140 $160 $180 $200 2004 2005 2006 2007 2008 2009 2010 2011 2012 2013 Millions Foreign exchange fees Deposit service charges Credit card fees Lending related fees LCs and standby LCs income Client investment fees Corporate finance fees Core Fee1 Income Has Grown 1. “Core fee” income is defined as fees from letters of credit, client investments, credit cards, deposit services, foreign exchange, and lending-related fees in aggregate. This is a non-GAAP measure. Please see non-GAAP reconciliations at end of presentation and in our most recent financial releases for more information. 2. Prior to 2009, lending-related fees were included in “Other noninterest income” and were not included in “Core” fees. 3. Corporate Finance Fees were related to the company’s investment banking arm, SVB Alliant, which ceased operations in 2007. 32 2 3
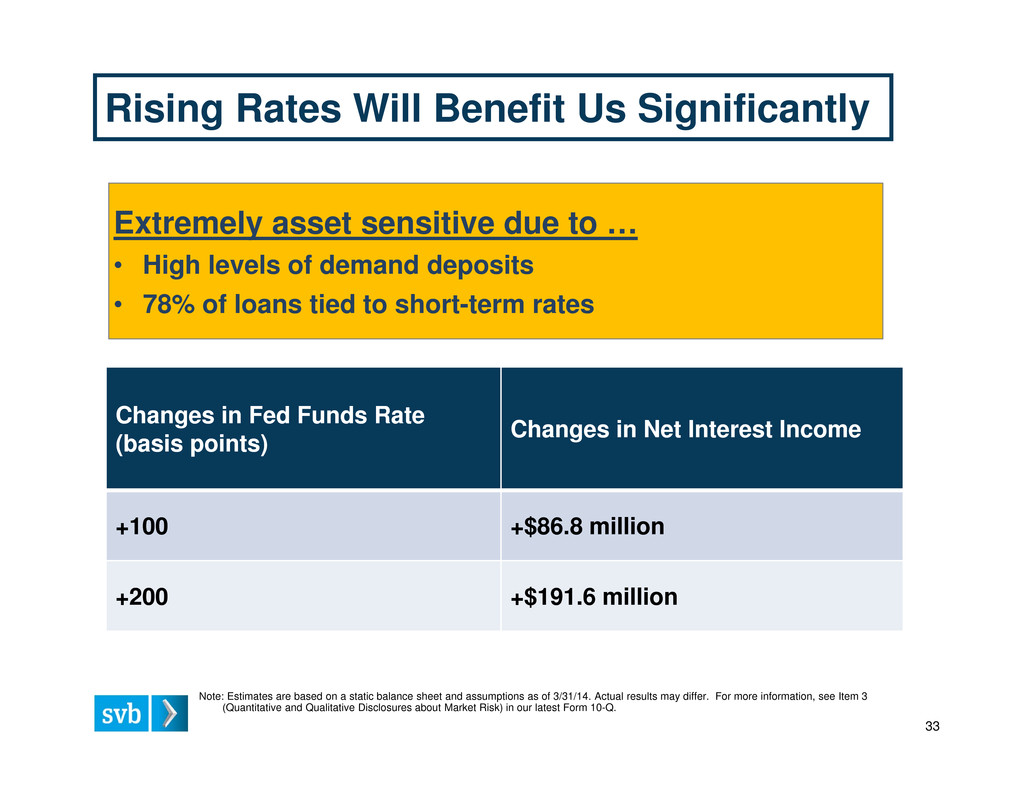
Note: Estimates are based on a static balance sheet and assumptions as of 3/31/14. Actual results may differ. For more information, see Item 3 (Quantitative and Qualitative Disclosures about Market Risk) in our latest Form 10-Q. 33 Changes in Fed Funds Rate (basis points) Changes in Net Interest Income +100 +$86.8 million +200 +$191.6 million Rising Rates Will Benefit Us Significantly Extremely asset sensitive due to … • High levels of demand deposits • 78% of loans tied to short-term rates
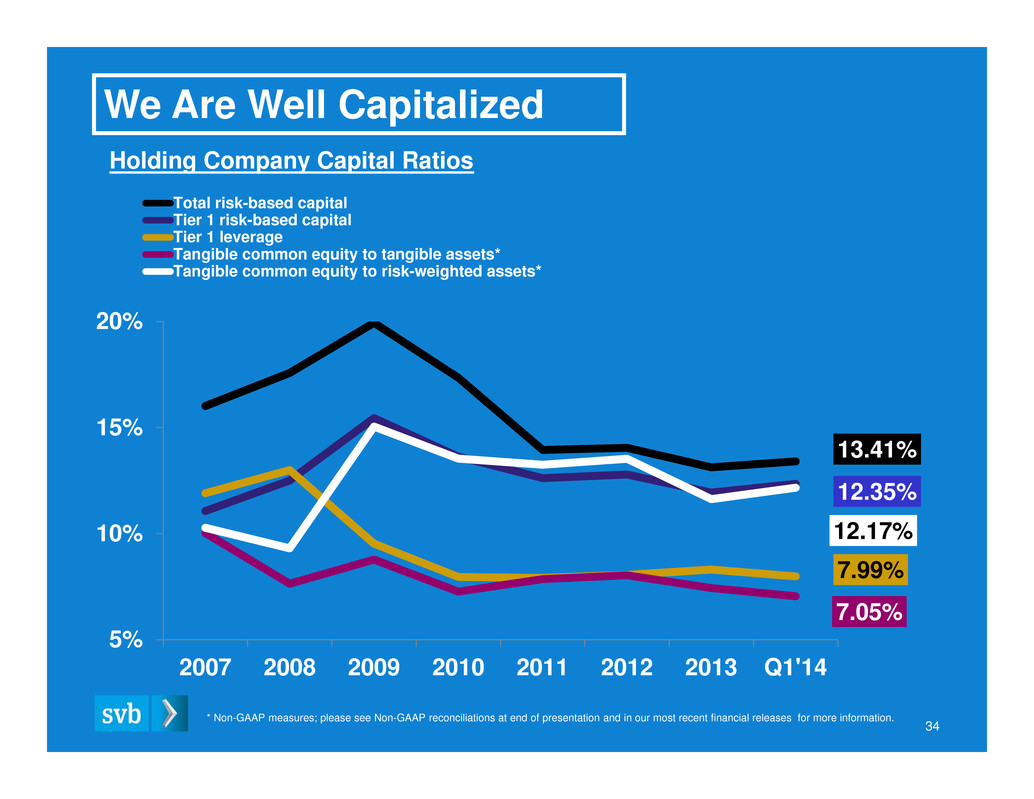
13.41% 12.35% 7.99% 7.05% 12.17% 5% 10% 15% 20% 2007 2008 2009 2010 2011 2012 2013 Q1'14 Total risk-based capital Tier 1 risk-based capital Tier 1 leverage Tangible common equity to tangible assets* Tangible common equity to risk-weighted assets* We Are Well Capitalized Holding Company Capital Ratios * Non-GAAP measures; please see Non-GAAP reconciliations at end of presentation and in our most recent financial releases for more information. 34
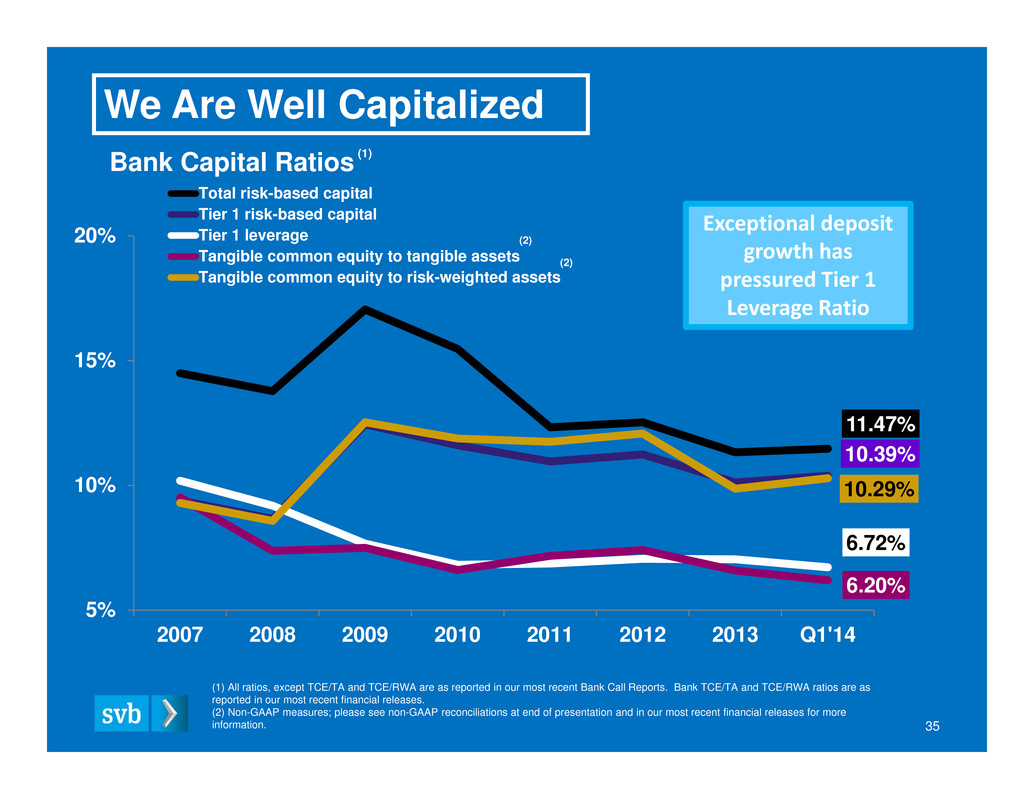
11.47% 10.39% 6.72% 6.20% 10.29% 5% 10% 15% 20% 2007 2008 2009 2010 2011 2012 2013 Q1'14 Total risk-based capital Tier 1 risk-based capital Tier 1 leverage Tangible common equity to tangible assets Tangible common equity to risk-weighted assets We Are Well Capitalized Bank Capital Ratios (1) All ratios, except TCE/TA and TCE/RWA are as reported in our most recent Bank Call Reports. Bank TCE/TA and TCE/RWA ratios are as reported in our most recent financial releases. (2) Non-GAAP measures; please see non-GAAP reconciliations at end of presentation and in our most recent financial releases for more information. (1) (2) (2) 35 Exceptional deposit growth has pressured Tier 1 Leverage Ratio
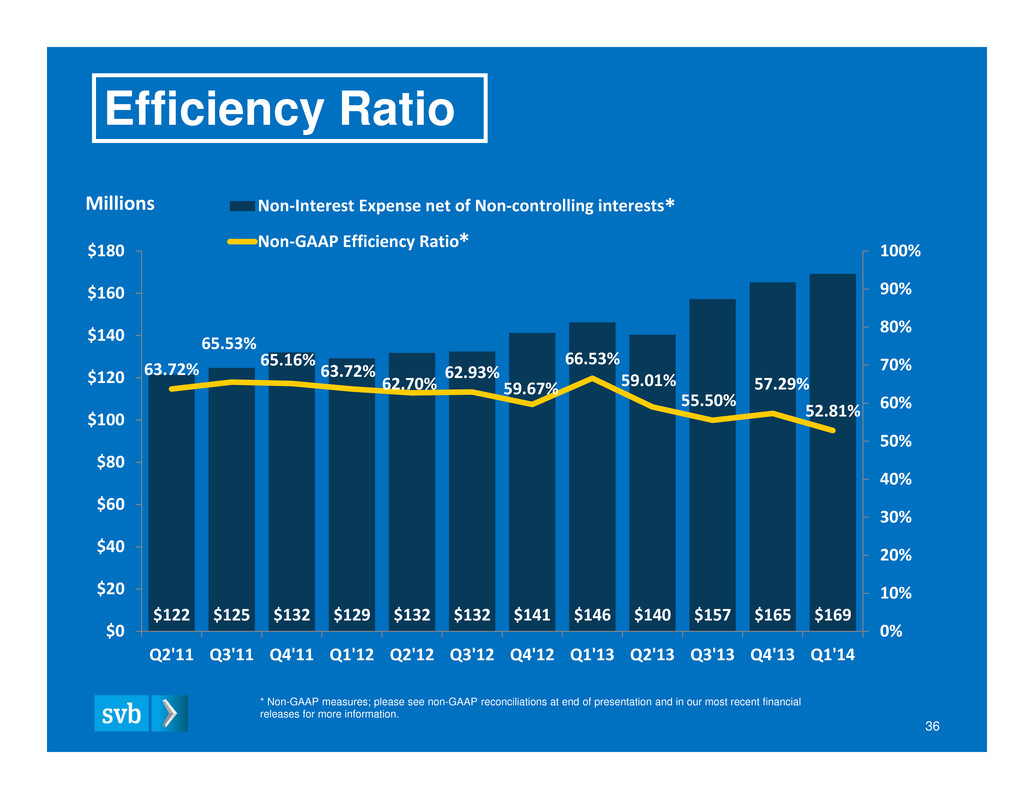
36 * Non-GAAP measures; please see non-GAAP reconciliations at end of presentation and in our most recent financial releases for more information. $122 $125 $132 $129 $132 $132 $141 $146 $140 $157 $165 $169 63.72% 65.53% 65.16% 63.72% 62.70% 62.93% 59.67% 66.53% 59.01% 55.50% 57.29% 52.81% 0% 10% 20% 30% 40% 50% 60% 70% 80% 90% 100% $0 $20 $40 $60 $80 $100 $120 $140 $160 $180 Q2'11 Q3'11 Q4'11 Q1'12 Q2'12 Q3'12 Q4'12 Q1'13 Q2'13 Q3'13 Q4'13 Q1'14 Non‐Interest Expense net of Non‐controlling interests Non‐GAAP Efficiency Ratio Efficiency Ratio Millions * *
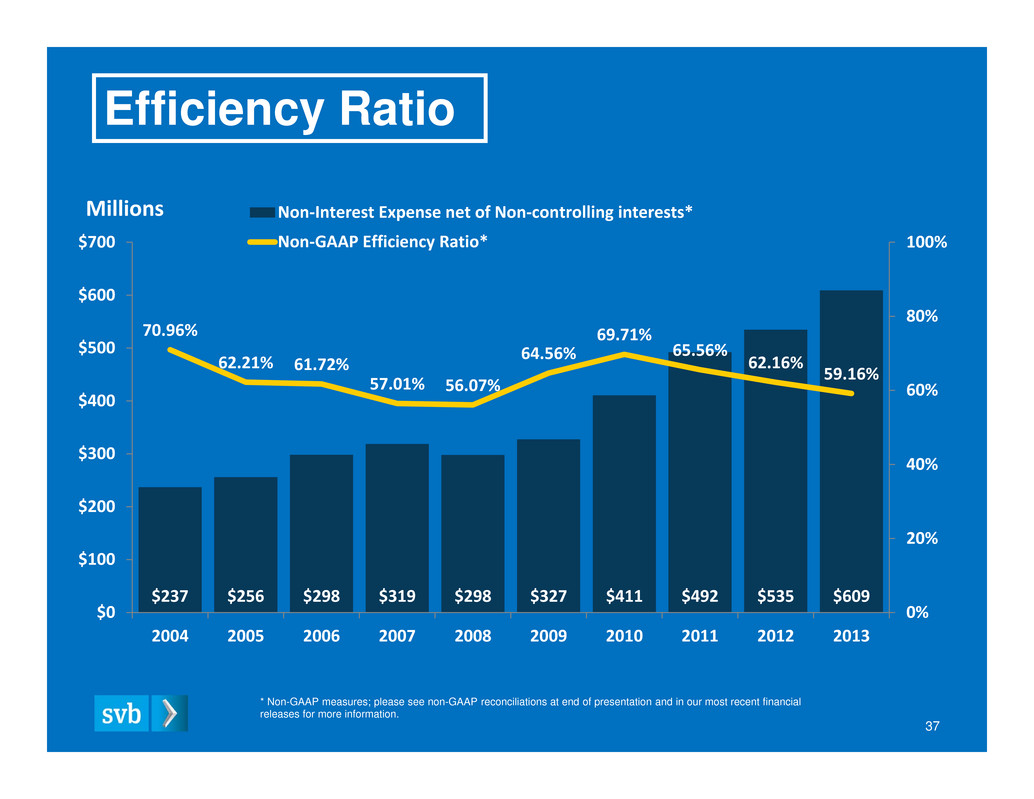
37 * Non-GAAP measures; please see non-GAAP reconciliations at end of presentation and in our most recent financial releases for more information. $237 $256 $298 $319 $298 $327 $411 $492 $535 $609 70.96% 62.21% 61.72% 57.01% 56.07% 64.56% 69.71% 65.56% 62.16% 59.16% 0% 20% 40% 60% 80% 100% $0 $100 $200 $300 $400 $500 $600 $700 2004 2005 2006 2007 2008 2009 2010 2011 2012 2013 Non‐Interest Expense net of Non‐controlling interests* Non‐GAAP Efficiency Ratio* Millions Efficiency Ratio

Non-GAAP Reconciliations

Non-GAAP core fee income (dollars in thousands) Year ended December 31, 2004 2005 2006 2007 2008 GAAP noninterest income $107,774 $117,495 $141,206 $220,969 $152,365 Less: gains (losses) on investment securities, net 5,198 4,307 2,551 46,724 -14,777 Less: gains (losses) on derivative instruments, net 3,428 6,750 17,949 23,935 18,505 Less: other noninterest income 10,959 9,711 23,565 26,096 19,052 Non-GAAP core fee income $88,189 $96,727 $97,141 $124,214 $129,585 Non-GAAP core fee income (dollars in thousands) Year ended December 31, 2009 2010 2011 2012 2013 GAAP noninterest income $97,743 $247,530 $382,332 $335,546 $673,206 Less: gains (losses) on investment securities, net -31,209 93,360 195,034 122,114 419,408 Less: gains (losses) on derivative instruments, net -753 9,522 36,798 18,679 42,184 Less: other noninterest income 29,961 35,642 21,230 36,363 36,139 Non-GAAP core fee income $99,744 $109,006 $129,270 $158,390 $175,475 “Core Fee” Income 39 “Core fee” income is defined as fees from letters of credit, client investments, credit cards, deposit services, foreign exchange, and lending-related fees in aggregate. This is a non-GAAP measure. For additional non-GAAP disclosures, please refer to our latest Forms 10-Q and 10-K, as well as our quarterly earnings releases. Non-GAAP Reconciliation

“Core Fee” Income Non-GAAP core fee income (dollars in thousands) Quarter ended June 30, 2011 Sept 30, 2011 Dec 31, 2011 Mar 31, 2012 June 30, 2012 Sept 30, 2012 GAAP noninterest income $123,708 $95,611 $73,059 $59,293 $80,426 $69,139 Less: gains on investment securities, net 71,680 52,262 19,755 7,839 25,809 20,228 Less: gains on derivative instruments, net 13,167 9,513 14,003 5,070 7,686 565 Less: other noninterest income 7,232 945 4,352 9,703 7,390 9,283 Non-GAAP core fee income $31,629 $32,891 $39,949 $36,681 $39,541 $39,063 40 Non-GAAP Reconciliation Non-GAAP core fee income (dollars in thousands) Quarter ended Dec 31, 2012 Mar 31, 2013 June 30, 2013 September 30, 2013 December 31, 2013 March 31, 2014 GAAP noninterest income $126,688 $78,604 $98,239 $257,650 $238,713 $310,225 Less: gains on investment securities, net 68,238 27,438 40,561 187,862 163,547 223,912 Less: gains on derivative instruments, net 5,358 10,292 8,087 9,423 14,382 24,167 Less: other noninterest income 9,987 (447) 7,634 17,161 11,791 11,200 Non-GAAP core fee income $43,105 $41,321 $41,957 $43,204 $48,993 $50,946 “Core fee” income is defined as fees from letters of credit, client investments, credit cards, deposit services, foreign exchange, and lending-related fees in aggregate. This is a non-GAAP measure. For additional non-GAAP disclosures, please refer to our latest Forms 10-Q and 10-K, as well as our quarterly earnings releases.

Non-Marketable Securities Non-GAAP non-marketable securities, net of non-controlling interests (dollars in thousands) March 31, 2014 GAAP non-marketable securities $1,770,456 Less: non-controlling interests in non-marketable securities 1,277,204 Non-GAAP non-marketable securities, net of non-controlling interests $493,252 41 Non-GAAP Reconciliation For additional non-GAAP disclosures, please refer to our latest Forms 10-Q and 10-K, as well as our quarterly earnings releases.

Gains (Losses) on Investment Securities Non-GAAP net gains on investment securities, net of non-controlling interests (dollars in thousands) Year ended December 31, 2005 2006 2007 2008 2009 2010 2011 2012 2013 GAAP net gains (losses) on investment securities $4,307 $ 2,551 $ 46,724 -- $14,777 --$31,209 $93,360 $ 195,034 $122,114 $419,408 Less: income (losses) attributable to non- controlling interests, including carried interest 5,743 5,032 35,449 -8,929 -26,638 52,586 125,042 85,640 342,128 Net gains (losses) on investment securities, net of non-controlling interests -1,436 - 2,481 11,275 -5,848) -4,571 40,774 69,992 36,474 77,280 Less: gains on sales of certain available-for-sale securities -- -- -- -- -- 24,699 37,314 4,955 -- Non-GAAP net gains (losses) on investment securities, net of non- controlling interests and excluding gains on sales of certain available-for- sale securities -- $1,436 -- $2,481 $ 11,275 -- $ 5,848 -- $ 4,571) $ 16,075 $ 32,678 $ 31,519 $77,280 42 Non-GAAP Reconciliation For additional non-GAAP disclosures, please refer to our latest Forms 10-Q and 10-K, as well as our quarterly earnings releases.
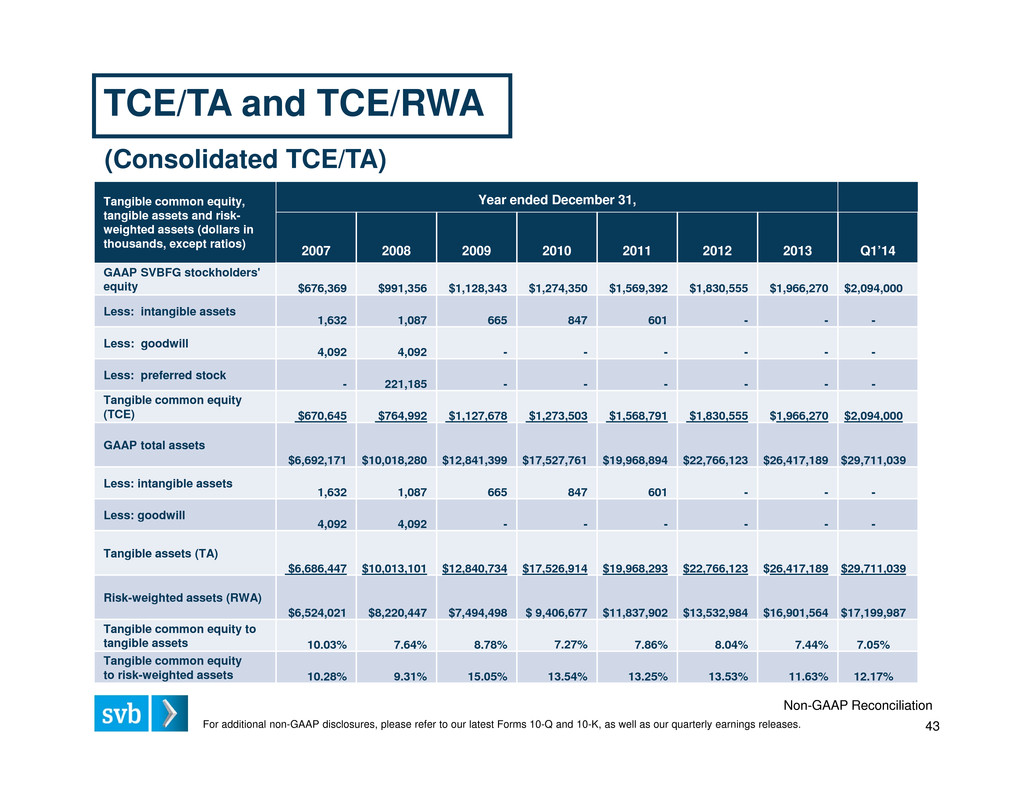
Tangible common equity, tangible assets and risk- weighted assets (dollars in thousands, except ratios) Year ended December 31, 2007 2008 2009 2010 2011 2012 2013 Q1’14 GAAP SVBFG stockholders' equity $676,369 $991,356 $1,128,343 $1,274,350 $1,569,392 $1,830,555 $1,966,270 $2,094,000 Less: intangible assets 1,632 1,087 665 847 601 - - - Less: goodwill 4,092 4,092 - - - - - - Less: preferred stock - 221,185 - - - - - - Tangible common equity (TCE) $670,645 $764,992 $1,127,678 $1,273,503 $1,568,791 $1,830,555 $1,966,270 $2,094,000 GAAP total assets $6,692,171 $10,018,280 $12,841,399 $17,527,761 $19,968,894 $22,766,123 $26,417,189 $29,711,039 Less: intangible assets 1,632 1,087 665 847 601 - - - Less: goodwill 4,092 4,092 - - - - - - Tangible assets (TA) $6,686,447 $10,013,101 $12,840,734 $17,526,914 $19,968,293 $22,766,123 $26,417,189 $29,711,039 Risk-weighted assets (RWA) $6,524,021 $8,220,447 $7,494,498 $ 9,406,677 $11,837,902 $13,532,984 $16,901,564 $17,199,987 Tangible common equity to tangible assets 10.03% 7.64% 8.78% 7.27% 7.86% 8.04% 7.44% 7.05% Tangible common equity to risk-weighted assets 10.28% 9.31% 15.05% 13.54% 13.25% 13.53% 11.63% 12.17% (Consolidated TCE/TA) TCE/TA and TCE/RWA 43 Non-GAAP Reconciliation For additional non-GAAP disclosures, please refer to our latest Forms 10-Q and 10-K, as well as our quarterly earnings releases.

Tangible common equity, tangible assets and risk-weighted assets (dollars in thousands, except ratios) Year ended December 31 2007 2008 2009 2010 2011 2012 2013 Q1’14 GAAP Silicon Valley Bank stockholders' equity $586,949 $695,438 $ 914,068 $1,074,561 $1,346,854 $1,591,643 $1,639,024 $1,737,916 Less: intangible assets - - - - - - - - Tangible common equity (TCE) $586,949 $695,438 $914,068 $1,074,561 $1,346,854 $1,591,643 $1,639,024 $1,737,916 GAAP total assets $6,164,111 $9,419,440 $12,186,203 $16,268,589 $18,758,813 $21,471,111 $24,854,119 $28,012,627 Less: intangible assets - - - - - - - - Tangible assets (TA) $6,164,111 $9,419,440 $12,186,203 $16,268,589 $18,758,813 $21,471,111 $24,854,119 $28,012,627 Risk-weighted assets (RWA) $6,310,721 $8,109,332 $7,293,332 $9,047,907 $11,467,401 $13,177,887 $16,598,312 $16,895,389 Tangible common equity to tangible assets 9.52% 7.38% 7.50% 6.61% 7.18% 7.41 % 6.59% 6.20% Tangible common equity to risk-weighted assets 9.30% 8.58% 12.53% 11.88% 11.75% 12.08% 9.87% 10.29% (Bank Only TCE/TA) TCE/TA and TCE/RWA 44 Non-GAAP Reconciliation For additional non-GAAP disclosures, please refer to our latest Forms 10-Q and 10-K, as well as our quarterly earnings releases.
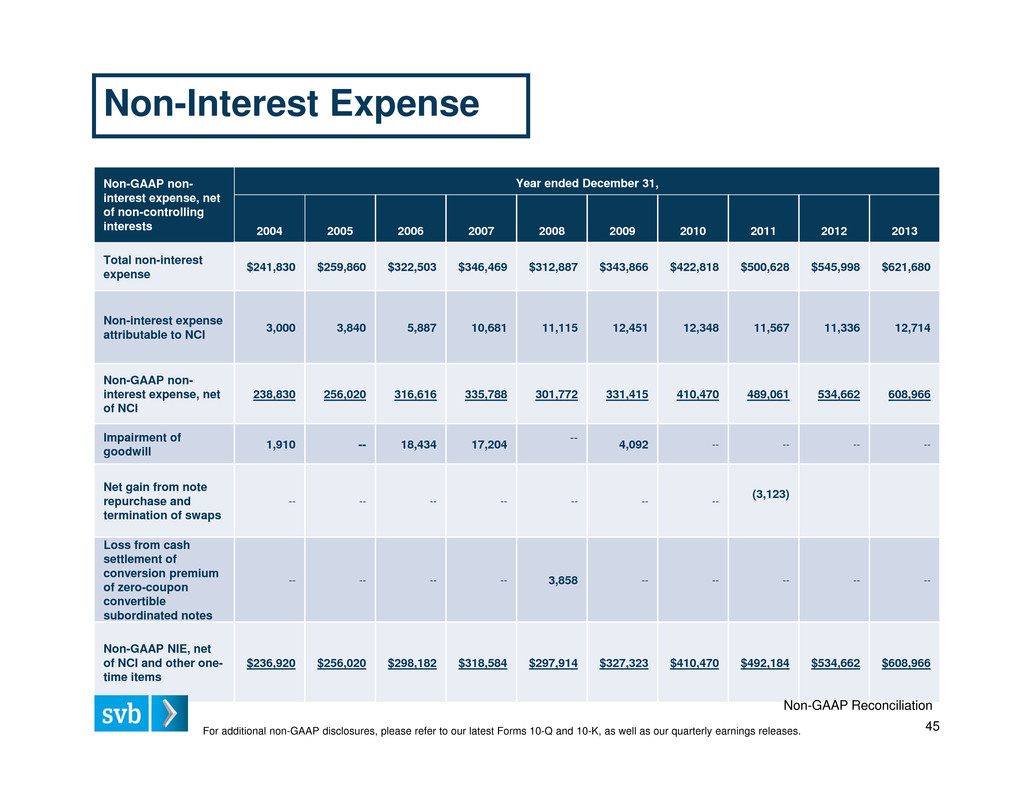
Non-GAAP non- interest expense, net of non-controlling interests Year ended December 31, 2004 2005 2006 2007 2008 2009 2010 2011 2012 2013 Total non-interest expense $241,830 $259,860 $322,503 $346,469 $312,887 $343,866 $422,818 $500,628 $545,998 $621,680 Non-interest expense attributable to NCI 3,000 3,840 5,887 10,681 11,115 12,451 12,348 11,567 11,336 12,714 Non-GAAP non- interest expense, net of NCI 238,830 256,020 316,616 335,788 301,772 331,415 410,470 489,061 534,662 608,966 Impairment of goodwill 1,910 -- 18,434 17,204 -- 4,092 -- -- -- -- Net gain from note repurchase and termination of swaps -- -- -- -- -- -- -- (3,123) Loss from cash settlement of conversion premium of zero-coupon convertible subordinated notes -- -- -- -- 3,858 -- -- -- -- -- Non-GAAP NIE, net of NCI and other one- time items $236,920 $256,020 $298,182 $318,584 $297,914 $327,323 $410,470 $492,184 $534,662 $608,966 For additional non-GAAP disclosures, please refer to our latest Forms 10-Q and 10-K, as well as our quarterly earnings releases. 45 Non-GAAP Reconciliation Non-Interest Expense
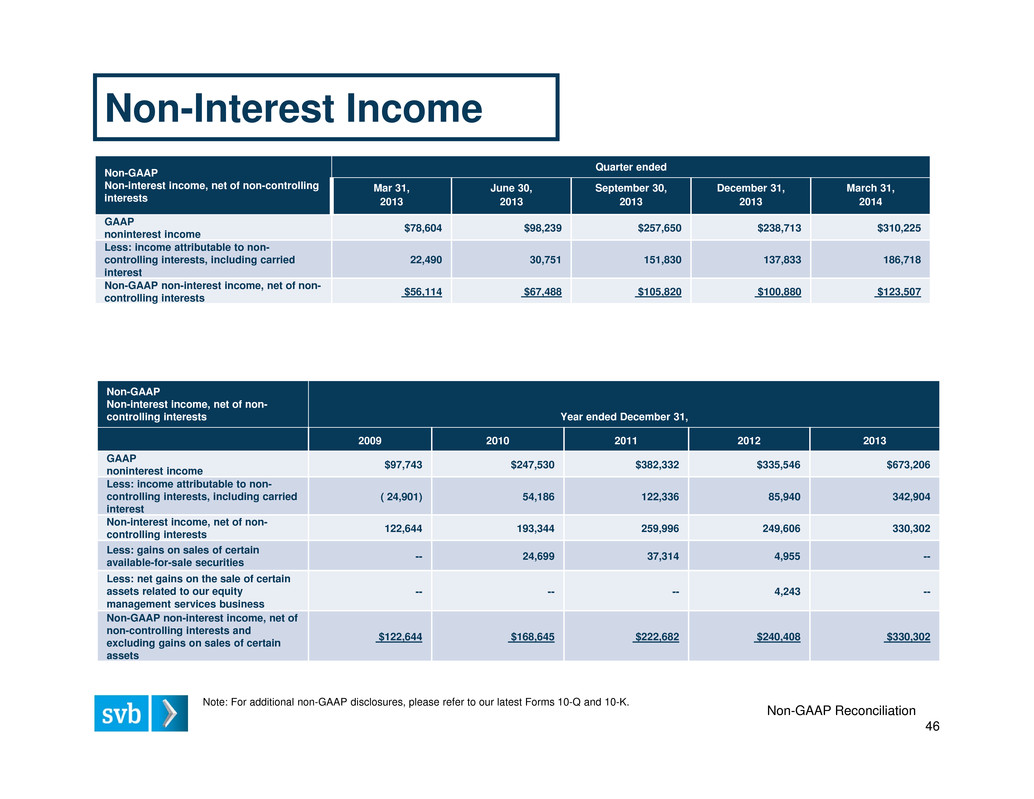
46 Non-GAAP Non-interest income, net of non-controlling interests Quarter ended Mar 31, 2013 June 30, 2013 September 30, 2013 December 31, 2013 March 31, 2014 GAAP noninterest income $78,604 $98,239 $257,650 $238,713 $310,225 Less: income attributable to non- controlling interests, including carried interest 22,490 30,751 151,830 137,833 186,718 Non-GAAP non-interest income, net of non- controlling interests $56,114 $67,488 $105,820 $100,880 $123,507 Non-Interest Income Non-GAAP Reconciliation Note: For additional non-GAAP disclosures, please refer to our latest Forms 10-Q and 10-K. Non-GAAP Non-interest income, net of non- controlling interests Year ended December 31, 2009 2010 2011 2012 2013 GAAP noninterest income $97,743 $247,530 $382,332 $335,546 $673,206 Less: income attributable to non- controlling interests, including carried interest ( 24,901) 54,186 122,336 85,940 342,904 Non-interest income, net of non- controlling interests 122,644 193,344 259,996 249,606 330,302 Less: gains on sales of certain available-for-sale securities -- 24,699 37,314 4,955 -- Less: net gains on the sale of certain assets related to our equity management services business -- -- -- 4,243 -- Non-GAAP non-interest income, net of non-controlling interests and excluding gains on sales of certain assets $122,644 $168,645 $222,682 $240,408 $330,302
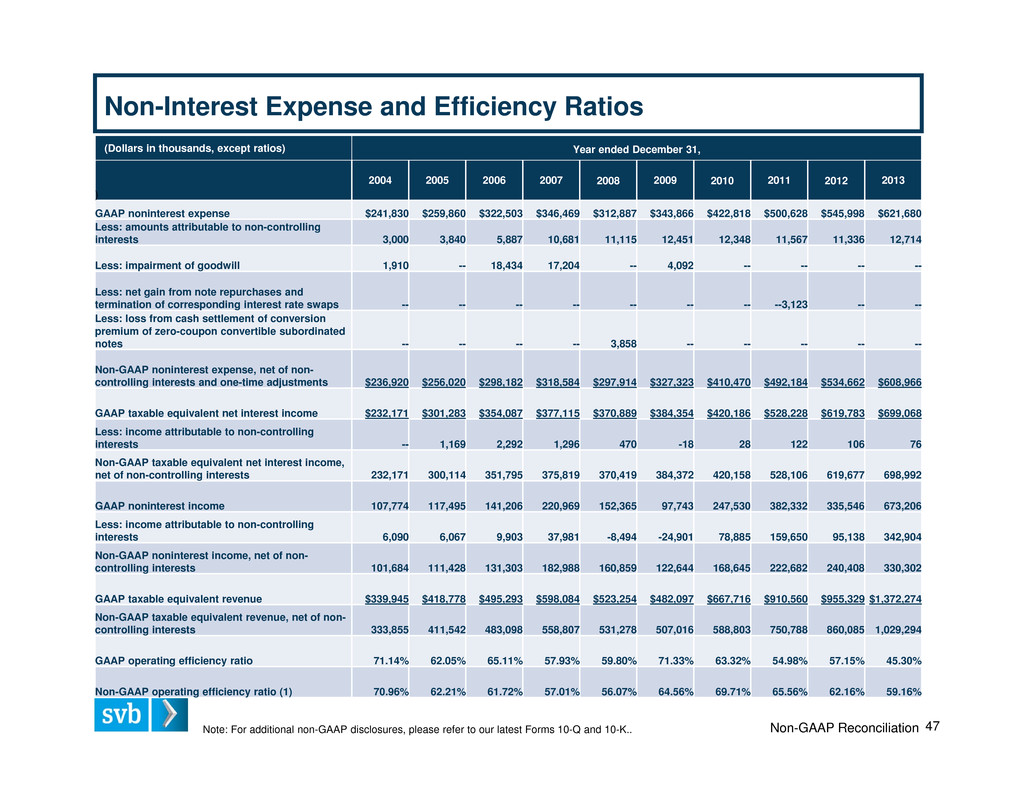
(Dollars in thousands, except ratios) Year ended December 31, ) 2004 2005 2006 2007 2008 2009 2010 2011 2012 2013 GAAP noninterest expense $241,830 $259,860 $322,503 $346,469 $312,887 $343,866 $422,818 $500,628 $545,998 $621,680 Less: amounts attributable to non-controlling interests 3,000 3,840 5,887 10,681 11,115 12,451 12,348 11,567 11,336 12,714 Less: impairment of goodwill 1,910 -- 18,434 17,204 -- 4,092 -- -- -- -- Less: net gain from note repurchases and termination of corresponding interest rate swaps -- -- -- -- -- -- -- --3,123 -- -- Less: loss from cash settlement of conversion premium of zero-coupon convertible subordinated notes -- -- -- -- 3,858 -- -- -- -- -- Non-GAAP noninterest expense, net of non- controlling interests and one-time adjustments $236,920 $256,020 $298,182 $318,584 $297,914 $327,323 $410,470 $492,184 $534,662 $608,966 GAAP taxable equivalent net interest income $232,171 $301,283 $354,087 $377,115 $370,889 $384,354 $420,186 $528,228 $619,783 $699,068 Less: income attributable to non-controlling interests -- 1,169 2,292 1,296 470 -18 28 122 106 76 Non-GAAP taxable equivalent net interest income, net of non-controlling interests 232,171 300,114 351,795 375,819 370,419 384,372 420,158 528,106 619,677 698,992 GAAP noninterest income 107,774 117,495 141,206 220,969 152,365 97,743 247,530 382,332 335,546 673,206 Less: income attributable to non-controlling interests 6,090 6,067 9,903 37,981 -8,494 -24,901 78,885 159,650 95,138 342,904 Non-GAAP noninterest income, net of non- controlling interests 101,684 111,428 131,303 182,988 160,859 122,644 168,645 222,682 240,408 330,302 GAAP taxable equivalent revenue $339,945 $418,778 $495,293 $598,084 $523,254 $482,097 $667,716 $910,560 $955,329 $1,372,274 Non-GAAP taxable equivalent revenue, net of non- controlling interests 333,855 411,542 483,098 558,807 531,278 507,016 588,803 750,788 860,085 1,029,294 GAAP operating efficiency ratio 71.14% 62.05% 65.11% 57.93% 59.80% 71.33% 63.32% 54.98% 57.15% 45.30% Non-GAAP operating efficiency ratio (1) 70.96% 62.21% 61.72% 57.01% 56.07% 64.56% 69.71% 65.56% 62.16% 59.16% 47Non-GAAP ReconciliationNote: For additional non-GAAP disclosures, please refer to our latest Forms 10-Q and 10-K.. Non-Interest Expense and Efficiency Ratios

(Dollars in thousands, except ratios) Quarter Ended June 30, 2011 Sept 30, 2011 Dec 31, 2011 Mar 31, 2012 June 30, 2012 Sept 30, 2012 GAAP noninterest expense $121,032 $127,451 $134,710 $132,012 $135,766 $135,171 Less: amounts attributable to non-controlling interests 2,621 2,766 2,699 2,818 3,947 2,723 Less: net gain from note repurchases and termination of corresponding interest rate swaps -3,123 - Non-GAAP noninterest expense, net of non- controlling interests $121,534 $124,685 $132,011 $129,194 $131,819 $132,448 GAAP taxable equivalent net interest income $130,929 $135,938 $140,555 $151,421 $152,419 $154,911 Less: income attributable to non-controlling interests 45 32 38 43 38 50 Non-GAAP taxable equivalent net interest income, net of non-controlling interests 130,884 135,906 140,517 151,378 152,381 154,861 GAAP noninterest income 123,708 95,611 73,059 59,293 80,426 69,139 Non-GAAP noninterest income, net of non-controlling interests 59,836 54,372 62,082 51,375 57,844 55,615 GAAP taxable equivalent revenue $254,637 $231,549 $213,614 $210,714 $232,845 $224,050 Non-GAAP taxable equivalent revenue, net of non- controlling interests 190,720 190,278 202,599 202,753 210,225 210,476 GAAP operating efficiency ratio 47.53% 55.04% 63.06% 62.65% 58.31% 60.33% Non-GAAP operating efficiency ratio (1) 63.72% 65.53% 65.16% 63.72% 62.70% 62.93% 48Non-GAAP ReconciliationNote: For additional non-GAAP disclosures, please refer to our latest Forms 10-Q and 10-K.. Non-Interest Expense and Efficiency Ratios
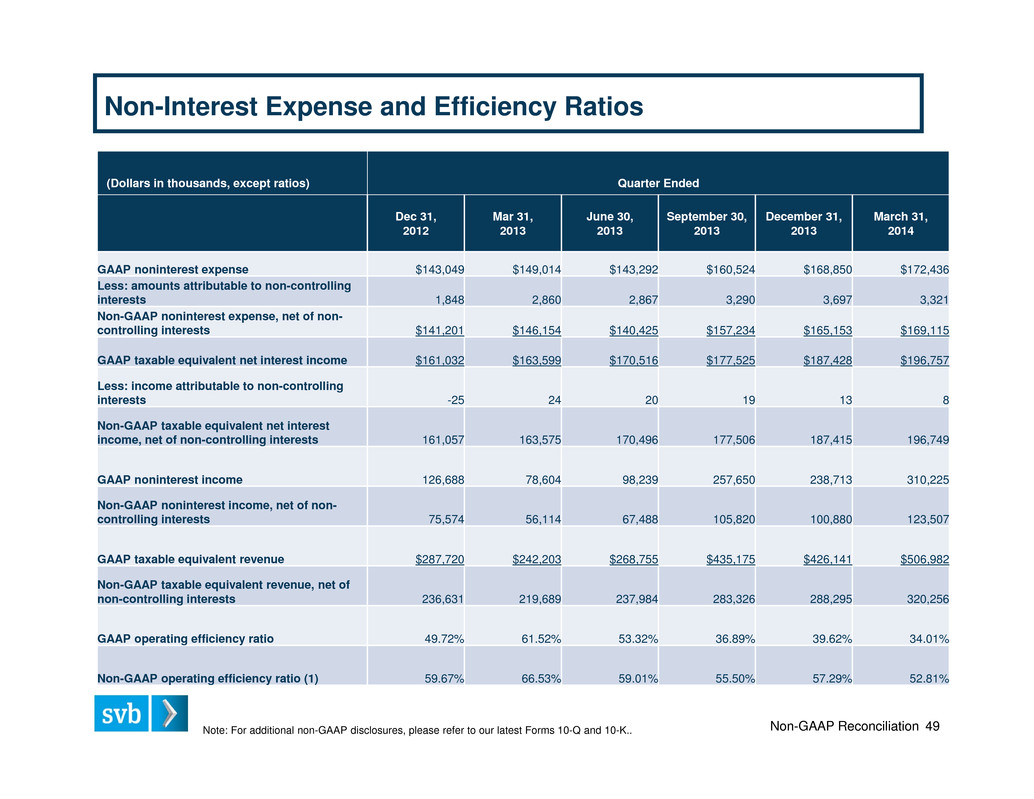
(Dollars in thousands, except ratios) Quarter Ended Dec 31, 2012 Mar 31, 2013 June 30, 2013 September 30, 2013 December 31, 2013 March 31, 2014 GAAP noninterest expense $143,049 $149,014 $143,292 $160,524 $168,850 $172,436 Less: amounts attributable to non-controlling interests 1,848 2,860 2,867 3,290 3,697 3,321 Non-GAAP noninterest expense, net of non- controlling interests $141,201 $146,154 $140,425 $157,234 $165,153 $169,115 GAAP taxable equivalent net interest income $161,032 $163,599 $170,516 $177,525 $187,428 $196,757 Less: income attributable to non-controlling interests -25 24 20 19 13 8 Non-GAAP taxable equivalent net interest income, net of non-controlling interests 161,057 163,575 170,496 177,506 187,415 196,749 GAAP noninterest income 126,688 78,604 98,239 257,650 238,713 310,225 Non-GAAP noninterest income, net of non- controlling interests 75,574 56,114 67,488 105,820 100,880 123,507 GAAP taxable equivalent revenue $287,720 $242,203 $268,755 $435,175 $426,141 $506,982 Non-GAAP taxable equivalent revenue, net of non-controlling interests 236,631 219,689 237,984 283,326 288,295 320,256 GAAP operating efficiency ratio 49.72% 61.52% 53.32% 36.89% 39.62% 34.01% Non-GAAP operating efficiency ratio (1) 59.67% 66.53% 59.01% 55.50% 57.29% 52.81% 49Non-GAAP ReconciliationNote: For additional non-GAAP disclosures, please refer to our latest Forms 10-Q and 10-K.. Non-Interest Expense and Efficiency Ratios

MEGHAN O'LEARY Director of Investor Relations 3005 Tasman Drive Santa Clara, CA 95054 T 408 654 6364 M 650 255 9934 moleary@svb.com Find SVB on LinkedIn, Facebook and Twitter


