1 Q2 2022 Earnings Highlights SVB Financial Group Q2 2022 CEO Letter To our Stakeholders SVB delivered Earnings Per Share of $5.60 and Net Income of $333 million in the second quarter, with a Return on Equity of 10.87 percent. Persistent public market volatility pressured VC investment and exits, reducing client liquidity inflows and impacting our 2022 outlook In the second quarter, private markets increasingly felt the impact of continued public market volatility. The IPO window remained closed and, in contrast to the first quarter when public market declines mostly affected later- stage companies, companies across all investment stages experienced challenges to accessing liquidity, with total VC investment declining 24 percent quarter-over-quarter. The reduction in client fundraising, coupled with increased burn rates – as companies with already accelerated burn rates took proactive actions to reduce future spending – pressured Q2 balance sheet growth. Despite these challenges, many parts of our core business performed well in the second quarter. Loan growth and pipelines were healthy; NII and client investment funds benefitted from higher interest rates; SVB Securities revenue was robust; and client acquisition remained near historic highs. NCOs and NPLs also remained low, although the increase in unreserved charge-offs and new NPLs may indicate potential emerging pressure from market volatility. We have adjusted our full-year 2022 outlook to reflect our expectations that challenged public equity markets and declines in venture deployment will continue for the remainder of 2022, which will pressure our balance sheet growth. While we are maintaining our full-year 2022 NCO outlook, we expect NCOs to increase in 2H’22 and have proactively raised reserves. To offset these changes somewhat, we decreased our expense outlook, leveraging the flexibility that allowed us to increase investment when revenue tailwinds were strong to dial down expense growth while still investing in our strategic priorities. Long-term growth opportunity remains intact, despite near-term challenges While the current environment is challenging for the innovation sector, we remain confident in the long-term growth opportunity of our markets, and we see reasons for optimism. VC and PE firms have record levels of dry powder (8 times higher than 2000 levels) to put to work, and we believe they will do so as valuations stabilize. If IPO markets reopen and we see faster deployment of private capital, or if client burn rates decelerate, we could see better balance sheet growth. While VC activity pulled back during the second quarter, our client acquisition remained near all-time highs. Experience has shown us that good companies are founded and funded in the troughs as well as the peaks of every cycle, a lesson not lost on PE and VC firms, many of whom regret missing out on opportunities during the Global Financial Crisis and VC Recalibration We believe the long-term tailwinds supporting the innovation economy remain intact and it will continue to expand over time. The digital economy has been a key driver of economic expansion in the past two decades, growing by 350 percent between 2000 and 2020 – 2.4 times faster than the overall US economyi, a figure that does not include the addressable market for innovation companies, which has expanded even faster as technology has made its way into every aspect of our lives.
2 Q2 2022 Earnings Highlights We are well-positioned to support our clients and navigate market conditions Against this backdrop of market uncertainty, SVB is better positioned than at any point in our history to support our clients. We have a unique business model serving dynamic, resilient markets; a high-quality, liquid balance sheet; and expanded capabilities and earnings power as a result of the investments we have made in our business. The resiliency of our clients has helped drive client funds growth over time that has provided the foundation for sustained revenue growth, market disruptions notwithstanding. While we have historically seen short periods of quarterly client fund declines during significant market cycles, annual average total client funds have only declined twice since 2000, and these pullbacks have been followed by quick rebounds and better-than-market expansion of client activity and funds growth. Through consistent focus over time, we have built a seasoned leadership team, and a proven track record of navigating successfully through market cycles. The market adjustments we are seeing today are a normal and necessary part of the innovation cycle (and the broader economic cycle), and we are confident in our ability to support our clients and manage our business through them. Focus on clients, partnership and execution SVB’s focus and commitment to our clients has made us a trusted partner for innovators, entrepreneurs, and investors across the global innovation economy for the last 40 years. We built our reputation over decades of focus and partnership, regardless of market conditions. When we talk about the power of the SVB platform, we are not just talking about our capabilities and insights; we are talking about being a committed partner in our clients’ journeys, even in challenging times … especially in challenging times. While we adjusted some of our near-term revenue expectations, we have not changed our view of the long-term growth opportunity represented by the innovation economy. We believe demand for investment in the most dynamic segment of the global economy will remain robust over time. With SVB’s diversified business model and unique role in helping individuals, investors and the world’s most innovative companies achieve extraordinary outcomes, we remain confident we are in the right market with the right strategy for the long term. Greg Becker President and CEO This Q2 2022 CEO Letter should be reviewed together with SVB’s Earnings Release, Earnings Presentation, and SEC filings for the same period. i Sources: Pitchbook, US Bureau of Economic Analysis, and SVB analysis; Digital economy defined by the US BEA and used as a proxy for the value added to US GDP by that sector between 2000 and 2020

Q2 2022 Financial Highlights July 21, 2022

Q2 2022 FINANCIAL HIGHLIGHTS 2 3 Snapshot and current environment 21 Performance detail and outlook drivers 34 Appendix 47 Non-GAAP reconciliations This presentation should be reviewed with our Q2 2022 Earnings Release and Q2 2022 CEO Letter, as well as the company’s SEC filings. Contents

Snapshot and current environment Q2 2022 FINANCIAL HIGHLIGHTS 3
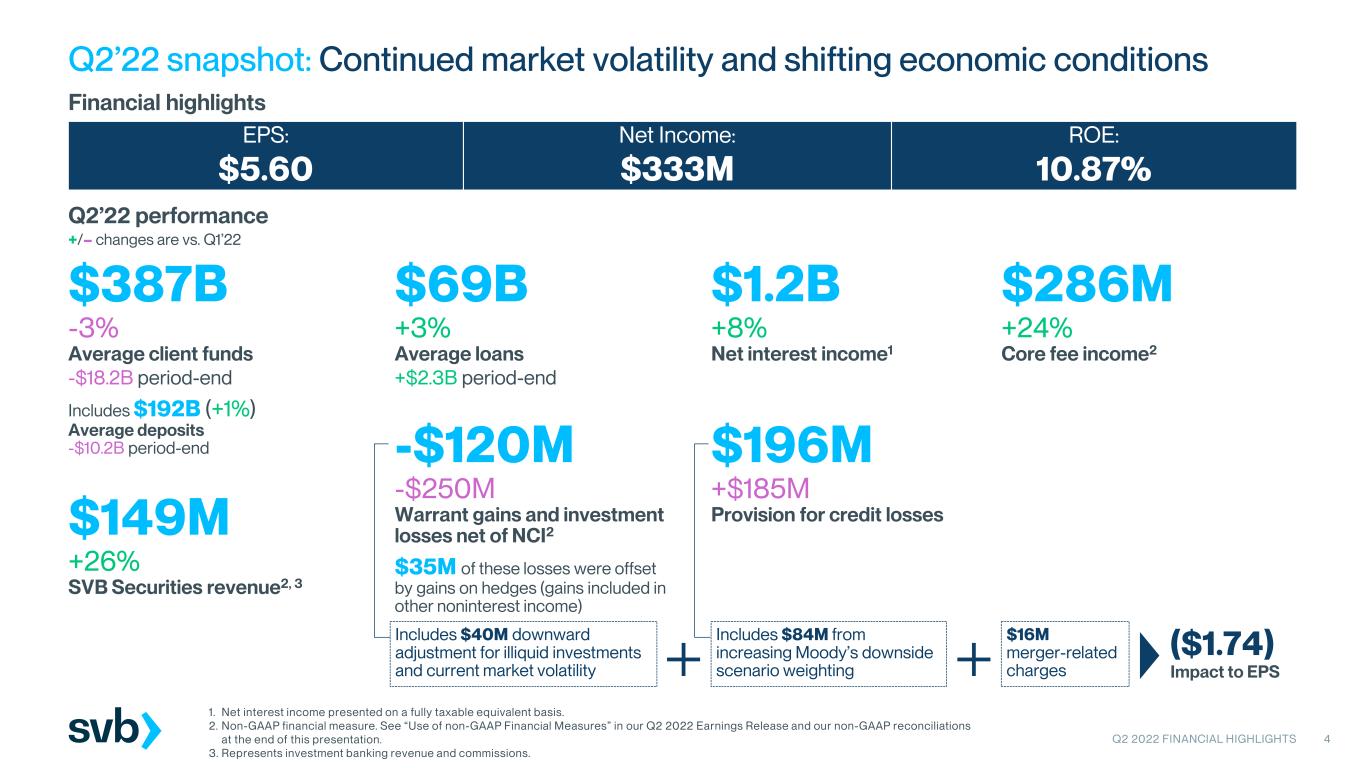
1. Net interest income presented on a fully taxable equivalent basis. 2. Non-GAAP financial measure. See “Use of non-GAAP Financial Measures” in our Q2 2022 Earnings Release and our non-GAAP reconciliations at the end of this presentation. 3. Represents investment banking revenue and commissions. Q2’22 snapshot: Continued market volatility and shifting economic conditions Financial highlights Q2’22 performance +/– changes are vs. Q1’22 $149M +26% SVB Securities revenue2, 3 $69B +3% Average loans +$2.3B period-end $387B -3% Average client funds -$18.2B period-end Includes $192B (+1%) Average deposits -$10.2B period-end $196M +$185M Provision for credit losses $1.2B +8% Net interest income1 EPS: $5.60 ROE: 10.87% Net Income: $333M $286M +24% Core fee income2 -$120M -$250M Warrant gains and investment losses net of NCI2 $35M of these losses were offset by gains on hedges (gains included in other noninterest income) ($1.74) Impact to EPS Q2 2022 FINANCIAL HIGHLIGHTS 4 Includes $40M downward adjustment for illiquid investments and current market volatility Includes $84M from increasing Moody’s downside scenario weighting $16M merger-related charges
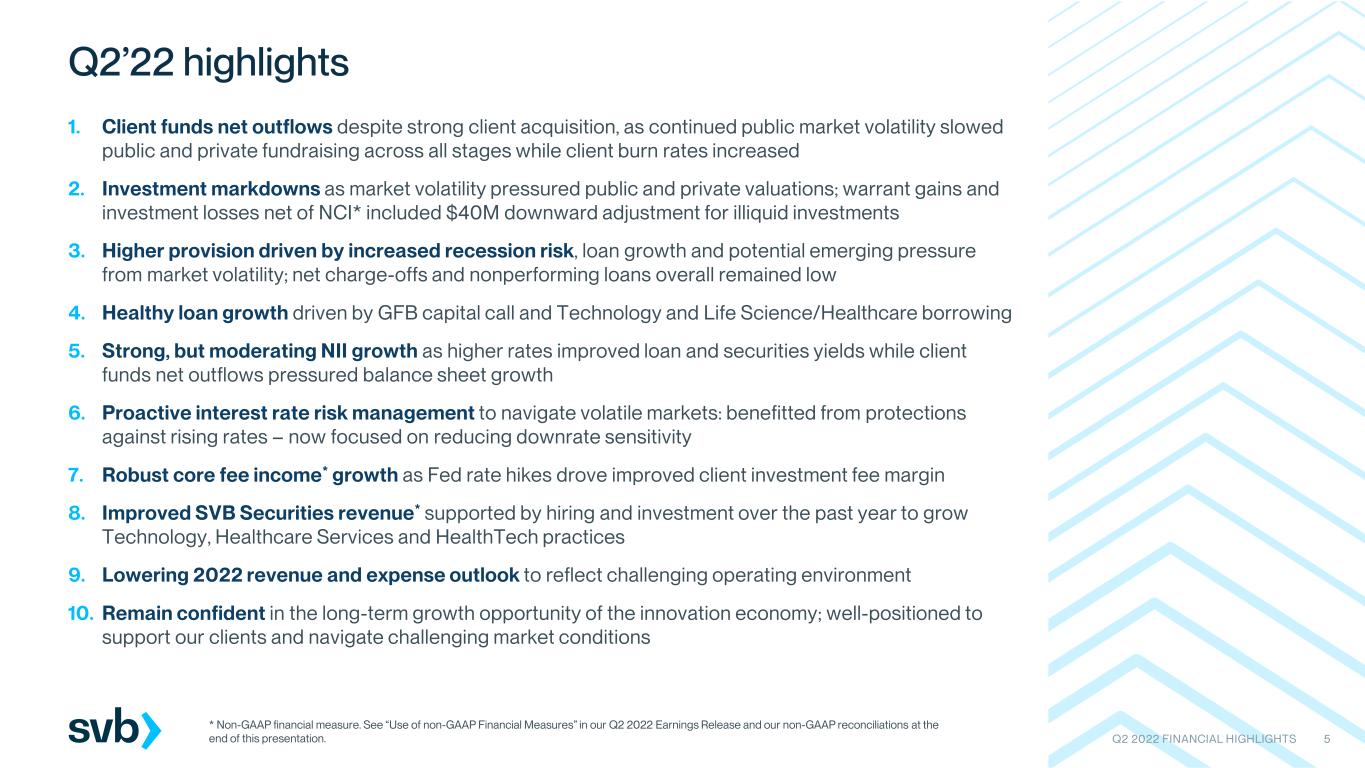
Q2 2022 FINANCIAL HIGHLIGHTS 5 Q2’22 highlights 1. Client funds net outflows despite strong client acquisition, as continued public market volatility slowed public and private fundraising across all stages while client burn rates increased 2. Investment markdowns as market volatility pressured public and private valuations; warrant gains and investment losses net of NCI* included $40M downward adjustment for illiquid investments 3. Higher provision driven by increased recession risk, loan growth and potential emerging pressure from market volatility; net charge-offs and nonperforming loans overall remained low 4. Healthy loan growth driven by GFB capital call and Technology and Life Science/Healthcare borrowing 5. Strong, but moderating NII growth as higher rates improved loan and securities yields while client funds net outflows pressured balance sheet growth 6. Proactive interest rate risk management to navigate volatile markets: benefitted from protections against rising rates – now focused on reducing downrate sensitivity 7. Robust core fee income* growth as Fed rate hikes drove improved client investment fee margin 8. Improved SVB Securities revenue* supported by hiring and investment over the past year to grow Technology, Healthcare Services and HealthTech practices 9. Lowering 2022 revenue and expense outlook to reflect challenging operating environment 10. Remain confident in the long-term growth opportunity of the innovation economy; well-positioned to support our clients and navigate challenging market conditions * Non-GAAP financial measure. See “Use of non-GAAP Financial Measures” in our Q2 2022 Earnings Release and our non-GAAP reconciliations at the end of this presentation.
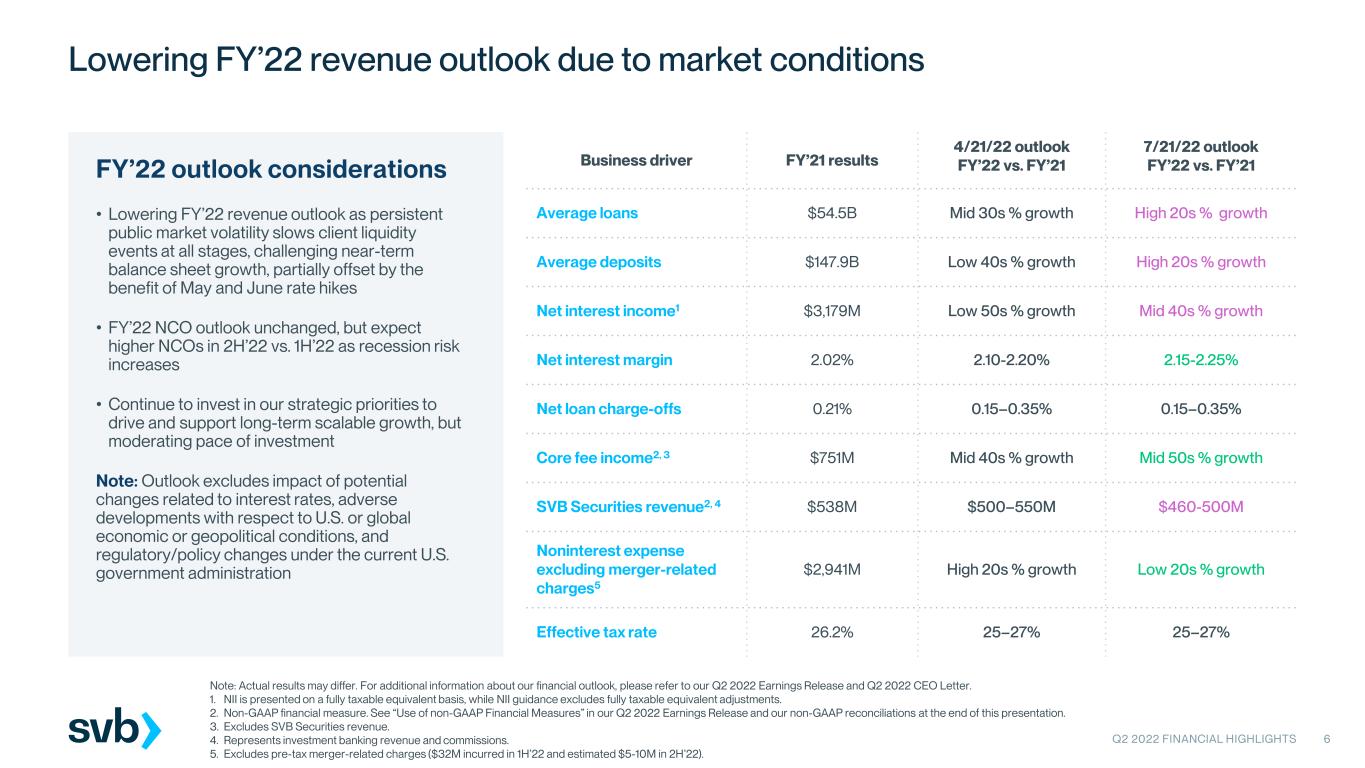
Q2 2022 FINANCIAL HIGHLIGHTS 6 Lowering FY’22 revenue outlook due to market conditions FY’22 outlook considerations • Lowering FY’22 revenue outlook as persistent public market volatility slows client liquidity events at all stages, challenging near-term balance sheet growth, partially offset by the benefit of May and June rate hikes • FY’22 NCO outlook unchanged, but expect higher NCOs in 2H’22 vs. 1H’22 as recession risk increases • Continue to invest in our strategic priorities to drive and support long-term scalable growth, but moderating pace of investment Note: Outlook excludes impact of potential changes related to interest rates, adverse developments with respect to U.S. or global economic or geopolitical conditions, and regulatory/policy changes under the current U.S. government administration Note: Actual results may differ. For additional information about our financial outlook, please refer to our Q2 2022 Earnings Release and Q2 2022 CEO Letter. 1. NII is presented on a fully taxable equivalent basis, while NII guidance excludes fully taxable equivalent adjustments. 2. Non-GAAP financial measure. See “Use of non-GAAP Financial Measures” in our Q2 2022 Earnings Release and our non-GAAP reconciliations at the end of this presentation. 3. Excludes SVB Securities revenue. 4. Represents investment banking revenue and commissions. 5. Excludes pre-tax merger-related charges ($32M incurred in 1H’22 and estimated $5-10M in 2H’22). Business driver FY’21 results 4/21/22 outlook FY’22 vs. FY’21 7/21/22 outlook FY’22 vs. FY’21 Average loans $54.5B Mid 30s % growth High 20s % growth Average deposits $147.9B Low 40s % growth High 20s % growth Net interest income1 $3,179M Low 50s % growth Mid 40s % growth Net interest margin 2.02% 2.10-2.20% 2.15-2.25% Net loan charge-offs 0.21% 0.15–0.35% 0.15–0.35% Core fee income2, 3 $751M Mid 40s % growth Mid 50s % growth SVB Securities revenue2, 4 $538M $500–550M $460-500M Noninterest expense excluding merger-related charges5 $2,941M High 20s % growth Low 20s % growth Effective tax rate 26.2% 25–27% 25–27%

25 25 35 30 20 Q2'21 Q3'21 Q4'21 Q1'22 Q2'22 U.S. seed, angel & early-stage VC investment $B Q2 2022 FINANCIAL HIGHLIGHTS 7 Persistent public market volatility further pressured VC investment and exits, reducing client funds inflows 56 64 59 52 42 Q2'21 Q3'21 Q4'21 Q1'22 Q2'22 U.S. later-stage VC investment $B IPO window remained closed as public markets continued to decline 237 157 167 23 5 Q2'21 Q3'21 Q4'21 Q1'22 Q2'22 U.S. VC-backed public listings $B Public equity valuation correction impacted VC deal activity across stages (-24% QoQ) S&P 500 ex Nasdaq-100 0.80x As of 6/30/22 Nasdaq-100* 0.70x Indexed price % vs. 12/31/21 Note: VC and public listing data sourced from PitchBook. Investment data has been updated with PitchBook’s proprietary back-end data set and filters which has resulted in prior period revisions. * Nasdaq 100 Index used as a proxy for technology markets.
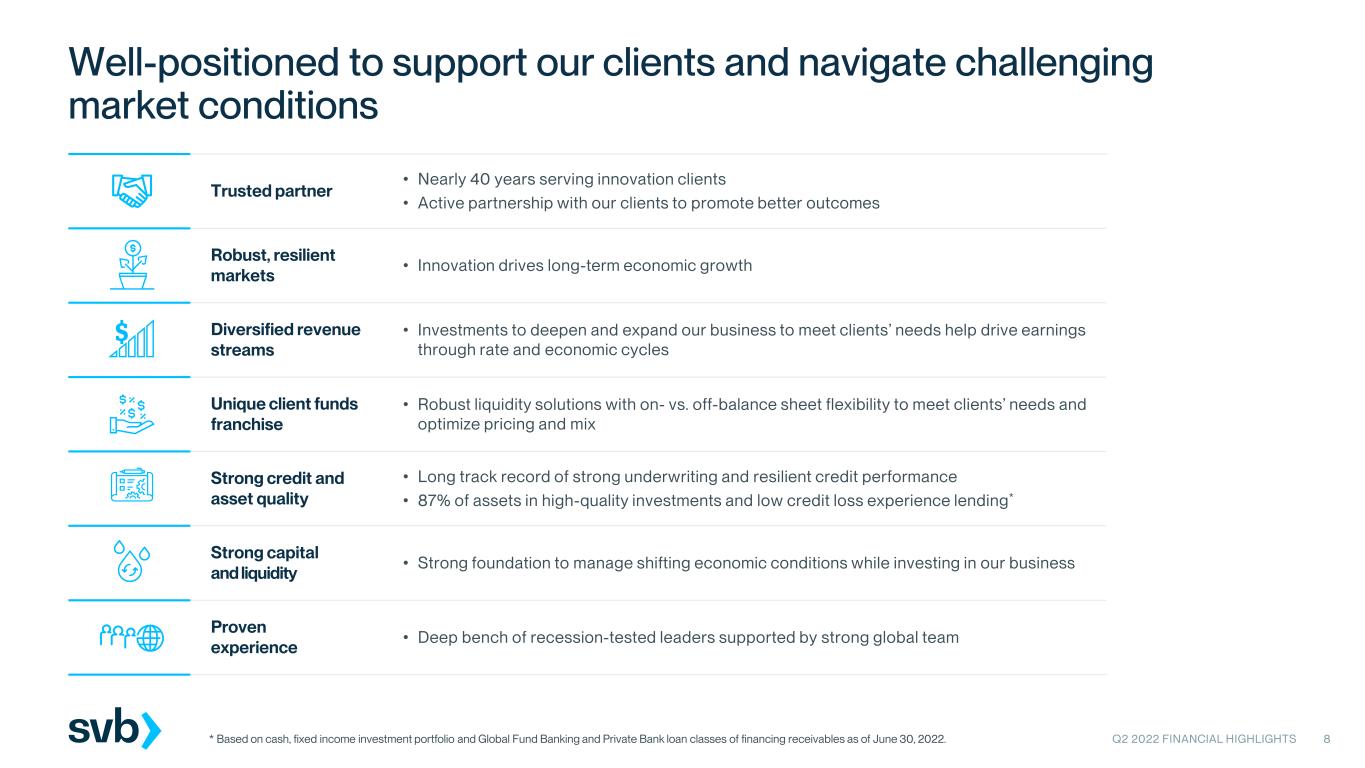
Q2 2022 FINANCIAL HIGHLIGHTS 8 Well-positioned to support our clients and navigate challenging market conditions Trusted partner • Nearly 40 years serving innovation clients • Active partnership with our clients to promote better outcomes Robust, resilient markets • Innovation drives long-term economic growth Diversified revenue streams • Investments to deepen and expand our business to meet clients’ needs help drive earnings through rate and economic cycles Unique client funds franchise • Robust liquidity solutions with on- vs. off-balance sheet flexibility to meet clients’ needs and optimize pricing and mix Strong credit and asset quality • Long track record of strong underwriting and resilient credit performance • 87% of assets in high-quality investments and low credit loss experience lending* Strong capital and liquidity • Strong foundation to manage shifting economic conditions while investing in our business Proven experience • Deep bench of recession-tested leaders supported by strong global team * Based on cash, fixed income investment portfolio and Global Fund Banking and Private Bank loan classes of financing receivables as of June 30, 2022.
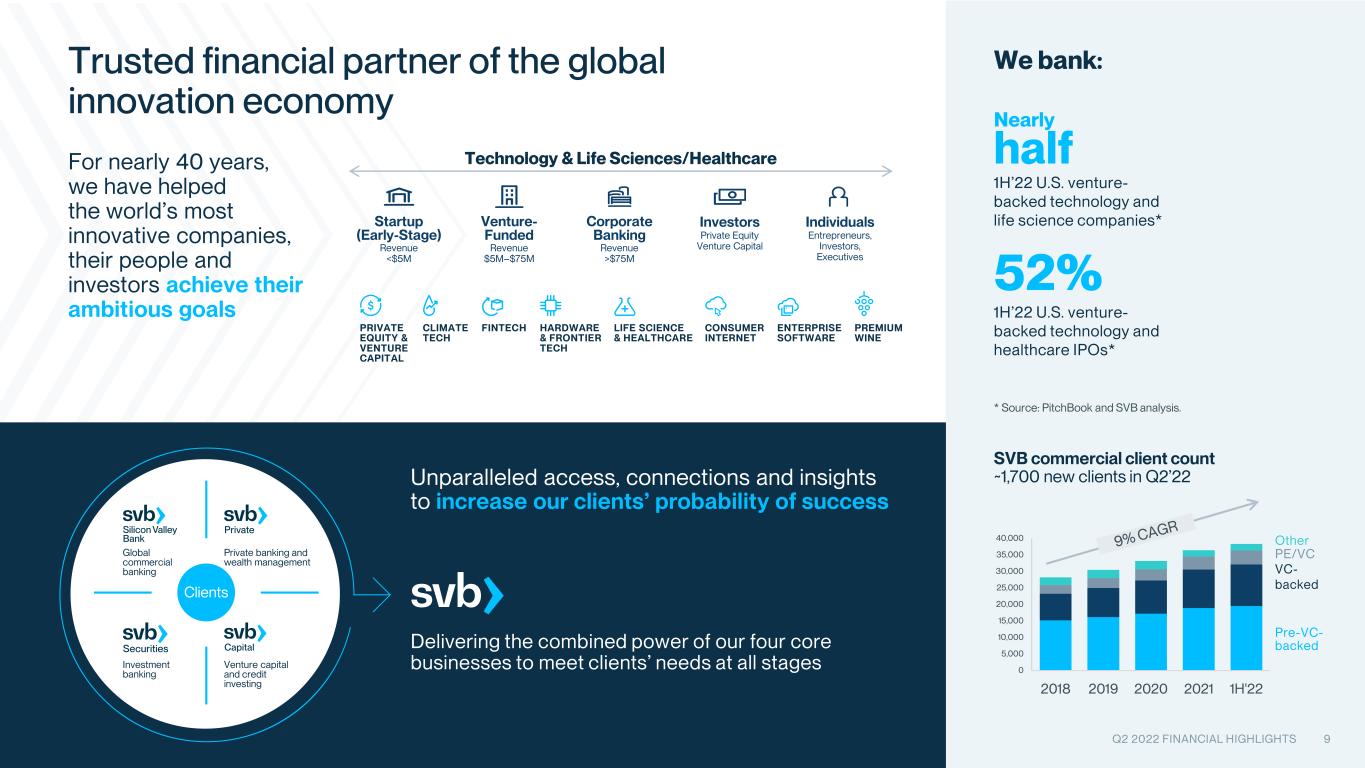
Technology & Life Sciences/Healthcare Corporate Banking Revenue >$75M Startup (Early-Stage) Revenue <$5M Venture- Funded Revenue $5M–$75M Investors Private Equity Venture Capital Individuals Entrepreneurs, Investors, Executives ENTERPRISE SOFTWARE CONSUMER INTERNET LIFE SCIENCE & HEALTHCARE PREMIUM WINE PRIVATE EQUITY & VENTURE CAPITAL HARDWARE & FRONTIER TECH FINTECHCLIMATE TECH Q2 2022 FINANCIAL HIGHLIGHTS 9 Trusted financial partner of the global innovation economy 1H’22 U.S. venture- backed technology and life science companies* Nearly half 1H’22 U.S. venture- backed technology and healthcare IPOs* We bank: 52% For nearly 40 years, we have helped the world’s most innovative companies, their people and investors achieve their ambitious goals Delivering the combined power of our four core businesses to meet clients’ needs at all stages Unparalleled access, connections and insights to increase our clients’ probability of success SVB commercial client count ~1,700 new clients in Q2’22 0 5,000 10,000 15,000 20,000 25,000 30,000 35,000 40,000 2018 2019 2020 2021 1H'22 Other PE/VC VC- backed Pre-VC- backed Global commercial banking Investment banking Private banking and wealth management Venture capital and credit investing Clients * Source: PitchBook and SVB analysis.
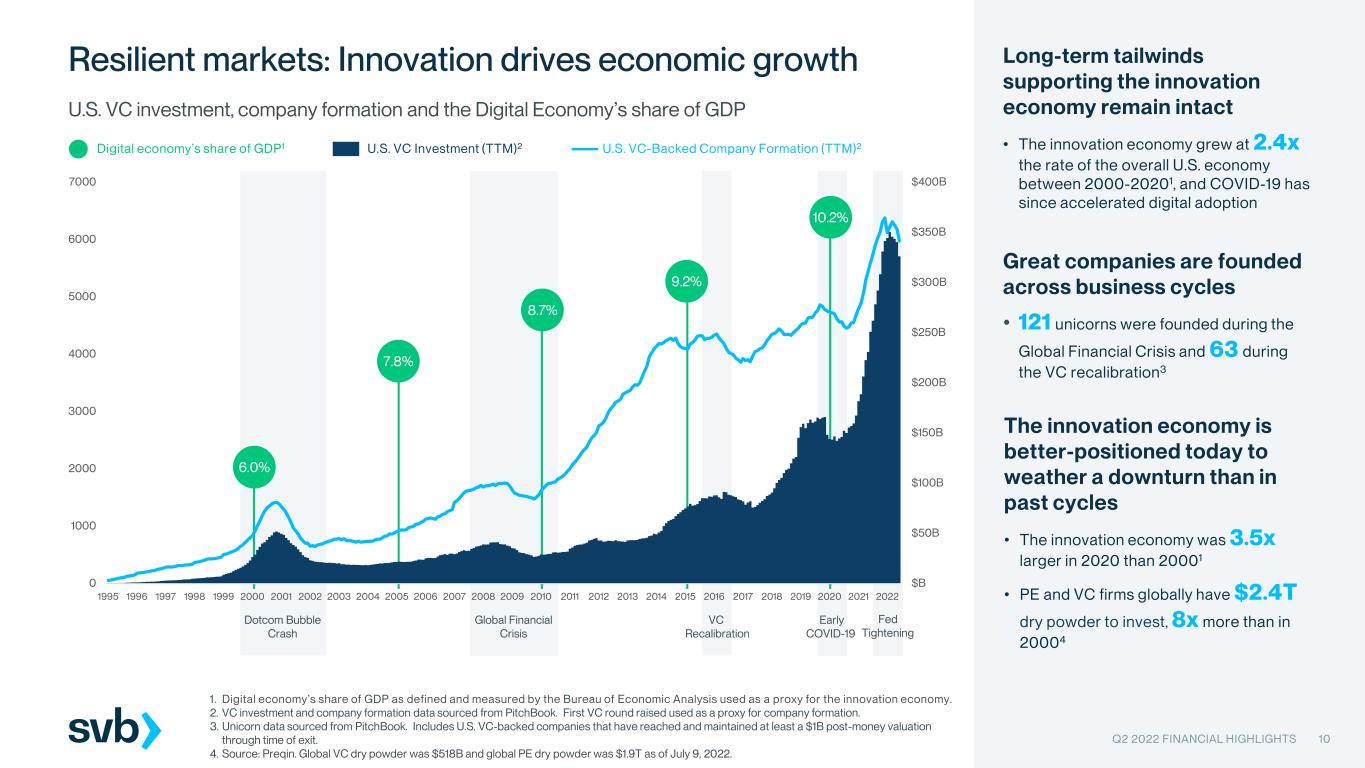
$B $50B $100B $150B $200B $250B $300B $350B $400B 0 1000 2000 3000 4000 5000 6000 7000 1995 1996 1997 1998 1999 2000 2001 2002 2003 2004 2005 2006 2007 2008 2009 2010 2011 2012 2013 2014 2015 2016 2017 2018 2019 2020 2021 2022 6.0% 7.8% 8.7% 9.2% 10.2% Q2 2022 FINANCIAL HIGHLIGHTS 10 Resilient markets: Innovation drives economic growth 1. Digital economy’s share of GDP as defined and measured by the Bureau of Economic Analysis used as a proxy for the innovation economy. 2. VC investment and company formation data sourced from PitchBook. First VC round raised used as a proxy for company formation. 3. Unicorn data sourced from PitchBook. Includes U.S. VC-backed companies that have reached and maintained at least a $1B post-money valuation through time of exit. 4. Source: Preqin. Global VC dry powder was $518B and global PE dry powder was $1.9T as of July 9, 2022. Long-term tailwinds supporting the innovation economy remain intact • The innovation economy grew at 2.4x the rate of the overall U.S. economy between 2000-20201, and COVID-19 has since accelerated digital adoption Digital economy’s share of GDP1 U.S. VC Investment (TTM)2 U.S. VC-Backed Company Formation (TTM)2 U.S. VC investment, company formation and the Digital Economy’s share of GDP Global Financial Crisis VC Recalibration Early COVID-19 Fed Tightening Dotcom Bubble Crash Great companies are founded across business cycles • 121 unicorns were founded during the Global Financial Crisis and 63 during the VC recalibration3 The innovation economy is better-positioned today to weather a downturn than in past cycles • The innovation economy was 3.5x larger in 2020 than 20001 • PE and VC firms globally have $2.4T dry powder to invest, 8x more than in 20004
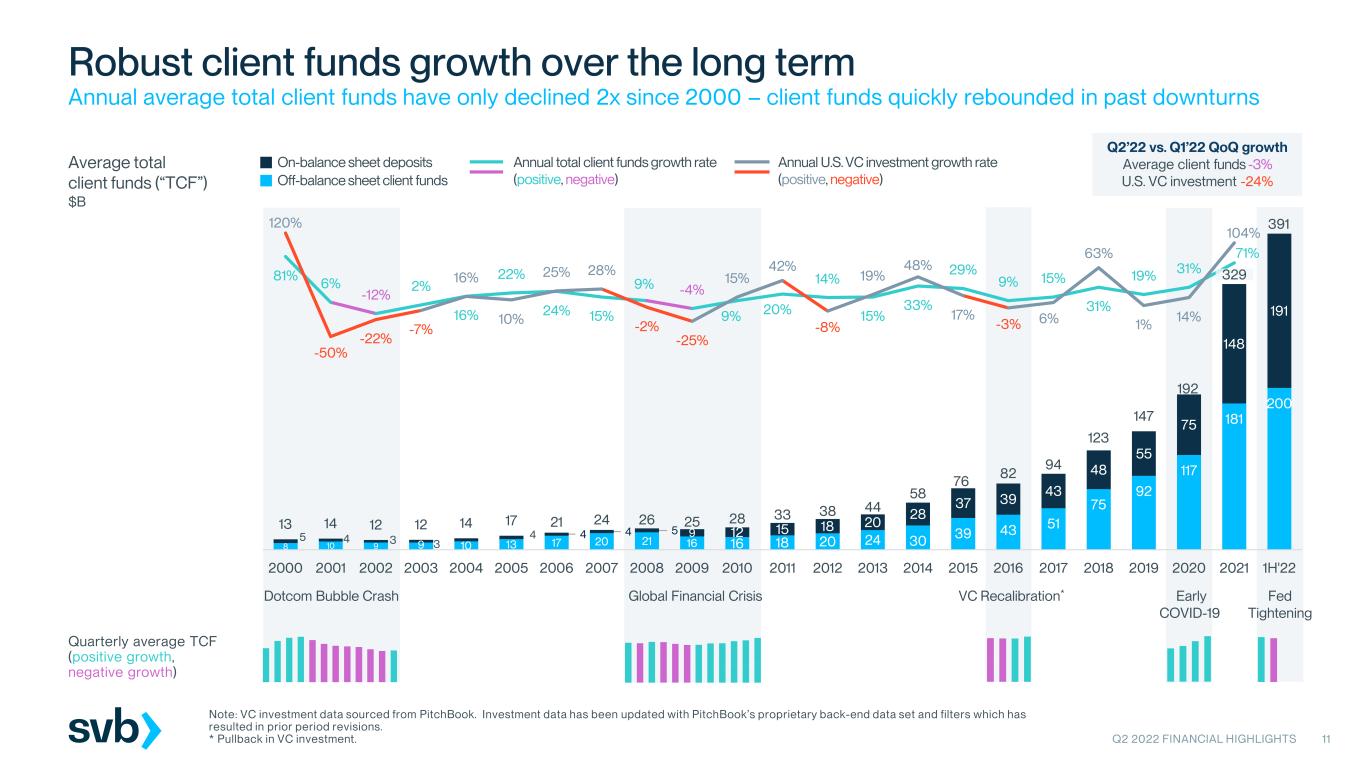
8 10 9 9 10 13 17 20 21 16 16 18 20 24 30 39 43 51 75 92 117 181 200 5 4 3 3 4 4 4 4 5 9 12 15 18 20 28 37 39 43 48 55 75 148 191 13 14 12 12 14 17 21 24 26 25 28 33 38 44 58 76 82 94 123 147 192 329 391 81% 6% -12% 2% 16% 22% 24% 15% 9% -4% 9% 20% 14% 15% 33% 29% 9% 15% 31% 19% 31% 71% 120% -50% -22% -7% 16% 10% 25% 28% -2% -25% 15% 42% -8% 19% 48% 17% -3% 6% 63% 1% 14% 104% -400% -300% -200% -100% 0% 100% 2000 2001 2002 2003 2004 2005 2006 2007 2008 2009 2010 2011 2012 2013 2014 2015 2016 2017 2018 2019 2020 2021 1H'22 Global Financial Crisis VC Recalibration* Early COVID-19 Q2 2022 FINANCIAL HIGHLIGHTS 11 Robust client funds growth over the long term Annual average total client funds have only declined 2x since 2000 – client funds quickly rebounded in past downturns Average total client funds (“TCF”) $B Annual total client funds growth rate (positive, negative) On-balance sheet deposits Annual U.S. VC investment growth rate (positive, negative)Off-balance sheet client funds Q2’22 vs. Q1’22 QoQ growth Average client funds -3% U.S. VC investment -24% Note: VC investment data sourced from PitchBook. Investment data has been updated with PitchBook’s proprietary back-end data set and filters which has resulted in prior period revisions. * Pullback in VC investment. Dotcom Bubble Crash - 20.0 40.0 Quarterly average TCF (positive growth, negative growth) Fed Tightening

Q2 2022 FINANCIAL HIGHLIGHTS Unique client funds franchise Flexibility to support deposits and optimize pricing and mix 40+ liquidity management products to meet clients’ needs Robust liquidity solutions, on- and off-balance sheet Diversified sources of client funds from high-growth markets 31% 17%8% 3% 19% 15% 7% 24% 32% 24% 9% 3% 8% Early stage life science/ healthcare Early stage technology Private Bank International2 Life science/ healthcare Technology U.S. Global Fund Banking Client niche1: Note: All figures as of June 30, 2022. 1. Represents management view of client niches. 2. International balances do not tie to regulatory definitions for foreign exposure. Includes clients across all client niches and life stages, with International Global Fund Banking representing 3% of total client funds. 3. Based on deposit rates and total deposit balances at June 30, 2022. $188B Deposits 28 bps weighted average spot deposit rate at 6/30/223 $191B OBS client funds 12 58% 37% 4% 1% Noninterest-bearing deposits Borrowings Interest-bearing deposits Other liabilities Deposits OBS Liabilities 61% 39% Deposits Funding source: Low cost funding mix Flexible liquidity solutions + substantial OBS balances to support deposits 60% Modeled interest- bearing deposit beta 55-60% Expected noninterest- bearing share of total deposits by 12/31/22
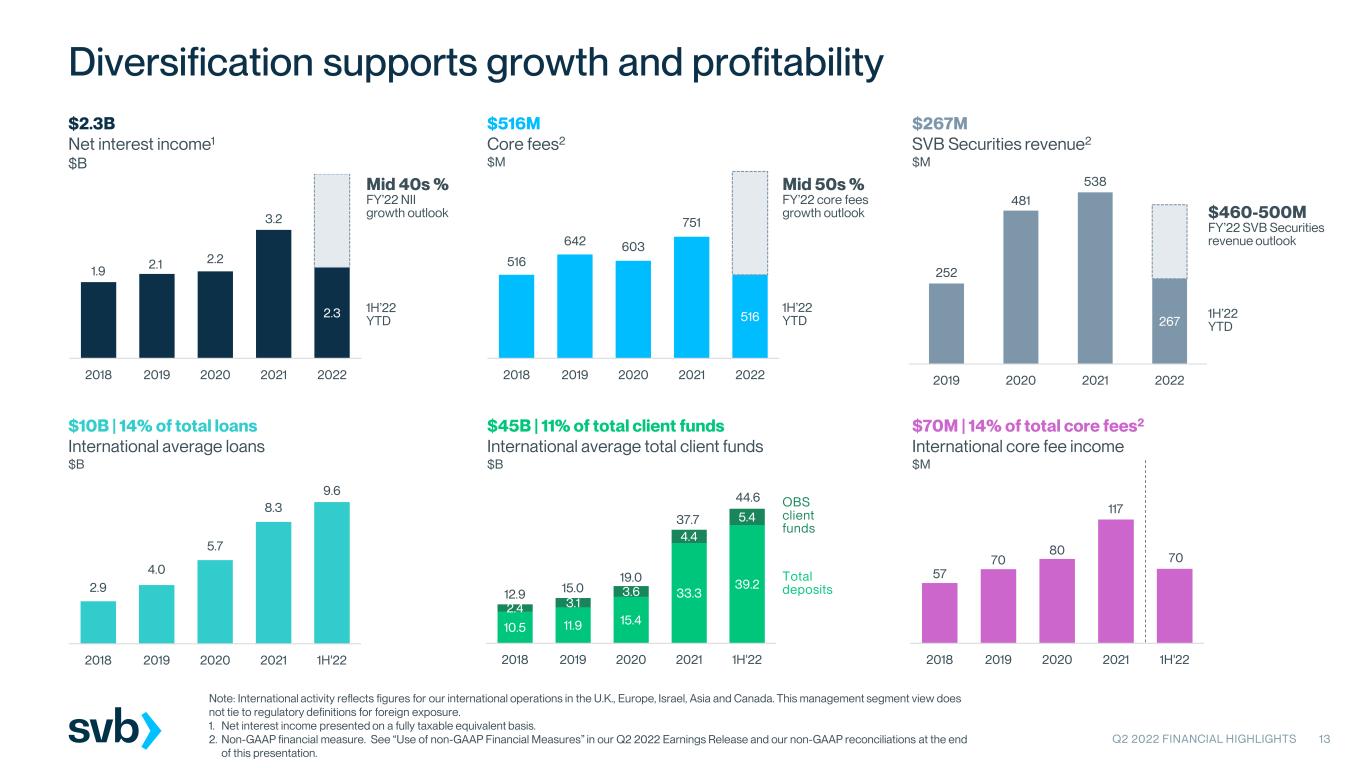
252 481 538 267 2019 2020 2021 2022 516 642 603 751 516 2018 2019 2020 2021 2022 1.9 2.1 2.2 3.2 2.3 2018 2019 2020 2021 2022 10.5 11.9 15.4 33.3 39.2 2.4 3.1 3.6 4.4 5.4 12.9 15.0 19.0 37.7 44.6 2018 2019 2020 2021 1H'22 Total deposits OBS client funds Q2 2022 FINANCIAL HIGHLIGHTS 13 Diversification supports growth and profitability Note: International activity reflects figures for our international operations in the U.K., Europe, Israel, Asia and Canada. This management segment view does not tie to regulatory definitions for foreign exposure. 1. Net interest income presented on a fully taxable equivalent basis. 2. Non-GAAP financial measure. See “Use of non-GAAP Financial Measures” in our Q2 2022 Earnings Release and our non-GAAP reconciliations at the end of this presentation. 57 70 80 117 70 2018 2019 2020 2021 1H'22 $10B | 14% of total loans International average loans $B $2.3B Net interest income1 $B 2.9 4.0 5.7 8.3 9.6 2018 2019 2020 2021 1H'22 $516M Core fees2 $M $45B | 11% of total client funds International average total client funds $B $70M | 14% of total core fees2 International core fee income $M $267M SVB Securities revenue2 $M Mid 40s % FY’22 NII growth outlook Mid 50s % FY’22 core fees growth outlook $460-500M FY’22 SVB Securities revenue outlook 1H’22 YTD 1H’22 YTD 1H’22 YTD
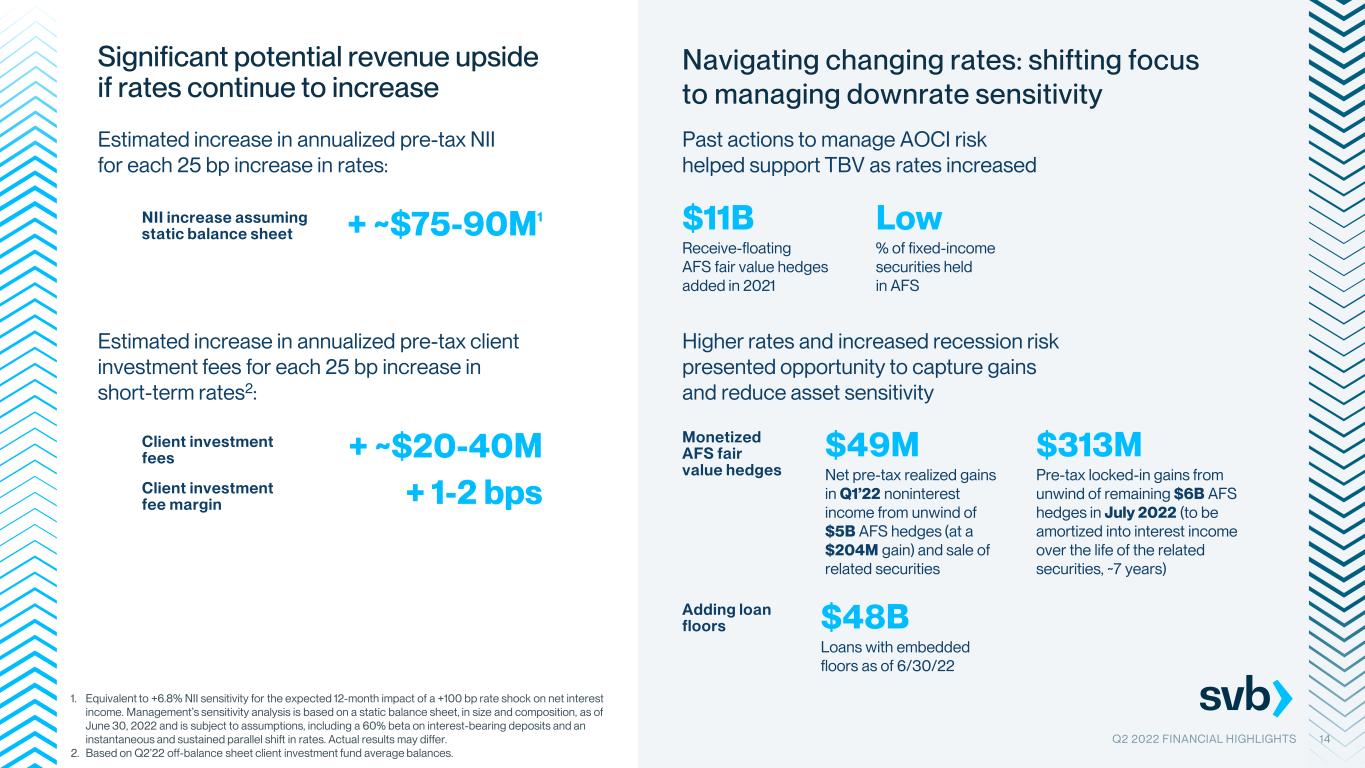
Navigating changing rates: shifting focus to managing downrate sensitivity Q2 2022 FINANCIAL HIGHLIGHTS Significant potential revenue upside if rates continue to increase + ~$75-90M1 Estimated increase in annualized pre-tax NII for each 25 bp increase in rates: NII increase assuming static balance sheet Estimated increase in annualized pre-tax client investment fees for each 25 bp increase in short-term rates2: + ~$20-40MClient investment fees + 1-2 bpsClient investment fee margin $11B Receive-floating AFS fair value hedges added in 2021 $49M Net pre-tax realized gains in Q1’22 noninterest income from unwind of $5B AFS hedges (at a $204M gain) and sale of related securities Low % of fixed-income securities held in AFS $313M Pre-tax locked-in gains from unwind of remaining $6B AFS hedges in July 2022 (to be amortized into interest income over the life of the related securities, ~7 years) Past actions to manage AOCI risk helped support TBV as rates increased Higher rates and increased recession risk presented opportunity to capture gains and reduce asset sensitivity Monetized AFS fair value hedges Adding loan floors $48B Loans with embedded floors as of 6/30/22 1. Equivalent to +6.8% NII sensitivity for the expected 12-month impact of a +100 bp rate shock on net interest income. Management’s sensitivity analysis is based on a static balance sheet, in size and composition, as of June 30, 2022 and is subject to assumptions, including a 60% beta on interest-bearing deposits and an instantaneous and sustained parallel shift in rates. Actual results may differ. 2. Based on Q2’22 off-balance sheet client investment fund average balances. 14
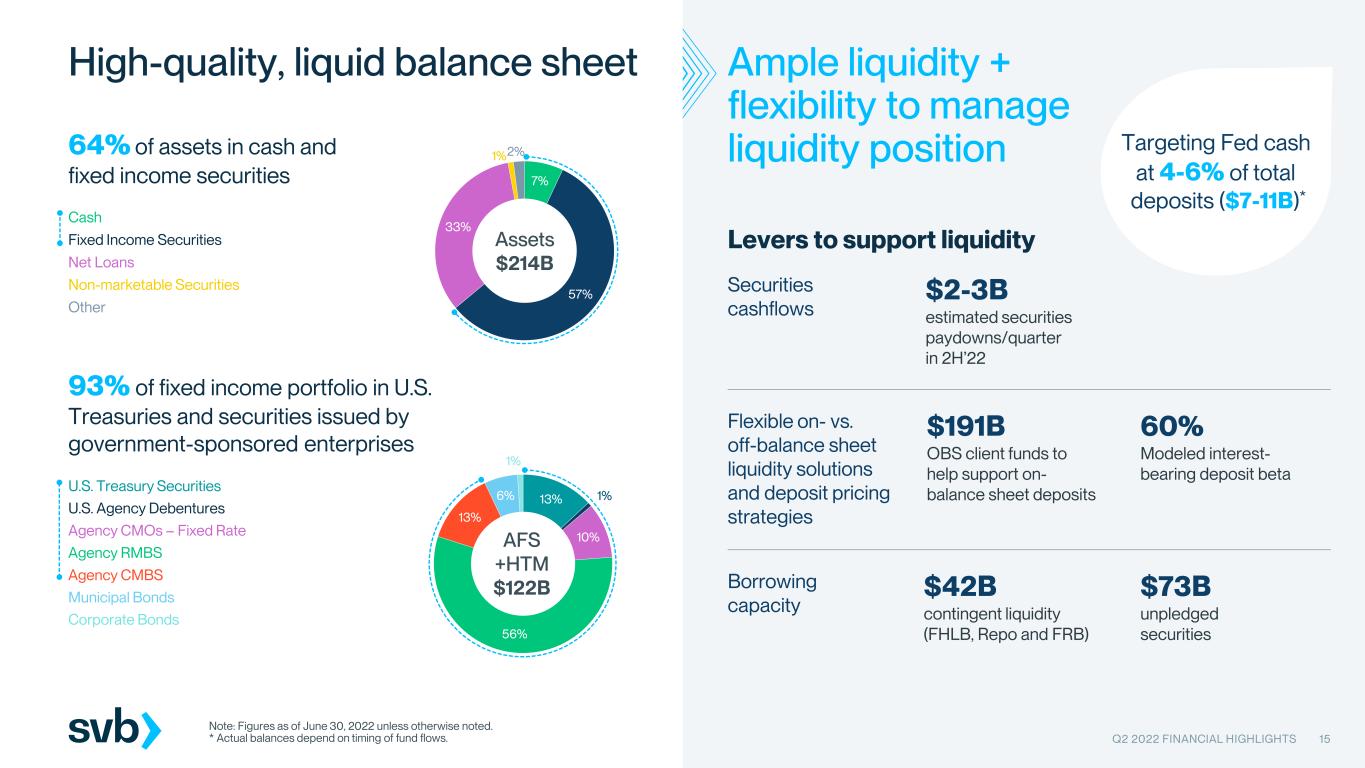
13% 1% 10% 56% 13% 6% 1% 7% 57% 33% 1%2% Other Fixed Income Securities Cash Non-marketable Securities Net Loans Q2 2022 FINANCIAL HIGHLIGHTS 15 High-quality, liquid balance sheet U.S. Treasury Securities Agency RMBS U.S. Agency Debentures Agency CMBS AFS +HTM $122BMunicipal Bonds Corporate Bonds 64% of assets in cash and fixed income securities Ample liquidity + flexibility to manage liquidity position 93% of fixed income portfolio in U.S. Treasuries and securities issued by government-sponsored enterprises Assets $214B Note: Figures as of June 30, 2022 unless otherwise noted. * Actual balances depend on timing of fund flows. $2-3B estimated securities paydowns/quarter in 2H’22 Securities cashflows $73B unpledged securities $42B contingent liquidity (FHLB, Repo and FRB) Borrowing capacity 60% Modeled interest- bearing deposit beta Flexible on- vs. off-balance sheet liquidity solutions and deposit pricing strategies $191B OBS client funds to help support on- balance sheet deposits Levers to support liquidity Targeting Fed cash at 4-6% of total deposits ($7-11B)* Agency CMOs – Fixed Rate
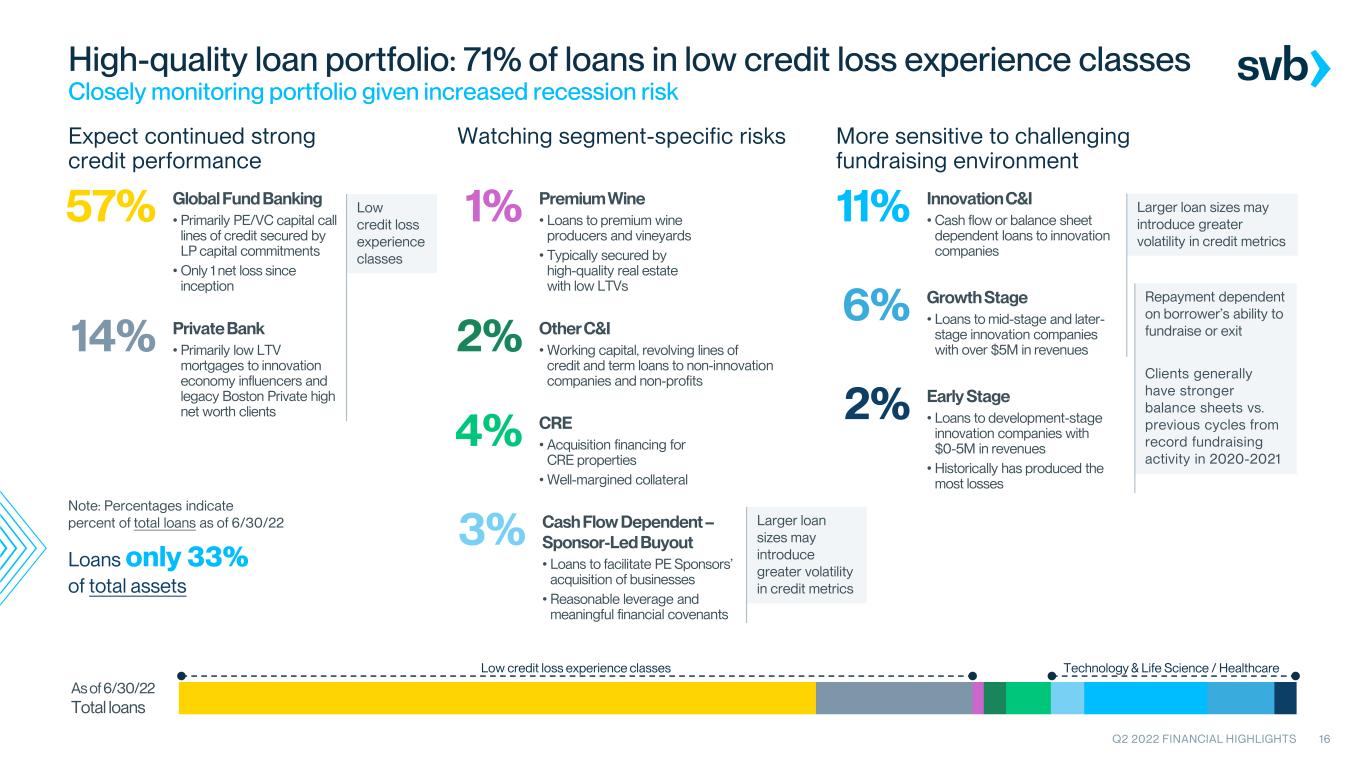
Technology & Life Science / HealthcareLow credit loss experience classes 16 High-quality loan portfolio: 71% of loans in low credit loss experience classes Closely monitoring portfolio given increased recession risk Global Fund Banking • Primarily PE/VC capital call lines of credit secured by LP capital commitments • Only 1 net loss since inception 57% Expect continued strong credit performance Watching segment-specific risks More sensitive to challenging fundraising environment Private Bank • Primarily low LTV mortgages to innovation economy influencers and legacy Boston Private high net worth clients 14% Premium Wine • Loans to premium wine producers and vineyards • Typically secured by high-quality real estate with low LTVs 1% Other C&I • Working capital, revolving lines of credit and term loans to non-innovation companies and non-profits 2% CRE • Acquisition financing for CRE properties • Well-margined collateral 4% Innovation C&I • Cash flow or balance sheet dependent loans to innovation companies 11% Cash Flow Dependent – Sponsor-Led Buyout • Loans to facilitate PE Sponsors’ acquisition of businesses • Reasonable leverage and meaningful financial covenants 3% Growth Stage • Loans to mid-stage and later- stage innovation companies with over $5M in revenues 6% Early Stage • Loans to development-stage innovation companies with $0-5M in revenues • Historically has produced the most losses 2% Larger loan sizes may introduce greater volatility in credit metrics Repayment dependent on borrower’s ability to fundraise or exit Clients generally have stronger balance sheets vs. previous cycles from record fundraising activity in 2020-2021 Low credit loss experience classes As of 6/30/22 Total loans Q2 2022 FINANCIAL HIGHLIGHTS Note: Percentages indicate percent of total loans as of 6/30/22 Loans only 33% of total assets Larger loan sizes may introduce greater volatility in credit metrics
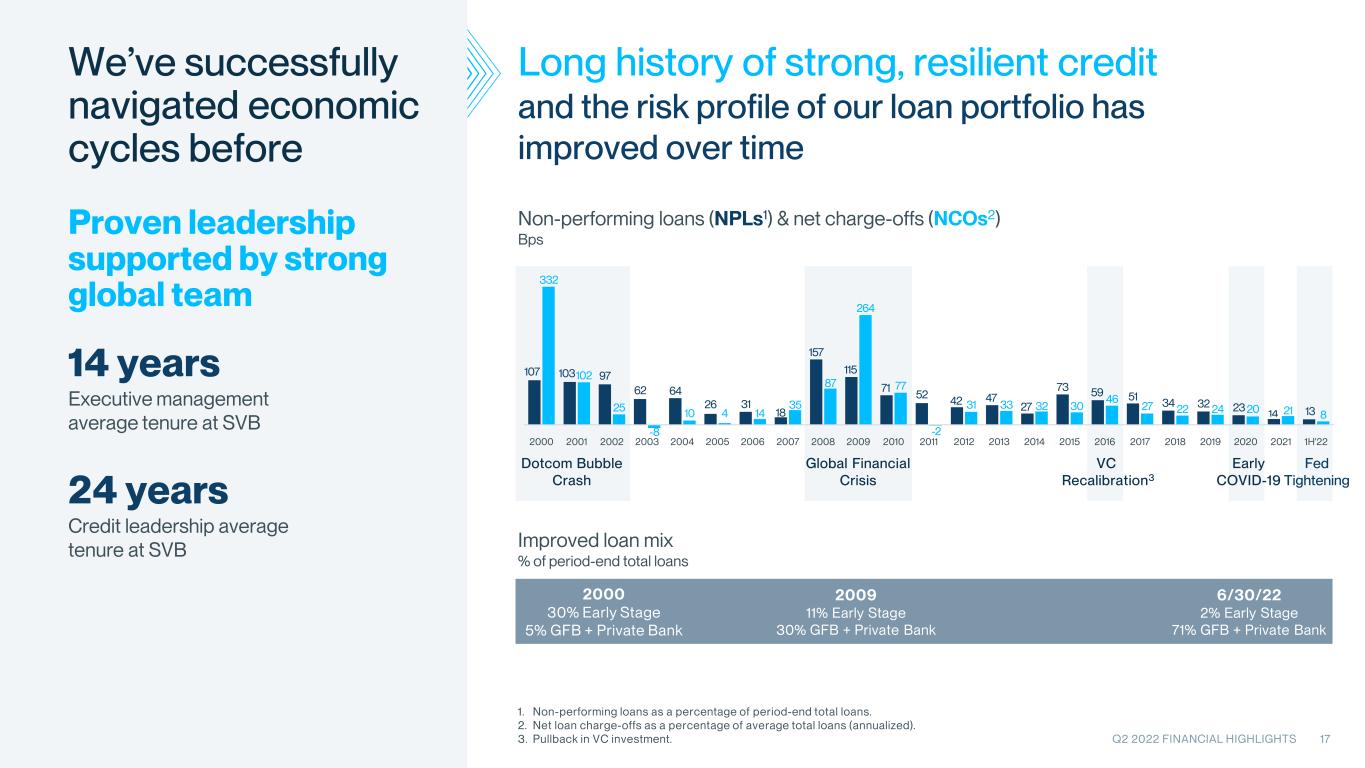
Non-performing loans (NPLs1) & net charge-offs (NCOs2) Bps Global Financial Crisis Dotcom Bubble Crash 2009 11% Early Stage 30% GFB + Private Bank 6/30/22 2% Early Stage 71% GFB + Private Bank 2000 30% Early Stage 5% GFB + Private Bank Early COVID-19 VC Recalibration3 Q2 2022 FINANCIAL HIGHLIGHTS 17 We’ve successfully navigated economic cycles before Proven leadership supported by strong global team and the risk profile of our loan portfolio has improved over time Long history of strong, resilient credit 14 years Executive management average tenure at SVB 24 years Credit leadership average tenure at SVB 1. Non-performing loans as a percentage of period-end total loans. 2. Net loan charge-offs as a percentage of average total loans (annualized). 3. Pullback in VC investment. Fed Tightening Improved loan mix % of period-end total loans 107 103 97 62 64 26 31 18 157 115 71 52 42 47 27 73 59 51 34 32 23 14 13 332 102 25 -8 10 4 14 35 87 264 77 -2 31 33 32 30 46 27 22 24 20 21 8 -10 40 90 140 190 240 290 340 2000 2001 2002 2003 2004 2005 2006 2007 2008 2009 2010 2011 2012 2013 2014 2015 2016 2017 2018 2019 2020 2021 1H'22
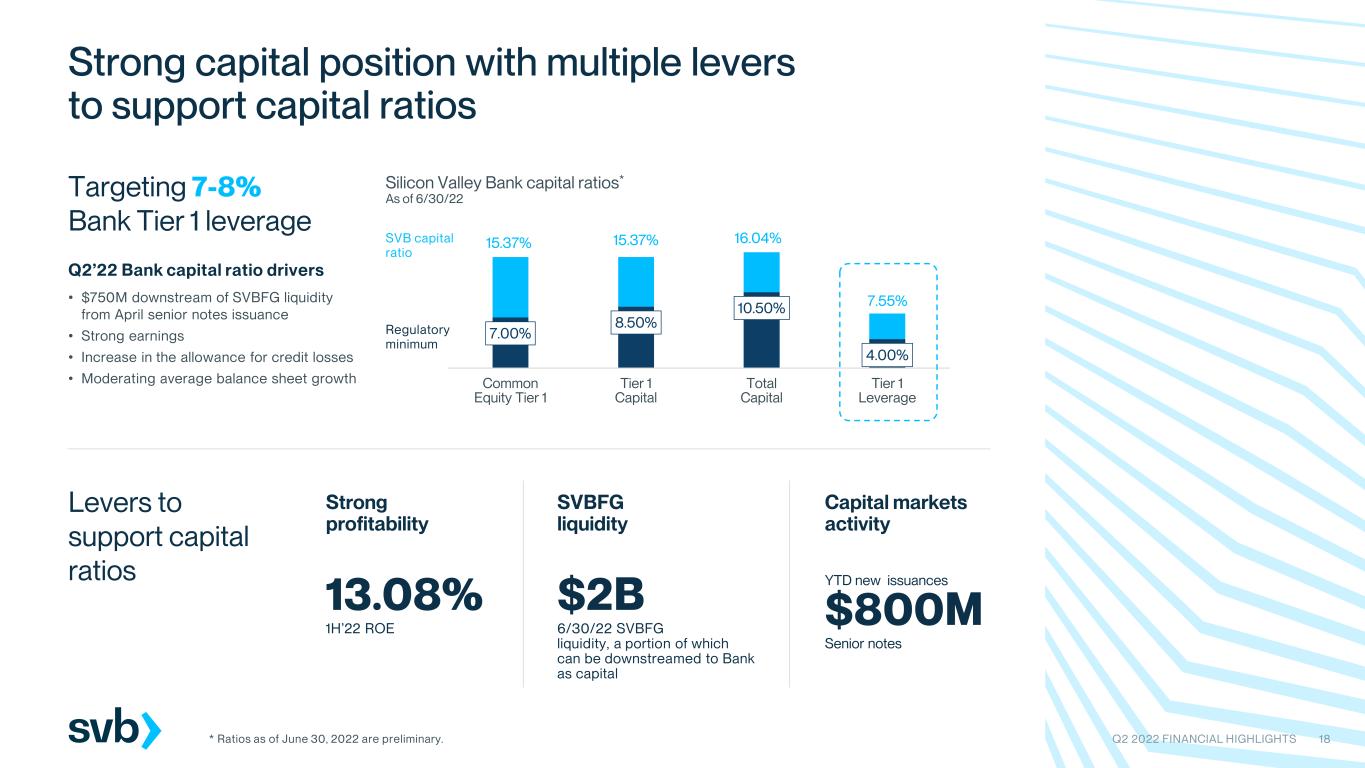
Silicon Valley Bank capital ratios* As of 6/30/22 18 Strong capital position with multiple levers to support capital ratios 7.00% 8.50% 10.50% 4.00% 15.37% 15.37% 16.04% 7.55% Common Equity Tier 1 Tier 1 Capital Total Capital Tier 1 Leverage SVB capital ratio Regulatory minimum Levers to support capital ratios Targeting 7-8% Bank Tier 1 leverage Q2’22 Bank capital ratio drivers • $750M downstream of SVBFG liquidity from April senior notes issuance • Strong earnings • Increase in the allowance for credit losses • Moderating average balance sheet growth * Ratios as of June 30, 2022 are preliminary. 13.08% 1H’22 ROE Strong profitability $2B 6/30/22 SVBFG liquidity, a portion of which can be downstreamed to Bank as capital SVBFG liquidity Capital markets activity YTD new issuances $800M Senior notes Q2 2022 FINANCIAL HIGHLIGHTS

Q2 2022 FINANCIAL HIGHLIGHTS 19 Continue to invest for the long term, but moderating pace of investment Lowering FY’22 expense growth outlook to low 20s % excluding merger-related charges OneSVB collaboration initiative to deliver the full power of the SVB platform to clients nCino credit onboarding platform Agile ways of working Mobile and collaboration tools Client and industry insights Global Delivery Centers Diversity, Equity & Inclusion initiatives Large Financial Institution regulatory requirements* Data foundation Cybersecurity U.K. subsidiarization requirements End-to-end digital banking platform Digital client onboarding Technology platform upgrades APIs and payment enablement Strategic partnerships to accelerate product delivery * Became subject to Category IV requirements in 2021. Category III standards will become applicable at >$250B in average total consolidated assets or >$75B in weighted short-term wholesale funding, nonbank assets or off-balance-sheet exposure. Talent attraction, retention and development SVB Securities expansion SVB Private integration and go-to-market strategy Strategic investments Client acquisition New products and product penetration Fintech strategy Geographic expansion New SVB Capital funds Strategic priorities to drive and support long-term scalable growth Enhance client experience Drive revenue growth Improve employee enablement Enhance risk management

Long-term growth opportunity remains attractive despite near-term challenges Market corrections are normal and necessary, and can help return the innovation economy to a more sustainable long-term growth trajectory The near-term environment will likely be challenging for the innovation sector SVB is stronger and better- positioned than at any time in our history to support our clients and navigate volatile markets This is our time to cement relationships and demonstrate to clients our commitment to partnership as we have in past cycles Our clients and markets are better-positioned today to weather a downturn than in previous cycles and have recovered quickly in the past We remain confident in our strategy: the growth trajectory of the innovation economy will continue to outpace other industries over the long-term Q2 2022 FINANCIAL HIGHLIGHTS 20

Performance detail and outlook drivers Q2 2022 FINANCIAL HIGHLIGHTS 21
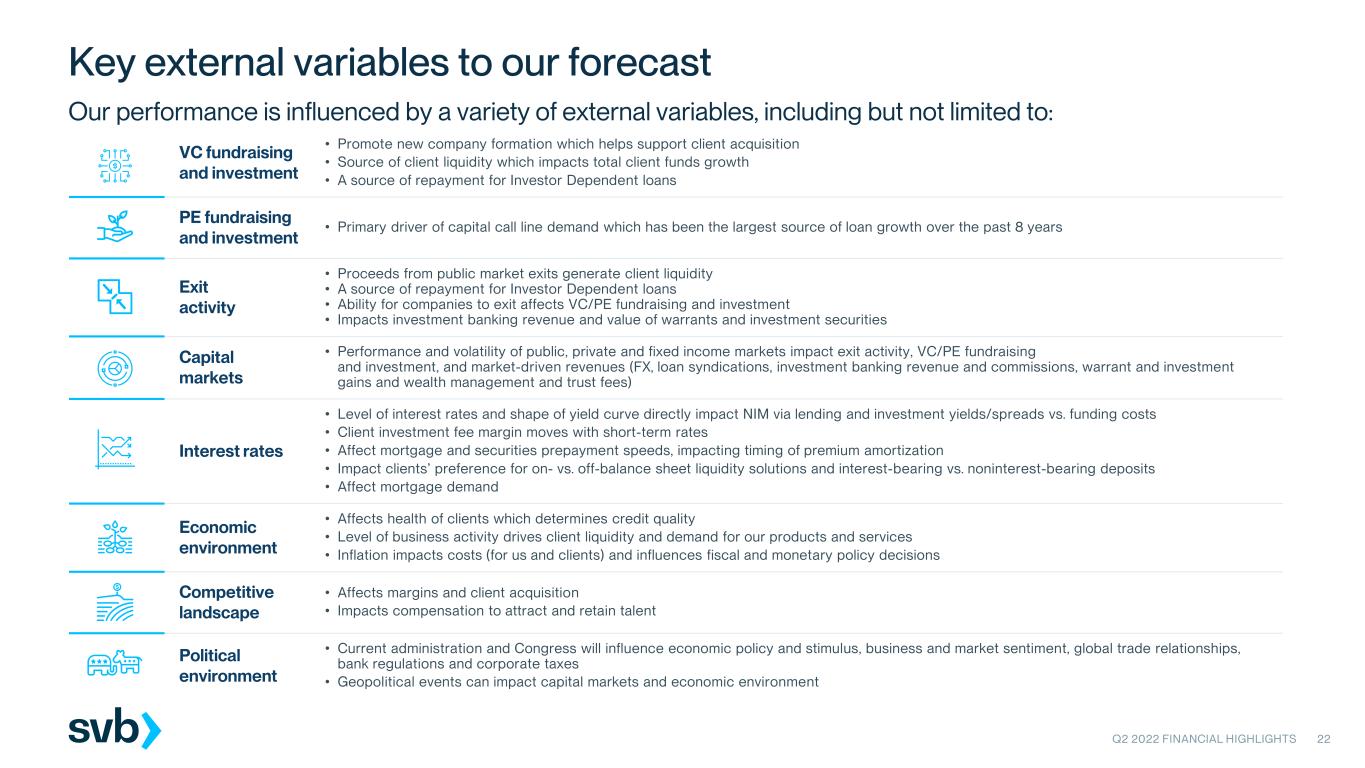
VC fundraising and investment • Promote new company formation which helps support client acquisition • Source of client liquidity which impacts total client funds growth • A source of repayment for Investor Dependent loans PE fundraising and investment • Primary driver of capital call line demand which has been the largest source of loan growth over the past 8 years Exit activity • Proceeds from public market exits generate client liquidity • A source of repayment for Investor Dependent loans • Ability for companies to exit affects VC/PE fundraising and investment • Impacts investment banking revenue and value of warrants and investment securities Capital markets • Performance and volatility of public, private and fixed income markets impact exit activity, VC/PE fundraising and investment, and market-driven revenues (FX, loan syndications, investment banking revenue and commissions, warrant and investment gains and wealth management and trust fees) Interest rates • Level of interest rates and shape of yield curve directly impact NIM via lending and investment yields/spreads vs. funding costs • Client investment fee margin moves with short-term rates • Affect mortgage and securities prepayment speeds, impacting timing of premium amortization • Impact clients’ preference for on- vs. off-balance sheet liquidity solutions and interest-bearing vs. noninterest-bearing deposits • Affect mortgage demand Economic environment • Affects health of clients which determines credit quality • Level of business activity drives client liquidity and demand for our products and services • Inflation impacts costs (for us and clients) and influences fiscal and monetary policy decisions Competitive landscape • Affects margins and client acquisition • Impacts compensation to attract and retain talent Political environment • Current administration and Congress will influence economic policy and stimulus, business and market sentiment, global trade relationships, bank regulations and corporate taxes • Geopolitical events can impact capital markets and economic environment Q2 2022 FINANCIAL HIGHLIGHTS 22 Key external variables to our forecast Our performance is influenced by a variety of external variables, including but not limited to:
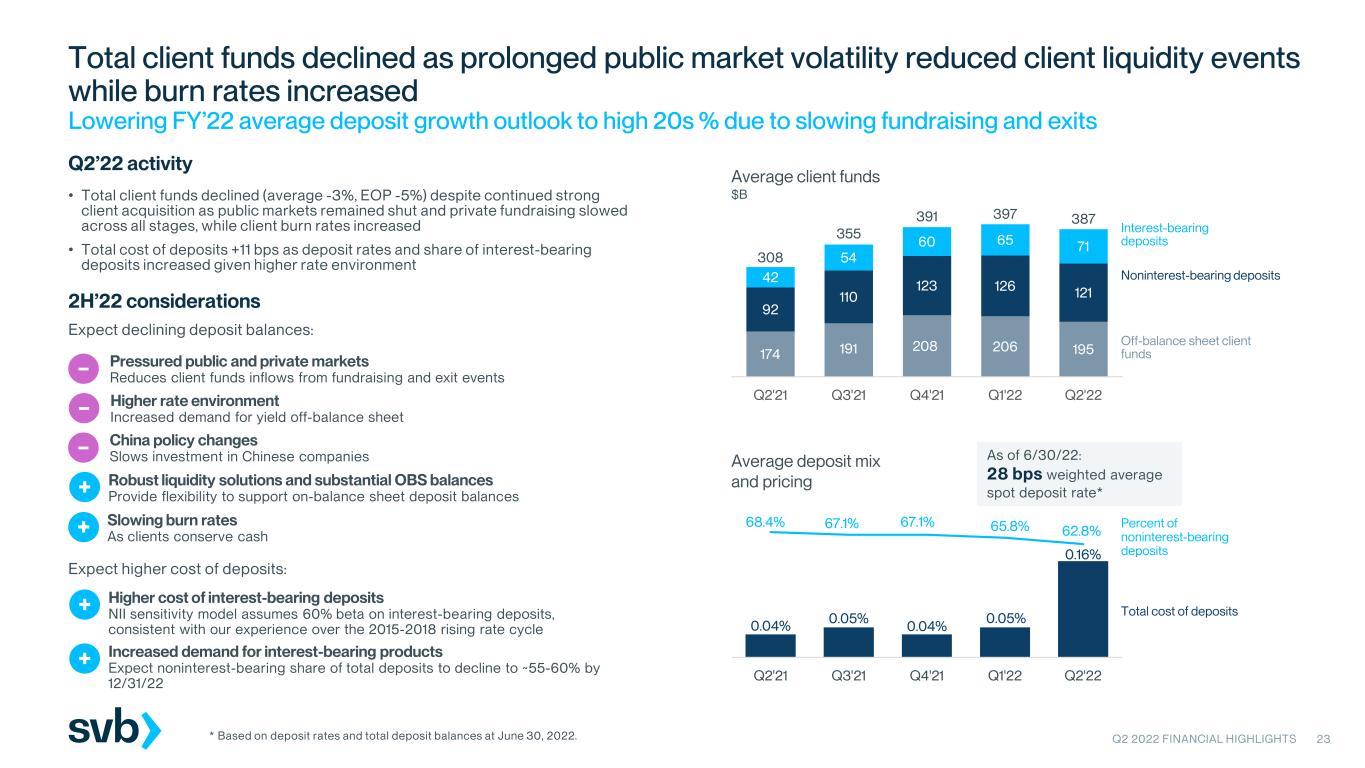
Q2 2022 FINANCIAL HIGHLIGHTS 23 Total client funds declined as prolonged public market volatility reduced client liquidity events while burn rates increased Lowering FY’22 average deposit growth outlook to high 20s % due to slowing fundraising and exits Average client funds $B China policy changes Slows investment in Chinese companies– Expect declining deposit balances: 2H’22 considerations Average deposit mix and pricing 174 191 208 206 195 92 110 123 126 121 42 54 60 65 71 308 355 391 397 387 Q2'21 Q3'21 Q4'21 Q1'22 Q2'22 0.04% 0.05% 0.04% 0.05% 0.16% 68.4% 67.1% 67.1% 65.8% 62.8% 10% 20% 30% 40% 50% 60% 70% 80% 0.00% 0.05% 0.10% 0.15% 0.20% 0.25% Q2'21 Q3'21 Q4'21 Q1'22 Q2'22 Off-balance sheet client funds Noninterest-bearing deposits Interest-bearing deposits Percent of noninterest-bearing deposits Total cost of deposits Robust liquidity solutions and substantial OBS balances Provide flexibility to support on-balance sheet deposit balances+ As of 6/30/22: 28 bps weighted average spot deposit rate* Expect higher cost of deposits: Increased demand for interest-bearing products Expect noninterest-bearing share of total deposits to decline to ~55-60% by 12/31/22 + Higher cost of interest-bearing deposits NII sensitivity model assumes 60% beta on interest-bearing deposits, consistent with our experience over the 2015-2018 rising rate cycle + Higher rate environment Increased demand for yield off-balance sheet– Pressured public and private markets Reduces client funds inflows from fundraising and exit events– Slowing burn rates As clients conserve cash + • Total client funds declined (average -3%, EOP -5%) despite continued strong client acquisition as public markets remained shut and private fundraising slowed across all stages, while client burn rates increased • Total cost of deposits +11 bps as deposit rates and share of interest-bearing deposits increased given higher rate environment Q2’22 activity * Based on deposit rates and total deposit balances at June 30, 2022.
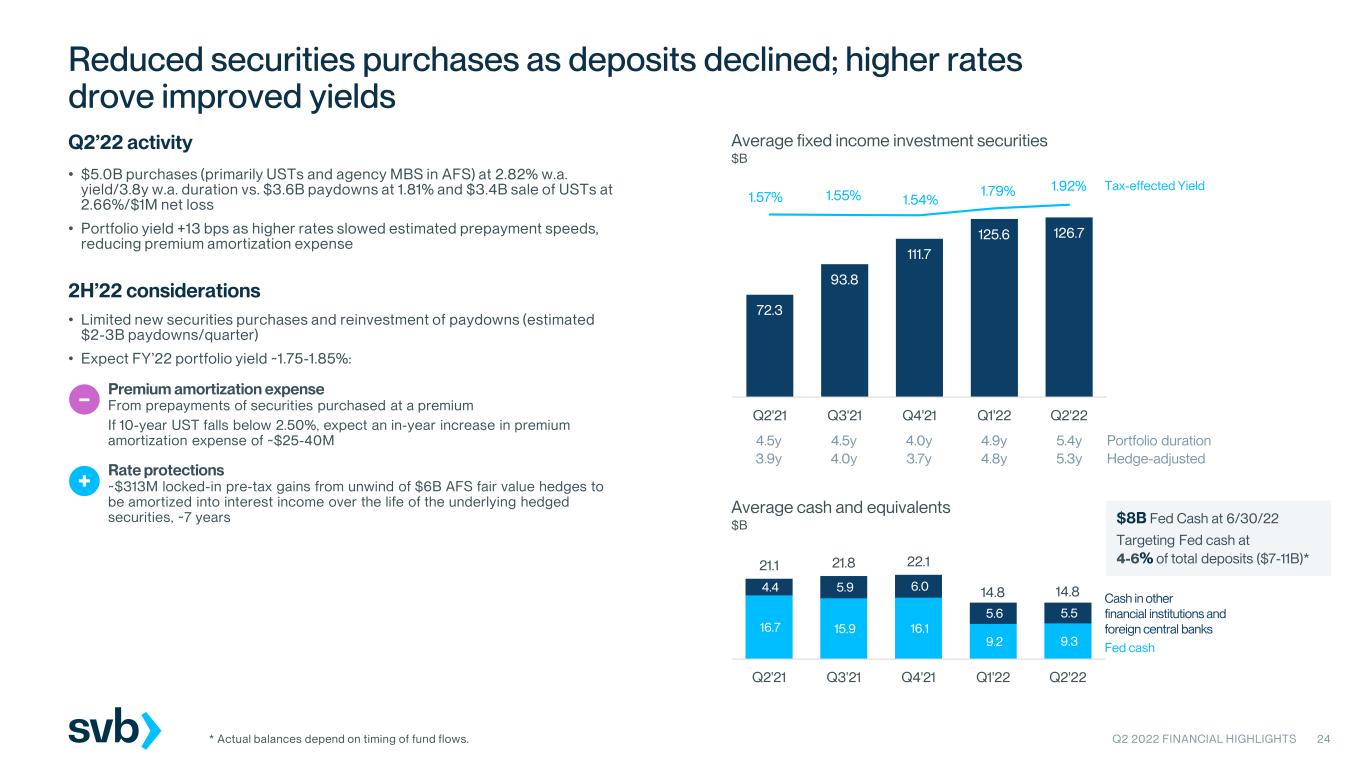
72.3 93.8 111.7 125.6 126.7 1.57% 1.55% 1.54% 1.79% 1.92% 0.0 20.0 40.0 60.0 80.0 100.0 120.0 140.0 Q2'21 Q3'21 Q4'21 Q1'22 Q2'22 16.7 15.9 16.1 9.2 9.3 4.4 5.9 6.0 5.6 5.5 21.1 21.8 22.1 14.8 14.8 Q2'21 Q3'21 Q4'21 Q1'22 Q2'22 Q2 2022 FINANCIAL HIGHLIGHTS 24 Reduced securities purchases as deposits declined; higher rates drove improved yields * Actual balances depend on timing of fund flows. Average fixed income investment securities $B Average cash and equivalents $B Tax-effected Yield • Limited new securities purchases and reinvestment of paydowns (estimated $2-3B paydowns/quarter) • Expect FY’22 portfolio yield ~1.75-1.85%: 2H’22 considerations 4.5y 4.5y 4.0y 4.9y 5.4y Portfolio duration 3.9y 4.0y 3.7y 4.8y 5.3y Hedge-adjusted Fed cash Cash in other financial institutions and foreign central banks $8B Fed Cash at 6/30/22 Targeting Fed cash at 4-6% of total deposits ($7-11B)* Premium amortization expense From prepayments of securities purchased at a premium If 10-year UST falls below 2.50%, expect an in-year increase in premium amortization expense of ~$25-40M – • $5.0B purchases (primarily USTs and agency MBS in AFS) at 2.82% w.a. yield/3.8y w.a. duration vs. $3.6B paydowns at 1.81% and $3.4B sale of USTs at 2.66%/$1M net loss • Portfolio yield +13 bps as higher rates slowed estimated prepayment speeds, reducing premium amortization expense Q2’22 activity Rate protections ~$313M locked-in pre-tax gains from unwind of $6B AFS fair value hedges to be amortized into interest income over the life of the underlying hedged securities, ~7 years +
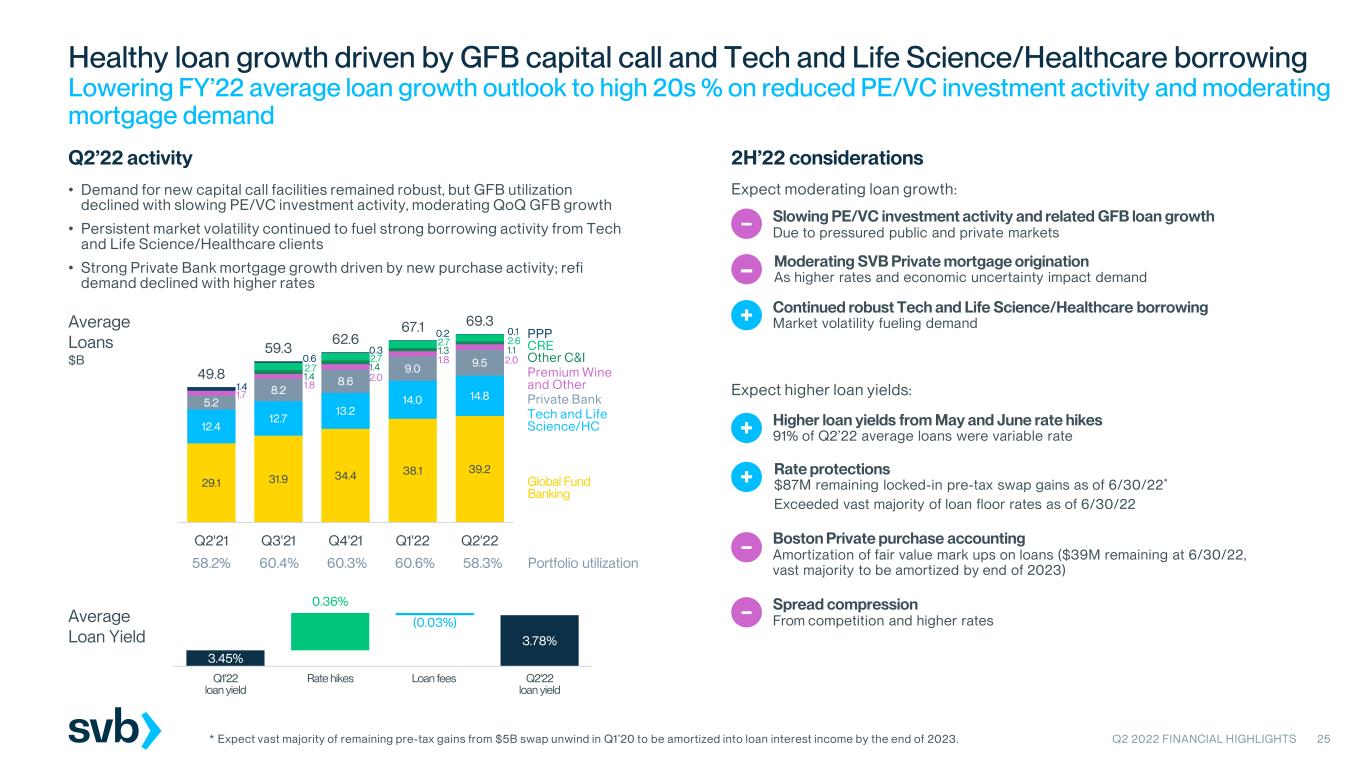
Q2 2022 FINANCIAL HIGHLIGHTS 25 Healthy loan growth driven by GFB capital call and Tech and Life Science/Healthcare borrowing Lowering FY’22 average loan growth outlook to high 20s % on reduced PE/VC investment activity and moderating mortgage demand Average Loans $B Expect moderating loan growth: Boston Private purchase accounting Amortization of fair value mark ups on loans ($39M remaining at 6/30/22, vast majority to be amortized by end of 2023) – Moderating SVB Private mortgage origination As higher rates and economic uncertainty impact demand– Continued robust Tech and Life Science/Healthcare borrowing Market volatility fueling demand+ 2H’22 considerations 3.45% 3.78% (0.03%) 0.36% Q1'22 loan yield Rate hikes Loan fees Q2'22 loan yield Global Fund Banking Private Bank PPP Premium Wine and Other Tech and Life Science/HC Average Loan Yield CRE Other C&I Expect higher loan yields: Spread compression From competition and higher rates– Rate protections $87M remaining locked-in pre-tax swap gains as of 6/30/22* Exceeded vast majority of loan floor rates as of 6/30/22 + * Expect vast majority of remaining pre-tax gains from $5B swap unwind in Q1’20 to be amortized into loan interest income by the end of 2023. 58.2% 60.4% 60.3% 60.6% 58.3% Portfolio utilization Higher loan yields from May and June rate hikes 91% of Q2’22 average loans were variable rate+ Slowing PE/VC investment activity and related GFB loan growth Due to pressured public and private markets– 29.1 31.9 34.4 38.1 39.2 12.4 12.7 13.2 14.0 14.8 5.2 8.2 8.6 9.0 9.5 1.7 1.8 2.0 1.8 2.0 1.4 1.4 1.3 1.1 2.7 2.7 2.7 2.6 1.4 0.6 0.3 0.2 0.1 49.8 59.3 62.6 67.1 69.3 Q2'21 Q3'21 Q4'21 Q1'22 Q2'22 • Demand for new capital call facilities remained robust, but GFB utilization declined with slowing PE/VC investment activity, moderating QoQ GFB growth • Persistent market volatility continued to fuel strong borrowing activity from Tech and Life Science/Healthcare clients • Strong Private Bank mortgage growth driven by new purchase activity; refi demand declined with higher rates Q2’22 activity
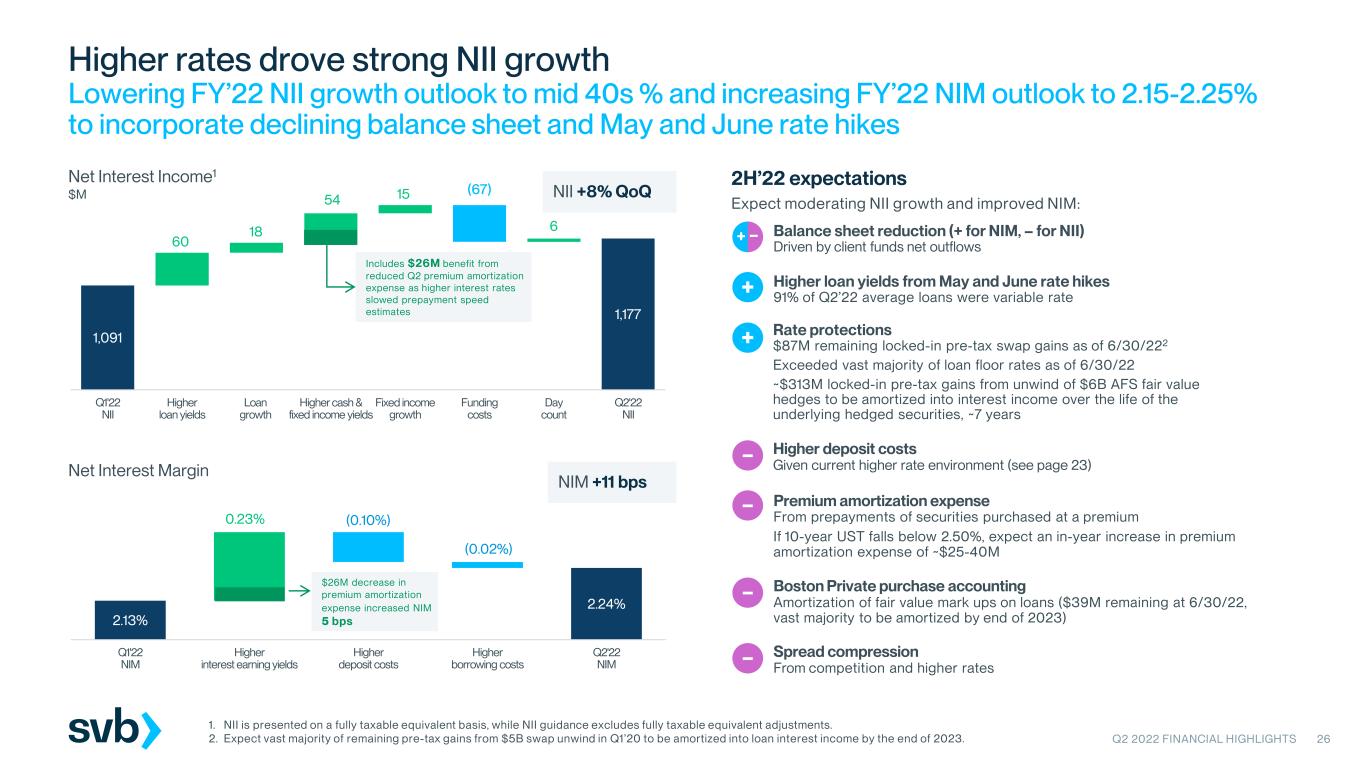
1,091 1,177 (67) 60 18 54 15 6 Q1'22 NII Higher loan yields Loan growth Higher cash & fixed income yields Fixed income growth Funding costs Day count Q2'22 NII Q2 2022 FINANCIAL HIGHLIGHTS 26 Higher rates drove strong NII growth Lowering FY’22 NII growth outlook to mid 40s % and increasing FY’22 NIM outlook to 2.15-2.25% to incorporate declining balance sheet and May and June rate hikes 2H’22 expectationsNet Interest Income1 $M NII +8% QoQ Net Interest Margin 2.13% 2.24% (0.10%) (0.02%) 0.23% Q1'22 NIM Higher interest earning yields Higher deposit costs Higher borrowing costs Q2'22 NIM 1. NII is presented on a fully taxable equivalent basis, while NII guidance excludes fully taxable equivalent adjustments. 2. Expect vast majority of remaining pre-tax gains from $5B swap unwind in Q1’20 to be amortized into loan interest income by the end of 2023. Spread compression From competition and higher rates – Higher loan yields from May and June rate hikes 91% of Q2’22 average loans were variable rate+ Boston Private purchase accounting Amortization of fair value mark ups on loans ($39M remaining at 6/30/22, vast majority to be amortized by end of 2023) – Higher deposit costs Given current higher rate environment (see page 23) – NIM +11 bps Includes $26M benefit from reduced Q2 premium amortization expense as higher interest rates slowed prepayment speed estimates Premium amortization expense From prepayments of securities purchased at a premium If 10-year UST falls below 2.50%, expect an in-year increase in premium amortization expense of ~$25-40M – $26M decrease in premium amortization expense increased NIM 5 bps Expect moderating NII growth and improved NIM: + – Balance sheet reduction (+ for NIM, – for NII) Driven by client funds net outflows Rate protections $87M remaining locked-in pre-tax swap gains as of 6/30/222 Exceeded vast majority of loan floor rates as of 6/30/22 ~$313M locked-in pre-tax gains from unwind of $6B AFS fair value hedges to be amortized into interest income over the life of the underlying hedged securities, ~7 years +
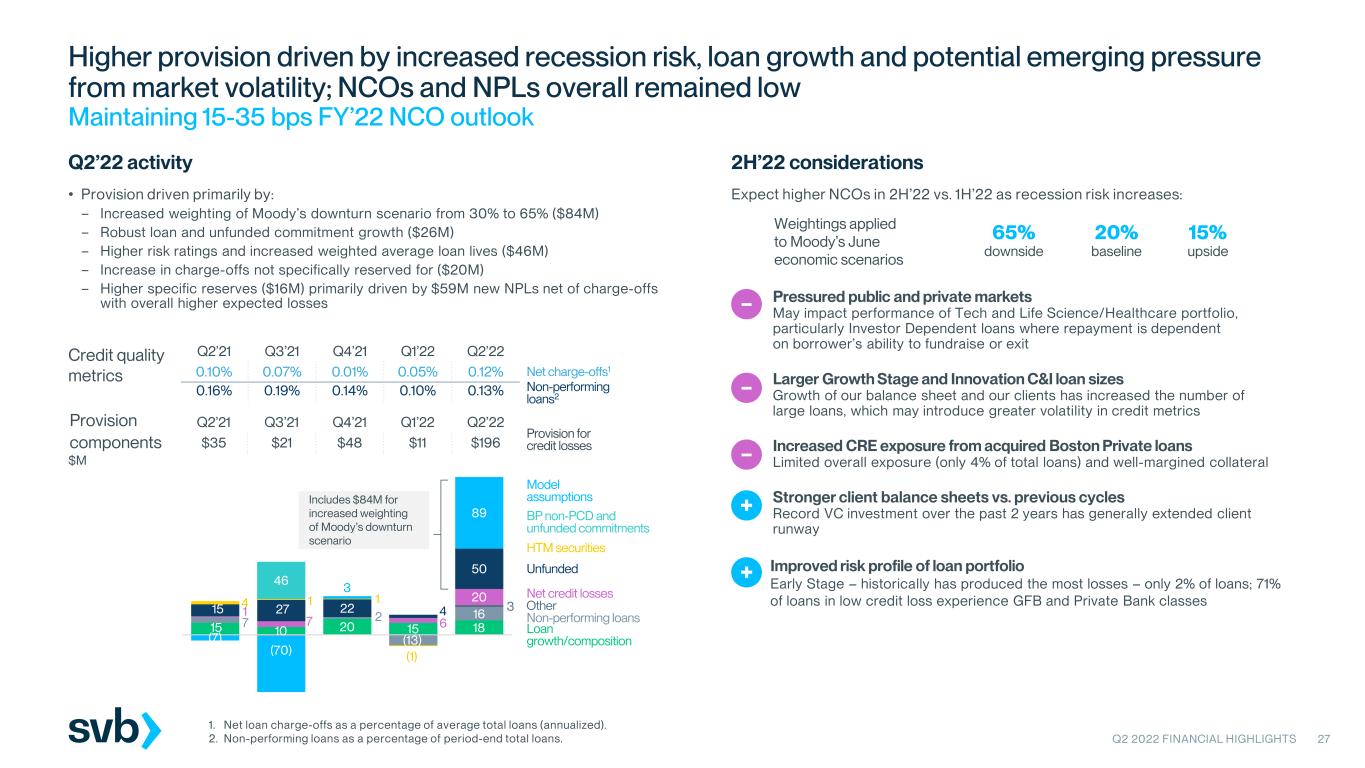
Q2 2022 FINANCIAL HIGHLIGHTS 27 Higher provision driven by increased recession risk, loan growth and potential emerging pressure from market volatility; NCOs and NPLs overall remained low Maintaining 15-35 bps FY’22 NCO outlook Credit quality metrics Provision components $M Q2’21 Q3’21 Q4’21 Q1’22 Q2’22 0.10% 0.07% 0.01% 0.05% 0.12% 0.16% 0.19% 0.14% 0.10% 0.13% Non-performing loans2 Net charge-offs1 15 10 20 15 18 7 2 (13) 16 3 1 7 6 20 15 27 22 4 50 4 1 1 (1) 46 (7) (70) 3 89 Q2'21 Q3'21 Q4'21 Q1'22 Q2'22 Non-performing loans Loan growth/composition Model assumptions Unfunded Net credit losses HTM securities BP non-PCD and unfunded commitments Q2’21 Q3’21 Q4’21 Q1’22 Q2’22 $35 $21 $48 $11 $196 Provision for credit losses 1 Expect higher NCOs in 2H’22 vs. 1H’22 as recession risk increases: 20% baseline 65% downside 15% upside Weightings applied to Moody’s June economic scenarios 2H’22 considerationsQ2’22 activity Other Includes $84M for increased weighting of Moody’s downturn scenario 1. Net loan charge-offs as a percentage of average total loans (annualized). 2. Non-performing loans as a percentage of period-end total loans. • Provision driven primarily by: – Increased weighting of Moody’s downturn scenario from 30% to 65% ($84M) – Robust loan and unfunded commitment growth ($26M) – Higher risk ratings and increased weighted average loan lives ($46M) – Increase in charge-offs not specifically reserved for ($20M) – Higher specific reserves ($16M) primarily driven by $59M new NPLs net of charge-offs with overall higher expected losses Stronger client balance sheets vs. previous cycles Record VC investment over the past 2 years has generally extended client runway + Larger Growth Stage and Innovation C&I loan sizes Growth of our balance sheet and our clients has increased the number of large loans, which may introduce greater volatility in credit metrics – Improved risk profile of loan portfolio Early Stage – historically has produced the most losses – only 2% of loans; 71% of loans in low credit loss experience GFB and Private Bank classes + Increased CRE exposure from acquired Boston Private loans Limited overall exposure (only 4% of total loans) and well-margined collateral– Pressured public and private markets May impact performance of Tech and Life Science/Healthcare portfolio, particularly Investor Dependent loans where repayment is dependent on borrower’s ability to fundraise or exit –
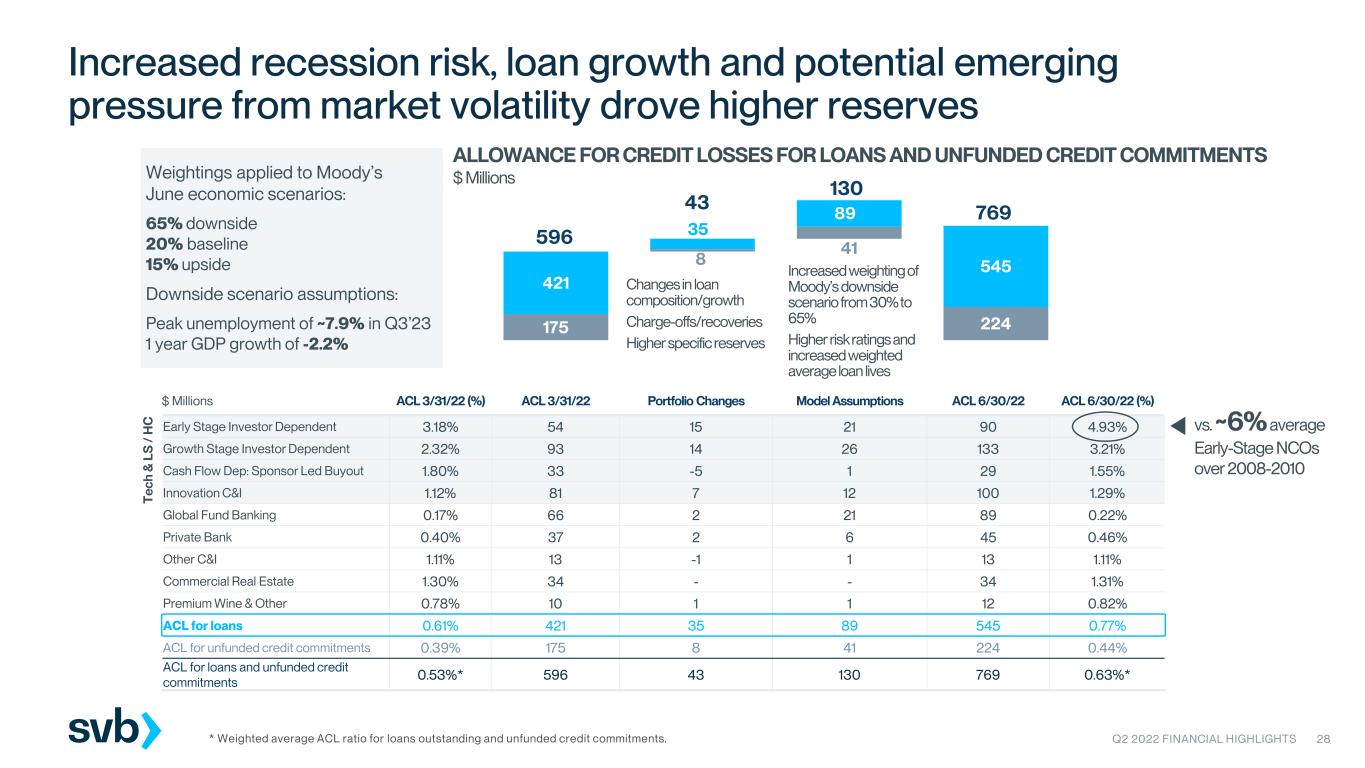
175 224 421 5458 41596 35 89 769 Changes in loan composition/growth Charge-offs/recoveries Higher specific reserves Increased weighting of Moody’s downside scenario from 30% to 65% Higher risk ratings and increased weighted average loan lives 130 43 ALLOWANCE FOR CREDIT LOSSES FOR LOANS AND UNFUNDED CREDIT COMMITMENTS $ Millions Q2 2022 FINANCIAL HIGHLIGHTS 28 Increased recession risk, loan growth and potential emerging pressure from market volatility drove higher reserves T ec h & L S / H C $ Millions ACL 3/31/22 (%) ACL 3/31/22 Portfolio Changes Model Assumptions ACL 6/30/22 ACL 6/30/22 (%) Early Stage Investor Dependent 3.18% 54 15 21 90 4.93% Growth Stage Investor Dependent 2.32% 93 14 26 133 3.21% Cash Flow Dep: Sponsor Led Buyout 1.80% 33 -5 1 29 1.55% Innovation C&I 1.12% 81 7 12 100 1.29% Global Fund Banking 0.17% 66 2 21 89 0.22% Private Bank 0.40% 37 2 6 45 0.46% Other C&I 1.11% 13 -1 1 13 1.11% Commercial Real Estate 1.30% 34 - - 34 1.31% Premium Wine & Other 0.78% 10 1 1 12 0.82% ACL for loans 0.61% 421 35 89 545 0.77% ACL for unfunded credit commitments 0.39% 175 8 41 224 0.44% ACL for loans and unfunded credit commitments 0.53%* 596 43 130 769 0.63%* vs. ~6%average Early-Stage NCOs over 2008-2010 * Weighted average ACL ratio for loans outstanding and unfunded credit commitments. Weightings applied to Moody’s June economic scenarios: 65% downside 20% baseline 15% upside Downside scenario assumptions: Peak unemployment of ~7.9% in Q3’23 1 year GDP growth of -2.2%
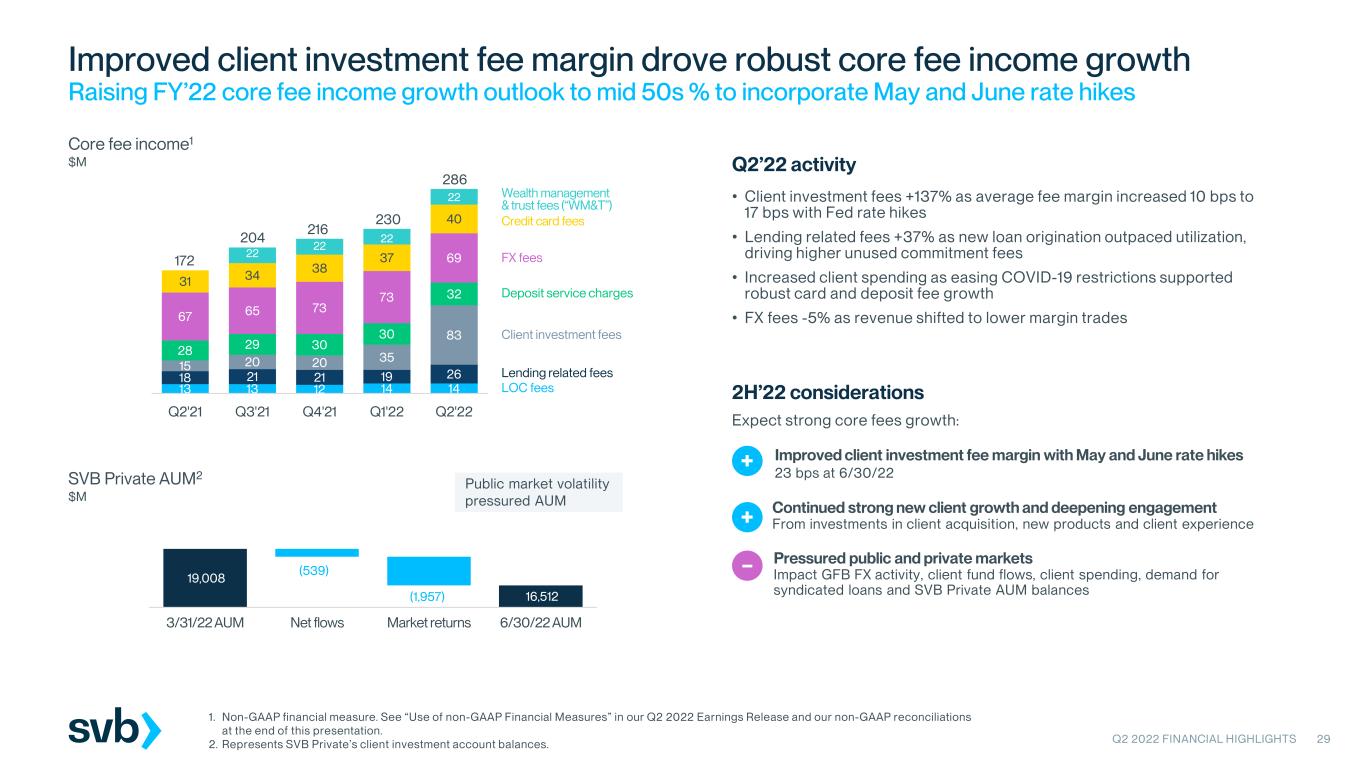
13 13 12 14 14 18 21 21 19 26 15 20 20 35 83 28 29 30 30 32 67 65 73 73 69 31 34 38 37 40 22 22 22 22 0 0 0 0 0 0 Q2'21 Q3'21 Q4'21 Q1'22 Q2'22 Q2 2022 FINANCIAL HIGHLIGHTS 29 Improved client investment fee margin drove robust core fee income growth Raising FY’22 core fee income growth outlook to mid 50s % to incorporate May and June rate hikes Core fee income1 $M • Client investment fees +137% as average fee margin increased 10 bps to 17 bps with Fed rate hikes • Lending related fees +37% as new loan origination outpaced utilization, driving higher unused commitment fees • Increased client spending as easing COVID-19 restrictions supported robust card and deposit fee growth • FX fees -5% as revenue shifted to lower margin trades Continued strong new client growth and deepening engagement From investments in client acquisition, new products and client experience+ Improved client investment fee margin with May and June rate hikes 23 bps at 6/30/22 + Lending related fees Deposit service charges Credit card fees LOC fees FX fees Wealth management & trust fees (“WM&T”) Q2’22 activity 2H’22 considerations 1. Non-GAAP financial measure. See “Use of non-GAAP Financial Measures” in our Q2 2022 Earnings Release and our non-GAAP reconciliations at the end of this presentation. 2. Represents SVB Private’s client investment account balances. Client investment fees SVB Private AUM2 $M 19,008 16,512 (539) (1,957) 3/31/22 AUM Net flows Market returns 6/30/22 AUM Pressured public and private markets Impact GFB FX activity, client fund flows, client spending, demand for syndicated loans and SVB Private AUM balances – Public market volatility pressured AUM 172 204 216 230 286 Expect strong core fees growth:
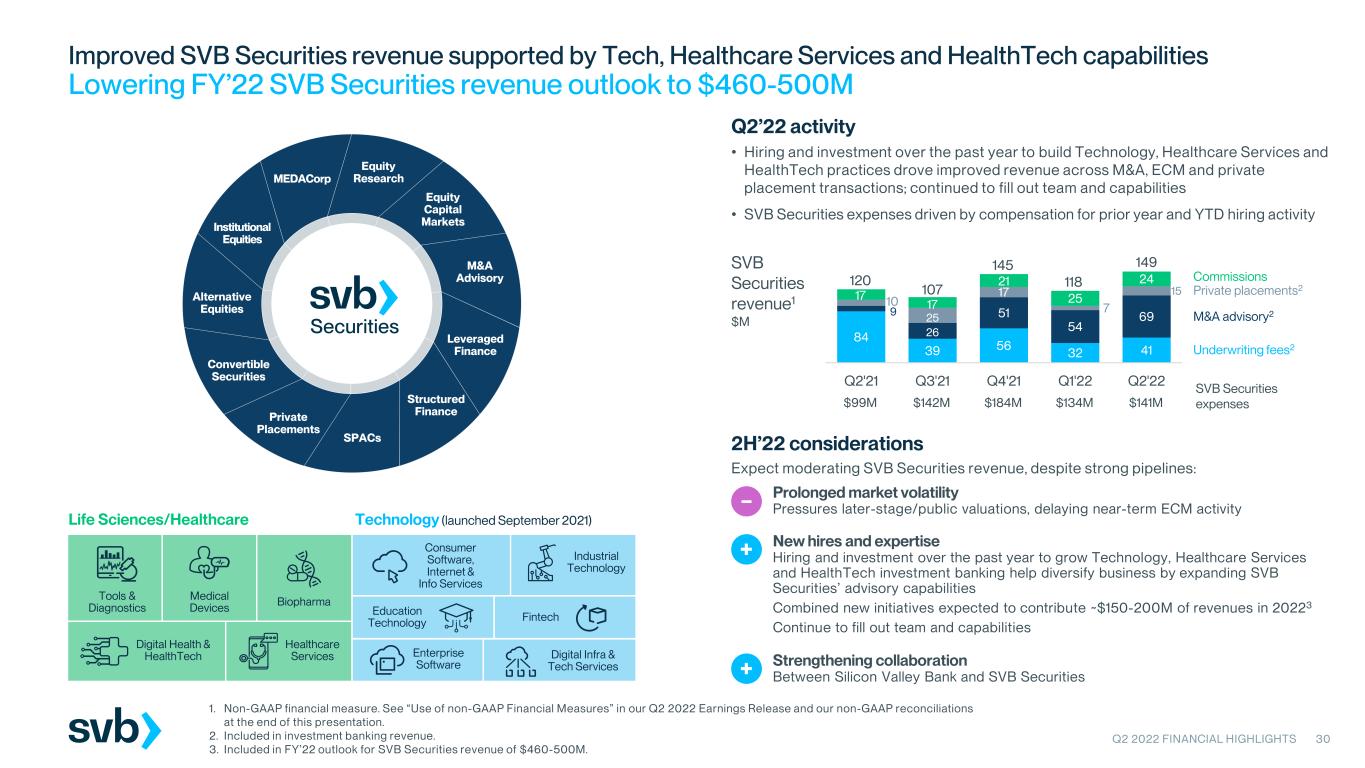
SVB Securities expenses • Hiring and investment over the past year to build Technology, Healthcare Services and HealthTech practices drove improved revenue across M&A, ECM and private placement transactions; continued to fill out team and capabilities • SVB Securities expenses driven by compensation for prior year and YTD hiring activity Q2 2022 FINANCIAL HIGHLIGHTS 30 Improved SVB Securities revenue supported by Tech, Healthcare Services and HealthTech capabilities Lowering FY’22 SVB Securities revenue outlook to $460-500M 1. Non-GAAP financial measure. See “Use of non-GAAP Financial Measures” in our Q2 2022 Earnings Release and our non-GAAP reconciliations at the end of this presentation. 2. Included in investment banking revenue. 3. Included in FY’22 outlook for SVB Securities revenue of $460-500M. New hires and expertise Hiring and investment over the past year to grow Technology, Healthcare Services and HealthTech investment banking help diversify business by expanding SVB Securities’ advisory capabilities Combined new initiatives expected to contribute ~$150-200M of revenues in 20223 Continue to fill out team and capabilities + 2H’22 considerations Q2’22 activity SVB Securities revenue1 $M Equity Capital Markets Convertible Securities Alternative Equities Institutional Equities MEDACorp M&A Advisory Equity Research Leveraged Finance Structured Finance SPACs Private Placements Technology (launched September 2021)Life Sciences/Healthcare Tools & Diagnostics Medical Devices Biopharma Healthcare Services Digital Health & HealthTech Education Technology Industrial Technology Enterprise Software Digital Infra & Tech Services Fintech Consumer Software, Internet & Info Services Prolonged market volatility Pressures later-stage/public valuations, delaying near-term ECM activity– Strengthening collaboration Between Silicon Valley Bank and SVB Securities+ Underwriting fees2 M&A advisory2 Commissions Private placements2 Expect moderating SVB Securities revenue, despite strong pipelines: 84 39 56 32 41 9 26 51 54 69 10 25 17 7 1517 17 21 25 24120 107 145 118 149 Q2'21 Q3'21 Q4'21 Q1'22 Q2'22 $99M $142M $184M $134M $141M
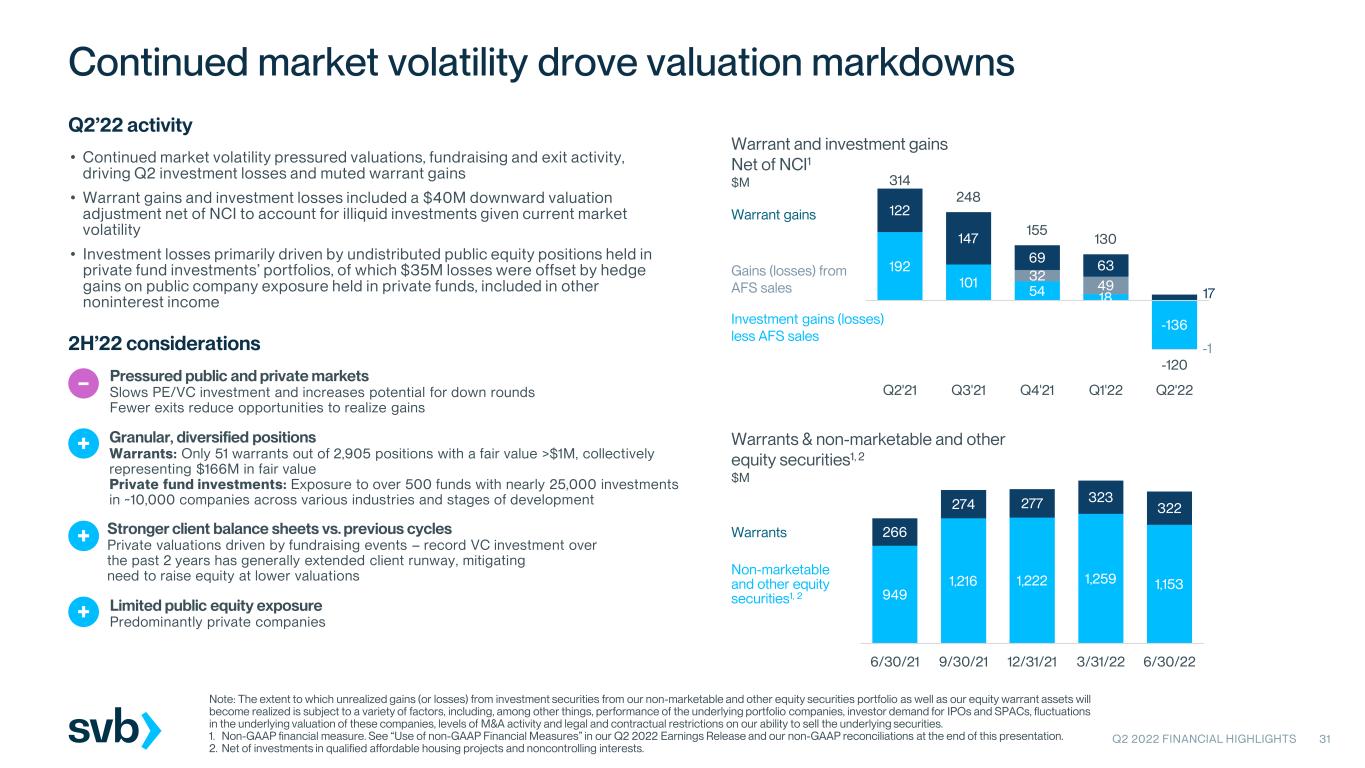
192 101 54 18 -136 32 49 -1 122 147 69 63 17 314 248 155 130 -120 Q2'21 Q3'21 Q4'21 Q1'22 Q2'22 Q2 2022 FINANCIAL HIGHLIGHTS 31 Continued market volatility drove valuation markdowns Note: The extent to which unrealized gains (or losses) from investment securities from our non-marketable and other equity securities portfolio as well as our equity warrant assets will become realized is subject to a variety of factors, including, among other things, performance of the underlying portfolio companies, investor demand for IPOs and SPACs, fluctuations in the underlying valuation of these companies, levels of M&A activity and legal and contractual restrictions on our ability to sell the underlying securities. 1. Non-GAAP financial measure. See “Use of non-GAAP Financial Measures” in our Q2 2022 Earnings Release and our non-GAAP reconciliations at the end of this presentation. 2. Net of investments in qualified affordable housing projects and noncontrolling interests. Warrant and investment gains Net of NCI1 $M • Continued market volatility pressured valuations, fundraising and exit activity, driving Q2 investment losses and muted warrant gains • Warrant gains and investment losses included a $40M downward valuation adjustment net of NCI to account for illiquid investments given current market volatility • Investment losses primarily driven by undistributed public equity positions held in private fund investments’ portfolios, of which $35M losses were offset by hedge gains on public company exposure held in private funds, included in other noninterest income 2H’22 considerations Warrants & non-marketable and other equity securities1, 2 $M Warrant gains Investment gains (losses) less AFS sales Warrants Non-marketable and other equity securities1, 2 Pressured public and private markets Slows PE/VC investment and increases potential for down rounds Fewer exits reduce opportunities to realize gains – Stronger client balance sheets vs. previous cycles Private valuations driven by fundraising events – record VC investment over the past 2 years has generally extended client runway, mitigating need to raise equity at lower valuations + Limited public equity exposure Predominantly private companies+ Granular, diversified positions Warrants: Only 51 warrants out of 2,905 positions with a fair value >$1M, collectively representing $166M in fair value Private fund investments: Exposure to over 500 funds with nearly 25,000 investments in ~10,000 companies across various industries and stages of development + Gains (losses) from AFS sales 949 1,216 1,222 1,259 1,153 266 274 277 323 322 6/30/21 9/30/21 12/31/21 3/31/22 6/30/22 Q2’22 activity
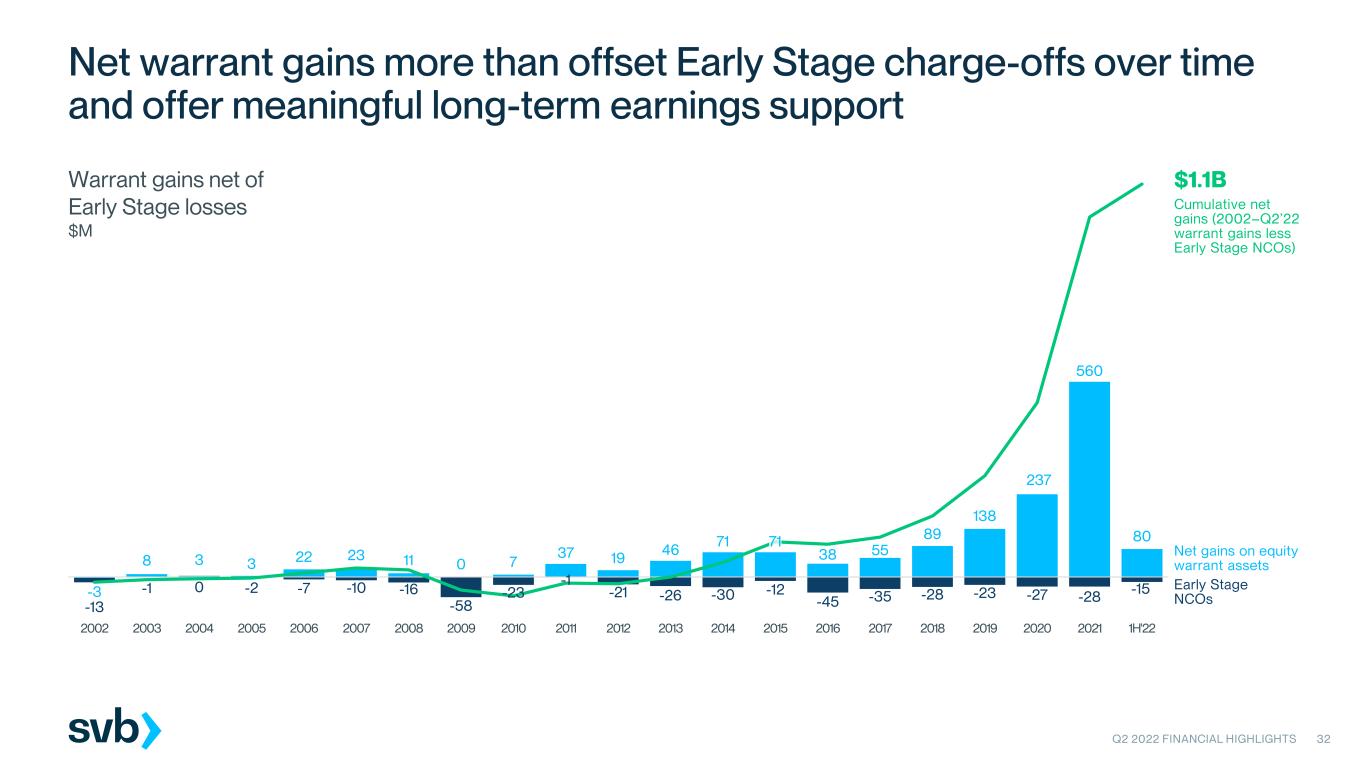
-3 8 3 3 22 23 11 0 7 37 19 46 71 71 38 55 89 138 237 560 80 -13 -1 0 -2 -7 -10 -16 -58 -23 -1 -21 -26 -30 -12 -45 -35 -28 -23 -27 -28 -15 2002 2003 2004 2005 2006 2007 2008 2009 2010 2011 2012 2013 2014 2015 2016 2017 2018 2019 2020 2021 1H'22 Q2 2022 FINANCIAL HIGHLIGHTS 32 Net warrant gains more than offset Early Stage charge-offs over time and offer meaningful long-term earnings support Net gains on equity warrant assets Cumulative net gains (2002–Q2’22 warrant gains less Early Stage NCOs) Early Stage NCOs $1.1BWarrant gains net of Early Stage losses $M

Core expense growth SVB Private SVB Securities Employee enablement & risk management Client experience & revenue growth initiatives FY’22 expenses FY’21 expenses Continued hiring & FY impact of 2021 hires FY impact of Boston Private expenses PBWM strategy High single digits % Mid single digits % High single digits % In line with historical core expense growth Q2 2022 FINANCIAL HIGHLIGHTS 33 Lower expenses as reduced revenue outlook decreased incentive compensation Lowering FY’22 noninterest expense growth outlook to low 20s % (excluding merger-related charges) due to market conditions * Excludes pre-tax merger-related charges ($32M incurred in 1H’22 and estimated $5-10M in 2H’22). Continue to invest in long-term strategic priorities, but moderating pace of investment due to market conditions 2H’22 considerations Noninterest expenses $M 425 548 597 584 502 97 104 110 106 132 37 54 54 58 60 3 6 11 14 27 17 25 23 23 26 19 83 27 16 16 55 59 80 72 85 653 879 902 873 848 43.9% 57.7% 60.1% 54.6% 55.5% 0 100 200 300 400 500 600 700 800 900 1000 Q2'21 Q3'21 Q4'21 Q1'22 Q2'22 4,808 6,024 6,431 6,975 7,528 Average FTEs GAAP efficiency ratio Other Occupancy BD&T Premises and equipment Professional services Compensation and benefits Merger-related charges Expected FY’22 noninterest expense growth Excludes merger-related charges* See page 19 for strategic priorities

Appendix Q2 2022 FINANCIAL HIGHLIGHTS 34
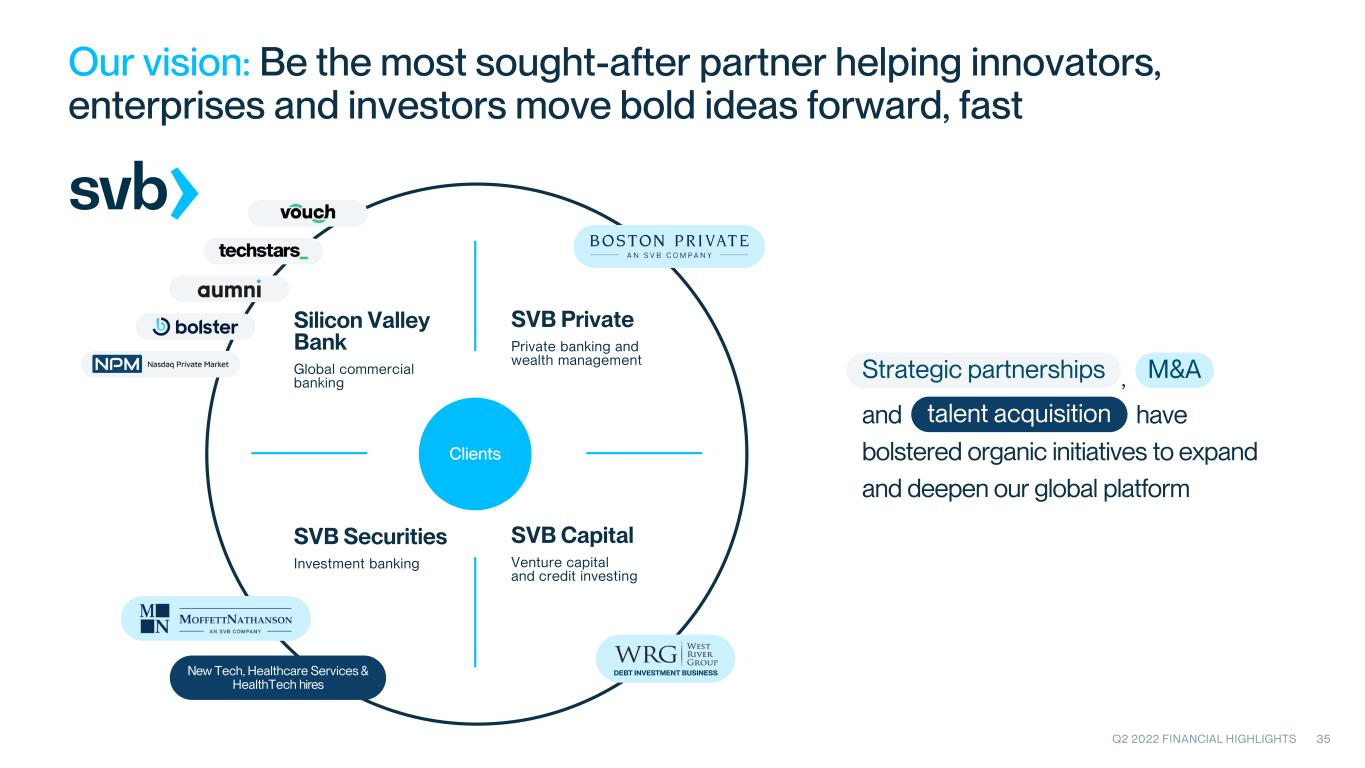
Clients Silicon Valley Bank Global commercial banking Q2 2022 FINANCIAL HIGHLIGHTS 35 Our vision: Be the most sought-after partner helping innovators, enterprises and investors move bold ideas forward, fast New Tech, Healthcare Services & HealthTech hires , and have bolstered organic initiatives to expand and deepen our global platform M&AStrategic partnerships talent acquisition SVB Securities Investment banking SVB Private Private banking and wealth management SVB Capital Venture capital and credit investing
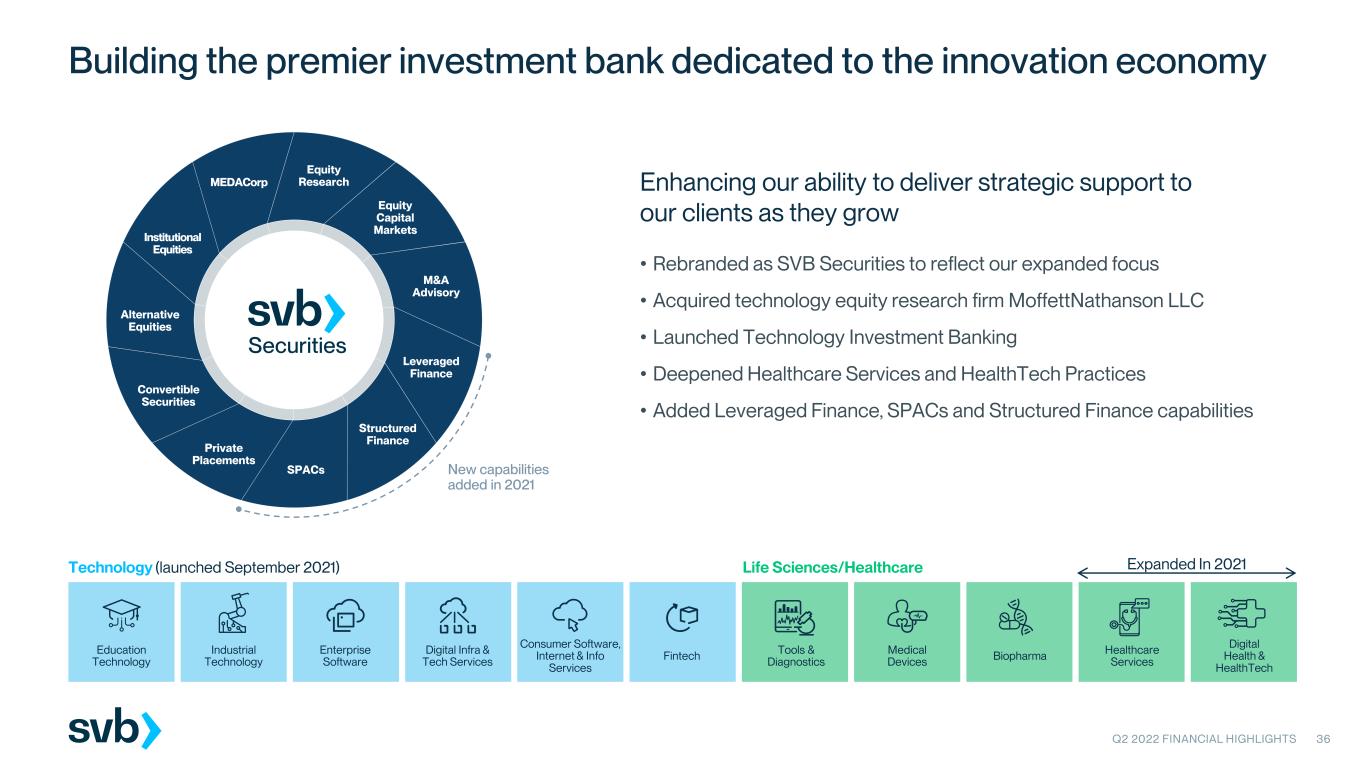
Equity Capital Markets Convertible Securities Alternative Equities Institutional Equities MEDACorp M&A Advisory Equity Research Leveraged Finance Structured Finance SPACs Private Placements New capabilities added in 2021 Q2 2022 FINANCIAL HIGHLIGHTS 36 Building the premier investment bank dedicated to the innovation economy • Rebranded as SVB Securities to reflect our expanded focus • Acquired technology equity research firm MoffettNathanson LLC • Launched Technology Investment Banking • Deepened Healthcare Services and HealthTech Practices • Added Leveraged Finance, SPACs and Structured Finance capabilities Life Sciences/Healthcare Expanded In 2021Technology (launched September 2021) Education Technology Industrial Technology Enterprise Software Digital Infra & Tech Services Consumer Software, Internet & Info Services Fintech Tools & Diagnostics Medical Devices Biopharma Healthcare Services Digital Health & HealthTech Enhancing our ability to deliver strategic support to our clients as they grow
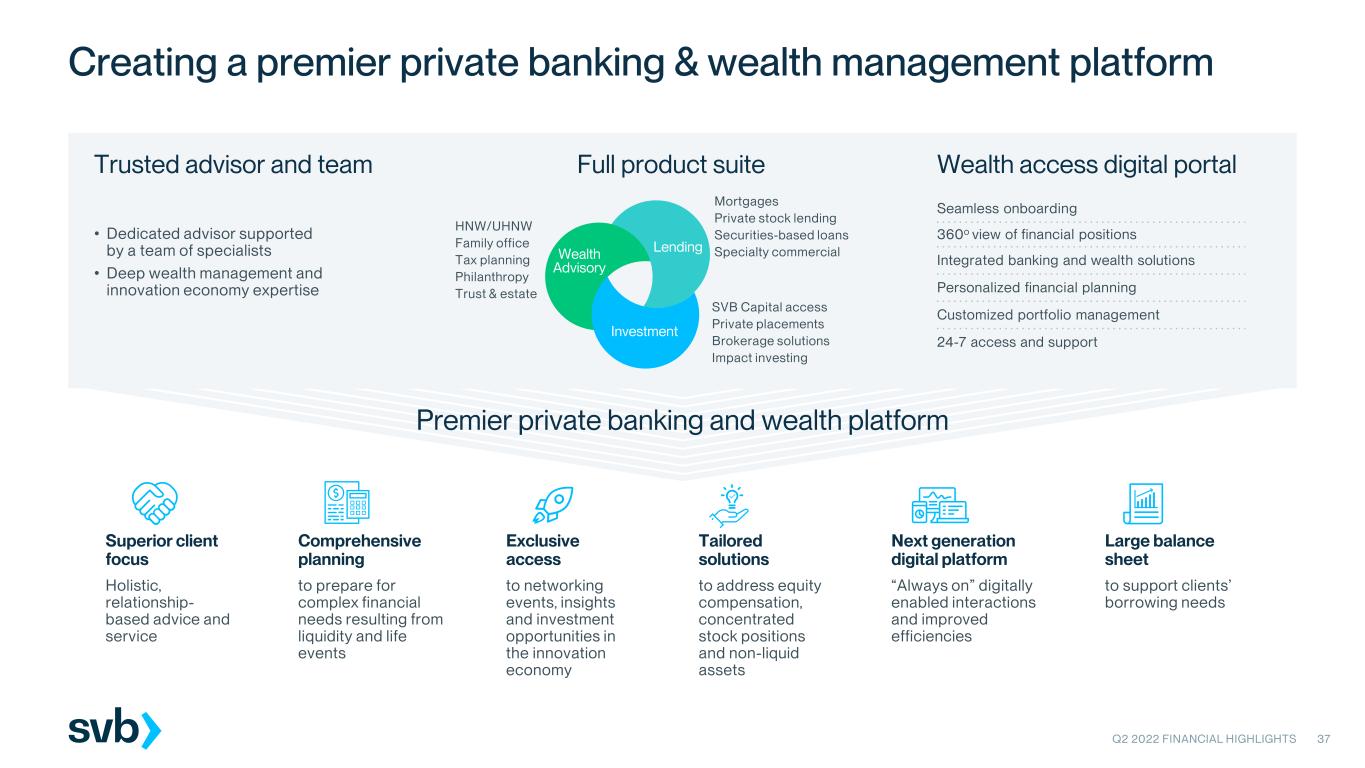
Wealth access digital portal Superior client focus Holistic, relationship- based advice and service Comprehensive planning to prepare for complex financial needs resulting from liquidity and life events Exclusive access to networking events, insights and investment opportunities in the innovation economy Tailored solutions to address equity compensation, concentrated stock positions and non-liquid assets Next generation digital platform “Always on” digitally enabled interactions and improved efficiencies Large balance sheet to support clients’ borrowing needs Wealth Advisory Investment Lending Q2 2022 FINANCIAL HIGHLIGHTS 37 Creating a premier private banking & wealth management platform • Dedicated advisor supported by a team of specialists • Deep wealth management and innovation economy expertise Seamless onboarding 360o view of financial positions Integrated banking and wealth solutions Personalized financial planning Customized portfolio management 24-7 access and support Mortgages Private stock lending Securities-based loans Specialty commercial SVB Capital access Private placements Brokerage solutions Impact investing HNW/UHNW Family office Tax planning Philanthropy Trust & estate Premier private banking and wealth platform Trusted advisor and team Full product suite

Centralized marketplace for trading private company stock Commercial Banking: Enable clients to manage secondary offerings with leading technology platform and global distribution network SVB Private, SVB Capital & SVB Securities: Provide investor clients more liquidity options and broader access to investment opportunities Marketplace for on-demand executive talent Commercial Banking: Help clients rapidly scale and diversify their leadership teams and boards SVB Private: Provide clients with access to job opportunities within the innovation economy Investment analytics platform for VCs, LPs and other private capital investors Commercial Banking: Provide a powerful solution for our PE and VC clients to gain enhanced insights into their portfolios SVB Capital: Assist SVB Capital team with market benchmarking, streamlined LP reporting and portfolio analytics Commercial insurance provider powered by technology serving high-growth, venture- backed startups Commercial Banking: Connect early and mid-stage clients to Vouch’s tailored commercial insurance solutions to benefit customer retention and risk mitigation Largest global seed investor and accelerator program Commercial Banking: Expand SVB’s early-stage client acquisition channels and support innovative companies in Techstars’ global network Gain sector and market insights in the innovation economy Q2 2022 FINANCIAL HIGHLIGHTS 38 Strategic partnerships: another channel to expand capabilities to better meet clients’ needs Note: SVB maintains a noncontrolling equity interest in each of the companies listed above.
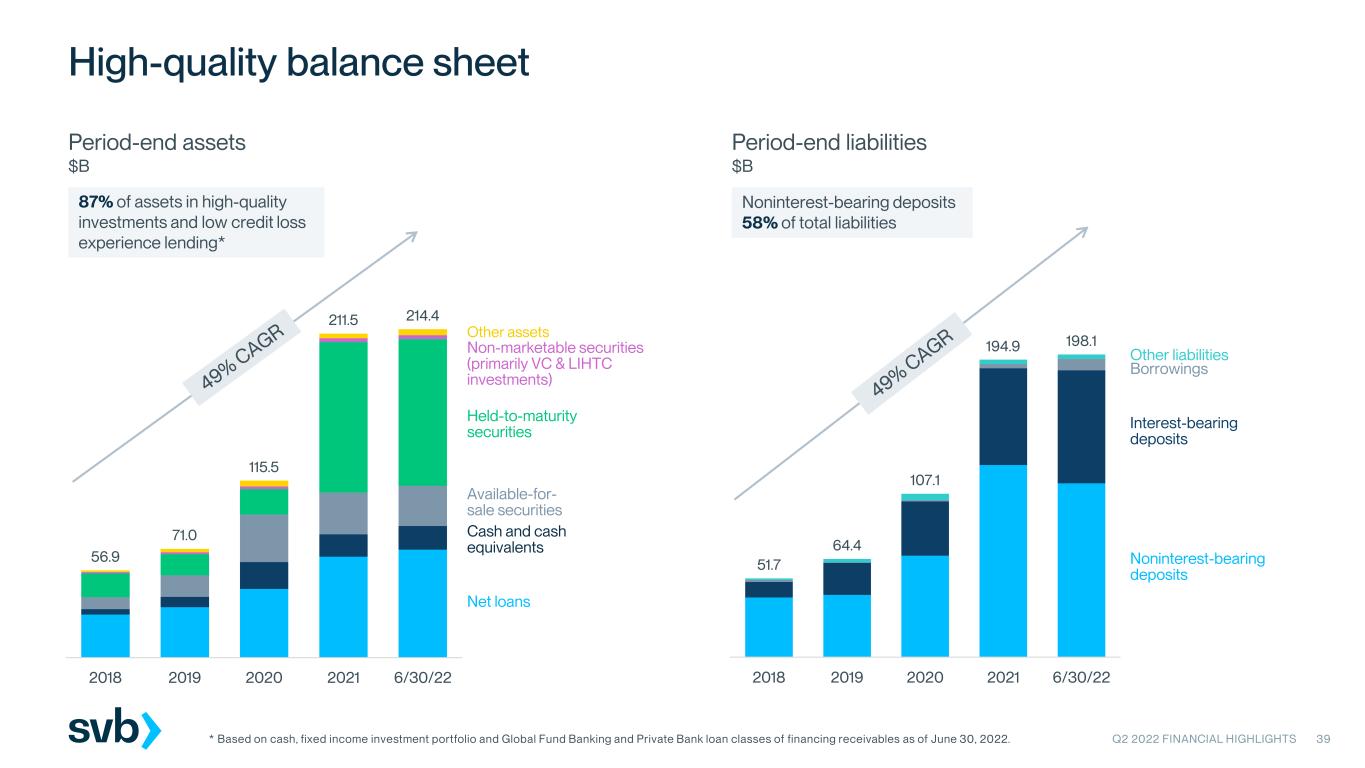
56.9 71.0 115.5 211.5 214.4 -$10 $10 $30 $50 $70 $90 $110 $130 $150 $170 $190 $210 $230 $250 2018 2019 2020 2021 6/30/22 Period-end assets $B Period-end liabilities $B 51.7 64.4 107.1 194.9 198.1 $ $20 $40 $60 $80 $100 $120 $140 $160 $180 $200 $220 2018 2019 2020 2021 6/30/22 Q2 2022 FINANCIAL HIGHLIGHTS 39 High-quality balance sheet Noninterest-bearing deposits Borrowings Interest-bearing deposits Other liabilities Net loans Other assets Non-marketable securities (primarily VC & LIHTC investments) Held-to-maturity securities Available-for- sale securities Cash and cash equivalents * Based on cash, fixed income investment portfolio and Global Fund Banking and Private Bank loan classes of financing receivables as of June 30, 2022. 87% of assets in high-quality investments and low credit loss experience lending* Noninterest-bearing deposits 58% of total liabilities

Q2 2022 FINANCIAL HIGHLIGHTS 40 Improved risk profile, with loan growth driven by lowest risk loan classes 71% of loans in Global Fund Banking and Private Bank, classes with lowest historical credit losses Early Stage ID % of total loans Other C&I Technology and Life Science/Healthcare Premium Wine and Other Private Bank Global Fund Banking Early Stage Investor Dependent (“ID”) loans, our highest risk loan class, now only 2% of total loans, down from 11% in 2009 and 30% in 2000 CRE PPP 4.5 5.5 7.0 8.9 10.9 14.4 16.7 19.9 23.1 28.3 33.2 45.2 66.3 71.011% 10% 8% 9% 9% 8% 6% 6% 6% 6% 5% 3% 2% 2% 2009 2010 2011 2012 2013 2014 2015 2016 2017 2018 2019 2020 2021 6/30/22 Period-end total loans $B

Q2 2022 FINANCIAL HIGHLIGHTS 41 Low credit risk capital call lines of credit Largest driver of loan growth over past 8 years; strong underwriting and well-diversified 1. Based on period-end loans at June 30, 2022. Capital call lines represent 97% of GFB portfolio. 2. Based on total GFB loan commitments (funded + unfunded) as of June 30, 2022. Global Fund Banking capital call lending Short-term lines of credit used by PE and VC funds to support investment activity prior to the receipt of Limited Partner capital contributions of total loans57%1 Limited partner commitments and robust secondary markets Value of fund investments with solid asset coverage Strong sources of repayment Only 1 net loss in our ~30 years of capital call lending Global Fund Banking portfolio2 By industry By investment style 22% 20% 12% 12% 9% 6% 19% Debt Buyout Growth Fund of funds VC funds Other Real estate 38% 14%6% 4% 8% 13% 3% 1% 2% 3% 8% Life sciences Industrial Other Consumer Debt Technology Real estate Fintech Natural resources Infrastructure Energy PE Funds
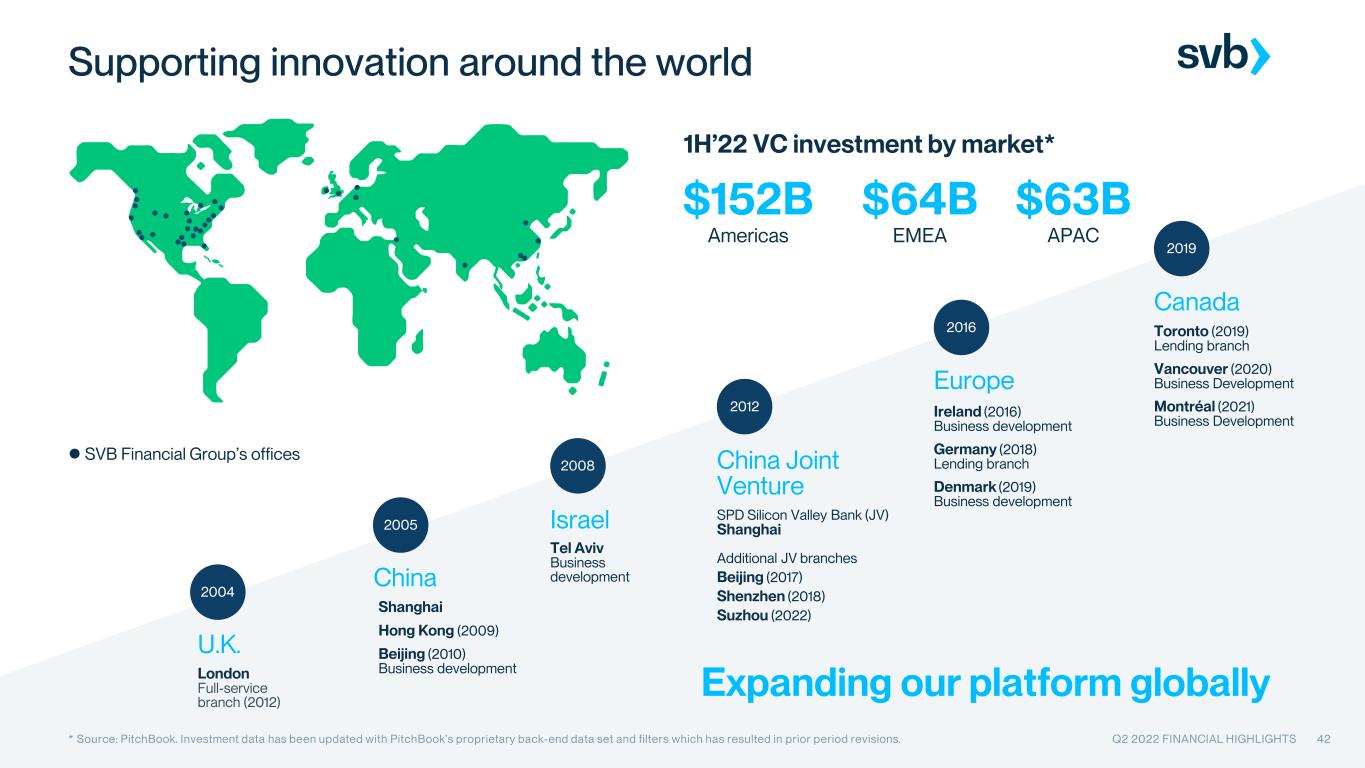
42 Supporting innovation around the world 2004 2005 2008 2012 2016 2019 SVB Financial Group’s offices * Source: PitchBook. Investment data has been updated with PitchBook’s proprietary back-end data set and filters which has resulted in prior period revisions. $152B Americas $64B EMEA $63B APAC 1H’22 VC investment by market* Expanding our platform globally Israel Tel Aviv Business developmentChina Shanghai Hong Kong (2009) Beijing (2010) Business development Canada Toronto (2019) Lending branch Vancouver (2020) Business Development Montréal (2021) Business Development Europe Ireland (2016) Business development Germany (2018) Lending branch Denmark (2019) Business development U.K. London Full-service branch (2012) China Joint Venture SPD Silicon Valley Bank (JV) Shanghai Additional JV branches Beijing (2017) Shenzhen (2018) Suzhou (2022) Q2 2022 FINANCIAL HIGHLIGHTS
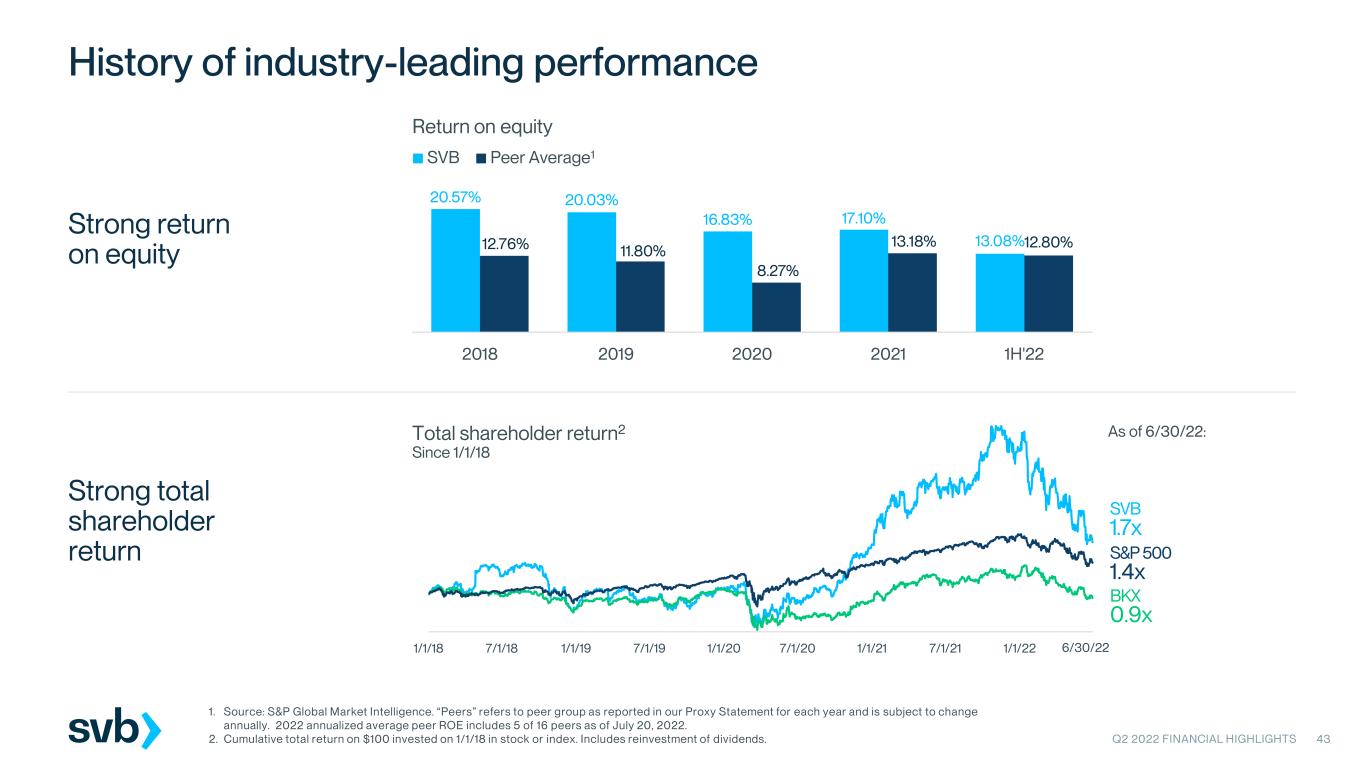
20.57% 20.03% 16.83% 17.10% 13.08%12.76% 11.80% 8.27% 13.18% 12.80% 0.00% 5.00% 10.00% 15.00% 20.00% 25.00% 30.00% 2018 2019 2020 2021 1H'22 SVB Peer Average 43 History of industry-leading performance Q2 2022 FINANCIAL HIGHLIGHTS 1/1/18 7/1/18 1/1/19 7/1/19 1/1/20 7/1/20 1/1/21 7/1/21 1/1/22 SVB 1.7x BKX 0.9x S&P 500 1.4x Total shareholder return2 Since 1/1/18 6/30/22 1. Source: S&P Global Market Intelligence. “Peers” refers to peer group as reported in our Proxy Statement for each year and is subject to change annually. 2022 annualized average peer ROE includes 5 of 16 peers as of July 20, 2022. 2. Cumulative total return on $100 invested on 1/1/18 in stock or index. Includes reinvestment of dividends. Return on equity Strong total shareholder return As of 6/30/22: 1 Strong return on equity
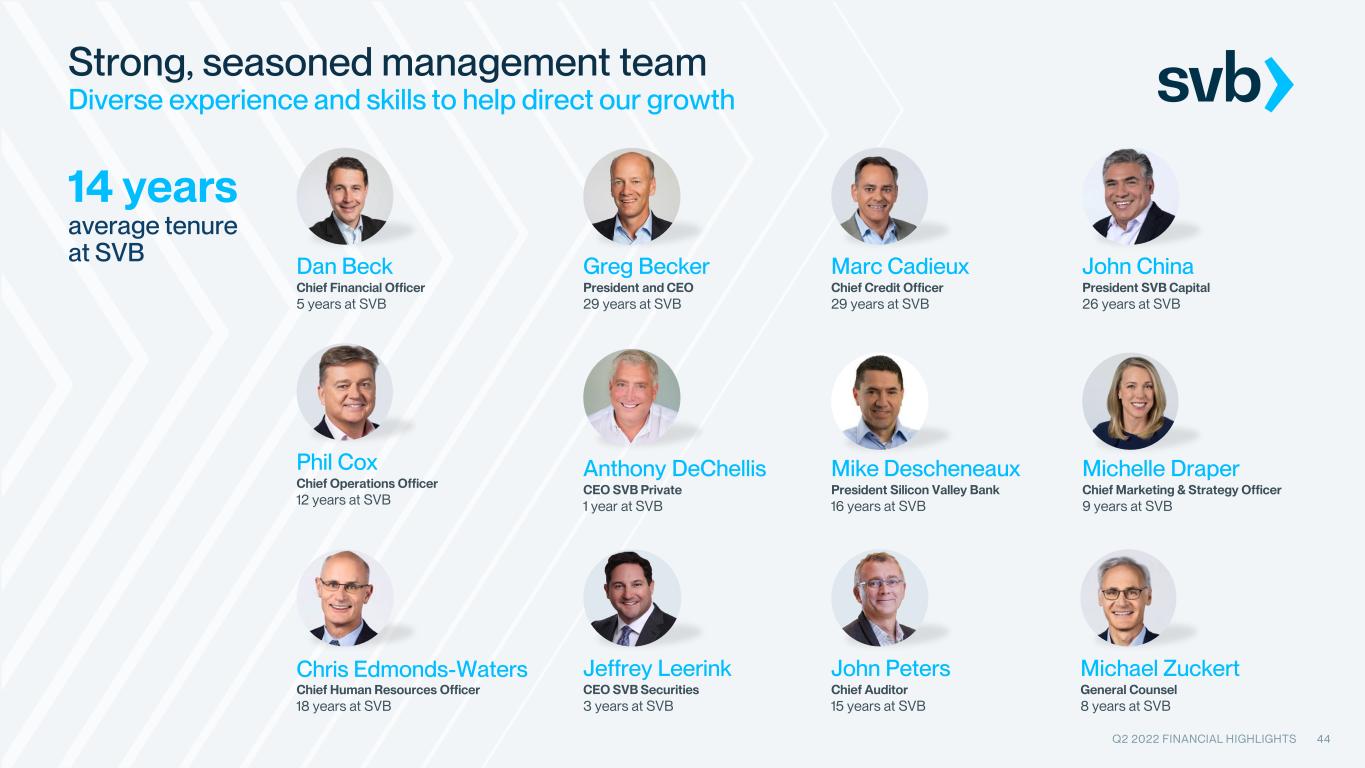
44 Strong, seasoned management team Diverse experience and skills to help direct our growth Dan Beck Chief Financial Officer 5 years at SVB Greg Becker President and CEO 29 years at SVB Marc Cadieux Chief Credit Officer 29 years at SVB John China President SVB Capital 26 years at SVB Phil Cox Chief Operations Officer 12 years at SVB Anthony DeChellis CEO SVB Private 1 year at SVB Mike Descheneaux President Silicon Valley Bank 16 years at SVB Michelle Draper Chief Marketing & Strategy Officer 9 years at SVB Chris Edmonds-Waters Chief Human Resources Officer 18 years at SVB Jeffrey Leerink CEO SVB Securities 3 years at SVB John Peters Chief Auditor 15 years at SVB Michael Zuckert General Counsel 8 years at SVB 14 years average tenure at SVB Q2 2022 FINANCIAL HIGHLIGHTS
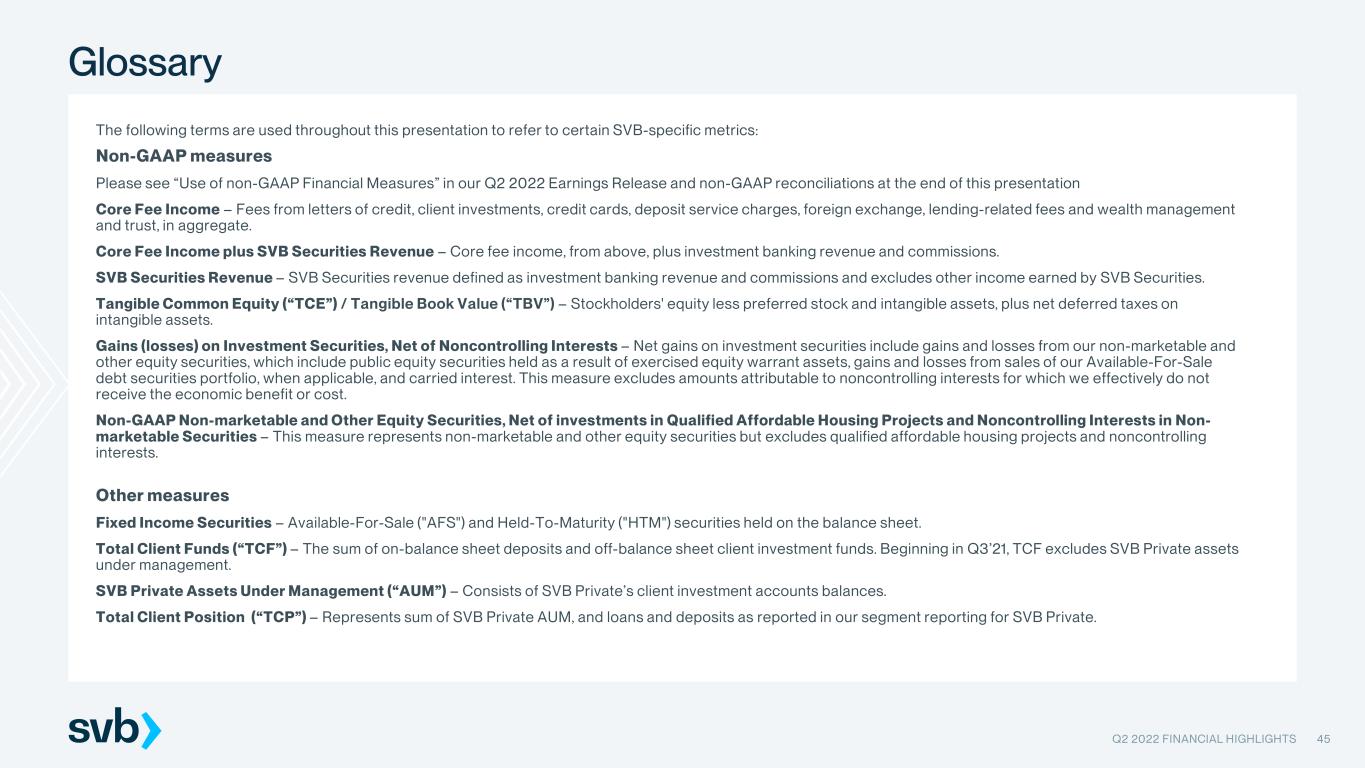
Glossary The following terms are used throughout this presentation to refer to certain SVB-specific metrics: Non-GAAP measures Please see “Use of non-GAAP Financial Measures” in our Q2 2022 Earnings Release and non-GAAP reconciliations at the end of this presentation Core Fee Income – Fees from letters of credit, client investments, credit cards, deposit service charges, foreign exchange, lending-related fees and wealth management and trust, in aggregate. Core Fee Income plus SVB Securities Revenue – Core fee income, from above, plus investment banking revenue and commissions. SVB Securities Revenue – SVB Securities revenue defined as investment banking revenue and commissions and excludes other income earned by SVB Securities. Tangible Common Equity (“TCE”) / Tangible Book Value (“TBV”) – Stockholders' equity less preferred stock and intangible assets, plus net deferred taxes on intangible assets. Gains (losses) on Investment Securities, Net of Noncontrolling Interests – Net gains on investment securities include gains and losses from our non-marketable and other equity securities, which include public equity securities held as a result of exercised equity warrant assets, gains and losses from sales of our Available-For-Sale debt securities portfolio, when applicable, and carried interest. This measure excludes amounts attributable to noncontrolling interests for which we effectively do not receive the economic benefit or cost. Non-GAAP Non-marketable and Other Equity Securities, Net of investments in Qualified Affordable Housing Projects and Noncontrolling Interests in Non- marketable Securities – This measure represents non-marketable and other equity securities but excludes qualified affordable housing projects and noncontrolling interests. Other measures Fixed Income Securities – Available-For-Sale ("AFS") and Held-To-Maturity ("HTM") securities held on the balance sheet. Total Client Funds (“TCF”) – The sum of on-balance sheet deposits and off-balance sheet client investment funds. Beginning in Q3’21, TCF excludes SVB Private assets under management. SVB Private Assets Under Management (“AUM”) – Consists of SVB Private’s client investment accounts balances. Total Client Position (“TCP”) – Represents sum of SVB Private AUM, and loans and deposits as reported in our segment reporting for SVB Private. Q2 2022 FINANCIAL HIGHLIGHTS 45
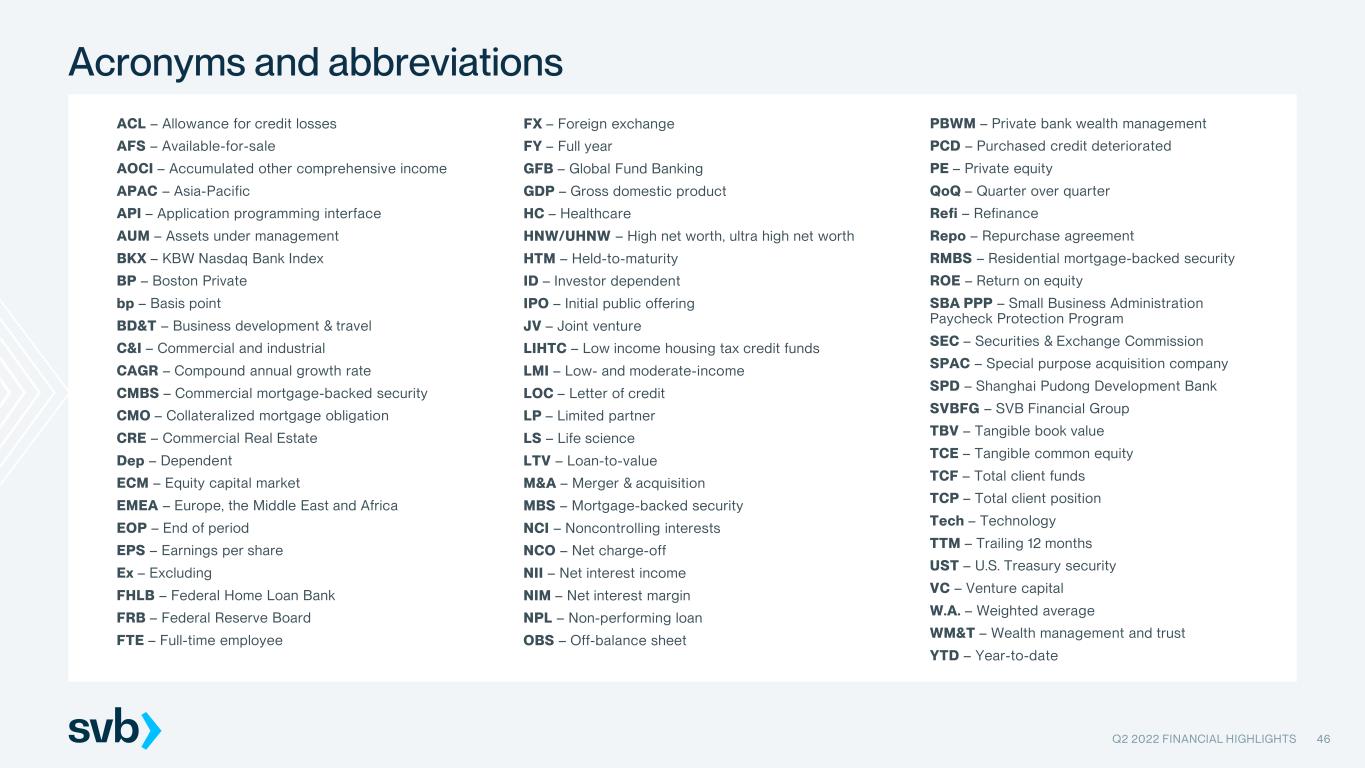
Acronyms and abbreviations FX – Foreign exchange FY – Full year GFB – Global Fund Banking GDP – Gross domestic product HC – Healthcare HNW/UHNW – High net worth, ultra high net worth HTM – Held-to-maturity ID – Investor dependent IPO – Initial public offering JV – Joint venture LIHTC – Low income housing tax credit funds LMI – Low- and moderate-income LOC – Letter of credit LP – Limited partner LS – Life science LTV – Loan-to-value M&A – Merger & acquisition MBS – Mortgage-backed security NCI – Noncontrolling interests NCO – Net charge-off NII – Net interest income NIM – Net interest margin NPL – Non-performing loan OBS – Off-balance sheet ACL – Allowance for credit losses AFS – Available-for-sale AOCI – Accumulated other comprehensive income APAC – Asia-Pacific API – Application programming interface AUM – Assets under management BKX – KBW Nasdaq Bank Index BP – Boston Private bp – Basis point BD&T – Business development & travel C&I – Commercial and industrial CAGR – Compound annual growth rate CMBS – Commercial mortgage-backed security CMO – Collateralized mortgage obligation CRE – Commercial Real Estate Dep – Dependent ECM – Equity capital market EMEA – Europe, the Middle East and Africa EOP – End of period EPS – Earnings per share Ex – Excluding FHLB – Federal Home Loan Bank FRB – Federal Reserve Board FTE – Full-time employee PBWM – Private bank wealth management PCD – Purchased credit deteriorated PE – Private equity QoQ – Quarter over quarter Refi – Refinance Repo – Repurchase agreement RMBS – Residential mortgage-backed security ROE – Return on equity SBA PPP – Small Business Administration Paycheck Protection Program SEC – Securities & Exchange Commission SPAC – Special purpose acquisition company SPD – Shanghai Pudong Development Bank SVBFG – SVB Financial Group TBV – Tangible book value TCE – Tangible common equity TCF – Total client funds TCP – Total client position Tech – Technology TTM – Trailing 12 months UST – U.S. Treasury security VC – Venture capital W.A. – Weighted average WM&T – Wealth management and trust YTD – Year-to-date Q2 2022 FINANCIAL HIGHLIGHTS 46

Non-GAAP reconciliations Q2 2022 FINANCIAL HIGHLIGHTS 47
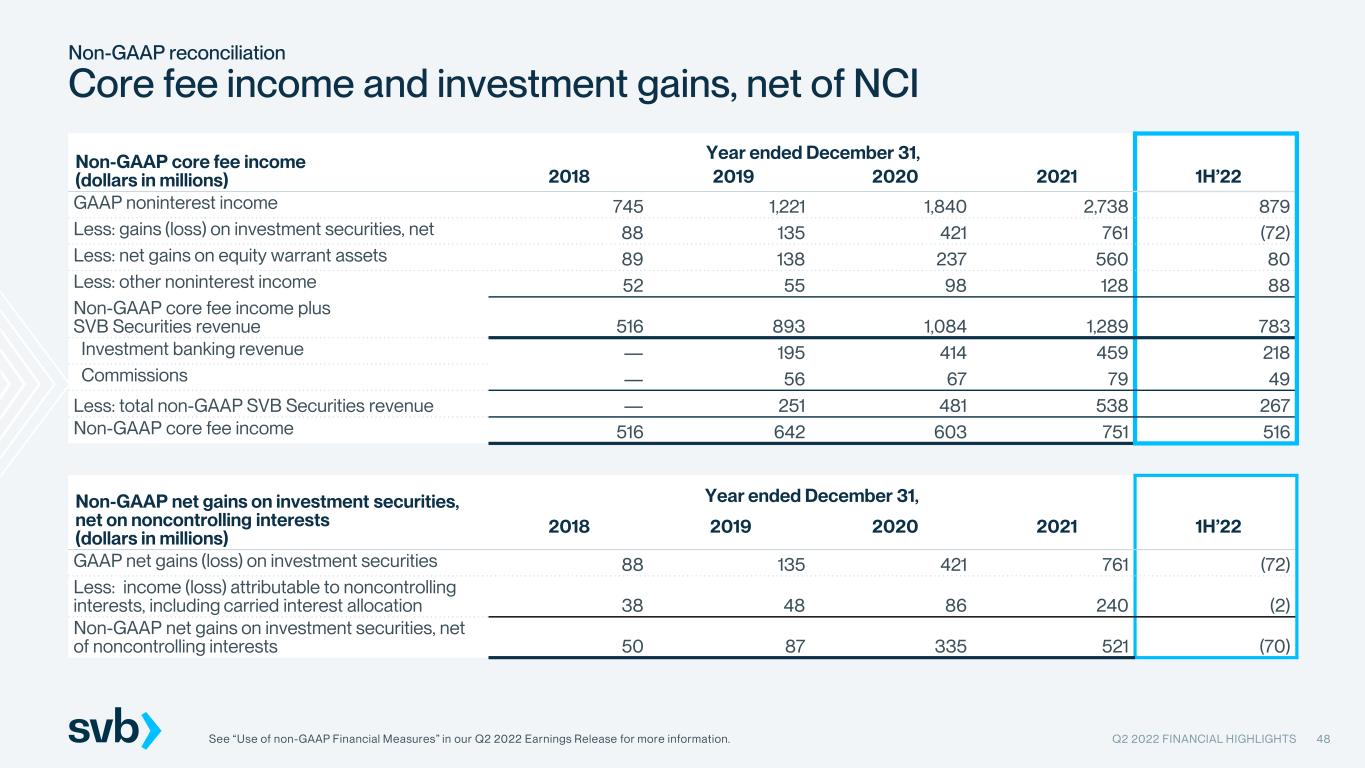
Non-GAAP reconciliation Core fee income and investment gains, net of NCI Q2 2022 FINANCIAL HIGHLIGHTS 48 Non-GAAP core fee income (dollars in millions) Yea ear ended December 31, r 2018 2019 2020 2021 1H’22 GAAP noninterest income 745 1,221 1,840 2,738 879 Less: gains (loss) on investment securities, net 88 135 421 761 (72) Less: net gains on equity warrant assets 89 138 237 560 80 Less: other noninterest income 52 55 98 128 88 Non-GAAP core fee income plus SVB Securities revenue 516 893 1,084 1,289 783 Investment banking revenue — 195 414 459 218 Commissions — 56 67 79 49 Less: total non-GAAP SVB Securities revenue — 251 481 538 267 Non-GAAP core fee income 516 642 603 751 516 See “Use of non-GAAP Financial Measures” in our Q2 2022 Earnings Release for more information. Non-GAAP net gains on investment securities, net on noncontrolling interests (dollars in millions) Year ended December 31, 2018 2019 2020 2021 1H’22 GAAP net gains (loss) on investment securities 88 135 421 761 (72) Less: income (loss) attributable to noncontrolling interests, including carried interest allocation 38 48 86 240 (2) Non-GAAP net gains on investment securities, net of noncontrolling interests 50 87 335 521 (70)
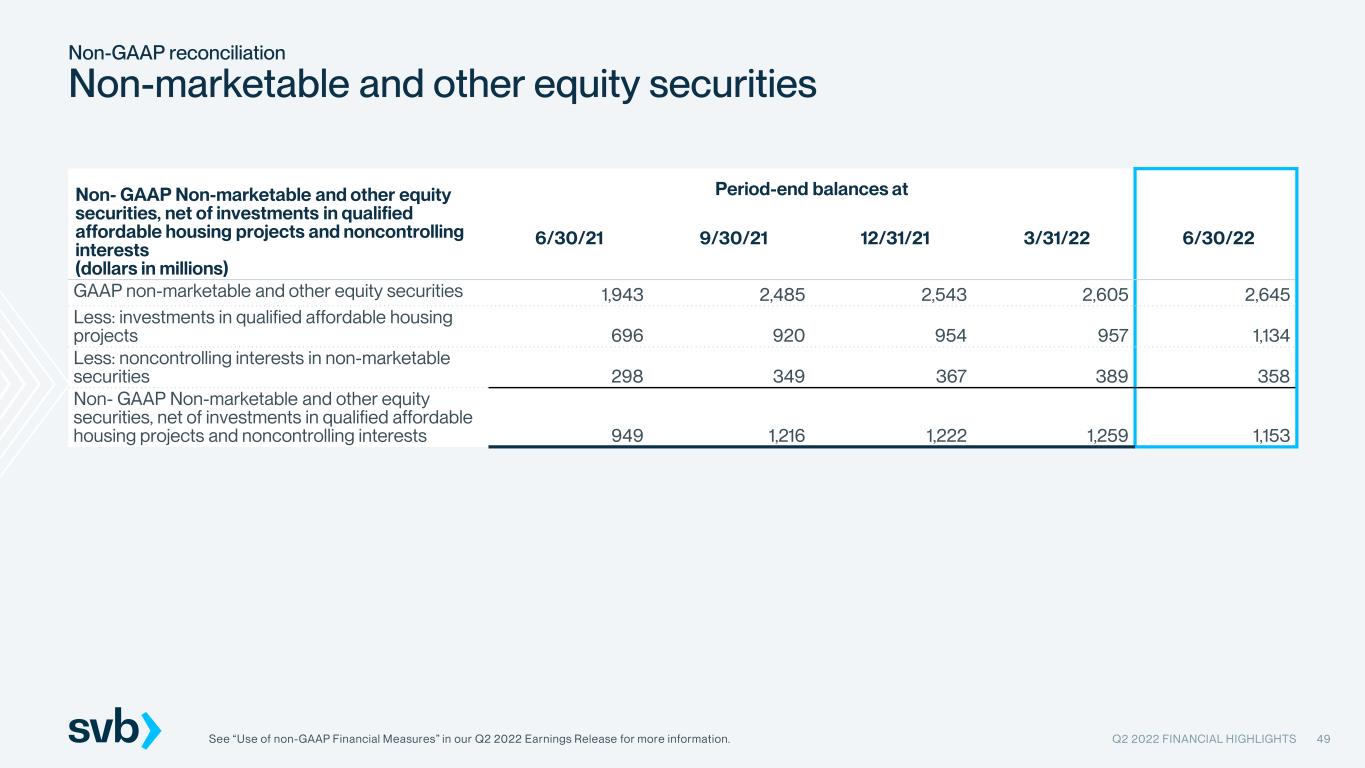
Non-GAAP reconciliation Non-marketable and other equity securities Q2 2022 FINANCIAL HIGHLIGHTS 49 Non- GAAP Non-marketable and other equity securities, net of investments in qualified affordable housing projects and noncontrolling interests (dollars in millions) Period-end balances at 6/30/21 9/30/21 12/31/21 3/31/22 6/30/22 GAAP non-marketable and other equity securities 1,943 2,485 2,543 2,605 2,645 Less: investments in qualified affordable housing projects 696 920 954 957 1,134 Less: noncontrolling interests in non-marketable securities 298 349 367 389 358 Non- GAAP Non-marketable and other equity securities, net of investments in qualified affordable housing projects and noncontrolling interests 949 1,216 1,222 1,259 1,153 See “Use of non-GAAP Financial Measures” in our Q2 2022 Earnings Release for more information.
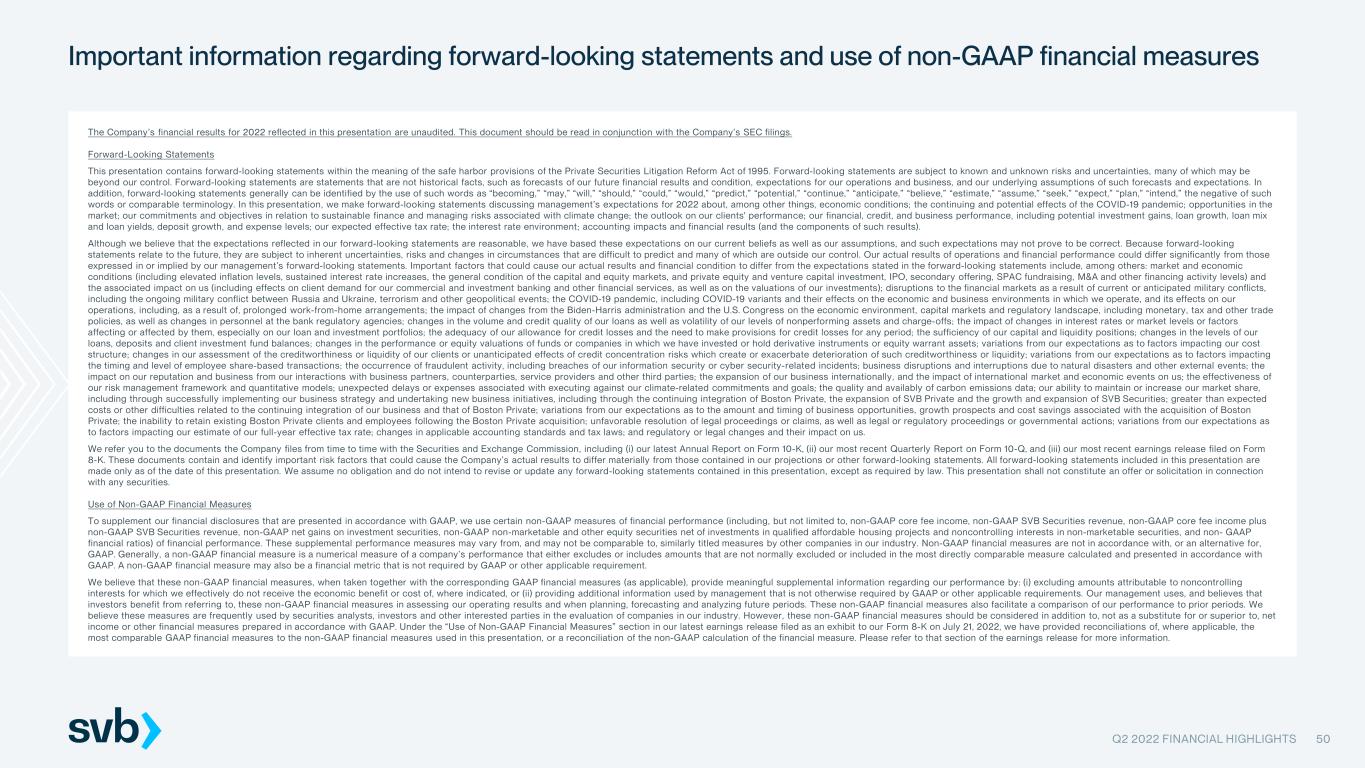
Important information regarding forward-looking statements and use of non-GAAP financial measures The Company’s financial results for 2022 reflected in this presentation are unaudited. This document should be read in conjunction with the Company’s SEC filings. Forward-Looking Statements This presentation contains forward-looking statements within the meaning of the safe harbor provisions of the Private Securities Litigation Reform Act of 1995. Forward-looking statements are subject to known and unknown risks and uncertainties, many of which may be beyond our control. Forward-looking statements are statements that are not historical facts, such as forecasts of our future financial results and condition, expectations for our operations and business, and our underlying assumptions of such forecasts and expectations. In addition, forward-looking statements generally can be identified by the use of such words as “becoming,” “may,” “will,” “should,” “could,” “would,” “predict,” “potential,” “continue,” “anticipate,” “believe,” “estimate,” “assume,” “seek,” “expect,” “plan,” “intend,” the negative of such words or comparable terminology. In this presentation, we make forward-looking statements discussing management’s expectations for 2022 about, among other things, economic conditions; the continuing and potential effects of the COVID-19 pandemic; opportunities in the market; our commitments and objectives in relation to sustainable finance and managing risks associated with climate change; the outlook on our clients' performance; our financial, credit, and business performance, including potential investment gains, loan growth, loan mix and loan yields, deposit growth, and expense levels; our expected effective tax rate; the interest rate environment; accounting impacts and financial results (and the components of such results). Although we believe that the expectations reflected in our forward-looking statements are reasonable, we have based these expectations on our current beliefs as well as our assumptions, and such expectations may not prove to be correct. Because forward-looking statements relate to the future, they are subject to inherent uncertainties, risks and changes in circumstances that are difficult to predict and many of which are outside our control. Our actual results of operations and financial performance could differ significantly from those expressed in or implied by our management’s forward-looking statements. Important factors that could cause our actual results and financial condition to differ from the expectations stated in the forward-looking statements include, among others: market and economic conditions (including elevated inflation levels, sustained interest rate increases, the general condition of the capital and equity markets, and private equity and venture capital investment, IPO, secondary offering, SPAC fundraising, M&A and other financing activity levels) and the associated impact on us (including effects on client demand for our commercial and investment banking and other financial services, as well as on the valuations of our investments); disruptions to the financial markets as a result of current or anticipated military conflicts, including the ongoing military conflict between Russia and Ukraine, terrorism and other geopolitical events; the COVID-19 pandemic, including COVID-19 variants and their effects on the economic and business environments in which we operate, and its effects on our operations, including, as a result of, prolonged work-from-home arrangements; the impact of changes from the Biden-Harris administration and the U.S. Congress on the economic environment, capital markets and regulatory landscape, including monetary, tax and other trade policies, as well as changes in personnel at the bank regulatory agencies; changes in the volume and credit quality of our loans as well as volatility of our levels of nonperforming assets and charge-offs; the impact of changes in interest rates or market levels or factors affecting or affected by them, especially on our loan and investment portfolios; the adequacy of our allowance for credit losses and the need to make provisions for credit losses for any period; the sufficiency of our capital and liquidity positions; changes in the levels of our loans, deposits and client investment fund balances; changes in the performance or equity valuations of funds or companies in which we have invested or hold derivative instruments or equity warrant assets; variations from our expectations as to factors impacting our cost structure; changes in our assessment of the creditworthiness or liquidity of our clients or unanticipated effects of credit concentration risks which create or exacerbate deterioration of such creditworthiness or liquidity; variations from our expectations as to factors impacting the timing and level of employee share-based transactions; the occurrence of fraudulent activity, including breaches of our information security or cyber security-related incidents; business disruptions and interruptions due to natural disasters and other external events; the impact on our reputation and business from our interactions with business partners, counterparties, service providers and other third parties; the expansion of our business internationally, and the impact of international market and economic events on us; the effectiveness of our risk management framework and quantitative models; unexpected delays or expenses associated with executing against our climate-related commitments and goals; the quality and availably of carbon emissions data; our ability to maintain or increase our market share, including through successfully implementing our business strategy and undertaking new business initiatives, including through the continuing integration of Boston Private, the expansion of SVB Private and the growth and expansion of SVB Securities; greater than expected costs or other difficulties related to the continuing integration of our business and that of Boston Private; variations from our expectations as to the amount and timing of business opportunities, growth prospects and cost savings associated with the acquisition of Boston Private; the inability to retain existing Boston Private clients and employees following the Boston Private acquisition; unfavorable resolution of legal proceedings or claims, as well as legal or regulatory proceedings or governmental actions; variations from our expectations as to factors impacting our estimate of our full-year effective tax rate; changes in applicable accounting standards and tax laws; and regulatory or legal changes and their impact on us. We refer you to the documents the Company files from time to time with the Securities and Exchange Commission, including (i) our latest Annual Report on Form 10-K, (ii) our most recent Quarterly Report on Form 10-Q, and (iii) our most recent earnings release filed on Form 8-K. These documents contain and identify important risk factors that could cause the Company’s actual results to differ materially from those contained in our projections or other forward-looking statements. All forward-looking statements included in this presentation are made only as of the date of this presentation. We assume no obligation and do not intend to revise or update any forward-looking statements contained in this presentation, except as required by law. This presentation shall not constitute an offer or solicitation in connection with any securities. Use of Non-GAAP Financial Measures To supplement our financial disclosures that are presented in accordance with GAAP, we use certain non-GAAP measures of financial performance (including, but not limited to, non-GAAP core fee income, non-GAAP SVB Securities revenue, non-GAAP core fee income plus non-GAAP SVB Securities revenue, non-GAAP net gains on investment securities, non-GAAP non-marketable and other equity securities net of investments in qualified affordable housing projects and noncontrolling interests in non-marketable securities, and non- GAAP financial ratios) of financial performance. These supplemental performance measures may vary from, and may not be comparable to, similarly titled measures by other companies in our industry. Non-GAAP financial measures are not in accordance with, or an alternative for, GAAP. Generally, a non-GAAP financial measure is a numerical measure of a company’s performance that either excludes or includes amounts that are not normally excluded or included in the most directly comparable measure calculated and presented in accordance with GAAP. A non-GAAP financial measure may also be a financial metric that is not required by GAAP or other applicable requirement. We believe that these non-GAAP financial measures, when taken together with the corresponding GAAP financial measures (as applicable), provide meaningful supplemental information regarding our performance by: (i) excluding amounts attributable to noncontrolling interests for which we effectively do not receive the economic benefit or cost of, where indicated, or (ii) providing additional information used by management that is not otherwise required by GAAP or other applicable requirements. Our management uses, and believes that investors benefit from referring to, these non-GAAP financial measures in assessing our operating results and when planning, forecasting and analyzing future periods. These non-GAAP financial measures also facilitate a comparison of our performance to prior periods. We believe these measures are frequently used by securities analysts, investors and other interested parties in the evaluation of companies in our industry. However, these non-GAAP financial measures should be considered in addition to, not as a substitute for or superior to, net income or other financial measures prepared in accordance with GAAP. Under the “Use of Non-GAAP Financial Measures” section in our latest earnings release filed as an exhibit to our Form 8-K on July 21, 2022, we have provided reconciliations of, where applicable, the most comparable GAAP financial measures to the non-GAAP financial measures used in this presentation, or a reconciliation of the non-GAAP calculation of the financial measure. Please refer to that section of the earnings release for more information. Q2 2022 FINANCIAL HIGHLIGHTS 50
About SVB SVB is the financial partner of the innovation economy, helping individuals, investors and the world’s most innovative companies achieve their ambitious goals. SVB’s businesses - Silicon Valley Bank, SVB Capital, SVB Private and SVB Securities - together offer the services that dynamic and fast-growing clients require as they grow, including commercial banking, venture investing, wealth planning and investment banking. Headquartered in Santa Clara, California, SVB operates in centers of innovation around the world. Learn more at svb.com/global. SVB Financial Group (Nasdaq: SIVB) is the holding company for all business units and groups. © 2022 SVB Financial Group. All rights reserved. SVB, SVB FINANCIAL GROUP, SILICON VALLEY BANK, SVB SECURITIES, SVB PRIVATE, SVB CAPITAL and the chevron device are trademarks of SVB Financial Group, used under license. Silicon Valley Bank is a member of the FDIC and the Federal Reserve System. Silicon Valley Bank is the California bank subsidiary of SVB Financial Group. Q2 2022 FINANCIAL HIGHLIGHTS 51

Investor Relations 3005 Tasman Drive Santa Clara, CA 95054 T 408 654 7400 ir@svb.com Q2 2022 FINANCIAL HIGHLIGHTS 52


