Exhibit 99.2
SVB Financial Group RBC Capital Markets
Financial Institutions Conference 2007
September 24-26, 2007
(Nasdaq: SIVB)
Principal Banking Subsidiary: Silicon Valley Bank
Member Federal Reserve System. Member FDIC
Safe Harbor Disclosure
This presentation contains projections or other forward-looking statements regarding management’s expectations about future events or the future financial performance of the company, and may include, without limitation, financial guidance for the company’s third fiscal quarter of 2007 and for the year 2007, as well as future economic, market and tax conditions. Forward-looking statements are statements that are not historical facts.
We wish to caution you that such statements are just predictions and actual events or results may differ materially, due to changes in economic, business and regulatory factors and trends. We also refer you to the documents the company files from time to time with the United States Securities and Exchange Commission, specifically the company’s latest Annual Report on Form 10-K for the year ended December 31, 2006, filed on March 1, 2007; and Form 10-Q for the three months ended June 30, 2007, filed on August 9, 2007. These documents contain and identify important risk factors that could cause the company’s actual results to differ materially from those contained in our projections or other forward-looking statements. All forward-looking statements included in this presentation are made only as of today’s date.
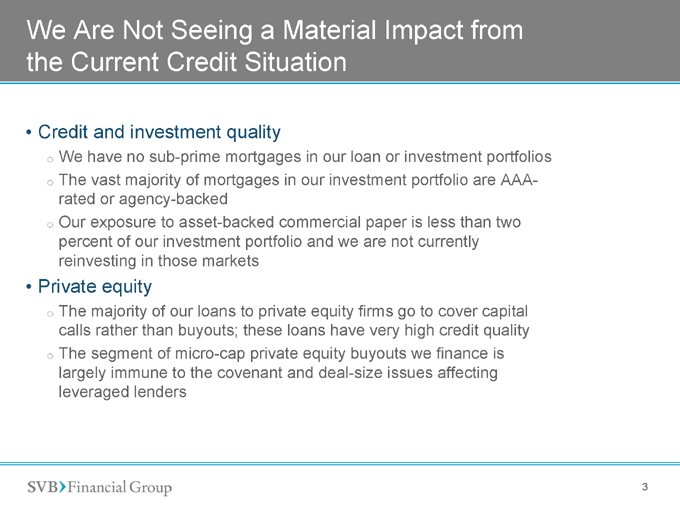
We Are Not Seeing a Material Impact from the Current Credit Situation
Credit and investment quality
We have no sub-prime mortgages in our loan or investment portfolios
The vast majority of mortgages in our investment portfolio are AAA-rated or agency-backed
Our exposure to asset-backed commercial paper is less than two percent of our investment portfolio and we are not currently reinvesting in those markets
Private equity
The majority of our loans to private equity firms go to cover capital calls rather than buyouts; these loans have very high credit quality
The segment of micro-cap private equity buyouts we finance is largely immune to the covenant and deal-size issues affecting leveraged lenders
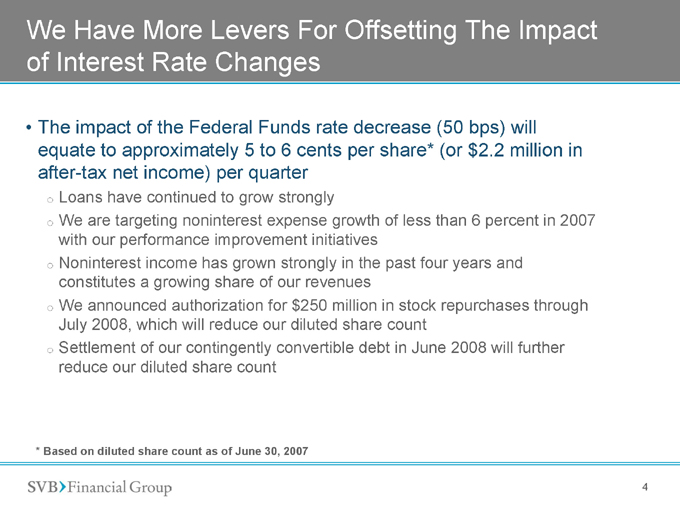
We Have More Levers For Offsetting The Impact of Interest Rate Changes
The impact of the Federal Funds rate decrease (50 bps) will equate to approximately 5 to 6 cents per share* (or $2.2 million in after-tax net income) per quarter
Loans have continued to grow strongly
We are targeting noninterest expense growth of less than 6 percent in 2007 with our performance improvement initiatives
Noninterest income has grown strongly in the past four years and constitutes a growing share of our revenues
We announced authorization for $250 million in stock repurchases through July 2008, which will reduce our diluted share count
Settlement of our contingently convertible debt in June 2008 will further reduce our diluted share count
* | | Based on diluted share count as of June 30, 2007 |
Corporate Overview
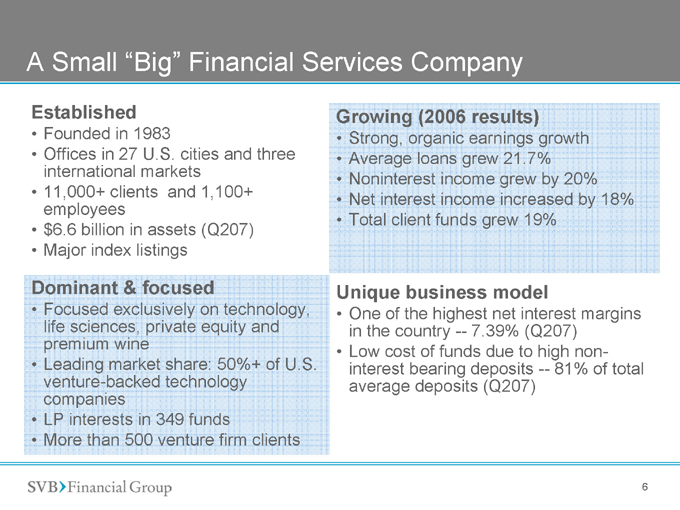
A Small “Big” Financial Services Company
Established
Founded in 1983
Offices in 27 U.S. cities and three international markets
11,000+ clients and 1,100+ employees
$6.6 billion in assets (Q207)
Major index listings
Dominant & focused
Focused exclusively on technology, life sciences, private equity and premium wine
Leading market share: 50%+ of U.S. venture-backed technology companies
LP interests in 349 funds
More than 500 venture firm clients
Growing (2006 results)
Strong, organic earnings growth
Average loans grew 21.7%
Noninterest income grew by 20%
Net interest income increased by 18%
Total client funds grew 19%
Unique business model
One of the highest net interest margins in the country 7.39% (Q207)
Low cost of funds due to high non-interest bearing deposits 81% of total average deposits (Q207)
SVB Platform: 20+ Years at the Core of Entrepreneurial Activity
SVB Financial Group
Mission: To help entrepreneurial companies succeed
SVB Analytics
Valuation Services
Formed 2006
Private company 409a valuations
Corporate equity management (600 clients)
SVB Capital
Funds Management
Venture capital
Private equity
$1.0B fund family
Investments in 349 funds
3 | | new funds in 2006; 2 new funds in 2007 |
SVB Global
Global Networks
Helping companies access foreign markets and opportunities
London rep office
Consulting/advising offices in China and India
SVB Private Client Services
Private Banking
Personal financing solutions for investors and entrepreneurs
SVB Silicon
Valley Bank
Commercial
Banking
Credit and global
cash management
VC-Backed
Asset-based
Cash flow
Term debt
Working capital
Strategy
Focus on technology, life science, private equity and premium wine
Meet client needs from inception to infinity
Offer a diversified product set
Do it worldwide
Take a high-touch approach with decentralized delivery
Practice innovation and thought leadership
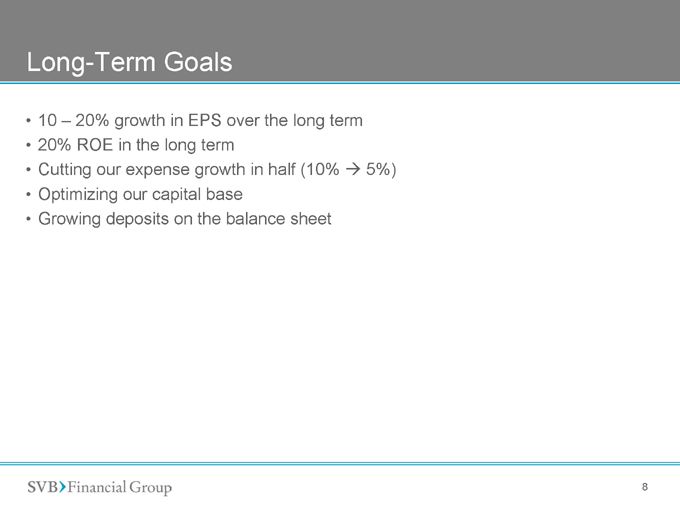
Long-Term Goals
10 – 20% growth in EPS over the long term
20% ROE in the long term
Cutting our expense growth in half (10% ®5%)
Optimizing our capital base
Growing deposits on the balance sheet
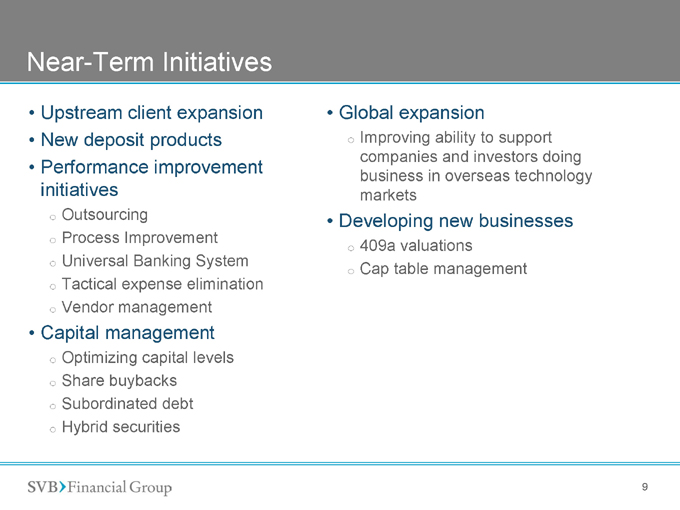
Near-Term Initiatives
Upstream client expansion
New deposit products
Performance improvement initiatives
Outsourcing
Process Improvement
Universal Banking System
Tactical expense elimination
Vendor management
Capital management
Optimizing capital levels
Share buybacks
Subordinated debt
Hybrid securities
Global expansion
Improving ability to support companies and investors doing business in overseas technology markets
Developing new businesses
409a valuations
Cap table management
9
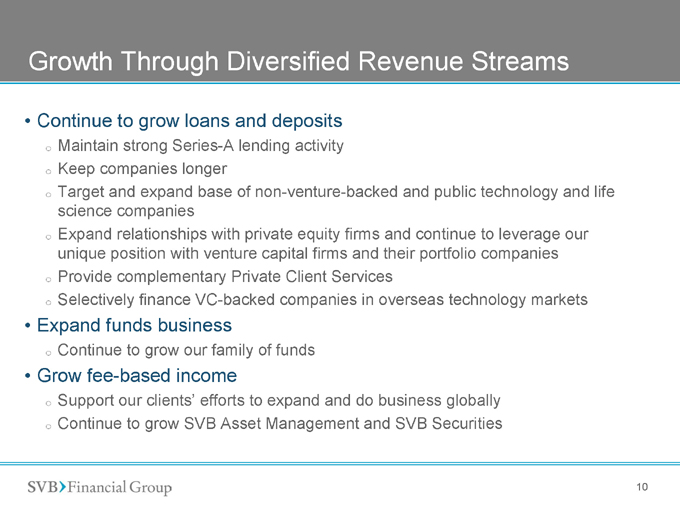
Growth Through Diversified Revenue Streams
Continue to grow loans and deposits
Maintain strong Series-A lending activity
Keep companies longer
Target and expand base of non-venture-backed and public technology and life science companies
Expand relationships with private equity firms and continue to leverage our unique position with venture capital firms and their portfolio companies
Provide complementary Private Client Services
Selectively finance VC-backed companies in overseas technology markets
Expand funds business
Continue to grow our family of funds
Grow fee-based income
Support our clients’ efforts to expand and do business globally
Continue to grow SVB Asset Management and SVB Securities
10
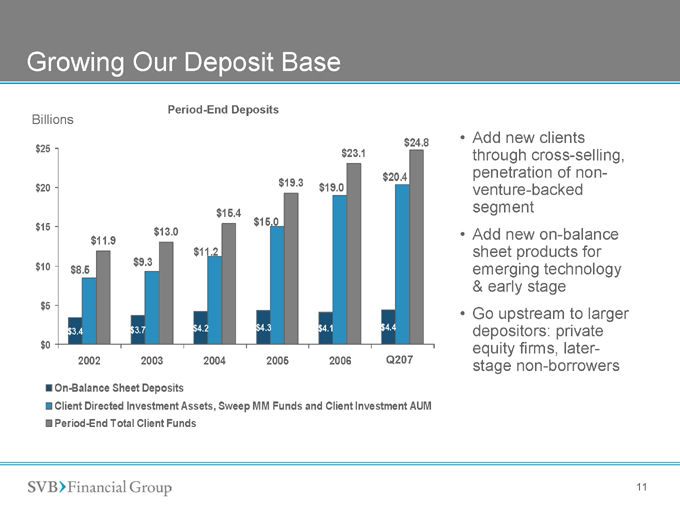
Growing Our Deposit Base
Period-End Deposits
Billions
$24.8
$25 $23.1 $20.4 $19.3 $19.0 $20
$15.4 $15.0
$15 $13.0 $11.9 $11.2
$10 $9.3 $8.5
$5
$3.4 $3.7 $4.2 $4.3 $4.1 $4.4 $0
2002 2003 2004 2005 2006 Q207
On-Balance Sheet Deposits
Client Directed Investment Assets, Sweep MM Funds and Client Investment AUM Period-End Total Client Funds
Add new clients through cross-selling, penetration of non-venture-backed segment
Add new on-balance sheet products for emerging technology & early stage
Go upstream to larger depositors: private equity firms, later-stage non-borrowers
11
Financial Highlights
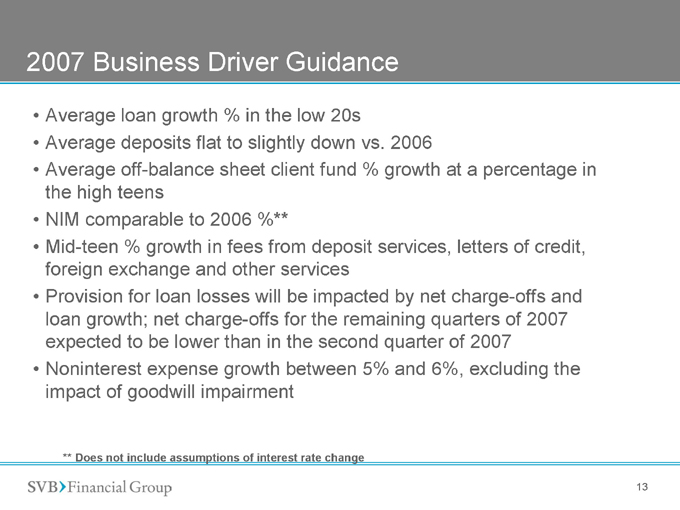
2007 Business Driver Guidance
Average loan growth % in the low 20s
Average deposits flat to slightly down vs. 2006
Average off-balance sheet client fund % growth at a percentage in the high teens NIM comparable to 2006 %**
Mid-teen % growth in fees from deposit services, letters of credit, foreign exchange and other services
Provision for loan losses will be impacted by net charge-offs and loan growth; net charge-offs for the remaining quarters of 2007 expected to be lower than in the second quarter of 2007
Noninterest expense growth between 5% and 6%, excluding the impact of goodwill impairment
** Does not include assumptions of interest rate change
13
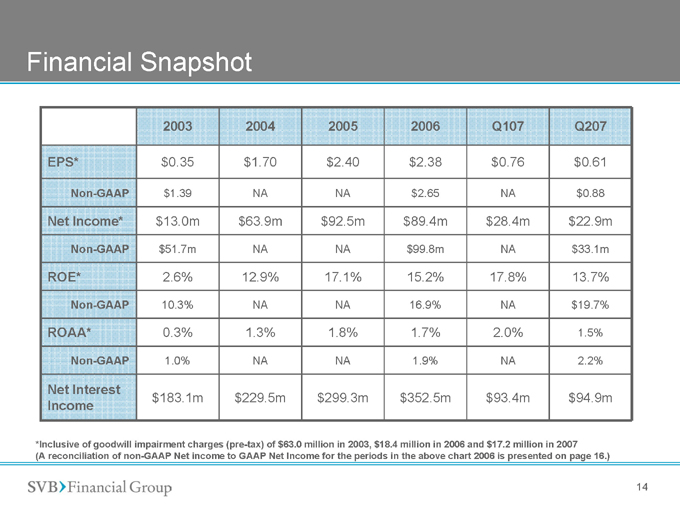
Financial Snapshot
2003 2004 2005 2006 Q107 Q207
EPS* $0.35 $1.70 $2.40 $2.38 $0.76 $0.61
Non-GAAP $1.39 NA NA $2.65 NA $0.88
Net Income* $13.0m $63.9m $92.5m $89.4m $28.4m $22.9m
Non-GAAP $51.7m NA NA $99.8m NA $33.1m
ROE* 2.6% 12.9% 17.1% 15.2% 17.8% 13.7%
Non-GAAP 10.3% NA NA 16.9% NA $19.7%
ROAA* 0.3% 1.3% 1.8% 1.7% 2.0% 1.5%
Non-GAAP 1.0% NA NA 1.9% NA 2.2%
Net Interest
$183.1m $229.5m $299.3m $352.5m $93.4m $94.9m
Income
*Inclusive of goodwill impairment charges (pre-tax) of $63.0 million in 2003, $18.4 million in 2006 and $17.2 million in 2007 (A reconciliation of non-GAAP Net income to GAAP Net Income for the periods in the above chart 2006 is presented on page 16.)
14
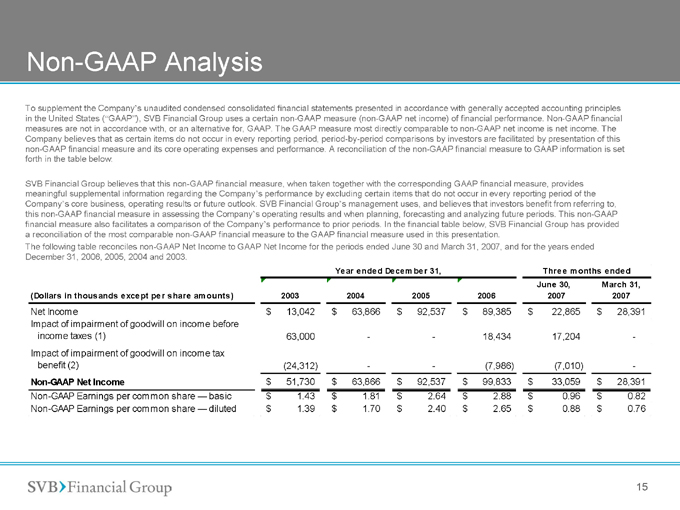
Non-GAAP Analysis
To supplement the Company’s unaudited condensed consolidated financial statements presented in accordance with generally accepted accounting principles in the United States (���GAAP”), SVB Financial Group uses a certain non-GAAP measure (non-GAAP net income) of financial performance. Non-GAAP financial measures are not in accordance with, or an alternative for, GAAP. The GAAP measure most directly comparable to non-GAAP net income is net income. The Company believes that as certain items do not occur in every reporting period, period-by-period comparisons by investors are facilitated by presentation of this non-GAAP financial measure and its core operating expenses and performance. A reconciliation of the non-GAAP financial measure to GAAP information is set forth in the table below.
SVB Financial Group believes that this non-GAAP financial measure, when taken together with the corresponding GAAP financial measure, provides meaningful supplemental information regarding the Company’s performance by excluding certain items that do not occur in every reporting period of the Company’s core business, operating results or future outlook. SVB Financial Group’s management uses, and believes that investors benefit from referring to, this non-GAAP financial measure in assessing the Company’s operating results and when planning, forecasting and analyzing future periods. This non-GAAP financial measure also facilitates a comparison of the Company’s performance to prior periods. In the financial table below, SVB Financial Group has provided a reconciliation of the most comparable non-GAAP financial measure to the GAAP financial measure used in this presentation.
The following table reconciles non-GAAP Net Income to GAAP Net Income for the periods ended June 30 and March 31, 2007, and for the years ended December 31, 2006, 2005, 2004 and 2003.
Year ended December 31, Three months ended
June 30, 2007 March 31, 2007
(Dollars in thousands except per share amounts) 2003 2004 2005 2006
Net Income $13,042 $63,866 $92,537 $89,385 $22,865 $28,391
Impact of impairment of goodwill on income before
income taxes (1) 63,000 —— 18,434 17,204 —
Impact of impairment of goodwill on income tax
benefit (2) (24,312) —— (7,986) (7,010) —
Non-GAAP Net Income $51,730 $63,866 $92,537 $99,833 $33,059 $28,391
Non-GAAP Earnings per common share — basic $1.43 $1.81 $2.64 $2.88 $0.96 $0.82
Non-GAAP Earnings per common share — diluted $1.39 $1.70 $2.40 $2.65 $0.88 $0.76
15
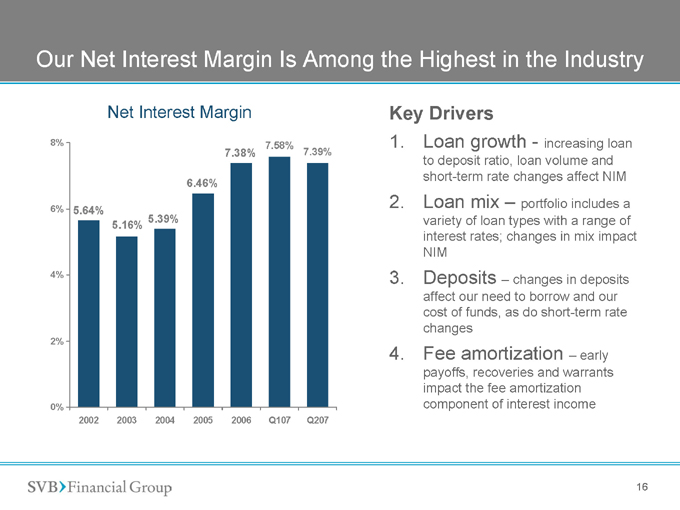
Our Net Interest Margin Is Among the Highest in the Industry
Key Drivers
1. Loan growth—increasing loan to deposit ratio, loan volume and short-term rate changes affect NIM
2. Loan mix – portfolio includes a variety of loan types with a range of interest rates; changes in mix impact NIM
3. Deposits – changes in deposits affect our need to borrow and our cost of funds, as do short-term rate changes
4. Fee amortization – early
payoffs, recoveries and warrants impact the fee amortization component of interest income
Net Interest Margin
8%
7.38% 7.58% 7.39%
6.46%
6% 5.64%
5.39% 5.16%
4%
2%
0%
2002 2003 2004 2005 2006 Q107 Q207
16
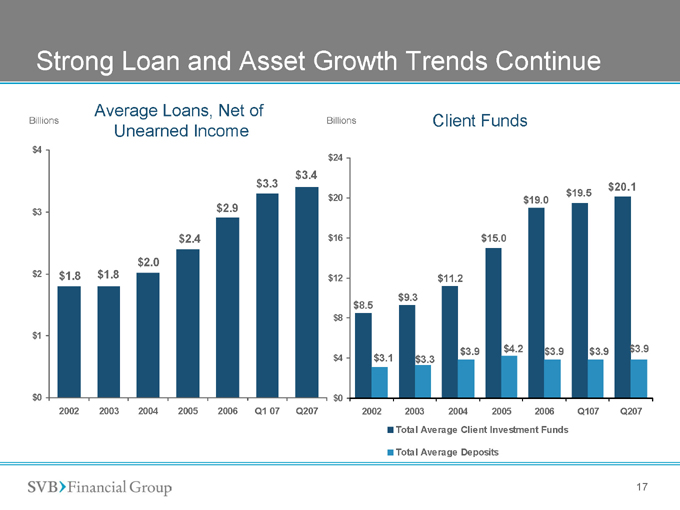
Strong Loan and Asset Growth Trends Continue
Average Loans, Net of
Billions Billions
Unearned Income
$4 $24
$3.4 $3.3
$20
$3 $2.9 $2.4 $16
$2.0
$2 $1.8 $1.8 $12
$8 $1
$4
$0 $0 2002 2003 2004 2005 2006 Q107 Q207
Client Funds $20.1 $19.5 $19.0
$15.0
$11.2 $9.3 $8.5
$3.9 $4.2 $3.9 $3.9 $3.9 $3.1 $3.3
2002 2003 2004 2005 2006 Q107 Q207 Total Average Client Investment Funds
Total Average Deposits
17
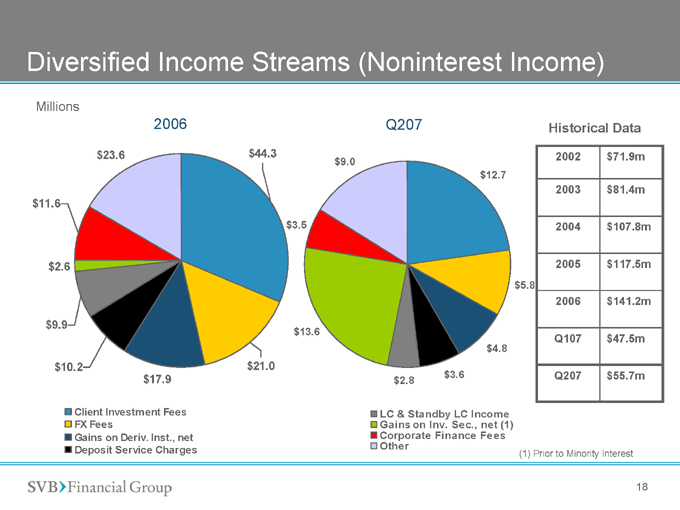
Diversified Income Streams (Noninterest Income)
Millions
2006
Q207
Historical Data
2002 $71.9m
2003 $81.4m
2004 $107.8m
2005 $117.5m
2006 $141.2m
Q107 $47.5m
Q207 $55.7m
Client Investment Fees FX Fees Gains on Deriv. Inst., net Deposit Service Charges
LC & Standby LC Income Gains on Inv. Sec., net (1) Corporate Finance Fees Other
(1) | | Prior to Minority Interest |
$23.6 $44.3 $9.0 $12.7
$11.6 $3.5
$2.6 $5.8
$9.9 $13.6 $4.8 $10.2 $21.0 $17.9 $3.6 $2.8
18
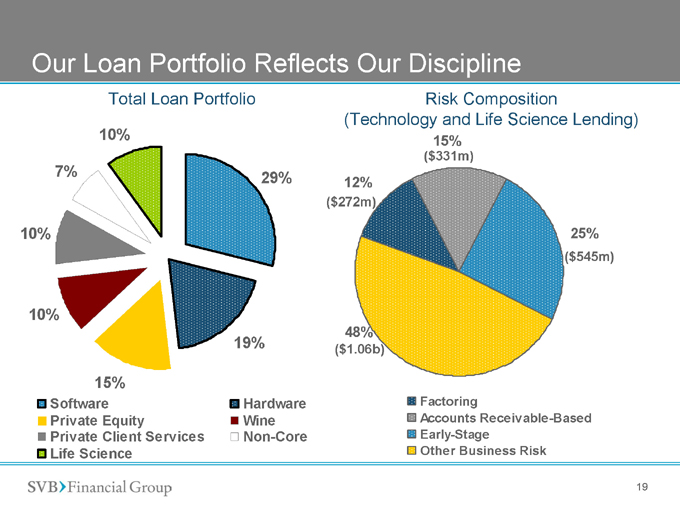
Our Loan Portfolio Reflects Our Discipline
Total Loan Portfolio
10%
7% 29% 10%
10%
19%
15%
Risk Composition
(Technology and Life Science Lending)
15%
($331m)
12%
($272m)
25%
($545m)
48%
($1.06b)
Factoring
Accounts Receivable-Based Early-Stage Other Business Risk
Software
Private Equity Hardware Wine Private Client Services Non-Core Life Science
19
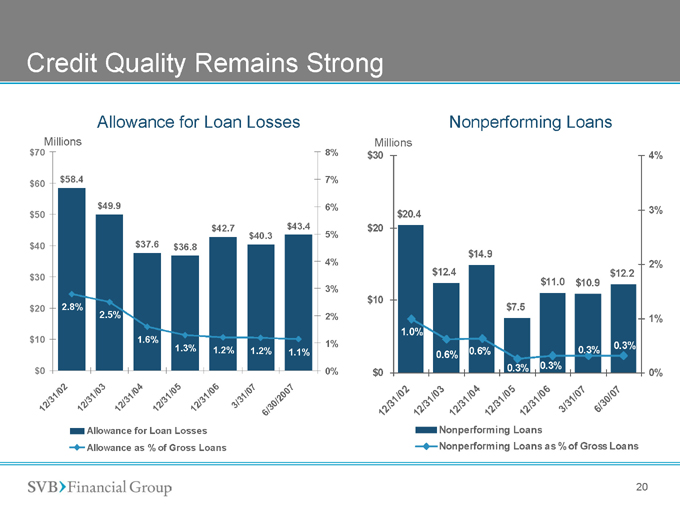
Credit Quality Remains Strong
Allowance for Loan Losses
Millions
$70 8%
$58.4 7% $60
$49.9 6% $50 $42.7 $43.4 $40.3 5%
$40 $37.6 $36.8
4% $30 3%
$20 2.8%
2.5% 2%
$10 1.6% 1% 1.3% 1.2% 1.2% 1.1%
$0 0%
12/31/02
12/31/03
12/31/04
12/31/05
12/31/06
3/30/07
6/30/07
Nonperforming Loans
Millions
$30 4%
$20.4 3% $20
$14.9
2% $12.4 $12.2 $11.0 $10.9 $10 $7.5 1% 1.0% 0.3% 0.6% 0.3% 0.6% 0.3% 0.3%
$0 0%
12/31/02
12/31/03
12/31/04
12/31/05
12/31/06
3/30/07
6/30/07
Allowance for Loan Losses Allowance as % of Gross Loans
Nonperforming Loans
Nonperforming Loans as % of Gross Loans
20
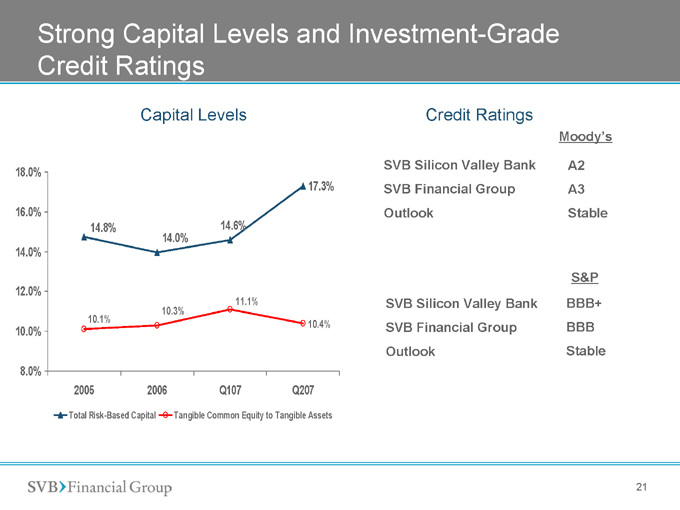
Strong Capital Levels and Investment-Grade Credit Ratings
Capital Levels
Credit Ratings
SVB Silicon Valley Bank SVB Financial Group Outlook
SVB Silicon Valley Bank SVB Financial Group Outlook
Moody’s
A2 A3 Stable
S&P
BBB+ BBB Stable
Total Risk-Based Capital Tangible Common Equity to Tangible Assets
18.0%
17.3%
16.0%
14.8% 14.6% 14.0% 14.0%
12.0%
11.1% 10.3% 10.1%
10.4%
10.0%
8.0%
2005 2006 Q107 Q207
21
In Summary
Strong performance
Continued growth
Solid shareholder returns
Solid credit and investment quality
No direct sub-prime exposure in loan or investment portfolios
Strong liquidity
Prospects for continued growth and multiple levers for driving efficiency and performance
Diversified income streams
Capital management
Performance improvement initiatives
22