
Exhibit 99.2 Strategic Actions/Q1’23 Mid-Quarter Update March 8, 2023

Disclaimer The issuer has filed an automatic shelf registration statement (including a prospectus) with the SEC, which is effective. The issuer has also filed a preliminary prospectus supplement with the SEC for the offerings to which this communication relates. Before you invest, you should read the preliminary prospectus supplement (and, when available, the final prospectus supplement for the relevant offering) and the accompanying prospectus and other documents the issuer has filed with the SEC for more complete information about the issuer and the offerings. You may get these documents for free by visiting EDGAR on the SEC website at www.sec.gov. Alternatively, these documents may be obtained from Goldman Sachs & Co. LLC at 200 West Street, New York, NY 10282, Attention: Prospectus Department, telephone: 1-866-471-2526, facsimile: 212-902-9316 or by emailing prospectus-ny@ny.email.gs.com. This document should be read in conjunction with the Company’s SEC filings. Forward-Looking Statements This presentation contains forward-looking statements within the meaning of the safe harbor provisions of the Private Securities Litigation Reform Act of 1995. Forward-looking statements are subject to known and unknown risks and uncertainties, many of which may be beyond our control. Forward-looking statements are statements that are not historical facts, such as forecasts of our future financial results and condition, expectations for our operations and business, and our underlying assumptions of such forecasts and expectations. In addition, forward-looking statements generally can be identified by the use of such words as “becoming,” “may,” “will,” “should,” “could,” “would,” “predict,” “potential,” “continue,” “anticipate,” “believe,” “estimate,” “assume,” “seek,” “expect,” “plan,” “intend,” the negative of such words or comparable terminology. In this presentation, we make forward-looking statements discussing management’s future expectations and projections about, among other things, our performance outlook, strategic initiatives, plans or objectives for future operations; economic conditions; opportunities in the market; the outlook on our clients' performance; our financial, credit, and business performance, including potential investment gains, loan and deposit growth, mix and yields/rates, and expense levels; our expected effective tax rate; the interest rate environment; accounting impacts and financial results (and the components of such results). Although we believe that the expectations reflected in our forward-looking statements are reasonable, we have based these expectations on our current beliefs as well as our assumptions, and such expectations may not prove to be correct. Because forward-looking statements relate to the future, they are subject to inherent uncertainties, risks and changes in circumstances that are difficult to predict and many of which are outside our control. Our actual results of operations and financial performance could differ significantly from those expressed in or implied by our management’s forward-looking statements. Important factors that could cause our actual results and financial condition to differ from the expectations stated in the forward-looking statements include, among others: market and economic conditions (including elevated inflation levels, sustained interest rate increases, the general condition of the capital and equity markets, and private equity and venture capital investment, IPO, secondary offering, SPAC fundraising, M&A and other financing activity levels) and the associated impact on us (including effects on total client funds and client demand for our commercial and investment banking and other financial services, as well as on the valuations of our investments); changes in credit ratings assigned to us or our subsidiaries; disruptions to the financial markets as a result of current or anticipated military conflicts, including the ongoing military conflict between Russia and Ukraine, terrorism and other geopolitical events; the COVID-19 pandemic, including COVID-19 variants and their effects on the economic and business environments in which we operate, and its effects on our business and operations; the impact of changes from the Biden-Harris administration and the U.S. Congress on the economic environment, capital markets and regulatory landscape, including monetary, tax and other trade policies, as well as regulatory changes from bank regulatory agencies; changes in the volume and credit quality of our loans as well as volatility of our levels of nonperforming assets and charge-offs; the impact of changes in interest rates or market levels or factors affecting or affected by them, including on our loan and investment portfolios and deposit costs; the adequacy of our allowance for credit losses and the need to make provisions for credit losses for any period; the sufficiency of our capital and liquidity positions, and our ability to generate capital or raise capital on favorable terms; changes in the levels or composition of our loans, deposits and client fund balances; changes in the performance or equity valuations of funds or companies in which we have invested or hold derivative instruments or equity warrant assets; variations from our expectations as to factors impacting our cost structure; changes in our assessment of the creditworthiness or liquidity of our clients or unanticipated effects of credit concentration risks which create or exacerbate deterioration of such creditworthiness or liquidity; variations from our expectations as to factors impacting the timing and level of employee share-based transactions; the occurrence of fraudulent activity, including breaches of our information security or cyber security-related incidents; business disruptions and interruptions due to natural disasters and other external events; the impact on our reputation and business from our interactions with business partners, counterparties, service providers and other third parties; the expansion of our business internationally, and the impact of geopolitical events and international market and economic events on us; the effectiveness of our risk management framework and qualitative and quantitative models; unexpected delays or expenses associated with executing against our climate-related commitments and goals; the quality and availably of carbon emissions data; our ability to maintain or increase our market share, including through successfully implementing our business strategy and undertaking new business initiatives and realizing the anticipated benefits of such strategies and initiatives, including the continuing integration of Boston Private, expansion of SVB Private and growth and expansion of SVB Securities; unfavorable resolution of legal proceedings or claims, as well as legal or regulatory proceedings or governmental actions; variations from our expectations as to factors impacting our estimate of our full-year effective tax rate; changes in applicable accounting standards and tax laws; and regulatory or legal changes (including changes to the laws and regulations that apply to us as a result of the growth of our business) and their impact on us. We refer you to the documents the Company files from time to time with the Securities and Exchange Commission, including (i) our latest Annual Report on Form 10-K, (ii) our most recent Quarterly Report on Form 10-Q, and (iii) our most recent earnings release filed on Form 8-K. These documents contain and identify important risk factors that could cause the Company’s actual results to differ materially from those contained in our projections or other forward-looking statements. All forward-looking statements included in this presentation are made only as of the date of this presentation. We assume no obligation and do not intend to revise or update any forward-looking statements contained in this presentation, except as required by law. Use of Non-GAAP Financial Measures To supplement our financial disclosures that are presented in accordance with GAAP, we use certain non-GAAP measures of financial performance (including, but not limited to, non-GAAP core fee income, non-GAAP SVB Securities revenue, non-GAAP core fee income plus non-GAAP SVB Securities revenue, non-GAAP net gains on investment securities, non-GAAP non-marketable and other equity securities net of investments in qualified affordable housing projects and noncontrolling interests in non-marketable securities, and non- GAAP financial ratios) of financial performance. These supplemental performance measures may vary from, and may not be comparable to, similarly titled measures by other companies in our industry. Non-GAAP financial measures are not in accordance with, or an alternative for, GAAP. Generally, a non-GAAP financial measure is a numerical measure of a company’s performance that either excludes or includes amounts that are not normally excluded or included in the most directly comparable measure calculated and presented in accordance with GAAP. A non-GAAP financial measure may also be a financial metric that is not required by GAAP or other applicable requirement. We believe that these non-GAAP financial measures, when taken together with the corresponding GAAP financial measures (as applicable), provide meaningful supplemental information regarding our performance by: (i) excluding amounts attributable to noncontrolling interests for which we effectively do not receive the economic benefit or cost of, where indicated, or (ii) providing additional information used by management that is not otherwise required by GAAP or other applicable requirements. Our management uses, and believes that investors benefit from referring to, these non-GAAP financial measures in assessing our operating results and when planning, forecasting and analyzing future periods. These non-GAAP financial measures also facilitate a comparison of our performance to prior periods. We believe these measures are frequently used by securities analysts, investors and other interested parties in the evaluation of companies in our industry. However, these non-GAAP financial measures should be considered in addition to, not as a substitute for or superior to, net income or other financial measures prepared in accordance with GAAP. In the “Non-GAAP reconciliations” section of this presentation, we have provided reconciliations of, where applicable, the most comparable GAAP financial measures to the non- GAAP financial measures used in this presentation, or a reconciliation of the non-GAAP calculation of the financial measure. Please refer to that section for more information. STRATEGIC ACTIONS/ Q1’23 MID-QUARTER UPDATE 2
Contents Overview of strategic actions 4 Q1’23 mid-quarter performance update 15 About SVB 20 Non-GAAP reconciliations 28 STRATEGIC ACTIONS/ Q1’23 MID-QUARTER UPDATE 3

Overview of strategic actions STRATEGIC ACTIONS/ Q1’23 MID-QUARTER UPDATE 4
Strategic actions to strengthen our financial position and enhance profitability and financial flexibility now and in the future • Today, we took strategic actions to strengthen our financial position – repositioning SVB’s balance sheet to increase asset sensitivity to take advantage of the potential for higher short-term rates, partially lock in funding costs, better protect net interest income (NII) and net interest margin (NIM), and enhance profitability. • We have sold substantially all of our Available for Sale (AFS) securities portfolio with the intention of reinvesting the proceeds, and commenced an underwritten public offering, seeking to raise approximately $2.25 billion between common equity and mandatory convertible preferred shares. As a part of this capital raise, General Atlantic, a leading global growth equity fund and longstanding client of SVB, has committed to invest $500 million on the same economic terms as our common offering. • Our financial position enables us to take these strategic actions, which are intended to further bolster that position now and over the long term. • We are taking these actions because we expect continued higher interest rates, pressured public and private markets, and elevated cash burn levels from our clients as they invest in their businesses. • We are experienced at navigating market cycles and are well positioned to serve our clients through market volatility, with a high-quality, liquid balance sheet and strong capital ratios. STRATEGIC ACTIONS/ Q1’23 MID-QUARTER UPDATE 5

Strategic actions to reposition balance sheet for current rate environment AFS Sale Size $21 billion Intended benefits: Securities Sold US Treasuries and Agency securities AFS Portfolio 1.79% Yield of Securities Sold Sale Estimated +$450M improvement 3.6-year Duration 1, 3, 4 in annualized NII (post-tax) Preliminary Estimated $(1.8) billion (after-tax) 1 Realized Loss ü Increase balance sheet flexibility and asset Common Stock $1.25 billion sensitivity $500 million commitment from General Atlantic to Capital Concurrent Private purchase restricted common stock at the public ü Immediately accretive to EPS (excluding Offerings Placement offering price in a separate private transaction (Base Size) realized loss) and improves ROE going 1, 3, 4 Mandatory Convertible forward $500 million Preferred Stock ü Attractive net pay-back period of Net Capital 2 SVBFG CET1 Ratio +0.15% 1, 3, 4, 5 approximately 3 years Ratio Impact Increase Fed cash target to 4-8% of total deposits Increase Fed cash ü Maintain strong capital ratios (from 4-6%) Actions to Partially lock-in term Increase term borrowings from $15B to $30B ü Partially lock-in funding costs and enhance Increase Asset 3 3 funding Hedge with forward starting swaps 3 liquidity Sensitivity 3 Buy short-duration USTs 3 Reconstruct AFS portfolio 3 Hedge with receive-floating swaps 1. Based on sale of $21B AFS securities executed on March 8, 2023. 2. Assumes successful offering of $1.75 billion in common stock inclusive of concurrent private placement. 3. “Actions to increase asset sensitivity” supporting estimated NII improvement are in progress and not yet completed. 4. These measures are forward-looking; are subject to significant business, economic, regulatory and competitive uncertainties and contingencies, many of which are beyond the control of the Company and its management; and are based upon assumptions with respect to future decisions, which are subject to change. Actual results may vary and those variations may be material. See Recent Developments on page 14 of this presentation regarding potential Moody’s ratings actions. Please also refer to “Forward-Looking Statements” in this presentation and our “Risk Factors,” under Part I, Item 1A of our latest Annual Report on Form 10-K for other factors that may STRATEGIC ACTIONS/ cause our results to differ materially from the expectations presented in our outlook. Q1’23 MID-QUARTER UPDATE 6 5. Net pay-back period is inclusive of estimated $165M annualized economic tax loss benefit from AFS Portfolio Sale. Assumes economic tax loss benefit is recognized over the duration of the securities sold.
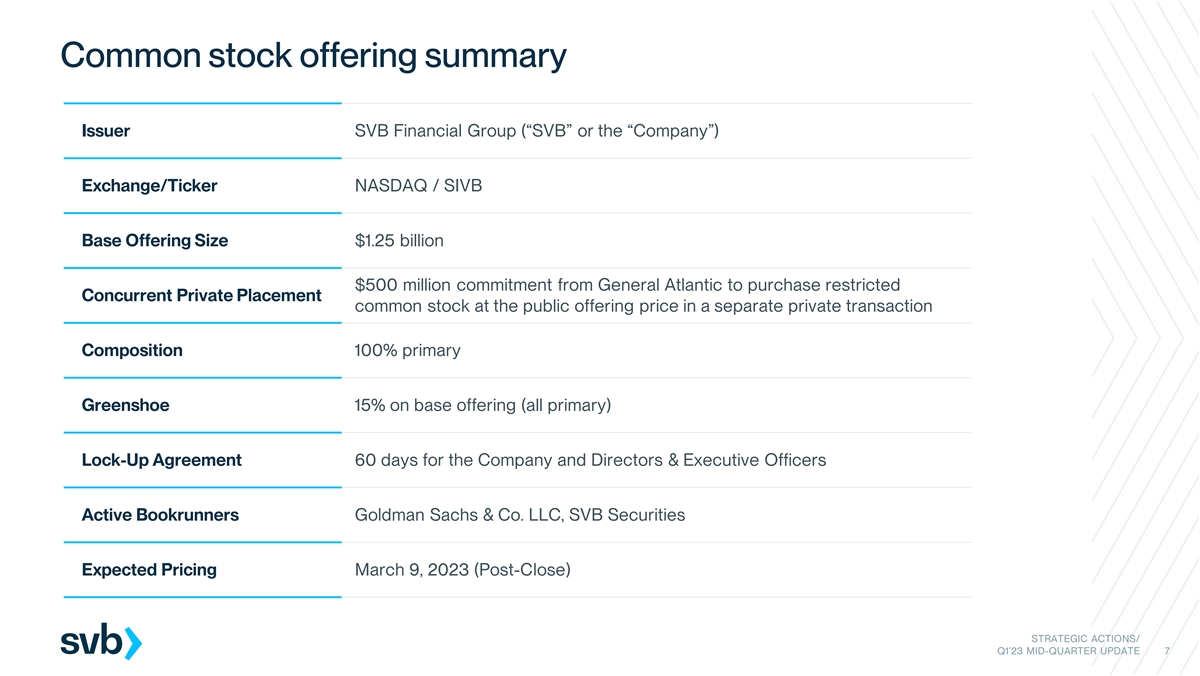
Common stock offering summary Issuer SVB Financial Group (“SVB” or the “Company”) Exchange/Ticker NASDAQ / SIVB Base Offering Size $1.25 billion $500 million commitment from General Atlantic to purchase restricted Concurrent Private Placement common stock at the public offering price in a separate private transaction Composition 100% primary Greenshoe 15% on base offering (all primary) Lock-Up Agreement 60 days for the Company and Directors & Executive Officers Active Bookrunners Goldman Sachs & Co. LLC, SVB Securities Expected Pricing March 9, 2023 (Post-Close) STRATEGIC ACTIONS/ Q1’23 MID-QUARTER UPDATE 7

Mandatory convertible preferred stock offering summary Issuer SVB Financial Group (“SVB” or the “Company”) Exchange/Ticker NASDAQ / SIVB Base Offering Size $500 million th Depositary shares each representing a 1/20 interest in a share of mandatory Mandatory Convertible convertible preferred stock ($1,000 liquidation preference per share of Structure preferred stock) Composition 100% primary Dividend Range 6.00 – 6.50% Premium Range 20.0 – 25.0% Greenshoe 15% (all primary) Lock-Up Agreement 60 days for the Company and Directors & Executive Officers Active Bookrunner Goldman Sachs & Co. LLC, SVB Securities Expected Pricing March 9, 2023 (Post-Close) STRATEGIC ACTIONS/ Q1’23 MID-QUARTER UPDATE 8
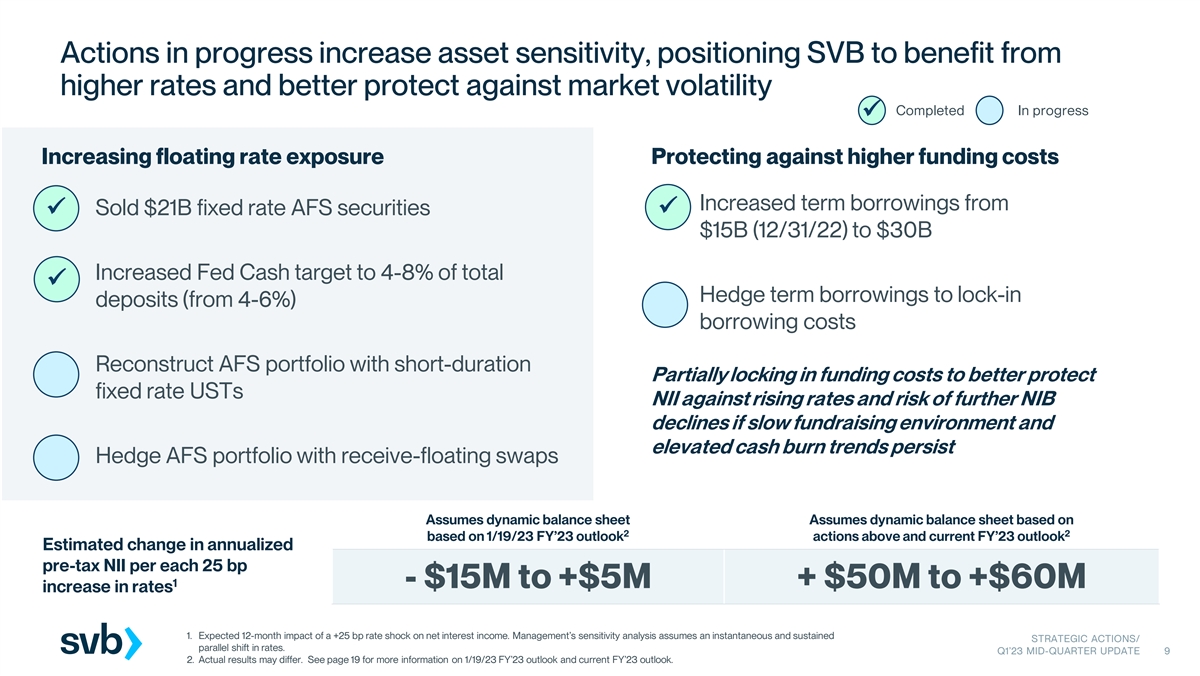
Actions in progress increase asset sensitivity, positioning SVB to benefit from higher rates and better protect against market volatility Completed In progress ü Increasing floating rate exposure Protecting against higher funding costs 1. Increased term borrowings from 1. Sold $21B fixed rate AFS securitiesü ü $15B (12/31/22) to $30B 2. Increased Fed Cash target to 4-8% of total ü 2. Hedge term borrowings to lock-in deposits (from 4-6%) borrowing costs 3. Reconstruct AFS portfolio with short-duration Partially locking in funding costs to better protect fixed rate USTs NII against rising rates and risk of further NIB declines if slow fundraising environment and elevated cash burn trends persist 4. Hedge AFS portfolio with receive-floating swaps Assumes dynamic balance sheet Assumes dynamic balance sheet based on 2 2 based on 1/19/23 FY’23 outlook actions above and current FY’23 outlook Estimated change in annualized pre-tax NII per each 25 bp 1 - $15M to +$5M + $50M to +$60M increase in rates 1. Expected 12-month impact of a +25 bp rate shock on net interest income. Management’s sensitivity analysis assumes an instantaneous and sustained STRATEGIC ACTIONS/ parallel shift in rates. Q1’23 MID-QUARTER UPDATE 9 2. Actual results may differ. See page 19 for more information on 1/19/23 FY’23 outlook and current FY’23 outlook.

Our financial position enables us to take these strategic actions Ample liquidity Strong capital Strong credit track record and asset quality • High-quality, liquid balance sheet • Strong capital ratios provide solid • Strong credit performance with very low loan-to-deposit ratio foundation to navigate shifting throughout cycles economic conditions while • Multiple levers to manage liquidity • Vast majority of assets in high-quality investing in our business position to sustain a continued investments and cycle-tested low slowdown credit loss lending* • Deep bench of recession-tested leaders supported by strong global team STRATEGIC ACTIONS/ * Based on cash, fixed income investment portfolio and Global Fund Banking and Private Bank loan portfolios. Q1’23 MID-QUARTER UPDATE 10
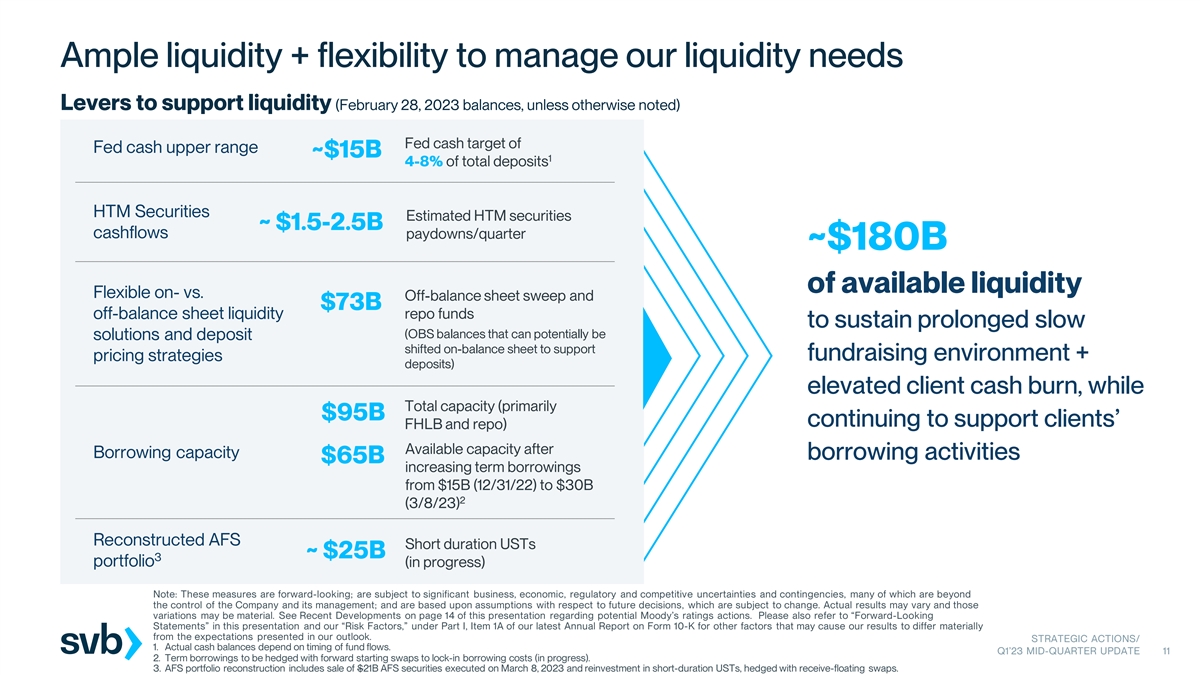
Ample liquidity + flexibility to manage our liquidity needs Levers to support liquidity (February 28, 2023 balances, unless otherwise noted) Fed cash target of Fed cash upper range ~$15B 1 4-8% of total deposits HTM Securities Estimated HTM securities ~ $1.5-2.5B cashflows paydowns/quarter ~$180B of available liquidity Flexible on- vs. Off-balance sheet sweep and $73B off-balance sheet liquidity repo funds to sustain prolonged slow (OBS balances that can potentially be solutions and deposit shifted on-balance sheet to support fundraising environment + pricing strategies deposits) elevated client cash burn, while Total capacity (primarily $95B continuing to support clients’ FHLB and repo) Available capacity after Borrowing capacity borrowing activities $65B increasing term borrowings from $15B (12/31/22) to $30B 2 (3/8/23) Reconstructed AFS Short duration USTs ~ $25B 3 portfolio (in progress) Note: These measures are forward-looking; are subject to significant business, economic, regulatory and competitive uncertainties and contingencies, many of which are beyond the control of the Company and its management; and are based upon assumptions with respect to future decisions, which are subject to change. Actual results may vary and those variations may be material. See Recent Developments on page 14 of this presentation regarding potential Moody’s ratings actions. Please also refer to “Forward-Looking Statements” in this presentation and our “Risk Factors,” under Part I, Item 1A of our latest Annual Report on Form 10-K for other factors that may cause our results to differ materially from the expectations presented in our outlook. STRATEGIC ACTIONS/ 1. Actual cash balances depend on timing of fund flows. Q1’23 MID-QUARTER UPDATE 11 2. Term borrowings to be hedged with forward starting swaps to lock-in borrowing costs (in progress). 3. AFS portfolio reconstruction includes sale of $21B AFS securities executed on March 8, 2023 and reinvestment in short-duration USTs, hedged with receive-floating swaps.
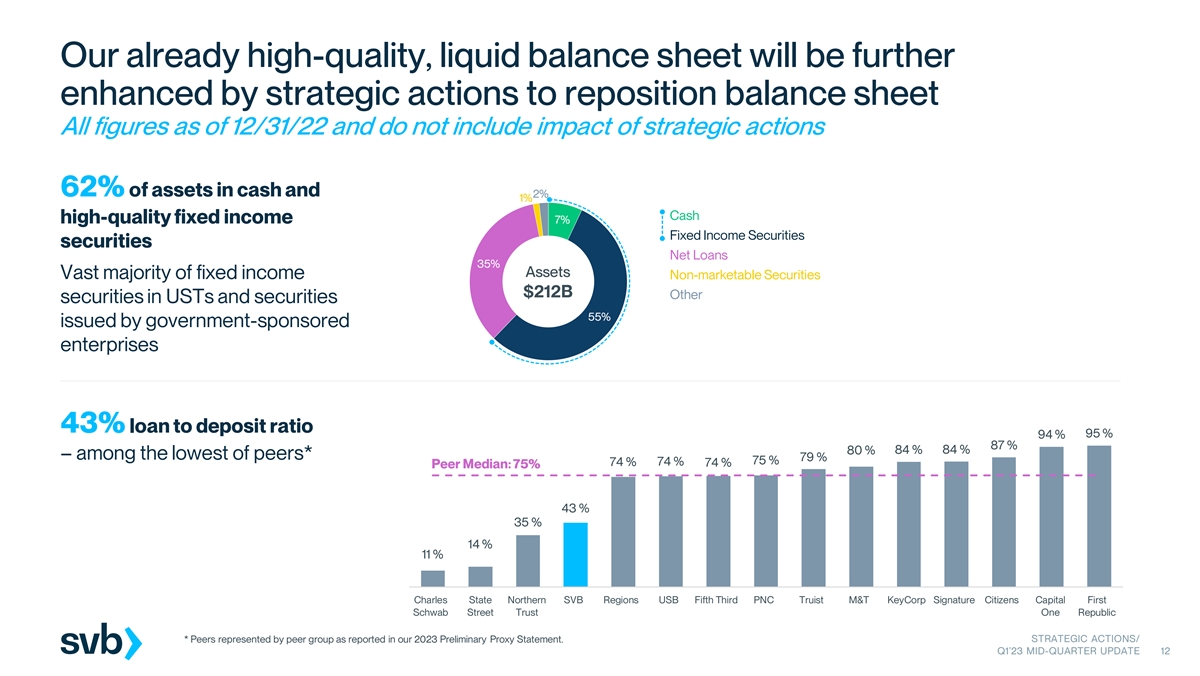
Our already high-quality, liquid balance sheet will be further enhanced by strategic actions to reposition balance sheet All figures as of 12/31/22 and do not include impact of strategic actions 62% of assets in cash and 2% 1% Cash high-quality fixed income 7% Fixed Income Securities securities Net Loans 35% Assets Vast majority of fixed income Non-marketable Securities $212B Other securities in USTs and securities 55% issued by government-sponsored enterprises 120 % 43% loan to deposit ratio 95 % 100 % 94 % 87 % 80 % 84 % 84 % – among the lowest of peers* 79 % 75 % 74 % 74 % 74 % Peer Median: 75% 80 % 60 % 43 % 35 % 40 % 14 % 11 % 20 % 0 % Charles State Northern SVB Regions USB Fifth Third PNC Truist M&T KeyCorp Signature Citizens Capital First Schwab Street Trust One Republic STRATEGIC ACTIONS/ * Peers represented by peer group as reported in our 2023 Preliminary Proxy Statement. Q1’23 MID-QUARTER UPDATE 12
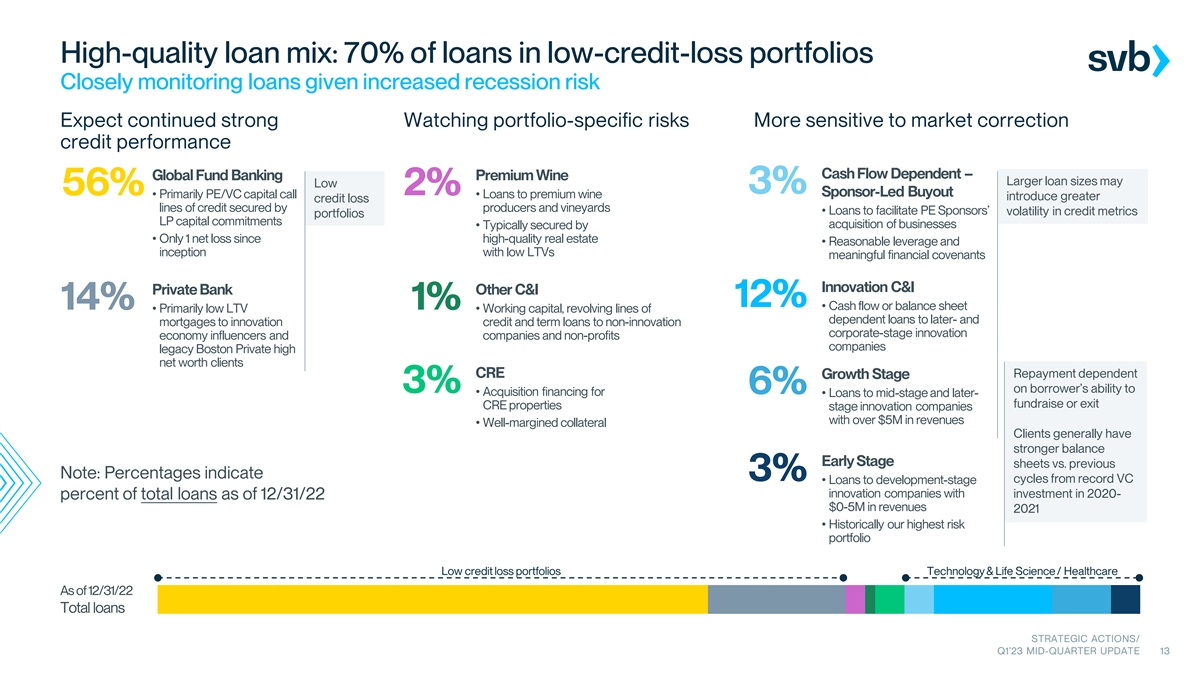
High-quality loan mix: 70% of loans in low-credit-loss portfolios Closely monitoring loans given increased recession risk Expect continued strong Watching portfolio-specific risks More sensitive to market correction credit performance Cash Flow Dependent – Global Fund Banking Premium Wine Larger loan sizes may Low 3% 56% 2% Sponsor-Led Buyout • Primarily PE/VC capital call • Loans to premium wine introduce greater credit loss lines of credit secured by producers and vineyards • Loans to facilitate PE Sponsors’ volatility in credit metrics portfolios LP capital commitments acquisition of businesses • Typically secured by • Only 1 net loss since high-quality real estate • Reasonable leverage and inception with low LTVs meaningful financial covenants Innovation C&I Private Bank Other C&I 12% 14% 1% • Cash flow or balance sheet • Primarily low LTV • Working capital, revolving lines of dependent loans to later- and mortgages to innovation credit and term loans to non-innovation corporate-stage innovation economy influencers and companies and non-profits companies legacy Boston Private high net worth clients CRE Repayment dependent Growth Stage 3% on borrower’s ability to 6% • Acquisition financing for • Loans to mid-stage and later- fundraise or exit CRE properties stage innovation companies with over $5M in revenues • Well-margined collateral Clients generally have stronger balance Early Stage sheets vs. previous Note: Percentages indicate 3% cycles from record VC • Loans to development-stage innovation companies with investment in 2020- percent of total loans as of 12/31/22 $0-5M in revenues 2021 • Historically our highest risk portfolio Low credit loss portfolios Technology & Life Science / Healthcare As of 12/31/22 Total loans STRATEGIC ACTIONS/ Q1’23 MID-QUARTER UPDATE 13

Strong capital position – well-above regulatory minimums and peers 16.40% 15.62% SVBFG 12.21% SVBFG pro forma Recent developments 12/31/22 pro forma 7.99% 10.50% We have been in dialogue 8.50% Regulatory capital ratios 7.00% minimum with Moody's, who we understand are 4.00% in the process of considering (includes impact of AFS Common Tier 1 Total Tier 1 potential ratings actions with respect Equity Tier 1 Capital Capital Leverage securities sale and capital to SVB, which could include a 1, 2 issuance) 3 SVBFG 12.05% 15.40% 16.18% 8.11% negative outlook, a downgrade of one 12/31/22 or potentially two notches and/or 4 Peer Median 9.66% 11.16% 12.81% 8.53% placing our ratings on review for such 12/31/22 a downgrade. In addition, it is possible that S&P also takes action, Targeting 7-8% which could include a 14.68% Bank Tier 1 leverage Silicon Valley 13.88% 13.88% SVB downgrade. Although the capital Bank offerings and the AFS 7.11% 10.50% pro forma portfolio actions, if successful, should Regulatory 8.50% 7.00% minimum improve our profile under rating capital ratios 4.00% agency criteria, an adverse ratings Common Tier 1 Total Tier 1 action remains likely and could occur (includes impact of AFS Equity Tier 1 Capital Capital Leverage at any time, including prior to closing. 1 securities sale) 3 SVB 15.26% 15.26% 16.05% 7.96% 12/31/22 1. Capital ratios as of December 31, 2022 adjusted to include impact of sale of $21B AFS securities executed on March 8, 2023. STRATEGIC ACTIONS/ 2. Assumes offering proceeds of $1.75 billion in CET1 qualifying capital for SVBFG. No capital contributions from SVBFG to Silicon Valley Bank assumed. Q1’23 MID-QUARTER UPDATE 14 3. As of December 31, 2022 (unadjusted). 4. Peers represented by peer group as reported in our 2023 Preliminary Proxy Statement.

Q1’23 mid-quarter performance update Reflects preliminary results as of and through February 28, 2023 and does not reflect the impact of the sale of substantially all of the AFS portfolio securities except as noted. Our registered independent public accounting firm has not reviewed or performed any procedures, and cannot provide any assurance, with respect to these mid-quarter results. Mid-quarter results are not necessarily indicative of future results as of and for the quarter ending March 31, 2023 or for any future period. Actual results will depend on completion of the quarter and finalizing of financial data. Actual quarterly results may differ materially. STRATEGIC ACTIONS/ Q1’23 MID-QUARTER UPDATE 15

Elevated client cash burn pressuring balance of fund flows 1 U.S. VC-backed investment activity As expected, slowing VC 94 100 89 $B 83 80 deployment has reduced client 79 75 80 fund inflows QTD 60 49 46 47 41 39 38 38 37 36 34 30 • Q1’23 U.S. VC investment is on track to 40 20 decline 15-20% vs. Q4’22, in-line with our expectations - Q1’19 Q2’19 Q3’19 Q4’19 Q1’20 Q2’20 Q3’20 Q4’20 Q1’21 Q2’21 Q3’21 Q4’21 Q1’22 Q2’22 Q3’22 Q4’22 Q1’23e Q1'19 Q2'19 Q3'19 Q4'19 Q1'20 Q2'20 Q3'20 Q4'20 Q1'21 Q2'21 Q3'21 Q4'21 Q1'22 Q2'22 Q3'22 Q4'22 We had expected modest, 2 QoQ period-end total client funds (“TCF”) by client activity (management’s approximation) progressive declines in client cash $B burn, but burn has not moderated 45.0 42.4 41.0 QTD, pressuring the balance of 31.5 27.9 21.1 21.7 fund flows 7.9 8.9 QoQ period-end 6.6 5.2 4.9 -1.9 TCF change (+/-) • Client cash burn remains ~2x higher than -12.2 -18.2 pre-2021 levels and has not adjusted to the -18.6 -25.5 2 slower fundraising environment Other inflows (primarily operating inflows) Current 2023 expectations Public fundraising Private fundraising • Cash burn remains elevated for 1H’23, Outflows (primarily cash burn) with modest declines in 2H’23 • Still expect ~$120-140B of U.S. VC 3 investment in 2023 Q1’19 Q2’19 Q3’19 Q4’19 Q1’20 Q2’20 Q3’20 Q4’20 Q1’21 Q2’21 Q3’21 Q4’21 Q1’22 Q2’22 Q3’22 Q4’22 Q1’23e Note: Q1’23 estimates include January and February actuals and estimates for March. Data is preliminary and is subject to change. 1. VC data sourced from PitchBook. Prior period investment data may be revised based on updates to Pitchbook’s proprietary back-end data set and filters. 2. Determination of TCF changes by client activity is an illustrative approximation based on management assumptions and analysis of SVB client and PitchBook data; STRATEGIC ACTIONS/ assumes each client's total change in period-end balances is attributed to one of the following activities: fundraising, other inflows or outflows. Prior period estimates may be revised based on updates to management assumptions and analysis. Q1’23 MID-QUARTER UPDATE 16 3. Management’s analysis.

While the fundamentals of our business remain healthy, the challenging market and rate environment has pressured QTD performance, with implications to our 2023 outlook 2/28/23 QTD financial highlights Continued underlying momentum Strong client engagement Helping clients navigate current market conditions $334B $326B $74B $74B Strong core fee income Consistent with expectations; higher rate environment Average client funds EOP client funds Average loans EOP loans supporting client investment fee margins $169B Deposits $165B Deposits $165B OBS $161B OBS Healthy Tech borrowing Clients continue to opt for debt over raising equity at pressured valuations Credit within guidance NCO outlook unchanged $627M 1.89% $224M $74M Record PE/VC dry powder 1 2 Global PE/VC funds have over $2.6T dry powder to Net interest income Net interest margin Core fee income SVB Securities 2, 3 4 revenue invest 1. Net interest income presented on a fully taxable equivalent basis. STRATEGIC ACTIONS/ 2. Non-GAAP financial measure. See “Use of non-GAAP Financial Measures” and our non-GAAP reconciliations at the end of this presentation. 3. Represents investment banking revenue and commissions. Q1’23 MID-QUARTER UPDATE 17 4. Source: Preqin. Global VC dry powder was $0.6T and global PE dry powder was $2.0T as of January 3, 2023.
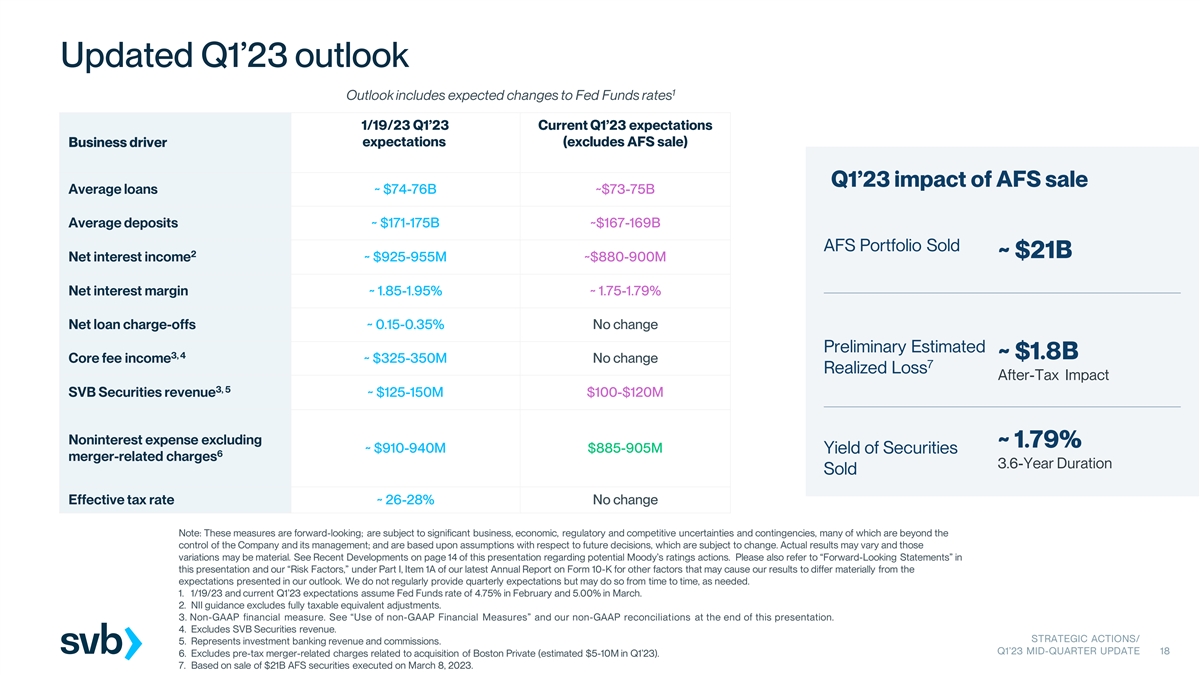
Updated Q1’23 outlook 1 Outlook includes expected changes to Fed Funds rates 1/19/23 Q1’23 Current Q1’23 expectations expectations (excludes AFS sale) Business driver Q1’23 impact of AFS sale Average loans ~ $74-76B ~$73-75B Average deposits ~ $171-175B ~$167-169B AFS Portfolio Sold 2 ~ $21B Net interest income ~ $925-955M ~$880-900M Net interest margin ~ 1.85-1.95% ~ 1.75-1.79% Net loan charge-offs ~ 0.15-0.35% No change Preliminary Estimated 3, 4 ~ $1.8B Core fee income ~ $325-350M No change 7 Realized Loss After-Tax Impact 3, 5 SVB Securities revenue ~ $125-150M $100-$120M Noninterest expense excluding ~ 1.79% ~ $910-940M $885-905M Yield of Securities 6 merger-related charges 3.6-Year Duration Sold Effective tax rate ~ 26-28% No change Note: These measures are forward-looking; are subject to significant business, economic, regulatory and competitive uncertainties and contingencies, many of which are beyond the control of the Company and its management; and are based upon assumptions with respect to future decisions, which are subject to change. Actual results may vary and those variations may be material. See Recent Developments on page 14 of this presentation regarding potential Moody’s ratings actions. Please also refer to “Forward-Looking Statements” in this presentation and our “Risk Factors,” under Part I, Item 1A of our latest Annual Report on Form 10-K for other factors that may cause our results to differ materially from the expectations presented in our outlook. We do not regularly provide quarterly expectations but may do so from time to time, as needed. 1. 1/19/23 and current Q1’23 expectations assume Fed Funds rate of 4.75% in February and 5.00% in March. 2. NII guidance excludes fully taxable equivalent adjustments. 3. Non-GAAP financial measure. See “Use of non-GAAP Financial Measures” and our non-GAAP reconciliations at the end of this presentation. 4. Excludes SVB Securities revenue. STRATEGIC ACTIONS/ 5. Represents investment banking revenue and commissions. Q1’23 MID-QUARTER UPDATE 18 6. Excludes pre-tax merger-related charges related to acquisition of Boston Private (estimated $5-10M in Q1’23). 7. Based on sale of $21B AFS securities executed on March 8, 2023.

Updated FY’23 outlook 1 Outlook includes expected changes to Fed Funds rates Impact of AFS Sale and actions 1/19/23 Current FY’22 7 Business driver FY’23 vs. FY’22 outlook FY’23 vs. FY’22 outlook to increase asset sensitivity results (excludes AFS sale) Low double digits % High single digits % Improvement in Average loans $70.3B + $450M (post-tax) growth growth annualized NII Low double digits Average deposits $185.7B Mid single digits % decline % decline FY’23 NII outlook Low twenties % decline 2 Net interest income $4,522M High teens % decline Mid thirties % decline with AFS sale Net interest margin 2.16% 1.75-1.85% 1.45% - 1.55% ~1.65-1.75% FY’23 NIM outlook with AFS sale Net loan charge-offs 0.10% 0.15-0.35% No change 3, 4 Core fee income $1,181M Low teens % growth High teens % growth 8 ROE 3, 5 + ~ 2% SVB Securities revenue $518M $540-590M $480-$530M Noninterest expense excluding merger-related $3,571M Low single digits % growth No Change Accretive EPS 6 charges Immediately (excluding realized loss) Effective tax rate 25.2% 26-28% No change Note: These measures are forward-looking; are subject to significant business, economic, regulatory and competitive uncertainties and contingencies, many of which are beyond the control of the Company and its management; and are based upon assumptions with respect to future decisions, which are subject to change. Actual results may vary and those variations may be material. See Recent Developments on page 14 of this presentation regarding potential Moody’s ratings actions. Please also refer to “Forward-Looking Statements” in this presentation and our “Risk Factors,” under Part I, Item 1A of our latest Annual Report on Form 10-K for other factors that may cause our results to differ materially from the expectations presented in our outlook. 1. 1/19/23 FY’23 outlook assumes Fed Funds rate of 4.75% in February and 5.00% in March. Current Q1’23 expectations assume Fed Funds at 5.00% in March, 5.25% in May and 5.50% in June. 2. NII is presented on a fully taxable equivalent basis, while NII guidance excludes fully taxable equivalent adjustments. 3. Non-GAAP financial measure. See “Use of non-GAAP Financial Measures” and our non-GAAP reconciliations at the end of this presentation. 4. Excludes SVB Securities revenue. 5. Represents investment banking revenue and commissions. 6. Excludes pre-tax merger-related charges related to acquisition of Boston Private ($50M incurred in FY’22, estimated $10-15M for FY’23). STRATEGIC ACTIONS/ 7. Based on sale of $21B AFS securities executed on March 8, 2023 and “Actions to increase asset sensitivity” (see page 6). “Actions to increase asset sensitivity” supporting estimated Q1’23 MID-QUARTER UPDATE 19 NII improvement are in progress and not yet completed. 8. Assumes successful offering of $1.75B in common stock, and $500M mandatory convertible preferred stock.

About SVB STRATEGIC ACTIONS/ Q1’23 MID-QUARTER UPDATE 20
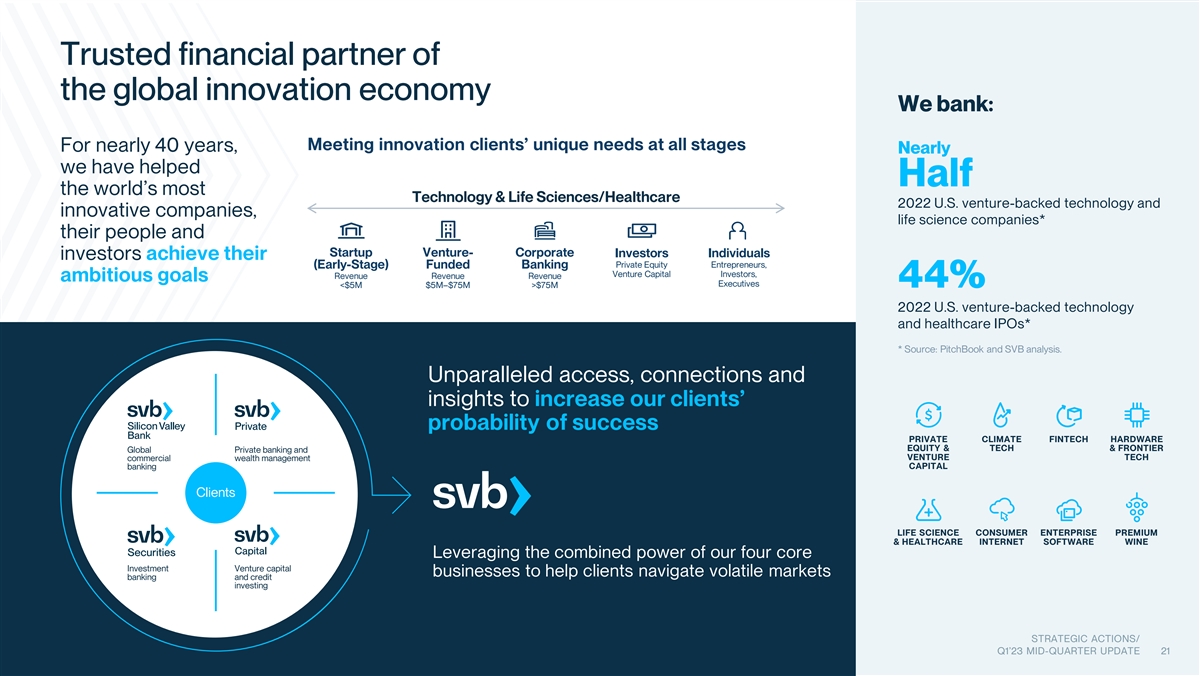
Trusted financial partner of the global innovation economy We bank: Meeting innovation clients’ unique needs at all stages For nearly 40 years, Nearly we have helped Half the world’s most Technology & Life Sciences/Healthcare 2022 U.S. venture-backed technology and innovative companies, life science companies* their people and Startup Venture- Corporate Investors Individuals investors achieve their Private Equity Entrepreneurs, (Early-Stage) Funded Banking Venture Capital Investors, Revenue Revenue Revenue ambitious goals Executives <$5M $5M–$75M >$75M 44% 2022 U.S. venture-backed technology and healthcare IPOs* * Source: PitchBook and SVB analysis. Unparalleled access, connections and insights to increase our clients’ probability of success PRIVATE CLIMATE FINTECH HARDWARE EQUITY & TECH & FRONTIER Global Private banking and VENTURE TECH commercial wealth management banking CAPITAL Clients LIFE SCIENCE CONSUMER ENTERPRISE PREMIUM & HEALTHCARE INTERNET SOFTWARE WINE Leveraging the combined power of our four core Investment Venture capital businesses to help clients navigate volatile markets banking and credit investing STRATEGIC ACTIONS/ Q1’23 MID-QUARTER UPDATE 21

Long-term tailwinds supporting the innovation economy remain intact Innovation drives economic U.S. VC investment, company formation and the Digital Economy’s share of GDP growth 1 2 Digital Economy’s share of GDP U.S. VC Investment U.S. VC-Backed Company Formation (TTM) 2 (in $ Billions TTM) • The innovation economy grew at 2.4x $400 the rate of the overall U.S. economy 1 7000 between 2000-2020 , and COVID-19 has since accelerated digital adoption $350 10.2% 6000 $300 Great companies are founded 9.2% across business cycles 5000 8.7% $250 • 127 unicorns were founded during the 4000 Global Financial Crisis and 64 during 7.8% $200 4 the VC recalibration 3000 $150 The innovation economy is better-positioned today to 2000 6.0% $100 weather a downturn than in past cycles 1000 $50 • The innovation economy was 3.5x 1 larger in 2020 than 2000 0 $- 1995 1996 1997 1998 1999 2000 2001 2002 2003 2004 2005 2006 2007 2008 2009 2010 2011 2012 2013 2014 2015 2016 2017 2018 2019 2020 2021 2022 • PE and VC firms globally have $2.6T Dotcom Bubble Global Financial VC Early Fed dry powder to invest, 8.7x more than 3 Crash Crisis Recalibration COVID-19 Tightening 5 in 2000 1. Digital economy’s share of GDP as defined and measured by the Bureau of Economic Analysis used as a proxy for the innovation economy. 2. VC investment and company formation data sourced from PitchBook. First VC round raised used as a proxy for company formation. Prior period investment data may be revised based on updates to Pitchbook’s proprietary back-end data set and filters. STRATEGIC ACTIONS/ 3. Pullback in VC investment. 4. Unicorn data sourced from PitchBook. Includes U.S. VC-backed companies that have reached and maintained at least a $1B post-money valuation through time of exit. Q1’23 MID-QUARTER UPDATE 22 5. Source: Preqin. Global VC dry powder was $0.6T and global PE dry powder was $2.0T as of January 3, 2023.

Robust client funds growth over the long term FY’22 vs. FY’21 YoY growth On-balance sheet deposits Annual total client funds growth rate Annual U.S. VC investment growth rate Average total Average client funds +14% (positive,negative) (positive, negative) Off-balance sheet client funds client funds U.S. VC investment -31% (“TCF”) 120% 101% $B 375 100% 71% 62% 47% 81% 41% 31% 29% 27% 25% 329 22% 20% 19% 16% 16% 14% 15% 14% 9% 9% 6% 2% -4% -12% 33% 31% 0% 24% 20% -31% 17% 16% 15% 15% 14% 10% 9% 7% 3% -3% -3% -7% -8% -22% -25% 186 148 -50% -100% 192 189 181 147 75 -200% 123 55 94 117 48 82 76 92 -300% 43 58 39 75 37 44 38 33 28 28 51 26 24 25 20 21 18 43 15 39 17 5 14 14 4 13 12 12 4 9 12 4 4 5 30 4 3 3 24 20 21 17 16 20 16 18 10 9 9 13 8 10 -400% 2000 2001 2002 2003 2004 2005 2006 2007 2008 2009 2010 2011 2012 2013 2014 2015 2016 2017 2018 2019 2020 2021 2022 50.0 * Early Fed Dotcom Bubble Crash Global Financial Crisis VC Recalibration 40.0 COVID-19 Tightening Quarterly 30.0 average TCF 20.0 (positive growth, 10.0 negative growth) - 1. Note: VC investment data sourced from PitchBook. Prior period investment data may be revised based on updates to Pitchbook’s proprietary back-end data STRATEGIC ACTIONS/ set and filters. * Pullback in VC investment. Q1’23 MID-QUARTER UPDATE 23

Robust client funds franchise, with flexibility to shift liquidity on or off the balance sheet Comprehensive liquidity management solutions to meet clients’ needs, on or off balance sheet 4% Noninterest-bearing 22% deposits 18% Clients’ operating cash typically held in on-balance Interest-bearing sheet noninterest-bearing deposits deposits Off-balance sheet $326B managed funds Clients’ excess liquidity generally held in on-balance TCF Off-balance sheet sheet interest-bearing deposits or off-balance sheet sweep funds 27% 29% Off-balance sheet client funds repo funds Leveraging flexible liquidity solutions that enable us to shift client funds on or off balance sheet to support deposits When client funds growth normalizes, we can $73B utilize our flexible liquidity solutions to Off-balance sheet sweep optimize our deposit costs and mix by shifting and repo funds OBS balances that can potentially higher-rate deposits off-balance sheet be shifted on-balance sheet STRATEGIC ACTIONS/ Note: All figures as of February 28, 2023. Q1’23 MID-QUARTER UPDATE 24

We’ve successfully Long history of strong, resilient credit and the risk profile of our loan portfolio has navigated economic improved over time cycles before 1 2 Non-performing loans (NPLs ) & net charge-offs (NCOs ) Proven leadership Bps 332 supported by strong 340 290 264 global team 240 190 157 140 115 107 103 102 97 13 years 87 90 77 71 73 62 64 59 52 51 47 46 42 34 32 26 31 35 31 33 40 32 30 27 25 27 23 22 24 20 18 Executive management 21 10 4 14 18 14 10 -10 -8 -2 average tenure at SVB 2000 2001 2002 2003 2004 2005 2006 2007 2008 2009 2010 2011 2012 2013 2014 2015 2016 2017 2018 2019 2020 2021 2022 Dotcom Bubble Global Financial VC Early Fed 3 Crash Crisis Recalibration COVID-19 Tightening 24 years Credit leadership average Improved loan mix tenure at SVB % of period-end total loans 2000 2009 12/31/22 30% Early Stage 11% Early Stage 3% Early Stage 5% GFB + Private Bank 30% GFB + Private Bank 70% GFB + Private Bank 1. Non-performing loans as a percentage of period-end total loans. 2. Net loan charge-offs as a percentage of average total loans. STRATEGIC ACTIONS/ 3. Pullback in VC investment. Q1’23 MID-QUARTER UPDATE 25
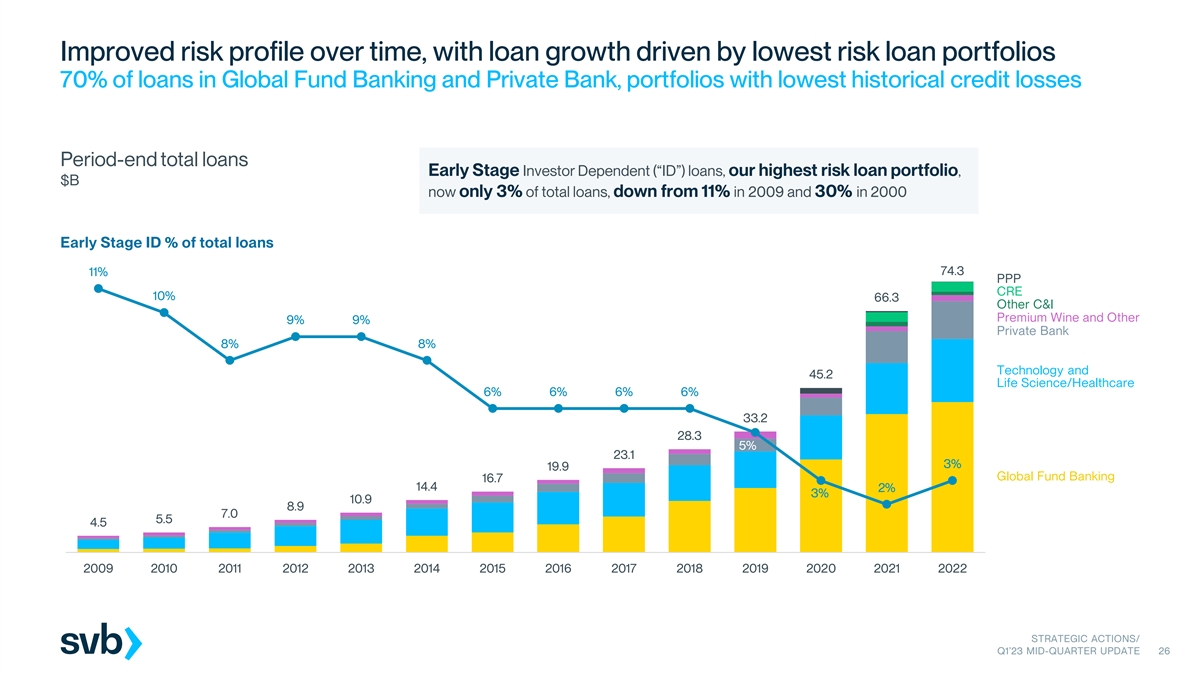
Improved risk profile over time, with loan growth driven by lowest risk loan portfolios 70% of loans in Global Fund Banking and Private Bank, portfolios with lowest historical credit losses Period-end total loans Early Stage Investor Dependent (“ID”) loans, our highest risk loan portfolio, $B now only 3% of total loans, down from 11% in 2009 and 30% in 2000 Early Stage ID % of total loans 74.3 11% PPP CRE 10% 66.3 Other C&I Premium Wine and Other 9% 9% Private Bank 8% 8% Technology and 45.2 Life Science/Healthcare 6% 6% 6% 6% 33.2 28.3 5% 23.1 3% 19.9 Global Fund Banking 16.7 14.4 2% 3% 10.9 8.9 7.0 5.5 4.5 2009 2010 2011 2012 2013 2014 2015 2016 2017 2018 2019 2020 2021 2022 STRATEGIC ACTIONS/ Q1’23 MID-QUARTER UPDATE 26

Strong, seasoned management team Diverse experience and skills to help direct our growth 13 years average tenure at SVB Dan Beck Greg Becker Marc Cadieux John China Chief Financial Officer President and CEO Chief Credit Officer President SVB Capital 5 years at SVB 29 years at SVB 30 years at SVB 26 years at SVB Laura Cushing Phil Cox Mike Descheneaux Michelle Draper Chief Human Resources Officer Chief Operations Officer President Silicon Valley Bank Chief Marketing & Strategy Officer Joined SVB 2022 13 years at SVB 17 years at SVB 9 years at SVB Jeffrey Leerink Kim Olson John Peters Michael Zuckert CEO SVB Securities Chief Risk Officer Chief Auditor General Counsel 4 years at SVB Joined SVB 2022 16 years at SVB 8 years at SVB STRATEGIC ACTIONS/ Q1’23 MID-QUARTER UPDATE 27

Non-GAAP reconciliations STRATEGIC ACTIONS/ Q1’23 MID-QUARTER UPDATE 28
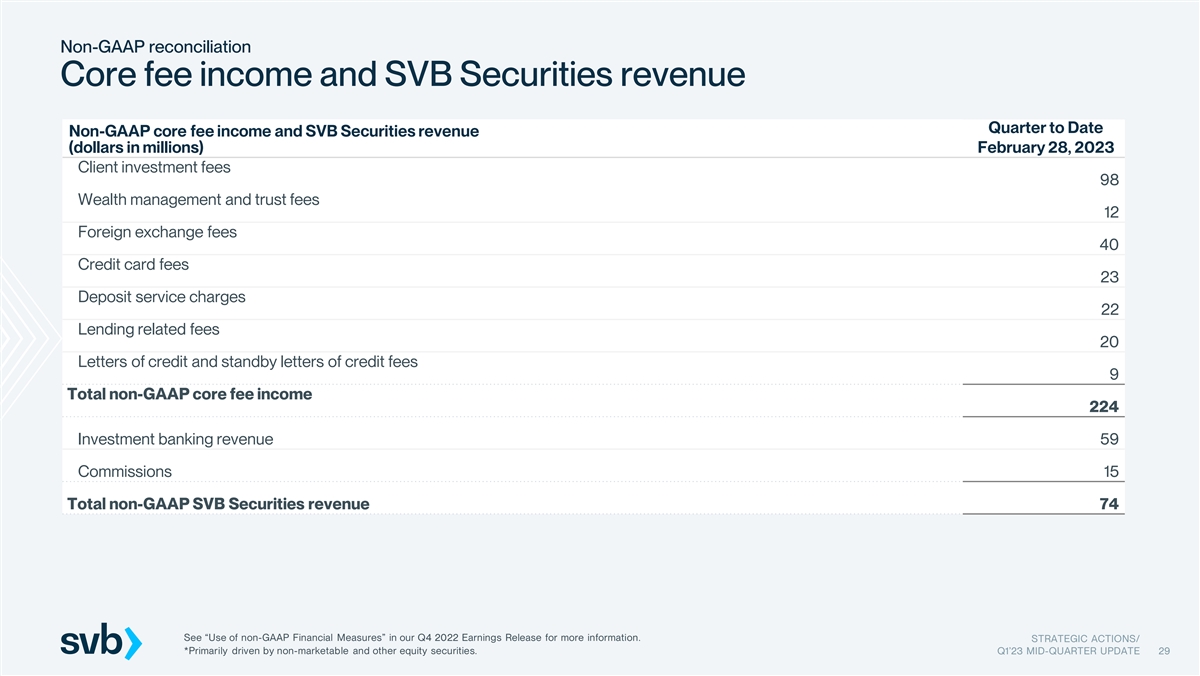
Non-GAAP reconciliation Core fee income and SVB Securities revenue Quarter to Date Non-GAAP core fee income and SVB Securities revenue (dollars in millions) February 28, 2023 Client investment fees 98 Wealth management and trust fees 12 Foreign exchange fees 40 Credit card fees 23 Deposit service charges 22 Lending related fees 20 Letters of credit and standby letters of credit fees 9 Total non-GAAP core fee income 224 Investment banking revenue 59 Commissions 15 Total non-GAAP SVB Securities revenue 74 See “Use of non-GAAP Financial Measures” in our Q4 2022 Earnings Release for more information. STRATEGIC ACTIONS/ *Primarily driven by non-marketable and other equity securities. Q1’23 MID-QUARTER UPDATE 29

About SVB SVB is the financial partner of the innovation economy, helping individuals, investors and the world’s most innovative companies achieve their ambitious goals. SVB’s businesses - Silicon Valley Bank, SVB Capital, SVB Private and SVB Securities - together offer the services that dynamic and fast-growing clients require as they grow, including commercial banking, venture investing, wealth planning and investment banking. Headquartered in Santa Clara, California, SVB operates in centers of innovation around the world. SVB Financial Group (Nasdaq: SIVB) is the holding company for all business units and groups. © 2023 SVB Financial Group. All rights reserved. SVB, SVB FINANCIAL GROUP, SILICON VALLEY BANK, SVB SECURITIES, SVB PRIVATE, SVB CAPITAL and the chevron device are trademarks of SVB Financial Group, used under license. Silicon Valley Bank is a member of the FDIC and the Federal Reserve System. Silicon Valley Bank is the California bank subsidiary of SVB Financial Group. Investor Relations | 3005 Tasman Drive Santa Clara, CA 95054 | T 408 654 7400 | ir@svb.com


