SVB Financial (SIVBQ) 8-KEntry into a Material Definitive Agreement
Filed: 10 Jan 24, 4:06pm
CONFIDENTIAL DRAFT Exhibit 99.1 Project Sierra Cleansing Materials January 2024

CONFIDENTIAL DRAFT Table of Contents SVBFG Direct Equity Investments SVBFG LP Fund Investments SVBFG Warrant Top 50 Positions SVB Capital Detail Cash Flow Forecast GUC Summary / Other MoffettNathanson 2

SVB Neue Montreal (Headings) Bierstadt (Body) CONFIDENTIAL DRAFT SVBFG – Direct Equity Investments Latest % of Cum. % Book Cost # of (1) # Anonymized Name Description Value Basis Invest. Date Total of Total Invest. 1 Company 1 Startup accelerator and seed fund $38 $25 2019 15% 15% 1 2 Company 2 End-to-end trading platform for private company secondary transactions 27 22 2021 11% 27% 2 3 Company 3 Insurance company serving early stage startups 21 29 2018 8% 35% 4 4 Company 4 Payment facilitation-as-a-service platform for SaaS and fintech companies 13 13 2022 5% 40% 2 5 Company 5 Startup accelerator and seed fund 12 2 2015 5% 45% 1 6 Company 6 Focused on the digital currency market 10 1 2009 4% 49% 1 Investment management platform tailored to emerging managers to 7 Company 7 9 9 2021 4% 53% 2 streamline private market transactions 8 Company 8 Revenue-based financing lender to small technology companies 7 7 2018 3% 56% 1 9 Company 9 Startup accelerator and seed fund 7 – 2012 3% 59% 1 Talent plalform to pair companies with executives for full-time, fractional, 10 Company 10 5 5 2020 2% 61% 4 and board roles Top 10 Total Direct Equity Investments $149 $114 61% 61% 19 (2) Public and Private Securities from Warrant Exercise 34 n.a. 245 14% 75% (3) Conversion Rights 13 n.a. 6 5% 80% All Other Direct Equity Investments n.a. 48 20% 100% 104 Total Direct Equity Investments $244 n.a. 100% 100% 374 Note: Dollars in millions. As of September 30, 2023. (1) Direct investments in private companies do not have a readily determinable fair value. Investments are typically measured at cost / time of investment, less impairment, plus or minus changes resulting from observable price changes in orderly transactions for identical or similar investments from the same issuer. (2) Represents direct equity investments in public and private securities resulting from the exercise of warrants. 3 SVB Financial Group Proprietary and Confidential (3) Represents option value of conversion right held at SVBFG. The associated convertible debt is held at SVB’s commercial bank. If converted to equity, SVBFG will own 100% of the equity, and owe the principal amount of the convertible debt to SVB commercial bank.

CONFIDENTIAL DRAFT Table of Contents SVBFG Direct Equity Investments SVBFG LP Fund Investments SVBFG Warrant Top 50 Positions SVB Capital Detail Cash Flow Forecast GUC Summary / Other MoffettNathanson 4
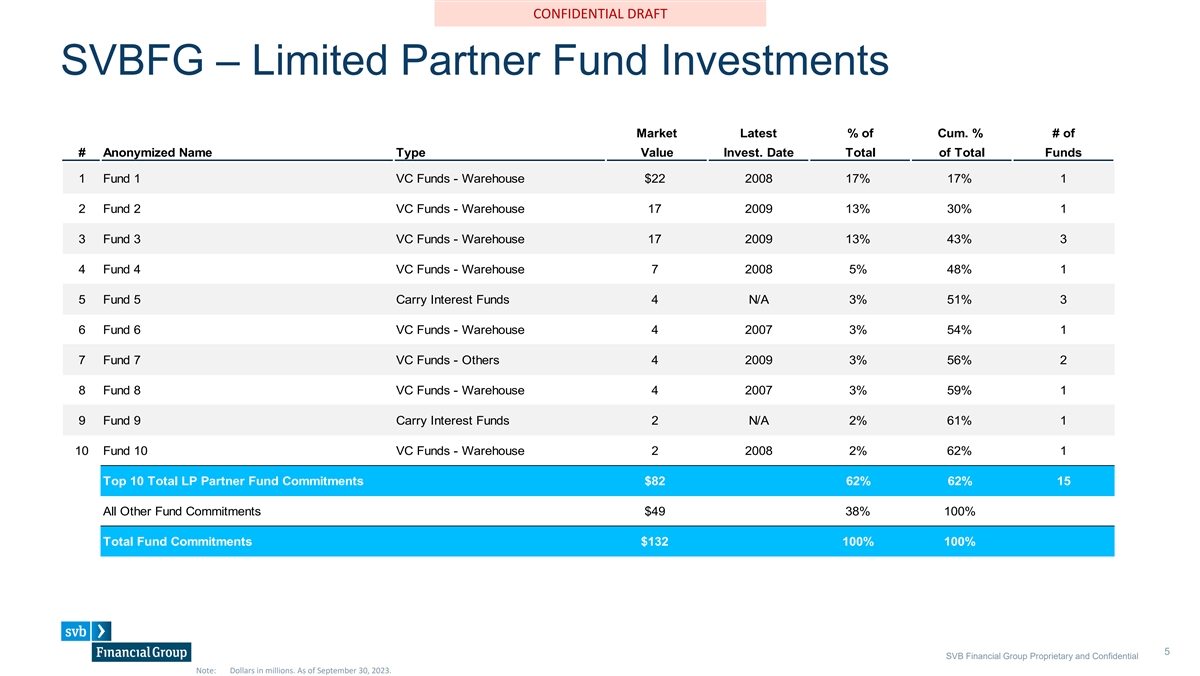
SVB Neue Montreal (Headings) Bierstadt (Body) CONFIDENTIAL DRAFT SVBFG – Limited Partner Fund Investments Market Latest % of Cum. % # of # Anonymized Name Type Value Invest. Date Total of Total Funds 1 Fund 1 VC Funds - Warehouse $22 2008 17% 17% 1 2 Fund 2 VC Funds - Warehouse 17 2009 13% 30% 1 3 Fund 3 VC Funds - Warehouse 17 2009 13% 43% 3 4 Fund 4 VC Funds - Warehouse 7 2008 5% 48% 1 5 Fund 5 Carry Interest Funds 4 N/A 3% 51% 3 6 Fund 6 VC Funds - Warehouse 4 2007 3% 54% 1 7 Fund 7 VC Funds - Others 4 2009 3% 56% 2 8 Fund 8 VC Funds - Warehouse 4 2007 3% 59% 1 9 Fund 9 Carry Interest Funds 2 N/A 2% 61% 1 10 Fund 10 VC Funds - Warehouse 2 2008 2% 62% 1 Top 10 Total LP Partner Fund Commitments $82 62% 62% 15 All Other Fund Commitments $49 38% 100% Total Fund Commitments $132 100% 100% 5 SVB Financial Group Proprietary and Confidential Note: Dollars in millions. As of September 30, 2023.

CONFIDENTIAL DRAFT Table of Contents SVBFG Direct Equity Investments SVBFG LP Fund Investments SVBFG Warrant Top 50 Positions SVB Capital Detail Cash Flow Forecast GUC Summary / Other MoffettNathanson 6
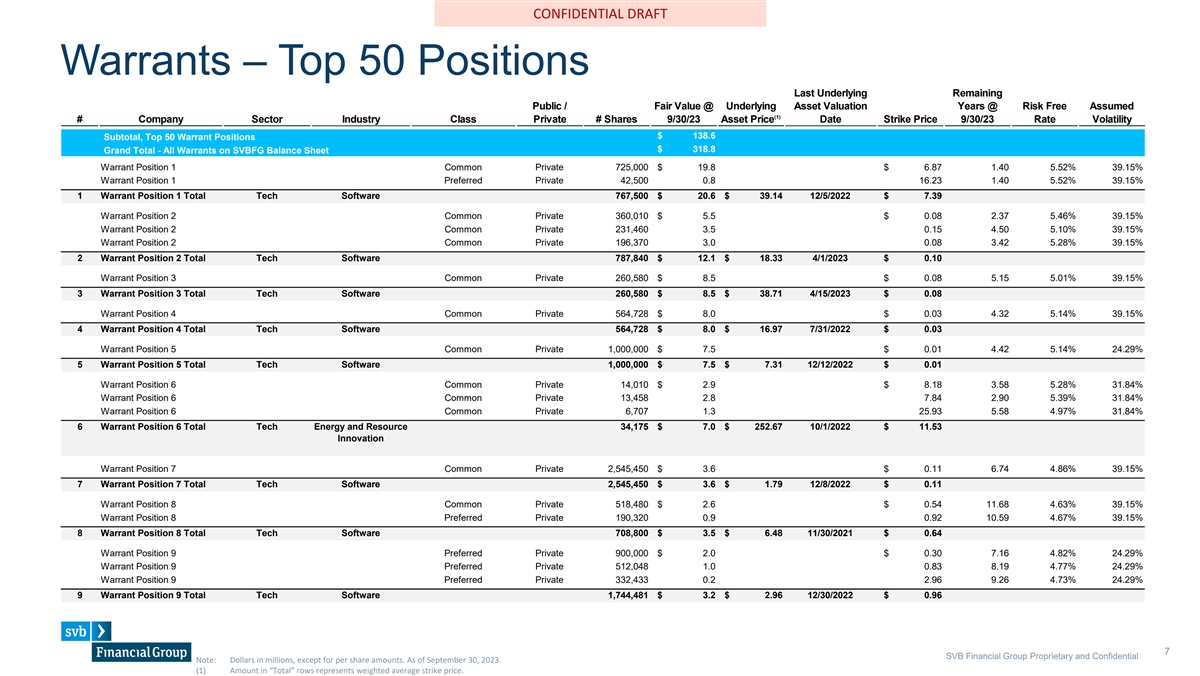
SVB Neue Montreal (Headings) Bierstadt (Body) CONFIDENTIAL DRAFT Warrants – Top 50 Positions La Last st U Un nd derl erly yiin ng g R Re emai maining ning Public / Fair Value @ Underlying Risk Free Assumed # Company Sector Industry Class Public / # Shares Fair Value @ Underlying A Ass sset et V Valuati aluatio on n Strike Price Y Yea ears rs @ @ Risk Free Assumed (1) Private 9/30/23 Asset Price Rate Volatility (1) # Company Sector Industry Class Private # Shares 9/30/23 Asset Price D Da ate te Strike Price 9/30/ 9/30/23 23 Rate Volatility $ 138.6 Subtotal, Top 50 Warrant Positions $ 318.8 Grand Total - All Warrants on SVBFG Balance Sheet Warrant Position 1 Common Private 725,000 $ 19.8 $ 6.87 1.40 5.52% 39.15% Warrant Position 1 Preferred Private 42,500 0.8 16.23 1.40 5.52% 39.15% 1 Warrant Position 1 Total Tech Software 767,500 $ 20.6 $ 39.14 12/5/2022 $ 7.39 Warrant Position 2 Common Private 360,010 $ 5.5 $ 0.08 2.37 5.46% 39.15% Warrant Position 2 Common Private 231,460 3.5 0.15 4.50 5.10% 39.15% Warrant Position 2 Common Private 196,370 3.0 0.08 3.42 5.28% 39.15% 2 Warrant Position 2 Total Tech Software 787,840 $ 12.1 $ 18.33 4/1/2023 $ 0.10 Warrant Position 3 Common Private 260,580 $ 8.5 $ 0.08 5.15 5.01% 39.15% 3 Warrant Position 3 Total Tech Software 260,580 $ 8.5 $ 38.71 4/15/2023 $ 0.08 Warrant Position 4 Common Private 564,728 $ 8.0 $ 0.03 4.32 5.14% 39.15% 4 Warrant Position 4 Total Tech Software 564,728 $ 8.0 $ 16.97 7/31/2022 $ 0.03 Warrant Position 5 Common Private 1,000,000 $ 7.5 $ 0.01 4.42 5.14% 24.29% 5 Warrant Position 5 Total Tech Software 1,000,000 $ 7.5 $ 7.31 12/12/2022 $ 0.01 Warrant Position 6 Common Private 14,010 $ 2.9 $ 8.18 3.58 5.28% 31.84% Warrant Position 6 Common Private 13,458 2.8 7.84 2.90 5.39% 31.84% Warrant Position 6 Common Private 6,707 1.3 25.93 5.58 4.97% 31.84% 6 Warrant Position 6 Total Tech Energy and Resource 34,175 $ 7.0 $ 252.67 10/1/2022 $ 11.53 Innovation Warrant Position 7 Common Private 2,545,450 $ 3.6 $ 0.11 6.74 4.86% 39.15% 7 Warrant Position 7 Total Tech Software 2,545,450 $ 3.6 $ 1.79 12/8/2022 $ 0.11 Warrant Position 8 Common Private 518,480 $ 2.6 $ 0.54 11.68 4.63% 39.15% Warrant Position 8 Preferred Private 190,320 0.9 0.92 10.59 4.67% 39.15% 8 Warrant Position 8 Total Tech Software 708,800 $ 3.5 $ 6.48 11/30/2021 $ 0.64 Warrant Position 9 Preferred Private 900,000 $ 2.0 $ 0.30 7.16 4.82% 24.29% Warrant Position 9 Preferred Private 512,048 1.0 0.83 8.19 4.77% 24.29% Warrant Position 9 Preferred Private 332,433 0.2 2.96 9.26 4.73% 24.29% 9 Warrant Position 9 Total Tech Software 1,744,481 $ 3.2 $ 2.96 12/30/2022 $ 0.96 7 SVB Financial Group Proprietary and Confidential Note: Dollars in millions, except for per share amounts. As of September 30, 2023. (1) Amount in “Total” rows represents weighted average strike price.
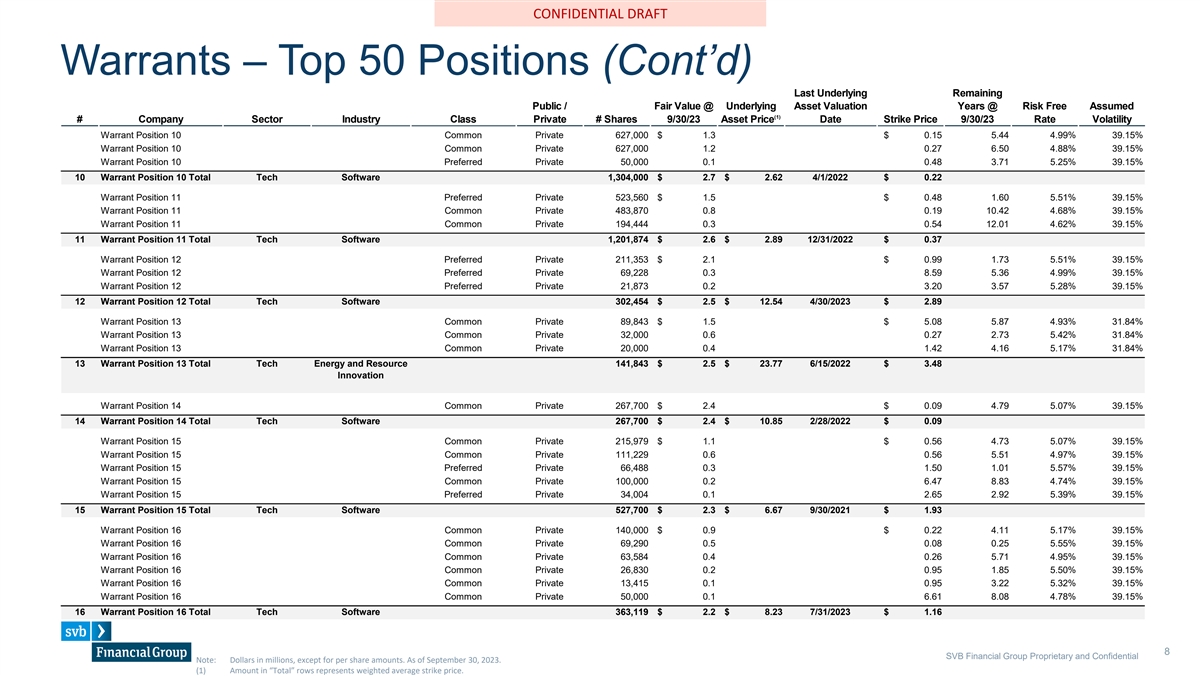
SVB Neue Montreal (Headings) Bierstadt (Body) CONFIDENTIAL DRAFT Warrants – Top 50 Positions (Cont’d) La Last st U Un nd derl erly yiin ng g R Re emai maining ning Public / Fair Value @ Underlying Risk Free Assumed # Company Sector Industry Class Public / # Shares Fair Value @ Underlying A Ass sset et V Valuati aluatio on n Strike Price Y Yea ears rs @ @ Risk Free Assumed (1) Private 9/30/23 Asset Price Rate Volatility (1) # Company Sector Industry Class Private # Shares 9/30/23 Asset Price D Da ate te Strike Price 9/30/ 9/30/23 23 Rate Volatility Warrant Position 10 Common Private 627,000 $ 1.3 $ 0.15 5.44 4.99% 39.15% Warrant Position 10 Common Private 627,000 1.2 0.27 6.50 4.88% 39.15% Warrant Position 10 Preferred Private 50,000 0.1 0.48 3.71 5.25% 39.15% 10 Warrant Position 10 Total Tech Software 1,304,000 $ 2.7 $ 2.62 4/1/2022 $ 0.22 Warrant Position 11 Preferred Private 523,560 $ 1.5 $ 0.48 1.60 5.51% 39.15% Warrant Position 11 Common Private 483,870 0.8 0.19 10.42 4.68% 39.15% Warrant Position 11 Common Private 194,444 0.3 0.54 12.01 4.62% 39.15% 11 Warrant Position 11 Total Tech Software 1,201,874 $ 2.6 $ 2.89 12/31/2022 $ 0.37 Warrant Position 12 Preferred Private 211,353 $ 2.1 $ 0.99 1.73 5.51% 39.15% Warrant Position 12 Preferred Private 69,228 0.3 8.59 5.36 4.99% 39.15% Warrant Position 12 Preferred Private 21,873 0.2 3.20 3.57 5.28% 39.15% 12 Warrant Position 12 Total Tech Software 302,454 $ 2.5 $ 12.54 4/30/2023 $ 2.89 Warrant Position 13 Common Private 89,843 $ 1.5 $ 5.08 5.87 4.93% 31.84% Warrant Position 13 Common Private 32,000 0.6 0.27 2.73 5.42% 31.84% Warrant Position 13 Common Private 20,000 0.4 1.42 4.16 5.17% 31.84% 13 Warrant Position 13 Total Tech Energy and Resource 141,843 $ 2.5 $ 23.77 6/15/2022 $ 3.48 Innovation Warrant Position 14 Common Private 267,700 $ 2.4 $ 0.09 4.79 5.07% 39.15% 14 Warrant Position 14 Total Tech Software 267,700 $ 2.4 $ 10.85 2/28/2022 $ 0.09 Warrant Position 15 Common Private 215,979 $ 1.1 $ 0.56 4.73 5.07% 39.15% Warrant Position 15 Common Private 111,229 0.6 0.56 5.51 4.97% 39.15% Warrant Position 15 Preferred Private 66,488 0.3 1.50 1.01 5.57% 39.15% Warrant Position 15 Common Private 100,000 0.2 6.47 8.83 4.74% 39.15% Warrant Position 15 Preferred Private 34,004 0.1 2.65 2.92 5.39% 39.15% 15 Warrant Position 15 Total Tech Software 527,700 $ 2.3 $ 6.67 9/30/2021 $ 1.93 Warrant Position 16 Common Private 140,000 $ 0.9 $ 0.22 4.11 5.17% 39.15% Warrant Position 16 Common Private 69,290 0.5 0.08 0.25 5.55% 39.15% Warrant Position 16 Common Private 63,584 0.4 0.26 5.71 4.95% 39.15% Warrant Position 16 Common Private 26,830 0.2 0.95 1.85 5.50% 39.15% Warrant Position 16 Common Private 13,415 0.1 0.95 3.22 5.32% 39.15% Warrant Position 16 Common Private 50,000 0.1 6.61 8.08 4.78% 39.15% 16 Warrant Position 16 Total Tech Software 363,119 $ 2.2 $ 8.23 7/31/2023 $ 1.16 8 SVB Financial Group Proprietary and Confidential Note: Dollars in millions, except for per share amounts. As of September 30, 2023. (1) Amount in “Total” rows represents weighted average strike price.
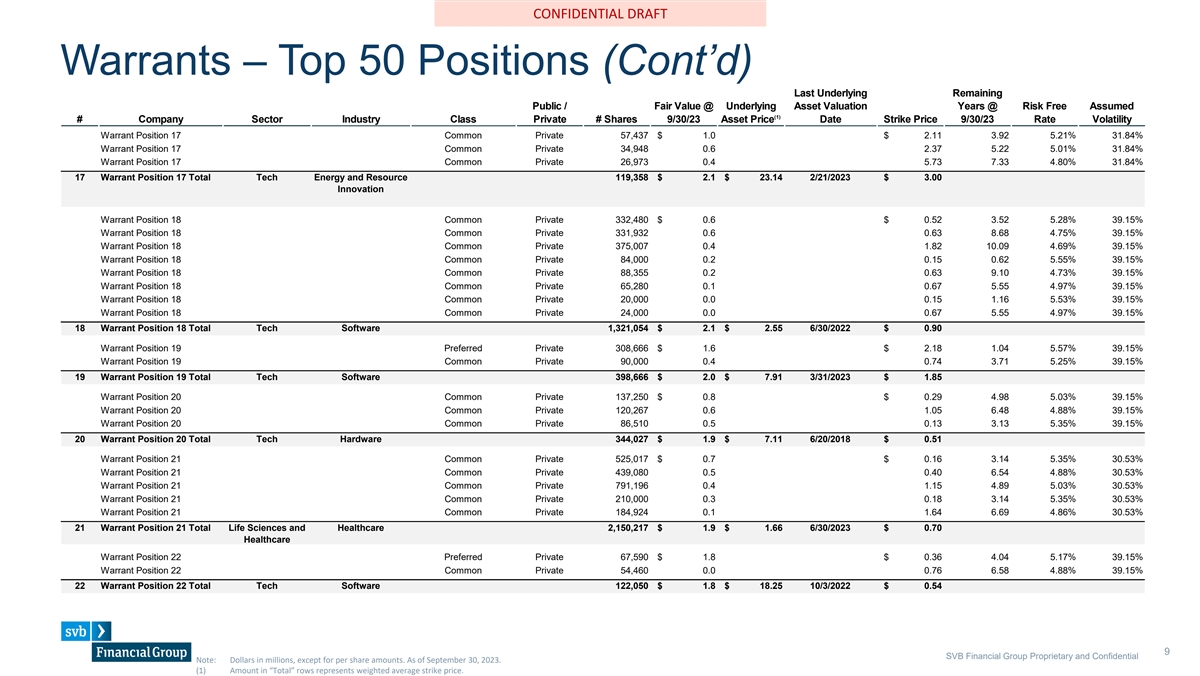
SVB Neue Montreal (Headings) Bierstadt (Body) CONFIDENTIAL DRAFT Warrants – Top 50 Positions (Cont’d) La Last st U Un nd derl erly yiin ng g R Re emai maining ning Public / Fair Value @ Underlying Risk Free Assumed # Company Sector Industry Class Public / # Shares Fair Value @ Underlying A Ass sset et V Valuati aluatio on n Strike Price Y Yea ears rs @ @ Risk Free Assumed (1) Private 9/30/23 Asset Price Rate Volatility (1) # Company Sector Industry Class Private # Shares 9/30/23 Asset Price D Da ate te Strike Price 9/30/ 9/30/23 23 Rate Volatility Warrant Position 17 Common Private 57,437 $ 1.0 $ 2.11 3.92 5.21% 31.84% Warrant Position 17 Common Private 34,948 0.6 2.37 5.22 5.01% 31.84% Warrant Position 17 Common Private 26,973 0.4 5.73 7.33 4.80% 31.84% 17 Warrant Position 17 Total Tech Energy and Resource 119,358 $ 2.1 $ 23.14 2/21/2023 $ 3.00 Innovation Warrant Position 18 Common Private 332,480 $ 0.6 $ 0.52 3.52 5.28% 39.15% Warrant Position 18 Common Private 331,932 0.6 0.63 8.68 4.75% 39.15% Warrant Position 18 Common Private 375,007 0.4 1.82 10.09 4.69% 39.15% Warrant Position 18 Common Private 84,000 0.2 0.15 0.62 5.55% 39.15% Warrant Position 18 Common Private 88,355 0.2 0.63 9.10 4.73% 39.15% Warrant Position 18 Common Private 65,280 0.1 0.67 5.55 4.97% 39.15% Warrant Position 18 Common Private 20,000 0.0 0.15 1.16 5.53% 39.15% Warrant Position 18 Common Private 24,000 0.0 0.67 5.55 4.97% 39.15% 18 Warrant Position 18 Total Tech Software 1,321,054 $ 2.1 $ 2.55 6/30/2022 $ 0.90 Warrant Position 19 Preferred Private 308,666 $ 1.6 $ 2.18 1.04 5.57% 39.15% Warrant Position 19 Common Private 90,000 0.4 0.74 3.71 5.25% 39.15% 19 Warrant Position 19 Total Tech Software 398,666 $ 2.0 $ 7.91 3/31/2023 $ 1.85 Warrant Position 20 Common Private 137,250 $ 0.8 $ 0.29 4.98 5.03% 39.15% Warrant Position 20 Common Private 120,267 0.6 1.05 6.48 4.88% 39.15% Warrant Position 20 Common Private 86,510 0.5 0.13 3.13 5.35% 39.15% 20 Warrant Position 20 Total Tech Hardware 344,027 $ 1.9 $ 7.11 6/20/2018 $ 0.51 Warrant Position 21 Common Private 525,017 $ 0.7 $ 0.16 3.14 5.35% 30.53% Warrant Position 21 Common Private 439,080 0.5 0.40 6.54 4.88% 30.53% Warrant Position 21 Common Private 791,196 0.4 1.15 4.89 5.03% 30.53% Warrant Position 21 Common Private 210,000 0.3 0.18 3.14 5.35% 30.53% Warrant Position 21 Common Private 184,924 0.1 1.64 6.69 4.86% 30.53% 21 Warrant Position 21 Total Life Sciences and Healthcare 2,150,217 $ 1.9 $ 1.66 6/30/2023 $ 0.70 Healthcare Warrant Position 22 Preferred Private 67,590 $ 1.8 $ 0.36 4.04 5.17% 39.15% Warrant Position 22 Common Private 54,460 0.0 0.76 6.58 4.88% 39.15% 22 Warrant Position 22 Total Tech Software 122,050 $ 1.8 $ 18.25 10/3/2022 $ 0.54 9 SVB Financial Group Proprietary and Confidential Note: Dollars in millions, except for per share amounts. As of September 30, 2023. (1) Amount in “Total” rows represents weighted average strike price.
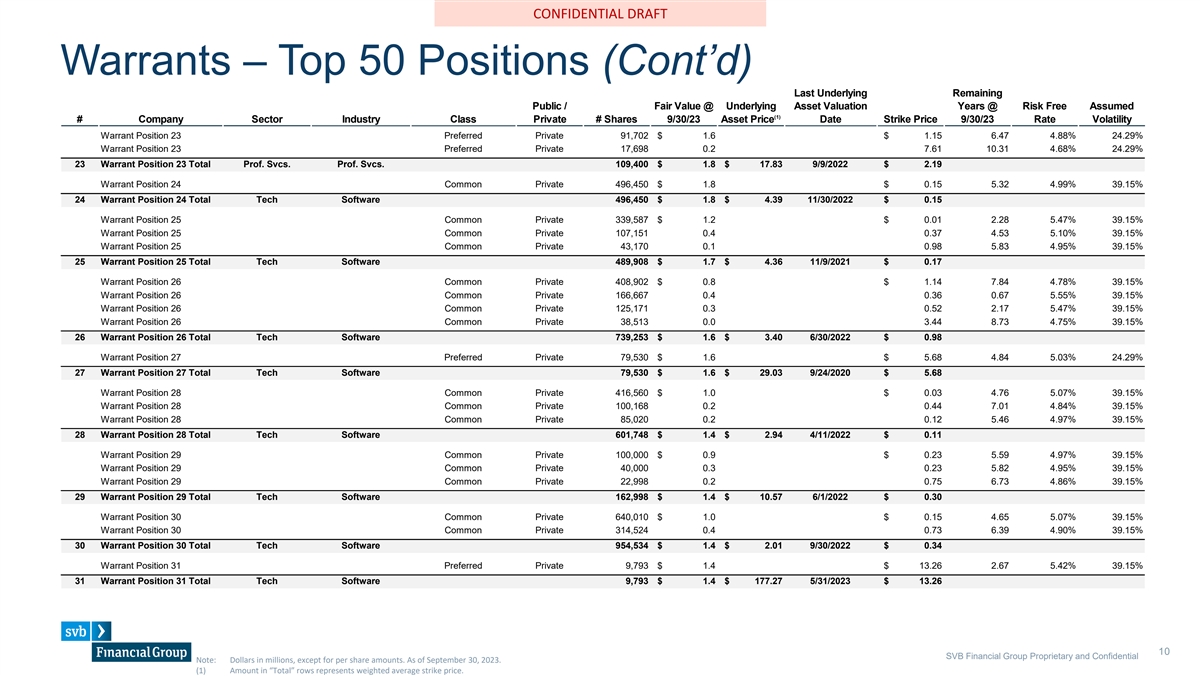
SVB Neue Montreal (Headings) Bierstadt (Body) CONFIDENTIAL DRAFT Warrants – Top 50 Positions (Cont’d) La Last st U Un nd derl erly yiin ng g R Re emai maining ning Public / Fair Value @ Underlying Risk Free Assumed # Company Sector Industry Class Public / # Shares Fair Value @ Underlying A Ass sset et V Valuati aluatio on n Strike Price Y Yea ears rs @ @ Risk Free Assumed (1) Private 9/30/23 Asset Price Rate Volatility (1) # Company Sector Industry Class Private # Shares 9/30/23 Asset Price D Da ate te Strike Price 9/30/ 9/30/23 23 Rate Volatility Warrant Position 23 Preferred Private 91,702 $ 1.6 $ 1.15 6.47 4.88% 24.29% Warrant Position 23 Preferred Private 17,698 0.2 7.61 10.31 4.68% 24.29% 23 Warrant Position 23 Total Prof. Svcs. Prof. Svcs. 109,400 $ 1.8 $ 17.83 9/9/2022 $ 2.19 Warrant Position 24 Common Private 496,450 $ 1.8 $ 0.15 5.32 4.99% 39.15% 24 Warrant Position 24 Total Tech Software 496,450 $ 1.8 $ 4.39 11/30/2022 $ 0.15 Warrant Position 25 Common Private 339,587 $ 1.2 $ 0.01 2.28 5.47% 39.15% Warrant Position 25 Common Private 107,151 0.4 0.37 4.53 5.10% 39.15% Warrant Position 25 Common Private 43,170 0.1 0.98 5.83 4.95% 39.15% 25 Warrant Position 25 Total Tech Software 489,908 $ 1.7 $ 4.36 11/9/2021 $ 0.17 Warrant Position 26 Common Private 408,902 $ 0.8 $ 1.14 7.84 4.78% 39.15% Warrant Position 26 Common Private 166,667 0.4 0.36 0.67 5.55% 39.15% Warrant Position 26 Common Private 125,171 0.3 0.52 2.17 5.47% 39.15% Warrant Position 26 Common Private 38,513 0.0 3.44 8.73 4.75% 39.15% 26 Warrant Position 26 Total Tech Software 739,253 $ 1.6 $ 3.40 6/30/2022 $ 0.98 Warrant Position 27 Preferred Private 79,530 $ 1.6 $ 5.68 4.84 5.03% 24.29% 27 Warrant Position 27 Total Tech Software 79,530 $ 1.6 $ 29.03 9/24/2020 $ 5.68 Warrant Position 28 Common Private 416,560 $ 1.0 $ 0.03 4.76 5.07% 39.15% Warrant Position 28 Common Private 100,168 0.2 0.44 7.01 4.84% 39.15% Warrant Position 28 Common Private 85,020 0.2 0.12 5.46 4.97% 39.15% 28 Warrant Position 28 Total Tech Software 601,748 $ 1.4 $ 2.94 4/11/2022 $ 0.11 Warrant Position 29 Common Private 100,000 $ 0.9 $ 0.23 5.59 4.97% 39.15% Warrant Position 29 Common Private 40,000 0.3 0.23 5.82 4.95% 39.15% Warrant Position 29 Common Private 22,998 0.2 0.75 6.73 4.86% 39.15% 29 Warrant Position 29 Total Tech Software 162,998 $ 1.4 $ 10.57 6/1/2022 $ 0.30 Warrant Position 30 Common Private 640,010 $ 1.0 $ 0.15 4.65 5.07% 39.15% Warrant Position 30 Common Private 314,524 0.4 0.73 6.39 4.90% 39.15% 30 Warrant Position 30 Total Tech Software 954,534 $ 1.4 $ 2.01 9/30/2022 $ 0.34 Warrant Position 31 Preferred Private 9,793 $ 1.4 $ 13.26 2.67 5.42% 39.15% 31 Warrant Position 31 Total Tech Software 9,793 $ 1.4 $ 177.27 5/31/2023 $ 13.26 10 SVB Financial Group Proprietary and Confidential Note: Dollars in millions, except for per share amounts. As of September 30, 2023. (1) Amount in “Total” rows represents weighted average strike price.
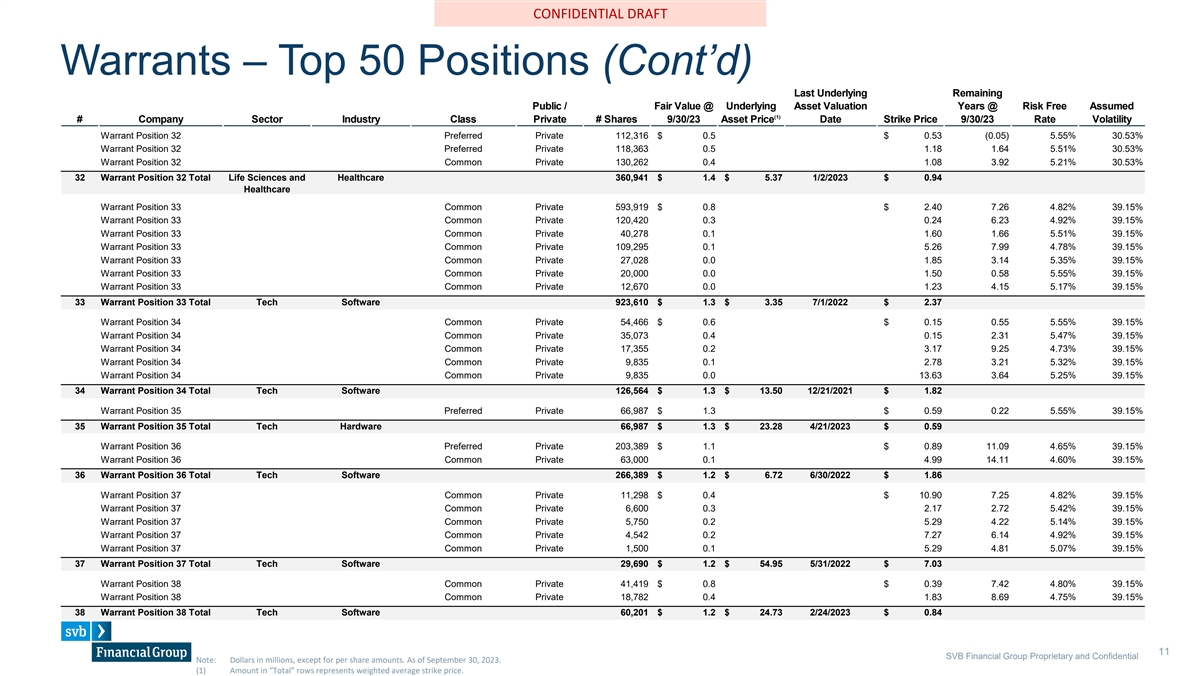
SVB Neue Montreal (Headings) Bierstadt (Body) CONFIDENTIAL DRAFT Warrants – Top 50 Positions (Cont’d) La Last st U Un nd derl erly yiin ng g R Re emai maining ning Public / Fair Value @ Underlying Risk Free Assumed # Company Sector Industry Class Public / # Shares Fair Value @ Underlying A Ass sset et V Valuati aluatio on n Strike Price Y Yea ears rs @ @ Risk Free Assumed (1) Private 9/30/23 Asset Price Rate Volatility (1) # Company Sector Industry Class Private # Shares 9/30/23 Asset Price D Da ate te Strike Price 9/30/ 9/30/23 23 Rate Volatility Warrant Position 32 Preferred Private 112,316 $ 0.5 $ 0.53 (0.05) 5.55% 30.53% Warrant Position 32 Preferred Private 118,363 0.5 1.18 1.64 5.51% 30.53% Warrant Position 32 Common Private 130,262 0.4 1.08 3.92 5.21% 30.53% 32 Warrant Position 32 Total Life Sciences and Healthcare 360,941 $ 1.4 $ 5.37 1/2/2023 $ 0.94 Healthcare Warrant Position 33 Common Private 593,919 $ 0.8 $ 2.40 7.26 4.82% 39.15% Warrant Position 33 Common Private 120,420 0.3 0.24 6.23 4.92% 39.15% Warrant Position 33 Common Private 40,278 0.1 1.60 1.66 5.51% 39.15% Warrant Position 33 Common Private 109,295 0.1 5.26 7.99 4.78% 39.15% Warrant Position 33 Common Private 27,028 0.0 1.85 3.14 5.35% 39.15% Warrant Position 33 Common Private 20,000 0.0 1.50 0.58 5.55% 39.15% Warrant Position 33 Common Private 12,670 0.0 1.23 4.15 5.17% 39.15% 33 Warrant Position 33 Total Tech Software 923,610 $ 1.3 $ 3.35 7/1/2022 $ 2.37 Warrant Position 34 Common Private 54,466 $ 0.6 $ 0.15 0.55 5.55% 39.15% Warrant Position 34 Common Private 35,073 0.4 0.15 2.31 5.47% 39.15% Warrant Position 34 Common Private 17,355 0.2 3.17 9.25 4.73% 39.15% Warrant Position 34 Common Private 9,835 0.1 2.78 3.21 5.32% 39.15% Warrant Position 34 Common Private 9,835 0.0 13.63 3.64 5.25% 39.15% 34 Warrant Position 34 Total Tech Software 126,564 $ 1.3 $ 13.50 12/21/2021 $ 1.82 Warrant Position 35 Preferred Private 66,987 $ 1.3 $ 0.59 0.22 5.55% 39.15% 35 Warrant Position 35 Total Tech Hardware 66,987 $ 1.3 $ 23.28 4/21/2023 $ 0.59 Warrant Position 36 Preferred Private 203,389 $ 1.1 $ 0.89 11.09 4.65% 39.15% Warrant Position 36 Common Private 63,000 0.1 4.99 14.11 4.60% 39.15% 36 Warrant Position 36 Total Tech Software 266,389 $ 1.2 $ 6.72 6/30/2022 $ 1.86 Warrant Position 37 Common Private 11,298 $ 0.4 $ 10.90 7.25 4.82% 39.15% Warrant Position 37 Common Private 6,600 0.3 2.17 2.72 5.42% 39.15% Warrant Position 37 Common Private 5,750 0.2 5.29 4.22 5.14% 39.15% Warrant Position 37 Common Private 4,542 0.2 7.27 6.14 4.92% 39.15% Warrant Position 37 Common Private 1,500 0.1 5.29 4.81 5.07% 39.15% 37 Warrant Position 37 Total Tech Software 29,690 $ 1.2 $ 54.95 5/31/2022 $ 7.03 Warrant Position 38 Common Private 41,419 $ 0.8 $ 0.39 7.42 4.80% 39.15% Warrant Position 38 Common Private 18,782 0.4 1.83 8.69 4.75% 39.15% 38 Warrant Position 38 Total Tech Software 60,201 $ 1.2 $ 24.73 2/24/2023 $ 0.84 11 SVB Financial Group Proprietary and Confidential Note: Dollars in millions, except for per share amounts. As of September 30, 2023. (1) Amount in “Total” rows represents weighted average strike price.

SVB Neue Montreal (Headings) Bierstadt (Body) CONFIDENTIAL DRAFT Warrants – Top 50 Positions (Cont’d) La Last st U Un nd derl erly yiin ng g R Re emai maining ning Public / Fair Value @ Underlying Risk Free Assumed # Company Sector Industry Class Public / # Shares Fair Value @ Underlying A Ass sset et V Valuati aluatio on n Strike Price Y Yea ears rs @ @ Risk Free Assumed (1) Private 9/30/23 Asset Price Rate Volatility (1) # Company Sector Industry Class Private # Shares 9/30/23 Asset Price D Da ate te Strike Price 9/30/ 9/30/23 23 Rate Volatility Warrant Position 39 Common Private 128,690 $ 0.5 $ 1.55 5.35 4.99% 41.63% Warrant Position 39 Preferred Private 118,483 0.5 1.27 0.32 5.60% 41.63% Warrant Position 39 Common Private 44,726 0.2 1.81 7.25 4.82% 41.63% 39 Warrant Position 39 Total Life Sciences and Healthcare 291,899 $ 1.1 $ 5.87 6/30/2023 $ 1.47 Healthcare Warrant Position 40 Common Private 18,216 $ 1.1 $ 7.73 5.70 4.95% 39.15% 40 Warrant Position 40 Total Tech Software 18,216 $ 1.1 $ 79.00 1/27/2021 $ 7.73 Warrant Position 41 Common Private 170,130 $ 0.5 $ 0.08 0.64 5.55% 39.15% Warrant Position 41 Common Private 98,029 0.3 0.49 4.18 5.17% 39.15% Warrant Position 41 Common Private 84,080 0.2 0.50 6.50 4.88% 39.15% Warrant Position 41 Common Private 55,209 0.1 0.39 1.54 5.52% 39.15% 41 Warrant Position 41 Total Tech Software 407,448 $ 1.1 $ 3.50 5/7/2021 $ 0.31 Warrant Position 42 Common Public 40,000 $ 1.1 $ 9.79 4.85 4.61% 41.63% 42 Warrant Position 42 Total Life Sciences and Healthcare 40,000 $ 1.1 $ 34.16 8/31/2023 $ 9.79 Healthcare Warrant Position 43 Common Private 545,620 $ 0.9 $ 0.36 9.38 4.72% 39.15% Warrant Position 43 Common Private 252,811 0.2 2.21 11.20 4.64% 39.15% 43 Warrant Position 43 Total Tech Software 798,431 $ 1.1 $ 2.21 12/9/2022 $ 0.95 Warrant Position 44 Common Private 82,974 $ 0.8 $ 0.86 3.92 5.21% 39.15% Warrant Position 44 Common Private 36,088 0.3 2.17 5.59 4.97% 39.15% 44 Warrant Position 44 Total Tech Software 119,062 $ 1.1 $ 11.73 2/28/2023 $ 1.26 Warrant Position 45 Common Private 140,589 $ 0.3 $ 1.54 6.48 4.88% 39.15% Warrant Position 45 Common Private 91,447 0.2 0.79 4.65 5.07% 39.15% Warrant Position 45 Common Private 108,558 0.2 1.54 5.91 4.93% 39.15% Warrant Position 45 Common Private 124,913 0.2 2.12 7.66 4.79% 39.15% Warrant Position 45 Common Private 79,944 0.1 2.12 7.66 4.79% 39.15% Warrant Position 45 Common Private 54,279 0.1 1.54 5.91 4.93% 39.15% 45 Warrant Position 45 Total Tech Software 599,730 $ 1.1 $ 3.44 10/6/2022 $ 1.62 Warrant Position 46 Common Private 1,676,680 $ 0.7 $ 0.17 6.23 4.92% 39.15% Warrant Position 46 Common Private 484,000 0.2 0.09 0.90 5.61% 39.15% Warrant Position 46 Common Private 300,000 0.1 0.09 2.42 5.46% 39.15% 46 Warrant Position 46 Total Tech Hardware 2,460,680 $ 1.1 $ 0.64 6/30/2023 $ 0.15 12 SVB Financial Group Proprietary and Confidential Note: Dollars in millions, except for per share amounts. As of September 30, 2023. (1) Amount in “Total” rows represents weighted average strike price.

SVB Neue Montreal (Headings) Bierstadt (Body) CONFIDENTIAL DRAFT Warrants – Top 50 Positions (Cont’d) La Last st U Un nd derl erly yiin ng g R Re emai maining ning Public / Fair Value @ Underlying Risk Free Assumed # Company Sector Industry Class Public / # Shares Fair Value @ Underlying A Ass sset et V Valuati aluatio on n Strike Price Y Yea ears rs @ @ Risk Free Assumed (1) Private 9/30/23 Asset Price Rate Volatility (1) # Company Sector Industry Class Private # Shares 9/30/23 Asset Price D Da ate te Strike Price 9/30/ 9/30/23 23 Rate Volatility Warrant Position 47 Common Private 60,000 $ 0.3 $ 0.66 4.34 5.14% 39.15% Warrant Position 47 Common Private 55,160 0.3 1.21 9.49 4.72% 39.15% Warrant Position 47 Common Private 34,755 0.2 1.21 9.21 4.73% 39.15% Warrant Position 47 Common Private 30,945 0.2 0.80 8.86 4.74% 39.15% Warrant Position 47 Common Private 12,558 0.0 7.31 10.93 4.66% 39.15% 47 Warrant Position 47 Total Tech Software 193,418 $ 1.0 $ 7.31 9/1/2022 $ 1.37 Warrant Position 48 Preferred Private 55,000 $ 0.5 $ 1.26 5.67 4.95% 31.84% Warrant Position 48 Preferred Private 53,455 0.5 3.10 6.48 4.88% 31.84% 48 Warrant Position 48 Total Tech Energy and Resource 108,455 $ 1.0 $ 13.07 9/20/2022 $ 2.17 Innovation Warrant Position 49 Common Private 787,500 $ 0.6 $ 2.89 9.43 4.72% 30.53% Warrant Position 49 Common Private 1,125,000 0.4 4.00 8.08 4.78% 30.53% 49 Warrant Position 49 Total Life Sciences and Healthcare 1,912,500 $ 1.0 $ 2.89 3/3/2023 $ 3.54 Healthcare Warrant Position 50 Common Private 112,240 $ 0.4 $ 2.29 8.41 4.76% 39.15% Warrant Position 50 Common Private 63,600 0.3 0.23 3.74 5.25% 39.15% Warrant Position 50 Common Private 50,857 0.2 0.77 5.45 4.97% 39.15% Warrant Position 50 Common Private 14,093 0.1 2.29 8.41 4.76% 39.15% 11/5/2021 50 Warrant Position 50 Total Tech Software 240,790 $ 1.0 $ 6.13 11/5/2021 $ 1.42 13 SVB Financial Group Proprietary and Confidential Note: Dollars in millions, except for per share amounts. As of September 30, 2023. (1) Amount in “Total” rows represents weighted average strike price.

CONFIDENTIAL DRAFT Table of Contents SVBFG Direct Equity Investments SVBFG LP Fund Investments SVBFG Warrant Top 50 Positions SVB Capital Detail Cash Flow Forecast GUC Summary / Other MoffettNathanson 14
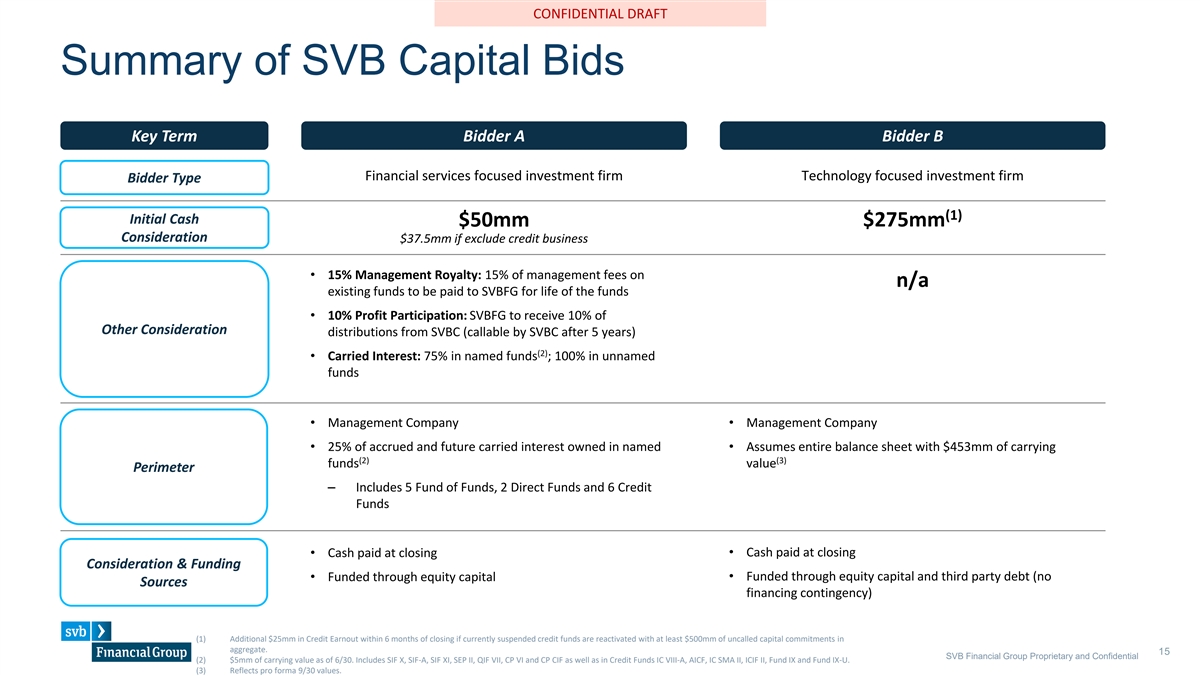
SVB Neue Montreal (Headings) Bierstadt (Body) CONFIDENTIAL DRAFT Summary of SVB Capital Bids Key Term Bidder A Bidder B Financial services focused investment firm Technology focused investment firm Bidder Type (1) Initial Cash $50mm $275mm Consideration $37.5mm if exclude credit business • 15% Management Royalty: 15% of management fees on n/a existing funds to be paid to SVBFG for life of the funds • 10% Profit Participation: SVBFG to receive 10% of Other Consideration distributions from SVBC (callable by SVBC after 5 years) (2) • Carried Interest: 75% in named funds ; 100% in unnamed funds • Management Company • Management Company • 25% of accrued and future carried interest owned in named • Assumes entire balance sheet with $453mm of carrying (2) (3) funds value Perimeter – Includes 5 Fund of Funds, 2 Direct Funds and 6 Credit Funds • Cash paid at closing • Cash paid at closing Consideration & Funding • Funded through equity capital • Funded through equity capital and third party debt (no Sources financing contingency) (1) Additional $25mm in Credit Earnout within 6 months of closing if currently suspended credit funds are reactivated with at least $500mm of uncalled capital commitments in aggregate. 15 SVB Financial Group Proprietary and Confidential (2) $5mm of carrying value as of 6/30. Includes SIF X, SIF-A, SIF XI, SEP II, QIF VII, CP VI and CP CIF as well as in Credit Funds IC VIII-A, AICF, IC SMA II, ICIF II, Fund IX and Fund IX-U. (3) Reflects pro forma 9/30 values.

SVB Neue Montreal (Headings) Bierstadt (Body) CONFIDENTIAL DRAFT SVB Capital Comparative Analysis On November 21, 2023, Bidder A provided a revised bid for SVB Capital which provided for: • Bidder A to purchase SVB Capital Management Company and 25% of SVBFG carried interest in newer vintage funds • $50 million purchase price paid at close • 15% of management fees on existing funds to be paid to SVBFG for life of the funds • Profit sharing on Management Company with final structure TBD The proposal was compared to the present value of cash flows for various go-forward scenarios where SVBFG maintains ownership of SVB Capital to manage the existing funds but does not pursue new fundraising activity • Scenario 1A: SVBFG maintains go forward ownership and existing funds operate in ordinary course • Scenario 1B: Reflects potential downside risk from limited operational disruption • Scenario 1C: Reflects potential further downside risk from additional disruption and reduced fund performance Base Case Scenarios Additional Scenarios (U.S. $ in millions) 11/21/23 11/21/23 (1) PV of Cash Flows Bidder A Bid Scenario 1A Scenario 1B Scenario 1C Bidder A Bid (3) Fund Performance Assumption Base Case Base Case Base Case Reduced Reduced Operational Disruption Assumption None None Limited Additional None PV of Cash PV of Cash vs. 11/21/23 PV of Cash PV of Cash PV of Cash Metric Flow Flow Bidder A Bid Flow Flow Flow Investment Management Advisor 50.0 138.8 88.8 92.4 68.1 50.0 15% Management Fee 45.0 - (45.0) - - 44.6 Total Investment Management Advisor 95.0 138.8 43.8 92.4 68.1 94.6 Carry from Funds Included in Bid 33.8 45.1 11.3 38.9 9.6 11.6 Other Carried & Capital Interest 388.1 388.1 - 362.7 280.8 302.7 Total Capital & Carried Interest 421.9 433.1 11.3 401.6 290.4 314.4 (2) TBD - TBD - - TBD Profit Share Total PV of Cash Flows 516.9 572.0 55.1 494.0 358.4 409.0 Note: Dollars in millions. Active Direct and FoF assume 3x MOIC, active credit funds assume 1.35x to 1.75x MOIC; legacy funds assume MOIC remains at current levels (1) All cash flows are discounted to 12/31/23 utilizing a 20% - 30% discount rate for capital and carried interest and a 12% - 18% discount rate on management fees for illustrative comparative purposes. Capital interest and carried interest cash flows utilize highly illustrative return target and distribution schedule assumptions for comparative purposes only. 16 SVB Financial Group Proprietary and Confidential (1) Analysis of the profit share component of the revised bid is still under review. (2) For reference, SVBC 2023E Fee Related Earnings are expected to be ~$4mm representing a margin of ~7%.

SVB Neue Montreal (Headings) Bierstadt (Body) C CON ONFIDENTI FIDENTIAL AL DRA DRAFT FT Limited Partner Profiles - SVB Capital’s Platform SVB Capital Assets by Limited Partner Category • Nearly $10B Limited Partners’ Capital Commitments 3.8% • SVB Capital has ~ 750 Limited Partners(“LPs”) 5.2% and continues to grow our LP base with a Public Pension Fund 6.3% strong pipeline 26.8% Family Office • $12.9M is the average investment size an LP Global Financial Institution across the Platform 12.1% Endowment/Foundation Insurance Pool/Company • 9 years is the average tenure Limited Partners Private Pension Fund have been investing with the Platform Operating Business • 15% of Limited Partners invest in both Fund Government Entity 12.9% of Funds and Direct Equity 19.6% • Five Limited Partners are invested across all three strategies 13.3% Note: As of June 30, 2023 Due to rounding, percentages may not total 100%. Several funds represented in these totals have not yet held their final LP Close. Investors encompass multiple Limited Partners which could be active across several funds and product types. SVB Financial Group Proprietary and Confidential 17 SVB Financial Group Proprietary and Confidential Investors may be duplicated as some are investors across multiple Strategies. GP commitments are excluded. Employee funds are included as a single HNW investor.

SVB Neue Montreal (Headings) Bierstadt (Body) CONFIDENTIAL DRAFT Limited Partner Profile by Strategy LP Assets by Category and Strategy Fund of Funds Direct Equity Private Credit In Market 2000-2023 In Market 2000-2023 In Market 2018-2023 1% 1% 6% 20% 21% 25% 27% 15% 32% 9% 6% 19% 18% 9% 13% 16% 25% 8% 8% 14% 8% Family Office Public Pension Fund Global Financial Institution Endowment/Foundation Insurance Pool/Company Private Pension Fund Government Entity Operating Business Note: As of June 30, 2023. Several funds represented in these totals have not yet held their final LP close (SIF XI, CP VI, ICIF II, Sprout II, and Arterial). Investors encompass multiple Limited Partners which 18 SVB Financial Group Proprietary and Confidential could be active across several funds and product types. Investors may be duplicated as some are invested across multiple strategies. GP commitments are excluded. Figures in pie charts represent the total LPs per type and % of total assets. QIF investments are included as a single HNWI investor.
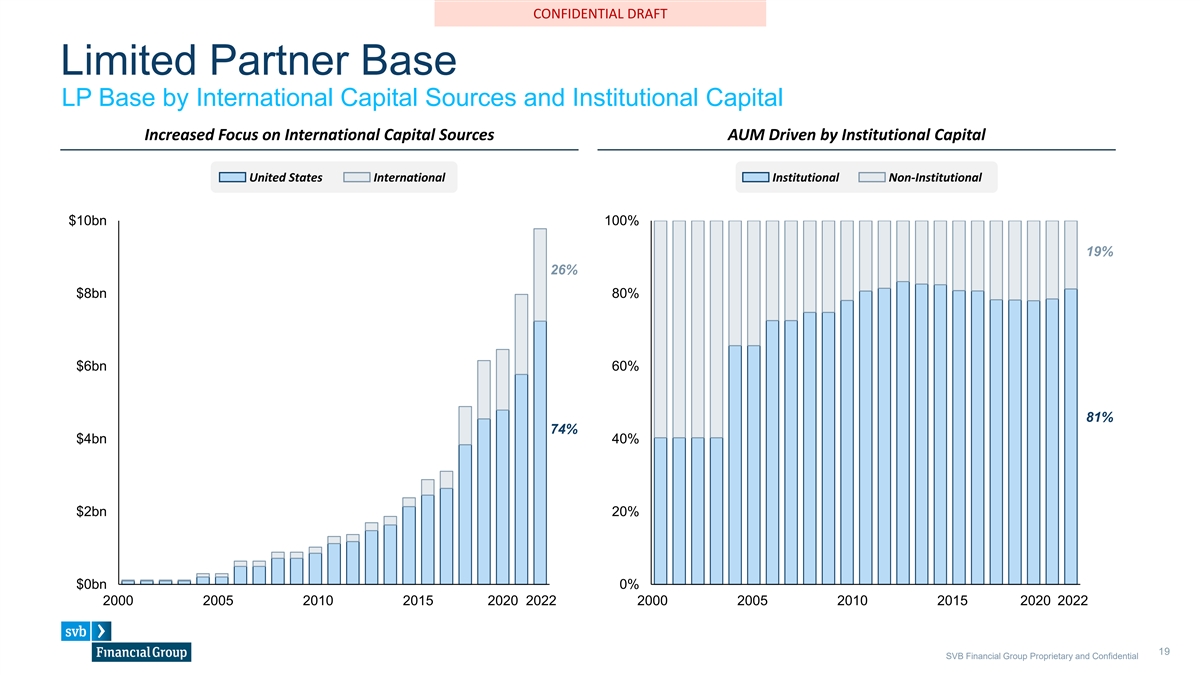
SVB Neue Montreal (Headings) Bierstadt (Body) CONFIDENTIAL DRAFT Limited Partner Base LP Base by International Capital Sources and Institutional Capital Increased Focus on International Capital Sources AUM Driven by Institutional Capital United States International Institutional Non-Institutional $10bn 100% 19% 26% $8bn 80% $6bn 60% 81% 74% $4bn 40% $2bn 20% $0bn 0% 2000 2005 2010 2015 2020 2022 2000 2005 2010 2015 2020 2022 19 SVB Financial Group Proprietary and Confidential
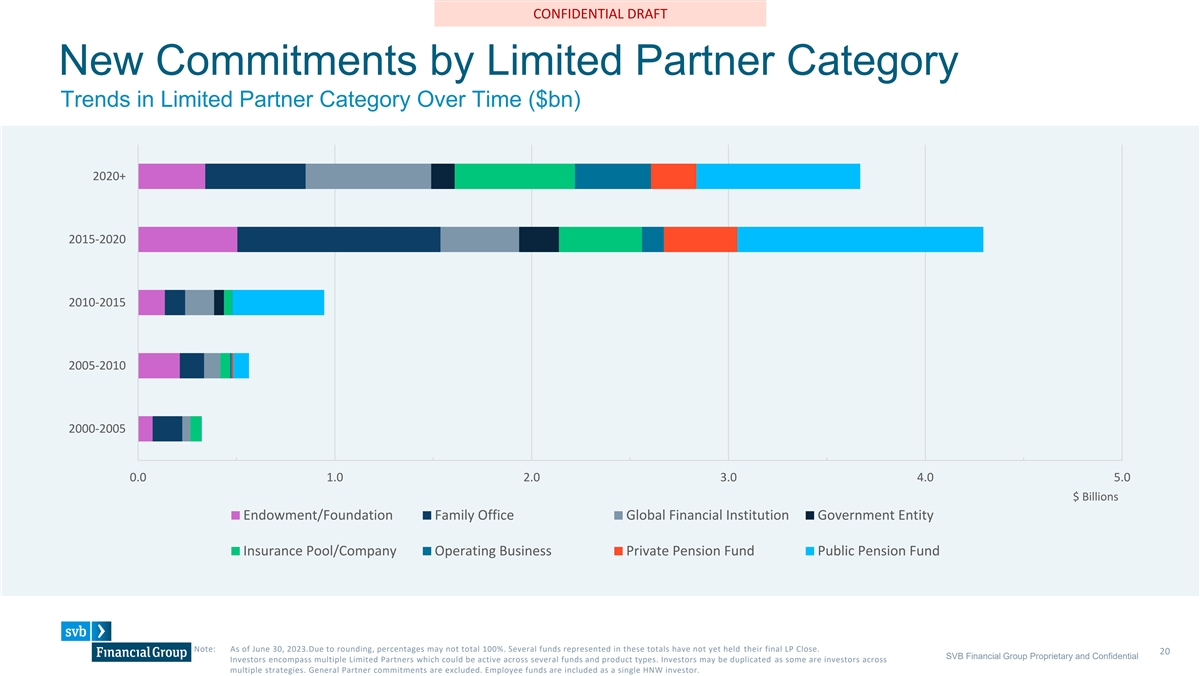
SVB Neue Montreal (Headings) Bierstadt (Body) C CON ONFIDENTI FIDENTIAL AL DRA DRAFT FT New Commitments by Limited Partner Category Trends in Limited Partner Category Over Time ($bn) 2020+ 2015-2020 2010-2015 2005-2010 2000-2005 0.0 1.0 2.0 3.0 4.0 5.0 $ Billions Endowment/Foundation Family Office Global Financial Institution Government Entity Insurance Pool/Company Operating Business Private Pension Fund Public Pension Fund Note: As of June 30, 2023.Due to rounding, percentages may not total 100%. Several funds represented in these totals have not yet held their final LP Close. 20 SVB Financial Group Proprietary and Confidential Investors encompass multiple Limited Partners which could be active across several funds and product types. Investors may be duplicated as some are investors across multiple strategies. General Partner commitments are excluded. Employee funds are included as a single HNW investor.
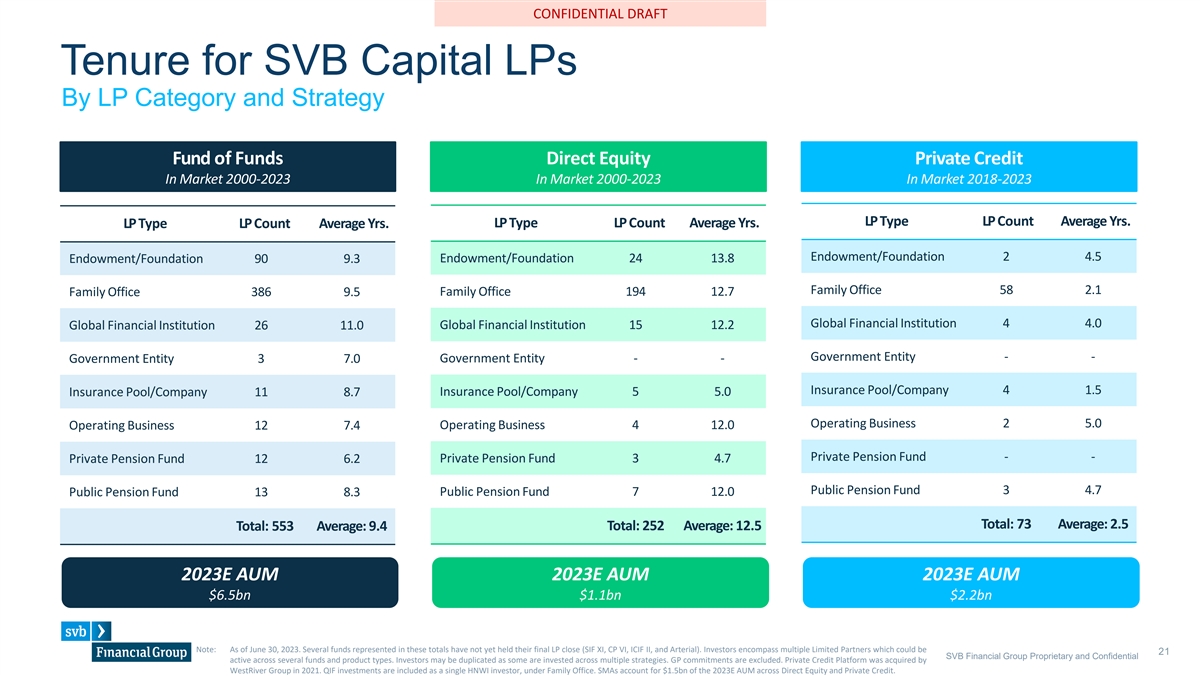
SVB Neue Montreal (Headings) Bierstadt (Body) CONFIDENTIAL DRAFT Tenure for SVB Capital LPs By LP Category and Strategy Fund of Funds Direct Equity Private Credit In Market 2000-2023 In Market 2000-2023 In Market 2018-2023 LP Type LP Count Average Yrs. LP Type LP Count Average Yrs. LP Type LP Count Average Yrs. Endowment/Foundation 2 4.5 Endowment/Foundation 90 9.3 Endowment/Foundation 24 13.8 Family Office 58 2.1 Family Office 194 12.7 Family Office 386 9.5 Global Financial Institution 4 4.0 Global Financial Institution 26 11.0 Global Financial Institution 15 12.2 Government Entity - - Government Entity 3 7.0 Government Entity - - Insurance Pool/Company 4 1.5 Insurance Pool/Company 5 5.0 Insurance Pool/Company 11 8.7 Operating Business 2 5.0 Operating Business 12 7.4 Operating Business 4 12.0 Private Pension Fund - - Private Pension Fund 12 6.2 Private Pension Fund 3 4.7 Public Pension Fund 3 4.7 Public Pension Fund 7 12.0 Public Pension Fund 13 8.3 Total: 73 Average: 2.5 Total: 553 Average: 9.4 Total: 252 Average: 12.5 2023E AUM 2023E AUM 2023E AUM $6.5bn $1.1bn $2.2bn Note: As of June 30, 2023. Several funds represented in these totals have not yet held their final LP close (SIF XI, CP VI, ICIF II, and Arterial). Investors encompass multiple Limited Partners which could be 21 SVB Financial Group Proprietary and Confidential active across several funds and product types. Investors may be duplicated as some are invested across multiple strategies. GP commitments are excluded. Private Credit Platform was acquired by WestRiver Group in 2021. QIF investments are included as a single HNWI investor, under Family Office. SMAs account for $1.5bn of the 2023E AUM across Direct Equity and Private Credit.
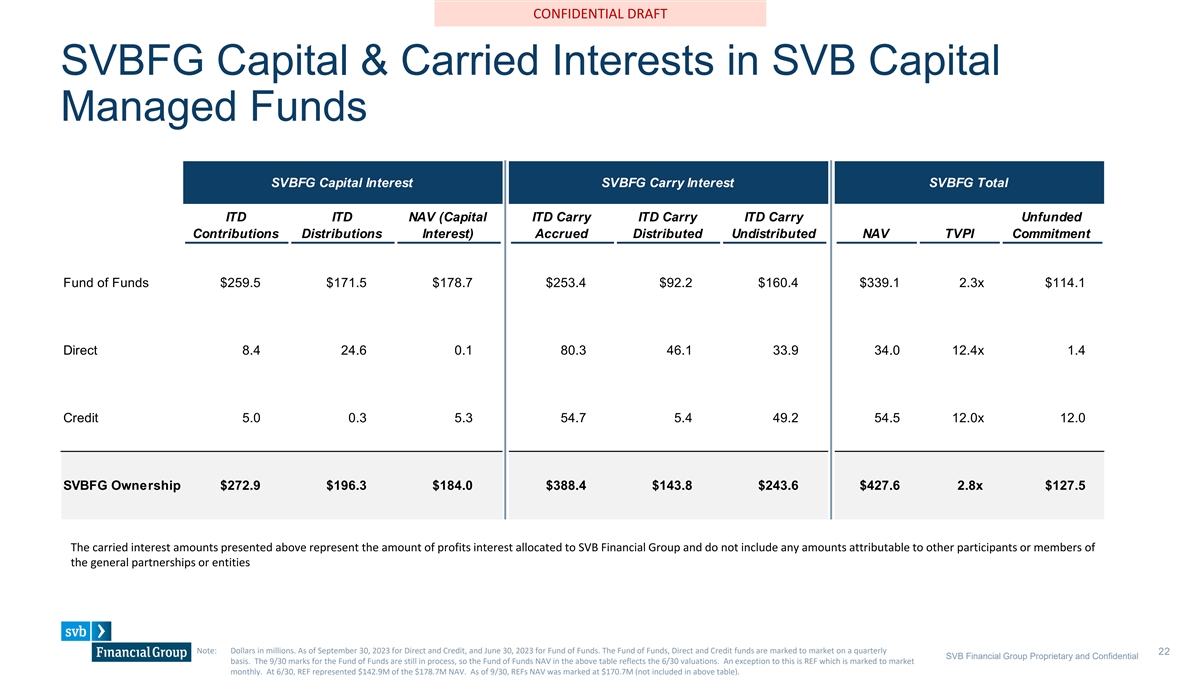
SVB Neue Montreal (Headings) Bierstadt (Body) CONFIDENTIAL DRAFT SVBFG Capital & Carried Interests in SVB Capital Managed Funds SVBFG Capital Interest SVBFG Carry Interest SVBFG Total ITD ITD NAV (Capital ITD Carry ITD Carry ITD Carry Unfunded Contributions Distributions Interest) Accrued Distributed Undistributed NAV TVPI Commitment Fund of Funds $259.5 $171.5 $178.7 $253.4 $92.2 $160.4 $339.1 2.3x $114.1 Direct 8.4 24.6 0.1 80.3 46.1 33.9 34.0 12.4x 1.4 Credit 5.0 0.3 5.3 54.7 5.4 49.2 54.5 12.0x 12.0 SVBFG Ownership $272.9 $196.3 $184.0 $388.4 $143.8 $243.6 $427.6 2.8x $127.5 The carried interest amounts presented above represent the amount of profits interest allocated to SVB Financial Group and do not include any amounts attributable to other participants or members of the general partnerships or entities Note: Dollars in millions. As of September 30, 2023 for Direct and Credit, and June 30, 2023 for Fund of Funds. The Fund of Funds, Direct and Credit funds are marked to market on a quarterly 22 SVB Financial Group Proprietary and Confidential basis. The 9/30 marks for the Fund of Funds are still in process, so the Fund of Funds NAV in the above table reflects the 6/30 valuations. An exception to this is REF which is marked to market monthly. At 6/30, REF represented $142.9M of the $178.7M NAV. As of 9/30, REFs NAV was marked at $170.7M (not included in above table).
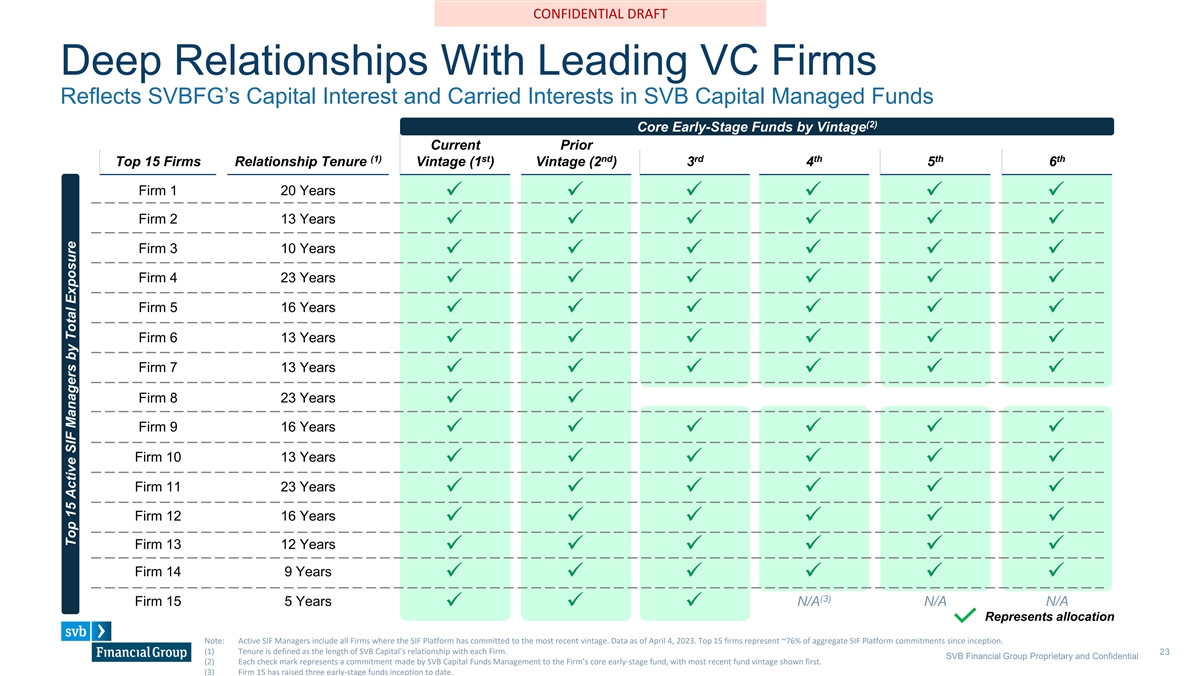
SVB Neue Montreal (Headings) Bierstadt (Body) C CON ONFIDENTI FIDENTIAL AL DRA DRAFT FT Deep Relationships With Leading VC Firms Reflects SVBFG’s Capital Interest and Carried Interests in SVB Capital Managed Funds (2) Core Early-Stage Funds by Vintage Current Prior (1) st nd rd th th th Top 15 Firms Relationship Tenure Vintage (1 ) Vintage (2 ) 3 4 5 6 Firm 1 20 Years ✓✓✓✓✓✓ Firm 2 13 Years ✓✓✓✓✓✓ Firm 3 10 Years ✓✓✓✓✓✓ Firm 4 23 Years ✓✓✓✓✓✓ Firm 5 16 Years ✓✓✓✓✓✓ Firm 6 13 Years ✓✓✓✓✓✓ Firm 7 13 Years ✓✓✓✓✓✓ Firm 8 23 Years ✓✓ Firm 9 16 Years ✓✓✓✓✓✓ Firm 10 13 Years ✓✓✓✓✓✓ Firm 11 23 Years ✓✓✓✓✓✓ Firm 12 16 Years ✓✓✓✓✓✓ Firm 13 12 Years ✓✓✓✓✓✓ Firm 14 9 Years ✓✓✓✓✓✓ (3) Firm 15 5 Years N/A N/A N/A ✓✓✓ Represents allocation Note: Active SIF Managers include all Firms where the SIF Platform has committed to the most recent vintage. Data as of April 4, 2023. Top 15 firms represent ~76% of aggregate SIF Platform commitments since inception. (1) Tenure is defined as the length of SVB Capital’s relationship with each Firm. 23 SVB Financial Group Proprietary and Confidential (2) Each check mark represents a commitment made by SVB Capital Funds Management to the Firm’s core early-stage fund, with most recent fund vintage shown first. (3) Firm 15 has raised three early-stage funds inception to date. Top 15 Active SIF Managers by Total Exposure
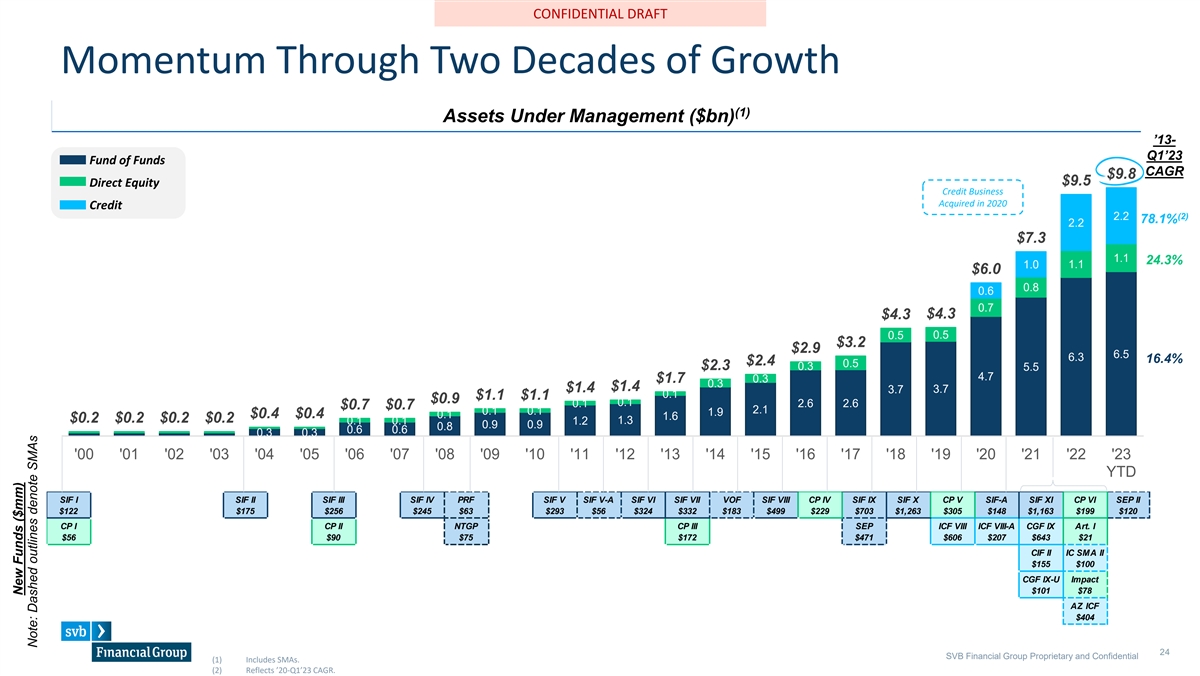
SVB Neue Montreal (Headings) Bierstadt (Body) C CON ONFIDENTI FIDENTIAL AL DRA DRAFT FT Momentum Through Two Decades of Growth (1) Assets Under Management ($bn) ’13- Q1’23 Fund of Funds CAGR $9.8 $9.5 Direct Equity Credit Business Acquired in 2020 Credit (2) 2.2 78.1% 2.2 $7.3 1.1 24.3% 1.1 1.0 $6.0 0.8 0.6 0.7 $4.3 $4.3 0.5 0.5 $3.2 $2.9 6.5 6.3 16.4% $2.4 0.5 $2.3 0.3 5.5 4.7 $1.7 0.3 0.3 $1.4 $1.4 3.7 3.7 0.1 $1.1 $1.1 $0.9 0.1 2.6 2.6 0.1 $0.7 $0.7 2.1 0.1 0.1 1.9 $0.4 $0.4 0.1 1.6 $0.2 $0.2 $0.2 $0.2 0.1 0.1 1.2 1.3 0.9 0.9 0.8 0.6 0.6 0.3 0.3 '00 '01 '02 '03 '04 '05 '06 '07 '08 '09 '10 '11 '12 '13 '14 '15 '16 '17 '18 '19 '20 '21 '22 '23 YTD SIF I SIF II SIF III SIF IV PRF SIF V SIF V-A SIF VI SIF VII VOF SIF VIII CP IV SIF IX SIF X CP V SIF-A SIF XI CP VI SEP II $122 $175 $256 $245 $63 $293 $56 $324 $332 $183 $499 $229 $703 $1,263 $305 $148 $1,163 $199 $120 CP I CP II NTGP CP III SEP ICF VIII ICF VIII-A CGF IX Art. I $56 $90 $75 $172 $471 $606 $207 $643 $21 CIF II IC SMA II $155 $100 CGF IX-U Impact $101 $78 AZ ICF $404 24 SVB Financial Group Proprietary and Confidential (1) Includes SMAs. (2) Reflects ’20-Q1’23 CAGR. New Funds ($mm) Note: Dashed outlines denote SMAs

SVB Neue Montreal (Headings) Bierstadt (Body) CONFIDENTIAL DRAFT Fund of Funds Performance VINTAGE FUND SIZE NET IRR NET TVPI NET DPI Outperforming th th th 4 Q 4 Q 4 Q SIF I 2000–02 $122M -1.6% 0.89x 0.87x the Public Markets 1st Q 1st Q 1st Q SIF II 2003–06 $175M 11.3% 2.14x 2.05x bps + OF ALPHA Top 5% 940 1st Q Top 5% SIF III 2006–08 $256M Top 5% 12.5% 2.70x 2.19x vs. 8.43% IRR from S&P 500 1st Q 1st Q 1st Q SIF IV 2008–11 $245M 17.0% 3.53x 2.44x + 940 bps vs. 8.44% IRR from Russell 3000 Top 5% Top 5% Top 5% SIF V 2011–13 $293M 27.3% 5.75x 3.80x 1st Q 1st Q 1st Q SIF VI 2013–14 $324M 24.6% 4.18x 1.28x bps 1st Q Top 5% 2nd Q SIF VII 2015–16 $332M 26.3% 3.48x 0.83x + OF ALPHA 599 1st Q 1st Q 3rd Q SIF VIII 2016–18 $499M 34.8% 3.21x 0.27x vs. 11.85% IRR from NASDAQ + 1,042 bps vs. 7.42% IRR from 3rd Q 1st Q SIF IX 2018–20 $703M 30.2% 1.82x 0.00x Russell 2000 SIF X 2019–22 $1,263M Too Early Too Early Too Early Note: Performance is reflective of highest fee-paying Limited Partners as of September 30, 2022. Cambridge Associates benchmarks are as of September 30, 2022. Benchmarks represent returns net of fees, expenses and carried interest and are Cambridge Associates Fund of Funds Net to Limited Partner TVPI benchmarks. Cambridge Associates provides this data at no charge. SIF X is a young portfolio. PME based on Direct Alpha methodology for SIF I- IX, SEP, VOF, NTGP and 25 SVB Financial Group Proprietary and Confidential PRF from 2000 – September 30, 2022. Outperformance cannot be guaranteed. Past performance is not a guarantee of future results. Future results cannot be guaranteed.

SVB Neue Montreal (Headings) Bierstadt (Body) CONFIDENTIAL DRAFT Direct Equity Performance Outperforming the Public Markets VINTAGE FUND SIZE NET IRR NET TVPI NET DPI bps + Top Top Top OF ALPHA 992 5% 5% 5% CP I 2000 $56M 11.0% 2.65x 2.65x Top vs. 6.36% IRR from S&P 500 1st Q 1st Q CP II 2006 $90M 20.4% 5% 3.00x 2.94x + 677 bps vs. 8.81% IRR from NASDAQ 3rd Q 3rd Q 2nd Q CP III 2014 $172M 18.5% 2.50x 1.25x 3rd Q 2nd Q 1st Q VOF I 2015 $183M 19.7% 2.41x 1.60x th th 4 Q 3rd Q 4 Q 3 bps CP IV 2017 $229M 14.4% 1.53x 0.00x + OF ALPHA 901 2nd Q 2nd Q 1st Q 4 CP V 2020 $305M 22.9% 1.32x 0.00x vs. 6.57% IRR from Russell 3000 + 892 bps vs. 6.66% IRR from Russell 2000 Note: CP I was fully realized in 2020. VOF I includes fund investments as well as direct investments. $88M was allocated to direct company investments as of September 30, 2022. CP IV recycled $30.1M based on proceeds from three portfolio companies. CP V recycled $8.4M based on proceeds from one portfolio company. CP I-V Performance is net to Limited Partners and as of December 31, 2022. VOF I performance is net to Limited Partners and as of September 30, 2022. The VOF I portfolio includes fund investments which cause a delay reporting cycle from the CP program. Cambridge Associates benchmarks are as of September 30, 2022. Benchmarks represent returns net of fees, expenses and carried interest and are Cambridge Associates US VC Net to Limited Partner 26 SVB Financial Group Proprietary and Confidential benchmarks. Cambridge Associates provides this data at no charge. Past performance is not indicative of future returns. PME based on Direct Alpha methodology for CP I-V from 2000-2022. Outperformance cannot be guaranteed. Past performance is not a guarantee of future results.

SVB Neue Montreal (Headings) Bierstadt (Body) CONFIDENTIAL DRAFT Credit Performance Funds I-IX and (2) Income Fund II FUND LOAN PRINCIPAL GROSS GROSS NET VINTAGE NET IRR NET DPI COMMIT. COMMIT. FUNDED IRR TVPI TVPI 1st Q 1st Q (1) I-VII Pre-2021 $760M $1,408M $1,062M 21.3% 1.44x 30.4% 1.73x 1.63x 1st Q 1st Q 28.0% VIII 2018 $606M $2,720M $2,206M 18.9% 1.20x 22.2% 1.29x 0.66x Net IRR VIII-A 2021 $207M $499M $332M Growth IX 2021 $593M $380M $169M Too Early Income II 2022 $155M $7M $7M 1.36x Net TVPI Note: Please see “Additional Information Regarding Funds I-VIII,” “Notes Regarding SVB Capital Credit Fund Performance Metrics“ and “Financial Definitions” at the end of this presentation to help interpret historical performance data provided herein. Data as of September 30, 2022. Past performance is not indicative of future results, which may vary. The value of investments and the income derived from them can go down as well as up. Future returns are not guaranteed and a total loss of principal may occur. Top Quartile Designation based on Preqin benchmarking of all private debt funds as of September 30, 2022, by weighted average net IRR and DPI. In order to ensure an adequate sample size, the calculation takes into account vintages from 2012 to 2019. The Preqin dataset does not include TVPI benchmarks. No fees were paid in connection with this benchmarking. Funds VIII-A, Growth IX, and Income II are young portfolios. (1) Funds I-VII were managed by WestRiver Management, LLC. Performance information with respect to such funds is presented in aggregate. (2) The SVB Capital Credit Funds financial performance metrics are for the Prior Funds, Growth Fund IX and Income Fund II on an aggregated basis and were calculated by aggregating the commitments, investments and cash flows of each fund and calculating performance metrics as if such commitments were made to, such investments were made by, and such 27 SVB Financial Group Proprietary and Confidential cash flows were of, a single fund. Net Fund IRR and Net Fund TVPI for the Prior Funds, Growth Fund IX and Income Fund II, on an aggregated basis, were calculated based on actual fee arrangements with limited partners of such funds and, accordingly, reflect the impact of weighted average fees charged to limited partners of such funds.
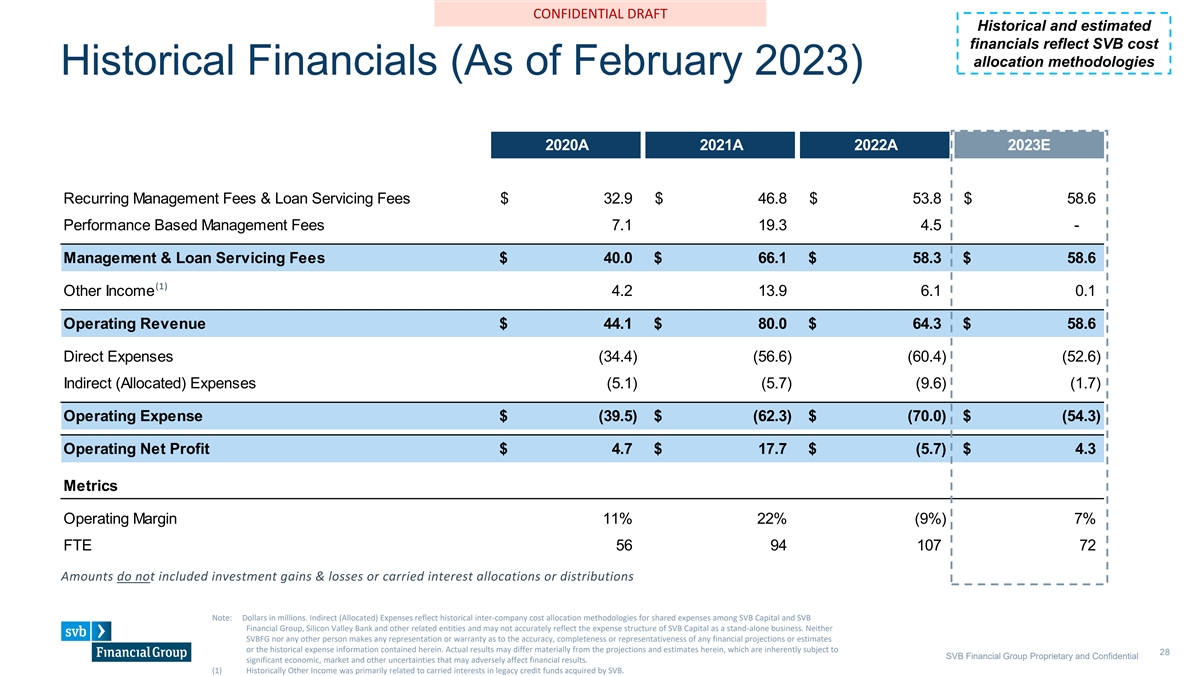
SVB Neue Montreal (Headings) Bierstadt (Body) CONFIDENTIAL DRAFT Historical and estimated financials reflect SVB cost allocation methodologies Historical Financials (As of February 2023) 2020A 2021A 2022A 2023E Recurring Management Fees & Loan Servicing Fees $ 32.9 $ 46.8 $ 53.8 $ 58.6 Performance Based Management Fees 7.1 19.3 4.5 - Management & Loan Servicing Fees $ 40.0 $ 66.1 $ 58.3 $ 58.6 (1) Other Income 4.2 13.9 6.1 0.1 Operating Revenue $ 44.1 $ 80.0 $ 64.3 $ 58.6 Direct Expenses (34.4) (56.6) (60.4) (52.6) Indirect (Allocated) Expenses (5.1) (5.7) (9.6) (1.7) Operating Expense $ (39.5) $ (62.3) $ (70.0) $ (54.3) Operating Net Profit $ 4.7 $ 17.7 $ (5.7) $ 4.3 Metrics Operating Margin 11% 22% (9%) 7% FTE 56 94 107 72 Amounts do not included investment gains & losses or carried interest allocations or distributions Note: Dollars in millions. Indirect (Allocated) Expenses reflect historical inter-company cost allocation methodologies for shared expenses among SVB Capital and SVB Financial Group, Silicon Valley Bank and other related entities and may not accurately reflect the expense structure of SVB Capital as a stand-alone business. Neither SVBFG nor any other person makes any representation or warranty as to the accuracy, completeness or representativeness of any financial projections or estimates or the historical expense information contained herein. Actual results may differ materially from the projections and estimates herein, which are inherently subject to 28 SVB Financial Group Proprietary and Confidential significant economic, market and other uncertainties that may adversely affect financial results. (1) Historically Other Income was primarily related to carried interests in legacy credit funds acquired by SVB.
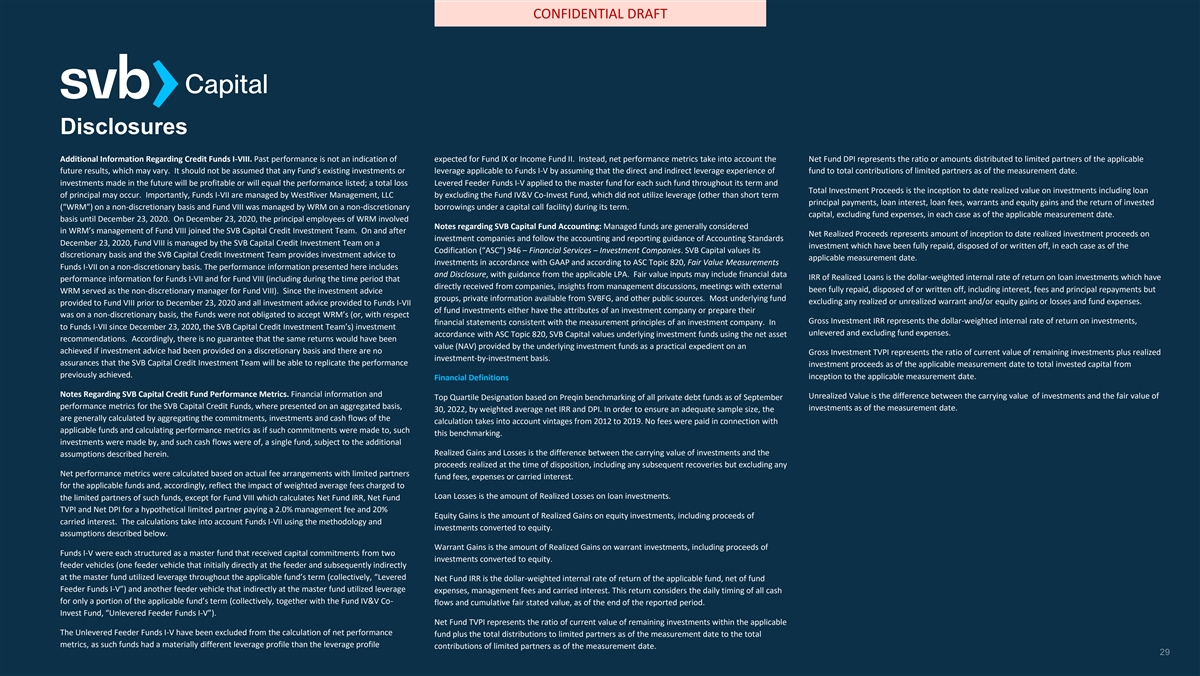
CONFIDENTIAL DRAFT Disclosures Additional Information Regarding Credit Funds I-VIII. Past performance is not an indication of expected for Fund IX or Income Fund II. Instead, net performance metrics take into account the Net Fund DPI represents the ratio or amounts distributed to limited partners of the applicable future results, which may vary. It should not be assumed that any Fund’s existing investments or leverage applicable to Funds I-V by assuming that the direct and indirect leverage experience of fund to total contributions of limited partners as of the measurement date. investments made in the future will be profitable or will equal the performance listed; a total loss Levered Feeder Funds I-V applied to the master fund for each such fund throughout its term and Total Investment Proceeds is the inception to date realized value on investments including loan of principal may occur. Importantly, Funds I-VII are managed by WestRiver Management, LLC by excluding the Fund IV&V Co-Invest Fund, which did not utilize leverage (other than short term principal payments, loan interest, loan fees, warrants and equity gains and the return of invested (“WRM”) on a non-discretionary basis and Fund VIII was managed by WRM on a non-discretionary borrowings under a capital call facility) during its term. capital, excluding fund expenses, in each case as of the applicable measurement date. basis until December 23, 2020. On December 23, 2020, the principal employees of WRM involved Notes regarding SVB Capital Fund Accounting: Managed funds are generally considered in WRM’s management of Fund VIII joined the SVB Capital Credit Investment Team. On and after Net Realized Proceeds represents amount of inception to date realized investment proceeds on investment companies and follow the accounting and reporting guidance of Accounting Standards December 23, 2020, Fund VIII is managed by the SVB Capital Credit Investment Team on a investment which have been fully repaid, disposed of or written off, in each case as of the Codification (“ASC”) 946 – Financial Services – Investment Companies. SVB Capital values its discretionary basis and the SVB Capital Credit Investment Team provides investment advice to applicable measurement date. investments in accordance with GAAP and according to ASC Topic 820, Fair Value Measurements Funds I-VII on a non-discretionary basis. The performance information presented here includes and Disclosure, with guidance from the applicable LPA. Fair value inputs may include financial data IRR of Realized Loans is the dollar-weighted internal rate of return on loan investments which have performance information for Funds I-VII and for Fund VIII (including during the time period that directly received from companies, insights from management discussions, meetings with external been fully repaid, disposed of or written off, including interest, fees and principal repayments but WRM served as the non-discretionary manager for Fund VIII). Since the investment advice groups, private information available from SVBFG, and other public sources. Most underlying fund excluding any realized or unrealized warrant and/or equity gains or losses and fund expenses. provided to Fund VIII prior to December 23, 2020 and all investment advice provided to Funds I-VII of fund investments either have the attributes of an investment company or prepare their was on a non-discretionary basis, the Funds were not obligated to accept WRM’s (or, with respect Gross Investment IRR represents the dollar-weighted internal rate of return on investments, financial statements consistent with the measurement principles of an investment company. In to Funds I-VII since December 23, 2020, the SVB Capital Credit Investment Team’s) investment unlevered and excluding fund expenses. accordance with ASC Topic 820, SVB Capital values underlying investment funds using the net asset recommendations. Accordingly, there is no guarantee that the same returns would have been value (NAV) provided by the underlying investment funds as a practical expedient on an achieved if investment advice had been provided on a discretionary basis and there are no Gross Investment TVPI represents the ratio of current value of remaining investments plus realized investment-by-investment basis. assurances that the SVB Capital Credit Investment Team will be able to replicate the performance investment proceeds as of the applicable measurement date to total invested capital from previously achieved. inception to the applicable measurement date. Financial Definitions Notes Regarding SVB Capital Credit Fund Performance Metrics. Financial information and Unrealized Value is the difference between the carrying value of investments and the fair value of Top Quartile Designation based on Preqin benchmarking of all private debt funds as of September performance metrics for the SVB Capital Credit Funds, where presented on an aggregated basis, investments as of the measurement date. 30, 2022, by weighted average net IRR and DPI. In order to ensure an adequate sample size, the are generally calculated by aggregating the commitments, investments and cash flows of the calculation takes into account vintages from 2012 to 2019. No fees were paid in connection with applicable funds and calculating performance metrics as if such commitments were made to, such this benchmarking. investments were made by, and such cash flows were of, a single fund, subject to the additional Realized Gains and Losses is the difference between the carrying value of investments and the assumptions described herein. proceeds realized at the time of disposition, including any subsequent recoveries but excluding any Net performance metrics were calculated based on actual fee arrangements with limited partners fund fees, expenses or carried interest. for the applicable funds and, accordingly, reflect the impact of weighted average fees charged to Loan Losses is the amount of Realized Losses on loan investments. the limited partners of such funds, except for Fund VIII which calculates Net Fund IRR, Net Fund TVPI and Net DPI for a hypothetical limited partner paying a 2.0% management fee and 20% Equity Gains is the amount of Realized Gains on equity investments, including proceeds of carried interest. The calculations take into account Funds I-VII using the methodology and investments converted to equity. assumptions described below. Warrant Gains is the amount of Realized Gains on warrant investments, including proceeds of Funds I-V were each structured as a master fund that received capital commitments from two investments converted to equity. feeder vehicles (one feeder vehicle that initially directly at the feeder and subsequently indirectly at the master fund utilized leverage throughout the applicable fund’s term (collectively, “Levered Net Fund IRR is the dollar-weighted internal rate of return of the applicable fund, net of fund Feeder Funds I-V”) and another feeder vehicle that indirectly at the master fund utilized leverage expenses, management fees and carried interest. This return considers the daily timing of all cash for only a portion of the applicable fund’s term (collectively, together with the Fund IV&V Co- flows and cumulative fair stated value, as of the end of the reported period. Invest Fund, “Unlevered Feeder Funds I-V”). Net Fund TVPI represents the ratio of current value of remaining investments within the applicable The Unlevered Feeder Funds I-V have been excluded from the calculation of net performance fund plus the total distributions to limited partners as of the measurement date to the total metrics, as such funds had a materially different leverage profile than the leverage profile contributions of limited partners as of the measurement date. 29
CONFIDENTIAL DRAFT Table of Contents SVBFG Direct Equity Investments SVBFG LP Fund Investments SVBFG Warrant Top 50 Positions SVB Capital Detail Cash Flow Forecast GUC Summary / Other MoffettNathanson 30
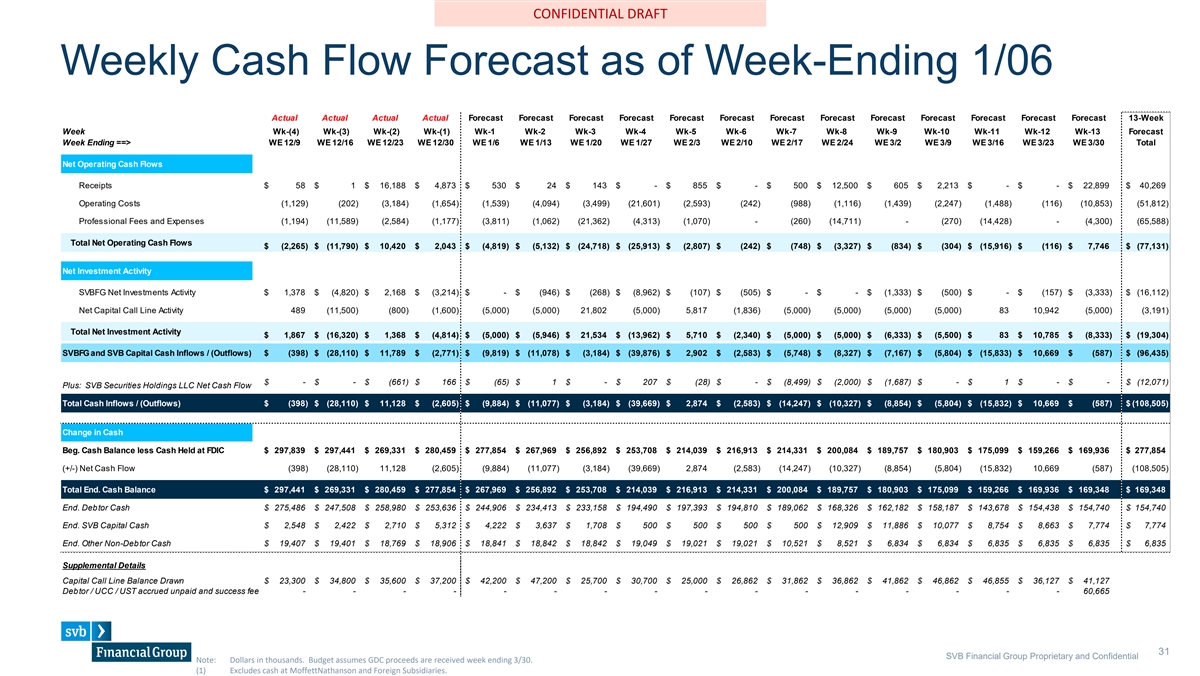
SVB Neue Montreal (Headings) Bierstadt (Body) CONFIDENTIAL DRAFT Weekly Cash Flow Forecast as of Week-Ending 1/06 Actual Actual Actual Actual Forecast Forecast Forecast Forecast Forecast Forecast Forecast Forecast Forecast Forecast Forecast Forecast Forecast 13-Week Week Wk-(4) Wk-(3) Wk-(2) Wk-(1) Wk-1 Wk-2 Wk-3 Wk-4 Wk-5 Wk-6 Wk-7 Wk-8 Wk-9 Wk-10 Wk-11 Wk-12 Wk-13 Forecast Week Ending ==> WE 12/9 WE 12/16 WE 12/23 WE 12/30 WE 1/6 WE 1/13 WE 1/20 WE 1/27 WE 2/3 WE 2/10 WE 2/17 WE 2/24 WE 3/2 WE 3/9 WE 3/16 WE 3/23 WE 3/30 Total Net Operating Cash Flows Receipts $ 58 $ 1 $ 16,188 $ 4,873 $ 530 $ 24 $ 143 $ - $ 855 $ - $ 500 $ 1 2,500 $ 605 $ 2,213 $ - $ - $ 2 2,899 $ 40,269 Operating Costs (1,129) (202) (3,184) (1,654) (1,539) (4,094) (3,499) (21,601) (2,593) (242) (988) (1,116) (1,439) (2,247) (1,488) (116) (1 0,853) (51,812) Professional Fees and Expenses (1,194) (1 1,589) (2,584) (1,177) (3,811) (1,062) (21,362) (4,313) (1,070) - (260) (14,711) - (270) (1 4,428) - (4,300) (65,588) Total Net Operating Cash Flows $ (2 ,265) $ (11,790) $ 1 0,420 $ 2,043 $ (4,819) $ (5 ,132) $ (24,718) $ (25,913) $ (2,807) $ (242) $ (748) $ (3 ,327) $ (834) $ (304) $ (15,916) $ (116) $ 7,746 $ (77,131) Net Investment Activity SVBFG Net Investments Activity $ 1,378 $ (4 ,820) $ 2,168 $ (3,214) $ - $ (946) $ (268) $ (8 ,962) $ (107) $ (505) $ - $ - $ (1,333) $ (500) $ - $ (157) $ (3 ,333) $ (16,112) Net Capital Call Line Activity 489 (11,500) (800) (1,600) (5,000) (5,000) 21,802 (5,000) 5,817 (1,836) (5,000) (5,000) (5,000) (5,000) 83 10,942 (5,000) (3,191) Total Net Investment Activity $ 1,867 $ (16,320) $ 1,368 $ (4,814) $ (5 ,000) $ (5,946) $ 2 1,534 $ (13,962) $ 5,710 $ (2 ,340) $ (5 ,000) $ (5,000) $ (6 ,333) $ (5 ,500) $ 83 $ 1 0,785 $ (8,333) $ (19,304) SVBFG and SVB Capital Cash Inflows / (Outflows) $ (398) $ (28,110) $ 11,789 $ (2 ,771) $ (9 ,819) $ (11,078) $ (3,184) $ (39,876) $ 2,902 $ (2,583) $ (5 ,748) $ (8,327) $ (7 ,167) $ (5,804) $ (15,833) $ 10,669 $ (587) $ (96,435) $ - $ - $ (661) $ 166 $ (65) $ 1 $ - $ 207 $ (28) $ - $ (8,499) $ (2,000) $ (1,687) $ - $ 1 $ - $ - $ (12,071) Plus: SVB Securities Holdings LLC Net Cash Flow Total Cash Inflows / (Outflows) $ (398) $ (28,110) $ 1 1,128 $ (2,605) $ (9 ,884) $ (11,077) $ (3,184) $ (39,669) $ 2,874 $ (2,583) $ (14,247) $ (10,327) $ (8,854) $ (5 ,804) $ (15,832) $ 1 0,669 $ (587) $ (108,505) Change in Cash Beg. Cash Balance less Cash Held at FDIC $ 297,839 $ 297,441 $ 269,331 $ 280,459 $ 277,854 $ 267,969 $ 256,892 $ 253,708 $ 214,039 $ 216,913 $ 214,331 $ 200,084 $ 189,757 $ 180,903 $ 175,099 $ 159,266 $ 169,936 $ 277,854 (+/-) Net Cash Flow (398) (28,110) 11,128 (2,605) (9,884) (1 1,077) (3,184) (39,669) 2,874 (2,583) (14,247) (1 0,327) (8,854) (5,804) (1 5,832) 10,669 (587) (108,505) Total End. Cash Balance $ 297,441 $ 269,331 $ 280,459 $ 277,854 $ 267,969 $ 256,892 $ 253,708 $ 214,039 $ 216,913 $ 214,331 $ 200,084 $ 189,757 $ 180,903 $ 175,099 $ 159,266 $ 169,936 $ 169,348 $ 169,348 End. Debtor Cash (1) $ 275,486 $ 247,508 $ 258,980 $ 253,636 $ 244,906 $ 234,413 $ 233,158 $ 194,490 $ 197,393 $ 194,810 $ 189,062 $ 168,326 $ 162,182 $ 158,187 $ 143,678 $ 154,438 $ 154,740 $ 154,740 End. SVB Capital Cash $ 2,548 $ 2,422 $ 2,710 $ 5,312 $ 4,222 $ 3,637 $ 1,708 $ 500 $ 500 $ 500 $ 500 $ 12,909 $ 11,886 $ 10,077 $ 8,754 $ 8,663 $ 7,774 $ 7,774 End. Other Non-Debtor Cash $ 19,407 $ 19,401 $ 18,769 $ 18,906 $ 18,841 $ 18,842 $ 18,842 $ 19,049 $ 19,021 $ 19,021 $ 10,521 $ 8,521 $ 6,834 $ 6,834 $ 6,835 $ 6,835 $ 6,835 $ 6,835 Supplemental Details Capital Call Line Balance Drawn $ 23,300 $ 34,800 $ 35,600 $ 37,200 $ 42,200 $ 47,200 $ 25,700 $ 30,700 $ 25,000 $ 26,862 $ 31,862 $ 36,862 $ 41,862 $ 46,862 $ 46,855 $ 36,127 $ 41,127 Debtor / UCC / UST accrued unpaid and success fees - - - - - - - - - - - - - - - - 60,665 31 SVB Financial Group Proprietary and Confidential Note: Dollars in thousands. Budget assumes GDC proceeds are received week ending 3/30. (1) Excludes cash at MoffettNathanson and Foreign Subsidiaries.
CONFIDENTIAL DRAFT Table of Contents SVBFG Direct Equity Investments SVBFG LP Fund Investments SVBFG Warrant Top 50 Positions SVB Capital Detail Cash Flow Forecast GUC Summary / Other MoffettNathanson 32
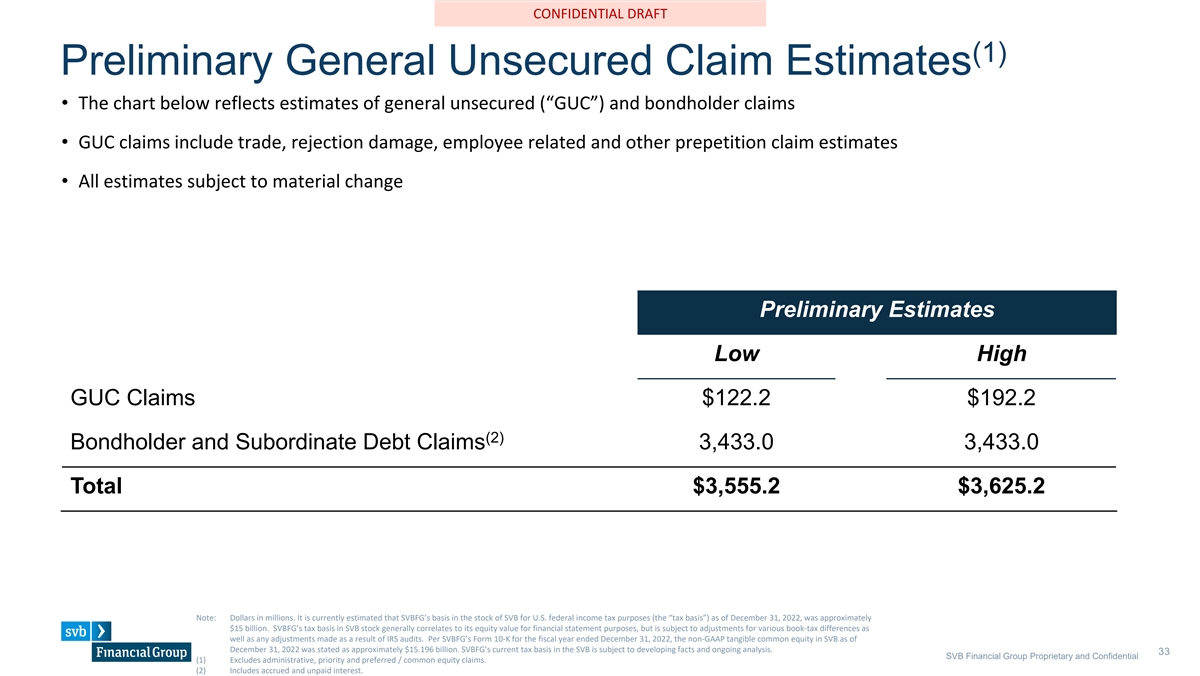
SVB Neue Montreal (Headings) Bierstadt (Body) CONFIDENTIAL DRAFT (1) Preliminary General Unsecured Claim Estimates • The chart below reflects estimates of general unsecured (“GUC”) and bondholder claims • GUC claims include trade, rejection damage, employee related and other prepetition claim estimates • All estimates subject to material change Preliminary Estimates Low High GUC Claims $122.2 $192.2 (2) Bondholder and Subordinate Debt Claims 3,433.0 3,433.0 Total $3,555.2 $3,625.2 Note: Dollars in millions. It is currently estimated that SVBFG’s basis in the stock of SVB for U.S. federal income tax purposes (the “tax basis”) as of December 31, 2022, was approximately $15 billion. SVBFG’s tax basis in SVB stock generally correlates to its equity value for financial statement purposes, but is subject to adjustments for various book-tax differences as well as any adjustments made as a result of IRS audits. Per SVBFG’s Form 10-K for the fiscal year ended December 31, 2022, the non-GAAP tangible common equity in SVB as of December 31, 2022 was stated as approximately $15.196 billion. SVBFG’s current tax basis in the SVB is subject to developing facts and ongoing analysis. 33 SVB Financial Group Proprietary and Confidential (1) Excludes administrative, priority and preferred / common equity claims. (2) Includes accrued and unpaid interest.
CONFIDENTIAL DRAFT Table of Contents SVBFG Direct Equity Investments SVBFG LP Fund Investments SVBFG Warrant Top 50 Positions SVB Capital Detail Cash Flow Forecast GUC Summary / Other MoffettNathanson 34
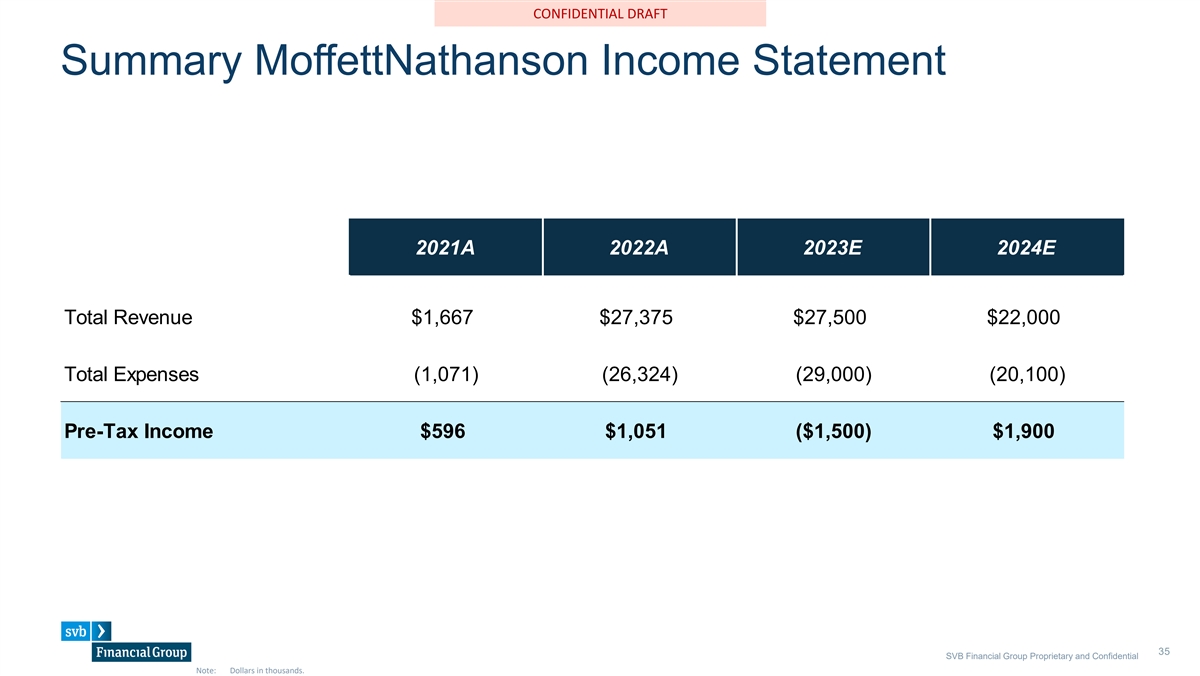
SVB Neue Montreal (Headings) Bierstadt (Body) CONFIDENTIAL DRAFT Summary MoffettNathanson Income Statement 2021A 2022A 2023E 2024E Total Revenue $1,667 $27,375 $27,500 $22,000 Total Expenses (1,071) (26,324) (29,000) (20,100) Pre-Tax Income $596 $1,051 ($1,500) $1,900 35 SVB Financial Group Proprietary and Confidential Note: Dollars in thousands.