|
Exhibit 99.1 
|
Exhibit 99.1
2015 ANALYSTAND INVESTOR DAY
MAY 21, 2015
SAFE HARBOR STATEMENT
Forward-Looking Statements
The Private Securities Litigation Reform Act of 1995 provides a safe harbor for certain forward-looking statements. The company’s Annual Report, as well as the Report on Form 10-K, its
Quarterly Reports on Form 10-Q and other filings with the Securities and Exchange Commission, the company’s press releases and oral statements made with the approval of an authorized executive officer, contain forward-looking statements that reflect the company’s current views with respect to future events and financial performance. These forward-looking statements are subject to certain risks and uncertainties that could cause actual results to differ materially from historical results or those anticipated. The words “aim,” “believe,” “expect,” “anticipate,” “intend,” “estimate” and other expressions that indicate future events and trends identify forward-looking statements including statements related to our fiscal 2016 outlook, business strategy, expected inventory reductions, product introductions and demand. Actual future results and trends may differ materially from historical results or those anticipated depending on a variety of factors, including, but not limited to those set forth in the company’s Annual Report on Form 10-K for the year ended March 31, 2014, under heading “Item 1A. Risk Factors.” The company does not undertake any obligation to publicly update or revise any forward-looking statement, whether as a result of new information, future events or otherwise.
TODAY’S AGENDA1
INTRODUCTIONS
4 | | 2020 VISION & STRATEGIC PLAN |
BREAK
CHRIS EPERJESY BACKGROUND
13 YEARS AS PUBLIC COMPANY CFO
CFO at Twin Disc, Inc.
International acquisitions
Global manufacturing & supply chain experience
25 YEARS OF INTERNATIONAL BUSINESS
DaimlerChrysler – USA, Belgium & Germany
PwC – USA & Germany
GUIDING PRINCIPLES
Finance enables profitable growth
Processes matter
Talent and its development are critical to succeed
Investors need to be kept informed
Chris Eperjesy
FINANCIAL
PERSPECTIVE
2015 FISCAL YEAR OVERVIEW
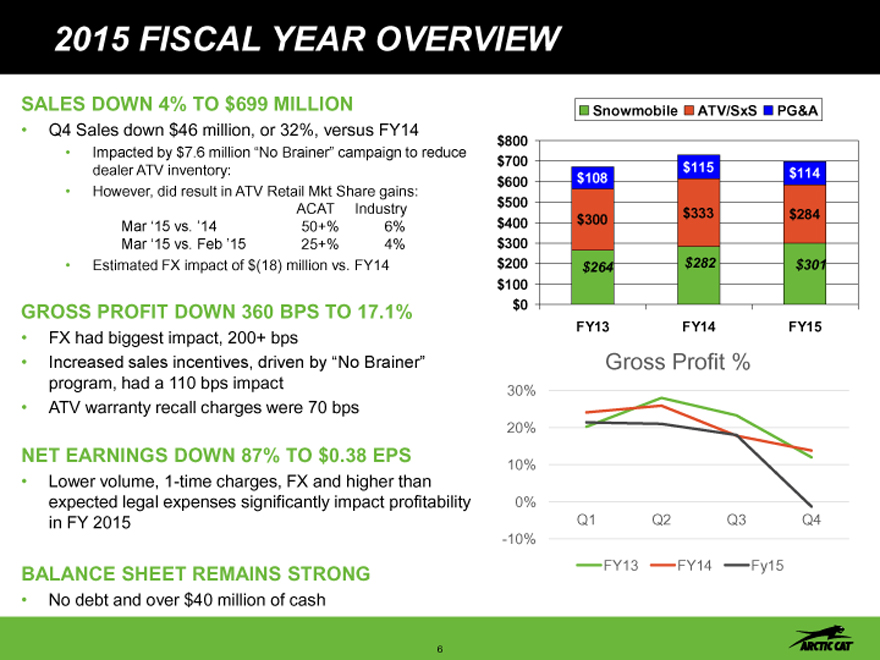
SALES DOWN 4% TO $699 MILLION
Q4 Sales down $46 million, or 32%, versus FY14
Impacted by $7.6 million “No Brainer” campaign to reduce dealer ATV inventory:
However, did result in ATV Retail Mkt Share gains:
ACAT Industry
Mar ‘15 vs. ’14 50+% 6%
Mar ‘15 vs. Feb ’15 25+% 4%
Estimated FX impact of $(18) million vs. FY14
GROSS PROFIT DOWN 360 BPS TO 17.1%
FX had biggest impact, 200+ bps
Increased sales incentives, driven by “No Brainer” program, had a 110 bps impact
ATV warranty recall charges were 70 bps
NET EARNINGS DOWN 87% TO $0.38 EPS
Lower volume, 1-time charges, FX and higher than expected legal expenses significantly impact profitability in FY 2015
BALANCE SHEET REMAINS STRONG
No debt and over $40 million of cash
Snowmobile ATV/SxS PG&A
$800
$700
$600 $108 $115 $114
$500
$400 $300 $333 $284
$300
$200 $264 $282 $301
$100
$0
FY13 FY14 FY15
Gross Profit %
30%
20%
10%
0%
Q1 Q2 Q3 Q4
-10%
FY13 FY14 Fy15
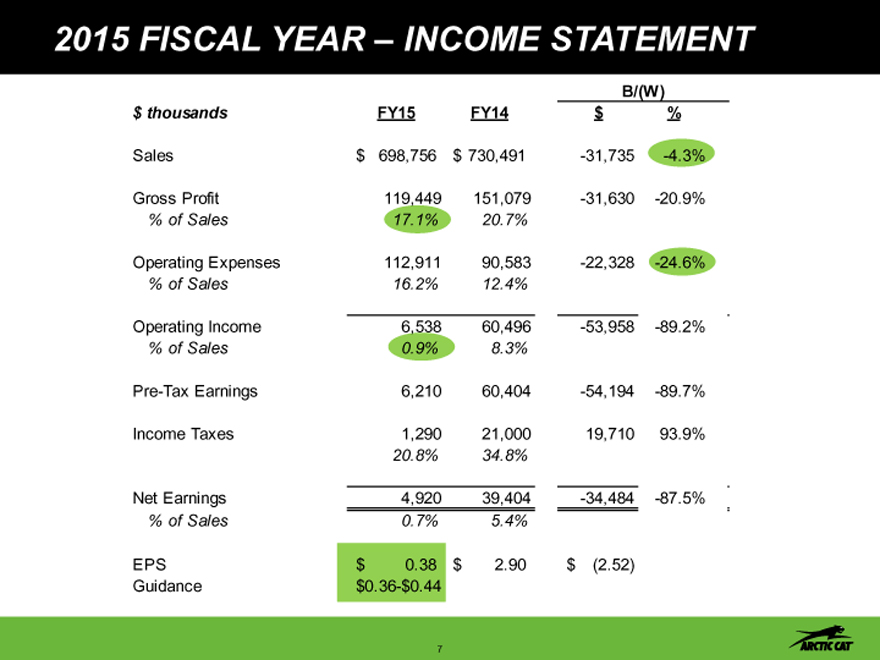
2015 FISCAL YEAR – INCOME STATEMENT
B/(W)
$ thousands FY15 FY14 $ %
Sales $ 698,756 $ 730,491 -31,735 -4.3%
Gross Profit 119,449 151,079 -31,630 -20.9%
% of Sales 17.1% 20.7%
Operating Expenses 112,911 90,583 -22,328 -24.6%
% of Sales 16.2% 12.4%
Operating Income 6,538 60,496 -53,958 -89.2%
% of Sales 0.9% 8.3%
Pre-Tax Earnings 6,210 60,404 -54,194 -89.7%
Income Taxes 1,290 21,000 19,710 93.9%
20.8% 34.8%
Net Earnings 4,920 39,404 -34,484 -87.5%
% of Sales 0.7% 5.4%
EPS $ 0.38 $ 2.90 $ (2.52)
Guidance $0.36-$0.44
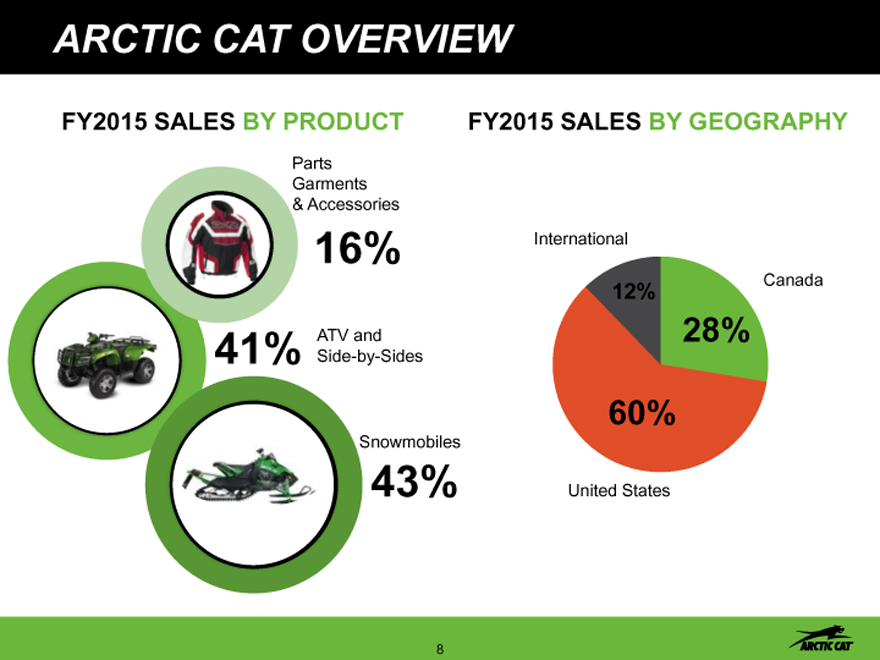
ARCTIC CAT OVERVIEW
FY2015 SALES BY PRODUCT
FY2015 SALES BY GEOGRAPHY
Parts Garments
& Accessories
16%
ATV and
41% Side-by-Sides
Snowmobiles
43%
International
12% Canada
28%
60%
United States
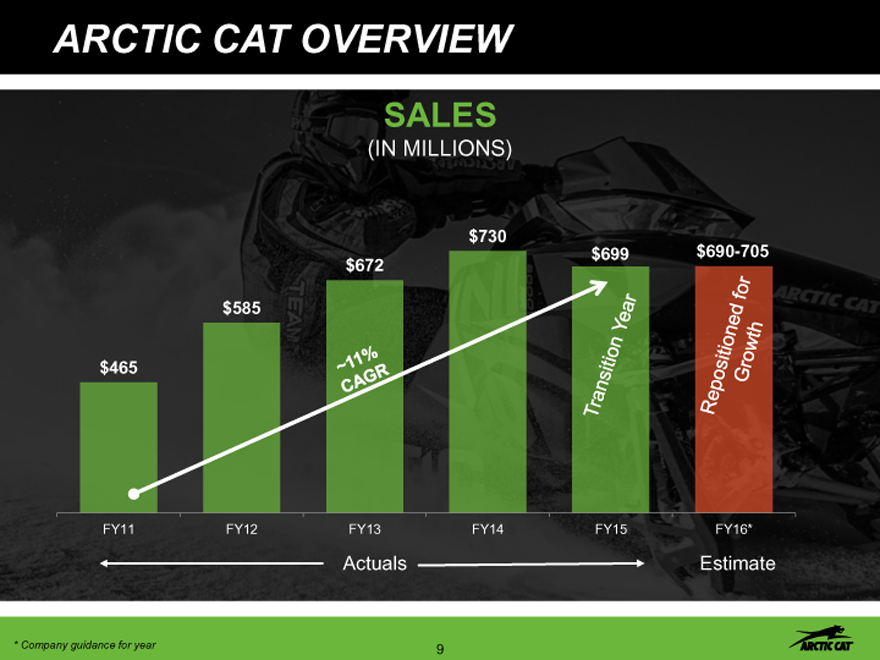
ARCTIC CAT OVERVIEW
SALES
(IN MILLIONS)
$730
$699 $690-705
$672
$585
$465
FY11 FY12 FY13 FY14 FY15 FY16*
Actuals Estimate
* | | Company guidance for year |
9
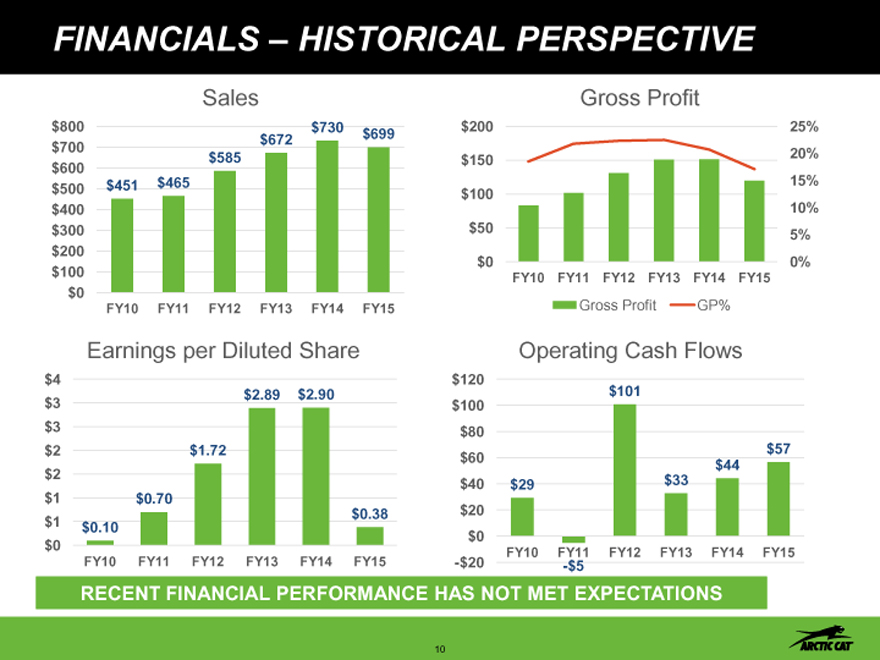
FINANCIALS – HISTORICAL PERSPECTIVE
Sales
$800 $730
$700 $672 $699
$585
$600
$500 $451 $465
$400
$300
$200
$100
$0
FY10 FY11 FY12 FY13 FY14 FY15
Gross Profit
$200 25%
$150 20%
15%
$100
10%
$50 5%
$0 0%
FY10 FY11 FY12 FY13 FY14 FY15
Gross Profit GP%
Earnings per Diluted Share
$ 4
$ 3 $ 2.89 $ 2.90
$ 3
$ 2 $ 1.72
$ 2
$ 1 $ 0.70
$ 0.38
$ 1 $ 0.10
$ 0
FY10 FY11 FY12 FY13 FY14 FY15
Operating Cash Flows
$120
$101
$100
$80
$57
$60 $44
$40 $29 $33
$20
$0
FY10 FY11 FY12 FY13 FY14 FY15
-$20 -$5
RECENT FINANCIAL PERFORMANCE HAS NOT MET EXPECTATIONS
10
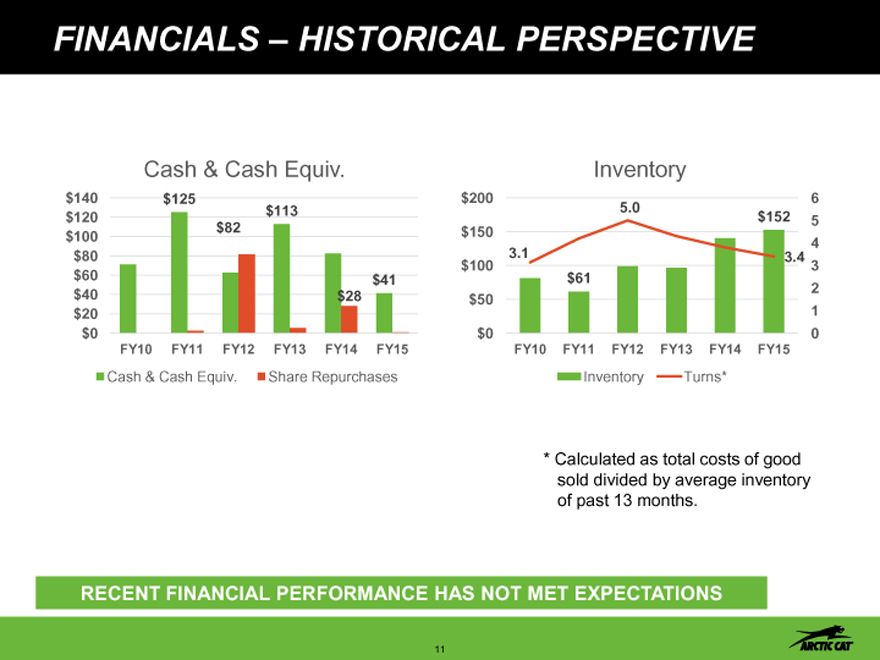
FINANCIALS – HISTORICAL PERSPECTIVE
Cash & Cash Equiv.
$140 $125
$120 $113
$100 $82
$80
$60 $41
$40 $28
$20
$0
FY10 FY11 FY12 FY13 FY14 FY15
Cash & Cash Equiv. Share Repurchases
Inventory
$200 6
5.0
$152 5
$150
3.1 3.4
$100 3
$61
$50
$0 0
FY10 FY11 FY12 FY13 FY14 FY15
Inventory Turns*
Calculated as total costs of good sold divided by average inventory of past 13 months.
RECENT FINANCIAL PERFORMANCE HAS NOT MET EXPECTATIONS
11
FY16
GUIDANCE
12
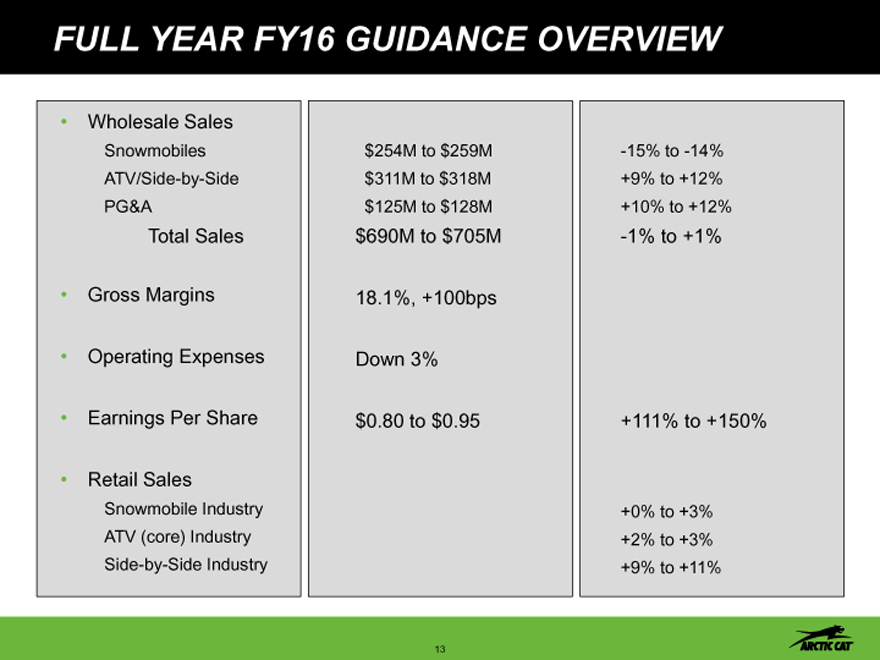
FULL YEAR FY16 GUIDANCE OVERVIEW
Wholesale Sales
Snowmobiles ATV/Side-by-Side PG&A
Total Sales Gross Margins Operating Expenses Earnings Per Share
Retail Sales
Snowmobile Industry ATV (core) Industry Side-by-Side Industry
$254M to $259M $311M to $318M $125M to $128M $690M to $705M
18.1%, +100bps Down 3% $0.80 to $0.95
-15% to -14%
+9% to +12%
+10% to +12%
-1% to +1%
+111% to +150%
+0% to +3%
+2% to +3%
+9% to +11%
13
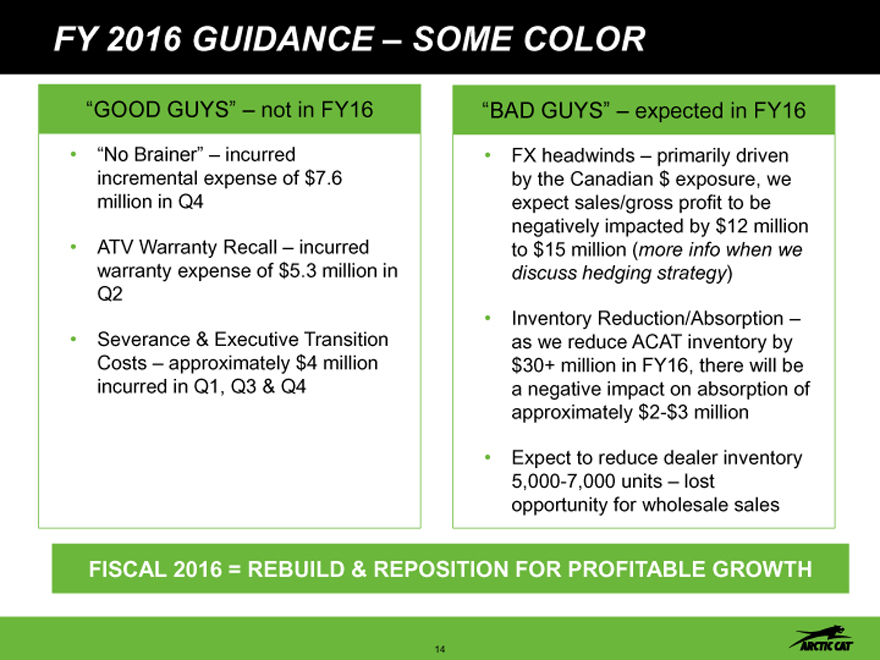
FY 2016 GUIDANCE – SOME COLOR
“GOOD GUYS” – not in FY16
“No Brainer” – incurred incremental expense of $7.6 million in Q4
ATV Warranty Recall – incurred warranty expense of $5.3 million in Q2
Severance & Executive Transition Costs – approximately $4 million incurred in Q1, Q3 & Q4
“BAD GUYS” – expected in FY16
FX headwinds – primarily driven by the Canadian $ exposure, we expect sales/gross profit to be negatively impacted by $12 million to $15 million (more info when we discuss hedging strategy)
Inventory Reduction/Absorption – as we reduce ACAT inventory by $30+ million in FY16, there will be a negative impact on absorption of approximately $2-$3 million
Expect to reduce dealer inventory 5,000-7,000 units – lost opportunity for wholesale sales
FISCAL 2016 = REBUILD & REPOSITION FOR PROFITABLE GROWTH
14
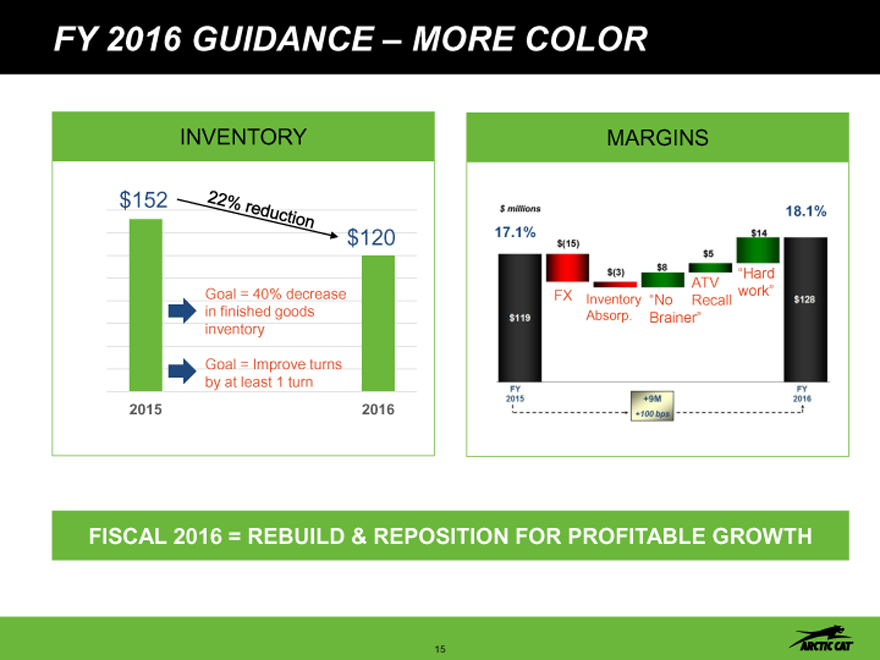
FY 2016 GUIDANCE – MORE COLOR
INVENTORY
$152
$120
Goal = 40% decrease
in finished goods
inventory
Goal = Improve turns
by at least 1 turn
2015 2016
MARGINS
18.1%
17.1%
ATV “Hard
FX Inventory “No Recall work”
Absorp. Brainer”
FISCAL 2016 = REBUILD & REPOSITION FOR PROFITABLE GROWTH
15
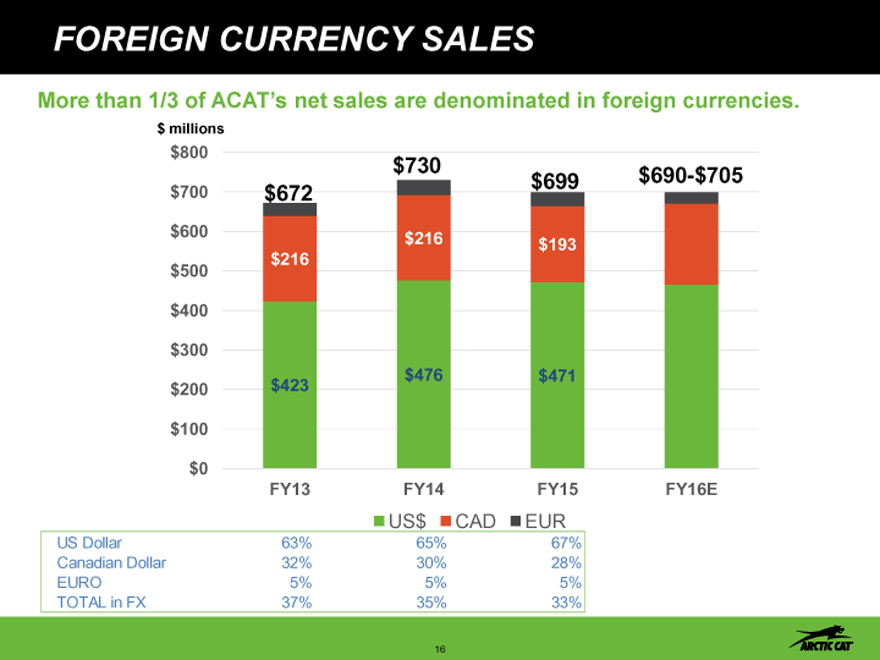
FOREIGN CURRENCY SALES
More than 1/3 of ACAT’s net sales are denominated in foreign currencies.
$ millions
$800
$730 $699 $690-$705
$700 $672
$600
$216 $193
$216
$500
$400
$300
$200 $423 $476 $471
$100
$0
FY13 FY14 FY15 FY16E
US$ CAD EUR
US Dollar 63% 65% 67%
Canadian Dollar 32% 30% 28%
EURO 5% 5% 5%
TOTAL in FX 37% 35% 33%
16
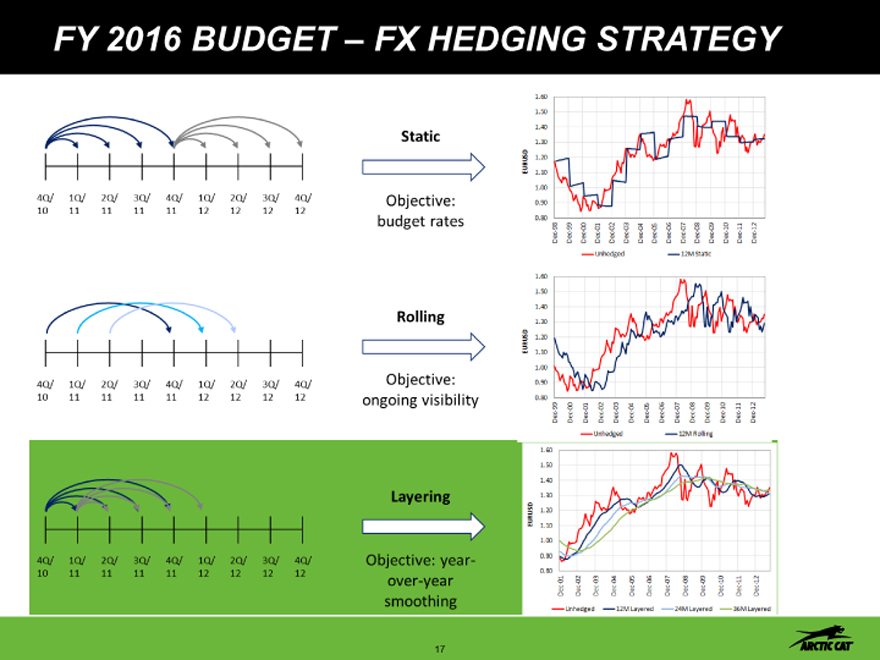
FY 2016 BUDGET – FX HEDGING STRATEGY
17
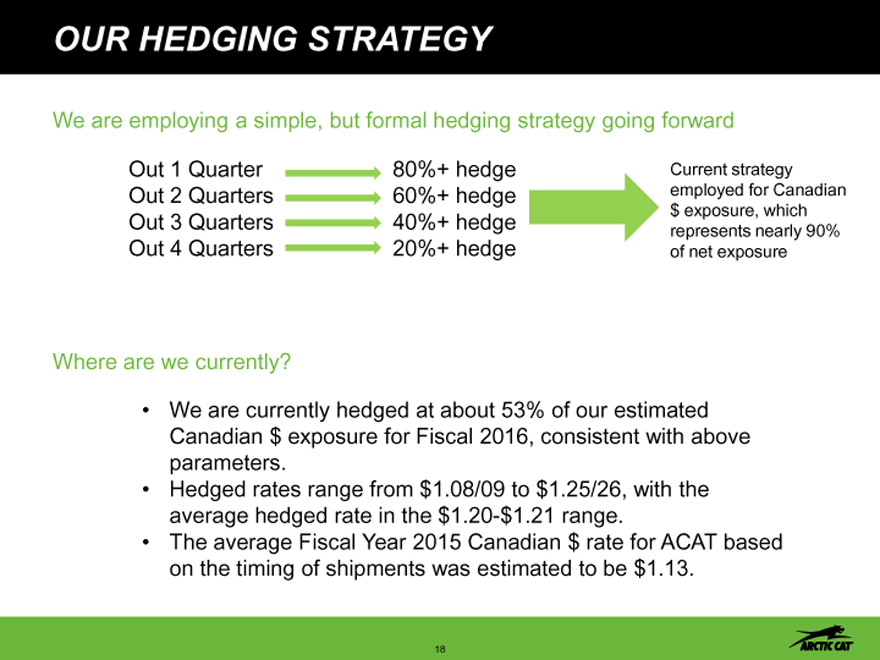
OUR HEDGING STRATEGY
We are employing a simple, but formal hedging strategy going forward
Out 1 Quarter 80%+ hedge Current strategy
Out 2 Quarters 60%+ hedge employed for Canadian
$ exposure, which
Out 3 Quarters 40%+ hedge represents nearly 90%
Out 4 Quarters 20%+ hedge of net exposure
Where are we currently
We are currently hedged at about 53% of our estimated Canadian $ exposure for Fiscal 2016, consistent with above parameters.
Hedged rates range from $1.08/09 to $1.25/26, with the average hedged rate in the $1.20-$1.21 range.
The average Fiscal Year 2015 Canadian $ rate for ACAT based on the timing of shipments was estimated to be $1.13.
18
OUTLOOK
19
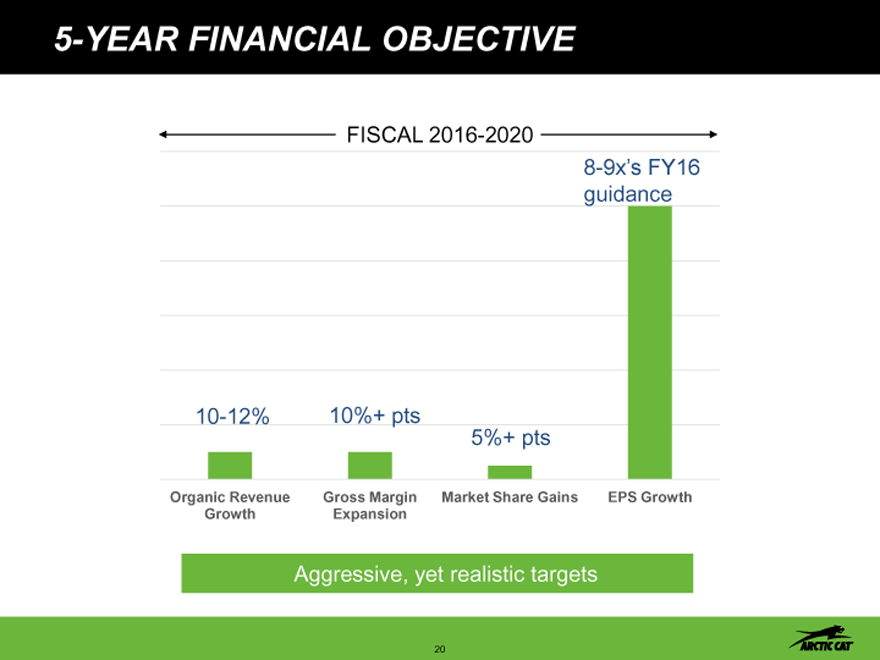
5-YEAR FINANCIAL OBJECTIVE
FISCAL 2016-2020
8-9x’s FY16
guidance
10-12% 10%+ pts
5%+ pts
Organic Revenue Gross Margin Market Share Gains EPS Growth
Growth Expansion
Aggressive, yet realistic targets
20
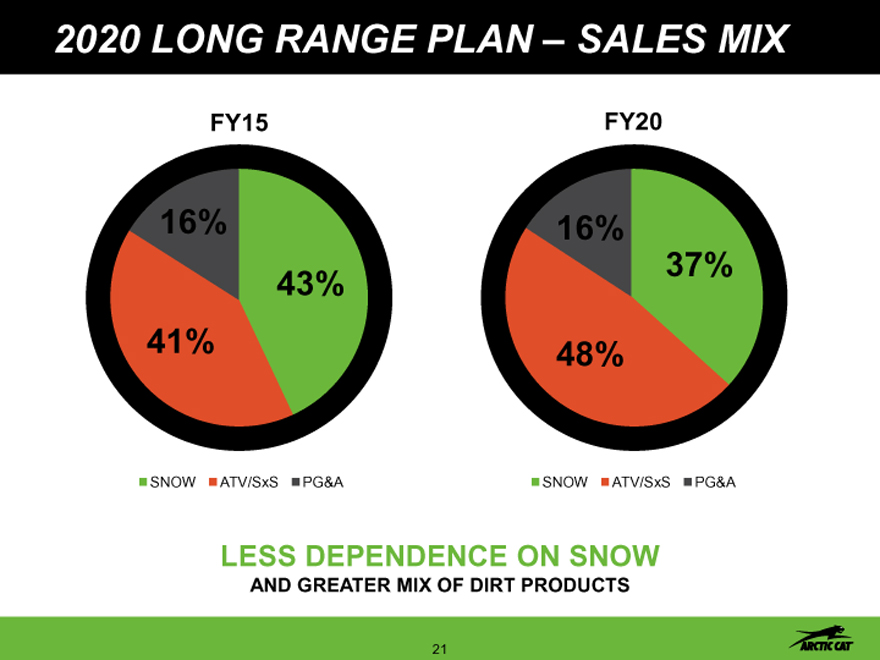
2020 LONG RANGE PLAN – SALES MIX
FY15
16%
43%
41%
SNOW ATV/SxS PG&A
FY20
16%
37%
48%
SNOW ATV/SxS PG&A
LESS DEPENDENCE ON SNOW
AND GREATER MIX OF DIRT PRODUCTS
21
2020 LONG RANGE PLAN – P&L
$ millions FY15A FY16E FY20E CAGR
SALES $698.8 $690.0-$705.0 $1,150.0 10.5%
GROSS PROFIT $119.4 $125.0-$128.0 $320.0 21.8%
% OF SALES 17.1% 18.0% to 18.2% 27.8%
OPERATING EXPENSES $112.9 $109.0-$111.0 $173.0 8.9%
% OF SALES 16.2% 15.6% to 15.8% 15.0%
OPERATING INCOME $6.5 $16.0-$19.0 147.0 86.4%
% OF SALES 0.9% 2.4% to 2.7% 12.8%
PRE-TAX EARNINGS $6.2 $16.0-$18.7 $147.0
12.8%
$1.3 $39.0
INCOME TAXES $5.4-$6.4
20.8% 26.5%
NET EARNINGS $4.9 $10.5-$12.5 $108.0 85.5%
% OF SALES 0.7% 1.5% to 1.8% 9.4%
INVESTMENT THESIS
TOPLINE GROWTH WITH RENEWED FOCUS ON MARGIN EXPANSION
22
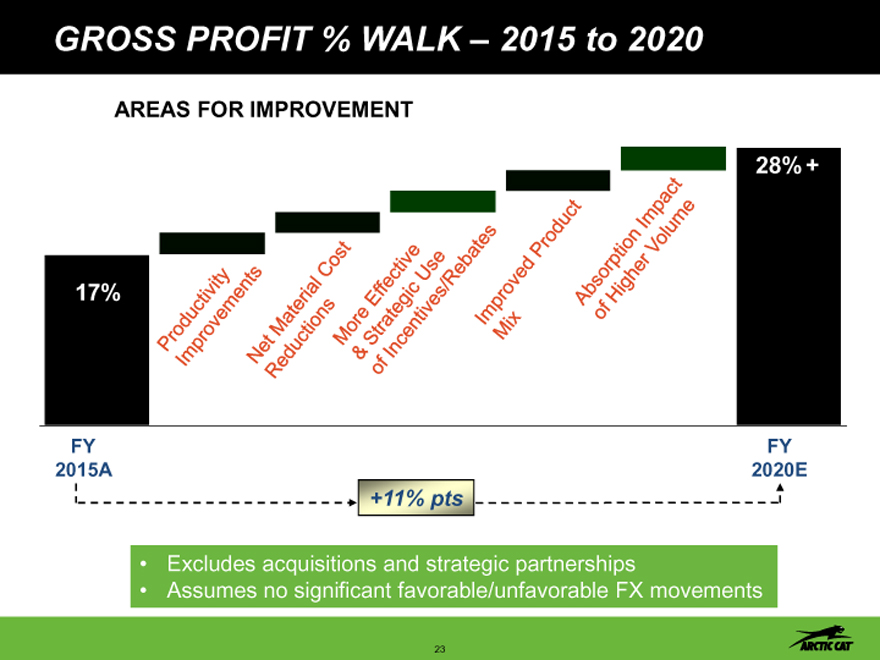
GROSS PROFIT % WALK – 2015 to 2020
AREAS FOR IMPROVEMENT
28% +
17%
FY FY
2015A 2020E
+11% pts
Excludes acquisitions and strategic partnerships
Assumes no significant favorable/unfavorable FX movements
23
ARCTIC CAT OVERVIEW
24
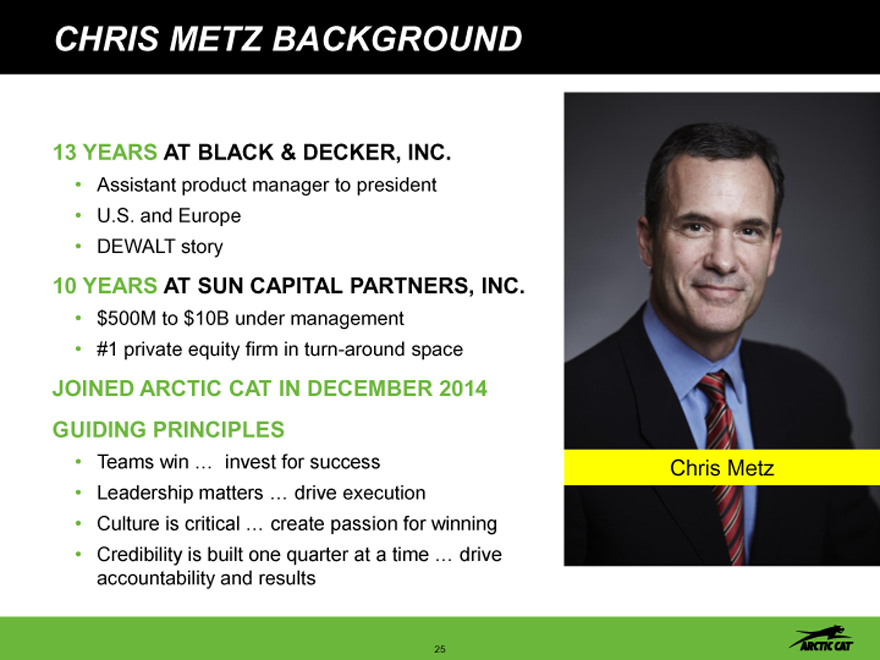
CHRIS METZ BACKGROUND
13 YEARS AT BLACK & DECKER, INC.
Assistant product manager to president
U.S. and Europe
DEWALT story
10 YEARS AT SUN CAPITAL PARTNERS, INC.
$500M to $10B under management
#1 private equity firm in turn-around space
JOINED ARCTIC CAT IN DECEMBER 2014 GUIDING PRINCIPLES
Teams win … invest for success
Leadership matters … drive execution
Culture is critical … create passion for winning
Credibility is built one quarter at a time … drive accountability and results
Chris Metz
25
REASONS FOR JOINING ARCTIC CAT
MARKET UNDERPERFORMER OPPORTUNITY
ICONIC LEADING WITH FUNDAMENTAL
BRAND PRODUCTS STRENGTHS TO WIN
PERFECT MATCH
PRODUCT STRONG GLOBAL UNDER- OUTDOOR/
IS A HERO LEADERSHIP BUSINESS PERFORMER SPORTS
SPACE
26
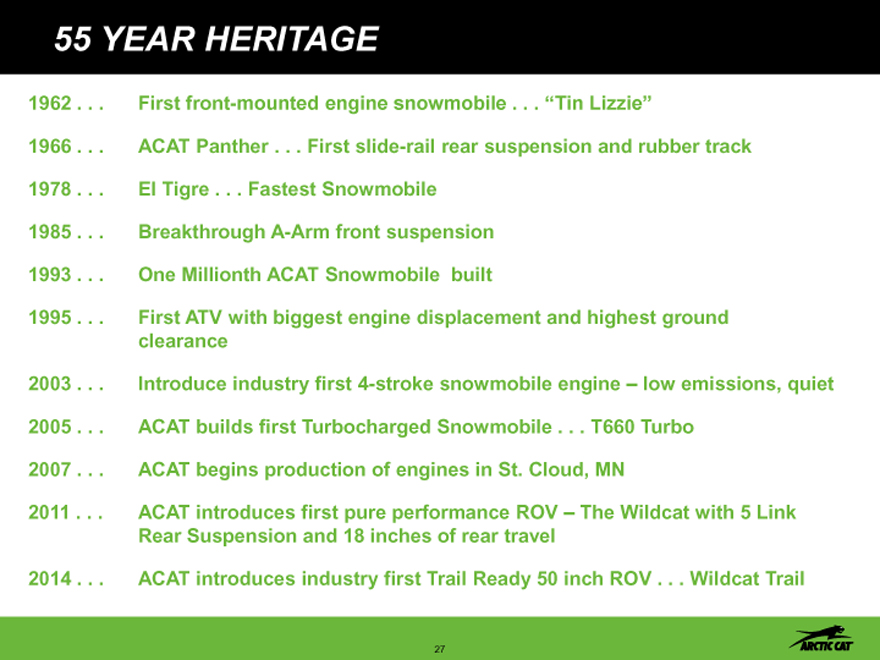
55 YEAR HERITAGE
1962 First front-mounted engine snowmobile “Tin Lizzie”
1966 ACAT Panther First slide-rail rear suspension and rubber track
1978 El Tigre Fastest Snowmobile
1985 Breakthrough A-Arm front suspension
1993 One Millionth ACAT Snowmobile built
1995 First ATV with biggest engine displacement and highest ground
clearance
2003 Introduce industry first 4-stroke snowmobile engine – low emissions, quiet
2005 ACAT builds first Turbocharged Snowmobile T660 Turbo
2007 ACAT begins production of engines in St. Cloud, MN
2011 ACAT introduces first pure performance ROV – The Wildcat with 5 Link
Rear Suspension and 18 inches of rear travel
2014 ACAT introduces industry first Trail Ready 50 inch ROV Wildcat Trail
27
CURRENT SITUATION
28
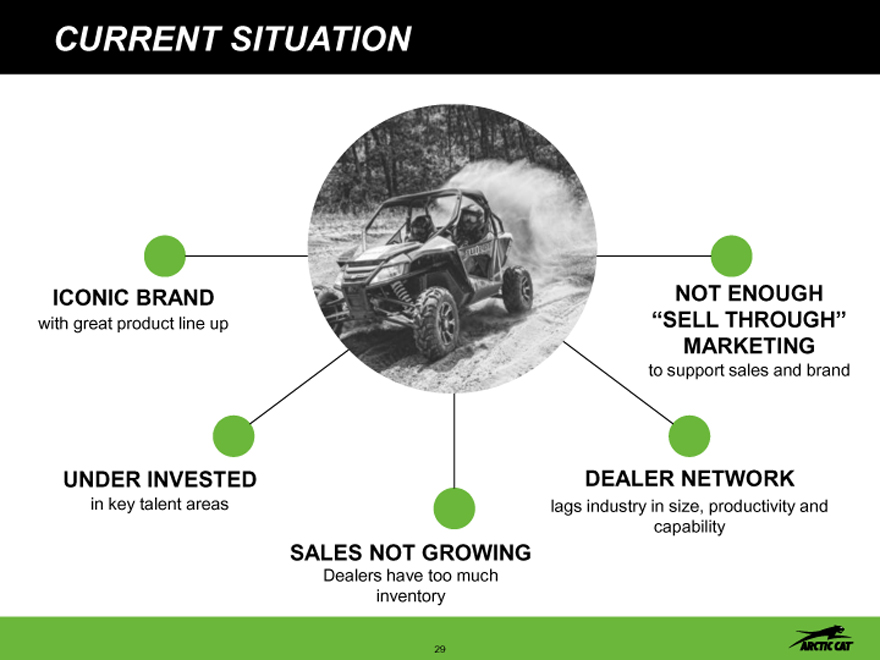
CURRENT SITUATION
ICONIC BRAND NOT ENOUGH
with great product line up “SELL THROUGH”
MARKETING
to support sales and brand
UNDER INVESTED DEALER NETWORK
in key talent areas lags industry in size, productivity and
capability
SALES NOT GROWING
Dealers have too much
inventory
29
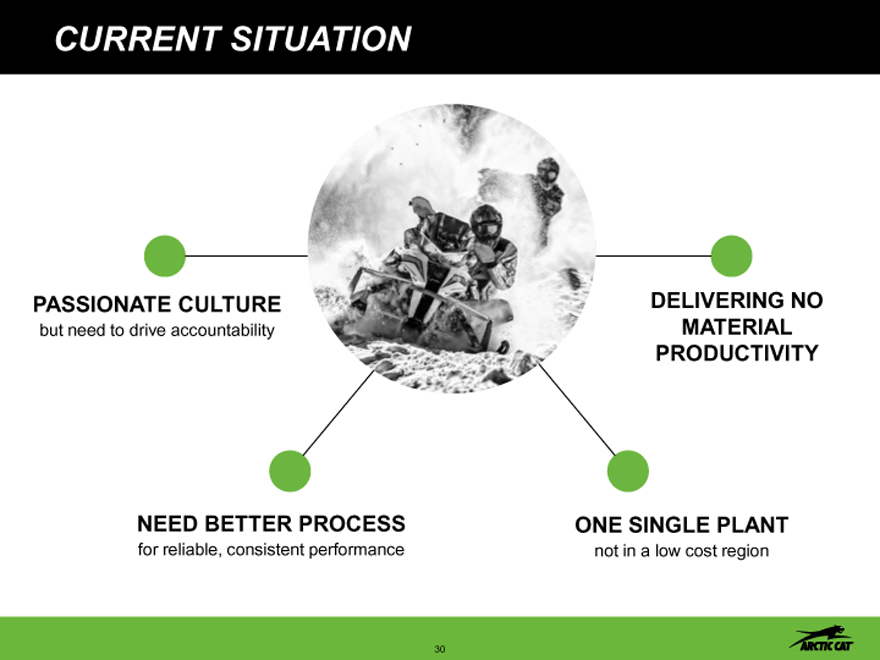
CURRENT SITUATION
PASSIONATE CULTURE DELIVERING NO
but need to drive accountability MATERIAL
PRODUCTIVITY
NEED BETTER PROCESS ONE SINGLE PLANT
for reliable, consistent performance not in a low cost region
30
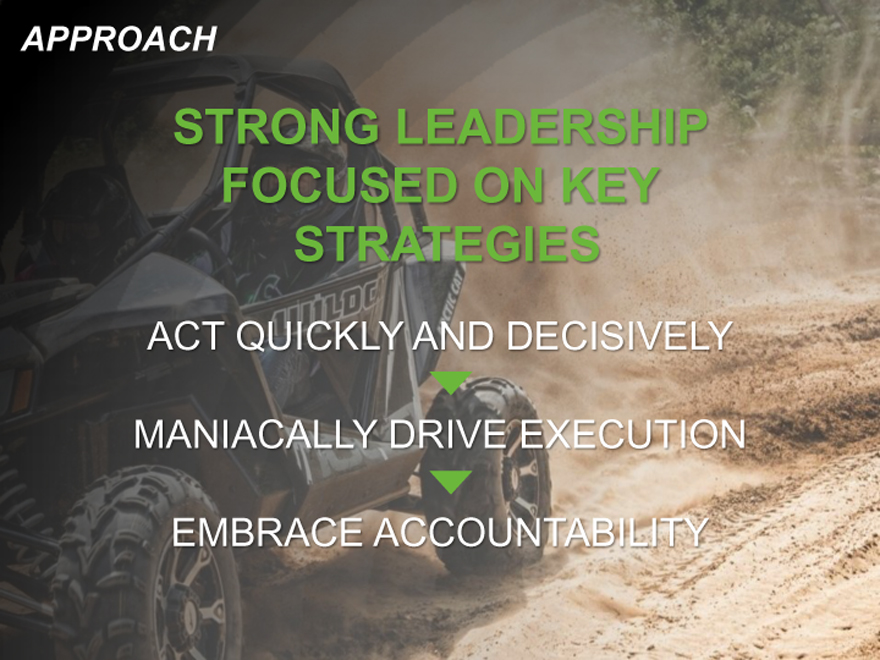
APPROACH
STRONG LEADERSHIP
FOCUSED ON KEY
STRATEGIES
ACT QUICKLY AND DECISIVELY
MANIACALLY DRIVE EXECUTION
EMBRACE ACCOUNTABILITY
31
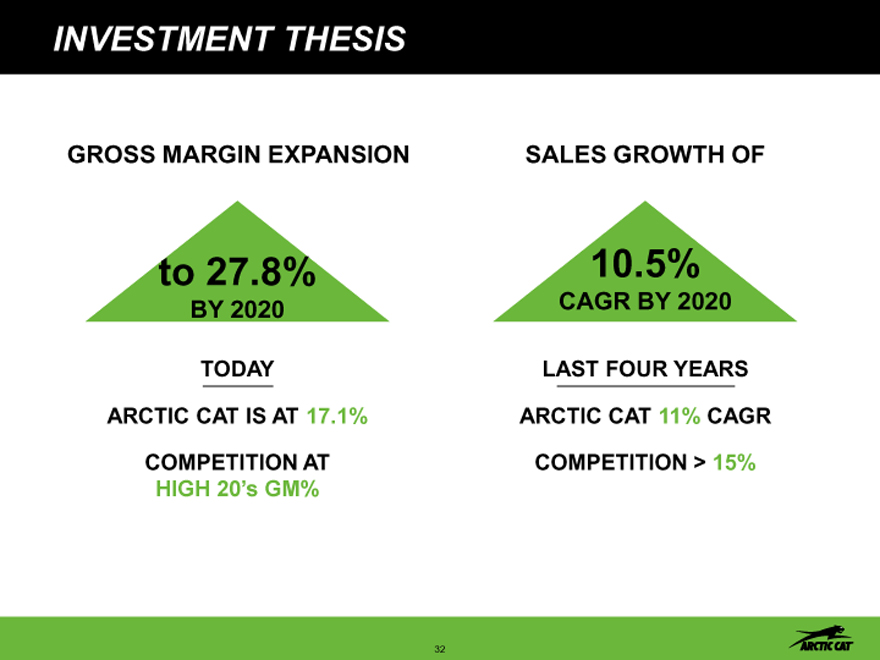
INVESTMENT THESIS
GROSS MARGIN EXPANSION
SALES GROWTH OF
to 27.8%
BY 2020
TODAY
ARCTIC CAT IS AT 17.1%
COMPETITION AT
HIGH 20’s GM%
10.5%
CAGR BY 2020
LAST FOUR YEARS
ARCTIC CAT 11% CAGR
COMPETITION > 15%
32
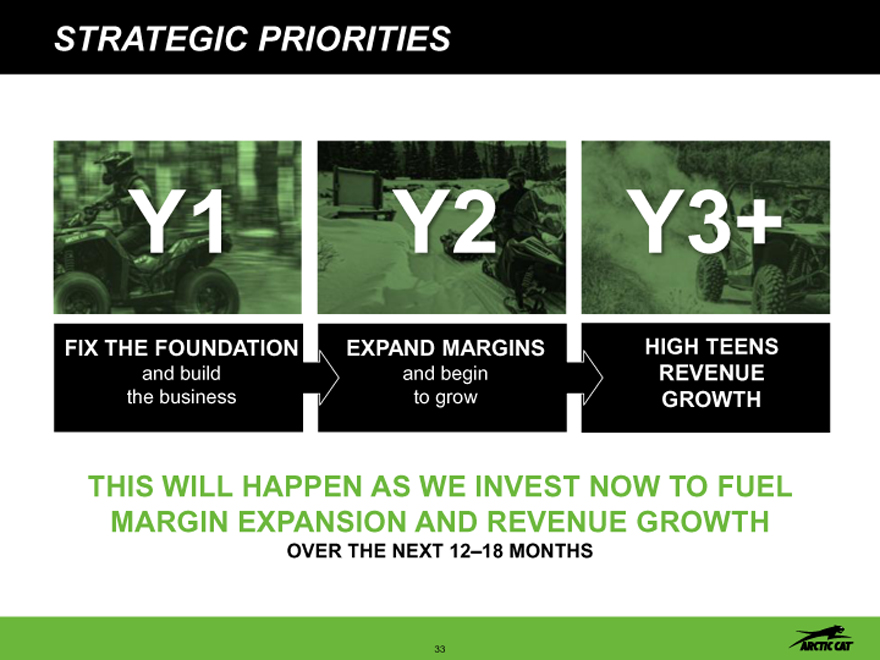
STRATEGIC PRIORITIES
Y1
Y2
Y3+
FIX THE FOUNDATION
EXPAND MARGINS
HIGH TEENS
and build
and begin
REVENUE
the business
to grow
GROWTH
THIS WILL HAPPEN AS WE INVEST NOW TO FUEL MARGIN EXPANSION AND REVENUE GROWTH
OVER THE NEXT 12–18 MONTHS
33
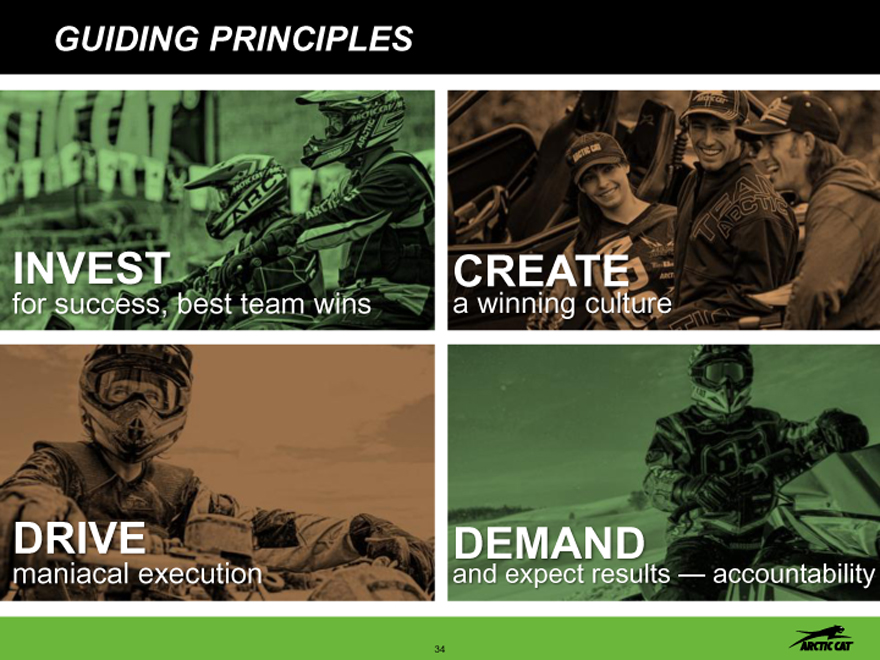
GUIDING PRINCIPLES
INVEST
for success, best team wins
CREATE
a winning culture
DRIVE
maniacal execution
DEMAND
and expect results — accountability
34
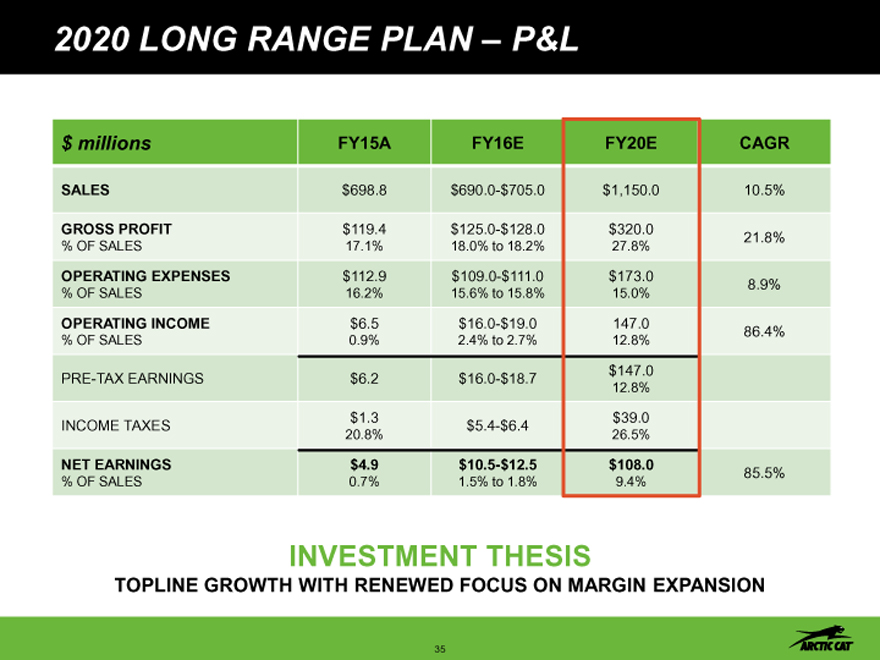
2020 LONG RANGE PLAN – P&L
$ millions
FY15A
FY16E
FY20E
CAGR
SALES
$698.8
$690.0-$705.0
$1,150.0
10.5%
GROSS PROFIT
$119.4
$125.0-$128.0
$320.0
21.8%
% OF SALES
17.1%
18.0% to 18.2%
27.8%
OPERATING EXPENSES
$112.9
$109.0-$111.0
$173.0
8.9%
% OF SALES
16.2%
15.6% to 15.8%
15.0%
OPERATING INCOME
$6.5
$16.0-$19.0
147.0
86.4%
% OF SALES
0.9%
2.4% to 2.7%
12.8%
PRE-TAX EARNINGS
$6.2
$16.0-$18.7
$147.0
12.8%
$1.3
$39.0
INCOME TAXES
$5.4-$6.4
20.8%
26.5%
NET EARNINGS
$4.9
$10.5-$12.5
$108.0
85.5%
% OF SALES
0.7%
1.5% to 1.8%
9.4%
INVESTMENT THESIS
TOPLINE GROWTH WITH RENEWED FOCUS ON MARGIN EXPANSION
35
VISION
Deliver the ultimate experience for riders, workers and outdoor enthusiasts around the world by driving passion and performance in every product and service we provide
36
BRAND PROMISE
Create the ultimate
off-road riding experience
37
STRATEGIC PLAN
38
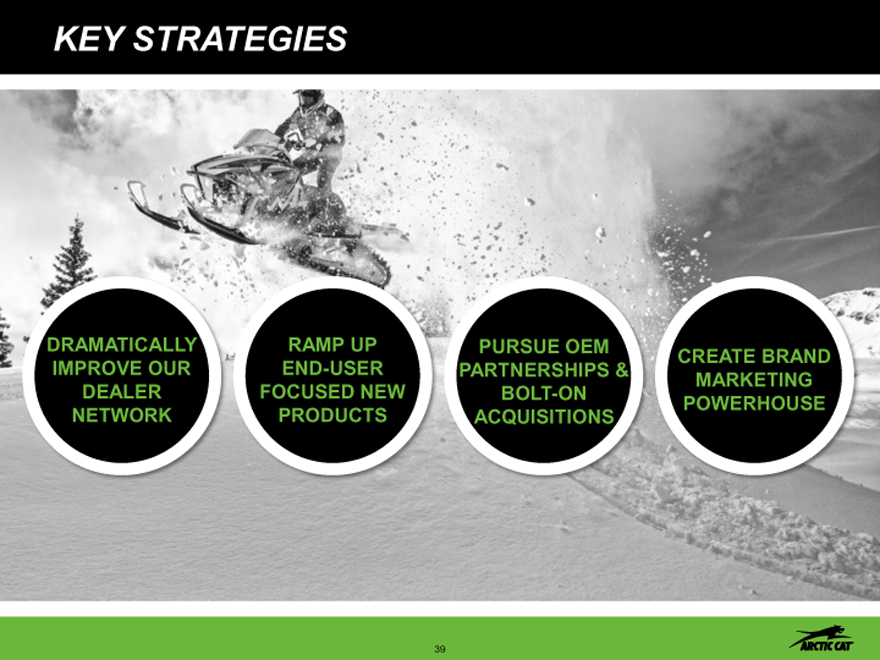
KEY STRATEGIES
DRAMATICALLY
RAMP UP
PURSUE OEM
CREATE BRAND
IMPROVE OUR
END-USER
PARTNERSHIPS &
MARKETING
DEALER
FOCUSED NEW
BOLT-ON
POWERHOUSE
NETWORK
PRODUCTS
ACQUISITIONS
39
KEY ENABLERS
PROCESS EXCELLENCE & EXECUTION
PROFIT IMPROVEMENT
PEOPLE AND CULTURE
40
ENABLER … PROCESS EXCELLENCE
Develop and implement clearly defined, documented and communicated processes across all functions to deliver consistent and reliable performance
41
ENABLER … PROCESS EXCELLENCE
Stage gate new product development Change management Lean productivity SAP
Strategic deployment
Weekly, monthly and quarterly reporting
Operating model
42
ENABLER … PROFIT IMPROVEMENT
Develop repeatable productivity methodology to deliver 5% gross productivity to expand gross margins and deliver
10% operating income
43
ENABLER … PROFIT IMPROVEMENT
Supplier cost down
Value engineering
In bound/out bound freight
Currency hedging
Lower rebate incentives with greater amount of current inventory
Lower effective tax rate
44
ENABLER … PEOPLE AND CULTURE
Top grade or recruit “A” talent in critical leadership and management positions supported by strategies and goals that are aligned and appraisals that are honest
45
ENABLER … PEOPLE AND CULTURE
Goal setting
Appraisals
Investing in talent
Minneapolis headquarters
46
KEY STRATEGY … IMPROVE DEALER NETWORK
Develop top quartile performing dealer network, in terms of size, productivity and capabilities in every key region in North America
47
KEY STRATEGY … IMPROVE DEALER NETWORK
Rank and top grade
Set expectations, measure results, drive accountability
Dealer development … existing and new
Training
Dramatically reduce non-current inventory
Sell-through programming Sell-through brand marketing Ensure appropriate resources
48
KEY STRATEGY … RAMP UP NEW PRODUCTS
Develop end-user focused SBUs that deliver industry leading “Hero” new products that are innovative, potentially breakthrough, and yield 25%+ gross margins
49
KEY STRATEGY … RAMP UP NEW PRODUCTS
Launch exciting “HERO” products for
MY 2017 (introduced August 2016)
Build product management functions focused on end-user
Develop 10 year multi-generational product and technology roadmap for ATVs, ROVs and snowmobiles
Unveil well thought out accessories with all new products
Use new stage gate process to drive faster and higher quality new products
Continue to develop existing and new OEM partnerships
50
KEY STRATEGY … OEM & BOLT-ON ACQUISITIONS
Leverage internal resources to pursue meaningful partnerships
Partnerships will leverage others’ channels of distribution strengths and geographic footprint
Acquisition into current space or near adjacencies
Acquisitions that are financially compelling
No Acquisitions Included in 2020 Vision
51
KEY STRATEGY … BRAND MARKETING
Create brand marketing powerhouse that delivers passionate and exciting experiences at all customer touch points to drive double-digit retail sales growth every year
52
KEY STRATEGY … BRAND MARKETING
Advertising
Invest in team
Experiential marketing
Event field marketing
Digital
Training
53
CULTURAL BEHAVIORS
PASSION FOR WINNING
INNOVATION
ATTITUDE
ACHIEVE COMMITMENTS
HIGH ENERGY
STRAIGHT TALK
RISK TAKING
RAISE THE BAR
54
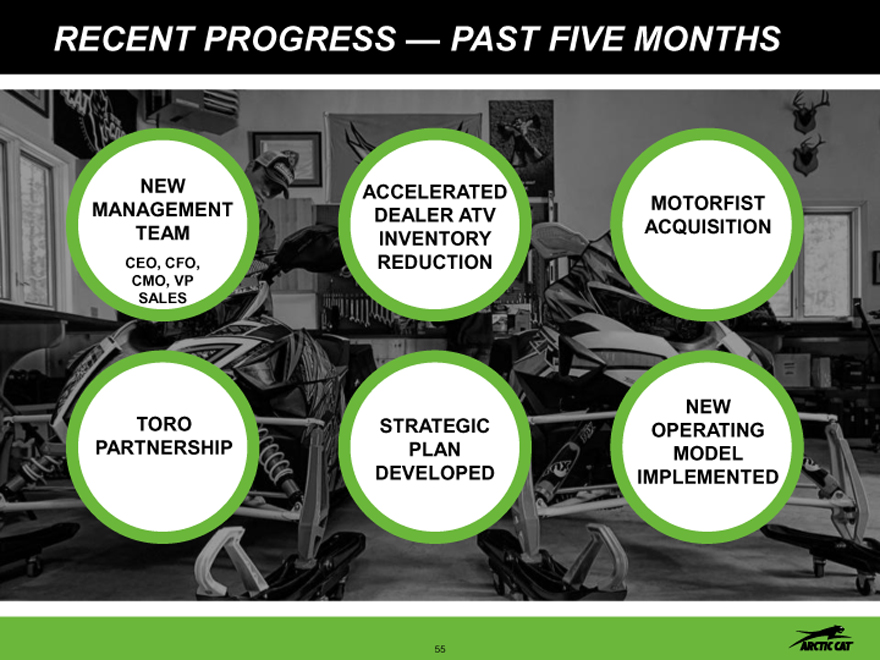
RECENT PROGRESS — PAST FIVE MONTHS
NEW
ACCELERATED
MANAGEMENT
DEALER ATV
MOTORFIST
TEAM
INVENTORY
ACQUISITION
CEO, CFO,
REDUCTION
CMO, VP
SALES
NEW
TORO
STRATEGIC
OPERATING
PARTNERSHIP
PLAN
MODEL
DEVELOPED
IMPLEMENTED
55
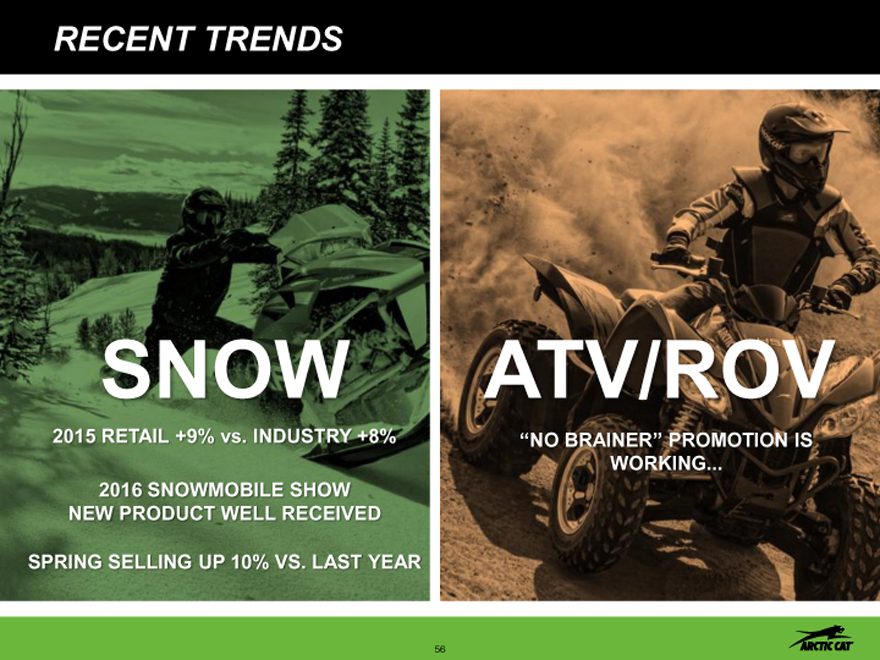
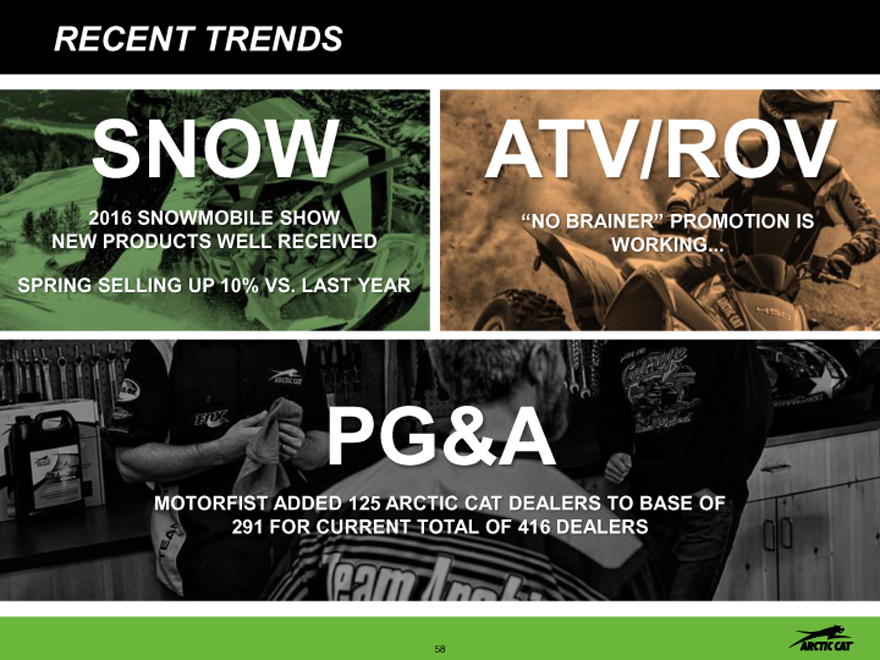
RECENT TRENDS
SNOW
2015 RETAIL +9% vs. INDUSTRY +8%
2016 SNOWMOBILE SHOW NEW PRODUCT WELL RECEIVED
SPRING SELLING UP 10% VS. LAST YEAR
ATV/ROV
“NO BRAINER” PROMOTION IS
WORKING
56
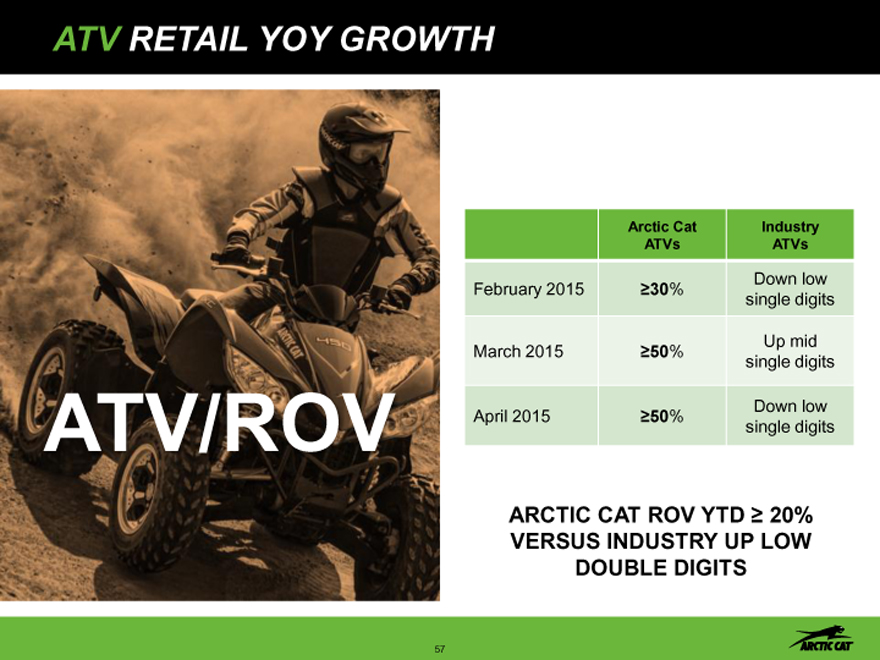
ATV RETAIL YOY GROWTH
ATV/ROV
Arctic Cat
Industry
ATVs
ATVs
February 2015
30%
Down low
single digits
March 2015
50%
Up mid
single digits
April 2015
50%
Down low
single digits
ARCTIC CAT ROV YTD 20% VERSUS INDUSTRY UP LOW
DOUBLE DIGITS
57
RECENT TRENDS
SNOW ATV/ROV
2016 SNOWMOBILE SHOW “NO BRAINER” PROMOTION IS
NEW PRODUCTS WELL RECEIVED WORKING SPRING SELLING UP 10% VS. LAST YEAR
PG&A
MOTORFIST ADDED 125 ARCTIC CAT DEALERS TO BASE OF 291 FOR CURRENT TOTAL OF 416 DEALERS
58
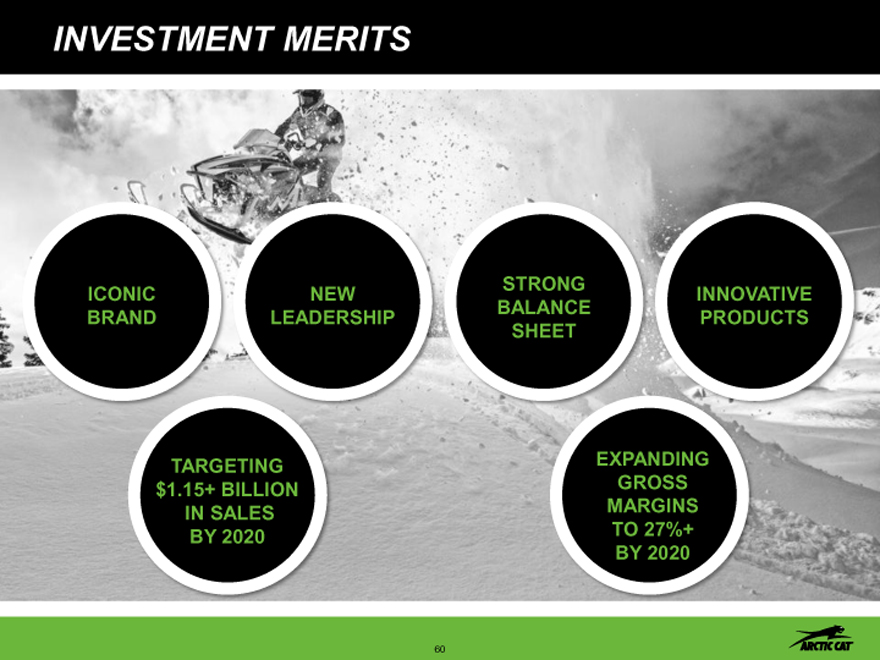
INVESTMENT MERITS
59
INVESTMENT MERITS
STRONG
ICONIC
NEW
INNOVATIVE
BALANCE
BRAND
LEADERSHIP
PRODUCTS
SHEET
TARGETING
EXPANDING
$1.15+ BILLION
GROSS
IN SALES
MARGINS
BY 2020
TO 27%+
BY 2020
60
BREAK
FOLLOWED BY
Q&A
61