|
Exhibit 99.1 
|
Exhibit 99.1
WELCOME
2016 ANALYST AND INVESTOR DAY
MAY 24, 2016
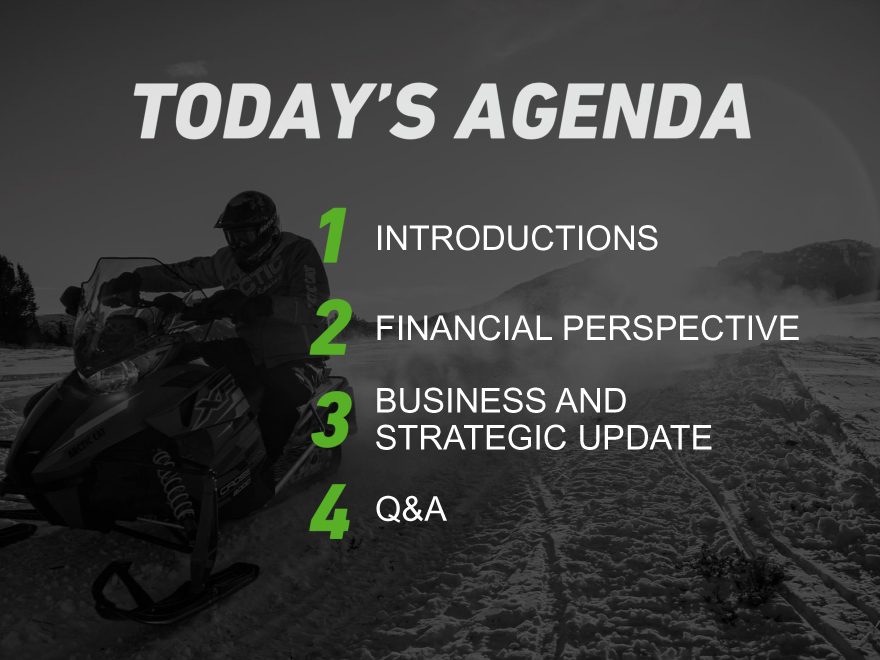
TODAY’S AGENDA
1 INTRODUCTIONS
2 FINANCIAL PERSPECTIVE
3 BUSINESS AND STRATEGIC UPDATE
4 Q&A
FINANCIAL
PERSPECTIVE
SAFE HARBOR STATEMENT
Forward-Looking Statements
The Private Securities Litigation Reform Act of 1995 provides a safe harbor for certain forward-looking statements. The company’s Annual Report, as well as the Report on Form 10-K, its
Quarterly Reports on Form 10-Q and other filings with the Securities and Exchange Commission, the company’s press releases and oral statements made with the approval of an authorized executive officer, contain forward-looking statements that reflect the company’s current views with respect to future events and financial performance. These forward-looking statements are subject to certain risks and uncertainties that could cause actual results to differ materially from historical results or those anticipated. The words “aim,” “believe,” “expect,” “anticipate,” “intend,” “estimate” and other expressions that indicate future events and trends identify forward-looking statements including statements related to our fiscal 2017 outlook, business strategy, strategic partnerships, performance opportunities, expected inventory reductions, product introductions and demand, expected expenses, market position, and the impact of foreign currency exchange rates. Actual future results and trends may differ materially from historical results or those anticipated depending on a variety of factors, including, but not limited to those set forth in the company’s Annual Report on Form 10-K for the year ended March 31, 2015, under heading “Item 1A. Risk Factors” and factors described in the company’s subsequent filings with the Securities and Exchange
Commission. The company does not undertake any obligation to publicly update or revise any forward-looking statement, whether as a result of new information, future events or otherwise.
4
FY 2016
REVISITED
ARCTIC CAT OVERVIEW
SALES (IN MILLIONS)
Expect it will take an additional year before returning to growth
$730 $699 $672 $633 $635-$655 $585
$465
~6.5%
CAGR Repositioned v for Growth Transition Year
FY11 FY12 FY13 FY14 FY15 FY16 FY17*
Actuals Estimate
Estimate impact of FX and bad snow years to be about $80M to $100M compared to FY14.
* Company guidance for year
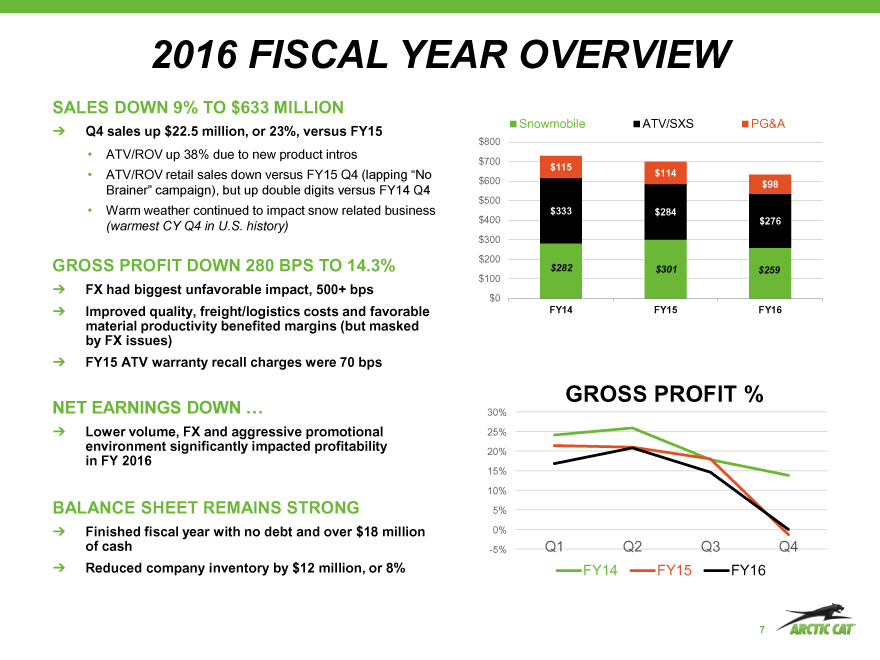
2016 FISCAL YEAR OVERVIEW
SALES DOWN 9% TO $633 MILLION
Snowmobile ATV/SXS PG&A
Q4 sales up $22.5 million, or 23%, versus FY15
$800
ATV/ROV up 38% due to new product intros
$700 $115
ATV/ROV retail sales down versus FY15 Q4 (lapping “No $114
$600 $98
Brainer” campaign), but up double digits versus FY14 Q4
$500
Warm weather continued to impact snow related business $400 $333 $284
(warmest CY Q4 in U.S. history) $276
$300
GROSS PROFIT DOWN 280 BPS TO 14.3% $200 $282
$301 $259
FX had biggest unfavorable impact, 500+ bps $100
$0
Improved quality, freight/logistics costs and favorable FY14 FY15 FY16 material productivity benefited margins (but masked by FX issues)
FY15 ATV warranty recall charges were 70 bps
GROSS PROFIT %
NET EARNINGS DOWN … 30%
Lower volume, FX and aggressive promotional 25% environment significantly impacted profitability 20% in FY 2016
15%
10%
BALANCE SHEET REMAINS STRONG 5%
Finished fiscal year with no debt and over $18 million 0% of cash -5% Q1 Q2 Q3 Q4
Reduced company inventory by $12 million, or 8% FY14 FY15 FY16
7
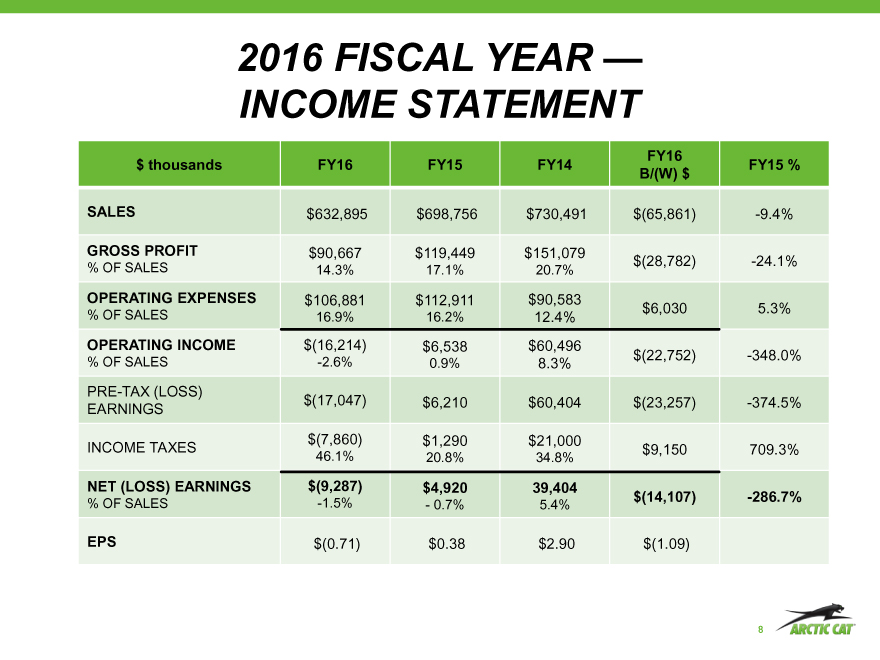
2016 FISCAL YEAR — INCOME STATEMENT
FY16 $ thousands FY16 FY15 FY14 FY15 % B/(W) $
SALES $632,895 $698,756 $730,491 $(65,861) -9.4%
GROSS PROFIT $90,667 $119,449 $151,079 $(28,782) -24.1%
% OF SALES 14.3% 17.1% 20.7%
OPERATING EXPENSES $106,881 $112,911 $90,583 $6,030 5.3%
% OF SALES 16.9% 16.2% 12.4%
OPERATING INCOME $(16,214) $6,538 $60,496 $(22,752) -348.0%
% OF SALES -2.6% 0.9% 8.3%
PRE-TAX (LOSS) $(17,047) $6,210 $60,404 $(23,257) -374.5% EARNINGS
$(7,860) $1,290 $21,000
INCOME TAXES $9,150 709.3%
46.1% 20.8% 34.8%
NET (LOSS) EARNINGS $(9,287) $4,920 39,404
-1.5% $(14,107) -286.7%
% OF SALES—0.7% 5.4%
EPS $(0.71) $0.38 $2.90 $(1.09)
8
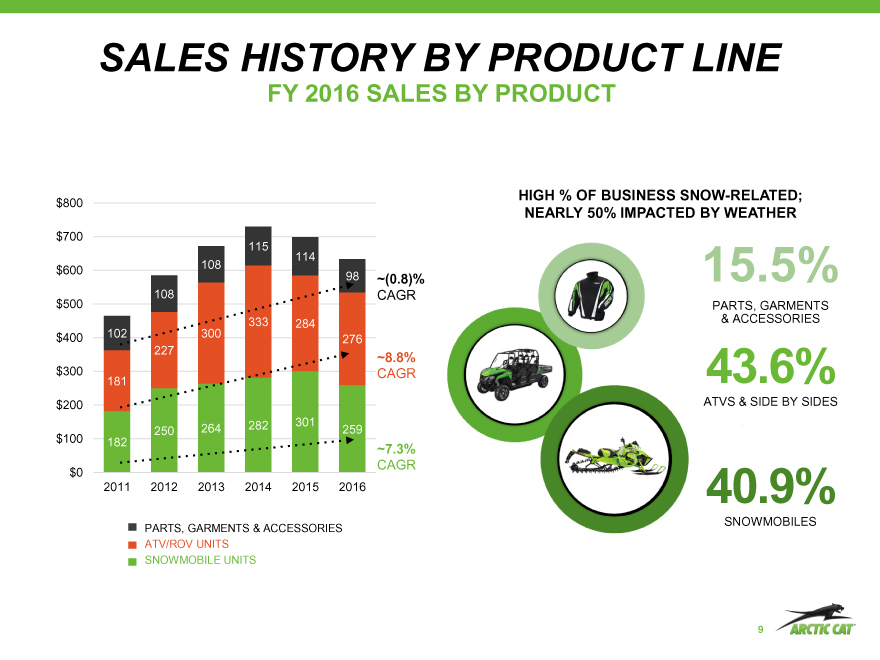
SALES HISTORY BY PRODUCT LINE
FY 2016 SALES BY PRODUCT
HIGH % OF BUSINESS SNOW-RELATED;
$800
NEARLY 50% IMPACTED BY WEATHER
$700
115 114 108 $600
98 ~(0.8)% 15.5%
108 CAGR $500 PARTS, GARMENTS
333 284 & ACCESSORIES $400 102 300
276
227
~8.8%
$300 CAGR 43.6%
181 $200 ATVS & SIDE BY SIDES
282 301 $100 250 264 259 182
~7.3%
CAGR $0
2011 2012 2013 2014 2015 2016 40.9%
SNOWMOBILES
PARTS, GARMENTS & ACCESSORIES ATV/ROV UNITS
SNOWMOBILE UNITS
9
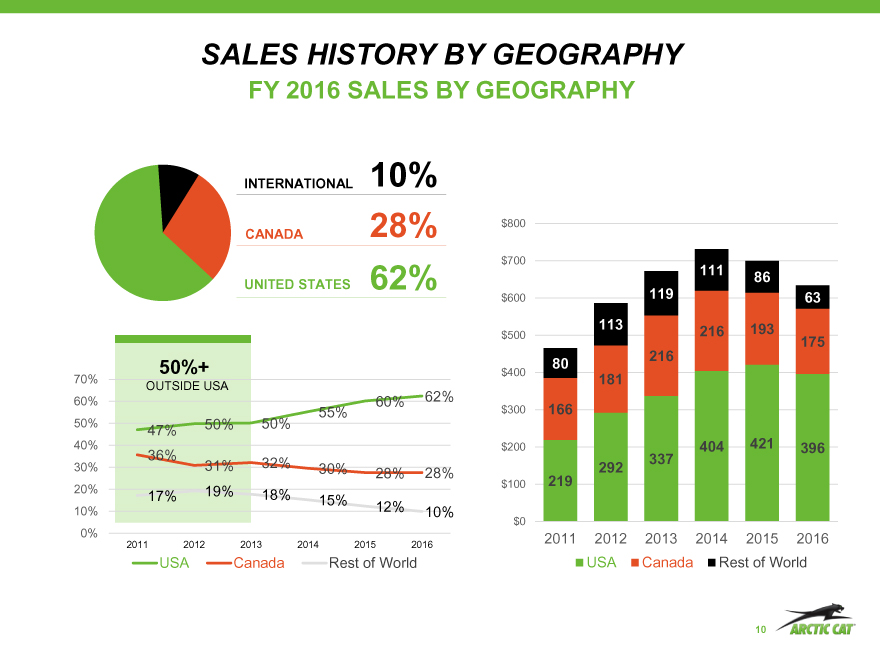
SALES HISTORY BY GEOGRAPHY
FY 2016 SALES BY GEOGRAPHY
INTERNATIONAL 10%
CANADA 28% $800
$700
111 86
UNITED STATES 62%
$600 119 63
113 193
$500 216
175 216
50%+ 80
$400
70% 181 OUTSIDE USA
60% 60% 62%
55% $300 166
50% 50% 50%
47% 421
40% $200 404 396
36% 337 30% 31% 32% 30% 292 28% 28%
$100 219
20% 19% 18%
17% 15%
10% 12% 10%
$0
0% 2011 2012 2013 2014 2015 2016
2011 2012 2013 2014 2015 2016
USA Canada Rest of World USA Canada Rest of World
10
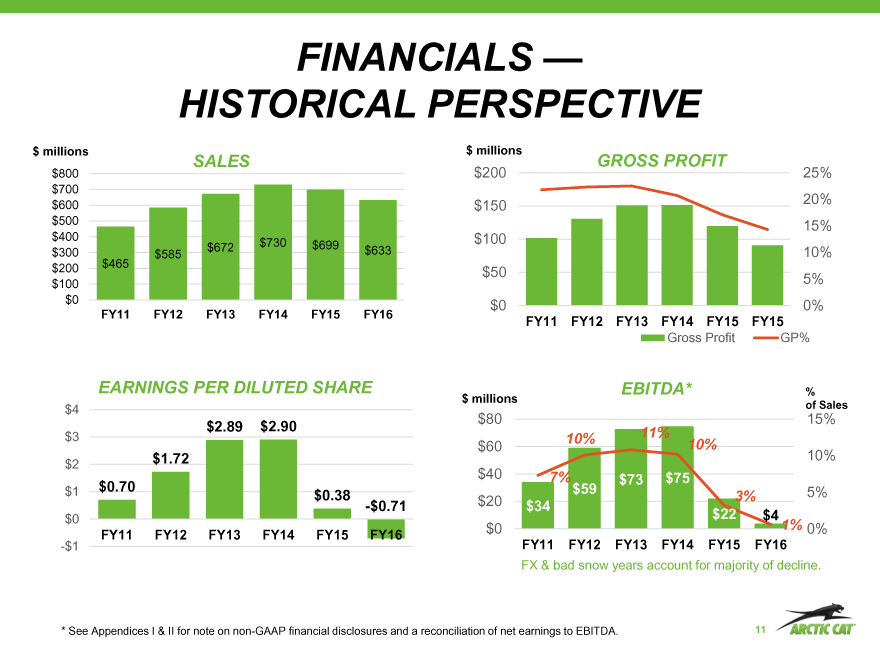
FINANCIALS — HISTORICAL PERSPECTIVE
$ millions $ millions
SALES GROSS PROFIT
$800 $200 25%
$700 $600 20%
$150
$500 15% $400 $100 $672 $730 $699 $300 $585 $633 10% $200 $465
$50
$100 5%
$0 $0 0%
FY11 FY12 FY13 FY14 FY15 FY16
FY11 FY12 FY13 FY14 FY15 FY15
Gross Profit GP%
EARNINGS PER DILUTED SHARE EBITDA* %
$ millions $4 of Sales
$80 15% $2.89 $2.90 11%
$3 10%
$60 10% $1.72 10% $2 $0.70 $40 7% $73 $75
$1 $0.38 $59 5%
$20 3%
-$0.71 $34
$0 $22 $4
$0 1% 0%
FY11 FY12 FY13 FY14 FY15 FY16
-$1 FY11 FY12 FY13 FY14 FY15 FY16
FX & bad snow years account for majority of decline.
* See Appendices I & II for note on non-GAAP financial disclosures and a reconciliation of net earnings to EBITDA. 11
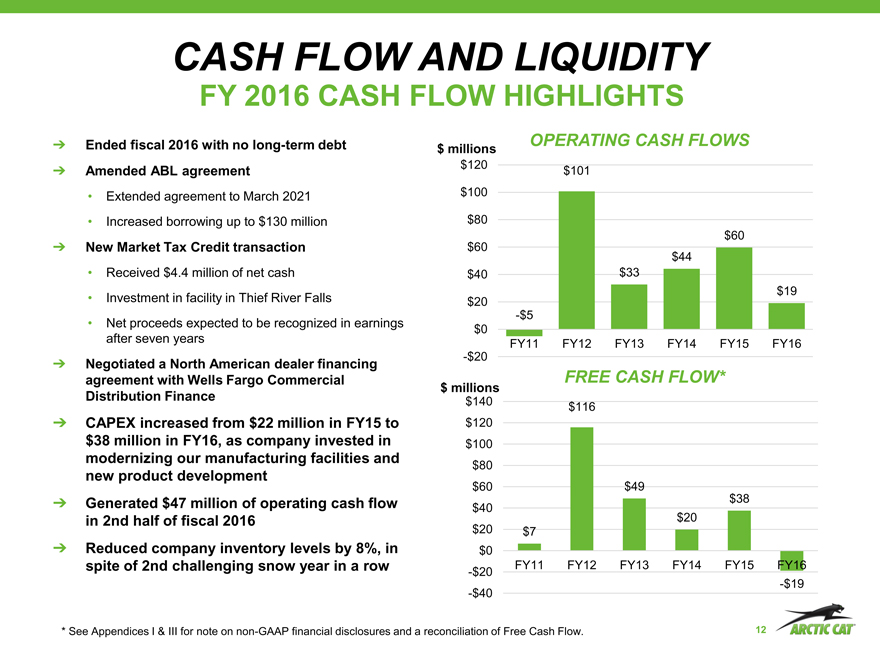
CASH FLOW AND LIQUIDITY
FY 2016 CASH FLOW HIGHLIGHTS
Ended fiscal 2016 with no long-term debt OPERATING CASH FLOWS $ millions $120
Amended ABL agreement $101
Extended agreement to March 2021 $100
Increased borrowing up to $130 million $80 $60
New Market Tax Credit transaction $60 $44
Received $4.4 million of net cash $40 $33 $19
Investment in facility in Thief River Falls $20
-$5
Net proceeds expected to be recognized in earnings $0 after seven years FY11 FY12 FY13 FY14 FY15 FY16
-$20
Negotiated a North American dealer financing agreement with Wells Fargo Commercial FREE CASH FLOW* $ millions
Distribution Finance $140 $116
CAPEX increased from $22 million in FY15 to $120 $38 million in FY16, as company invested in $100 modernizing our manufacturing facilities and
$80
new product development
$60 $49
Generated $47 million of operating cash flow $38
$40
in 2nd half of fiscal 2016 $20
$20 $7
Reduced company inventory levels by 8%, in $0 spite of 2nd challenging snow year in a row FY11 FY12 FY13 FY14 FY15 FY16
-$20
-$19
-$40
* See Appendices I & III for note on non-GAAP financial disclosures and a reconciliation of Free Cash Flow. 12
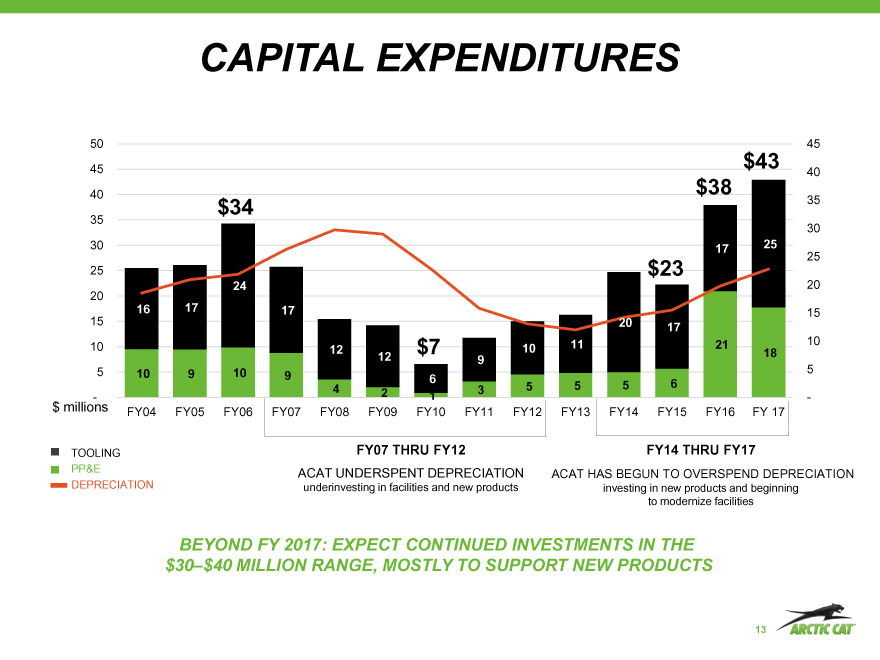
CAPITAL EXPENDITURES
50 45
45 $43 40
40 $38
$34 35
35
30
30 17 25
25
25 $23
24 20 20
16 17 17 15
15 20
17
11 21 10
10 12 $7 10
12 18 9
5 10 9 10 5
9 6
4 5 5 5 6
2 3 $ millions — 1 -FY04 FY05 FY06 FY07 FY08 FY09 FY10 FY11 FY12 FY13 FY14 FY15 FY16 FY 17
TOOLING FY07 THRU FY12 FY14 THRU FY17
PP&E ACAT UNDERSPENT DEPRECIATION ACAT HAS BEGUN TO OVERSPEND DEPRECIATION
DEPRECIATION underinvesting in facilities and new products investing in new products and beginning to modernize facilities
BEYOND FY 2017: EXPECT CONTINUED INVESTMENTS IN THE $30–$40 MILLION RANGE, MOSTLY TO SUPPORT NEW PRODUCTS
13
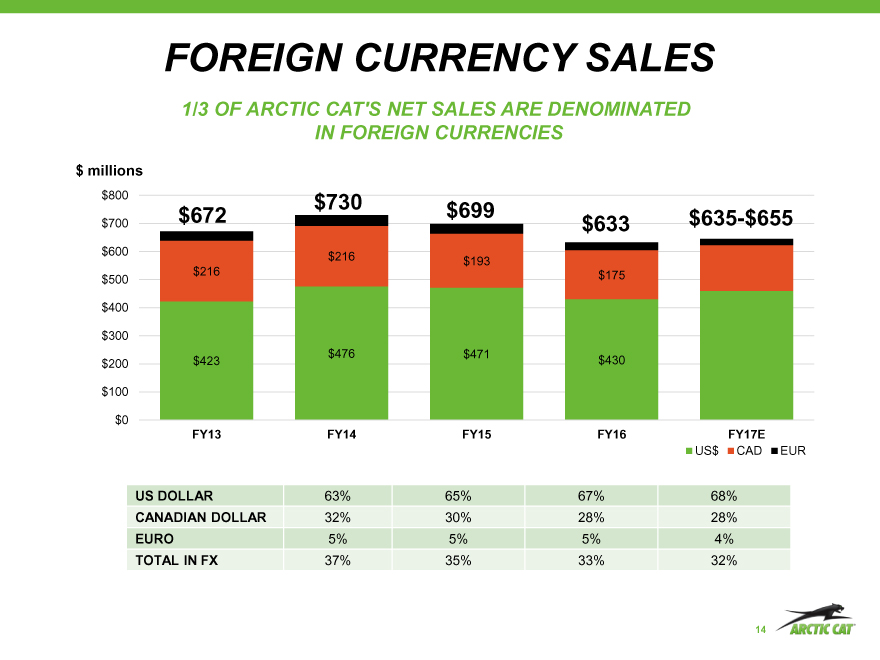
FOREIGN CURRENCY SALES
1/3 OF ARCTIC CAT’S NET SALES ARE DENOMINATED IN FOREIGN CURRENCIES
$ millions
$800 $730
$672 $699 $635-$655
$700 $633 $600 $216 $216 $193 $500 $175 $400
$300 $476 $471 $200 $423 $430 $100
$0
FY13 FY14 FY15 FY16 FY17E
US$ CAD EUR
US DOLLAR 63% 65% 67% 68%
CANADIAN DOLLAR 32% 30% 28% 28%
EURO 5% 5% 5% 4% TOTAL IN FX 37% 35% 33% 32%
14
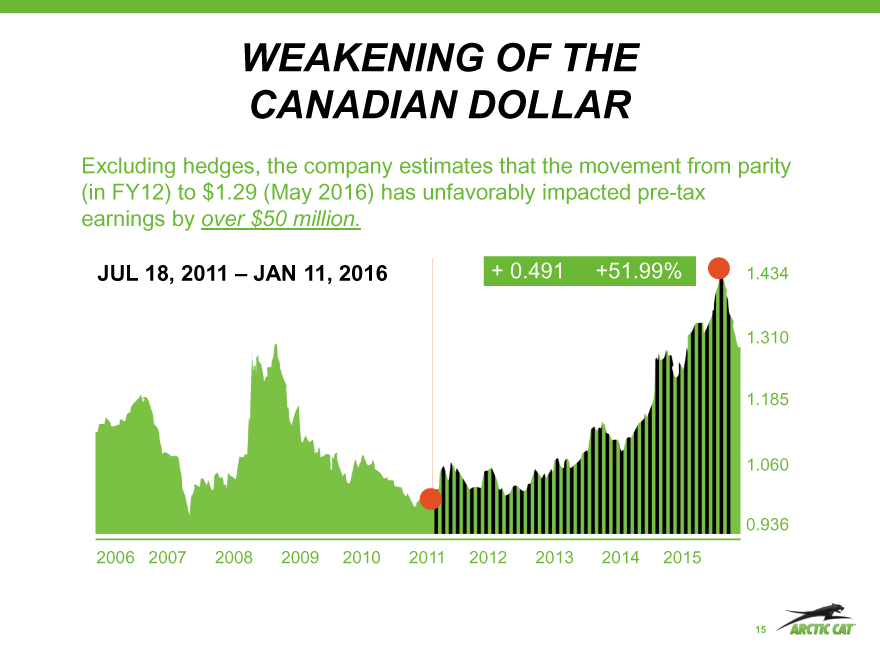
WEAKENING OF THE CANADIAN DOLLAR
Excluding hedges, the company estimates that the movement from parity
(in FY12) to $1.29 (May 2016) has unfavorably impacted pre-tax earnings by over $50 million.
+ 0.491 +51.99% 1.434
1.310 1.185 1.060
0.936 2006 2007 2008 2009 2010 2011 2012 2013 2014 2015
15
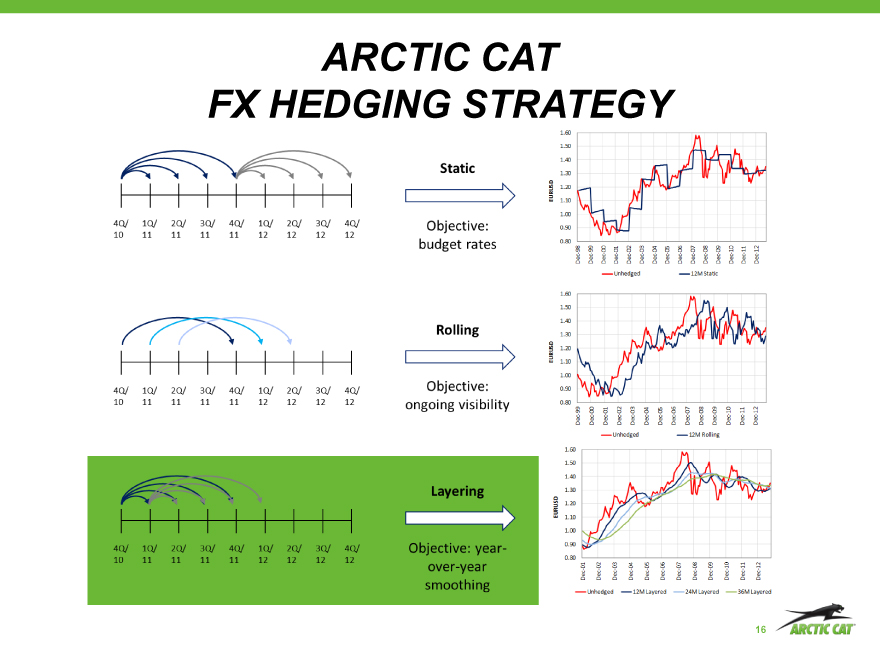
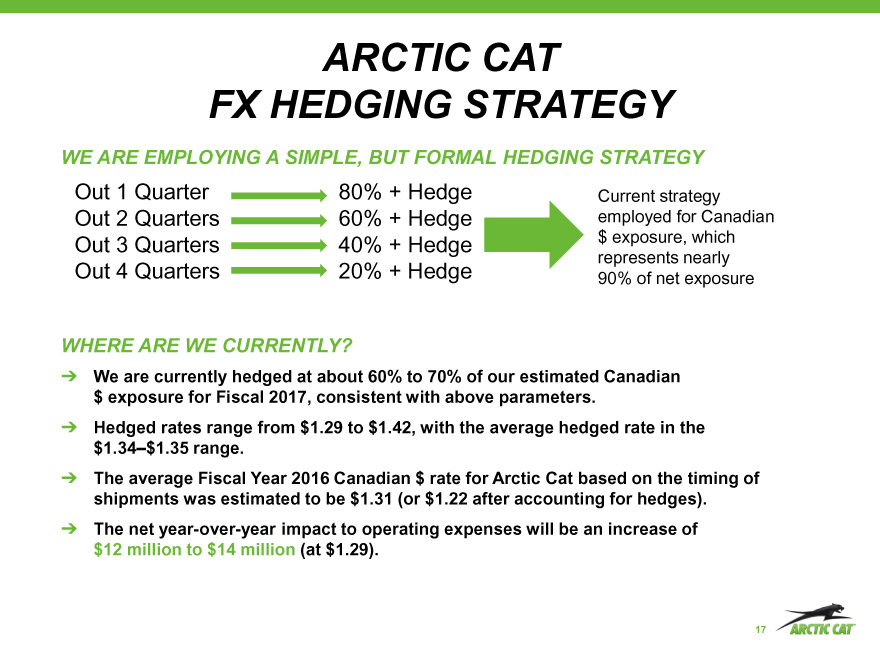
ARCTIC CAT FX HEDGING STRATEGY
16
ARCTIC CAT FX HEDGING STRATEGY
WE ARE EMPLOYING A SIMPLE, BUT FORMAL HEDGING STRATEGY
Out 1 Quarter 80% + Hedge Current strategy Out 2 Quarters 60% + Hedge employed for Canadian Out 3 Quarters 40% + Hedge $ exposure, which
represents nearly
Out 4 Quarters 20% + Hedge 90% of net exposure
WHERE ARE WE CURRENTLY?
We are currently hedged at about 60% to 70% of our estimated Canadian $ exposure for Fiscal 2017, consistent with above parameters.
Hedged rates range from $1.29 to $1.42, with the average hedged rate in the
$1.34–$1.35 range.
The average Fiscal Year 2016 Canadian $ rate for Arctic Cat based on the timing of shipments was estimated to be $1.31 (or $1.22 after accounting for hedges).
The net year-over-year impact to operating expenses will be an increase of $12 million to $14 million (at $1.29).
17
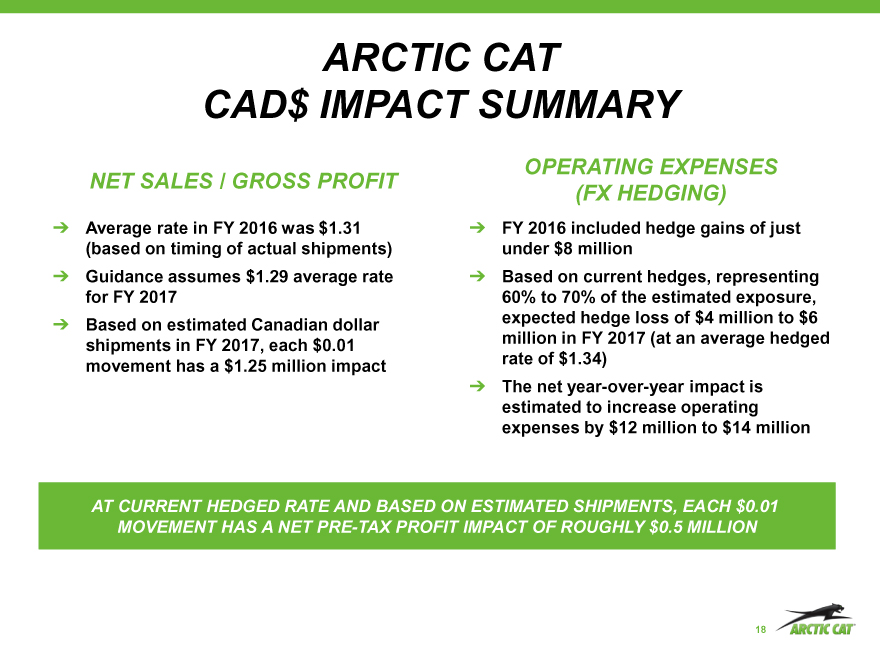
ARCTIC CAT CAD$ IMPACT SUMMARY
OPERATING EXPENSES
NET SALES / GROSS PROFIT
(FX HEDGING)
Average rate in FY 2016 was $1.31 FY 2016 included hedge gains of just (based on timing of actual shipments) under $8 million
Guidance assumes $1.29 average rate Based on current hedges, representing for FY 2017 60% to 70% of the estimated exposure,
Based on estimated Canadian dollar expected hedge loss of $4 million to $6 shipments in FY 2017, each $0.01 million in FY 2017 (at an average hedged movement has a $1.25 million impact rate of $1.34)
The net year-over-year impact is estimated to increase operating expenses by $12 million to $14 million
AT CURRENT HEDGED RATE AND BASED ON ESTIMATED SHIPMENTS, EACH $0.01 MOVEMENT HAS A NET PRE-TAX PROFIT IMPACT OF ROUGHLY $0.5 MILLION
18
FY 2017 GUIDANCE
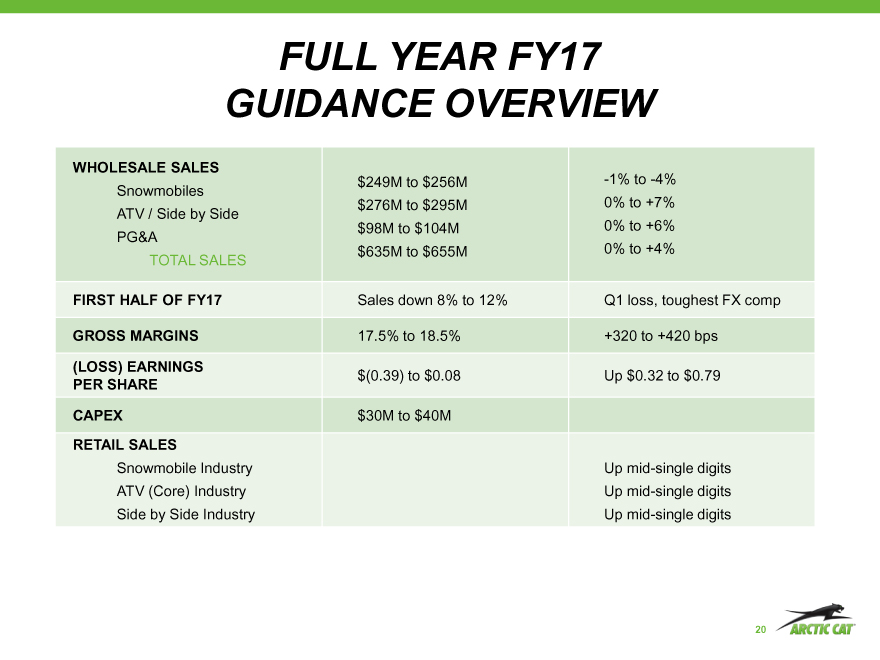
FULL YEAR FY17 GUIDANCE OVERVIEW
WHOLESALE SALES $249M to $256M -1% to -4% Snowmobiles $276M to $295M 0% to +7% ATV / Side by Side $98M to $104M 0% to +6% PG&A $635M to $655M 0% to +4% TOTAL SALES
FIRST HALF OF FY17 Sales down 8% to 12% Q1 loss, toughest FX comp
GROSS MARGINS 17.5% to 18.5% +320 to +420 bps
(LOSS) EARNINGS
$(0.39) to $0.08 Up $0.32 to $0.79
PER SHARE
CAPEX $30M to $40M
RETAIL SALES
Snowmobile Industry Up mid-single digits ATV (Core) Industry Up mid-single digits Side by Side Industry Up mid-single digits
20
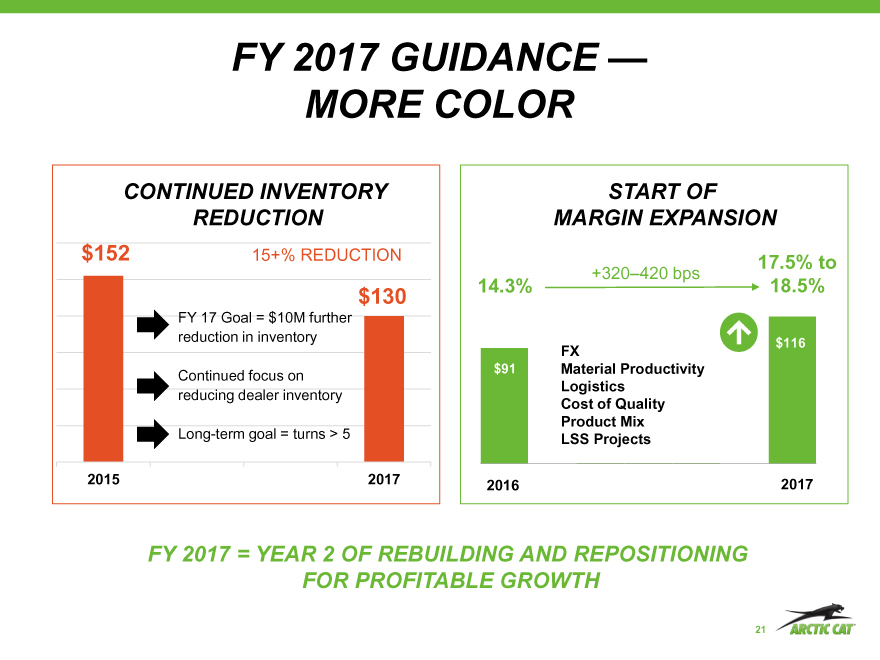
FY 2017 GUIDANCE — MORE COLOR
CONTINUED INVENTORY START OF REDUCTION MARGIN EXPANSION
$152 15+% REDUCTION 17.5% to +320–420 bps
14.3% 18.5%
$130
FY 17 Goal = $10M further reduction in inventory $116
FX
$91 Material Productivity
Continued focus on
Logistics reducing dealer inventory
Cost of Quality Product Mix
Long-term goal = turns > 5 LSS Projects
2015 2017 2016 2017
FY 2017 = YEAR 2 OF REBUILDING AND REPOSITIONING FOR PROFITABLE GROWTH
21
LOOKING BEYOND 2017
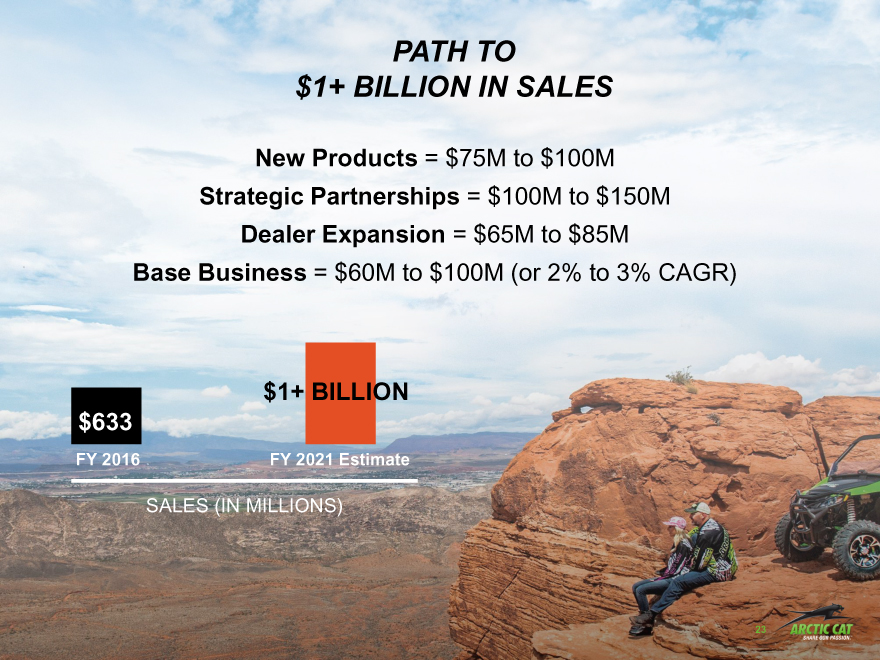
PATH TO
$1+ BILLION IN SALES
New Products = $75M to $100M
Strategic Partnerships = $100M to $150M Dealer Expansion = $65M to $85M
Base Business = $60M to $100M (or 2% to 3% CAGR)
$1+ BILLION $633
FY 2016 FY 2021 Estimate
SALES (IN MILLIONS)
23
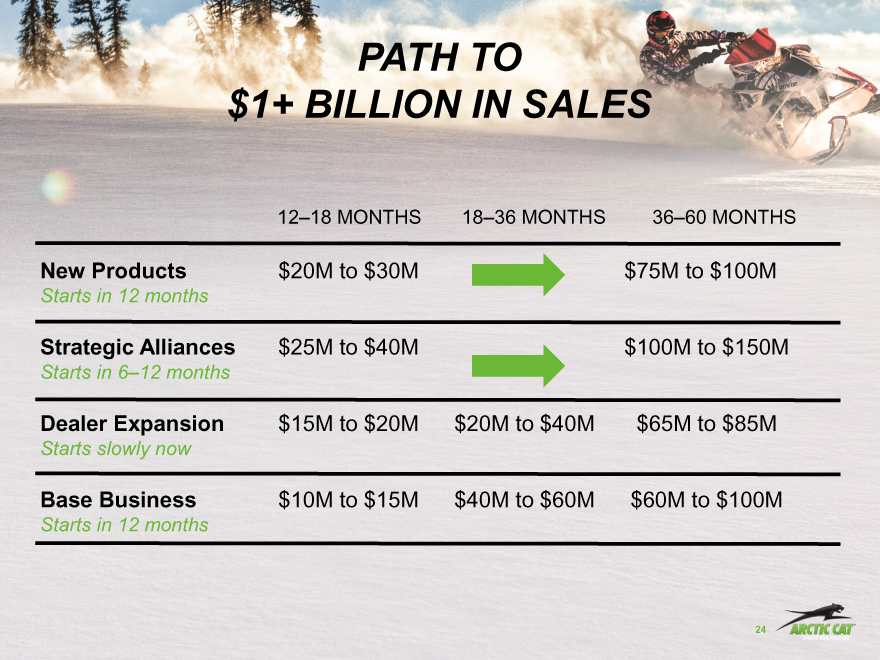
PATH TO
$1+ BILLION IN SALES
12–18 MONTHS 18–36 MONTHS 36–60 MONTHS
New Products $20M to $30M $75M to $100M
Starts in 12 months
Strategic Alliances $25M to $40M $100M to $150M
Starts in 6–12 months
Dealer Expansion $15M to $20M $20M to $40M $65M to $85M
Starts slowly now
Base Business $10M to $15M $40M to $60M $60M to $100M
Starts in 12 months
24
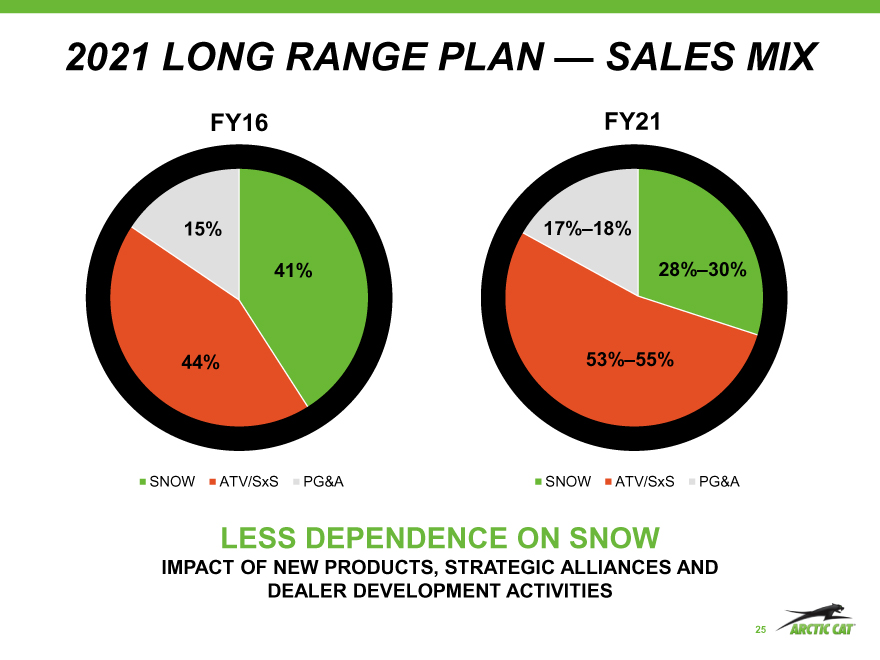
2021 LONG RANGE PLAN — SALES MIX
FY16 FY21
15% 17%–18%
41% 28%–30%
44% 53%–55%
SNOW ATV/SxS PG&A SNOW ATV/SxS PG&A
LESS DEPENDENCE ON SNOW
IMPACT OF NEW PRODUCTS, STRATEGIC ALLIANCES AND DEALER DEVELOPMENT ACTIVITIES
25
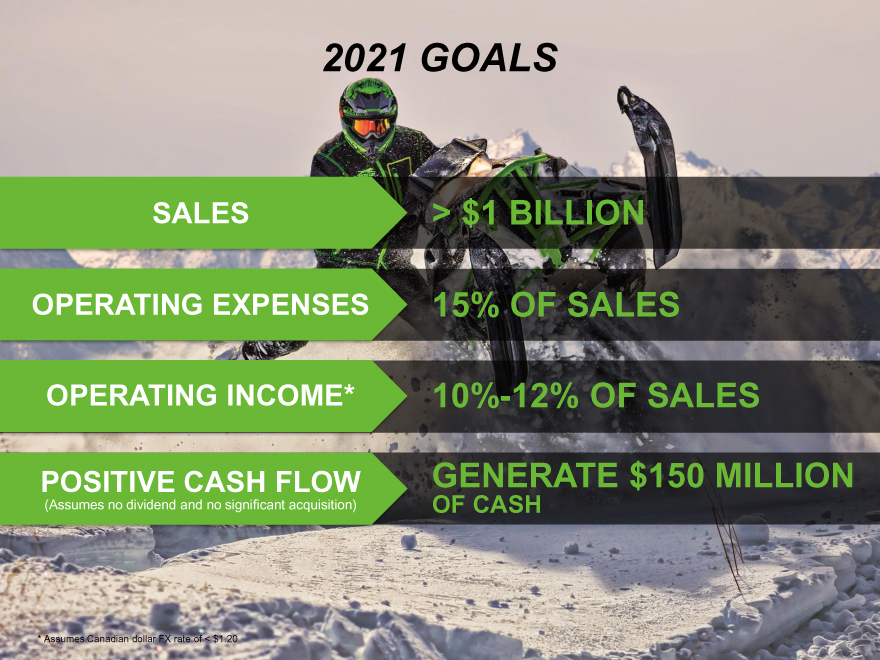
2021 GOALS
SALES > $1 BILLION
OPERATING EXPENSES 15% OF SALES
OPERATING INCOME* 10%-12% OF SALES
POSITIVE CASH FLOW GENERATE $150 MILLION
(Assumes no dividend and no significant acquisition) OF CASH
* Assumes Canadian dollar FX rate of < $1.20
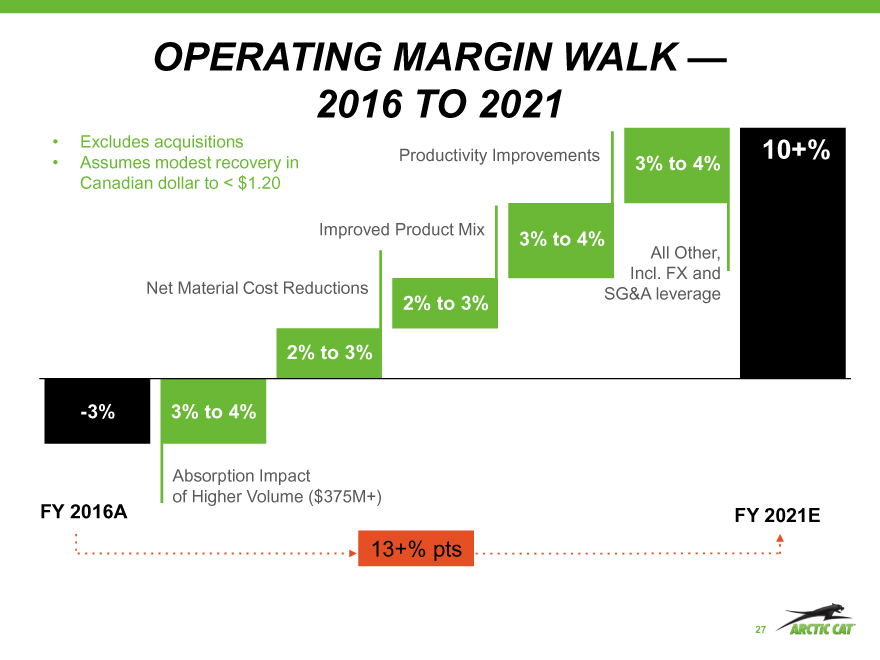
OPERATING MARGIN WALK — 2016 TO 2021
Excludes acquisitions 10+%
Assumes modest recovery in Productivity Improvements 3% to 4% Canadian dollar to < $1.20
Improved Product Mix
3% to 4%
All Other, Net Material Cost Reductions Incl. FX and SG&A leverage
2% to 3%
2% to 3%
-3% 3% to 4%
Absorption Impact of Higher Volume ($375M+)
FY 2016A FY 2021E
13+% pts
27
BUSINESS AND STRATEGIC UPDATE
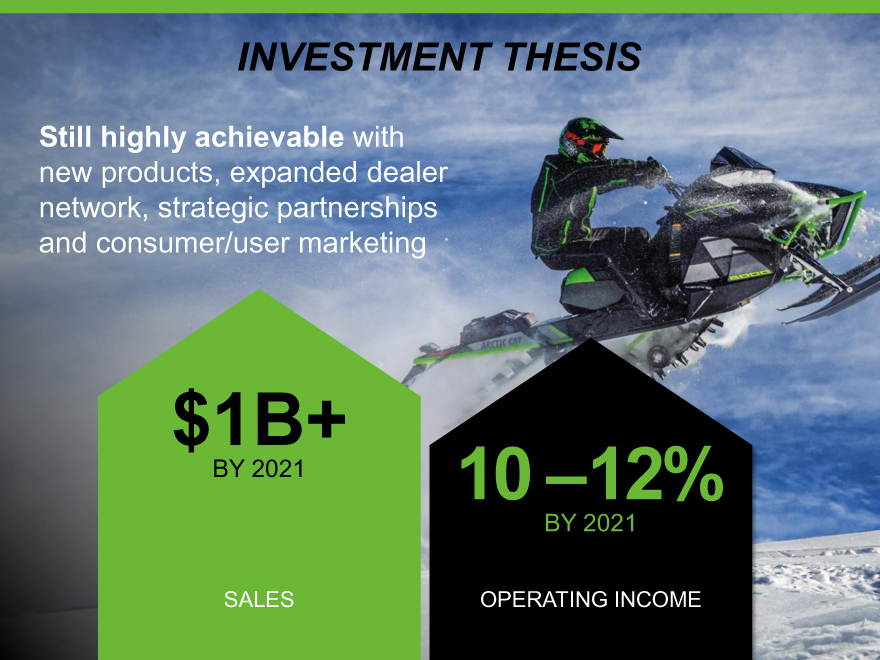
INVESTMENT THESIS
Still highly achievable with new products, expanded dealer network, strategic partnerships and consumer/user marketing
$1B+
BY 2021 10 –12% BY 2021
SALES OPERATING INCOME
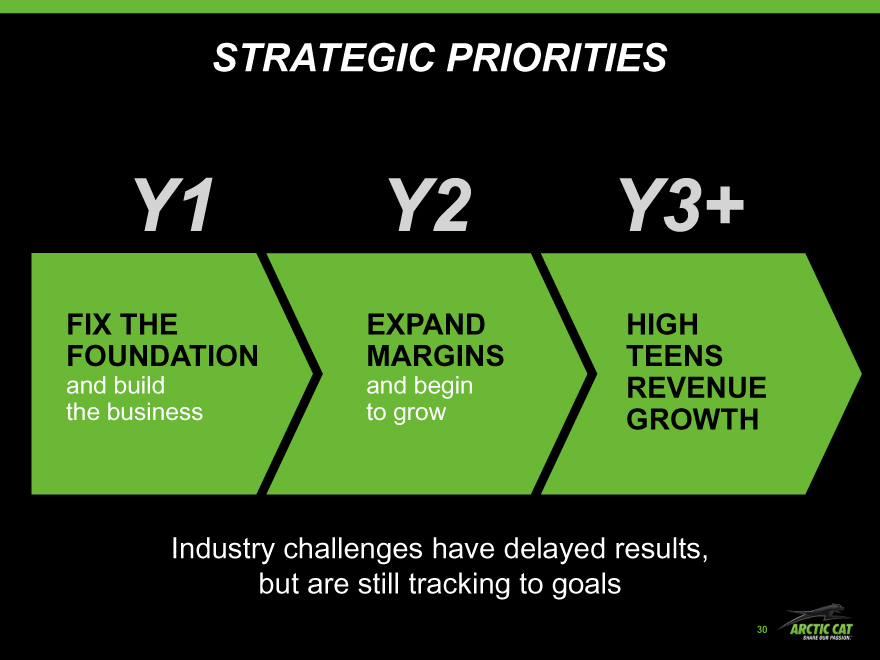
STRATEGIC PRIORITIES
FIX THE EXPAND HIGH FOUNDATION MARGINS TEENS
and build and begin REVENUE the business to grow GROWTH
Industry challenges have delayed results, INDUSTRY but areCHALLENGES still tracking HAVE to DELAYED goals
RESULTS BUT STILL TRACKING TO GOALS
30
GUIDING PRINCIPLES
A WINNING FOR SUCCESS, EXECUTION AND EXPECT CULTURE BEST TEAM WINS RESULTS — ACCOUNTABILITY
DELIVER THE ULTIMATE
EXPERIENCE
FOR RIDERS, WORKERS AND OUTDOOR ENTHUSIASTS AROUND THE WORLD BY DRIVING
PASSION AND PERFORMANCE IN EVERY PRODUCT AND SERVICE WE PROVIDE
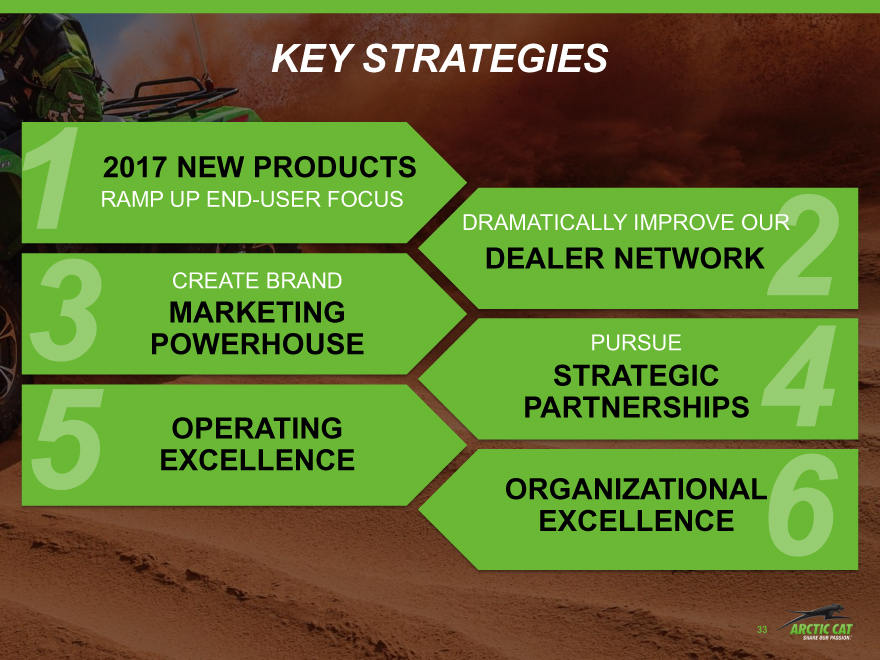
KEY STRATEGIES
2017 NEW PRODUCTS
RAMP UP END-USER FOCUS
DRAMATICALLY IMPROVE OUR
DEALER NETWORK
CREATE BRAND
MARKETING
POWERHOUSE PURSUE STRATEGIC
PARTNERSHIPS OPERATING
EXCELLENCE
ORGANIZATIONAL EXCELLENCE
33
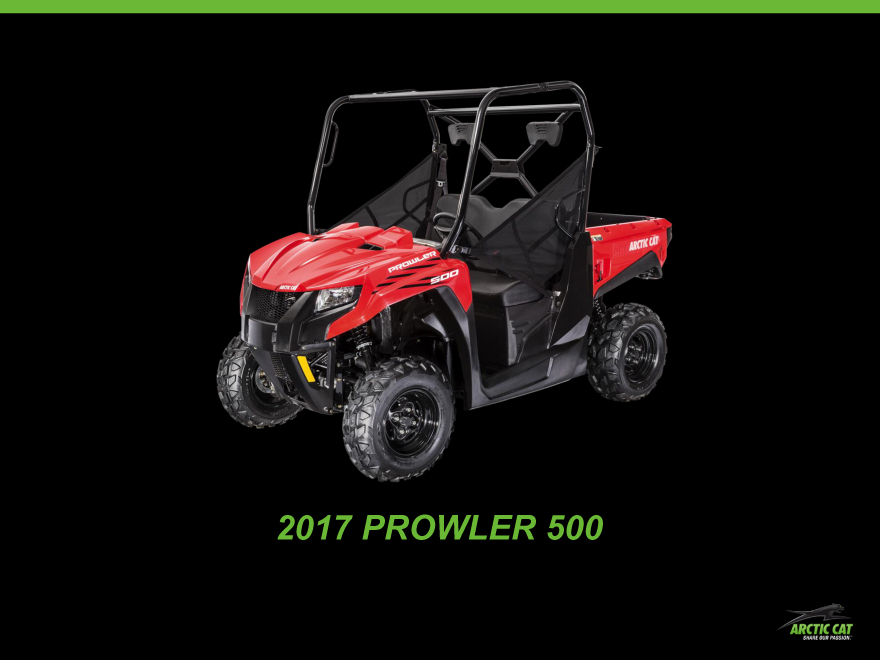
2017 NEW PRODUCTS
Hero products Margin enhancement
Gap fillers New categories
2017 NEW PRODUCTS
2017 HDX CREW
2017 PROWLER 500
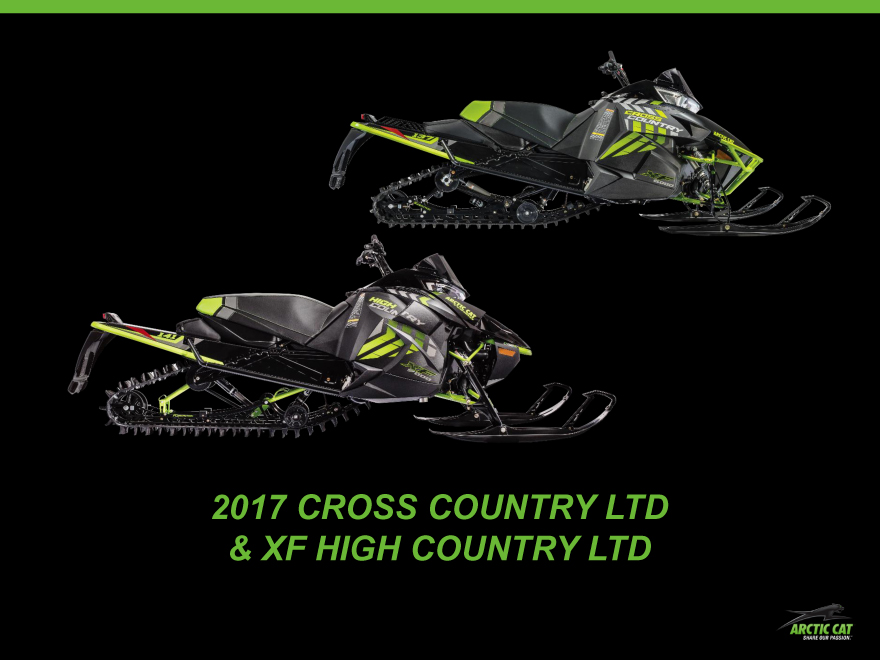
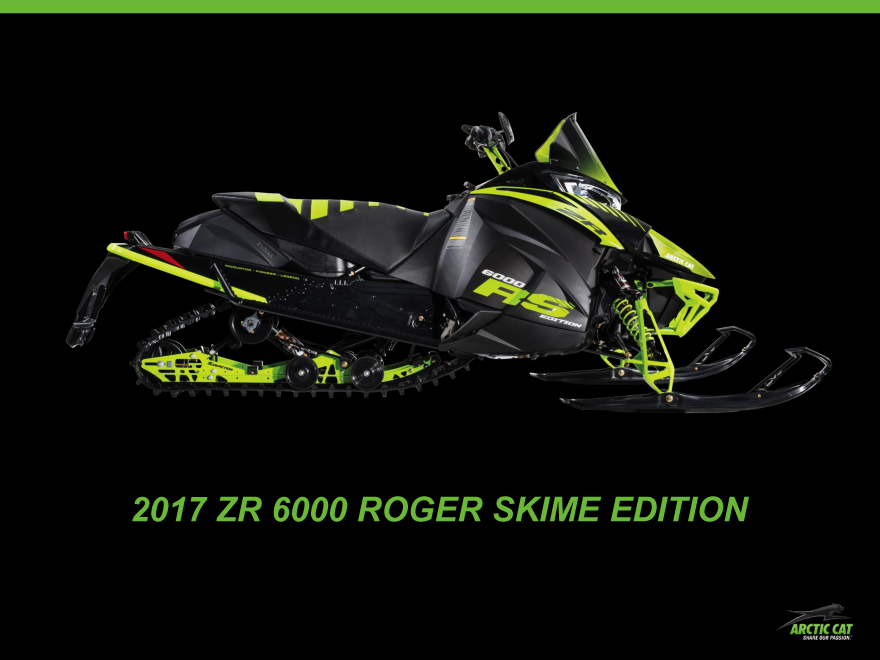
2017 NEW PRODUCTS
2017 MOUNTAIN CAT & THUNDERCAT 9000
2017 CROSS COUNTRY LTD
& XF HIGH COUNTRY LTD
2017 ZR 6000 ROGER SKIME EDITION
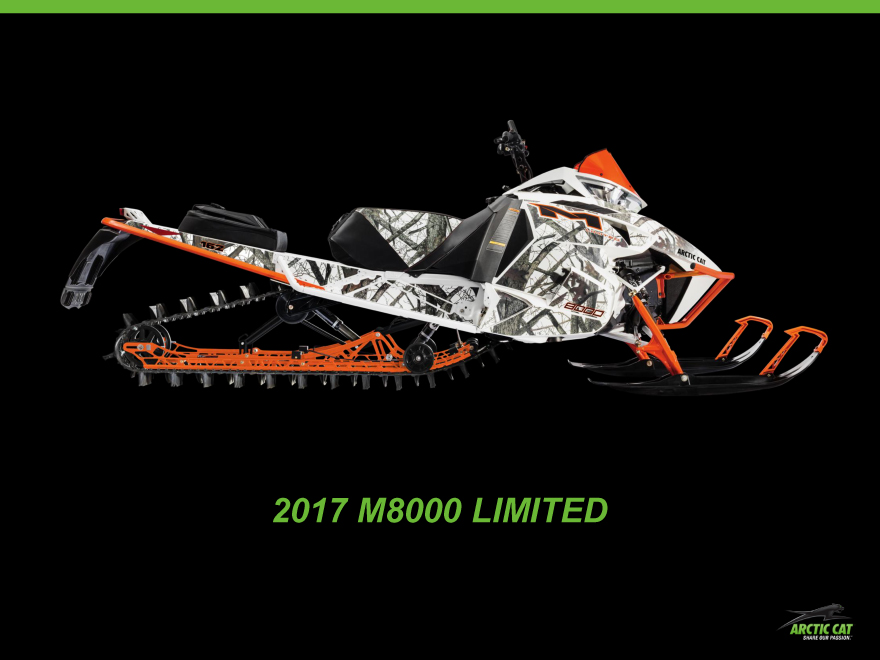
2017 M8000 LIMITED
2017 SVX 450
ACCOLADES
surpassing the 2017 Polaris XCR 800,
2017 SkiDoo XRS 800 and
2017 Yamaha Viper RTX
DEALER NETWORK
Add new dealers Reduce dealer inventory
Enhance dealer profitability Add dealer advisory council
MARKETING POWERHOUSE
Event marketing Brand marketing partnerships
Digital marketing Consumer promotions and programs
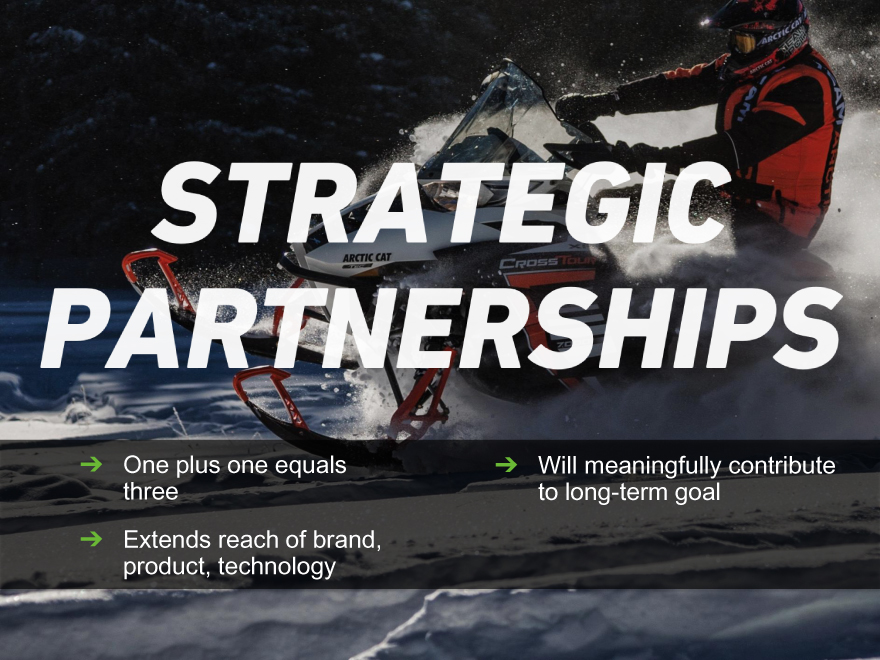
STRATEGIC PARTNERSHIPS
One plus one equals Will meaningfully contribute three to long-term goal
Extends reach of brand, product, technology
OPERATING EXCELLENCE
Manufacturing productivity Lower interest expense
Lower inventory Better VA/VE
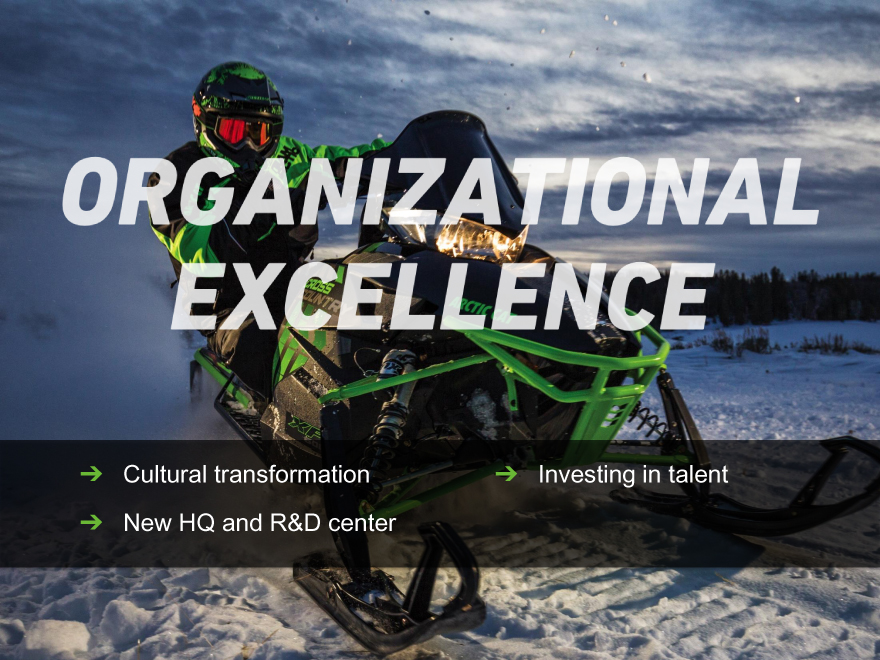
ORGANIZATIONAL EXCELLENCE
Cultural transformation Investing in talent
New HQ and R&D center
NEW FACILITIES
Q&A
APPENDIX
APPENDIX I — NON-GAAP FINANCIAL DISCLOSURES
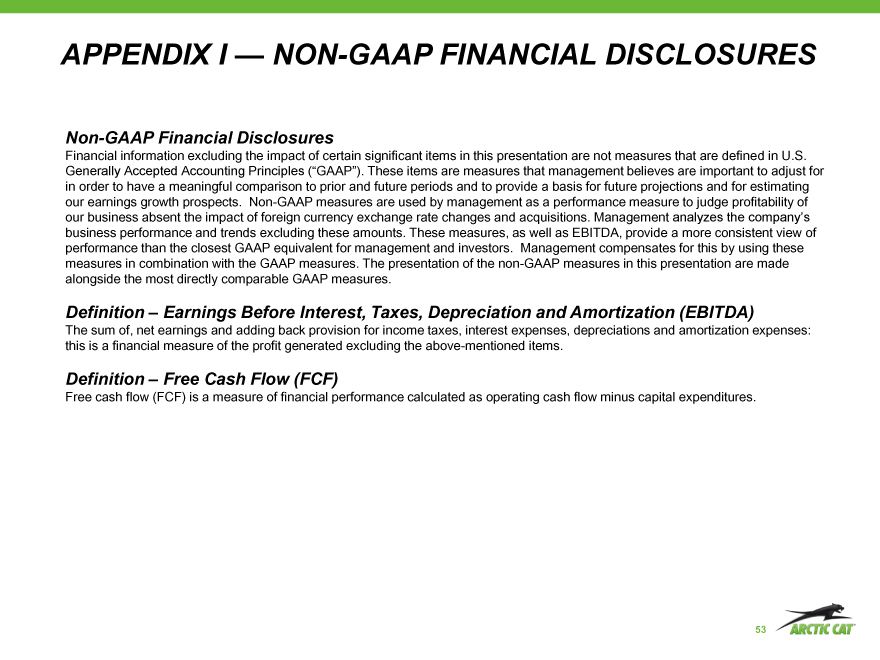
Non-GAAP Financial Disclosures
Financial information excluding the impact of certain significant items in this presentation are not measures that are defined in U.S. Generally Accepted Accounting Principles (“GAAP”). These items are measures that management believes are important to adjust for in order to have a meaningful comparison to prior and future periods and to provide a basis for future projections and for estimating our earnings growth prospects. Non-GAAP measures are used by management as a performance measure to judge profitability of our business absent the impact of foreign currency exchange rate changes and acquisitions. Management analyzes the company’s business performance and trends excluding these amounts. These measures, as well as EBITDA, provide a more consistent view of performance than the closest GAAP equivalent for management and investors. Management compensates for this by using these measures in combination with the GAAP measures. The presentation of the non-GAAP measures in this presentation are made alongside the most directly comparable GAAP measures.
Definition – Earnings Before Interest, Taxes, Depreciation and Amortization (EBITDA)
The sum of, net earnings and adding back provision for income taxes, interest expenses, depreciations and amortization expenses: this is a financial measure of the profit generated excluding the above-mentioned items.
Definition – Free Cash Flow (FCF)
Free cash flow (FCF) is a measure of financial performance calculated as operating cash flow minus capital expenditures.
53
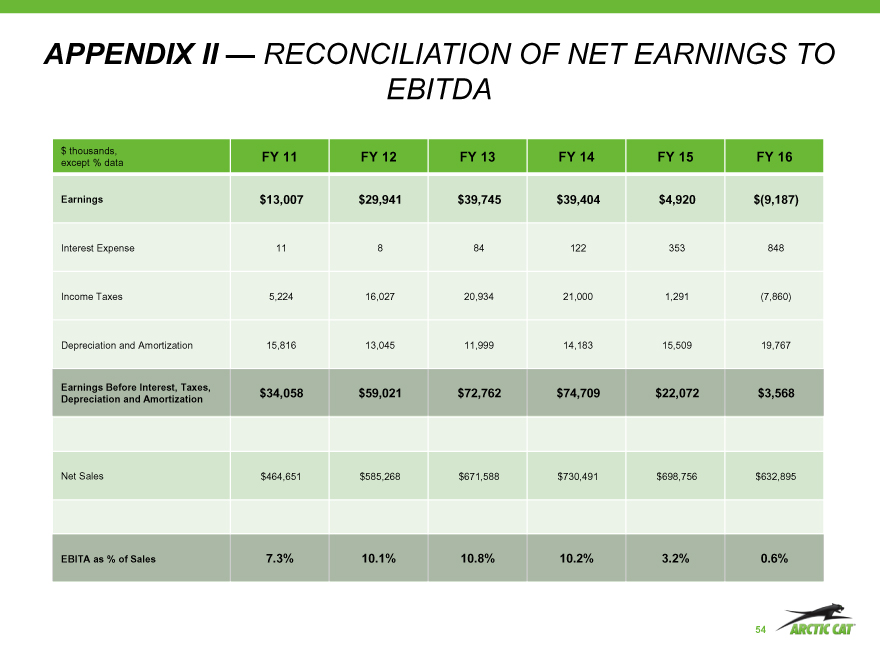
APPENDIX II — RECONCILIATION OF NET EARNINGS TO
EBITDA
$ thousands, FY 11 FY 12 FY 13 FY 14 FY 15 FY 16
except % data
Earnings $13,007 $29,941 $39,745 $39,404 $4,920 $(9,187)
Interest Expense 11 8 84 122 353 848
Income Taxes 5,224 16,027 20,934 21,000 1,291(7,860)
Depreciation and Amortization 15,816 13,045 11,999 14,183 15,509 19,767
Net Sales $464,651 $585,268 $671,588 $730,491 $698,756 $632,895
54
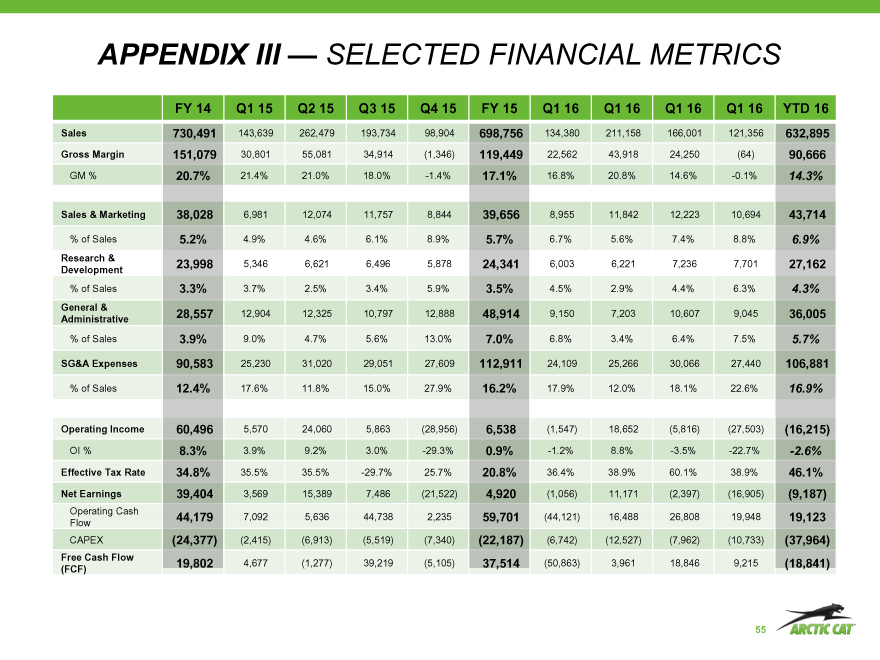
APPENDIX III — SELECTED FINANCIAL METRICS
FY 14 Q1 15 Q2 15 Q3 15 Q4 15 FY 15 Q1 16 Q1 16 Q1 16 Q1 16 YTD 16
Sales 143,639 262,479 193,734 98,904 134,380 211,158 166,001 121,356
Gross Margin 30,801 55,081 34,914(1,346) 22,562 43,918 24,250(64)
GM % 21.4% 21.0% 18.0% -1.4% 16.8% 20.8% 14.6% -0.1%
Sales & Marketing 6,981 12,074 11,757 8,844 8,955 11,842 12,223 10,694
% of Sales 4.9% 4.6% 6.1% 8.9% 6.7% 5.6% 7.4% 8.8%
Research &
Development 5,346 6,621 6,496 5,878 6,003 6,221 7,236 7,701
% of Sales 3.7% 2.5% 3.4% 5.9% 4.5% 2.9% 4.4% 6.3%
General &
Administrative 12,904 12,325 10,797 12,888 9,150 7,203 10,607 9,045
% of Sales 9.0% 4.7% 5.6% 13.0% 6.8% 3.4% 6.4% 7.5%
SG&A Expenses 25,230 31,020 29,051 27,609 24,109 25,266 30,066 27,440
% of Sales 17.6% 11.8% 15.0% 27.9% 17.9% 12.0% 18.1% 22.6%
Operating Income 5,570 24,060 5,863(28,956)(1,547) 18,652(5,816)(27,503)
OI % 3.9% 9.2% 3.0% -29.3% -1.2% 8.8% -3.5% -22.7%
Effective Tax Rate 35.5% 35.5% -29.7% 25.7% 36.4% 38.9% 60.1% 38.9%
Net Earnings 3,569 15,389 7,486(21,522)(1,056) 11,171(2,397)(16,905)
Operating Cash
Flow 7,092 5,636 44,738 2,235(44,121) 16,488 26,808 19,948
CAPEX(2,415)(6,913)(5,519)(7,340)(6,742)(12,527)(7,962)(10,733)
Free Cash Flow 4,677(1,277) 39,219(5,105)(50,863) 3,961 18,846 9,215
(FCF)
55
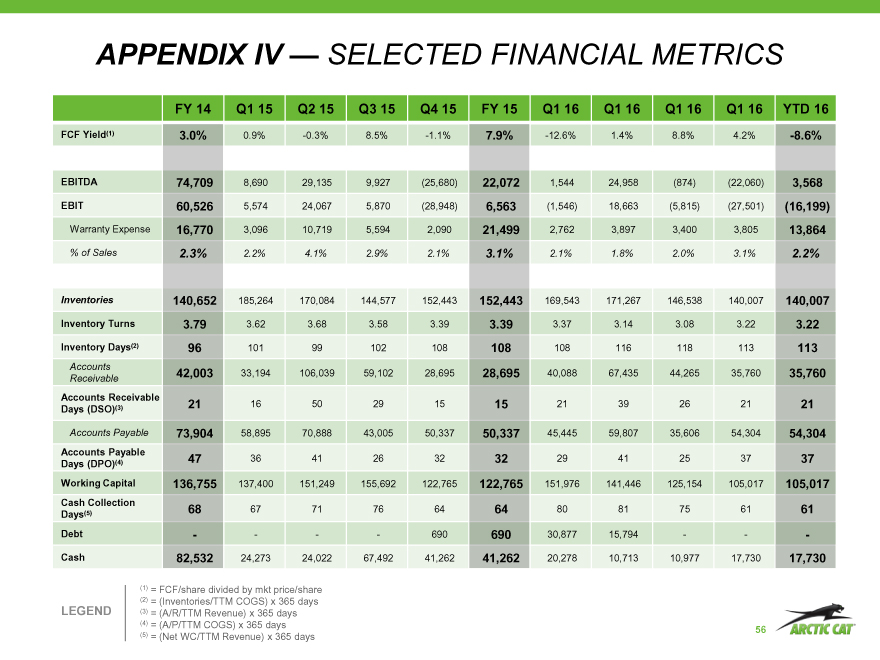
APPENDIX IV — SELECTED FINANCIAL METRICS
FY 14 Q1 15 Q2 15 Q3 15 Q4 15 FY 15 Q1 16 Q1 16 Q1 16 Q1 16 YTD 16
FCF Yield(1) 0.9% -0.3% 8.5% -1.1% -12.6% 1.4% 8.8% 4.2%
EBITDA 8,690 29,135 9,927(25,680) 1,544 24,958(874)(22,060)
EBIT 5,574 24,067 5,870(28,948)(1,546) 18,663(5,815)(27,501)
Warranty Expense 3,096 10,719 5,594 2,090 2,762 3,897 3,400 3,805
% of Sales 2.2% 4.1% 2.9% 2.1% 2.1% 1.8% 2.0% 3.1%
Inventories 185,264 170,084 144,577 152,443 169,543 171,267 146,538 140,007
Inventory Turns 3.62 3.68 3.58 3.39 3.37 3.14 3.08 3.22
Inventory Days(2) 101 99 102 108 108 116 118 113
Accounts
Receivable 33,194 106,039 59,102 28,695 40,088 67,435 44,265 35,760
Accounts Receivable
Days (DSO)(3) 16 50 29 15 21 39 26 21
Accounts Payable 58,895 70,888 43,005 50,337 45,445 59,807 35,606 54,304
Accounts Payable
Days (DPO)(4) 36 41 26 32 29 41 25 37
Working Capital 137,400 151,249 155,692 122,765 151,976 141,446 125,154 105,017
Cash Collection
Days(5) 67 71 76 64 80 81 75 61
Debt ——690 30,877 15,794 —
Cash 24,273 24,022 67,492 41,262 20,278 10,713 10,977 17,730
(1) = FCF/share divided by mkt price/share
(2) = (Inventories/TTM COGS) x 365 days
LEGEND(3) = (A/R/TTM Revenue) x 365 days
(4) = (A/P/TTM COGS) x 365 days 56
(5) = (Net WC/TTM Revenue) x 365 days
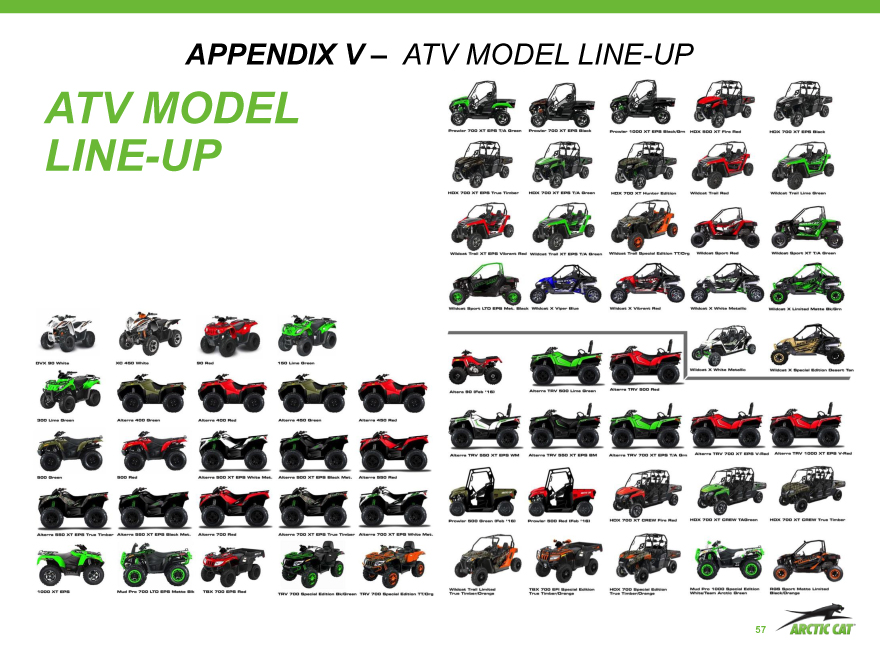
APPENDIX V – ATV MODEL LINE-UP
ATV MODEL LINE-UP
57
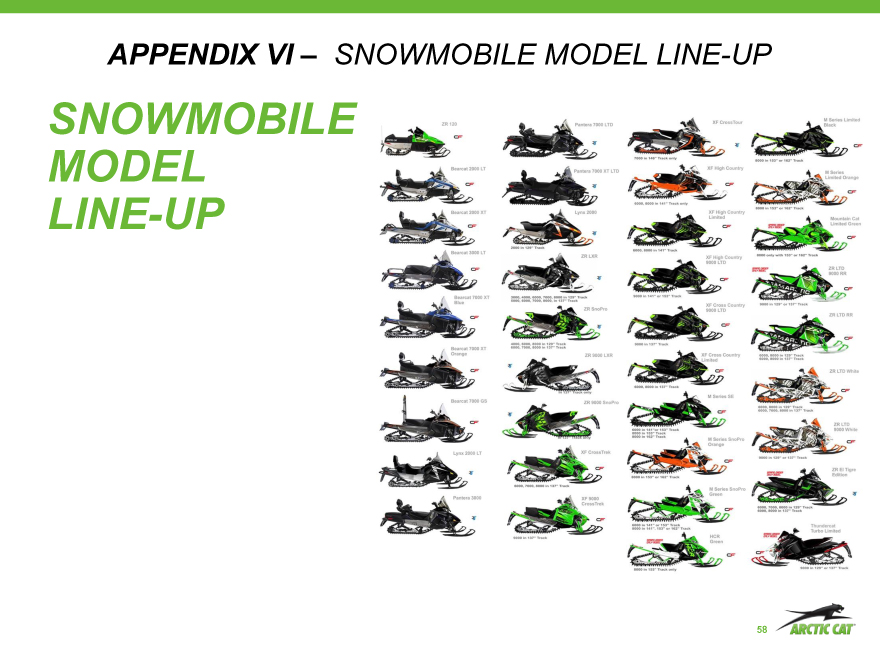
APPENDIX VI – SNOWMOBILE MODEL LINE-UP
SNOWMOBILE
MODEL
LINE-UP
58