
Raymond James Financial Analyst & Investor Day May 12, 2015 1

2 AGENDA 8:30 AM – 9:00 AM Welcome & General Overview Paul Reilly CEO, Raymond James Financial 9:00 AM – 9:30 AM Private Client Group Tash Elwyn President, Raymond James & Associates – PCG 9:30 AM – 10:00 AM Equity Capital Markets Jeff Trocin President, Global Equities and Investment Banking 10:00 AM – 10:15 AM Break 10:15 AM – 10:45 AM Asset Management Group Jeff Dowdle Executive Vice President, RJF 10:45 AM – 11:30 AM Raymond James Bank Steve Raney President and CEO, Raymond James Bank 11:30 AM – 12:00 PM Financial Review & Closing Jeff Julien CFO, Raymond James Financial 12:00 PM – 1:00 PM Lunch

3 FORWARD LOOKING STATEMENTS Certain statements made in this presentation and the associated webcast may constitute “forward-looking statements” under the Private Securities Litigation Reform Act of 1995. Forward-looking statements include information concerning future strategic objectives, business prospects, anticipated savings, financial results (including expenses, earnings, liquidity, cash flow and capital expenditures), industry or market conditions, demand for and pricing of our products, acquisitions and divestitures, anticipated results of litigation and regulatory developments or general economic conditions. In addition, words such as “believes,” “expects,” “anticipates,” “intends,” “plans,” “estimates,” “projects,” “forecasts,” and future or conditional verbs such as “will,” “may,” “could,” “should,” and “would,” as well as any other statement that necessarily depends on future events, are intended to identify forward-looking statements. Forward- looking statements are not guarantees, and they involve risks, uncertainties and assumptions. Although we make such statements based on assumptions that we believe to be reasonable, there can be no assurance that actual results will not differ materially from those expressed in the forward-looking statements. We caution investors not to rely unduly on any forward-looking statements and urge you to carefully consider the risks described in our filings with the Securities and Exchange Commission (the “SEC”) from time to time, including our most recent Annual Report on Form 10-K and subsequent Forms 10-Q, which are available on www.raymondjames.com and the SEC’s website at www.sec.gov. We expressly disclaim any obligation to update any forward-looking statement in the event it later turns out to be inaccurate, whether as a result of new information, future events, or otherwise.

4 WELCOME AND GENERAL OVERVIEW Paul Reilly CEO, Raymond James Financial

Private Client Group $3,267mm 67% Capital Markets $966mm 20% Asset Mgmt. $370mm 8% RJ Bank $352mm 7% FY 2014 Net Revenues* $4,861,369,000 OVERVIEW OF RAYMOND JAMES FINANCIAL KEY FACTS (as of March 31, 2015) • Headquartered in St. Petersburg, FL • Founded in 1962; public in 1983 • Approximately 2,600 locations • United States, Canada and overseas • Nearly 6,400 financial advisors • $496 billion of AUA • RJF shareholders’ equity of $4.4 billion • Market capitalization of approximately $8 billion 5 *Pie chart above does not include intersegment eliminations or the Other segment

CONTINUED PROFITABILITY 6 Trailing 10 Years E a rni n gs P e r Sha re (B a si c ) 109 Consecutive Profitable Quarters $0.00 $0.20 $0.40 $0.60 $0.80 $1.00 $1.20 J u n -0 5 S e p -0 5 D ec-0 5 M a r- 0 6 J u n -0 6 S e p -0 6 Dec-0 6 M a r- 0 7 J u n -0 7 S e p -0 7 Dec-0 7 M a r- 0 8 J u n -0 8 S e p -0 8 Dec-0 8 M a r- 0 9 J u n -0 9 S e p -0 9 Dec-0 9 M a r- 1 0 J u n -1 0 S e p -1 0 Dec-1 0 M a r- 1 1 J u n -1 1 S e p -1 1 Dec-1 1 M a r- 1 2 J u n -1 2 S e p -1 2 D ec-1 2 M a r- 1 3 J u n -1 3 S e p -1 3 Dec-1 3 M a r- 1 4 J u n -1 4 S e p -1 4 Dec-1 4 M a r- 1 5

7 RJF Stock Price vs. Sector, Five-Year Change CONTINUED PROFITABILITY Pe rcen t Cha n g e Five Years Ended March 31, 2015

VALUES-BASED CULTURE 8 INTEGRITY INDEPENDENCE CONSERVATISM CLIENT FIRST

FINANCIAL STABILITY TOTAL CAPITAL RATIO 20% 2X Regulatory Requirement OVER $1 Billion Cash 9

THE PREMIER ALTERNATIVE TO WALL STREET 10

STRATEGY 11 STRENGTHEN Invest in people, processes and technology GROW Refine and expand our offerings, recruit and acquire PROTECT Focus on clients, thoughtful risk management, long-term success

STRENGTHEN: ADVISOR RETENTION 12 REGRETTED ATTRITION

STRENGTHEN: TECHNOLOGY INVESTMENT 13

GROW: PRIVATE CLIENT GROUP 14

GROW: CAPITAL MARKETS 15 $1,858,550,000 The Regents of the University of California General Revenue Bonds 2013 AI-AK September 2013 PUBLIC FINANCE EXPANSION INVESTMENT BANKING PRACTICE EXPANSION $135,830,000 Los Angeles Unified School District 2014 General Obligation Bonds August 2014

GROW: ASSET MANAGEMENT 16 INCREASE INTERNAL USE INSTITUTIONAL CONSULTING

GROW: RAYMOND JAMES BANK 17 SECURITIES-BASED LENDING CANADIAN OPPORTUNITIES TAX-EXEMPT LENDING

GROW: ACQUISITIONS 18

PROTECT: REGULATORY ENVIRONMENT 19

PROTECT: VALUES-BASED CULTURE 20 INTEGRITY INDEPENDENCE CONSERVATISM CLIENT FIRST

LOOKING FORWARD 21

CHALLENGES 22

CLIENT OF THE FUTURE 23

TECHNOLOGY PLATFORM OF THE FUTURE 24

ADVICE OF THE FUTURE 25

ADVISOR OF THE FUTURE 26

THE BIONIC ADVISOR 27

PREMIER ALTERNATIVE TO WALL STREET 28

PRIVATE CLIENT GROUP Tash Elwyn President, Raymond James & Associates – PCG 29

PRIVATE CLIENT GROUP 30 The Private Client Group segment includes multiple affiliation options – referred to as AdvisorChoice® – as well as support functions including technology, operations, and practice management.

31 Raymond James is one of the largest private client firms in the industry. PRIVATE CLIENT GROUP Rank Firm Client Assets FAs ($B) 1 Bank of America / Merrill Lynch $2,510 16,175 2 Morgan Stanley 2,047 15,915 3 Wells Fargo & Co. 1,700 15,134 4 UBS Americas 1,087 6,997 5 Edward Jones & Co. 866 14,000 6 LPL Financial 485 14,098 7 RAYMOND JAMES* 471 6,384 8 Ameriprise 453 9,691 *Only includes AUA for PCG; RJF client assets and FA count are as of 3/31/2015 Note: Data from various dates based on availability. The definitions for client assets and FAs may be inconsistent across companies; rankings exclude RIA custodians but include independent B/Ds. Sources: Various company reports, company presentations, news releases, estimates.

88 163 220 215 230 330 168 FY 09 FY 10 FY 11 FY 12 FY 13 FY 14 FYTD 15 336* 32 1,549 1,901 2,182 2,474 2,919 3,267 1,716 FY 09 FY 10 FY 11 FY 12 FY 13 FY 14 FYTD 15 * First two quarters of fiscal 2015, annualized. ** FY 2012 and 2013 results were adversely impacted by acquisition-related and redundant expenses that were not included in the “Other” segment prior to retail platform consolidation in Feb. 2013. Notes: Charts not to scale; FYTD 15 includes first two quarters of fiscal year 2015. Net Revenues ($ millions) Pre-Tax Income ($ millions) Raymond James has consistently grown net revenues and pre-tax income in the Private Client Group segment. 3,432* PRIVATE CLIENT GROUP 16% 5-YR CAGR 30% 5-YR CAGR**

33 717 882 1,002 1,036 1,171 1,353 723 432 539 610 835 1,082 1,186 612 FY 09 FY 10 FY 11 FY 12 FY 13 FY 14 FYTD 15 RJIS RJL RJA RJFS1,263 1,585 1,818 2,056 2,455 1,438 PRIVATE CLIENT GROUP * First two quarters of fiscal 2015, annualized. Notes: RJA includes MK beginning in FY 2012. Charts not to scale; FYTD 15 includes first two quarters of fiscal year 2015. 2,876* 17% 5-YR CAGR Compared to 2009, the current mix between the employee (RJA) and independent (RJFS) channels is more balanced. Commissions and Fees ($ millions) 2,758
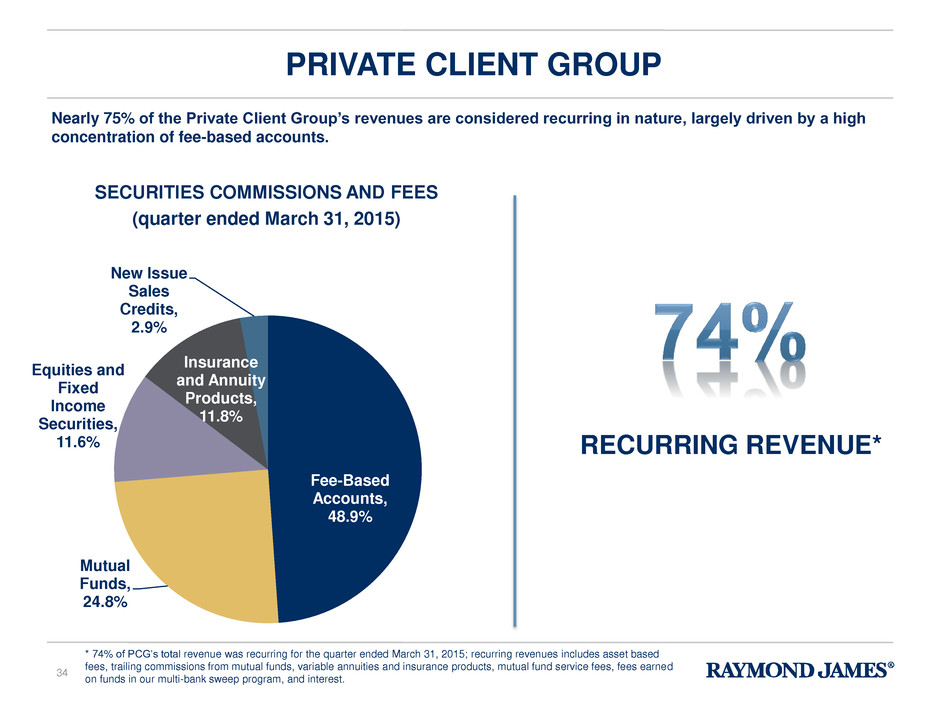
Fee-Based Accounts, 48.9% Mutual Funds, 24.8% Equities and Fixed Income Securities, 11.6% Insurance and Annuity Products, 11.8% New Issue Sales Credits, 2.9% PRIVATE CLIENT GROUP SECURITIES COMMISSIONS AND FEES (quarter ended March 31, 2015) 34 * 74% of PCG’s total revenue was recurring for the quarter ended March 31, 2015; recurring revenues includes asset based fees, trailing commissions from mutual funds, variable annuities and insurance products, mutual fund service fees, fees earned on funds in our multi-bank sweep program, and interest. RECURRING REVENUE* Nearly 75% of the Private Client Group’s revenues are considered recurring in nature, largely driven by a high concentration of fee-based accounts.

*Excludes RIAs with custody-only relationships 35 FY 09 FY 10 FY 11 FY 12 FY 13 FY 14 Q2 15 RJIS RJL RJA RJFS MK 5,154 6,210 6,265 6,384 6,197 5,182 5,216 223 249 254 368 403 451 471 FY 09 FY 10 FY 11 FY 12 FY 13 FY 14 Q2 15 PRIVATE CLIENT GROUP PCG AUA ($ billions) No. of Advisors* 15% 5-YR CAGR +1,202 FAs Private Client Group client assets have grown on average 15% per year from FY 2009 to FY 2014. The number of financial advisors have grown steadily over this period as well . . .

36 PRIVATE CLIENT GROUP . . . but Raymond James has always been more focused on quality of advisors instead of quantity of advisors. For example, in the first half of FY 2015, the average productivity of financial advisors recruited was much higher than the average productivity of financial advisors lost. 0 100 200 300 400 500 600 700 Avg. Production of Advisors Recruited in RJA and RJFS (FYTD 2015) Avg. Production of Advisors Lost in RJA and RJFS (FYTD 2015) Note: Average productivity estimates above based on unaudited management reports; figures above for domestic PCG business (RJA and RJFS) only

Expand Geographic Footprint Help Advisors Grow Their Business 37 Attract and Retain Highest-Quality Advisors Expand Training Program NEAR-TERM GROWTH INITIATIVES The near-term growth initiatives for the Private Client Group are largely unchanged from last year, as we have a significant opportunity to grow executing on our current strategy. . . PRIVATE CLIENT GROUP

THE CLIENT OF THE FUTURE PRIVATE CLIENT GROUP . . . but we have already started thinking beyond the next 5 years, so we can begin making the investments necessary to be competitive 10 to 20+ years from now. 38

PRIVATE CLIENT GROUP HIGH LOW C lari ty o f n e e d /c o m p le x it y V a lu e /pr ic in g p o w e r SELF- DIRECTED ADVICE- DEPENDENT Generational Preferences + Technology Advances Intrinsic advice preferences Growing market for addressing financial needs via technology alone Raymond James’ Value Proposition Robo advice will commoditize lower-value parts of our business but can also serve as a resource to support advisors. 39

PRIVATE CLIENT GROUP 40 OUTLOOK Strong retention and recruiting results despite competitive environment Continued success leveraging synergies with other businesses (fee based accounts, securities based loans) Intensifying regulatory environment

41 PRIVATE CLIENT GROUP INTEGRITY INDEPENDENCE CONSERVATISM CLIENT FIRST

EQUITY CAPITAL MARKETS Jeff Trocin President, Global Equities and Investment Banking 42

ECM (US/Europe) $415mil Fixed Income $392mil Tax Credit Funds $51mil ECM (Canada/Lat- Am/Other) $108mil FY 2014 Capital Markets Segment Net Revenue 100% = $966 million CAPITAL MARKETS SEGMENT The Capital Markets segment consists of several different divisions. The focus of this presentation is the Equity Capital Markets division in the U.S. and Europe, which represented $415 million of net revenues in FY 2014, or approximately 43% of the segment’s total net revenues. 43

537 596 691 812 938 966 467 FY 09 FY 10 FY 11 FY 12 FY 13 FY 14 FYTD 15 69 79 83 76 102 131 49 FY 09 FY 10 FY 11 FY 12 FY 13 FY 14 FYTD 15 98* 44 * First two quarters of fiscal 2015, annualized. Notes: Charts not to scale; FYTD 15 includes first two quarters of fiscal year 2015. Net Revenues ($ millions) Pre-Tax Income ($ millions) Raymond James has steadily grown net revenues and pre-tax income in the Capital Markets segment. . . 934* CAPITAL MARKETS SEGMENT 12% 5-YR CAGR 14% 5-YR CAGR

$207 $259 $294 $281 $379 $415 $213 FY 09 FY 10 FY 11 FY 12 FY13 FY 14 FYTD 15 EQUITY CAPITAL MARKETS Equity Capital Markets (United States / Europe) Net Revenues ($ millions) 15% 5-YR CAGR . . . and net revenues for the equity capital markets business in the U.S. and Europe grew on average 15% per year from FY 2009 to FY 2014. . . $426* * First two quarters of fiscal 2015, annualized. Notes: FYTD 15 includes first two quarters of fiscal year 2015. 45

$53 $118 $226 $207 $415 FY 95 FY 99 FY 04 FY 09 FY 14 EQUITY CAPITAL MARKETS ECM Formalized: 1996 Equity Capital Markets (United States / Europe) Net Revenues ($ millions) . . . which is up substantially from when the equity capital markets division was formalized in 1996. 46
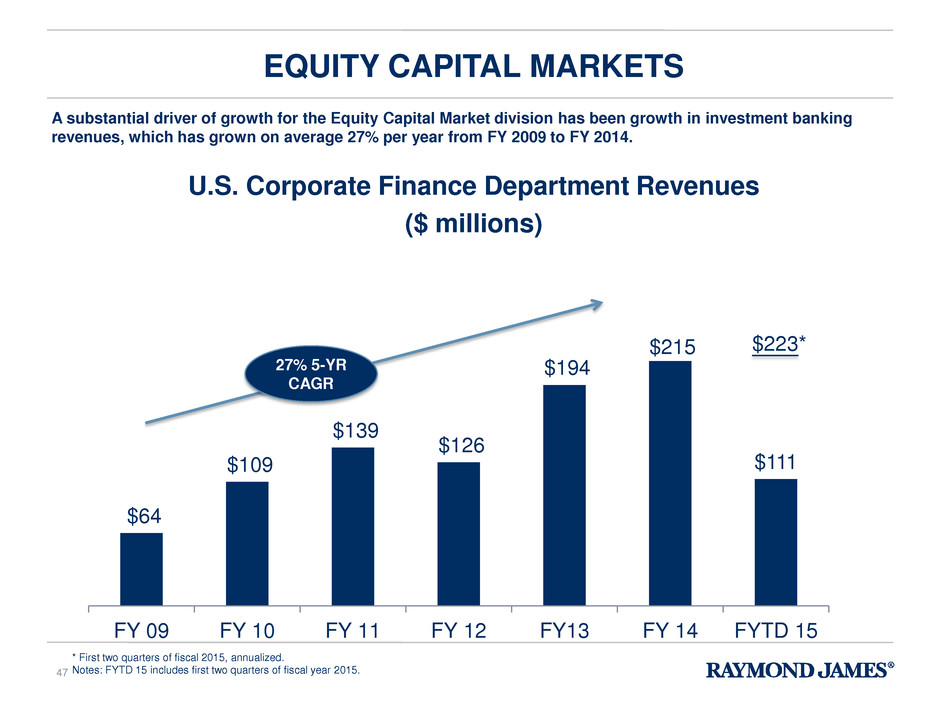
$64 $109 $139 $126 $194 $215 $111 FY 09 FY 10 FY 11 FY 12 FY13 FY 14 FYTD 15 EQUITY CAPITAL MARKETS U.S. Corporate Finance Department Revenues ($ millions) 27% 5-YR CAGR A substantial driver of growth for the Equity Capital Market division has been growth in investment banking revenues, which has grown on average 27% per year from FY 2009 to FY 2014. $223* * First two quarters of fiscal 2015, annualized. Notes: FYTD 15 includes first two quarters of fiscal year 2015. 47

12 19 31 29 42 46 32 FY 09 FY 10 FY 11 FY 12 FY 13 FY 14 FYTD 15 Advisory Fees > $1 million $41 $59 $87 $80 $132 $148 $87 FY 09 FY 10 FY 11 FY 12 FY 13 FY 14 FYTD 15 M&A/PP1 Advisory Revenues ($ millions) EQUITY CAPITAL MARKETS 1 Merger and acquisition fees and private placement advisory fees Investment banking growth has been lifted by substantial investments to strengthen our M&A capabilities over the past several years. 29% 5-YR CAGR $174* 64* 1) Merger & Acquisition and Private Placement * First two qu rters of fiscal 2015, annualized. Notes: FYTD 15 includes first two quarters of fiscal year 2015. 48

13 24 25 23 42 39 FY 09 FY 10 FY 11 FY 12 FY 13 FY 14 # Common Equity Underwritings/ Registered Block Transaction Fees > $1 Million EQUITY CAPITAL MARKETS The underwriting business has also benefitted from completing larger transactions, with a notable spike in the past two fiscal years. 49

IB Firm of the Year: Restructuring & Turnaround 8 Deals of the Year: M&A, Advisory Services, International RECENT ACCOLADES EQUITY CAPITAL MARKETS USA M&A Investment Bank of the Year 2 Deals of the Year: M&A & Advisory Services Investment Services Provider of the Year – USA Best Real Estate Investment Banking Practice 2014 IB Firm of the Year M&A Dealmaker of the Year: Jim Bunn 2013 2014 2014 2012 2013 Our investment banking platform has earned many accolades in the past few years. 50

2012 EQUITY CAPITAL MARKETS INVESTMENT BANKING MANAGING DIRECTORS 2011 2009 Joined via Acquisition 21 Legacy Raymond James/ External Hires 54 75 Managing Directors As of February 15, 2015 Currently, there are approximately 75 managing directors in investment banking, including many high-quality additions from recent acquisitions. 51

$203 $226 $261 $230 $247 $261 $130 FY 09 FY 10 FY 11 FY 12 FY 13 FY 14 FYTD 15 CAPITAL MARKETS Institutional Equity Commissions ($ millions) Meanwhile, the market environment has been extremely challenging for institutional equity commissions over the past several years. $260* * First two quarters of fiscal 2015, annualized. Notes: FYTD 15 includes first two quarters of fiscal year 2015. 5% 5-YR CAGR 52

• 52 Senior Analysts • 979 Covered Companies Global Equity Research U.S. Equity Research EQUITY CAPITAL MARKETS • 16 Senior Analysts • 217 Covered Companies Canada Equity Research • 11 Senior Analysts • 119 Covered Companies Europe/LatAm Equity Research • #1 Top Conferences 1 • #1 Research Service - Calls & Visits • 13 analysts recognized as award winners – 2nd most among all firms (2014) • “RYJ” Strong Buy-1 ETF • Based on all U.S. “Strong Buy” rated stocks • #1 Telecom Services Research • #1 Energy Services Research • #1 Energy – E&P Research • #1 Restaurants Research • 17 analysts recognized as award winners – 2nd most among all firms (2013) • -rated fund performance 2 Analyst and coverage data per Raymond James April 2015 Global Equity Research Register 1) Greenwich Associates, North American Equity Investors, U.S. Small/Mid-Cap Funds 2015 53
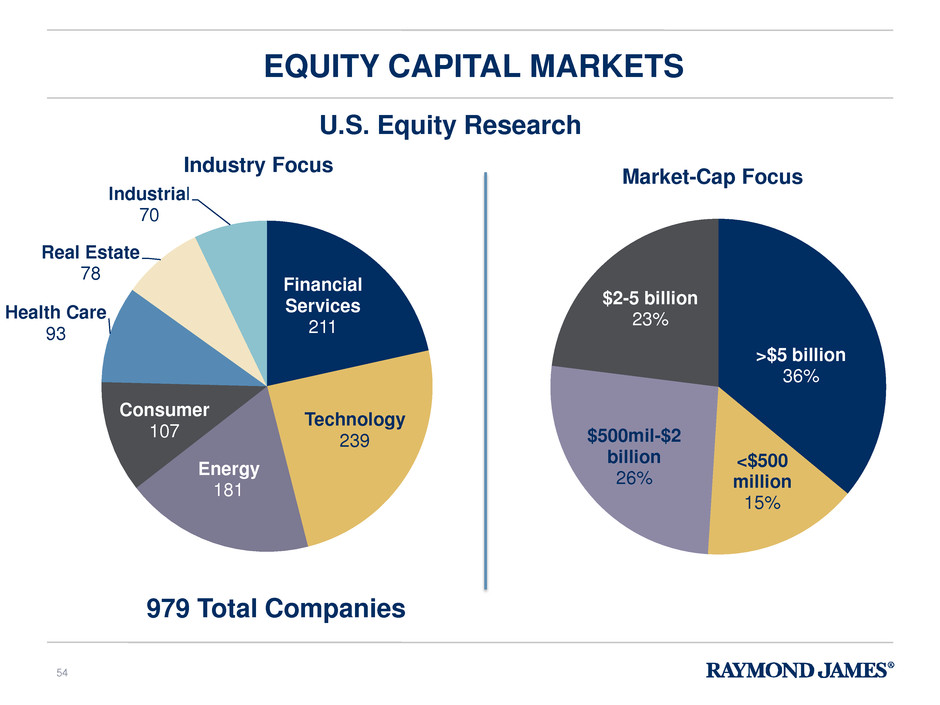
Financial Services 211 Technology 239 Energy 181 Consumer 107 Health Care 93 Real Estate 78 Industrial 70 Industry Focus 979 Total Companies >$5 billion 36% <$500 million 15% $500mil-$2 billion 26% $2-5 billion 23% Market-Cap Focus EQUITY CAPITAL MARKETS U.S. Equity Research As of December 31, 2014 54

EQUITY CAPITAL MARKETS • Build a meaningful Life Sciences/Biotech franchise • 15-20% of recent U.S. Equity U/W fees are in the Life Sciences sector • RJ has hired a senior banking team in the last several months • RJ has hired senior specialty pharmaceuticals research analyst and now targeting biotechnology hires • Build/Lift Out/Acquire European M&A/Advisory capabilities • Several peers/boutique firms are originating over 30% of their advisory revenues outside of North America Life Sciences European M&A/Advisory 2015 MAJOR GROWTH INITIATIVES 55

EQUITY CAPITAL MARKETS OUTLOOK Conducive environment for investment banking, particularly M&A Continued headwinds for institutional equity commissions Increased importance of balance sheet / lending capabilities relative to research expertise 56

ASSET MANAGEMENT GROUP Jeff Dowdle Executive Vice President, RJF 57

ASSET MANAGEMENT GROUP Asset Management Services Eagle Asset Management, Inc. Raymond James Trust Co. Overview of Asset Management Segment • $44B of financial assets under management • $87 billion of assets in non- discretionary asset-based programs • Offers discretionary and non discretionary fee-based programs – both managed and non-managed – exclusively to Private Client Group advisors and clients • $29B of assets under management (Eagle and affiliates) • Offers a variety of equity and fixed income objectives managed by highly experienced portfolio management teams • Provides separately managed accounts and mutual funds to institutional and retail clients • $3.5B of client assets • Provides broad range of personal trust services exclusively to Private Client Group advisors and clients 58 The Asset Management segment includes the Asset Management Services division, Eagle Asset Management (and affiliates), and Raymond James Trust. Balances as of 3/31/2015

30 47 66 67 96 128 71 FY 09 FY 10 FY 11 FY 12 FY 13 FY 14 FYTD 15 142* 59 177 197 227 237 293 370 194 FY 09 FY 10 FY 11 FY 12 FY 13 FY 14 FYTD 15 * First two quarters of fiscal 2015, annualized. Notes: Charts not to scale; FYTD 15 includes first two quarters of fiscal year 2015. Net Revenues ($ millions) Pre-Tax Income ($ millions) Raymond James has consistently grown net revenues and pre-tax income in the Asset Management segment. 388* ASSET MANAGEMENT GROUP 16% 5-YR CAGR 34% 5-YR CAGR

ASSET MANAGEMENT GROUP Growth in Financial Assets under Management – Eagle1 and AMS2 as of March 31, 2015 1. Includes Eagle and all affiliates; excludes Eagle Money Market Fund assets in FY 2009 2. Excludes non-managed AMS fee-based assets 15.3 18.0 19.6 27.0 32.9 40.6 44.5 13.6 15.6 16.1 20.0 27.9 28.8 29.0 (3.0) (3.5) (3.6) (4.2) (4.8) (4.8) (4.1) ($10) $0 $10 $20 $30 $40 $50 $60 $70 $80 FY 09 FY 10 FY 11 FY 12 FY 13 FY 14 FYTD 15 $ in billion s AMS Eagle Managed for Affiliates 60 20% 5-YR CAGR 69.4 64.6 56.0 42.8 32.1 30.0 25.9 Financial assets under management have grown on average 20% per year from FY 2009 to FY 2014.

Small Cap, $10.0B SMID / Mid Cap, $3.8B Large Cap, $5.5B Fixed Income, $5.9B ClariVest, $3.8B Eagle Asset Management, Inc. (and affiliates) Financial Assets under Management as of March 31, 2015 ASSET MANAGEMENT GROUP 61 Institutional, $12.4B Subadvisory, $2.6B Eagle Funds, $6.5B Retail SMA, $7.5B 35% 13% 19% 20% 13% 43% 9% 22% 26% Strategy Distribution Channel Eagle’s assets are well diversified – just under 50% are represented by small and mid cap strategies, and the products are distributed via multiple channels.

For the first half of FY 2015, net flows in non-discretionary asset-based programs are annualizing at 16.4% ASSET MANAGEMENT GROUP Net Flows of Financial Assets under Management – Eagle1 and AMS2 as of March 31, 2015 1. Includes Eagle and all affiliates; excludes Eagle Money Market Fund assets in FY 2009 2. Excludes non-managed AMS fee-based assets 62 Annualized net flows of financial assets under management have averaged about 8% per year since FY 2009. 2.6% 8.4% 9.7% 8.4% 10.4% 7.7% 3.4% FY 09 FY 10 FY 11 FY 12 FY 13 FY 14 FYTD 15 6.8%* * First two quarters of fiscal 2015, annualized.

ASSET MANAGEMENT GROUP Annualized Revenue Yield by Asset Category (% of Average Assets) 0.45% 0.35% 0.45% 0.18% 0.00% 0.10% 0.20% 0.30% 0.40% 0.50% Eagle Asset Mgmt. AMS - Mgd. % of A v e ra ge A sset s Gross Investment Advisory Fees Net Fees (Net of Subadvisor Pymts.) Note: Annualized revenue yield estimates are based on unaudited management reports 63 Assets held in managed programs represent approximately 80% of the investment advisory fees recorded in the Asset Management segment. Managed assets in Eagle generate higher revenue yields for the segment than managed assets in AMS.

Asset Management Group Investment Performance Highlights VS. PEER GROUPS FREEDOM EXCESS RETURNS 3Y 5Y 10Y Conservative Balanced (50%/50%) +1.5% +0.9% +1.2% Balanced (65/35) +0.8% +0.3% +0.9% Growth (100% Equity) +1.7% +0.9% +0.3% ASSET MANAGEMENT GROUP 64 AMS MANAGED PERFORMANCE EAGLE MANAGED PERFORMANCE Managed assets in both AMS and Eagle have generated attractive investment performance. • Over the past five years, 77% of Eagle fixed income and equity products beat their benchmarks • Over the past ten years, 95% of Eagle fixed income and equity products beat their benchmarks All figures above are as of 12/31/2014.

Acquisitions and Lift Outs Product Development Leveraging Synergies Asset Management Group Growth Opportunities ASSET MANAGEMENT GROUP 65 There are significant growth opportunities for both AMS and Eagle.

Attractive Growth of Fee Based Assets, Both Managed and Non-Discretionary Continued Yield Compression ASSET MANAGEMENT GROUP 66 Asset Management Group Outlook The outlook for the Asset Management segment is continued growth of assets, largely driven by growth in the Private Client Group, a structural trend towards fee based accounts, and a focus on acquisitions and lift outs to diversify and strengthen the array of products.

RAYMOND JAMES BANK Steve Raney President & CEO, Raymond James Bank 67

Conservative Credit Standards Prudent Financial / Capital Management Strong Internal Controls / Regulatory Compliance Sustainable, Profitable Growth Serve Financial Advisors, Retail & Institutional Clients RAYMOND JAMES BANK RJ Bank’s vision is to maximize shareholder value through prudent investing, efficient operations and delivery of selected banking products that enhance client relationships while providing mutually beneficial opportunities for financial advisors and affiliates. Business Model • Stable, low cost source of deposits • Flexible deposit base and capital base • Only one branch and two ATMs (no plans to increase either) • Synergies with Private Client Group and Capital Markets Segments 68

Corporate (C&I) Securities Based Lending / Residential Mortgages Typically target: • Institutional / Capital Markets clients • Relatively mature industries • Near investment grade ratings • EBITDA greater than $25 - $50 million • No mezzanine lending • Mostly floating rate facilities • Target debt service coverage of at least 1.25x Typically target: • Private Client Group clients • High credit quality / strong payment histories •Well collateralized loans • No Alt. A / subprime / negative amortizing mortgages Commercial Real Estate (CRE) Typically target: • Institutional / Capital Markets clients • REITs and stabilized properties – limited exposure to construction / development • Project finance loans are well collateralized and provided to experienced borrowers with good repayment histories 69 RJ Bank has a targeted lending strategy focused on corporate, commercial real estate, and retail loans. RAYMOND JAMES BANK

3.50% 3.31% 3.43% 3.50% 3.25% 2.98% 3.06% 70 317 258 269 336 347 352 203 FY 09 FY 10 FY 11 FY 12 FY 13 FY 14 FYTD 15 80 112 173 240 268 243 136 FY 09 FY 10 FY 11 FY 12 FY 13 FY 14 FYTD 15 * First two quarters of fiscal 2015, annualized. Notes: Charts not to scale; FYTD 15 includes first two quarters of fiscal year 2015. Net Revenues ($ millions) Pre-Tax Income ($ millions) RJ Bank has consistently grown revenues and pre-tax income, although compression of net interest margins has provided headwinds since FY 2012, although NIM compression has abated in the first half of fiscal 2015. RAYMOND JAMES BANK 406* 272* Net Interest Margin Net Revenues 25% 5-YR CAGR

6,594 6,095 6,548 7,992 8,821 10,964 12,061 FY 2009 FY 2010 FY 2011 FY 2012 FY 2013 FY 2014 Q2 FY 15 71 RAYMOND JAMES BANK RAYMOND JAMES BANK NET LOAN GROWTH ($ millions) RJ Bank has grown its loan portfolio nearly 11% annually since FY 2009. 11% 5 -YR CAGR

72 RJ Bank maintains a well-diversified loan portfolio, both in terms of type of loans. . . Commercial and Industrial, 55.5% Commercial Real Estate, 14.5% Residential Mortgages, 16.1% Securities Based Loans, 10.2% Tax Exempt Loans, 3.0% Loans Held for Sale, 0.7% RAYMOND JAMES BANK LOAN COMPOSITION (% of total loans, Q2 FY 2015) RAYMOND JAMES BANK
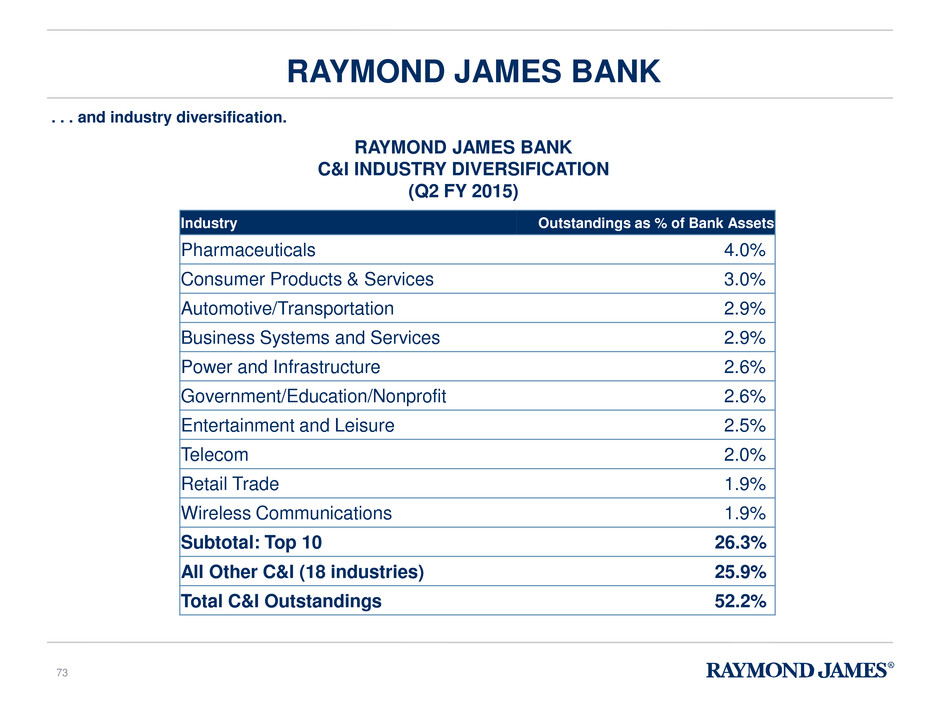
73 RAYMOND JAMES BANK C&I INDUSTRY DIVERSIFICATION (Q2 FY 2015) RAYMOND JAMES BANK . . . and industry diversification. Industry Outstandings as % of Bank Assets Pharmaceuticals 4.0% Consumer Products & Services 3.0% Automotive/Transportation 2.9% Business Systems and Services 2.9% Power and Infrastructure 2.6% Government/Education/Nonprofit 2.6% Entertainment and Leisure 2.5% Telecom 2.0% Retail Trade 1.9% Wireless Communications 1.9% Subtotal: Top 10 26.3% All Other C&I (18 industries) 25.9% Total C&I Outstandings 52.2%

• Established in 1977, the Shared National Credit (“SNC”) designation is a loan commitment of $20 million or more shared by three or more supervised institutions. • SNCs allow for consistent and efficient regulatory reviews and assessments of large C&I and CRE credits. • Raymond James Bank: • Individually underwrites, approves and monitors each loan, • Has access to all borrowers, and • Does not purchase SNC loans on a pool basis or as part of a fund / blind participation. • Raymond James Bank is an attractive partner in SNC syndications given “debt only” focus. • SNC loans provide a relatively liquid secondary market. 74 RAYMOND JAMES BANK OVERVIEW OF SHARED NATIONAL CREDITS The vast majority of RJ Bank’s corporate loans are shared national credits.

17.9% 12.7% 10.6% 10.0% 10.1% 15.7% 6.4% 5.6% 6.6% 2.6% 2010 2011 2012 2013 2014 All Shared National Credits (Industrywide) RJ Bank Shared National Credits RJ Bank Classified Loans 9.3% 3.2% 2.3% 2.1% Industrywide Classified Loans 12.1% 8.5% 7.5% 6.2% 0.8% 5.6% Source: OCC, RJF estimates and analysis RAYMOND JAMES BANK SHARED NATIONAL CREDITS CRITICIZED LOANS (% OF TOTAL SNC LOANS) The credit quality of RJ Bank’s Shared National Credits has consistently outperformed the industry by a wide margin. 75

76 The credit trends have improved significantly for RJ Bank’s loan portfolio since FY 2009. PROVISION EXPENSE ($ thousands) RAYMOND JAMES BANK NET CHARGE OFFS ($ thousands) NONPERFORMING ASSETS (% of total assets) ALLOWANCE FOR LOAN LOSSES (% of loans) 169,341 80,413 33,655 25,894 2,565 13,565 13,302 FY 2009 FY 2010 FY 2011 FY 2012 FY 2013 FY 2014 FYTD 15 107,224 83,601 34,995 24,214 13,309 1,747 (251) FY 2009 FY 2010 FY 2011 FY 2012 FY 2013 FY 2014 FYTD 15 2.10% 2.48% 1.64% 1.18% 0.99% 0.69% 0.55% FY 2009 FY 2010 FY 2011 FY 2012 FY 2013 FY 2014 Q2 FY 15 2.23% 2.36% 2.18% 1.81% 1.52% 1.33% 1.32% FY 2009 FY 2010 FY 2011 FY 2012 FY 2013 FY 2014 Q2 FY 15 Notes: Charts not to scale; FYTD 15 includes first two quarters of fiscal year 2015.

77 RAYMOND JAMES BANK Expand Lending and Cash Management Solutions to Private Client Group Lending to Capital Markets Clients GROWTH INITIATIVES RJ Bank’s growth initiatives continue to be focused on strengthening relationships with clients in the Private Client Group and Capital Markets segments.
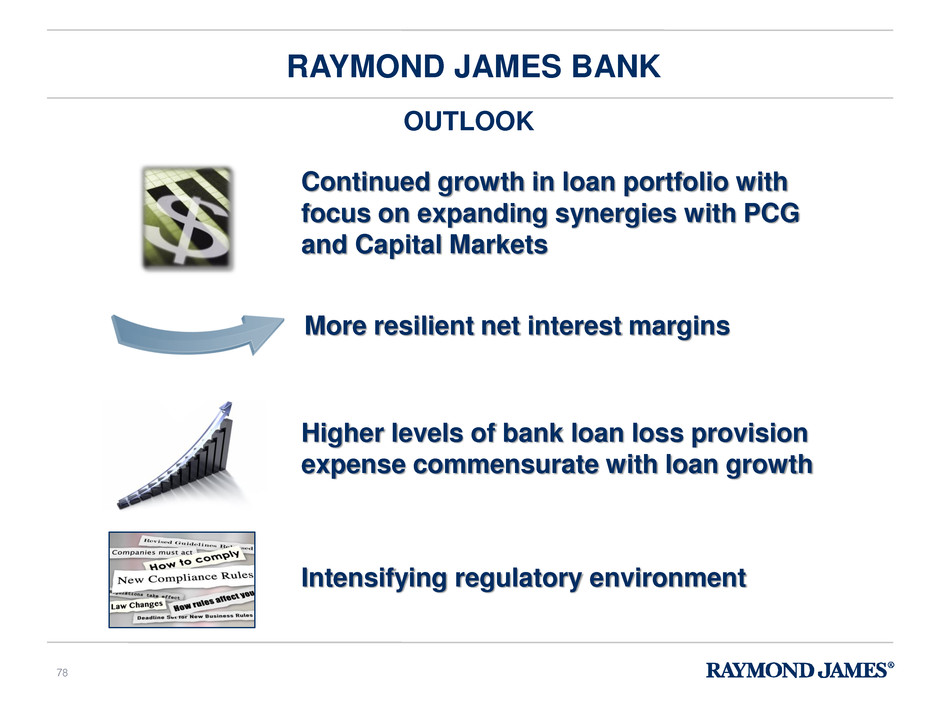
Continued growth in loan portfolio with focus on expanding synergies with PCG and Capital Markets More resilient net interest margins Higher levels of bank loan loss provision expense commensurate with loan growth RAYMOND JAMES BANK OUTLOOK Intensifying regulatory environment 78

79 RAYMOND JAMES BANK SUMMARY OF STRATEGY Provides Cash Management and Lending Solutions to Private Client Group Deepens Relationships with Capital Markets Clients Provides Business Diversification Attractive Risk-Adjusted Returns on Cash and Capital The long-term target is to grow RJ Bank at the same rate as the overall firm, limiting its balance sheet equity to roughly one-third of RJF’s total equity. Why does Raymond James have a bank?

FINANCIAL REVIEW & CLOSING Jeff Julien CFO, Raymond James Financial 80

2,546 2,917 3,334 3,807 4,485 4,861 2,538 FY 09 FY 10 FY 11 FY 12 FY 13 FY 14 FYTD 15 TRACK RECORD OF PROFITABLE GROWTH 14.6% 14.3% 14.2% 17.8% Net Revenues Recurring Revenues* (%) 52.8% 53.9% 55.0% 55.5% 56.3% * Includes fee-based accounts, investment advisory fees, interest income, cash sweep fees, and financial service fees (% is based on total revenues) ** First two quarters of fiscal 2015, annualized Annual Growth 14% 5-YR CAGR 61.3% NET REVENUE GROWTH ($ millions) 8.4% 63.9% 5,076** Raymond James has grown its net revenues 14% per year, on average, since FY 2009. 81

249 362 503 533 644 748 383 FY 09 FY 10 FY 11 FY 12 FY 13 FY 14 FYTD 15 9.8% 12.4% 15.1% 14.0% 14.4% 15.4% 15.1% Pre-Tax Income (Non-GAAP*) Pre-Tax Margin** (Non-GAAP) *For a reconciliation of the GAAP to the Non-GAAP measures, please see the schedule of Non-GAAP Information contained in the Appendix ** Based on net revenues. *** First two quarters of fiscal 2015, annualized Annual Growth 45.4% 38.9% 6.0% 20.8% TRACK RECORD OF PROFITABLE GROWTH 25% 5-YR CAGR PRE-TAX INCOME GROWTH NON-GAAP* ($ millions; %) 16.1% 766*** Raymond James has grown its pre-tax income by 25% per year, on average, since FY 2009. 82

TRACK RECORD OF PROFITABLE GROWTH PRE-TAX INCOME BY CORE SEGMENT ($ millions) 89 163 220 215 230 330 336 69 79 83 76 102 131 98 80 112 173 240 268 243 272 30 47 66 67 96 128 142 FY 09 FY 10 FY 11 FY 12 FY 13 FY 14 FYTD 15 RJ Bank Private Client Group Capital Markets Asset Management * First two quarters of fiscal 2015, annualized Note: Chart excludes Other segment Annualized* All of the firm’s core segments have steadily grown pre-tax income over the past 5½ years. 83

1.25 1.83 2.19 2.20 2.58 3.32 1.64 2.39 2.51 2.95 FY 09 FY 10 FY 11 FY 12 FY 13 FY 14 FYTD 15 GAAP Non-GAAP* *For a reconciliation of the GAAP to the Non-GAAP measures, please see the schedule of Non-GAAP Information contained in the Appendix. ** First two quarters of fiscal 2015, annualized TRACK RECORD OF PROFITABLE GROWTH 5-YR CAGR: 22% GAAP DILUTED EARNINGS PER SHARE GROWTH GAAP AND NON-GAAP* 3.28** Diluted earnings per share has grown on average by 22% per year since FY 2009. 84

7.9% 11.3% 9.7% 10.6% 11.3% 10.6% 12.2% 11.0% 12.0% 12.3% FY 09 FY 10 FY 11 FY 12 FY 13 FY 14 FYTD 15* GAAP NON-GAAP* *For a reconciliation of the GAAP to the Non-GAAP measures, please see the schedule of Non-GAAP Information contained in the Appendix. ** Annualized return on equity for first two quarters of fiscal 2015 RJF ANNUAL RETURN ON EQUITY TRACK RECORD OF PROFITABLE GROWTH Raymond James generated a 12.3% return on equity in FY 2014, just above the 12% target. 85

13.1 15.7 15.6 13.0 7.9 10.6 11.3 9.7 10.6 12.3 13.5 23.2 13.4 6.7 3.9 8.9 7.8 8.0 10.2 11.6 FY 2005 FY 2006 FY 2007 FY 2008 FY 2009 FY 2010 FY 2011 FY 2012 FY 2013 FY 2014 RJF Competitor Group Median* * Except as otherwise indicated, all numbers represented in bar chart are GAAP (for both RJF and Competitor Group). Competitor Group includes GS, MS, SF, LPLA, PJC, SCHW, EVR, LAZ (Source: RJF Financial Reports; SNL Financial). TRACK RECORD OF PROFITABLE GROWTH 8% pts. 19% pts. RETURN ON EQUITY RJF VS. COMPETITOR GROUP* (%) Raymond James has a track record of generating much less volatile returns to our shareholders relative to other firms in our industry. 86

CONSERVATIVE FINANCIAL MANAGEMENT Total Assets $25.0 billion Equity Attributable to RJF $4.375 billion Leverage (Assets/RJF Equity) 5.7x $1.2 billion Corporate Debt Level 3 Assets to RJF Equity Total Capital Ratio Tier 1 Leverage Ratio 8.5%* 20.1% 16.2% Regulatory Requirements** * Level 3 Assets in the calculation exclude impaired loans and the noncontrolling interests in private equity holdings ** To be well capitalized under prompt corrective action provisions 10% 5% BALANCE SHEET DATA (as of March 31, 2015) Leverage (excl. RJ Bank) 4.0x Raymond James maintains a very strong balance sheet. 87

$250 @ 4.25% 2016 2019 2024 2042* $350 @ 6.90% $300 @ 8.60% $250 @ 5.625% Maturity $ mm; Coupon * Can be called anytime after March 2017 Vintage 2011 2009 2012 2012 CORPORATE DEBT CONSERVATIVE FINANCIAL MANAGEMENT The firm maintains a conservative level of corporate debt with a staggered maturity profile, with the first maturity in 2016. 88

CAPITAL DISCUSSION CONSERVATIVE FINANCIAL MANAGEMENT 89 23.7% 17.1% 19.8% 22.2% 18.8% 17.0% 20.7% 23.4% Q3 FY 2013 Q4 FY 2013 Q1 FY 2014 Q2 FY 2014 Q3 FY 2014 Q4 FY 2014 Q1 FY 2015 Q2 FY 2015 $0.59 $0.82 Earnings per Diluted Share (GAAP) $0.14 $0.14 Dividend per Share* Average Dividend Payout 20.1% $0.16 $0.81 *Timing of quarterly dividends based on payment date to shareholders. $0.16 $0.72 Dividends: Target is typically 15-25% of earnings. In market downturns, the company maintains its most recent dividend if feasible Securities Repurchases: Historically, an opportunistic approach. Typically target stock repurchases when the price of RJF stock falls to relatively low price multiples and to purchase shares surrendered by employees as payment for option exercises $0.85 $0.94 $0.16 $0.16 $0.18 $0.87 $0.18 $0.77 Raymond James has maintained a disciplined and consistent approach to capital deployment, with a priority on deploying capital to grow the business.

6.0% 6.5% 7.0% 7.5% 8.0% 8.5% 9.0% 9.5% 10.0% Oc t-0 9 Dec-0 9 F e b -1 0 A p r-1 0 J u n -1 0 A u g -1 0 Oc t-1 0 Dec-1 0 F e b -1 1 A p r-1 1 J u n -1 1 A u g -1 1 Oc t-1 1 Dec-1 1 F e b -1 2 A p r-1 2 J u n -1 2 A u g -1 2 Oc t-1 2 Dec-1 2 F e b -1 3 A p r-1 3 J u n -1 3 A u g -1 3 Oc t-1 3 Dec-1 3 F e b -1 4 A p r-1 4 J u n -1 4 A u g -1 4 Oc t-1 4 Dec-1 4 F e b -1 5 90 CONSERVATIVE FINANCIAL MANAGEMENT CLIENT CASH BALANCES* TO TOTAL CLIENT ASSETS UNDER ADMINISTRATION (%) 8.2% Average * Does not include cash held through non-money market mutual funds or cash equivalents, etc. Domestic retail business only. For the past several quarters, client cash balances to total client assets have remained below the historical averages.

91 CONSERVATIVE FINANCIAL MANAGEMENT Brokerage Client Cash / Cash Interest Program (~$3 B) Raymond James Bank Deposit Program (RJBDP) (~$28 B) Client Margin Loans (~$2 B) Raymond James Bank’s Earning Assets (~$11 B***) Off-Balance Sheet Assets Earning Fees (~$19 B) Segregated Assets (~$2 B) to Raymond James Bank (~$11 B) to unaffiliated banks (~$17 B) Money Market Mutual Funds (~$2 B) CLIENT CASH BALANCES* (~$33 B) CORRESPONDING ASSETS • NII to PCG Segment • NII to PCG Segment • NII to Raymond James Bank • Account and Service Fees to PCG Segment** • Account and Service Fees to PCG Segment * Includes money market mutual funds ** These Account and Service Fees from RJ Bank to PCG are eliminated in the consolidated financial statements *** Average earning assets for RJ Bank was ~$13 B for the period; the ~$11 B represents the estimated amount funded with Client Cash (the other portion funded with capital, other borrowings, and other cash balances). Note: The diagram does not contain all of the firm’s interest bearing assets and liabilities; instead, the diagram is intended to only illustrate those interest bearing assets and liabilities that are related to domestic client cash balances; the numbers on this page are directional any may not tie perfectly to other financial reports; numbers may not add due to rounding OVERVIEW OF SENSITIVITY TO CHANGES IN SHORT-TERM INTEREST RATES (as of March 31, 2015)

92 ~$20 mm ~$40 mm ~$70 mm ~$130 mm Raymond James Bank Rest of Firm* (excl. Raymond James Bank) Account and Service Fees in PCG (RJBDP to Unaffiliated Banks & Money Market Funds) Projected Incremental Pre-Tax Earnings CONSERVATIVE FINANCIAL MANAGEMENT NET INTEREST INCOME * Mostly attributable to PCG, but also includes impact on non-PCG segments, such as trading Inventories, corporate/subsidiary free cash balances, etc. PROJECTED INCREASE IN ANNUAL PRE-TAX EARNINGS FROM A 100 BPS RISE IN SHORT-TERM RATES (as of March 31, 2015) Key Assumptions • Based on static balances on March 31, 2015 and an instantaneous change in short-term rates • Ultimately, the amount earned by clients and kept by the firm will be influenced by market / competitive pricing, rates available on substitute products, the firm’s philosophy / strategy, etc. • The firm is expected to keep 40 bps of the first 100 bp increase and pass the remaining 60 bps to clients; all incremental rate increases over 100 bps are expected to be passed to clients on their cash balances • Every 10 bps of incremental firm retention would result in an additional $30-35 million annual benefit • After the first 100 bp rate increase, the firm is expected to earn an incremental ~$20 million with each subsequent 100 bps increase A 100 bps rise in short-term rates is expected to result in approximately $130 million of incremental annual pre-tax earnings.

FINANCIAL TARGETS 93 FIRM TARGETS: PRE-TAX MARGIN*, COMPENSATION RATIO, AND RETURN ON EQUITY Metric Target** Commentary Pre-Tax Margin* >15% • Assumes similar revenue level and mix as FYTD 2015 • Targets by segment: PCG (10%), Capital Markets (15%), Asset Management (30%+) • A 100 bps increase in short-term rates would increase target by ~200 bps Compensation Ratio* <68% • Assumes similar business mix as FYTD 2015 • A 100 bps increase in short-term rates would decrease target by ~150-200 bps Return on Equity 12% • Assumes similar revenue levels, business mix, and capital levels as FYTD 2015 • A 100 bps increase in short-term rates would increase target by ~200 bps *On net revenues. ** In current market and interest rate environment. Achieving targets could be impacted by various factors; please refer to Forward Looking Statement disclosure at the beginning of this presentation. The firm has not yet changed the financial targets presented last year, even though these targets were already achieved in FY 2014.

FINANCIAL SUMMARY WELL CAPITALIZED (LOW LEVERAGE) AMPLE LIQUIDITY RELATIVELY LOW VOLATILITY OF EARNINGS TRACK RECORD OF PROFITABLE GROWTH KEY TAKEAWAYS 94

Appendix 95
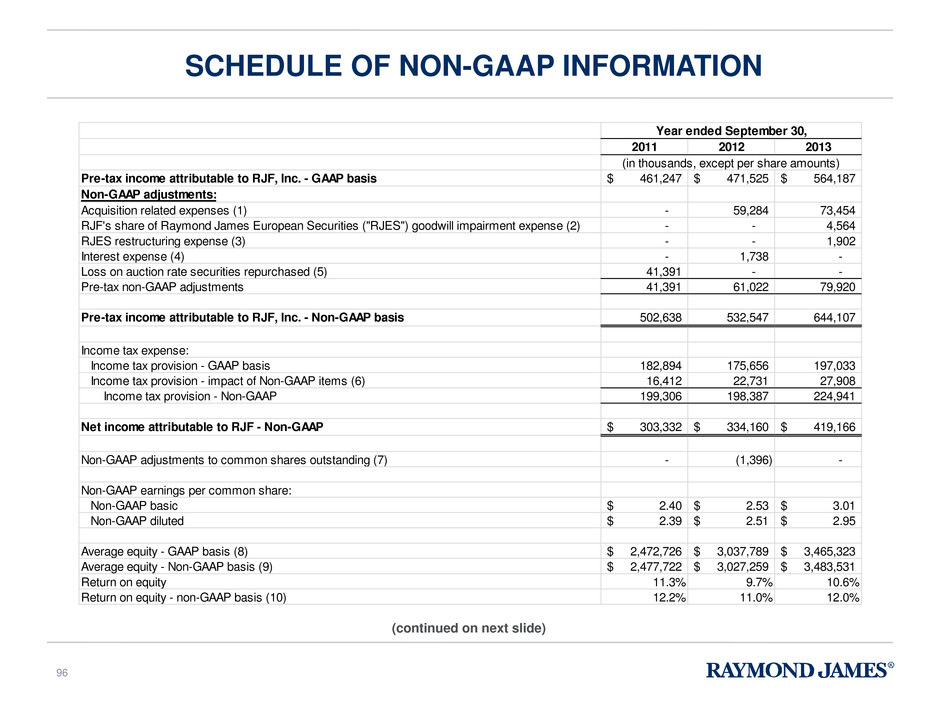
SCHEDULE OF NON-GAAP INFORMATION (continued on next slide) 2011 2012 2013 Pre-tax income attributable to RJF, Inc. - GAAP basis 461,247$ 471,525$ 564,187$ Non-GAAP adjustments: Acquisition related expenses (1) - 59,284 73,454 RJF's share of Raymond James European Securities ("RJES") goodwill impairment expense (2) - - 4,564 RJES restructuring expense (3) - - 1,902 Interest expense (4) - 1,738 - Loss on auction rate securities repurchased (5) 41,391 - - Pre-tax non-GAAP adjustments 41,391 61,022 79,920 Pre-tax income attributable to RJF, Inc. - Non-GAAP basis 502,638 532,547 644,107 Income tax expense: Income tax provision - GAAP basis 182,894 175,656 197,033 Income tax provision - impact of Non-GAAP items (6) 16,412 22,731 27,908 Income tax provision - Non-GAAP 199,306 198,387 224,941 Net income attributable to RJF - Non-GAAP 303,332$ 334,160$ 419,166$ Non-GAAP adjustments to common shares outstanding (7) - (1,396) - Non-GAAP earnings per common share: Non-GAAP basic 2.40$ 2.53$ 3.01$ Non-GAAP diluted 2.39$ 2.51$ 2.95$ Average equity - GAAP basis (8) 2,472,726$ 3,037,789$ 3,465,323$ Average equity - Non-GAAP basis (9) 2,477,722$ 3,027,259$ 3,483,531$ Return on equity 11.3% 9.7% 10.6% Return on equity - non-GAAP basis (10) 12.2% 11.0% 12.0% Year ended September 30, (in thousands, except per share amounts) 96
Footnote Explanations: 1. The non-GAAP adjustment adds back to pre-tax income one-time acquisition and integration expenses associated with acquisitions that were incurred during each respective period. 2. The non-GAAP adjustment adds back to pre-tax income RJF’s share of the total goodwill impairment expense associated with our RJES reporting unit. 3. The non-GAAP adjustment adds back to pre-tax income restructuring expenses associated with our RJES operations. 4. The non-GAAP adjustment adds back to pre-tax income the incremental interest expense incurred during the March 31, 2012 quarter on debt financings that occurred in March 2012, prior to and in anticipation of, the closing of the Morgan Keegan acquisition. 5. The non-GAAP adjustment adds back to pre-tax income the loss associated with the resolution of the auction rate securities matter. 6. The income tax effect of all the pre-tax non-GAAP adjustments, utilizing the effective tax rate applicable to the respective year. 7. The non-GAAP adjustment to the weighted average common shares outstanding in the basic and diluted non-GAAP earnings per share computation reduces the actual shares outstanding for the effect of the 11,075,000 common shares issued by RJF in February 2012 as a component of the financing of the Morgan Keegan acquisition. 8. Computed by adding the total equity attributable to RJF, Inc. as of each quarter-end during the year-to-date period, plus the beginning of the year total, divided by five. 9. The calculation of non-GAAP average equity includes the impact on equity (the after-tax effect) of the pre-tax non-GAAP adjustments described in the table above, as applicable for each respective period. 10. Computed by utilizing the net income attributable to RJF, Inc.-non-GAAP basis and the average equity-non-GAAP basis, for each respective period. See footnotes 8 and 9 above for the calculation of average equity-non-GAAP basis. (continued from prior slide) SCHEDULE OF NON-GAAP INFORMATION 97

EXECUTIVE COMMITTEE BIOS 98

EXECUTIVE COMMITTEE BIOS 99 Paul Reilly Chief Executive Officer Raymond James Financial Presenting Paul Reilly became chief executive officer of Raymond James Financial in May 2010, after joining the firm’s management team as president and CEO-designate in May 2009. He has served on the firm’s board of directors since 2005. From July 2007 to April 2009, he was executive chairman of Korn/Ferry International, a global provider of talent management solutions with more than 90 offices in 39 countries throughout North America, Latin America, Europe, the Middle East, Africa and Asia Pacific. Mr. Reilly began his tenure with the company as chairman and CEO in 2001. Prior to Korn/Ferry, he was CEO at KPMG International, a firm of more than 100,000 employees with annual revenues of $12 billion. Based in Amsterdam, he was responsible for the overall strategy and implementation of the firm's products, services and infrastructure on a global basis. Before being named CEO at KPMG, he ran the firm's financial services business and earlier had held senior management positions in its real estate consulting group. Mr. Reilly holds his Bachelor of Science degree and MBA from the University of Notre Dame and earned the Certified Public Accountant designation. He serves on the Mendoza Graduate Alumni Board and the school’s Business Advisory Council, and was the recipient of the Distinguished Alumnus Award in 2004-2005. He is a current member of the National Leadership Roundtable on Church Management and a past member of the board for Our Lady of Divine Providence House of Prayer in Clearwater, Florida, where he now serves as a trustee for the foundation. A native of St. Petersburg, Florida, Mr. Reilly is also active with the American Heart Association as the 2014 Tampa Bay Heart Walk chair, and is the executive compensation committee chair for United Way Suncoast.

100 Prior to being appointed to his current position, Elwyn served for five years as divisional director, senior vice president of the Atlantic Division of RJ&A. In that role, he devoted his energies to attracting new advisors to the firm and supporting advisors’ growth plans and adoption of best practices. In addition to his role as president of RJ&A, Elwyn was also recently elected to the Board of Raymond James Trust Company. Elwyn began his career at Raymond James in 1993 as a financial advisor trainee out of college. After building a successful practice, he became an assistant branch manager in Atlanta and subsequently a branch manager in Chattanooga. Elwyn earned a Bachelor of Arts in Political Science from Emory University in 1993 and remains committed to his alma mater where he serves on the Emory College Alumni Board. Over the years, Elwyn has also contributed to Emory through his service with the Emory Board of Governors, the Alumni Admissions Network and as a Mentor in the Emory Career Network. Elwyn is an alumnus of the Securities Industry Institute, an educational partnership between Wharton and SIFMA. He has continued his executive education by also completing the “Strategic Thinking and Management for Competitive Advantage” program at the Aresty Institute of Executive Education at Wharton. Locally, Elwyn is active in the University of South Florida Corporate Mentor Program and is a board member for the St. Petersburg Opera. He was born in Boston and grew up in Atlanta. He is married and has two children. Presenting Tash Elwyn President Raymond James and Associates Private Client Group EXECUTIVE COMMITTEE BIOS

101 Jeffrey Trocin President Raymond James & Associates Global Equities and Investment Banking Mr. Trocin joined Raymond James & Associates in 1986 and has directed the firm’s Equity Capital Markets group, which includes the firm’s investment banking, research, institutional sales, trading and syndicate operations, since 1996. Mr. Trocin also serves as a member of the firm’s Capital Markets Commitment Committee. Prior to joining Raymond James, Mr. Trocin was a member of the Corporate Finance Department of Merrill Lynch Capital Markets. Before that, he was a marketing manager for Burroughs Corporation in Ft. Lauderdale, Fla. Mr. Trocin graduated with honors with a bachelor’s degree in economics from the University of Miami. He continued his education at Harvard Business School where he earned his MBA in 1986. Presenting EXECUTIVE COMMITTEE BIOS
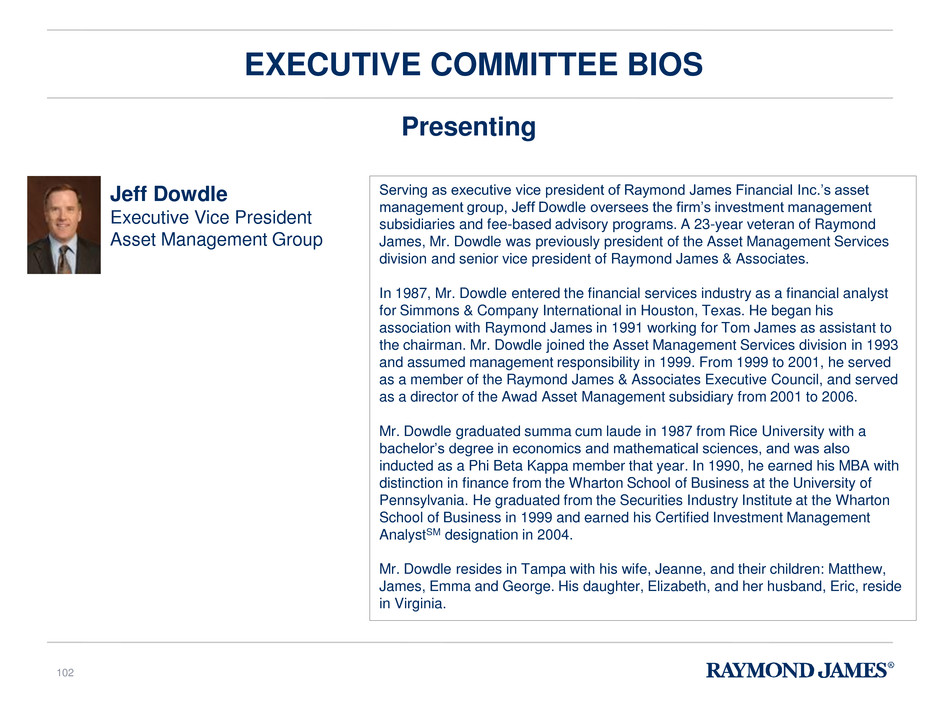
102 Presenting Serving as executive vice president of Raymond James Financial Inc.’s asset management group, Jeff Dowdle oversees the firm’s investment management subsidiaries and fee-based advisory programs. A 23-year veteran of Raymond James, Mr. Dowdle was previously president of the Asset Management Services division and senior vice president of Raymond James & Associates. In 1987, Mr. Dowdle entered the financial services industry as a financial analyst for Simmons & Company International in Houston, Texas. He began his association with Raymond James in 1991 working for Tom James as assistant to the chairman. Mr. Dowdle joined the Asset Management Services division in 1993 and assumed management responsibility in 1999. From 1999 to 2001, he served as a member of the Raymond James & Associates Executive Council, and served as a director of the Awad Asset Management subsidiary from 2001 to 2006. Mr. Dowdle graduated summa cum laude in 1987 from Rice University with a bachelor’s degree in economics and mathematical sciences, and was also inducted as a Phi Beta Kappa member that year. In 1990, he earned his MBA with distinction in finance from the Wharton School of Business at the University of Pennsylvania. He graduated from the Securities Industry Institute at the Wharton School of Business in 1999 and earned his Certified Investment Management AnalystSM designation in 2004. Mr. Dowdle resides in Tampa with his wife, Jeanne, and their children: Matthew, James, Emma and George. His daughter, Elizabeth, and her husband, Eric, reside in Virginia. Jeff Dowdle Executive Vice President Asset Management Group EXECUTIVE COMMITTEE BIOS

103 Presenting Steven Raney is a Tampa native and has worked in the area’s banking community since 1988. He is currently the president and CEO of Raymond James Bank, a wholly-owned subsidiary of Raymond James Financial. RJ Bank’s core business includes a residential lending platform that supports the mortgage loan needs of the firm’s clients, as well as a significant corporate and real estate lending business. Mr. Raney also serves on the board of Raymond James Trust Company and is one of the firm’s representatives on the Financial Services Roundtable, an industry leadership group of the 100 largest financial services firms in the country. He currently serves on the Executive Council of Raymond James & Associates and is a member of the Government Relations Committee of the Florida Banker’s Association. Prior to joining RJ Bank in 2006, he worked for Bank of America for 17 years serving as Tampa president and commercial banking executive for Central Florida. He also spent a year working at LCM Group, a Tampa-based investment and private equity firm. Mr. Raney graduated from Chamberlain High School in 1983. He earned a bachelor’s degree in Finance from the University of Florida and an MBA from the Hough Graduate School of Business at the University of Florida. Mr. Raney serves on the board of trustees of the Tampa Bay History Center and he is also an elder at Palma Ceia Presbyterian Church. Steve Raney President and CEO Raymond James Bank EXECUTIVE COMMITTEE BIOS

104 Presenting In addition to his positions as executive vice president of finance and chief financial officer of Raymond James Financial, Inc., Jeff Julien serves as Chairman of the Board of both Raymond James Trust Company and Raymond James Bank. He also serves in a director capacity for many of the firm’s other subsidiaries. His responsibilities include managing all aspects of financial reporting, corporate taxation, certain employee benefit and insurance programs, cash management, transaction cost analysis, corporate acquisition analysis and new business development. He also oversees operations of Raymond James Bank and Raymond James Trust Company. Mr. Julien joined Raymond James in 1983 after working as CPA for Price Waterhouse (now Pricewaterhouse Coopers) in Tampa, Florida. He became chief financial officer in 1987. Mr. Julien earned his bachelor’s degree in management science with a concentration in accounting from Duke University in 1978. Jeffrey P. Julien Chief Finance Officer Raymond James Financial EXECUTIVE COMMITTEE BIOS

105 Not Presenting Bella Allaire Executive Vice President Technology and Operations As executive vice president of technology and operations for Raymond James, Bella Loykhter Allaire oversees the firm’s technology and operations functions, including client service and the technology platforms for our advisors and capital markets professionals. Previously, she was managing director and chief information officer of UBS Wealth Management Americas, where she developed and executed the strategic road map to transform legacy Paine Webber technology into a differentiating wealth management platform. She began her career at Prudential Securities, where she worked for 26 years in a variety of capacities in its technology area before being promoted to executive vice president and chief information officer in 2000. During her tenure as CIO, managing a team of more than 2,000 professionals with a budget of more than $500 million, she was recognized for her leadership in establishing the firm’s technology platform as a model for best practices in supporting financial advisors and their clients. After Wachovia’s acquisition of Prudential Securities in 2003, Ms. Allaire became a technology strategy consultant to Morgan Stanley and served as CEO of Wealthigen, initiating a securities line of business for Exigen Group, a software development firm. Her professional affiliations include Fortune magazine’s 500 Most Powerful Women in Business, Wall Street Technologists Board of Directors and the NASDAQ Technology Group. Born and educated in Ukraine, earning her bachelor’s degree from Lviv University, she immigrated to the United States in 1977. EXECUTIVE COMMITTEE BIOS

Paul Allison Chairman and CEO Raymond James Ltd. 106 Not Presenting As chairman and chief executive officer of Raymond James Ltd., Paul Allison oversees business-building efforts and strategic leadership of the firm’s Canadian operations, including Equity Capital Markets, Private Client and Corporate Services. Prior to joining the firm in August 2008, he worked as executive vice president and vice-chairman at Merrill Lynch Canada, as well as co-head of the firm’s Investment Banking business. Before joining Merrill, he was head of Equity Capital Markets at BMO Nesbitt Burns, one of Canada’s leading bank-owned investment dealers. Mr. Allison brings more than 26 years of senior capital markets and investment banking experience to this role, including underwriting and arranging public and private debt and equity capital raising, as well as developing and managing retail products. An active volunteer in various charitable and industry organizations, Mr. Allison is a director of the Investment Industry Association of Canada; member of the Dean’s Business Advisory Council, DeGroote School of Business, McMaster University; and he is also Board Vice Chair and Chair of the Governance/Nominating Committee at Humber River Regional Hospital. Mr. Allison holds a Master of Business Administration degree (MBA) and a Bachelor’s degree in Mechanical Engineering and Management from McMaster University. He is a member of the Association of Professional Engineers. EXECUTIVE COMMITTEE BIOS
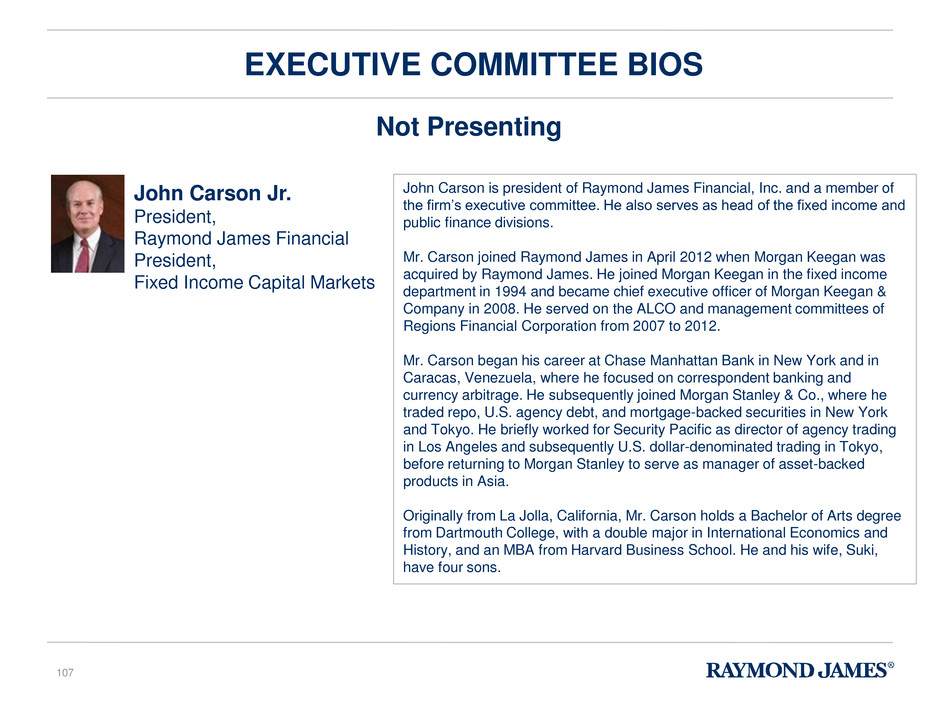
107 Not Presenting John Carson is president of Raymond James Financial, Inc. and a member of the firm’s executive committee. He also serves as head of the fixed income and public finance divisions. Mr. Carson joined Raymond James in April 2012 when Morgan Keegan was acquired by Raymond James. He joined Morgan Keegan in the fixed income department in 1994 and became chief executive officer of Morgan Keegan & Company in 2008. He served on the ALCO and management committees of Regions Financial Corporation from 2007 to 2012. Mr. Carson began his career at Chase Manhattan Bank in New York and in Caracas, Venezuela, where he focused on correspondent banking and currency arbitrage. He subsequently joined Morgan Stanley & Co., where he traded repo, U.S. agency debt, and mortgage-backed securities in New York and Tokyo. He briefly worked for Security Pacific as director of agency trading in Los Angeles and subsequently U.S. dollar-denominated trading in Tokyo, before returning to Morgan Stanley to serve as manager of asset-backed products in Asia. Originally from La Jolla, California, Mr. Carson holds a Bachelor of Arts degree from Dartmouth College, with a double major in International Economics and History, and an MBA from Harvard Business School. He and his wife, Suki, have four sons. John Carson Jr. President, Raymond James Financial President, Fixed Income Capital Markets EXECUTIVE COMMITTEE BIOS

108 Not Presenting As president of Raymond James Financial Services, Mr. Curtis directs Raymond James’ independent contractor business that includes approximately 3,200 retail financial advisors. He was promoted to his current position following six years as senior vice president of Raymond James & Associates Private Client Group (PCG) where he was responsible for prioritizing and directing numerous initiatives focused on PCG revenue growth, margin enhancement, service improvement, and risk mitigation. Scott joined Raymond James in February 2003 as president of Raymond James Insurance Group. Mr. Curtis spent the prior thirteen years of his career with GE Financial Assurance in a variety of senior leadership roles -- including as national sales director for mutual funds and annuities and as president of the firm’s FINRA-registered broker/dealer. Mr. Curtis earned a MBA degree from the Ross School of Business at the University of Michigan and received a BA in economics and English from Denison University. Scott is a Trustee of SIFMA’s Securities Industry Institute program at the Wharton School and serves on the Board for the Chi Chi Rodriguez Academy Youth Foundation. Scott Curtis President Raymond James Financial Services EXECUTIVE COMMITTEE BIOS

Tom James Executive Chairman Raymond James Financial 109 Not Presenting Thomas A. James is executive chairman of Raymond James Financial, Inc. (NYSE-RJF), and chairman of its subsidiary, Raymond James & Associates, Inc., member New York Stock Exchange/SIPC. Until May of 2010, he served as chief executive officer of Raymond James Financial, a title he had held since 1970. Mr. James graduated magna cum laude from Harvard College in 1964 and from Harvard Business School in 1966, where he was a Baker Scholar and graduated with high distinction. He also holds a Juris Doctor from Stetson College of Law, St. Petersburg, Florida, and obtained his Certified Financial Planner designation in 1978. Mr. James is a member of the board of Cora Health Services and has previously served on the boards of numerous public companies. In addition, Mr. James is the past chairman of The Financial Services Roundtable, the Securities Industry Association (now SIFMA), the Southern District of the SIA, the District 7 Business Conduct Committee of the National Association of Securities Dealers, and a past president of the Florida Security Dealers Association, as well as Raymond James Bank, N.A. and Heritage Family of Funds (subsidiaries of Raymond James Financial, Inc.). Locally, Mr. James is the immediate past chairman of the Florida Council of 100 and president of the board of trustees of The Salvador Dali Museum. He currently serves on the Board of Dean’s Advisors at Harvard Business School, the board of the International Tennis Hall of Fame and is the chairman of the board of the Chi Chi Rodriguez Youth Foundation. He is also a past chairman of the Florida Council of Economic Education. In addition, Mr. James has been an active participant in the United Way of Pinellas County as a member of the board of directors and as founding chairman of the organization’s Alexis de Tocqueville Society and the 1995 Pinellas County campaign. He is a past member of the board of Junior Achievement of Pinellas County and has served as Commodore of the Treasure Island Tennis & Yacht Club. Mr. James has received numerous awards and honors for his industry leadership, support of the arts, philanthropic activities and community service. His interests include tennis, golf, guitar, and art collecting, particularly Southwestern United States. EXECUTIVE COMMITTEE BIOS

Dennis Zank Chief Operating Officer Raymond James Financial Chief Executive Officer Raymond James & Associates 110 Not Presenting Dennis Zank serves as chief operating officer of Raymond James Financial, Inc. as well as Chief Executive Officer of Raymond James & Associates (RJA). In his current role, he oversees our domestic Private Client Group businesses as well as many of the firm’s corporate administrative and support departments. Dennis was appointed president of RJA in 2002 and prior to that role served as executive vice president of operations and administration. In that role, he directed securities and customer operations, client services, information technology, office services, human resources, financial and regulatory reporting, and international operations. Dennis joined Raymond James’ Accounting Department in 1978, becoming the controller in 1982. He was appointed treasurer in 1985 and was promoted to senior vice president in 1986 and executive vice president in 1992. From 2000 to 2006, Dennis served on the board of directors of the Options Clearing Corporation. He also served a three-year term on the board of directors of the National Securities Clearing Corporation from 1994 to 1997. A 1976 graduate of the University of South Florida with a bachelor’s degree in accounting, he earned his MBA from the University of Tampa in 1982. Originally from Michigan, Dennis currently resides in St. Petersburg, Florida with his wife, Marnie. He enjoys boating, fishing, racquetball and golf. EXECUTIVE COMMITTEE BIOS


