
May 27, 2021

2021 ANALYST & INVESTOR DAY Welcome & Agenda Kristie Waugh Vice President, Head of Investor Relations and FP&A

3 Forward-looking statements Certain statements made in this presentation may constitute “forward-looking statements” under the Private Securities Litigation Reform Act of 1995. Forward-looking statements include information concerning future strategic objectives, business prospects, anticipated savings, financial results (including expenses, earnings, liquidity, cash flow and capital expenditures), industry or market conditions, demand for and pricing of our products, acquisitions and divestitures, anticipated results of litigation and regulatory developments or general economic conditions. In addition, words such as “believes,” “expects,” “anticipates,” “intends,” “plans,” “estimates,” “projects,” “forecasts,” and future or conditional verbs such as “will,” “may,” “could,” “should,” and “would,” as well as any other statement that necessarily depends on future events, are intended to identify forward-looking statements. Forward-looking statements are not guarantees, and they involve risks, uncertainties and assumptions. Although we make such statements based on assumptions that we believe to be reasonable, there can be no assurance that actual results will not differ materially from those expressed in the forward-looking statements. We caution investors not to rely unduly on any forward-looking statements and urge you to carefully consider the risks described in our filings with the Securities and Exchange Commission (the “SEC”) from time to time, including our most recent Annual Report on Form 10-K and subsequent Quarterly Reports on Form 10-Q, which are available at www.raymondjames.com and the SEC’s website at www.sec.gov. We expressly disclaim any obligation to update any forward-looking statement in the event it later turns out to be inaccurate, whether as a result of new information, future events, or otherwise.
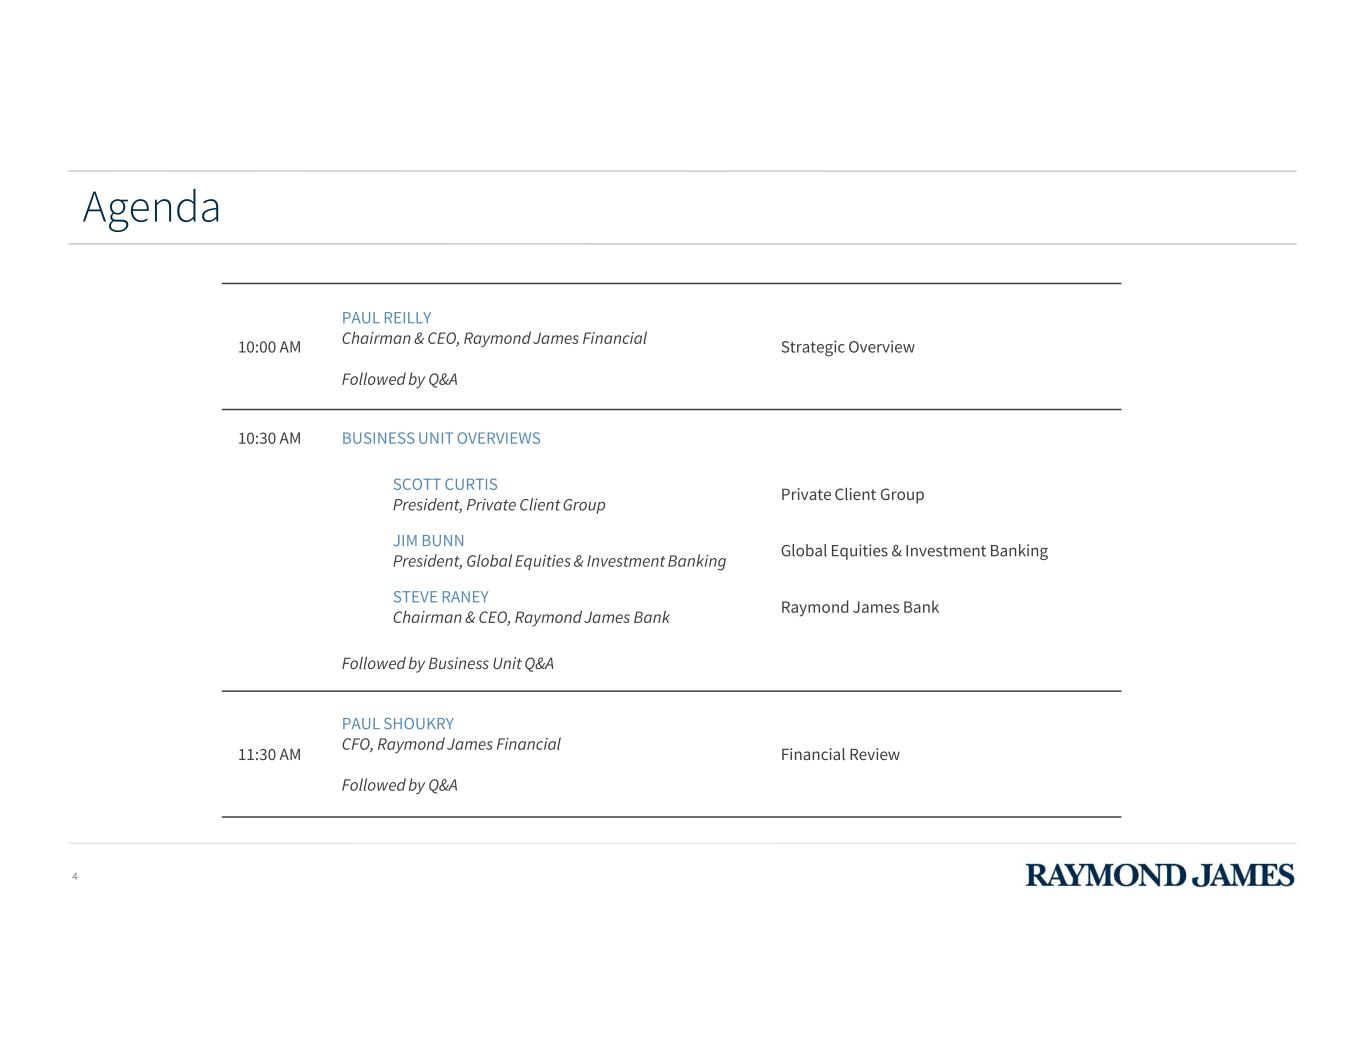
4 Agenda 10:00 AM PAUL REILLY Chairman & CEO, Raymond James Financial Followed by Q&A Strategic Overview 10:30 AM BUSINESS UNIT OVERVIEWS SCOTT CURTIS President, Private Client Group Private Client Group JIM BUNN President, Global Equities & Investment Banking Global Equities & Investment Banking STEVE RANEY Chairman & CEO, Raymond James Bank Raymond James Bank Followed by Business Unit Q&A 11:30 AM PAUL SHOUKRY CFO, Raymond James Financial Followed by Q&A Financial Review

5 Q&A sessions Throughout the event, please submit all questions in the Q&A section of your webinar dashboard
2021 ANALYST & INVESTOR DAY Strategic Overview Paul Reilly Chairman & CEO, Raymond James Financial
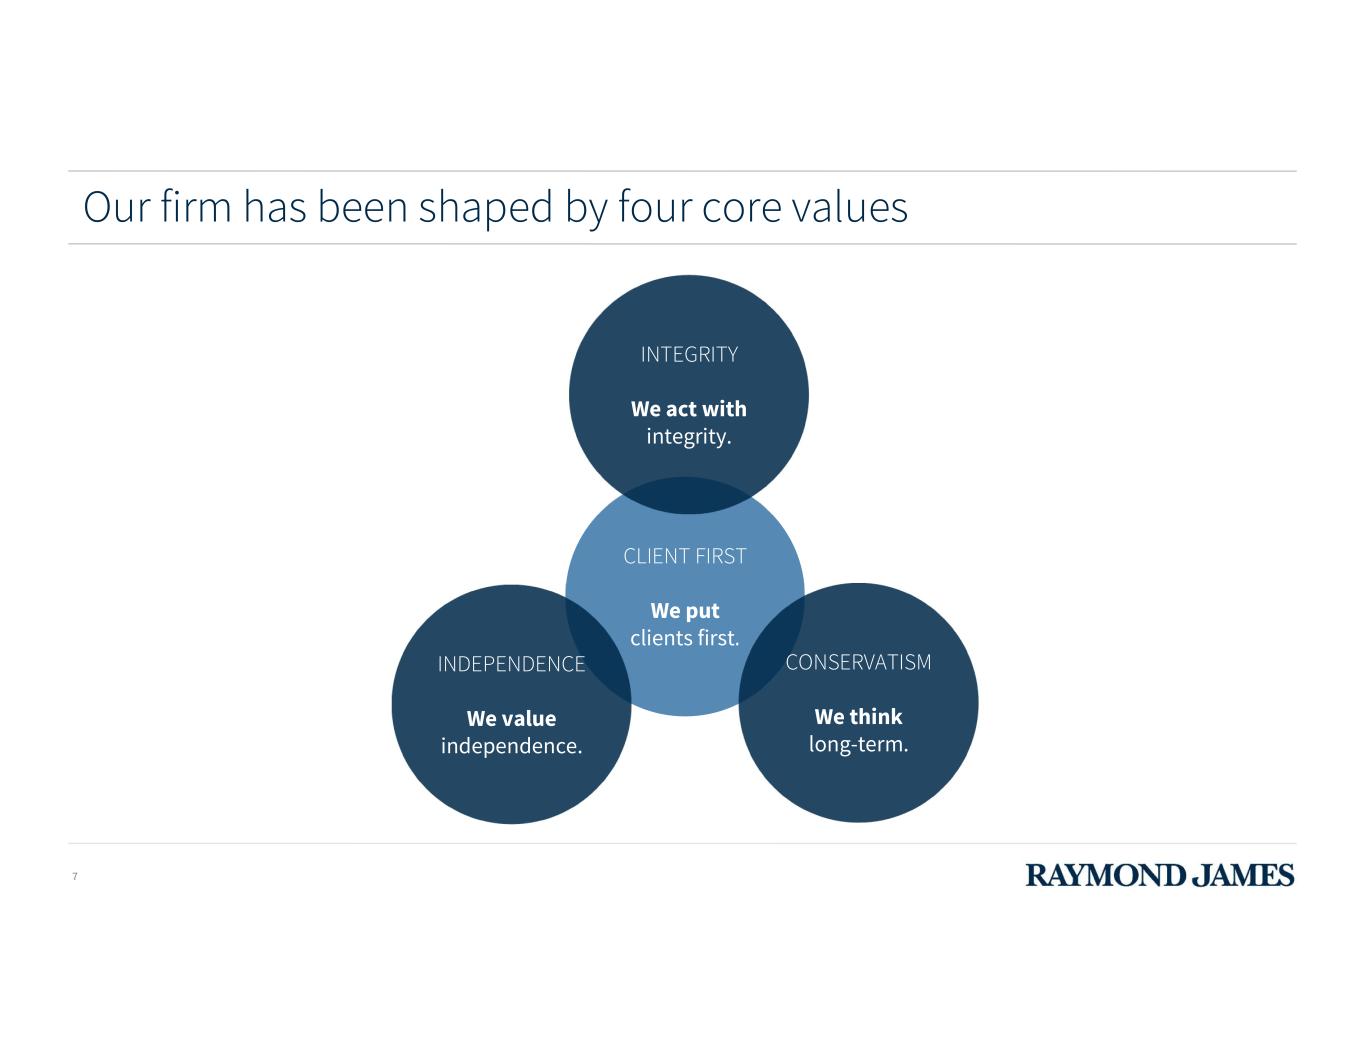
7 Our firm has been shaped by four core values CLIENT FIRST We put clients first. CONSERVATISM We think long-term. INDEPENDENCE We value independence. INTEGRITY We act with integrity.

8 Raymond James Financial Note: Pie chart above does not include intersegment eliminations or the Other segment. BY THE NUMBERS (as of Mar. 31, 2021) Client assets under administration $1.09 trillion Over 8,300 advisors in U.S., Canada, and U.K. 133 consecutive quarters of profitability More than 2x required total capital ratio Strong credit ratings with stable outlook: A- (Fitch), BBB+ (S&P), Baa1 (Moody’s) S&P 500 & Fortune 400 company Private Client Group, 67% Capital Markets, 15% Asset Management, 9% RJ Bank, 9% $8.0B NET REVENUES FY 2020

9 We set out to be the Premier Alternative to Wall Street Sc op e an d Sc al e of S er vi ce s Culture: Advisor/Client Orientation Wirehouses Custodians Regionals Boutiques RJF 2010 Independents 10+ years ago The Premier Alternative to Wall Street
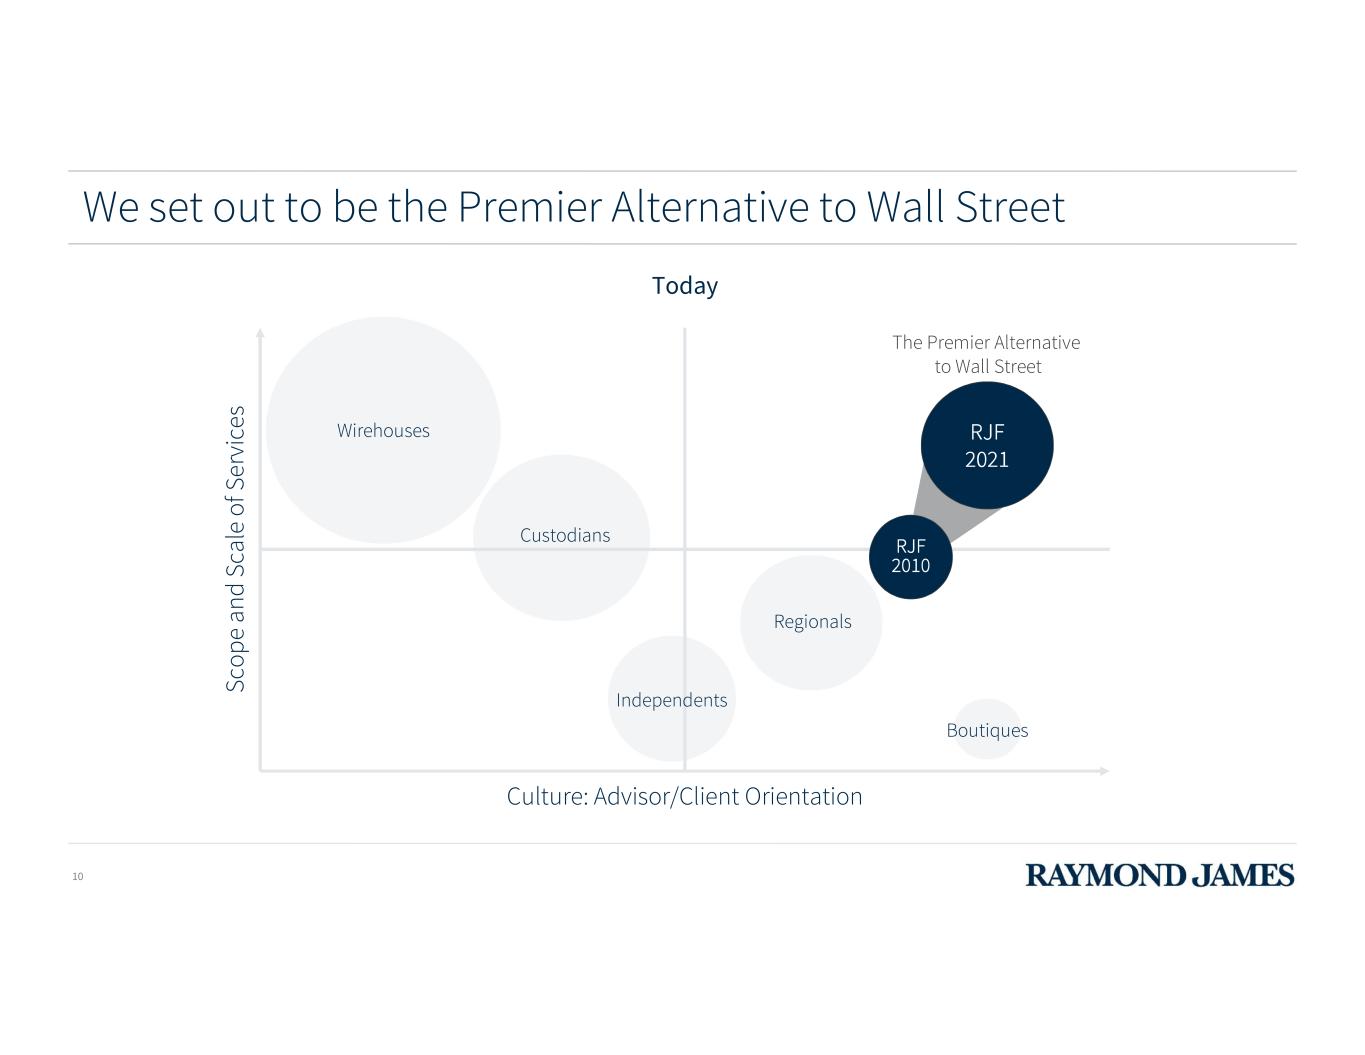
10 We set out to be the Premier Alternative to Wall Street RJF 2021 Sc op e an d Sc al e of S er vi ce s Culture: Advisor/Client Orientation Wirehouses Custodians Regionals Boutiques RJF 2010 Independents Today The Premier Alternative to Wall Street

2,917 7,990 FY 2010 FY 2020 10.6% 10-YR CAGR 11 This focus resulted in strong growth over the past 10 years Note: 10-year CAGR for period FY 2010 – FY 2020. Charts not to scale. Client Assets Under Administration ($ billions) 249 930 FY 2010 FY 2020 14.1% 10-YR CAGR Consolidated Net Revenues ($ millions) $1.83 $5.83 FY 2010 FY 2020 Earnings per Diluted Share 12.3% 10-YR CAGR
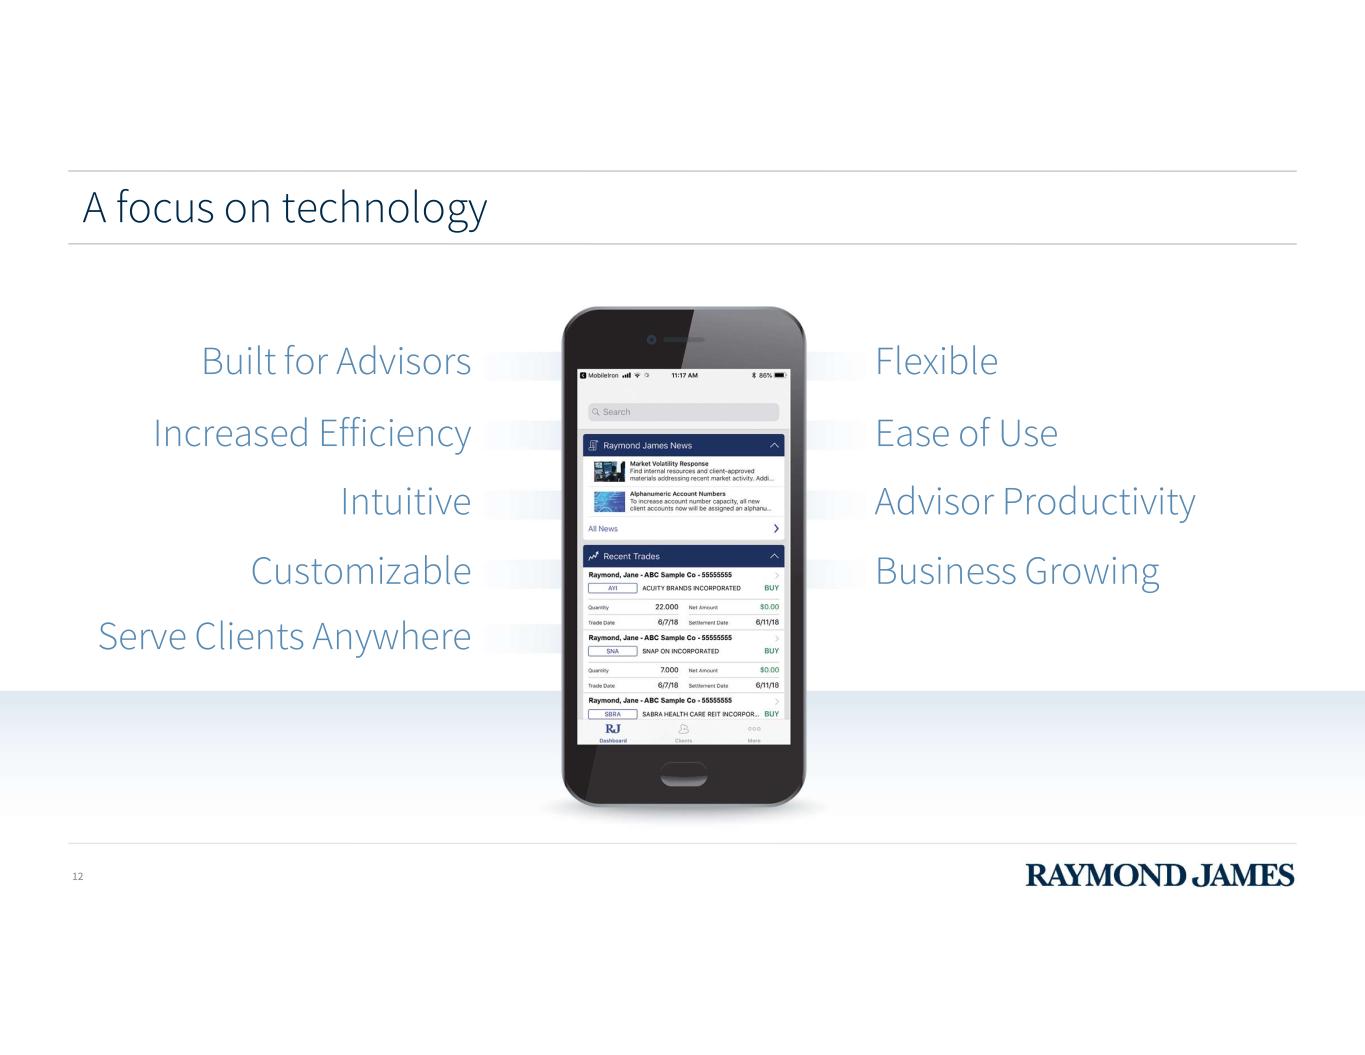
12 A focus on technology Serve Clients Anywhere Ease of UseIncreased Efficiency Business Growing Intuitive Advisor Productivity Customizable FlexibleBuilt for Advisors

13 Tools recognized by advisors and the industry I love how intuitive and customizable the technology is. It's like each system is tailored to me. Made to meet my needs. Financial Advisor – California Sometimes I forget what application I’m running! RJ Tech makes it easy to focus on the tasks at hand and not even think about the technology. Financial Advisor – Colorado My team loves it. And I sleep better at night. The portal makes it so easy to stay on top of alerts. Much more efficient and simple! Branch Manager – New Jersey RJ Tech allows me to spend less time managing my office and more time connecting with clients. Financial Advisor – Florida 2019 Portfolio Management 2018 Product Catalog 2017 Advisor Mobile 2016 Client Reporting 2015 Account Aggregation 2014 Client Center 2013 Goal Planning & Monitoring 2020 RJ Social (finalist) 2019 Portfolio Management (finalist) 2017 Advisor Mobile (finalist) 2016 Client Reporting 2015 Client Center Bank Insurance & Securities Association Awards Wealth Management Industry Awards

RAYMOND JAMES BANK 14 ASSET MANAGEMENT CAPITAL MARKETS Loans to PCG Clients (mortgages, SBL loans, structured lending) Stable source of deposits Loans to institutional clients Research opinions Referrals Economic and industry research and perspectives Referrals Corporate executive services High-quality research Significant distribution capabilities Investment options (CTA) Product due diligence and selection (AMS) Our four core businesses are diverse but complementary PRIVATE CLIENT GROUP
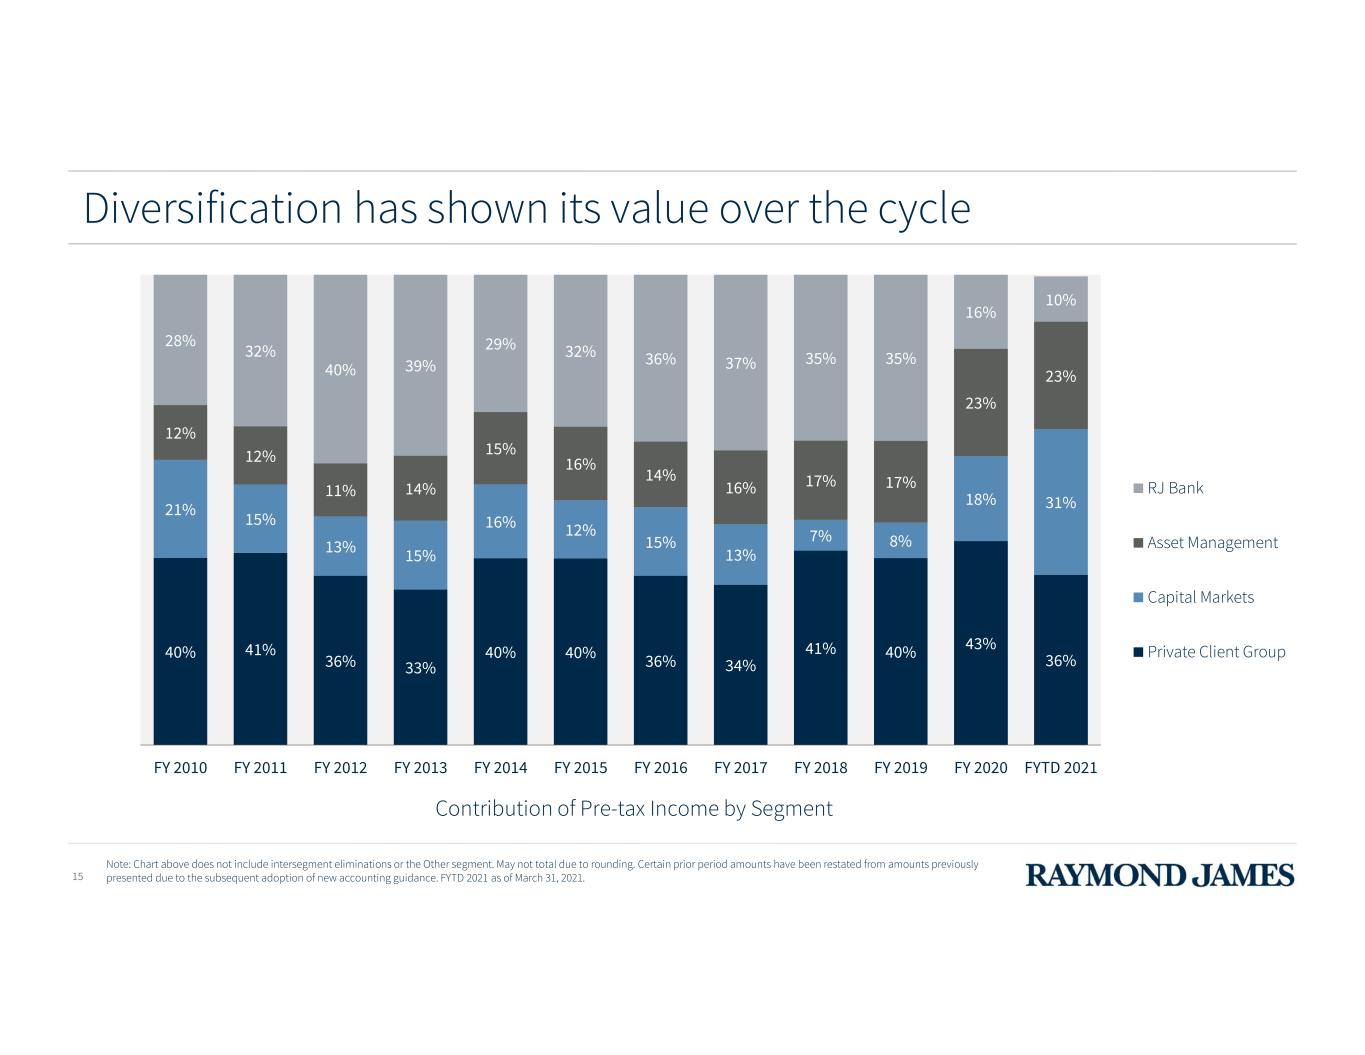
40% 41% 36% 33% 40% 40% 36% 34% 41% 40% 43% 36% 21% 15% 13% 15% 16% 12% 15% 13% 7% 8% 18% 31% 12% 12% 11% 14% 15% 16% 14% 16% 17% 17% 23% 23% 28% 32% 40% 39% 29% 32% 36% 37% 35% 35% 16% 10% FY 2010 FY 2011 FY 2012 FY 2013 FY 2014 FY 2015 FY 2016 FY 2017 FY 2018 FY 2019 FY 2020 FYTD 2021 Contribution of Pre-tax Income by Segment RJ Bank Asset Management Capital Markets Private Client Group 15 Diversification has shown its value over the cycle Note: Chart above does not include intersegment eliminations or the Other segment. May not total due to rounding. Certain prior period amounts have been restated from amounts previously presented due to the subsequent adoption of new accounting guidance. FYTD 2021 as of March 31, 2021.
16 Looking ahead
17 Growth initiatives Drive organic growth across core businesses Expand investments in technology Sharpen focus on strategic M&A 1 2 3

18 Drive organic growth across core businesses1 Private Client Group Best-in-class experience Leverage entire firm’s resources Strong retention and recruiting
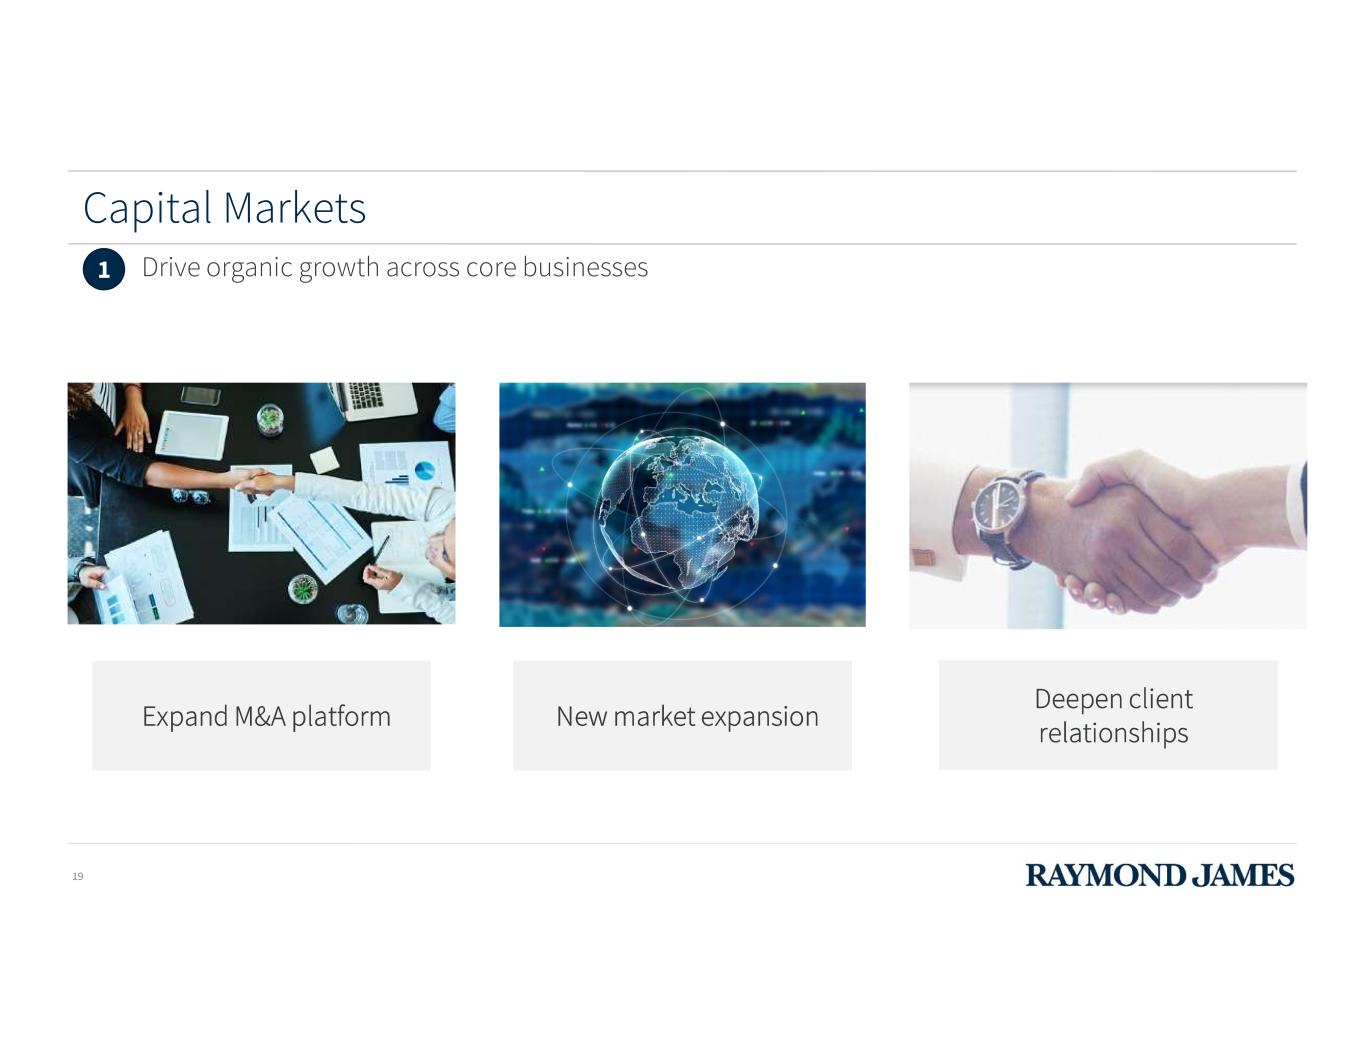
19 Drive organic growth across core businesses1 Capital Markets Expand M&A platform New market expansion Deepen client relationships

Expand Carillon Tower Advisers offering Enhance investment solutions Implement technology for efficiency 20 Drive organic growth across core businesses1 Asset Management

21 Drive organic growth across core businesses1 Raymond James Bank Grow PCG client loans Expand securities portfolio Selectively grow corporate loans Manage credit risk

22 Expand investments in technology • Artificial Intelligence • Augmented Reality • Blockchain • Data Lake • Digital Personas • Machine Learning • Real-Time Everything • Robotics • Zero Day Settlement 2
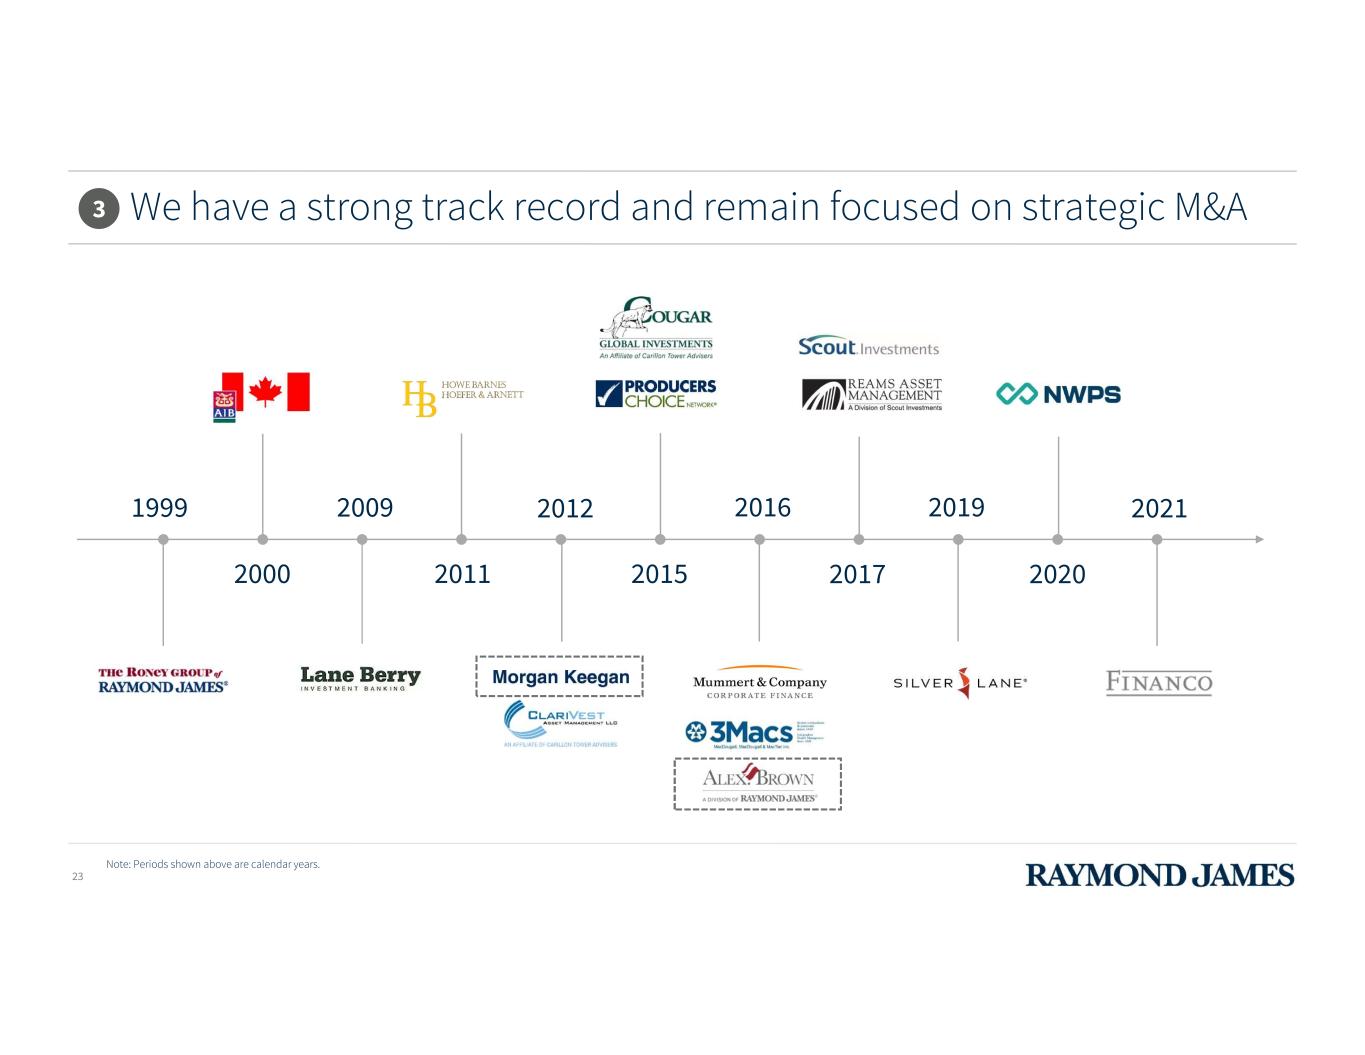
3 23 We have a strong track record and remain focused on strategic M&A 1999 2000 2009 2011 2012 2015 2016 2017 2019 2020 2021 Note: Periods shown above are calendar years.

24 Our approach to corporate responsibility People. We cultivate a people-first workplace for associates and advisors. Sustainability. We focus on making sustainable business and operational decisions. Community. We give back to the communities in which we live and work. Governance. We have a longstanding commitment to strong corporate governance.
2021 ANALYST & INVESTOR DAY Q & A Paul Reilly Chairman & CEO, Raymond James Financial

2021 ANALYST & INVESTOR DAY Private Client Group Scott Curtis President, Private Client Group

Private Client Group 27 OVERVIEW #6 largest wealth manager* in U.S. Client assets under administration approximately $1.03 trillion Assets in fee-based accounts $568 billion More than 80% asset-based revenues** 8,327 advisors in U.S., Canada, and U.K. Flexible affiliation options with AdvisorChoice® platform Full-service support resources and award-winning technology BY THE NUMBERS client assets under administration $1.03T regrettable attrition*** < 1% Note: As of March 31, 2021 unless otherwise noted. *Based on client assets. The definitions for client assets may be inconsistent across companies. Rankings include independent B/Ds but exclude RIA custodians. Sourced from company reports with latest available data. **Asset-based revenues include asset management and related administrative fees, asset-based brokerage revenues, interest income, RJBDP fees, and mutual fund and annuity service fees. ***Regrettable attrition is defined as any Financial Advisor with a T12 production greater than $350k, who voluntarily leaves the firm to join a competitor. advisors 8,327
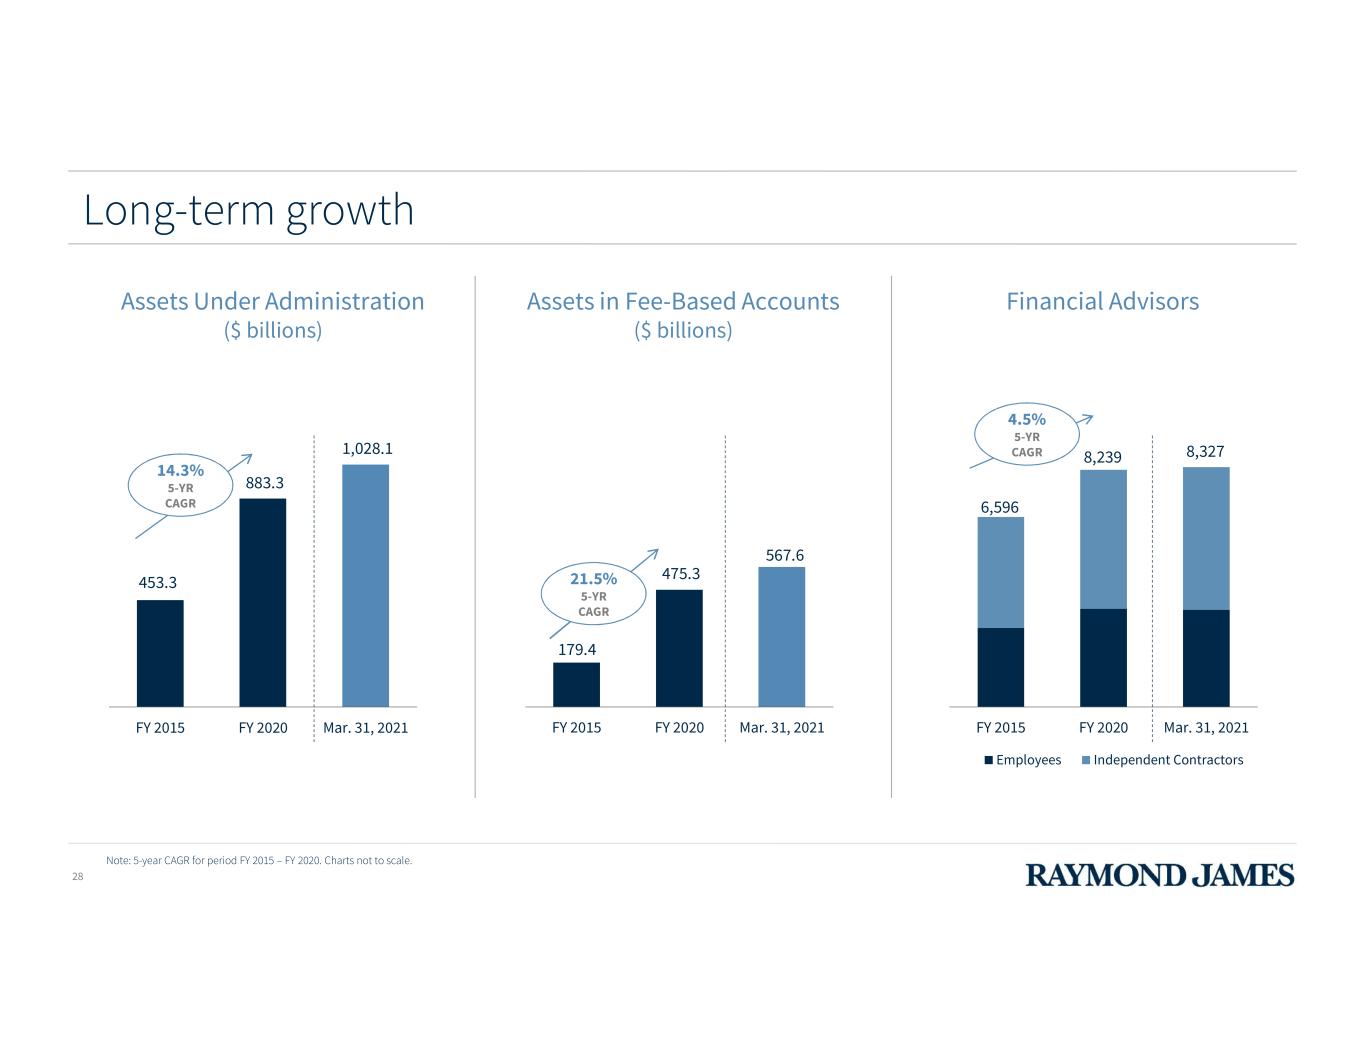
Assets Under Administration ($ billions) Note: 5-year CAGR for period FY 2015 – FY 2020. Charts not to scale. 453.3 883.3 1,028.1 FY 2015 FY 2020 Mar. 31, 2021 179.4 475.3 567.6 FY 2015 FY 2020 Mar. 31, 2021 14.3% 5-YR CAGR 21.5% 5-YR CAGR FY 2015 FY 2020 Mar. 31, 2021 Employees Independent Contractors 4.5% 5-YR CAGR 8,327 6,596 8,239 Long-term growth Assets in Fee-Based Accounts ($ billions) Financial Advisors 28

111.7% 65.9% Raymond James Peer Group Median 273.9% 146.3% Raymond James Peer Group Median 1-Year Change (March 31, 2020 - March 31, 2021) Total PCG Client Assets Under Administration 48.0% 37.3% Raymond James Peer Group Median 3-Year Change (March 31, 2018 - March 31, 2021) 5-Year Change (March 31, 2016 - March 31, 2021) 10-Year Change (March 31, 2011 - March 31, 2021) Note: Charts not to scale. Based on publicly available information and RJF estimates and analysis. The definitions for client assets may be inconsistent across companies. Peer Group Median includes: Ameriprise, Bank of America/Merrill Lynch, LPL Financial, Morgan Stanley, Stifel Financial and Wells Fargo. Wells Fargo not included in Peer Group Median for the 10-year time period. Long-term growth 29 40.1% 36.5% Raymond James Peer Group Median

342 539 323 332 FY 2015 FY 2020 FYTD 2020 FYTD 2021 3,508 5,552 2,909 3,114 FY 2015 FY 2020 FYTD 2020 FYTD 2021 9.6% 5-YR CAGR 9.5% 5-YR CAGR Note: 5-year CAGR for period FY 2015 – FY 2020. FYTD 2020 as of March 31, 2020. FYTD 2021 as of March 31, 2021. Charts not to scale. Long-term growth Net Revenues ($ millions) Pre-Tax Income ($ millions) 30 7.0% Y/Y CHANGE 2.8% Y/Y CHANGE
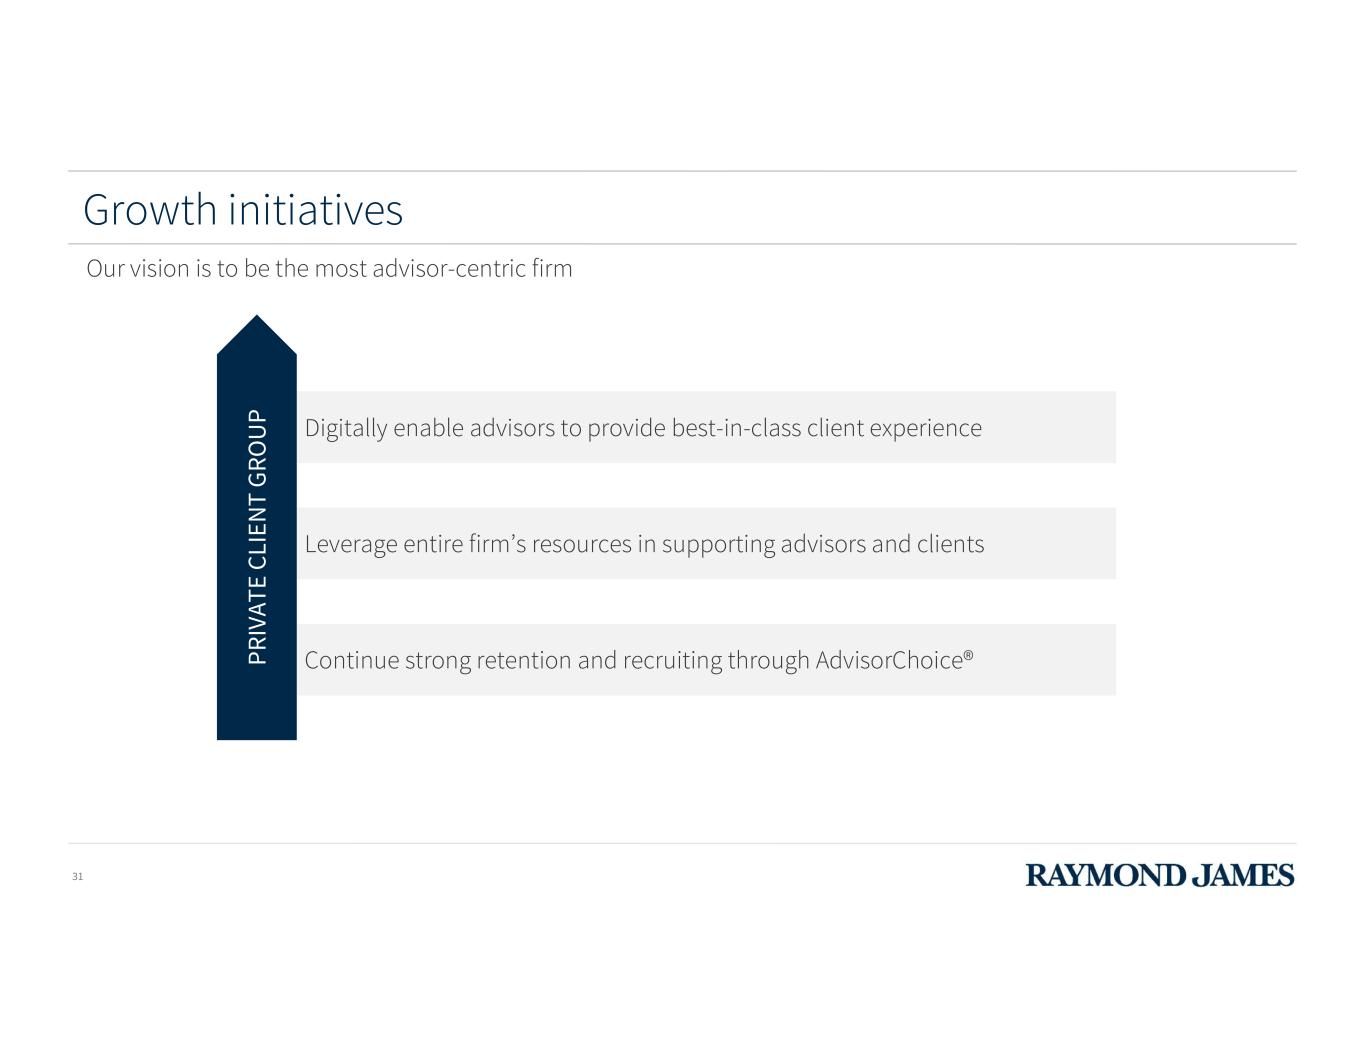
31 Growth initiatives Our vision is to be the most advisor-centric firm Digitally enable advisors to provide best-in-class client experience Leverage entire firm’s resources in supporting advisors and clients Continue strong retention and recruiting through AdvisorChoice®P R IV AT E C LI EN T G R O U P

Core principles guiding digital innovation 32 Operational Efficiency & Risk Management Business Growth & Client Engagement Collaborate & Track Progress Enable Digital Advice Personalize & Gamify Tools Provide Holistic Wealth Platform Mobile Office Device Agnostic Design Surface Relevant Insights Automate Processes D ig it al E na bl em en t
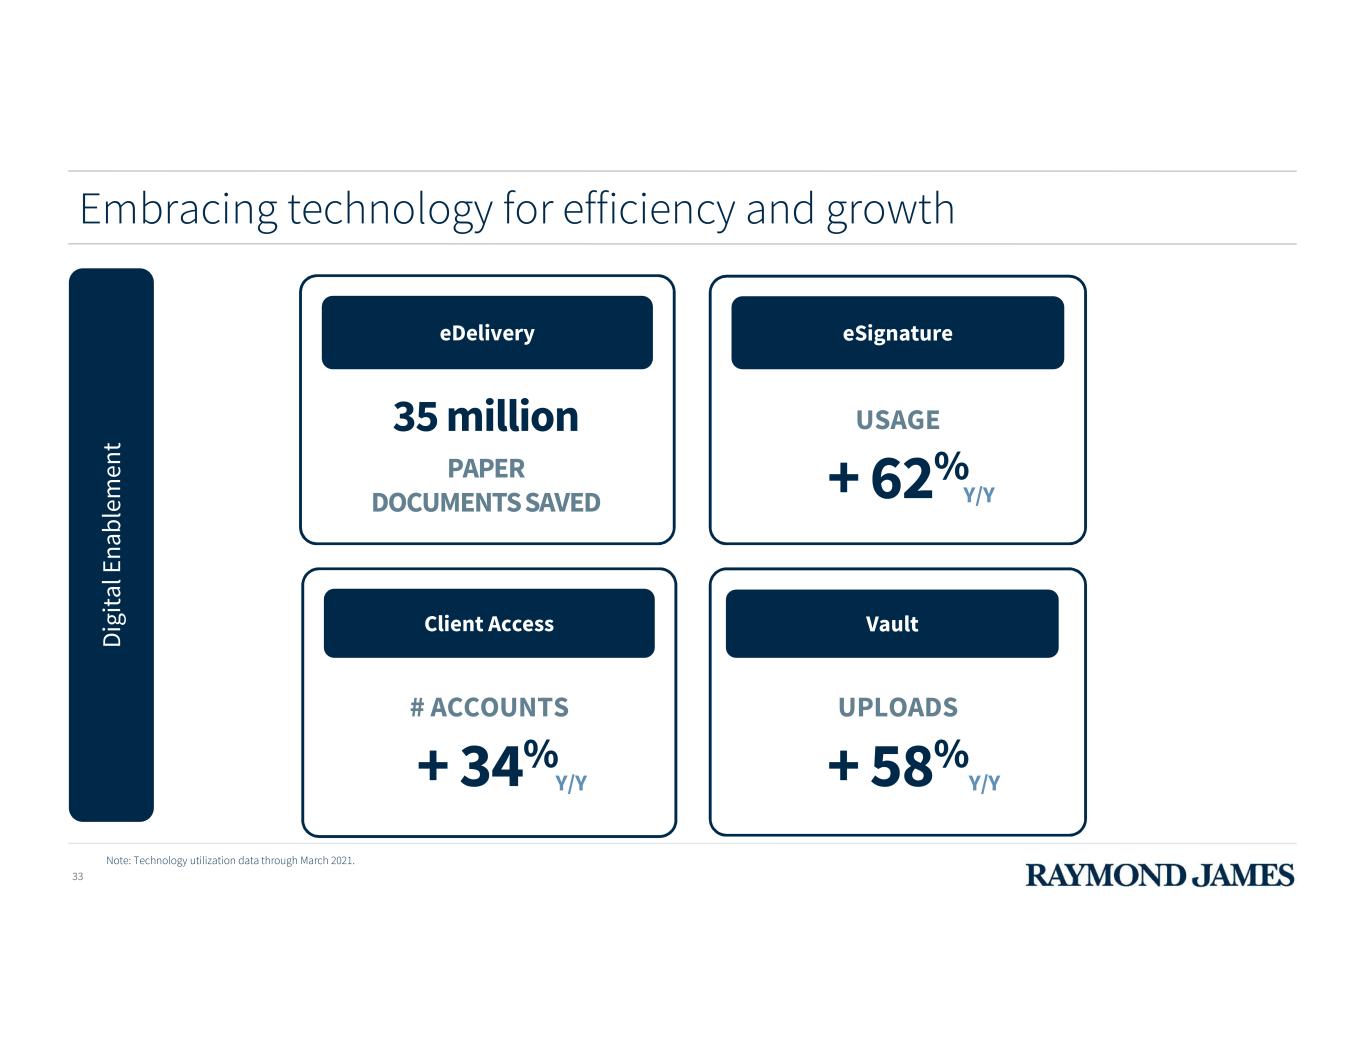
Embracing technology for efficiency and growth 33 D ig it al E na bl em en t + 34% Client Access # ACCOUNTS eDelivery + 62% eSignature USAGE Vault 35 million PAPER DOCUMENTS SAVED UPLOADS + 58%Y/YY/Y Y/Y Note: Technology utilization data through March 2021.

Expanding our offering 34 Le ve ra ge E nt ir e Fi rm ’s R es ou rc es
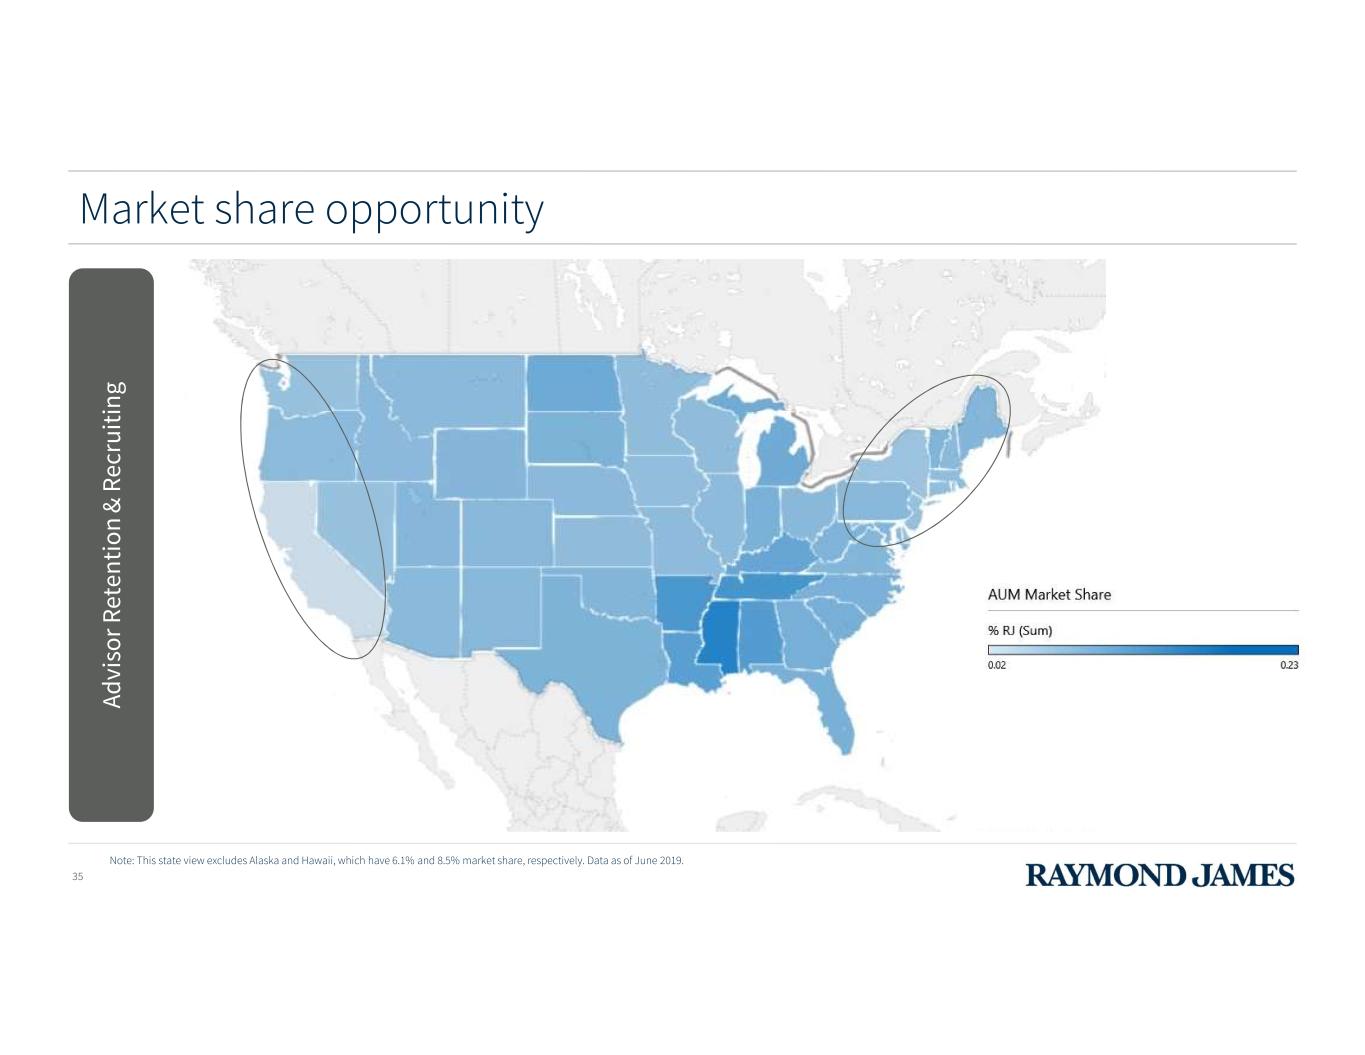
Market share opportunity Note: This state view excludes Alaska and Hawaii, which have 6.1% and 8.5% market share, respectively. Data as of June 2019. Ad vi so r R et en ti on & R ec ru it in g 35
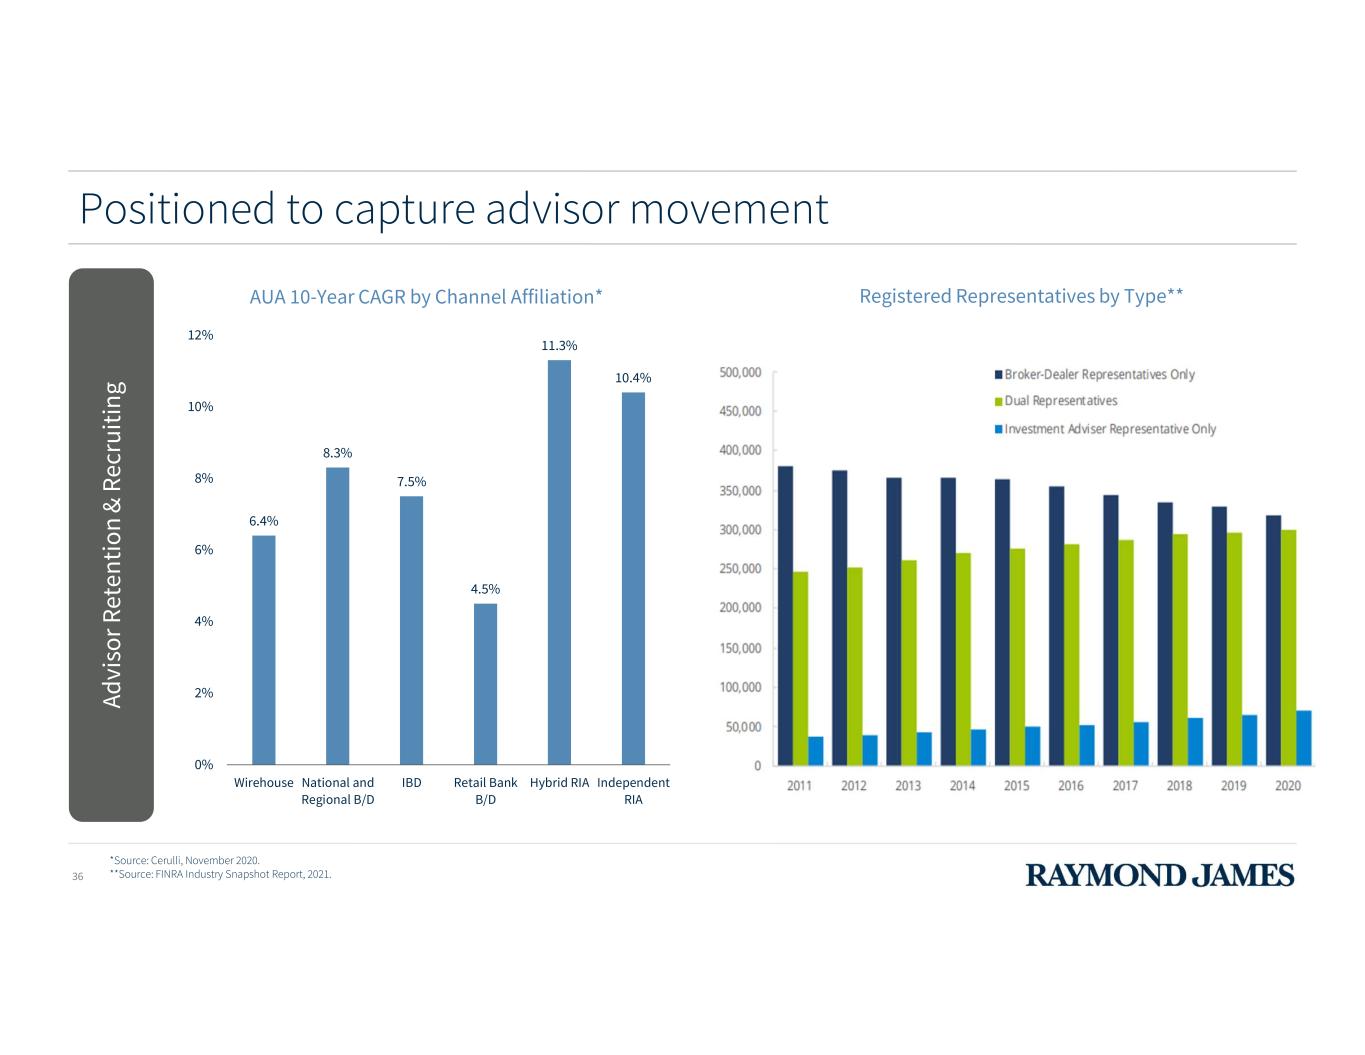
Positioned to capture advisor movement Ad vi so r R et en ti on & R ec ru it in g 36 6.4% 8.3% 7.5% 4.5% 11.3% 10.4% 0% 2% 4% 6% 8% 10% 12% Wirehouse National and Regional B/D IBD Retail Bank B/D Hybrid RIA Independent RIA AUA 10-Year CAGR by Channel Affiliation* Registered Representatives by Type** *Source: Cerulli, November 2020. **Source: FINRA Industry Snapshot Report, 2021.

Retention and recruiting powered by AdvisorChoice® 37 Ad vi so r R et en ti on & R ec ru it in g RJF Peer 1 Peer 2 Peer 3 Peer 4 Peer 5 Peer 6 Peer 7 Peer 8 Protocol Firm Employee option(s) Independent option(s) RIA option(s) No direct to client sales No payout penalties based on client size Full support transitioning book upon firm departure Comprehensive advisor technology Note: Based on publicly available information and RJF analysis.
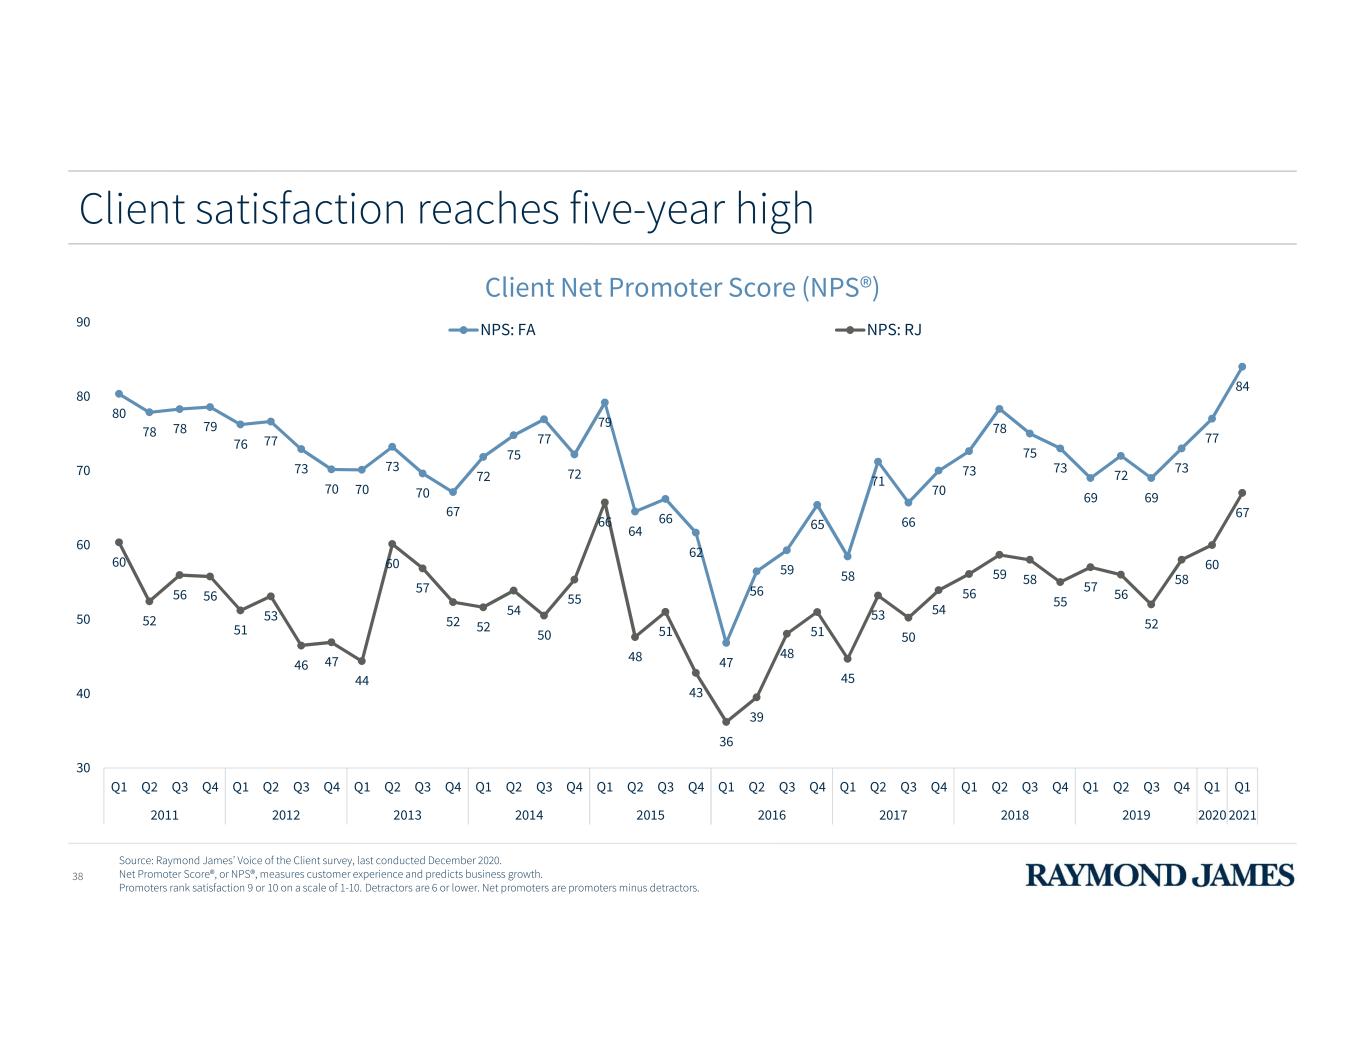
Client satisfaction reaches five-year high 38 Client Net Promoter Score (NPS®) 80 78 78 79 76 77 73 70 70 73 70 67 72 75 77 72 79 64 66 62 47 56 59 65 58 71 66 70 73 78 75 73 69 72 69 73 77 84 60 52 56 56 51 53 46 47 44 60 57 52 52 54 50 55 66 48 51 43 36 39 48 51 45 53 50 54 56 59 58 55 57 56 52 58 60 67 30 40 50 60 70 80 90 Q1 Q2 Q3 Q4 Q1 Q2 Q3 Q4 Q1 Q2 Q3 Q4 Q1 Q2 Q3 Q4 Q1 Q2 Q3 Q4 Q1 Q2 Q3 Q4 Q1 Q2 Q3 Q4 Q1 Q2 Q3 Q4 Q1 Q2 Q3 Q4 Q1 Q1 2011 2012 2013 2014 2015 2016 2017 2018 2019 2020 2021 NPS: FA NPS: RJ Source: Raymond James’ Voice of the Client survey, last conducted December 2020. Net Promoter Score®, or NPS®, measures customer experience and predicts business growth. Promoters rank satisfaction 9 or 10 on a scale of 1-10. Detractors are 6 or lower. Net promoters are promoters minus detractors.
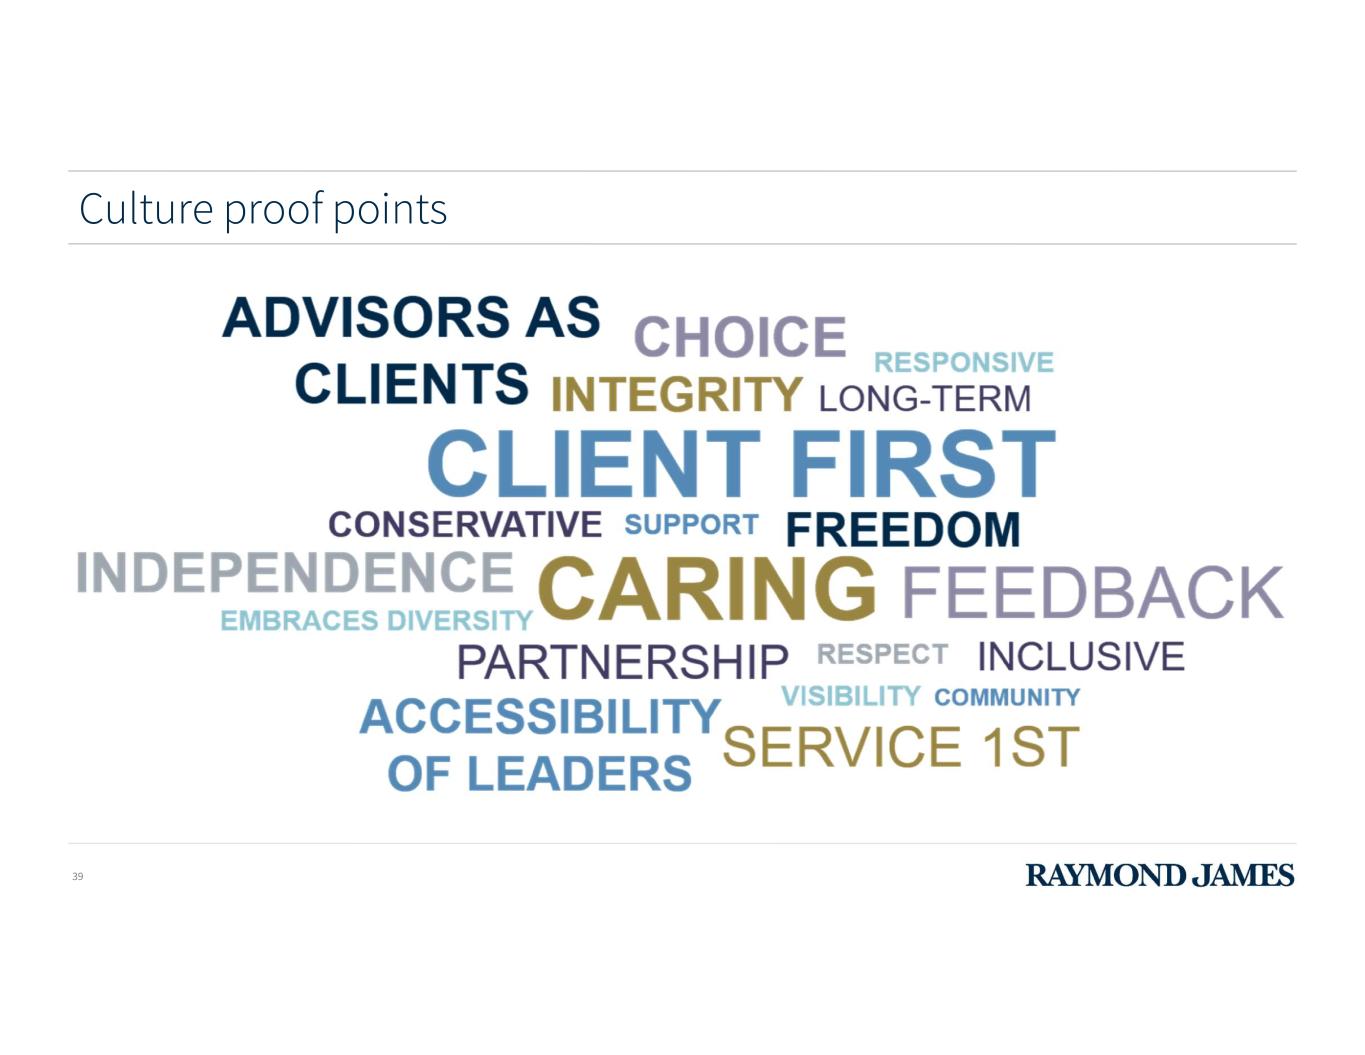
Culture proof points 39
2021 ANALYST & INVESTOR DAY Global Equities & Investment Banking Jim Bunn President, Global Equities & Investment Banking
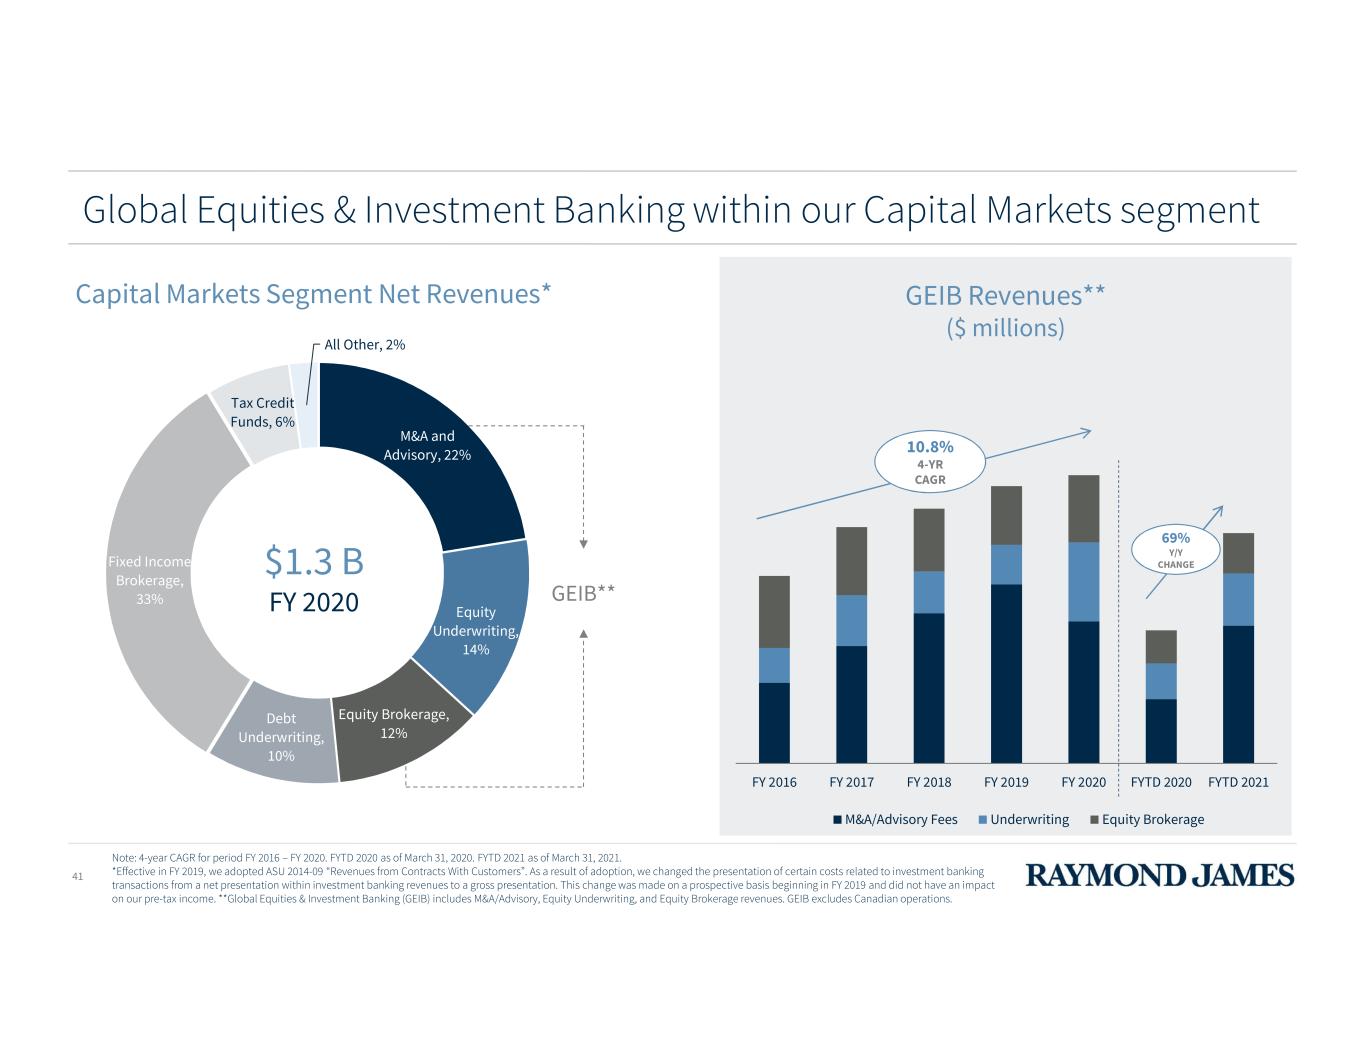
41 Capital Markets Segment Net Revenues* Global Equities & Investment Banking within our Capital Markets segment Note: 4-year CAGR for period FY 2016 – FY 2020. FYTD 2020 as of March 31, 2020. FYTD 2021 as of March 31, 2021. *Effective in FY 2019, we adopted ASU 2014-09 “Revenues from Contracts With Customers”. As a result of adoption, we changed the presentation of certain costs related to investment banking transactions from a net presentation within investment banking revenues to a gross presentation. This change was made on a prospective basis beginning in FY 2019 and did not have an impact on our pre-tax income. **Global Equities & Investment Banking (GEIB) includes M&A/Advisory, Equity Underwriting, and Equity Brokerage revenues. GEIB excludes Canadian operations. M&A and Advisory, 22% Equity Underwriting, 14% Equity Brokerage, 12% Debt Underwriting, 10% Fixed Income Brokerage, 33% Tax Credit Funds, 6% All Other, 2% GEIB** $1.3 B FY 2020 FY 2016 FY 2017 FY 2018 FY 2019 FY 2020 FYTD 2020 FYTD 2021 M&A/Advisory Fees Underwriting Equity Brokerage GEIB Revenues** ($ millions) 10.8% 4-YR CAGR 69% Y/Y CHANGE

42 ECM/SYNDICATE CORPORATE ACCESS INSTITUTIONAL SALES EQUITY TRADING GEIB INVESTMENT BANKING EQUITY RESEARCH • In 2020, marketed over 950 companies and executed over 7,000 meetings across ~750 events in the U.S., Europe, Canada and Asia • Institutional Investors Conference is one of largest and oldest generalist investor conferences; ~350 companies in attendance at 2021 virtual event • ~1,200 domestic institutional clients • ~500 international institutional clients • Global sales force, 70+ professionals (over half in the U.S. and including specialty sales) • ~25% of all institutional equity commissions generated outside the U.S. • Launched pan-Asia research/trading partnership with large Asian broker in Q3 2020 • 425+ professionals organized by industry and transaction specialty groups • Since 2015, completed more than 760 advisory assignments, including more than 640 M&A buy-side and sell-side advisory assignments • Senior trading teams specialized by industry • Focused and limited capital commitment • EDT launched in Q3 2017 • Electronic Trading (RJET) launched in Q2 2019 • When-Issued trading launched in Q3 2019 • Program Trading launched in Q1 2020 • Liquidity Solutions launched in Q2 2020 • One of Wall Street’s leading equity research efforts with nearly 60 research analysts covering ~900 U.S. and ~250 Canadian companies Generalist Sales Sector Specialty Sales Cash Trading Electronic Trading Risk Arb/ Event Driven Derivatives Sales Trading Global Equities & Investment Banking • Senior ECM professionals are dedicated by industry sector and support the public capital raising needs of our corporate clients • Participated in raising ~$230 billion in capital for corporate clients since 2015 • Outperformance in deal execution: bookrunner capacity in ~30% of all 2020 offerings Note: As of March 31, 2021 unless otherwise noted. GEIB excludes Canadian operations.
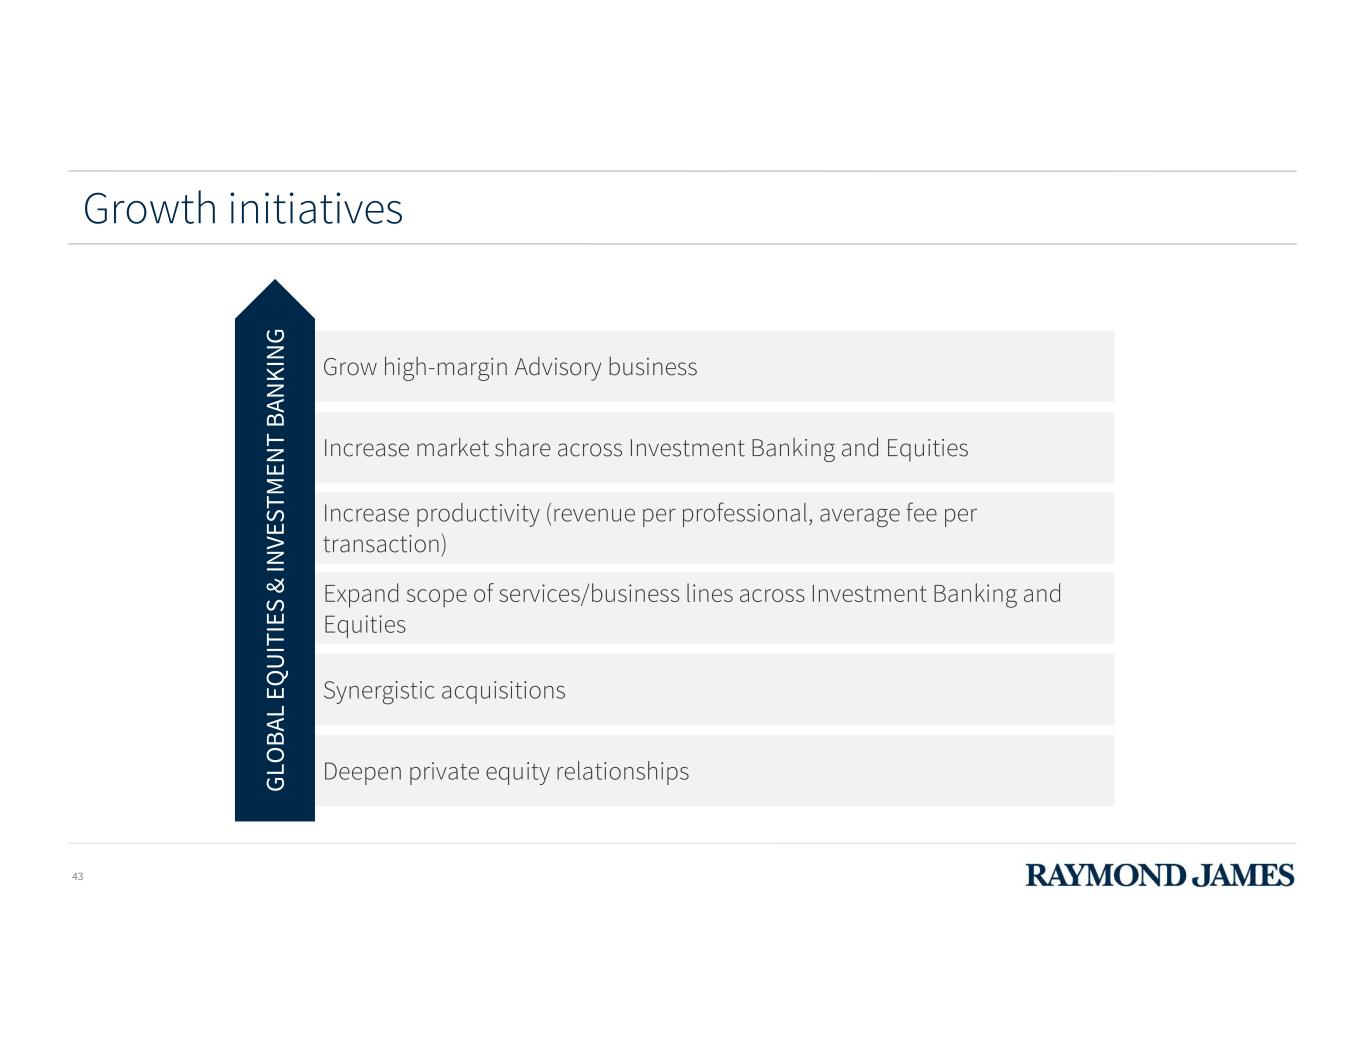
43 Growth initiatives Grow high-margin Advisory business Increase productivity (revenue per professional, average fee per transaction) Synergistic acquisitions Deepen private equity relationships Expand scope of services/business lines across Investment Banking and Equities Increase market share across Investment Banking and Equities G LO B AL E Q U IT IE S & IN VE ST M EN T B AN K IN G

44 CONVERTIBLE FINANCING • Equity • Debt RESTRUCTURING • Reorganizations • Workouts • Financings PRIVATE CAPITAL FUND ADVISORY • GP-led Secondaries • Fund Placement • LP-led Secondaries CORPORATE & EXECUTIVE SERVICES • Share Buybacks • Equity Compensation Plan Administration • Cash Management CONSUMER FINANCIAL SERVICES DIVERSIFIED INDUSTRIALS HEALTH CARE TECHNOLOGY & SERVICES ENERGY REAL ESTATE M&A ADVISORY • Sell-side • Buy-side • Divestitures PRIVATE EQUITY CAPITAL • Recapitalizations • Growth Equity • Structured Equity PRIVATE DEBT CAPITAL • Senior Debt • Unitranche • Mezzanine PUBLIC DEBT CAPITAL • Investment Grade • High Yield • Structured Debt 20+ Offices 320+ Bankers Three Offices 40+ Bankers NORTH AMERICA EUROPE Two Offices 40+ Bankers London Office 25+ Bankers PUBLIC EQUITY CAPITAL • IPOs • Follow-ons • ATMs • Bought / Block Deals Full-service investment banking capabilities with deep industry expertise Note: As of March 31, 2021.
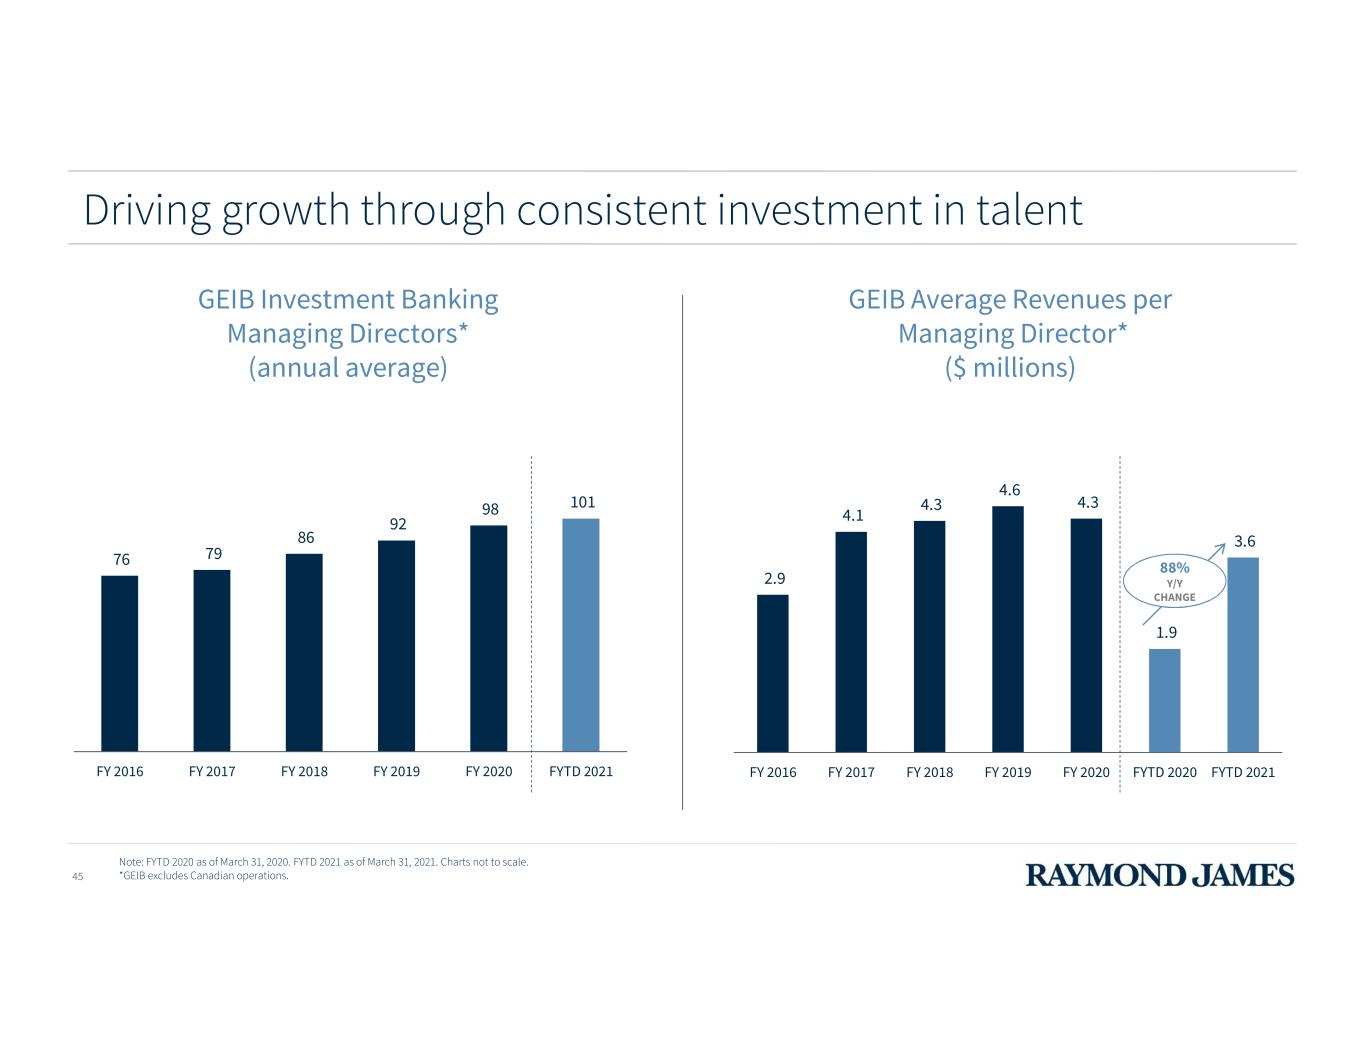
2.9 4.1 4.3 4.6 4.3 1.9 3.6 FY 2016 FY 2017 FY 2018 FY 2019 FY 2020 FYTD 2020 FYTD 2021 Driving growth through consistent investment in talent 45 GEIB Investment Banking Managing Directors* (annual average) GEIB Average Revenues per Managing Director* ($ millions) 76 79 86 92 98 101 FY 2016 FY 2017 FY 2018 FY 2019 FY 2020 FYTD 2021 Note: FYTD 2020 as of March 31, 2020. FYTD 2021 as of March 31, 2021. Charts not to scale. *GEIB excludes Canadian operations. 88% Y/Y CHANGE
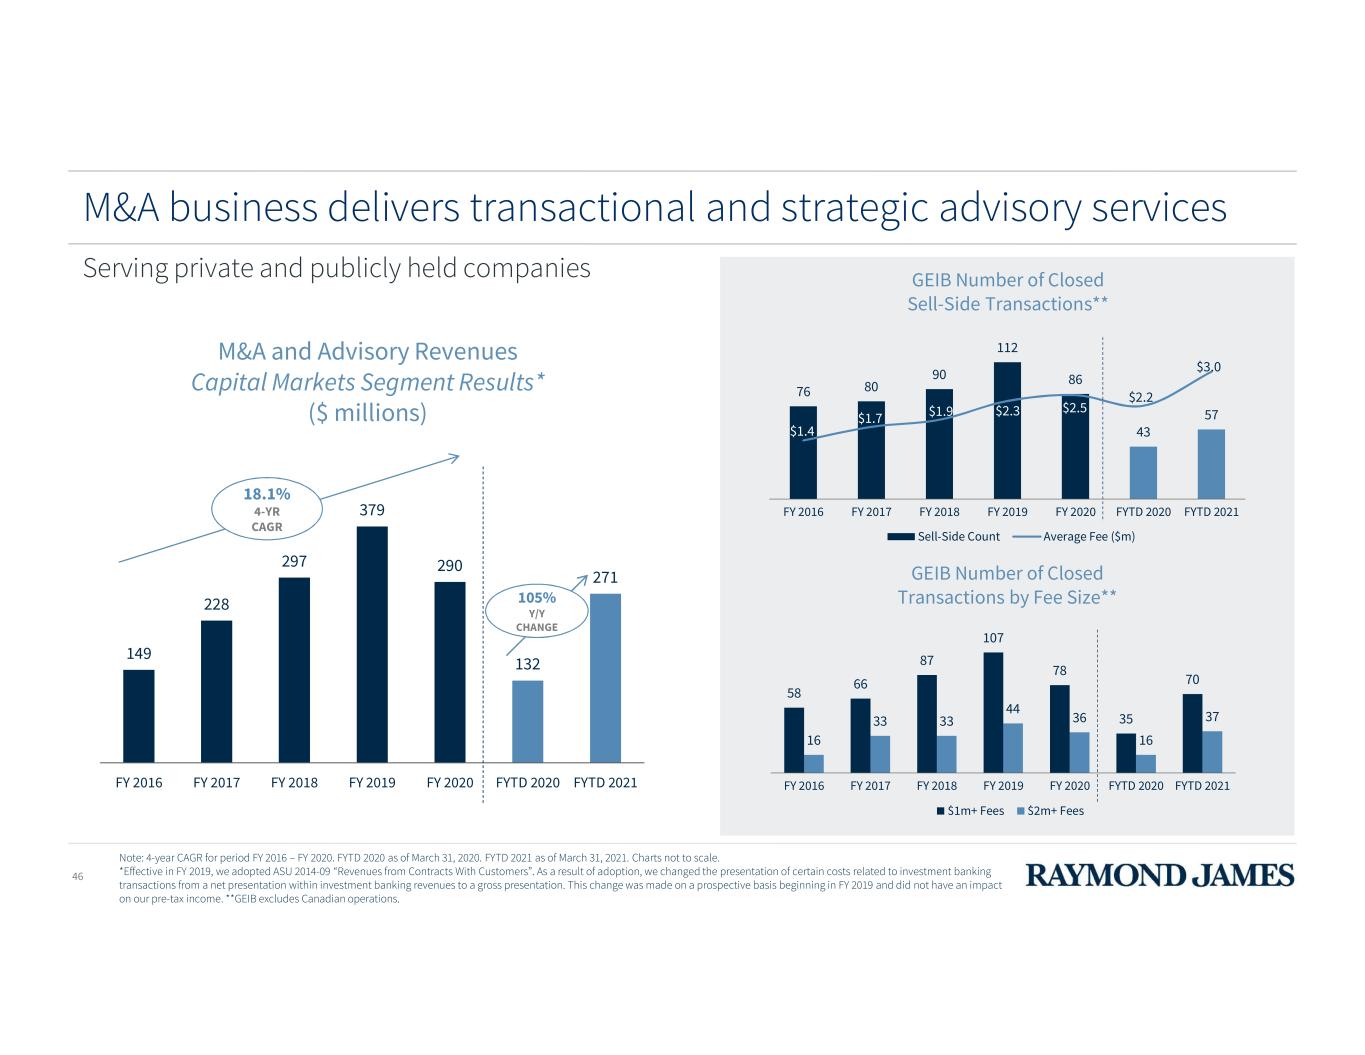
Note: 4-year CAGR for period FY 2016 – FY 2020. FYTD 2020 as of March 31, 2020. FYTD 2021 as of March 31, 2021. Charts not to scale. *Effective in FY 2019, we adopted ASU 2014-09 “Revenues from Contracts With Customers”. As a result of adoption, we changed the presentation of certain costs related to investment banking transactions from a net presentation within investment banking revenues to a gross presentation. This change was made on a prospective basis beginning in FY 2019 and did not have an impact on our pre-tax income. **GEIB excludes Canadian operations. 149 228 297 379 290 132 271 FY 2016 FY 2017 FY 2018 FY 2019 FY 2020 FYTD 2020 FYTD 2021 46 M&A and Advisory Revenues Capital Markets Segment Results* ($ millions) M&A business delivers transactional and strategic advisory services 18.1% 4-YR CAGR GEIB Number of Closed Sell-Side Transactions** GEIB Number of Closed Transactions by Fee Size** Serving private and publicly held companies 76 80 90 112 86 43 57 $1.4 $1.7 $1.9 $2.3 $2.5 $2.2 $3.0 $0.0 $0.5 $1.0 $1.5 $2.0 $2.5 $3.0 $3.5 - 20.0 40.0 60.0 80.0 100.0 120.0 FY 2016 FY 2017 FY 2018 FY 2019 FY 2020 FYTD 2020 FYTD 2021 Sell-Side Count Average Fee ($m) 58 66 87 107 78 35 70 16 33 33 44 36 16 37 - 20.0 40.0 60.0 80.0 100.0 120.0 FY 2016 FY 2017 FY 2018 FY 2019 FY 2020 FYTD 2020 FYTD 2021 $1m+ Fees $2m+ Fees 105% Y/Y CHANGE
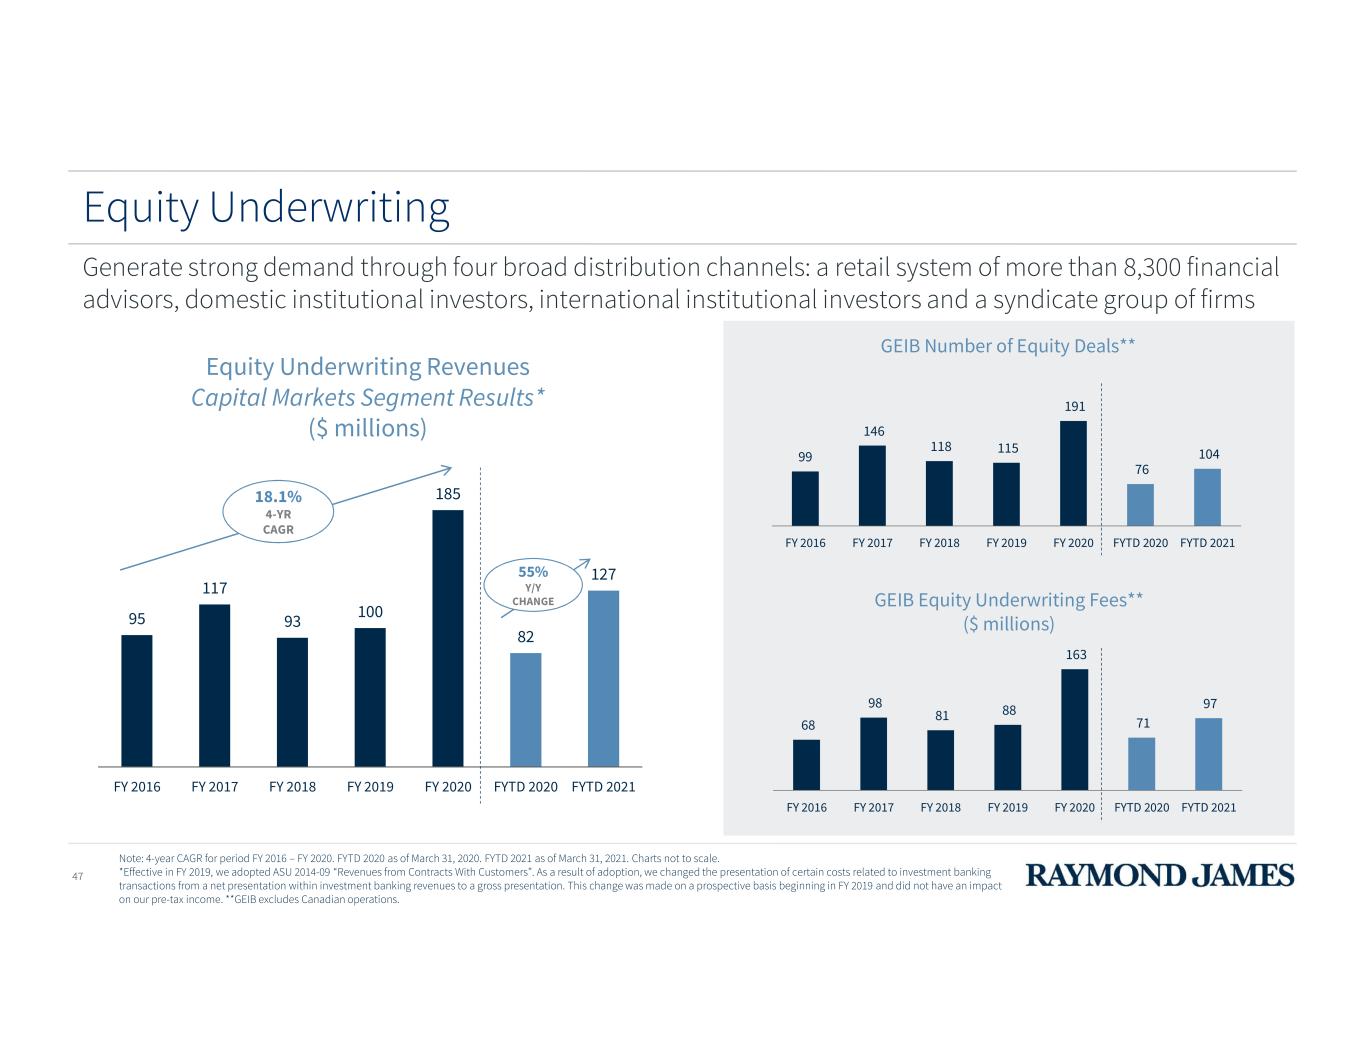
68 98 81 88 163 71 97 FY 2016 FY 2017 FY 2018 FY 2019 FY 2020 FYTD 2020 FYTD 2021 47 Equity Underwriting Revenues Capital Markets Segment Results* ($ millions) 95 117 93 100 185 82 127 FY 2016 FY 2017 FY 2018 FY 2019 FY 2020 FYTD 2020 FYTD 2021 Note: 4-year CAGR for period FY 2016 – FY 2020. FYTD 2020 as of March 31, 2020. FYTD 2021 as of March 31, 2021. Charts not to scale. *Effective in FY 2019, we adopted ASU 2014-09 “Revenues from Contracts With Customers”. As a result of adoption, we changed the presentation of certain costs related to investment banking transactions from a net presentation within investment banking revenues to a gross presentation. This change was made on a prospective basis beginning in FY 2019 and did not have an impact on our pre-tax income. **GEIB excludes Canadian operations. Equity Underwriting 18.1% 4-YR CAGR Generate strong demand through four broad distribution channels: a retail system of more than 8,300 financial advisors, domestic institutional investors, international institutional investors and a syndicate group of firms 99 146 118 115 191 76 104 FY 2016 FY 2017 FY 2018 FY 2019 FY 2020 FYTD 2020 FYTD 2021 GEIB Equity Underwriting Fees** ($ millions) 55% Y/Y CHANGE GEIB Number of Equity Deals**
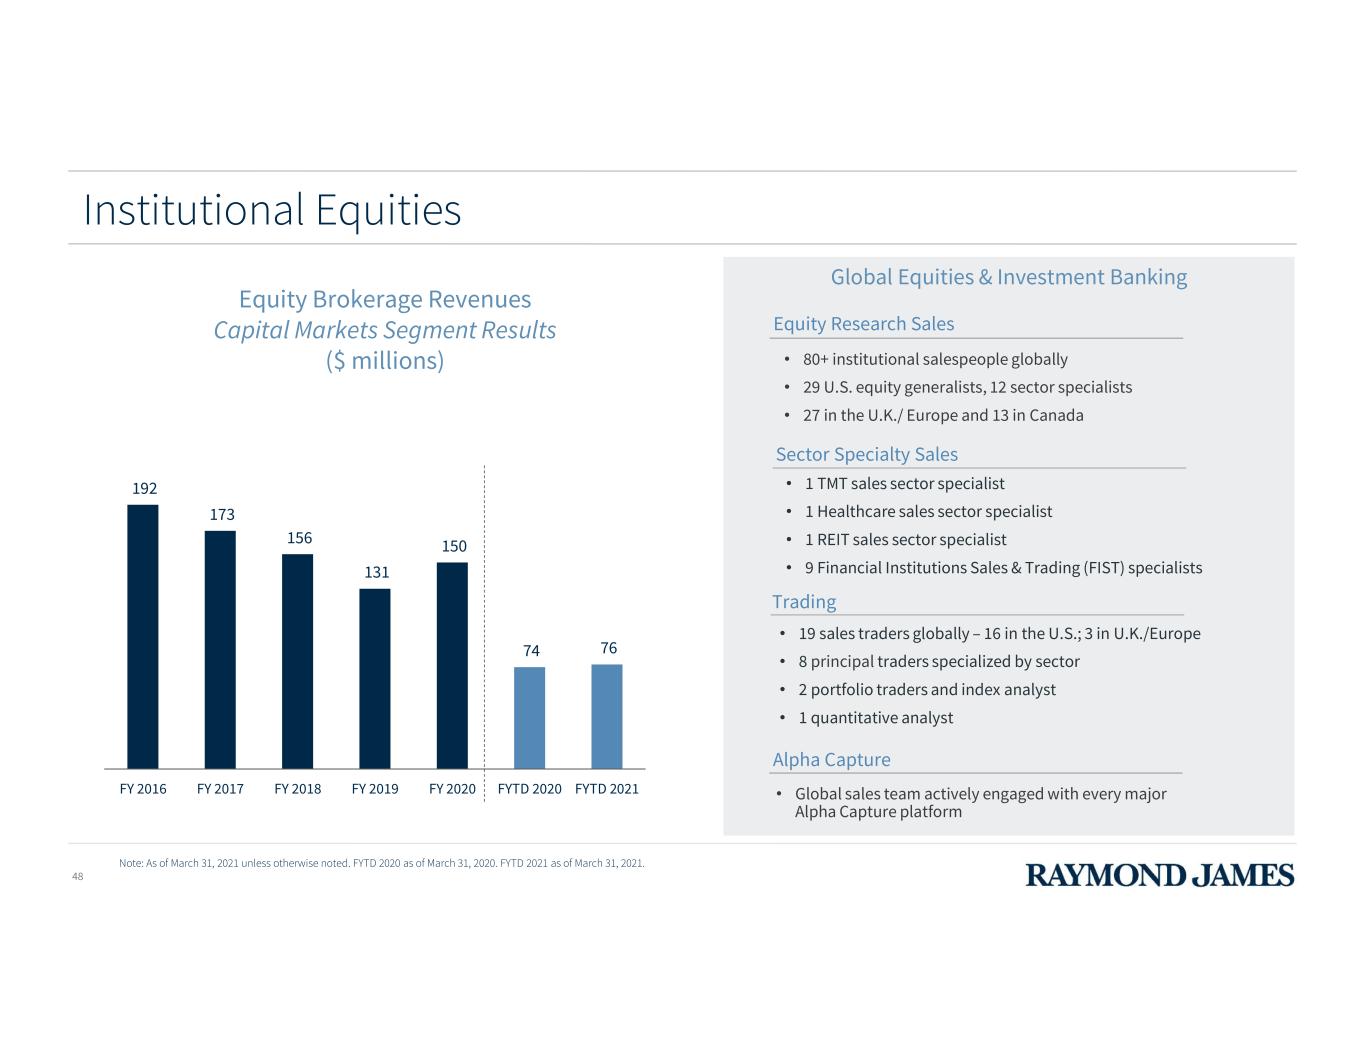
48 Equity Brokerage Revenues Capital Markets Segment Results ($ millions) 192 173 156 131 150 74 76 FY 2016 FY 2017 FY 2018 FY 2019 FY 2020 FYTD 2020 FYTD 2021 Note: As of March 31, 2021 unless otherwise noted. FYTD 2020 as of March 31, 2020. FYTD 2021 as of March 31, 2021. Alpha Capture • Global sales team actively engaged with every major Alpha Capture platform • 19 sales traders globally – 16 in the U.S.; 3 in U.K./Europe • 8 principal traders specialized by sector • 2 portfolio traders and index analyst • 1 quantitative analyst Trading • 1 TMT sales sector specialist • 1 Healthcare sales sector specialist • 1 REIT sales sector specialist • 9 Financial Institutions Sales & Trading (FIST) specialists Sector Specialty Sales • 80+ institutional salespeople globally • 29 U.S. equity generalists, 12 sector specialists • 27 in the U.K./ Europe and 13 in Canada Equity Research Sales Institutional Equities Global Equities & Investment Banking

Global research department supports our institutional and retail sales efforts 49 • Ranked #1 on Thematic and Forward-Looking Research Consumer 9% Energy 10% Financial Services 24% Healthcare 16% Real Estate 10% Technology & Telecommunications 24% Transportation & Industrial Services 7% Sector Focus** $10B+, 32% $5B-$10B, 14% $2B-$5B, 21% $500M-$2B, 23% <$500M, 10% Market Capitalization *Equity research coverage as of March 31, 2021. Includes U.S. & Canadian companies. **Excludes Materials. U.S. Equity Research* (~1,150 Total Companies) Source: Coalition Greenwich, 2020. • Ranked #2 on Being Most Knowledgeable of Companies and Industries • Ranked #2 on Client Service Intensity by Analysts • Ranked #2 on Corporate Access • Ranked #1 on Providing Corporate Access to Small/Mid-Cap Companies Based on 2020 U.S. Equities study with Small/Mid-Cap Funds Based on 2020 U.S. Equities study with Small/Mid-Cap Funds Based on 2020 U.S. Equities study with Small/Mid-Cap Funds Based on 2020 U.S. Equities study with Small/Mid-Cap Funds Based on 2020 U.S. Equities study with Generalist PMs

Premier research provider covering growth companies 50 Source: Starmine North American Peer Coverage April 1, 2021. North America coverage based on covered company’s location. • The Raymond James Equity Research team is composed of nearly 60 equity analysts covering ~900 U.S. and ~250 Canadian companies • Our U.S. industry analysts possess over 670 cumulative years experience with an average of 16 years of sell-side experience • Raymond James also provides Macro, Policy and Strategy research to complement its industry and company research Raymond James is the 4th ranked provider of Equity Research in North America by stocks under coverage and is ranked 2nd in breadth of small/mid-cap researchcoverage C O M P AN IE S CO VE R ED NORTH AMERICAN EQUITY RESEARCH Top provider of North American research Note: As of March 31, 2021 unless otherwise noted.

Successful track record of acquisitions 51 Standalone Revenue 10x Developed the #1 middle market fintech practice in the U.S. Current Tech & Services Revenue Standalone Revenue Current European IB Revenue Established one of the fastest growing European investment banking businesses 9x Standalone Revenue Potential Future Consumer Revenue Established GEIB as a leader in Consumer & Retail investment banking Transaction Closed on Mar. 30, 2021 Standalone Revenue 3x Current Asset & Wealth Management IB Revenue Created a leader in Asset & Wealth Management investment banking Standalone Revenue Potential Future Revenue Expands our scope of services into the Private Capital Fund Advisory market Transaction Announced on May 25, 2021
2021 ANALYST & INVESTOR DAY Raymond James Bank Steve Raney Chairman & CEO, Raymond James Bank
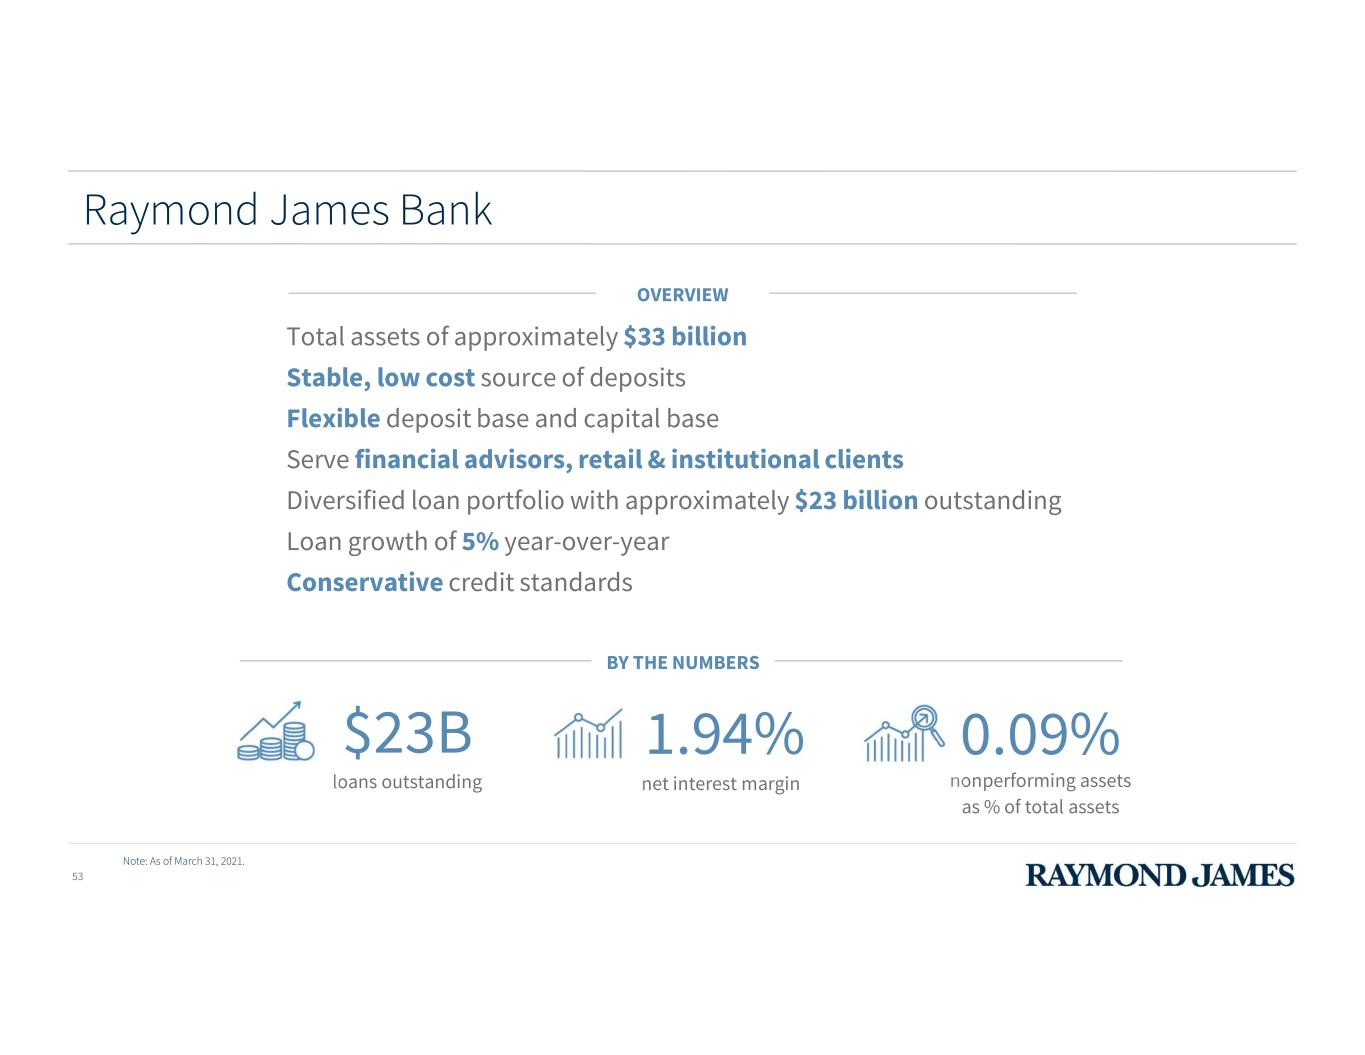
OVERVIEW Total assets of approximately $33 billion Stable, low cost source of deposits Flexible deposit base and capital base Serve financial advisors, retail & institutional clients Diversified loan portfolio with approximately $23 billion outstanding Loan growth of 5% year-over-year Conservative credit standards BY THE NUMBERS loans outstanding $23B net interest margin 1.94% Note: As of March 31, 2021. nonperforming assets as % of total assets 0.09% Raymond James Bank 53
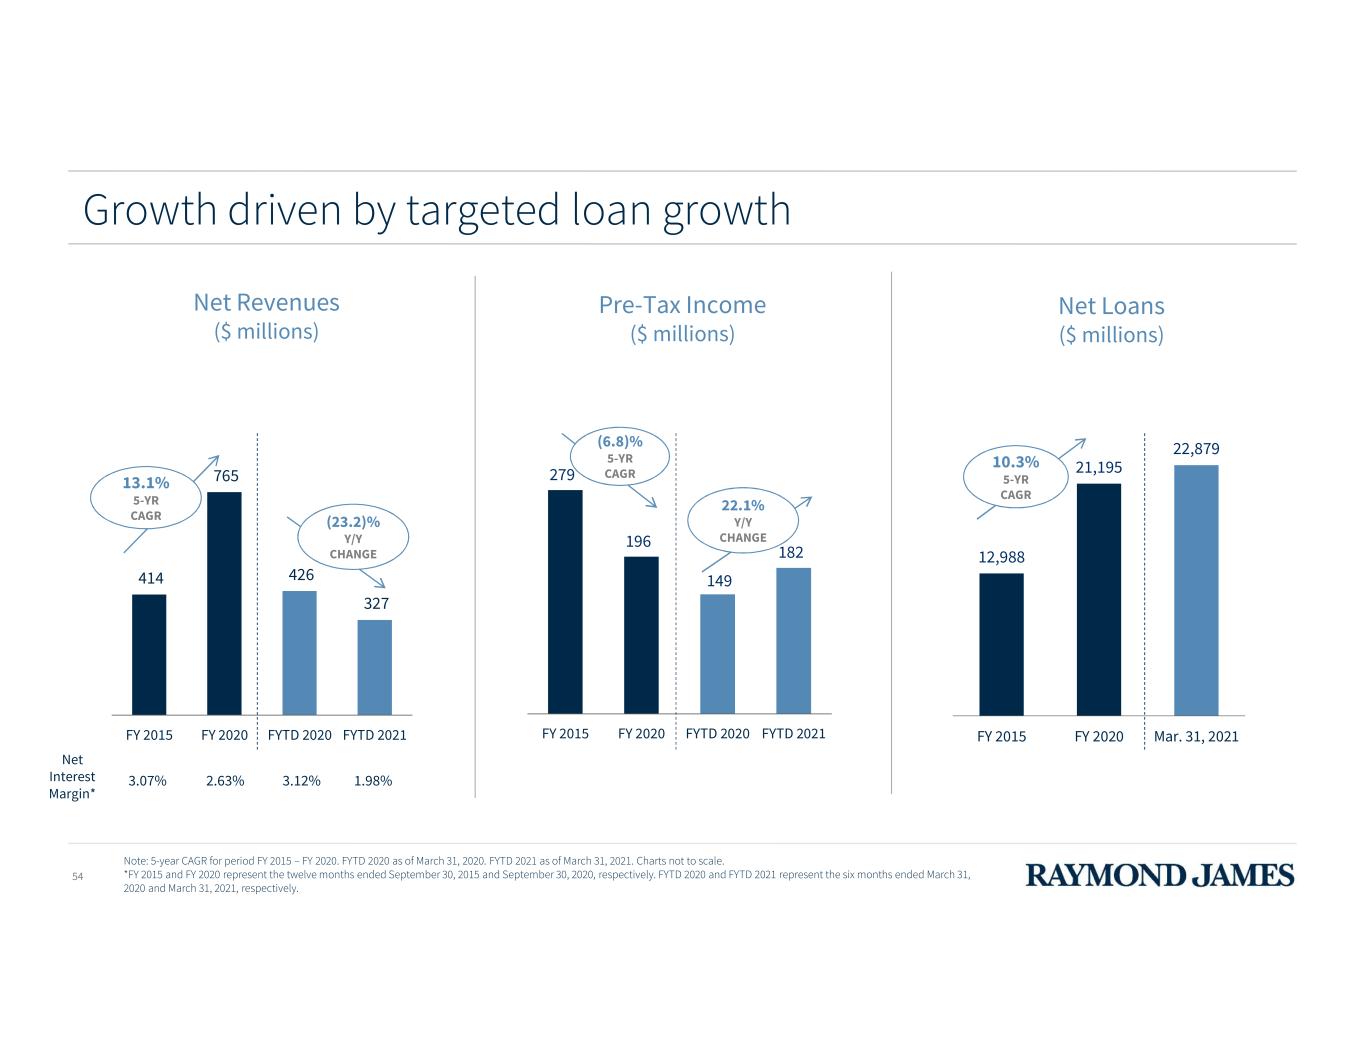
12,988 21,195 22,879 FY 2015 FY 2020 Mar. 31, 2021 Note: 5-year CAGR for period FY 2015 – FY 2020. FYTD 2020 as of March 31, 2020. FYTD 2021 as of March 31, 2021. Charts not to scale. *FY 2015 and FY 2020 represent the twelve months ended September 30, 2015 and September 30, 2020, respectively. FYTD 2020 and FYTD 2021 represent the six months ended March 31, 2020 and March 31, 2021, respectively. 414 765 426 327 FY 2015 FY 2020 FYTD 2020 FYTD 2021 279 196 149 182 FY 2015 FY 2020 FYTD 2020 FYTD 2021 13.1% 5-YR CAGR (6.8)% 5-YR CAGR 10.3% 5-YR CAGR Net Interest Margin* 3.07% 2.63% 1.98% Growth driven by targeted loan growth Net Revenues ($ millions) Pre-Tax Income ($ millions) Net Loans ($ millions) 54 (23.2)% Y/Y CHANGE 22.1% Y/Y CHANGE 3.12%
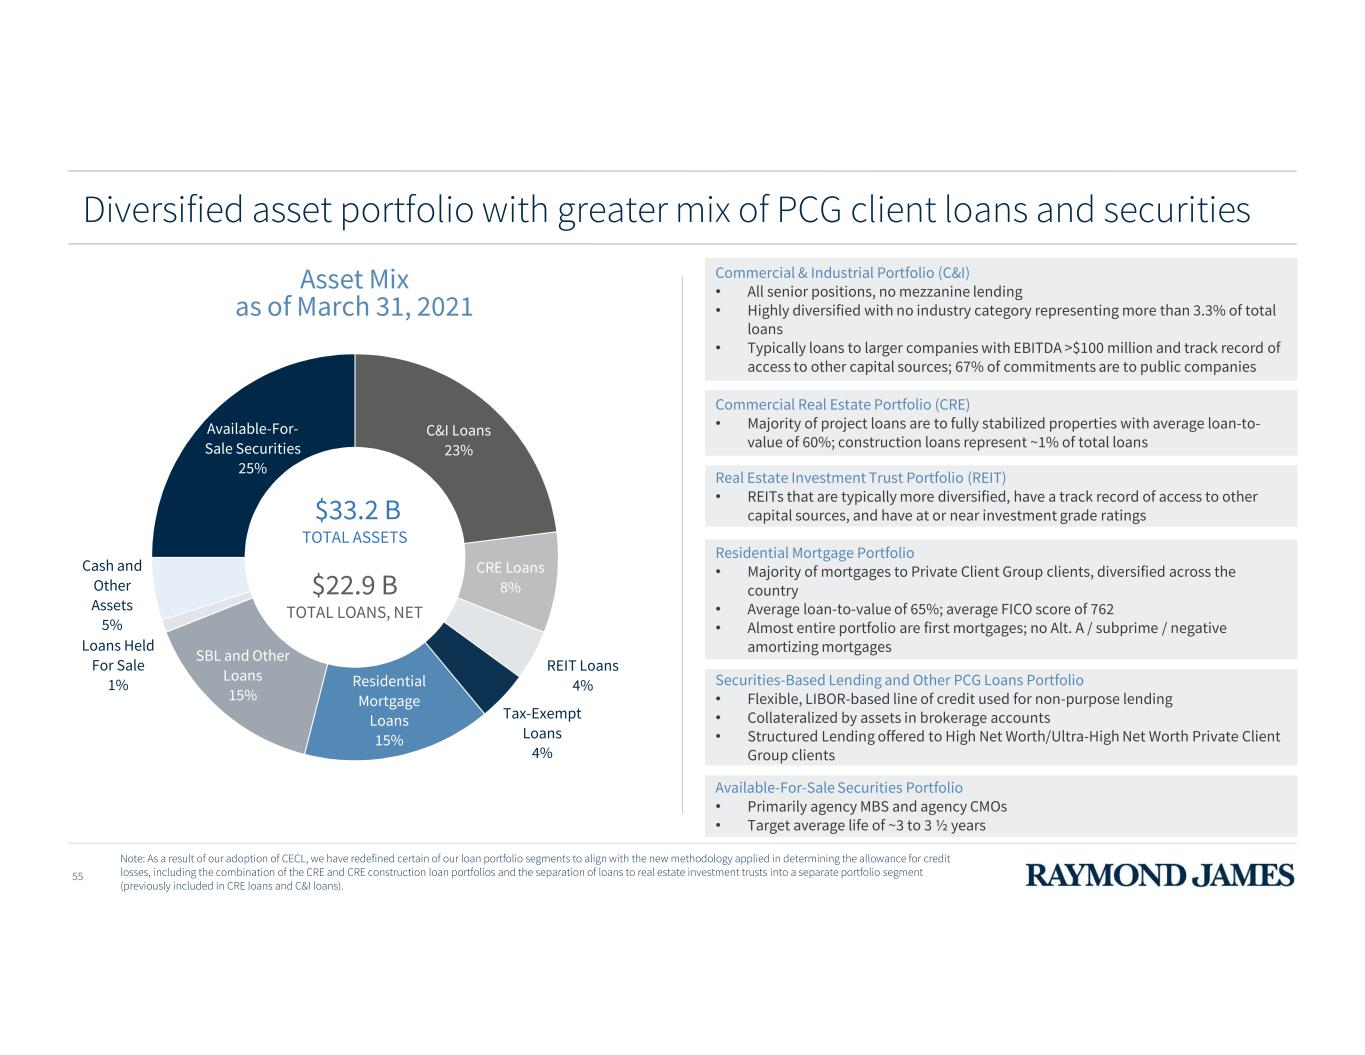
C&I Loans 23% CRE Loans 8% REIT Loans 4% Tax-Exempt Loans 4% Residential Mortgage Loans 15% SBL and Other Loans 15% Loans Held For Sale 1% Cash and Other Assets 5% Available-For- Sale Securities 25% Diversified asset portfolio with greater mix of PCG client loans and securities Asset Mix as of March 31, 2021 $33.2 B TOTAL ASSETS $22.9 B TOTAL LOANS, NET Note: As a result of our adoption of CECL, we have redefined certain of our loan portfolio segments to align with the new methodology applied in determining the allowance for credit losses, including the combination of the CRE and CRE construction loan portfolios and the separation of loans to real estate investment trusts into a separate portfolio segment (previously included in CRE loans and C&I loans). 55 Commercial & Industrial Portfolio (C&I) • All senior positions, no mezzanine lending • Highly diversified with no industry category representing more than 3.3% of total loans • Typically loans to larger companies with EBITDA >$100 million and track record of access to other capital sources; 67% of commitments are to public companies Commercial Real Estate Portfolio (CRE) • Majority of project loans are to fully stabilized properties with average loan-to- value of 60%; construction loans represent ~1% of total loans Real Estate Investment Trust Portfolio (REIT) • REITs that are typically more diversified, have a track record of access to other capital sources, and have at or near investment grade ratings Residential Mortgage Portfolio • Majority of mortgages to Private Client Group clients, diversified across the country • Average loan-to-value of 65%; average FICO score of 762 • Almost entire portfolio are first mortgages; no Alt. A / subprime / negative amortizing mortgages Available-For-Sale Securities Portfolio • Primarily agency MBS and agency CMOs • Target average life of ~3 to 3 ½ years Securities-Based Lending and Other PCG Loans Portfolio • Flexible, LIBOR-based line of credit used for non-purpose lending • Collateralized by assets in brokerage accounts • Structured Lending offered to High Net Worth/Ultra-High Net Worth Private Client Group clients

Loan growth RJ Bank Loans* 5-Year CAGRs (March 31, 2016 – March 31, 2021) *Quarter-end balances as of March 31, 2016 and March 31, 2021, respectively. **Corporate loans includes C&I, CRE and CRE construction loans for the quarter ended March 31, 2016, and includes C&I, CRE and REIT loans for the quarter ended March 31, 2021.56 23.5% 17.7% 14.9% 3.8% SBL and Other Loans Residential Mortgage Loans Tax-Exempt Loans Corporate Loans** Agency-Backed Securities Portfolio grew at 5-Year CAGR of 81%
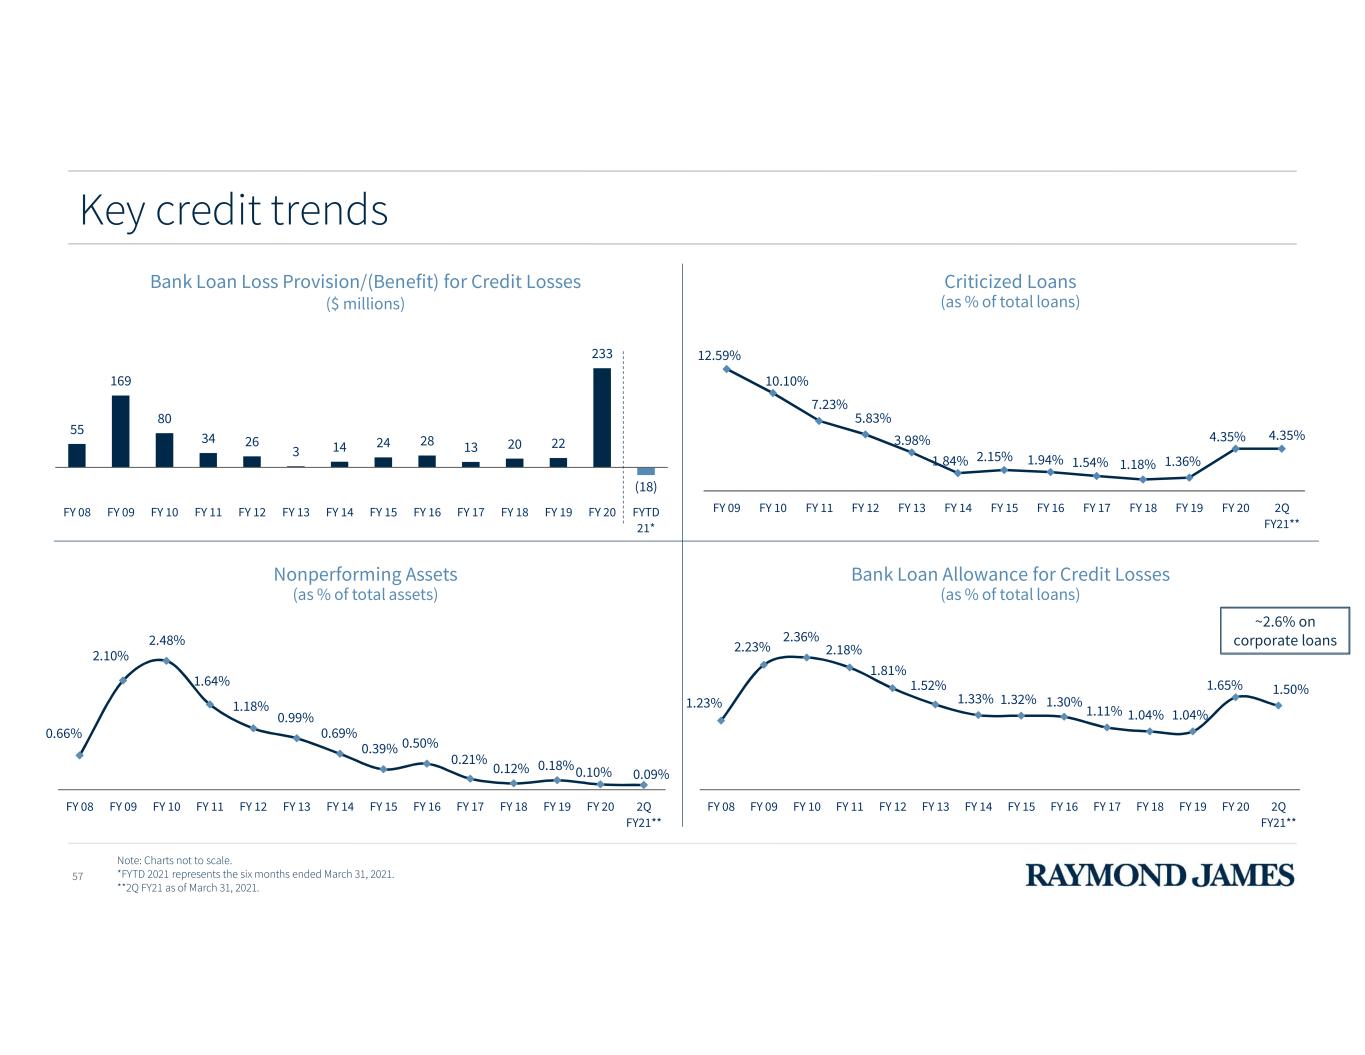
Bank Loan Loss Provision/(Benefit) for Credit Losses ($ millions) Note: Charts not to scale. *FYTD 2021 represents the six months ended March 31, 2021. **2Q FY21 as of March 31, 2021. 55 169 80 34 26 3 14 24 28 13 20 22 233 (18) FY 08 FY 09 FY 10 FY 11 FY 12 FY 13 FY 14 FY 15 FY 16 FY 17 FY 18 FY 19 FY 20 FYTD 21* 0.66% 2.10% 2.48% 1.64% 1.18% 0.99% 0.69% 0.39% 0.50% 0.21% 0.12% 0.18%0.10% 0.09% FY 08 FY 09 FY 10 FY 11 FY 12 FY 13 FY 14 FY 15 FY 16 FY 17 FY 18 FY 19 FY 20 2Q FY21** 1.23% 2.23% 2.36% 2.18% 1.81% 1.52% 1.33% 1.32% 1.30% 1.11% 1.04% 1.04% 1.65% 1.50% FY 08 FY 09 FY 10 FY 11 FY 12 FY 13 FY 14 FY 15 FY 16 FY 17 FY 18 FY 19 FY 20 2Q FY21** 12.59% 10.10% 7.23% 5.83% 3.98% 1.84% 2.15% 1.94% 1.54% 1.18% 1.36% 4.35% 4.35% FY 09 FY 10 FY 11 FY 12 FY 13 FY 14 FY 15 FY 16 FY 17 FY 18 FY 19 FY 20 2Q FY21** Nonperforming Assets (as % of total assets) Bank Loan Allowance for Credit Losses (as % of total loans) Criticized Loans (as % of total loans) 57 Key credit trends ~2.6% on corporate loans
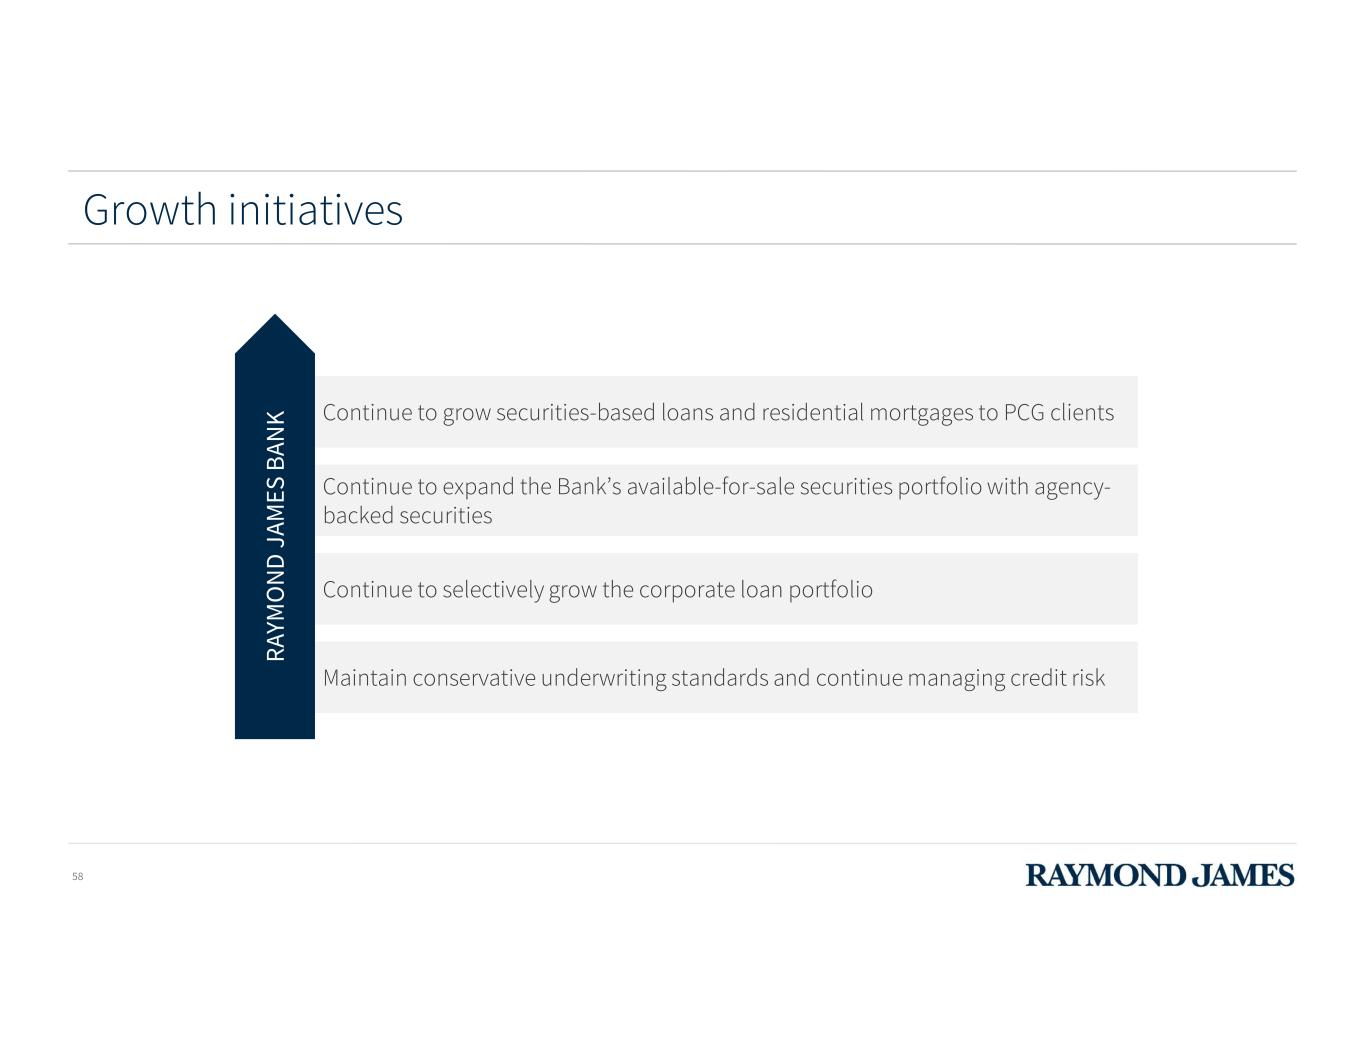
58 Growth initiatives Continue to grow securities-based loans and residential mortgages to PCG clients Continue to expand the Bank’s available-for-sale securities portfolio with agency- backed securities Continue to selectively grow the corporate loan portfolio Maintain conservative underwriting standards and continue managing credit risk R AY M O N D J AM ES B AN K

2021 ANALYST & INVESTOR DAY Q & A Scott Curtis, President, Private Client Group Jim Bunn, President, Global Equities & Investment Banking Steve Raney, Chairman & CEO, Raymond James Bank

2021 ANALYST & INVESTOR DAY Financial Review Paul Shoukry Chief Financial Officer, Raymond James Financial
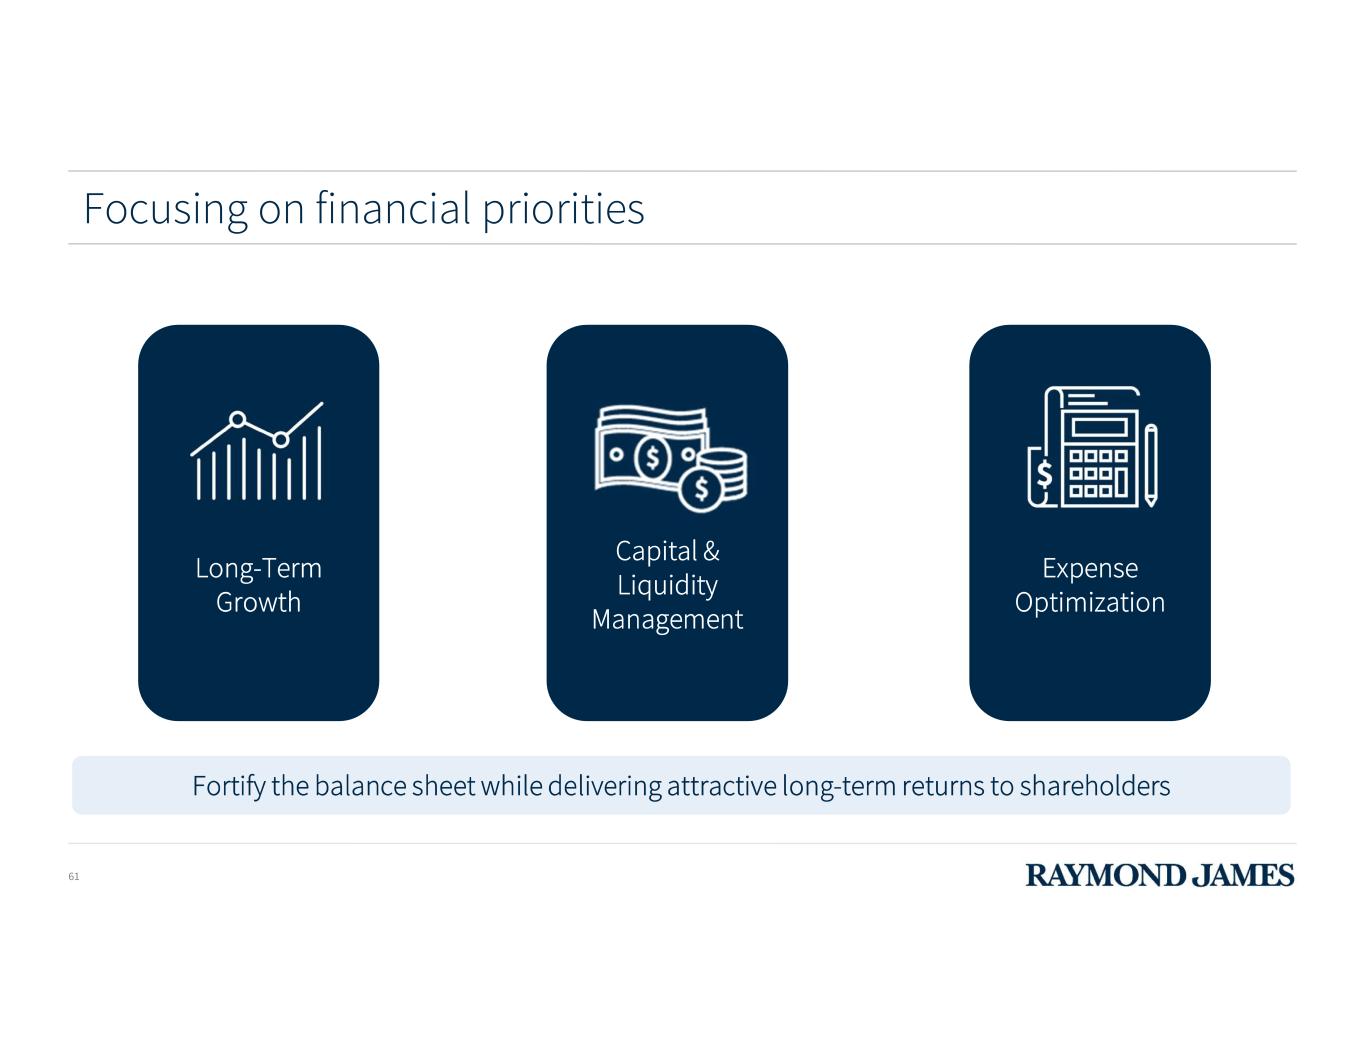
Focusing on financial priorities Long-Term Growth Fortify the balance sheet while delivering attractive long-term returns to shareholders Capital & Liquidity Management Expense Optimization 61

Long-term growth: Net Revenues Consolidated Net Revenues ($ millions) 5,204 5,405 6,371 7,274 7,740 7,990 4,077 4,594 FY 2015 FY 2016 FY 2017 FY 2018 FY 2019 FY 2020 FYTD 2020 FYTD 2021 9.0% 5-YR CAGR Note: 5-year CAGR for period FY 2015 – FY 2020. FYTD 2020 as of March 31, 2020. FYTD 2021 as of March 31, 2021. *Asset-based revenues include asset management and related administrative fees, asset-based brokerage revenues, interest income, RJBDP fees, and mutual fund and annuity service fees.62 Asset-Based Revenues* (%) 64% 66% 69% 74% 12.7% Y/Y CHANGE 75% 69% 72%74%
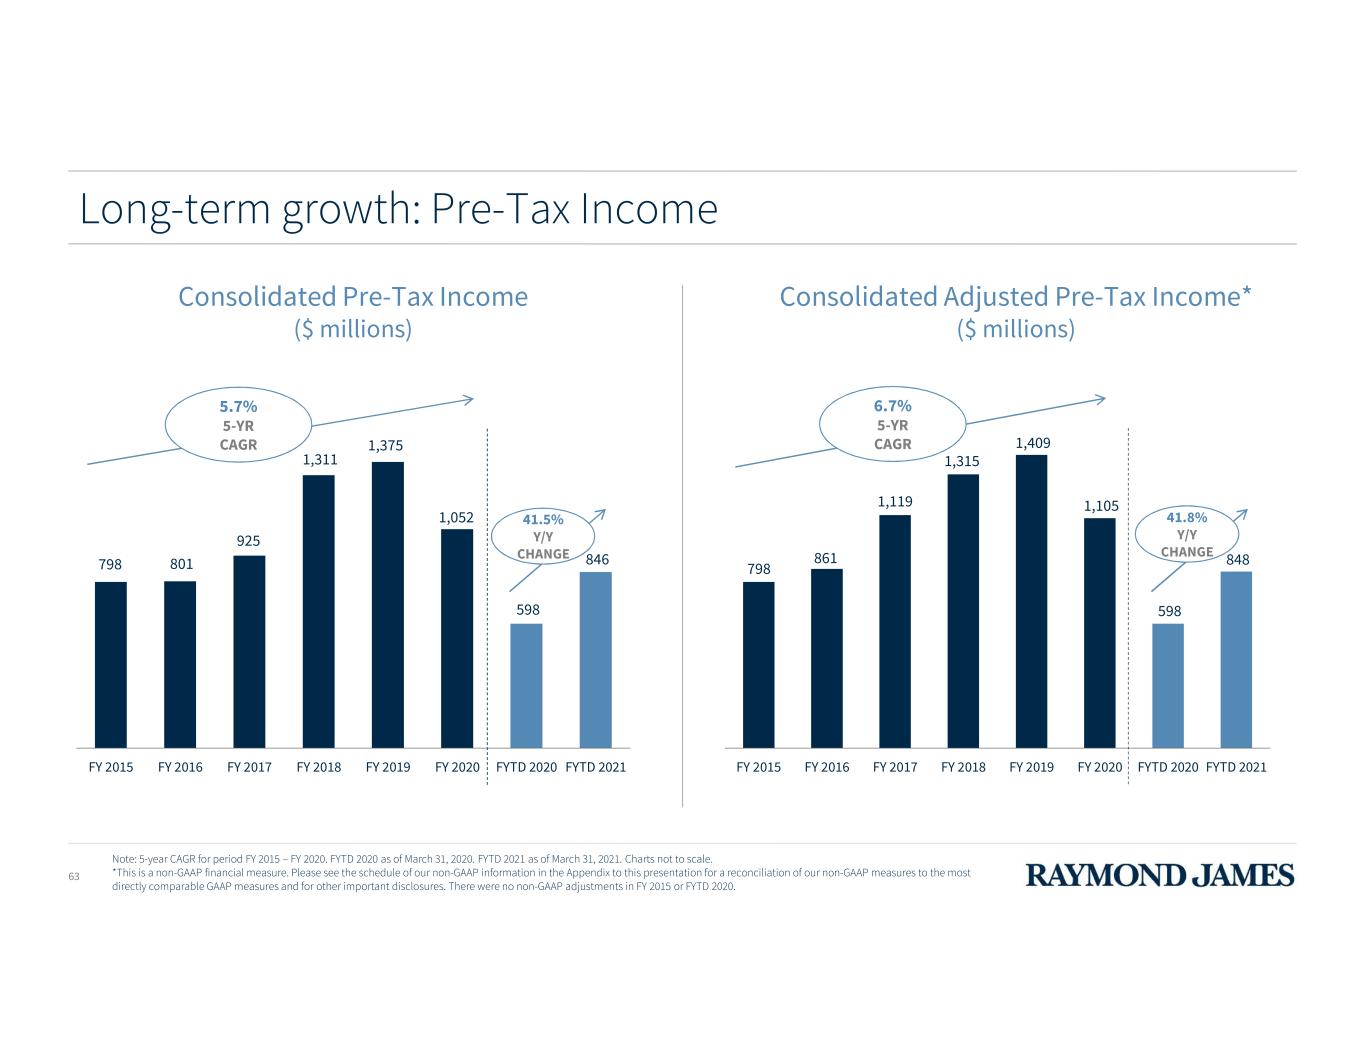
Long-term growth: Pre-Tax Income Consolidated Adjusted Pre-Tax Income* ($ millions) 798 861 1,119 1,315 1,409 1,105 598 848 FY 2015 FY 2016 FY 2017 FY 2018 FY 2019 FY 2020 FYTD 2020 FYTD 2021 6.7% 5-YR CAGR Note: 5-year CAGR for period FY 2015 – FY 2020. FYTD 2020 as of March 31, 2020. FYTD 2021 as of March 31, 2021. Charts not to scale. *This is a non-GAAP financial measure. Please see the schedule of our non-GAAP information in the Appendix to this presentation for a reconciliation of our non-GAAP measures to the most directly comparable GAAP measures and for other important disclosures. There were no non-GAAP adjustments in FY 2015 or FYTD 2020. 63 798 801 925 1,311 1,375 1,052 598 846 FY 2015 FY 2016 FY 2017 FY 2018 FY 2019 FY 2020 FYTD 2020 FYTD 2021 Consolidated Pre-Tax Income ($ millions) 5.7% 5-YR CAGR 41.5% CHANGE Y/Y 41.8% CHANGE Y/Y

64 Long-term growth: Pre-Tax Margin 15.3% 14.8% 14.5% 18.0% 17.8% 13.2% 18.4% 15.9% 17.6% 18.1% 18.2% 13.8% 18.5% FY 2015 FY 2016 FY 2017 FY 2018 FY 2019 FY 2020 FYTD 2021 Pre-Tax Margin* Adjusted Pre-Tax Margin** Note: FYTD 2021 as of March 31, 2021. *Based on net revenues. **This is a non-GAAP financial measure. Please see the schedule of our non-GAAP information in the Appendix to this presentation for a reconciliation of our non-GAAP measures to the most directly comparable GAAP measures and for other important disclosures. There were no non-GAAP adjustments in FY 2015.

$3.43 $6.11 $3.09 $4.76 FY 2015 FY 2020 FYTD 2020 FYTD 2021 65 Long-term growth: Earnings per Share $3.43 $5.83 $3.09 $4.74 FY 2015 FY 2020 FYTD 2020 FYTD 2021 Note: 5-Year CAGR for period FY 2015 – 2020. FYTD 2020 as of March 31, 2020. FYTD 2021 as of March 31, 2021. Charts not to scale. *Adjusted Earnings per Diluted Share is a non-GAAP financial measure. See the schedule in the Appendix of this presentation for a reconciliation of our non-GAAP measures to the most directly comparable GAAP measures and for more information on these measures. There were no non-GAAP adjustments in FY 2015 or FYTD 2020. 11.2% 5-YR CAGR Earnings per Diluted Share Adjusted Earnings per Diluted Share* 53.4% Y/Y CHANGE 54.0% Y/Y CHANGE 12.2% 5-YR CAGR

11.5% 11.3% 12.2% 14.4% 16.2% 11.9% 18.1% 12.1% 14.5% 16.0% 16.7% 12.5% 18.2% FY 2015 FY 2016 FY 2017 FY 2018 FY 2019 FY 2020 FYTD 2021 Return on Equity Adjusted Return on Equity** Long-term growth: Return on Equity *Six months ended March 31, 2021, annualized. **This is a non-GAAP financial measure. Please see the schedule of our non-GAAP information in the Appendix to this presentation for a reconciliation of our non-GAAP measures to the most directly comparable GAAP measures and for other important disclosures. There were no non-GAAP adjustments in FY 2015. Annualized* 66
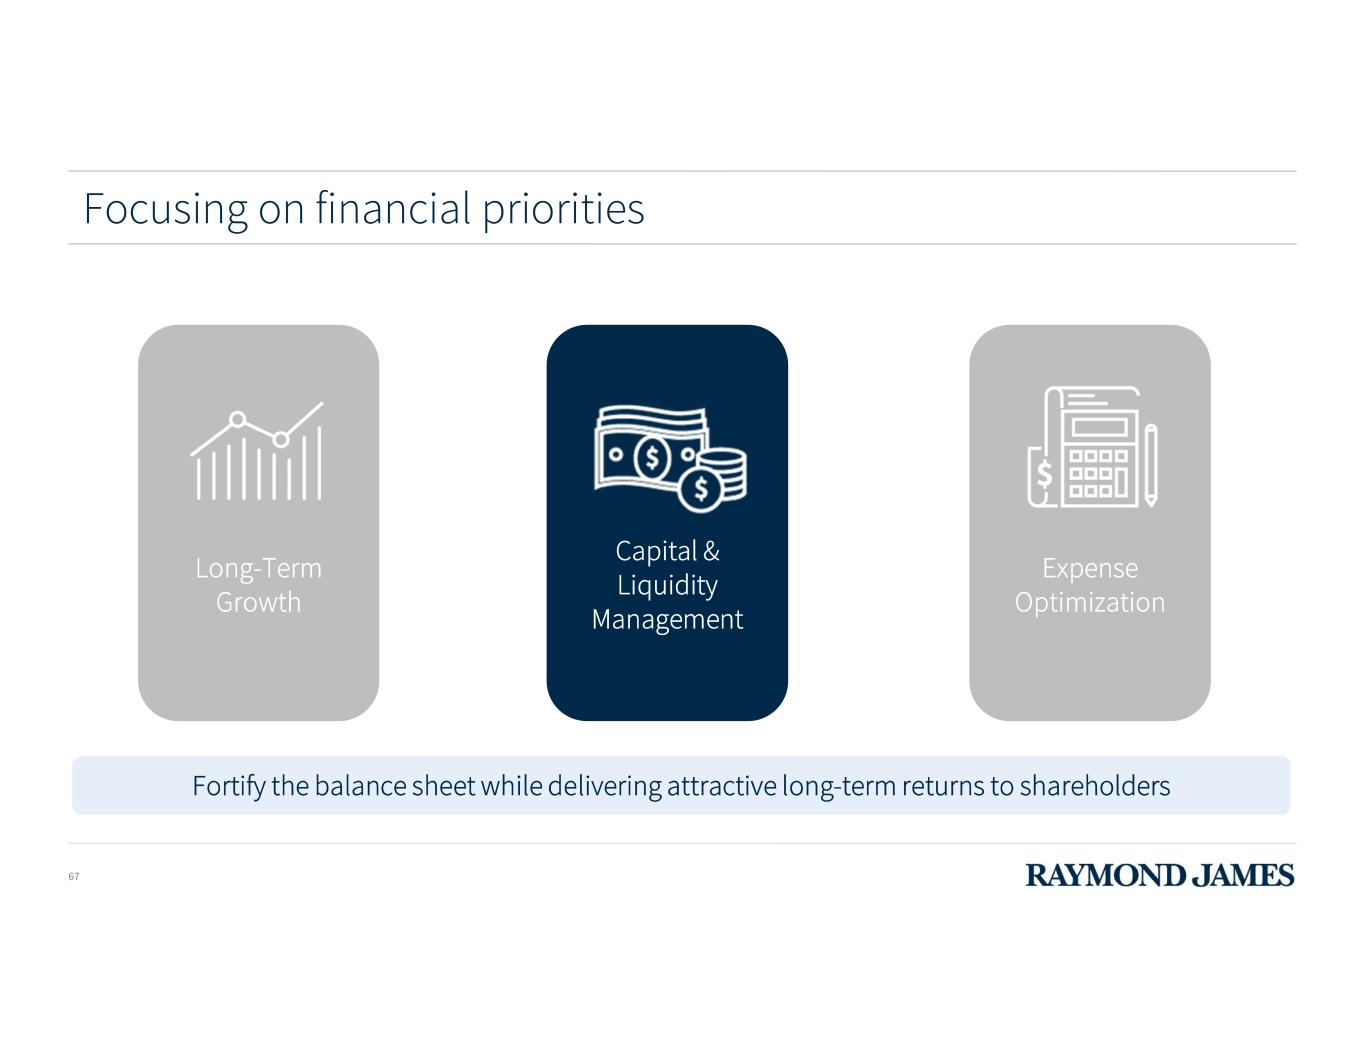
Focusing on financial priorities Long-Term Growth Fortify the balance sheet while delivering attractive long-term returns to shareholders Expense Optimization 67 Capital & Liquidity Management
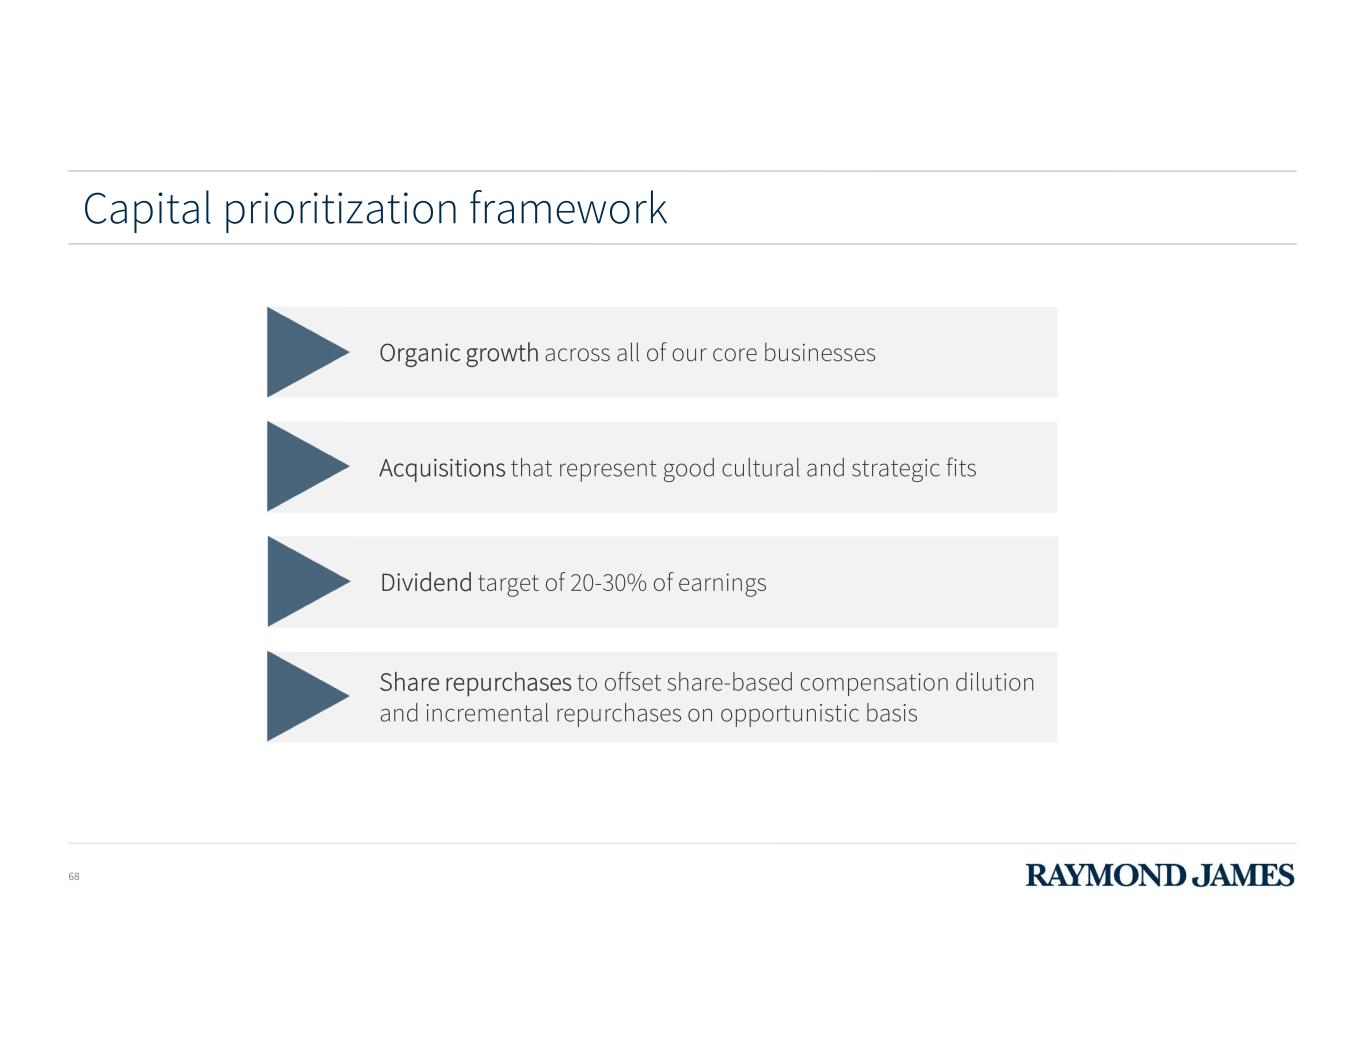
Capital prioritization framework 68 Organic growth across all of our core businesses Acquisitions that represent good cultural and strategic fits Dividend target of 20-30% of earnings Share repurchases to offset share-based compensation dilution and incremental repurchases on opportunistic basis

Balance sheet highlights $ in millions, except per share amounts 2Q21 Total assets $ 56,066 RJF corporate cash* $ 1,701 Total equity attributable to RJF $ 7,592 Book value per share $ 55.34 Tangible book value per share** $ 49.42 Weighted-average common and common equivalent shares outstanding – diluted 141.2 Tier 1 capital ratio 23.6% Total capital ratio 24.7% Tier 1 leverage ratio 12.2% Note: As of March 31, 2021. *This amount includes cash on hand at the parent, as well as parent cash loaned to Raymond James & Associates ("RJ&A"), which RJ&A has invested on behalf of RJF in cash and cash equivalents or otherwise deployed in its normal business activities. **This is a non-GAAP measure. See the schedule in the Appendix of this presentation for a reconciliation of our non-GAAP measures to the most directly comparable GAAP measures and for more information on these measures. ***To be well capitalized. 69 Regulatory Requirements*** 8% 10% 5%
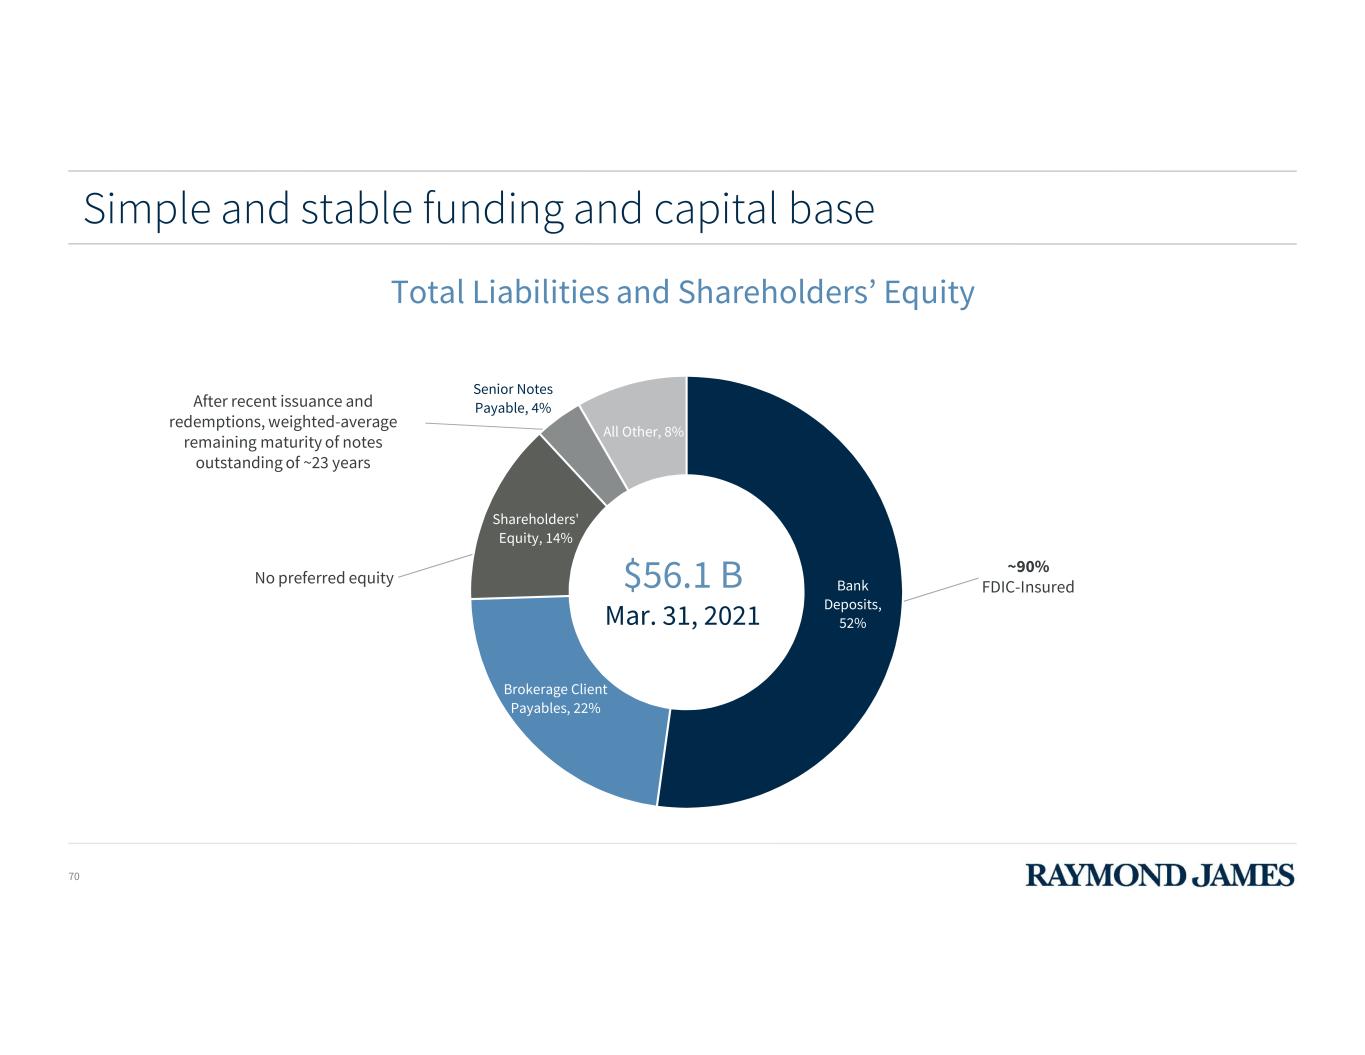
Bank Deposits, 52% Brokerage Client Payables, 22% Shareholders' Equity, 14% Senior Notes Payable, 4% All Other, 8% Simple and stable funding and capital base ~90% FDIC-InsuredNo preferred equity After recent issuance and redemptions, weighted-average remaining maturity of notes outstanding of ~23 years Total Liabilities and Shareholders’ Equity 70 $56.1 B Mar. 31, 2021

71 Multiple sources of liquidity • $500 million* committed, unsecured corporate revolver (syndicate of 8 banks; February 2026 maturity) • $100 million committed, secured line • Over $2 billion uncommitted, secured repos / lines of inventory financing availability (well-diversified across many institutions) RJ Bank • $850 million of Federal Home Loan Bank (FHLB) Advances outstanding (secured with residential mortgages; ~$3.1 billion of additional immediate availability and, with pledge of additional collateral, total available credit of 30% of total assets) • Ability to borrow from the Federal Reserve Bank (FRB) (secured by pledged C&I loans) RJF • $500 million* committed, unsecured corporate revolver (syndicate of 8 banks; February 2026 maturity) • $50 million uncommitted, unsecured line of credit • $789 million of Corporate Owned Life Insurance (COLI) borrowings available RJ&A Summary of Borrowing Sources Note: As of March 31, 2021. For additional details on these financing arrangements, see Management’s Discussion and Analysis of Financial Condition and Results of Operations – Liquidity and Capital Resources – Borrowings and Financing Arrangements in the latest Form 10-Q. *This facility provides for maximum borrowings of up to $500 million, with a sublimit of $300 million for RJF. RJ&A may borrow up to $500 million under the Credit Facility, depending on the amount of outstanding borrowings by RJF.

Strong capital ratios 5% 10% 15% 20% 25% 30% 4% 5% 6% 7% 8% 9% 10% 11% 12% 13% To ta l C ap it al R at io * Tier 1 Leverage Ratio** Peer 2 Peer 3 Peer 4 Peer 5 Peer 6 RJF Peer 1 Note: Sourced from publicly available information as of March 31, 2021. *Total Capital Ratio is equal to Total Capital divided by risk weighted assets (as defined by regulations). **Tier 1 Leverage Ratio is equal to Tier 1 Capital divided by average assets (as defined by regulations). Regulatory Requirements to be Well Capitalized 72 R JF T ar ge t
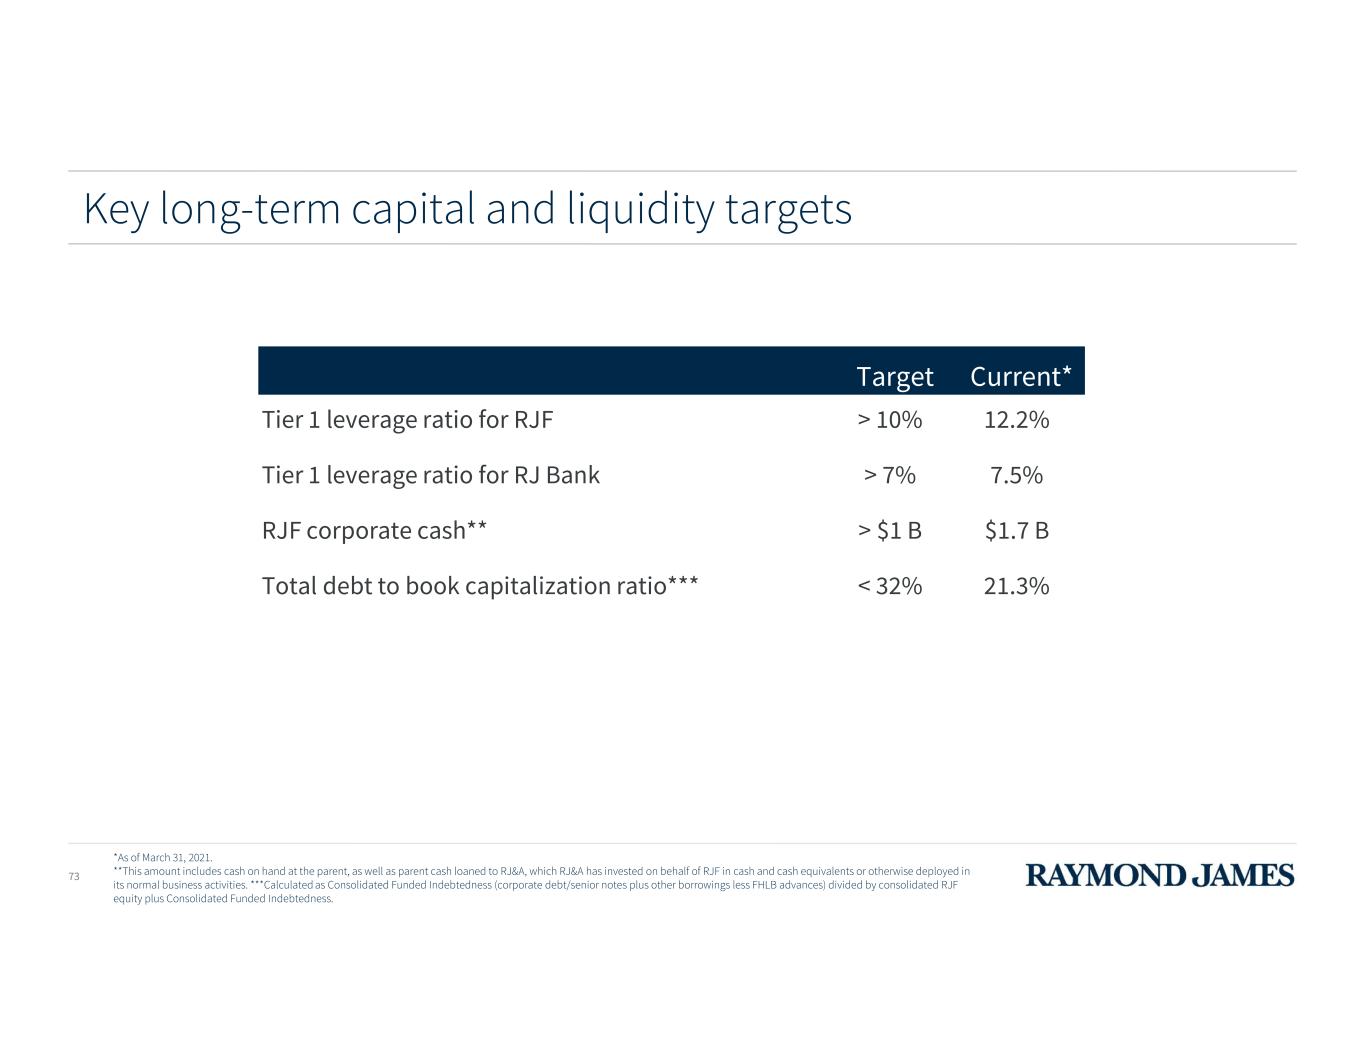
Key long-term capital and liquidity targets Target Current* Tier 1 leverage ratio for RJF > 10% 12.2% Tier 1 leverage ratio for RJ Bank > 7% 7.5% RJF corporate cash** > $1 B $1.7 B Total debt to book capitalization ratio*** < 32% 21.3% *As of March 31, 2021. **This amount includes cash on hand at the parent, as well as parent cash loaned to RJ&A, which RJ&A has invested on behalf of RJF in cash and cash equivalents or otherwise deployed in its normal business activities. ***Calculated as Consolidated Funded Indebtedness (corporate debt/senior notes plus other borrowings less FHLB advances) divided by consolidated RJF equity plus Consolidated Funded Indebtedness. 73

Tier 1 leverage ratio sensitivity Tier 1 Regulatory Capital ($B) 6.79 6.54 6.29 6.04 5.79 5.54 A ve ra ge A ss et s ($ B ) 55.5 12.2% 11.8% 11.3% 10.9% 10.4% 10.0% 56.5 12.0% 11.6% 11.1% 10.7% 10.2% 9.8% 57.5 11.8% 11.4% 10.9% 10.5% 10.1% 9.6% 58.5 11.6% 11.2% 10.8% 10.3% 9.9% 9.5% 59.5 11.4% 11.0% 10.6% 10.2% 9.7% 9.3% 60.5 11.2% 10.8% 10.4% 10.0% 9.6% 9.2% 61.5 11.0% 10.6% 10.2% 9.8% 9.4% 9.0% 62.5 10.9% 10.5% 10.1% 9.7% 9.3% 8.9% 63.5 10.7% 10.3% 9.9% 9.5% 9.1% 8.7% 64.5 10.5% 10.1% 9.8% 9.4% 9.0% 8.6% 65.5 10.4% 10.0% 9.6% 9.2% 8.8% 8.5% 66.5 10.2% 9.8% 9.5% 9.1% 8.7% 8.3% 67.5 10.1% 9.7% 9.3% 8.9% 8.6% 8.2% Current* Levers: • Loan growth • Growth of agency-backed securities portfolio • Acquisitions (if target has meaningful balance sheet assets) Levers: • Acquisitions (intangible assets) • Dividends • Share Repurchases 74 *As of March 31, 2021.
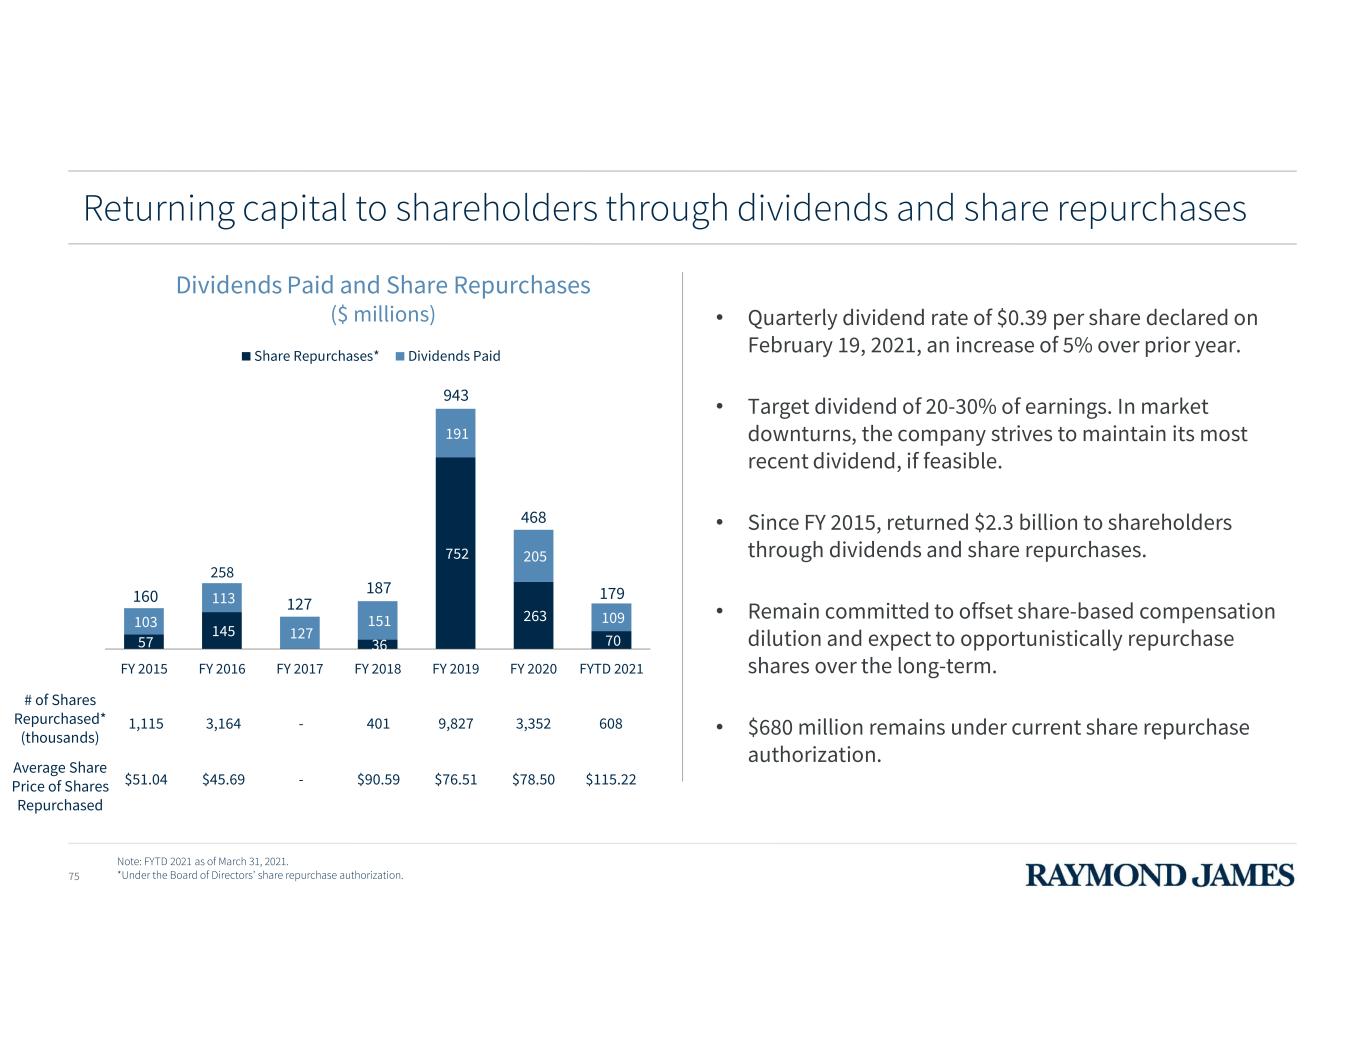
Returning capital to shareholders through dividends and share repurchases 57 145 36 752 263 70 103 113 127 151 191 205 109 FY 2015 FY 2016 FY 2017 FY 2018 FY 2019 FY 2020 FYTD 2021 Share Repurchases* Dividends Paid 1,115 3,164 - 401 9,827 3,352 608 $51.04 $45.69 - $90.59 $76.51 $78.50 $115.22 # of Shares Repurchased* (thousands) Average Share Price of Shares Repurchased Note: FYTD 2021 as of March 31, 2021. *Under the Board of Directors’ share repurchase authorization. 160 258 127 187 943 468 179 Dividends Paid and Share Repurchases ($ millions) • Quarterly dividend rate of $0.39 per share declared on February 19, 2021, an increase of 5% over prior year. • Target dividend of 20-30% of earnings. In market downturns, the company strives to maintain its most recent dividend, if feasible. • Since FY 2015, returned $2.3 billion to shareholders through dividends and share repurchases. • Remain committed to offset share-based compensation dilution and expect to opportunistically repurchase shares over the long-term. • $680 million remains under current share repurchase authorization. 75
Focusing on financial priorities Long-Term Growth Fortify the balance sheet while delivering attractive long-term returns to shareholders Expense Optimization 76 Capital & Liquidity Management
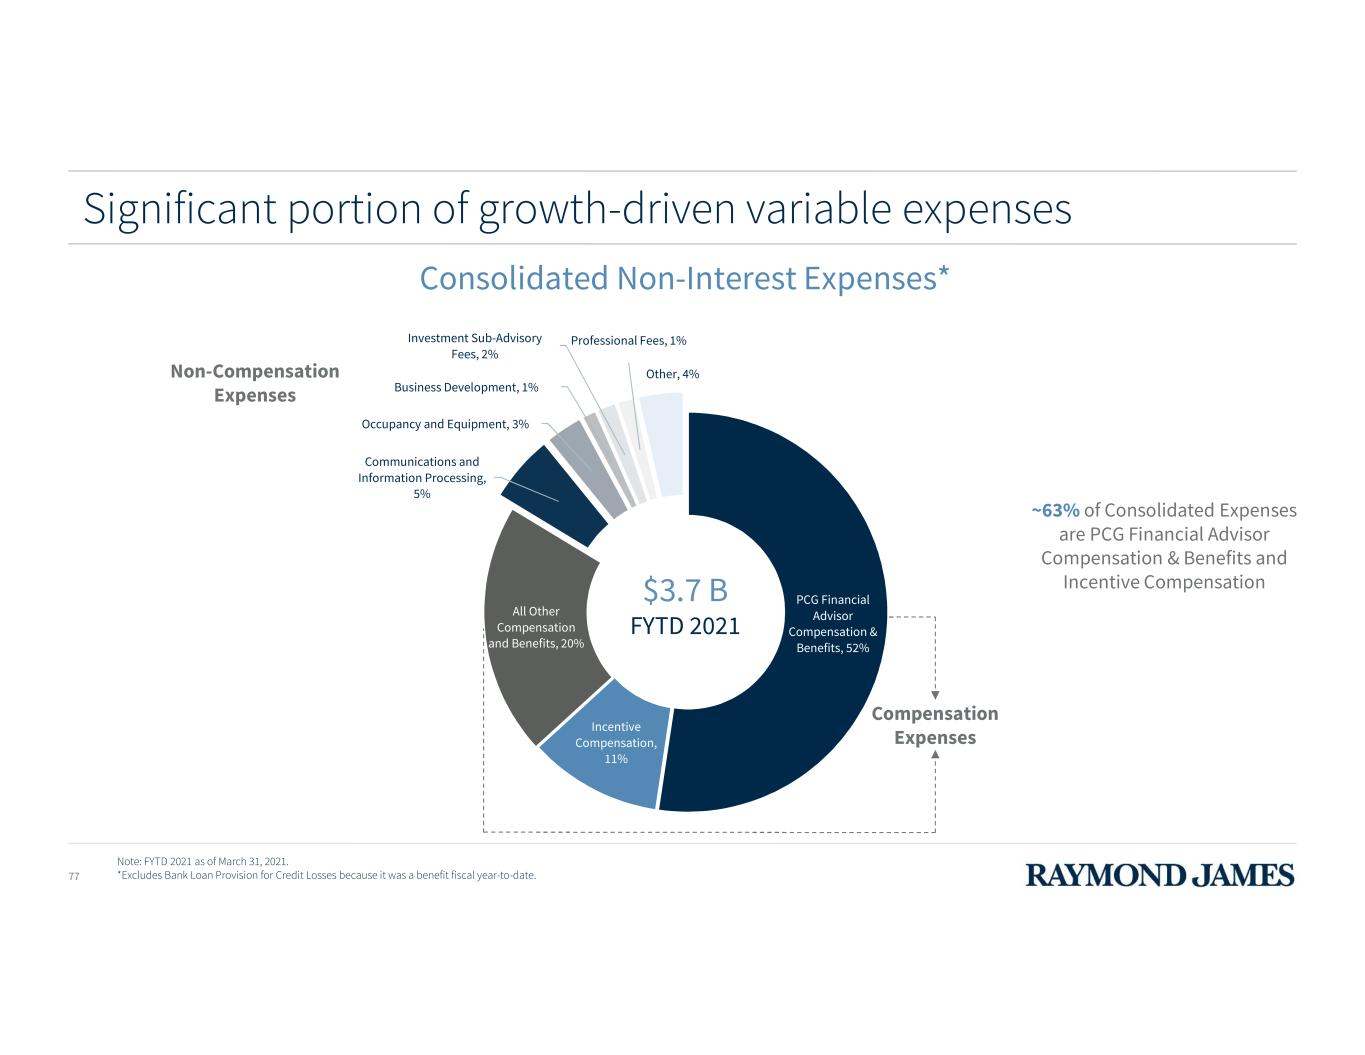
77 Consolidated Non-Interest Expenses* Significant portion of growth-driven variable expenses PCG Financial Advisor Compensation & Benefits, 52% Incentive Compensation, 11% All Other Compensation and Benefits, 20% Communications and Information Processing, 5% Occupancy and Equipment, 3% Business Development, 1% Investment Sub-Advisory Fees, 2% Professional Fees, 1% Other, 4%Non-Compensation Expenses Compensation Expenses Note: FYTD 2021 as of March 31, 2021. *Excludes Bank Loan Provision for Credit Losses because it was a benefit fiscal year-to-date. $3.7 B FYTD 2021 ~63% of Consolidated Expenses are PCG Financial Advisor Compensation & Benefits and Incentive Compensation
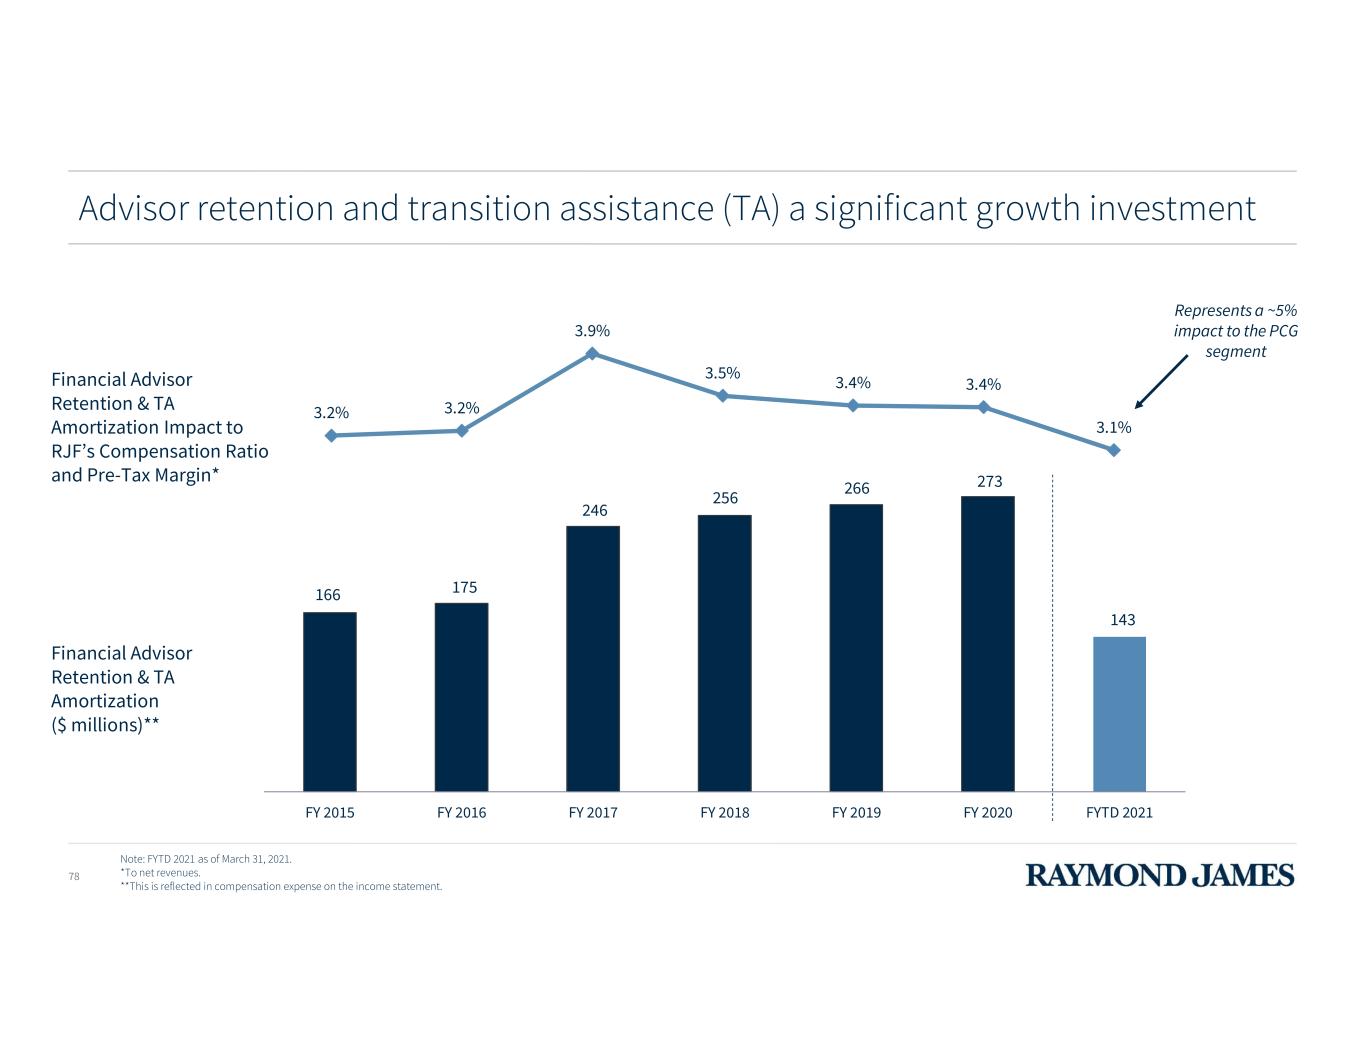
78 Advisor retention and transition assistance (TA) a significant growth investment 3.2% 3.2% 3.9% 3.5% 3.4% 3.4% 3.1% 166 175 246 256 266 273 143 FY 2015 FY 2016 FY 2017 FY 2018 FY 2019 FY 2020 FYTD 2021 Financial Advisor Retention & TA Amortization Impact to RJF’s Compensation Ratio and Pre-Tax Margin* Represents a ~5% impact to the PCG segment Note: FYTD 2021 as of March 31, 2021. *To net revenues. **This is reflected in compensation expense on the income statement. Financial Advisor Retention & TA Amortization ($ millions)**

79 Financial targets < 70% Pre-Tax Margin* Compensation Ratio* Return on Equity Note: These targets are operating targets that exclude any potential non-GAAP items. Achieving these targets could be impacted by various factors. The firm targets above are based on current market / interest rate / tax environment. *On net revenues. **This is a non-GAAP measure. See the schedule in the Appendix of this presentation for a reconciliation of our non-GAAP measures to the most directly comparable GAAP measures and for more information on these measures. 15% - 16%+ 14% - 15%+ Return on Tangible Common Equity** 16% - 17%+

Domestic cash sweep balances Clients’ Domestic Cash Sweep Balances and Corresponding Assets (March 31, 2021; $ billions) Brokerage Client Cash / Client Interest Program ($9.5) Raymond James Bank Deposit Program (RJBDP) ($53.3) Client Margin Loans & Segregated Assets ($9.53) Raymond James Bank’s Earning Assets ($~281) Third-Party Banks ($~25) Clients’ Domestic Cash Sweep Balances ($62.8) Corresponding Assets • Net Interest Income to PCG Segment • Net Interest Income to Raymond James Bank • Account and Service Fees to PCG Segment2 • Account and Service Fees Mainly to PCG Segment Note: The diagram does not contain all of the firm’s interest bearing assets and liabilities. Instead, the diagram is intended to only illustrate those interest bearing assets and liabilities that are related to clients’ domestic cash sweep balances. The numbers on this page are directional and may not tie perfectly to other financial reports. The numbers may not tie due to rounding. 1. Assets for RJ Bank were $33 billion; the ~$28 billion represents the estimated amount funded with client cash sweep balances (the other portion funded with capital, other borrowings, and other cash balances). 2. These Account and Service Fees from RJ Bank to PCG are eliminated in the consolidated financial statements. 3. Client Margin Loans and Segregated Assets of $9.5 billion reflect portion attributable to corresponding cash balances, the actual amount of these balances is larger and includes other items. 80

Interest rate sensitivity: upside from increase in short-term interest rates Projected Incremental Net Interest Income and RJBDP Fees from Third-Party Banks from 100 Basis Point Instantaneous Increase in Short-Term Interest Rates* ($ millions) *Reflects instantaneous static balance scenario using balance sheet as of March 31, 2021. Assumes average deposit beta of 10-15% for first 100 basis point increase, in line with historical experience from 2015 to 2018.81 Incremental Net Interest Income Total Incremental Benefit 467 244 Incremental RJBDP Fees from Third- Party Banks 223
2021 ANALYST & INVESTOR DAY Q & A Paul Shoukry Chief Financial Officer, Raymond James Financial

2021 ANALYST & INVESTOR DAY Appendix

2021 ANALYST & INVESTOR DAY Presenter Biographies

Paul Reilly Paul Reilly became chief executive officer of Raymond James Financial in May 2010, after joining the firm’s management team as president and CEO-designate in May 2009. He has served on the firm’s board of directors since 2006. From July 2007 to April 2009, he was executive chairman of Korn/Ferry International, a global provider of talent management solutions with more than 90 offices in 39 countries throughout North America, Latin America, Europe, the Middle East, Africa and Asia Pacific. Mr. Reilly began his tenure with the company as chairman and CEO in 2001. Prior to Korn/Ferry, he was CEO at KPMG International, a firm of more than 100,000 employees with annual revenues of $12 billion. Based in Amsterdam, he was responsible for the overall strategy and implementation of the firm's products, services and infrastructure on a global basis. Before being named CEO at KPMG, he ran the firm's financial services business and earlier had held senior management positions in its real estate consulting group. Mr. Reilly holds his Bachelor of Science degree and MBA from the University of Notre Dame and remains active with the school, serving on the Mendoza Graduate Alumni Board and the Business Advisory Council, and being recognized as a recipient of the Distinguished Alumnus Award in 2004-2005. In addition to his degrees, he earned the Certified Public Accountant designation. He is a financial services industry leader, serving on the board of the Financial Services Roundtable and as an executive committee member of SIFMA, and also is active in charitable causes, including involvement with the National Leadership Roundtable on Church Management, Our Lady of Divine Providence House of Prayer in Clearwater, Florida, the United Way Suncoast, and the American Heart Association’s Tampa Bay Heart Walk. Chairman & Chief Executive Officer, Raymond James Financial 85 Presenter biographies

Scott Curtis Scott Curtis is president of Raymond James’ Private Client Group, leading the firm’s domestic wealth management businesses that include more than 8,000 employee and independent financial advisors and generate approximately 70% of overall firm revenues. Prior to his current role, he served as president of Raymond James Financial Services, directing the firm’s independent advisor business. From 2006 to 2012, Mr. Curtis was senior vice president of the Raymond James & Associates Private Client Group where he was responsible for leading multiple initiatives focused on revenue growth, efficiency enhancements, product development, risk mitigation and service improvement. He joined Raymond James in February 2003 as president of Raymond James Insurance Group, having spent the prior 13 years of his career with GE Financial Assurance in a variety of senior leadership roles, including as national sales director for packaged investment products and as president of the firm’s retail broker/dealer. Mr. Curtis earned his MBA from the Ross School of Business at the University of Michigan and received a bachelor’s degree in economics and English from Denison University. He is a member of the Raymond James Financial Executive Committee and serves on the board of Raymond James Bank and Raymond James Ltd., the firm’s Canadian subsidiary. Mr. Curtis is also a member of the FINRA Membership Committee and serves on the board of The Financial Services Institute, the Chi Chi Rodriguez Youth Foundation, and the United Way Suncoast. President, Private Client Group 86 Presenter biographies

Jim Bunn Jim Bunn is the president of Global Equities & Investment Banking and head of Investment Banking for Raymond James. Prior to his current role, Mr. Bunn served as the head of Investment Banking. From 2009 to 2013, Mr. Bunn was a Managing Director and Co-Head of Technology Services group for Raymond James. He has more than 17 years of investment banking experience working with software, transaction processing and technology-enabled outsourcing companies. Prior to joining Raymond James, Mr. Bunn was head of the financial technology investment banking practice for Lane, Berry & Co., a leading middle market advisory firm that was acquired by Raymond James in 2009. Prior to Lane Berry, Mr. Bunn was with Citigroup Global Markets in the electronic financial services group focusing exclusively on the financial technology, payment and transaction processing industries. Mr. Bunn has completed more than 75 transactions over the course of his career. He received both his undergraduate degree and his MBA from the University of Michigan. President, Global Equities & Investment Banking 87 Presenter biographies
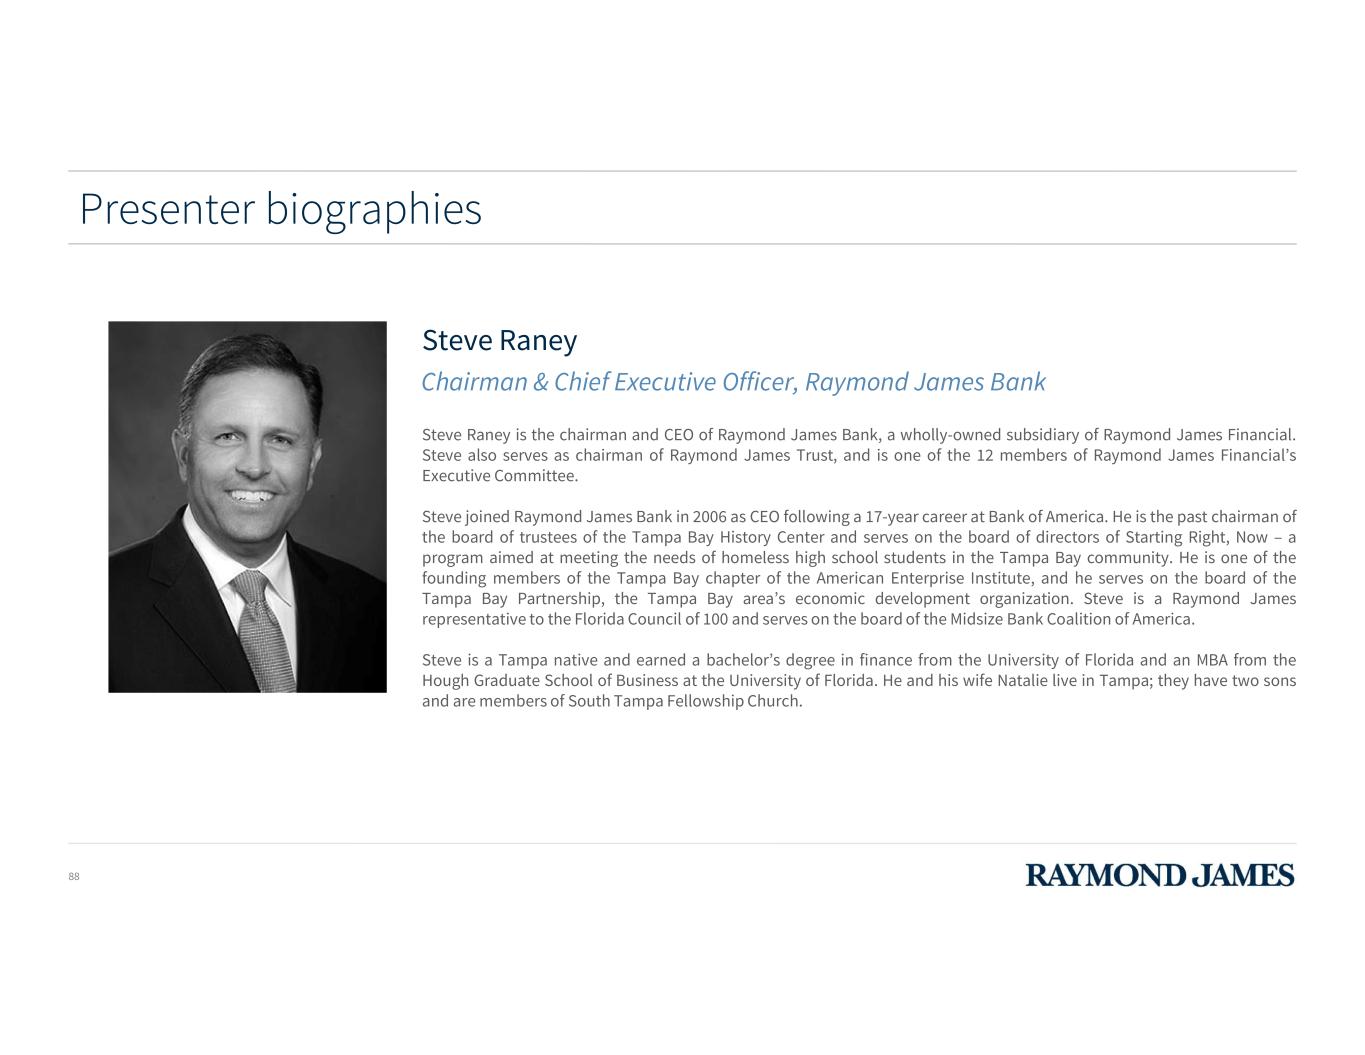
Steve Raney Steve Raney is the chairman and CEO of Raymond James Bank, a wholly-owned subsidiary of Raymond James Financial. Steve also serves as chairman of Raymond James Trust, and is one of the 12 members of Raymond James Financial’s Executive Committee. Steve joined Raymond James Bank in 2006 as CEO following a 17-year career at Bank of America. He is the past chairman of the board of trustees of the Tampa Bay History Center and serves on the board of directors of Starting Right, Now ‒ a program aimed at meeting the needs of homeless high school students in the Tampa Bay community. He is one of the founding members of the Tampa Bay chapter of the American Enterprise Institute, and he serves on the board of the Tampa Bay Partnership, the Tampa Bay area’s economic development organization. Steve is a Raymond James representative to the Florida Council of 100 and serves on the board of the Midsize Bank Coalition of America. Steve is a Tampa native and earned a bachelor’s degree in finance from the University of Florida and an MBA from the Hough Graduate School of Business at the University of Florida. He and his wife Natalie live in Tampa; they have two sons and are members of South Tampa Fellowship Church. Chairman & Chief Executive Officer, Raymond James Bank 88 Presenter biographies

Paul Shoukry Paul Shoukry is chief financial officer and treasurer of Raymond James Financial, Inc. (NYSE: RJF). He is responsible for the overall financial management of the company, including balance sheet management, financial reporting, investor relations, corporate tax, cash management, regulatory reporting and financial planning and analysis. He is a member of the firm’s Executive Committee. Mr. Shoukry joined Raymond James in 2010 to participate in the firm's Assistant to the Chairman program. He earned an MBA with honors from Columbia University. Before business school, Mr. Shoukry worked for a strategy consulting firm that focused on serving clients in the financial services industry. He started his career as a commercial banker after graduating magna cum laude with a Bachelor and Master of Accounting from The University of Georgia. Mr. Shoukry also completed the Strategic CFO Program at The Wharton School. He is a Certified Public Accountant (CPA), a Certified Treasury Professional, and a Series 7 and 27 holder. Mr. Shoukry enjoys spending time with his wife and three children. He is passionate about childhood education and serves on the advisory board of Step Up for Students. He is the executive sponsor for the firm's multicultural network. Chief Financial Officer, Raymond James Financial 89 Presenter biographies

90 Paul Reilly Chairman & CEO Raymond James Financial Bella Loykhter Allaire EVP, Technology & Operations Raymond James & Associates Paul Allison Chairman & CEO Raymond James Limited Steve Raney Chairman & CEO Raymond James Bank John Carson Jr. President Raymond James Financial Jonathan Santelli EVP & General Counsel Raymond James Financial Scott Curtis President Private Client Group Jim Bunn President, Global Equities & Investment Banking Raymond James & Associates Jeff Dowdle Chief Operating Officer Raymond James Financial President Asset Management Group Tash Elwyn President & CEO Raymond James & Associates Jodi Perry President, Independent Contractors Division RJFS Paul Shoukry CFO Raymond James Financial Executive Committee
2021 ANALYST & INVESTOR DAY Non-GAAP Financial Measures
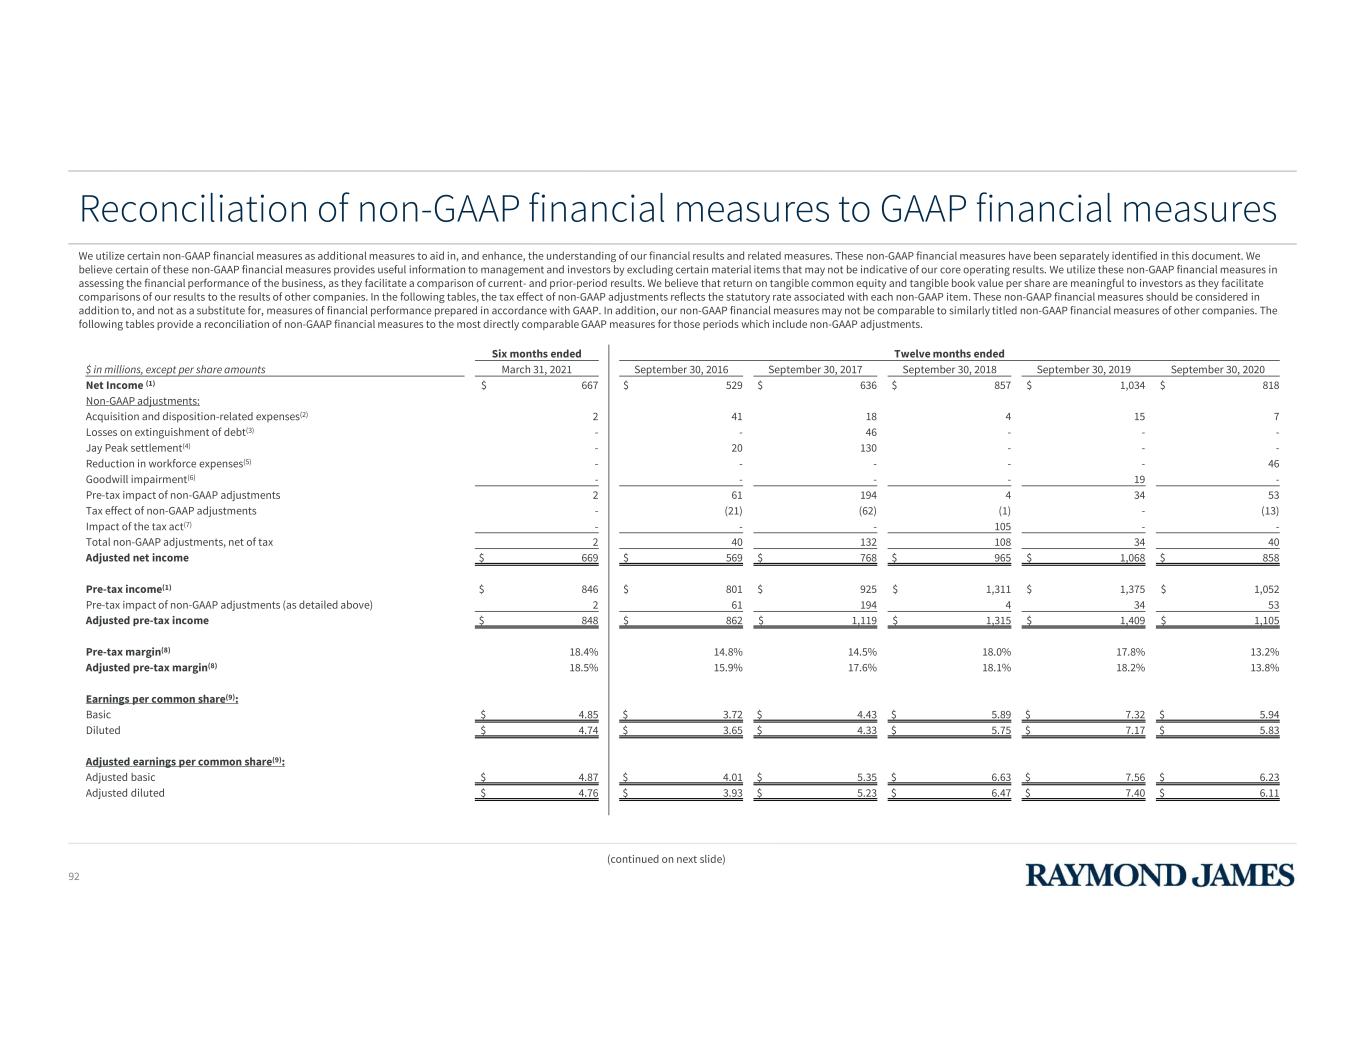
Reconciliation of non-GAAP financial measures to GAAP financial measures (continued on next slide) We utilize certain non-GAAP financial measures as additional measures to aid in, and enhance, the understanding of our financial results and related measures. These non-GAAP financial measures have been separately identified in this document. We believe certain of these non-GAAP financial measures provides useful information to management and investors by excluding certain material items that may not be indicative of our core operating results. We utilize these non-GAAP financial measures in assessing the financial performance of the business, as they facilitate a comparison of current- and prior-period results. We believe that return on tangible common equity and tangible book value per share are meaningful to investors as they facilitate comparisons of our results to the results of other companies. In the following tables, the tax effect of non-GAAP adjustments reflects the statutory rate associated with each non-GAAP item. These non-GAAP financial measures should be considered in addition to, and not as a substitute for, measures of financial performance prepared in accordance with GAAP. In addition, our non-GAAP financial measures may not be comparable to similarly titled non-GAAP financial measures of other companies. The following tables provide a reconciliation of non-GAAP financial measures to the most directly comparable GAAP measures for those periods which include non-GAAP adjustments. Six months ended Twelve months ended $ in millions, except per share amounts March 31, 2021 September 30, 2016 September 30, 2017 September 30, 2018 September 30, 2019 September 30, 2020 Net Income (1) $ 667 $ 529 $ 636 $ 857 $ 1,034 $ 818 Non-GAAP adjustments: Acquisition and disposition-related expenses(2) 2 41 18 4 15 7 Losses on extinguishment of debt(3) - - 46 - - - Jay Peak settlement(4) - 20 130 - - - Reduction in workforce expenses(5) - - - - - 46 Goodwill impairment(6) - - - - 19 - Pre-tax impact of non-GAAP adjustments 2 61 194 4 34 53 Tax effect of non-GAAP adjustments - (21) (62) (1) - (13) Impact of the tax act(7) - - - 105 - - Total non-GAAP adjustments, net of tax 2 40 132 108 34 40 Adjusted net income $ 669 $ 569 $ 768 $ 965 $ 1,068 $ 858 Pre-tax income(1) $ 846 $ 801 $ 925 $ 1,311 $ 1,375 $ 1,052 Pre-tax impact of non-GAAP adjustments (as detailed above) 2 61 194 4 34 53 Adjusted pre-tax income $ 848 $ 862 $ 1,119 $ 1,315 $ 1,409 $ 1,105 Pre-tax margin(8) 18.4% 14.8% 14.5% 18.0% 17.8% 13.2% Adjusted pre-tax margin(8) 18.5% 15.9% 17.6% 18.1% 18.2% 13.8% Earnings per common share(9): Basic $ 4.85 $ 3.72 $ 4.43 $ 5.89 $ 7.32 $ 5.94 Diluted $ 4.74 $ 3.65 $ 4.33 $ 5.75 $ 7.17 $ 5.83 Adjusted earnings per common share(9): Adjusted basic $ 4.87 $ 4.01 $ 5.35 $ 6.63 $ 7.56 $ 6.23 Adjusted diluted $ 4.76 $ 3.93 $ 5.23 $ 6.47 $ 7.40 $ 6.11 92

Book value per share As of $ in millions, except per share amounts March 31, 2021 Total equity attributable to Raymond James Financial, Inc. $ 7,592 Less non-GAAP adjustments: Goodwill and identifiable intangible assets, net 868 Deferred tax liabilities, net (56) Tangible common equity attributable to Raymond James Financial, Inc. $ 6,780 Common shares outstanding 137.2 Book value per share(12) $ 55.34 Tangible book value per share(12) $ 49.42 (continued on next slide) Six months ended Twelve months ended $ in millions, except per share amounts March 31, 2021 September 30, 2016 September 30, 2017 September 30, 2018 September 30, 2019 September 30, 2020 Weighted average common shares outstanding - basic 137.3 141.8 143.3 145.3 141.0 137.6 Weighted average common shares outstanding - diluted 140.4 144.5 146.6 148.8 144.0 140.2 Average equity(10) 7,356 4,696 5,235 5,949 6,392 6,860 Adjusted average equity(10) 7,357 4,708 5,310 6,043 6,408 6,868 Return on equity(11) 18.1% 11.3% 12.2% 14.4% 16.2% 11.9% Adjusted return on equity(11) 18.2% 12.1% 14.5% 16.0% 16.7% 12.5% 93 Reconciliation of non-GAAP financial measures to GAAP financial measures
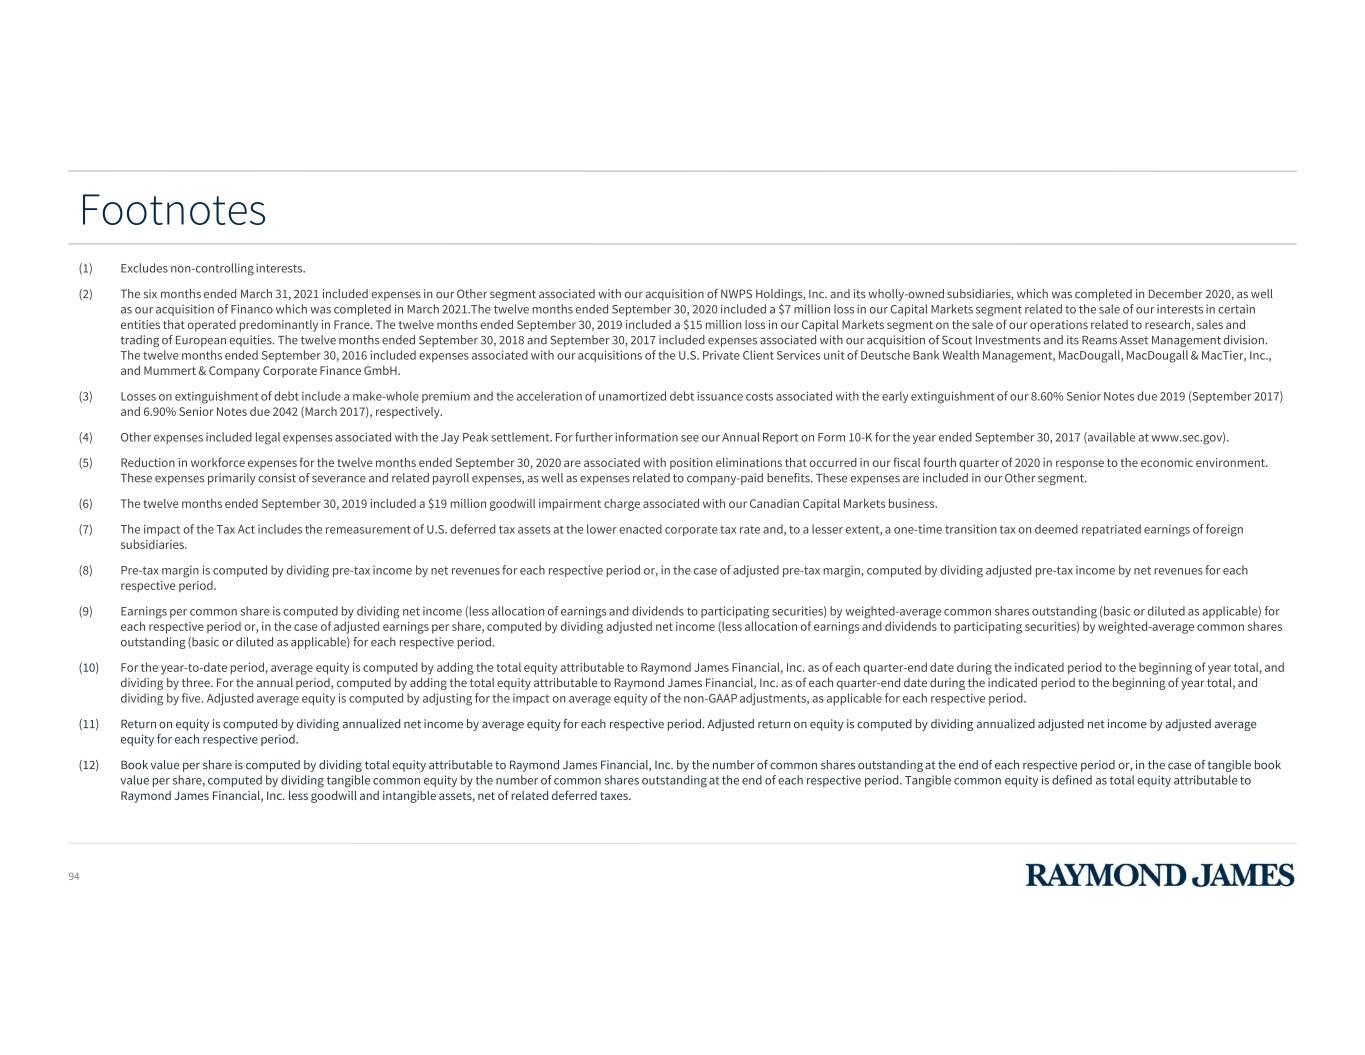
(1) Excludes non-controlling interests. (2) The six months ended March 31, 2021 included expenses in our Other segment associated with our acquisition of NWPS Holdings, Inc. and its wholly-owned subsidiaries, which was completed in December 2020, as well as our acquisition of Financo which was completed in March 2021.The twelve months ended September 30, 2020 included a $7 million loss in our Capital Markets segment related to the sale of our interests in certain entities that operated predominantly in France. The twelve months ended September 30, 2019 included a $15 million loss in our Capital Markets segment on the sale of our operations related to research, sales and trading of European equities. The twelve months ended September 30, 2018 and September 30, 2017 included expenses associated with our acquisition of Scout Investments and its Reams Asset Management division. The twelve months ended September 30, 2016 included expenses associated with our acquisitions of the U.S. Private Client Services unit of Deutsche Bank Wealth Management, MacDougall, MacDougall & MacTier, Inc., and Mummert & Company Corporate Finance GmbH. (3) Losses on extinguishment of debt include a make-whole premium and the acceleration of unamortized debt issuance costs associated with the early extinguishment of our 8.60% Senior Notes due 2019 (September 2017) and 6.90% Senior Notes due 2042 (March 2017), respectively. (4) Other expenses included legal expenses associated with the Jay Peak settlement. For further information see our Annual Report on Form 10-K for the year ended September 30, 2017 (available at www.sec.gov). (5) Reduction in workforce expenses for the twelve months ended September 30, 2020 are associated with position eliminations that occurred in our fiscal fourth quarter of 2020 in response to the economic environment. These expenses primarily consist of severance and related payroll expenses, as well as expenses related to company-paid benefits. These expenses are included in our Other segment. (6) The twelve months ended September 30, 2019 included a $19 million goodwill impairment charge associated with our Canadian Capital Markets business. (7) The impact of the Tax Act includes the remeasurement of U.S. deferred tax assets at the lower enacted corporate tax rate and, to a lesser extent, a one-time transition tax on deemed repatriated earnings of foreign subsidiaries. (8) Pre-tax margin is computed by dividing pre-tax income by net revenues for each respective period or, in the case of adjusted pre-tax margin, computed by dividing adjusted pre-tax income by net revenues for each respective period. (9) Earnings per common share is computed by dividing net income (less allocation of earnings and dividends to participating securities) by weighted-average common shares outstanding (basic or diluted as applicable) for each respective period or, in the case of adjusted earnings per share, computed by dividing adjusted net income (less allocation of earnings and dividends to participating securities) by weighted-average common shares outstanding (basic or diluted as applicable) for each respective period. (10) For the year-to-date period, average equity is computed by adding the total equity attributable to Raymond James Financial, Inc. as of each quarter-end date during the indicated period to the beginning of year total, and dividing by three. For the annual period, computed by adding the total equity attributable to Raymond James Financial, Inc. as of each quarter-end date during the indicated period to the beginning of year total, and dividing by five. Adjusted average equity is computed by adjusting for the impact on average equity of the non-GAAP adjustments, as applicable for each respective period. (11) Return on equity is computed by dividing annualized net income by average equity for each respective period. Adjusted return on equity is computed by dividing annualized adjusted net income by adjusted average equity for each respective period. (12) Book value per share is computed by dividing total equity attributable to Raymond James Financial, Inc. by the number of common shares outstanding at the end of each respective period or, in the case of tangible book value per share, computed by dividing tangible common equity by the number of common shares outstanding at the end of each respective period. Tangible common equity is defined as total equity attributable to Raymond James Financial, Inc. less goodwill and intangible assets, net of related deferred taxes. Footnotes 94


