UNITED STATES
SECURITIES AND EXCHANGE COMMISSION
Washington, D.C. 20549
FORM N-CSR
CERTIFIED SHAREHOLDER REPORT OF REGISTERED MANAGEMENT
INVESTMENT COMPANIES
| |
| Investment Company Act file number | 811- 3757 |
DREYFUS PREMIER CALIFORNIA AMT-FREE MUNICIPAL BOND FUND, INC.
- Dreyfus California AMT-Free Municipal Bond Fund
(Exact name of Registrant as specified in charter)
c/o The Dreyfus Corporation
200 Park Avenue
New York, New York 10166
(Address of principal executive offices) (Zip code)
Michael A. Rosenberg, Esq.
200 Park Avenue
New York, New York 10166
(Name and address of agent for service)
| |
| Registrant's telephone number, including area code: | (212) 922-6000 |
| |
| Date of fiscal year end: | 5/31 |
| Date of reporting period: | 5/31/10 |
FORM N-CSR
| |
| Item 1. | Reports to Stockholders. |
|
| Dreyfus |
| California AMT-Free |
| Municipal Bond Fund |
ANNUAL REPORT May 31, 2010

Save time. Save paper. View your next shareholder report online as soon as it’s available. Log into www.dreyfus.com and sign up for Dreyfus eCommunications. It’s simple and only takes a few minutes.
The views expressed in this report reflect those of the portfolio manager only through the end of the period covered and do not necessarily represent the views of Dreyfus or any other person in the Dreyfus organization. Any such views are subject to change at any time based upon market or other conditions and Dreyfus disclaims any responsibility to update such views.These views may not be relied on as investment advice and, because investment decisions for a Dreyfus fund are based on numerous factors, may not be relied on as an indication of trading intent on behalf of any Dreyfus fund.

| | Contents |
| | THE FUND |
| 2 | A Letter from the Chairman and CEO |
| 3 | Discussion of Fund Performance |
| 6 | Fund Performance |
| 8 | Understanding Your Fund’s Expenses |
| 8 | Comparing Your Fund’s Expenses With Those of Other Funds |
| 9 | Statement of Investments |
| 26 | Statement of Assets and Liabilities |
| 27 | Statement of Operations |
| 28 | Statement of Changes in Net Assets |
| 30 | Financial Highlights |
| 35 | Notes to Financial Statements |
| 45 | Report of Independent Registered Public Accounting Firm |
| 46 | Important Tax Information |
| 47 | Board Members Information |
| 50 | Officers of the Fund |
| | FOR MORE INFORMATION |
| | Back Cover |
Dreyfus
California AMT-Free
Municipal Bond Fund
The Fund

A LETTER FROM THE CHAIRMAN AND CEO
Dear Shareholder:
We are pleased to present this annual report for Dreyfus California AMT-Free Municipal Bond Fund, covering the 12-month period from June 1, 2009, through May 31, 2010.
Psychology historically has played an important role in how investors —especially individual investors — perceive the financial markets and make asset allocation decisions. Unlike the purely rational investor who, in an ideal world, would seek investments that potentially can deliver the best risk/return characteristics, the everyday investor typically has been influenced by emotions. Currently, investors’ emotions appear to be deeply divided, with a large number still seeking low risk investments (such as cash instruments), and others favoring higher risk investments (such as smaller-cap and emerging market stocks). Meanwhile, investment classes in the middle of the risk spectrum seemingly have been largely avoided.
It is important to note that investor sentiment often lags the economic cycle.That’s why we continue to stress the importance of a long-term, well balanced asset allocation strategy that can help cushion the volatility produced by the emotional swings of the financial markets. If you have not revisited your investment portfolio recently, we urge you to speak with your financial advisor about taking advantage of long-term market fundamentals rather than remaining susceptible to the effects of emotional reactions to short-term developments.
For information about how the fund performed during the reporting period, as well as general market perspectives, we provide a Discussion of Fund Performance on the pages that follow.
Thank you for your continued confidence and support.
Jonathan R. Baum
Chairman and Chief Executive Officer
The Dreyfus Corporation
June 15, 2010
2

DISCUSSION OF FUND PERFORMANCE
For the period of June 1, 2009, through May 31, 2010, as provided by Jeffrey B. Burger and James Welch, Portfolio Managers
Fund and Market Performance Overview
For the 12-month period ended May 31, 2010, Dreyfus California AMT-Free Municipal Bond Fund’s Class A,B,C,I and Z shares achieved total returns of 8.30%, 7.65%, 7.36%, 8.57% and 8.52%, respectively.1 The Barclays Capital Municipal Bond Index (the “Index”), the fund’s benchmark, achieved a total return of 8.52% for the same period.2
Municipal bonds generally continued to gain value over the reporting period amid robust demand for a limited supply of securities. The fund’s Class I and Class Z shares performed in line with its benchmark, as shortfalls stemming from the fund’s high-quality bias were balanced by the success of our security selection strategy.
On a separate note, Jeffrey B. Burger and James Welch became co-primary portfolio managers of the fund in December 2009.
The Fund’s Investment Approach
The fund seeks as high a level of current income exempt from federal and California state income taxes as is consistent with the preservation of capital. To pursue this goal, the fund normally invests substantially all of its assets in municipal bonds that provide income exempt from federal and California state personal income taxes.The fund also seeks to provide income exempt from the federal Alternative Minimum Tax. The fund will invest at least 80% of its assets in investment-grade municipal bonds or the unrated equivalent as determined by Dreyfus. The fund may invest up to 20% of its assets in municipal bonds rated below investment grade (“junk” bonds) or the unrated equivalent as determined by Dreyfus.The dollar-weighted average maturity of the fund’s portfolio normally exceeds 10 years, but the fund’s average portfolio maturity is not restricted.
We focus on identifying undervalued sectors and securities, and we minimize the use of interest rate forecasting. We select municipal
DISCUSSION OF FUND PERFORMANCE (continued)
bonds by using fundamental credit analysis to estimate the relative value and attractiveness of various sectors and securities and to exploit pricing inefficiencies in the municipal bond market.We actively trade among various sectors, such as pre-refunded, general obligation and revenue, based on their apparent relative values.
Municipal Bonds Rebounded with U.S. Economy
An improving U.S. economy bolstered confidence among consumers, businesses and investors during the reporting period. However, unemployment has remained stubbornly high, and the pace of the economic recovery so far has proved to be slower than historical averages. In addition, most states, including California, have continued to struggle with declining tax revenues and intensifying demand for services. In light of these challenges, the Federal Reserve Board left short-term interest rates unchanged throughout the reporting period in a historically low range between 0% and 0.25%.
In this environment, the national municipal bond market was influenced by improving investor sentiment. In addition, municipal bonds were supported by favorable supply-and-demand dynamics. Issuance of new tax-exempt bonds moderated significantly due to the federally subsidized Build America Bonds program, part of the stimulus package that shifted a substantial portion of new issuance to the taxable bond market. Meanwhile, demand for municipal bonds intensified as individual and institutional investors sought alternatives to low yielding money market funds. Consequently, longer-term municipal bond yields trended downward, on average, over the reporting period. For much of the reporting period, performance was stronger among lower-rated municipal bonds that had been punished severely during the downturn, while bonds backed by general tax revenues generally lagged market averages.
Security Selection Strategy Supported Fund Returns
Given California’s serious fiscal challenges, we maintained a bias toward higher-quality securities.We generally favored municipal bonds backed by revenues from utilities, transportation resources and other facilities that our credit analysts considered fundamentally sound and relatively liquid. Conversely, we typically shied away from bonds backed by general tax receipts on the state and local levels. Although
4
we do not attempt to forecast interest rates, we emphasized 20-year securities, where we believed the risk adjusted total return potential was optimized, particularly due to the yield curve’s steepness.
Supply-and-Demand Factors May Remain Favorable
Although California state and local governments have remained under pressure, we have continued to find attractive opportunities among individual municipal bond issuers. In addition, we remain optimistic about the overall market’s long-term prospects. Demand seems likely to stay robust as investors grow increasingly concerned regarding potential income tax increases on the state and federal levels. In addition, the Build America Bonds program may be extended beyond its current expiration date at the end of this year, which could keep the national supply of new tax-exempt bonds relatively low. Consequently, we have continued to focus on higher-quality, revenue-backed bonds. For new purchases, we have emphasized bonds with coupon rates above 5% to position the fund for expected challenges when short-term interest rates eventually begin to rise.
June 15, 2010
Bond funds are subject generally to interest rate, credit, liquidity and market risks, to varying degrees, all of which are more fully described in the fund’s prospectus. Generally, all other factors being equal, bond prices are inversely related to interest-rate changes, and rate increases can cause price declines.
| |
| 1 | Total return includes reinvestment of dividends and any capital gains paid, and does not take into |
| | consideration the maximum initial sales charge in the case of Class A shares, or the applicable |
| | contingent deferred sales charges imposed on redemptions in the case of Class B and Class C |
| | shares. Had these charges been reflected, returns would have been lower. Each share class is subject |
| | to a different expense structure and will achieve different returns. Class I and Class Z (which is |
| | closed to new investors) are not subject to any initial or deferred sales charges. Past performance is |
| | no guarantee of future results. Share price, yield and investment return fluctuate such that upon |
| | redemption, fund shares may be worth more or less than their original cost. Income may be subject |
| | to state and local taxes for non-California residents. Capital gains, if any, are fully taxable. Return |
| | figure for Class I shares reflects the absorption of certain fund expenses by The Dreyfus |
| | Corporation which may be modified or terminated at any time. Had these expenses not been |
| | absorbed, the fund’s returns would have been lower. |
| 2 | SOURCE: LIPPER INC. — Reflects reinvestment of dividends and, where applicable, capital |
| | gain distributions.The Barclays Capital Municipal Bond Index is a widely accepted, unmanaged |
| | and geographically unrestricted total return performance benchmark for the long-term, investment- |
| | grade, tax-exempt bond market. Index returns do not reflect fees and expenses associated with |
| | operating a mutual fund. |

|
| Comparison of change in value of $10,000 investment in Dreyfus California AMT-Free Municipal |
| Bond Fund, Inc. Class Z shares and the Barclays Capital Municipal Bond Index |
| † Source: Lipper Inc. |
| Past performance is not predictive of future performance. |
| The above graph compares a $10,000 investment made in Class Z shares of Dreyfus California AMT-Free Municipal |
| Bond Fund on 5/31/00 to a $10,000 investment made in the Barclays Capital Municipal Bond Index (the “Index”) |
| on that date.All dividends and capital gain distributions are reinvested. |
| The fund invests primarily in California municipal securities and its performance shown in the line graph takes into |
| account all applicable fees and expenses for Class Z shares. Performance for Class A, Class B, Class C and Class I |
| shares will vary from the performance of Class Z shares shown above due to differences in charges and expenses.The |
| Index is not limited to investments principally in California municipal obligations.The Index, unlike the fund, is an |
| unmanaged total return performance benchmark for the long-term, investment-grade, geographically unrestricted tax- |
| exempt bond market, calculated by using municipal bonds selected to be representative of the municipal market overall. |
| These factors can contribute to the Index potentially outperforming or underperforming the fund. Unlike a mutual fund, |
| the Index is not subject to charges, fees and other expenses. Investors cannot invest directly in any index. Further |
| information relating to fund performance, including expense reimbursements, if applicable, is contained in the Financial |
| Highlights section of the prospectus and elsewhere in this report. |
6
| | | | |
| Average Annual Total Returns as of 5/31/10 | | |
| |
| | Inception | | | |
| | Date | 1 Year | 5 Years | 10 Years |
| Class A shares | | | | |
| with maximum sales charge (4.5%) | 10/21/04 | 3.40% | 2.46% | 4.83%††† |
| without sales charge | 10/21/04 | 8.30% | 3.42% | 5.32%††† |
| Class B shares | | | | |
| with applicable redemption charge † | 10/21/04 | 3.65% | 2.51% | 5.23%†††, †††† |
| without redemption | 10/21/04 | 7.65% | 2.86% | 5.23%†††, †††† |
| Class C shares | | | | |
| with applicable redemption charge †† | 10/21/04 | 6.36% | 2.60% | 4.85%††† |
| without redemption | 10/21/04 | 7.36% | 2.60% | 4.85%††† |
| Class I shares | 12/15/08 | 8.57% | 3.64%††† | 5.44%††† |
| Class Z shares | 7/26/83 | 8.52% | 3.64% | 5.44% |
| Barclays Capital | | | | |
| Municipal Bond Index | | 8.52% | 4.52% | 5.90% |
Past performance is not predictive of future performance.The fund’s performance shown in the graph and table does not reflect the deduction of taxes that a shareholder would pay on fund distributions or the redemption of fund shares.
| |
| † | The maximum contingent deferred sales charge for Class B shares is 4%.After six years Class B shares convert to |
| | Class A shares. |
| †† | The maximum contingent deferred sales charge for Class C shares is 1% for shares redeemed within one year of |
| | the date of purchase. |
| ††† | The total return performance figures presented for Class A, Class B and Class C shares of the fund represent the |
| | performance of the fund’s Class Z shares for periods prior to 10/21/04 (the inception date for Class A, Class B |
| | and Class C shares), adjusted to reflect the applicable sales load for each share class. |
| | The total return performance figures presented for Class I shares of the fund represent the performance of the fund’s |
| | Class Z shares for periods prior to 12/15/08 (the inception date for Class I shares). |
| †††† | Assumes the conversion of Class B shares to Class A shares at the end of the sixth year following the |
| | date of purchase. |
UNDERSTANDING YOUR FUND’S EXPENSES (Unaudited)
As a mutual fund investor, you pay ongoing expenses, such as management fees and other expenses. Using the information below, you can estimate how these expenses affect your investment and compare them with the expenses of other funds.You also may pay one-time transaction expenses, including sales charges (loads) and redemption fees, which are not shown in this section and would have resulted in higher total expenses. For more information, see your fund’s prospectus or talk to your financial adviser.
Review your fund’s expenses
The table below shows the expenses you would have paid on a $1,000 investment in Dreyfus California AMT-Free Municipal Bond Fund from December 1, 2009 to May 31, 2010. It also shows how much a $1,000 investment would be worth at the close of the period, assuming actual returns and expenses.
Expenses and Value of a $1,000 Investment
assuming actual returns for the six months ended May 31, 2010
| | | | | |
| | Class A | Class B | Class C | Class I | Class Z |
| Expenses paid per $1,000† | $4.73 | $7.86 | $8.82 | $3.46 | $3.66 |
| Ending value (after expenses) | $1,038.30 | $1,035.20 | $1,034.10 | $1,039.50 | $1,039.40 |
COMPARING YOUR FUND’S EXPENSES
WITH THOSE OF OTHER FUNDS (Unaudited)
Using the SEC’s method to compare expenses
The Securities and Exchange Commission (SEC) has established guidelines to help investors assess fund expenses. Per these guidelines, the table below shows your fund’s expenses based on a $1,000 investment, assuming a hypothetical 5% annualized return. You can use this information to compare the ongoing expenses (but not transaction expenses or total cost) of investing in the fund with those of other funds.All mutual fund shareholder reports will provide this information to help you make this comparison. Please note that you cannot use this information to estimate your actual ending account balance and expenses paid during the period.
Expenses and Value of a $1,000 Investment
assuming a hypothetical 5% annualized return for the six months ended May 31, 2010
| | | | | |
| | Class A | Class B | Class C | Class I | Class Z |
| Expenses paid per $1,000† | $4.68 | $7.80 | $8.75 | $3.43 | $3.63 |
| Ending value (after expenses) | $1,020.29 | $1,017.20 | $1,016.26 | $1,021.54 | $1,021.34 |
|
| † Expenses are equal to the fund’s annualized expense ratio of .93% for Class A, 1.55% for Class B, 1.74% for |
| Class C, .68% for Class I and .72% for Class Z, multiplied by the average account value over the period, |
| multiplied by 182/365 (to reflect the one-half year period). |
8
|
| STATEMENT OF INVESTMENTS |
| May 31, 2010 |
| | | | |
| Long-Term Municipal | Coupon | Maturity | Principal | |
| Investments—99.2% | Rate (%) | Date | Amount ($) | Value ($) |
| California—92.5% | | | | |
| ABAG Finance Authority for | | | | |
| Nonprofit Corporations, COP | | | | |
| (Episcopal Homes Foundation) | 5.25 | 7/1/10 | 3,500,000 | 3,510,780 |
| ABAG Finance Authority for | | | | |
| Nonprofit Corporations, | | | | |
| Insured Revenue (Sansum- | | | | |
| Santa Barbara Medical | | | | |
| Foundation Clinic) | 5.50 | 4/1/21 | 3,500,000 | 3,552,010 |
| ABAG Finance Authority for | | | | |
| Nonprofit Corporations, | | | | |
| Revenue (San Diego | | | | |
| Hospital Association) | 5.38 | 3/1/21 | 4,000,000 | 4,072,400 |
| Alameda Corridor Transportation | | | | |
| Authority, Revenue (Insured; | | | | |
| National Public Finance | | | | |
| Guarantee Corp.) | 5.13 | 10/1/16 | 2,000,000 | 2,022,840 |
| Bay Area Toll Authority, | | | | |
| San Francisco Bay Area Toll | | | | |
| Bridge Revenue | 5.25 | 4/1/24 | 17,580,000 | 19,681,337 |
| Bay Area Toll Authority, | | | | |
| San Francisco Bay Area Toll | | | | |
| Bridge Revenue | 5.00 | 4/1/34 | 15,000,000 | 15,490,050 |
| Bay Area Toll Authority, | | | | |
| San Francisco Bay Area Toll | | | | |
| Bridge Revenue | 5.50 | 4/1/43 | 11,720,000 | 12,606,735 |
| Brentwood Infrastructure Financing | | | | |
| Authority, Water Revenue | 5.75 | 7/1/38 | 4,250,000 | 4,642,913 |
| California, | | | | |
| Economic Recovery Bonds | 5.00 | 7/1/20 | 20,000,000 | 22,351,400 |
| California, | | | | |
| GO (Various Purpose) | 5.25 | 3/1/30 | 15,000,000 | 15,367,050 |
| California, | | | | |
| GO (Various Purpose) | 5.75 | 4/1/31 | 4,500,000 | 4,798,080 |
| California, | | | | |
| GO (Various Purpose) | 6.50 | 4/1/33 | 30,000,000 | 33,988,500 |
| California Department of Veteran | | | | |
| Affairs, Home Purchase Revenue | 5.20 | 12/1/28 | 8,530,000 | 8,534,692 |
| California Department of Water | | | | |
| Resources, Power Supply Revenue | 5.00 | 5/1/21 | 7,500,000 | 8,252,925 |
STATEMENT OF INVESTMENTS (continued)
| | | | | |
| Long-Term Municipal | Coupon | Maturity | Principal | | |
| Investments (continued) | Rate (%) | Date | Amount ($) | | Value ($) |
| California (continued) | | | | | |
| California Department of Water | | | | | |
| Resources, Power Supply | | | | | |
| Revenue (Prerefunded) | 5.88 | 5/1/12 | 10,000,000 | a | 11,110,600 |
| California Department of Water | | | | | |
| Resources, Water System | | | | | |
| Revenue (Central Valley Project) | 5.00 | 12/1/26 | 7,500,000 | | 8,222,175 |
| California Department of Water | | | | | |
| Resources, Water System | | | | | |
| Revenue (Central Valley Project) | 5.00 | 12/1/27 | 11,600,000 | | 12,649,452 |
| California Department of Water | | | | | |
| Resources, Water System | | | | | |
| Revenue (Central Valley | | | | | |
| Project) (Prerefunded) | 5.50 | 12/1/11 | 225,000 | a | 241,938 |
| California Educational Facilities | | | | | |
| Authority, Revenue (Pooled | | | | | |
| College and University Projects) | 5.63 | 7/1/23 | 210,000 | | 172,183 |
| California Educational Facilities | | | | | |
| Authority, Revenue (Pooled | | | | | |
| College and University Projects) | 5.63 | 7/1/23 | 135,000 | | 165,158 |
| California Educational Facilities | | | | | |
| Authority, Revenue (University | | | | | |
| of Southern California) | 4.50 | 10/1/33 | 49,625,000 | | 49,515,825 |
| California Educational Facilities | | | | | |
| Authority, Revenue (University | | | | | |
| of Southern California) | 5.25 | 10/1/38 | 9,500,000 | | 10,233,400 |
| California Health Facilities | | | | | |
| Financing Authority, Health | | | | | |
| Facility Revenue (Adventist | | | | | |
| Health System/West) | 5.00 | 3/1/17 | 870,000 | | 898,893 |
| California Health Facilities | | | | | |
| Financing Authority, Health | | | | | |
| Facility Revenue (Adventist | | | | | |
| Health System/West) | 5.00 | 3/1/18 | 1,000,000 | | 1,027,390 |
| California Health Facilities | | | | | |
| Financing Authority, Revenue | | | | | |
| (Catholic Healthcare West) | 5.63 | 7/1/32 | 5,875,000 | | 6,048,606 |
| California Health Facilities | | | | | |
| Financing Authority, Revenue | | | | | |
| (Scripps Health) | 5.00 | 11/15/36 | 6,000,000 | | 6,017,820 |
10
| | | | |
| Long-Term Municipal | Coupon | Maturity | Principal | |
| Investments (continued) | Rate (%) | Date | Amount ($) | Value ($) |
| California (continued) | | | | |
| California Health Facilities | | | | |
| Financing Authority, Revenue | | | | |
| (Sutter Health) | 5.25 | 8/15/22 | 6,000,000 | 6,455,040 |
| California Health Facilities | | | | |
| Financing Authority, Revenue | | | | |
| (Sutter Health) | 6.25 | 8/15/35 | 7,465,000 | 7,554,132 |
| California Health Facilities | | | | |
| Financing Authority, Revenue | | | | |
| (Sutter Health) (Insured; | | | | |
| National Public Finance | | | | |
| Guarantee Corp.) | 5.35 | 8/15/28 | 2,290,000 | 2,293,801 |
| California Housing Finance Agency, | | | | |
| Home Mortgage Revenue | 5.50 | 8/1/38 | 16,195,000 | 16,233,868 |
| California Infrastructure and | | | | |
| Economic Development Bank, | | | | |
| Revenue (Kaiser Hospital | | | | |
| Assistance I-LLC) | 5.55 | 8/1/31 | 21,900,000 | 22,177,473 |
| California Infrastructure and | | | | |
| Economic Development Bank, | | | | |
| Revenue (Performing Arts | | | | |
| Center of Los Angeles County) | 5.00 | 12/1/27 | 1,000,000 | 1,015,000 |
| California Infrastructure and | | | | |
| Economic Development Bank, | | | | |
| Revenue (The J. Paul Getty Trust) | 4.00 | 12/1/11 | 2,515,000 | 2,628,955 |
| California Municipal Finance | | | | |
| Authority, COP (Community | | | | |
| Hospitals of Central | | | | |
| California Obligated Group) | 5.25 | 2/1/27 | 6,750,000 | 6,446,250 |
| California Pollution Control | | | | |
| Financing Authority, PCR (San | | | | |
| Diego Gas and Electric | | | | |
| Company) (Insured; National | | | | |
| Public Finance Guarantee Corp.) | 5.90 | 6/1/14 | 59,330,000 | 66,937,293 |
| California Public Works Board, | | | | |
| LR (Department of Corrections, | | | | |
| Calipatria State Prison, | | | | |
| Imperial County) (Insured; | | | | |
| National Public Finance | | | | |
| Guarantee Corp.) | 6.50 | 9/1/17 | 13,000,000 | 14,386,840 |
STATEMENT OF INVESTMENTS (continued)
| | | | |
| Long-Term Municipal | Coupon | Maturity | Principal | |
| Investments (continued) | Rate (%) | Date | Amount ($) | Value ($) |
| California (continued) | | | | |
| California Public Works Board, | | | | |
| LR (Department of Health | | | | |
| Services-Richmond Laboratory, | | | | |
| Phase III Office Building) | | | | |
| (Insured; XLCA) | 5.00 | 11/1/19 | 1,680,000 | 1,740,917 |
| California Public Works Board, | | | | |
| LR (Various University of | | | | |
| California Projects) | 5.50 | 6/1/14 | 5,000,000 | 5,413,750 |
| California State University | | | | |
| Fresno Association Inc., | | | | |
| Auxiliary Organization Event | | | | |
| Center Revenue (Prerefunded) | 6.00 | 7/1/12 | 5,250,000 a | 5,855,640 |
| California State University | | | | |
| Trustees, Systemwide Revenue | 5.00 | 11/1/27 | 2,510,000 | 2,633,743 |
| California State University | | | | |
| Trustees, Systemwide Revenue | 5.00 | 11/1/28 | 5,000,000 | 5,225,950 |
| California State University | | | | |
| Trustees, Systemwide Revenue | | | | |
| (Insured; National Public | | | | |
| Finance Guarantee Corp.) | 5.00 | 11/1/26 | 10,485,000 | 10,924,007 |
| California Statewide Communities | | | | |
| Development Authority, COP | | | | |
| (The Internext Group) | 5.38 | 4/1/30 | 20,000,000 | 18,516,000 |
| California Statewide Communities | | | | |
| Development Authority, Health | | | | |
| Facility Revenue (Adventist | | | | |
| Health System/West) | 5.00 | 3/1/35 | 7,380,000 | 7,185,242 |
| California Statewide Communities | | | | |
| Development Authority, | | | | |
| Insured Revenue | | | | |
| (Saint Joseph Health | | | | |
| System) (Insured; FGIC) | 5.75 | 7/1/47 | 10,000,000 | 10,327,600 |
| California Statewide Communities | | | | |
| Development Authority, | | | | |
| Insured Revenue (Saint | | | | |
| Joseph Health System) | | | | |
| (Insured; National Public | | | | |
| Finance Guarantee Corp.) | 5.13 | 7/1/24 | 5,000,000 | 5,161,850 |
12
| | | | |
| Long-Term Municipal | Coupon | Maturity | Principal | |
| Investments (continued) | Rate (%) | Date | Amount ($) | Value ($) |
| California (continued) | | | | |
| California Statewide Communities | | | | |
| Development Authority, | | | | |
| Revenue (Daughters of | | | | |
| Charity Health System) | 5.25 | 7/1/24 | 8,205,000 | 7,834,872 |
| California Statewide Communities | | | | |
| Development Authority, | | | | |
| Revenue (Daughters of | | | | |
| Charity Health System) | 5.25 | 7/1/35 | 10,770,000 | 9,550,513 |
| California Statewide Communities | | | | |
| Development Authority, Revenue | | | | |
| (Inland Regional Center Project) | 5.25 | 12/1/27 | 9,000,000 | 7,592,850 |
| California Statewide Communities | | | | |
| Development Authority, Revenue | | | | |
| (Kaiser Permanente) | 5.50 | 11/1/32 | 13,500,000 | 13,694,805 |
| California Statewide Communities | | | | |
| Development Authority, Revenue | | | | |
| (Saint Ignatius College | | | | |
| Preparatory) (Insured; AMBAC) | 5.00 | 6/1/32 | 5,635,000 | 5,502,690 |
| California Statewide Communities | | | | |
| Development Authority, Revenue | | | | |
| (Sutter Health) | 5.50 | 8/15/28 | 14,000,000 | 14,356,440 |
| California Statewide Communities | | | | |
| Development Authority, Revenue | | | | |
| (The California Endowment) | 5.25 | 7/1/20 | 2,280,000 | 2,526,377 |
| California Statewide Communities | | | | |
| Development Authority, Revenue | | | | |
| (The California Endowment) | 5.00 | 7/1/28 | 15,360,000 | 15,844,762 |
| California Statewide Communities | | | | |
| Development Authority, Revenue | | | | |
| (The California Endowment) | 5.00 | 7/1/33 | 19,710,000 | 20,176,339 |
| California Statewide Communities | | | | |
| Development Authority, Revenue | | | | |
| (The California Endowment) | 5.00 | 7/1/36 | 14,355,000 | 14,648,703 |
| California Statewide Communities | | | | |
| Development Authority, School | | | | |
| Facility Revenue (Aspire | | | | |
| Public Schools) | 6.00 | 7/1/40 | 10,000,000 | 10,006,000 |
STATEMENT OF INVESTMENTS (continued)
| | | | | |
| Long-Term Municipal | Coupon | Maturity | Principal | | |
| Investments (continued) | Rate (%) | Date | Amount ($) | | Value ($) |
| California (continued) | | | | | |
| California Statewide Communities | | | | | |
| Development Authority, Student | | | | | |
| Housing Revenue (CHF-Irvine, | | | | | |
| LLC-UCI East Campus | | | | | |
| Apartments, Phase II) | 5.75 | 5/15/32 | 4,500,000 | | 4,597,830 |
| Capistrano Unified School District | | | | | |
| (Ladera) Community Facilities | | | | | |
| District Number 98-2, Special | | | | | |
| Tax Bonds (Insured; National | | | | | |
| Public Finance Guarantee Corp.) | 5.00 | 9/1/19 | 3,545,000 | | 3,609,803 |
| Capistrano Unified School | | | | | |
| District, School Facilities | | | | | |
| Improvement District Number 1 | | | | | |
| (Insured; National Public | | | | | |
| Finance Guarantee Corp.) | 6.00 | 8/1/24 | 2,075,000 | | 2,112,640 |
| Carson Redevelopment Agency, | | | | | |
| Tax Allocation Revenue | | | | | |
| (Redevelopment Project Area | | | | | |
| Number 1) (Insured; National | | | | | |
| Public Finance Guarantee Corp.) | 5.50 | 10/1/13 | 1,000,000 | | 1,086,750 |
| Central California Joint Powers | | | | | |
| Health Financing Authority, | | | | | |
| COP (Community Hospitals of | | | | | |
| Central California Obligated | | | | | |
| Group) (Prerefunded) | 5.75 | 2/1/11 | 16,000,000 | a | 16,742,400 |
| Chabot-Las Positas Community | | | | | |
| College District, GO | | | | | |
| (Insured; AMBAC) | 0.00 | 8/1/22 | 3,000,000 | b | 1,649,820 |
| Chabot-Las Positas Community | | | | | |
| College District, GO | | | | | |
| (Insured; AMBAC) | 0.00 | 8/1/32 | 10,000,000 | b | 2,520,700 |
| Chino Valley Unified School | | | | | |
| District, GO (Insured; | | | | | |
| National Public Finance | | | | | |
| Guarantee Corp.) | 5.25 | 8/1/30 | 10,000,000 | | 10,249,400 |
| Coast Community College District, | | | | | |
| GO (Insured; Assured Guaranty | | | | | |
| Municipal Corp.) | 0/5.00 | 8/1/29 | 15,565,000 | c | 13,191,804 |
| Compton Public Finance Authority, | | | | | |
| LR (Various Capital Projects) | | | | | |
| (Insured; AMBAC) | 5.25 | 9/1/27 | 13,355,000 | | 13,532,488 |
14
| | | | |
| Long-Term Municipal | Coupon | Maturity | Principal | |
| Investments (continued) | Rate (%) | Date | Amount ($) | Value ($) |
| California (continued) | | | | |
| Delano, | | | | |
| COP (Delano Regional | | | | |
| Medical Center) | 5.25 | 1/1/18 | 11,325,000 | 11,325,113 |
| Fontana Community Facilities | | | | |
| District Number 2, Senior | | | | |
| Special Tax Revenue (Village | | | | |
| of Heritage) (Insured; | | | | |
| National Public Finance | | | | |
| Guarantee Corp.) | 5.25 | 9/1/17 | 10,000,000 | 10,010,400 |
| Fontana Public Financing | | | | |
| Authority, Tax Allocation | | | | |
| Revenue (North Fontana | | | | |
| Redevelopment Project) | | | | |
| (Insured; AMBAC) | 5.50 | 9/1/32 | 13,800,000 | 13,798,758 |
| Foothill-De Anza Community College | | | | |
| District, GO (Insured; AMBAC) | 5.00 | 8/1/22 | 10,350,000 | 11,360,056 |
| Foothill/Eastern Transportation | | | | |
| Corridor Agency, | | | | |
| Toll Road Revenue | 5.75 | 1/15/40 | 1,745,000 | 1,703,643 |
| Foothill/Eastern Transportation | | | | |
| Corridor Agency, Toll Road | | | | |
| Revenue (Insured; National | | | | |
| Public Finance Guarantee Corp.) | 5.25 | 1/15/12 | 4,550,000 | 4,598,503 |
| Foothill/Eastern Transportation | | | | |
| Corridor Agency, Toll Road | | | | |
| Revenue (Insured; National | | | | |
| Public Finance Guarantee Corp.) | 5.13 | 1/15/19 | 2,000,000 | 2,003,120 |
| Fullerton Community Facilities | | | | |
| District Number 1, Special Tax | | | | |
| Revenue (Amerige Heights) | 6.20 | 9/1/32 | 2,500,000 | 2,503,875 |
| Golden State Tobacco | | | | |
| Securitization Corporation, | | | | |
| Enhanced Tobacco Settlement | | | | |
| Asset-Backed Bonds | | | | |
| (Insured; Assured Guaranty | | | | |
| Municipal Corp.) | 0/4.55 | 6/1/22 | 1,725,000 c | 1,616,877 |
| Golden State Tobacco | | | | |
| Securitization Corporation, | | | | |
| Tobacco Settlement | | | | |
| Asset-Backed Bonds | 4.50 | 6/1/27 | 13,500,000 | 12,214,800 |
STATEMENT OF INVESTMENTS (continued)
| | | | | |
| Long-Term Municipal | Coupon | Maturity | Principal | | |
| Investments (continued) | Rate (%) | Date | Amount ($) | | Value ($) |
| California (continued) | | | | | |
| Golden State Tobacco | | | | | |
| Securitization Corporation, | | | | | |
| Tobacco Settlement | | | | | |
| Asset-Backed Bonds | 5.00 | 6/1/33 | 10,000,000 | | 7,960,300 |
| Golden State Tobacco | | | | | |
| Securitization Corporation, | | | | | |
| Tobacco Settlement | | | | | |
| Asset-Backed Bonds | 5.75 | 6/1/47 | 10,725,000 | | 7,864,321 |
| Golden State Tobacco | | | | | |
| Securitization Corporation, | | | | | |
| Tobacco Settlement Asset-Backed | | | | | |
| Bonds (Prerefunded) | 6.75 | 6/1/13 | 14,770,000 | a | 17,158,752 |
| Grossmont Union High School | | | | | |
| District, GO (Insured; Assured | | | | | |
| Guaranty Municipal Corp.) | 0.00 | 8/1/21 | 4,375,000 | b | 2,671,812 |
| Grossmont Union High School | | | | | |
| District, GO (Insured; Assured | | | | | |
| Guaranty Municipal Corp.) | 0.00 | 8/1/22 | 4,605,000 | b | 2,662,197 |
| Grossmont Union High School | | | | | |
| District, GO (Insured; Assured | | | | | |
| Guaranty Municipal Corp.) | 0.00 | 8/1/23 | 4,850,000 | b | 2,545,959 |
| Grossmont Union High School | | | | | |
| District, GO (Insured; Assured | | | | | |
| Guaranty Municipal Corp.) | 0.00 | 8/1/26 | 3,265,000 | b | 1,301,037 |
| Kaweah Delta Health Care District, | | | | | |
| Revenue (Prerefunded) | 6.00 | 8/1/12 | 9,000,000 | a | 10,182,780 |
| Lincoln Community Facilities | | | | | |
| District Number 2003-1, | | | | | |
| Special Tax Bonds (Lincoln | | | | | |
| Crossing Project) (Prerefunded) | 5.65 | 9/1/13 | 1,125,000 | a | 1,307,070 |
| Los Angeles, | | | | | |
| Wastewater System Revenue | | | | | |
| (Insured; Assured Guaranty | | | | | |
| Municipal Corp.) | 5.00 | 6/1/32 | 6,050,000 | | 6,177,050 |
| Los Angeles, | | | | | |
| Wastewater System Revenue | | | | | |
| (Insured; National Public | | | | | |
| Finance Guarantee Corp.) | 4.75 | 6/1/35 | 8,000,000 | | 8,038,880 |
| Los Angeles Department of | | | | | |
| Airports, Senior Revenue (Los | | | | | |
| Angeles International Airport) | 5.25 | 5/15/29 | 16,090,000 | | 17,278,729 |
16
| | | | | |
| Long-Term Municipal | Coupon | Maturity | Principal | | |
| Investments (continued) | Rate (%) | Date | Amount ($) | | Value ($) |
| California (continued) | | | | | |
| Los Angeles Department of | | | | | |
| Airports, Senior Revenue (Los | | | | | |
| Angeles International Airport) | 5.00 | 5/15/35 | 25,000,000 | | 25,832,000 |
| Los Angeles Department of Water | | | | | |
| and Power, Power System Revenue | 5.00 | 7/1/30 | 4,250,000 | | 4,345,710 |
| Los Angeles Harbor Department, | | | | | |
| Revenue | 5.25 | 8/1/25 | 26,055,000 | | 28,808,232 |
| Los Angeles Unified School | | | | | |
| District, GO (Insured; National | | | | | |
| Public Finance Guarantee Corp.) | 5.75 | 7/1/15 | 3,000,000 | | 3,499,260 |
| Los Angeles Unified School District, | | | | | |
| GO (Insured; National Public | | | | | |
| Finance Guarantee Corp.) | 5.75 | 7/1/17 | 8,385,000 | | 9,927,253 |
| Metropolitan Water District of | | | | | |
| Southern California, Water Revenue | 5.00 | 1/1/39 | 5,000,000 | | 5,306,200 |
| Midpeninsula Regional Open Space | | | | | |
| District Financing Authority, | | | | | |
| Revenue (Insured; AMBAC) | 0.00 | 9/1/15 | 2,825,000 | b | 2,523,233 |
| Murrieta Valley Unified School | | | | | |
| District, GO (Insured; | | | | | |
| National Public Finance | | | | | |
| Guarantee Corp.) | 0.00 | 9/1/21 | 4,950,000 | b | 2,713,045 |
| Natomas Unified School District, | | | | | |
| GO (Insured; National Public | | | | | |
| Finance Guarantee Corp.) | 5.95 | 9/1/21 | 2,500,000 | | 2,877,700 |
| Northern California Power Agency, | | | | | |
| Revenue (Hydroelectric Project | | | | | |
| Number 1) (Insured; AMBAC) | | | | | |
| (Prerefunded) | 7.00 | 1/1/16 | 670,000 | a | 848,200 |
| Northern California Power Agency, | | | | | |
| Revenue (Hydroelectric Project | | | | | |
| Number 1) (Insured; AMBAC) | | | | | |
| (Prerefunded) | 7.50 | 7/1/21 | 375,000 | a | 509,280 |
| Northern California Power Agency, | | | | | |
| Revenue (Hydroelectric Project | | | | | |
| Number 1) (Insured; National | | | | | |
| Public Finance Guarantee Corp.) | 6.30 | 7/1/18 | 26,400,000 | | 30,411,216 |
| Oakland Unified School District, | | | | | |
| GO (Insured; National Public | | | | | |
| Finance Guarantee Corp.) | 5.25 | 8/1/24 | 17,275,000 | | 17,690,637 |
STATEMENT OF INVESTMENTS (continued)
| | | | |
| Long-Term Municipal | Coupon | Maturity | Principal | |
| Investments (continued) | Rate (%) | Date | Amount ($) | Value ($) |
| California (continued) | | | | |
| Orange County Community Facilities | | | | |
| District (Landera Ranch) | | | | |
| Special Tax Number 3 | 5.60 | 8/15/28 | 3,250,000 | 3,151,590 |
| Orange County Community Facilities | | | | |
| District (Landera Ranch) | | | | |
| Special Tax Number 3 | 5.63 | 8/15/34 | 6,000,000 | 5,732,400 |
| Pomona, | | | | |
| COP (General Fund Lease | | | | |
| Financing) (Insured; AMBAC) | 5.50 | 6/1/28 | 1,000,000 | 1,046,240 |
| Pomona Redevelopment Agency, | | | | |
| Tax Allocation Revenue | | | | |
| (West Holt Avenue | | | | |
| Redevelopment Project) | 5.50 | 5/1/32 | 3,000,000 | 2,984,730 |
| Rancho California Water District | | | | |
| Financing Authority, Revenue | | | | |
| (Insured; Assured Guaranty | | | | |
| Municipal Corp.) | 5.00 | 8/1/28 | 8,965,000 | 9,355,515 |
| Rancho Cucamonga Redevelopment | | | | |
| Agency, Tax Allocation Revenue | | | | |
| (Rancho Development Project) | | | | |
| (Insured; National Public | | | | |
| Finance Guarantee Corp.) | 5.38 | 9/1/25 | 7,485,000 | 7,511,871 |
| Rancho Mirage Joint Powers | | | | |
| Financing Authority, Revenue | | | | |
| (Eisenhower Medical Center) | | | | |
| (Prerefunded) | 5.63 | 7/1/14 | 10,430,000 a | 12,214,886 |
| Riverside County Public Financing | | | | |
| Authority, Tax Allocation | | | | |
| Revenue (Redevelopment | | | | |
| Projects) (Insured; XLCA) | 5.25 | 10/1/18 | 1,275,000 | 1,311,899 |
| Sacramento County, | | | | |
| Airport System Senior Revenue | 5.00 | 7/1/24 | 5,090,000 | 5,316,963 |
| Sacramento County, | | | | |
| Airport System Senior Revenue | 5.13 | 7/1/25 | 5,890,000 | 6,169,657 |
| Sacramento County Water | | | | |
| Financing Authority, Revenue | | | | |
| (Sacramento County | | | | |
| Water Agency Zones 40 | | | | |
| and 41 Water System Project) | | | | |
| (Insured; National Public | | | | |
| Finance Guarantee Corp.) | 5.00 | 6/1/25 | 10,845,000 | 11,128,488 |
18
| | | | |
| Long-Term Municipal | Coupon | Maturity | Principal | |
| Investments (continued) | Rate (%) | Date | Amount ($) | Value ($) |
| California (continued) | | | | |
| Sacramento Municipal Utility District, | | | | |
| Electric Revenue (Insured; National | | | | |
| Public Finance Guarantee Corp.) | 6.50 | 9/1/13 | 6,930,000 | 7,476,708 |
| San Bernardino County, | | | | |
| COP (Capital Facilities Project) | 6.88 | 8/1/24 | 5,000,000 | 6,678,600 |
| San Diego County, | | | | |
| COP (Burnham Institute for | | | | |
| Medical Research) | 5.00 | 9/1/24 | 2,265,000 | 2,126,178 |
| San Diego County, | | | | |
| COP (Burnham Institute for | | | | |
| Medical Research) | 5.00 | 9/1/34 | 9,880,000 | 8,602,121 |
| San Diego Public Facilities | | | | |
| Financing Authority, Senior | | | | |
| Sewer Revenue | 5.25 | 5/15/34 | 8,045,000 | 8,589,888 |
| San Diego Public Facilities Financing | | | | |
| Authority, Water Revenue | 5.13 | 8/1/29 | 6,470,000 | 6,921,412 |
| San Diego Unified School District, | | | | |
| GO (Insured; Assured Guaranty | | | | |
| Municipal Corp.) | 5.25 | 7/1/16 | 1,465,000 | 1,654,337 |
| San Francisco City and County, | | | | |
| COP (San Bruno Jail Number 3) | | | | |
| (Insured; AMBAC) | 5.25 | 10/1/21 | 2,985,000 | 3,024,641 |
| San Francisco City and County | | | | |
| Airport Commission, San | | | | |
| Francisco International | | | | |
| Airport Second Series Revenue | | | | |
| (Issue 32F) (Insured; National | | | | |
| Public Finance Guarantee Corp.) | 5.00 | 5/1/21 | 1,000,000 | 1,068,190 |
| San Francisco City and County | | | | |
| Airport Commission, San Francisco | | | | |
| International Airport Second | | | | |
| Series Revenue (Issue 34D) | 5.25 | 5/1/26 | 4,000,000 | 4,277,720 |
| San Francisco City and County | | | | |
| Public Utilities Commission, | | | | |
| San Francisco Water Revenue | 5.00 | 11/1/27 | 11,000,000 | 11,865,370 |
| San Francisco City and County | | | | |
| Public Utilities Commission, | | | | |
| San Francisco Water Revenue | | | | |
| (Insured; Assured Guaranty | | | | |
| Municipal Corp.) | 5.00 | 11/1/24 | 13,185,000 | 14,112,960 |
STATEMENT OF INVESTMENTS (continued)
| | | | | |
| Long-Term Municipal | Coupon | Maturity | Principal | | |
| Investments (continued) | Rate (%) | Date | Amount ($) | | Value ($) |
| California (continued) | | | | | |
| San Francisco City and County | | | | | |
| Redevelopment Agency, | | | | | |
| Community Facilities District | | | | | |
| Number 6 (Mission Bay South | | | | | |
| Public Improvements) | 0.00 | 8/1/18 | 445,000 | b | 277,302 |
| San Francisco City and County | | | | | |
| Redevelopment Agency, | | | | | |
| Community Facilities District | | | | | |
| Number 6 (Mission Bay South | | | | | |
| Public Improvements) | 0.00 | 8/1/21 | 500,000 | b | 250,540 |
| Santa Rosa, | | | | | |
| Wastewater Revenue | | | | | |
| (Insured; Assured Guaranty | | | | | |
| Municipal Corp.) | 5.25 | 9/1/24 | 5,110,000 | | 5,536,123 |
| Sequoia Union High School | | | | | |
| District, GO (Insured; Assured | | | | | |
| Guaranty Municipal Corp.) | 5.00 | 7/1/24 | 2,695,000 | | 2,870,822 |
| Simi Valley School Financing | | | | | |
| Authority, GO Revenue (Simi | | | | | |
| Valley Unified School District, | | | | | |
| GO Bond) (Insured; Assured | | | | | |
| Guaranty Municipal Corp.) | 5.00 | 8/1/27 | 6,500,000 | | 6,963,775 |
| Southern California Public Power | | | | | |
| Authority, Revenue (Milford | | | | | |
| Wind Corridor Phase I Project) | 5.00 | 7/1/29 | 11,865,000 | | 12,341,261 |
| Tobacco Securitization Authority | | | | | |
| of Northern California, Tobacco | | | | | |
| Settlement Asset-Backed Bonds | | | | | |
| (Sacramento County Tobacco | | | | | |
| Securitization Corporation) | 5.38 | 6/1/38 | 20,000,000 | | 16,012,400 |
| Tobacco Securitization Authority | | | | | |
| of Southern California, Tobacco | | | | | |
| Settlement Asset-Backed Bonds | | | | | |
| (San Diego County Tobacco Asset | | | | | |
| Securitization Corporation) | 4.75 | 6/1/25 | 2,030,000 | | 1,941,533 |
| Torrance Redevelopment Agency, | | | | | |
| Tax Allocation Revenue | 5.63 | 9/1/28 | 500,000 | | 437,375 |
| Tuolumne Wind Project Authority, | | | | | |
| Revenue (Tuolumne | | | | | |
| Company Project) | 5.63 | 1/1/29 | 8,000,000 | | 8,658,800 |
20
| | | | | |
| Long-Term Municipal | Coupon | Maturity | Principal | | |
| Investments (continued) | Rate (%) | Date | Amount ($) | | Value ($) |
| California (continued) | | | | | |
| Turlock Irrigation District, | | | | | |
| Revenue | 5.00 | 1/1/25 | 5,610,000 | d | 5,974,818 |
| Turlock Irrigation District, | | | | | |
| Revenue | 5.00 | 1/1/26 | 8,120,000 | d | 8,601,922 |
| University of California Regents, | | | | | |
| General Revenue | 5.25 | 5/15/28 | 10,000,000 | | 10,927,800 |
| University of California Regents, | | | | | |
| General Revenue | 5.75 | 5/15/31 | 8,000,000 | | 9,113,680 |
| University of California Regents, | | | | | |
| Medical Center Pooled Revenue | 5.25 | 5/15/19 | 10,000,000 | | 11,160,500 |
| West Covina Redevelopment | | | | | |
| Agency, Community Facilities | | | | | |
| District, Special Tax Revenue | | | | | |
| (Fashion Plaza) | 6.00 | 9/1/17 | 6,000,000 | | 6,741,420 |
| West Covina Redevelopment | | | | | |
| Agency, Community Facilities | | | | | |
| District, Special Tax Revenue | | | | | |
| (Fashion Plaza) | 6.00 | 9/1/22 | 11,325,000 | | 12,897,476 |
| West Kern Community College | | | | | |
| District, GO (Insured; XLCA) | 0.00 | 11/1/20 | 1,000,000 | b | 576,010 |
| Whittier, | | | | | |
| Health Facility Revenue | | | | | |
| (Presbyterian Intercommunity | | | | | |
| Hospital) (Prerefunded) | 5.75 | 6/1/12 | 10,090,000 | a | 11,221,594 |
| Yorba Linda Water District, | | | | | |
| Revenue, COP (Capital | | | | | |
| Improvement Projects) | 5.00 | 10/1/38 | 3,000,000 | | 3,079,500 |
| U.S. Related—6.7% | | | | | |
| Government of Guam, | | | | | |
| LOR (Section 30) | 5.63 | 12/1/29 | 2,850,000 | | 2,942,112 |
| Puerto Rico Commonwealth, | | | | | |
| Public Improvement GO | 5.25 | 7/1/22 | 2,000,000 | | 2,059,720 |
| Puerto Rico Electric Power | | | | | |
| Authority, Power Revenue | 5.00 | 7/1/28 | 6,040,000 | | 6,111,876 |
| Puerto Rico Electric Power | | | | | |
| Authority, Power Revenue | 5.25 | 7/1/28 | 5,000,000 | | 5,170,000 |
| Puerto Rico Electric Power | | | | | |
| Authority, Power Revenue | 5.25 | 7/1/40 | 5,000,000 | | 5,062,300 |
STATEMENT OF INVESTMENTS (continued)
| | | | |
| Long-Term Municipal | Coupon | Maturity | Principal | |
| Investments (continued) | Rate (%) | Date | Amount ($) | Value ($) |
| U.S. Related (continued) | | | | |
| Puerto Rico Electric Power | | | | |
| Authority, Power Revenue | | | | |
| (Insured; National Public | | | | |
| Finance Guarantee Corp.) | 5.25 | 7/1/30 | 10,000,000 | 10,522,600 |
| Puerto Rico Highways and | | | | |
| Transportation Authority, | | | | |
| Highway Revenue (Insured; | | | | |
| Assured Guaranty Municipal Corp.) | 6.25 | 7/1/16 | 3,000,000 | 3,519,000 |
| Puerto Rico Highways and | | | | |
| Transportation Authority, | | | | |
| Highway Revenue (Insured; | | | | |
| National Public Finance | | | | |
| Guarantee Corp.) | 5.50 | 7/1/13 | 4,750,000 | 5,046,828 |
| Puerto Rico Infrastructure | | | | |
| Financing Authority, Special | | | | |
| Tax Revenue (Insured; AMBAC) | 5.50 | 7/1/28 | 10,200,000 | 10,727,238 |
| Puerto Rico Public Buildings | | | | |
| Authority, Government | | | | |
| Facility Revenue | 5.50 | 7/1/16 | 1,500,000 | 1,640,445 |
| Puerto Rico Sales Tax Financing | | | | |
| Corporation, Sales Tax Revenue | | | | |
| (First Subordinate Series) | 5.38 | 8/1/39 | 5,000,000 | 5,192,600 |
| Puerto Rico Sales Tax Financing | | | | |
| Corporation, Sales Tax Revenue | | | | |
| (First Subordinate Series) | 6.38 | 8/1/39 | 4,500,000 | 5,066,910 |
| Puerto Rico Sales Tax Financing | | | | |
| Corporation, Sales Tax Revenue | | | | |
| (First Subordinate Series) | 6.00 | 8/1/42 | 7,500,000 | 8,137,800 |
| University of Puerto Rico, | | | | |
| University System Revenue | 5.00 | 6/1/23 | 10,000,000 | 10,155,400 |
22
| | | | |
| Long-Term Municipal | Coupon | Maturity | Principal | |
| Investments (continued) | Rate (%) | Date | Amount ($) | Value ($) |
| U.S. Related (continued) | | | | |
| Virgin Islands Public Finance | | | | |
| Authority, Revenue | 7.30 | 10/1/18 | 3,100,000 | 3,833,708 |
| Virgin Islands Public Finance | | | | |
| Authority, Revenue (Virgin | | | | |
| Islands Gross Receipts Taxes | | | | |
| Loan Note) | 5.63 | 10/1/10 | 345,000 | 350,047 |
| Virgin Islands Public Finance | | | | |
| Authority, Revenue | | | | |
| (Virgin Islands Matching | | | | |
| Fund Loan Notes) | 5.00 | 10/1/25 | 5,000,000 | 5,108,250 |
| |
| Total Investments (cost $1,282,777,318) | | 99.2% | 1,335,446,336 |
| Cash and Receivables (Net) | | | .8% | 10,117,266 |
| Net Assets | | | 100.0% | 1,345,563,602 |
|
| a These securities are prerefunded; the date shown represents the prerefunded date. Bonds which are prerefunded are |
| collateralized by U.S. Government securities which are held in escrow and are used to pay principal and interest on |
| the municipal issue and to retire the bonds in full at the earliest refunding date. |
| b Security issued with a zero coupon. Income is recognized through the accretion of discount. |
| c Zero coupon until a specified date at which time the stated coupon rate becomes effective until maturity. |
| d Purchased on a delayed delivery basis. |
STATEMENT OF INVESTMENTS (continued)
| | | |
| Summary of Abbreviations | | |
| |
| ABAG | Association of Bay Area Governments | ACA | American Capital Access |
| AGC | ACE Guaranty Corporation | AGIC | Asset Guaranty Insurance Company |
| AMBAC | American Municipal Bond | ARRN | Adjustable Rate Receipt Notes |
| | Assurance Corporation | | |
| BAN | Bond Anticipation Notes | BPA | Bond Purchase Agreement |
| CIFG | CDC Ixis Financial Guaranty | COP | Certificate of Participation |
| CP | Commercial Paper | EDR | Economic Development Revenue |
| EIR | Environmental Improvement Revenue | FGIC | Financial Guaranty Insurance |
| | | | Company |
| FHA | Federal Housing Administration | FHLB | Federal Home Loan Bank |
| FHLMC | Federal Home Loan Mortgage | FNMA | Federal National |
| | Corporation | | Mortgage Association |
| GAN | Grant Anticipation Notes | GIC | Guaranteed Investment Contract |
| GNMA | Government National | GO | General Obligation |
| | Mortgage Association | | |
| HR | Hospital Revenue | IDB | Industrial Development Board |
| IDC | Industrial Development Corporation | IDR | Industrial Development Revenue |
| LOC | Letter of Credit | LOR | Limited Obligation Revenue |
| LR | Lease Revenue | MFHR | Multi-Family Housing Revenue |
| MFMR | Multi-Family Mortgage Revenue | PCR | Pollution Control Revenue |
| PILOT | Payment in Lieu of Taxes | PUTTERS Puttable Tax-Exempt Receipts |
| RAC | Revenue Anticipation Certificates | RAN | Revenue Anticipation Notes |
| RAW | Revenue Anticipation Warrants | RRR | Resources Recovery Revenue |
| SAAN | State Aid Anticipation Notes | SBPA | Standby Bond Purchase Agreement |
| SFHR | Single Family Housing Revenue | SFMR | Single Family Mortgage Revenue |
| SONYMA | State of New York Mortgage Agency | SWDR | Solid Waste Disposal Revenue |
| TAN | Tax Anticipation Notes | TAW | Tax Anticipation Warrants |
| TRAN | Tax and Revenue Anticipation Notes | XLCA | XL Capital Assurance |
24
| | | | | |
| Summary of Combined Ratings (Unaudited) | |
| |
| Fitch | or | Moody’s | or | Standard & Poor’s | Value (%)† |
| AAA | | Aaa | | AAA | 23.7 |
| AA | | Aa | | AA | 29.2 |
| A | | A | | A | 32.4 |
| BBB | | Baa | | BBB | 12.2 |
| Not Ratede | | Not Ratede | | Not Ratede | 2.5 |
| | | | | | 100.0 |
|
| † Based on total investments. |
| e Securities which, while not rated by Fitch, Moody’s and Standard & Poor’s, have been determined by the Manager to |
| be of comparable quality to those rated securities in which the fund may invest. |
See notes to financial statements.
|
| STATEMENT OF ASSETS AND LIABILITIES |
| May 31, 2010 |
| | |
| | Cost | Value |
| Assets ($): | | |
| Investments in securities—See Statement of Investments | 1,282,777,318 | 1,335,446,336 |
| Cash | | 6,122,919 |
| Interest receivable | | 20,526,336 |
| Receivable for shares of Common Stock subscribed | | 279,735 |
| Prepaid expenses | | 49,899 |
| | | 1,362,425,225 |
| Liabilities ($): | | |
| Due to The Dreyfus Corporation and affiliates—Note 3(c) | | 834,539 |
| Payable for investment securities purchased | | 14,502,606 |
| Payable for shares of Common Stock redeemed | | 1,342,739 |
| Accrued expenses | | 181,739 |
| | | 16,861,623 |
| Net Assets ($) | | 1,345,563,602 |
| Composition of Net Assets ($): | | |
| Paid-in capital | | 1,317,906,728 |
| Accumulated net realized gain (loss) on investments | | (25,012,144) |
| Accumulated net unrealized appreciation | | |
| (depreciation) on investments | | 52,669,018 |
| Net Assets ($) | | 1,345,563,602 |
See notes to financial statements.
26
|
| STATEMENT OF OPERATIONS |
| Year Ended May 31, 2010 |
| |
| Investment Income ($): | |
| Interest Income | 65,635,414 |
| Expenses: | |
| Management fee—Note 3(a) | 8,001,581 |
| Shareholder servicing costs—Note 3(c) | 1,306,101 |
| Directors’ fees and expenses—Note 3(d) | 102,078 |
| Custodian fees—Note 3(c) | 98,052 |
| Professional fees | 84,609 |
| Registration fees | 76,982 |
| Distribution fees—Note 3(b) | 68,613 |
| Prospectus and shareholders’ reports | 23,263 |
| Loan commitment fees—Note 2 | 23,162 |
| Interest expense—Note 2 | 237 |
| Miscellaneous | 63,292 |
| Total Expenses | 9,847,970 |
| Less—reduction in expenses due to undertaking—Note 3(a) | (409) |
| Less—reduction in fees due to earnings credits—Note 1(b) | (1,749) |
| Net Expenses | 9,845,812 |
| Investment Income—Net | 55,789,602 |
| Realized and Unrealized Gain (Loss) on Investments—Note 4 ($): | |
| Net realized gain (loss) on investments | (16,672,613) |
| Net unrealized appreciation (depreciation) on investments | 69,698,995 |
| Net Realized and Unrealized Gain (Loss) on Investments | 53,026,382 |
| Net Increase in Net Assets Resulting from Operations | 108,815,984 |
| |
| See notes to financial statements. | |
��
STATEMENT OF CHANGES IN NET ASSETS
| | |
| | | Year Ended May 31, |
| | 2010 | 2009a |
| Operations ($): | | |
| Investment income—net | 55,789,602 | 58,391,935 |
| Net realized gain (loss) on investments | (16,672,613) | 2,782,328 |
| Net unrealized appreciation | | |
| (depreciation) on investments | 69,698,995 | (51,838,668) |
| Net Increase (Decrease) in Net Assets | | |
| Resulting from Operations | 108,815,984 | 9,335,595 |
| Dividends to Shareholders from ($): | | |
| Investment income—net: | | |
| Class A Shares | (4,771,285) | (4,678,138) |
| Class B Shares | (38,623) | (67,556) |
| Class C Shares | (264,949) | (210,117) |
| Class I Shares | (276,304) | (7,953) |
| Class Z Shares | (50,157,461) | (53,251,339) |
| Total Dividends | (55,508,622) | (58,215,103) |
| Capital Stock Transactions ($): | | |
| Net proceeds from shares sold: | | |
| Class A Shares | 32,361,154 | 35,053,151 |
| Class B Shares | 25,697 | 106,129 |
| Class C Shares | 3,509,430 | 4,381,967 |
| Class I Shares | 19,883,394 | 1,977,841 |
| Class Z Shares | 51,875,811 | 70,232,465 |
| Dividends reinvested: | | |
| Class A Shares | 3,417,236 | 3,208,842 |
| Class B Shares | 27,612 | 51,421 |
| Class C Shares | 182,954 | 127,855 |
| Class I Shares | 75,810 | 551 |
| Class Z Shares | 35,416,916 | 37,386,398 |
| Cost of shares redeemed: | | |
| Class A Shares | (35,278,189) | (27,913,770) |
| Class B Shares | (640,694) | (1,696,527) |
| Class C Shares | (1,636,028) | (2,812,813) |
| Class I Shares | (4,607,244) | (49,854) |
| Class Z Shares | (140,530,807) | (177,066,005) |
| Increase (Decrease) in Net Assets | | |
| from Capital Stock Transactions | (35,916,948) | (57,012,349) |
| Total Increase (Decrease) in Net Assets | 17,390,414 | (105,891,857) |
| Net Assets ($): | | |
| Beginning of Period | 1,328,173,188 | 1,434,065,045 |
| End of Period | 1,345,563,602 | 1,328,173,188 |
28
| | |
| | | Year Ended May 31, |
| | 2010 | 2009a |
| Capital Share Transactions: | | |
| Class Ab | | |
| Shares sold | 2,275,545 | 2,532,749 |
| Shares issued for dividends reinvested | 239,862 | 234,829 |
| Shares redeemed | (2,477,491) | (2,073,400) |
| Net Increase (Decrease) in Shares Outstanding | 37,916 | 694,178 |
| Class Bb | | |
| Shares sold | 1,838 | 7,708 |
| Shares issued for dividends reinvested | 1,943 | 3,749 |
| Shares redeemed | (45,575) | (121,790) |
| Net Increase (Decrease) in Shares Outstanding | (41,794) | (110,333) |
| Class C | | |
| Shares sold | 245,886 | 320,366 |
| Shares issued for dividends reinvested | 12,824 | 9,348 |
| Shares redeemed | (115,007) | (208,703) |
| Net Increase (Decrease) in Shares Outstanding | 143,703 | 121,011 |
| Class I | | |
| Shares sold | 1,391,676 | 143,899 |
| Shares issued for dividends reinvested | 5,269 | 40 |
| Shares redeemed | (328,089) | (3,642) |
| Net Increase (Decrease) in Shares Outstanding | 1,068,856 | 140,297 |
| Class Z | | |
| Shares sold | 3,650,671 | 5,082,834 |
| Shares issued for dividends reinvested | 2,486,133 | 2,734,794 |
| Shares redeemed | (9,892,804) | (13,027,962) |
| Net Increase (Decrease) in Shares Outstanding | (3,756,000) | (5,210,334) |
|
| a The fund commenced offering Class I shares on December 15, 2008. |
| b During the period ended May 31, 2010, 15,923 Class B shares representing $221,753 were automatically |
| converted to 15,923 Class A shares and during the period ended May 31, 2009, 7,057 Class B shares representing |
| $100,227 were automatically converted to 7,057 Class A shares. |
See notes to financial statements.
FINANCIAL HIGHLIGHTS
The following tables describe the performance for each share class for the fiscal periods indicated. All information (except portfolio turnover rate) reflects financial results for a single fund share.Total return shows how much your investment in the fund would have increased (or decreased) during each period, assuming you had reinvested all dividends and distributions.These figures have been derived from the fund’s financial statements.
| | | | | |
| | | Year Ended May 31, | |
| Class A Shares | 2010 | 2009 | 2008 | 2007 | 2006 |
| Per Share Data ($): | | | | | |
| Net asset value, beginning of period | 13.95 | 14.40 | 14.72 | 14.62 | 15.00 |
| Investment Operations: | | | | | |
| Investment income—neta | .57 | .57 | .57 | .57 | .58 |
| Net realized and unrealized | | | | | |
| gain (loss) on investments | .57 | (.45) | (.32) | .11 | (.37) |
| Total from Investment Operations | 1.14 | .12 | .25 | .68 | .21 |
| Distributions: | | | | | |
| Dividends from investment income—net | (.57) | (.57) | (.57) | (.57) | (.58) |
| Dividends from net realized | | | | | |
| gain on investments | — | — | — | (.01) | (.01) |
| Total Distributions | (.57) | (.57) | (.57) | (.58) | (.59) |
| Net asset value, end of period | 14.52 | 13.95 | 14.40 | 14.72 | 14.62 |
| Total Return (%)b | 8.30 | 1.00 | 1.78 | 4.75 | 1.44 |
| Ratios/Supplemental Data (%): | | | | | |
| Ratio of total expenses | | | | | |
| to average net assets | .92 | .96 | 1.02 | 1.06 | 1.04 |
| Ratio of net expenses | | | | | |
| to average net assets | .92c | .95 | 1.02c | 1.05 | 1.01 |
| Ratio of interest and expense related | | | | | |
| to floating rate notes issued | | | | | |
| to average net assets | — | .02 | .10 | .13 | .10 |
| Ratio of net investment income | | | | | |
| to average net assets | 3.99 | 4.18 | 3.96 | 3.87 | 3.90 |
| Portfolio Turnover Rate | 22.39 | 16.57 | 43.66 | 43.68 | 35.92 |
| Net Assets, end of period ($ x 1,000) | 123,053 | 117,685 | 111,504 | 95,698 | 81,579 |
| |
| a | Based on average shares outstanding at each month end. |
| b | Exclusive of sales charge. |
| c | Expense waivers and/or reimbursements amounted to less than .01%. |
See notes to financial statements.
30
| | | | | |
| | | Year Ended May 31, | |
| Class B Shares | 2010 | 2009 | 2008 | 2007 | 2006 |
| Per Share Data ($): | | | | | |
| Net asset value, beginning of period | 13.95 | 14.40 | 14.72 | 14.62 | 15.00 |
| Investment Operations: | | | | | |
| Investment income—neta | .48 | .48 | .49 | .49 | .50 |
| Net realized and unrealized | | | | | |
| gain (loss) on investments | .57 | (.43) | (.32) | .12 | (.37) |
| Total from Investment Operations | 1.05 | .05 | .17 | .61 | .13 |
| Distributions: | | | | | |
| Dividends from investment income—net | (.48) | (.50) | (.49) | (.50) | (.50) |
| Dividends from net realized | | | | | |
| gain on investments | — | — | — | (.01) | (.01) |
| Total Distributions | (.48) | (.50) | (.49) | (.51) | (.51) |
| Net asset value, end of period | 14.52 | 13.95 | 14.40 | 14.72 | 14.62 |
| Total Return (%)b | 7.65 | .46 | 1.22 | 4.20 | .93 |
| Ratios/Supplemental Data (%): | | | | | |
| Ratio of total expenses | | | | | |
| to average net assets | 1.52 | 1.52 | 1.58 | 1.58 | 1.56 |
| Ratio of net expenses | | | | | |
| to average net assets | 1.52c | 1.52c | 1.57 | 1.58c | 1.51 |
| Ratio of interest and expense related | | | | | |
| to floating rate notes issued | | | | | |
| to average net assets | — | .02 | .10 | .13 | .10 |
| Ratio of net investment income | | | | | |
| to average net assets | 3.41 | 3.62 | 3.40 | 3.35 | 3.39 |
| Portfolio Turnover Rate | 22.39 | 16.57 | 43.66 | 43.68 | 35.92 |
| Net Assets, end of period ($ x 1,000) | 913 | 1,460 | 3,097 | 5,411 | 6,626 |
| |
| a | Based on average shares outstanding at each month end. |
| b | Exclusive of sales charge. |
| c | Expense waivers and/or reimbursements amounted to less than .01%. |
See notes to financial statements.
FINANCIAL HIGHLIGHTS (continued)
| | | | | |
| | | Year Ended May 31, | |
| Class C Shares | 2010 | 2009 | 2008 | 2007 | 2006 |
| Per Share Data ($): | | | | | |
| Net asset value, beginning of period | 13.95 | 14.40 | 14.72 | 14.62 | 15.00 |
| Investment Operations: | | | | | |
| Investment income—neta | .45 | .46 | .46 | .46 | .46 |
| Net realized and unrealized | | | | | |
| gain (loss) on investments | .56 | (.45) | (.32) | .11 | (.37) |
| Total from Investment Operations | 1.01 | .01 | .14 | .57 | .09 |
| Distributions: | | | | | |
| Dividends from investment income—net | (.45) | (.46) | (.46) | (.46) | (.46) |
| Dividends from net realized | | | | | |
| gain on investments | — | — | — | (.01) | (.01) |
| Total Distributions | (.45) | (.46) | (.46) | (.47) | (.47) |
| Net asset value, end of period | 14.51 | 13.95 | 14.40 | 14.72 | 14.62 |
| Total Return (%)b | 7.36 | .22 | 1.00 | 3.95 | .67 |
| Ratios/Supplemental Data (%): | | | | | |
| Ratio of total expenses | | | | | |
| to average net assets | 1.72 | 1.73 | 1.79 | 1.82 | 1.80 |
| Ratio of net expenses | | | | | |
| to average net assets | 1.72c | 1.73c | 1.79c | 1.81 | 1.87 |
| Ratio of interest and expense related | | | | | |
| to floating rate notes issued | | | | | |
| to average net assets | — | .02 | .10 | .13 | .10 |
| Ratio of net investment income | | | | | |
| to average net assets | 3.18 | 3.39 | 3.18 | 3.10 | 3.13 |
| Portfolio Turnover Rate | 22.39 | 16.57 | 43.66 | 43.68 | 35.92 |
| Net Assets, end of period ($ x 1,000) | 9,653 | 7,272 | 5,767 | 4,451 | 3,054 |
| |
| a | Based on average shares outstanding at each month end. |
| b | Exclusive of sales charge. |
| c | Expense waivers and/or reimbursements amounted to less than .01%. |
See notes to financial statements.
32
| | |
| | Year Ended May 31, |
| Class I Shares | 2010 | 2009a |
| Per Share Data ($): | | |
| Net asset value, beginning of period | 13.94 | 12.60 |
| Investment Operations: | | |
| Investment income—netb | .59 | .24 |
| Net realized and unrealized | | |
| gain (loss) on investments | .58 | 1.38 |
| Total from Investment Operations | 1.17 | 1.62 |
| Distributions: | | |
| Dividends from investment income—net | (.60) | (.28) |
| Net asset value, end of period | 14.51 | 13.94 |
| Total Return (%) | 8.57 | 12.97c |
| Ratios/Supplemental Data (%): | | |
| Ratio of total expenses to average net assets | .68 | .70d |
| Ratio of net expenses to average net assets | .67 | .70d,e |
| Ratio of interest and expense related to | | |
| floating rate notes issued to average net assets | — | —f |
| Ratio of net investment income to average net assets | 4.20 | 4.33d |
| Portfolio Turnover Rate | 22.39 | 16.57 |
| Net Assets, end of period ($ x 1,000) | 17,546 | 1,956 |
| |
| a | From December 15, 2008 (commencement of initial offering) to May 31, 2009. |
| b | Based on average shares outstanding at each month end. |
| c | Not annualized. |
| d | Annualized. |
| e | Expense waivers and/or reimbursements amounted to less than .01%. |
| f | There were no floating rate notes outstanding during the class’ period of operations. |
See notes to financial statements.
FINANCIAL HIGHLIGHTS (continued)
| | | | | |
| | | | Year Ended May 31, | |
| Class Z Shares | 2010 | 2009 | 2008 | 2007 | 2006 |
| Per Share Data ($): | | | | | |
| Net asset value, | | | | | |
| beginning of period | 13.95 | 14.40 | 14.71 | 14.61 | 15.00 |
| Investment Operations: | | | | | |
| Investment income—neta | .60 | .60 | .61 | .61 | .61 |
| Net realized and unrealized | | | | | |
| gain (loss) on investments | .57 | (.45) | (.31) | .11 | (.38) |
| Total from Investment Operations | 1.17 | .15 | .30 | .72 | .23 |
| Distributions: | | | | | |
| Dividends from | | | | | |
| investment income—net | (.60) | (.60) | (.61) | (.61) | (.61) |
| Dividends from net realized | | | | | |
| gain on investments | — | — | — | (.01) | (.01) |
| Total Distributions | (.60) | (.60) | (.61) | (.62) | (.62) |
| Net asset value, end of period | 14.52 | 13.95 | 14.40 | 14.71 | 14.61 |
| Total Return (%) | 8.52 | 1.22 | 2.08 | 4.97 | 1.57 |
| Ratios/Supplemental Data (%): | | | | | |
| Ratio of total expenses | | | | | |
| to average net assets | .71 | .74 | .81 | .84 | .81 |
| Ratio of net expenses | | | | | |
| to average net assets | .71b | .74b | .80 | .83 | .81 |
| Ratio of interest and expense related | | | | |
| to floating rate notes issued | | | | | |
| to average net assets | — | .02 | .10 | .13 | .10 |
| Ratio of net investment income | | | | | |
| to average net assets | 4.21 | 4.39 | 4.19 | 4.09 | 4.10 |
| Portfolio Turnover Rate | 22.39 | 16.57 | 43.66 | 43.68 | 35.92 |
| Net Assets, end of period | | | | | |
| ($ x 1,000) | 1,194,399 | 1,199,800 | 1,313,697 | 1,125,008 | 1,155,038 |
| |
| a | Based on average shares outstanding at each month end. |
| b | Expense waivers and/or reimbursements amounted to less than .01%. |
See notes to financial statements.
34
NOTES TO FINANCIAL STATEMENTS
NOTE 1—Significant Accounting Policies:
Dreyfus California AMT-Free Municipal Bond Fund (the “fund”) is the sole series of Dreyfus Premier California AMT-Free Municipal Bond Fund Inc. (the “Company”), which is registered under the Investment Company Act of 1940, as amended (the “Act”), as a non-diversified open-end management investment company. The fund’s investment objective is to provide investors with a high level of current income exempt from federal and California state income taxes, as is consistent with the preservation of capital. The Dreyfus Corporation (the “Manager” or “Dreyfus”), a wholly-owned subsidiary of The Bank of New York Mellon Corporation (“BNY Mellon”), serves as the fund’s investment adviser.
MBSC Securities Corporation (the “Distributor”), a wholly-owned subsidiary of the Manager, is the distributor of the fund’s shares. The fund is authorized to issue 600 million shares of $.001 par value Common Stock.The fund currently offers five classes of shares: Class A (100 million shares authorized), Class B (100 million shares authorized), Class C (100 million shares authorized), Class I (100 million shares authorized) and Class Z (200 million shares authorized). Class A shares are subject to a sales charge imposed at the time of purchase. Class B shares are subject to a contingent deferred sales charge (“CDSC”) imposed on Class B share redemptions made within six years of purchase and automatically convert to Class A shares after six years. The fund does not offer Class B shares, except in connection with dividend reinvestment and permitted exchanges of Class B shares. Class C shares are subject t o a CDSC imposed on Class C shares redeemed within one year of purchase. Class I shares are sold at net asset value per share only to institutional investors. Class Z shares are sold at net asset value per share generally only to shareholders who received Class Z shares in exchange for their shares of General California Municipal Bond Fund, California Municipal Income, Inc.
NOTES TO FINANCIAL STATEMENTS (continued)
and Dreyfus California Intermediate Municipal Bond Fund, as a result of the reorganization of such funds. Class Z shares generally are not available for new accounts. Other differences between the classes include the services offered to and the expenses borne by each class, the allocation of certain transfer agency costs and certain voting rights. Income, expenses (other than expenses attributable to a specific class), and realized and unrealized gains or losses on investments are allocated to each class of shares based on its relative net assets.
The Financial Accounting Standards Board (“FASB”) Accounting Standards Codification (“ASC”) has become the exclusive reference of authoritative U.S. generally accepted accounting principles (“GAAP”) recognized by the FASB to be applied by nongovernmental entities. Rules and interpretive releases of the Securities and Exchange Commission (“SEC”) under authority of federal laws are also sources of authoritative GAAP for SEC registrants. The ASC has superseded all existing non-SEC accounting and reporting standards. The fund’s financial statements are prepared in accordance with GAAP, which may require the use of management estimates and assumptions.Actual results could differ from those estimates.
The Company enters into contracts that contain a variety of indemnifications. The fund’s maximum exposure under these arrangements is unknown.The fund does not anticipate recognizing any loss related to these arrangements.
(a) Portfolio valuation: Investments in securities are valued each business day by an independent pricing service (the “Service”) approved by the Board of Directors. Investments for which quoted bid prices are readily available and are representative of the bid side of the market in the judgment of the Service are valued at the mean between the quoted bid prices (as obtained by the Service from dealers in such securities) and asked prices (as calculated by the Service based upon its evaluation of the market for such securities). Other investments (which constitute a majority of the portfolio securities) are carried at fair value as deter-
36
mined by the Service, based on methods which include consideration of: yields or prices of municipal securities of comparable quality, coupon, maturity and type; indications as to values from dealers; and general market conditions. Options and financial futures on municipal and U.S.Treasury securities are valued at the last sales price on the securities exchange on which such securities are primarily traded or at the last sales price on the national securities market on each business day.
The fair value of a financial instrument is the amount that would be received to sell an asset or paid to transfer a liability in an orderly transaction between market participants at the measurement date (i.e. the exit price). GAAP establishes a fair value hierarchy that prioritizes the inputs of valuation techniques used to measure fair value.This hierarchy gives the highest priority to unadjusted quoted prices in active markets for identical assets or liabilities (Level 1 measurements) and the lowest priority to unobservable inputs (Level 3 measurements).
Additionally, GAAP provides guidance on determining whether the volume and activity in a market has decreased significantly and whether such a decrease in activity results in transactions that are not orderly. GAAP requires enhanced disclosures around valuation inputs and techniques used during annual and interim periods.
Various inputs are used in determining the value of the fund’s investments relating to fair value measurements.These inputs are summarized in the three broad levels listed below:
Level 1—unadjusted quoted prices in active markets for
identical investments.
Level 2—other significant observable inputs (including quoted
prices for similar investments, interest rates, prepayment speeds,
credit risk, etc.).
Level 3—significant unobservable inputs (including the fund’s own
assumptions in determining the fair value of investments).
NOTES TO FINANCIAL STATEMENTS (continued)
The inputs or methodology used for valuing securities are not necessarily an indication of the risk associated with investing in those securities.
The following is a summary of the inputs used as of May 31, 2010 in valuing the fund’s investments:
| | | | |
| | | Level 2—Other | Level 3— | |
| | Level 1— | Significant | Significant | |
| | Unadjusted | Observable | Unobservable | |
| | Quoted Prices | Inputs | Inputs | Total |
| Assets ($) | | | | |
| Investments in Securities: | | | |
| Municipal Bonds | — | 1,335,446,336 | — | 1,335,446,336 |
In January 2010, FASB issued Accounting Standards Update (“ASU”) No. 2010-06 “Improving Disclosures about Fair Value Measurements”. ASU 2010-06 will require reporting entities to make new disclosures about amounts and reasons for significant transfers in and out of Level 1 and Level 2 fair value measurements as well as inputs and valuation techniques used to measure fair value for both recurring and nonrecurring fair value measurements that fall in either Level 2 or Level 3, and information on purchases, sales, issuances and settlements on a gross basis in the reconciliation of activity in Level 3 fair value measurements. The new and revised disclosures are required to be implemented for fiscal years beginning after December 15, 2009 except for the disclosures surrounding purchases,sales,issuances and settlements on a gross basis in the reconciliation of Level 3 fair value measurements, which are effective f or fiscal years beginning after December 15, 2010. Management is currently evaluating the impact the adoption of ASU No. 2010-06 may have on the fund’s financial statement disclosures.
(b) Securities transactions and investment income: Securities transactions are recorded on a trade date basis. Interest income, adjusted for accretion of discount and amortization of premium on investments, is earned from settlement date and recognized on the accrual basis. Realized gains and losses from securities transactions are recorded on the identified cost basis. Securities purchased or sold on a when-issued or delayed-delivery basis may be settled a month or more after the trade date.
38
The fund has arrangements with the custodian and cash management bank whereby the fund may receive earnings credits from the custodian when positive cash balances are maintained, which are used to offset custody and cash management fees. For financial reporting purposes, the fund includes net earnings credits as an expense offset in the Statement of Operations.
The fund follows an investment policy of investing primarily in municipal obligations of one state. Economic changes affecting the state and certain of its public bodies and municipalities may affect the ability of issuers within the state to pay interest on, or repay principal of, municipal obligations held by the fund.
(c) Dividends to shareholders: It is the policy of the fund to declare dividends daily from investment income-net. Such dividends are paid monthly. Dividends from net realized capital gains, if any, are normally declared and paid annually, but the fund may make distributions on a more frequent basis to comply with the distribution requirements of the Internal Revenue Code of 1986, as amended (the “Code”).To the extent that net realized capital gains can be offset by capital loss carryovers, it is the policy of the fund not to distribute such gains. Income and capital gain distributions are determined in accordance with income tax regulations, which may differ from GAAP.
(d) Federal income taxes: It is the policy of the fund to continue to qualify as a regulated investment company, which can distribute tax exempt dividends, by complying with the applicable provisions of the Code, and to make distributions of income and net realized capital gain sufficient to relieve it from substantially all federal income and excise taxes.
As of and during the period ended May 31, 2010, the fund did not have any liabilities for any uncertain tax positions.The fund recognizes interest and penalties, if any, related to uncertain tax positions as income tax expense in the Statement of Operations. During the period, the fund did not incur any interest or penalties.
NOTES TO FINANCIAL STATEMENTS (continued)
Each of the tax years in the four-year period ended May 31, 2010 remains subject to examination by the Internal Revenue Service and state taxing authorities.
At May 31, 2010, the components of accumulated earnings on a tax basis were as follows: undistributed tax exempt income $566,377, accumulated capital losses $24,624,833 and unrealized appreciation $53,139,497. In addition, the fund had $857,790 of capital losses realized after October 31, 2009, which were deferred for tax purposes to the first day of the following fiscal year.
The accumulated capital loss carryover is available for federal income tax purposes to be applied against future net securities profits, if any, realized subsequent to May 31, 2010. If not applied, $5,001,471 of the carryover expires in fiscal 2011, $187,278 expires in fiscal 2014, $3,616,725 expires in fiscal 2016 and $15,819,359 expires in fiscal 2018. Based on certain provisions in the Code, some of these losses acquired from fund mergers are subject to an annual limitation.
The tax character of distributions paid to shareholders during the fiscal periods ended May 31, 2010 and May 31, 2009 were as follows: tax exempt income $55,373,408 and $58,188,156 and ordinary income $135,214 and $26,947, respectively.
During the period ended May 31, 2010, as a result of permanent book to tax differences, primarily due to the tax treatment for amortization adjustments and dividend reclassification, the fund decreased accumulated undistributed investment income-net by $280,980, increased accumulated net realized gain (loss) on investments by $123,427 and increased paid-in capital by $157,553. Net assets and net asset value per share were not affected by this reclassification.
NOTE 2—Bank Lines of Credit:
The fund participates with other Dreyfus-managed funds in a $225 million unsecured credit facility led by Citibank, N.A. and a $300 million unsecured credit facility provided by The Bank of New York Mellon, a subsidiary of BNY Mellon and an affiliate of Dreyfus (each,
40
a “Facility”), each to be utilized primarily for temporary or emergency purposes, including the financing of redemptions. In connection therewith, the fund has agreed to pay its pro rata portion of commitment fees for each Facility. Interest is charged to the fund based on rates determined pursuant to the terms of the respective Facility at the time of borrowing.
The average amount of borrowings outstanding under the Facilities during the period ended May 31, 2010, was approximately $19,900 with a related weighted average annualized interest rate of 1.41%.
NOTE 3—Management Fee and Other Transactions with Affiliates:
(a) Pursuant to a management agreement (“Agreement”) with the Manager, the management fee is computed at the annual rate of .60% of the value of the fund’s average daily net assets and is payable monthly. The Agreement provides that if in any fiscal year the aggregate expenses allocable to Class Z shares, exclusive of taxes, brokerage fees, interest on borrowings, commitment fees and extraordinary expenses, exceed 1 1 / 2% of the value of the average daily net assets of Class Z shares, the fund may deduct from the fees paid to the Manager, or the Manager will bear such excess expense. During the period ended May 31, 2010, there was no expense reimbursement pursuant to the Agreement.
The Manager had undertaken from June 1, 2009 through May 31, 2010 to reduce the expenses paid by Class I shares, to the extent that Class I shares aggregate annual expenses, exclusive of certain expenses as described above, do not exceed an annual rate of .70% of the value of the average daily net assets of Class I shares. The reduction in expenses for Class I shares, pursuant to the undertaking, amounted to $409 during the period ended May 31, 2010.
During the period ended May 31, 2010, the Distributor retained $21,450 from commissions earned on sales of the fund’s Class A shares and $22,728 and $4,152 from CDSCs on redemptions of the fund’s Class B and Class C shares, respectively.
NOTES TO FINANCIAL STATEMENTS (continued)
(b) Under the Distribution Plan (the “Plan”) adopted pursuant to Rule 12b-1 under the Act, Class B and Class C shares pay the Distributor for distributing their shares at an annual rate of .50% of the value of the average daily net assets of Class B shares and .75% of the value of the average daily net assets of Class C shares. During the period ended May 31, 2010, Class B and Class C shares were charged $5,701 and $62,912, respectively, pursuant to the Plan.
(c) Under the Shareholder Services Plan, Class A, Class B and Class C shares pay the Distributor at an annual rate of .25% of the value of the average daily net assets of their shares, for the provision of certain services.The services provided may include personal services relating to shareholder accounts, such as answering shareholder inquiries regarding the fund and providing reports and other information, and services related to the maintenance of shareholder accounts. The Distributor may make payments to Service Agents (a securities dealer, financial institution or other industry professional) in respect of these services. The Distributor determines the amounts to be paid to Service Agents. During the period ended May 31, 2010, Class A, Class B and Class C shares were charged $300,414, $2,851 and $20,971, respectively, pursuant to the Shareholder Services Plan.
Under the Shareholder Services Plan, Class Z shares reimburse the Distributor an amount not to exceed an annual rate of .25% of the value of Class Z shares’ average daily net assets for certain allocated expenses of providing personal services and/or maintaining shareholder accounts.The services provided may include personal services relating to shareholder accounts, such as answering shareholder inquiries regarding Class Z shares and providing reports and other information, and services related to the maintenance of shareholder accounts. During the period ended May 31, 2010, Class Z shares were charged $397,969 pursuant to the Shareholder Services Plan.
The fund compensates Dreyfus Transfer, Inc., a wholly-owned subsidiary of the Manager, under a transfer agency agreement for providing personnel and facilities to perform transfer agency services for the
42
fund. During the period ended May 31, 2010, the fund was charged $303,621 pursuant to the transfer agency agreement, which is included in Shareholder servicing costs in the Statement of Operations.
The fund compensates The Bank of New York Mellon under a cash management agreement for performing cash management services related to fund subscriptions and redemptions. During the period ended May 31, 2010, the fund was charged $32,088 pursuant to the cash management agreement, which is included in Shareholder servicing costs in the Statement of Operations.These fees were partially offset by earnings credits of $1,749.
The fund also compensates The Bank of New York Mellon under a custody agreement for providing custodial services for the fund. During the period ended May 31, 2010, the fund was charged $98,052 pursuant to the custody agreement.
During the period ended May 31, 2010, the fund was charged $5,436 for services performed by the Chief Compliance Officer.
The components of “Due to The Dreyfus Corporation and affiliates” in the Statement of Assets and Liabilities consist of: management fees $684,710, Rule 12b-1 distribution plan fees $6,504, shareholder services plan fees $27,545, custodian fees $30,890, chief compliance officer fees $3,656 and transfer agency per account fees $81,643, which are offset against an expense reimbursement currently in effect in the amount of $409.
(d) Each Board member also serves as a Board member of other funds within the Dreyfus complex. Annual retainer fees and attendance fees are allocated to each fund based on net assets.
NOTE 4—Securities Transactions:
The aggregate amount of purchases and sales of investment securities, excluding short-term securities, during the period ended May 31, 2010, amounted to $295,387,280 and $308,021,652, respectively.
NOTES TO FINANCIAL STATEMENTS (continued)
The provisions of ASC Topic 815 “Derivatives and Hedging” require qualitative disclosures about objectives and strategies for using derivatives, quantitative disclosures about fair value amounts of gains and losses on derivative instruments and disclosures about credit-risk-related contingent features in derivative agreements. The fund held no derivatives during the period ended May 31, 2010.These disclosures did not impact the notes to the financial statements.
At May 31,2010,the cost of investments for federal income tax purposes was $1,282,306,839; accordingly, accumulated net unrealized appreciation on investments was $53,139,497, consisting of $66,700,403 gross unrealized appreciation and $13,560,906 gross unrealized depreciation.
44
|
| REPORT OF INDEPENDENT REGISTERED |
| PUBLIC ACCOUNTING FIRM |
Shareholders and Board of Directors
Dreyfus California AMT-Free Municipal Bond Fund
We have audited the accompanying statement of assets and liabilities, including the statement of investments, of Dreyfus California AMT-Free Municipal Bond Fund, (the sole series comprising Dreyfus Premier California AMT-Free Municipal Bond Fund Inc.) as of May 31, 2010, and the related statement of operations for the year then ended, the statement of changes in net assets for each of the two years in the period then ended and financial highlights for each of the periods indicated therein. These financial statements and financial highlights are the responsibility of the Fund’s management. Our responsibility is to express an opinion on these financial statements and financial highlights based on our audits.
We conducted our audits in accordance with the standards of the Public Company Accounting Oversight Board (United States).Those standards require that we plan and perform the audit to obtain reasonable assurance about whether the financial statements and financial highlights are free of material misstatement.We were not engaged to perform an audit of the Fund’s internal control over financial reporting. Our audits included consideration of internal control over financial reporting as a basis for designing audit procedures that are appropriate in the circumstances, but not for the purpose of expressing an opinion on the effectiveness of the Fund’s internal control over financial reporting. Accordingly, we express no such opinion.An audit also includes examining, on a test basis, evidence supporting the amounts and disclosures in the financial statements and financial highlights, assessing the accounting principles used and significant estimates made by management, and evaluating the overall financial statement presentation. Our procedures included confirmation of securities owned as of May 31, 2010 by correspondence with the custodian and others.We believe that our audits provide a reasonable basis for our opinion.
In our opinion, the financial statements and financial highlights referred to above present fairly, in all material respects, the financial position of Dreyfus California AMT-Free Municipal Bond Fund at May 31, 2010, the results of its operations for the year then ended, the changes in its net assets for each of the two years in the period then ended, and the financial highlights for each of the indicated periods, in conformity with U.S. generally accepted accounting principles.
IMPORTANT TAX INFORMATION (Unaudited)
In accordance with federal tax law, the fund hereby designates all the dividends paid from investment income-net during its fiscal year ended May 31, 2010 as “exempt-interest dividends” (not subject to regular federal income tax, and for individuals who are California residents, California personal income taxes), except $135,214 that is being designated as an ordinary income distribution for reporting purposes.Where required by federal tax law rules, shareholders will receive notification of their portion of the fund’s taxable ordinary dividends (if any) and capital gains distributions (if any) paid for the 2010 calendar year on Form 1099-DIV and their portion of the fund’s tax-exempt dividends paid for the 2010 calendar year on Form 1099-INT, both of which will be mailed by early 2011.
46
BOARD MEMBERS INFORMATION (Unaudited)
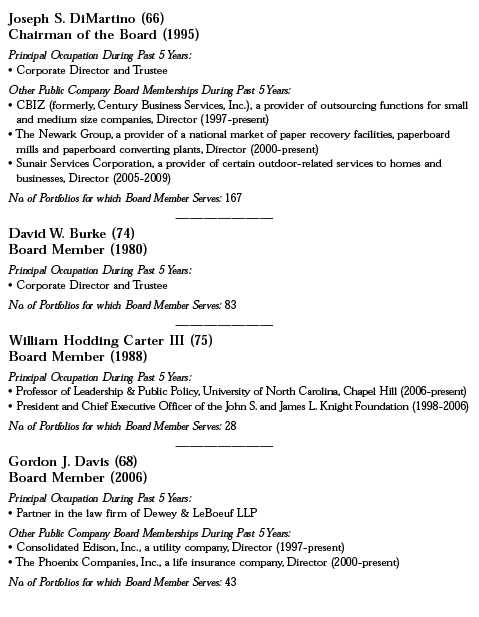
BOARD MEMBERS INFORMATION (Unaudited) (continued)
48
———————
Once elected all Board Members serve for an indefinite term, but achieve Emeritus status upon reaching age 80.The address of the Board Members and Officers is in c/o The Dreyfus Corporation, 200 Park Avenue, NewYork, NewYork 10166.Additional information about the Board Members is available in the fund’s Statement of Additional Information which can be obtained from Dreyfus free of charge by calling this toll free number: 1-800-554-4611.
Arnold S. Hiatt, Emeritus Board Member
OFFICERS OF THE FUND (Unaudited)
50
OFFICERS OF THE FUND (Unaudited) (continued)
52
For More Information
Telephone Call your financial representative or 1-800-554-4611 Holders of Class Z call 1-800-645-6561
Mail The Dreyfus Family of Funds, 144 Glenn Curtiss Boulevard, Uniondale, NY 11556-0144
The fund files its complete schedule of portfolio holdings with the Securities and Exchange Commission (“SEC”) for the first and third quarters of each fiscal year on Form N-Q. The fund's Forms N-Q are available on the SEC’s website at http://www.sec.gov and may be reviewed and copied at the SEC’s Public Reference Room in Washington, DC. Information on the operation of the Public Reference Room may be obtained by calling 1-800-SEC-0330.
Information regarding how the fund voted proxies relating to portfolio securities for the most recent 12-month period ended June 30 is available on the SEC’s website at http://www.sec.gov and without charge, upon request, by calling 1-800-645-6561.

Item 2. Code of Ethics.
The Registrant has adopted a code of ethics that applies to the Registrant's principal executive officer, principal financial officer, principal accounting officer or controller, or persons performing similar functions. There have been no amendments to, or waivers in connection with, the Code of Ethics during the period covered by this Report.
Item 3. Audit Committee Financial Expert.
The Registrant's Board has determined that Ehud Houminer, a member of the Audit Committee of the Board, is an audit committee financial expert as defined by the Securities and Exchange Commission (the "SEC"). Mr. Houminer is "independent" as defined by the SEC for purposes of audit committee financial expert determinations.
Item 4. Principal Accountant Fees and Services.
(a) Audit Fees. The aggregate fees billed for each of the last two fiscal years (the "Reporting Periods") for professional services rendered by the Registrant's principal accountant (the "Auditor") for the audit of the Registrant's annual financial statements or services that are normally provided by the Auditor in connection with the statutory and regulatory filings or engagements for the Reporting Periods, were $44,719 in 2009 and $44,719 in 2010.
(b) Audit-Related Fees. The aggregate fees billed in the Reporting Periods for assurance and related services by the Auditor that are reasonably related to the performance of the audit of the Registrant's financial statements and are not reported under paragraph (a) of this Item 4 were $5,276 in 2009 and $5,382 in 2010. These services consisted of one or more of the following: (i) agreed upon procedures related to compliance with Internal Revenue Code section 817(h), (ii) security counts required by Rule 17f-2 under the Investment Company Act of 1940, as amended, (iii) advisory services as to the accounting or disclosure treatment of Registrant transactions or events and (iv) advisory services to the accounting or disclosure treatment of the actual or potential impact to the Registrant of final or proposed rules, standards or interpretations by the Securities and Exchange Commission, the Financial Accounting Standards Boards or other regulatory or standard-setting bodies.
The aggregate fees billed in the Reporting Periods for non-audit assurance and related services by the Auditor to the Registrant's investment adviser (not including any sub-investment adviser whose role is primarily portfolio management and is subcontracted with or overseen by another investment adviser), and any entity controlling, controlled by or under common control with the investment adviser that provides ongoing services to the Registrant ("Service Affiliates"), that were reasonably related to the performance of the annual audit of the Service Affiliate, which required pre-approval by the Audit Committee were $0 in 2009 and $0 in 2010.
(c) Tax Fees. The aggregate fees billed in the Reporting Periods for professional services rendered by the Auditor for tax compliance, tax advice, and tax planning ("Tax Services") were $3,234 in 2009 and $3,934 in 2010. These services consisted of: (i) review or preparation of U.S. federal, state, local and excise tax returns; (ii) U.S. federal, state and local tax planning, advice and assistance regarding statutory, regulatory or administrative developments; (iii) tax advice regarding tax qualification matters and/or treatment of various financial instruments held or proposed to be acquired or held. The aggregate fees billed in the Reporting Periods for Tax Services by the Auditor to Service Affiliates, which required pre-approval by the Audit Committee were $0 in 2009 and $0 in 2010.
(d) All Other Fees. The aggregate fees billed in the Reporting Periods for products and services provided by the Auditor, other than the services reported in paragraphs (a) through (c) of this Item, were $377 in 2009 and $0 in 2010. These services consisted of a review of the Registrant's anti-money laundering program.
The aggregate fees billed in the Reporting Periods for Non-Audit Services by the Auditor to Service Affiliates, other than the services reported in paragraphs (b) through (c) of this Item, which required pre-approval by the Audit Committee, were $0 in 2009 and $0 in 2010.
(e)(1) Audit Committee Pre-Approval Policies and Procedures. The Registrant's Audit Committee has established policies and procedures (the "Policy") for pre-approval (within specified fee limits) of the Auditor's engagements for non-audit services to the Registrant and Service Affiliates without specific case-by-case consideration. The pre-approved services in the Policy can include pre-approved audit services, pre-approved audit-related services, pre-approved tax services and pre-approved all other services. Pre-approval considerations include whether the proposed services are compatible with maintaining the Auditor's independence. Pre-approvals pursuant to the Policy are considered annually.
(e)(2) Note: None of the services described in paragraphs (b) through (d) of this Item 4 were approved by the Audit Committee pursuant to paragraph (c)(7)(i)(C) of Rule 2-01 of Regulation S-X.
(f) None of the hours expended on the principal accountant's engagement to audit the registrant's financial statements for the most recent fiscal year were attributed to work performed by persons other than the principal account's full-time, permanent employees.
Non-Audit Fees. The aggregate non-audit fees billed by the Auditor for services rendered to the Registrant, and rendered to Service Affiliates, for the Reporting Periods were $20,898,574 in 2009 and $28,017,293 in 2010.
Auditor Independence. The Registrant's Audit Committee has considered whether the provision of non-audit services that were rendered to Service Affiliates, which were not pre-approved (not requiring pre-approval), is compatible with maintaining the Auditor's independence.
| |
| Item 5. | Audit Committee of Listed Registrants. |
| | Not applicable. [CLOSED-END FUNDS ONLY] |
| Item 6. | Investments. |
| (a) | Not applicable. |
| Item 7. | Disclosure of Proxy Voting Policies and Procedures for Closed-End Management |
| | Investment Companies. |
| | Not applicable. [CLOSED-END FUNDS ONLY] |
| Item 8. | Portfolio Managers of Closed-End Management Investment Companies. |
| | Not applicable. [CLOSED-END FUNDS ONLY, beginning with reports for periods ended |
| | on and after December 31, 2005] |
| Item 9. | Purchases of Equity Securities by Closed-End Management Investment Companies and |
| | Affiliated Purchasers. |
| |
| | Not applicable. [CLOSED-END FUNDS ONLY] |
| Item 10. | Submission of Matters to a Vote of Security Holders. |
| | There have been no material changes to the procedures applicable to Item 10. |
| Item 11. | Controls and Procedures. |
(a) The Registrant's principal executive and principal financial officers have concluded, based on their evaluation of the Registrant's disclosure controls and procedures as of a date within 90 days of the filing date of this report, that the Registrant's disclosure controls and procedures are reasonably designed to ensure that information required to be disclosed by the Registrant on Form N-CSR is recorded, processed, summarized and reported within the required time periods and that information required to be disclosed by the Registrant in the reports that it files or submits on Form N-CSR is accumulated and communicated to the Registrant's management, including its principal executive and principal financial officers, as appropriate to allow timely decisions regarding required disclosure.
(b) There were no changes to the Registrant's internal control over financial reporting that occurred during the second fiscal quarter of the period covered by this report that have materially affected, or are reasonably likely to materially affect, the Registrant's internal control over financial reporting.
(a)(1) Code of ethics referred to in Item 2.
(a)(2) Certifications of principal executive and principal financial officers as required by Rule 30a-2(a) under the Investment Company Act of 1940.
(a)(3) Not applicable.
(b) Certification of principal executive and principal financial officers as required by Rule 30a-2(b) under the Investment Company Act of 1940.
SIGNATURES
Pursuant to the requirements of the Securities Exchange Act of 1934 and the Investment Company Act of 1940, the Registrant has duly caused this Report to be signed on its behalf by the undersigned, thereunto duly authorized.
DREYFUS PREMIER CALIFORNIA AMT-FREE MUNICIPAL BOND FUND, INC.
- Dreyfus California AMT-Free Municipal Bond Fund
| |
| By: | /s/ Bradley J. Skapyak |
| | Bradley J. Skapyak, |
| | President |
| |
| Date: | July 23, 2010 |
Pursuant to the requirements of the Securities Exchange Act of 1934 and the Investment Company Act of 1940, this Report has been signed below by the following persons on behalf of the Registrant and in the capacities and on the dates indicated.
| |
| By: | /s/ Bradley J. Skapyak |
| | Bradley J. Skapyak, |
| | President |
| |
| Date: | July 23 2010 |
| |
| By: | /s/ James Windels |
| James Windels, |
| | Treasurer |
| |
| Date: | July 23, 2010 |
EXHIBIT INDEX
(a)(1) Code of ethics referred to in Item 2.
(a)(2) Certifications of principal executive and principal financial officers as required by Rule 30a-2(a) under the Investment Company Act of 1940. (EX-99.CERT)
(b) Certification of principal executive and principal financial officers as required by Rule 30a-2(b) under the Investment Company Act of 1940. (EX-99.906CERT)
