UNITED STATES
SECURITIES AND EXCHANGE COMMISSION
Washington, D.C. 20549
FORM N-CSR
CERTIFIED SHAREHOLDER REPORT OF REGISTERED MANAGEMENT
INVESTMENT COMPANIES
Investment Company Act file number 811- 3757
DREYFUS PREMIER CALIFORNIA AMT-FREE MUNICIPAL BOND FUND, INC.
- Dreyfus California AMT-Free Municipal Bond Fund
(Exact name of Registrant as specified in charter)
c/o The Dreyfus Corporation
200 Park Avenue
New York, New York 10166
(Address of principal executive offices) (Zip code)
John Pak, Esq.
200 Park Avenue
New York, New York 10166
(Name and address of agent for service)
Registrant's telephone number, including area code: (212) 922-6000
Date of fiscal year end: 5/31
Date of reporting period: 5/31/14
FORM N-CSR
Item 1. Reports to Stockholders.
|
| Dreyfus |
| California AMT-Free |
| Municipal Bond Fund |
ANNUAL REPORT May 31, 2014

Save time. Save paper. View your next shareholder report online as soon as it’s available. Log into www.dreyfus.com and sign up for Dreyfus eCommunications. It’s simple and only takes a few minutes.
The views expressed in this report reflect those of the portfolio manager only through the end of the period covered and do not necessarily represent the views of Dreyfus or any other person in the Dreyfus organization. Any such views are subject to change at any time based upon market or other conditions and Dreyfus disclaims any responsibility to update such views.These views may not be relied on as investment advice and, because investment decisions for a Dreyfus fund are based on numerous factors, may not be relied on as an indication of trading intent on behalf of any Dreyfus fund.
|
| Not FDIC-Insured • Not Bank-Guaranteed • May Lose Value |
| | Contents |
| | THE FUND |
| 2 | A Letter from the President |
| 3 | Discussion of Fund Performance |
| 6 | Fund Performance |
| 8 | Understanding Your Fund’s Expenses |
| 8 | Comparing Your Fund’s Expenses With Those of Other Funds |
| 9 | Statement of Investments |
| 23 | Statement of Assets and Liabilities |
| 24 | Statement of Operations |
| 25 | Statement of Changes in Net Assets |
| 28 | Financial Highlights |
| 33 | Notes to Financial Statements |
| 46 | Report of Independent Registered Public Accounting Firm |
| 47 | Important Tax Information |
| 48 | Board Members Information |
| 51 | Officers of the Fund |
| | FOR MORE INFORMATION |
| | Back Cover |
Dreyfus
California AMT-Free
Municipal Bond Fund
The Fund
A LETTER FROM THE PRESIDENT
Dear Shareholder:
We are pleased to present this annual report for Dreyfus California AMT-Free Municipal Bond Fund, covering the 12-month period from June 1, 2013, through May 31, 2014. For information about how the fund performed during the reporting period, as well as general market perspectives, we provide a Discussion of Fund Performance on the pages that follow.
In the wake of heightened market volatility over much of 2013, municipal bonds generally stabilized over the first five months of 2014, enabling them to post positive total returns, on average, for the reporting period overall.Although concerns regarding a shift to a more moderately accommodative monetary policy initially roiled fixed income markets, investors later took the Federal Reserve Board’s actions in stride. Moreover, investor demand rebounded while the supply of newly issued securities ebbed, and most states and municipalities saw improved credit conditions in the recovering U.S. economy.
We remain cautiously optimistic regarding the municipal bond market’s prospects over the months ahead.We expect the domestic economy to continue to strengthen, which could support higher tax revenues for most states and municipalities.We also anticipate rising demand for a limited supply of securities as more income-oriented investors seek the tax advantages of municipal bonds. As always, we encourage you to discuss our observations with your financial advisor to assess their potential impact on your investments.
Thank you for your continued confidence and support.

J. Charles Cardona
President
The Dreyfus Corporation
June 16, 2014
2
DISCUSSION OF FUND PERFORMANCE
For the period of June 1, 2013, through May 31, 2014, as provided by Jeffrey B. Burger, Primary Portfolio Manager
Fund and Market Performance Overview
For the 12-month period June 1, 2013, through May 31, 2014, Dreyfus California AMT-Free Municipal Bond Fund’s Class A, C, I, and Z shares achieved total returns of 2.71%, 1.92%, 2.96%, and 2.92%, respectively.1 The Barclays Municipal Bond Index (the “Index”), the fund’s benchmark, produced a total return of 3.05% for the same period.2 Between their inception on July 1, 2013, and May 31, 2014, the fund’s Class Y shares achieved a total return of 6.95%.
Heightened market volatility over the reporting period’s first half was followed by rallies as long-term interest rates moderated, investor demand rebounded, the supply of newly issued securities declined, and credit conditions improved.The fund lagged its benchmark over the one-year period, mainly due to weakness among Puerto Rico bond holdings.
The Fund’s Investment Approach
The fund seeks as high a level of current income exempt from federal and California state income taxes as is consistent with the preservation of capital.To pursue its goal, the fund normally invests substantially all of its assets in municipal bonds that provide income exempt from federal and California state personal income taxes.The fund also seeks to provide income exempt from the federal Alternative Minimum Tax. The fund will invest at least 80% of its assets in investment-grade municipal bonds or the unrated equivalent as determined by Dreyfus.The fund may invest up to 20% of its assets in municipal bonds rated below investment grade (“junk” bonds) or the unrated equivalent as determined by Dreyfus. The dollar-weighted average maturity of the fund’s portfolio normally exceeds 10 years, but the fund’s average portfolio maturity is not restricted.
We focus on identifying undervalued sectors and securities, and we minimize the use of interest rate forecasting. We select municipal bonds by using fundamental credit analysis to estimate the relative value and attractiveness of various sectors and securities and to exploit pricing inefficiencies in the municipal bond market. We
The Fund 3
DISCUSSION OF FUND PERFORMANCE (continued)
actively trade among various sectors, such as pre-refunded, general obligation, and revenue, based on their apparent relative values.
Municipal Bonds Rebounded from Earlier Weakness
Municipal bonds generally lost value at the start of the reporting period in the wake of news that the Federal Reserve Board would soon back away from its quantitative easing program. The resulting selling pressure in the municipal bond market sent long-term bond prices lower and yields higher.
Municipal bonds generally stabilized in the fall, and the first five months of 2014 witnessed a market recovery amid weaker-than-expected economic data stemming from unusually harsh winter weather. Municipal bond prices also were supported by favorable supply-and-demand dynamics when investor demand recovered and less refinancing activity produced a reduced supply of newly issued securities.
The economic rebound, higher tax rates, and reduced bond issuance resulted in better underlying credit conditions for California, enabling the state to achieve a budget surplus and replenish reserves. However, credit concerns lingered with regard to municipal bonds issued by Puerto Rico, which are exempt from federal and California state income taxes but lost value after media reports detailed the U.S. territory’s fiscal challenges.
Puerto Rico Bonds Undermined Relative Performance
Although California municipal bonds fared well compared to national averages over the reporting period, the fund’s relative performance was hampered by overweighted exposure to Puerto Rico securities.We took advantage of periodic rebounds during 2014 to reduce the fund’s exposure to Puerto Rico bonds at relatively attractive prices.
The fund achieved better relative performance in other areas. An emphasis on California revenue bonds proved effective, and the fund received especially strong contributions from bonds backed by hospitals, airports, and the state’s settlement of litigation with U.S. tobacco companies. An underweighted position in lower yielding escrowed bonds also buoyed relative results. The fund further benefited from its interest-rate strategies, as a relatively long average duration enabled it to participate more fully in gains at the longer end of the market’s maturity spectrum, and a focus on securities with 15- to 25-year maturities helped support higher levels of current income.
4
Positioned for an Improving Market Environment
We already have seen evidence of a more robust U.S. recovery in warmer spring weather, including a strengthening labor market. California’s fiscal condition has continued to improve, leading to widespread speculation regarding a potential credit-rating upgrade. In addition, we believe that recently positive market trends have been driven, in part, by investors returning their focus to market and issuer fundamentals.
We have maintained a constructive investment posture under generally favorable fundamental and technical market conditions. We have redeployed proceeds from recent sales of Puerto Rico bonds to longer term California securities with strong income characteristics.We also have maintained a relatively long average duration in seeking to capture higher levels of current income and in anticipation of narrower yield differences along the market’s maturity range.
June 16, 2014
Bond funds are subject generally to interest rate, credit, liquidity, and market risks, to varying degrees, all of which are more fully described in the fund’s prospectus. Generally, all other factors being equal, bond prices are inversely related to interest-rate changes, and rate increases can cause price declines.
High yield bonds involve increased credit and liquidity risks compared with investment grade bonds and are considered speculative in terms of the issuer’s ability to pay interest and repay principal on a timely basis.
The use of derivatives involves risk different from, or possibly greater than, the risk associated with investing directly in the underlying assets. Derivatives can be highly volatile, illiquid, and difficult to value and there is the risk that the changes in the value of a derivative held by the fund will not correlate with the underlying instruments or the fund’s other investments.
|
| 1 Total return includes reinvestment of dividends and any capital gains paid, and does not take into consideration the |
| maximum initial sales charge in the case of Class A shares, or the applicable contingent deferred sales charges |
| imposed on redemptions in the case of Class C shares. Had these charges been reflected, returns would have been |
| lower. Class I, Class Y, and Class Z (which is closed to new investors) are not subject to any initial or deferred sales |
| charge. Past performance is no guarantee of future results. Share price, yield, and investment return fluctuate such |
| that upon redemption, fund shares may be worth more or less than their original cost. Income may be subject to state |
| and local taxes for non-California residents. Capital gains, if any, are fully taxable. Class Y shares returns are since |
| inception 7/1/13. |
| 2 SOURCE: LIPPER INC. — Reflects reinvestment of dividends and, where applicable, capital gain distributions. |
| The Barclays Municipal Bond Index is a widely accepted, unmanaged and geographically unrestricted total return |
| performance benchmark for the long-term, investment-grade, tax-exempt bond market. Index returns do not reflect fees |
| and expenses associated with operating a mutual fund. |
The Fund 5
FUND PERFORMANCE
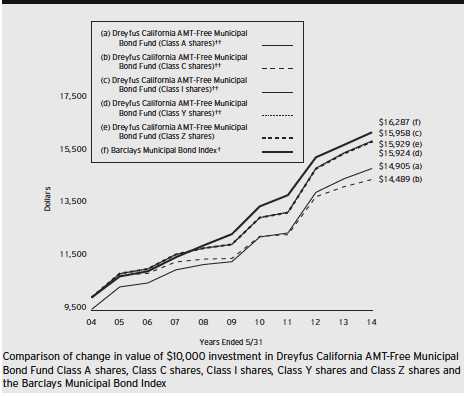
| |
| † | Source: Lipper Inc. |
| †† | The total return figures presented for Class A and Class C shares of the fund reflect the performance of the fund’s |
| | Class Z shares for the period prior to 10/21/04 (the inception date for Class A and Class C shares), adjusted to |
| | reflect the applicable sales load for Class A shares. |
| | The total return figures presented for Class I shares of the fund reflect the performance of the fund’s Class Z shares |
| | for the period prior to 12/15/08 (the inception date for Class I shares). |
| | The total return figures presented for ClassY shares of the fund reflect the performance of the fund’s Class Z shares |
| | for the period prior to 7/1/13 (the inception date for ClassY shares). |
Past performance is not predictive of future performance.
The above graph compares a $10,000 investment made in each of the Class A, Class C, Class I, ClassY and Class Z shares of Dreyfus California AMT-Free Municipal Bond Fund on 5/31/04 to a $10,000 investment made in the Barclays Municipal Bond Index (the “Index”) on that date. All dividends and capital gain distributions are reinvested. On April 29, 2013, the Board authorized the fund to offer ClassY shares, as a new class of shares, to certain investors, including certain institutional investors. On July 1, 2013, ClassY shares were offered at net asset value and are not subject to certain fees, including Distribution Plan and Shareholder Services Plan fees.
The fund invests primarily in California municipal securities and its performance shown in the line graph above takes into account the maximum initial sales charge on Class A shares and all other applicable fees and expenses on all classes. The Index is not limited to investments principally in California municipal obligations.The Index, unlike the fund, is an unmanaged total return performance benchmark for the long-term, investment-grade, geographically unrestricted tax-exempt bond market, calculated by using municipal bonds selected to be representative of the municipal market overall. These factors can contribute to the Index potentially outperforming or underperforming the fund. Unlike a mutual fund, the Index is not subject to charges, fees and other expenses. Investors cannot invest directly in any index. Further information relating to fund performance, including expense reimbursements, if applicable, is contained in the Financial Highlights section of the prospectus and elsewhere in this report.
6
| | | | | | | |
| Average Annual Total Returns as of 5/31/14 | | | | | |
| | Inception | | | | | | |
| | Date | 1 Year | | 5 Years | | 10 Years | |
| Class A shares | | | | | | | |
| with maximum sales charge (4.5%) | 10/21/04 | –1.90 | % | 4.61 | % | 4.07 | %†† |
| without sales charge | 10/21/04 | 2.71 | % | 5.58 | % | 4.55 | %†† |
| Class C shares | | | | | | | |
| with applicable redemption charge † | 10/21/04 | 0.93 | % | 4.75 | % | 3.78 | %†† |
| without redemption | 10/21/04 | 1.92 | % | 4.75 | % | 3.78 | %†† |
| Class I shares | 12/15/08 | 2.96 | % | 5.84 | % | 4.79 | %†† |
| Class Y shares | 7/01/13 | 2.88 | %†† | 5.79 | %†† | 4.76 | %†† |
| Class Z shares | 7/26/83 | 2.92 | % | 5.80 | % | 4.77 | % |
| Barclays Municipal Bond Index | | 3.05 | % | 5.59 | % | 5.00 | % |
Past performance is not predictive of future performance.The fund’s performance shown in the graph and table does not reflect the deduction of taxes that a shareholder would pay on fund distributions or the redemption of fund shares. In addition to the performance of Class A shares shown with and without a maximum sales charge, the fund’s performance shown in the table takes into account all other applicable fees and expenses on all classes.
| |
| † | The maximum contingent deferred sales charge for Class C shares is 1% for shares redeemed within one year of the |
| | date of purchase. |
| †† | The total return performance figures presented for Class A and Class C shares of the fund reflect the performance of |
| | the fund’s Class Z shares for the period prior to 10/21/04 (the inception date for Class A and Class C shares), |
| | adjusted to reflect the applicable sales load for Class A shares. |
| | The total return performance figures presented for Class I shares of the fund reflect the performance of the fund’s |
| | Class Z shares for the period prior to 12/15/08 (the inception date for Class I shares). |
| | The total return performance figures presented for ClassY shares of the fund reflect the performance of the fund’s |
| | Class Z shares for the period prior to 7/1/13 (the inception date for ClassY shares). |
The Fund 7
UNDERSTANDING YOUR FUND’S EXPENSES (Unaudited)
As a mutual fund investor, you pay ongoing expenses, such as management fees and other expenses. Using the information below, you can estimate how these expenses affect your investment and compare them with the expenses of other funds.You also may pay one-time transaction expenses, including sales charges (loads) and redemption fees, which are not shown in this section and would have resulted in higher total expenses. For more information, see your fund’s prospectus or talk to your financial adviser.
Review your fund’s expenses
The table below shows the expenses you would have paid on a $1,000 investment in Dreyfus California AMT-Free Municipal Bond Fund from December 1, 2013 to May 31, 2014. It also shows how much a $1,000 investment would be worth at the close of the period, assuming actual returns and expenses.
Expenses and Value of a $1,000 Investment
assuming actual returns for the six months ended May 31, 2014
| | | | | | | | | | |
| | | Class A | | Class C | | Class I | | Class Y | | Class Z |
| Expenses paid per $1,000† | $ | 4.80 | $ | 8.76 | $ | 3.51 | $ | 3.36 | $ | 3.77 |
| Ending value (after expenses) | $ | 1,071.20 | $ | 1,066.40 | $ | 1,072.60 | $ | 1,072.50 | $ | 1,072.30 |
COMPARING YOUR FUND’S EXPENSES
WITH THOSE OF OTHER FUNDS (Unaudited)
Using the SEC’s method to compare expenses
The Securities and Exchange Commission (SEC) has established guidelines to help investors assess fund expenses. Per these guidelines, the table below shows your fund’s expenses based on a $1,000 investment, assuming a hypothetical 5% annualized return. You can use this information to compare the ongoing expenses (but not transaction expenses or total cost) of investing in the fund with those of other funds.All mutual fund shareholder reports will provide this information to help you make this comparison. Please note that you cannot use this information to estimate your actual ending account balance and expenses paid during the period.
Expenses and Value of a $1,000 Investment
assuming a hypothetical 5% annualized return for the six months ended May 31, 2014
| | | | | | | | | | |
| | | Class A | | Class C | | Class I | | Class Y | | Class Z |
| Expenses paid per $1,000† | $ | 4.68 | $ | 8.55 | $ | 3.43 | $ | 3.28 | $ | 3.68 |
| Ending value (after expenses) | $ | 1,020.29 | $ | 1,016.45 | $ | 1,021.54 | $ | 1,021.69 | $ | 1,021.29 |
|
| † Expenses are equal to the fund’s annualized expense ratio of .93% for Class A, 1.70% for Class C, .68% for |
| Class I, .65% for ClassY and .73% for Class Z, multiplied by the average account value over the period, multiplied |
| by 182/365 (to reflect the one-half year period). |
8
| | | | |
| STATEMENT OF INVESTMENTS | | | |
| May 31, 2014 | | | | |
| |
| |
| |
| |
| Long-Term Municipal | Coupon | Maturity | Principal | |
| Investments—99.9% | Rate (%) | Date | Amount ($) | Value ($) |
| California—96.5% | | | | |
| ABAG Finance Authority for | | | | |
| Nonprofit Corporations, | | | | |
| Revenue (Sharp HealthCare) | 6.00 | 8/1/30 | 5,000,000 | 6,097,150 |
| ABAG Finance Authority for | | | | |
| Nonprofit Corporations, | | | | |
| Revenue (Sharp HealthCare) | 5.00 | 8/1/43 | 3,000,000 | 3,283,680 |
| Alameda Corridor Transportation | | | | |
| Authority, Senior Lien Revenue | 5.00 | 10/1/21 | 2,300,000 | 2,751,237 |
| Bay Area Toll Authority, | | | | |
| San Francisco Bay Area | | | | |
| Subordinate Lien Toll | | | | |
| Bridge Revenue | 5.00 | 4/1/43 | 7,500,000 | 8,225,850 |
| Bay Area Toll Authority, | | | | |
| San Francisco Bay Area Toll | | | | |
| Bridge Revenue | 5.25 | 4/1/24 | 17,580,000 | 20,889,611 |
| Bay Area Toll Authority, | | | | |
| San Francisco Bay Area Toll | | | | |
| Bridge Revenue | 5.00 | 4/1/34 | 10,000,000 | 11,152,300 |
| Brentwood Infrastructure Financing | | | | |
| Authority, Water Revenue | 5.75 | 7/1/38 | 4,250,000 | 4,822,220 |
| California, | | | | |
| GO | 5.00 | 8/1/22 | 5,000,000 | 5,581,050 |
| California, | | | | |
| GO (Various Purpose) | 5.00 | 11/1/23 | 5,000,000 | 6,030,450 |
| California, | | | | |
| GO (Various Purpose) | 5.25 | 2/1/29 | 13,835,000 | 16,050,537 |
| California, | | | | |
| GO (Various Purpose) | 5.00 | 10/1/29 | 5,250,000 | 5,877,165 |
| California, | | | | |
| GO (Various Purpose) | 5.25 | 3/1/30 | 15,000,000 | 17,375,400 |
| California, | | | | |
| GO (Various Purpose) | 5.75 | 4/1/31 | 4,500,000 | 5,334,525 |
| California, | | | | |
| GO (Various Purpose) | 5.25 | 9/1/31 | 25,000,000 | 28,737,500 |
| California, | | | | |
| GO (Various Purpose) | 5.25 | 9/1/32 | 19,500,000 | 22,278,360 |
| California, | | | | |
| GO (Various Purpose) | 5.25 | 10/1/32 | 9,170,000 | 10,490,021 |
| California, | | | | |
| GO (Various Purpose) | 6.00 | 3/1/33 | 3,000,000 | 3,631,680 |
The Fund 9
STATEMENT OF INVESTMENTS (continued)
| | | | |
| Long-Term Municipal | Coupon | Maturity | Principal | |
| Investments (continued) | Rate (%) | Date | Amount ($) | Value ($) |
| California (continued) | | | | |
| California, | | | | |
| GO (Various Purpose) | 6.50 | 4/1/33 | 30,000,000 | 36,774,600 |
| California, | | | | |
| GO (Various Purpose) | 5.50 | 11/1/35 | 10,000,000 | 11,649,500 |
| California, | | | | |
| GO (Various Purpose) | 5.00 | 2/1/38 | 5,000,000 | 5,488,100 |
| California, | | | | |
| GO (Various Purpose) | 5.50 | 3/1/40 | 17,500,000 | 20,209,875 |
| California Department of | | | | |
| Water Resources, | | | | |
| Power Supply Revenue | 5.00 | 5/1/21 | 4,000,000 | 4,652,800 |
| California Department of Water | | | | |
| Resources, Water System | | | | |
| Revenue (Central Valley Project) | 5.00 | 12/1/26 | 7,500,000 | 8,630,175 |
| California Department of Water | | | | |
| Resources, Water System | | | | |
| Revenue (Central Valley Project) | 5.00 | 12/1/27 | 11,600,000 | 13,323,412 |
| California Educational Facilities | | | | |
| Authority, Revenue (Pooled | | | | |
| College and University Projects) | | | | |
| (Escrowed to Maturity) | 5.63 | 6/30/23 | 135,000 | 172,957 |
| California Educational Facilities | | | | |
| Authority, Revenue (University | | | | |
| of Southern California) | 5.25 | 10/1/38 | 5,000,000 | 5,698,950 |
| California Health Facilities | | | | |
| Financing Authority, Revenue | | | | |
| (Catholic Healthcare West) | 5.63 | 7/1/32 | 5,875,000 | 6,026,634 |
| California Health Facilities | | | | |
| Financing Authority, Revenue | | | | |
| (City of Hope) | 5.00 | 11/15/23 | 1,650,000 | 1,949,458 |
| California Health Facilities | | | | |
| Financing Authority, Revenue | | | | |
| (City of Hope) | 5.00 | 11/15/24 | 1,600,000 | 1,877,600 |
| California Health Facilities | | | | |
| Financing Authority, Revenue | | | | |
| (Lucile Salter Packard Children’s | | | | |
| Hospital at Stanford) | 5.00 | 8/15/25 | 5,855,000 | 6,865,046 |
| California Health Facilities | | | | |
| Financing Authority, Revenue | | | | |
| (Rady Children’s Hospital— | | | | |
| San Diego) | 5.25 | 8/15/41 | 8,500,000 | 9,468,660 |
10
| | | | | |
| Long-Term Municipal | Coupon | Maturity | Principal | | |
| Investments (continued) | Rate (%) | Date | Amount ($) | | Value ($) |
| California (continued) | | | | | |
| California Health Facilities | | | | | |
| Financing Authority, Revenue | | | | | |
| (Saint Joseph Health System) | 5.00 | 7/1/37 | 7,500,000 | | 8,334,975 |
| California Health Facilities | | | | | |
| Financing Authority, Revenue | | | | | |
| (Scripps Health) | 5.00 | 11/15/36 | 7,525,000 | | 8,220,009 |
| California Health Facilities | | | | | |
| Financing Authority, Revenue | | | | | |
| (Stanford Hospital and Clinics) | 5.00 | 8/15/42 | 1,000,000 | | 1,093,840 |
| California Health Facilities | | | | | |
| Financing Authority, Revenue | | | | | |
| (Sutter Health) | 5.25 | 8/15/22 | 6,000,000 | | 7,002,360 |
| California Health Facilities | | | | | |
| Financing Authority, Revenue | | | | | |
| (Sutter Health) | 5.25 | 8/15/31 | 3,500,000 | | 3,978,975 |
| California Housing Finance Agency, | | | | | |
| Home Mortgage Revenue | | | | | |
| (Collateralized; FNMA) | 5.50 | 8/1/38 | 7,455,000 | | 7,462,231 |
| California Municipal Finance | | | | | |
| Authority, COP (Community | | | | | |
| Hospitals of Central | | | | | |
| California Obligated Group) | 5.25 | 2/1/27 | 6,750,000 | | 7,014,735 |
| California Pollution Control | | | | | |
| Financing Authority, Revenue | | | | | |
| (San Jose Water Company Project) | 5.10 | 6/1/40 | 5,500,000 | | 5,812,510 |
| California Pollution Control | | | | | |
| Financing Authority, Water | | | | | |
| Facilities Revenue (American | | | | | |
| Water Capital Corporation Project) | 5.25 | 8/1/40 | 7,500,000 | a | 7,950,825 |
| California State Public Works | | | | | |
| Board, LR (Department of | | | | | |
| Corrections and Rehabilitation) | | | | | |
| (Various Correctional Facilities) | 5.00 | 9/1/26 | 5,000,000 | | 5,937,450 |
| California State Public Works | | | | | |
| Board, LR (Judicial Council of | | | | | |
| California) (Various Judicial | | | | | |
| Council Projects) | 5.00 | 3/1/25 | 1,795,000 | | 2,109,789 |
| California State Public Works | | | | | |
| Board, LR (Judicial Council of | | | | | |
| California) (Various Judicial | | | | | |
| Council Projects) | 5.00 | 12/1/31 | 10,000,000 | | 11,195,700 |
The Fund 11
STATEMENT OF INVESTMENTS (continued)
| | | | |
| Long-Term Municipal | Coupon | Maturity | Principal | |
| Investments (continued) | Rate (%) | Date | Amount ($) | Value ($) |
| California (continued) | | | | |
| California State University | | | | |
| Trustees, Systemwide Revenue | 5.00 | 11/1/27 | 2,510,000 | 2,835,447 |
| California State University | | | | |
| Trustees, Systemwide Revenue | 5.00 | 11/1/28 | 5,000,000 | 5,655,250 |
| California Statewide Communities | | | | |
| Development Authority, COP | | | | |
| (The Internext Group) | 5.38 | 4/1/30 | 10,100,000 | 10,111,716 |
| California Statewide Communities | | | | |
| Development Authority, | | | | |
| Revenue (American Baptist | | | | |
| Homes of the West) | 2.10 | 10/1/19 | 2,000,000 | 2,001,660 |
| California Statewide Communities | | | | |
| Development Authority, Revenue | | | | |
| (Cottage Health System | | | | |
| Obligated Group) | 5.25 | 11/1/30 | 3,750,000 | 4,101,712 |
| California Statewide Communities | | | | |
| Development Authority, Revenue | | | | |
| (Cottage Health System | | | | |
| Obligated Group) | 5.00 | 11/1/40 | 11,940,000 | 12,588,939 |
| California Statewide Communities | | | | |
| Development Authority, Revenue | | | | |
| (Henry Mayo Newhall Memorial | | | | |
| Hospital) (Insured; Assured | | | | |
| Guaranty Municipal Corp.) | 5.25 | 10/1/43 | 2,100,000 | 2,286,900 |
| California Statewide Communities | | | | |
| Development Authority, Revenue | | | | |
| (Kaiser Permanente) | 5.00 | 4/1/42 | 3,000,000 | 3,250,320 |
| California Statewide Communities | | | | |
| Development Authority, Revenue | | | | |
| (Saint Joseph Health System) | | | | |
| (Insured; FGIC) | 5.75 | 7/1/47 | 10,000,000 | 11,413,600 |
| California Statewide Communities | | | | |
| Development Authority, | | | | |
| Revenue (Saint Joseph | | | | |
| Health System) (Insured; | | | | |
| National Public Finance | | | | |
| Guarantee Corp.) | 5.13 | 7/1/24 | 5,000,000 | 5,694,200 |
| California Statewide Communities | | | | |
| Development Authority, School | | | | |
| Facility Revenue (Aspire | | | | |
| Public Schools) | 6.00 | 7/1/40 | 7,975,000 | 8,181,074 |
12
| | | | | |
| Long-Term Municipal | Coupon | Maturity | Principal | | |
| Investments (continued) | Rate (%) | Date | Amount ($) | | Value ($) |
| California (continued) | | | | | |
| California Statewide Communities | | | | | |
| Development Authority, Student | | | | | |
| Housing Revenue (CHF-Irvine, | | | | | |
| LLC-UCI East Campus | | | | | |
| Apartments, Phase II) | 5.75 | 5/15/32 | 4,000,000 | | 4,313,800 |
| Capistrano Unified School District | | | | | |
| (Ladera) Community Facilities | | | | | |
| District Number 98-2, Special | | | | | |
| Tax Bonds (Insured; National | | | | | |
| Public Finance Guarantee Corp.) | 5.00 | 9/1/19 | 3,545,000 | | 3,677,512 |
| Chabot-Las Positas Community | | | | | |
| College District, GO | | | | | |
| (Insured; AMBAC) | 0.00 | 8/1/22 | 3,000,000 | b | 2,193,090 |
| Coast Community College District, | | | | | |
| GO (Insured; Assured Guaranty | | | | | |
| Municipal Corp.) | 5.00 | 8/1/29 | 15,565,000 | | 17,693,358 |
| Delano, | | | | | |
| COP (Delano Regional | | | | | |
| Medical Center) | 3.00 | 1/1/15 | 1,210,000 | | 1,220,466 |
| Delano, | | | | | |
| COP (Delano Regional | | | | | |
| Medical Center) | 4.00 | 1/1/16 | 1,245,000 | | 1,294,389 |
| Delano, | | | | | |
| COP (Delano Regional | | | | | |
| Medical Center) | 4.00 | 1/1/17 | 1,305,000 | | 1,373,486 |
| East Bay Municipal Utility | | | | | |
| District, Water System Revenue | 5.00 | 6/1/30 | 3,755,000 | | 4,498,528 |
| El Dorado Irrigation District, | | | | | |
| Revenue (Insured; Assured | | | | | |
| Guaranty Municipal Corp.) | 5.00 | 3/1/27 | 1,250,000 | | 1,468,675 |
| El Dorado Irrigation District, | | | | | |
| Revenue (Insured; Assured | | | | | |
| Guaranty Municipal Corp.) | 5.00 | 3/1/28 | 1,000,000 | | 1,162,930 |
| Foothill-De Anza Community College | | | | | |
| District, GO (Insured; AMBAC) | 5.00 | 8/1/22 | 10,350,000 | | 11,663,104 |
| Golden State Tobacco | | | | | |
| Securitization Corporation, | | | | | |
| Enhanced Tobacco Settlement | | | | | |
| Asset-Backed Bonds (Insured; | | | | | |
| Assured Guaranty Municipal Corp.) | 4.55 | 6/1/22 | 1,725,000 | | 1,827,482 |
The Fund 13
STATEMENT OF INVESTMENTS (continued)
| | | | | |
| Long-Term Municipal | Coupon | Maturity | Principal | | |
| Investments (continued) | Rate (%) | Date | Amount ($) | | Value ($) |
| California (continued) | | | | | |
| Golden State Tobacco | | | | | |
| Securitization Corporation, | | | | | |
| Tobacco Settlement | | | | | |
| Asset-Backed Bonds | 4.50 | 6/1/27 | 10,545,000 | | 9,629,589 |
| Golden State Tobacco | | | | | |
| Securitization Corporation, | | | | | |
| Tobacco Settlement | | | | | |
| Asset-Backed Bonds | 5.13 | 6/1/47 | 8,000,000 | | 6,229,120 |
| Golden State Tobacco | | | | | |
| Securitization Corporation, | | | | | |
| Tobacco Settlement | | | | | |
| Asset-Backed Bonds | 5.75 | 6/1/47 | 12,500,000 | | 10,554,125 |
| Grossmont Union High School | | | | | |
| District, GO (Insured; Assured | | | | | |
| Guaranty Municipal Corp.) | 0.00 | 8/1/21 | 4,375,000 | b | 3,626,394 |
| Grossmont Union High School | | | | | |
| District, GO (Insured; Assured | | | | | |
| Guaranty Municipal Corp.) | 0.00 | 8/1/22 | 4,605,000 | b | 3,646,930 |
| Grossmont Union High School | | | | | |
| District, GO (Insured; Assured | | | | | |
| Guaranty Municipal Corp.) | 0.00 | 8/1/23 | 4,850,000 | b | 3,659,907 |
| Grossmont Union High School | | | | | |
| District, GO (Insured; Assured | | | | | |
| Guaranty Municipal Corp.) | 0.00 | 8/1/26 | 3,265,000 | b | 2,142,819 |
| JPMorgan Chase Putters/Drivers | | | | | |
| Trust (Series 4354) Non-recourse | | | | | |
| (Riverside County Transportation | | | | | |
| Commission, Sales Tax Revenue) | 5.25 | 6/1/21 | 7,500,000 | a,c | 8,634,225 |
| JPMorgan Chase Putters/Drivers | | | | | |
| Trust (Series 4361) Non-recourse | | | | | |
| (Los Angeles Department of | | | | | |
| Water and Power, Water | | | | | |
| System Revenue) | 5.00 | 7/1/20 | 12,000,000 | a,c | 13,297,920 |
| Los Angeles Department of | | | | | |
| Airports, Senior Revenue (Los | | | | | |
| Angeles International Airport) | 5.25 | 5/15/26 | 5,000,000 | | 5,871,800 |
| Los Angeles Department of | | | | | |
| Airports, Senior Revenue (Los | | | | | |
| Angeles International Airport) | 5.00 | 5/15/29 | 3,915,000 | | 4,496,652 |
14
| | | | | |
| Long-Term Municipal | Coupon | Maturity | Principal | | |
| Investments (continued) | Rate (%) | Date | Amount ($) | | Value ($) |
| California (continued) | | | | | |
| Los Angeles Department of | | | | | |
| Airports, Senior Revenue (Los | | | | | |
| Angeles International Airport) | 5.25 | 5/15/29 | 16,090,000 | | 18,878,397 |
| Los Angeles Department of | | | | | |
| Airports, Senior Revenue (Los | | | | | |
| Angeles International Airport) | 5.00 | 5/15/35 | 25,000,000 | | 27,768,250 |
| Los Angeles Department of | | | | | |
| Airports, Senior Revenue (Los | | | | | |
| Angeles International Airport) | 5.00 | 5/15/38 | 3,500,000 | | 3,851,190 |
| Los Angeles Harbor Department, | | | | | |
| Revenue | 5.25 | 8/1/25 | 26,055,000 | | 30,759,751 |
| Metropolitan Water District of | | | | | |
| Southern California, | | | | | |
| Water Revenue | 5.00 | 10/1/34 | 7,390,000 | | 8,434,429 |
| Metropolitan Water District of | | | | | |
| Southern California, | | | | | |
| Water Revenue | 5.00 | 1/1/39 | 5,000,000 | | 5,598,650 |
| Midpeninsula Regional Open Space | | | | | |
| District Financing Authority, | | | | | |
| Revenue (Insured; AMBAC) | | | | | |
| (Escrowed to Maturity) | 0.00 | 9/1/15 | 2,825,000 | b | 2,816,920 |
| Murrieta Valley Unified School | | | | | |
| District, GO (Insured; National | | | | | |
| Public Finance Guarantee Corp.) | 0.00 | 9/1/21 | 4,950,000 | b | 4,025,686 |
| Natomas Unified School District, | | | | | |
| GO (Insured; National Public | | | | | |
| Finance Guarantee Corp.) | 5.95 | 9/1/21 | 2,500,000 | | 2,856,325 |
| North Natomas Community | | | | | |
| Facilities District Number 4, | | | | | |
| Special Tax Bonds | 5.25 | 9/1/26 | 2,760,000 | | 3,157,164 |
| Northern California Power Agency, | | | | | |
| Revenue (Hydroelectric Project | | | | | |
| Number 1) (Insured; AMBAC) | | | | | |
| (Prerefunded) | 7.00 | 1/1/16 | 670,000 | d | 711,641 |
| Northern California Power Agency, | | | | | |
| Revenue (Hydroelectric Project | | | | | |
| Number 1) (Insured; AMBAC) | | | | | |
| (Prerefunded) | 7.50 | 7/1/21 | 375,000 | d | 493,688 |
The Fund 15
STATEMENT OF INVESTMENTS (continued)
| | | | | |
| Long-Term Municipal | Coupon | Maturity | Principal | | |
| Investments (continued) | Rate (%) | Date | Amount ($) | | Value ($) |
| California (continued) | | | | | |
| Northern California Power Agency, | | | | | |
| Revenue (Hydroelectric Project | | | | | |
| Number 1) (Insured; National | | | | | |
| Public Finance Guarantee Corp.) | 6.30 | 7/1/18 | 19,000,000 | | 21,405,400 |
| Oakland Unified School District, | | | | | |
| GO | 6.63 | 8/1/38 | 5,000,000 | | 5,984,600 |
| Pomona Redevelopment Agency, | | | | | |
| Tax Allocation Revenue (West Holt | | | | | |
| Avenue Redevelopment Project) | 5.50 | 5/1/32 | 3,000,000 | | 3,560,970 |
| Poway Unified School District, | | | | | |
| School Facilities Improvement | | | | | |
| District Number 2007-1, GO | 0.00 | 8/1/35 | 12,850,000 | b | 4,926,947 |
| Sacramento County, | | | | | |
| Airport System Senior Revenue | 5.00 | 7/1/24 | 5,090,000 | | 5,836,856 |
| Sacramento County, | | | | | |
| Airport System Senior Revenue | 5.13 | 7/1/25 | 5,890,000 | | 6,778,330 |
| Sacramento County Sanitation | | | | | |
| Districts Financing Authority, | | | | | |
| Revenue (Sacramento Regional | | | | | |
| County Sanitation District) | 5.00 | 12/1/26 | 7,000,000 | | 8,267,350 |
| Sacramento County Water Financing | | | | | |
| Authority, Revenue (Sacramento | | | | | |
| County Water Agency Zones 40 | | | | | |
| and 41 Water System Project) | | | | | |
| (Insured; National Public | | | | | |
| Finance Guarantee Corp.) | 5.00 | 6/1/25 | 8,500,000 | | 9,497,985 |
| Sacramento Municipal Utility | | | | | |
| District, Electric Revenue | 5.00 | 8/15/28 | 2,500,000 | | 2,843,550 |
| San Bernardino County, | | | | | |
| COP (Capital Facilities | | | | | |
| Project) (Escrowed to Maturity) | 6.88 | 8/1/24 | 5,000,000 | | 6,730,900 |
| San Diego County, | | | | | |
| COP (Burnham Institute for | | | | | |
| Medical Research) | 5.00 | 9/1/24 | 2,265,000 | | 2,340,606 |
| San Diego County, | | | | | |
| COP (Burnham Institute for | | | | | |
| Medical Research) | 5.00 | 9/1/34 | 9,880,000 | | 10,102,300 |
| San Diego County Regional Airport | | | | | |
| Authority, Subordinate | | | | | |
| Airport Revenue | 5.00 | 7/1/34 | 3,000,000 | | 3,219,990 |
16
| | | | | |
| Long-Term Municipal | Coupon | Maturity | Principal | | |
| Investments (continued) | Rate (%) | Date | Amount ($) | | Value ($) |
| California (continued) | | | | | |
| San Diego County Water Authority, | | | | | |
| Water Revenue | 5.00 | 5/1/31 | 4,935,000 | | 5,598,609 |
| San Diego Public Facilities | | | | | |
| Financing Authority, Senior | | | | | |
| Sewer Revenue | 5.25 | 5/15/34 | 6,045,000 | | 6,934,219 |
| San Diego Public Facilities | | | | | |
| Financing Authority, | | | | | |
| Water Revenue | 5.25 | 8/1/28 | 6,000,000 | | 7,130,160 |
| San Francisco City and County | | | | | |
| Airport Commission, | | | | | |
| Second Series Revenue | | | | | |
| (San Francisco | | | | | |
| International Airport) | 5.00 | 5/1/23 | 6,775,000 | | 7,933,593 |
| San Francisco City and County | | | | | |
| Airport Commission, Second | | | | | |
| Series Revenue (San Francisco | | | | | |
| International Airport) | 5.25 | 5/1/26 | 4,000,000 | | 4,602,600 |
| San Francisco City and County | | | | | |
| Airport Commission, Second | | | | | |
| Series Revenue (San Francisco | | | | | |
| International Airport) | 5.00 | 5/1/28 | 2,000,000 | | 2,283,840 |
| San Francisco City and County | | | | | |
| Airport Commission, Second | | | | | |
| Series Revenue (San Francisco | | | | | |
| International Airport) | 5.00 | 5/1/29 | 2,000,000 | | 2,271,760 |
| San Francisco City and County | | | | | |
| Public Utilities Commission, | | | | | |
| San Francisco Water Revenue | 5.00 | 11/1/37 | 10,000,000 | | 11,098,800 |
| San Francisco City and County | | | | | |
| Public Utilities Commission, | | | | | |
| San Francisco Water Revenue | | | | | |
| (Insured; Assured Guaranty | | | | | |
| Municipal Corp.) | 5.00 | 11/1/24 | 13,185,000 | | 14,313,768 |
| San Francisco City and County | | | | | |
| Redevelopment Agency | | | | | |
| Community Facilities | | | | | |
| District Number 6, | | | | | |
| Special Tax Revenue | | | | | |
| (Mission Bay South | | | | | |
| Public Improvements) | 0.00 | 8/1/18 | 445,000 | b | 363,347 |
The Fund 17
STATEMENT OF INVESTMENTS (continued)
| | | | | |
| Long-Term Municipal | Coupon | Maturity | Principal | | |
| Investments (continued) | Rate (%) | Date | Amount ($) | | Value ($) |
| California (continued) | | | | | |
| San Francisco City and County | | | | | |
| Redevelopment Agency Community | | | | | |
| Facilities District Number 6, | | | | | |
| Special Tax Revenue (Mission | | | | | |
| Bay South Public Improvements) | 5.00 | 8/1/18 | 1,585,000 | | 1,795,900 |
| San Francisco City and County | | | | | |
| Redevelopment Agency Community | | | | | |
| Facilities District Number 6, | | | | | |
| Special Tax Revenue (Mission | | | | | |
| Bay South Public Improvements) | 0.00 | 8/1/21 | 500,000 | b | 338,805 |
| Santa Margarita Water District | | | | | |
| Community Facilities District | | | | | |
| Number 2013-1, Special Tax | | | | | |
| Revenue (Village of Sendero) | 5.63 | 9/1/43 | 7,000,000 | | 7,639,940 |
| South Orange County Public | | | | | |
| Financing Authority, Special | | | | | |
| Tax Senior Lien Revenue | | | | | |
| (Ladera Ranch) | 5.00 | 8/15/29 | 1,500,000 | | 1,660,965 |
| South Orange County Public | | | | | |
| Financing Authority, Special | | | | | |
| Tax Senior Lien Revenue | | | | | |
| (Ladera Ranch) | 5.00 | 8/15/30 | 1,000,000 | | 1,101,250 |
| Southern California Public Power | | | | | |
| Authority, Revenue | | | | | |
| (Apex Power Project) | 5.00 | 7/1/33 | 8,000,000 | | 9,266,400 |
| Southern California Public Power | | | | | |
| Authority, Revenue (Canyon | | | | | |
| Power Project) | 5.25 | 7/1/27 | 7,485,000 | | 8,732,226 |
| Southern California Public Power | | | | | |
| Authority, Revenue (Linden | | | | | |
| Wind Energy Project) | 5.00 | 7/1/28 | 3,145,000 | | 3,659,365 |
| Southern California Public Power | | | | | |
| Authority, Revenue (Linden | | | | | |
| Wind Energy Project) | 5.00 | 7/1/29 | 2,230,000 | | 2,582,987 |
| Southern California Public Power | | | | | |
| Authority, Revenue (Milford | | | | | |
| Wind Corridor Phase I Project) | 5.00 | 7/1/29 | 11,865,000 | | 13,637,750 |
| Southern California Public Power | | | | | |
| Authority, Revenue (Windy | | | | | |
| Point/Windy Flats Project) | 5.00 | 7/1/27 | 13,765,000 | | 16,189,154 |
18
| | | | |
| Long-Term Municipal | Coupon | Maturity | Principal | |
| Investments (continued) | Rate (%) | Date | Amount ($) | Value ($) |
| California (continued) | | | | |
| Stockton Public Financing | | | | |
| Authority, Water Revenue | | | | |
| (Delta Water Supply Project) | 6.25 | 10/1/38 | 1,000,000 | 1,138,840 |
| Stockton Public Financing | | | | |
| Authority, Water Revenue | | | | |
| (Delta Water Supply Project) | 6.25 | 10/1/40 | 1,500,000 | 1,716,915 |
| Stockton Unified School District, | | | | |
| GO (Insured; Assured Guaranty | | | | |
| Municipal Corp.) | 5.00 | 7/1/25 | 1,620,000 | 1,826,291 |
| Stockton Unified School District, | | | | |
| GO (Insured; Assured Guaranty | | | | |
| Municipal Corp.) | 5.00 | 7/1/26 | 1,115,000 | 1,244,775 |
| Stockton Unified School District, | | | | |
| GO (Insured; Assured Guaranty | | | | |
| Municipal Corp.) | 5.00 | 8/1/38 | 2,500,000 | 2,697,300 |
| Tobacco Securitization Authority | | | | |
| of Southern California, | | | | |
| Tobacco Settlement | | | | |
| Asset-Backed Bonds (San Diego | | | | |
| County Tobacco Asset | | | | |
| Securitization Corporation) | 4.75 | 6/1/25 | 1,410,000 | 1,390,401 |
| Tobacco Securitization Authority | | | | |
| of Southern California, | | | | |
| Tobacco Settlement | | | | |
| Asset-Backed Bonds (San Diego | | | | |
| County Tobacco Asset | | | | |
| Securitization Corporation) | 5.13 | 6/1/46 | 8,850,000 | 7,060,884 |
| Torrance, | | | | |
| Revenue (Torrance Memorial | | | | |
| Medical Center) | 5.00 | 9/1/40 | 3,000,000 | 3,150,780 |
| Tuolumne Wind Project Authority, | | | | |
| Revenue (Tuolumne | | | | |
| Company Project) | 5.63 | 1/1/29 | 8,000,000 | 9,439,600 |
| Turlock Irrigation District, | | | | |
| Revenue | 5.00 | 1/1/25 | 5,610,000 | 6,273,214 |
| Turlock Irrigation District, | | | | |
| Revenue | 5.00 | 1/1/26 | 8,120,000 | 9,017,666 |
| University of California Regents, | | | | |
| General Revenue | 5.25 | 5/15/28 | 10,000,000 | 11,319,700 |
The Fund 19
STATEMENT OF INVESTMENTS (continued)
| | | | | |
| Long-Term Municipal | Coupon | Maturity | Principal | | |
| Investments (continued) | Rate (%) | Date | Amount ($) | | Value ($) |
| California (continued) | | | | | |
| University of California Regents, | | | | | |
| General Revenue | 5.25 | 5/15/30 | 3,000,000 | | 3,633,420 |
| University of California Regents, | | | | | |
| General Revenue | 5.75 | 5/15/31 | 8,000,000 | | 9,530,320 |
| University of California Regents, | | | | | |
| Limited Project Revenue | 5.00 | 5/15/42 | 10,000,000 | | 11,015,700 |
| University of California Regents, | | | | | |
| Medical Center Pooled Revenue | 5.00 | 5/15/43 | 10,000,000 | | 10,931,600 |
| West Kern Community College | | | | | |
| District, GO (Insured; XLCA) | 0.00 | 11/1/20 | 1,000,000 | b | 780,820 |
| U.S. Related—3.4% | | | | | |
| Guam, | | | | | |
| Hotel Occupancy Tax Revenue | 6.00 | 11/1/26 | 3,300,000 | | 3,737,580 |
| Guam, | | | | | |
| LOR (Section 30) | 5.63 | 12/1/29 | 2,850,000 | | 3,126,079 |
| Puerto Rico Aqueduct and Sewer | | | | | |
| Authority, Senior Lien Revenue | 5.00 | 7/1/21 | 10,000,000 | | 7,878,500 |
| Puerto Rico Aqueduct and Sewer | | | | | |
| Authority, Senior Lien Revenue | 5.13 | 7/1/37 | 3,730,000 | | 2,764,415 |
| Puerto Rico Commonwealth, | | | | | |
| Public Improvement GO | 5.25 | 7/1/22 | 2,000,000 | | 1,602,100 |
| Puerto Rico Industrial, Tourist, | | | | | |
| Educational, Medical and | | | | | |
| Environmental Control Facilities | | | | | |
| Financing Authority, HR | | | | | |
| (Hospital Auxilio Mutuo | | | | | |
| Obligated Group Project) | 6.00 | 7/1/33 | 2,450,000 | | 2,504,390 |
| Puerto Rico Sales Tax Financing | | | | | |
| Corporation, Sales Tax Revenue | | | | | |
| (First Subordinate Series) | 5.38 | 8/1/39 | 2,500,000 | | 2,027,125 |
| University of Puerto Rico, | | | | | |
| University System Revenue | 5.00 | 6/1/23 | 10,000,000 | | 6,312,500 |
| Virgin Islands Public Finance | | | | | |
| Authority, Revenue (Virgin Islands | | | | | |
| Matching Fund Loan Notes) | 5.00 | 10/1/25 | 5,000,000 | | 5,404,300 |
| Total Long-Term Municipal Investments | | | | |
| (cost $941,195,425) | | | | | 1,037,315,549 |
20
| | | | |
| Short-Term Municipal | Coupon | Maturity | Principal | |
| Investments—.4% | Rate (%) | Date | Amount ($) | Value ($) |
| California; | | | | |
| California, | | | | |
| GO Notes | | | | |
| (Kindergarten-University) | | | | |
| (LOC; Citibank NA) | 0.04 | 6/2/14 | 2,000,000e | 2,000,000 |
| California Infrastructure and | | | | |
| Economic Development Bank, | | | | |
| Revenue, Refunding (Los | | | | |
| Angeles County Museum of | | | | |
| Natural History Foundation) | | | | |
| (LOC; Wells Fargo Bank) | 0.04 | 6/2/14 | 2,400,000e | 2,400,000 |
| Total Short-Term Municipal Investments | | | |
| (cost $4,400,000) | | | | 4,400,000 |
| |
| Total Investments (cost $945,595,425) | | | 100.3 % | 1,041,715,549 |
| Liabilities, Less Cash and Receivables | | | (.3%) | (3,414,012) |
| Net Assets | | | 100.0% | 1,038,301,537 |
|
| a Securities exempt from registration pursuant to Rule 144A under the Securities Act of 1933.These securities may be |
| resold in transactions exempt from registration, normally to qualified institutional buyers.At May 31, 2014, these |
| securities were valued at $29,882,970 or 2.9% of net assets. |
| b Security issued with a zero coupon. Income is recognized through the accretion of discount. |
| c Collateral for floating rate borrowings. |
| d These securities are prerefunded; the date shown represents the prerefunded date. Bonds which are prerefunded are |
| collateralized by U.S. Government securities which are held in escrow and are used to pay principal and interest on |
| the municipal issue and to retire the bonds in full at the earliest refunding date. |
| e Variable rate demand note—rate shown is the interest rate in effect at May 31, 2014. Maturity date represents the |
| next demand date, or the ultimate maturity date if earlier. |
| | | |
| Portfolio Summary (Unaudited)† | | |
| |
| | Value (%) | | Value (%) |
| Utility-Water and Sewer | 18.8 | Lease | 2.0 |
| Transportation Services | 14.2 | Asset-Backed | 1.8 |
| State/Territory | 13.9 | Housing | 1.4 |
| Health Care | 13.1 | Prerefunded | 1.1 |
| Education | 9.2 | County | .3 |
| Utility-Electric | 8.2 | Industrial | .2 |
| Special Tax | 4.2 | Other | 7.8 |
| City | 4.1 | | 100.3 |
The Fund 21
STATEMENT OF INVESTMENTS (continued)
| | | |
| Summary of Abbreviations | | |
| |
| ABAG | Association of Bay Area | ACA | American Capital Access |
| | Governments | | |
| AGC | ACE Guaranty Corporation | AGIC | Asset Guaranty Insurance Company |
| AMBAC | American Municipal Bond | ARRN | Adjustable Rate |
| | Assurance Corporation | | Receipt Notes |
| BAN | Bond Anticipation Notes | BPA | Bond Purchase Agreement |
| CIFG | CDC Ixis Financial Guaranty | COP | Certificate of Participation |
| CP | Commercial Paper | DRIVERS | Derivative Inverse |
| | | | Tax-Exempt Receipts |
| EDR | Economic Development | EIR | Environmental Improvement |
| | Revenue | | Revenue |
| FGIC | Financial Guaranty | FHA | Federal Housing |
| | Insurance Company | | Administration |
| FHLB | Federal Home | FHLMC | Federal Home Loan Mortgage |
| | Loan Bank | | Corporation |
| FNMA | Federal National | GAN | Grant Anticipation Notes |
| | Mortgage Association | | |
| GIC | Guaranteed Investment | GNMA | Government National Mortgage |
| | Contract | | Association |
| GO | General Obligation | HR | Hospital Revenue |
| IDB | Industrial Development Board | IDC | Industrial Development Corporation |
| IDR | Industrial Development | LIFERS | Long Inverse Floating |
| | Revenue | | Exempt Receipts |
| LOC | Letter of Credit | LOR | Limited Obligation Revenue |
| LR | Lease Revenue | MERLOTS | Municipal Exempt Receipts |
| | | | Liquidity Option Tender |
| MFHR | Multi-Family Housing Revenue | MFMR | Multi-Family Mortgage Revenue |
| PCR | Pollution Control Revenue | PILOT | Payment in Lieu of Taxes |
| P-FLOATS | Puttable Floating Option | PUTTERS | Puttable Tax-Exempt Receipts |
| | Tax-Exempt Receipts | | |
| RAC | Revenue Anticipation Certificates | RAN | Revenue Anticipation Notes |
| RAW | Revenue Anticipation Warrants | RIB | Residual Interest Bonds |
| ROCS | Reset Options Certificates | RRR | Resources Recovery Revenue |
| SAAN | State Aid Anticipation Notes | SBPA | Standby Bond Purchase Agreement |
| SFHR | Single Family Housing Revenue | SFMR | Single Family Mortgage Revenue |
| SONYMA | State of New York | SPEARS | Short Puttable Exempt |
| | Mortgage Agency | | Adjustable Receipts |
| SWDR | Solid Waste Disposal Revenue | TAN | Tax Anticipation Notes |
| TAW | Tax Anticipation Warrants | TRAN | Tax and Revenue Anticipation Notes |
| XLCA | XL Capital Assurance | | |
| |
| See notes to financial statements. | | |
22
STATEMENT OF ASSETS AND LIABILITIES
May 31, 2014
| | | | | | |
| | | | | Cost | Value | |
| Assets ($): | | | | | | |
| Investments in securities—See Statement of Investments | 945,595,425 | 1,041,715,549 | |
| Interest receivable | | | | | 12,945,679 | |
| Receivable for shares of Common Stock subscribed | | | 5,700 | |
| Prepaid expenses | | | | | 44,289 | |
| | | | | | 1,054,711,217 | |
| Liabilities ($): | | | | | | |
| Due to The Dreyfus Corporation and affiliates—Note 3(c) | | | 619,825 | |
| Cash overdraft due to Custodian | | | | 585,466 | |
| Payable for floating rate notes issued—Note 4 | | | 9,750,000 | |
| Payable for investment securities purchased | | | 4,469,426 | |
| Payable for shares of Common Stock redeemed | | | 878,967 | |
| Interest and expense payable related to | | | | | |
| floating rate notes issued—Note 4 | | | | 24,755 | |
| Accrued expenses | | | | | 81,241 | |
| | | | | | 16,409,680 | |
| Net Assets ($) | | | | | 1,038,301,537 | |
| Composition of Net Assets ($): | | | | | |
| Paid-in capital | | | | | 967,575,711 | |
| Accumulated undistributed investment income—net | | | 104,139 | |
| Accumulated net realized gain (loss) on investments | | | (25,498,437 | ) |
| Accumulated net unrealized appreciation | | | | | |
| (depreciation) on investments | | | | 96,120,124 | |
| Net Assets ($) | | | | | 1,038,301,537 | |
| |
| |
| Net Asset Value Per Share | | | | | |
| | Class A | Class C | Class I | Class Y | Class Z | |
| Net Assets ($) | 89,524,849 | 9,251,011 | 19,349,711 | 1,032 | 920,174,934 | |
| Shares Outstanding | 5,890,630 | 608,847 | 1,273,779 | 67.94 | 60,543,444 | |
| Net Asset Value | | | | | | |
| Per Share ($) | 15.20 | 15.19 | 15.19 | 15.19 | 15.20 | |
| |
| See notes to financial statements. | | | | | |
The Fund 23
|
| STATEMENT OF OPERATIONS |
| Year Ended May 31, 2014 |
| | |
| Investment Income ($): | | |
| Interest Income | 48,683,251 | |
| Expenses: | | |
| Management fee—Note 3(a) | 6,328,901 | |
| Shareholder servicing costs—Note 3(c) | 985,309 | |
| Professional fees | 114,010 | |
| Directors’ fees and expenses—Note 3(d) | 79,342 | |
| Custodian fees—Note 3(c) | 78,906 | |
| Distribution fees—Note 3(b) | 75,146 | |
| Registration fees | 70,638 | |
| Interest and expense related to floating rate notes issued—Note 4 | 57,107 | |
| Prospectus and shareholders’ reports | 39,556 | |
| Loan commitment fees—Note 2 | 10,466 | |
| Miscellaneous | 63,567 | |
| Total Expenses | 7,902,948 | |
| Less—reduction in fees due to earnings credits—Note 3(c) | (751 | ) |
| Net Expenses | 7,902,197 | |
| Investment Income—Net | 40,781,054 | |
| Realized and Unrealized Gain (Loss) on Investments—Note 4 ($): | | |
| Net realized gain (loss) on investments | (10,015,247 | ) |
| Net realized gain (loss) on swap transactions | 390,000 | |
| Net Realized Gain (Loss) | (9,625,247 | ) |
| Net unrealized appreciation (depreciation) on investments | (8,957,420 | ) |
| Net unrealized appreciation (depreciation) on swap transactions | 119,964 | |
| Net Unrealized Appreciation (Depreciation) | (8,837,456 | ) |
| Net Realized and Unrealized Gain (Loss) on Investments | (18,462,703 | ) |
| Net Increase in Net Assets Resulting from Operations | 22,318,351 | |
| |
| See notes to financial statements. | | |
24
STATEMENT OF CHANGES IN NET ASSETS
| | | | |
| | | | Year Ended May 31, | |
| | 2014 | a | 2013 | |
| Operations ($): | | | | |
| Investment income—net | 40,781,054 | | 42,726,177 | |
| Net realized gain (loss) on investments | (9,625,247 | ) | 6,828,582 | |
| Net unrealized appreciation | | | | |
| (depreciation) on investments | (8,837,456 | ) | (3,256,322 | ) |
| Net Increase (Decrease) in Net Assets | | | | |
| Resulting from Operations | 22,318,351 | | 46,298,437 | |
| Dividends to Shareholders from ($): | | | | |
| Investment income—net: | | | | |
| Class A | (3,494,299 | ) | (3,914,959 | ) |
| Class C | (289,786 | ) | (312,868 | ) |
| Class I | (1,002,015 | ) | (1,289,944 | ) |
| Class Y | (36 | ) | — | |
| Class Z | (35,680,490 | ) | (37,006,858 | ) |
| Net realized gain (loss) on investments: | | | | |
| Class A | — | | (22,975 | ) |
| Class C | — | | (2,432 | ) |
| Class I | — | | (7,241 | ) |
| Class I | — | | (198,947 | ) |
| Total Dividends | (40,466,626 | ) | (42,756,224 | ) |
| Capital Stock Transactions ($): | | | | |
| Net proceeds from shares sold: | | | | |
| Class A | 6,449,175 | | 18,286,079 | |
| Class C | 1,162,870 | | 3,253,096 | |
| Class I | 7,044,161 | | 20,125,439 | |
| Class Y | 1,000 | | — | |
| Class Z | 16,870,108 | | 27,950,589 | |
The Fund 25
STATEMENT OF CHANGES IN NET ASSETS (continued)
| | | | |
| | | | Year Ended May 31, | |
| | 2014 | a | 2013 | |
| Capital Stock Transactions ($) (continued): | | | | |
| Dividends reinvested: | | | | |
| Class A | 2,277,089 | | 2,540,181 | |
| Class C | 180,420 | | 178,355 | |
| Class I | 403,050 | | 508,784 | |
| Class Z | 26,306,218 | | 26,935,685 | |
| Cost of shares redeemed: | | | | |
| Class A | (32,772,028 | ) | (22,260,585 | ) |
| Class C | (4,194,853 | ) | (2,837,253 | ) |
| Class I | (29,970,236 | ) | (7,921,501 | ) |
| Class Z | (143,616,011 | ) | (89,568,079 | ) |
| Increase (Decrease) in Net Assets | | | | |
| from Capital Stock Transactions | (149,859,037 | ) | (22,809,210 | ) |
| Total Increase (Decrease) in Net Assets | (168,007,312 | ) | (19,266,997 | ) |
| Net Assets ($): | | | | |
| Beginning of Period | 1,206,308,849 | | 1,225,575,846 | |
| End of Period | 1,038,301,537 | | 1,206,308,849 | |
| Undistributed investment income—net | 104,139 | | — | |
26
| | | | |
| | | | Year Ended May 31, | |
| | 2014 | a | 2013 | |
| Capital Share Transactions: | | | | |
| Class Ab | | | | |
| Shares sold | 442,316 | | 1,174,497 | |
| Shares issued for dividends reinvested | 155,838 | | 163,763 | |
| Shares redeemed | (2,251,904 | ) | (1,436,280 | ) |
| Net Increase (Decrease) in Shares Outstanding | (1,653,750 | ) | (98,020 | ) |
| Class Cb | | | | |
| Shares sold | 79,662 | | 209,275 | |
| Shares issued for dividends reinvested | 12,356 | | 11,501 | |
| Shares redeemed | (288,228 | ) | (183,296 | ) |
| Net Increase (Decrease) in Shares Outstanding | (196,210 | ) | 37,480 | |
| Class I | | | | |
| Shares sold | 483,188 | | 1,296,197 | |
| Shares issued for dividends reinvested | 27,631 | | 32,795 | |
| Shares redeemed | (2,064,161 | ) | (511,985 | ) |
| Net Increase (Decrease) in Shares Outstanding | (1,553,342 | ) | 817,007 | |
| Class Y | | | | |
| Shares sold | 67.94 | | — | |
| Class Z | | | | |
| Shares sold | 1,155,104 | | 1,801,224 | |
| Shares issued for dividends reinvested | 1,799,679 | | 1,736,687 | |
| Shares redeemed | (9,846,116 | ) | (5,780,374 | ) |
| Net Increase (Decrease) in Shares Outstanding | (6,891,333 | ) | (2,242,463 | ) |
|
| a Effective July 1, 2013, the fund commenced offering ClassY shares. |
| b During the period ended May 31, 2013, 35,307 Class C shares representing $548,860 were exchange for 35,342 |
| Class A shares. |
See notes to financial statements.
The Fund 27
FINANCIAL HIGHLIGHTS
The following tables describe the performance for each share class for the fiscal periods indicated. All information (except portfolio turnover rate) reflects financial results for a single fund share.Total return shows how much your investment in the fund would have increased (or decreased) during each period, assuming you had reinvested all dividends and distributions.These figures have been derived from the fund’s financial statements.
| | | | | | | | | | |
| | | | Year Ended May 31, | | | |
| Class A Shares | 2014 | | 2013 | | 2012 | | 2011 | | 2010 | |
| Per Share Data ($): | | | | | | | | | | |
| Net asset value, beginning of period | 15.35 | | 15.30 | | 14.12 | | 14.52 | | 13.95 | |
| Investment Operations: | | | | | | | | | | |
| Investment income—neta | .54 | | .51 | | .55 | | .57 | | .57 | |
| Net realized and unrealized | | | | | | | | | | |
| gain (loss) on investments | (.16 | ) | .05 | | 1.17 | | (.40 | ) | .57 | |
| Total from Investment Operations | .38 | | .56 | | 1.72 | | .17 | | 1.14 | |
| Distributions: | | | | | | | | | | |
| Dividends from investment income—net | (.53 | ) | (.51 | ) | (.54 | ) | (.57 | ) | (.57 | ) |
| Dividends from net realized | | | | | | | | | | |
| gain on investments | — | | (.00 | )b | — | | — | | — | |
| Total Distributions | (.53 | ) | (.51 | ) | (.54 | ) | (.57 | ) | (.57 | ) |
| Net asset value, end of period | 15.20 | | 15.35 | | 15.30 | | 14.12 | | 14.52 | |
| Total Return (%)c | 2.71 | | 3.67 | | 12.41 | | 1.20 | | 8.30 | |
| Ratios/Supplemental Data (%): | | | | | | | | | | |
| Ratio of total expenses | | | | | | | | | | |
| to average net assets | .93 | | .92 | | .93 | | .93 | | .92 | |
| Ratio of net expenses | | | | | | | | | | |
| to average net assets | .93 | | .92 | | .93 | | .93 | | .92 | |
| Ratio of interest and expense related | | | | | | | | | | |
| to floating rate notes issued | | | | | | | | | | |
| to average net assets | .01 | | — | | — | | — | | — | |
| Ratio of net investment income | | | | | | | | | | |
| to average net assets | 3.68 | | 3.28 | | 3.70 | | 4.00 | | 3.99 | |
| Portfolio Turnover Rate | 13.90 | | 9.57 | | 20.88 | | 14.78 | | 22.39 | |
| Net Assets, end of period ($ x 1,000) | 89,525 | | 115,773 | | 116,939 | | 105,584 | | 123,053 | |
| |
| a | Based on average shares outstanding at each month end. |
| b | Amount represents less than $.01 per share. |
| c | Exclusive of sales charge. |
See notes to financial statements.
28
| | | | | | | | | | |
| | | | Year Ended May 31, | | | |
| Class C Shares | 2014 | | 2013 | | 2012 | | 2011 | | 2010 | |
| Per Share Data ($): | | | | | | | | | | |
| Net asset value, beginning of period | 15.34 | | 15.30 | | 14.12 | | 14.51 | | 13.95 | |
| Investment Operations: | | | | | | | | | | |
| Investment income—neta | .43 | | .39 | | .43 | | .46 | | .45 | |
| Net realized and unrealized | | | | | | | | | | |
| gain (loss) on investments | (.16 | ) | .04 | | 1.18 | | (.39 | ) | .56 | |
| Total from Investment Operations | .27 | | .43 | | 1.61 | | .07 | | 1.01 | |
| Distributions: | | | | | | | | | | |
| Dividends from investment income—net | (.42 | ) | (.39 | ) | (.43 | ) | (.46 | ) | (.45 | ) |
| Dividends from net realized | | | | | | | | | | |
| gain on investments | — | | (.00 | )b | — | | — | | — | |
| Total Distributions | (.42 | ) | (.39 | ) | (.43 | ) | (.46 | ) | (.45 | ) |
| Net asset value, end of period | 15.19 | | 15.34 | | 15.30 | | 14.12 | | 14.51 | |
| Total Return (%)c | 1.92 | | 2.81 | | 11.58 | | .48 | | 7.36 | |
| Ratios/Supplemental Data (%): | | | | | | | | | | |
| Ratio of total expenses | | | | | | | | | | |
| to average net assets | 1.70 | | 1.68 | | 1.66 | | 1.71 | | 1.72 | |
| Ratio of net expenses | | | | | | | | | | |
| to average net assets | 1.70 | | 1.68 | | 1.66 | | 1.71 | | 1.72 | |
| Ratio of interest and expense related | | | | | | | | | | |
| to floating rate notes issued | | | | | | | | | | |
| to average net assets | .01 | | — | | — | | — | | — | |
| Ratio of net investment income | | | | | | | | | | |
| to average net assets | 2.92 | | 2.51 | | 2.95 | | 3.23 | | 3.18 | |
| Portfolio Turnover Rate | 13.90 | | 9.57 | | 20.88 | | 14.78 | | 22.39 | |
| Net Assets, end of period ($ x 1,000) | 9,251 | | 12,351 | | 11,742 | | 9,485 | | 9,653 | |
| |
| a | Based on average shares outstanding at each month end. |
| b | Amount represents less than $.01 per share. |
| c | Exclusive of sales charge. |
See notes to financial statements.
The Fund 29
FINANCIAL HIGHLIGHTS (continued)
| | | | | | | | | | |
| | | | Year Ended May 31, | | | |
| Class I Shares | 2014 | | 2013 | | 2012 | | 2011 | | 2010 | |
| Per Share Data ($): | | | | | | | | | | |
| Net asset value, beginning of period | 15.34 | | 15.29 | | 14.12 | | 14.51 | | 13.94 | |
| Investment Operations: | | | | | | | | | | |
| Investment income—neta | .57 | | .54 | | .58 | | .61 | | .59 | |
| Net realized and unrealized | | | | | | | | | | |
| gain (loss) on investments | (.15 | ) | .06 | | 1.17 | | (.40 | ) | .58 | |
| Total from Investment Operations | .42 | | .60 | | 1.75 | | .21 | | 1.17 | |
| Distributions: | | | | | | | | | | |
| Dividends from investment income—net | (.57 | ) | (.55 | ) | (.58 | ) | (.60 | ) | (.60 | ) |
| Dividends from net realized | | | | | | | | | | |
| gain on investments | — | | (.00 | )b | — | | — | | — | |
| Total Distributions | (.57 | ) | (.55 | ) | (.58 | ) | (.60 | ) | (.60 | ) |
| Net asset value, end of period | 15.19 | | 15.34 | | 15.29 | | 14.12 | | 14.51 | |
| Total Return (%) | 2.96 | | 3.93 | | 12.60 | | 1.54 | | 8.57 | |
| Ratios/Supplemental Data (%): | | | | | | | | | | |
| Ratio of total expenses | | | | | | | | | | |
| to average net assets | .68 | | .66 | | .68 | | .66 | | .68 | |
| Ratio of net expenses | | | | | | | | | | |
| to average net assets | .68 | | .66 | | .68 | | .66 | | .67 | |
| Ratio of interest and expense related | | | | | | | | | | |
| to floating rate notes issued | | | | | | | | | | |
| to average net assets | .01 | | — | | — | | — | | — | |
| Ratio of net investment income | | | | | | | | | | |
| to average net assets | 3.93 | | 3.52 | | 3.92 | | 4.29 | | 4.20 | |
| Portfolio Turnover Rate | 13.90 | | 9.57 | | 20.88 | | 14.78 | | 22.39 | |
| Net Assets, end of period ($ x 1,000) | 19,350 | | 43,363 | | 30,742 | | 24,039 | | 17,546 | |
| |
| a | Based on average shares outstanding at each month end. |
| b | Amount represents less than $.01 per share. |
See notes to financial statements.
30
| | |
| | Period Ended | |
| Class Y Shares | May 31, 2014a | |
| Per Share Data ($): | | |
| Net asset value, beginning of period | 14.72 | |
| Investment Operations: | | |
| Investment income—netb | .53 | |
| Net realized and unrealized | | |
| gain (loss) on investments | .46 | |
| Total from Investment Operations | .99 | |
| Distributions: | | |
| Dividends from investment income—net | (.52 | ) |
| Net asset value, end of period | 15.19 | |
| Total Return (%)c | 6.95 | |
| Ratios/Supplemental Data (%): | | |
| Ratio of total expenses to average net assetsd | .63 | |
| Ratio of net expenses to average net assetsd | .63 | |
| Ratio of interest and expense related to | | |
| floating rate notes issued to average net assets | .01 | |
| Ratio of net investment income to average net assetsd | 3.97 | |
| Portfolio Turnover Rate | 13.90 | |
| Net Assets, end of period ($ x 1,000) | 1 | |
| |
| a | From July 1, 2013 (commencement of initial offering) to May 31, 2014. |
| b | Based on average shares outstanding at each month end. |
| c | Not annualized. |
| d | Annualized. |
See notes to financial statements.
The Fund 31
FINANCIAL HIGHLIGHTS (continued)
| | | | | | | | | | |
| | | | | | Year Ended May 31, | | | |
| Class Z Shares | 2014 | | 2013 | | 2012 | | 2011 | | 2010 | |
| Per Share Data ($): | | | | | | | | | | |
| Net asset value, | | | | | | | | | | |
| beginning of period | 15.35 | | 15.30 | | 14.12 | | 14.52 | | 13.95 | |
| Investment Operations: | | | | | | | | | | |
| Investment income—neta | .57 | | .54 | | .58 | | .60 | | .60 | |
| Net realized and unrealized | | | | | | | | | | |
| gain (loss) on investments | (.16 | )�� | .05 | | 1.17 | | (.40 | ) | .57 | |
| Total from Investment Operations | .41 | | .59 | | 1.75 | | .20 | | 1.17 | |
| Distributions: | | | | | | | | | | |
| Dividends from | | | | | | | | | | |
| investment income—net | (.56 | ) | (.54 | ) | (.57 | ) | (.60 | ) | (.60 | ) |
| Dividends from net realized | | | | | | | | | | |
| gain on investments | — | | (.00 | )b | — | | — | | — | |
| Total Distributions | (56 | ) | (.54 | ) | (.57 | ) | (.60 | ) | (.60 | ) |
| Net asset value, end of period | 15.20 | | 15.35 | | 15.30 | | 14.12 | | 14.52 | |
| Total Return (%) | 2.92 | | 3.89 | | 12.63 | | 1.43 | | 8.52 | |
| Ratios/Supplemental Data (%): | | | | | | | | | | |
| Ratio of total expenses | | | | | | | | | | |
| to average net assets | .72 | | .70 | | .73 | | .71 | | .71 | |
| Ratio of net expenses | | | | | | | | | | |
| to average net assets | .72 | | .70 | | .73 | | .71 | | .71 | |
| Ratio of interest and expense related | | | | | | | | | | |
| to floating rate notes issued | | | | | | | | | | |
| to average net assets | .01 | | — | | — | | — | | — | |
| Ratio of net investment income | | | | | | | | | | |
| to average net assets | 3.89 | | 3.50 | | 3.90 | | 4.23 | | 4.21 | |
| Portfolio Turnover Rate | 13.90 | | 9.57 | | 20.88 | | 14.78 | | 22.39 | |
| Net Assets, end of period | | | | | | | | | | |
| ($ x 1,000) | 920,175 | | 1,034,822 | | 1,066,153 | | 1,016,288 | | 1,194,399 | |
| |
| a | Based on average shares outstanding at each month end. |
| b | Amount represents less than $.01 per share. |
See notes to financial statements.
32
NOTES TO FINANCIAL STATEMENTS
NOTE 1—Significant Accounting Policies:
Dreyfus California AMT-Free Municipal Bond Fund (the “fund”) is the sole series of Dreyfus Premier California AMT-Free Municipal Bond Fund Inc. (the “Company”), which is registered under the Investment Company Act of 1940, as amended (the “Act”), as a non-diversified open-end management investment company. The fund’s investment objective is to seek as high a level of current income exempt from federal and California state income taxes, as is consistent with the preservation of capital. The Dreyfus Corporation (the “Manager” or “Dreyfus”), a wholly-owned subsidiary of The Bank of New York Mellon Corporation (“BNY Mellon”), serves as the fund’s investment adviser.
MBSC Securities Corporation (the “Distributor”), a wholly-owned subsidiary of the Manager, is the distributor of the fund’s shares. The fund is authorized to issue 600 million shares of $.001 par value Common Stock.The fund currently offers five classes of shares: Class A (100 million shares authorized), Class C (100 million shares authorized), Class I (100 million shares authorized), Class Y (100 million shares authorized) and Class Z (200 million shares authorized). Class A shares generally are subject to a sales charge imposed at the time of purchase. Class C shares are subject to a contingent deferred sales charge (“CDSC”) imposed on Class C shares redeemed within one year of purchase. Class I and ClassY shares are sold at net asset value per share generally to institutional investors. Class Z shares are sold at net asset value per share generally only to shareholders who received Class Z shares in exchange for their shares of General California Municipal Bond Fund, California Municipal Income, Inc. and Dreyfus California Intermediate Municipal Bond Fund, as a result of the reorganization of such funds. Class Z shares generally are not available for new accounts. Other differences between the classes include the services offered to
The Fund 33
NOTES TO FINANCIAL STATEMENTS (continued)
and the expenses borne by each class, the allocation of certain transfer agency costs, and certain voting rights. Income, expenses (other than expenses attributable to a specific class), and realized and unrealized gains or losses on investments are allocated to each class of shares based on its relative net assets.
As of May 31, 2014, MBC Investments Corp., an indirect subsidiary of BNY Mellon, held all of the outstanding Class Y shares of the fund.
The Financial Accounting Standards Board (“FASB”) Accounting Standards Codification is the exclusive reference of authoritative U.S. generally accepted accounting principles (“GAAP”) recognized by the FASB to be applied by nongovernmental entities. Rules and interpretive releases of the Securities and Exchange Commission (“SEC”) under authority of federal laws are also sources of authoritative GAAP for SEC registrants. The fund’s financial statements are prepared in accordance with GAAP, which may require the use of management estimates and assumptions.Actual results could differ from those estimates.
The Company enters into contracts that contain a variety of indemnifications. The fund’s maximum exposure under these arrangements is unknown.The fund does not anticipate recognizing any loss related to these arrangements.
(a) Portfolio valuation: The fair value of a financial instrument is the amount that would be received to sell an asset or paid to transfer a liability in an orderly transaction between market participants at the measurement date (i.e., the exit price). GAAP establishes a fair value hierarchy that pri-oritizes the inputs of valuation techniques used to measure fair value.This hierarchy gives the highest priority to unadjusted quoted prices in active markets for identical assets or liabilities (Level 1 measurements) and the lowest priority to unobservable inputs (Level 3 measurements).
Additionally, GAAP provides guidance on determining whether the volume and activity in a market has decreased significantly and whether such a decrease in activity results in transactions that are not orderly. GAAP requires enhanced disclosures around valuation inputs and techniques used during annual and interim periods.
34
Various inputs are used in determining the value of the fund’s investments relating to fair value measurements.These inputs are summarized in the three broad levels listed below:
Level 1—unadjusted quoted prices in active markets for identical investments.
Level 2—other significant observable inputs (including quoted prices for similar investments, interest rates, prepayment speeds, credit risk, etc.).
Level 3—significant unobservable inputs (including the fund’s own assumptions in determining the fair value of investments).
The inputs or methodology used for valuing securities are not necessarily an indication of the risk associated with investing in those securities.
Changes in valuation techniques may result in transfers in or out of an assigned level within the disclosure hierarchy. Valuation techniques used to value the fund’s investments are as follows:
Investments in securities are valued each business day by an independent pricing service (the “Service”) approved by the Company’s Board of Directors (the “Board”). Investments for which quoted bid prices are readily available and are representative of the bid side of the market in the judgment of the Service are valued at the mean between the quoted bid prices (as obtained by the Service from dealers in such securities) and asked prices (as calculated by the Service based upon its evaluation of the market for such securities). Other investments (which constitute a majority of the portfolio securities) are carried at fair value as determined by the Service, based on methods which include consideration of the following: yields or prices of municipal securities of comparable quality, coupon, maturity and type; indications as to values from dealers; and general market conditions. All of the preceding securities are generally categorized within Level 2 of the fair value hierarchy. Investments in swap transactions are valued each business day by the Service. Swaps are valued by the Service by using a swap pricing model which incorporates among other factors, default probabilities, recovery rates, credit
The Fund 35
NOTES TO FINANCIAL STATEMENTS (continued)
curves of the underlying issuer and swap spreads on interest rates and are generally categorized within Level 2 of the fair value hierarchy.
The Service’s procedures are reviewed by Dreyfus under the general supervision of the Board.
When market quotations or official closing prices are not readily available, or are determined not to reflect accurately fair value, such as when the value of a security has been significantly affected by events after the close of the exchange or market on which the security is principally traded, but before the fund calculates its net asset value, the fund may value these investments at fair value as determined in accordance with the procedures approved by the Board. Certain factors may be considered when fair valuing investments such as: fundamental analytical data, the nature and duration of restrictions on disposition, an evaluation of the forces that influence the market in which the securities are purchased and sold, and public trading in similar securities of the issuer or comparable issuers.These securities are either categorized within Level 2 or 3 of the fair value hierarchy depending on the relevant inputs used.
For restricted securities where observable inputs are limited, assumptions about market activity and risk are used and are generally categorized within Level 3 of the fair value hierarchy.
The following is a summary of the inputs used as of May 31, 2014 in valuing the fund’s investments:
| | | | | | |
| | | Level 2—Other | | Level 3— | | |
| | Level 1— | Significant | | Significant | | |
| | Unadjusted | Observable | | Unobservable | | |
| Quoted Prices | Inputs | | Inputs | Total | |
| Assets ($) | | | | | | |
| Investments in Securities: | | | | | |
| Municipal Bonds† | — | 1,041,715,549 | | — | 1,041,715,549 | |
| Liabilities ($) | | | | | | |
| Floating Rate Notes†† | — | (9,750,000 | ) | — | (9,750,000 | ) |
| |
| † | See Statement of Investments for additional detailed categorizations. |
| †† | Certain of the fund’s liabilities are held at carrying amount, which approximates fair value for |
| | financial reporting purposes. |
36
At May 31, 2014, there were no transfers between Level 1 and Level 2 of the fair value hierarchy.
(b) Securities transactions and investment income: Securities transactions are recorded on a trade date basis. Realized gains and losses from securities transactions are recorded on the identified cost basis. Interest income, adjusted for accretion of discount and amortization of premium on investments, is earned from settlement date and recognized on the accrual basis. Securities purchased or sold on a when issued or delayed delivery basis may be settled a month or more after the trade date.
The fund follows an investment policy of investing primarily in municipal obligations of one state. Economic changes affecting the state and certain of its public bodies and municipalities may affect the ability of issuers within the state to pay interest on, or repay principal of, municipal obligations held by the fund.
(c) Dividends to shareholders: It is the policy of the fund to declare dividends daily from investment income-net. Such dividends are paid monthly. Dividends from net realized capital gains, if any, are normally declared and paid annually, but the fund may make distributions on a more frequent basis to comply with the distribution requirements of the Internal Revenue Code of 1986, as amended (the “Code”).To the extent that net realized capital gains can be offset by capital loss carryovers, it is the policy of the fund not to distribute such gains. Income and capital gain distributions are determined in accordance with income tax regulations, which may differ from GAAP.
(d) Federal income taxes: It is the policy of the fund to continue to qualify as a regulated investment company, which can distribute tax-exempt dividends, by complying with the applicable provisions of the Code, and to make distributions of income and net realized capital gain sufficient to relieve it from substantially all federal income and excise taxes.
The Fund 37
NOTES TO FINANCIAL STATEMENTS (continued)
As of and during the period ended May 31, 2014, the fund did not have any liabilities for any uncertain tax positions.The fund recognizes interest and penalties, if any, related to uncertain tax positions as income tax expense in the Statement of Operations. During the period ended May 31, 2014, the fund did not incur any interest or penalties.
Each tax year in the four-year period ended May 31, 2014 remains subject to examination by the Internal Revenue Service and state taxing authorities.
At May 31, 2014, the components of accumulated earnings on a tax basis were as follows: undistributed tax-exempt income $1,004,965, accumulated capital losses $26,282,220 and unrealized appreciation $96,903,907.
Under the Regulated Investment Company Modernization Act of 2010 (the “2010 Act”), the fund is permitted to carry forward capital losses incurred in taxable years beginning after December 22, 2010 (“post-enactment losses”) for an unlimited period. Furthermore, post-enactment capital loss carryovers retain their character as either short-term or long-term capital losses rather than short-term as they were under previous statute.The 2010 Act requires post-enactment losses to be utilized before the utilization of losses incurred in taxable years prior to the effective date of the 2010 Act (“pre-enactment losses”).As a result of this ordering rule, pre-enactment losses may be more likely to expire unused.
The accumulated capital loss carryover is available for federal income tax purposes to be applied against future net realized capital gains, if any, realized subsequent to May 31, 2014. If not applied, $158,542 of the carryover expires in fiscal year 2016 and $15,819,359 expires in fiscal year 2018.The fund has $3,697,784 of post-enactment short-term capital losses and $6,606,535 of post-enactment long-term capital losses which can be carried forward for an unlimited period.
The tax character of distributions paid to shareholders during the fiscal periods ended May 31, 2014 and May 31, 2013 were as follows: tax-exempt income $40,412,982 and $42,412,918, and ordinary income $53,644 and $343,306, respectively.
38
During the period ended May 31, 2014, as a result of permanent book to tax differences, primarily due to the tax treatment for amortization adjustments and dividend reclassification, the fund decreased accumulated undistributed investment income-net by $210,289, increased accumulated net realized gain (loss) on investments by $147,156 and increased paid-in capital by $63,133. Net assets and net asset value per share were not affected by this reclassification.
NOTE 2—Bank Lines of Credit:
The fund participates with other Dreyfus-managed funds in a $265 million unsecured credit facility led by Citibank, N.A. and a $300 million unsecured credit facility provided by The Bank of New York Mellon, a subsidiary of BNY Mellon and an affiliate of Dreyfus (each, a “Facility”), each to be utilized primarily for temporary or emergency purposes, including the financing of redemptions. Prior to October 9, 2013, the unsecured credit facility with Citibank, N.A. was $210 million. In connection therewith, the fund has agreed to pay its pro rata portion of commitment fees for each Facility. Interest is charged to the fund based on rates determined pursuant to the terms of the respective Facility at the time of borrowing. During the period ended May 31, 2014, the fund did not borrow under the Facilities.
NOTE 3—Management Fee and Other Transactions with Affiliates:
(a) Pursuant to a management agreement (the “Agreement”) with the Manager, the management fee is computed at the annual rate of .60% of the value of the fund’s average daily net assets and is payable monthly.The Agreement provides that if in any fiscal year the aggregate expenses allocable to Class Z shares (excluding taxes, brokerage commissions, interest expense, commitment fees on borrowings and extraordinary expenses) exceed 1 1 / 2% of the value of the average daily net assets of Class Z shares, the fund may deduct from the fees paid to the Manager, or the Manager will bear, such excess expense. During the period ended May 31, 2014, there was no reduction in expenses pursuant to the Agreement.
The Fund 39
NOTES TO FINANCIAL STATEMENTS (continued)
During the period ended May 31, 2014, the Distributor retained $2,593 from commissions earned on sales of the fund’s Class A shares and $884 from CDSCs on redemptions of the fund’s Class C shares.
(b) Under the Distribution Plan adopted pursuant to Rule 12b-1 under the Act, Class C shares pay the Distributor for distributing its shares at an annual rate of .75% of the value of its average daily net assets. During the period ended May 31, 2014, Class C shares were charged $75,146 pursuant to the Distribution Plan.
(c) Under the Shareholder Services Plan, Class A and Class C shares pay the Distributor at an annual rate of .25% of the value of their average daily net assets for the provision of certain services.The services provided may include personal services relating to shareholder accounts, such as answering shareholder inquiries regarding the fund and providing reports and other information, and services related to the maintenance of shareholder accounts.The Distributor may make payments to Service Agents (securities dealers, financial institutions or other industry professionals) with respect to these services. The Distributor determines the amounts to be paid to Service Agents. During the period ended May 31, 2014, Class A and Class C shares were charged $238,913 and $25,049, respectively, pursuant to the Shareholder Services Plan.
Under the Shareholder Services Plan, Class Z shares reimburse the Distributor at an amount not to exceed an annual rate of .25% of the value of Class Z shares’ average daily net assets for certain allocated expenses of providing personal services and/or maintaining shareholder accounts.The services provided may include personal services relating to shareholder accounts, such as answering shareholder inquiries regarding Class Z shares and providing reports and other information, and services related to the maintenance of shareholder accounts. During the period ended May 31, 2014, Class Z shares were charged $394,599 pursuant to the Shareholder Services Plan.
40
The fund has arrangements with the transfer agent and the custodian whereby the fund may receive earnings credits when positive cash balances are maintained, which are used to offset transfer agency and custody fees. For financial reporting purposes, the fund includes net earnings credits as an expense offset in the Statement of Operations.
The fund compensates DreyfusTransfer, Inc., a wholly-owned subsidiary of the Manager, under a transfer agency agreement for providing transfer agency and cash management services for the fund. The majority of transfer agency fees are comprised of amounts paid on a per account basis, while cash management fees are related to fund subscriptions and redemptions. During the period ended May 31, 2014, the fund was charged $212,564 for transfer agency services and $9,716 for cash management services.These fees are included in Shareholder servicing costs in the Statement of Operations. Cash management fees were partially offset by earnings credits of $751.
The fund compensates The Bank of NewYork Mellon under a custody agreement for providing custodial services for the fund.These fees are determined based on net assets, geographic region and transaction activity. During the period ended May 31, 2014, the fund was charged $78,906 pursuant to the custody agreement.
The fund compensated The Bank of New York Mellon for performing certain cash management services related to fund subscriptions and redemptions, including shareholder redemption draft processing, under a cash management agreement that was in effect until September 30, 2013 and, beginning October 1, 2013, compensates The Bank of New York Mellon for processing shareholder redemption drafts under a shareholder draft processing agreement. During the period ended May 31, 2014, the fund was charged $5,798 pursuant to the agreements, which is included in Shareholder servicing costs in the Statement of Operations.
The Fund 41
NOTES TO FINANCIAL STATEMENTS (continued)
During the period ended May 31, 2014, the fund was charged $9,157 for services performed by the Chief Compliance Officer and his staff.
The components of “Due to The Dreyfus Corporation and affiliates” in the Statement of Assets and Liabilities consist of: management fees $526,640, Distribution Plan fees $5,904, Shareholder Services Plan fees $22,956, custodian fees $26,172, Chief Compliance Officer fees $1,472 and transfer agency fees $36,681.
(d) Each Board member also serves as a Board member of other funds within the Dreyfus complex. Annual retainer fees and attendance fees are allocated to each fund based on net assets.
NOTE 4—Securities Transactions:
The aggregate amount of purchases and sales of investment securities, excluding short-term securities and swap transactions, during the period ended May 31, 2014, amounted to $145,599,927 and $290,542,341, respectively.
Inverse Floater Securities: The fund participates in secondary inverse floater structures in which fixed-rate, tax-exempt municipal bonds are transferred to a trust (the “Trust”).TheTrust typically issues two variable rate securities that are collateralized by the cash flows of the fixed-rate, tax-exempt municipal bonds. One of these variable rate securities pays interest based on a short-term floating rate set by a remarketing agent at predetermined intervals (“Trust Certificates”). A residual interest tax-exempt security is also created by the Trust, which is transferred to the fund, and is paid interest based on the remaining cash flow of the Trust, after payment of interest on the other securities and various expenses of the Trust. An inverse floater security may be collapsed without the consent of the fund due to certain termination events such as bankruptcy, default or other credit event.
The fund accounts for the transfer of bonds to the Trust as secured borrowings, with the securities transferred remaining in the fund’s investments, and the related floating rate certificate securities reflected as fund liabilities in the Statement of Assets and Liabilities.
42
The fund may invest in inverse floater securities on either a non-recourse or recourse basis.These securities are typically supported by a liquidity facility provided by a bank or other financial institution (the “Liquidity Provider”) that allows the holders of the Trust Certificates to tender their certificates in exchange for payment from the Liquidity Provider of par plus accrued interest on any business day prior to a termination event.When the fund invests in inverse floater securities on a non-recourse basis, the Liquidity Provider is required to make a payment under the liquidity facility due to a termination event to the holders of the Trust Certificates. When this occurs, the Liquidity Provider typically liquidates all or a portion of the municipal securities held in the Trust. A liquidation shortfall occurs if the Trust Certificates exceed the proceeds of the sale of the bonds in the Trust (“Liquidation Shortfall”).When a fund invests in inverse floater securities on a recourse basis, the fund typically enters into a reimbursement agreement with the Liquidity Provider where the fund is required to repay the Liquidity Provider the amount of any Liquidation Shortfall. As a result, the fund investing in a recourse inverse floater security bears the risk of loss with respect to any Liquidation Shortfall.
The average amount of borrowings outstanding under the inverse floater structure during the period ended May 31, 2014, was approximately $8,937,500 with a related weighted average annualized interest rate of .64%.
Derivatives: A derivative is a financial instrument whose performance is derived from the performance of another asset. Each type of derivative instrument that was held by the fund during the period ended May 31, 2014 is discussed below.
Swap Transactions: The fund enters into swap agreements to exchange the interest rate on, or return generated by, one nominal instrument for the return generated by another nominal instrument. Swap agreements are privately negotiated in the over-the-counter (“OTC”) market or centrally cleared.The fund enters into these agreements to hedge cer-
The Fund 43
NOTES TO FINANCIAL STATEMENTS (continued)
tain market or interest rate risks, to manage the interest rate sensitivity (sometimes called duration) of fixed income securities, to provide a substitute for purchasing or selling particular securities or to increase potential returns.
For OTC swaps, the fund accrues for the interim payments on a daily basis, with the net amount recorded within unrealized appreciation (depreciation) on swap agreements in the Statement of Assets and Liabilities. Once the interim payments are settled in cash, the net amount is recorded as a realized gain (loss) on swaps, in addition to realized gain (loss) recorded upon the termination of swap transactions in the Statement of Operations. Upfront payments made and/or received by the fund, are recorded as an asset and/or liability in the Statement of Assets and Liabilities and are recorded as a realized gain or loss ratably over the agreement’s term/event with the exception of forward starting interest rate swaps which are recorded as realized gains or losses on the termination date.
Fluctuations in the value of swap agreements are recorded for financial statement purposes as unrealized appreciation or depreciation on swap transactions.
Interest Rate Swaps: Interest rate swaps involve the exchange of commitments to pay and receive interest based on a notional principal amount.The fund may elect to pay a fixed rate and receive a floating rate, or receive a fixed rate and pay a floating rate on a notional principal amount.The net interest received or paid on interest rate swap agreements is included within realized gain (loss) on swap transactions in the Statement of Operations. Interest rate swap agreements are subject to general market risk, liquidity risk, counterparty risk and interest rate risk. For financial reporting purposes, forward rate agreements are classified as interest rate swaps.At May 31, 2014, there were no interest rate swap agreements outstanding.
44
The following summarizes the average notional value of swap agreements outstanding during the period ended May 31, 2014:
| |
| | Average Notional Value ($) |
| Interest rate swap agreements | 4,615,385 |
At May 31, 2014, the cost of investments for federal income tax purposes was $935,061,642; accordingly, accumulated net unrealized appreciation on investments was $96,903,907, consisting of $105,641,242 gross unrealized appreciation and $8,737,335 gross unrealized depreciation.
The Fund 45
|
| REPORT OF INDEPENDENT REGISTERED |
| PUBLIC ACCOUNTING FIRM |
Shareholders and Board of Directors
Dreyfus California AMT-Free Municipal Bond Fund
We have audited the accompanying statement of assets and liabilities, including the statement of investments, of Dreyfus California AMT-Free Municipal Bond Fund (the sole series comprising Dreyfus Premier California AMT-Free Municipal Bond Fund Inc.) as of May 31, 2014, and the related statement of operations for the year then ended, the statement of changes in net assets for each of the two years in the period then ended, and the financial highlights for each of the periods indicated therein. These financial statements and financial highlights are the responsibility of the Fund’s management. Our responsibility is to express an opinion on these financial statements and financial highlights based on our audits.
We conducted our audits in accordance with the standards of the Public Company Accounting Oversight Board (United States).Those standards require that we plan and perform the audit to obtain reasonable assurance about whether the financial statements and financial highlights are free of material misstatement.We were not engaged to perform an audit of the Fund’s internal control over financial reporting. Our audits included consideration of internal control over financial reporting as a basis for designing audit procedures that are appropriate in the circumstances, but not for the purpose of expressing an opinion on the effectiveness of the Fund’s internal control over financial reporting. Accordingly, we express no such opinion. An audit also includes examining, on a test basis, evidence supporting the amounts and disclosures in the financial statements and financial highlights, assessing the accounting principles used and significant estimates made by management, and evaluating the overall financial statement presentation. Our procedures included confirmation of securities owned as of May 31, 2014 by correspondence with the custodian and others. We believe that our audits provide a reasonable basis for our opinion.
In our opinion, the financial statements and financial highlights referred to above present fairly, in all material respects, the financial position of Dreyfus California AMT-Free Municipal Bond Fund at May 31, 2014, the results of its operations for the year then ended, the changes in its net assets for each of the two years in the period then ended, and the financial highlights for each of the indicated periods, in conformity with U.S. generally accepted accounting principles.

New York, New York
July 25, 2014
46
IMPORTANT TAX INFORMATION (Unaudited)
In accordance with federal tax law, the fund hereby reports all the dividends paid from investment income-net during the fiscal year ended May 31, 2014 as “exempt-interest dividends” (not subject to regular federal income tax, and for individuals who are California residents, California personal income taxes), except $53,644 that is being reported as an ordinary income distribution for reporting purposes.
Where required by federal tax law rules, shareholders will receive notification of their portion of the fund’s taxable ordinary dividends (if any), capital gains distributions (if any) and tax-exempt dividends paid for the 2014 calendar year on Form 1099-DIV, which will be mailed in early 2015.
The Fund 47
|
| BOARD MEMBERS INFORMATION (Unaudited) |
| INDEPENDENT BOARD MEMBERS |
|
| Joseph S. DiMartino (70) |
| Chairman of the Board (1995) |
| Principal Occupation During Past 5Years: |
| • Corporate Director and Trustee |
| Other Public Company Board Memberships During Past 5Years: |
| • CBIZ (formerly, Century Business Services, Inc.), a provider of outsourcing functions for small |
| and medium size companies, Director (1997-present) |
| • The Newark Group, a provider of a national market of paper recovery facilities, paperboard |
| mills and paperboard converting plants, Director (2000-2010) |
| • Sunair Services Corporation, a provider of certain outdoor-related services to homes and |
| businesses, Director (2005-2009) |
| No. of Portfolios for which Board Member Serves: 146 |
| ——————— |
| William Hodding Carter III (79) |
| Board Member (1988) |
| Principal Occupation During Past 5Years: |
| • Professor of Leadership & Public Policy, University of North Carolina, Chapel Hill (2006-present) |
| No. of Portfolios for which Board Member Serves: 24 |
| ——————— |
| Joni Evans (72) |
| Board Member (2006) |
| Principal Occupation During Past 5Years: |
| • Chief Executive Officer, www.wowOwow.com an online community dedicated to women’s |
| conversations and publications (2007-present) |
| • Principal, Joni Evans Ltd. (publishing) (2006-present) |
| No. of Portfolios for which Board Member Serves: 24 |
| ——————— |
| Ehud Houminer (73) |
| Board Member (1994) |
| Principal Occupation During Past 5Years: |
| • Executive-in-Residence at the Columbia Business School, Columbia University (1992-present) |
| Other Public Company Board Membership During Past 5Years: |
| • Avnet Inc., an electronics distributor, Director (1993-2012) |
| No. of Portfolios for which Board Member Serves: 66 |
48
|
| Richard C. Leone (74) |
| Board Member (1980) |
| Principal Occupation During Past 5Years: |
| • Senior Fellow of The Century Foundation (formerly,The Twentieth Century Fund, Inc.), a |
| tax exempt research foundation engaged in the study of economic, |
| foreign policy and domestic issues |
| • President—The Century Foundation (1989-2011) |
| No. of Portfolios for which Board Member Serves: 24 |
| ——————— |
| Hans C. Mautner (76) |
| Board Member (1980) |
| Principal Occupation During Past 5Years: |
| • President—International Division and an Advisory Director of Simon Property Group, a real |
| estate investment company (1998-2010) |
| • Chairman and Chief Executive Officer of Simon Global Limited, a real estate company (1999-2010) |
| No. of Portfolios for which Board Member Serves: 24 |
| ——————— |
| Robin A. Melvin (50) |
| Board Member (1995) |
| Principal Occupation During Past 5Years: |
| • Board Member, Illinois Mentoring Partnership, non-profit organization dedicated to increasing |
| the quantity and quality of mentoring services in Illinois (2013-present) |
| • Director, Boisi Family Foundation, a private family foundation that supports youth-serving orga- |
| nizations that promote the self sufficiency of youth from disadvantaged circumstances (1995-2012) |
| No. of Portfolios for which Board Member Serves: 113 |
| ——————— |
| Burton N. Wallack (63) |
| Board Member (2006) |
| Principal Occupation During Past 5Years: |
| • President and Co-owner of Wallack Management Company, a real estate management company |
| (1987-present) |
| No. of Portfolios for which Board Member Serves: 24 |
| ——————— |
| John E. Zuccotti (76) |
| Board Member (1980) |
| Principal Occupation During Past 5Years: |
| • Chairman of Brookfield Properties, Inc. (1996-present) |
| • Senior Counsel of Weil, Gotshal & Manges, LLP (1997-present) |
| Other Public Company Board Membership During Past 5Years: |
| • Wellpoint, Inc., a health benefits company, Director (2005-2010) |
| No. of Portfolios for which Board Member Serves: 24 |
The Fund 49
|
| BOARD MEMBERS INFORMATION (Unaudited) (continued) |
| INTERESTED BOARD MEMBER |
|
| Gordon J. Davis (72) |
| Board Member (2006) |
| Principal Occupation During Past 5Years: |
| • Partner in the law firm of Venable LLP (2012-present) |
| • Partner in the law firm of Dewey & LeBoeuf LLP (1994-2012) |
| Other Public Company Board Memberships During Past 5Years: |
| • Consolidated Edison, Inc., a utility company, Director (1997-present) |
| • The Phoenix Companies, Inc., a life insurance company, Director (2000-present) |
| No. of Portfolios for which Board Member Serves: 59 |
| Gordon J. Davis is deemed to be an “interested person” (as defined in the Act) of the fund as a result of his affiliation |
| with Venable LLP, which provides legal services to the fund. |
| ——————— |
Once elected all Board Members serve for an indefinite term, but achieve Emeritus status upon reaching age 80.The address of the Board Members and Officers is c/o The Dreyfus Corporation, 200 Park Avenue, NewYork, NewYork 10166. Additional information about the Board Members is available in the fund’s Statement of Additional Information which can be obtained from Dreyfus free of charge by calling this toll free number: 1-800-DREYFUS.
Arnold S. Hiatt, Emeritus Board Member
50
OFFICERS OF THE FUND (Unaudited)
BRADLEY J. SKAPYAK, President since January 2010.
Chief Operating Officer and a director of the Manager since June 2009, Chairman of Dreyfus Transfer, Inc., an affiliate of the Manager and the transfer agent of the funds, since May 2011 and Executive Vice President of the Distributor since June 2007. From April 2003 to June 2009, Mr. Skapyak was the head of the Investment Accounting and Support Department of the Manager. He is an officer of 69 investment companies (comprised of 146 portfolios) managed by the Manager. He is 55 years old and has been an employee of the Manager since February 1988.
JOHN PAK, Chief Legal Officer since March 2013.
Chief Legal Officer of the Manager and Associate General Counsel and Managing Director of BNY Mellon since August 2012; from March 2005 to July 2012, Managing Director of Deutsche Bank, Deputy Global Head of Deutsche Asset Management Legal and Regional Head of Deutsche Asset Management Americas Legal. He is an officer of 70 investment companies (comprised of 171 portfolios) managed by the Manager. He is 45 years old and has been an employee of the Manager since August 2012.
JANETTE E. FARRAGHER, Vice President and Secretary since December 2011.
Assistant General Counsel of BNY Mellon, and an officer of 70 investment companies (comprised of 171 portfolios) managed by the Manager. She is 51 years old and has been an employee of the Manager since February 1984.
KIESHA ASTWOOD, Vice President and Assistant Secretary since January 2010.
Senior Counsel of BNY Mellon, and an officer of 70 investment companies (comprised of 171 portfolios) managed by the Manager. She is 41 years old and has been an employee of the Manager since July 1995.
JAMES BITETTO, Vice President and Assistant Secretary since August 2005.
Managing Counsel of BNY Mellon and Secretary of the Manager, and an officer of 70 investment companies (comprised of 171 portfolios) managed by the Manager. He is 47 years old and has been an employee of the Manager since December 1996.
JONI LACKS CHARATAN, Vice President and Assistant Secretary since August 2005.
Managing Counsel of BNY Mellon, and an officer of 70 investment companies (comprised of 171 portfolios) managed by the Manager. She is 58 years old and has been an employee of the Manager since October 1988.
JOSEPH M. CHIOFFI, Vice President and Assistant Secretary since August 2005.
Managing Counsel of BNY Mellon, and an officer of 70 investment companies (comprised of 171 portfolios) managed by the Manager. He is 52 years old and has been an employee of the Manager since June 2000.
JOHN B. HAMMALIAN, Vice President and Assistant Secretary since August 2005.
Senior Managing Counsel of BNY Mellon, and an officer of 70 investment companies (comprised of 171 portfolios) managed by the Manager. He is 50 years old and has been an employee of the Manager since February 1991.
SARAH S. KELLEHER, Vice President and Assistant Secretary since April 2014.
Senior Counsel of BNY Mellon, and an officer of 70 investment companies (comprised of 171 portfolios) managed by the Manager; from August 2005 to March 2013, Associate General Counsel of Third Avenue Management. She is 38 years old and has been an employee of the Manager since March 2013.
The Fund 51
OFFICERS OF THE FUND (Unaudited) (continued)
JEFF PRUSNOFSKY, Vice President and Assistant Secretary since August 2005.
Senior Managing Counsel of BNY Mellon, and an officer of 70 investment companies (comprised of 171 portfolios) managed by the Manager. He is 49 years old and has been an employee of the Manager since October 1990.
JAMES WINDELS, Treasurer since November 2001.
Director – Mutual Fund Accounting of the Manager, and an officer of 70 investment companies (comprised of 171 portfolios) managed by the Manager. He is 55 years old and has been an employee of the Manager since April 1985.
RICHARD CASSARO, Assistant Treasurer since January 2008.
Senior Accounting Manager – Money Market and Municipal Bond Funds of the Manager, and an officer of 70 investment companies (comprised of 171 portfolios) managed by the Manager. He is 55 years old and has been an employee of the Manager since September 1982.
GAVIN C. REILLY, Assistant Treasurer since December 2005.
Tax Manager of the Investment Accounting and Support Department of the Manager, and an officer of 70 investment companies (comprised of 171 portfolios) managed by the Manager. He is 45 years old and has been an employee of the Manager since April 1991.
ROBERT S. ROBOL, Assistant Treasurer since August 2003.
Senior Accounting Manager – Fixed Income Funds of the Manager, and an officer of 70 investment companies (comprised of 171 portfolios) managed by the Manager. He is 50 years old and has been an employee of the Manager since October 1988.
ROBERT SALVIOLO, Assistant Treasurer since July 2007.
Senior Accounting Manager – Equity Funds of the Manager, and an officer of 70 investment companies (comprised of 171 portfolios) managed by the Manager. He is 47 years old and has been an employee of the Manager since June 1989.
ROBERT SVAGNA, Assistant Treasurer since August 2005.
Senior Accounting Manager – Equity Funds of the Manager, and an officer of 70 investment companies (comprised of 171 portfolios) managed by the Manager. He is 47 years old and has been an employee of the Manager since November 1990.
JOSEPH W. CONNOLLY, Chief Compliance Officer since October 2004.
Chief Compliance Officer of the Manager and The Dreyfus Family of Funds (70 investment companies, comprised of 171 portfolios). He is 57 years old and has served in various capacities with the Manager since 1980, including manager of the firm’s Fund Accounting Department from 1997 through October 2001.
MATTHEW D. CONNOLLY, Anti-Money Laundering Compliance Officer since April 2012.
Anti-Money Laundering Compliance Officer of the Distributor since October 2011; from March 2010 to September 2011, Global Head, KYC Reviews and Director of UBS Investment Bank; until March 2010, AML Compliance Officer and Senior Vice President of Citi Global Wealth Management. He is an officer of 65 investment companies (comprised of 166 portfolios) managed by the Manager. He is 41 years old and has been an employee of the Distributor since October 2011.
52
For More Information

Telephone Call your financial representative or 1-800-DREYFUS
Mail The Dreyfus Family of Funds, 144 Glenn Curtiss Boulevard, Uniondale, NY 11556-0144
The fund files its complete schedule of portfolio holdings with the Securities and Exchange Commission (“SEC”) for the first and third quarters of each fiscal year on Form N-Q. The fund’s Forms N-Q are available on the SEC’s website at http://www.sec.gov and may be reviewed and copied at the SEC’s Public Reference Room in Washington, DC. Information on the operation of the Public Reference Room may be obtained by calling 1-800-SEC-0330.
Information regarding how the fund voted proxies relating to portfolio securities for the most recent 12-month period ended June 30 is available on the SEC’s website at http://www.sec.gov and without charge, upon request, by calling 1-800-DREYFUS.

Item 2. Code of Ethics.
The Registrant has adopted a code of ethics that applies to the Registrant's principal executive officer, principal financial officer, principal accounting officer or controller, or persons performing similar functions. There have been no amendments to, or waivers in connection with, the Code of Ethics during the period covered by this Report.
Item 3. Audit Committee Financial Expert.
The Registrant's Board has determined that Ehud Houminer, a member of the Audit Committee of the Board, is an audit committee financial expert as defined by the Securities and Exchange Commission (the "SEC"). Mr. Houminer is "independent" as defined by the SEC for purposes of audit committee financial expert determinations.
Item 4. Principal Accountant Fees and Services.
(a) Audit Fees. The aggregate fees billed for each of the last two fiscal years (the "Reporting Periods") for professional services rendered by the Registrant's principal accountant (the "Auditor") for the audit of the Registrant's annual financial statements or services that are normally provided by the Auditor in connection with the statutory and regulatory filings or engagements for the Reporting Periods, were $32,149 in 2013 and $32,792 in 2014.
(b) Audit-Related Fees. The aggregate fees billed in the Reporting Periods for assurance and related services by the Auditor that are reasonably related to the performance of the audit of the Registrant's financial statements and are not reported under paragraph (a) of this Item 4 were $6,000 in 2013 and $7,320 in 2014. These services consisted of one or more of the following: (i) agreed upon procedures related to compliance with Internal Revenue Code section 817(h), (ii) security counts required by Rule 17f-2 under the Investment Company Act of 1940, as amended, (iii) advisory services as to the accounting or disclosure treatment of Registrant transactions or events and (iv) advisory services to the accounting or disclosure treatment of the actual or potential impact to the Registrant of final or proposed rules, standards or interpretations by the Securities and Exchange Commission, the Financial Accounting Standards Boards or other regulatory or standard-setting bodies.
The aggregate fees billed in the Reporting Periods for non-audit assurance and related services by the Auditor to the Registrant's investment adviser (not including any sub-investment adviser whose role is primarily portfolio management and is subcontracted with or overseen by another investment adviser), and any entity controlling, controlled by or under common control with the investment adviser that provides ongoing services to the Registrant ("Service Affiliates"), that were reasonably related to the performance of the annual audit of the Service Affiliate, which required pre-approval by the Audit Committee were $0 in 2013 and $0 in 2014.
(c) Tax Fees. The aggregate fees billed in the Reporting Periods for professional services rendered by the Auditor for tax compliance, tax advice, and tax planning ("Tax Services") were $3,040 in 2013 and $4,249 in 2014. These services consisted of: (i) review or preparation of U.S. federal, state, local and excise tax returns; (ii) U.S. federal, state and local tax planning, advice and assistance regarding statutory, regulatory or administrative developments; and (iii) tax advice regarding tax qualification matters and/or treatment of various financial instruments held or proposed to be acquired or held. The aggregate fees billed in the Reporting Periods for Tax Services by the Auditor to Service Affiliates, which required pre-approval by the Audit Committee were $0 in 2013 and $0 in 2014.
(d) All Other Fees. The aggregate fees billed in the Reporting Periods for products and services provided by the Auditor, other than the services reported in paragraphs (a) through (c) of this Item, were $0 in 2013 and $3,693 in 2014. These services included a review of the Registrant's anti-money laundering program.
The aggregate fees billed in the Reporting Periods for Non-Audit Services by the Auditor to Service Affiliates, other than the services reported in paragraphs (b) through (c) of this Item, which required pre-approval by the Audit Committee, were $200,000 in 2013 and $0 in 2014.
(e)(1) Audit Committee Pre-Approval Policies and Procedures. The Registrant's Audit Committee has established policies and procedures (the "Policy") for pre-approval (within specified fee limits) of the Auditor's engagements for non-audit services to the Registrant and Service Affiliates without specific case-by-case consideration. The pre-approved services in the Policy can include pre-approved audit services, pre-approved audit-related services, pre-approved tax services and pre-approved all other services. Pre-approval considerations include whether the proposed services are compatible with maintaining the Auditor's independence. Pre-approvals pursuant to the Policy are considered annually.
(e)(2) Note: None of the services described in paragraphs (b) through (d) of this Item 4 were approved by the Audit Committee pursuant to paragraph (c)(7)(i)(C) of Rule 2-01 of Regulation S-X.
(f) None of the hours expended on the principal accountant's engagement to audit the registrant's financial statements for the most recent fiscal year were attributed to work performed by persons other than the principal account's full-time, permanent employees.
Non-Audit Fees. The aggregate non-audit fees billed by the Auditor for services rendered to the Registrant, and rendered to Service Affiliates, for the Reporting Periods were $49,714,645 in 2013 and $40,974,357 in 2014.
Auditor Independence. The Registrant's Audit Committee has considered whether the provision of non-audit services that were rendered to Service Affiliates, which were not pre-approved (not requiring pre-approval), is compatible with maintaining the Auditor's independence.
Item 5. Audit Committee of Listed Registrants.
Not applicable. [CLOSED-END FUNDS ONLY]
Item 6. Investments.
(a) Not applicable.
Item 7. Disclosure of Proxy Voting Policies and Procedures for Closed-End Management Investment Companies.
Not applicable. [CLOSED-END FUNDS ONLY]
Item 8. Portfolio Managers of Closed-End Management Investment Companies.
Not applicable. [CLOSED-END FUNDS ONLY, beginning with reports for periods ended on and after December 31, 2005]
Item 9. Purchases of Equity Securities by Closed-End Management Investment Companies and Affiliated Purchasers.
Not applicable. [CLOSED-END FUNDS ONLY]
Item 10. Submission of Matters to a Vote of Security Holders.
There have been no material changes to the procedures applicable to Item 10.
Item 11. Controls and Procedures.
(a) The Registrant's principal executive and principal financial officers have concluded, based on their evaluation of the Registrant's disclosure controls and procedures as of a date within 90 days of the filing date of this report, that the Registrant's disclosure controls and procedures are reasonably designed to ensure that information required to be disclosed by the Registrant on Form N-CSR is recorded, processed, summarized and reported within the required time periods and that information required to be disclosed by the Registrant in the reports that it files or submits on Form N-CSR is accumulated and communicated to the Registrant's management, including its principal executive and principal financial officers, as appropriate to allow timely decisions regarding required disclosure.
(b) There were no changes to the Registrant's internal control over financial reporting that occurred during the second fiscal quarter of the period covered by this report that have materially affected, or are reasonably likely to materially affect, the Registrant's internal control over financial reporting.
Item 12. Exhibits.
(a)(1) Code of ethics referred to in Item 2.
(a)(2) Certifications of principal executive and principal financial officers as required by Rule 30a-2(a) under the Investment Company Act of 1940.
(a)(3) Not applicable.
(b) Certification of principal executive and principal financial officers as required by Rule 30a-2(b) under the Investment Company Act of 1940.
SIGNATURES
Pursuant to the requirements of the Securities Exchange Act of 1934 and the Investment Company Act of 1940, the Registrant has duly caused this Report to be signed on its behalf by the undersigned, thereunto duly authorized.
DREYFUS PREMIER CALIFORNIA AMT-FREE MUNICIPAL BOND FUND, INC.
- Dreyfus California AMT-Free Municipal Bond Fund
By: /s/ Bradley J. Skapyak
Bradley J. Skapyak,
President
Date: July 21, 2014
Pursuant to the requirements of the Securities Exchange Act of 1934 and the Investment Company Act of 1940, this Report has been signed below by the following persons on behalf of the Registrant and in the capacities and on the dates indicated.
By: /s/ Bradley J. Skapyak
Bradley J. Skapyak,
President
�� Date: July 21, 2014
By: /s/ James Windels
James Windels,
Treasurer
Date: July 21, 2014
EXHIBIT INDEX
(a)(1) Code of ethics referred to in Item 2.
(a)(2) Certifications of principal executive and principal financial officers as required by Rule 30a-2(a) under the Investment Company Act of 1940. (EX-99.CERT)
(b) Certification of principal executive and principal financial officers as required by Rule 30a-2(b) under the Investment Company Act of 1940. (EX-99.906CERT)