UNITED STATES
SECURITIES AND EXCHANGE COMMISSION
Washington, D.C. 20549
FORM N-CSR
CERTIFIED SHAREHOLDER REPORT OF REGISTERED MANAGEMENT
INVESTMENT COMPANIES
Investment Company Act file number | 811-03757 |
| |
| BNY Mellon California AMT-Free Municipal Bond Fund, Inc. | |
| (Exact name of Registrant as specified in charter) | |
| | |
| c/o BNY Mellon Investment Adviser, Inc. 240 Greenwich Street New York, New York 10286 | |
| (Address of principal executive offices)�� (Zip code) | |
| | |
| Bennett A. MacDougall, Esq. 240 Greenwich Street New York, New York 10286 | |
| (Name and address of agent for service) | |
|
Registrant's telephone number, including area code: | (212) 922-6400 |
| |
Date of fiscal year end: | 05/31 | |
Date of reporting period: | 05/31/2019 | |
| | | | | | | |
FORM N-CSR
Item 1. Reports to Stockholders.
BNY Mellon California AMT-Free Municipal Bond Fund, Inc.
| |
ANNUAL REPORT May 31, 2019 |
| |
Save time. Save paper. View your next shareholder report online as soon as it’s available. Log into www.bnymellonim.com/us and sign up for eCommunications. It’s simple and only takes a few minutes. |
| |
The views expressed in this report reflect those of the portfolio manager(s) only through the end of the period covered and do not necessarily represent the views of BNY Mellon Investment Adviser, Inc. or any other person in the BNY Mellon Investment Adviser, Inc. organization. Any such views are subject to change at any time based upon market or other conditions and BNY Mellon Investment Adviser, Inc. disclaims any responsibility to update such views. These views may not be relied on as investment advice and, because investment decisions for a fund in the BNY Mellon Family of Funds are based on numerous factors, may not be relied on as an indication of trading intent on behalf of any fund in the BNY Mellon Family of Funds. |
| |
Not FDIC-Insured • Not Bank-Guaranteed • May Lose Value |
Contents
THE FUND
FOR MORE INFORMATION
Back Cover
| | | | |
| |
BNY Mellon California AMT-Free Municipal Bond Fund, Inc.
| | The Fund |
A LETTER FROM THE PRESIDENT OF BNY MELLON INVESTMENT ADVISER, INC.
Dear Shareholder:
We are pleased to present this annual report for BNY Mellon California AMT-Free Municipal Bond Fund, Inc. (formerly the Dreyfus California AMT-Free Municipal Bond Fund), covering the 12-month period from June 1, 2018 through May 31, 2019. For information about how the fund performed during the reporting period, as well as general market perspectives, we provide a Discussion of Fund Performance on the pages that follow.
At the beginning of the reporting period, developed economies outside of the U.S. continued to weaken, while the U.S. economy sustained its relatively healthy growth rate. Calm markets prevailed throughout the summer, as robust growth and strong corporate earnings supported U.S. stock returns, while other developed markets continued to decline.
The fourth quarter of 2018 saw broad market weakness, due in part to heightened concerns about rising interest rates, trade tensions and slowing global growth. The slump largely erased prior gains on U.S. indices, while losses deepened in international markets. December experienced a sharp sell-off, as it appeared that the U.S. Federal Reserve (the “Fed”) would maintain its hawkish stance on monetary policy. However, comments made by the Fed in January indicated that it would slow the pace of interest-rate increases, and this helped stimulate a rebound across equity markets that continued through much of the reporting period. However, in May, escalating trade tensions once again disrupted equity market progress, causing stock prices to pull back.
Fixed-income markets declined early in the period, as interest rates and inflation rose, pressuring most bond prices. Comparatively strong U.S. equity markets fed investor risk appetites, reducing the demand for Treasuries and increasing yields. But a return of stock market volatility in October triggered a flight to quality, boosting Treasury prices and flattening the yield curve. In January, when the Fed’s comments indicated that rate increases would be less likely in 2019, bond markets rallied. And Bond prices benefited from falling rates through the end of the period.
We remain positive on the near-term economic outlook for the U.S. but will monitor relevant data for any signs of a change. As always, we encourage you to discuss the risks and opportunities in today’s investment environment with your financial advisor.
Thank you for your continued confidence and support.
Sincerely,

Renee LaRoche-Morris
President
BNY Mellon Investment Adviser, Inc.
June 17, 2019
2
DISCUSSION OF FUND PERFORMANCE(Unaudited)
For the period from June 1, 2018 through May 31, 2019, as provided by Jeffrey Burger and Thomas Casey, Portfolio Managers
Market and Fund Performance Overview
For the 12-month period ended May 31, 2019, BNY Mellon California AMT-Free Municipal Bond Fund, Inc.’s (formerly, Dreyfus California AMT-Free Municipal Bond Fund) Class A shares produced a total return of 4.40%, Class C shares returned 3.68%, Class I shares returned 4.73%, Class Y shares returned 4.75%, and Class Z shares returned 4.62%.1 In comparison, the Bloomberg Barclays U.S. Municipal Bond Index (the “Index”), the fund’s benchmark index, which is composed of bonds issued nationally and not solely within California, achieved a total return of 6.40% for the same period.2
Municipal bonds encountered heightened volatility stemming from shifting Federal Reserve policy and changing supply-and-demand dynamics in the municipal securities market. The fund underperformed the Index, partly due to security selection strategies and to holdings that were less sensitive to the decision of the Federal Reserve to postpone additional rate increases.
The Fund’s Investment Approach
The fund seeks as high a level of current income exempt from federal and California state income taxes as is consistent with the preservation of capital. To pursue its goal, the fund normally invests at least 80% of its net assets in municipal bonds that provide income exempt from federal and California state income taxes. The fund also seeks to provide income exempt from the federal alternative minimum tax. The fund invests at least 80% of its assets in investment-grade municipal bonds or the unrated equivalent as determined by BNY Mellon Investment Adviser, Inc. The fund may invest up to 20% of its assets in municipal bonds rated below investment grade (“high yield” or “junk” bonds) or the unrated equivalent as determined by BNY Mellon Investment Adviser, Inc. The dollar-weighted average maturity of the fund’s portfolio normally exceeds 10 years, but the fund may invest without regard to maturity.
We focus on identifying undervalued sectors and securities, and we minimize the use of interest-rate forecasting. We select municipal bonds by using fundamental credit analysis to estimate the relative value and attractiveness of various sectors and securities and to exploit pricing inefficiencies in the municipal bond market. We actively trade among various sectors, such as pre-refunded, general obligation, and revenue, based on their apparent relative values.
A Shift in Federal Reserve Policy Drove Municipal Bonds
Municipal bonds struggled during the first two-thirds of the reporting period, as the economy continued to perform well, and the Federal Reserve (the “Fed”) continued on a path of raising short-term interest rates. The Fed hiked the federal funds policy rate three times during the reporting period, bringing the target range to 2.25%-2.50%. Flows into municipal bond funds remained robust, however, driven in part by the effects of the Tax Cuts and Jobs Act of 2017, which capped the federal tax deductibility of state and local taxes. Supply also was manageable, as new issuance for 2018 came in approximately 24% below that of 2017.
3
DISCUSSION OF FUND PERFORMANCE(Unaudited) (continued)
Toward the end of 2018, economic data became more mixed, and investors became increasingly concerned about the effect of the Fed’s hawkish stance on interest rates. This resulted in some volatility in capital markets that resulted in a flight to quality in which higher-quality securities, including municipal bonds, rallied strongly. The Fed’s shift to a more dovish stance also fed demand, as it confirmed investor concerns about a possible weakening of the economy.
As 2019 progressed, supply continued to be manageable, while demand rallied. Fund flows surged, hitting record levels. Contributing to this was ongoing demand, especially in high-tax states, from higher-income earners seeking shelter from the effects of the new cap on the deductibility of state and local taxes. The relative stability of the municipal bond market relative to that of the equity markets also attracted investors.
The flight to quality caused rates to fall, and investors then began to reach for yield. As a result, longer-term municipals, especially those 10 years and longer, experienced a greater compression of yields than did shorter maturities, resulting in a flatter municipal bond yield curve. Investors also began to reach for the yield available from lower-quality issues, resulting in a tightening of quality spreads. The ratio of municipal bond yields to Treasury yields fell significantly, especially for longer-dated bonds, reflecting the outperformance of municipal bonds versus Treasuries.
Credit fundamentals remained stable to strong during the period and income tax revenues were healthy, driven by continued economic strength.
Sector Allocation Drove Fund Results
The fund’s performance compared to the Index was hampered in part by an overweight to tobacco-backed bonds, which underperformed the Index. In addition, although the fund’s duration was not materially shorter than that of the Index, the longer-duration holdings included tobacco-backed bonds, which failed to respond substantially to the decision of the Fed to postpone additional rate hikes.
In contrast, certain sector allocations contributed positively to fund performance. Overweight positions in certain revenue bond sectors, including the hospital, airport, and transportation sectors, were particularly beneficial. Positions in securities with maturities in excess of 20 years also contributed positively to both the fund’s total return and to its yield.
A Positive Investment Posture
The economy remains strong, employment continues to be robust, and we expect this to continue for the remainder of the year. One risk to this outlook is a deterioration in trade relations, which could derail the economy’s momentum. Despite record-low unemployment, inflation remains subdued, so we anticipate that the Fed will leave short-term interest rates unchanged.
The technical backdrop for California municipal bonds is also positive. With demand for municipal bonds likely to remain strong and supply likely to be manageable, the municipal bond market is likely to perform relatively well. The cap on federal deductibility of state and local taxes will continue to help drive demand for municipal securities, encouraging the reinvestment of the proceeds of a large number of bonds that are due to mature in the
4
coming months. We will continue to focus on security selection, emphasizing undervalued issues and relying on our credit research capabilities.
June 17, 2019
1 Total return includes reinvestment of dividends and any capital gains paid and does not take into consideration the maximum initial sales charge in the case of Class A shares, or the applicable contingent deferred sales charges imposed on redemptions in the case of Class C shares. Had these charges been reflected, returns would have been lower. Class I, Class Y, and Class Z (which is closed to new investors) shares are not subject to any initial or deferred sales charge. Past performance is no guarantee of future results. Share price, yield, and investment return fluctuate such that upon redemption, fund shares may be worth more or less than their original cost. Income may be subject to state and local taxes for non-California residents. Capital gains, if any, are fully taxable.
2 Source: Lipper Inc. — The Bloomberg Barclays U.S. Municipal Bond Index covers the U.S. dollar-denominated, long-term, tax-exempt bond market. Investors cannot invest directly in any index.
Bonds are subject generally to interest-rate, credit, liquidity, and market risks, to varying degrees, all of which are more fully described in the fund’s prospectus. Generally, all other factors being equal, bond prices are inversely related to interest-rate changes, and rate increases can cause price declines.
High yield bonds involve increased credit and liquidity risks compared with investment-grade bonds and are considered speculative in terms of the issuer’s ability to pay interest and repay principal on a timely basis.
5
FUND PERFORMANCE(Unaudited)
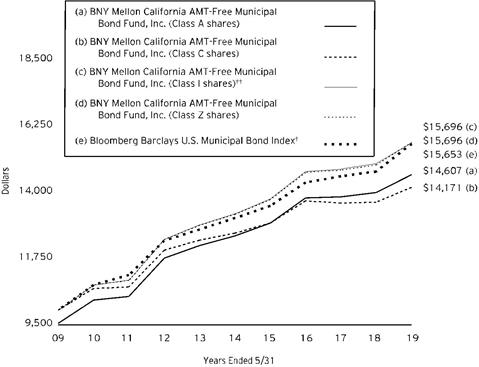
Comparison of change in value of a $10,000 investment in Class A shares, Class C shares, Class I shares and Class Z shares of BNY Mellon California AMT-Free Municipal Bond Fund, Inc. with a hypothetical investment of $10,000 in the Bloomberg Barclays U.S. Municipal Bond Index (the “Index”)
† Source: Lipper Inc.
Past performance is not predictive of future performance.
The above graph compares a $10,000 investment made in each of the Class A, Class C, Class I and Class Z shares of BNY Mellon California AMT-Free Municipal Bond Fund, Inc. on 5/31/09 to a $10,000 investment made in the Index on that date. All dividends and capital gain distributions are reinvested.
The fund invests primarily in California municipal securities and its performance shown in the line graph above takes into account the maximum initial sales charge on Class A shares and all other applicable fees and expenses on all classes. The Index is not limited to investments principally in California municipal obligations. The Index, unlike the fund, covers the U.S.-dollar-denominated long-term tax-exempt bond market. These factors can contribute to the Index potentially outperforming or underperforming the fund. Unlike a mutual fund, the Index is not subject to charges, fees and other expenses. Investors cannot invest directly in any index. Further information relating to fund performance, including expense reimbursements, if applicable, is contained in the Financial Highlights section of the prospectus and elsewhere in this report.
6
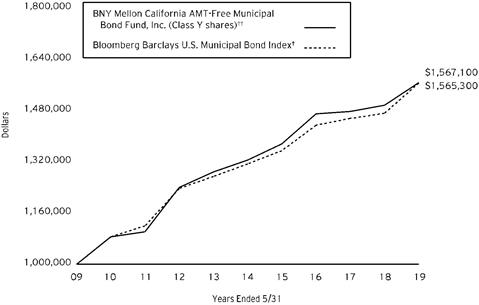
Comparison of change in value of a $1,000,000 investment in Class Y shares of BNY Mellon California AMT-Free Municipal Bond Fund, Inc. with a hypothetical investment of $1,000,000 in the Bloomberg Barclays U.S. Municipal Bond Index (the “Index”)
† Source: Lipper Inc.
†† The total return figures presented for Class Y shares of the fund reflect the performance of the fund’s Class Z shares for the period prior to 7/1/13 (the inception date for Class Y shares).
Past performance is not predictive of future performance.
The above graph compares a hypothetical $1,000,000 investment made in Class Y shares of BNY Mellon California AMT-Free Municipal Bond Fund, Inc. on 5/31/09 to a hypothetical investment of $1,000,000 made in the Index on that date. All dividends and capital gain distributions are reinvested.
The fund invests primarily in California municipal securities and its performance shown in the line graph above takes into account the maximum initial sales charge on Class Y shares and all other applicable fees and expenses on all classes. The Index is not limited to investments principally in California municipal obligations. The Index, unlike the fund, covers the U.S.-dollar-denominated long-term tax-exempt bond market. These factors can contribute to the Index potentially outperforming or underperforming the fund. Unlike a mutual fund, the Index is not subject to charges, fees and other expenses. Investors cannot invest directly in any index. Further information relating to fund performance, including expense reimbursements, if applicable, is contained in the Financial Highlights section of the prospectus and elsewhere in this report.
7
FUND PERFORMANCE(Unaudited) (continued)
| | | | | |
Average Annual Total Returns as of 5/31/19 | | | |
| Inception Date | 1 Year | 5 Years | 10 Years |
Class A shares | | | | |
with maximum sales charge (4.5%) | 10/21/04 | -0.32% | 2.17% | 3.86% |
without sales charge | 10/21/04 | 4.40% | 3.12% | 4.34% |
Class C shares | | | | |
with applicable redemption charge† | 10/21/04 | 2.68% | 2.35% | 3.55% |
without redemption | 10/21/04 | 3.68% | 2.35% | 3.55% |
Class I shares | 12/15/08 | 4.73% | 3.39% | 4.61% |
Class Y shares | 7/1/13 | 4.75% | 3.41% | 4.60%†† |
Class Z shares | 7/26/83 | 4.62% | 3.35% | 4.56% |
Bloomberg Barclays U.S. Municipal Bond Index | | 6.40% | 3.58% | 4.58% |
† The maximum contingent deferred sales charge for Class C shares is 1% for shares redeemed within one year of the date of purchase.
†† The total return performance figures presented for Class Y shares of the fund reflect the performance of the fund’s Class Z shares for the period prior to 7/1/13 (the inception date for Class Y shares).
The performance data quoted represents past performance, which is no guarantee of future results. Share price and investment return fluctuate and an investor’s shares may be worth more or less than original cost upon redemption. Current performance may be lower or higher than the performance quoted. Go to im.bnymellon.com for the fund’s most recent month-end returns.
The fund’s performance shown in the graph and table does not reflect the deduction of taxes that a shareholder would pay on fund distributions or the redemption of fund shares. In addition to the performance of Class A shares shown with and without a maximum sales charge, the fund’s performance shown in the table takes into account all other applicable fees and expenses on all classes.
8
UNDERSTANDING YOUR FUND’S EXPENSES(Unaudited)
As a mutual fund investor, you pay ongoing expenses, such as management fees and other expenses. Using the information below, you can estimate how these expenses affect your investment and compare them with the expenses of other funds. You also may pay one-time transaction expenses, including sales charges (loads) and redemption fees, which are not shown in this section and would have resulted in higher total expenses. For more information, see your fund’s prospectus or talk to your financial adviser.
Review your fund’s expenses
The table below shows the expenses you would have paid on a $1,000 investment in BNY Mellon California AMT-Free Municipal Bond Fund, Inc. from December 1, 2018 to May 31, 2019. It also shows how much a $1,000 investment would be worth at the close of the period, assuming actual returns and expenses.
| | | | | | | | | | | | | |
Expenses and Value of a $1,000 Investment | |
assuming actual returns for the six months ended May 31, 2019 | |
| | | Class A | Class C | Class I | Class Y | Class Z |
Expenses paid per $1,000† | | $5.11 | | $9.04 | | $3.89 | | $3.69 | | $3.94 |
Ending value (after expenses) | | $1,051.10 | | $1,047.90 | | $1,053.20 | | $1,053.20 | | $1,052.20 |
COMPARING YOUR FUND’S EXPENSES
WITH THOSE OF OTHER FUNDS(Unaudited)
Using the SEC’s method to compare expenses
The Securities and Exchange Commission (“SEC”) has established guidelines to help investors assess fund expenses. Per these guidelines, the table below shows your fund’s expenses based on a $1,000 investment, assuming a hypothetical 5% annualized return. You can use this information to compare the ongoing expenses (but not transaction expenses or total cost) of investing in the fund with those of other funds. All mutual fund shareholder reports will provide this information to help you make this comparison. Please note that you cannot use this information to estimate your actual ending account balance and expenses paid during the period.
| | | | | | | | | | | | | | |
Expenses and Value of a $1,000 Investment | |
assuming a hypothetical 5% annualized return for the six months ended May 31, 2019 |
| | | Class A | Class C | Class I | Class Y | Class Z |
Expenses paid per $1,000† | | $5.04 | | $8.90 | | $3.83 | | $3.63 | | $3.88 |
Ending value (after expenses) | | $1,019.95 | | $1,016.11 | | $1,021.14 | | $1,021.34 | | $1,021.09 |
† Expenses are equal to the fund’s annualized expense ratio of 1.00% for Class A, 1.77% for Class C, .76% for Class I, .72% for Class Y and .77% for Class Z, multiplied by the average account value over the period, multiplied by 182/365 (to reflect the one-half year period).
9
STATEMENT OF INVESTMENTS
May 31, 2019
| | | | | | | | | | |
| |
Description | Coupon
Rate (%) | | Maturity
Date | | Principal
Amount ($) | | Value ($) | |
Bonds and Notes - .4% | | | | | |
Municipal Bonds - .4% | | | | | |
Federal Home Loan Mortgage Corp. Multifamily VRD Certificates,
Revenue Bonds, Ser. M-049
(cost $3,527,370) | | 3.05 | | 4/1/2034 | | 3,500,000 | | 3,643,395 | |
| | | | | | | | | |
Long-Term Municipal Investments - 103.0% | | | | | |
California - 101.5% | | | | | |
ABAG Finance Authority for Nonprofit Corporation,
Revenue Bonds (Sharp HealthCare) Ser. A | | 5.00 | | 8/1/2043 | | 13,250,000 | | 14,799,720 | |
ABAG Finance Authority for Nonprofit Corporation,
Revenue Bonds (Sharp HealthCare) Ser. A | | 6.00 | | 8/1/2030 | | 5,000,000 | | 5,486,000 | |
Alameda Corridor Transportation Authority,
Revenue Bonds, Refunding, Ser. B | | 5.00 | | 10/1/2037 | | 1,650,000 | | 1,904,760 | |
Allan Hancock Joint Community College,
GO, Ser. C | | 0/5.60 | | 8/1/2047 | | 11,375,000 | a | 8,579,025 | |
Anaheim Community Facilities District,
Special Tax Bonds, Refunding (Platinum Triangle) | | 4.00 | | 9/1/2046 | | 2,000,000 | | 2,092,180 | |
Anaheim Community Facilities District,
Special Tax Bonds, Refunding (Platinum Triangle) | | 4.00 | | 9/1/2041 | | 5,250,000 | | 5,512,710 | |
California,
GO (Various Purpose) | | 5.00 | | 4/1/2049 | | 22,995,000 | | 28,049,301 | |
California,
GO (Various Purpose) | | 5.25 | | 9/1/2032 | | 19,500,000 | | 21,123,570 | |
California,
GO (Various Purpose) | | 5.25 | | 10/1/2032 | | 9,170,000 | | 9,961,463 | |
California,
GO (Various Purpose) | | 5.25 | | 3/1/2030 | | 10,000,000 | | 10,286,600 | |
California,
GO (Various Purpose) | | 5.50 | | 3/1/2040 | | 17,500,000 | | 18,015,200 | |
California,
GO (Various Purpose) | | 5.50 | | 11/1/2035 | | 10,000,000 | | 10,567,700 | |
California,
GO (Various Purpose) | | 6.00 | | 3/1/2033 | | 2,000,000 | | 2,068,960 | |
California,
GO, Refunding (Various Purpose) | | 5.00 | | 9/1/2036 | | 10,000,000 | | 12,007,100 | |
10
| | | | | | | | | | |
| |
Description | Coupon
Rate (%) | | Maturity Date | | Principal Amount ($) | | Value ($) | |
Long-Term Municipal Investments - 103.0%(continued) | | | | | |
California - 101.5% (continued) | | | | | |
California,
GO, Refunding (Various Purpose) | | 5.00 | | 8/1/2036 | | 7,000,000 | | 8,386,910 | |
California,
GO, Refunding (Various Purpose) | | 5.00 | | 2/1/2038 | | 5,000,000 | | 5,432,900 | |
California,
GO, Refunding (Various Purpose) | | 5.25 | | 2/1/2029 | | 13,835,000 | | 15,209,784 | |
California County,
Revenue Bonds | | 0.00 | | 6/1/2046 | | 12,500,000 | b | 1,812,750 | |
California County,
Revenue Bonds, Refunding (Kern County Tobacco Funding Corporation) | | 5.00 | | 6/1/2034 | | 5,000,000 | | 5,273,300 | |
California Education Facilities Authority,
Revenue Bonds, Refunding (Loma Linda University) Ser. A | | 5.00 | | 4/1/2036 | | 3,845,000 | | 4,554,595 | |
California Education Facilities Authority,
Revenue Bonds, Refunding (Loma Linda University) Ser. A | | 5.00 | | 4/1/2037 | | 1,500,000 | | 1,771,335 | |
California Educational Facilities Authority,
Revenue Bonds (Chapman University) | | 5.00 | | 4/1/2040 | | 5,000,000 | | 5,720,900 | |
California Educational Facilities Authority,
Revenue Bonds (Chapman University) | | 5.00 | | 4/1/2045 | | 2,305,000 | | 2,627,954 | |
California Educational Facilities Authority,
Revenue Bonds (Pooled College and University Projects) (Escrowed to Maturity) Ser. A | | 5.63 | | 7/1/2023 | | 90,000 | | 97,578 | |
California Educational Facilities Authority,
Revenue Bonds, Refunding (Occidental College) | | 5.00 | | 10/1/2045 | | 500,000 | | 577,035 | |
California Educational Facilities Authority,
Revenue Bonds, Refunding (Pepperdine University) | | 5.00 | | 9/1/2045 | | 5,000,000 | | 5,808,500 | |
California Health Facilities Financing Authority,
Revenue Bonds (City of Hope) Ser. A | | 5.00 | | 11/15/2024 | | 1,600,000 | | 1,782,928 | |
California Health Facilities Financing Authority,
Revenue Bonds (Providence Health and Services) Ser. A | | 5.00 | | 10/1/2030 | | 3,500,000 | | 4,090,730 | |
11
STATEMENT OF INVESTMENTS (continued)
| | | | | | | | | | |
| |
Description | Coupon
Rate (%) | | Maturity Date | | Principal Amount ($) | | Value ($) | |
Long-Term Municipal Investments - 103.0%(continued) | | | | | |
California - 101.5% (continued) | | | | | |
California Health Facilities Financing Authority,
Revenue Bonds (Providence Health and Services) Ser. A | | 5.00 | | 10/1/2031 | | 4,430,000 | | 5,152,976 | |
California Health Facilities Financing Authority,
Revenue Bonds (Rady Children's Hospital - San Diego) | | 5.25 | | 8/15/2041 | | 8,500,000 | | 9,126,620 | |
California Health Facilities Financing Authority,
Revenue Bonds (Saint Joseph Health System) Ser. A | | 5.00 | | 7/1/2037 | | 7,500,000 | | 8,416,875 | |
California Health Facilities Financing Authority,
Revenue Bonds (Scripps Health) Ser. A | | 5.00 | | 11/15/2036 | | 7,525,000 | | 7,648,711 | |
California Health Facilities Financing Authority,
Revenue Bonds (Stanford Hospital and Clinics) Ser. A | | 5.00 | | 8/15/2042 | | 1,000,000 | | 1,094,570 | |
California Health Facilities Financing Authority,
Revenue Bonds (Sutter Health) Ser. A | | 5.00 | | 11/15/2031 | | 1,150,000 | | 1,366,120 | |
California Health Facilities Financing Authority,
Revenue Bonds (Sutter Health) Ser. A | | 5.00 | | 11/15/2030 | | 750,000 | | 895,275 | |
California Health Facilities Financing Authority,
Revenue Bonds (Sutter Health) Ser. A | | 5.00 | | 11/15/2048 | | 3,000,000 | | 3,532,800 | |
California Health Facilities Financing Authority,
Revenue Bonds, Refunding (Adventist Health System/West) Ser. A | | 4.00 | | 3/1/2039 | | 2,925,000 | | 3,101,641 | |
California Health Facilities Financing Authority,
Revenue Bonds, Refunding (Children's Hospital) Ser. A | | 5.00 | | 8/15/2047 | | 2,000,000 | | 2,307,700 | |
California Health Facilities Financing Authority,
Revenue Bonds, Refunding (Stanford Health Care) Ser. A | | 5.00 | | 11/15/2037 | | 3,360,000 | | 4,078,838 | |
California Health Facilities Financing Authority,
Revenue Bonds, Refunding (Sutter Health) Ser. A | | 5.00 | | 8/15/2043 | | 2,000,000 | | 2,288,700 | |
12
| | | | | | | | | | |
| |
Description | Coupon
Rate (%) | | Maturity Date | | Principal Amount ($) | | Value ($) | |
Long-Term Municipal Investments - 103.0%(continued) | | | | | |
California - 101.5% (continued) | | | | | |
California Health Facilities Financing Authority,
Revenue Bonds, Refunding (Sutter Health) Ser. D | | 5.25 | | 8/15/2031 | | 3,500,000 | | 3,780,105 | |
California Infrastructure and Economic Development Bank,
Revenue Bonds, Refunding (Academy of Motion Pictures Arts and Sciences Obligated Group) | | 5.00 | | 11/1/2041 | | 2,250,000 | | 2,523,240 | |
California Municipal Finance Authority,
Revenue Bonds (Bowles Hall Foundation) Ser. A | | 5.00 | | 6/1/2050 | | 1,500,000 | | 1,640,160 | |
California Municipal Finance Authority,
Revenue Bonds (California Baptist University) Ser. A | | 5.00 | | 11/1/2046 | | 2,500,000 | c | 2,810,425 | |
California Municipal Finance Authority,
Revenue Bonds (Channing House Project) Ser. B | | 5.00 | | 5/15/2047 | | 2,500,000 | | 2,932,900 | |
California Municipal Finance Authority,
Revenue Bonds (LAX Integrated Express Solutions Project) | | 5.00 | | 12/31/2035 | | 1,500,000 | | 1,770,855 | |
California Municipal Finance Authority,
Revenue Bonds (Student Housing Project, CHF-Riverside I LLC) | | 5.00 | | 5/15/2043 | | 2,000,000 | | 2,344,760 | |
California Municipal Finance Authority,
Revenue Bonds (The Palmdale Aerospace Academy Project) | | 5.00 | | 7/1/2041 | | 1,750,000 | c | 1,908,620 | |
California Municipal Finance Authority,
Revenue Bonds (The Palmdale Aerospace Academy Project) | | 5.00 | | 7/1/2046 | | 1,670,000 | c | 1,813,754 | |
California Municipal Finance Authority,
Revenue Bonds (Town And Country Manor) Ser. 2019 | | 5.00 | | 7/1/2049 | | 2,100,000 | | 2,541,126 | |
California Municipal Finance Authority,
Revenue Bonds (Town And Country Manor) Ser. 2019 | | 5.00 | | 7/1/2034 | | 1,720,000 | | 2,146,818 | |
California Municipal Finance Authority,
Revenue Bonds, Refunding (Biola University) | | 5.00 | | 10/1/2039 | | 1,000,000 | | 1,171,900 | |
13
STATEMENT OF INVESTMENTS (continued)
| | | | | | | | | | |
| |
Description | Coupon
Rate (%) | | Maturity Date | | Principal Amount ($) | | Value ($) | |
Long-Term Municipal Investments - 103.0%(continued) | | | | | |
California - 101.5% (continued) | | | | | |
California Municipal Finance Authority,
Revenue Bonds, Refunding (Community Medical Centers) Ser. A | | 5.00 | | 2/1/2037 | | 1,000,000 | | 1,151,590 | |
California Municipal Finance Authority,
Revenue Bonds, Refunding (Community Medical Centers) Ser. A | | 5.00 | | 2/1/2036 | | 1,000,000 | | 1,155,000 | |
California Municipal Finance Authority,
Revenue Bonds, Refunding (Eisenhower Medical Center) Ser. A | | 5.00 | | 7/1/2037 | | 1,000,000 | | 1,154,360 | |
California Municipal Finance Authority,
Revenue Bonds, Refunding (Eisenhower Medical Center) Ser. A | | 5.00 | | 7/1/2042 | | 3,500,000 | | 3,997,875 | |
California Municipal Finance Authority,
Revenue Bonds, Refunding (Eisenhower Medical Center) Ser. A | | 5.00 | | 7/1/2036 | | 1,100,000 | | 1,275,549 | |
California Municipal Finance Authority,
Revenue Bonds, Refunding (Eisenhower Medical Center) Ser. B | | 5.00 | | 7/1/2042 | | 2,500,000 | | 2,855,625 | |
California Municipal Finance Authority,
Revenue Bonds, Refunding (William Jessup University) | | 5.00 | | 8/1/2048 | | 9,115,000 | | 9,932,889 | |
California Pollution Control Financing Authority,
Revenue Bonds (American Water Capital Corporation Project) | | 5.25 | | 8/1/2040 | | 7,500,000 | c | 7,838,325 | |
California Pollution Control Financing Authority,
Revenue Bonds (San Jose Water Company Project) | | 5.10 | | 6/1/2040 | | 5,500,000 | | 5,704,160 | |
California Pollution Control Financing Authority,
Revenue Bonds (Waste Management Project) Ser. A | | 2.50 | | 5/1/2024 | | 3,000,000 | | 3,031,530 | |
14
| | | | | | | | | | |
| |
Description | Coupon
Rate (%) | | Maturity Date | | Principal Amount ($) | | Value ($) | |
Long-Term Municipal Investments - 103.0%(continued) | | | | | |
California - 101.5% (continued) | | | | | |
California Public Finance Authority,
Revenue Bonds (NCCD-Claremont Properties LLC-Claremont Colleges Project) Ser. A | | 5.00 | | 7/1/2047 | | 1,000,000 | c | 1,025,330 | |
California Public Finance Authority,
Revenue Bonds, Refunding (Henry Mayo Newhall Hospital) | | 5.00 | | 10/15/2047 | | 3,000,000 | | 3,326,340 | |
California School Finance Authority,
Revenue Bonds (Alliance for College-Ready Public Schools Projects) Ser. A | | 5.00 | | 7/1/2045 | | 3,500,000 | c | 3,873,835 | |
California School Finance Authority,
Revenue Bonds (Green Dot Public School Authority) Ser. A | | 5.00 | | 8/1/2048 | | 1,650,000 | c | 1,897,055 | |
California School Finance Authority,
Revenue Bonds (Kipp Socal Projects) Ser. 2019-A | | 5.00 | | 7/1/2049 | | 1,000,000 | | 1,172,130 | |
California School Finance Authority,
Revenue Bonds (Lucie Salter Packard Children's Hospital at Sanford) Ser. A | | 5.00 | | 7/1/2047 | | 875,000 | c | 1,001,079 | |
California School Finance Authority,
Revenue Bonds (Lucie Salter Packard Children's Hospital at Sanford) Ser. A | | 5.00 | | 7/1/2037 | | 590,000 | c | 685,574 | |
California School Finance Authority,
Revenue Bonds, Refunding (Aspire Public Schools - Obligated Group) | | 5.00 | | 8/1/2041 | | 1,750,000 | c | 1,934,415 | |
California State Public Works Board,
Revenue Bonds (Department of Corrections and Rehabilitation) (Various Correctional Facilities) Ser. A | | 5.00 | | 9/1/2026 | | 3,000,000 | | 3,533,580 | |
California State Public Works Board,
Revenue Bonds (Judicial Council of California) (Various Judicial Council Projects) Ser. D | | 5.00 | | 12/1/2031 | | 10,000,000 | | 10,841,400 | |
California Statewide Communities Development Authority,
Revenue Bonds (Cottage Health System Obligated Group) | | 5.00 | | 11/1/2040 | | 11,940,000 | | 12,388,466 | |
California Statewide Communities Development Authority,
Revenue Bonds (Cottage Health System Obligated Group) | | 5.25 | | 11/1/2030 | | 3,750,000 | | 3,940,125 | |
15
STATEMENT OF INVESTMENTS (continued)
| | | | | | | | | | |
| |
Description | Coupon
Rate (%) | | Maturity Date | | Principal Amount ($) | | Value ($) | |
Long-Term Municipal Investments - 103.0%(continued) | | | | | |
California - 101.5% (continued) | | | | | |
California Statewide Communities Development Authority,
Revenue Bonds (Henry Mayo Newhall Memorial Hospital) (Insured; Assured Guaranty Municipal Corp.) Ser. A | | 5.25 | | 10/1/2043 | | 2,100,000 | | 2,355,675 | |
California Statewide Communities Development Authority,
Revenue Bonds (Loma Linda University Medical Center) Ser. A | | 5.00 | | 12/1/2036 | | 5,250,000 | c | 5,862,360 | |
California Statewide Communities Development Authority,
Revenue Bonds (Loma Linda University Medical Center) Ser. A | | 5.50 | | 12/1/2058 | | 1,500,000 | c | 1,736,685 | |
California Statewide Communities Development Authority,
Revenue Bonds (University of California Irvine Campus Apartments Phase IV) Ser. A | | 5.00 | | 5/15/2042 | | 4,000,000 | | 4,650,520 | |
California Statewide Communities Development Authority,
Revenue Bonds (Viamonte Senior Living Project) | | 3.00 | | 7/1/2025 | | 3,700,000 | | 3,773,038 | |
California Statewide Communities Development Authority,
Revenue Bonds, Refunding (American Baptist Homes of the West) | | 5.00 | | 10/1/2045 | | 3,550,000 | | 3,916,821 | |
California Statewide Communities Development Authority,
Revenue Bonds, Refunding (Baptist University) Ser. A | | 5.00 | | 11/1/2041 | | 700,000 | c | 801,661 | |
California Statewide Communities Development Authority,
Revenue Bonds, Refunding (Baptist University) Ser. A | | 5.00 | | 11/1/2032 | | 1,855,000 | c | 2,175,488 | |
California Statewide Communities Development Authority,
Revenue Bonds, Refunding (Bentley School) Ser. A | | 7.00 | | 7/1/2040 | | 4,000,000 | | 4,220,920 | |
California Statewide Communities Development Authority,
Revenue Bonds, Refunding (Buck Institute for Research on Aging) (Insured; Assured Guaranty Municipal Corp.) | | 5.00 | | 11/15/2034 | | 2,390,000 | | 2,758,419 | |
16
| | | | | | | | | | |
| |
Description | Coupon
Rate (%) | | Maturity Date | | Principal Amount ($) | | Value ($) | |
Long-Term Municipal Investments - 103.0%(continued) | | | | | |
California - 101.5% (continued) | | | | | |
California Statewide Communities Development Authority,
Revenue Bonds, Refunding (Cottage Health System Obligated Group) | | 5.00 | | 11/1/2043 | | 4,000,000 | | 4,516,960 | |
California Statewide Communities Development Authority,
Revenue Bonds, Refunding (Front Porch Communities & Services) | | 5.00 | | 4/1/2047 | | 4,555,000 | | 5,270,955 | |
California Statewide Communities Development Authority,
Revenue Bonds, Refunding (John Muir Health) Ser. A | | 5.00 | | 8/15/2041 | | 1,200,000 | | 1,387,308 | |
California Statewide Communities Development Authority,
Revenue Bonds, Refunding (University of California, Irvine East Campus Apartments) | | 5.00 | | 5/15/2040 | | 3,000,000 | | 3,438,210 | |
Carlsbad Unified School District,
GO, Ser. B | | 6.00 | | 5/1/2034 | | 5,000,000 | | 6,031,850 | |
Escondido Union High School District,
GO, Ser. C | | 0.00 | | 8/1/2046 | | 3,000,000 | b | 1,196,610 | |
Foothill/Eastern Transportation Corridor Agency,
Revenue Bonds, Refunding (Insured; Assured Guaranty Municipal Corp.) | | 0.00 | | 1/15/2035 | | 10,000,000 | b | 6,217,700 | |
Fresno Joint Powers Financing Authority,
Revenue Bonds, Refunding (Master Lease Project) (Insured; Assured Guaranty Municipal Corporation) Ser. A | | 5.00 | | 4/1/2035 | | 1,000,000 | | 1,182,390 | |
Fresno Joint Powers Financing Authority,
Revenue Bonds, Refunding (Master Lease Project) (Insured; Assured Guaranty Municipal Corporation) Ser. A | | 5.00 | | 4/1/2037 | | 850,000 | | 995,826 | |
Golden State Tobacco Securitization Corporation,
Revenue Bonds, Refunding (Tobacco Settlement) Ser. A-1 | | 5.00 | | 6/1/2026 | | 2,500,000 | | 2,946,200 | |
Golden State Tobacco Securitization Corporation,
Revenue Bonds, Refunding Ser. A-1 | | 5.00 | | 6/1/2029 | | 8,000,000 | | 9,434,320 | |
17
STATEMENT OF INVESTMENTS (continued)
| | | | | | | | | | |
| |
Description | Coupon
Rate (%) | | Maturity Date | | Principal Amount ($) | | Value ($) | |
Long-Term Municipal Investments - 103.0%(continued) | | | | | |
California - 101.5% (continued) | | | | | |
Golden State Tobacco Securitization Corporation,
Revenue Bonds, Refunding, Ser. A-1 | | 5.00 | | 6/1/2047 | | 4,500,000 | | 4,477,545 | |
Grossmont Union High School District,
GO (Insured; Assured Guaranty Municipal Corp.) | | 0.00 | | 8/1/2023 | | 4,850,000 | b | 4,525,777 | |
Grossmont Union High School District,
GO (Insured; Assured Guaranty Municipal Corp.) | | 0.00 | | 8/1/2026 | | 3,265,000 | b | 2,844,076 | |
Grossmont Union High School District,
GO (Insured; Assured Guaranty Municipal Corp.) | | 0.00 | | 8/1/2022 | | 3,605,000 | b | 3,427,634 | |
Hesperia Community Redevelopment Agency Successor Agency,
Tax Allocation Bonds (Insured; Assured Guaranty Municipal Corporation) Ser. A | | 5.00 | | 9/1/2034 | | 3,255,000 | | 3,955,834 | |
Hesperia Community Redevelopment Agency Successor Agency,
Tax Allocation Bonds (Insured; Assured Guaranty Municipal Corporation) Ser. A | | 5.00 | | 9/1/2035 | | 6,835,000 | | 8,284,430 | |
Imperial Irrigation District,
Revenue Bonds, Refunding, Ser. C | | 5.00 | | 11/1/2038 | | 1,800,000 | | 2,117,286 | |
Imperial Irrigation District,
Revenue Bonds, Refunding, Ser. C | | 5.00 | | 11/1/2037 | | 2,500,000 | | 2,950,150 | |
Irvine,
Special Tax Bonds (Great Park) | | 5.00 | | 9/1/2044 | | 2,500,000 | | 2,744,475 | |
Irvine,
Special Tax Bonds, Ser. A | | 5.00 | | 9/1/2048 | | 4,250,000 | | 4,829,487 | |
Irvine,
Special Tax Bonds, Ser. A | | 5.00 | | 9/1/2043 | | 2,500,000 | | 2,849,550 | |
Irvine Unified School District,
Special Tax Bonds, Ser. A | | 5.00 | | 9/1/2042 | | 400,000 | | 459,540 | |
Irvine Unified School District,
Special Tax Bonds, Ser. B | | 5.00 | | 9/1/2042 | | 1,000,000 | | 1,148,850 | |
Irvine Unified School District,
Special Tax Bonds, Ser. C | | 5.00 | | 9/1/2042 | | 1,000,000 | | 1,148,850 | |
Jurupa Public Financing Authority,
Special Tax Bonds, Refunding, Ser. A | | 5.00 | | 9/1/2042 | | 3,420,000 | | 3,870,824 | |
18
| | | | | | | | | | |
| |
Description | Coupon
Rate (%) | | Maturity Date | | Principal Amount ($) | | Value ($) | |
Long-Term Municipal Investments - 103.0%(continued) | | | | | |
California - 101.5% (continued) | | | | | |
Lancaster Redevelopment Agency,
Tax Allocation Bonds, Refunding (Comb Redevelopment Project Areas) (Insured; Assured Guaranty Municipal Corporation) | | 5.00 | | 8/1/2033 | | 1,200,000 | | 1,429,776 | |
Lodi Public Financing Authority,
Revenue Bonds, Refunding (Insured; Assured Guaranty Municipal Corporation) | | 5.00 | | 9/1/2030 | | 1,275,000 | | 1,607,711 | |
Long Beach,
Revenue Bonds, Ser. D | | 5.00 | | 5/15/2042 | | 3,500,000 | | 4,055,905 | |
Los Angeles Community Facilities District,
Special Tax Bonds, Refunding (Playa Vista-Phase 1) | | 5.00 | | 9/1/2029 | | 1,190,000 | | 1,379,698 | |
Los Angeles Community Facilities District,
Special Tax Bonds, Refunding (Playa Vista-Phase 1) | | 5.00 | | 9/1/2030 | | 1,110,000 | | 1,281,073 | |
Los Angeles County Public Works Financing Authority,
Revenue Bonds, Ser. D | | 5.00 | | 12/1/2045 | | 4,000,000 | | 4,649,240 | |
Los Angeles County Regional Financing Authority,
Revenue Bonds (MonteCedro Inc. Project) Ser. A | | 5.00 | | 11/15/2044 | | 2,000,000 | | 2,214,120 | |
Los Angeles Department of Airports,
Revenue Bonds (Los Angeles International Airport) Ser. A | | 5.00 | | 5/15/2035 | | 25,000,000 | | 25,843,750 | |
Los Angeles Department of Airports,
Revenue Bonds (Los Angeles International Airport) Ser. A | | 5.00 | | 5/15/2029 | | 3,915,000 | | 4,055,040 | |
Los Angeles Department of Airports,
Revenue Bonds (Los Angeles International Airport) Ser. B | | 5.00 | | 5/15/2038 | | 3,500,000 | | 3,923,710 | |
Los Angeles Department of Airports,
Revenue Bonds, Refunding | | 5.00 | | 5/15/2032 | | 16,985,000 | | 21,292,906 | |
Los Angeles Department of Airports,
Revenue Bonds, Refunding (Los Angeles International Airport) Ser. C | | 5.00 | | 5/15/2038 | | 4,500,000 | | 5,210,415 | |
Los Angeles Department of Airports,
Revenue Bonds, Refunding, Ser. A | | 5.00 | | 5/15/2028 | | 4,215,000 | | 5,326,917 | |
Los Angeles Department of Airports,
Revenue Bonds, Refunding, Ser. A | | 5.00 | | 5/15/2027 | | 2,370,000 | | 2,945,886 | |
Los Angeles Department of Water & Power Power System Revenue,
Revenue Bonds, Refunding (Power System) Ser. A-6 | | 1.30 | | 7/1/2035 | | 3,000,000 | | 3,000,000 | |
19
STATEMENT OF INVESTMENTS (continued)
| | | | | | | | | | |
| |
Description | Coupon
Rate (%) | | Maturity Date | | Principal Amount ($) | | Value ($) | |
Long-Term Municipal Investments - 103.0%(continued) | | | | | |
California - 101.5% (continued) | | | | | |
Los Angeles Harbor Department,
Revenue Bonds, Refunding, Ser. B | | 5.00 | | 8/1/2039 | | 2,050,000 | | 2,348,152 | |
Metropolitan Water District of Southern California,
Revenue Bonds, Refunding, Ser. A | | 5.00 | | 10/1/2034 | | 5,000,000 | | 5,480,900 | |
Metropolitan Water District of Southern California,
Revenue Bonds, Ser. A | | 5.00 | | 7/1/2040 | | 2,000,000 | | 2,346,060 | |
North Natomas Community Facilities District,
Special Tax Bonds, Refunding, Ser. E | | 5.25 | | 9/1/2026 | | 2,760,000 | | 3,157,854 | |
Northern California Power Agency,
Revenue Bonds, Refunding (Hydroelectric Project Number 1) (Insured; AMBAC) | | 7.50 | | 7/1/2021 | | 295,000 | d | 320,370 | |
Northern California Transmission Agency,
Revenue Bonds, Refunding (California-Oregon Transmission Project) Ser. A | | 5.00 | | 5/1/2038 | | 1,565,000 | | 1,835,009 | |
Northern California Transmission Agency,
Revenue Bonds, Refunding (California-Oregon Transmission Project) Ser. A | | 5.00 | | 5/1/2039 | | 1,500,000 | | 1,757,445 | |
Oakland Redevelopment Successor Agency,
Tax Allocation Bonds, Refunding (Insured; Assured Guaranty Municipal Corp.) Ser. TE | | 5.00 | | 9/1/2036 | | 3,000,000 | | 3,483,930 | |
Oakland Unified School District,
GO, Ser. A | | 5.00 | | 8/1/2040 | | 3,500,000 | | 3,973,760 | |
Orange County,
Special Tax Bonds (Esencia Village Improvement Area #1) Ser. A | | 5.00 | | 8/15/2042 | | 3,000,000 | | 3,484,230 | |
Orange County,
Special Tax Bonds (Esencia Village Improvement Area #1) Ser. A | | 5.00 | | 8/15/2047 | | 1,000,000 | | 1,157,060 | |
Orange County,
Special Tax Bonds (Village of Esencia) Ser. A | | 5.00 | | 8/15/2041 | | 6,000,000 | | 6,794,760 | |
Palomar Community College District,
GO, Ser. B | | 0/6.38 | | 8/1/2045 | | 16,615,000 | a | 15,197,076 | |
Palomar Health,
Revenue Bonds, Refunding (Palomar Health and Arch Health Partners) | | 5.00 | | 11/1/2042 | | 5,000,000 | | 5,590,050 | |
20
| | | | | | | | | | |
| |
Description | Coupon
Rate (%) | | Maturity Date | | Principal Amount ($) | | Value ($) | |
Long-Term Municipal Investments - 103.0%(continued) | | | | | |
California - 101.5% (continued) | | | | | |
Palomar Health,
Revenue Bonds, Refunding (Palomar Health and Arch Health Partners) | | 5.00 | | 11/1/2026 | | 1,845,000 | | 2,186,694 | |
Peralta Community College District,
GO, Refunding, Ser. A | | 4.00 | | 8/1/2039 | | 5,000,000 | | 5,376,200 | |
Pittsburg Successor Agency Redevelopment Agency,
Tax Allocation Bonds, Refunding (Los Medanos Community Development Project) (Insured; Assured Guaranty Municipal Corp.) Ser. A | | 5.00 | | 9/1/2028 | | 3,000,000 | | 3,622,470 | |
Pomona Redevelopment Agency,
Tax Allocation Bonds (West Holt Avenue Redevelopment Project) Ser. Y | | 5.50 | | 5/1/2032 | | 3,000,000 | | 3,832,770 | |
Pomona Unified School District,
GO (Insured; Build America Mutual Assurance Company) Ser. F | | 5.00 | | 8/1/2039 | | 2,000,000 | | 2,274,060 | |
Sacramento County,
Revenue Bonds, Refunding, Ser. A | | 5.00 | | 7/1/2041 | | 3,250,000 | | 3,800,387 | |
Sacramento County,
Revenue Bonds, Refunding, Ser. B | | 5.00 | | 7/1/2036 | | 1,375,000 | | 1,690,178 | |
Sacramento County,
Revenue Bonds, Refunding, Ser. B | | 5.00 | | 7/1/2035 | | 1,000,000 | | 1,234,040 | |
Sacramento County,
Revenue Bonds, Refunding, Ser. C | | 5.00 | | 7/1/2028 | | 5,615,000 | | 7,116,395 | |
Sacramento County Water Financing Authority,
Revenue Bonds (Sacramento County Water Agency Zones 40 and 41 Water System Project) (Insured; National Public Finance Guarantee Corp.) Ser. A | | 5.00 | | 6/1/2025 | | 4,000,000 | | 4,170,240 | |
Sacramento Municipal Utility District,
Revenue Bonds, Refunding, Ser. X | | 5.00 | | 8/15/2028 | | 1,845,000 | | 1,992,213 | |
San Diego Association of Governments,
Revenue Bonds, Refunding, Ser. A | | 5.00 | | 7/1/2042 | | 6,000,000 | | 7,108,500 | |
San Diego Association of Governments,
Revenue Bonds, Refunding, Ser. A | | 5.00 | | 7/1/2038 | | 2,000,000 | | 2,392,380 | |
San Diego County Regional Airport Authority,
Revenue Bonds, Refunding, Ser. A | | 5.00 | | 7/1/2042 | | 3,000,000 | | 3,571,170 | |
21
STATEMENT OF INVESTMENTS (continued)
| | | | | | | | | | |
| |
Description | Coupon
Rate (%) | | Maturity Date | | Principal Amount ($) | | Value ($) | |
Long-Term Municipal Investments - 103.0%(continued) | | | | | |
California - 101.5% (continued) | | | | | |
San Diego County Regional Airport Authority,
Revenue Bonds, Ser. A | | 5.00 | | 7/1/2034 | | 3,000,000 | | 3,107,580 | |
San Diego County Regional Transportation Commission,
Sales Tax Revenue Bonds, Ser. A | | 5.00 | | 4/1/2044 | | 10,000,000 | | 11,339,400 | |
San Francisco City & County Redevelopment Agency Successor Agency,
Special Tax Bonds (Mission Bay South Public Improvements) Ser. B | | 0.00 | | 8/1/2021 | | 500,000 | b | 443,940 | |
San Francisco City & County Redevelopment Agency Successor Agency,
Tax Allocation Bonds (Mission Bay South Redevelopment Project) (Insured; National Public Finance Guarantee Corp.) Ser. B | | 5.00 | | 8/1/2043 | | 1,100,000 | | 1,271,193 | |
San Francisco City & County Redevelopment Agency Successor Agency,
Tax Allocation Bonds, Refunding (Mission Bay North Redevelopment Project) Ser. A | | 5.00 | | 8/1/2036 | | 1,555,000 | | 1,825,710 | |
San Francisco City & County Redevelopment Agency Successor Agency,
Tax Allocation Bonds, Refunding (Mission Bay South Redevelopment Project) (Insured; National Public Finance Guarantee Corp.) Ser. C | | 5.00 | | 8/1/2041 | | 1,750,000 | | 2,024,400 | |
San Francisco City and County Airport Commission,
Revenue Bonds, Refunding (San Francisco International Airport) Ser. GOTVL | | 5.00 | | 5/1/2029 | | 2,000,000 | | 2,201,480 | |
San Francisco City and County Airport Commission,
Revenue Bonds, Refunding (SFO Fuel Co LLC) Ser. A | | 5.00 | | 1/1/2047 | | 4,000,000 | | 4,760,720 | |
San Francisco City and County Airport Commission,
Second Series Revenue Bonds, Refunding (San Francisco International Airport) Ser. A | | 5.00 | | 5/1/2029 | | 1,000,000 | | 1,228,860 | |
22
| | | | | | | | | | |
| |
Description | Coupon
Rate (%) | | Maturity Date | | Principal Amount ($) | | Value ($) | |
Long-Term Municipal Investments - 103.0%(continued) | | | | | |
California - 101.5% (continued) | | | | | |
San Francisco City and County Airport Commission,
Second Series Revenue Bonds, Refunding (San Francisco International Airport) Ser. A | | 5.00 | | 5/1/2032 | | 1,000,000 | | 1,203,260 | |
San Francisco City and County Airport Commission,
Second Series Revenue Bonds, Refunding (San Francisco International Airport) Ser. GOTVL | | 5.00 | | 5/1/2028 | | 2,000,000 | | 2,205,700 | |
San Francisco City and County Public Utilities Commission,
Revenue Bonds | | 5.00 | | 11/1/2037 | | 10,000,000 | | 10,944,400 | |
San Joaquin Hills Transportation Corridor Agency,
Revenue Bonds, Refunding, Ser. A | | 5.00 | | 1/15/2050 | | 5,000,000 | | 5,588,100 | |
San Jose Airport,
Revenue Bonds, Refunding, Ser. B | | 5.00 | | 3/1/2042 | | 2,550,000 | | 3,006,450 | |
San Mateo Foster City Public Financing Authority,
Revenue Bonds (Clean Water Program) | | 4.00 | | 8/1/2039 | | 1,500,000 | | 1,698,315 | |
San Mateo Foster City Public Financing Authority,
Revenue Bonds (Clean Water Program) | | 4.00 | | 8/1/2037 | | 2,200,000 | | 2,507,208 | |
Santa Margarita Water District,
Special Tax Bonds (Village of Sendero) | | 5.63 | | 9/1/2043 | | 7,000,000 | | 7,687,610 | |
Santa Margarita Water District,
Special Tax Bonds, Refunding (Talega) Ser. B | | 5.00 | | 9/1/2027 | | 1,945,000 | | 2,202,849 | |
South Orange County Public Financing Authority,
Special Tax Bonds, Refunding (Ladera Ranch) Ser. A | | 5.00 | | 8/15/2030 | | 1,000,000 | | 1,085,950 | |
South Orange County Public Financing Authority,
Special Tax Bonds, Refunding (Ladera Ranch) Ser. A | | 5.00 | | 8/15/2029 | | 1,500,000 | | 1,634,325 | |
Southern California Public Power Authority,
Revenue Bonds (Linden Wind Energy Project) Ser. A | | 5.00 | | 7/1/2029 | | 1,230,000 | | 1,278,671 | |
Southern California Public Power Authority,
Revenue Bonds (Linden Wind Energy Project) Ser. A | | 5.00 | | 7/1/2028 | | 2,145,000 | | 2,230,114 | |
23
STATEMENT OF INVESTMENTS (continued)
| | | | | | | | | | |
| |
Description | Coupon
Rate (%) | | Maturity Date | | Principal Amount ($) | | Value ($) | |
Long-Term Municipal Investments - 103.0%(continued) | | | | | |
California - 101.5% (continued) | | | | | |
Southern California Public Power Authority,
Revenue Bonds (Milford Wind Corridor Phase I Project) | | 5.00 | | 7/1/2029 | | 10,865,000 | | 11,085,559 | |
Southern California Public Power Authority,
Revenue Bonds (Windy Point/Windy Flats Project) | | 5.00 | | 7/1/2027 | | 7,765,000 | | 8,073,969 | |
Stockton Unified School District,
GO (Insured; Assured Guaranty Municipal Corp.) Ser. A | | 5.00 | | 8/1/2038 | | 2,500,000 | | 2,836,375 | |
Stockton Unified School District,
GO, Refunding (Insured; Assured Guaranty Municipal Corp.) | | 5.00 | | 7/1/2026 | | 1,115,000 | | 1,231,763 | |
Stockton Unified School District,
GO, Refunding (Insured; Assured Guaranty Municipal Corp.) | | 5.00 | | 7/1/2025 | | 1,620,000 | | 1,792,724 | |
Tender Option Bond Trust Receipts (Series 2016-XM0375),
(Riverside County Transportation Commission, Sales Tax Revenue Bonds) Non-recourse, Underlying Coupon Rate (%) 5.25 | | 8.62 | | 6/1/2039 | | 7,500,000 | c,e | 8,661,375 | |
Tender Option Bond Trust Receipts (Series 2016-XM0379),
(Los Angeles Department of Water and Power, Water System Revenue Bonds) Non-recourse, Underlying Coupon Rate (%) 5.00 | | 14.41 | | 7/1/2043 | | 12,000,000 | c,e | 13,212,120 | |
Tender Option Bond Trust Receipts (Series 2019-XF0761),
(Los Angeles Department of Harbors, Revenue Bonds, Refunding (Green Bonds)) Ser. C, Underlying Coupon Rate (%) 4.00 | | 10.80 | | 8/1/2039 | | 10,000,000 | c,e | 10,863,400 | |
Tender Option Bond Trust Receipts (Series 2019-XF0762),
(California Health Facilities Financing Authority, Revenue Bonds, Refunding (Sutter Health)) Ser. B, Underlying Coupon Rate (%) 5.00 | | 14.84 | | 11/15/2046 | | 12,275,000 | c,e | 14,296,227 | |
Tobacco Securitization Authority of Northern California,
Revenue Bonds, Ser. C | | 0.00 | | 6/1/2045 | | 66,760,000 | b | 7,864,996 | |
Tobacco Securitization Authority of Southern California,
Revenue Bonds, Ser. A1 | | 4.75 | | 6/1/2025 | | 595,000 | | 598,011 | |
24
| | | | | | | | | | |
| |
Description | Coupon
Rate (%) | | Maturity Date | | Principal Amount ($) | | Value ($) | |
Long-Term Municipal Investments - 103.0%(continued) | | | | | |
California - 101.5% (continued) | | | | | |
Tobacco Securitization Authority of Southern California,
Revenue Bonds, Ser. A2 | | 5.13 | | 6/1/2046 | | 5,850,000 | | 5,862,636 | |
Torrance,
Revenue Bonds (Torrance Memorial Medical Center) Ser. A | | 5.00 | | 9/1/2040 | | 3,000,000 | | 3,122,850 | |
Turlock Irrigation District,
Revenue Bonds, Refunding, Ser. A | | 5.00 | | 1/1/2026 | | 25,000 | | 25,518 | |
University of California,
Revenue Bonds, Refunding, Ser. A | | 5.00 | | 11/1/2038 | | 5,000,000 | | 6,022,200 | |
University of California Regents,
Revenue Bonds, Refunding, Ser. L | | 4.00 | | 5/15/2044 | | 3,000,000 | | 3,218,100 | |
University of California Regents,
Revenue Bonds, Ser. AM | | 5.25 | | 5/15/2030 | | 3,000,000 | | 3,525,210 | |
University of California Regents,
Revenue Bonds, Ser. G | | 5.00 | | 5/15/2042 | | 10,000,000 | | 10,887,000 | |
University of California Regents,
Revenue Bonds, Ser. J | | 5.00 | | 5/15/2043 | | 10,000,000 | | 11,121,700 | |
Walnut Energy Center Authority,
Revenue Bonds, Refunding | | 5.00 | | 1/1/2027 | | 3,150,000 | | 3,690,067 | |
Wiseburn School District,
GO, Ser. C | | 0.00 | | 8/1/2037 | | 6,400,000 | b | 3,681,024 | |
| | 896,876,992 | |
U.S. Related - 1.5% | | | | | |
Federal Home Loan Mortgage Corp. Multifamily VRD Certificates,
Revenue Bonds, Ser. M-050 | | 3.05 | | 6/15/2037 | | 6,490,000 | | 6,752,780 | |
Puerto Rico Highway & Transportation Authority,
Revenue Bonds, Refunding (Insured; Assured Guaranty Municipal Corporation) Ser. CC | | 5.25 | | 7/1/2034 | | 5,905,000 | | 6,493,433 | |
| | 13,246,213 | |
TotalLong-Term Municipal Investments
(cost $859,353,285) | | 910,123,205 | |
Total Investments(cost $862,880,655) | | 103.4% | 913,766,600 | |
Liabilities, Less Cash and Receivables | | (3.4%) | (30,428,034) | |
Net Assets | | 100.0% | 883,338,566 | |
a Zero coupon until a specified date at which time the stated coupon rate becomes effective until maturity.
b Security issued with a zero coupon. Income is recognized through the accretion of discount.
c Security exempt from registration pursuant to Rule 144A under the Securities Act of 1933. These securities may be resold in transactions exempt from registration, normally to qualified institutional buyers. At May 31, 2019, these securities were valued at $82,397,728 or 9.33% of net assets.
d These securities are prerefunded; the date shown represents the prerefunded date. Bonds which are prerefunded are collateralized by U.S. Government securities which are held in escrow and are used to pay principal and interest on the municipal issue and to retire the bonds in full at the earliest refunding date.
e Collateral for floating rate borrowings. The coupon rate given represents the current interest rate for the inverse floating rate security.
25
STATEMENT OF INVESTMENTS (continued)
| | |
Portfolio Summary (Unaudited)† | Value (%) |
General Obligation | 18.3 |
Medical | 16.3 |
Airport | 11.4 |
Education | 9.7 |
Transportation | 6.6 |
General | 6.4 |
Special Tax | 6.2 |
Water | 4.6 |
Tobacco Settlement | 4.3 |
Power | 4.0 |
School District | 3.8 |
Development | 3.0 |
Nursing Homes | 2.6 |
Pollution | 1.5 |
Housing | 1.5 |
Facilities | 1.2 |
Multifamily Housing | 1.2 |
Utilities | .8 |
Prerefunded | .0 |
| | 103.4 |
† Based on net assets.
See notes to financial statements.
26
| | | | |
| |
Summary of Abbreviations(Unaudited) |
| |
ABAG | Association of Bay Area Governments | ACA | American Capital Access |
AGC | ACE Guaranty Corporation | AGIC | Asset Guaranty Insurance Company |
AMBAC | American Municipal Bond Assurance Corporation | ARRN | Adjustable Rate Receipt Notes |
BAN | Bond Anticipation Notes | BPA | Bond Purchase Agreement |
CIFG | CDC Ixis Financial Guaranty | COP | Certificate of Participation |
CP | Commercial Paper | DRIVERS | Derivative Inverse Tax-Exempt Receipts |
EDR | Economic Development Revenue | EIR | Environmental Improvement Revenue |
EURIBOR | Euro Interbank Offered Rate | FGIC | Financial Guaranty Insurance Company |
FHA | Federal Housing Administration | FHLB | Federal Home Loan Bank |
FHLMC | Federal Home Loan Mortgage Corporation | FNMA | Federal National Mortgage Association |
GAN | Grant Anticipation Notes | GIC | Guaranteed Investment Contract |
GNMA | Government National Mortgage Association | GO | General Obligation |
HR | Hospital Revenue | IDB | Industrial Development Board |
IDC | Industrial Development Corporation | IDR | Industrial Development Revenue |
LIBOR | London Interbank Offered Rate | LIFERS | Long Inverse Floating Exempt Receipts |
LOC | Letter of Credit | LOR | Limited Obligation Revenue |
LR | Lease Revenue | MERLOTS | Municipal Exempt Receipts Liquidity Option Tender |
MFHR | Multi-Family Housing Revenue | MFMR | Multi-Family Mortgage Revenue |
MUNIPSA | Securities Industry and Financial Markets Association Municipal Swap Index Yield | PCR | Pollution Control Revenue |
PILOT | Payment in Lieu of Taxes | P-FLOATS | Puttable Floating Option Tax-Exempt Receipts |
PUTTERS | Puttable Tax-Exempt Receipts | RAC | Revenue Anticipation Certificates |
RAN | Revenue Anticipation Notes | RAW | Revenue Anticipation Warrants |
RIB | Residual Interest Bonds | ROCS | Reset Options Certificates |
RRR | Resources Recovery Revenue | SAAN | State Aid Anticipation Notes |
SBPA | Standby Bond Purchase Agreement | SFHR | Single Family Housing Revenue |
SFMR | Single Family Mortgage Revenue | SOFRRATE | Secured Overnight Financing Rate |
SONYMA | State of New York Mortgage Agency | SPEARS | Short Puttable Exempt Adjustable Receipts |
SWDR | Solid Waste Disposal Revenue | TAN | Tax Anticipation Notes |
TAW | Tax Anticipation Warrants | TRAN | Tax and Revenue Anticipation Notes |
XLCA | XL Capital Assurance | | |
See notes to financial statements.
27
STATEMENT OF ASSETS AND LIABILITIES
May 31, 2019
| | | | | | | |
| | | | | | |
| | | Cost | | Value | |
Assets ($): | | | | |
Investments in securities—See Statement of Investments | 862,880,655 | | 913,766,600 | |
Cash | | | | | 207,376 | |
Interest receivable | | 9,173,772 | |
Receivable for shares of Common Stock subscribed | | 1,021,183 | |
Prepaid expenses | | | | | 48,735 | |
| | | | | 924,217,666 | |
Liabilities ($): | | | | |
Due to BNY Mellon Investment Adviser, Inc. and affiliates—Note 3(c) | | 488,119 | |
Payable for floating rate notes issued—Note 4 | | 29,455,000 | |
Payable for investment securities purchased | | 10,021,708 | |
Payable for shares of Common Stock redeemed | | 664,046 | |
Interest and expense payable related to
floating rate notes issued—Note 4 | | 150,090 | |
Directors fees and expenses payable | | 5,367 | |
Accrued expenses | | | | | 94,770 | |
| | | | | 40,879,100 | |
Net Assets ($) | | | 883,338,566 | |
Composition of Net Assets ($): | | | | |
Paid-in capital | | | | | 831,983,576 | |
Total distributable earnings (loss) | | | | | 51,354,990 | |
Net Assets ($) | | | 883,338,566 | |
| | | | | | | |
Net Asset Value Per Share | Class A | Class C | Class I | Class Y | Class Z | |
Net Assets ($) | 80,779,583 | 9,609,089 | 50,295,850 | 3,910,102 | 738,743,942 | |
Shares Outstanding | 5,405,812 | 643,210 | 3,367,259 | 261,776 | 49,435,549 | |
Net Asset Value Per Share ($) | 14.94 | 14.94 | 14.94 | 14.94 | 14.94 | |
| | | | | | |
See notes to financial statements. | | | | | | |
28
STATEMENT OF OPERATIONS
Year Ended May 31, 2019
| | | | | | | |
| | | | | | |
| | | | | | |
Investment Income ($): | | | | |
Interest Income | | | 35,052,365 | |
Expenses: | | | | |
Management fee—Note 3(a) | | | 5,294,643 | |
Shareholder servicing costs—Note 3(c) | | | 750,460 | |
Interest and expense related to floating rate notes issued—Note 4 | | | 469,935 | |
Professional fees | | | 92,569 | |
Directors’ fees and expenses—Note 3(d) | | | 89,414 | |
Registration fees | | | 78,671 | |
Distribution fees—Note 3(b) | | | 69,891 | |
Loan commitment fees—Note 2 | | | 18,058 | |
Prospectus and shareholders’ reports | | | 17,159 | |
Custodian fees—Note 3(c) | | | 7,860 | |
Miscellaneous | | | 46,373 | |
Total Expenses | | | 6,935,033 | |
Less—reduction in fees due to earnings credits—Note 3(c) | | | (7,789) | |
Net Expenses | | | 6,927,244 | |
Investment Income—Net | | | 28,125,121 | |
Realized and Unrealized Gain (Loss) on Investments—Note 4 ($): | | |
Net realized gain (loss) on investments | 641,316 | |
Net realized gain (loss) on futures | (58,144) | |
Net Realized Gain (Loss) | | | 583,172 | |
Net unrealized appreciation (depreciation) on investments | | | 10,512,510 | |
Net Realized and Unrealized Gain (Loss) on Investments | | | 11,095,682 | |
Net Increase in Net Assets Resulting from Operations | | 39,220,803 | |
| | | | | | |
See notes to financial statements. | | | | | |
29
STATEMENT OF CHANGES IN NET ASSETS
| | | | | | | | | | |
| | | | Year Ended May 31, |
| | | | 2019 | | 2018a | |
Operations ($): | | | | | | | | |
Investment income—net | | | 28,125,121 | | | | 30,907,401 | |
Net realized gain (loss) on investments | | 583,172 | | | | 7,058,179 | |
Net unrealized appreciation (depreciation)
on investments | | 10,512,510 | | | | (26,811,898) | |
Net Increase (Decrease) in Net Assets
Resulting from Operations | 39,220,803 | | | | 11,153,682 | |
Distributions ($): | |
Distributions to shareholders: | | | | | | | | |
Class A | | | (2,596,628) | | | | (3,168,541) | |
Class C | | | (250,028) | | | | (412,428) | |
Class I | | | (1,810,189) | | | | (2,151,610) | |
Class Y | | | (129,565) | | | | (142,934) | |
Class Z | | | (27,072,555) | | | | (32,651,597) | |
Total Distributions | | | (31,858,965) | | | | (38,527,110) | |
Capital Stock Transactions ($): | |
Net proceeds from shares sold: | | | | | | | | |
Class A | | | 14,354,026 | | | | 12,181,838 | |
Class C | | | 1,507,130 | | | | 1,727,220 | |
Class I | | | 15,297,990 | | | | 20,607,878 | |
Class Y | | | 914,093 | | | | 175,000 | |
Class Z | | | 15,740,399 | | | | 18,766,978 | |
Distributions reinvested: | | | | | | | | |
Class A | | | 2,048,565 | | | | 2,443,808 | |
Class C | | | 210,354 | | | | 331,985 | |
Class I | | | 1,767,427 | | | | 1,999,517 | |
Class Y | | | 13,833 | | | | 17,662 | |
Class Z | | | 21,246,748 | | | | 25,442,017 | |
Cost of shares redeemed: | | | | | | | | |
Class A | | | (14,746,650) | | | | (16,113,089) | |
Class C | | | (2,235,029) | | | | (7,729,082) | |
Class I | | | (18,821,929) | | | | (19,317,573) | |
Class Y | | | (209,246) | | | | (487,468) | |
Class Z | | | (79,592,548) | | | | (70,752,300) | |
Increase (Decrease) in Net Assets
from Capital Stock Transactions | (42,504,837) | | | | (30,705,609) | |
Total Increase (Decrease) in Net Assets | (35,142,999) | | | | (58,079,037) | |
Net Assets ($): | |
Beginning of Period | | | 918,481,565 | | | | 976,560,602 | |
End of Period | | | 883,338,566 | | | | 918,481,565 | |
30
| | | | | | | | | | |
| | | | Year Ended May 31, |
| | | | 2019 | | 2018a | |
Capital Share Transactions (Shares): | |
Class Ab | | | | | | | | |
Shares sold | | | 974,527 | | | | 807,236 | |
Shares issued for distributions reinvested | | | 139,881 | | | | 162,887 | |
Shares redeemed | | | (1,010,196) | | | | (1,073,896) | |
Net Increase (Decrease) in Shares Outstanding | 104,212 | | | | (103,773) | |
Class Cb | | | | | | | | |
Shares sold | | | 103,009 | | | | 114,432 | |
Shares issued for distributions reinvested | | | 14,376 | | | | 22,109 | |
Shares redeemed | | | (152,411) | | | | (514,173) | |
Net Increase (Decrease) in Shares Outstanding | (35,026) | | | | (377,632) | |
Class I | | | | | | | | |
Shares sold | | | 1,045,389 | | | | 1,371,001 | |
Shares issued for distributions reinvested | | | 120,726 | | | | 133,368 | |
Shares redeemed | | | (1,289,449) | | | | (1,289,606) | |
Net Increase (Decrease) in Shares Outstanding | (123,334) | | | | 214,763 | |
Class Yc | | | | | | | | |
Shares sold | | | 62,303 | | | | 11,468 | |
Shares issued for distributions reinvested | | | 947 | | | | 1,177 | |
Shares redeemed | | | (14,261) | | | | (32,515) | |
Net Increase (Decrease) in Shares Outstanding | 48,989 | | | | (19,870) | |
Class Zc | | | | | | | | |
Shares sold | | | 1,073,264 | | | | 1,247,214 | |
Shares issued for distributions reinvested | | | 1,450,822 | | | | 1,695,436 | |
Shares redeemed | | | (5,439,158) | | | | (4,707,171) | |
Net Increase (Decrease) in Shares Outstanding | (2,915,072) | | | | (1,764,521) | |
| | | | | | | | | |
a Distributions to shareholders include $2,486,984 Class A, $309,280 Class C, $1,711,545 Class I, $114,945 Class Y and $26,046,224 Class Z from investment income—net and $681,557 Class A, $103,148 Class C, $440,065 Class I, $27,989 Class Y and $6,605,373 Class Z distributions from net realized gains. | |
b During the period May 31, 2018, 2,755 Class C shares representing $41,434 were automatically converted for 2,755 Class A shares. | |
c During the period ended May 31, 2019, 12,557 Class Z shares representing $186,093 were exchanged for 12,565 Class Y shares. | |
See notes to financial statements.
| | | | | | | | |
31
FINANCIAL HIGHLIGHTS
The following tables describe the performance for each share class for the fiscal periods indicated. All information (except portfolio turnover rate) reflects financial results for a single fund share. Total return shows how much your investment in the fund would have increased (or decreased) during each period, assuming you had reinvested all dividends and distributions. These figures have been derived from the fund’s financial statements.
| | | | | | | | |
| | |
| | |
| | Year Ended May 31, |
Class A Shares | | 2019 | 2018 | 2017 | 2016 | 2015 |
Per Share Data ($): | | | | | | |
Net asset value, beginning of period | | 14.81 | 15.24 | 15.69 | 15.22 | 15.20 |
Investment Operations: | | | | | | |
Investment income—neta | | .44 | .46 | .48 | .51 | .52 |
Net realized and unrealized
gain (loss) on investments | | .19 | (.30) | (.45) | .47 | .01 |
Total from Investment Operations | | .63 | .16 | .03 | .98 | .53 |
Distributions: | | | | | | |
Dividends from investment
income—net | | (.44) | (.46) | (.48) | (.51) | (.51) |
Dividends from net realized
gain on investments | | (.06) | (.13) | (.00)b | − | − |
Total Distributions | | (.50) | (.59) | (.48) | (.51) | (.51) |
Net asset value, end of period | | 14.94 | 14.81 | 15.24 | 15.69 | 15.22 |
Total Return (%)c | | 4.40 | 1.03 | .25 | 6.54 | 3.54 |
Ratios/Supplemental Data (%): | | | | | | |
Ratio of total expenses to
average net assets | | .98 | .95 | .94 | .93 | .93 |
Ratio of net expenses to
average net assets | | .98 | .94 | .94 | .93 | .93 |
Ratio of interest and expense
related to floating rate notes
issued to average net assets | | .05 | .02 | .01 | .01 | .01 |
Ratio of net investment income
to average net assets | | 3.00 | 3.07 | 3.15 | 3.29 | 3.38 |
Portfolio Turnover Rate | | 22.63 | 14.26 | 21.23 | 11.03 | 9.33 |
Net Assets, end of period ($ x 1,000) | | 80,780 | 78,495 | 82,369 | 107,497 | 90,386 |
a Based on average shares outstanding.
b Amount represents less than $.01 per share.
c Exclusive of sales charge.
See notes to financial statements.
32
| | | | | | | | |
| | |
| | |
| | Year Ended May 31, |
Class C Shares | | 2019 | 2018 | 2017 | 2016 | 2015 |
Per Share Data ($): | | | | | | |
Net asset value, beginning of period | | 14.80 | 15.24 | 15.69 | 15.21 | 15.19 |
Investment Operations: | | | | | | |
Investment income—neta | | .33 | .35 | .37 | .38 | .40 |
Net realized and unrealized
gain (loss) on investments | | .20 | (.32) | (.46) | .49 | .02 |
Total from Investment Operations | | .53 | .03 | (.09) | .87 | .42 |
Distributions: | | | | | | |
Dividends from investment
income—net | | (.33) | (.34) | (.36) | (.39) | (.40) |
Dividends from net realized
gain on investments | | (.06) | (.13) | (.00)b | − | − |
Total Distributions | | (.39) | (.47) | (.36) | (.39) | (.40) |
Net asset value, end of period | | 14.94 | 14.80 | 15.24 | 15.69 | 15.21 |
Total Return (%)c | | 3.68 | .19 | (.52) | 5.79 | 2.76 |
Ratios/Supplemental Data (%): | | | | | | |
Ratio of total expenses to
average net assets | | 1.75 | 1.70 | 1.70 | 1.70 | 1.69 |
Ratio of net expenses to
average net assets | | 1.75 | 1.70 | 1.70 | 1.70 | 1.69 |
Ratio of interest and expense
related to floating rate notes
issued to average net assets | | .05 | .02 | .01 | .01 | .01 |
Ratio of net investment income
to average net assets | | 2.24 | 2.31 | 2.39 | 2.50 | 2.62 |
Portfolio Turnover Rate | | 22.63 | 14.26 | 21.23 | 11.03 | 9.33 |
Net Assets, end of period ($ x 1,000) | | 9,609 | 10,040 | 16,087 | 16,347 | 9,427 |
a Based on average shares outstanding.
b Amount represents less than $.01 per share.
c Exclusive of sales charge.
See notes to financial statements.
33
FINANCIAL HIGHLIGHTS (continued)
| | | | | | | | |
| | |
| | |
| | Year Ended May 31, |
Class I Shares | | 2019 | 2018 | 2017 | 2016 | 2015 |
Per Share Data ($): | | | | | | |
Net asset value, beginning of period | | 14.80 | 15.23 | 15.68 | 15.21 | 15.19 |
Investment Operations: | | | | | | |
Investment income—neta | | .47 | .50 | .52 | .53 | .55 |
Net realized and unrealized
gain (loss) on investments | | .21 | (.30) | (.45) | .49 | .02 |
Total from Investment Operations | | .68 | .20 | .07 | 1.02 | .57 |
Distributions: | | | | | | |
Dividends from investment
income—net | | (.48) | (.50) | (.52) | (.55) | (.55) |
Dividends from net realized
gain on investments | | (.06) | (.13) | (.00)b | − | − |
Total Distributions | | (.54) | (.63) | (.52) | (.55) | (.55) |
Net asset value, end of period | | 14.94 | 14.80 | 15.23 | 15.68 | 15.21 |
Total Return (%) | | 4.73 | 1.28 | .49 | 6.80 | 3.79 |
Ratios/Supplemental Data (%): | | | | | | |
Ratio of total expenses to
average net assets | | .73 | .70 | .69 | .69 | .68 |
Ratio of net expenses to
average net assets | | .73 | .70 | .69 | .69 | .68 |
Ratio of interest and expense
related to floating rate notes
issued to average net assets | | .05 | .02 | .01 | .01 | .01 |
Ratio of net investment income
to average net assets | | 3.25 | 3.32 | 3.39 | 3.51 | 3.63 |
Portfolio Turnover Rate | | 22.63 | 14.26 | 21.23 | 11.03 | 9.33 |
Net Assets, end of period ($ x 1,000) | | 50,296 | 51,660 | 49,897 | 48,827 | 20,289 |
a Based on average shares outstanding.
b Amount represents less than $.01 per share.
See notes to financial statements.
34
| | | | | | | | | | | |
| | | | |
| | |
| | Year Ended May 31, |
Class Y Shares | | 2019 | 2018 | 2017 | 2016 | 2015 |
Per Share Data ($): | | | | | | |
Net asset value, beginning of period | | 14.80 | 15.23 | 15.68 | 15.21 | 15.19 |
Investment Operations: | | | | | | |
Investment income—neta | | .48 | .50 | .53 | .55 | .60 |
Net realized and unrealized
gain (loss) on investments | | .20 | (.30) | (.46) | .47 | (.03) |
Total from Investment Operations | | .68 | .20 | .07 | 1.02 | .57 |
Distributions: | | | | | | |
Dividends from investment
income—net | | (.48) | (.50) | (.52) | (.55) | (.55) |
Dividends from net realized
gain on investments | | (.06) | (.13) | (.00)b | − | − |
Total Distributions | | (.54) | (.63) | (.52) | (.55) | (.55) |
Net asset value, end of period | | 14.94 | 14.80 | 15.23 | 15.68 | 15.21 |
Total Return (%) | | 4.75 | 1.31 | .52 | 6.83 | 3.79 |
Ratios/Supplemental Data (%): | | | | | | |
Ratio of total expenses to
average net assets | | .70 | .67 | .67 | .65 | .67 |
Ratio of net expenses to
average net assets | | .70 | .67 | .67 | .65 | .67 |
Ratio of interest and expense
related to floating rate notes
issued to average net assets | | .05 | .02 | .01 | .01 | .01 |
Ratio of net investment income
to average net assets | | 3.27 | 3.35 | 3.43 | 3.57 | 3.63 |
Portfolio Turnover Rate | | 22.63 | 14.26 | 21.23 | 11.03 | 9.33 |
Net Assets, end of period ($ x 1,000) | | 3,910 | 3,149 | 3,544 | 3,819 | 3,841 |
a Based on average shares outstanding.
b Amount represents less than $.01 per share.
See notes to financial statements.
35
FINANCIAL HIGHLIGHTS (continued)
| | | | | | | | |
| | |
| | |
| | Year Ended May 31, |
Class Z Shares | | 2019 | 2018 | 2017 | 2016 | 2015 |
Per Share Data ($): | | | | | | |
Net asset value, beginning of period | | 14.81 | 15.24 | 15.69 | 15.22 | 15.20 |
Investment Operations: | | | | | | |
Investment income—neta | | .47 | .49 | .52 | .54 | .55 |
Net realized and unrealized
gain (loss) on investments | | .19 | (.30) | (.46) | .47 | .02 |
Total from Investment Operations | | .66 | .19 | .06 | 1.01 | .57 |
Distributions: | | | | | | |
Dividends from investment
income—net | | (.47) | (.49) | (.51) | (.54) | (.55) |
Dividends from net realized
gain on investments | | (.06) | (.13) | (.00)b | − | − |
Total Distributions | | (.53) | (.62) | (.51) | (.54) | (.55) |
Net asset value, end of period | | 14.94 | 14.81 | 15.24 | 15.69 | 15.22 |
Total Return (%) | | 4.62 | 1.24 | .47 | 6.76 | 3.76 |
Ratios/Supplemental Data (%): | | | | | | |
Ratio of total expenses to
average net assets | | .76 | .73 | .72 | .72 | .72 |
Ratio of net expenses to
average net assets | | .76 | .73 | .72 | .72 | .72 |
Ratio of interest and expense
related to floating rate notes
issued to average net assets | | .05 | .02 | .01 | .01 | .01 |
Ratio of net investment income
to average net assets | | 3.21 | 3.29 | 3.38 | 3.50 | 3.59 |
Portfolio Turnover Rate | | 22.63 | 14.26 | 21.23 | 11.03 | 9.33 |
Net Assets, end of period ($ x 1,000) | | 738,744 | 775,138 | 824,664 | 873,673 | 881,000 |
a Based on average shares outstanding.
b Amount represents less than $.01 per share.
See notes to financial statements
36
NOTES TO FINANCIAL STATEMENTS
NOTE 1—Significant Accounting Policies:
BNY Mellon California AMT-Free Municipal Bond Fund, Inc. (the “fund”) is registered under the Investment Company Act of 1940, as amended (the “Act”), is a non-diversified open-end management investment company. The fund’s investment objective is to seek as high a level of current income exempt from federal and California state income taxes, as is consistent with the preservation of capital. BNY Mellon Investment Adviser, Inc. (the “Adviser”), a wholly-owned subsidiary of The Bank of New York Mellon Corporation (“BNY Mellon”), serves as the fund’s investment adviser.
Effective June 3, 2019, the fund changed its name from Dreyfus California AMT-Free Municipal Bond Fund to BNY Mellon California AMT-Free Municipal Bond Fund, Inc. and was reclassified as a standalone fund. In addition, The Dreyfus Corporation, the fund’s investment adviser and administrator, changed its name to “BNY Mellon Investment Adviser, Inc.”, MBSC Securities Corporation, the fund’s distributor, changed its name to “BNY Mellon Securities Corporation” and Dreyfus Transfer, Inc., the fund’s transfer agent, changed its name to “BNY Mellon Transfer, Inc.”
BNY Mellon Securities Corporation (the “Distributor”), a wholly-owned subsidiary of the Adviser, is the distributor of the fund’s shares. The fund is authorized to issue 700 million shares of $.001 par value Common Stock. The fund currently has authorized five classes of shares: Class A (100 million shares authorized), Class C (100 million shares authorized), Class I (100 million shares authorized), Class T (100 million shares authorized), Class Y (100 million shares authorized) and Class Z (200 million shares authorized). Class A and Class T shares generally are subject to a sales charge imposed at the time of purchase. Class C shares are subject to a contingent deferred sales charge (“CDSC”) imposed on Class C shares redeemed within one year of purchase. Class C shares automatically convert to Class A shares ten years after the date of purchase, without the imposition of a sales charge. Class I and Class Y shares are sold at net asset value per share generally to institutional investors. Class Z shares are sold at net asset value per share to certain shareholders of the fund. Class Z shares generally are not available for new accounts. As of the date of this report, the fund did not offer Class T shares for purchase. Other differences between the classes include the services offered to and the expenses borne by each class, the allocation of certain transfer agency costs, and certain voting rights. Income, expenses (other than expenses attributable to a specific class), and realized and
37
NOTES TO FINANCIAL STATEMENTS(continued)
unrealized gains or losses on investments are allocated to each class of shares based on its relative net assets.
The Financial Accounting Standards Board (“FASB”) Accounting Standards Codification is the exclusive reference of authoritative U.S. generally accepted accounting principles (“GAAP”) recognized by the FASB to be applied by nongovernmental entities. Rules and interpretive releases of the Securities and Exchange Commission (“SEC”) under authority of federal laws are also sources of authoritative GAAP for SEC registrants. The fund’s financial statements are prepared in accordance with GAAP, which may require the use of management estimates and assumptions. Actual results could differ from those estimates.
The fundenters into contracts that contain a variety of indemnifications. The fund’s maximum exposure under these arrangements is unknown. The fund does not anticipate recognizing any loss related to these arrangements.
(a) Portfolio valuation: The fair value of a financial instrument is the amount that would be received to sell an asset or paid to transfer a liability in an orderly transaction between market participants at the measurement date (i.e., the exit price). GAAP establishes a fair value hierarchy that prioritizes the inputs of valuation techniques used to measure fair value. This hierarchy gives the highest priority to unadjusted quoted prices in active markets for identical assets or liabilities (Level 1 measurements) and the lowest priority to unobservable inputs (Level 3 measurements).
Additionally, GAAP provides guidance on determining whether the volume and activity in a market has decreased significantly and whether such a decrease in activity results in transactions that are not orderly. GAAP requires enhanced disclosures around valuation inputs and techniques used during annual and interim periods.
Various inputs are used in determining the value of the fund’s investments relating to fair value measurements. These inputs are summarized in the three broad levels listed below:
Level 1—unadjusted quoted prices in active markets for identical investments.
Level 2—other significant observable inputs (including quoted prices for similar investments, interest rates, prepayment speeds, credit risk, etc.).
Level 3—significant unobservable inputs (including the fund’s own assumptions in determining the fair value of investments).
38
The inputs or methodology used for valuing securities are not necessarily an indication of the risk associated with investing in those securities.
Changes in valuation techniques may result in transfers in or out of an assigned level within the disclosure hierarchy. Valuation techniques used to value the fund’s investments are as follows:
Investments in securities are valued each business day by an independent pricing service (the “Service”) approved by the fund’s Board of Directors (the “Board”). Investments for which quoted bid prices are readily available and are representative of the bid side of the market in the judgment of the Service are valued at the mean between the quoted bid prices (as obtained by the Service from dealers in such securities) and asked prices (as calculated by the Service based upon its evaluation of the market for such securities). Other investments (which constitute a majority of the portfolio securities) are carried at fair value as determined by the Service, based on methods which include consideration of the following: yields or prices of municipal securities of comparable quality, coupon, maturity and type; indications as to values from dealers; and general market conditions. All of the preceding securities are generally categorized within Level 2 of the fair value hierarchy.
The Service is engaged under the general oversight of the Board.
When market quotations or official closing prices are not readily available, or are determined not to accurately reflect fair value, such as when the value of a security has been significantly affected by events after the close of the exchange or market on which the security is principally traded, but before the fund calculates its net asset value, the fund may value these investments at fair value as determined in accordance with the procedures approved by the Board. Certain factors may be considered when fair valuing investments such as: fundamental analytical data, the nature and duration of restrictions on disposition, an evaluation of the forces that influence the market in which the securities are purchased and sold, and public trading in similar securities of the issuer or comparable issuers. These securities are either categorized within Level 2 or 3 of the fair value hierarchy depending on the relevant inputs used.
For restricted securities where observable inputs are limited, assumptions about market activity and risk are used and such securities are generally categorized within Level 3 of the fair value hierarchy.
The following is a summary of the inputs used as of May 31, 2019in valuing the fund’s investments:
39
NOTES TO FINANCIAL STATEMENTS(continued)
| | | | | |
| | Level 1 - Unadjusted Quoted Prices | Level 2 - Other Significant Observable Inputs | Level 3 -Significant Unobservable Inputs | Total |
Assets ($) | | | | |
Investments in Securities: | | | | |
Municipal Bonds† | - | 913,766,600 | - | 913,766,600 |
Liabilities ($) | | | | |
Floating Rate Notes†† | - | (29,455,000) | - | (29,455,000) |
† See Statement of Investments for additional detailed categorizations.
†† Certain of the fund’s liabilities are held at carrying amount, which approximates fair value for financial reporting purposes.
At May 31, 2019, there were no transfers between levels of the fair value hierarchy. It is the fund’s policy to recognize transfers between levels at the end of the reporting period.
(b) Securities transactions and investment income: Securities transactions are recorded on a trade date basis. Realized gains and losses from securities transactions are recorded on the identified cost basis. Interest income, adjusted for accretion of discount and amortization of premium on investments, is earned from settlement date and recognized on the accrual basis. Securities purchased or sold on a when issued or delayed delivery basis may be settled a month or more after the trade date.
The fund follows an investment policy of investing primarily in municipal obligations of one state. Economic changes affecting the state and certain of its public bodies and municipalities may affect the ability of issuers within the state to pay interest on, or repay principal of, municipal obligations held by the fund.
(c) Dividends and distributions to shareholders:It is the policy of the fund to declare dividends daily from investment income-net. Such dividends are paid monthly. Dividends from net realized capital gains, if any, are normally declared and paid annually, but the fund may make distributions on a more frequent basis to comply with the distribution requirements of the Internal Revenue Code of 1986, as amended (the “Code”). To the extent that net realized capital gains can be offset by capital loss carryovers, it is the policy of the fund not to distribute such gains. Income and capital gain distributions are determined in accordance with income tax regulations, which may differ from GAAP.
(d) Federal income taxes: It is the policy of the fund to continue to qualify as a regulated investment company, which can distribute tax-exempt dividends, by complying with the applicable provisions of the Code, and to make distributions of income and net realized capital gain sufficient to relieve it from substantially all federal income and excise taxes.
40
As of and during the period ended May 31, 2019, the fund did not have any liabilities for any uncertain tax positions. The fund recognizes interest and penalties, if any, related to uncertain tax positions as income tax expense in the Statement of Operations. During the period ended May 31, 2019, the fund did not incur any interest or penalties.
Each tax year in the four-year period ended May 31, 2019 remains subject to examination by the Internal Revenue Service and state taxing authorities.
At May 31, 2019, the components of accumulated earnings on a tax basis were as follows: undistributed tax-exempt income $1,183,491, undistributed capital gains $180,445 and unrealized appreciation $51,174,545.
The tax character of distributions paid to shareholders during the fiscal periods ended May 31, 2019 and May 31, 2018 were as follows: tax-exempt income $28,143,918 and $30,668,978, ordinary income $117,864 and $539,742, and long-term capital gains $3,597,183 and $7,318,390, respectively.
During the period ended May 31, 2019, as a result of permanent book to tax differences, primarily due to the tax treatment for amortization adjustments, the fund decreased total distributable earnings (loss) by $13 and increased paid-in capital by the same amount. Net assets and net asset value per share were not affected by this reclassification.
(e) New Accounting Pronouncements: In March 2017, the FASB issued Accounting Standards Update 2017-08, Receivables—Nonrefundable Fees and Other Costs (Subtopic 310-20): Premium Amortization On Purchased Callable Debt Securities (“ASU 2017-08”). The update shortens the amortization period for the premium on certain purchased callable debt securities to the earliest call date. ASU 2017-08 will be effective for fiscal years beginning after December 15, 2018.
Also in August 2018, the FASB issued Accounting Standards Update 2018-13, Fair Value Measurement (Topic 820): Disclosure Framework—Changes to the Disclosure Requirements for Fair Value Measurement (“ASU 2018-13”). The update provides guidance that modifies certain disclosure requirements for fair value measurements. ASU 2018-13 will be effective for fiscal years beginning after December 15, 2019. Management is currently assessing the potential impact of these changes to future financial statements.
41
NOTES TO FINANCIAL STATEMENTS(continued)
NOTE 2—Bank Lines of Credit:
The fund participates with other long-term open-end funds managed by the Adviser in a $1.030 billion unsecured credit facility led by Citibank, N.A. (the “Citibank Credit Facility”) and a $300 million unsecured credit facility provided by The Bank of New York Mellon (the “BNYM Credit Facility”), a subsidiary of BNY Mellon and an affiliate of the Adviser, each to be utilized primarily for temporary or emergency purposes, including the financing of redemptions (each, a “Facility”). The Citibank Credit Facility is available in two tranches: (i) Tranche A is in an amount equal to $830 million and is available to all long-term open-ended funds, including the fund, and (ii) Tranche B is in amount equal to $200 million and is available only to BNY Mellon Floating Rate Income Fund, a series of BNY Mellon Investment Funds IV, Inc. Prior to October 3, 2018, the unsecured credit facility with Citibank, N.A. was $830 million. In connection therewith, the fund has agreed to pay its pro rata portion of commitment fees for Tranche A of the Citibank Credit Facility and the BNYM Credit Facility. Interest is charged to the fund based on rates determined pursuant to the terms of the respective Facility at the time of borrowing. During the period ended May 31, 2019, the fund did not borrow under the Facilities.
NOTE 3—Management Fee and Other Transactions with Affiliates:
(a)Pursuant to a management agreement (the “Agreement”) with the Adviser, the management fee is computed at the annual rate of .60% of the value of the fund’s average daily net assets and is payable monthly. The Agreement provides that if in any fiscal year the aggregate expenses allocable to Class Z shares (excluding taxes, brokerage commissions, interest expense and extraordinary expenses) exceed 1½% of the value of the average daily net assets of Class Z shares, the fund may deduct from the fees paid to the Adviser, or the Adviser will bear such excess expense. During the period ended May 31, 2019, there was no reduction in expenses pursuant to the Agreement.
During the period ended May 31, 2019, the Distributor retained $886 from commissions earned on sales of the fund’s Class A shares.
(b) Under the Distribution Plan adopted pursuant to Rule 12b-1 under the Act, Class C shares pay the Distributor for distributing its shares at an annual rate of .75% of the value of its average daily net assets. During the period ended May 31, 2019, Class C shares were charged $69,891 pursuant to the Distribution Plan.
(c)Under the Shareholder Services Plan, Class A and Class C shares pay the Distributor at an annual rate of .25% of the value of their average daily
42
net assets for the provision of certain services. The services provided may include personal services relating to shareholder accounts, such as answering shareholder inquiries regarding the fund and providing reports and other information, and services related to the maintenance of shareholder accounts. The Distributor may make payments to Service Agents (securities dealers, financial institutions or other industry professionals) with respect to these services. The Distributor determines the amounts to be paid to Service Agents. During the period ended May 31, 2019, Class A and Class C shares were charged $190,460and $23,297, respectively, pursuant to the Shareholder Services Plan.
Under the Shareholder Services Plan, Class Z shares reimburse the Distributor at an amount not to exceed an annual rate of .25% of the value of Class Z shares’ average daily net assets for the provision of certain services. The services provided may include personal services relating to shareholder accounts, such as answering shareholder inquiries regarding Class Z shares and providing reports and other information, and services related to the maintenance of shareholder accounts. During the period ended May 31, 2019,Class Z shares were charged $290,054 pursuant to the Shareholder Services Plan.
The fund has arrangements with the transfer agent and the custodian whereby the fund may receive earnings credits when positive cash balances are maintained, which are used to offset transfer agency and custody fees. For financial reporting purposes, the fund includes net earnings credits, if any, as an expense offset in the Statement of Operations.
The fund compensates BNY Mellon Transfer, Inc., a wholly-owned subsidiary of the Adviser, under a transfer agency agreement for providing transfer agency and cash management services for the fund. The majority of transfer agency fees are comprised of amounts paid on a per account basis, while cash management fees are related to fund subscriptions and redemptions. During the period ended May 31, 2019, the fund was charged $129,759 for transfer agency services. These fees are included in Shareholder servicing costs in the Statement of Operations.
The fund compensates The Bank of New York Mellon under a custody agreement for providing custodial services for the fund. These fees are determined based on net assets, geographic region and transaction activity. During the period ended May 31, 2019, the fund was charged $7,860 pursuant to the custody agreement. These fees were partially offset by earnings credits of $7,772.
The fund compensates The Bank of New York Mellon under a shareholder redemption draft processing agreement for providing certain
43
NOTES TO FINANCIAL STATEMENTS(continued)
services related to the fund’s check writing privilege. During the period ended May 31, 2019, the fund was charged $7,207 pursuant to the agreement, which is included in Shareholder servicing costs in the Statement of Operations. These fees were partially offset by earnings credits of $17.
During the period ended May 31, 2019, the fund was charged $12,449 for services performed by the Chief Compliance Officer and his staff. These fees are included in Miscellaneous in the Statement of Operations.
The components of “Due to BNY Mellon Investment Adviser, Inc. and affiliates” in the Statement of Assets and Liabilities consist of: management fees $446,638, Distribution Plan fees $6,029, Shareholder Services Plan fees $22,166, custodian fees $3,900, Chief Compliance Officer fees $4,090 and transfer agency fees $5,296.
(d) Each Board member also serves as a Board member of other funds in the BNY Mellon Family of Funds complex. Annual retainer fees and attendance fees are allocated to each fund based on net assets.
NOTE 4—Securities Transactions:
The aggregate amount of purchases and sales of investment securities, excluding short-term securities and futures during the period ended May 31, 2019, amounted to $198,879,548 and $233,700,679, respectively.
Inverse Floater Securities: The fund participates in secondary inverse floater structures in which fixed-rate, tax-exempt municipal bonds are transferred to a trust (the “Inverse Floater Trust”). The Inverse Floater Trust typically issues two variable rate securities that are collateralized by the cash flows of the fixed-rate, tax-exempt municipal bonds. One of these variable rate securities pays interest based on a short-term floating rate set by a remarketing agent at predetermined intervals (“Trust Certificates”). A residual interest tax-exempt security is also created by the Inverse Floater Trust, which is transferred to the fund, and is paid interest based on the remaining cash flows of the Inverse Floater Trust, after payment of interest on the other securities and various expenses of the Inverse Floater Trust. An Inverse Floater Trust may be collapsed without the consent of the fund due to certain termination events such as bankruptcy, default or other credit event.
The fund accounts for the transfer of bonds to the Inverse Floater Trust as secured borrowings, with the securities transferred remaining in the fund’s investments, and the Trust Certificates reflected as fund liabilities in the Statement of Assets and Liabilities.
44
The fund may invest in inverse floater securities on either a non-recourse or recourse basis. These securities are typically supported by a liquidity facility provided by a bank or other financial institution (the “Liquidity Provider”) that allows the holders of the Trust Certificates to tender their certificates in exchange for payment from the Liquidity Provider of par plus accrued interest on any business day prior to a termination event. When the fund invests in inverse floater securities on a non-recourse basis, the Liquidity Provider is required to make a payment under the liquidity facility due to a termination event to the holders of the Trust Certificates. When this occurs, the Liquidity Provider typically liquidates all or a portion of the municipal securities held in the Inverse Floater Trust. A liquidation shortfall occurs if the Trust Certificates exceed the proceeds of the sale of the bonds in the Inverse Floater Trust (“Liquidation Shortfall”). When a fund invests in inverse floater securities on a recourse basis, the fund typically enters into a reimbursement agreement with the Liquidity Provider where the fund is required to repay the Liquidity Provider the amount of any Liquidation Shortfall. As a result, a fund investing in a recourse inverse floater security bears the risk of loss with respect to any Liquidation Shortfall.
The average amount of borrowings outstanding under the inverse floater structure during the period ended May 31, 2019, was approximately $15,320,000, with a related weighted average annualized interest rate of 3.07%.
Derivatives:A derivative is a financial instrument whose performance is derived from the performance of another asset. Each type of derivative instrument that was held by the fund during the period ended May 31, 2019 is discussed below.
Futures:In the normal course of pursuing its investment objective, the fund is exposed to market risk, including interest rate risk,as a result of changes in value of underlying financial instruments. The fund invests in futures in order to manage its exposure to or protect against changes in the market. A futures contract represents a commitment for the future purchase or a sale of an asset at a specified date. Upon entering into such contracts, these investments require initial margin deposits with a counterparty, which consist of cash or cash equivalents. The amount of these deposits is determined by the exchange or Board of Trade on which the contract is traded and is subject to change. Accordingly, variation margin payments are received or made to reflect daily unrealized gains or losses which are recorded in the Statement of Operations. When the contracts are closed, the fund recognizes a realized gain or loss which is reflected in the Statement of Operations. There is minimal counterparty
45
NOTES TO FINANCIAL STATEMENTS(continued)
credit risk to the fund with futures since they are exchange traded, and the exchange guarantees the futures against default. At May 31, 2019, there were no futures outstanding.
The following summarizes the average market value of derivatives outstanding duringthe period ended May 31, 2019:
| | | |
| | Average Market Value ($) |
Interest rate futures | | 37,915 |
At May 31, 2019, the cost of investments for federal income tax purposes was $833,137,055; accordingly, accumulated net unrealized appreciation on investments was $51,174,545, consisting of $52,253,743 gross unrealized appreciation and $1,079,198 gross unrealized depreciation.
46
REPORT OF INDEPENDENT REGISTERED PUBLIC ACCOUNTING FIRM
To the Shareholders and the Board of Directors of BNY Mellon California AMT-Free Municipal Bond Fund, Inc. (formerly the Dreyfus California AMT-Free Municipal Bond Fund)
Opinion on the Financial Statements
We have audited the accompanying statement of assets and liabilities of BNY Mellon California AMT-Free Municipal Bond Fund, Inc. (the “Fund”) (formerly the Dreyfus California AMT-Free Municipal Bond Fund), including the statement of investments, as of May 31, 2019, and the related statement of operations for the year then ended, the statements of changes in net assets for each of the two years in the period then ended, the financial highlights for each of the five years in the period then ended and the related notes (collectively referred to as the “financial statements”). In our opinion, the financial statements present fairly, in all material respects, the financial position of the Fund at May 31, 2019, the results of its operations for the year then ended, the changes in its net assets for each of the two years in the period then ended and its financial highlights for each of the five years in the period then ended, in conformity with U.S. generally accepted accounting principles.
Basis for Opinion
These financial statements are the responsibility of the Fund’s management. Our responsibility is to express an opinion on the Fund’s financial statements based on our audits. We are a public accounting firm registered with the Public Company Accounting Oversight Board (United States) (“PCAOB”) and are required to be independent with respect to the Fund in accordance with the U.S. federal securities laws and the applicable rules and regulations of the Securities and Exchange Commission and the PCAOB.
We conducted our audits in accordance with the standards of the PCAOB. Those standards require that we plan and perform the audit to obtain reasonable assurance about whether the financial statements are free of material misstatement, whether due to error or fraud. The Fund is not required to have, nor were we engaged to perform, an audit of the Fund’s internal control over financial reporting. As part of our audits, we are required to obtain an understanding of internal control over financial reporting, but not for the purpose of expressing an opinion on the effectiveness of the Fund’s internal control over financial reporting. Accordingly, we express no such opinion.
Our audits included performing procedures to assess the risks of material misstatement of the financial statements, whether due to error or fraud, and performing procedures that respond to those risks. Such procedures included examining, on a test basis, evidence regarding the amounts and disclosures in the financial statements. Our procedures included confirmation of securities owned as of May 31, 2019, by correspondence with the custodian and others or by other appropriate auditing procedures where replies from others were not received. Our audits also included evaluating the accounting principles used and significant estimates made by management, as well as evaluating the overall presentation of the financial statements. We believe that our audits provide a reasonable basis for our opinion.

We have served as the auditor of one or more investment companies in the BNY Mellon Family of Funds since at least 1957, but we are unable to determine the specific year.
New York, New York
July 25, 2019
47
IMPORTANT TAX INFORMATION(Unaudited)
In accordance with federal tax law, the fund hereby reports all the dividends paid from investment income-net during the fiscal year ended May 31, 2019 as “exempt-interest dividends” (not subject to regular federal income tax, and for individuals who are California residents, California personal income taxes).
Where required by federal tax law rules, shareholders will receive notification of their portion of the fund’s taxable ordinary dividends (if any), capital gains distributions (if any) and tax-exempt dividends paid for the 2019 calendar year on Form 1099-DIV, which will be mailed in early 2020. Also, the fund hereby reports $.0020 per share as a short-term capital gain distribution and $.0607 per share as a long-term capital gain distribution paid on December 28, 2018.
48
BOARD MEMBERS INFORMATION(Unaudited)
INDEPENDENT BOARD MEMBERS
Joseph S. DiMartino (75)
Chairman of the Board (1995)
Principal Occupation During Past 5 Years:
· Corporate Director and Trustee (1995-present)
Other Public Company Board Memberships During Past 5 Years:
· CBIZ (formerly, Century Business Services, Inc.), a provider of outsourcing functions for small and medium size companies, Director (1997-present)
No. of Portfolios for which Board Member Serves:120
———————
Joni Evans (77)
Board Member (2006)
Principal Occupation During Past 5 Years:
· Chief Executive Officer, www.wowOwow.com, an online community dedicated to women’s conversations and publications (2007-present)
· Principal, Joni Evans Ltd. (publishing) (2006-present)
No. of Portfolios for which Board Member Serves:21
———————
Joan Gulley (71)
Board Member (2017)
Principal Occupation During Past 5 Years:
· PNC Financial Services Group, Inc.(1993-2014), Executive Vice President and Chief Human Resources Officer and Executive Committee Member (2008-2014)
No. of Portfolios for which Board Member Serves:51
———————
Ehud Houminer (78)
Board Member (1994)
Principal Occupation During Past 5 Years:
· Board of Overseers at the Columbia Business School, Columbia
University (1992-present)
Trustee, Ben Gurion University
No. of Portfolios for which Board Member Serves: 51
———————
49
BOARD MEMBERS INFORMATION (Unaudited) (continued)
INDEPENDENT BOARD MEMBERS (continued)
Alan H. Howard (59)
Board Member (2018)
Principal Occupation During Past 5 Years:
· Managing Partner of Heathcote Advisors LLC, a financial advisory services firm (2008 – present)
· President of Dynatech/MPX Holdings LLC (2012 – 2019), a global supplier and service provider of military aircraft parts, including Board Member of two operating subsidiaries, Dynatech International LLC and Military Parts Exchange LLC (2012-2019); Chief Executive Officer of an operating subsidiary, Dynatech International LLC (2013 – 2019)
· Senior Advisor, Rossoff & Co., an independent investment banking firm (2014 – present)
Other Public Company Board Memberships During Past 5 Years:
· Movado Group, a designer and manufacturer of watches, Director (1997-present)
No. of Portfolios for which Board Member Serves:21
———————
Robin A. Melvin (55)
Board Member (1995)
Principal Occupation During Past 5 Years:
· Co-chairman, Illinois Mentoring Partnership, non-profit organization dedicated to increasing the quantity and quality of mentoring services in Illinois; (2014-present; board member since 2013)
No. of Portfolios for which Board Member Serves:98
———————
Burton N. Wallack (68)
Board Member (2006)
Principal Occupation During Past 5 Years:
· President and Co-owner of Wallack Management Company, a real estate management company (1987-present)
Board member, Mount Sinai Hospital (2017-present)
No. of Portfolios for which Board Member Serves:21
———————
Benaree Pratt Wiley (73)
Board Member (2016)
Principal Occupation During Past 5 Years:
· Principal, The Wiley Group, a firm specializing in strategy and business development (2005-present)
Other Public Company Board Memberships During Past 5 Years:
· CBIZ (formerly, Century Business Services, Inc.), a provider of outsourcing functions for small and medium size companies, Director (2008-present)
No. of Portfolios for which Board Member Serves: 76
———————
50
INTERESTED BOARD MEMBER
Gordon J. Davis (77)
Board Member (2006)
Principal Occupation During Past 5 Years:
· Partner in the law firm of Venable LLP (2012-present)
Other Public Company Board Memberships During Past 5 Years:
· Consolidated Edison, Inc., a utility company, Director (1997-2014)
· The Phoenix Companies, Inc., a life insurance company, Director (2000-2014)
No. of Portfolios for which Board Member Serves:55
Gordon J. Davis is deemed to be an “interested person” (as defined under the Act) of the fund as a result of his affiliation with Venable LLP, which provides legal services to the fund.
———————
Once elected all Board Members serve for an indefinite term, but achieve Emeritus status upon reaching age 80. The address of the Board Members and Officers is c/o BNY Mellon Investment Adviser, Inc. 240 Greenwich Street, New York, New York 10166. Additional information about the Board Members is available in the fund’s Statement of Additional Information which can be obtained from the Adviser free of charge by calling this toll free number: 1-800-373-9387.
William Hodding Carter III, Emeritus Board Member
Hans C. Mautner, Emeritus Board Member
51
OFFICERS OF THE FUND(Unaudited)
RENEE LAROCHE-MORRIS, President since January 2018.
President and a director of BNY Mellon Investment Adviser, Inc. since January 2018. She is an officer of 62 investment companies (comprised of 120 portfolios) managed by the Adviser. She is 47 years old and has been an employee of BNY Mellon since 2003.
JAMES WINDELS, Treasurer since November 2001.
Director- BNY Mellon Fund Administration, and an officer of 63 investment companies (comprised of 143 portfolios) managed by the Adviser. He is 60 years old and has been an employee of the Adviser since April 1985.
BENNETT A. MACDOUGALL, Chief Legal Officer since October 2015.
Chief Legal Officer of the Adviser and Associate General Counsel and Managing Director of BNY Mellon since June 2015; Director and Associate General Counsel of Deutsche Bank – Asset & Wealth Management Division from June 2005 to June 2015, and as Chief Legal Officer of Deutsche Investment Management Americas Inc. from June 2012 to May 2015. He is an officer of 63 investment companies (comprised of 143 portfolios) managed by the Adviser. He is 47 years old and has been an employee of the Adviser since June 2015.
DAVID DIPETRILLO, Vice President since January 2018.
Head of North America Product, BNY Mellon Investment Management since January 2018, Director of Product Strategy, BNY Mellon Investment Management from January 2016 to December 2017; Head of US Retail Product and Channel Marketing, BNY Mellon Investment Management from January 2014 to December 2015. He is an officer of 62 investment companies (comprised of 120 portfolios) managed by the Adviser. He is 41 years old and has been an employee of BNY Mellon since 2005.
JAMES BITETTO, Vice President since August 2005 and Secretary since February 2018.
Managing Counsel of BNY Mellon and Secretary of the Adviser, and an officer of 63 investment companies (comprised of 143 portfolios) managed by the Adviser. He is 52 years old and has been an employee of the Adviser since December 1996.
SONALEE CROSS, Vice President and Assistant Secretary since March 2018.
Counsel of BNY Mellon since October 2016; Associate at Proskauer Rose LLP from April 2016 to September 2016; Attorney at EnTrust Capital from August 2015 to February 2016; Associate at Sidley Austin LLP from September 2013 to August 2015. She is an officer of 63 investment companies (comprised of 143 portfolios) managed by the Adviser. She is 31 years old and has been an employee of the Adviser since October 2016.
DEIRDRE CUNNANE, Vice President and Assistant Secretary since March 2019.
Counsel of BNY Mellon since August 2018; Senior Regulatory Specialist at BNY Mellon Investment Management Services from February 2016 to August 2018; Trustee Associate at BNY Mellon Trust Company (Ireland) Limited from August 2013 to February 2016. She is an officer of 63 investment companies (comprised of 143 portfolios) managed by the Adviser. She is 29 years old and has been an employee of the Adviser since August 2018.
SARAH S. KELLEHER, Vice President and Assistant Secretary since April 2014.
Managing Counsel of BNY Mellon since December 2017, Senior Counsel of BNY Mellon from March 2013 to December 2017. She is an officer of 63 investment companies (comprised of 143 portfolios) managed by the Adviser. She is 43 years old and has been an employee of the Adviser since March 2013.
JEFF PRUSNOFSKY, Vice President and Assistant Secretary since August 2005.
Senior Managing Counsel of BNY Mellon, and an officer of 63 investment companies (comprised of 143 portfolios) managed by the Adviser. He is 54 years old and has been an employee of the Adviser since October 1990.
PETER M. SULLIVAN, Vice President and Assistant Secretary since March 2019.
Managing Counsel of BNY Mellon, and an officer of 63 investment companies (comprised of 143 portfolios) managed by the Adviser. He is 51 years old and has been an employee of the Adviser since April 2004.
52
NATALYA ZELENSKY, Vice President and Assistant Secretary since March 2017.
Counsel of BNY Mellon since May 2016; Attorney at Wildermuth Endowment Strategy Fund/Wildermuth Advisory, LLC from November 2015 to May 2016 and Assistant General Counsel at RCS Advisory Services from July 2014 to November 2015. She is an officer of 63 investment companies (comprised of 143 portfolios) managed by the Adviser. She is 34 years old and has been an employee of the Adviser since May 2016.
GAVIN C. REILLY, Assistant Treasurer since December 2005.
Tax Manager - BNY Mellon Fund Administration, and an officer of 63 investment companies (comprised of 143 portfolios) managed by the Adviser. He is 50 years old and has been an employee of the Adviser since April 1991.
ROBERT S. ROBOL, Assistant Treasurer since August 2003.
Senior Accounting Manager- BNY Mellon Fund Administration, and an officer of 63 investment companies (comprised of 143 portfolios) managed by the Adviser. He is 55 years old and has been an employee of the Adviser since October 1988.
ROBERT SALVIOLO, Assistant Treasurer since July 2007.
Senior Accounting Manager – BNY Mellon Fund Administration, and an officer of 63 investment companies (comprised of 143 portfolios) managed by the Adviser. He is 52 years old and has been an employee of the Adviser since June 1989.
ROBERT SVAGNA, Assistant Treasurer since August 2005.
Senior Accounting Manager – BNY Mellon Fund Administration, and an officer of 63 investment companies (comprised of 143 portfolios) managed by the Adviser. He is 52 years old and has been an employee of the Adviser since November 1990.
JOSEPH W. CONNOLLY, Chief Compliance Officer since October 2004.
Chief Compliance Officer of the Adviser, the BNY Mellon Family of Funds and BNY Mellon Funds Trust (63 investment companies, comprised of 143 portfolios). He is 62 years old and has served in various capacities with the Adviser since 1980, including manager of the firm’s Fund Accounting Department from 1997 through October 2001.
CARIDAD M. CAROSELLA, Anti-Money Laundering Compliance Officer since January 2016.
Anti-Money Laundering Compliance Officer of the BNY Mellon Family of Funds and BNY Mellon Funds Trust since January 2016; from May 2015 to December 2015, Interim Anti-Money Laundering Compliance Officer of the BNY Mellon Family of Funds and BNY Mellon Funds Trust and the Distributor; from January 2012 to May 2015, AML Surveillance Officer of the Distributor. She is an officer of 57 investment companies (comprised of 137 portfolios) managed by the Adviser. She is 50 years old and has been an employee of the Distributor since 1997.
53
BNY Mellon California AMT-Free Municipal Bond Fund, Inc.
240 Greenwich Street
New York, NY 10286
Adviser
BNY Mellon Investment Adviser, Inc.
240 Greenwich Street
New York, NY 10286
Custodian
The Bank of New York Mellon
240 Greenwich Street
New York, NY 10286
Transfer Agent &
Dividend Disbursing Agent
BNY Mellon Transfer, Inc.
240 Greenwich Street
New York, NY 10286
Distributor
BNY Mellon Securities Corporation
240 Greenwich Street
New York, NY 10286
| | |
Ticker Symbols: | Class A: DCAAX Class C: DCACX Class I: DCMIX Class Y: DCAYX Class Z: DRCAX |
Telephone Call your financial representative or 1-800-373-9387
Mail The BNY Mellon Family of Funds, 144 Glenn Curtiss Boulevard, Uniondale, NY 11556-0144
E-mailSend your request toinfo@bnymellon.com
InternetInformation can be viewed online or downloaded atwww.bnymellonim.com/us
The fund files its complete schedule of portfolio holdings with the Securities and Exchange Commission (“SEC”) for the first and third quarters of each fiscal year on Form N-PORT. The fund’s Forms N-PORT are available on the SEC’s website atwww.sec.gov.
A description of the policies and procedures that the fund uses to determine how to vote proxies relating to portfolio securities and information regarding how the fund voted these proxies for the most recent 12-month period ended June 30 is available atwww.bnymellonim.com/us and on the SEC’s website atwww.sec.gov and without charge, upon request, by calling 1-800-373-9387.
| | |
© 2019 BNY Mellon Securities Corporation
6124AR0519 | 
|
Item 2. Code of Ethics.
The Registrant has adopted a code of ethics that applies to the Registrant's principal executive officer, principal financial officer, principal accounting officer or controller, or persons performing similar functions. There have been no amendments to, or waivers in connection with, the Code of Ethics during the period covered by this Report.
Item 3. Audit Committee Financial Expert.
The Registrant's Board has determined that Ehud Houminer, a member of the Audit Committee of the Board, is an audit committee financial expert as defined by the Securities and Exchange Commission (the "SEC”). Ehud Houminer is "independent" as defined by the SEC for purposes of audit committee financial expert determinations.
Item 4. Principal Accountant Fees and Services.
(a) Audit Fees. The aggregate fees billed for each of the last two fiscal years (the "Reporting Periods") for professional services rendered by the Registrant's principal accountant (the "Auditor") for the audit of the Registrant's annual financial statements or services that are normally provided by the Auditor in connection with the statutory and regulatory filings or engagements for the Reporting Periods, were $35,843 in 2018 and $38,470 in 2019.
(b) Audit-Related Fees. The aggregate fees billed in the Reporting Periods for assurance and related services by the Auditor that are reasonably related to the performance of the audit of the Registrant's financial statements and are not reported under paragraph (a) of this Item 4 were $9,789 in 2018 and $6,807 in 2019. These services consisted of one or more of the following: (i) agreed upon procedures related to compliance with Internal Revenue Code section 817(h), (ii) security counts required by Rule 17f-2 under the Investment Company Act of 1940, as amended, (iii) advisory services as to the accounting or disclosure treatment of Registrant transactions or events and (iv) advisory services to the accounting or disclosure treatment of the actual or potential impact to the Registrant of final or proposed rules, standards or interpretations by the Securities and Exchange Commission, the Financial Accounting Standards Boards or other regulatory or standard-setting bodies.
The aggregate fees billed in the Reporting Periods for non-audit assurance and related services by the Auditor to the Registrant's investment adviser (not including any sub-investment adviser whose role is primarily portfolio management and is subcontracted with or overseen by another investment adviser), and any entity controlling, controlled by or under common control with the investment adviser that provides ongoing services to the Registrant ("Service Affiliates"), that were reasonably related to the performance of the annual audit of the Service Affiliate, which required pre-approval by the Audit Committee were $0 in 2018 and $0 in 2019.
(c) Tax Fees. The aggregate fees billed in the Reporting Periods for professional services rendered by the Auditor for tax compliance, tax advice, and tax planning ("Tax Services") were $3,875 in 2018 and $3,458 in 2019. These services consisted of: (i) review or preparation of U.S. federal, state, local and excise tax returns; (ii) U.S. federal, state and local tax planning, advice and assistance regarding statutory, regulatory or administrative developments; (iii) tax advice regarding tax qualification matters and/or treatment of various financial instruments held or proposed to be acquired or held, and (iv) determination of Passive Foreign Investment Companies. The aggregate fees billed in the Reporting Periods for Tax Services by the Auditor to Service Affiliates, which required pre-approval by the Audit Committee were $0 in 2018 and $0 in 2019.
(d) All Other Fees. The aggregate fees billed in the Reporting Periods for products and services provided by the Auditor, other than the services reported in paragraphs (a) through (c) of this Item, were $1,854 in 2018 and $1,875 in 2019.
The aggregate fees billed in the Reporting Periods for Non-Audit Services by the Auditor to Service Affiliates, other than the services reported in paragraphs (b) through (c) of this Item, which required pre-approval by the Audit Committee, were $0 in 2018 and $0 in 2019.
(e)(1) Audit Committee Pre-Approval Policies and Procedures. The Registrant's Audit Committee has established policies and procedures (the "Policy") for pre-approval (within specified fee limits) of the Auditor's engagements for non-audit services to the Registrant and Service Affiliates without specific case-by-case consideration. The pre-approved services in the Policy can include pre-approved audit services, pre-approved audit-related services, pre-approved tax services and pre-approved all other services. Pre-approval considerations include whether the proposed services are compatible with maintaining the Auditor's independence. Pre-approvals pursuant to the Policy are considered annually.
(e)(2) Note. None of the services described in paragraphs (b) through (d) of this Item 4 were approved by the Audit Committee pursuant to paragraph (c)(7)(i)(C) of Rule 2-01 of Regulation S-X.
(f) None of the hours expended on the principal accountant's engagement to audit the registrant's financial statements for the most recent fiscal year were attributed to work performed by persons other than the principal account's full-time, permanent employees.
Non-Audit Fees. The aggregate non-audit fees billed by the Auditor for services rendered to the Registrant, and rendered to Service Affiliates, for the Reporting Periods were $20,678,286 in 2018 and $28,630,247 in 2019.
Auditor Independence. The Registrant's Audit Committee has considered whether the provision of non-audit services that were rendered to Service Affiliates, which were not pre-approved (not requiring pre-approval), is compatible with maintaining the Auditor's independence.
Item 5. Audit Committee of Listed Registrants.
Not applicable.
Item 6. Investments.
(a) Not applicable.
Item 7. Disclosure of Proxy Voting Policies and Procedures for Closed-End Management Investment Companies.
Not applicable.
Item 8. Portfolio Managers of Closed-End Management Investment Companies.
Not applicable.
Item 9. Purchases of Equity Securities by Closed-End Management Investment Companies and Affiliated Purchasers.
Not applicable.
Item 10. Submission of Matters to a Vote of Security Holders.
There have been no material changes to the procedures applicable to Item 10.
Item 11. Controls and Procedures.
(a) The Registrant's principal executive and principal financial officers have concluded, based on their evaluation of the Registrant's disclosure controls and procedures as of a date within 90 days of the filing date of this report, that the Registrant's disclosure controls and procedures are reasonably designed to ensure that information required to be disclosed by the Registrant on Form N-CSR is recorded, processed, summarized and reported within the required time periods and that information required to be disclosed by the Registrant in the reports that it files or submits on Form N-CSR is accumulated and communicated to the Registrant's management, including its principal executive and principal financial officers, as appropriate to allow timely decisions regarding required disclosure.
(b) There were no changes to the Registrant's internal control over financial reporting that occurred during the second fiscal quarter of the period covered by this report that have materially affected, or are reasonably likely to materially affect, the Registrant's internal control over financial reporting.
Item 12. Disclosure of Securities Lending Activities for Closed-End Management Investment Companies.
Not applicable.
Item 13. Exhibits.
(a)(1) Code of ethics referred to in Item 2.
(a)(2) Certifications of principal executive and principal financial officers as required by Rule 30a-2(a) under the Investment Company Act of 1940.
(a)(3) Not applicable.
(b) Certification of principal executive and principal financial officers as required by Rule 30a-2(b) under the Investment Company Act of 1940.
SIGNATURES
Pursuant to the requirements of the Securities Exchange Act of 1934 and the Investment Company Act of 1940, the Registrant has duly caused this Report to be signed on its behalf by the undersigned, thereunto duly authorized.
BNY Mellon California AMT-Free Municipal Bond Fund, Inc.
By: /s/ Renee LaRoche-Morris
Renee LaRoche-Morris
President (Principal Executive Officer)
Date: July 26, 2019
Pursuant to the requirements of the Securities Exchange Act of 1934 and the Investment Company Act of 1940, this Report has been signed below by the following persons on behalf of the Registrant and in the capacities and on the dates indicated.
By: /s/ Renee LaRoche-Morris
Renee LaRoche-Morris
President (Principal Executive Officer)
Date: July 26, 2019
By: /s/ James Windels
James Windels
Treasurer (Principal Financial Officer)
Date: July 26, 2019
EXHIBIT INDEX
(a)(1) Code of ethics referred to in Item 2.
(a)(2) Certifications of principal executive and principal financial officers as required by Rule 30a-2(a) under the Investment Company Act of 1940. (EX-99.CERT)
(b) Certification of principal executive and principal financial officers as required by Rule 30a-2(b) under the Investment Company Act of 1940. (EX-99.906CERT)
