UNITED STATES
SECURITIES AND EXCHANGE COMMISSION
Washington, D.C. 20549
FORM N-CSR
CERTIFIED SHAREHOLDER REPORT OF REGISTERED MANAGEMENT INVESTMENT COMPANIES
Investment Company Act file number
(Exact name of registrant as specified in charter)
680 Washington Boulevard, Suite 500, Stamford, Connecticut 06901
(Address of principal executive offices) (Zip code)
AMG Funds LLC
680 Washington Boulevard, Suite 500, Stamford, Connecticut 06901
(Name and address of agent for service)
Registrant's telephone number, including area code:
Date of reporting period:
January 01, 2024 - June 30, 2024
(Semi-Annual Shareholder Report)
Item 1. Reports to Shareholders
(a)
AMG GW&K ESG Bond Fund
Class N/MGFIX
SEMI-ANNUAL SHAREHOLDER REPORT | June 30, 2024
This semi-annual shareholder report contains important information about AMG GW&K ESG Bond Fund (the “Fund”) for the period of January 1, 2024 to June 30, 2024. You can find additional information about the Fund at https://wealth.amg.com/resources/order-literature. You can also request this information by contacting us at 800-548-4539.
Fund Expenses
What were the Fund costs for the last six months?
(Based on a hypothetical $10,000 investment)
| Fund (Class) | Costs of a $10,000 investment | Costs paid as a percentage of a $10,000 investment |
AMG GW&K ESG Bond Fund
(Class N/MGFIX) | $34 | 0.68% |
Key Fund Statistics (as of June 30, 2024)
| Fund net assets | $397,878,366% |
| Total number of portfolio holdings | $149% |
| Net advisory fees paid | $406,227% |
| Portfolio turnover rate as of the end of the reporting period | $18% |
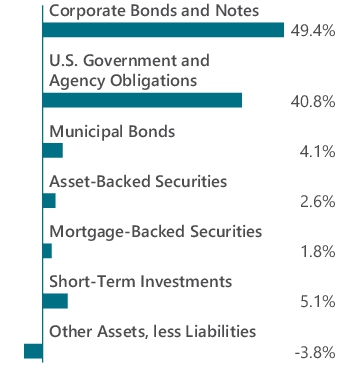
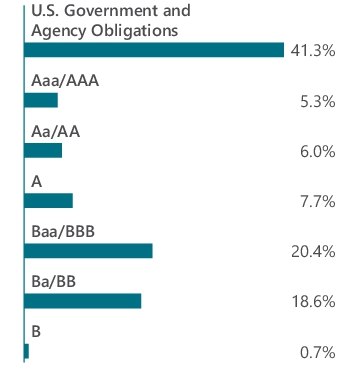
Graphical Representation of Holdings (as of June 30, 2024)
Top ten holdings and portfolio breakdown are shown as a percentage of net assets of the Fund and ratings are shown as a percentage of total long-term investments of the Fund.
| FHLMC, 3.000%, 04/01/51 | 3.2% |
| U.S. Treasury Bonds, 2.250%, 05/15/41 | 3.0% |
| FNMA, 3.500%, 08/01/49 | 2.2% |
| U.S. Treasury Bonds, 1.875%, 02/15/51 | 2.2% |
| U.S. Treasury Bonds, 3.125%, 05/15/48 | 2.2% |
| FNMA, 3.500%, 02/01/35 | 2.1% |
| FNMA, 3.500%, 02/01/47 | 1.8% |
| FHLMC, 3.500%, 02/01/50 | 1.8% |
| FHLMC, 4.500%, 12/01/48 | 1.7% |
| FNMA, 4.000%, 06/01/48 | 1.7% |
| Top Ten as a Group | 21.9% |
Availability of Additional Information
You can find additional information about the Fund such as the prospectus, financial information, fund holdings and proxy voting information at https://wealth.amg.com/resources/order-literature. You can also request this information by contacting us at 800.548.4539.
Householding
In order to reduce expenses, we will deliver a single copy of prospectuses, proxies, financial reports and other communication to shareholders with the same residential address, provided they have the same last name or we reasonably believe them to be members of the same family. Unless we are notified otherwise, we will continue to send recipients only one copy of these materials for as long as they remain a shareholder of the Fund. If you would like to receive individual mailings, please call 800.548.4539 and we will begin sending you separate copies of these materials within 30 days after receiving your request.
For additional information, please navigate to the additional material at https://wealth.amg.com/resources/order-literature.
AMG GW&K ESG Bond Fund
Class I/MGBIX
SEMI-ANNUAL SHAREHOLDER REPORT | June 30, 2024
This semi-annual shareholder report contains important information about AMG GW&K ESG Bond Fund (the “Fund”) for the period of January 1, 2024 to June 30, 2024. You can find additional information about the Fund at https://wealth.amg.com/resources/order-literature. You can also request this information by contacting us at 800-548-4539.
Fund Expenses
What were the Fund costs for the last six months?
(Based on a hypothetical $10,000 investment)
| Fund (Class) | Costs of a $10,000 investment | Costs paid as a percentage of a $10,000 investment |
AMG GW&K ESG Bond Fund
(Class I/MGBIX) | $24 | 0.48% |
Key Fund Statistics (as of June 30, 2024)
| Fund net assets | $397,878,366% |
| Total number of portfolio holdings | $149% |
| Net advisory fees paid | $406,227% |
| Portfolio turnover rate as of the end of the reporting period | $18% |
Graphical Representation of Holdings (as of June 30, 2024)
Top ten holdings and portfolio breakdown are shown as a percentage of net assets of the Fund and ratings are shown as a percentage of total long-term investments of the Fund.
| FHLMC, 3.000%, 04/01/51 | 3.2% |
| U.S. Treasury Bonds, 2.250%, 05/15/41 | 3.0% |
| FNMA, 3.500%, 08/01/49 | 2.2% |
| U.S. Treasury Bonds, 1.875%, 02/15/51 | 2.2% |
| U.S. Treasury Bonds, 3.125%, 05/15/48 | 2.2% |
| FNMA, 3.500%, 02/01/35 | 2.1% |
| FNMA, 3.500%, 02/01/47 | 1.8% |
| FHLMC, 3.500%, 02/01/50 | 1.8% |
| FHLMC, 4.500%, 12/01/48 | 1.7% |
| FNMA, 4.000%, 06/01/48 | 1.7% |
| Top Ten as a Group | 21.9% |
Availability of Additional Information
You can find additional information about the Fund such as the prospectus, financial information, fund holdings and proxy voting information at https://wealth.amg.com/resources/order-literature. You can also request this information by contacting us at 800.548.4539.
Householding
In order to reduce expenses, we will deliver a single copy of prospectuses, proxies, financial reports and other communication to shareholders with the same residential address, provided they have the same last name or we reasonably believe them to be members of the same family. Unless we are notified otherwise, we will continue to send recipients only one copy of these materials for as long as they remain a shareholder of the Fund. If you would like to receive individual mailings, please call 800.548.4539 and we will begin sending you separate copies of these materials within 30 days after receiving your request.
For additional information, please navigate to the additional material at https://wealth.amg.com/resources/order-literature.
AMG GW&K High Income Fund
Class N/MGGBX
SEMI-ANNUAL SHAREHOLDER REPORT | June 30, 2024
This semi-annual shareholder report contains important information about AMG GW&K High Income Fund (the “Fund”) for the period of January 1, 2024 to June 30, 2024. You can find additional information about the Fund at https://wealth.amg.com/resources/order-literature. You can also request this information by contacting us at 800-548-4539.
This report describes changes to the Fund that occurred during the reporting period.
Fund Expenses
What were the Fund costs for the last six months?
(Based on a hypothetical $10,000 investment)
| Fund (Class) | Costs of a $10,000 investment | Costs paid as a percentage of a $10,000 investment |
AMG GW&K High Income Fund
(Class N/MGGBX) | $41 | 0.82% |
Key Fund Statistics (as of June 30, 2024)
| Fund net assets | $6,686,315% |
| Total number of portfolio holdings | $1% |
| Net advisory fees paid | $0% |
| Portfolio turnover rate as of the end of the reporting period | $25% |
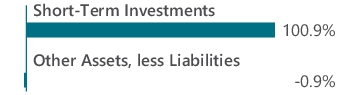
Graphical Representation of Holdings (as of June 30, 2024)
Top ten holdings and portfolio breakdown are shown as a percentage of net assets of the Fund.
| Dreyfus Institutional Preferred Government Money Market Fund, Institutional Shares, 5.270% | 100.9% |
| Top Ten as a Group | 100.9% |
Recent Fund Changes
This is a summary of certain changes to the Fund since January 1, 2024. For more complete information, you may review the Fund's prospectus at https://wealth.amg.com/resources/order-literature. The Fund's prospectus is also available without charge by calling 800.548.4539 or by sending an e-mail request to shareholderservices@amg.com.
The Board of Trustees of AMG Funds III has approved a plan to liquidate and terminate the Fund (the "Liquidation"), which is expected to occur on or about September 11, 2024 (the "Liquidation Date"). In conjunction with the Liquidation, the Fund sold its portfolio investments and invested the proceeds in cash and cash equivalents. Effective June 14, 2024, the Fund discontinued accruing 12b-1 Distribution fees through the Liquidation Date, and effective June 17, 2024, and through the Liquidation Date, the Investment Manager waived its management fee and will waive the right to recoup any prior reimbursed expenses under the Fund's Expense Limitation Agreement. Since immediately following the close of business on June 13, 2024, the Fund no longer accepts investments, except for investments made through existing asset allocation programs investing in the Fund, and shares purchased pursuant to automatic investment programs, such as automatic investments through 401(k) plans and reinvestments of any dividends and distributions.
Availability of Additional Information
You can find additional information about the Fund such as the prospectus, financial information, fund holdings and proxy voting information at https://wealth.amg.com/resources/order-literature. You can also request this information by contacting us at 800.548.4539.
Householding
In order to reduce expenses, we will deliver a single copy of prospectuses, proxies, financial reports and other communication to shareholders with the same residential address, provided they have the same last name or we reasonably believe them to be members of the same family. Unless we are notified otherwise, we will continue to send recipients only one copy of these materials for as long as they remain a shareholder of the Fund. If you would like to receive individual mailings, please call 800.548.4539 and we will begin sending you separate copies of these materials within 30 days after receiving your request.
For additional information, please navigate to the additional material at https://wealth.amg.com/resources/order-literature.
AMG GW&K High Income Fund
Class I/GWHIX
SEMI-ANNUAL SHAREHOLDER REPORT | June 30, 2024
This semi-annual shareholder report contains important information about AMG GW&K High Income Fund (the “Fund”) for the period of January 1, 2024 to June 30, 2024. You can find additional information about the Fund at https://wealth.amg.com/resources/order-literature. You can also request this information by contacting us at 800-548-4539.
This report describes changes to the Fund that occurred during the reporting period.
Fund Expenses
What were the Fund costs for the last six months?
(Based on a hypothetical $10,000 investment)
| Fund (Class) | Costs of a $10,000 investment | Costs paid as a percentage of a $10,000 investment |
AMG GW&K High Income Fund
(Class I/GWHIX) | $31 | 0.62% |
Key Fund Statistics (as of June 30, 2024)
| Fund net assets | $6,686,315% |
| Total number of portfolio holdings | $1% |
| Net advisory fees paid | $0% |
| Portfolio turnover rate as of the end of the reporting period | $25% |
Graphical Representation of Holdings (as of June 30, 2024)
Top ten holdings and portfolio breakdown are shown as a percentage of net assets of the Fund.
| Dreyfus Institutional Preferred Government Money Market Fund, Institutional Shares, 5.270% | 100.9% |
| Top Ten as a Group | 100.9% |
Recent Fund Changes
This is a summary of certain changes to the Fund since January 1, 2024. For more complete information, you may review the Fund's prospectus at https://wealth.amg.com/resources/order-literature. The Fund's prospectus is also available without charge by calling 800.548.4539 or by sending an e-mail request to shareholderservices@amg.com.
The Board of Trustees of AMG Funds III has approved a plan to liquidate and terminate the Fund (the "Liquidation"), which is expected to occur on or about September 11, 2024 (the "Liquidation Date"). In conjunction with the Liquidation, the Fund sold its portfolio investments and invested the proceeds in cash and cash equivalents. Effective June 14, 2024, the Fund discontinued accruing 12b-1 Distribution fees through the Liquidation Date, and effective June 17, 2024, and through the Liquidation Date, the Investment Manager waived its management fee and will waive the right to recoup any prior reimbursed expenses under the Fund's Expense Limitation Agreement. Since immediately following the close of business on June 13, 2024, the Fund no longer accepts investments, except for investments made through existing asset allocation programs investing in the Fund, and shares purchased pursuant to automatic investment programs, such as automatic investments through 401(k) plans and reinvestments of any dividends and distributions.
Availability of Additional Information
You can find additional information about the Fund such as the prospectus, financial information, fund holdings and proxy voting information at https://wealth.amg.com/resources/order-literature. You can also request this information by contacting us at 800.548.4539.
Householding
In order to reduce expenses, we will deliver a single copy of prospectuses, proxies, financial reports and other communication to shareholders with the same residential address, provided they have the same last name or we reasonably believe them to be members of the same family. Unless we are notified otherwise, we will continue to send recipients only one copy of these materials for as long as they remain a shareholder of the Fund. If you would like to receive individual mailings, please call 800.548.4539 and we will begin sending you separate copies of these materials within 30 days after receiving your request.
For additional information, please navigate to the additional material at https://wealth.amg.com/resources/order-literature.
AMG Veritas Asia Pacific Fund
Class N/MGSEX
SEMI-ANNUAL SHAREHOLDER REPORT | June 30, 2024
This semi-annual shareholder report contains important information about AMG Veritas Asia Pacific Fund (the “Fund”) for the period of January 1, 2024 to June 30, 2024. You can find additional information about the Fund at https://wealth.amg.com/resources/order-literature. You can also request this information by contacting us at 800-548-4539.
Fund Expenses
What were the Fund costs for the last six months?
(Based on a hypothetical $10,000 investment)
| Fund (Class) | Costs of a $10,000 investment | Costs paid as a percentage of a $10,000 investment |
AMG Veritas Asia Pacific Fund
(Class N/MGSEX) | $61 | 1.17% |
Key Fund Statistics (as of June 30, 2024)
| Fund net assets | $88,229,688% |
| Total number of portfolio holdings | $46% |
| Net advisory fees paid | $228,065% |
| Portfolio turnover rate as of the end of the reporting period | $39% |
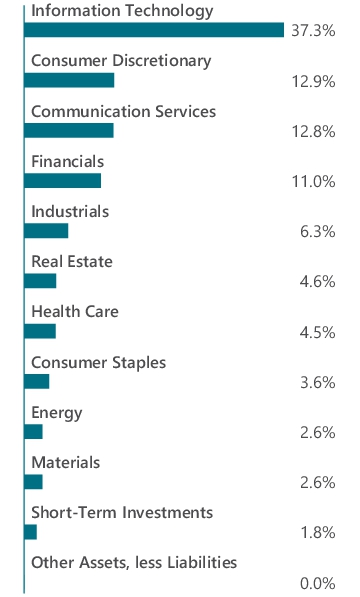
Graphical Representation of Holdings (as of June 30, 2024)
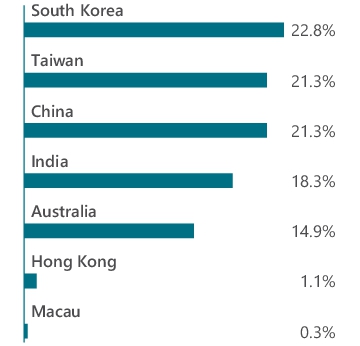
Top ten holdings and portfolio breakdown are shown as a percentage of net assets of the Fund and country allocation is shown as a percentage of total long-term investments of the Fund.
| Taiwan Semiconductor Manufacturing Co., Ltd. (Taiwan) | 17.0% |
| Tencent Holdings, Ltd. (China) | 7.8% |
| Samsung Electronics Co., Ltd. (South Korea) | 7.8% |
| Alibaba Group Holding, Ltd. (China) | 6.1% |
| Goodman Group (Australia) | 4.6% |
| HDFC Bank, Ltd., ADR (India) | 4.1% |
| SK Hynix, Inc. (South Korea) | 4.0% |
| REA Group, Ltd. (Australia) | 3.6% |
| Aristocrat Leisure, Ltd. (Australia) | 3.3% |
| Hanwha Aerospace Co., Ltd. (South Korea) | 2.6% |
| Top Ten as a Group | 60.9% |
Availability of Additional Information
You can find additional information about the Fund such as the prospectus, financial information, fund holdings and proxy voting information at https://wealth.amg.com/resources/order-literature. You can also request this information by contacting us at 800.548.4539.
Householding
In order to reduce expenses, we will deliver a single copy of prospectuses, proxies, financial reports and other communication to shareholders with the same residential address, provided they have the same last name or we reasonably believe them to be members of the same family. Unless we are notified otherwise, we will continue to send recipients only one copy of these materials for as long as they remain a shareholder of the Fund. If you would like to receive individual mailings, please call 800.548.4539 and we will begin sending you separate copies of these materials within 30 days after receiving your request.
For additional information, please navigate to the additional material at https://wealth.amg.com/resources/order-literature.
AMG Veritas Asia Pacific Fund
Class I/MSEIX
SEMI-ANNUAL SHAREHOLDER REPORT | June 30, 2024
This semi-annual shareholder report contains important information about AMG Veritas Asia Pacific Fund (the “Fund”) for the period of January 1, 2024 to June 30, 2024. You can find additional information about the Fund at https://wealth.amg.com/resources/order-literature. You can also request this information by contacting us at 800-548-4539.
Fund Expenses
What were the Fund costs for the last six months?
(Based on a hypothetical $10,000 investment)
| Fund (Class) | Costs of a $10,000 investment | Costs paid as a percentage of a $10,000 investment |
AMG Veritas Asia Pacific Fund
(Class I/MSEIX) | $48 | 0.93% |
Key Fund Statistics (as of June 30, 2024)
| Fund net assets | $88,229,688% |
| Total number of portfolio holdings | $46% |
| Net advisory fees paid | $228,065% |
| Portfolio turnover rate as of the end of the reporting period | $39% |
Graphical Representation of Holdings (as of June 30, 2024)
Top ten holdings and portfolio breakdown are shown as a percentage of net assets of the Fund and country allocation is shown as a percentage of total long-term investments of the Fund.
| Taiwan Semiconductor Manufacturing Co., Ltd. (Taiwan) | 17.0% |
| Tencent Holdings, Ltd. (China) | 7.8% |
| Samsung Electronics Co., Ltd. (South Korea) | 7.8% |
| Alibaba Group Holding, Ltd. (China) | 6.1% |
| Goodman Group (Australia) | 4.6% |
| HDFC Bank, Ltd., ADR (India) | 4.1% |
| SK Hynix, Inc. (South Korea) | 4.0% |
| REA Group, Ltd. (Australia) | 3.6% |
| Aristocrat Leisure, Ltd. (Australia) | 3.3% |
| Hanwha Aerospace Co., Ltd. (South Korea) | 2.6% |
| Top Ten as a Group | 60.9% |
Availability of Additional Information
You can find additional information about the Fund such as the prospectus, financial information, fund holdings and proxy voting information at https://wealth.amg.com/resources/order-literature. You can also request this information by contacting us at 800.548.4539.
Householding
In order to reduce expenses, we will deliver a single copy of prospectuses, proxies, financial reports and other communication to shareholders with the same residential address, provided they have the same last name or we reasonably believe them to be members of the same family. Unless we are notified otherwise, we will continue to send recipients only one copy of these materials for as long as they remain a shareholder of the Fund. If you would like to receive individual mailings, please call 800.548.4539 and we will begin sending you separate copies of these materials within 30 days after receiving your request.
For additional information, please navigate to the additional material at https://wealth.amg.com/resources/order-literature.
(b) Not applicable.
Item 2. CODE OF ETHICS
Not required in this filing.
Item 3. AUDIT COMMITTEE FINANCIAL EXPERT
Not required in this filing.
Item 4. PRINCIPAL ACCOUNTANT FEES AND SERVICES
Not required in this filing.
Item 5. AUDIT COMMITTEE OF LISTED REGISTRANTS
Not applicable.
Item 6. INVESTMENTS
The schedule of investments in securities of unaffiliated issuers as of the close of the reporting period is included in the financial statements filed under Item 7 hereof.
Item 7. FINANCIAL STATEMENTS AND FINANCIAL HIGHLIGHTS FOR OPEN-END MANAGEMENT INVESTMENT COMPANIES.
| | |
 | | SEMI-ANNUAL REPORT |
| | | | | | |
| | | | AMG Funds June 30, 2024 
AMG Veritas Asia Pacific Fund |
| | | |
| | | | | Class N: MGSEX | Class I: MSEIX |
| | | | |
| | | | | | | |
| | | | |
| | |
| wealth.amg.com | | | | 063024 SAR078 |
| | |
| | | AMG Funds Semi-Annual Report — June 30, 2024 (unaudited) |
Nothing contained herein is to be considered an offer, sale or solicitation of an offer to buy shares of any series of the AMG Funds Family of Funds. Such offering is made only by prospectus, which includes details as to offering price and other material information.
| | |
| | | AMG Veritas Asia Pacific Fund Schedule of Portfolio Investments (unaudited) June 30, 2024 |
| | | | | | | | |
| | | Shares | | | Value | |
| | |
Common Stocks - 92.4% | | | | | | | | |
| | |
Communication Services - 12.8% | | | | | | | | |
| | |
NetEase, Inc. (China) | | | 60,000 | | | | $1,145,755 | |
| | |
REA Group, Ltd. (Australia) | | | 24,684 | | | | 3,223,107 | |
| | |
Tencent Holdings, Ltd. (China) | | | 145,939 | | | | 6,923,394 | |
| | |
Total Communication Services | | | | | | | 11,292,256 | |
| | |
Consumer Discretionary - 11.3% | | | | | | | | |
| | |
Alibaba Group Holding, Ltd. (China) | | | 595,250 | | | | 5,364,893 | |
| | |
Aristocrat Leisure, Ltd. (Australia) | | | 86,802 | | | | 2,874,495 | |
| | |
Li Auto, Inc., Class A (China)* | | | 25,000 | | | | 223,887 | |
| | |
Sands China, Ltd. (Macau)* | | | 142,100 | | | | 295,469 | |
| | |
Zomato, Ltd. (India)* | | | 510,263 | | | | 1,224,514 | |
| | |
Total Consumer Discretionary | | | | | | | 9,983,258 | |
| | |
Consumer Staples - 3.6% | | | | | | | | |
| | |
Kweichow Moutai Co., Ltd., Class A (China) | | | 4,000 | | | | 805,928 | |
| | |
Nestle India, Ltd. (India) | | | 29,350 | | | | 897,236 | |
| | |
Varun Beverages, Ltd. (India) | | | 74,582 | | | | 1,454,552 | |
| | |
Total Consumer Staples | | | | | | | 3,157,716 | |
| | |
Energy - 1.0% | | | | | | | | |
| | |
Reliance Industries, Ltd. (India) | | | 23,200 | | | | 869,690 | |
| | |
Financials - 11.0% | | | | | | | | |
| | |
HDFC Bank, Ltd., ADR (India) | | | 55,817 | | | | 3,590,708 | |
| | |
Hong Kong Exchanges & Clearing, Ltd. (Hong Kong) | | | 31,150 | | | | 996,898 | |
| | |
ICICI Bank, Ltd., Sponsored ADR (India) | | | 15,424 | | | | 444,366 | |
| | |
KB Financial Group, Inc. (South Korea) | | | 38,326 | | | | 2,179,988 | |
| | |
Samsung Fire & Marine Insurance Co., Ltd. (South Korea) | | | 4,574 | | | | 1,286,612 | |
| | |
Samsung Life Insurance Co., Ltd. (South Korea) | | | 19,498 | | | | 1,247,104 | |
| | |
Total Financials | | | | | | | 9,745,676 | |
| | |
Health Care - 3.5% | | | | | | | | |
| | |
CSL, Ltd. (Australia) | | | 5,938 | | | | 1,164,425 | |
| | |
CSPC Pharmaceutical Group, Ltd. (China) | | | 818,000 | | | | 651,447 | |
| | |
Innovent Biologics, Inc. (China)*,1 | | | 100,000 | | | | 470,717 | |
| | |
Shenzhen Mindray Bio-Medical Electronics Co., Ltd., Class A (China) | | | 19,700 | | | | 788,164 | |
| | |
Total Health Care | | | | | | | 3,074,753 | |
| | |
Industrials - 6.3% | | | | | | | | |
| | |
Contemporary Amperex Technology Co., Ltd., Class A (China) | | | 39,900 | | | | 988,382 | |
| | |
Hanwha Aerospace Co., Ltd. (South Korea) | | | 12,722 | | | | 2,294,391 | |
| | |
Samsung C&T Corp. (South Korea) | | | 11,897 | | | | 1,220,931 | |
| | | | | | | | |
| | | Shares | | | Value | |
| | |
Shenzhen Inovance Technology Co., Ltd., Class A (China) | | | 149,500 | | | | $1,054,280 | |
| | |
Total Industrials | | | | | | | 5,557,984 | |
| | |
Information Technology - 35.7% | | | | | | | | |
| | |
ASMedia Technology, Inc. (Taiwan) | | | 6,000 | | | | 412,332 | |
| | |
ASPEED Technology, Inc. (Taiwan) | | | 3,000 | | | | 445,172 | |
| | |
Chroma ATE, Inc. (Taiwan) | | | 81,000 | | | | 791,991 | |
| | |
Delta Electronics, Inc. (Taiwan) | | | 44,000 | | | | 524,810 | |
| | |
Hon Hai Precision Industry Co., Ltd. (Taiwan) | | | 195,000 | | | | 1,283,865 | |
| | |
Infosys, Ltd., Sponsored ADR (India)2 | | | 120,000 | | | | 2,234,400 | |
| | |
Samsung Electronics Co., Ltd. (South Korea) | | | 116,495 | | | | 6,856,176 | |
| | |
Samsung SDI Co., Ltd. (South Korea) | | | 1,700 | | | | 434,096 | |
| | |
SK Hynix, Inc. (South Korea)* | | | 20,750 | | | | 3,521,454 | |
| | |
Taiwan Semiconductor Manufacturing Co., Ltd. (Taiwan) | | | 506,400 | | | | 15,003,429 | |
| | |
Total Information Technology | | | | | | | 31,507,725 | |
| | |
Materials - 2.6% | | | | | | | | |
| | |
LG Chem, Ltd. (South Korea) | | | 2,957 | | | | 736,869 | |
| | |
Rio Tinto, Ltd. (Australia) | | | 19,500 | | | | 1,544,632 | |
| | |
Total Materials | | | | | | | 2,281,501 | |
| | |
Real Estate - 4.6% | | | | | | | | |
| | |
Goodman Group, REIT (Australia) | | | 176,341 | | | | 4,068,168 | |
| | |
Total Common Stocks
(Cost $75,845,336) | | | | | | | 81,538,727 | |
| | |
Participation Notes - 5.8% | | | | | | | | |
| | |
Consumer Discretionary - 1.6% | | | | | | | | |
| | |
Zomato, Ltd. (CLSA Ltd.), 07/22/26 (India) | | | 579,936 | | | | 1,391,713 | |
| | |
Energy - 1.6% | | | | | | | | |
| | |
Reliance Industries Ltd. (CLSA Ltd.), 06/30/25 (India) | | | 36,895 | | | | 1,383,069 | |
| | |
Health Care - 1.0% | | | | | | | | |
| | |
Apollo Hospitals Enterprise, Ltd. (CLSA Ltd.), 06/30/27 (India) | | | 12,580 | | | | 931,475 | |
| | |
Information Technology - 1.6% | | | | | | | | |
| | |
Tata Consultancy Services, Ltd. (CLSA Ltd.), 02/25/25 (India) | | | 30,365 | | | | 1,418,448 | |
| | |
Total Participation Notes
(Cost $4,007,828) | | | | | | | 5,124,705 | |
The accompanying notes are an integral part of these financial statements.
2
| | |
| | | AMG Veritas Asia Pacific Fund Schedule of Portfolio Investments (continued) |
| | | |
| | | |
| | | | | | | | |
| | | Principal
Amount | | | Value | |
| | |
Short-Term Investments - 1.8% | | | | | | | | |
| |
Joint Repurchase Agreements - 1.1%3 | | | | | |
| | |
Bethesda Securities LLC, dated 06/28/24, due 07/01/24, 5.450% total to be received $951,616 (collateralized by various U.S. Government Agency Obligations, 2.500% - 6.070%, 10/01/27 - 01/01/57, totaling $970,208) | | | $951,184 | | | | $951,184 | |
| | |
| | | Shares | | | | |
| |
Other Investment Companies - 0.7% | | | | | |
| | |
Dreyfus Government Cash Management Fund, Institutional Shares, 5.19%4 | | | 256,535 | | | | 256,535 | |
| | | | | | | | |
| | | Shares | | | Value | |
| | |
Dreyfus Institutional Preferred Government Money Market Fund, Institutional Shares, 5.27%4 | | | 384,802 | | | | $384,802 | |
| | |
Total Other Investment Companies | | | | | | | 641,337 | |
| | |
Total Short-Term Investments
(Cost $1,592,521) | | | | | | | 1,592,521 | |
| | |
Total Investments - 100.0%
(Cost $81,445,685) | | | | | | | 88,255,953 | |
| | |
Other Assets, less Liabilities - (0.0)%# | | | | | | | (26,265 | ) |
| | |
Net Assets - 100.0% | | | | | | | $88,229,688 | |
| | | | | | | | |
| * | Non-income producing security. |
| 1 | Security exempt from registration under Rule 144A of the Securities Act of 1933. This security may be resold in transactions exempt from registration, normally to qualified institutional buyers. At June 30, 2024, the value of this security amounted to $470,717 or 0.5% of net assets. |
| 2 | Some of this security, amounting to $2,212,056 or 2.5% of net assets, was out on loan to various borrowers and are collateralized by cash and various U.S. Treasury Obligations. See Note 4 of Notes to Financial Statements. |
| 3 | Cash collateral received for securities lending activity was invested in these joint repurchase agreements. |
| 4 | Yield shown represents the June 30, 2024, seven day average yield, which refers to the sum of the previous seven days’ dividends paid, expressed as an annual percentage. |
ADR American Depositary Receipt
REIT Real Estate Investment Trust
The accompanying notes are an integral part of these financial statements.
3
| | |
| | | AMG Veritas Asia Pacific Fund Schedule of Portfolio Investments (continued) |
| | | |
| | | |
The following table summarizes the inputs used to value the Fund’s investments by the fair value hierarchy levels as of June 30, 2024:
| | | | | | | | | | | | | | | | |
| | | Level 1 | | | Level 21 | | | Level 3 | | | Total | |
Investments in Securities | | | | | | | | | | | | | | | | |
| | | | |
Common Stocks | | | | | | | | | | | | | | | | |
| | | | |
Information Technology | | | $2,234,400 | | | | $29,273,325 | | | | — | | | | $31,507,725 | |
| | | | |
Communication Services | | | — | | | | 11,292,256 | | | | — | | | | 11,292,256 | |
| | | | |
Consumer Discretionary | | | — | | | | 9,983,258 | | | | — | | | | 9,983,258 | |
| | | | |
Financials | | | 4,035,074 | | | | 5,710,602 | | | | — | | | | 9,745,676 | |
| | | | |
Industrials | | | — | | | | 5,557,984 | | | | — | | | | 5,557,984 | |
| | | | |
Real Estate | | | — | | | | 4,068,168 | | | | — | | | | 4,068,168 | |
| | | | |
Consumer Staples | | | — | | | | 3,157,716 | | | | — | | | | 3,157,716 | |
| | | | |
Health Care | | | — | | | | 3,074,753 | | | | — | | | | 3,074,753 | |
| | | | |
Materials | | | — | | | | 2,281,501 | | | | — | | | | 2,281,501 | |
| | | | |
Energy | | | — | | | | 869,690 | | | | — | | | | 869,690 | |
| | | | |
Participation Notes† | | | — | | | | 5,124,705 | | | | — | | | | 5,124,705 | |
| | | | |
Short-Term Investments | | | | | | | | | | | | | | | | |
| | | | |
Joint Repurchase Agreements | | | — | | | | 951,184 | | | | — | | | | 951,184 | |
| | | | |
Other Investment Companies | | | 641,337 | | | | — | | | | — | | | | 641,337 | |
| | | | | | | | | | | | | | | | |
| | | | |
Total Investments in Securities | | | $6,910,811 | | | | $81,345,142 | | | | — | | | | $88,255,953 | |
| | | | | | | | | | | | | | | | |
| † | All participation notes held in the Fund are Level 2 securities. For a detailed breakout of participation notes by major industry classification, please refer to the Fund’s Schedule of Portfolio Investments. |
| 1 | An external pricing service is used to reflect any impact on security value due to market movements between the time the Fund valued such foreign securities and the earlier closing of foreign markets. |
For the six months ended June 30, 2024, there were no transfers in or out of Level 3.
The accompanying notes are an integral part of these financial statements.
4
| | |
| | | Statement of Assets and Liabilities (unaudited) June 30, 2024 |
| | | |
| | | |
| | | | |
| | | AMG Veritas
Asia
Pacific Fund |
| |
Assets: | | | | |
| |
Investments at value1 (including securities on loan valued at $2,212,056) | | | $88,255,953 | |
| |
Foreign currency2 | | | 450,933 | |
| |
Receivable for investments sold | | | 1,400,014 | |
| |
Dividend and interest receivables | | | 350,479 | |
| |
Securities lending income receivable | | | 413 | |
| |
Receivable for Fund shares sold | | | 3,217 | |
| |
Receivable from affiliate | | | 12,962 | |
| |
Prepaid expenses and other assets | | | 16,112 | |
| |
Total assets | | | 90,490,083 | |
| |
Liabilities: | | | | |
| |
Payable upon return of securities loaned | | | 951,184 | |
| |
Payable for investments purchased | | | 911,488 | |
| |
Payable for Fund shares repurchased | | | 10,550 | |
| |
Payable for foreign capital gains tax | | | 270,268 | |
| |
Accrued expenses: | | | | |
| |
Investment advisory and management fees | | | 50,347 | |
| |
Administrative fees | | | 10,637 | |
| |
Shareholder service fees | | | 15,554 | |
| |
Other | | | 40,367 | |
| |
Total liabilities | | | 2,260,395 | |
| |
Commitments and Contingencies (Notes 2 & 6) | | | | |
| |
Net Assets | | | $88,229,688 | |
| |
1 Investments at cost | | | $81,445,685 | |
| |
2 Foreign currency at cost | | | $449,292 | |
The accompanying notes are an integral part of these financial statements.
5
| | |
| | | Statement of Assets and Liabilities (continued) |
| | | |
| | | |
| | | | |
| | | AMG Veritas
Asia
Pacific Fund |
| |
Net Assets Represent: | | | | |
| |
Paid-in capital | | | $133,635,203 | |
| |
Total distributable loss | | | (45,405,515 | ) |
| |
Net Assets | | | $88,229,688 | |
| |
Class N: | | | | |
| |
Net Assets | | | $80,995,987 | |
| |
Shares outstanding | | | 1,310,588 | |
| |
Net asset value, offering and redemption price per share | | | $61.80 | |
| |
Class I: | | | | |
| |
Net Assets | | | $7,233,701 | |
| |
Shares outstanding | | | 106,621 | |
| |
Net asset value, offering and redemption price per share | | | $67.84 | |
The accompanying notes are an integral part of these financial statements.
6
| | |
| | | Statement of Operations (unaudited) For the six months ended June 30, 2024 |
| | | |
| | | |
| | | | |
| | | AMG Veritas
Asia
Pacific Fund |
| |
Investment Income: | | | | |
| |
Dividend income | | | $843,785 | |
| |
Interest income | | | 2,451 | |
| |
Securities lending income | | | 1,303 | |
| |
Foreign withholding tax | | | (78,251 | ) |
| |
Total investment income | | | 769,288 | |
| |
Expenses: | | | | |
| |
Investment advisory and management fees | | | 299,629 | |
| |
Administrative fees | | | 63,302 | |
| |
Shareholder servicing fees - Class N | | | 94,689 | |
| |
Custodian fees | | | 26,604 | |
| |
Professional fees | | | 21,282 | |
| |
Registration fees | | | 16,827 | |
| |
Reports to shareholders | | | 11,648 | |
| |
Transfer agent fees | | | 7,978 | |
| |
Trustee fees and expenses | | | 3,245 | |
| |
Miscellaneous | | | 13,521 | |
| |
Total expenses before offsets | | | 558,725 | |
| |
Expense reimbursements | | | (71,564 | ) |
| |
Net expenses | | | 487,161 | |
| | | | |
| |
Net investment income | | | 282,127 | |
| |
Net Realized and Unrealized Gain: | | | | |
| |
Net realized loss on investments | | | (7,166,147 | )1 |
| |
Net realized loss on foreign currency transactions | | | (32,323 | ) |
| |
Net change in unrealized appreciation/depreciation on investments | | | 14,566,278 | 2 |
| |
Net change in unrealized appreciation/depreciation on foreign currency translations | | | (1,914 | ) |
| |
Net realized and unrealized gain | | | 7,365,894 | |
| | | | |
| |
Net increase in net assets resulting from operations | | | $7,648,021 | |
| 1 | Net of foreign capital gains tax of $141,814. |
| 2 | Net of change in accrued foreign capital gains tax of $(115,349). |
The accompanying notes are an integral part of these financial statements.
7
| | |
| | | Statements of Changes in Net Assets For the six months ended June 30, 2024 (unaudited) and the fiscal year ended December 31, 2023 |
| | | |
| | | |
| | | | | | | | | | | | |
| | | AMG Veritas
Asia Pacific Fund |
| | | |
| | | June 30, 2024 | | | | December 31, 2023 |
| | | |
Increase (Decrease) in Net Assets Resulting From Operations: | | | | | | | | | | | | |
| | | |
Net investment income | | | $282,127 | | | | | | | | $149,439 | |
| | | |
Net realized loss on investments | | | (7,198,470 | ) | | | | | | | (15,082,837 | ) |
| | | |
Net change in unrealized appreciation/depreciation on investments | | | 14,564,364 | | | | | | | | 9,845,574 | |
| | | | | | | | | | | | |
| | | |
Net increase (decrease) in net assets resulting from operations | | | 7,648,021 | | | | | | | | (5,087,824 | ) |
| | | |
Distributions to Shareholders: | | | | | | | | | | | | |
| | | |
Class N | | | — | | | | | | | | (93,333 | ) |
| | | |
Class I | | | — | | | | | | | | (25,321 | ) |
| | | | | | | | | | | | |
| | | |
Total distributions to shareholders | | | — | | | | | | | | (118,654 | ) |
| | | |
Capital Share Transactions:1 | | | | | | | | | | | | |
| | | |
Net decrease from capital share transactions | | | (7,246,082 | ) | | | | | | | (19,983,339 | ) |
| | | | | | | | | | | | |
| | | |
Total increase (decrease) in net assets | | | 401,939 | | | | | | | | (25,189,817 | ) |
| | | |
Net Assets: | | | | | | | | | | | | |
| | | |
Beginning of period | | | 87,827,749 | | | | | | | | 113,017,566 | |
| | | | | | | | | | | | |
| | | |
End of period | | | $88,229,688 | | | | | | | | $87,827,749 | |
1 See Note 1(g) of the Notes to Financial Statements.
The accompanying notes are an integral part of these financial statements.
8
| | |
| | | AMG Veritas Asia Pacific Fund Financial Highlights For a share outstanding throughout each fiscal period |
| | | | | | | | | | | | | | | | | | | | | | | | | | | | | | |
| | | For the six months ended June 30, 2024 (unaudited) | | For the fiscal years ended December 31, |
| Class N | | 2023 | | 2022 | | 2021 | | 2020 | | 2019 |
| | | | | | |
Net Asset Value, Beginning of Period | | | | $56.49 | | | | | $59.41 | | | | | $82.42 | | | | | $147.58 | | | | | $111.15 | | | | | $114.95 | |
| | | | | | |
Income (loss) from Investment Operations: | | | | | | | | | | | | | | | | | | | | | | | | | | | | | | |
| | | | | | |
Net investment income (loss)1,2 | | | | 0.18 | | | | | 0.07 | | | | | (0.05 | ) | | | | (0.67 | ) | | | | (1.03 | ) | | | | (1.03 | ) |
| | | | | | |
Net realized and unrealized gain (loss) on investments | | | | 5.13 | | | | | (2.93 | ) | | | | (22.96 | ) | | | | 4.55 | | | | | 43.88 | | | | | 30.19 | |
| | | | | | | | | | | | | | | | | | | | | | | | | | | | | | |
| | | | | | |
Total income (loss) from investment operations | | | | 5.31 | | | | | (2.86 | ) | | | | (23.01 | ) | | | | 3.88 | | | | | 42.85 | | | | | 29.16 | |
| | | | | | |
Less Distributions to Shareholders from: | | | | | | | | | | | | | | | | | | | | | | | | | | | | | | |
| | | | | | |
Net investment income | | | | — | | | | | (0.06 | ) | | | | — | | | | | — | | | | | — | | | | | — | |
| | | | | | |
Net realized gain on investments | | | | — | | | | | — | | | | | — | | | | | (56.87 | ) | | | | (6.42 | ) | | | | (32.96 | ) |
| | | | | | |
Paid in capital | | | | — | | | | | — | | | | | — | | | | | (12.17 | ) | | | | — | | | | | — | |
| | | | | | | | | | | | | | | | | | | | | | | | | | | | | | |
| | | | | | |
Total distributions to shareholders | | | | — | | | | | (0.06 | ) | | | | — | | | | | (69.04 | ) | | | | (6.42 | ) | | | | (32.96 | ) |
| | | | | | |
Net Asset Value, End of Period | | | | $61.80 | | | | | $56.49 | | | | | $59.41 | | | | | $82.42 | | | | | $147.58 | | | | | $111.15 | |
| | | | | | | | | | | | | | | | | | | | | | | | | | | | | | |
| | | | | | |
Total Return2,3 | | | | 9.40 | %4 | | | | (4.82 | )% | | | | (27.91 | )% | | | | 3.16 | % | | | | 38.74 | % | | | | 25.69 | % |
| | | | | | |
Ratio of net expenses to average net assets | | | | 1.17 | %5 | | | | 1.17 | % | | | | 1.18 | % | | | | 1.27 | %6 | | | | 1.36 | %6 | | | | 1.36 | %6 |
| | | | | | |
Ratio of gross expenses to average net assets7 | | | | 1.34 | %5 | | | | 1.29 | % | | | | 1.29 | % | | | | 1.31 | % | | | | 1.42 | % | | | | 1.42 | % |
| | | | | | |
Ratio of net investment income (loss) to average net assets2 | | | | 0.65 | %5 | | | | 0.13 | % | | | | (0.07 | )% | | | | (0.69 | )% | | | | (0.89 | )% | | | | (0.76 | )% |
| | | | | | |
Portfolio turnover | | | | 39 | %4 | | | | 44 | % | | | | 54 | % | | | | 222 | % | | | | 100 | % | | | | 96 | % |
| | | | | | |
Net assets end of period (000’s) omitted | | | | $80,996 | | | | | $80,640 | | | | | $100,679 | | | | | $166,168 | | | | | $204,794 | | | | | $171,801 | |
| | | | | | |
| | | | | | | | | | | | | | | | | | | | | | | | | | | | | | | |
9
| | |
| | | AMG Veritas Asia Pacific Fund Financial Highlights For a share outstanding throughout each fiscal period |
| | | | | | | | | | | | | | | | | | | | | | | | | | | | | | |
| | | For the six months ended June 30, 2024 (unaudited) | | For the fiscal years ended December 31, |
| Class I | | 2023 | | 2022 | | 2021 | | 2020 | | 2019 |
| | | | | | |
Net Asset Value, Beginning of Period | | | | $61.94 | | | | | $65.15 | | | | | $90.15 | | | | | $154.81 | | | | | $116.08 | | | | | $118.57 | |
| | | | | | |
Income (loss) from Investment Operations: | | | | | | | | | | | | | | | | | | | | | | | | | | | | | | |
| | | | | | |
Net investment income (loss)1,2 | | | | 0.28 | | | | | 0.24 | | | | | 0.13 | | | | | (0.48 | ) | | | | (0.77 | ) | | | | (0.72 | ) |
| | | | | | |
Net realized and unrealized gain (loss) on investments | | | | 5.62 | | | | | (3.23 | ) | | | | (25.13 | ) | | | | 4.86 | | | | | 45.92 | | | | | 31.19 | |
| | | | | | | | | | | | | | | | | | | | | | | | | | | | | | |
| | | | | | |
Total income (loss) from investment operations | | | | 5.90 | | | | | (2.99 | ) | | | | (25.00 | ) | | | | 4.38 | | | | | 45.15 | | | | | 30.47 | |
| | | | | | |
Less Distributions to Shareholders from: | | | | | | | | | | | | | | | | | | | | | | | | | | | | | | |
| | | | | | |
Net investment income | | | | — | | | | | (0.22 | ) | | | | — | | | | | — | | | | | — | | | | | — | |
| | | | | | |
Net realized gain on investments | | | | — | | | | | — | | | | | — | | | | | (56.87 | ) | | | | (6.42 | ) | | | | (32.96 | ) |
| | | | | | |
Paid in capital | | | | — | | | | | — | | | | | — | | | | | (12.17 | ) | | | | — | | | | | — | |
| | | | | | | | | | | | | | | | | | | | | | | | | | | | | | |
| | | | | | |
Total distributions to shareholders | | | | — | | | | | (0.22 | ) | | | | — | | | | | (69.04 | ) | | | | (6.42 | ) | | | | (32.96 | ) |
| | | | | | |
Net Asset Value, End of Period | | | | $67.84 | | | | | $61.94 | | | | | $65.15 | | | | | $90.15 | | | | | $154.81 | | | | | $116.08 | |
| | | | | | | | | | | | | | | | | | | | | | | | | | | | | | |
| | | | | | |
Total Return2,3 | | | | 9.54 | %4 | | | | (4.58 | )% | | | | (27.73 | )% | | | | 3.43 | % | | | | 39.08 | % | | | | 26.02 | % |
| | | | | | |
Ratio of net expenses to average net assets | | | | 0.93 | %5 | | | | 0.93 | % | | | | 0.93 | % | | | | 1.02 | %6 | | | | 1.11 | %6 | | | | 1.11 | %6 |
| | | | | | |
Ratio of gross expenses to average net assets7 | | | | 1.10 | %5 | | | | 1.05 | % | | | | 1.04 | % | | | | 1.06 | % | | | | 1.17 | % | | | | 1.17 | % |
| | | | | | |
Ratio of net investment income (loss) to average net assets2 | | | | 0.89 | %5 | | | | 0.37 | % | | | | 0.18 | % | | | | (0.44 | )% | | | | (0.64 | )% | | | | (0.51 | )% |
| | | | | | |
Portfolio turnover | | | | 39 | %4 | | | | 44 | % | | | | 54 | % | | | | 222 | % | | | | 100 | % | | | | 96 | % |
| | | | | | |
Net assets end of period (000’s) omitted | | | | $7,234 | | | | | $7,188 | | | | | $12,339 | | | | | $22,066 | | | | | $44,593 | | | | | $38,093 | |
| | | | | | |
| | | | | | | | | | | | | | | | | | | | | | | | | | | | | | | |
| 1 | Per share numbers have been calculated using average shares. |
| 2 | Total returns and net investment income (loss) would have been lower had certain expenses not been offset. |
| 3 | The total return is calculated using the published Net Asset Value as of period end. |
| 6 | Includes reduction from broker recapture amounting to less than 0.01% for the fiscal years ended December 31, 2021, 2020 and 2019, respectively. |
| 7 | Excludes the impact of expense reimbursement or fee waivers and expense reductions such as brokerage credits, but includes expense repayments and non-reimbursable expenses, if any, such as interest, taxes, and extraordinary expenses. (See Note 1(c) and 2 in the Notes to Financial Statements.) |
10
| | |
| | | Notes to Financial Statements (unaudited) June 30, 2024 |
| | | |
| | | |
1. ORGANIZATION AND SUMMARY OF SIGNIFICANT ACCOUNTING POLICIES
AMG Funds III (the “Trust”) is an open-end management investment company, organized as a Massachusetts business trust, and registered under the Investment Company Act of 1940, as amended (the “1940 Act”). Currently, the Trust consists of a number of different funds, each having distinct investment management objectives, strategies, risks, and policies. Included in this report is AMG Veritas Asia Pacific Fund (the “Fund”).
The Fund offers Class N and Class I shares. Each class represents an interest in the same assets of the Fund. Although all share classes generally have identical voting rights, each share class votes separately when required by law. Different share classes may have different net asset values per share to the extent the share classes pay different distribution amounts and/or the expenses of such share classes differ. Each share class has its own expense structure. Please refer to a current prospectus for additional information on each share class.
The Fund is non-diversified.
The Fund’s financial statements are prepared in accordance with accounting principles generally accepted in the United States of America (“U.S. GAAP”), including accounting and reporting guidance pursuant to Accounting Standards Codification Topic 946 applicable to investment companies. U.S. GAAP requires management to make estimates and assumptions that affect the reported amounts of assets and liabilities and disclosure of contingent assets and liabilities at the date of the financial statements and the reported amounts of income and expenses during the reporting period. Actual results could differ from those estimates and such differences could be material. The following is a summary of significant accounting policies followed by the Fund in the preparation of its financial statements:
a. VALUATION OF INVESTMENTS
Equity securities traded on a national securities exchange or reported on the NASDAQ national market system (“NMS”) are valued at the last quoted sales price on the primary exchange or, if applicable, the NASDAQ official closing price or the official closing price of the relevant exchange or, lacking any sales, at the last quoted bid price. Equity securities held by the Fund that are traded in the over-the-counter market (other than NMS securities) are valued at the bid price. Foreign equity securities (securities principally traded in markets other than U.S. markets) held by the Fund are valued at the official closing price on the primary exchange or, for markets that either do not offer an official closing price or where the official closing price may not be representative of the overall market, the last quoted sale price.
Fixed income securities purchased with a remaining maturity of 60 days or less are valued at amortized cost, provided that the amortized cost value is approximately the same as the fair value of the security valued without the use of amortized cost. Investments in other open-end registered investment companies are valued at their end of day net asset value per share.
Participation notes (“P-Notes”) are valued using the underlying equity security’s official closing price on the primary exchange or, for markets that either do not offer an official closing price or where the official closing price may not be representative of the overall market, the last quoted sale price.
The Fund’s portfolio investments are generally valued based on independent market quotations or prices or, if none, “evaluative” or other market based
valuations provided by third party pricing services. Pursuant to Rule 2a-5 under the 1940 Act, the Fund’s Board of Trustees (the “Board”) designated AMG Funds LLC (the “Investment Manager”) as the Fund’s Valuation Designee to perform the Fund’s fair value determinations. Such determinations are subject to Board oversight and certain reporting and other requirements intended to ensure that the Board receives the information it needs to oversee the Investment Manager’s fair value determinations.
Under certain circumstances, the value of certain Fund portfolio investments may be based on an evaluation of fair value, pursuant to procedures established by the Investment Manager and under the general supervision of the Board. The Fund may use the fair value of a portfolio investment to calculate its net asset value (“NAV”) in the event that the market quotation, price or market based valuation for the portfolio investment is not readily available or otherwise not determinable pursuant to the Fund’s valuation procedures, if the Investment Manager believes the quotation, price or market based valuation to be unreliable, or in certain other circumstances. When determining the fair value of an investment, the Investment Manager seeks to determine the price that the Fund might reasonably expect to receive from current sale of that portfolio investment in an arms-length transaction. Fair value determinations shall be based upon consideration of all available facts and information, including, but not limited to (i) attributes specific to the investment; (ii) fundamental and analytical data relating to the investment; and (iii) the value of other comparable securities or relevant financial instruments, including derivative securities, traded on other markets or among dealers.
The values assigned to fair value portfolio investments are based on available information and do not necessarily represent amounts that might ultimately be realized in the future, since such amounts depend on future developments inherent in long-term investments. Because of the inherent uncertainty of valuation, those estimated values may differ significantly from the values that would have been used had a ready market for the investments existed, and the differences could be material. The Board will be presented with quarterly reports, as of the most recent quarter end, summarizing all fair value activity, material fair value matters that occurred during the quarter, and all outstanding securities fair valued by the Fund. Additionally, the Board will be presented with an annual report that assesses the adequacy and effectiveness of the Investment Manager’s process for determining the fair value of the Fund’s investments.
With respect to foreign equity securities and certain foreign fixed income securities, securities held in the Fund that can be fair valued by the applicable fair value pricing service are fair valued on each business day provided that each individual price exceeds a pre-established confidence level.
U.S. GAAP defines fair value as the price that a fund would receive to sell an asset or pay to transfer a liability in an orderly transaction between market participants at the measurement date. U.S. GAAP also establishes a framework for measuring fair value, and a three level hierarchy for fair value measurements based upon the transparency of inputs to the valuation of an asset or liability. Inputs may be observable or unobservable and refer broadly to the assumptions that market participants would use in pricing the asset or liability. Observable inputs reflect the assumptions market participants would use in pricing the asset or liability based on market data obtained from sources independent of the Fund. Unobservable inputs reflect the Fund’s own assumptions about the assumptions that market participants would use in pricing the asset or liability developed based on the best information available in the circumstances. Each investment is assigned a level based upon the observability of the inputs which are significant to the overall valuation.
11
| | |
| | | Notes to Financial Statements (continued) |
| | | |
| | | |
The three-tier hierarchy of inputs is summarized below:
Level 1 – inputs are quoted prices in active markets for identical investments (e.g., equity securities, open-end investment companies)
Level 2 – other observable inputs (including, but not limited to: quoted prices for similar assets or liabilities in markets that are active, quoted prices for identical or similar assets or liabilities in markets that are not active, inputs other than quoted prices that are observable for the assets or liabilities (such as interest rates, yield curves, volatilities, prepayment speeds, loss severities, credit risks and default rates) or other market corroborated inputs) (e.g., debt securities, government securities, foreign currency exchange contracts, P-Notes, foreign securities utilizing international fair value pricing, fair valued securities with observable inputs)
Level 3 – inputs are significant unobservable inputs (including the Fund’s own assumptions used to determine the fair value of investments) (e.g., fair valued securities with unobservable inputs)
Changes in inputs or methodologies used for valuing investments may result in a transfer in or out of levels within the fair value hierarchy. The inputs or methodologies used for valuing investments may not necessarily be an indication of the risk associated with investing in those investments.
b. SECURITY TRANSACTIONS
Security transactions are accounted for as of trade date. Realized gains and losses on securities sold are determined on the basis of identified cost.
c. INVESTMENT INCOME AND EXPENSES
Dividend income is recorded on the ex-dividend date. Dividends from foreign securities are recorded on the ex-dividend date, and if after the fact, as soon as the Fund becomes aware of the ex-dividend date, except for Korean securities where dividends are recorded on confirmation date. Interest income, which includes amortization of premium and accretion of discount on debt securities, is accrued as earned. Dividend and interest income on foreign securities is recorded gross of any withholding tax. Non-cash dividends included in dividend income, if any, are reported at the fair market value of the securities received. Other income and expenses are recorded on an accrual basis. Expenses that cannot be directly attributed to the Fund are apportioned among the funds in the Trust and other trusts or funds within the AMG Funds Family of Funds (collectively, the “AMG Funds Family”) based upon their relative average net assets or number of shareholders. Investment income, realized and unrealized capital gains and losses, the common expenses of the Fund, and certain fund level expense reductions, if any, are allocated on a pro-rata basis to each class based on the relative net assets of each class to the total net assets of the Fund.
d. DIVIDENDS AND DISTRIBUTIONS
Fund distributions resulting from either net investment income or realized net capital gains, if any, will normally be declared and paid at least annually in
December. Distributions to shareholders are recorded on the ex-dividend date. Distributions are determined in accordance with federal income tax regulations, which may differ from net investment income and net realized capital gains for financial statement purposes (U.S. GAAP). Differences may be permanent or temporary. Permanent differences are reclassified among capital accounts in the financial statements to reflect their tax character. Permanent book and tax basis differences, if any, relating to shareholder distributions will result in reclassifications to paid-in capital. Temporary differences arise when certain items of income, expense and gain or loss are recognized in different periods for financial statement and tax purposes; these differences will reverse at some time in the future. There were no permanent differences. Temporary differences are primarily due to wash sale loss deferrals and cost adjustments on dividend income received from spinoffs.
At June 30, 2024, the aggregate cost for federal income tax purposes approximates the aggregate cost for book purposes. The approximate cost of investments and the aggregate gross unrealized appreciation and depreciation for federal income tax purposes were as follows:
| | | | | | | | | | | | |
| Cost | | Appreciation | | | Depreciation | | | Net Appreciation | |
| | | |
| $81,445,685 | | | $13,144,310 | | | | $(6,334,042 | ) | | | $6,810,268 | |
e. FEDERAL TAXES
The Fund currently qualifies as an investment company and intends to comply with the requirements under Subchapter M of the Internal Revenue Code of 1986, as amended (the “Code”), and to distribute substantially all of its taxable income and gains to its shareholders and to meet certain diversification and income requirements with respect to investment companies. The Investment Manager has analyzed the Fund’s tax positions taken on federal income tax returns for all open tax years (generally, the three prior taxable years), and has concluded that no provision for federal income tax is required in the Fund’s financial statements. Additionally, the Investment Manager is not aware of any tax position for which it is reasonably possible that the total amounts of unrecognized tax benefit/detriment will change materially in the next twelve months.
Furthermore, based on the Fund’s understanding of the tax rules and rates related to income, gains and transactions for the foreign jurisdictions in which it invests, the Fund will provide for foreign taxes, and where appropriate, deferred foreign taxes.
f. CAPITAL LOSS CARRYOVERS AND DEFERRALS
As of December 31, 2023, the Fund had capital loss carryovers for federal income tax purposes as shown in the following chart. These amounts may be used to offset future realized capital gains indefinitely, and retain their character as short-term and/or long-term.
| | | | | | | | | | |
Short-Term | | | | Long-Term | | | | | Total |
| | | | |
$21,979,638 | | | | | $22,136,011 | | | | | $44,115,649 |
g. CAPITAL STOCK
The Trust’s Declaration of Trust authorizes for the Fund the issuance of an unlimited number of shares of beneficial interest, without par value. The Fund records sales and repurchases of its capital stock on the trade date.
12
| | |
| | | Notes to Financial Statements (continued) |
| | | |
| | | |
For the six months ended June 30, 2024 (unaudited) and the fiscal year ended December 31, 2023, the capital stock transactions by class for the Fund were as follows:
| | | | | | | | | | | | | | | | |
| | | June 30, 2024 | | | December 31, 2023 | |
| | | | |
| | | Shares | | | Amount | | | Shares | | | Amount | |
| | | | |
Class N: | | | | | | | | | | | | | | | | |
| | | | |
Shares sold | | | 5,022 | | | | $287,585 | | | | 13,202 | | | | $769,999 | |
| | | | |
Shares issued in reinvestment of distributions | | | — | | | | — | | | | 1,666 | | | | 90,774 | |
| | | | |
Shares redeemed | | | (121,966) | | | | (6,933,545) | | | | (281,875) | | | | (16,206,613) | |
| | | | | | | | | | | | | | | | |
| | | | |
Net decrease | | | (116,944) | | | | $(6,645,960) | | | | (267,007) | | | | $(15,345,840) | |
| | | | | | | | | | | | | | | | |
| | | | |
Class I: | | | | | | | | | | | | | | | | |
| | | | |
Shares sold | | | 10,416 | | | | $654,923 | | | | 20,098 | | | | $1,294,720 | |
| | | | |
Shares issued in reinvestment of distributions | | | — | | | | — | | | | 413 | | | | 24,694 | |
| | | | |
Shares redeemed | | | (19,844) | | | | (1,255,045) | | | | (93,867) | | | | (5,956,913) | |
| | | | | | | | | | | | | | | | |
| | | | |
Net decrease | | | (9,428) | | | | $(600,122) | | | | (73,356) | | | | $(4,637,499) | |
| | | | | | | | | | | | | | | | |
h. REPURCHASE AGREEMENTS AND JOINT REPURCHASE AGREEMENTS
The Fund may enter into third-party and bilateral repurchase agreements for temporary cash management purposes and for reinvestment of cash collateral on securities lending transactions under the securities lending program offered by The Bank of New York Mellon (“BNYM”) (the “Securities Lending Program”) (collectively, “Repurchase Agreements”). The value of the underlying collateral, including accrued interest, must equal or exceed the value of the Repurchase Agreements during the term of the agreement. For joint repurchase agreements, the Fund participates on a pro rata basis with other clients of BNYM in its share of the underlying collateral under such joint repurchase agreements and in its share of proceeds from any repurchase or other disposition of the underlying collateral. The underlying collateral for all Repurchase Agreements is held by the Fund’s custodian or at the Federal Reserve Bank. If the seller defaults and the value of the collateral declines, or if bankruptcy proceedings commence with respect to the seller of the security, realization of the collateral by the Fund may be delayed or limited. Pursuant to the Securities Lending Program, the Fund is indemnified for such losses by BNYM on joint repurchase agreements.
At June 30, 2024, the market value of Repurchase Agreements outstanding for Veritas Asia Pacific Fund was $951,184.
i. FOREIGN CURRENCY TRANSLATION
The books and records of the Fund are maintained in U.S. Dollars. The value of investments, assets and liabilities denominated in currencies other than U.S. Dollars are translated into U.S. Dollars based upon current foreign exchange rates. Purchases and sales of foreign investments, income and expenses are converted into U.S. Dollars based on currency exchange rates prevailing on the respective dates of such transactions. Net realized and unrealized gain (loss) on foreign currency transactions represent: (1) foreign exchange gains and losses from the sale and holdings of foreign currencies; (2) gains and losses between trade date and settlement date on investment securities transactions and foreign currency exchange contracts; and (3) gains and losses from the difference between amounts of interest and dividends recorded and the amounts actually received.
The Fund does not isolate the net realized and unrealized gain or loss resulting from changes in exchange rates from the fluctuations in market prices of securities held. Such fluctuations are included with the net realized and unrealized gain or loss on investments.
2. AGREEMENTS AND TRANSACTIONS WITH AFFILIATES
The Trust has entered into an investment advisory agreement under which the Investment Manager, a subsidiary and the U.S. wealth platform of Affiliated Managers Group, Inc. (“AMG”), serves as investment manager to the Fund and is responsible for the Fund’s overall administration and operations. The Investment Manager selects and recommends, subject to the approval of the Board and, in certain circumstances, shareholders, the subadviser for the Fund and monitors the subadviser’s investment performance, security holdings and investment strategies. The Fund’s investment portfolio is managed by Veritas Asset Management LLP (“Veritas”) who serves as subadviser pursuant to a subadvisory agreement with the Investment Manager. AMG indirectly owns a majority interest in Veritas.
Investment management fees are paid directly by the Fund to the Investment Manager based on average daily net assets. For the six months ended June 30, 2024, the Fund paid an investment management fee at the annual rate of 0.71% of the average daily net assets of the Fund.
The fee paid to Veritas for its services as subadviser is paid out of the fee the Investment Manager receives from the Fund and does not increase the expenses of the Fund.
The Investment Manager has contractually agreed, through at least May 1, 2025, to waive management fees and/or pay or reimburse fund expenses in order to limit total annual Fund operating expenses after fee waiver and expense reimbursements (exclusive of taxes, interest (including interest incurred in connection with bank and custody overdrafts, and in connection with securities sold short), shareholder servicing fees, distribution and service (12b-1) fees, brokerage commissions and other transaction costs, dividends payable with respect to securities sold short, acquired fund fees and expenses and extraordinary expenses) to the annual rate of 0.93% of the Fund’s average daily net assets (this annual rate or such other annual rate that may be in effect from time
13
| | |
| | | Notes to Financial Statements (continued) |
| | | |
| | | |
to time, the “Expense Cap”), subject to later reimbursement by the Fund in certain circumstances.
In general, for a period of up to 36 months after the date any amounts are paid, waived or reimbursed by the Investment Manager, the Investment Manager may recover such amounts from the Fund, provided that such repayment would not cause the Fund’s total annual operating expenses after fee waiver and expense reimbursements (exclusive of the items noted in the parenthetical above) to exceed either (i) the Expense Cap in effect at the time such amounts were paid, waived or reimbursed, or (ii) the Expense Cap in effect at the time of such repayment by the Fund.
The contractual expense limitation may only be terminated in the event the Investment Manager or a successor ceases to be the investment manager of the Fund or a successor fund, by mutual agreement between the Investment Manager and the Board, or in the event of the Fund’s liquidation unless the Fund is reorganized or is a party to a merger in which the surviving entity is successor to the accounting and performance information of the Fund.
For the six months ended June 30, 2024, the Investment Manager reimbursed the Fund $71,564, and did not recoup any previously reimbursed expenses. At June 30, 2024, the Fund’s expiration of reimbursements subject to recoupment is as follows:
| | | | |
Expiration Period | | | |
| |
Less than 1 year | | $ | 153,233 | |
| |
1-2 years | | | 125,055 | |
| |
2-3 years | | | 134,406 | |
| | | | |
| |
Total | | $ | 412,694 | |
| | | | |
The Trust, on behalf of the Fund, has entered into an amended and restated Administration Agreement under which the Investment Manager serves as the Fund’s administrator (the “Administrator”) and is responsible for certain aspects of managing the Fund’s operations, including administration and shareholder services to the Fund. The Fund pays a fee to the Administrator at the rate of 0.15% per annum of the Fund’s average daily net assets for this service.
The Fund is distributed by AMG Distributors, Inc. (the “Distributor”), a wholly-owned subsidiary of the Investment Manager. The Distributor serves as the distributor and underwriter for the Fund and is a registered broker-dealer and member of the Financial Industry Regulatory Authority, Inc. (“FINRA”). Shares of the Fund will be continuously offered and will be sold directly to prospective purchasers and through brokers, dealers or other financial intermediaries who have executed selling agreements with the Distributor. Generally, the Distributor bears all or a portion of the expenses of providing services pursuant to the distribution agreement, including the payment of the expenses relating to the distribution of prospectuses for sales purposes and any advertising or sales literature.
For Class N shares, the Board has approved reimbursement payments to the Investment Manager for shareholder servicing expenses (“shareholder servicing fees”) incurred. Shareholder servicing fees include payments to financial intermediaries, such as broker-dealers (including fund supermarket platforms), banks, and trust companies who provide shareholder recordkeeping, account servicing and other services. The Class N shares may reimburse the Investment Manager for the actual amount incurred up to a maximum annual rate of the Class’s average daily net assets as shown in the table below.
The impact on the annualized expense ratios for the six months ended June 30, 2024, was as follows:
| | | | | | | | |
| | | Maximum Annual
Amount
Approved | | | Actual Amount Incurred | |
| | |
Class N | | | 0.25% | | | | 0.24% | |
The Board provides supervision of the affairs of the Trust and other trusts within the AMG Funds Family. The Trustees of the Trust who are not affiliated with the Investment Manager receive an annual retainer and per meeting fees for regular, special and telephonic meetings, and they are reimbursed for out-of-pocket expenses incurred while carrying out their duties as Board members. The Chairman of the Board and the Audit Committee Chair receive additional annual retainers. Certain Trustees and Officers of the Fund are Officers and/or Directors of the Investment Manager, AMG and/or the Distributor.
The Securities and Exchange Commission (the “SEC”) granted an exemptive order that permits certain eligible funds in the AMG Funds Family to lend and borrow money for certain temporary purposes directly to and from other eligible funds in the AMG Funds Family. Participation in this interfund lending program is voluntary for both the borrowing and lending funds, and an interfund loan is only made if it benefits each participating fund. The Administrator manages the program according to procedures approved by the Board, and the Board monitors the operation of the program. An interfund loan must comply with certain conditions set out in the exemptive order, which are designed to assure fairness and protect all participating funds. The interest earned and interest paid on interfund loans are included on the Statement of Operations as interest income and interest expense, respectively. At June 30, 2024, the Fund had no interfund loans outstanding. The Fund did not borrow during the six months ended June 30, 2024.
The Fund utilized the interfund loan program during the six months ended June 30, 2024 as follows:
| | | | | | | | | | | | | | |
Average
Lent | | Number
of Days | | | | Interest
Earned | | | | | Average Interest Rate | |
| | | | | |
$2,872,084 | | 5 | | | | | $2,451 | | | | | | 6.230% | |
3. PURCHASES AND SALES OF SECURITIES
Purchases and sales of securities (excluding short-term securities and U.S. Government Obligations) for the six months ended June 30, 2024, were $32,632,596 and $37,049,670, respectively.
The Fund had no purchases or sales of U.S. Government Obligations during the six months ended June 30, 2024.
4. PORTFOLIO SECURITIES LOANED
The Fund participates in the Securities Lending Program providing for the lending of securities to qualified borrowers. Securities lending income includes earnings of such temporary cash investments, plus or minus any rebate to a borrower. These earnings (after any rebate) are then divided between BNYM, as a fee for its services under the Securities Lending Program, and the Fund, according to agreed-upon rates. Collateral on all securities loaned is accepted in cash, U.S. Treasury Obligations or U.S. Government Agency Obligations. Collateral is maintained at a minimum level of 102% (105% in the case of certain foreign securities) of the market value, plus interest, if applicable, of investments on loan. It is the Fund’s policy to obtain additional collateral from or return excess collateral
14
| | |
| | | Notes to Financial Statements (continued) |
| | | |
| | | |
to the borrower by the end of the next business day, following the valuation date of the securities loaned. Therefore, the value of the collateral held may be temporarily less than the value of the securities on loan. Lending securities entails a risk of loss to the Fund if and to the extent that the market value of the securities loaned were to increase and the borrower did not increase the collateral accordingly, and the borrower fails to return the securities. Under the terms of the Securities Lending Program, the Fund is indemnified for such losses by BNYM. Cash collateral is held in separate omnibus accounts managed by BNYM, who is authorized to exclusively enter into joint repurchase agreements for that cash collateral. Securities collateral is held in separate omnibus accounts managed by BNYM and cannot be sold or pledged. BNYM bears the risk of any deficiency in the amount of the cash collateral available for return to the borrower due to any loss on the collateral invested. Loans of securities are terminable at any time and the borrower, after notice, is required to return borrowed securities as soon as practical, which is normally within three business days.
The value of securities loaned on positions held, cash collateral and securities collateral received at June 30, 2024, was as follows:
| | | | | | | | |
Securities Loaned | | Cash Collateral Received | | Securities Collateral Received | | | Total Collateral Received |
| | | |
$2,212,056 | | $951,184 | | | $1,312,310 | | | $2,263,494 |
The following table summarizes the securities received as collateral for securities lending at June 30, 2024:
| | | | | | |
Collateral Type | | Coupon
Range | | Maturity Date Range |
| | |
U.S. Treasury Obligations | | 0.000%-5.456% | | | 07/15/24-08/15/53 | |
5. FUND RISKS
In the normal course of business, the Fund invests in securities or other instruments and may enter into certain transactions, and such activities subject the Fund to various risks. The value of securities or other instruments may also be affected by various factors, including, without limitation: (i) the general economy; (ii) the overall market as well as local, regional or global political and/or social instability; or (iii) currency and price fluctuations. Please refer to the Fund’s current prospectus for additional information about the Fund’s principal risks.
Market Risk: Market prices of investments held by the Fund may fall rapidly or unpredictably due to a variety of factors, including economic, political, or market conditions, or other factors including terrorism, war, natural disasters and the spread of infectious illness or other public health issues, including epidemics or pandemics, or in response to events that affect particular industries or companies.
Management Risk: Because the Fund is an actively managed investment portfolio, security selection or focus on securities in a particular style, market sector or group of companies may cause the Fund to incur losses or underperform relative to its benchmarks or other funds with a similar investment objective. There can be no guarantee that the Subadviser’s investment techniques and risk analysis will produce the desired result.
Non-Diversified Fund Risk: The Fund is non-diversified and therefore a greater percentage of holdings may be focused in a small number of issuers or a single issuer, which can place the Fund at greater risk. Notwithstanding the Fund’s status as a “non-diversified” investment company under the 1940 Act, the Fund intends to qualify as a regulated investment company accorded favorable tax treatment
under the Code, which imposes its own diversification requirements that are less restrictive than the requirements applicable to “diversified” investment companies under the 1940 Act. The Fund’s intention to qualify as a regulated investment company may limit its pursuit of its investment strategy and its investment strategy could limit its ability to so qualify.
Focused Investment Risk: To the extent the Fund invests a substantial portion of its assets in a relatively small number of securities or a particular market, industry, group of industries, country, region, group of countries, asset class or sector, it generally will be subject to greater risk than a fund that invests in a more diverse investment portfolio. In addition, the value of the Fund would be more susceptible to any single economic, market, political or regulatory occurrence affecting, for example, that particular market, industry, region or sector.
Sector Risk: Issuers and companies that are in similar industry sectors may be similarly affected by particular economic or market events; to the extent the Fund has substantial holdings within a particular sector, the risks associated with that sector increase.
Foreign Investment Risk: Investments in foreign issuers involve additional risks (such as risks arising from less frequent trading, changes in political or social conditions, and less publicly available information about non-U.S. issuers) that differ from those associated with investments in U.S. issuers and may result in greater price volatility.
Emerging Markets Risk: Investments in emerging markets are subject to the general risks of foreign investments, as well as additional risks which can result in greater price volatility. Such additional risks include the risk that markets in emerging market countries are typically less developed and less liquid than markets in developed countries and such markets are subjected to increased economic, political, or regulatory uncertainties.
Currency Risk: Fluctuations in exchange rates may affect the total loss or gain on a non-U.S. dollar investment when converted back to U.S. dollars and exposure to non-U.S. currencies may subject the Fund to the risk that those currencies will decline in value relative to the U.S. dollar.
Geographic Focus Risk: To the extent the Fund focuses its investments in a particular country, group of countries or geographic region, the Fund is particularly susceptible to economic, political, regulatory or other events or conditions affecting such countries or region, and the Fund’s NAV may be more volatile than the NAV of a more geographically diversified fund and may result in losses.
Risks Associated with Investments in Greater China: The Fund is particularly susceptible to risks in the Greater China region, which consists of Hong Kong, The People’s Republic of China (“PRC”) and Taiwan, among other countries. Economies in the Greater China region are dependent on the economies of other countries and can be significantly affected by currency fluctuations and increasing competition from other emerging economies in Asia with lower costs. Adverse events in any one country within the region may impact the other countries in the region or Asia as a whole. Markets in the Greater China region can experience significant volatility due to social, economic, regulatory and political uncertainties. Significant portions of the Chinese securities markets may become rapidly illiquid, as Chinese issuers have the ability to suspend the trading of their equity securities, and have shown a willingness to exercise that option in response to market volatility and other events. U.S. or foreign government restrictions or intervention could negatively affect the implementation of the Fund’s investment strategies, for example by precluding the Fund from making certain investments or
15
| | |
| | | Notes to Financial Statements (continued) |
| | | |
| | | |
causing the Fund to sell investments at disadvantageous times. China has yet to develop comprehensive securities, corporate, or commercial laws, its market is relatively new and less developed, and its economy may be adversely impacted by a slowdown in export growth.
Risks Associated with Investments in India: In India, the government has exercised and continues to exercise significant influence over many aspects of the economy. Government actions, bureaucratic obstacles and inconsistent economic reform within the Indian government have had a significant effect on its economy and could adversely affect market conditions, economic growth and the profitability of private enterprises in India. Global factors and foreign actions may inhibit the flow of foreign capital on which India is dependent to sustain its growth. Large portions of many Indian companies remain in the hands of their founders (including members of their families). Corporate governance standards of family-controlled companies may be weaker and less transparent, which increases the potential for loss and unequal treatment of investors. India experiences many of the risks associated with developing economies, including relatively low levels of liquidity, which may result in extreme volatility in the prices of Indian securities. Religious, cultural and military disputes persist in India, and between India and Pakistan (as well as sectarian groups within each country).
Political Risk: Changes in the general political and social environment of a country can have substantial effects on the value of investments exposed to that country.
PRC Tax Risk: The application of the tax laws and regulations of the PRC to income, including capital gains, derived from certain investments of the Fund remains unclear, and may well continue to evolve, possibly with retroactive effect. Any taxes imposed on the investments of the Fund pursuant to such laws and regulations will reduce the Fund’s overall returns.
Stock Connect Risk: Trading in China A-Shares through Stock Connect is subject to sudden changes in quota limitations, application of trading suspensions,
differences in trading days between the PRC and Stock Connect, operational risk, clearing and settlement risk and regulatory and taxation risk.
Large-Capitalization Stock Risk: The stocks of large capitalization companies are generally more mature and may not be able to reach the same levels of growth as the stocks of small- or mid-capitalization companies.
Small- and Mid-Capitalization Stock Risk: The stocks of small- and mid- capitalization companies often have greater price volatility, lower trading volume, and less liquidity than the stocks of larger, more established companies.
Value Stock Risk: Value stocks may perform differently from the market as a whole and may be undervalued by the market for a long period of time.
Liquidity Risk: The Fund may not be able to dispose of particular investments, such as illiquid securities, readily at favorable times or prices or the Fund may have to sell them at a loss.
6. COMMITMENTS AND CONTINGENCIES
Under the Trust’s organizational documents, its Trustees and Officers are indemnified against certain liabilities arising out of the performance of their duties to the Trust. In addition, in the normal course of business, the Fund may enter into contracts and agreements that contain a variety of representations and warranties, which provide general indemnifications. The maximum exposure to the Fund under these arrangements is unknown, as this would involve future claims that may be made against the Fund that have not yet occurred. However, based on experience, the Fund had no prior claims or losses and expects the risks of loss to be remote.
7. MASTER NETTING AGREEMENTS
The Fund may enter into master netting agreements with its counterparties for the Securities Lending Program and Repurchase Agreements, which provide the right, in the event of default (including bankruptcy or insolvency) for the non-defaulting party to liquidate the collateral and calculate net exposure to the defaulting party or request additional collateral. For financial reporting purposes, the Fund does not offset financial assets and financial liabilities that are subject to master netting agreements in the Statement of Assets and Liabilities. For securities lending transactions, see Note 4.
The following table is a summary of the Fund’s open Repurchase Agreements that are subject to a master netting agreement as of June 30, 2024:
| | | | | | | | | | | | | | | | | | | | | | | | | | | | | | |
| | | | | | | | Gross Amount Not Offset in the | | | | | | | | | |
| | | | | | | | Statement of Assets and Liabilities | | | | | | | | | |
| | | | | | | | | |
| | | Gross Amounts of
Assets Presented in
the Statement of
Assets and Liabilities | | | | | Offset Amount | | | | | Net Asset Balance | | | | | Collateral Received | | | | | | Net Amount | |
| | | | | | | | | |
| | | | | | | | | | | | | | | | | | | | | | | | | | | | | | |
| | | | | | | | | |
| | | | | | | | | | | | | | | | | | | | | | | | | | | | | | |
| | | | | | | | | |
Bethesda Securities LLC | | | $951,184 | | | | | | — | | | | | | $951,184 | | | | | | $951,184 | | | | | | | | — | |
8. SUBSEQUENT EVENTS
The Fund has determined that no material events or transactions occurred through the issuance date of the Fund’s financial statements which require an additional disclosure in or adjustment of the Fund’s financial statements.
16
| | |
| | | Other Information (unaudited) |
| | | |
| | | |
ITEM 8. CHANGES IN AND DISAGREEMENTS WITH ACCOUNTANTS FOR OPEN-END MANAGEMENT INVESTMENT COMPANIES
During the six months ended June 30, 2024, there were no changes in and/or disagreements with accountants.
ITEM 9. PROXY DISCLOSURES FOR OPEN-END MANAGEMENT INVESTMENT COMPANIES
Not applicable.
ITEM 10. REMUNERATION PAID TO DIRECTORS, OFFICERS, AND OTHERS OF OPEN-END MANAGEMENT INVESTMENT COMPANIES
The remuneration paid to the Trustees during the six months ended June 30, 2024, was $3,245, which is reflected as “Trustee fees and expenses” on the Statement of Operations. There was no remuneration paid to any Fund officer or to any affiliated person of any Fund Trustee or officer during the six months ended June 30, 2024.
17
| | |
| | | ITEM 11. STATEMENT REGARDING BASIS FOR APPROVAL OF INVESTMENT
ADVISORY CONTRACT |
| | | |
| | | |
| | | | | | | | |
AMG Veritas Asia Pacific Fund: Approval of Investment Management Agreement and Subadvisory Agreement on June 12, 2024 At an in-person meeting held on June 12, 2024, the Board of Trustees (the “Board” or the “Trustees”), and separately a majority of the Trustees who are not “interested persons” of AMG Funds III (the “Trust”) (the “Independent Trustees”), approved (i) the Investment Management Agreement, as amended pursuant to letter agreements at any time prior to the date of the meeting, with AMG Funds LLC (the “Investment Manager”) for AMG Veritas Asia Pacific Fund (the “Fund”) and separately each of Amendment No. 1 thereto dated July 1, 2015, and Amendment No. 2 thereto dated October 1, 2016 (collectively, the “Investment Management Agreement”); and (ii) the Subadvisory Agreement with respect to the Fund, as amended at any time prior to the date of the meeting (the “Subadvisory Agreement”), with Veritas Asset Management LLP, the Fund’s subadviser (the “Subadviser”). The Independent Trustees were separately represented by independent legal counsel in connection with their consideration of the approval of these agreements. In considering the Investment Management Agreement and Subadvisory Agreement, the Trustees reviewed a variety of materials relating to the Fund, the Investment Manager and the Subadviser, including the nature, extent and quality of services, comparative performance, fee and expense information for an appropriate peer group of similar mutual funds for the Fund (the “Peer Group”), performance information for the relevant benchmark index for the Fund (the “Fund Benchmark”), other relevant matters, including management fees, the profitability of the Investment Manager and the Subadviser, and the potential for economies of scale that may be shared with the Funds, and other information provided to them on a periodic basis throughout the year. Prior to voting, the Independent Trustees: (a) reviewed the foregoing information with their independent legal counsel; (b) received materials from their independent legal counsel discussing the legal standards applicable to their consideration of the Investment Management Agreement and the Subadvisory Agreement; and (c) met with their independent legal counsel in private sessions at which no representatives of management were present. NATURE, EXTENT AND QUALITY OF SERVICES In considering the nature, extent and quality of the services provided by the Investment Manager, the Trustees reviewed information provided by the | | | | Investment Manager at the June 12, 2024 meeting and prior meetings relating to the Investment Manager’s operations and personnel. Among other things, the Investment Manager provided financial information, information about its supervisory and professional staff and descriptions of its organizational and management structure. The Trustees also took into account information provided periodically throughout the previous year by the Investment Manager in Board meetings relating to the performance of its duties with respect to the Fund and the Trustees’ knowledge of the Investment Manager’s management and the quality of the performance of the Investment Manager’s duties under the Investment Management Agreement and Administration Agreement. In the course of their deliberations regarding the Investment Manager, the Trustees evaluated, among other things: (a) the extent and quality of the Investment Manager’s oversight of the operation and management of the Fund; (b) the quality of the Investment Manager’s oversight of the performance by the Subadviser of its portfolio management duties; (c) the Investment Manager’s ability to supervise the Fund’s other service providers; and (d) the Investment Manager’s compliance program. The Trustees also took into account that, in performing its functions under the Investment Management Agreement and supervising the Subadviser, the Investment Manager: performs periodic detailed analyses and reviews of the performance by the Subadviser of its obligations to the Fund, including without limitation, analysis and review of portfolio and other compliance matters and review of the Subadviser’s investment performance with respect to the Fund; prepares and presents periodic reports to the Board regarding the investment performance of the Subadviser and other information regarding the Subadviser, at such times and in such forms as the Board may reasonably request; reviews and considers any changes in the personnel of the Subadviser responsible for performing the Subadviser’s obligations and makes appropriate reports to the Board; reviews and considers any changes in the ownership or senior management of the Subadviser and makes appropriate reports to the Board; performs periodic in-person, telephonic or videoconference diligence meetings, including with respect to compliance matters, with representatives of the Subadviser; assists the Board and management of the Trust in developing and reviewing information with respect to the initial approval of the Subadvisory Agreement and annual consideration of the Subadvisory Agreement thereafter; prepares recommendations with respect to the continued retention of the Subadviser or the replacement of the Subadviser, | | | | including at the request of the Board; identifies potential successors to, or replacements of, the Subadviser or potential additional subadvisers, including performing appropriate due diligence, and developing and presenting to the Board a recommendation as to any such successor, replacement, or additional subadviser, including at the request of the Board; designates and compensates from its own resources such personnel as the Investment Manager may consider necessary or appropriate to the performance of its services; and performs such other review and reporting functions as the Board shall reasonably request consistent with the Investment Management Agreement and applicable law. The Trustees noted the affiliation of the Subadviser with the Investment Manager, noting any potential conflicts of interest. The Trustees also took into account the financial condition of the Investment Manager with respect to its ability to provide the services required under the Investment Management Agreement and the Investment Manager’s undertaking to maintain a contractual expense limitation for the Fund. The Trustees also considered the Investment Manager’s risk management processes. The Trustees also reviewed information relating to the Subadviser’s operations and personnel and the investment philosophy, strategies and techniques (its “Investment Strategy”) used in managing the Fund. Among other things, the Trustees reviewed information on portfolio management and other professional staff, information regarding the Subadviser’s organizational and management structure and the Subadviser’s brokerage policies and practices. The Trustees considered specific information provided regarding the experience of the individuals at the Subadviser with portfolio management responsibility for the Fund, including the information set forth in the Fund’s prospectus and statement of additional information. In the course of their deliberations, the Trustees evaluated, among other things: (a) the services rendered by the Subadviser in the past; (b) the qualifications and experience of the Subadviser’s personnel; and (c) the Subadviser’s compliance program. The Trustees also took into account the financial condition of the Subadviser with respect to its ability to provide the services required under the Subadvisory Agreement. The Trustees also considered the Subadviser’s risk management processes. PERFORMANCE The Board considered the Fund’s net performance during relevant time periods as compared to the Fund’s Peer Group and Fund Benchmark, considered |
18
| | |
| | | ITEM 11. STATEMENT REGARDING BASIS FOR APPROVAL OF INVESTMENT
ADVISORY CONTRACT (continued) |
| | | |
| | | |
| | | | | | | | |
the gross performance of the Fund as compared to the Subadviser’s relevant performance composite that utilizes a similar investment strategy and approach, and noted that the Board reviews on a quarterly basis detailed information about both the Fund’s performance results and portfolio composition, as well as the Subadviser’s Investment Strategy. The Board was mindful of the Investment Manager’s expertise, resources and attention to monitoring the Subadviser’s performance, investment style and risk-adjusted performance with respect to the Fund and its discussions with the management of the Fund’s subadviser during the period regarding the factors that contributed to the performance of the Fund. Among other information relating to the Fund’s performance, the Trustees noted that the Fund’s performance for Class N shares (which share class has the earliest inception date and the largest amount of assets of all the share classes of the Fund) for the 1-year, 3-year, 5-year and 10-year periods ended March 31, 2024, was below, below, below, and above, respectively, the median performance of the Peer Group and below, below, below, and above, respectively, the performance of the Fund Benchmark, the MSCI AC Asia Pacific ex Japan Index. The Trustees took into account management’s discussion of the Fund’s performance, including the reasons for the Fund’s more recent underperformance and the fact that the Fund ranked in the top third of its Peer Group for the 10-year period. The Trustees also took into account the fact that the Fund’s subadviser, investment strategy, and Fund Benchmark changed effective March 19, 2021, and that the performance information prior to that date reflected that of the Fund’s prior subadvisers and investment strategy. The Trustees considered management’s discussion that the Fund’s performance has been within management’s expectations since the current Subadviser assumed subadvisory responsibilities. The Trustees concluded that the Fund’s overall performance has been satisfactory in light of the Fund’s investment objective, strategies, and policies. ADVISORY AND SUBADVISORY FEES; FUND EXPENSES; PROFITABILTY; AND ECONOMIES OF SCALE In considering the reasonableness of the advisory fee payable to the Investment Manager, the Trustees reviewed information provided by the Investment Manager at the June 12, 2024 meeting and prior meetings setting forth all revenues and other benefits, both direct and indirect (including any so-called “fallout benefits” such as reputational value | | | | derived from the Investment Manager serving as Investment Manager to the Fund), received by the Investment Manager and its affiliates attributable to managing the Fund and all the mutual funds in the AMG Funds Family of Funds; the cost of providing such services; the significant risks undertaken as Investment Manager and sponsor of the Fund, including investment, operational, enterprise, entrepreneurial, litigation, regulatory and compliance risks; and the resulting profitability to the Investment Manager and its affiliates from these relationships. The Trustees also considered the amount of the advisory fee retained by the Investment Manager after payment of the subadvisory fee with respect to the Fund. The Trustees also noted payments are made from the Subadviser to the Investment Manager, and other payments are made from the Investment Manager to the Subadviser. The Trustees also considered management’s discussion of the current asset level of the Fund, and the impact on profitability of both the current asset level and any future growth of assets of the Fund. In considering the cost of services to be provided by the Investment Manager under the Investment Management Agreement and the profitability to the Investment Manager of its relationship with the Fund, the Trustees noted the undertaking by the Investment Manager to maintain a contractual expense limitation for the Fund. The Board also took into account management’s discussion of the advisory fee structure, and the services the Investment Manager provides in performing its functions under the Investment Management Agreement and supervising the Subadviser. Based on the foregoing, the Trustees concluded that the profitability to the Investment Manager is reasonable and that the Investment Manager is not realizing material benefits from economies of scale that would warrant adjustments to the advisory fee at this time. Also, with respect to economies of scale, the Trustees noted that as the Fund’s assets increase over time, the Fund may realize other economies of scale to the extent the increase in assets is proportionally greater than the increase in certain other expenses. In considering the reasonableness of the subadvisory fee payable by the Investment Manager to the Subadviser, the Trustees reviewed information regarding the cost to the Subadviser of providing subadvisory services to the Fund and the resulting profitability from the relationship. The Trustees noted that, because the Subadviser is an affiliate of the Investment Manager, a portion of the Subadviser’s revenues or profits might be shared directly or | | | | indirectly with the Investment Manager. The Trustees also noted that the subadvisory fees are paid by the Investment Manager out of its advisory fee. The Board also took into account management’s discussion of the subadvisory fee structure, and the services the Subadviser provides in performing its functions under the Subadvisory Agreement. Based on the foregoing, the Trustees concluded that the profitability to the Subadviser is reasonable and that the Subadviser is not realizing material benefits from economies of scale that would warrant adjustments to the subadvisory fees at this time. Also, with respect to economies of scale, the Trustees noted that as the Fund’s assets increase over time, the Fund may realize other economies of scale to the extent the increase in assets is proportionally greater than the increase in certain other expenses. The Trustees noted that the management fees (which include both the advisory and administration fees) and total expenses (net of applicable expense waivers/reimbursements) of Class I shares (the class of shares which is the primary focus of the Fund’s distribution) of the Fund as of March 31, 2024, were both rated in the Below Average rating level of the Fund’s Peer Group. The Trustees noted that the rating level corresponded to the Fund’s quintile ranking in its Peer Group. The Trustees took into account the fact that the Investment Manager has contractually agreed, through May 1, 2025, to limit the Fund’s net annual operating expenses (subject to certain excluded expenses) to 0.93%. The Trustees concluded that, in light of the nature, extent and quality of the services provided by the Investment Manager and the Subadviser (which is an affiliate of the Investment Manager), the foregoing expense limitation and the considerations noted above with respect to the Investment Manager and the Subadviser, the Fund’s advisory and subadvisory fees are reasonable. * * * * After consideration of the foregoing, the Trustees also reached the following conclusions (in addition to the conclusions discussed above) regarding the Investment Management Agreement and the Subadvisory Agreement: (a) the Investment Manager and the Subadviser have demonstrated that they possess the capability and resources to perform the duties required of them under the Investment Management Agreement and the Subadvisory Agreement and (b) the Investment Manager and Subadviser maintain appropriate compliance programs. |
19
| | |
| | | ITEM 11. STATEMENT REGARDING BASIS FOR APPROVAL OF INVESTMENT
ADVISORY CONTRACT (continued) |
| | | |
| | | |
| | | | | | | | |
Based on all of the above-mentioned factors and their related conclusions, with no single factor or conclusion being determinative and with each Trustee not necessarily attributing the same weight to each factor, the Trustees concluded that approval | | | | of the Investment Management Agreement and the Subadvisory Agreement would be in the best interests of the Fund and its shareholders. Accordingly, on June 12, 2024, the Trustees, and | | | | separately a majority of the Independent Trustees, voted to approve the Investment Management Agreement and the Subadvisory Agreement for the Fund. |
20
|
|
|
| |
| | | | | | | | |
INVESTMENT MANAGER AND ADMINISTRATOR AMG Funds LLC 680 Washington Blvd., Suite 500 Stamford, CT 06901 800.548.4539 DISTRIBUTOR AMG Distributors, Inc. 680 Washington Blvd., Suite 500 Stamford, CT 06901 800.548.4539 SUBADVISER Veritas Asset Management LLP 1 Smart’s Place London, WC2B 5LW CUSTODIAN The Bank of New York Mellon Mutual Funds Custody 240 Greenwich Street New York, NY 10286 | | | | LEGAL COUNSEL Ropes & Gray LLP Prudential Tower, 800 Boylston Street Boston, MA 02199-3600 TRANSFER AGENT BNY Mellon Investment Servicing (US) Inc. AMG Funds Attn: 534426 AIM 154-0520 500 Ross Street Pittsburgh, PA 15262 800.548.4539 TRUSTEES Jill R. Cuniff Kurt A. Keilhacker Peter W. MacEwen Steven J. Paggioli Eric Rakowski Victoria L. Sassine Garret W. Weston | | | | This report is prepared for the Fund’s shareholders. It is authorized for distribution to prospective investors only when preceded or accompanied by an effective prospectus. To receive a free copy of the prospectus or Statement of Additional Information, which includes additional information about Fund Trustees, please contact us by calling 800.548.4539. Distributed by AMG Distributors, Inc., member FINRA/SIPC. Current net asset values per share for the Fund are available on the Fund’s website at wealth.amg.com. A description of the policies and procedures the Fund uses to vote its proxies is available: (i) without charge, upon request, by calling 800.548.4539, or (ii) on the Securities and Exchange Commission’s (SEC) website at sec.gov. For information regarding the Fund’s proxy voting record for the 12-month period ended June 30, call 800.548.4539 or visit the SEC website at sec.gov. The Fund files its complete schedule of portfolio holdings with the SEC for the first and third quarters of each fiscal year as an exhibit to its reports on Form N-PORT. The Fund’s portfolio holdings on Form N-PORT are available on the SEC’s website at sec.gov and the Fund’s website at wealth.amg.com. To review a complete list of the Fund’s portfolio holdings, or to view the most recent semi-annual report or annual report, please visit wealth.amg.com. |
| | | | | | | | | |
| | | | | | | | | |
| | | | | | | | | |
| | | | | | | | | |
|
|
|
| |
| | | | | | | | |
EQUITY FUNDS AMG Boston Common Global Impact Boston Common Asset Management, LLC AMG Frontier Small Cap Growth Frontier Capital Management Co., LLC AMG GW&K Small Cap Core AMG GW&K Small Cap Value AMG GW&K Small/Mid Cap Core AMG GW&K Small/Mid Cap Growth AMG GW&K International Small Cap GW&K Investment Management, LLC AMG Montrusco Bolton Large Cap Growth Montrusco Bolton Investments, Inc. AMG Renaissance Large Cap Growth The Renaissance Group LLC | | | | AMG River Road Dividend All Cap Value AMG River Road Focused Absolute Value AMG River Road Large Cap Value Select AMG River Road Mid Cap Value AMG River Road Small-Mid Cap Value AMG River Road Small Cap Value River Road Asset Management, LLC AMG TimesSquare Emerging Markets Small Cap AMG TimesSquare Global Small Cap AMG TimesSquare International Small Cap AMG TimesSquare Mid Cap Growth AMG TimesSquare Small Cap Growth TimesSquare Capital Management, LLC AMG Veritas Asia Pacific AMG Veritas China AMG Veritas Global Focus AMG Veritas Global Real Return Veritas Asset Management LLP AMG Yacktman AMG Yacktman Focused AMG Yacktman Global AMG Yacktman Special Opportunities Yacktman Asset Management LP | | | | FIXED INCOME FUNDS AMG Beutel Goodman Core Plus Bond Beutel, Goodman & Company Ltd. AMG GW&K Core Bond ESG AMG GW&K ESG Bond AMG GW&K Municipal Bond AMG GW&K Municipal Enhanced Yield GW&K Investment Management, LLC ALTERNATIVE FUNDS AMG Systematica Managed Futures Strategy Systematica Investments Limited, acting as general partner of Systematica Investments LP |
| | | | |
| | | |
| wealth.amg.com | | | | 063024 SAR078 |
| | |
| | | SEMI-ANNUAL REPORT |
| | | | | | |
| | | | AMG Funds June 30, 2024 
AMG GW&K ESG Bond Fund |
| | | |
| | | | | Class N: MGFIX | Class I: MGBIX |
| | | |
| | | | | AMG GW&K Enhanced Core Bond ESG Fund |
| | | |
| | | | | Class N: MFDAX | Class I: MFDSX | Class Z: MFDYX |
| | | |
| | | | | AMG GW&K High Income Fund |
| | | |
| | | | | Class N: MGGBX | Class I: GWHIX |
| | | |
| | | | | AMG GW&K Municipal Bond Fund |
| | | |
| | | | | Class N: GWMTX | Class I: GWMIX |
| | | |
| | | | | AMG GW&K Municipal Enhanced Yield Fund |
| | | |
| | | | | Class N: GWMNX | Class I: GWMEX | Class Z: GWMZX |
| | | | |
| | | | | | | |
| | | | |
| | |
wealth.amg.com | | | | 063024 SAR088 |
| | |
| | | AMG Funds Semi-Annual Report — June 30, 2024 (unaudited) |
Nothing contained herein is to be considered an offer, sale or solicitation of an offer to buy shares of any series of the AMG Funds Family of Funds. Such offering is made only by prospectus, which includes details as to offering price and other material information.
|
AMG GW&K ESG Bond Fund Schedule of Portfolio Investments (unaudited) June 30, 2024 |
| | | | | | | | |
| | | Principal Amount | | | Value | |
| |
Corporate Bonds and Notes - 49.4% | | | | | |
| | |
Basic Materials - 5.3% | | | | | | | | |
| | |
Air Products and Chemicals, Inc.
2.700%, 05/15/40 | | | $1,950,000 | | | | $1,391,102 | |
| | |
Alcoa Nederland Holding, B.V. (Netherlands)
4.125%, 03/31/291,2 | | | 2,150,000 | | | | 1,994,152 | |
| | |
Celanese US Holdings LLC
6.550%, 11/15/30 | | | 3,999,000 | | | | 4,178,928 | |
| | |
CF Industries, Inc.
5.150%, 03/15/34 | | | 1,170,000 | | | | 1,121,948 | |
| | |
FMG Resources August 2006 Pty, Ltd. (Australia)
4.500%, 09/15/271,2 | | | 2,750,000 | | | | 2,627,765 | |
| | |
Freeport-McMoRan, Inc.
4.625%, 08/01/30 | | | 2,111,000 | | | | 2,030,806 | |
| | |
HB Fuller Co.
4.250%, 10/15/28 | | | 3,150,000 | | | | 2,968,948 | |
| | |
Methanex Corp. (Canada)
5.125%, 10/15/27 | | | 1,205,000 | | | | 1,162,315 | |
| | |
Novelis Corp.
3.250%, 11/15/261 | | | 2,175,000 | | | | 2,046,684 | |
| | |
Steel Dynamics, Inc.
5.375%, 08/15/34 | | | 1,540,000 | | | | 1,513,646 | |
| | |
Total Basic Materials | | | | | | | 21,036,294 | |
| | |
Communications - 4.1% | | | | | | | | |
| | |
AT&T, Inc.
4.300%, 02/15/30 | | | 1,000,000 | | | | 958,037 | |
| | |
CCO Holdings LLC/CCO Holdings Capital Corp.
4.500%, 05/01/32 | | | 2,500,000 | | | | 2,013,553 | |
| | |
Cisco Systems, Inc.
5.500%, 01/15/40 | | | 1,400,000 | | | | 1,421,147 | |
| | |
Cogent Communications Group, Inc.
3.500%, 05/01/261 | | | 3,365,000 | | | | 3,222,565 | |
| | |
Comcast Corp.
4.650%, 02/15/332 | | | 2,117,000 | | | | 2,043,823 | |
| | |
Discovery Communications LLC
3.950%, 03/20/28 | | | 2,047,000 | | | | 1,913,044 | |
| | |
Lamar Media Corp.
4.875%, 01/15/29 | | | 3,250,000 | | | | 3,123,034 | |
| | |
Verizon Communications, Inc.
5.500%, 02/23/542 | | | 1,625,000 | | | | 1,590,747 | |
| | |
Total Communications | | | | | | | 16,285,950 | |
| | |
Consumer, Cyclical - 7.8% | | | | | | | | |
| | |
Air Canada (Canada)
3.875%, 08/15/261 | | | 1,180,000 | | | | 1,122,406 | |
| | |
Aramark Services, Inc.
5.000%, 02/01/281 | | | 3,020,000 | | | | 2,920,711 | |
| | |
Caesars Entertainment, Inc.
6.500%, 02/15/321 | | | 975,000 | | | | 979,781 | |
| | |
Hasbro, Inc.
3.900%, 11/19/292 | | | 3,105,000 | | | | 2,863,719 | |
| | | | | | | | |
| | | Principal Amount | | | Value | |
| | |
Hilton Domestic Operating Co., Inc.
4.875%, 01/15/30 | | | $2,600,000 | | | | $2,495,414 | |
| | |
The Home Depot, Inc.
5.875%, 12/16/36 | | | 1,450,000 | | | | 1,536,344 | |
| | |
KB Home
4.800%, 11/15/29 | | | 1,222,000 | | | | 1,152,163 | |
6.875%, 06/15/27 | | | 1,726,000 | | | | 1,761,145 | |
| | |
M/I Homes, Inc.
3.950%, 02/15/30 | | | 335,000 | | | | 298,599 | |
| | |
Mattel, Inc.
3.750%, 04/01/291 | | | 1,075,000 | | | | 991,402 | |
6.200%, 10/01/40 | | | 1,661,000 | | | | 1,637,230 | |
| | |
Murphy Oil USA, Inc.
4.750%, 09/15/29 | | | 2,250,000 | | | | 2,131,197 | |
| | |
Penske Automotive Group, Inc.
3.750%, 06/15/29 | | | 1,750,000 | | | | 1,579,383 | |
| | |
PulteGroup, Inc.
6.000%, 02/15/35 | | | 2,050,000 | | | | 2,107,294 | |
| | |
Toll Brothers Finance Corp.
4.875%, 03/15/27 | | | 2,225,000 | | | | 2,191,897 | |
| | |
Travel + Leisure Co.
4.625%, 03/01/301 | | | 575,000 | | | | 523,282 | |
6.000%, 04/01/273 | | | 475,000 | | | | 473,996 | |
| | |
Walmart, Inc.
4.050%, 06/29/48 | | | 1,850,000 | | | | 1,536,302 | |
| | |
Yum! Brands, Inc.
3.625%, 03/15/312 | | | 3,010,000 | | | | 2,656,460 | |
| | |
Total Consumer, Cyclical | | | | | | | 30,958,725 | |
| | |
Consumer, Non-cyclical - 8.1% | | | | | | | | |
| | |
Advocate Health & Hospitals Corp.
4.272%, 08/15/48 | | | 1,670,000 | | | | 1,433,894 | |
| | |
Anheuser-Busch InBev Worldwide, Inc.
4.375%, 04/15/38 | | | 2,200,000 | | | | 2,002,577 | |
| | |
APi Group DE, Inc.
4.125%, 07/15/291 | | | 1,255,000 | | | | 1,142,051 | |
| | |
Ashtead Capital, Inc.
1.500%, 08/12/261 | | | 1,786,000 | | | | 1,627,978 | |
| | |
Campbell Soup Co.
2.375%, 04/24/30 | | | 2,180,000 | | | | 1,875,782 | |
| | |
Centene Corp.
3.375%, 02/15/30 | | | 3,620,000 | | | | 3,213,161 | |
| | |
CommonSpirit Health
3.347%, 10/01/29 | | | 1,075,000 | | | | 986,744 | |
| | |
The Ford Foundation
Series 2020, 2.415%, 06/01/50 | | | 2,690,000 | | | | 1,615,705 | |
| | |
HCA, Inc.
3.500%, 09/01/30 | | | 3,050,000 | | | | 2,751,212 | |
| | |
Kraft Heinz Foods Co.
4.625%, 10/01/39 | | | 2,480,000 | | | | 2,196,793 | |
The accompanying notes are an integral part of these financial statements.
2
|
AMG GW&K ESG Bond Fund Schedule of Portfolio Investments (continued) |
| | | | | | | | |
| | | Principal Amount | | | Value | |
| |
Consumer, Non-cyclical - 8.1% (continued) | | | | | |
| | |
Prime Security Services Borrower LLC/Prime Finance, Inc.
5.750%, 04/15/261 | | | $2,800,000 | | | | $2,778,726 | |
| | |
Sysco Corp.
2.400%, 02/15/30 | | | 2,125,000 | | | | 1,841,112 | |
| | |
Teleflex, Inc.
4.250%, 06/01/281 | | | 2,120,000 | | | | 1,997,823 | |
| | |
Tenet Healthcare Corp.
4.625%, 06/15/28 | | | 1,735,000 | | | | 1,649,982 | |
| | |
Teva Pharmaceutical Finance Netherlands III, B.V. (Netherlands)
5.125%, 05/09/292 | | | 2,300,000 | | | | 2,212,528 | |
| | |
United Rentals North America, Inc.
3.875%, 02/15/312 | | | 3,400,000 | | | | 3,033,331 | |
| | |
Total Consumer, Non-cyclical | | | | | | | 32,359,399 | |
| | |
Financials - 11.4% | | | | | | | | |
| | |
Bank of America Corp. | | | | | | | | |
MTN, (4.330% to 03/15/49 then 3 month SOFR + 1.782%), 4.330%, 03/15/504,5 | | | 2,775,000 | | | | 2,316,555 | |
(5.872% to 09/15/33 then SOFR + 1.840%), 5.872%, 09/15/344,5 | | | 3,050,000 | | | | 3,137,520 | |
| | |
The Bank of New York Mellon Corp. | | | | | | | | |
Series H, (3.700% to 03/20/26 then U.S. Treasury Yield Curve CMT 5 year + 3.352%), 3.700%, 03/20/262,4,5,6 | | | 2,165,000 | | | | 2,056,458 | |
| | |
The Charles Schwab Corp. | | | | | | | | |
Series G, (5.375% to 06/01/25 then U.S. Treasury Yield Curve CMT 5 year + 4.971%), 5.375%, 06/01/254,5,6 | | | 2,000,000 | | | | 1,977,550 | |
| | |
Citigroup, Inc. | | | | | | | | |
Series P, (5.950% to 05/15/25 then 3 month SOFR + 4.167%), 5.950%, 05/15/252,4,5,6 | | | 1,550,000 | | | | 1,539,872 | |
Series T, (6.250% to 08/15/26 then 3 month SOFR + 4.779%), 6.250%, 08/15/264,5,6 | | | 1,075,000 | | | | 1,074,249 | |
| | |
Crown Castle, Inc.
4.000%, 03/01/27 | | | 1,040,000 | | | | 1,004,509 | |
| | |
The Goldman Sachs Group, Inc. | | | | | | | | |
Series X, (7.500% to 05/10/29 then U.S. Treasury Yield Curve CMT 5 year + 2.809%), 7.500%, 05/10/294,5,6 | | | 2,977,000 | | | | 3,061,410 | |
| | |
Huntington Bancshares, Inc. | | | | | | | | |
(4.443% to 08/04/27 then SOFR + 1.970%), 4.443%, 08/04/282,4,5 | | | 2,430,000 | | | | 2,353,840 | |
| | |
JPMorgan Chase & Co. | | | | | | | | |
(3.157% to 04/22/41 then SOFR + 1.460%), 3.157%, 04/22/424,5 | | | 2,710,000 | | | | 2,016,652 | |
| | |
MetLife, Inc. | | | | | | | | |
Series G, (3.850% to 09/15/25 then U.S. Treasury Yield Curve CMT 5 year + 3.576%), 3.850%, 09/15/252,4,5,6 | | | 2,130,000 | | | | 2,061,543 | |
| | | | | | | | |
| | | Principal Amount | | | Value | |
| | |
Morgan Stanley | | | | | | | | |
(4.431% to 01/23/29 then 3 month SOFR + 1.890%), 4.431%, 01/23/304,5 | | | $2,048,000 | | | | $1,981,213 | |
| | |
The PNC Financial Services Group, Inc. | | | | | | | | |
(5.068% to 01/24/33 then SOFR + 1.933%), 5.068%, 01/24/344,5 | | | 2,386,000 | | | | 2,306,181 | |
| | |
SBA Communications Corp.
3.875%, 02/15/27 | | | 1,265,000 | | | | 1,205,581 | |
| | |
SLM Corp.
3.125%, 11/02/26 | | | 3,365,000 | | | | 3,134,398 | |
4.200%, 10/29/25 | | | 838,000 | | | | 815,127 | |
| | |
Starwood Property Trust, Inc.
4.375%, 01/15/271,2 | | | 1,775,000 | | | | 1,680,520 | |
| | |
Truist Financial Corp., MTN | | | | | | | | |
(5.867% to 06/08/33 then SOFR + 2.361%), 5.867%, 06/08/344,5 | | | 2,288,000 | | | | 2,305,382 | |
| | |
US Bancorp | | | | | | | | |
(5.775% to 06/12/28 then SOFR + 2.020%), 5.775%, 06/12/294,5 | | | 2,350,000 | | | | 2,385,582 | |
| | |
Wells Fargo & Co. | | | | | | | | |
Series U, 5.875%, 06/15/252,5,6 | | | 4,228,000 | | | | 4,208,681 | |
| | |
Weyerhaeuser Co.
6.875%, 12/15/33 | | | 2,600,000 | | | | 2,839,290 | |
| | |
Total Financials | | | | | | | 45,462,113 | |
| | |
Industrials - 7.8% | | | | | | | | |
| | |
AECOM
5.125%, 03/15/27 | | | 1,650,000 | | | | 1,621,413 | |
| | |
Ball Corp.
2.875%, 08/15/30 | | | 3,625,000 | | | | 3,079,535 | |
| | |
BWX Technologies, Inc.
4.125%, 06/30/281 | | | 1,210,000 | | | | 1,129,386 | |
| | |
Clean Harbors, Inc.
4.875%, 07/15/271 | | | 2,070,000 | | | | 2,003,631 | |
| | |
Clearwater Paper Corp.
4.750%, 08/15/281 | | | 1,950,000 | | | | 1,802,552 | |
| | |
Crown Americas LLC/Crown Americas Capital Corp. V
4.250%, 09/30/26 | | | 1,650,000 | | | | 1,589,855 | |
| | |
Graphic Packaging International LLC
3.500%, 03/01/291 | | | 2,850,000 | | | | 2,554,238 | |
| | |
Howmet Aerospace, Inc.
6.875%, 05/01/25 | | | 1,025,000 | | | | 1,032,580 | |
| | |
Jacobs Engineering Group, Inc.
5.900%, 03/01/33 | | | 4,068,000 | | | | 4,065,861 | |
| | |
L3Harris Technologies, Inc.
5.050%, 06/01/29 | | | 2,047,000 | | | | 2,032,611 | |
| | |
Mueller Water Products, Inc.
4.000%, 06/15/291 | | | 3,000,000 | | | | 2,746,733 | |
| | |
Owens Corning
7.000%, 12/01/363 | | | 1,800,000 | | | | 2,001,789 | |
The accompanying notes are an integral part of these financial statements.
3
|
AMG GW&K ESG Bond Fund Schedule of Portfolio Investments (continued) |
| | | | | | | | |
| | | Principal Amount | | | Value | |
| | |
Industrials - 7.8% (continued) | | | | | | | | |
| | |
Packaging Corp. of America 5.700%, 12/01/33 | | | $2,140,000 | | | | $2,173,760 | |
| | |
Sonoco Products Co. 2.850%, 02/01/322 | | | 1,822,000 | | | | 1,513,868 | |
| | |
United Parcel Service, Inc. 6.200%, 01/15/38 | | | 1,500,000 | | | | 1,624,071 | |
| | |
Total Industrials | | | | | | | 30,971,883 | |
| | |
Technology - 4.1% | | | | | | | | |
| | |
Broadcom, Inc.
4.300%, 11/15/32 | | | 2,820,000 | | | | 2,635,768 | |
| | |
Crowdstrike Holdings, Inc. 3.000%, 02/15/29 | | | 1,285,000 | | | | 1,158,615 | |
| | |
Dell International LLC/EMC Corp. 8.100%, 07/15/36 | | | 972,000 | | | | 1,159,186 | |
| | |
Kyndryl Holdings, Inc. 3.150%, 10/15/31 | | | 2,375,000 | | | | 1,988,816 | |
| | |
Microsoft Corp.
2.525%, 06/01/50 | | | 2,450,000 | | | | 1,546,975 | |
| | |
MSCI, Inc.
3.250%, 08/15/331 | | | 2,015,000 | | | | 1,664,657 | |
| | |
Open Text Holdings, Inc. 4.125%, 02/15/301 | | | 1,125,000 | | | | 1,014,531 | |
| | |
SK Hynix, Inc. (South Korea) 2.375%, 01/19/311,2 | | | 3,000,000 | | | | 2,470,708 | |
| | |
Twilio, Inc.
3.625%, 03/15/29 | | | 600,000 | | | | 539,693 | |
3.875%, 03/15/31 | | | 2,194,000 | | | | 1,929,589 | |
| | |
Total Technology | | | | | | | 16,108,538 | |
| | |
Utilities - 0.8% | | | | | | | | |
| | |
National Rural Utilities Cooperative Finance Corp.
1.350%, 03/15/31 | | | 4,160,000 | | | | 3,254,178 | |
| | |
Total Corporate Bonds and Notes
(Cost $209,632,616) | | | | | | | 196,437,080 | |
| | |
Asset-Backed Securities - 2.6% | | | | | | | | |
| | |
American Express Credit Account Master Trust
Series 2022-4, Class A
4.950%, 10/15/27 | | | 2,145,000 | | | | 2,134,255 | |
| | |
Ford Credit Auto Owner Trust
Series 2022-B, Class A4
3.930%, 08/15/27 | | | 2,353,000 | | | | 2,304,254 | |
| | |
John Deere Owner Trust
Series 2022-A, Class A4
2.490%, 01/16/29 | | | 2,206,000 | | | | 2,128,936 | |
| | |
Santander Drive Auto Receivables Trust | | | | | | | | |
Series 2020-4, Class D 1.480%, 01/15/27 | | | 1,033,155 | | | | 1,020,406 | |
Series 2022-7, Class B 5.950%, 01/17/28 | | | 2,100,000 | | | | 2,103,264 | |
| | | | | | | | |
| | | | | | | | |
| | | Principal Amount | | | Value | |
| | |
Toyota Auto Receivables Owner Trust Series 2021-B, Class A4 0.530%, 10/15/26 | | | $923,000 | | | | $889,106 | |
| | |
Total Asset-Backed Securities
(Cost $10,579,582) | | | | | | | 10,580,221 | |
| | |
Mortgage-Backed Securities - 1.8% | | | | | | | | |
| | |
Chase Home Lending Mortgage Trust Series
Series 2024-1, Class A6 6.500%, 01/25/551,5 | | | 1,477,496 | | | | 1,477,549 | |
| | |
GS Mortgage-Backed Securities Corp. Trust Series 2021-PJ4, Class A6 2.500%, 09/25/511,5 | | | 2,833,934 | | | | 2,559,504 | |
Series 2021-PJ9, Class A8 2.500%, 02/26/521,5 | | | 1,603,894 | | | | 1,380,042 | |
| | |
Morgan Stanley Residential Mortgage Loan Trust
Series 2024-1, Class A4 5.500%, 12/25/531,5 | | | 1,763,108 | | | | 1,736,258 | |
| | |
Total Mortgage-Backed Securities
(Cost $7,193,154) | | | | | | | 7,153,353 | |
| | |
Municipal Bonds - 4.1% | | | | | | | | |
| | |
California Health Facilities Financing Authority
4.190%, 06/01/37 | | | 3,500,000 | | | | 3,186,492 | |
| | |
California State General Obligation, School Improvements, Build America Bonds
7.550%, 04/01/39 | | | 2,280,000 | | | | 2,710,271 | |
| | |
Dallas Fort Worth International Airport, Series A
4.507%, 11/01/51 | | | 1,000,000 | | | | 887,557 | |
| | |
JobsOhio Beverage System, Series A 2.833%, 01/01/38 | | | 3,700,000 | | | | 2,999,107 | |
| | |
New Jersey Economic Development Authority, Pension Funding, Series A (National Insured)
7.425%, 02/15/29 | | | 3,300,000 | | | | 3,515,407 | |
| | |
Port Authority of New York & New Jersey
6.040%, 12/01/29 | | | 1,750,000 | | | | 1,845,486 | |
| | |
University of California, Series BI 1.697%, 05/15/29 | | | 1,200,000 | | | | 1,045,344 | |
| | |
Total Municipal Bonds
(Cost $19,056,858) | | | | | | | 16,189,664 | |
| | |
| U.S. Government and Agency Obligations - 40.8% | | | | | | | | |
| | |
Fannie Mae - 15.1% | | | | | | | | |
| | |
FNMA
3.500%, 02/01/35 to 02/01/51 | | | 31,056,233 | | | | 28,470,120 | |
4.000%, 07/01/44 to 06/01/49 | | | 19,040,988 | | | | 17,735,219 | |
4.500%, 05/01/48 to 06/01/49 | | | 5,752,762 | | | | 5,571,299 | |
5.000%, 05/01/50 | | | 2,534,435 | | | | 2,495,730 | |
5.500%, 11/01/52 | | | 5,968,968 | | | | 5,985,090 | |
| | |
Total Fannie Mae | | | | | | | 60,257,458 | |
| | |
Freddie Mac - 13.1% | | | | | | | | |
| | |
FHLMC 2.000%, 03/01/36 | | | 7,193,037 | | | | 6,359,346 | |
3.000%, 04/01/51 | | | 14,669,979 | | | | 12,619,470 | |
| | | | | | | | |
The accompanying notes are an integral part of these financial statements.
4
|
AMG GW&K ESG Bond Fund Schedule of Portfolio Investments (continued) |
| | | | | | | | |
| | | Principal Amount | | | Value | |
| | |
Freddie Mac - 13.1% (continued) | | | | | | | | |
| | |
FHLMC
3.500%, 02/01/50 | | | $8,159,261 | | | | $7,313,927 | |
4.500%, 10/01/48 to 12/01/48 | | | 8,498,652 | | | | 8,132,686 | |
5.500%, 07/01/53 | | | 6,245,176 | | | | 6,235,153 | |
| | |
Freddie Mac Multifamily Structured Pass Through Certificates | | | | | | | | |
Series K134, Class A2 2.243%, 10/25/315 | | | 6,230,000 | | | | 5,266,018 | |
| | |
Freddie Mac REMICS | | | | | | | | |
Series 5106, Class KA 2.000%, 03/25/41 | | | 4,451,607 | | | | 4,026,193 | |
Series 5297, Class DA 5.000%, 12/25/52 | | | 2,044,893 | | | | 1,985,526 | |
| | |
Total Freddie Mac | | | | | | | 51,938,319 | |
| | |
Ginnie Mae - 0.5% | | | | | | | | |
| | |
GNMA | | | | | | | | |
Series 2023-111, Class FD
(SOFR + 1.000%, Cap 7.000%, Floor 1.000%), 6.333%, 08/20/535 | | | 2,053,842 | | | | 2,045,919 | |
| |
U.S. Treasury Obligations - 12.1% | | | | | |
| | |
U.S. Treasury Bonds 1.250%, 05/15/50 | | | 5,625,000 | | | | 2,787,891 | |
1.875%, 02/15/51 | | | 14,997,000 | | | | 8,758,014 | |
2.250%, 05/15/41 | | | 16,359,000 | | | | 11,835,992 | |
2.500%, 02/15/46 | | | 2,096,000 | | | | 1,476,861 | |
3.125%, 05/15/48 | | | 10,968,000 | | | | 8,529,334 | |
3.500%, 02/15/39 | | | 5,500,000 | | | | 4,948,926 | |
| | |
| | | | | | | | |
| | | | | | | | |
| | | Principal Amount | | | Value | |
| | |
U.S. Treasury Bonds
3.625%, 02/15/53 | | | $2,010,000 | | | | $1,709,913 | |
3.875%, 02/15/43 | | | 4,474,000 | | | | 4,044,076 | |
| | |
U.S. Treasury Notes
3.875%, 11/30/29 | | | 4,100,000 | | | | 4,004,547 | |
| | |
Total U.S. Treasury Obligations | | | | | | | 48,095,554 | |
| |
Total U.S. Government and Agency Obligations
(Cost $190,986,432) | | | | 162,337,250 | |
| | |
Short-Term Investments - 5.1% | | | | | | | | |
| |
Joint Repurchase Agreements - 4.2%7 | | | | | |
| | |
State of Wisconsin Investment Board, dated 06/28/24, due 07/01/24, 5.450% total to be received $16,832,736 (collateralized by various U.S. Treasuries, 0.125% - 3.625%, 10/15/25 - 02/15/53, totaling $17,128,784) | | | 16,825,095 | | | | 16,825,095 | |
| |
Repurchase Agreements - 0.9% | | | | | |
| | |
Fixed Income Clearing Corp., dated 06/28/24, due 07/01/24, 5.150% total to be received $3,469,488 (collateralized by a U.S. Treasury Note, 0.125%, 04/15/25, totaling $3,537,438) | | | 3,468,000 | | | | 3,468,000 | |
| | |
Total Short-Term Investments
(Cost $20,293,095) | | | | | | | 20,293,095 | |
| | |
Total Investments - 103.8%
(Cost $457,741,737) | | | | | | | 412,990,663 | |
| |
Other Assets, less Liabilities - (3.8)% | | | | (15,112,297 | ) |
| | |
Net Assets - 100.0% | | | | | | | $397,878,366 | |
| | |
| | | | | | | | |
| 1 | Security exempt from registration under Rule 144A of the Securities Act of 1933. These securities may be resold in transactions exempt from registration, normally to qualified institutional buyers. At June 30, 2024, the value of these securities amounted to $48,195,635 or 12.1% of net assets. |
| 2 | Some of these securities, amounting to $21,447,918 or 5.4% of net assets, were out on loan to various borrowers and are collateralized by cash and various U.S. Treasury Obligations. See Note 4 of Notes to Financial Statements. |
| 3 | Step Bond: A debt instrument with either deferred interest payments or an interest rate that resets at specific times during its term. |
| 4 | Fixed to variable rate investment. The rate shown reflects the fixed rate in effect at June 30, 2024. Rate will reset at a future date. |
| 5 | Variable rate security. The rate shown is based on the latest available information as of June 30, 2024. Certain variable rate securities are not based on a published reference rate and spread but are determined by the issuer or agent and are based on current market conditions. These securities do not indicate a reference rate and spread in their description above. |
| 6 | Perpetuity Bond. The date shown represents the next call date. |
| 7 | Cash collateral received for securities lending activity was invested in these joint repurchase agreements. |
| CMT | Constant Maturity Treasury |
| National Insured | National Public Finance Guarantee Corp. |
| REMICS | Real Estate Mortgage Investment Conduit |
| SOFR | Secured Overnight Financing Rate |
The accompanying notes are an integral part of these financial statements.
5
|
AMG GW&K ESG Bond Fund Schedule of Portfolio Investments (continued) |
The following table summarizes the inputs used to value the Fund’s investments by the fair value hierarchy levels as of June 30, 2024:
| | | | | | | | | | | | | | | | |
| | | Level 1 | | | Level 2 | | | Level 3 | | | Total | |
Investments in Securities | | | | | | | | | | | | | | | | |
| | | | |
Corporate Bonds and Notes† | | | — | | | $ | 196,437,080 | | | | — | | | $ | 196,437,080 | |
| | | | |
Asset-Backed Securities | | | — | | | | 10,580,221 | | | | — | | | | 10,580,221 | |
| | | | |
Mortgage-Backed Securities | | | — | | | | 7,153,353 | | | | — | | | | 7,153,353 | |
| | | | |
Municipal Bonds† | | | — | | | | 16,189,664 | | | | — | | | | 16,189,664 | |
| | | | |
U.S. Government and Agency Obligations† | | | — | | | | 162,337,250 | | | | — | | | | 162,337,250 | |
| | | | |
Short-Term Investments | | | | | | | | | | | | | | | | |
| | | | |
Joint Repurchase Agreements | | | — | | | | 16,825,095 | | | | — | | | | 16,825,095 | |
| | | | |
Repurchase Agreements | | | — | | | | 3,468,000 | | | | — | | | | 3,468,000 | |
| | | | | | | | | | | | | | | | |
| | | | |
Total Investments in Securities | | | — | | | $ | 412,990,663 | | | | — | | | $ | 412,990,663 | |
| | | | | | | | | | | | | | | | |
| † | All corporate bonds and notes, municipal bonds and U.S. government and agency obligations held in the Fund are Level 2 securities. For a detailed breakout of corporate bonds and notes, municipal bonds and U.S. government and agency obligations by major industry or agency classification, please refer to the Fund’s Schedule of Portfolio Investments. |
For the six months ended June 30, 2024, there were no transfers in or out of Level 3.
The accompanying notes are an integral part of these financial statements.
6
|
AMG GW&K Enhanced Core Bond ESG Fund Schedule of Portfolio Investments (unaudited) June 30, 2024 |
| | | | | | | | |
| | | Shares | | | Value | |
| | |
Short-Term Investments - 100.3% | | | | | | | | |
| |
Other Investment Companies - 100.3% | | | | | |
| | |
Dreyfus Institutional Preferred Government Money Market Fund, Institutional Shares, 5.27%1,2 | | | 27,524,882 | | | | $27,524,882 | |
| | |
Total Short-Term Investments
(Cost $27,524,882) | | | | | | | 27,524,882 | |
| | | | | | | | |
| | | | | | | | |
| | | | | | Value | |
| | |
Total Investments - 100.3%
(Cost $27,524,882) | | | | | | | $27,524,882 | |
| | |
Other Assets, less Liabilities - (0.3)% | | | | | | | (89,795 | ) |
| | |
Net Assets - 100.0% | | | | | | | $27,435,087 | |
| | | | | | | | |
| 1 | Yield shown represents the June 30, 2024, seven day average yield, which refers to the sum of the previous seven days’ dividends paid, expressed as an annual percentage. |
| 2 | A copy of the security’s annual report to shareholders may be obtained without charge on the SEC’s website (http://www.sec.gov). |
The following table summarizes the inputs used to value the Fund’s investments by the fair value hierarchy levels as of June 30, 2024:
| | | | | | | | | | | | | | | | | | | | | | | | | | | | | | | | |
| | | | | | Level 1 | | | | | | Level 2 | | | | | | Level 3 | | | | | | Total | |
Investments in Securities | | | | | | | | | | | | | | | | | | | | | | | | | | | | | | | | |
| | | | | | | | |
Short-Term Investments | | | | | | | | | | | | | | | | | | | | | | | | | | | | | | | | |
| | | | | | | | |
Other Investment Companies | | | | | | $ | 27,524,882 | | | | | | | | — | | | | | | | | — | | | | | | | $ | 27,524,882 | |
| | | | | | | | | | | | | | | | | | | | | | | | | | | | | | | | |
Total Investments in Securities | | | | | | $ | 27,524,882 | | | | | | | | — | | | | | | | | — | | | | | | | $ | 27,524,882 | |
| | | | | | | | | | | | | | | | | | | | | | | | | | | | | | | | |
For the six months ended June 30, 2024, there were no transfers in or out of Level 3.
The accompanying notes are an integral part of these financial statements.
7
|
AMG GW&K High Income Fund Schedule of Portfolio Investments (unaudited) June 30, 2024 |
| | | | | | | | |
| | | Shares | | | Value | |
| | |
Short-Term Investments - 100.9% | | | | | | | | |
| |
Other Investment Companies - 100.9% | | | | | |
| | |
Dreyfus Institutional Preferred Government Money Market Fund, Institutional Shares, 5.27%1,2 | | | 6,746,570 | | | | $6,746,570 | |
| | |
Total Short-Term Investments
(Cost $6,746,570) | | | | | | | 6,746,570 | |
| | |
| | | | | | | | |
| | | | | | | | |
| | | | | | Value | |
| | |
Total Investments - 100.9%
(Cost $6,746,570) | | | | | | | $6,746,570 | |
| | |
Other Assets, less Liabilities - (0.9)% | | | | | | | (60,255 | ) |
| | |
Net Assets - 100.0% | | | | | | | $6,686,315 | |
| | | | | | | | |
| 1 | Yield shown represents the June 30, 2024, seven day average yield, which refers to the sum of the previous seven days’ dividends paid, expressed as an annual percentage. |
| 2 | A copy of the security’s annual report to shareholders may be obtained without charge on the SEC’s website (http://www.sec.gov). |
The following table summarizes the inputs used to value the Fund’s investments by the fair value hierarchy levels as of June 30, 2024:
| | | | | | | | | | | | | | | | | | | | | | | | | | | | | | | | |
| | | | | | Level 1 | | | | | | Level 2 | | | | | | Level 3 | | | | | | Total | |
Investments in Securities | | | | | | | | | | | | | | | | | | | | | | | | | | | | | | | | |
| | | | | | | | |
Short-Term Investments | | | | | | | | | | | | | | | | | | | | | | | | | | | | | | | | |
| | | | | | | | |
Other Investment Companies | | | | | | $ | 6,746,570 | | | | | | | | — | | | | | | | | — | | | | | | | $ | 6,746,570 | |
| | | | | | | | | | | | | | | | | | | | | | | | | | | | | | | | |
Total Investments in Securities | | | | | | $ | 6,746,570 | | | | | | | | — | | | | | | | | — | | | | | | | $ | 6,746,570 | |
| | | | | | | | | | | | | | | | | | | | | | | | | | | | | | | | |
For the six months ended June 30, 2024, there were no transfers in or out of Level 3.
The accompanying notes are an integral part of these financial statements.
8
|
AMG GW&K Municipal Bond Fund Schedule of Portfolio Investments (unaudited) June 30, 2024 |
| | | | | | | | |
| | | Principal Amount | | | Value | |
| | |
Municipal Bonds - 101.8% | | | | | | | | |
| | |
Alabama - 1.4% | | | | | | | | |
| | |
Alabama Public School and College Authority, Series A
5.000%, 11/01/34 | | | $7,500,000 | | | | $8,335,789 | |
| | |
County of Jefferson
5.250%, 10/01/49 | | | 5,810,000 | | | | 6,214,269 | |
| | |
Total Alabama | | | | | | | 14,550,058 | |
| | |
Arizona - 1.3% | | | | | | | | |
| | |
Arizona Board of Regents
5.000%, 08/01/31 | | | 3,400,000 | | | | 3,818,486 | |
| | |
City of Glendale
5.000%, 07/01/36 | | | 4,920,000 | | | | 5,694,528 | |
| | |
Maricopa County Industrial Development Authority, Series D,
5.000%, 12/01/401 | | | 2,150,000 | | | | 2,312,981 | |
5.000%, 12/01/411 | | | 1,000,000 | | | | 1,069,430 | |
| | |
Total Arizona | | | | | | | 12,895,425 | |
| | |
California - 6.0% | | | | | | | | |
| | |
California Municipal Finance Authority, Community Medical Centers, Series A
5.000%, 02/01/31 | | | 900,000 | | | | 920,352 | |
| | |
City of Los Angeles Department of Airports, Series C
5.000%, 05/15/30 | | | 5,515,000 | | | | 5,948,709 | |
| | |
Los Angeles Unified School District, Series A
5.000%, 07/01/33 | | | 6,500,000 | | | | 7,546,486 | |
| | |
San Francisco City & County Airport Commission, San Francisco International Airport, Series A,
5.000%, 05/01/32 | | | 3,000,000 | | | | 3,243,987 | |
5.000%, 05/01/34 | | | 5,010,000 | | | | 5,285,475 | |
5.000%, 05/01/35 | | | 5,800,000 | | | | 6,116,595 | |
| | |
State of California,
5.000%, 09/01/29 | | | 4,075,000 | | | | 4,216,245 | |
5.000%, 09/01/33 | | | 5,000,000 | | | | 5,819,366 | |
5.000%, 09/01/35 | | | 5,000,000 | | | | 5,807,067 | |
5.000%, 09/01/35 | | | 2,500,000 | | | | 2,922,564 | |
5.000%, 10/01/36 | | | 5,000,000 | | | | 5,772,007 | |
| | |
The Regents of the University of California, Series BV
5.000%, 05/15/40 | | | 6,000,000 | | | | 6,878,773 | |
| | |
Total California | | | | | | | 60,477,626 | |
| | |
Colorado - 0.5% | | | | | | | | |
| | |
Colorado Health Facilities Authority, Series A
5.000%, 08/01/33 | | | 4,260,000 | | | | 4,549,625 | |
| | |
Connecticut - 4.0% | | | | | | | | |
| | |
Connecticut State Health & Educational Facilities Authority,
5.000%, 07/01/31 | | | 6,205,000 | | | | 6,630,588 | |
5.000%, 07/01/33 | | | 2,750,000 | | | | 2,933,407 | |
5.000%, 07/01/34 | | | 3,100,000 | | | | 3,305,190 | |
| | | | | | | | |
| | | | | | | | |
| | | Principal Amount | | | Value | |
| | |
State of Connecticut Special Tax Obligation, Transportation Infrastructure, Series A
5.000%, 01/01/30 | | | $10,180,000 | | | | $10,741,120 | |
| | |
State of Connecticut Special Tax Obligation, Transportation Infrastructure, Series B
5.000%, 10/01/35 | | | 7,500,000 | | | | 7,960,262 | |
| | |
State of Connecticut, Series A 5.000%, 01/15/31 | | | 7,650,000 | | | | 8,392,510 | |
| | |
Total Connecticut | | | | | | | 39,963,077 | |
| | |
District of Columbia - 1.8% | | | | | | | | |
| | |
District of Columbia, Series A
5.000%, 06/01/30 | | | 6,020,000 | | | | 6,203,090 | |
| | |
District of Columbia, Series B
5.000%, 06/01/31 | | | 5,080,000 | | | | 5,430,109 | |
| | |
District of Columbia, Series C
5.000%, 12/01/34 | | | 6,000,000 | | | | 6,878,146 | |
| | |
Total District of Columbia | | | | | | | 18,511,345 | |
| | |
Florida - 4.6% | | | | | | | | |
| | |
Escambia County Health Facilities Authority
5.000%, 08/15/37 | | | 6,000,000 | | | | 6,161,132 | |
| | |
Florida Development Finance Corp.
4.000%, 11/15/33 | | | 10,000,000 | | | | 10,301,652 | |
| | |
Florida Housing Finance Corp., Series 3, (GNMA FNMA FHLMC)
4.500%, 07/01/44 | | | 5,000,000 | | | | 5,006,804 | |
| | |
Florida’s Turnpike Enterprise, Department of Transportation, Series C
5.000%, 07/01/28 | | | 7,075,000 | | | | 7,294,040 | |
| | |
Lee Memorial Health System, Series A1
5.000%, 04/01/34 | | | 3,145,000 | | | | 3,333,419 | |
| | |
Orange County Health Facilities Authority, Series A
5.000%, 10/01/31 | | | 4,525,000 | | | | 4,648,858 | |
| | |
State Board of Administration Finance Corp., Series A
5.526%, 07/01/34 | | | 10,000,000 | | | | 10,060,965 | |
| | |
Total Florida | | | | | | | 46,806,870 | |
| | |
Illinois - 8.3% | | | | | | | | |
| | |
Chicago O’Hare International Airport, Senior Lien, Series A,
5.000%, 01/01/35 | | | 5,010,000 | | | | 5,411,719 | |
5.000%, 01/01/36 | | | 10,050,000 | | | | 10,448,865 | |
5.000%, 01/01/38 | | | 5,500,000 | | | | 5,693,573 | |
| | |
Illinois Finance Authority, Series A,
4.000%, 08/15/37 | | | 5,910,000 | | | | 5,961,248 | |
5.000%, 04/01/34 | | | 3,500,000 | | | | 4,050,521 | |
| | |
Illinois Finance Authority, Series B
5.000%, 04/01/351 | | | 2,970,000 | | | | 3,426,730 | |
| | |
| | | | | | | | |
The accompanying notes are an integral part of these financial statements.
9
|
AMG GW&K Municipal Bond Fund Schedule of Portfolio Investments (continued) |
| | | | | | | | |
| | |
| | | Principal Amount | | | Value | |
| |
Illinois - 8.3% (continued) | | | | | |
| | |
Illinois State Toll Highway Authority, Senior Revenue, Series A,
5.000%, 01/01/30 | | | $10,110,000 | | | | $10,862,701 | |
5.000%, 12/01/31 | | | 9,735,000 | | | | 9,910,054 | |
5.000%, 01/01/36 | | | 3,000,000 | | | | 3,469,878 | |
| | |
State of Illinois, Series A
5.250%, 03/01/37 | | | 8,500,000 | | | | 9,441,958 | |
| | |
State of Illinois, Series B,
5.000%, 05/01/34 | | | 10,000,000 | | | | 10,964,664 | |
5.250%, 05/01/42 | | | 2,000,000 | | | | 2,217,584 | |
5.250%, 05/01/45 | | | 2,000,000 | | | | 2,185,262 | |
| | |
Total Illinois | | | | | | | 84,044,757 | |
| | |
Indiana - 0.9% | | | | | | | | |
| | |
Indiana Finance Authority, Series 1
5.000%, 10/01/29 | | | 3,555,000 | | | | 3,889,639 | |
| | |
Indiana Finance Authority, Series A
5.000%, 02/01/32 | | | 5,000,000 | | | | 5,595,679 | |
| | |
Total Indiana | | | | | | | 9,485,318 | |
| | |
Iowa - 1.6% | | | | | | | | |
| | |
Iowa Finance Authority, State Revolving Fund Green Bond
5.000%, 08/01/30 | | | 15,025,000 | | | | 15,809,995 | |
| | |
Kentucky - 1.3% | | | | | | | | |
| | |
Kentucky State Property & Building Commission, Series A
5.000%, 11/01/29 | | | 3,010,000 | | | | 3,248,751 | |
| | |
Kentucky State Property & Building Commission, Series B
5.000%, 11/01/29 | | | 4,000,000 | | | | 4,317,277 | |
| | |
Louisville/Jefferson County Metropolitan Government, Norton Healthcare Inc.
5.000%, 10/01/29 | | | 5,505,000 | | | | 5,615,160 | |
| | |
Total Kentucky | | | | | | | 13,181,188 | |
| | |
Louisiana - 1.7% | | | | | | | | |
| | |
Louisiana Stadium & Exposition District, Series A,
5.000%, 07/01/40 | | | 2,750,000 | | | | 3,016,332 | |
5.000%, 07/01/42 | | | 11,500,000 | | | | 12,501,322 | |
| | |
State of Louisiana, Series A
5.000%, 09/01/30 | | | 2,000,000 | | | | 2,133,204 | |
| | |
Total Louisiana | | | | | | | 17,650,858 | |
| | |
Maryland - 3.9% | | | | | | | | |
| | |
Maryland State Transportation Authority
5.000%, 07/01/33 | | | 6,350,000 | | | | 7,020,196 | |
| | |
State of Maryland, Department of Transportation,
5.000%, 10/01/28 | | | 12,365,000 | | | | 12,811,229 | |
5.000%, 09/01/29 | | | 12,205,000 | | | | 12,880,483 | |
| | |
State of Maryland, State & Local Facilities Loan of 2019, 1st Series
5.000%, 03/15/30 | | | 6,000,000 | | | | 6,519,636 | |
| | |
Total Maryland | | | | | | | 39,231,544 | |
| | | | | | | | |
| | | | | | | | |
| | |
| | | Principal Amount | | | Value | |
| | |
Massachusetts - 3.4% | | | | | | | | |
| | |
Commonwealth of Massachusetts, Series A,
5.000%, 03/01/32 | | | $11,355,000 | | | | $12,887,416 | |
5.000%, 03/01/35 | | | 4,710,000 | | | | 5,481,201 | |
| | |
Massachusetts Bay Transportation Authority, Series A,
5.000%, 07/01/38 | | | 5,000,000 | | | | 5,696,950 | |
5.000%, 07/01/39 | | | 4,730,000 | | | | 5,370,442 | |
| | |
Massachusetts Development Finance Agency
5.250%, 07/01/48 | | | 4,250,000 | | | | 4,552,411 | |
| | |
Total Massachusetts | | | | | | | 33,988,420 | |
| | |
Michigan - 0.8% | | | | | | | | |
| | |
Michigan Finance Authority, Henry Ford Health System
5.000%, 11/15/29 | | | 3,500,000 | | | | 3,596,931 | |
| | |
Wayne County Airport Authority, Series A,
5.000%, 12/01/37 | | | 2,285,000 | | | | 2,527,881 | |
5.000%, 12/01/39 | | | 1,800,000 | | | | 1,976,250 | |
| | |
Total Michigan | | | | | | | 8,101,062 | |
| | |
Nebraska - 0.6% | | | | | | | | |
| | |
Omaha Public Power District, Series B,
5.000%, 02/01/361 | | | 3,000,000 | | | | 3,440,992 | |
5.000%, 02/01/371 | | | 2,000,000 | | | | 2,281,505 | |
| | |
Total Nebraska | | | | | | | 5,722,497 | |
| | |
New Jersey - 6.4% | | | | | | | | |
| | |
New Jersey Economic Development Authority, Series A
5.250%, 11/01/40 | | | 7,000,000 | | | | 7,774,156 | |
| | |
New Jersey Economic Development Authority, Series SSS,
5.250%, 06/15/36 | | | 3,000,000 | | | | 3,470,708 | |
5.250%, 06/15/37 | | | 2,000,000 | | | | 2,301,961 | |
| | |
New Jersey State Turnpike Authority, Series D
5.000%, 01/01/28 | | | 6,000,000 | | | | 6,144,666 | |
| | |
New Jersey Transportation Trust Fund Authority, Series A,
5.250%, 06/15/41 | | | 2,700,000 | | | | 3,020,480 | |
5.250%, 06/15/42 | | | 2,500,000 | | | | 2,785,788 | |
| | |
New Jersey Transportation Trust Fund Authority, Series B,
5.000%, 06/15/30 | | | 6,255,000 | | | | 6,823,241 | |
5.000%, 06/15/31 | | | 7,615,000 | | | | 8,410,366 | |
5.000%, 06/15/32 | | | 5,750,000 | | | | 6,346,476 | |
5.000%, 06/15/33 | | | 6,000,000 | | | | 6,617,706 | |
| | |
New Jersey Transportation Trust Fund Authority, Series BB
4.000%, 06/15/37 | | | 3,000,000 | | | | 3,049,241 | |
| | |
New Jersey Turnpike Authority, Series C
5.000%, 01/01/451 | | | 4,000,000 | | | | 4,365,641 | |
| | |
South Jersey Transportation Authority,
5.000%, 11/01/39 | | | 1,150,000 | | | | 1,233,310 | |
5.000%, 11/01/41 | | | 2,565,000 | | | | 2,730,244 | |
| | |
Total New Jersey | | | | | | | 65,073,984 | |
| | | | | | | | |
The accompanying notes are an integral part of these financial statements.
10
|
AMG GW&K Municipal Bond Fund Schedule of Portfolio Investments (continued) |
| | | | | | | | |
| | |
| | | Principal Amount | | | Value | |
| | |
New Mexico - 0.8% | | | | | | | | |
| | |
New Mexico Finance Authority, Series A
5.000%, 06/15/30 | | | $7,500,000 | | | | $8,268,068 | |
| | |
New York - 20.0% | | | | | | | | |
| | |
City of New York
5.000%, 08/01/34 | | | 5,000,000 | | | | 5,739,629 | |
| | |
City of New York, Series B-1
5.000%, 08/01/32 | | | 3,000,000 | | | | 3,403,810 | |
| | |
City of New York, Series C,
5.000%, 08/01/33 | | | 1,500,000 | | | | 1,656,094 | |
5.000%, 08/01/34 | | | 3,250,000 | | | | 3,586,630 | |
| | |
City of New York, Series D
5.000%, 04/01/32 | | | 7,705,000 | | | | 8,704,489 | |
| | |
City of New York, Series L-5
5.000%, 04/01/33 | | | 6,500,000 | | | | 7,243,206 | |
| | |
Long Island Power Authority
5.000%, 09/01/35 | | | 5,030,000 | | | | 5,386,750 | |
| | |
Metropolitan Transportation Authority, Green Bond, Series B
5.000%, 11/15/27 | | | 14,225,000 | | | | 14,973,601 | |
| | |
Metropolitan Transportation Authority, Series F
5.000%, 11/15/28 | | | 4,760,000 | | | | 4,844,327 | |
| | |
New York City Municipal Water Finance Authority, Series 2
5.000%, 06/15/36 | | | 4,000,000 | | | | 4,759,430 | |
| | |
New York City Transitional Finance Authority Building Aid Revenue, Series S-3, (State Aid Withholding)
5.000%, 07/15/31 | | | 5,080,000 | | | | 5,399,015 | |
| | |
New York City Transitional Finance Authority, Future Tax Secured Subordinate, Series A-1,
5.000%, 05/01/40 | | | 2,500,000 | | | | 2,790,333 | |
5.000%, 05/01/41 | | | 3,000,000 | | | | 3,329,407 | |
| | |
New York City Transitional Finance Authority, Future Tax Secured Subordinate, Series E-1
5.000%, 02/01/37 | | | 7,000,000 | | | | 7,761,461 | |
| | |
New York City Transitional Finance Authority, Future Tax Secured Subordinate, Series F-1,
5.000%, 11/01/31 | | | 2,500,000 | | | | 2,802,061 | |
5.000%, 11/01/32 | | | 4,000,000 | | | | 4,478,366 | |
5.000%, 02/01/39 | | | 4,000,000 | | | | 4,435,463 | |
| | |
New York State Dormitory Authority
4.000%, 05/01/39 | | | 2,000,000 | | | | 2,004,200 | |
| | |
New York State Dormitory Authority, Series A,
5.000%, 03/15/31 | | | 7,670,000 | | | | 8,226,149 | |
5.000%, 03/15/32 | | | 3,000,000 | | | | 3,340,642 | |
5.000%, 03/15/33 | | | 3,200,000 | | | | 3,610,182 | |
5.000%, 03/15/40 | | | 5,250,000 | | | | 5,938,216 | |
5.000%, 03/15/41 | | | 9,340,000 | | | | 10,507,808 | |
| | |
New York State Dormitory Authority, Series E
5.000%, 03/15/32 | | | 8,410,000 | | | | 8,525,005 | |
| | |
New York State Thruway Authority, Series K
5.000%, 01/01/31 | | | 4,430,000 | | | | 4,458,248 | |
| | | | | | | | |
| | | | | | | | |
| | |
| | | Principal Amount | | | Value | |
| | |
New York State Urban Development Corp.
5.000%, 03/15/32 | | | $7,000,000 | | | | $7,763,688 | |
| | |
New York Transportation Development Corp.,
4.000%, 10/31/41 | | | 1,250,000 | | | | 1,126,394 | |
4.000%, 10/31/46 | | | 1,500,000 | | | | 1,293,000 | |
5.000%, 12/01/30 | | | 1,000,000 | | | | 1,088,639 | |
5.000%, 12/01/31 | | | 1,100,000 | | | | 1,197,842 | |
5.000%, 12/01/32 | | | 1,450,000 | | | | 1,578,767 | |
5.000%, 12/01/33 | | | 1,000,000 | | | | 1,088,767 | |
5.000%, 12/01/36 | | | 10,000,000 | | | | 10,710,587 | |
5.250%, 06/30/49 | | | 5,000,000 | | | | 5,222,923 | |
6.000%, 06/30/54 | | | 3,000,000 | | | | 3,294,688 | |
| | |
New York Transportation Development Corp. (AGM)
5.000%, 06/30/49 | | | 2,000,000 | | | | 2,073,033 | |
| | |
Port Authority of New York & New Jersey, Series 221
5.000%, 07/15/32 | | | 6,545,000 | | | | 6,988,293 | |
| | |
Triborough Bridge & Tunnel Authority
5.000%, 11/15/33 | | | 3,970,000 | | | | 4,555,731 | |
| | |
Triborough Bridge & Tunnel Authority, Series C,
5.000%, 11/15/35 | | | 2,000,000 | | | | 2,290,570 | |
5.000%, 11/15/361 | | | 12,000,000 | | | | 13,835,460 | |
| | |
Total New York | | | | | | | 202,012,904 | |
| | |
North Carolina - 2.1% | | | | | | | | |
| | |
County of Union Enterprise System Revenue,
1.750%, 06/01/34 | | | 3,300,000 | | | | 2,590,934 | |
1.750%, 06/01/35 | | | 4,225,000 | | | | 3,261,148 | |
1.850%, 06/01/36 | | | 4,315,000 | | | | 3,301,055 | |
2.125%, 06/01/40 | | | 3,350,000 | | | | 2,447,208 | |
| | |
North Carolina Turnpike Authority, Series A, (AGM)
5.000%, 01/01/58 | | | 9,000,000 | | | | 9,504,209 | |
| | |
Total North Carolina | | | | | | | 21,104,554 | |
| | |
Ohio - 1.1% | | | | | | | | |
| | |
Ohio Housing Finance Agency, Series A, (GNMA FNMA FHLMC)
4.350%, 09/01/44 | | | 2,995,000 | | | | 3,003,671 | |
| | |
Ohio State General Obligation, Series T
5.000%, 05/01/30 | | | 5,000,000 | | | | 5,244,586 | |
| | |
Ohio Water Development Authority Water Pollution Control Loan Fund, Series B
5.000%, 06/01/35 | | | 2,500,000 | | | | 2,886,814 | |
| | |
Total Ohio | | | | | | | 11,135,071 | |
| | |
Pennsylvania - 3.2% | | | | | | | | |
| | |
Allegheny County Airport Authority, Series A,
5.000%, 01/01/31 | | | 1,350,000 | | | | 1,446,747 | |
5.000%, 01/01/32 | | | 2,215,000 | | | | 2,374,285 | |
| | |
Commonwealth Financing Authority, Pennsylvania Tobacco
5.000%, 06/01/32 | | | 7,910,000 | | | | 8,348,367 | |
| | | | | | | | |
The accompanying notes are an integral part of these financial statements.
11
|
AMG GW&K Municipal Bond Fund Schedule of Portfolio Investments (continued) |
| | | | | | | | |
| | |
| | | Principal Amount | | | Value | |
| | |
Pennsylvania - 3.2% (continued) | | | | | | | | |
| | |
Hospitals & Higher Education Facilities Authority of Philadelphia, (AGM)
4.000%, 07/01/38 | | | $2,500,000 | | | | $2,504,075 | |
4.000%, 07/01/39 | | | 2,000,000 | | | | 1,986,465 | |
| | |
Pennsylvania Economic Development Financing Authority,
5.250%, 06/30/35 | | | 3,000,000 | | | | 3,282,432 | |
5.750%, 06/30/48 | | | 6,000,000 | | | | 6,501,881 | |
| | |
Pennsylvania Turnpike Commission, Series A
5.000%, 12/01/33 | | | 5,000,000 | | | | 5,665,022 | |
| | |
Total Pennsylvania | | | | | | | 32,109,274 | |
| | |
Rhode Island - 0.5% | | | | | | | | |
| | |
Rhode Island Health and Educational Building Corp.
5.250%, 05/15/49 | | | 4,300,000 | | | | 4,583,435 | |
| | |
South Carolina - 1.2% | | | | | | | | |
| | |
Richland County School District No 2, Series A, (South Carolina School District)
2.000%, 03/01/38 | | | 6,190,000 | | | | 4,698,445 | |
2.000%, 03/01/39 | | | 10,080,000 | | | | 7,407,100 | |
| | |
Total South Carolina | | | | | | | 12,105,545 | |
| | |
Tennessee - 0.6% | | | | | | | | |
| | |
City of Chattanooga Electric System Revenue
2.000%, 09/01/39 | | | 8,925,000 | | | | 6,510,467 | |
| | |
Texas - 12.2% | | | | | | | | |
| | |
City of Corpus Christi Utility System, Junior Lien Revenue Improvement
5.000%, 07/15/29 | | | 3,125,000 | | | | 3,327,993 | |
| | |
City of Houston Airport System, Series A,
4.000%, 07/01/35 | | | 1,100,000 | | | | 1,089,810 | |
4.000%, 07/01/36 | | | 1,100,000 | | | | 1,091,890 | |
5.000%, 07/01/34 | | | 2,835,000 | | | | 3,038,031 | |
| | |
City of San Antonio Electric & Gas Systems, Series A,
5.000%, 02/01/31 | | | 10,715,000 | | | | 11,906,752 | |
5.000%, 02/01/34 | | | 5,460,000 | | | | 6,235,563 | |
5.000%, 02/01/35 | | | 3,000,000 | | | | 3,424,780 | |
5.000%, 02/01/37 | | | 3,010,000 | | | | 3,314,293 | |
5.000%, 02/01/38 | | | 2,985,000 | | | | 3,273,238 | |
| | |
City of San Antonio TX Electric & Gas Systems Revenue, Series A,
5.000%, 02/01/35 | | | 1,000,000 | | | | 1,154,839 | |
5.000%, 02/01/36 | | | 1,000,000 | | | | 1,152,060 | |
| | |
County of Harris Toll Road First Lien, Series A
5.000%, 08/15/34 | | | 5,000,000 | | | | 5,729,744 | |
| | |
County of Harris TX Toll Road Revenue, Series A
5.000%, 08/15/36 | | | 4,000,000 | | | | 4,616,391 | |
| | |
Denton Independent School District, (PSF-GTD)
5.000%, 08/15/33 | | | 5,000,000 | | | | 5,756,633 | |
5.000%, 08/15/35 | | | 3,000,000 | | | | 3,460,654 | |
| | |
Lamar Consolidated Independent School District
5.000%, 02/15/34 | | | 7,965,000 | | | | 9,037,031 | |
| | | | | | | | |
| | | | | | | | |
| | |
| | | Principal Amount | | | Value | |
| | |
Leander Independent School District, (PSF-GTD)
5.000%, 02/15/32 | | | $6,795,000 | | | | $7,674,634 | |
| | |
Lower Colorado River Authority 5.000%, 05/15/31 | | | 6,000,000 | | | | 6,671,195 | |
| | |
North Texas Municipal Water District Water System Revenue Refunding and Improvement
5.000%, 09/01/29 | | | 7,350,000 | | | | 7,601,957 | |
| | |
North Texas Tollway Authority, 2nd Tier, Series B,
5.000%, 01/01/31 | | | 2,000,000 | | | | 2,031,845 | |
5.000%, 01/01/32 | | | 3,010,000 | | | | 3,122,673 | |
| | |
North Texas Tollway Authority, Series A
5.250%, 01/01/38 | | | 4,500,000 | | | | 5,070,579 | |
| | |
Prosper Independent School District, Series A, (PSF-GTD)
1.750%, 02/15/34 | | | 3,565,000 | | | | 2,815,385 | |
1.750%, 02/15/35 | | | 5,155,000 | | | | 3,992,391 | |
| | |
State of Texas, Series A
5.000%, 10/01/29 | | | 5,000,000 | | | | 5,095,744 | |
| | |
Texas Private Activity Bond Surface Transportation Corp.,
5.500%, 06/30/41 | | | 1,000,000 | | | | 1,079,686 | |
5.500%, 06/30/42 | | | 1,000,000 | | | | 1,077,747 | |
5.500%, 06/30/43 | | | 1,000,000 | | | | 1,075,433 | |
| | |
Texas Private Activity Bond Surface Transportation Corp., Series A,
4.000%, 12/31/37 | | | 5,000,000 | | | | 5,015,999 | |
4.000%, 12/31/38 | | | 3,735,000 | | | | 3,731,742 | |
| | |
Total Texas | | | | | | | 123,666,712 | |
| | |
Utah - 2.8% | | | | | | | | |
| | |
Intermountain Power Agency,
5.000%, 07/01/33 | | | 3,500,000 | | | | 3,970,362 | |
5.000%, 07/01/34 | | | 3,500,000 | | | | 3,973,777 | |
5.000%, 07/01/35 | | | 3,250,000 | | | | 3,674,848 | |
| | |
Intermountain Power Agency, Series A
5.000%, 07/01/34 | | | 5,250,000 | | | | 5,881,035 | |
| | |
Salt Lake City Corp. Airport Revenue, Series A,
5.000%, 07/01/29 | | | 3,450,000 | | | | 3,598,557 | |
5.000%, 07/01/30 | | | 6,585,000 | | | | 6,875,041 | |
| | |
Total Utah | | | | | | | 27,973,620 | |
| | |
Virginia - 1.5% | | | | | | | | |
| | |
Virginia College Building Authority
5.000%, 02/01/33 | | | 8,250,000 | | | | 9,478,616 | |
| | |
Virginia Small Business Financing Authority,
4.000%, 01/01/37 | | | 3,000,000 | | | | 3,013,387 | |
4.000%, 01/01/38 | | | 3,000,000 | | | | 2,998,403 | |
| | |
Total Virginia | | | | | | | 15,490,406 | |
| | |
Washington - 4.0% | | | | | | | | |
| | |
Energy Northwest, Series A
5.000%, 07/01/35 | | | 8,000,000 | | | | 9,213,234 | |
| | |
Port of Seattle, Series C
5.000%, 08/01/31 | | | 5,000,000 | | | | 5,386,838 | |
| | | | | | | | |
The accompanying notes are an integral part of these financial statements.
12
|
AMG GW&K Municipal Bond Fund Schedule of Portfolio Investments (continued) |
| | | | | | | | |
| | |
| | | Principal Amount | | | Value | |
| | |
Washington - 4.0% (continued) | | | | | | | | |
| | |
State of Washington School Improvements, Series C
5.000%, 02/01/28 | | | $7,370,000 | | | | $7,558,271 | |
| | |
State of Washington, Series B
5.000%, 08/01/31 | | | 4,680,000 | | | | 4,823,852 | |
| | |
State of Washington, Series R
5.000%, 07/01/31 | | | 9,975,000 | | | | 10,041,564 | |
| | |
Washington Health Care Facilities Authority, Series A
5.000%, 08/01/38 | | | 3,270,000 | | | | 3,452,230 | |
| | |
Total Washington | | | | | | | 40,475,989 | |
| | |
West Virginia - 1.6% | | | | | | | | |
| | |
West Virginia Hospital Finance Authority, Series B
6.000%, 09/01/48 | | | 5,250,000 | | | | 5,963,077 | |
| | |
West Virginia Parkways Authority,
5.000%, 06/01/37 | | | 1,750,000 | | | | 1,940,079 | |
5.000%, 06/01/38 | | | 2,000,000 | | | | 2,200,467 | |
5.000%, 06/01/39 | | | 5,150,000 | | | | 5,634,143 | |
| | |
Total West Virginia | | | | | | | 15,737,766 | |
| | | | | | | | |
| | |
| | | Principal Amount | | | Value | |
| | |
Wisconsin - 1.7% | | | | | | | | |
| | |
State of Wisconsin Transportation, Series 2
5.000%, 07/01/29 | | | $10,405,000 | | | | $10,935,814 | |
| | |
State of Wisconsin, Series 2
5.000%, 05/01/35 | | | 5,000,000 | | | | 5,767,616 | |
| | |
Total Wisconsin | | | | | | | 16,703,430 | |
| |
Total Municipal Bonds | | | | | |
(Cost $1,057,250,789) | | | | | | | 1,027,920,890 | |
| |
Short-Term Investments - 0.6% | | | | | |
| |
Repurchase Agreements - 0.6% | | | | | |
| | |
Fixed Income Clearing Corp., dated 06/28/24, due 07/01/24, 5.150% total to be received $6,464,773 (collateralized by a U.S. Treasury Note, 0.125%, 04/15/25, totaling $6,591,308) | | | 6,462,000 | | | | 6,462,000 | |
| |
Total Short-Term Investments | | | | | |
(Cost $6,462,000) | | | | | | | 6,462,000 | |
| |
Total Investments - 102.4% | | | | | |
(Cost $1,063,712,789) | | | | | | | 1,034,382,890 | |
| |
Other Assets, less Liabilities - (2.4)% | | | | (24,471,602 | ) |
| |
Net Assets - 100.0% | | | | $1,009,911,288 | |
| 1 | All or part of a security is delayed delivery transaction. The market value for delayed delivery securities at June 30, 2024, amounted to $30,732,739, or 3.0% of net assets. |
| | |
AGM | | Assured Guaranty Municipal Corp. |
| |
| FHLMC | | Freddie Mac |
| | |
FNMA | | Fannie Mae |
| |
| GNMA | | Ginnie Mae |
| |
| PSF-GTD | | Permanent School Fund Guaranteed |
The following table summarizes the inputs used to value the Fund’s investments by the fair value hierarchy levels as of June 30, 2024:
| | | | | | | | | | | | | | | | | | | | | | | | | | | | |
| | | Level 1 | | | | | | Level 2 | | | | | | Level 3 | | | | | | Total | |
| | | | | | | |
Investments in Securities | | | | | | | | | | | | | | | | | | | | | | | | | | | | |
| | | | | | | |
Municipal Bonds† | | | — | | | | | | | $ | 1,027,920,890 | | | | | | | | — | | | | | | | $ | 1,027,920,890 | |
| | | | | | | |
Short-Term Investments | | | | | | | | | | | | | | | | | | | | | | | | | | | | |
| | | | | | | |
Repurchase Agreements | | | — | | | | | | | | 6,462,000 | | | | | | | | — | | | | | | | | 6,462,000 | |
| | | | | | | | | | | | | | | | | | | | | | | | | | | | |
| | | | | | | |
Total Investments in Securities | | | — | | | | | | | $ | 1,034,382,890 | | | | | | | | — | | | | | | | $ | 1,034,382,890 | |
| | | | | | | | | | | | | | | | | | | | | | | | | | | | |
| † | All municipal bonds held in the Fund are Level 2 securities. For a detailed breakout of municipal bonds by major classification, please refer to the Fund’s Schedule of Portfolio Investments. |
For the six months ended June 30, 2024, there were no transfers in or out of Level 3.
The accompanying notes are an integral part of these financial statements.
13
|
AMG GW&K Municipal Enhanced Yield Fund Schedule of Portfolio Investments (unaudited) June 30, 2024 |
| | | | | | | | |
| | | Principal
Amount | | | Value | |
| | |
Municipal Bonds - 98.7% | | | | | | | | |
| | |
Alabama - 1.5% | | | | | | | | |
| | |
County of Jefferson Sewer Revenue
5.500%, 10/01/53 | | | $2,750,000 | | | | $2,976,075 | |
| | |
California - 5.1% | | | | | | | | |
| | |
California Municipal Finance Authority,
5.000%, 05/15/43 | | | 2,515,000 | | | | 2,581,734 | |
5.000%, 05/15/48 | | | 3,855,000 | | | | 3,924,426 | |
| | |
California Municipal Finance Authority, Series A
4.000%, 02/01/51 | | | 1,260,000 | | | | 1,141,013 | |
| | |
Riverside County Transportation Commission, Series C
4.000%, 06/01/47 | | | 2,870,000 | | | | 2,740,562 | |
| | |
Total California | | | | | | | 10,387,735 | |
| | |
Colorado - 5.4% | | | | | | | | |
| | |
Colorado Health Facilities Authority, Series A
5.000%, 08/01/44 | | | 4,185,000 | | | | 4,309,193 | |
| | |
Public Authority for Colorado Energy Natural Gas Purchase Revenue
6.500%, 11/15/38 | | | 5,395,000 | | | | 6,611,481 | |
| | |
Total Colorado | | | | | | | 10,920,674 | |
| | |
Connecticut - 2.0% | | | | | | | | |
| | |
Connecticut State Health & Educational Facilities Authority,
4.000%, 07/01/40 | | | 2,845,000 | | | | 2,743,571 | |
4.000%, 07/01/42 | | | 1,465,000 | | | | 1,371,276 | |
| | |
Total Connecticut | | | | | | | 4,114,847 | |
| | |
Florida - 12.1% | | | | | | | | |
| | |
Brevard County Health Facilities Authority, Series A
5.000%, 04/01/47 | | | 1,000,000 | | | | 1,046,969 | |
| | |
City of Tampa, Series B
5.000%, 07/01/50 | | | 2,065,000 | | | | 2,124,634 | |
| | |
County of Miami-Dade Florida Seaport Department, Series 1, (AGM)
4.000%, 10/01/45 | | | 2,730,000 | | | | 2,547,302 | |
| | |
County of Miami-Dade Florida Seaport Department, Series A
5.250%, 10/01/52 | | | 1,260,000 | | | | 1,331,297 | |
| | |
Escambia County Health Facilities Authority
4.000%, 08/15/50 | | | 5,065,000 | | | | 4,460,873 | |
| | |
Florida Development Finance Corp.,
4.000%, 02/01/52 | | | 2,515,000 | | | | 1,906,808 | |
5.000%, 02/01/52 | | | 1,675,000 | | | | 1,595,454 | |
| | |
Florida Housing Finance Corp., Series 3, (GNMA FNMA FHLMC)
4.750%, 07/01/54 | | | 2,000,000 | | | | 2,000,492 | |
| | |
Hillsborough County Industrial Development Authority
4.000%, 08/01/50 | | | 4,185,000 | | | | 3,760,938 | |
| |
| | | | | |
| | | | | | | | |
| | | Principal
Amount | | | Value | |
| | |
Miami Beach Health Facilities Authority
4.000%, 11/15/46 | | | $4,185,000 | | | | $3,973,443 | |
| | |
Total Florida | | | | | | | 24,748,210 | |
| | |
Illinois - 7.1% | | | | | | | | |
| | |
Chicago O’Hare International Airport, Senior Lien, Series A
5.000%, 01/01/48 | | | 3,000,000 | | | | 3,035,073 | |
| | |
Metropolitan Pier & Exposition Authority,
4.000%, 06/15/52 | | | 2,515,000 | | | | 2,327,249 | |
5.000%, 06/15/50 | | | 4,185,000 | | | | 4,324,753 | |
| | |
State of Illinois
5.750%, 05/01/45 | | | 2,515,000 | | | | 2,731,548 | |
| | |
State of Illinois, Series A
4.000%, 03/01/40 | | | 1,000,000 | | | | 969,619 | |
| | |
State of Illinois, Series B
5.250%, 05/01/47 | | | 1,000,000 | | | | 1,084,792 | |
| | |
Total Illinois | | | | | | | 14,473,034 | |
| | |
Massachusetts - 3.3% | | | | | | | | |
| | |
Massachusetts Development Finance Agency,
4.000%, 07/01/51 | | | 4,340,000 | | | | 3,659,236 | |
5.250%, 07/01/52 | | | 2,795,000 | | | | 2,984,923 | |
| | |
Total Massachusetts | | | | | | | 6,644,159 | |
| | |
Minnesota - 1.1% | | | | | | | | |
| | |
Duluth Economic Development Authority, Series A
5.000%, 02/15/48 | | | 2,140,000 | | | | 2,163,970 | |
| | |
Nebraska - 2.5% | | | | | | | | |
| | |
Central Plains Energy Project #3, Series A
5.000%, 09/01/42 | | | 4,655,000 | | | | 5,060,614 | |
| | |
New Jersey - 6.8% | | | | | | | | |
| | |
New Jersey Transportation Trust Fund Authority, Series AA
4.000%, 06/15/50 | | | 1,675,000 | | | | 1,594,935 | |
| | |
South Jersey Transportation Authority,
4.625%, 11/01/47 | | | 1,680,000 | | | | 1,711,734 | |
5.250%, 11/01/52 | | | 3,770,000 | | | | 4,007,453 | |
| | |
Tobacco Settlement Financing Corp., Series A,
5.000%, 06/01/46 | | | 2,095,000 | | | | 2,139,695 | |
5.250%, 06/01/46 | | | 2,755,000 | | | | 2,848,316 | |
| | |
Tobacco Settlement Financing Corp., Series B
5.000%, 06/01/46 | | | 1,500,000 | | | | 1,513,721 | |
| | |
Total New Jersey | | | | | | | 13,815,854 | |
| | |
New York - 13.6% | | | | | | | | |
| | |
Metropolitan Transportation Authority, Series 1,
4.750%, 11/15/45 | | | 1,660,000 | | | | 1,703,452 | |
5.000%, 11/15/50 | | | 1,000,000 | | | | 1,041,546 | |
5.250%, 11/15/55 | | | 2,530,000 | | | | 2,661,005 | |
| | |
New York State Dormitory Authority, Series A,
4.000%, 07/01/47 | | | 1,675,000 | | | | 1,606,398 | |
4.000%, 07/01/52 | | | 1,775,000 | | | | 1,663,963 | |
| |
| | | | | |
The accompanying notes are an integral part of these financial statements.
14
|
AMG GW&K Municipal Enhanced Yield Fund Schedule of Portfolio Investments (continued) |
| | | | | | | | |
| | | Principal
Amount | | | Value | |
| |
New York - 13.6% (continued) | | | | | |
| | |
New York Transportation Development Corp.,
4.000%, 04/30/53 | | | $5,790,000 | | | | $4,804,913 | |
5.000%, 12/01/41 | | | 2,185,000 | | | | 2,288,911 | |
5.500%, 06/30/54 | | | 1,500,000 | | | | 1,589,906 | |
5.625%, 04/01/40 | | | 4,000,000 | | | | 4,349,672 | |
6.000%, 04/01/35 | | | 2,500,000 | | | | 2,825,560 | |
6.000%, 06/30/54 | | | 2,000,000 | | | | 2,196,459 | |
| | |
Suffolk Regional Off-Track Betting Co.
5.750%, 12/01/44 | | | 1,000,000 | | | | 1,041,569 | |
| | |
Total New York | | | | | | | 27,773,354 | |
| |
Ohio - 0.5% | | | | | |
| | |
Ohio Housing Finance Agency, Series A, (GNMA FNMA FHLMC)
4.550%, 09/01/49 | | | 1,000,000 | | | | 1,003,533 | |
| | |
Pennsylvania - 9.8% | | | | | | | | |
| | |
Allegheny County Airport Authority, Series A
5.000%, 01/01/51 | | | 4,185,000 | | | | 4,310,530 | |
| | |
Montgomery County Higher Education and Health Authority, Series B
5.000%, 05/01/52 | | | 3,980,000 | | | | 4,109,707 | |
| | |
Pennsylvania Economic Development Financing Authority
5.250%, 06/30/53 | | | 5,025,000 | | | | 5,212,917 | |
| | |
Pennsylvania Turnpike Commission, Series A
4.000%, 12/01/50 | | | 1,065,000 | | | | 996,948 | |
| | |
Philadelphia Authority for Industrial Development
5.250%, 11/01/52 | | | 5,185,000 | | | | 5,436,757 | |
| | |
Total Pennsylvania | | | | | | | 20,066,859 | |
| | |
Rhode Island - 4.7% | | | | | | | | |
| | |
Rhode Island Health and Educational Building Corp.,
5.250%, 05/15/49 | | | 2,000,000 | | | | 2,131,830 | |
5.250%, 05/15/54 | | | 4,500,000 | | | | 4,775,165 | |
| | |
Tobacco Settlement Financing Corp., Series A
5.000%, 06/01/40 | | | 2,755,000 | | | | 2,770,224 | |
| | |
Total Rhode Island | | | | | | | 9,677,219 | |
| | |
South Carolina - 3.0% | | | | | | | | |
| | |
Richland County School District No 2, Series A,
(South Carolina School District)
1.875%, 03/01/38 | | | 8,290,000 | | | | 6,083,090 | |
| | |
Tennessee - 5.2% | | | | | | | | |
| | |
City of Chattanooga Electric
2.000%, 09/01/40 | | | 7,710,000 | | | | 5,473,874 | |
| | |
Knox County Health Educational & Housing Facility Board, Series 1, (BAM)
5.125%, 07/01/54 | | | 1,900,000 | | | | 2,004,845 | |
| | |
Knox County Health Educational & Housing Facility Board, Series A1, (BAM)
5.500%, 07/01/54 | | | 1,000,000 | | | | 1,087,484 | |
| |
| | | | | |
| | | | | | | | |
| | | Principal
Amount | | | Value | |
| | |
Metropolitan Government Nashville & Davidson County Health & Educational Facilities
5.250%, 05/01/53 | | | $2,000,000 | | | | $2,126,789 | |
| | |
Total Tennessee | | | | | | | 10,692,992 | |
| | |
Texas - 6.0% | | | | | | | | |
| | |
Central Texas Regional Mobility Authority, Series B
4.000%, 01/01/51 | | | 1,000,000 | | | | 953,853 | |
| | |
Texas Private Activity Bond Surface Transportation Corp.,
5.000%, 06/30/58 | | | 7,800,000 | | | | 7,955,241 | |
5.500%, 12/31/58 | | | 1,120,000 | | | | 1,214,259 | |
| | |
Texas Private Activity Bond Surface Transportation Corp., Series A
4.000%, 12/31/39 | | | 2,055,000 | | | | 2,045,674 | |
| | |
Total Texas | | | | | | | 12,169,027 | |
| | |
Virginia - 6.4% | | | | | | | | |
| | |
Lynchburg Economic Development Authority
4.000%, 01/01/55 | | | 1,260,000 | | | | 1,176,586 | |
| | |
Virginia Small Business Financing Authority,
4.000%, 01/01/39 | | | 2,515,000 | | | | 2,485,092 | |
4.000%, 01/01/40 | | | 2,515,000 | | | | 2,457,915 | |
5.000%, 12/31/47 | | | 2,145,000 | | | | 2,219,828 | |
5.000%, 12/31/49 | | | 2,095,000 | | | | 2,122,305 | |
5.000%, 12/31/52 | | | 2,655,000 | | | | 2,684,415 | |
| | |
Total Virginia | | | | | | | 13,146,141 | |
| | |
Washington - 0.5% | | | | | | | | |
| | |
Washington State Housing Finance Commission
5.500%, 07/01/49 | | | 1,000,000 | | | | 1,072,392 | |
| | |
West Virginia - 1.5% | | | | | | | | |
| | |
West Virginia Hospital Finance Authority, Series B
6.000%, 09/01/53 | | | 2,625,000 | | | | 2,960,547 | |
| | |
Wisconsin - 0.6% | | | | | | | | |
| | |
Public Finance Authority, Series A
5.000%, 06/01/411 | | | 1,250,000 | | | | 1,265,139 | |
| |
Total Municipal Bonds | | | | | |
(Cost $212,022,431) | | | | | | | 201,215,465 | |
| |
Short-Term Investments - 0.2% | | | | | |
| | |
Repurchase Agreements - 0.2% | | | | | | | | |
| | |
Fixed Income Clearing Corp., dated 06/28/24, due 07/01/24, 5.150% total to be received $271,116 (collateralized by a U.S. Treasury Note, 0.125%, 04/15/25, totaling $276,477) | | | 271,000 | | | | 271,000 | |
| |
Total Short-Term Investments | | | | | |
(Cost $271,000) | | | | | | | 271,000 | |
| |
Total Investments - 98.9% | | | | | |
(Cost $212,293,431) | | | | | | | 201,486,465 | |
| |
Other Assets, less Liabilities - 1.1% | | | | 2,318,461 | |
| |
Net Assets - 100.0% | | | | $203,804,926 | |
| |
| | | | | |
The accompanying notes are an integral part of these financial statements.
15
|
AMG GW&K Municipal Enhanced Yield Fund Schedule of Portfolio Investments (continued) |
| 1 | Security exempt from registration under Rule 144A of the Securities Act of 1933. This security may be resold in transactions exempt from registration, normally to qualified institutional buyers. At June 30, 2024, the value of this security amounted to $1,265,139 or 0.6% of net assets. |
| | |
| |
| AGM | | Assured Guaranty Municipal Corp. |
| | |
| |
| BAM | | Build America Mutual Assurance Co. |
| |
| FHLMC | | Freddie Mac |
| |
| FNMA | | Fannie Mae |
| |
| GNMA | | Ginnie Mae |
The following table summarizes the inputs used to value the Fund’s investments by the fair value hierarchy levels as of June 30, 2024:
| | | | | | | | | | | | | | | | | | | | | | | | | | | | |
| | | Level 1 | | | | | | Level 2 | | | | | | Level 3 | | | | | | Total | |
| | | | | | | |
Investments in Securities | | | | | | | | | | | | | | | | | | | | | | | | | | | | |
| | | | | | | |
Municipal Bonds† | | | — | | | | | | | $ | 201,215,465 | | | | | | | | — | | | | | | | $ | 201,215,465 | |
| | | | | | | |
Short-Term Investments | | | | | | | | | | | | | | | | | | | | | | | | | | | | |
| | | | | | | |
Repurchase Agreements | | | — | | | | | | | | 271,000 | | | | | | | | — | | | | | | | | 271,000 | |
| | | | | | | | | | | | | | | | | | | | | | | | | | | | |
| | | | | | | |
Total Investments in Securities | | | — | | | | | | | $ | 201,486,465 | | | | | | | | — | | | | | | | $ | 201,486,465 | |
| | | | | | | | | | | | | | | | | | | | | | | | | | | | |
| † | All municipal bonds held in the Fund are Level 2 securities. For a detailed breakout of municipal bonds by major classification, please refer to the Fund’s Schedule of Portfolio Investments. |
For the six months ended June 30, 2024, there were no transfers in or out of Level 3.
The accompanying notes are an integral part of these financial statements.
16
|
Statement of Assets and Liabilities (unaudited) June 30, 2024 |
| | | | | | | | | | | | | | | | | | | | | | | | | |
| | | | | |
| | | AMG GW&K
ESG
Bond Fund | | AMG
GW&K Enhanced
Core Bond
ESG Fund | | AMG
GW&K High
Income Fund | | AMG
GW&K Municipal
Bond Fund | | AMG
GW&K Municipal
Enhanced
Yield Fund |
| | | | | |
Assets: | | | | | | | | | | | | | | | | | | | | | | | | | |
| | | | | |
Investments at value1 (including securities on loan valued at $21,447,918, $0, $0, $0, and $0, respectively) | | | | $412,990,663 | | | | | $27,524,882 | | | | | $6,746,570 | | | | | $1,034,382,890 | | | | | $201,486,465 | |
| | | | | |
Cash | | | | 533 | | | | | — | | | | | — | | | | | 965 | | | | | 931 | |
| | | | | |
Receivable for investments sold | | | | — | | | | | — | | | | | — | | | | | 4,649,076 | | | | | — | |
| | | | | |
Receivable for delayed delivery investments sold | | | | — | | | | | — | | | | | — | | | | | — | | | | | 637,605 | |
| | | | | |
Interest receivables | | | | 3,551,890 | | | | | 60,423 | | | | | 14,158 | | | | | 13,445,102 | | | | | 2,708,715 | |
| | | | | |
Securities lending income receivable | | | | 4,976 | | | | | 197 | | | | | 286 | | | | | — | | | | | — | |
| | | | | |
Receivable for Fund shares sold | | | | 137,809 | | | | | 34,559 | | | | | — | | | | | 819,557 | | | | | 77,841 | |
| | | | | |
Receivable from affiliate | | | | 11,920 | | | | | 37,065 | | | | | 14,545 | | | | | 51,118 | | | | | 15,506 | |
| | | | | |
Prepaid expenses and other assets | | | | 29,658 | | | | | — | | | | | — | | | | | 41,983 | | | | | 18,284 | |
| | | | | |
Total assets | | | | 416,727,449 | | | | | 27,657,126 | | | | | 6,775,559 | | | | | 1,053,390,691 | | | | | 204,945,347 | |
| | | | | |
Liabilities: | | | | | | | | | | | | | | | | | | | | | | | | | |
| | | | | |
Payable upon return of securities loaned | | | | 16,825,095 | | | | | — | | | | | — | | | | | — | | | | | — | |
| | | | | |
Payable for investments purchased | | | | 1,610,249 | | | | | — | | | | | — | | | | | 11,067,102 | | | | | — | |
| | | | | |
Payable for delayed delivery investments purchased | | | | — | | | | | — | | | | | — | | | | | 30,592,532 | | | | | 610,890 | |
| | | | | |
Payable for Fund shares repurchased | | | | 156,049 | | | | | 164,162 | | | | | 54,254 | | | | | 1,347,727 | | | | | 365,428 | |
| | | | | |
Due to custodian | | | | — | | | | | 5,598 | | | | | — | | | | | — | | | | | — | |
| | | | | |
Accrued expenses: | | | | | | | | | | | | | | | | | | | | | | | | | |
| | | | | |
Investment advisory and management fees | | | | 75,827 | | | | | 8,382 | | | | | 2,366 | | | | | 172,866 | | | | | 76,144 | |
| | | | | |
Administrative fees | | | | 49,452 | | | | | 4,192 | | | | | 910 | | | | | 124,270 | | | | | 25,381 | |
| | | | | |
Distribution fees | | | | — | | | | | 820 | | | | | — | | | | | 2,391 | | | | | 680 | |
| | | | | |
Shareholder service fees | | | | 56,689 | | | | | 1,286 | | | | | 1,357 | | | | | 42,160 | | | | | 8,727 | |
| | | | | |
Other | | | | 75,722 | | | | | 37,599 | | | | | 30,357 | | | | | 130,355 | | | | | 53,171 | |
| | | | | |
Total liabilities | | | | 18,849,083 | | | | | 222,039 | | | | | 89,244 | | | | | 43,479,403 | | | | | 1,140,421 | |
| | | | | | | | | | | | | | | | | | | | | | | | | |
| | | | | |
Commitments and Contingencies (Notes 2 & 5) | | | | | | | | | | | | | | | | | | | | | | | | | |
| | | | | |
Net Assets | | | | $397,878,366 | | | | | $27,435,087 | | | | | $6,686,315 | | | | | $1,009,911,288 | | | | | $203,804,926 | |
| | | | | |
1 Investments at cost | | | | $457,741,737 | | | | | $27,524,882 | | | | | $6,746,570 | | | | | $1,063,712,789 | | | | | $212,293,431 | |
The accompanying notes are an integral part of these financial statements.
17
|
Statement of Assets and Liabilities (continued) |
| | | | | | | | | | | | | | | | | | | | | | | | | |
| | | AMG GW&K
ESG
Bond Fund | | AMG
GW&K Enhanced
Core Bond
ESG Fund | | AMG
GW&K High
Income Fund | | AMG
GW&K Municipal
Bond Fund | | AMG
GW&K Municipal
Enhanced
Yield Fund |
| | | | | |
Net Assets Represent: | | | | | | | | | | | | | | | | | | | | | | | | | |
| | | | | |
Paid-in capital | | | | $490,352,097 | | | | | $38,014,594 | | | | | $8,407,503 | | | | | $1,069,616,764 | | | | | $231,856,131 | |
| | | | | |
Total distributable loss | | | | (92,473,731 | ) | | | | (10,579,507 | ) | | | | (1,721,188 | ) | | | | (59,705,476 | ) | | | | (28,051,205 | ) |
| | | | | |
Net Assets | | | | $397,878,366 | | | | | $27,435,087 | | | | | $6,686,315 | | | | | $1,009,911,288 | | | | | $203,804,926 | |
| | | | | |
Class N: | | | | | | | | | | | | | | | | | | | | | | | | | |
| | | | | |
Net Assets | | | | $241,736,925 | | | | | $7,517,164 | | | | | $5,846,078 | | | | | $11,817,511 | | | | | $3,042,130 | |
| | | | | |
Shares outstanding | | | | 11,297,799 | | | | | 844,191 | | | | | 283,942 | | | | | 1,050,995 | | | | | 332,509 | |
| | | | | |
Net asset value, offering and redemption price per share | | | | $21.40 | | | | | $8.90 | | | | | $20.59 | | | | | $11.24 | | | | | $9.15 | |
| | | | | |
Class I: | | | | | | | | | | | | | | | | | | | | | | | | | |
| | | | | |
Net Assets | | | | $156,141,441 | | | | | $14,540,667 | | | | | $840,237 | | | | | $998,093,777 | | | | | $200,638,529 | |
| | | | | |
Shares outstanding | | | | 7,296,510 | | | | | 1,626,543 | | | | | 40,837 | | | | | 88,242,714 | | | | | 22,661,569 | |
| | | | | |
Net asset value, offering and redemption price per share | | | | $21.40 | | | | | $8.94 | | | | | $20.58 | | | | | $11.31 | | | | | $8.85 | |
| | | | | |
Class Z: | | | | | | | | | | | | | | | | | | | | | | | | | |
| | | | | |
Net Assets | | | | — | | | | | $5,377,256 | | | | | — | | | | | — | | | | | $124,267 | |
| | | | | |
Shares outstanding | | | | — | | | | | 601,751 | | | | | — | | | | | — | | | | | 14,039 | |
| | | | | |
Net asset value, offering and redemption price per share | | | | — | | | | | $8.94 | | | | | — | | | | | — | | | | | $8.85 | |
The accompanying notes are an integral part of these financial statements.
18
|
Statement of Operations (unaudited) For the six months ended June 30, 2024 |
| | | | | | | | | | | | | | | | | | | | | | | | | |
| | | AMG GW&K
ESG
Bond Fund | | AMG
GW&K Enhanced
Core Bond
ESG Fund | | AMG
GW&K High
Income Fund | | AMG
GW&K Municipal
Bond Fund | | AMG
GW&K Municipal
Enhanced
Yield Fund |
| | | | | |
Investment Income: | | | | | | | | | | | | | | | | | | | | | | | | | |
| | | | | |
Dividend income | | | | — | | | | | $60,405 | | | | | $14,262 | | | | | — | | | | | — | |
| | | | | |
Interest income | | | | $8,423,863 | | | | | 782,174 | | | | | 306,566 | | | | | $14,552,022 | | | | | $4,104,387 | |
| | | | | |
Securities lending income | | | | 46,232 | | | | | 5,542 | | | | | 5,318 | | | | | — | | | | | — | |
| | | | | |
Foreign withholding tax | | | | (6,188 | ) | | | | (67 | ) | | | | (141 | ) | | | | — | | | | | — | |
| | | | | |
Total investment income | | | | 8,463,907 | | | | | 848,054 | | | | | 326,005 | | | | | 14,552,022 | | | | | 4,104,387 | |
| | | | | |
Expenses: | | | | | | | | | | | | | | | | | | | | | | | | | |
| | | | | |
Investment advisory and management fees | | | | 471,616 | | | | | 56,955 | | | | | 22,233 | | | | | 1,066,353 | | | | | 466,004 | |
| | | | | |
Administrative fees | | | | 307,576 | | | | | 28,477 | | | | | 8,551 | | | | | 767,132 | | | | | 155,334 | |
| | | | | |
Distribution fees - Class N | | | | — | | | | | 11,163 | | | | | — | | | | | 14,199 | | | | | 4,218 | |
| | | | | |
Shareholder servicing fees - Class N | | | | 314,608 | | | | | — | | | | | 8,459 | | | | | 7,213 | | | | | 2,531 | |
| | | | | |
Shareholder servicing fees - Class I | | | | 39,604 | | | | | 8,763 | | | | | 1,159 | | | | | 252,871 | | | | | 50,904 | |
| | | | | |
Professional fees | | | | 41,130 | | | | | 7,090 | | | | | 7,359 | | | | | 54,104 | | | | | 26,055 | |
| | | | | |
Reports to shareholders | | | | 31,718 | | | | | 14,966 | | | | | 6,928 | | | | | 25,892 | | | | | 6,741 | |
| | | | | |
Registration fees | | | | 28,292 | | | | | 43,705 | | | | | 23,802 | | | | | 36,760 | | | | | 22,474 | |
| | | | | |
Custodian fees | | | | 26,565 | | | | | 17,821 | | | | | 13,472 | | | | | 41,733 | | | | | 16,394 | |
| | | | | |
Trustee fees and expenses | | | | 15,790 | | | | | 1,420 | | | | | 410 | | | | | 38,866 | | | | | 8,098 | |
| | | | | |
Transfer agent fees | | | | 11,970 | | | | | 2,274 | | | | | 914 | | | | | 18,566 | | | | | 4,001 | |
| | | | | |
Interest expense | | | | — | | | | | — | | | | | — | | | | | — | | | | | 349 | |
| | | | | |
Miscellaneous | | | | 12,449 | | | | | 4,676 | | | | | 5,012 | | | | | 23,843 | | | | | 6,255 | |
| | | | | |
Total expenses before offsets | | | | 1,301,318 | | | | | 197,310 | | | | | 98,299 | | | | | 2,347,532 | | | | | 769,358 | |
| | | | | |
Expense reimbursements | | | | (65,389 | ) | | | | (86,603 | ) | | | | (55,202 | ) | | | | (334,418 | ) | | | | (100,374 | ) |
| | | | | |
Fee waivers | | | | — | | | | | (3,470 | ) | | | | (1,041 | ) | | | | — | | | | | — | |
| | | | | |
Net expenses | | | | 1,235,929 | | | | | 107,237 | | | | | 42,056 | | | | | 2,013,114 | | | | | 668,984 | |
| | | | | | | | | | | | | | | | | | | | | | | | | |
| | | | | |
Net investment income | | | | 7,227,978 | | | | | 740,817 | | | | | 283,949 | | | | | 12,538,908 | | | | | 3,435,403 | |
| | | | | |
Net Realized and Unrealized Loss: | | | | | | | | | | | | | | | | | | | | | | | | | |
| | | | | |
Net realized loss on investments | | | | (7,515,374 | ) | | | | (3,436,483 | ) | | | | (169,536 | ) | | | | (3,658,855 | ) | | | | (1,082,875 | ) |
| | | | | |
Net change in unrealized appreciation/depreciation on investments | | | | (1,379,102 | ) | | | | 2,754,428 | | | | | 58,851 | | | | | (22,375,297 | ) | | | | (241,610 | ) |
| | | | | |
Net realized and unrealized loss | | | | (8,894,476 | ) | | | | (682,055 | ) | | | | (110,685 | ) | | | | (26,034,152 | ) | | | | (1,324,485 | ) |
| | | | | | | | | | | | | | | | | | | | | | | | | |
| | | | | |
Net increase (decrease) in net assets resulting from operations | | | | $(1,666,498) | | | | | $58,762 | | | | | $173,264 | | | | | $(13,495,244 | ) | | | | $2,110,918 | |
The accompanying notes are an integral part of these financial statements.
19
| | |
| | | Statements of Changes in Net Assets For the six months ended June 30, 2024 (unaudited) and the fiscal year ended December 31, 2023 |
| | | |
| | | |
| | | | | | | | | | | | | | | | | | | | | | | | | | | | | | |
| | | AMG GW&K
ESG Bond Fund | | AMG
GW&K Enhanced
Core Bond ESG Fund | | AMG
GW&K High
Income Fund |
| | | | | | |
| | | June 30, 2024 | | December 31, 2023 | | June 30, 2024 | | December 31, 2023 | | June 30, 2024 | | December 31, 2023 |
| | | | | | |
Increase (Decrease) in Net Assets Resulting From Operations: | | | | | | | | | | | | | | | | | | | | | | | | | | | | | | |
| | | | | | |
Net investment income | | | | $7,227,978 | | | | | $13,959,156 | | | | | $740,817 | | | | | $1,330,094 | | | | | $283,949 | | | | | $758,990 | |
| | | | | | |
Net realized loss on investments | | | | (7,515,374 | ) | | | | (19,675,989) | | | | | (3,436,483 | ) | | | | (1,593,070 | ) | | | | (169,536 | ) | | | | (225,634 | ) |
| | | | | | |
Net change in unrealized appreciation/depreciation on investments | | | | (1,379,102 | ) | | | | 34,991,525 | | | | | 2,754,428 | | | | | 2,720,322 | | | | | 58,851 | | | | | 825,281 | |
| | | | | | | | | | | | | | | | | | | | | | | | | | | | | | |
| | | | | | |
Net increase (decrease) in net assets resulting from operations | | | | (1,666,498 | ) | | | | 29,274,692 | | | | | 58,762 | | | | | 2,457,346 | | | | | 173,264 | | | | | 1,358,637 | |
| | | | | | |
Distributions to Shareholders: | | | | | | | | | | | | | | | | | | | | | | | | | | | | | | |
| | | | | | |
Class N | | | | (4,328,571 | ) | | | | (8,492,938) | | | | | (274,602 | ) | | | | (347,751 | ) | | | | (252,488 | ) | | | | (325,482 | ) |
| | | | | | |
Class I | | | | (2,893,513 | ) | | | | (5,729,614) | | | | | (601,555 | ) | | | | (691,238 | ) | | | | (118,105 | ) | | | | (446,846 | ) |
| | | | | | |
Class Z | | | | — | | | | | — | | | | | (212,553 | ) | | | | (280,142 | ) | | | | — | | | | | — | |
| | | | | | | | | | | | | | | | | | | | | | | | | | | | | | |
| | | | | | |
Total distributions to shareholders | | | | (7,222,084 | ) | | | | (14,222,552) | | | | | (1,088,710 | ) | | | | (1,319,131 | ) | | | | (370,593 | ) | | | | (772,328 | ) |
| | | | | | |
Capital Share Transactions:1 | | | | | | | | | | | | | | | | | | | | | | | | | | | | | | |
| | | | | | |
Net decrease from capital share transactions | | | | (28,654,508 | ) | | | | (72,637,330) | | | | | (12,351,626 | ) | | | | (768,427 | ) | | | | (7,131,530 | ) | | | | (3,839,684 | ) |
| | | | | | | | | | | | | | | | | | | | | | | | | | | | | | |
| | | | | | |
Total increase (decrease) in net assets | | | | (37,543,090 | ) | | | | (57,585,190) | | | | | (13,381,574 | ) | | | | 369,788 | | | | | (7,328,859 | ) | | | | (3,253,375 | ) |
| | | | | | |
Net Assets: | | | | | | | | | | | | | | | | | | | | | | | | | | | | | | |
| | | | | | |
Beginning of period | | | | 435,421,456 | | | | | 493,006,646 | | | | | 40,816,661 | | | | | 40,446,873 | | | | | 14,015,174 | | | | | 17,268,549 | |
| | | | | | | | | | | | | | | | | | | | | | | | | | | | | | |
| | | | | | |
End of period | | | | $397,878,366 | | | | | $435,421,456 | | | | | $27,435,087 | | | | | $40,816,661 | | | | | $6,686,315 | | | | | $14,015,174 | |
1 See Note 1(g) of the Notes to Financial Statements.
The accompanying notes are an integral part of these financial statements.
20
| | |
| | | Statements of Changes in Net Assets (continued) For the six months ended June 30, 2024 (unaudited) and the fiscal year ended December 31, 2023 |
| | | |
| | | |
| | | | | | | | | | | | | | | | | | | | |
| | | AMG
GW&K Municipal
Bond Fund | | AMG
GW&K Municipal
Enhanced Yield Fund |
| | | | |
| | | June 30, 2024 | | December 31, 2023 | | June 30, 2024 | | December 31, 2023 |
| | | | |
Increase (Decrease) in Net Assets Resulting From Operations: | | | | | | | | | | | | | | | | | | | | |
| | | | |
Net investment income | | | | $12,538,908 | | | | | $22,827,789 | | | | | $3,435,403 | | | | | $7,868,751 | |
| | | | |
Net realized loss on investments | | | | (3,658,855 | ) | | | | (16,640,418 | ) | | | | (1,082,875 | ) | | | | (10,403,174 | ) |
| | | | |
Net change in unrealized appreciation/depreciation on investments | | | | (22,375,297 | ) | | | | 53,394,216 | | | | | (241,610 | ) | | | | 24,812,114 | |
| | | | | | | | | | | | | | | | | | | | |
| | | | |
Net increase (decrease) in net assets resulting from operations | | | | (13,495,244 | ) | | | | 59,581,587 | | | | | 2,110,918 | | | | | 22,277,691 | |
| | | | |
Distributions to Shareholders: | | | | | | | | | | | | | | | | | | | | |
| | | | |
Class N | | | | (122,045 | ) | | | | (240,964 | ) | | | | (45,882 | ) | | | | (109,195 | ) |
| | | | |
Class I | | | | (12,430,098 | ) | | | | (22,338,212 | ) | | | | (3,397,416 | ) | | | | (7,709,369 | ) |
| | | | |
Class Z | | | | — | | | | | — | | | | | (2,080 | ) | | | | (3,806 | ) |
| | | | | | | | | | | | | | | | | | | | |
| | | | |
Total distributions to shareholders | | | | (12,552,143 | ) | | | | (22,579,176 | ) | | | | (3,445,378 | ) | | | | (7,822,370 | ) |
| | | | |
Capital Share Transactions:1 | | | | | | | | | | | | | | | | | | | | |
| | | | |
Net increase (decrease) from capital share transactions | | | | 7,270,119 | | | | | (89,576,367 | ) | | | | (6,268,880 | ) | | | | (62,041,101 | ) |
| | | | | | | | | | | | | | | | | | | | |
| | | | |
Total decrease in net assets | | | | (18,777,268 | ) | | | | (52,573,956 | ) | | | | (7,603,340 | ) | | | | (47,585,780 | ) |
| | | | |
Net Assets: | | | | | | | | | | | | | | | | | | | | |
| | | | |
Beginning of period | | | | 1,028,688,556 | | | | | 1,081,262,512 | | | | | 211,408,266 | | | | | 258,994,046 | |
| | | | | | | | | | | | | | | | | | | | |
| | | | |
End of period | | | | $1,009,911,288 | | | | | $1,028,688,556 | | | | | $203,804,926 | | | | | $211,408,266 | |
1 See Note 1(g) of the Notes to Financial Statements.
The accompanying notes are an integral part of these financial statements.
21
|
AMG GW&K ESG Bond Fund Financial Highlights For a share outstanding throughout each fiscal period |
| | | | | | | | | | | | | | | | | | | | | | | | |
| | | For the six
months ended
June 30, 2024 (unaudited) | | For the fiscal years ended December 31, |
| Class N | | 2023 | | 2022 | | 2021 | | 2020 | | 2019 |
| | | | | | |
Net Asset Value, Beginning of Period | | | $21.85 | | | | $21.11 | | | | $24.88 | | | | $28.12 | | | | $27.14 | | | | $25.49 | |
| | | | |
Income (loss) from Investment Operations: | | | | | | | | | | | | | | | | | |
| | | | | | |
Net investment income1,2 | | | 0.37 | | | | 0.63 | | | | 0.44 | | | | 0.44 | | | | 0.90 | | | | 0.94 | |
| | | | | | |
Net realized and unrealized gain (loss) on investments | | | (0.45 | ) | | | 0.75 | | | | (3.70 | ) | | | (0.83 | ) | | | 1.03 | | | | 1.85 | |
| | | | | | | | | | | | | | | | | | | | | | | | |
| | | | | | |
Total income (loss) from investment operations | | | (0.08 | ) | | | 1.38 | | | | (3.26 | ) | | | (0.39 | ) | | | 1.93 | | | | 2.79 | |
| | | | | | |
Less Distributions to Shareholders from: | | | | | | | | | | | | | | | | | | | | | | | | |
| | | | | | |
Net investment income | | | (0.37 | ) | | | (0.64 | ) | | | (0.47 | ) | | | (0.47 | ) | | | (0.88 | ) | | | (0.98 | ) |
| | | | | | |
Net realized gain on investments | | | — | | | | — | | | | (0.04 | ) | | | (2.38 | ) | | | (0.07 | ) | | | (0.16 | ) |
| | | | | | | | | | | | | | | | | | | | | | | | |
| | | | | | |
Total distributions to shareholders | | | (0.37 | ) | | | (0.64 | ) | | | (0.51 | ) | | | (2.85 | ) | | | (0.95 | ) | | | (1.14 | ) |
| | | | | | |
Net Asset Value, End of Period | | | $21.40 | | | | $21.85 | | | | $21.11 | | | | $24.88 | | | | $28.12 | | | | $27.14 | |
| | | | | | | | | | | | | | | | | | | | | | | | |
| | | | | | |
Total Return2,3 | | | (0.35 | )%4 | | | 6.69 | % | | | (13.17 | )% | | | (1.29 | )% | | | 7.34 | % | | | 11.10 | % |
| | | | | | |
Ratio of net expenses to average net assets | | | 0.68 | %5 | | | 0.68 | % | | | 0.68 | % | | | 0.69 | %6 | | | 0.71 | % | | | 0.72 | %7 |
| | | | | | |
Ratio of gross expenses to average net assets8 | | | 0.71 | %5 | | | 0.70 | % | | | 0.69 | % | | | 0.69 | %6 | | | 0.72 | % | | | 0.73 | %7 |
| | | | | | |
Ratio of net investment income to average net assets2 | | | 3.45 | %5 | | | 2.94 | % | | | 1.98 | % | | | 1.71 | % | | | 3.31 | % | | | 3.53 | % |
| | | | | | |
Portfolio turnover | | | 18 | %4 | | | 27 | % | | | 23 | % | | | 186 | % | | | 25 | % | | | 20 | % |
| | | | | | |
Net assets end of period (000’s) omitted | | | $241,737 | | | | $269,529 | | | | $301,028 | | | | $427,818 | | | | $555,124 | | | | $618,381 | |
| | | | | | |
| | | | | | | | | | | | | | | | | | | | | | | | | |
22
|
AMG GW&K ESG Bond Fund Financial Highlights For a share outstanding throughout each fiscal period |
| | | | | | | | | | | | | | | | | | | | | | | | |
| | | For the six
months ended
June 30, 2024 (unaudited) | | For the fiscal years ended December 31, |
| Class I | | 2023 | | 2022 | | 2021 | | 2020 | | 2019 |
| | | | | | |
Net Asset Value, Beginning of Period | | | $21.85 | | | | $21.12 | | | | $24.89 | | | | $28.13 | | | | $27.14 | | | | $25.49 | |
| | | | |
Income (loss) from Investment Operations: | | | | | | | | | | | | | | | | | |
| | | | | | |
Net investment income1,2 | | | 0.39 | | | | 0.67 | | | | 0.49 | | | | 0.50 | | | | 0.95 | | | | 0.99 | |
| | | | | | |
Net realized and unrealized gain (loss) on investments | | | (0.45 | ) | | | 0.75 | | | | (3.71 | ) | | | (0.83 | ) | | | 1.05 | | | | 1.85 | |
| | | | | | | | | | | | | | | | | | | | | | | | |
| | | | | | |
Total income (loss) from investment operations | | | (0.06 | ) | | | 1.42 | | | | (3.22 | ) | | | (0.33 | ) | | | 2.00 | | | | 2.84 | |
| | | | | | |
Less Distributions to Shareholders from: | | | | | | | | | | | | | | | | | | | | | | | | |
| | | | | | |
Net investment income | | | (0.39 | ) | | | (0.69 | ) | | | (0.51 | ) | | | (0.53 | ) | | | (0.94 | ) | | | (1.03 | ) |
| | | | | | |
Net realized gain on investments | | | — | | | | — | | | | (0.04 | ) | | | (2.38 | ) | | | (0.07 | ) | | | (0.16 | ) |
| | | | | | | | | | | | | | | | | | | | | | | | |
| | | | | | |
Total distributions to shareholders | | | (0.39 | ) | | | (0.69 | ) | | | (0.55 | ) | | | (2.91 | ) | | | (1.01 | ) | | | (1.19 | ) |
| | | | | | |
Net Asset Value, End of Period | | | $21.40 | | | | $21.85 | | | | $21.12 | | | | $24.89 | | | | $28.13 | | | | $27.14 | |
| | | | | | | | | | | | | | | | | | | | | | | | |
| | | | | | |
Total Return2,3 | | | (0.25 | )%4 | | | 6.85 | % | | | (12.99 | )% | | | (1.05 | )% | | | 7.57 | % | | | 11.32 | % |
| | | | | | |
Ratio of net expenses to average net assets | | | 0.48 | %5 | | | 0.48 | % | | | 0.48 | % | | | 0.49 | %6 | | | 0.50 | % | | | 0.52 | %7 |
| | | | | | |
Ratio of gross expenses to average net assets8 | | | 0.51 | %5 | | | 0.50 | % | | | 0.49 | % | | | 0.49 | %6 | | | 0.51 | % | | | 0.53 | %7 |
| | | | | | |
Ratio of net investment income to average net assets2 | | | 3.65 | %5 | | | 3.14 | % | | | 2.18 | % | | | 1.91 | % | | | 3.52 | % | | | 3.73 | % |
| | | | | | |
Portfolio turnover | | | 18 | %4 | | | 27 | % | | | 23 | % | | | 186 | % | | | 25 | % | | | 20 | % |
| | | | | | |
Net assets end of period (000’s) omitted | | | $156,141 | | | | $165,892 | | | | $191,979 | | | | $327,121 | | | | $546,698 | | | | $605,353 | |
| | | | | | |
| | | | | | | | | | | | | | | | | | | | | | | | | |
| 1 | Per share numbers have been calculated using average shares. |
| 2 | Total returns and net investment income would have been lower had certain expenses not been offset. |
| 3 | The total return is calculated using the published Net Asset Value as of period end. |
| 6 | Ratio includes recapture of reimbursed fees from prior years amounting to less than 0.01% for the fiscal year ended December 31, 2021. |
| 7 | Includes 0.01% of extraordinary expense related to legal expense in support of an investment held in the portfolio. |
| 8 | Excludes the impact of expense reimbursement or fee waivers and expense reductions such as brokerage credits, but includes expense repayments and non-reimbursable expenses, if any, such as interest, taxes, and extraordinary expenses. (See Note 1(c) and 2 in the Notes to Financial Statements.) |
23
|
AMG GW&K Enhanced Core Bond ESG Fund Financial Highlights For a share outstanding throughout each fiscal period |
| | | | | | | | | | | | | | | | | | | | | | | | |
| | | For the six
months ended
June 30, 2024 (unaudited) | | For the fiscal years ended December 31, |
| Class N | | 2023 | | 2022 | | 2021 | | 2020 | | 2019 |
| | | | | | |
Net Asset Value, Beginning of Period | | | $9.15 | | | | $8.92 | | | | $10.61 | | | | $10.90 | | | | $10.15 | | | | $9.43 | |
| | | | |
Income (loss) from Investment Operations: | | | | | | | | | | | | | | | | | |
| | | | | | |
Net investment income1,2 | | | 0.17 | | | | 0.29 | | | | 0.19 | | | | 0.14 | | | | 0.20 | | | | 0.24 | |
| | | | | | |
Net realized and unrealized gain (loss) on investments | | | (0.15 | ) | | | 0.22 | | | | (1.69 | ) | | | (0.28 | ) | | | 0.75 | | | | 0.73 | |
| | | | | | | | | | | | | | | | | | | | | | | | |
| | | | | | |
Total income (loss) from investment operations | | | 0.02 | | | | 0.51 | | | | (1.50 | ) | | | (0.14 | ) | | | 0.95 | | | | 0.97 | |
| | | | | | |
Less Distributions to Shareholders from: | | | | | | | | | | | | | | | | | | | | | | | | |
| | | | | | |
Net investment income | | | (0.27 | ) | | | (0.28 | ) | | | (0.19 | ) | | | (0.14 | ) | | | (0.20 | ) | | | (0.25 | ) |
| | | | | | |
Paid in capital | | | — | | | | — | | | | — | | | | (0.01 | ) | | | — | | | | — | |
| | | | | | | | | | | | | | | | | | | | | | | | |
| | | | | | |
Total distributions to shareholders | | | (0.27 | ) | | | (0.28 | ) | | | (0.19 | ) | | | (0.15 | ) | | | (0.20 | ) | | | (0.25 | ) |
| | | | | | |
Net Asset Value, End of Period | | | $8.90 | | | | $9.15 | | | | $8.92 | | | | $10.61 | | | | $10.90 | | | | $10.15 | |
| | | | | | | | | | | | | | | | | | | | | | | | |
| | | | | | |
Total Return2,3 | | | 0.20 | %4 | | | 5.89 | % | | | (14.17 | )% | | | (1.26 | )% | | | 9.41 | % | | | 10.35 | % |
| | | | | | |
Ratio of net expenses to average net assets | | | 0.69 | %5 | | | 0.73 | % | | | 0.73 | % | | | 0.73 | % | | | 0.73 | % | | | 0.73 | % |
| | | | | | |
Ratio of gross expenses to average net assets6 | | | 1.16 | %5 | | | 1.05 | % | | | 1.00 | % | | | 0.93 | % | | | 1.06 | % | | | 1.16 | % |
| | | | | | |
Ratio of net investment income to average net assets2 | | | 3.78 | %5 | | | 3.20 | % | | | 1.99 | % | | | 1.32 | % | | | 1.86 | % | | | 2.43 | % |
| | | | | | |
Portfolio turnover | | | 24 | %4 | | | 51 | % | | | 54 | % | | | 86 | % | | | 101 | % | | | 71 | % |
| | | | | | |
Net assets end of period (000’s) omitted | | | $7,517 | | | | $11,370 | | | | $10,680 | | | | $13,736 | | | | $15,794 | | | | $14,779 | |
| | | | | | |
| | | | | | | | | | | | | | | | | | | | | | | | | |
24
|
AMG GW&K Enhanced Core Bond ESG Fund Financial Highlights For a share outstanding throughout each fiscal period |
| | | | | | | | | | | | | | | | | | | | | | | | |
| | | For the six
months ended
June 30, 2024 (unaudited) | | For the fiscal years ended December 31, |
| Class I | | 2023 | | 2022 | | 2021 | | 2020 | | 2019 |
| | | | | | |
Net Asset Value, Beginning of Period | | | $9.18 | | | | $8.95 | | | | $10.65 | | | | $10.94 | | | | $10.19 | | | | $9.47 | |
| | | | |
Income (loss) from Investment Operations: | | | | | | | | | | | | | | | | | |
| | | | | | |
Net investment income1,2 | | | 0.18 | | | | 0.30 | | | | 0.21 | | | | 0.16 | | | | 0.22 | | | | 0.26 | |
| | | | | | |
Net realized and unrealized gain (loss) on investments | | | (0.15 | ) | | | 0.23 | | | | (1.70 | ) | | | (0.28 | ) | | | 0.75 | | | | 0.73 | |
| | | | | | | | | | | | | | | | | | | | | | | | |
| | | | | | |
Total income (loss) from investment operations | | | 0.03 | | | | 0.53 | | | | (1.49 | ) | | | (0.12 | ) | | | 0.97 | | | | 0.99 | |
| | | | | | |
Less Distributions to Shareholders from: | | | | | | | | | | | | | | | | | | | | | | | | |
| | | | | | |
Net investment income | | | (0.27 | ) | | | (0.30 | ) | | | (0.21 | ) | | | (0.16 | ) | | | (0.22 | ) | | | (0.27 | ) |
| | | | | | |
Paid in capital | | | — | | | | — | | | | — | | | | (0.01 | ) | | | — | | | | — | |
| | | | | | | | | | | | | | | | | | | | | | | | |
| | | | | | |
Total distributions to shareholders | | | (0.27 | ) | | | (0.30 | ) | | | (0.21 | ) | | | (0.17 | ) | | | (0.22 | ) | | | (0.27 | ) |
| | | | | | |
Net Asset Value, End of Period | | | $8.94 | | | | $9.18 | | | | $8.95 | | | | $10.65 | | | | $10.94 | | | | $10.19 | |
| | | | | | | | | | | | | | | | | | | | | | | | |
| | | | | | |
Total Return2,3 | | | 0.36 | %4 | | | 6.05 | % | | | (14.07 | )% | | | (1.07 | )% | | | 9.57 | % | | | 10.51 | % |
| | | | | | |
Ratio of net expenses to average net assets | | | 0.55 | %5 | | | 0.56 | % | | | 0.56 | % | | | 0.56 | % | | | 0.55 | % | | | 0.55 | % |
| | | | | | |
Ratio of gross expenses to average net assets6 | | | 1.02 | %5 | | | 0.88 | % | | | 0.83 | % | | | 0.76 | % | | | 0.88 | % | | | 0.98 | % |
| | | | | | |
Ratio of net investment income to average net assets2 | | | 3.92 | %5 | | | 3.37 | % | | | 2.16 | % | | | 1.49 | % | | | 2.04 | % | | | 2.62 | % |
| | | | | | |
Portfolio turnover | | | 24 | %4 | | | 51 | % | | | 54 | % | | | 86 | % | | | 101 | % | | | 71 | % |
| | | | | | |
Net assets end of period (000’s) omitted | | | $14,541 | | | | $21,805 | | | | $19,890 | | | | $33,402 | | | | $27,800 | | | | $8,502 | |
| | | | | | |
| | | | | | | | | | | | | | | | | | | | | | | | | |
25
|
AMG GW&K Enhanced Core Bond ESG Fund Financial Highlights For a share outstanding throughout each fiscal period |
| | | | | | | | | | | | | | | | | | | | | | | | |
| | | For the six
months ended
June 30, 2024 (unaudited) | | For the fiscal years ended December 31, |
| Class Z | | 2023 | | 2022 | | 2021 | | 2020 | | 2019 |
| | | | | | |
Net Asset Value, Beginning of Period | | | $9.18 | | | | $8.95 | | | | $10.65 | | | | $10.93 | | | | $10.18 | | | | $9.46 | |
| | | | |
Income (loss) from Investment Operations: | | | | | | | | | | | | | | | | | |
| | | | | | |
Net investment income1,2 | | | 0.18 | | | | 0.31 | | | | 0.21 | | | | 0.17 | | | | 0.22 | | | | 0.27 | |
| | | | | | |
Net realized and unrealized gain (loss) on investments | | | (0.14 | ) | | | 0.23 | | | | (1.69 | ) | | | (0.27 | ) | | | 0.75 | | | | 0.72 | |
| | | | | | | | | | | | | | | | | | | | | | | | |
| | | | | | |
Total income (loss) from investment operations | | | 0.04 | | | | 0.54 | | | | (1.48 | ) | | | (0.10 | ) | | | 0.97 | | | | 0.99 | |
| | | | | | |
Less Distributions to Shareholders from: | | | | | | | | | | | | | | | | | | | | | | | | |
| | | | | | |
Net investment income | | | (0.28 | ) | | | (0.31 | ) | | | (0.22 | ) | | | (0.17 | ) | | | (0.22 | ) | | | (0.27 | ) |
| | | | | | |
Paid in capital | | | — | | | | — | | | | — | | | | (0.01 | ) | | | — | | | | — | |
| | | | | | | | | | | | | | | | | | | | | | | | |
| | | | | | |
Total distributions to shareholders | | | (0.28 | ) | | | (0.31 | ) | | | (0.22 | ) | | | (0.18 | ) | | | (0.22 | ) | | | (0.27 | ) |
| | | | | | |
Net Asset Value, End of Period | | | $8.94 | | | | $9.18 | | | | $8.95 | | | | $10.65 | | | | $10.93 | | | | $10.18 | |
| | | | | | | | | | | | | | | | | | | | | | | | |
| | | | | | |
Total Return2,3 | | | 0.43 | %4 | | | 6.13 | % | | | (14.00 | )% | | | (0.92 | )% | | | 9.65 | % | | | 10.59 | % |
| | | | | | |
Ratio of net expenses to average net assets | | | 0.46 | %5 | | | 0.48 | % | | | 0.48 | % | | | 0.48 | % | | | 0.48 | % | | | 0.48 | % |
| | | | | | |
Ratio of gross expenses to average net assets6 | | | 0.93 | %5 | | | 0.80 | % | | | 0.75 | % | | | 0.68 | % | | | 0.81 | % | | | 0.91 | % |
| | | | | | |
Ratio of net investment income to average net assets2 | | | 4.01 | %5 | | | 3.45 | % | | | 2.24 | % | | | 1.57 | % | | | 2.11 | % | | | 2.72 | % |
| | | | | | |
Portfolio turnover | | | 24 | %4 | | | 51 | % | | | 54 | % | | | 86 | % | | | 101 | % | | | 71 | % |
| | | | | | |
Net assets end of period (000’s) omitted | | | $5,377 | | | | $7,641 | | | | $9,877 | | | | $13,712 | | | | $11,552 | | | | $10,080 | |
| | | | | | |
| | | | | | | | | | | | | | | | | | | | | | | | | |
| 1 | Per share numbers have been calculated using average shares. |
| 2 | Total returns and net investment income would have been lower had certain expenses not been offset. |
| 3 | The total return is calculated using the published Net Asset Value as of period end. |
| 6 | Excludes the impact of expense reimbursement or fee waivers and expense reductions such as brokerage credits, but includes expense repayments and non-reimbursable expenses, if any, such as interest, taxes, and extraordinary expenses. (See Note 1(c) and 2 in the Notes to Financial Statements.) |
26
|
AMG GW&K High Income Fund Financial Highlights For a share outstanding throughout each fiscal period |
| | | | | | | | | | | | | | | | | | | | | | | | |
| | | For the six
months ended
June 30, 2024 (unaudited) | | For the fiscal years ended December 31, |
| Class N | | 2023 | | 2022 | | 2021 | | 2020 | | 2019 |
| | | | | | |
Net Asset Value, Beginning of Period | | | $20.91 | | | | $20.11 | | | | $22.46 | | | | $22.23 | | | | $21.52 | | | | $20.04 | |
| | | | |
Income (loss) from Investment Operations: | | | | | | | | | | | | | | | | | |
| | | | | | |
Net investment income1,2 | | | 0.51 | | | | 0.96 | | | | 0.67 | | | | 0.53 | | | | 0.51 | | | | 0.57 | |
| | | | | | |
Net realized and unrealized gain (loss) on investments | | | (0.06 | ) | | | 0.83 | | | | (2.20 | ) | | | 0.28 | | | | 2.09 | | | | 0.98 | |
| | | | | | | | | | | | | | | | | | | | | | | | |
| | | | | | |
Total income (loss) from investment operations | | | 0.45 | | | | 1.79 | | | | (1.53 | ) | | | 0.81 | | | | 2.60 | | | | 1.55 | |
| | | | | | |
Less Distributions to Shareholders from: | | | | | | | | | | | | | | | | | | | | | | | | |
| | | | | | |
Net investment income | | | (0.77 | ) | | | (0.99 | ) | | | (0.77 | ) | | | (0.53 | ) | | | (0.48 | ) | | | (0.07 | ) |
| | | | | | |
Net realized gain on investments | | | — | | | | — | | | | (0.05 | ) | | | (0.05 | ) | | | (1.41 | ) | | | — | |
| | | | | | | | | | | | | | | | | | | | | | | | |
| | | | | | |
Total distributions to shareholders | | | (0.77 | ) | | | (0.99 | ) | | | (0.82 | ) | | | (0.58 | ) | | | (1.89 | ) | | | (0.07 | ) |
| | | | | | |
Net Asset Value, End of Period | | | $20.59 | | | | $20.91 | | | | $20.11 | | | | $22.46 | | | | $22.23 | | | | $21.52 | |
| | | | | | | | | | | | | | | | | | | | | | | | |
| | | | | | |
Total Return2,3 | | | 2.21 | %4 | | | 9.13 | % | | | (6.80 | )% | | | 3.67 | % | | | 12.16 | % | | | 7.67 | % |
| | | | | | |
Ratio of net expenses to average net assets | | | 0.82 | %5 | | | 0.84 | % | | | 0.86 | %6 | | | 0.84 | % | | | 0.89 | % | | | 0.89 | % |
| | | | | | |
Ratio of gross expenses to average net assets7 | | | 1.81 | %5 | | | 1.48 | % | | | 1.32 | % | | | 1.37 | % | | | 1.70 | % | | | 1.87 | % |
| | | | | | |
Ratio of net investment income to average net assets2 | | | 4.90 | %5 | | | 4.72 | % | | | 3.22 | % | | | 2.36 | % | | | 2.28 | % | | | 2.70 | % |
| | | | | | |
Portfolio turnover | | | 25 | %4 | | | 25 | % | | | 74 | % | | | 97 | % | | | 157 | % | | | 52 | % |
| | | | | | |
Net assets end of period (000’s) omitted | | | $5,846 | | | | $7,061 | | | | $6,528 | | | | $8,157 | | | | $10,302 | | | | $9,638 | |
| | | | | | |
| | | | | | | | | | | | | | | | | | | | | | | | | |
27
|
AMG GW&K High Income Fund Financial Highlights For a share outstanding throughout each fiscal period |
| | | | | | | | | | | | | | | | | | |
| | | For the six
months ended
June 30, 2024 (unaudited) | | | | For the fiscal years ended December 31, | | For the fiscal period ended December 31, |
| Class I | | 2023 | | 2022 | | 20218 |
| | | | | |
Net Asset Value, Beginning of Period | | | $20.90 | | | | | | $20.10 | | | | $22.45 | | | | $22.27 | |
| | |
Income (loss) from Investment Operations: | | | | | | | | | |
| | | | | |
Net investment income1,2 | | | 0.53 | | | | | | 1.00 | | | | 0.71 | | | | 0.46 | |
| | | | | |
Net realized and unrealized gain (loss) on investments | | | (0.05 | ) | | | | | 0.83 | | | | (2.20 | ) | | | 0.35 | |
| | | | | | | | | | | | | | | | | | |
| | | | | |
Total income (loss) from investment operations | | | 0.48 | | | | | | 1.83 | | | | (1.49 | ) | | | 0.81 | |
| | | | | |
Less Distributions to Shareholders from: | | | | | | | | | | | | | | | | | | |
| | | | | |
Net investment income | | | (0.80 | ) | | | | | (1.03 | ) | | | (0.81 | ) | | | (0.58 | ) |
| | | | | |
Net realized gain on investments | | | — | | | | | | — | | | | (0.05 | ) | | | (0.05 | ) |
| | | | | | | | | | | | | | | | | | |
| | | | | |
Total distributions to shareholders | | | (0.80 | ) | | | | | (1.03 | ) | | | (0.86 | ) | | | (0.63 | ) |
| | | | | |
Net Asset Value, End of Period | | | $20.58 | | | | | | $20.90 | | | | $20.10 | | | | $22.45 | |
| | | | | | | | | | | | | | | | | | |
| | | | | |
Total Return2,3 | | | 2.28 | %4 | | | | | 9.35 | % | | | (6.63 | )% | | | 3.68 | %4 |
| | | | | |
Ratio of net expenses to average net assets | | | 0.62 | %5 | | | | | 0.64 | % | | | 0.66 | %6 | | | 0.64 | %5 |
| | | | | |
Ratio of gross expenses to average net assets7 | | | 1.61 | %5 | | | | | 1.28 | % | | | 1.12 | % | | | 1.17 | %5 |
| | | | | |
Ratio of net investment income to average net assets2 | | | 5.10 | %5 | | | | | 4.92 | % | | | 3.42 | % | | | 2.56 | %5 |
| | | | | |
Portfolio turnover | | | 25 | %4 | | | | | 25 | % | | | 74 | % | | | 97 | % |
| | | | | |
Net assets end of period (000’s) omitted | | | $840 | | | | | | $6,954 | | | | $10,740 | | | | $13,166 | |
| | | | | |
| | | | | | | | | | | | | | | | | | | |
| 1 | Per share numbers have been calculated using average shares. |
| 2 | Total returns and net investment income would have been lower had certain expenses not been offset. |
| 3 | The total return is calculated using the published Net Asset Value as of period end. |
| 6 | Includes interest expense totaling 0.02% related to participation in the interfund lending program. |
| 7 | Excludes the impact of expense reimbursement or fee waivers and expense reductions such as brokerage credits, but includes expense repayments and non-reimbursable expenses, if any, such as interest, taxes, and extraordinary expenses. (See Note 1(c) and 2 in the Notes to Financial Statements.) |
| 8 | Commencement of operations was on March 15, 2021. |
28
|
AMG GW&K Municipal Bond Fund Financial Highlights For a share outstanding throughout each fiscal period |
| | | | | | | | | | | | | | | | | | | | | | | | |
| | | For the six
months ended
June 30, 2024 (unaudited) | | For the fiscal years ended December 31, |
| Class N | | 2023 | | 2022 | | 2021 | | 2020 | | 2019 |
| | | | | | |
Net Asset Value, Beginning of Period | | | $11.53 | | | | $11.11 | | | | $12.24 | | | | $12.45 | | | | $12.12 | | | | $11.48 | |
| | | | |
Income (loss) from Investment Operations: | | | | | | | | | | | | | | | | | |
| | | | | | |
Net investment income (loss)1,2 | | | 0.12 | | | | 0.21 | | | | 0.15 | | | | 0.13 | | | | 0.15 | | | | 0.19 | |
| | | | | | |
Net realized and unrealized gain (loss) on investments | | | (0.29 | ) | | | 0.42 | | | | (1.10 | ) | | | (0.11 | ) | | | 0.33 | | | | 0.64 | |
| | | | | | | | | | | | | | | | | | | | | | | | |
| | | | | | |
Total income (loss) from investment operations | | | (0.17 | ) | | | 0.63 | | | | (0.95 | ) | | | 0.02 | | | | 0.48 | | | | 0.83 | |
| | | | | | |
Less Distributions to Shareholders from: | | | | | | | | | | | | | | | | | | | | | | | | |
| | | | | | |
Net investment income | | | (0.12 | ) | | | (0.21 | ) | | | (0.16 | ) | | | (0.13 | ) | | | (0.15 | ) | | | (0.19 | ) |
| | | | | | |
Net realized gain on investments | | | — | | | | — | | | | (0.02 | ) | | | (0.10 | ) | | | — | | | | — | |
| | | | | | | | | | | | | | | | | | | | | | | | |
| | | | | | |
Total distributions to shareholders | | | (0.12 | ) | | | (0.21 | ) | | | (0.18 | ) | | | (0.23 | ) | | | (0.15 | ) | | | (0.19 | ) |
| | | | | | |
Net Asset Value, End of Period | | | $11.24 | | | | $11.53 | | | | $11.11 | | | | $12.24 | | | | $12.45 | | | | $12.12 | |
| | | | | | | | | | | | | | | | | | | | | | | | |
| | | | | | |
Total Return2,3 | | | (1.46 | )%4 | | | 5.72 | % | | | (7.80 | )% | | | 0.10 | % | | | 4.31 | % | | | 7.29 | % |
| | | | | | |
Ratio of net expenses to average net assets | | | 0.72 | %5 | | | 0.72 | % | | | 0.72 | % | | | 0.71 | % | | | 0.71 | % | | | 0.71 | % |
| | | | | | |
Ratio of gross expenses to average net assets6 | | | 0.79 | %5 | | | 0.79 | % | | | 0.78 | % | | | 0.76 | % | | | 0.77 | % | | | 0.78 | % |
| | | | | | |
Ratio of net investment income to average net assets2 | | | 2.13 | %5 | | | 1.85 | % | | | 1.35 | % | | | 1.01 | % | | | 1.25 | % | | | 1.59 | % |
| | | | | | |
Portfolio turnover | | | 15 | %4 | | | 29 | % | | | 20 | % | | | 24 | % | | | 17 | % | | | 18 | % |
| | | | | | |
Net assets end of period (000’s) omitted | | | $11,818 | | | | $12,081 | | | | $12,972 | | | | $17,112 | | | | $18,153 | | | | $18,711 | |
| | | | | | |
| | | | | | | | | | | | | | | | | | | | | | | | | |
29
| | |
| | | AMG GW&K Municipal Bond Fund Financial Highlights For a share outstanding throughout each fiscal period |
| | | |
| | | |
| | | | | | | | | | | | | | | | | | | | | | | | | | | | | | |
| | | For the six
months ended
June 30, 2024
(unaudited) | | For the fiscal years ended December 31, |
| Class I | | 2023 | | 2022 | | 2021 | | 2020 | | 2019 |
| | | | | | |
Net Asset Value, Beginning of Period | | | | $11.60 | | | | | $11.18 | | | | | $12.31 | | | | | $12.52 | | | | | $12.18 | | | | | $11.54 | |
| | | | | | |
Income (loss) from Investment Operations: | | | | | | | | | | | | | | | | | | | | | | | | | | | | | | |
| | | | | | |
Net investment income1,2 | | | | 0.14 | | | | | 0.25 | | | | | 0.19 | | | | | 0.17 | | | | | 0.19 | | | | | 0.23 | |
| | | | | | |
Net realized and unrealized gain (loss) on investments | | | | (0.29 | ) | | | | 0.41 | | | | | (1.11 | ) | | | | (0.11 | ) | | | | 0.34 | | | | | 0.64 | |
| | | | | | | | | | | | | | | | | | | | | | | | | | | | | | |
| | | | | | |
Total income (loss) from investment operations | | | | (0.15 | ) | | | | 0.66 | | | | | (0.92 | ) | | | | 0.06 | | | | | 0.53 | | | | | 0.87 | |
| | | | | | |
Less Distributions to Shareholders from: | | | | | | | | | | | | | | | | | | | | | | | | | | | | | | |
| | | | | | |
Net investment income | | | | (0.14 | ) | | | | (0.24 | ) | | | | (0.19 | ) | | | | (0.17 | ) | | | | (0.19 | ) | | | | (0.23 | ) |
| | | | | | |
Net realized gain on investments | | | | — | | | | | — | | | | | (0.02 | ) | | | | (0.10 | ) | | | | — | | | | | — | |
| | | | | | | | | | | | | | | | | | | | | | | | | | | | | | |
| | | | | | |
Total distributions to shareholders | | | | (0.14 | ) | | | | (0.24 | ) | | | | (0.21 | ) | | | | (0.27 | ) | | | | (0.19 | ) | | | | (0.23 | ) |
| | | | | | |
Net Asset Value, End of Period | | | | $11.31 | | | | | $11.60 | | | | | $11.18 | | | | | $12.31 | | | | | $12.52 | | | | | $12.18 | |
| | | | | | | | | | | | | | | | | | | | | | | | | | | | | | |
| | | | | | |
Total Return2,3 | | | | (1.30 | )%4 | | | | 6.04 | % | | | | (7.45 | )% | | | | 0.43 | % | | | | 4.70 | % | | | | 7.58 | % |
| | | | | | |
Ratio of net expenses to average net assets | | | | 0.39 | %5 | | | | 0.39 | % | | | | 0.39 | % | | | | 0.39 | % | | | | 0.39 | % | | | | 0.39 | % |
| | | | | | |
Ratio of gross expenses to average net assets6 | | | | 0.46 | %5 | | | | 0.46 | % | | | | 0.45 | % | | | | 0.44 | % | | | | 0.45 | % | | | | 0.46 | % |
| | | | | | |
Ratio of net investment income to average net assets2 | | | | 2.46 | %5 | | | | 2.18 | % | | | | 1.68 | % | | | | 1.33 | % | | | | 1.57 | % | | | | 1.91 | % |
| | | | | | |
Portfolio turnover | | | | 15 | %4 | | | | 29 | % | | | | 20 | % | | | | 24 | % | | | | 17 | % | | | | 18 | % |
| | | | | | |
Net assets end of period (000’s) omitted | | | | $998,094 | | | | | $1,016,607 | | | | | $1,068,290 | | | | | $1,331,958 | | | | | $1,287,667 | | | | | $1,014,514 | |
| | | | | | |
| | | | | | | | | | | | | | | | | | | | | | | | | | | | | | | |
| 1 | Per share numbers have been calculated using average shares. |
| 2 | Total returns and net investment income would have been lower had certain expenses not been offset. |
| 3 | The total return is calculated using the published Net Asset Value as of period end. |
| 6 | Excludes the impact of expense reimbursement or fee waivers and expense reductions such as brokerage credits, but includes expense repayments and non-reimbursable expenses, if any, such as interest, taxes, and extraordinary expenses. (See Note 1(c) and 2 in the Notes to Financial Statements.) |
30
| | |
| | | AMG GW&K Municipal Enhanced Yield Fund Financial Highlights For a share outstanding throughout each fiscal period |
| | | |
| | | |
| | | | | | | | | | | | | | | | | | | | | | | | | | | | | | |
| | | For the six
months ended
June 30, 2024
(unaudited) | | For the fiscal years ended December 31, |
| Class N | | 2023 | | 2022 | | 2021 | | 2020 | | 2019 |
| | | | | | |
Net Asset Value, Beginning of Period | | | | $9.20 | | | | | $8.56 | | | | | $10.74 | | | | | $10.69 | | | | | $10.42 | | | | | $9.69 | |
| | | | | | |
Income (loss) from Investment Operations: | | | | | | | | | | | | | | | | | | | | | | | | | | | | | | |
| | | | | | |
Net investment income1,2 | | | | 0.13 | | | | | 0.25 | | | | | 0.22 | | | | | 0.20 | | | | | 0.23 | | | | | 0.26 | |
| | | | | | |
Net realized and unrealized gain (loss) on investments | | | | (0.05 | ) | | | | 0.64 | | | | | (2.17 | ) | | | | 0.18 | | | | | 0.37 | | | | | 0.78 | |
| | | | | | | | | | | | | | | | | | | | | | | | | | | | | | |
| | | | | | |
Total income (loss) from investment operations | | | | 0.08 | | | | | 0.89 | | | | | (1.95 | ) | | | | 0.38 | | | | | 0.60 | | | | | 1.04 | |
| | | | | | |
Less Distributions to Shareholders from: | | | | | | | | | | | | | | | | | | | | | | | | | | | | | | |
| | | | | | |
Net investment income | | | | (0.13 | ) | | | | (0.25 | ) | | | | (0.20 | ) | | | | (0.19 | ) | | | | (0.21 | ) | | | | (0.25 | ) |
| | | | | | |
Net realized gain on investments | | | | — | | | | | — | | | | | (0.03 | ) | | | | (0.14 | ) | | | | (0.12 | ) | | | | (0.06 | ) |
| | | | | | | | | | | | | | | | | | | | | | | | | | | | | | |
| | | | | | |
Total distributions to shareholders | | | | (0.13 | ) | | | | (0.25 | ) | | | | (0.23 | ) | | | | (0.33 | ) | | | | (0.33 | ) | | | | (0.31 | ) |
| | | | | | |
Net Asset Value, End of Period | | | | $9.15 | | | | | $9.20 | | | | | $8.56 | | | | | $10.74 | | | | | $10.69 | | | | | $10.42 | |
| | | | | | | | | | | | | | | | | | | | | | | | | | | | | | |
| | | | | | |
Total Return2,3 | | | | 0.89 | %4 | | | | 10.53 | % | | | | (18.19 | )% | | | | 3.59 | % | | | | 5.95 | % | | | | 10.92 | % |
| | | | | | |
Ratio of net expenses to average net assets | | | | 0.99 | %5,6 | | | | 0.99 | % | | | | 0.99 | % | | | | 0.99 | % | | | | 0.99 | % | | | | 0.99 | % |
| | | | | | |
Ratio of gross expenses to average net assets7 | | | | 1.09 | %5 | | | | 1.08 | % | | | | 1.07 | % | | | | 1.05 | % | | | | 1.07 | % | | | | 1.08 | % |
| | | | | | |
Ratio of net investment income to average net assets2 | | | | 2.97 | %5 | | | | 2.87 | % | | | | 2.39 | % | | | | 1.85 | % | | | | 2.17 | % | | | | 2.56 | % |
| | | | | | |
Portfolio turnover | | | | 14 | %4 | | | | 24 | % | | | | 45 | % | | | | 61 | % | | | | 81 | % | | | | 40 | % |
| | | | | | |
Net assets end of period (000’s) omitted | | | | $3,042 | | | | | $5,964 | | | | | $2,955 | | | | | $14,923 | | | | | $5,015 | | | | | $5,722 | |
| | | | | | |
| | | | | | | | | | | | | | | | | | | | | | | | | | | | | | | |
31
| | |
| | | AMG GW&K Municipal Enhanced Yield Fund Financial Highlights For a share outstanding throughout each fiscal period |
| | | |
| | | |
| | | | | | | | | | | | | | | | | | | | | | | | | | | | | | |
| | | For the six
months ended
June 30, 2024
(unaudited) | | For the fiscal years ended December 31, |
| Class I | | 2023 | | 2022 | | 2021 | | 2020 | | 2019 |
| | | | | | |
Net Asset Value, Beginning of Period | | | | $8.91 | | | | | $8.30 | | | | | $10.43 | | | | | $10.40 | | | | | $10.15 | | | | | $9.45 | |
| | | | | | |
Income (loss) from Investment Operations: | | | | | | | | | | | | | | | | | | | | | | | | | | | | | | |
| | | | | | |
Net investment income1,2 | | | | 0.15 | | | | | 0.27 | | | | | 0.24 | | | | | 0.23 | | | | | 0.25 | | | | | 0.29 | |
| | | | | | |
Net realized and unrealized gain (loss) on investments | | | | (0.06 | ) | | | | 0.62 | | | | | (2.09 | ) | | | | 0.17 | | | | | 0.37 | | | | | 0.76 | |
| | | | | | | | | | | | | | | | | | | | | | | | | | | | | | |
| | | | | | |
Total income (loss) from investment operations | | | | 0.09 | | | | | 0.89 | | | | | (1.85 | ) | | | | 0.40 | | | | | 0.62 | | | | | 1.05 | |
| | | | | | |
Less Distributions to Shareholders from: | | | | | | | | | | | | | | | | | | | | | | | | | | | | | | |
| | | | | | |
Net investment income | | | | (0.15 | ) | | | | (0.28 | ) | | | | (0.25 | ) | | | | (0.23 | ) | | | | (0.25 | ) | | | | (0.29 | ) |
| | | | | | |
Net realized gain on investments | | | | — | | | | | — | | | | | (0.03 | ) | | | | (0.14 | ) | | | | (0.12 | ) | | | | (0.06 | ) |
| | | | | | | | | | | | | | | | | | | | | | | | | | | | | | |
| | | | | | |
Total distributions to shareholders | | | | (0.15 | ) | | | | (0.28 | ) | | | | (0.28 | ) | | | | (0.37 | ) | | | | (0.37 | ) | | | | (0.35 | ) |
| | | | | | |
Net Asset Value, End of Period | | | | $8.85 | | | | | $8.91 | | | | | $8.30 | | | | | $10.43 | | | | | $10.40 | | | | | $10.15 | |
| | | | | | | | | | | | | | | | | | | | | | | | | | | | | | |
| | | | | | |
Total Return2,3 | | | | 1.00 | %4 | | | | 10.89 | % | | | | (17.86 | )% | | | | 3.94 | % | | | | 6.31 | % | | | | 11.28 | % |
| | | | | | |
Ratio of net expenses to average net assets | | | | 0.64 | %5,6 | | | | 0.64 | % | | | | 0.64 | % | | | | 0.64 | % | | | | 0.64 | % | | | | 0.64 | % |
| | | | | | |
Ratio of gross expenses to average net assets7 | | | | 0.74 | %5 | | | | 0.73 | % | | | | 0.72 | % | | | | 0.70 | % | | | | 0.72 | % | | | | 0.73 | % |
| | | | | | |
Ratio of net investment income to average net assets2 | | | | 3.32 | %5 | | | | 3.22 | % | | | | 2.74 | % | | | | 2.20 | % | | | | 2.52 | % | | | | 2.91 | % |
| | | | | | |
Portfolio turnover | | | | 14 | %4 | | | | 24 | % | | | | 45 | % | | | | 61 | % | | | | 81 | % | | | | 40 | % |
| | | | | | |
Net assets end of period (000’s) omitted | | | | $200,639 | | | | | $205,322 | | | | | $255,928 | | | | | $369,473 | | | | | $323,439 | | | | | $273,228 | |
| | | | | | |
| | | | | | | | | | | | | | | | | | | | | | | | | | | | | | |
32
| | |
| | | AMG GW&K Municipal Enhanced Yield Fund Financial Highlights For a share outstanding throughout each fiscal period |
| | | |
| | | |
| | | | | | | | | | | | | | | | | | | | | | | | | | | | | | |
| | | For the six
months ended
June 30, 2024
(unaudited) | | For the fiscal years ended December 31, |
| Class Z | | 2023 | | 2022 | | 2021 | | 2020 | | 2019 |
| | | | | | |
Net Asset Value, Beginning of Period | | | | $8.91 | | | | | $8.30 | | | | | $10.43 | | | | | $10.40 | | | | | $10.15 | | | | | $9.44 | |
| | | | | | |
Income (loss) from Investment Operations: | | | | | | | | | | | | | | | | | | | | | | | | | | | | | | |
| | | | | | |
Net investment income1,2 | | | | 0.15 | | | | | 0.28 | | | | | 0.25 | | | | | 0.24 | | | | | 0.26 | | | | | 0.30 | |
| | | | | | |
Net realized and unrealized gain (loss) on investments | | | | (0.06 | ) | | | | 0.61 | | | | | (2.10 | ) | | | | 0.17 | | | | | 0.37 | | | | | 0.76 | |
| | | | | | | | | | | | | | | | | | | | | | | | | | | | | | |
| | | | | | |
Total income (loss) from investment operations | | | | 0.09 | | | | | 0.89 | | | | | (1.85 | ) | | | | 0.41 | | | | | 0.63 | | | | | 1.06 | |
| | | | | | |
Less Distributions to Shareholders from: | | | | | | | | | | | | | | | | | | | | | | | | | | | | | | |
| | | | | | |
Net investment income | | | | (0.15 | ) | | | | (0.28 | ) | | | | (0.25 | ) | | | | (0.24 | ) | | | | (0.26 | ) | | | | (0.29 | ) |
| | | | | | |
Net realized gain on investments | | | | — | | | | | — | | | | | (0.03 | ) | | | | (0.14 | ) | | | | (0.12 | ) | | | | (0.06 | ) |
| | | | | | | | | | | | | | | | | | | | | | | | | | | | | | |
| | | | | | |
Total distributions to shareholders | | | | (0.15 | ) | | | | (0.28 | ) | | | | (0.28 | ) | | | | (0.38 | ) | | | | (0.38 | ) | | | | (0.35 | ) |
| | | | | | |
Net Asset Value, End of Period | | | | $8.85 | | | | | $8.91 | | | | | $8.30 | | | | | $10.43 | | | | | $10.40 | | | | | $10.15 | |
| | | | | | | | | | | | | | | | | | | | | | | | | | | | | | |
| | | | | | |
Total Return2,3 | | | | 1.03 | %4 | | | | 10.95 | % | | | | (17.82 | )% | | | | 3.99 | % | | | | 6.37 | % | | | | 11.45 | % |
| | | | | | |
Ratio of net expenses to average net assets | | | | 0.59 | %5,6 | | | | 0.59 | % | | | | 0.59 | % | | | | 0.59 | % | | | | 0.59 | % | | | | 0.59 | % |
| | | | | | |
Ratio of gross expenses to average net assets7 | | | | 0.69 | %5 | | | | 0.68 | % | | | | 0.67 | % | | | | 0.65 | % | | | | 0.67 | % | | | | 0.68 | % |
| | | | | | |
Ratio of net investment income to average net assets2 | | | | 3.37 | %5 | | | | 3.27 | % | | | | 2.79 | % | | | | 2.25 | % | | | | 2.57 | % | | | | 2.96 | % |
| | | | | | |
Portfolio turnover | | | | 14 | %4 | | | | 24 | % | | | | 45 | % | | | | 61 | % | | | | 81 | % | | | | 40 | % |
| | | | | | |
Net assets end of period (000’s) omitted | | | | $124 | | | | | $123 | | | | | $111 | | | | | $135 | | | | | $130 | | | | | $120 | |
| | | | | | |
| | | | | | | | | | | | | | | | | | | | | | | | | | | | | | | |
| 1 | Per share numbers have been calculated using average shares. |
| 2 | Total returns and net investment income would have been lower had certain expenses not been offset. |
| 3 | The total return is calculated using the published Net Asset Value as of period end. |
| 6 | Includes interest expense of less than 0.01% related to participation in the interfund lending program. |
| 7 | Excludes the impact of expense reimbursement or fee waivers and expense reductions such as brokerage credits, but includes expense repayments and non-reimbursable expenses, if any, such as interest, taxes, and extraordinary expenses. (See Note 1(c) and 2 in the Notes to Financial Statements.) |
33
| | |
| | | Notes to Financial Statements (unaudited) June 30, 2024 |
| | | |
| | | |
1. ORGANIZATION AND SUMMARY OF SIGNIFICANT ACCOUNTING POLICIES
AMG Funds, AMG Funds II (“Trust II”) and AMG Funds III (“Trust III”) (the “Trusts”) are open-end management investment companies, organized as Massachusetts business trusts, and registered under the Investment Company Act of 1940, as amended (the “1940 Act”). Currently, the Trusts consist of a number of different funds, each having distinct investment management objectives, strategies, risks, and policies. Included in this report are AMG Funds: AMG GW&K Municipal Bond Fund (“Municipal Bond”), AMG GW&K Municipal Enhanced Yield Fund (“Municipal Enhanced”), Trust II: AMG GW&K Enhanced Core Bond ESG Fund (“Enhanced Core Bond ESG”) and Trust III: AMG GW&K ESG Bond Fund (“ESG Bond”) and AMG GW&K High Income Fund (“High Income”), each a “Fund” and collectively, the “Funds”.
Each Fund offers different classes of shares. All Funds offer Class N shares and Class I shares; and Enhanced Core Bond ESG and Municipal Enhanced offer Class Z shares. Each class represents an interest in the same assets of the respective Fund. Although all share classes generally have identical voting rights, each share class votes separately when required by law. Different share classes may have different net asset values per share to the extent the share classes pay different distribution amounts and/or the expenses of such share classes differ. Each share class has its own expense structure. Please refer to a current prospectus for additional information on each share class.
On June 12, 2024, the Boards of Trustees of AMG Funds II and AMG Funds III approved a plan to liquidate and terminate Enhanced Core Bond ESG and High Income (the “Liquidation”) on or around September 11, 2024 (the “Liquidation Date”). In conjunction with the Liquidation, Enhanced Core Bond ESG and High Income sold their portfolio investments and invested the proceeds in cash and cash equivalents. Effective June 14, 2024, Enhanced Core Bond ESG and High Income discontinued accruing 12b-1 Distribution fees through the Liquidation Date, and effective June 17, 2024, and through the Liquidation Date, the Investment Manager waived its management fee and will waive the right to recoup any prior reimbursed expenses under Enhanced Core Bond ESG’s and High Income’s Expense Limitation Agreements. Since immediately following the close of business on June 13, 2024, Enhanced Core Bond ESG and High Income no longer accept investments, except for investments made through existing asset allocation programs investing in Enhanced Core Bond ESG and High Income, and shares purchased pursuant to automatic investment programs, such as automatic investments through 401(k) plans and reinvestments of any dividends and distributions.
The Funds’ financial statements are prepared in accordance with accounting principles generally accepted in the United States of America (“U.S. GAAP”), including accounting and reporting guidance pursuant to Accounting Standards Codification Topic 946 applicable to investment companies. U.S. GAAP requires management to make estimates and assumptions that affect the reported amounts of assets and liabilities and disclosure of contingent assets and liabilities at the date of the financial statements and the reported amounts of income and expenses during the reporting period. Actual results could differ from those estimates and such differences could be material. The following is a summary of significant accounting policies followed by the Funds in the preparation of their financial statements:
a. VALUATION OF INVESTMENTS
Fixed income securities purchased with a remaining maturity exceeding 60 days are valued at the evaluated bid price provided by an authorized pricing service or,
if an evaluated price is not available, by reference to other securities which are considered comparable in credit rating, interest rate, due date and other features (generally referred to as “matrix pricing”) or other similar pricing methodologies. Investments in certain mortgage-backed and stripped mortgage-backed securities, convertible securities, derivatives and other debt securities not traded on an organized securities market are valued on the basis of valuations provided by dealers or by a pricing service which uses information with respect to transactions in such securities and various relationships between such securities and yield to maturity in determining value.
Fixed income securities purchased with a remaining maturity of 60 days or less are valued at amortized cost, provided that the amortized cost value is approximately the same as the fair value of the security valued without the use of amortized cost. Investments in other open-end registered investment companies are valued at their end of day net asset value per share.
The Funds’ portfolio investments are generally valued based on independent market quotations or prices or, if none, “evaluative” or other market based valuations provided by third party pricing services. Pursuant to Rule 2a-5 under the 1940 Act, the Funds’ Boards of Trustees (the “Board”) designated AMG Funds LLC (the “Investment Manager”) as the Funds’ Valuation Designee to perform the Funds’ fair value determinations. Such determinations are subject to Board oversight and certain reporting and other requirements intended to ensure that the Board receives the information it needs to oversee the Investment Manager’s fair value determinations.
Under certain circumstances, the value of certain Fund portfolio investments may be based on an evaluation of fair value, pursuant to procedures established by the Investment Manager and under the general supervision of the Board. The Funds may use the fair value of a portfolio investment to calculate its net asset value (“NAV”) in the event that the market quotation, price or market based valuation for the portfolio investment is not readily available or otherwise not determinable pursuant to the Funds’ valuation procedures, if the Investment Manager believes the quotation, price or market based valuation to be unreliable, or in certain other circumstances. When determining the fair value of an investment, the Investment Manager seeks to determine the price that the Funds might reasonably expect to receive from current sale of that portfolio investment in an arms-length transaction. Fair value determinations shall be based upon consideration of all available facts and information, including, but not limited to (i) attributes specific to the investment; (ii) fundamental and analytical data relating to the investment; and (iii) the value of other comparable securities or relevant financial instruments, including derivative securities, traded on other markets or among dealers.
The values assigned to fair value portfolio investments are based on available information and do not necessarily represent amounts that might ultimately be realized in the future, since such amounts depend on future developments inherent in long-term investments. Because of the inherent uncertainty of valuation, those estimated values may differ significantly from the values that would have been used had a ready market for the investments existed, and the differences could be material. The Board will be presented with quarterly reports, as of the most recent quarter end, summarizing all fair value activity, material fair value matters that occurred during the quarter, and all outstanding securities fair valued by the Funds. Additionally, the Board will be presented with an annual report that assesses the adequacy and effectiveness of the Investment Manager’s process for determining the fair value of the Funds’ investments.
U.S. GAAP defines fair value as the price that a fund would receive to sell an asset or pay to transfer a liability in an orderly transaction between market participants
34
| | |
| | | Notes to Financial Statements (continued) |
| | | |
| | | |
at the measurement date. U.S. GAAP also establishes a framework for measuring fair value, and a three level hierarchy for fair value measurements based upon the transparency of inputs to the valuation of an asset or liability. Inputs may be observable or unobservable and refer broadly to the assumptions that market participants would use in pricing the asset or liability. Observable inputs reflect the assumptions market participants would use in pricing the asset or liability based on market data obtained from sources independent of the Funds. Unobservable inputs reflect the Funds’ own assumptions about the assumptions that market participants would use in pricing the asset or liability developed based on the best information available in the circumstances. Each investment is assigned a level based upon the observability of the inputs which are significant to the overall valuation.
The three-tier hierarchy of inputs is summarized below:
Level 1 – inputs are quoted prices in active markets for identical investments (e.g., equity securities, open-end investment companies)
Level 2 – other observable inputs (including, but not limited to: quoted prices for similar assets or liabilities in markets that are active, quoted prices for identical or similar assets or liabilities in markets that are not active, inputs other than quoted prices that are observable for the assets or liabilities (such as interest rates, yield curves, volatilities, prepayment speeds, loss severities, credit risks and default rates) or other market corroborated inputs) (e.g., debt securities, government securities, foreign currency exchange contracts, foreign securities utilizing international fair value pricing, fair valued securities with observable inputs)
Level 3 – inputs are significant unobservable inputs (including the Fund’s own assumptions used to determine the fair value of investments) (e.g., fair valued securities with unobservable inputs)
Changes in inputs or methodologies used for valuing investments may result in a transfer in or out of levels within the fair value hierarchy. The inputs or methodologies used for valuing investments may not necessarily be an indication of the risk associated with investing in those investments.
b. SECURITY TRANSACTIONS
Security transactions are accounted for as of trade date. Realized gains and losses on securities sold are determined on the basis of identified cost.
c. INVESTMENT INCOME AND EXPENSES
Interest income, which includes amortization of premium and accretion of discount on debt securities, is accrued as earned. Interest income on foreign securities is recorded gross of any withholding tax. Other income and expenses are recorded on an accrual basis. Expenses that cannot be directly attributed to a Fund are apportioned among the funds in the Trusts and other trusts or funds within the AMG Funds Family of Funds (collectively, the “AMG Funds Family”) based upon their relative average net assets or number of shareholders. Investment income, realized and unrealized capital gains and losses, the common expenses of each Fund, and certain fund level expense reductions, if any, are allocated on a pro-rata basis to each class based on the relative net assets of each class to the total net assets of each Fund.
d. DIVIDENDS AND DISTRIBUTIONS
Fund distributions resulting from net investment income, if any, will normally be declared and paid monthly by the Funds. Fund distributions resulting from realized
net capital gains, if any, will normally be declared and paid at least annually in December. Distributions to shareholders are recorded on the ex-dividend date. Distributions are determined in accordance with federal income tax regulations, which may differ from net investment income and net realized capital gains for financial statement purposes (U.S. GAAP). Differences may be permanent or temporary. Permanent differences are reclassified among capital accounts in the financial statements to reflect their tax character. Permanent book and tax basis differences, if any, relating to shareholder distributions will result in reclassifications to paid-in capital. Temporary differences arise when certain items of income, expense and gain or loss are recognized in different periods for financial statement and tax purposes; these differences will reverse at some time in the future. Permanent differences are primarily due to redemptions in kind for Enhanced Core Bond ESG, High Income and Municipal Enhanced. There were no permanent differences for ESG Bond or Municipal Bond. Temporary differences are primarily due to wash sale loss deferrals for ESG Bond and Municipal Enhanced and premium amortization on callable bonds for ESG Bond. Enhanced Core Bond ESG, High Income and Municipal Bond had no temporary differences.
At June 30, 2024, the aggregate cost for federal income tax purposes approximates the aggregate cost for book purposes. The approximate cost of investments and the aggregate gross unrealized appreciation and depreciation for federal income tax purposes were as follows:
| | | | | | | | | | | | | | | | |
| | | | |
| Fund | | Cost | | | Appreciation | | | Depreciation | | | Net Depreciation | |
| | | | |
ESG Bond | | | $457,741,737 | | | | $2,406,987 | | | | $(47,158,061) | | | | $(44,751,074) | |
| | | | |
Enhanced Core Bond ESG | | | 27,524,882 | | | | — | | | | — | | | | — | |
| | | | |
High Income | | | 6,746,570 | | | | — | | | | — | | | | — | |
| | | | |
Municipal Bond | | | 1,063,712,789 | | | | 5,108,959 | | | | (34,438,858) | | | | (29,329,899) | |
| | | | |
Municipal Enhanced | | | 212,293,431 | | | | 2,696,769 | | | | (13,503,735) | | | | (10,806,966) | |
e. FEDERAL TAXES
Each Fund currently qualifies as an investment company and intends to comply with the requirements under Subchapter M of the Internal Revenue Code of 1986, as amended, and to distribute substantially all of its taxable income and gains to its shareholders and to meet certain diversification and income requirements with respect to investment companies. The Investment Manager has analyzed the Funds’ tax positions taken on federal income tax returns for all open tax years (generally, the three prior taxable years), and has concluded that no provision for federal income tax is required in the Funds’ financial statements. Additionally, the Investment Manager is not aware of any tax position for which it is reasonably possible that the total amounts of unrecognized tax benefit/detriment will change materially in the next twelve months.
Furthermore, based on each Fund’s understanding of the tax rules and rates related to income, gains and transactions for the foreign jurisdictions in which it invests, each Fund will provide for foreign taxes, and where appropriate, deferred foreign taxes.
35
| | |
| | | Notes to Financial Statements (continued) |
| | | |
| | | |
f. CAPITAL LOSS CARRYOVERS AND DEFERRALS
As of December 31, 2023, the Funds had capital loss carryovers for federal income tax purposes as shown in the following chart. These amounts may be used to offset future realized capital gains indefinitely, and retain their character as short-term and/or long-term.
| | | | | | | | | | | | |
| | | |
| Fund | | Short-Term | | | Long-Term | | | Total | |
| | | |
ESG Bond | | | $9,213,293 | | | | $30,595,067 | | | | $39,808,360 | |
| | | | | | | | | | | | |
| | | |
| Fund | | Short-Term | | | Long-Term | | | Total | |
| | | |
Enhanced Core Bond ESG | | | $2,675,067 | | | | $3,874,633 | | | | $6,549,700 | |
| | | |
High Income | | | 398,620 | | | | 1,036,677 | | | | 1,435,297 | |
| | | |
Municipal Bond | | | 1,211,437 | | | | 25,741,340 | | | | 26,952,777 | |
| | | |
Municipal Enhanced | | | 4,404,660 | | | | 11,810,700 | | | | 16,215,360 | |
g. CAPITAL STOCK
Each of AMG Funds’ Amended and Restated Agreement and Declaration of Trust, AMG Funds II’s Amended and Restated Declaration of Trust, and AMG Funds III’s Declaration of Trust authorizes for each applicable Fund the issuance of an unlimited number of shares of beneficial interest, without par value. Each Fund records sales and repurchases of its capital stock on the trade date. For the fiscal year ended December 31, 2023, Municipal Enhanced delivered securities, and cash in connection with redemptions in-kind transactions in the amount of $46,736,183 for subscriptions in-kind to AMG GW&K Municipal Enhanced SMA Shares, an affiliated fund, and a related party. For the purposes of U.S. GAAP, the transactions were treated as sales of securities and the resulting gain or loss was recognized based on the market value of the securities on the date of the transfer. For tax purposes, no gains or losses were recognized.
For the six months ended June 30, 2024 (unaudited) and the fiscal year ended December 31, 2023, the capital stock transactions by class for the Funds were as follows:
| | | | | | | | | | | | | | | | | | | | | | | | | | | | | | | | |
| | | ESG Bond | | Enhanced Core Bond ESG |
| | | | |
| | | June 30, 2024 | | December 31, 2023 | | June 30, 2024 | | December 31, 2023 |
| | | | | | | | |
| | | Shares | | Amount | | Shares | | Amount | | Shares | | Amount | | Shares | | Amount |
| | | | | | | | |
Class N: | | | | | | | | | | | | | | | | | | | | | | | | | | | | | | | | |
| | | | | | | | |
Shares sold | | | 233,326 | | | | $5,004,534 | | | | 502,045 | | | | $10,618,434 | | | | 51,840 | | | | $465,722 | | | | 384,052 | | | | $3,446,741 | |
| | | | | | | | |
Shares issued in reinvestment of distributions | | | 200,184 | | | | 4,270,980 | | | | 395,272 | | | | 8,384,556 | | | | 25,076 | | | | 223,137 | | | | 32,277 | | | | 287,738 | |
| | | | | | | | |
Shares redeemed | | | (1,472,770 | ) | | | (31,593,566 | ) | | | (2,817,229 | ) | | | (59,923,434 | ) | | | (475,535 | ) | | | (4,260,195 | ) | | | (370,741 | ) | | | (3,342,409 | ) |
| | | | | | | | | | | | | | | | | | | | | | | | | | | | | | | | |
| | | | | | | | |
Net increase (decrease) | | | (1,039,260 | ) | | | $(22,318,052 | ) | | | (1,919,912 | ) | | | $(40,920,444 | ) | | | (398,619 | ) | | | $(3,571,336 | ) | | | 45,588 | | | | $392,070 | |
| | | | | | | | | | | | | | | | | | | | | | | | | | | | | | | | |
| | | | | | | | |
Class I: | | | | | | | | | | | | | | | | | | | | | | | | | | | | | | | | |
| | | | | | | | |
Shares sold | | | 644,818 | | | | $13,853,438 | | | | 1,156,432 | | | | $24,647,398 | | | | 258,879 | | | | $2,342,986 | | | | 1,011,926 | | | | $9,000,136 | |
| | | | | | | | |
Shares issued in reinvestment of distributions | | | 129,567 | | | | 2,764,575 | | | | 259,536 | | | | 5,507,823 | | | | 65,832 | | | | 588,259 | | | | 74,147 | | | | 663,551 | |
| | | | | | | | |
Shares redeemed | | | (1,070,182 | ) | | | (22,954,469 | ) | | | (2,914,785 | ) | | | (61,872,107 | ) | | | (1,072,672 | ) | | | (9,636,926 | ) | | | (933,098 | ) | | | (8,401,244 | ) |
| | | | | | | | | | | | | | | | | | | | | | | | | | | | | | | | |
| | | | | | | | |
Net increase (decrease) | | | (295,797 | ) | | | $(6,336,456 | ) | | | (1,498,817 | ) | | | $(31,716,886 | ) | | | (747,961 | ) | | | $(6,705,681 | ) | | | 152,975 | | | | $1,262,443 | |
| | | | | | | | | | | | | | | | | | | | | | | | | | | | | | | | |
| | | | | | | | |
Class Z: | | | | | | | | | | | | | | | | | | | | | | | | | | | | | | | | |
| | | | | | | | |
Shares sold | | | — | | | | — | | | | — | | | | — | | | | 61,586 | | | | $553,423 | | | | 143,285 | | | | $1,297,193 | |
| | | | | | | | |
Shares issued in reinvestment of distributions | | | — | | | | — | | | | — | | | | — | | | | 23,188 | | | | 207,028 | | | | 30,302 | | | | 271,456 | |
| | | | | | | | |
Shares redeemed | | | — | | | | — | | | | — | | | | — | | | | (315,335 | ) | | | (2,835,060 | ) | | | (444,712 | ) | | | (3,991,589 | ) |
| | | | | | | | | | | | | | | | | | | | | | | | | | | | | | | | |
| | | | | | | | |
Net decrease | | | — | | | | — | | | | — | | | | — | | | | (230,561 | ) | | | $(2,074,609 | ) | | | (271,125 | ) | | | $(2,422,940 | ) |
| | | | | | | | | | | | | | | | | | | | | | | | | | | | | | | | |
| | |
| | | High Income | | Municipal Bond |
| | | | |
| | | June 30, 2024 | | December 31, 2023 | | June 30, 2024 | | December 31, 2023 |
| | | | | | | | |
| | | Shares | | Amount | | Shares | | Amount | | Shares | | Amount | | Shares | | Amount |
| | | | | | | | |
Class N: | | | | | | | | | | | | | | | | | | | | | | | | | | | | | | | | |
| | | | | | | | |
Shares sold | | | 17,155 | | | | $357,564 | | | | 80,767 | | | | $1,656,985 | | | | 351,551 | | | | $3,984,094 | | | | 418,863 | | | | $4,709,065 | |
| | | | | | | | |
Shares issued in reinvestment of distributions | | | 11,802 | | | | 244,102 | | | | 15,456 | | | | 314,368 | | | | 9,290 | | | | 104,922 | | | | 18,635 | | | | 207,971 | |
| | | | | | | | |
Shares redeemed | | | (82,697 | ) | | | (1,710,885 | ) | | | (83,177 | ) | | | (1,699,230 | ) | | | (357,567 | ) | | | (4,054,495 | ) | | | (556,927 | ) | | | (6,183,058 | ) |
| | | | | | | | | | | | | | | | | | | | | | | | | | | | | | | | |
| | | | | | | | |
Net increase (decrease) | | | (53,740 | ) | | | $(1,109,219 | ) | | | 13,046 | | | | $272,123 | | | | 3,274 | | | | $34,521 | | | | (119,429 | ) | | | $(1,266,022 | ) |
| | | | | | | | | | | | | | | | | | | | | | | | | | | | | | | | |
36
| | |
| | | Notes to Financial Statements (continued) |
| | | |
| | | |
| | | | | | | | | | | | | | | | | | | | | | | | | | | | | | | | |
| | | High Income | | Municipal Bond |
| | | | |
| | | June 30, 2024 | | December 31, 2023 | | June 30, 2024 | | December 31, 2023 |
| | | | | | | | |
| | | Shares | | Amount | | Shares | | Amount | | Shares | | Amount | | Shares | | Amount |
| | | | | | | | |
Class I: | | | | | | | | | | | | | | | | | | | | | | | | | | | | | | | | |
| | | | | | | | |
Shares sold | | | 37,655 | | | | $784,917 | | | | 58,087 | | | | $1,187,228 | | | | 13,066,061 | | | | $149,467,439 | | | | 37,373,757 | | | | $421,157,504 | |
| | | | | | | | |
Shares issued in reinvestment of distributions | | | 5,683 | | | | 118,105 | | | | 21,980 | | | | 446,846 | | | | 826,135 | | | | 9,381,871 | | | | 1,488,315 | | | | 16,699,309 | |
| | | | | | | | |
Shares redeemed | | | (335,188 | ) | | | (6,925,333 | ) | | | (281,706 | ) | | | (5,745,881 | ) | | | (13,292,312 | ) | | | (151,613,712 | ) | | | (46,781,942 | ) | | | (526,167,158 | ) |
| | | | | | | | | | | | | | | | | | | | | | | | | | | | | | | | |
| | | | | | | | |
Net increase (decrease) | | | (291,850 | ) | | | $(6,022,311 | ) | | | (201,639 | ) | | | $(4,111,807 | ) | | | 599,884 | | | | $7,235,598 | | | | (7,919,870 | ) | | | $(88,310,345) | |
| | | | | | | | | | | | | | | | | | | | | | | | | | | | | | | | |
| | | | | |
| | | Municipal Enhanced | | | | | | | | |
| | | | | | |
| | | June 30, 2024 | | December 31, 2023 | | | | | | | | |
| | | | | | | | |
| | | Shares | | Amount | | Shares | | Amount | | | | | | | | |
| | | | | | | | |
Class N: | | | | | | | | | | | | | | | | | | | | | | | | | | | | | | | | |
| | | | | | | | |
Shares sold | | | 779,629 | | | | $7,072,813 | | | | 1,862,046 | | | | $16,341,115 | | | | | | | | | | | | | | | | | |
| | | | | | | | |
Shares issued in reinvestment of distributions | | | 2,834 | | | | 25,706 | | | | 8,269 | | | | 72,921 | | | | | | | | | | | | | | | | | |
| | | | | | | | |
Shares redeemed | | | (1,098,349 | ) | | | (10,025,108 | ) | | | (1,567,017 | ) | | | (13,721,798 | ) | | | | | | | | | | | | | | | | |
| | | | | | | | | | | | | | | | | | | | | | | | | | | | | | | | |
| | | | | | | | |
Net increase (decrease) | | | (315,886 | ) | | | $(2,926,589 | ) | | | 303,298 | | | | $2,692,238 | | | | | | | | | | | | | | | | | |
| | | | | | | | | | | | | | | | | | | | | | | | | | | | | | | | |
| | | | | | | | |
Class I: | | | | | | | | | | | | | | | | | | | | | | | | | | | | | | | | |
| | | | | | | | |
Shares sold | | | 3,499,842 | | | | $30,963,142 | | | | 14,554,470 | | | | $124,614,205 | | | | | | | | | | | | | | | | | |
| | | | | | | | |
Shares issued in reinvestment of distributions | | | 139,893 | | | | 1,228,430 | | | | 330,028 | | | | 2,811,647 | | | | | | | | | | | | | | | | | |
| | | | | | | | |
Shares redeemed | | | (4,023,359 | ) | | | (35,535,943 | ) | | | (22,667,440 | ) | | | (192,162,997 | )1 | | | | | | | | | | | | | | | | |
| | | | | | | | | | | | | | | | | | | | | | | | | | | | | | | | |
| | | | | | | | |
Net decrease | | | (383,624 | ) | | | $(3,344,371 | ) | | | (7,782,942 | ) | | | $(64,737,145 | ) | | | | | | | | | | | | | | | | |
| | | | | | | | | | | | | | | | | | | | | | | | | | | | | | | | |
| | | | | | | | |
Class Z: | | | | | | | | | | | | | | | | | | | | | | | | | | | | | | | | |
| | | | | | | | |
Shares issued in reinvestment of distributions | | | 236 | | | | $2,080 | | | | 448 | | | | $3,806 | | | | | | | | | | | | | | | | | |
| | | | | | | | | | | | | | | | | | | | | | | | | | | | | | | | |
| | | | | | | | |
Net increase | | | 236 | | | | $2,080 | | | | 448 | | | | $3,806 | | | | | | | | | | | | | | | | | |
| | | | | | | | | | | | | | | | | | | | | | | | | | | | | | | | |
| 1 | Includes redemption in-kind in the amount of $46,736,183. |
h. REPURCHASE AGREEMENTS AND JOINT REPURCHASE AGREEMENTS
The Funds may enter into third-party and bilateral repurchase agreements for temporary cash management purposes and for reinvestment of cash collateral on securities lending transactions under the securities lending program offered by The Bank of New York Mellon (“BNYM”) (the “Securities Lending Program”) (collectively, “Repurchase Agreements”). The value of the underlying collateral, including accrued interest, must equal or exceed the value of the Repurchase Agreements during the term of the agreement. For joint repurchase agreements, the Funds participate on a pro rata basis with other clients of BNYM in their share of the underlying collateral under such joint repurchase agreements and in their share of proceeds from any repurchase or other disposition of the underlying collateral. The underlying collateral for all Repurchase Agreements is held by the Funds’ custodian or at the Federal Reserve Bank. If the seller defaults and the value of the collateral declines, or if bankruptcy proceedings commence with respect to the seller of the security, realization of the collateral by the Funds may be delayed or limited. Pursuant to the Securities Lending Program, the Funds are indemnified for such losses by BNYM on joint repurchase agreements.
At June 30, 2024, the market value of Repurchase Agreements outstanding for ESG Bond, Municipal Bond and Municipal Enhanced was $20,293,095, $6,462,000 and $271,000, respectively.
i. DELAYED DELIVERY TRANSACTIONS AND WHEN-ISSUED SECURITIES
The Funds may enter into securities transactions on a delayed delivery or when issued basis. Payment and delivery may take place after the customary settlement period for that security. The price of the underlying securities and the date when the securities will be delivered and paid for are fixed at the time the transaction is negotiated. During the time a delayed delivery sell is outstanding, the contract is marked to market daily and equivalent deliverable securities are held for the transaction. The value of the securities purchased on a delayed delivery or when-issued basis are identified as such in each Fund’s Schedule of Portfolio Investments. With respect to purchase commitments, the Funds identify securities as segregated in their records with a value at least equal to the amount of the commitment. Delayed delivery or when-issued securities that have been purchased from and sold to different brokers are reflected as an investment in
37
| | |
| | | Notes to Financial Statements (continued) |
| | | |
| | | |
securities and a forward sale commitment in the Fund’s Statement of Assets and Liabilities. For financial reporting purposes, the Fund does offset the receivable and payable for delayed delivery investments purchased and sold. Losses may arise due to changes in the value of the underlying securities or if the counterparty does not perform under the contract, or if the issuer does not issue the securities due to political, economic, or other factors.
During the six months ended June 30, 2024, Municipal Enhanced entered into securities transactions on a delayed delivery or when issued basis. At June 30, 2024, there were no delayed delivery or when issued securities.
2. AGREEMENTS AND TRANSACTIONS WITH AFFILIATES
For each of the Funds, the Trusts have entered into investment advisory agreements under which the Investment Manager, a subsidiary and the U.S. wealth platform of Affiliated Managers Group, Inc. (“AMG”), serves as investment manager to the Funds and is responsible for the Funds’ overall administration and operations. The Investment Manager selects and recommends, subject to the approval of the Boards and, in certain circumstances, shareholders, the subadviser(s) for the Funds and monitors the subadviser’s investment performance, security holdings and investment strategies. Each Fund’s investment portfolio is managed by GW&K Investment Management, LLC (“GW&K”), who serves as subadviser pursuant to a subadvisory agreement with the Investment Manager. AMG indirectly owns a majority interest in GW&K.
Investment management fees are paid directly by the Funds to the Investment Manager based on average daily net assets. For the six months ended June 30, 2024, the Funds’ investment management fees were paid at the following annual rates of each Fund’s respective average daily net assets:
| | |
| |
ESG Bond | | 0.23% |
| |
Enhanced Core Bond ESG | | 0.30% |
| |
High Income | | 0.39% |
| |
Municipal Bond | | 0.21%1 |
| |
on first $25 million | | 0.35% |
| |
on next $25 million | | 0.30% |
| |
on next $50 million | | 0.25% |
| |
on balance over $100 million | | 0.20% |
| |
Municipal Enhanced | | 0.45% |
| 1 | The rate shown is the effective rate as of June 30, 2024. |
The fee paid to GW&K for its services as subadviser is paid out of the fee the Investment Manager receives from each Fund and does not increase the expenses of each Fund.
The Investment Manager has contractually agreed, through at least May 1, 2025, to waive management fees and/or pay or reimburse fund expenses in order to limit total annual Fund operating expenses after fee waiver and expense reimbursements (exclusive of taxes, interest (including interest incurred in connection with bank and custody overdrafts, and in connection with securities sold short), shareholder servicing fees, distribution and service (12b-1) fees, brokerage commissions and other transaction costs, dividends payable with respect to securities sold short, acquired fund fees and expenses and extraordinary expenses) of ESG Bond, Enhanced Core Bond ESG, High Income,
Municipal Bond, and Municipal Enhanced to the annual rate of 0.43%, 0.48%, 0.59%, 0.34%, and 0.59%, respectively, of each Fund’s average daily net assets (this annual rate or such other annual rate that may be in effect from time to time, the “Expense Cap”), subject to later reimbursement by the Funds in certain circumstances.
In general, for a period of up to 36 months after the date any amounts are paid, waived or reimbursed by the Investment Manager, the Investment Manager may recover such amounts from a Fund, provided that such repayment would not cause the Fund’s total annual operating expenses after fee waiver and expense reimbursements (exclusive of the items noted in the parenthetical above) to exceed either (i) the Expense Cap in effect at the time such amounts were paid, waived or reimbursed, or (ii) the Expense Cap in effect at the time of such repayment by the Fund.
The contractual expense limitation may only be terminated in the event the Investment Manager or a successor ceases to be the investment manager of a Fund or a successor fund, by mutual agreement between the Investment Manager and the Boards, or in the event of a Fund’s liquidation unless the Fund is reorganized or is a party to a merger in which the surviving entity is successor to the accounting and performance information of a Fund.
For the six months ended June 30, 2024, the Investment Manager’s expense reimbursements, and repayments of prior reimbursements by the Funds to the Investment Manager, if any, are as follows:
| | | | | | | | | | |
| | | Expense | | Repayment of |
| | | Reimbursements | | Prior Reimbursements |
| | |
| ESG Bond | | | | $65,389 | | | | | — | |
| | |
| Enhanced Core Bond ESG | | | | 86,603 | | | | | — | |
| | |
| High Income | | | | 55,202 | | | | | — | |
| | |
| Municipal Bond | | | | 334,418 | | | | | — | |
| | |
| Municipal Enhanced | | | | 100,374 | | | | | — | |
At June 30, 2024, the Funds’ expiration of reimbursements subject to recoupment is as follows:
| | | | | | | | | | | | |
Expiration Period | | ESG Bond | | | Municipal Bond | | | Municipal Enhanced | |
| | | |
| Less than 1 year | | | $51,752 | | | | $719,840 | | | | $230,878 | |
| | | |
| 1-2 years | | | 86,383 | | | | 748,215 | | | | 217,440 | |
| | | |
| 2-3 years | | | 107,311 | | | | 717,835 | | | | 217,680 | |
| | | | | | | | | | | | |
| | | |
| Total | | | $245,446 | | | | $2,185,890 | | | | $665,998 | |
| | | | | | | | | | | | |
Effective June 17, 2024, for Enhanced Core Bond ESG and High Income the Investment Manager waived its management fee and right to recoup any prior reimbursed expenses under Enhanced Core Bond ESG’s and High Income’s Expense Limitation Agreements. For the six months ended June 30, 2024, the investment management fees for Enhanced Core Bond ESG and High Income were reduced by $3,470 and $1,041, respectively, or 0.02% of average daily net assets.
The Trusts, on behalf of the Funds, have entered into an amended and restated Administration Agreement under which the Investment Manager serves as the Funds’ administrator (the “Administrator”) and is responsible for certain aspects of managing the Funds’ operations, including administration and shareholder
38
| | |
| | | Notes to Financial Statements (continued) |
| | | |
| | | |
services to each Fund. Each Fund pays a fee to the Administrator at the rate of 0.15% per annum of the Fund’s average daily net assets for this service.
The Funds are distributed by AMG Distributors, Inc. (the “Distributor”), a wholly-owned subsidiary of the Investment Manager. The Distributor serves as the distributor and underwriter for each Fund and is a registered broker-dealer and member of the Financial Industry Regulatory Authority, Inc. (“FINRA”). Shares of each Fund will be continuously offered and will be sold directly to prospective purchasers and through brokers, dealers or other financial intermediaries who have executed selling agreements with the Distributor. Generally, the Distributor bears all or a portion of the expenses of providing services pursuant to the distribution agreement, including the payment of the expenses relating to the distribution of prospectuses for sales purposes and any advertising or sales literature.
The Trusts have adopted a distribution and service plan (the “Plan”) with respect to the Class N shares, in accordance with the requirements of Rule 12b-1 under the 1940 Act and the requirements of the applicable rules of FINRA regarding asset-based sales charges. Pursuant to the Plan, Enhanced Core Bond ESG, Municipal Bond and Municipal Enhanced may make payments to the Distributor for its expenditures in financing any activity primarily intended to result in the sale of each Fund’s Class N shares and for maintenance and personal service provided to existing shareholders of that class. The Plan authorizes payments to the Distributor up to 0.25% annually of Enhanced Core Bond ESG, Municipal Bond and Municipal Enhanced average daily net assets attributable to the Class N shares. The portion of payments made under the plan by Class N shares of Enhanced Core Bond ESG, Municipal Bond and Municipal Enhanced for shareholder servicing may not exceed an annual rate of 0.25% of the average daily net asset value of each Fund’s shares of that class owned by clients of such broker, dealer or financial intermediary.
For each of Class N and Class I shares of ESG Bond, High Income, Municipal Bond, and Municipal Enhanced, and for Enhanced Core Bond ESG’s Class I shares, the Board has approved reimbursement payments to the Investment Manager for shareholder servicing expenses (“shareholder servicing fees”) incurred. Shareholder servicing fees include payments to financial intermediaries, such as broker-dealers (including fund supermarket platforms), banks, and trust companies who provide shareholder recordkeeping, account servicing and other services. The Class N and Class I shares may reimburse the Investment Manager for the actual amount incurred up to a maximum annual rate of each Class’s average daily net assets as shown in the table below.
The impact on the annualized expense ratios for the six months ended June 30, 2024, was as follows:
| | | | | | | | |
| | | Maximum Annual | | | Actual | |
| | | Amount | | | Amount | |
| Fund | | Approved | | | Incurred | |
| | |
ESG Bond | | | | | | | | |
| | |
Class N | | | 0.25% | | | | 0.25% | |
Class I | | | 0.05% | | | | 0.05% | |
| | |
Enhanced Core Bond ESG | | | | | | | | |
| | |
Class I | | | 0.10% | | | | 0.08% | |
| | |
High Income | | | | | | | | |
| | |
Class N | | | 0.25% | | | | 0.25% | |
Class I | | | 0.05% | | | | 0.05% | |
| | |
Municipal Bond | | | | | | | | |
| | |
Class N | | | 0.15% | | | | 0.13% | |
Class I | | | 0.05% | | | | 0.05% | |
| | |
Municipal Enhanced | | | | | | | | |
| | |
Class N | | | 0.15% | | | | 0.15% | |
Class I | | | 0.05% | | | | 0.05% | |
The Board provides supervision of the affairs of the Trusts and other trusts within the AMG Funds Family. The Trustees of the Trusts who are not affiliated with the Investment Manager receive an annual retainer and per meeting fees for regular, special and telephonic meetings, and they are reimbursed for out-of-pocket expenses incurred while carrying out their duties as Board members. The Chairman of the Board and the Audit Committee Chair receive additional annual retainers. Certain Trustees and Officers of the Funds are Officers and/or Directors of the Investment Manager, AMG and/or the Distributor.
The Securities and Exchange Commission (the “SEC”) granted an exemptive order that permits certain eligible funds in the AMG Funds Family to lend and borrow money for certain temporary purposes directly to and from other eligible funds in the AMG Funds Family. Participation in this interfund lending program is voluntary for both the borrowing and lending funds, and an interfund loan is only made if it benefits each participating fund. The Administrator manages the program according to procedures approved by the Board, and the Board monitors the operation of the program. An interfund loan must comply with certain conditions set out in the exemptive order, which are designed to assure fairness and protect all participating funds. The interest earned and interest paid on interfund loans are included on the Statement of Operations as interest income and interest expense, respectively. At June 30, 2024, the Funds had no interfund loans outstanding. The Funds did not lend during the six months ended June 30, 2024.
The following Fund utilized the interfund loan program during the six months ended June 30, 2024 as follows:
| | | | | | | | | | | | | | | | |
| Fund | | Average
Borrowed | | | Number
of Days | | | Interest
Paid | | | Average
Interest Rate | |
| | | | |
Municipal Enhanced | | | $2,049,864 | | | | 1 | | | | $349 | | | | 6.215% | |
39
| | |
| | | Notes to Financial Statements (continued) |
| | | |
| | | |
3. PURCHASES AND SALES OF SECURITIES
Purchases and sales of securities (excluding short-term securities and U.S. Government Obligations) for the six months ended June 30, 2024, were as follows:
| | | | | | | | |
| | | Long Term Securities | |
| | |
| Fund | | Purchases | | | Sales | |
| | |
ESG Bond | | | $53,194,626 | | | | $79,762,186 | |
| | |
Enhanced Core Bond ESG | | | 4,654,271 | | | | 24,631,119 | |
| | |
High Income | | | 2,497,584 | | | | 16,060,393 | |
| | |
Municipal Bond | | | 204,995,847 | | | | 150,809,183 | |
| | |
Municipal Enhanced | | | 28,026,669 | | | | 33,262,651 | |
Purchases and sales of U.S. Government Obligations for the six months ended June 30, 2024 were as follows:
| | | | | | | | |
| | | U.S. Government Obligations | |
| | |
| Fund | | Purchases | | | Sales | |
| | |
ESG Bond | | | $18,371,458 | | | | $21,734,426 | |
| | |
Enhanced Core Bond ESG | | | 3,215,725 | | | | 22,537,734 | |
4. PORTFOLIO SECURITIES LOANED
The Funds, except Municipal Bond and Municipal Enhanced, participate in the Securities Lending Program providing for the lending of securities to qualified borrowers. Securities lending income includes earnings of such temporary cash investments, plus or minus any rebate to a borrower. These earnings (after any rebate) are then divided between BNYM, as a fee for its services under the Securities Lending Program, and the Funds, according to agreed-upon rates. Collateral on all securities loaned is accepted in cash, U.S. Treasury Obligations or U.S. Government Agency Obligations. Collateral is maintained at a minimum level of 102% (105% in the case of certain foreign securities) of the market value, plus interest, if applicable, of investments on loan. It is the Funds’ policy to obtain additional collateral from or return excess collateral to the borrower by the end of the next business day, following the valuation date of the securities loaned. Therefore, the value of the collateral held may be temporarily less than the value of the securities on loan. Lending securities entails a risk of loss to the Funds if and to the extent that the market value of the securities loaned were to increase and the borrower did not increase the collateral accordingly, and the borrower fails to return the securities. Under the terms of the Securities Lending Program, the Funds are indemnified for such losses by BNYM. Cash collateral is held in separate omnibus accounts managed by BNYM, who is authorized to exclusively enter into joint repurchase agreements for that cash collateral. Securities collateral is held in separate omnibus accounts managed by BNYM and cannot be sold or pledged. BNYM bears the risk of any deficiency in the amount of the cash collateral available for return to the borrower due to any loss on the collateral invested. Loans of securities are terminable by a Fund at any time and the borrower, after notice, is required to return borrowed securities as soon as practical, which is normally within three business days.
The value of securities loaned on positions held, cash collateral and securities collateral received at June 30, 2024, was as follows:
| | | | | | | | | | | | | | | | |
| Fund | | Securities
Loaned | | | Cash
Collateral
Received | | | Securities
Collateral
Received | | | Total Collateral Received | |
| | | | |
ESG Bond | | | $21,447,918 | | | | $16,825,095 | | | | $5,491,355 | | | | $22,316,450 | |
The following table summarizes the securities received as collateral for securities lending at June 30, 2024:
| | | | | | |
| Fund | | Collateral Type | | Coupon
Range | | Maturity
Date Range |
| | | |
ESG Bond | | U.S. Treasury Obligations | | 0.125%-5.250% | | 10/15/24-05/15/52 |
5. FUND RISKS
In the normal course of business, the Funds invest in securities or other instruments and may enter into certain transactions, and such activities subject the Funds to various risks. Below is a summary of some, but not all, of those risks. Each risk described below does not necessarily apply to each Fund. Please refer to each Fund’s prospectus for a description of the principal risks associated with investing in a particular Fund. The value of securities or other instruments may also be affected by various factors, including, without limitation: (i) the general economy; (ii) the overall market as well as local, regional or global political and/or social instability; or (iii) price fluctuations.
Market Risk: Market prices of investments held by the Funds may fall rapidly or unpredictably due to a variety of factors, including economic, political, or market conditions, or other factors including terrorism, war, natural disasters and the spread of infectious illness or other public health issues, including epidemics or pandemics, or in response to events that affect particular industries or companies.
Management Risk: Because the Funds are actively managed investment portfolios, security selection or focus on securities in a particular style, market sector or group of companies may cause the Funds to incur losses or underperform relative to its benchmarks or other funds with a similar investment objective. There can be no guarantee that GW&K’s investment techniques and risk analysis will produce the desired result.
Municipal Market Risk: Factors unique to the municipal bond market may negatively affect the value of the Funds’ investment in municipal bonds. These factors include political or legislative changes, and uncertainties related to the tax status of the securities and the rights of investors in the securities. The Funds may invest in a group of municipal obligations that are related in such a way that an economic, business, or political development affecting one would also affect the others.
Sector Risk: Issuers and companies that are in similar industry sectors may be similarly affected by particular economic or market events; to the extent certain Funds have substantial holdings within a particular sector, the risks associated with that sector increase. A portion of certain Funds’ assets may be invested in fixed income securities that would tend to respond similarly to particular economic or political developments or the interest on which is based on revenues or otherwise related to similar types of projects. An example would be securities of issuers whose revenues are paid from similar types of projects, such as health care (including hospitals), utilities, or transportation.
Debt Securities Risk: The value of a debt security changes in response to various factors, including, for example, market-related factors, such as changes in interest rates or changes in the actual or perceived ability of an issuer to meet its
40
| | |
| | | Notes to Financial Statements (continued) |
| | | |
| | | |
obligations. Investments in debt securities are subject to, among other risks, credit risk, interest rate risk, extension risk, prepayment risk and liquidity risk.
Interest Rate Risk: Fixed coupon payments (cash flows) of bonds and debt securities may become less competitive with the market in periods of rising interest rates and cause bond prices to decline. During periods of increasing interest rates, the Funds may experience high levels of volatility and shareholder redemptions, and may have to sell securities at times when it would otherwise not do so, and at unfavorable prices, which could reduce the returns of the Funds.
Credit and Counterparty Risk: The issuer of bonds or other debt securities may be unable or unwilling, or may be perceived as unable or unwilling, to make timely interest, principal or settlement payments or otherwise honor its obligations.
Prepayment Risk: A debtor may exercise its right to pay back a bond or other debt security earlier than expected or required during periods of decreasing interest rates.
Extension Risk: During periods of rising interest rates, a debtor may pay back a bond or other fixed income security slower than expected or required, and the value of such security may fall.
Asset-Backed and Mortgage-Backed Securities Risk: Investments in asset-backed and mortgage-backed securities involve risk of severe credit downgrades, loss due to prepayments that occur earlier or later than expected, illiquidity and default.
U.S. Government Securities Risk: Obligations issued by some U.S. Government agencies, authorities, instrumentalities, or sponsored enterprises such as Government National Mortgage Association (“GNMA”) are backed by the full faith and credit of the U.S. Government, while obligations issued by others, such as Federal National Mortgage Association (“FNMA”), Federal Home Loan Mortgage Corporation (“FHLMC”), and Federal Home Loan Banks (“FHLBs”), are not backed by the full faith and credit of the U.S. Government and are backed solely by the entity’s own resources or by the ability of the entity to borrow from the U.S. Treasury. If one of these agencies defaults on a loan, there is no guarantee that the U.S. Government will provide financial support.
Liquidity Risk: The Funds may not be able to dispose of particular investments, such as illiquid securities, readily at favorable times or prices or the Fund may have to sell them at a loss.
High Yield Risk: Below investment grade debt securities and unrated securities of similar credit quality (commonly known as “junk bonds” or “high yield securities”) may be subject to greater levels of interest rate, credit, liquidity, and market risk than higher-rated securities. These securities are considered predominately speculative with respect to the issuer’s continuing ability to make principal and interest payments.
ESG Investing Risk: Because applying a Fund’s ESG investment criteria may result in the selection or exclusion of securities of certain issuers for reasons other than financial performance, a Fund’s investment returns may underperform funds that do not incorporate ESG factors into their investment process. The incorporation of ESG criteria into the investment process may affect a Fund’s investment exposure to certain companies, sectors, regions, countries or types of investments, which could negatively impact a Fund’s performance depending on whether such investments are in or out of favor. Applying ESG criteria to investment decisions is qualitative and subjective by nature, and there is no guarantee that the criteria utilized by GW&K or any judgment exercised by GW&K will improve the financial performance of a Fund or reflect the beliefs or values of any particular investor. ESG standards differ by region and industry, and a company’s ESG practices or GW&K’s assessment of a company’s ESG practices may change over time. GW&K’s evaluation of a company also may be dependent on the availability of timely, complete and accurate ESG data reported by issuers and/or third party data providers. Different methodologies may be used by the various issuers and third party sources that provide ESG data, and such ESG data often lacks standardization, consistency and transparency.
6. COMMITMENTS AND CONTINGENCIES
Under the Trusts’ organizational documents, their Trustees and Officers are indemnified against certain liabilities arising out of the performance of their duties to the Trusts. In addition, in the normal course of business, the Funds may enter into contracts and agreements that contain a variety of representations and warranties, which provide general indemnifications. The maximum exposure to the Funds under these arrangements is unknown, as this would involve future claims that may be made against a Fund that have not yet occurred. However, based on experience, the Funds had no prior claims or losses and expect the risks of loss to be remote.
7. RISKS ASSOCIATED WITH HIGH YIELD SECURITIES
Investing in high yield securities involves greater risks and considerations not typically associated with U.S. Government and other high quality/investment grade securities. High yield securities are generally below investment grade securities and do not have an established retail secondary market. Economic downturns may disrupt the high yield market and impair the issuer’s ability to repay principal and interest. Also, an increase in interest rates would likely have an adverse impact on the value of such obligations and could cause the securities to become less liquid.
8. MASTER NETTING AGREEMENTS
The Funds may enter into master netting agreements with their counterparties for the Securities Lending Program and Repurchase Agreements, which provide the right, in the event of default (including bankruptcy or insolvency) for the non-defaulting party to liquidate the collateral and calculate net exposure to the defaulting party or request additional collateral. For financial reporting purposes, the Funds do not offset financial assets and financial liabilities that are subject to master netting agreements in the Statement of Assets and Liabilities. For securities lending transactions, see Note 4.
The following table is a summary of the Funds’ open Repurchase Agreements that are subject to a master netting agreement as of June 30, 2024:
41
| | |
| | | Notes to Financial Statements (continued) |
| | | |
| | | |
| | | | | | | | | | | | | | | | | | | | | | | | | | | | | |
| | | | | Gross Amount Not Offset in the | | | | | | | | |
| | | | | Statement of Assets and Liabilities | | | | | | | | |
| | | | | | | | | | | | | | | | | | | | | | | | |
| Fund | | Gross Amounts of
Assets Presented in
the Statement of
Assets and Liabilities | | Offset Amount | | Net Asset Balance | | | | Collateral Received | | | | Net Amount |
| | | | | | | | | | | | | | | |
| | | | | | | |
ESG Bond | | | | | | | | | | | | | | | | | | | | | | | | | | | | | |
| | | | | | | |
State of Wisconsin Investment Board | | | | $16,825,095 | | | | | — | | | | | $16,825,095 | | | | | | | $16,825,095 | | | | | | | — | |
| | | | | | | |
Fixed Income Clearing Corp. | | | | 3,468,000 | | | | | — | | | | | 3,468,000 | | | | | | | 3,468,000 | | | | | | | — | |
| | | | | | | | | | | | | | | | | | | | | | | | | | | | | |
| | | | | | | |
Total | | | | $20,293,095 | | | | | — | | | | | $20,293,095 | | | | | | | $20,293,095 | | | | | | | — | |
| | | | | | | | | | | | | | | | | | | | | | | | | | | | | |
| | | | | | | | | | | | | | | |
| | | | | | | |
Municipal Bond | | | | | | | | | | | | | | | | | | | | | | | | | | | | | |
| | | | | | | |
Fixed Income Clearing Corp. | | | | $6,462,000 | | | | | — | | | | | $6,462,000 | | | | | | | $6,462,000 | | | | | | | — | |
| | | | | | | |
Municipal Enhanced | | | | | | | | | | | | | | | | | | | | | | | | | | | | | |
| | | | | | | |
Fixed Income Clearing Corp. | | | | $271,000 | | | | | — | | | | | $271,000 | | | | | | | $271,000 | | | | | | | — | |
9. SUBSEQUENT EVENTS
The Funds have determined that no material events or transactions occurred through the issuance date of the Funds’ financial statements which require an additional disclosure in or adjustment of the Funds’ financial statements.
42
| | |
| | | Other Information (unaudited) |
| | | |
| | | |
ITEM 8. CHANGES IN AND DISAGREEMENTS WITH ACCOUNTANTS FOR OPEN-END MANAGEMENT INVESTMENT COMPANIES
During the six months ended June 30, 2024, there were no changes in and/or disagreements with accountants.
ITEM 9. PROXY DISCLOSURES FOR OPEN-END MANAGEMENT INVESTMENT COMPANIES
Not applicable.
ITEM 10. REMUNERATION PAID TO DIRECTORS, OFFICERS, AND OTHERS OF OPEN-END MANAGEMENT INVESTMENT COMPANIES
The remuneration paid to the Trustees during the six months ended June 30, 2024, is reflected as “Trustee fees and expenses” on the Statement of Operations and is set forth in the table below. There was no remuneration paid to any Fund officer or to any affiliated person of any Fund Trustee or officer during the six months ended June 30, 2024.
| | | | |
| | | Trustee fees and expenses | |
| |
AMG GW&K ESG Bond Fund | | | $15,790 | |
| |
AMG GW&K Enhanced Core Bond ESG Fund | | | 1,420 | |
| |
AMG GW&K High Income Fund | | | 410 | |
| |
AMG GW&K Municipal Bond Fund | | | 38,866 | |
| |
AMG GW&K Municipal Enhanced Yield Fund | | | 8,098 | |
43
| | |
| | | ITEM 11. STATEMENT REGARDING BASIS FOR APPROVAL OF INVESTMENT
ADVISORY CONTRACT |
| | | |
| | | |
AMG GW&K Municipal Enhanced Yield Fund, AMG GW&K Municipal Bond Fund, AMG GW&K Enhanced Core Bond ESG Fund, AMG GW&K ESG Bond Fund, and AMG GW&K High Income Fund: Approval of Investment Management and Subadvisory Agreements on June 12, 2024
At an in-person meeting held on June 12, 2024, the Board of Trustees (the “Board” or the “Trustees”) of each of AMG Funds, AMG Funds II, and AMG Funds III (each, a “Trust” and collectively, the “Trusts”), and separately a majority of the Trustees who are not “interested persons” of the Trusts (the “Independent Trustees”), approved (i) the Investment Management Agreement, as amended pursuant to letter agreements at any time prior to the date of the meeting, with AMG Funds LLC (the “Investment Manager”) and AMG Funds for each of AMG GW&K Municipal Enhanced Yield Fund and AMG GW&K Municipal Bond Fund, and separately each of Amendment No. 1 thereto dated July 1, 2015, and Amendment No. 2 thereto dated October 1, 2016; the Investment Management Agreement, as amended pursuant to letter agreements at any time prior to the date of the meeting, with the Investment Manager and AMG Funds II for AMG GW&K Enhanced Core Bond ESG Fund, and separately each of Amendment No. 1 thereto, Amendment No. 2 thereto dated July 1, 2015, and Amendment No. 3 thereto dated October 1, 2016; and the Fund Management Agreement, as amended pursuant to letter agreements at any time prior to the date of the meeting, with the Investment Manager and AMG Funds III for AMG GW&K ESG Bond Fund and AMG GW&K High Income Fund, and separately each of Amendment No. 1 thereto dated July 1, 2015, and Amendment No. 2 thereto dated October 1, 2016 (collectively, the “Investment Management Agreements”); and (ii) the Subadvisory Agreement with respect to each of AMG GW&K Municipal Enhanced Yield Fund, AMG GW&K Municipal Bond Fund, AMG GW&K Enhanced Core Bond ESG Fund, AMG GW&K ESG Bond Fund, and AMG GW&K High Income Fund (each, a “Fund,” and collectively, the “Funds”), as amended at any time prior to the date of the meeting (collectively, the “Subadvisory Agreements”), with GW&K Investment Management, LLC, the Funds’ subadviser (the “Subadviser”). The Independent Trustees were separately represented by independent legal counsel in connection with their consideration of the approval of these agreements. In considering the Investment Management Agreements and the Subadvisory Agreements, the Trustees reviewed a variety of materials relating to each Fund, the Investment Manager and the Subadviser, including the nature,
extent and quality of services, comparative performance, fee and expense information for an appropriate peer group of similar mutual funds for each Fund (each, a “Peer Group”), performance information for the relevant benchmark index for each Fund (each, a “Fund Benchmark”), other relevant matters, including management fees, the profitability of the Investment Manager and the Subadviser, and the potential for economies of scale that may be shared with the Funds, and other information provided to them on a periodic basis throughout the year. Prior to voting, the Independent Trustees: (a) reviewed the foregoing information with their independent legal counsel; (b) received materials from their independent legal counsel discussing the legal standards applicable to their consideration of the Investment Management Agreements and Subadvisory Agreements; and (c) met with their independent legal counsel in private sessions at which no representatives of management were present.
NATURE, EXTENT AND QUALITY OF SERVICES
In considering the nature, extent and quality of the services provided by the Investment Manager, the Trustees reviewed information provided by the Investment Manager at the June 12, 2024 meeting and prior meetings relating to the Investment Manager’s operations and personnel. Among other things, the Investment Manager provided financial information, information about its supervisory and professional staff and descriptions of its organizational and management structure. The Trustees also took into account information provided periodically throughout the previous year by the Investment Manager in Board meetings relating to the performance of its duties with respect to the Funds and the Trustees’ knowledge of the Investment Manager’s management and the quality of the performance of the Investment Manager’s duties under the Investment Management Agreements and Administration Agreement. In the course of their deliberations regarding the Investment Manager, the Trustees evaluated, among other things: (a) the extent and quality of the Investment Manager’s oversight of the operation and management of the Funds; (b) the quality of the Investment Manager’s oversight of the performance by the Subadviser of its portfolio management duties; (c) the Investment Manager’s ability to supervise the Funds’ other service providers; and (d) the Investment Manager’s compliance program. The Trustees also took into account that, in performing its functions under the Investment Management Agreements and
supervising the Subadviser, the Investment Manager: performs periodic detailed analyses and reviews of the performance by the Subadviser of its obligations to each Fund, including without limitation, analysis and review of portfolio and other compliance matters and review of the Subadviser’s investment performance with respect to each Fund; prepares and presents periodic reports to the Board regarding the investment performance of the Subadviser and other information regarding the Subadviser, at such times and in such forms as the Board may reasonably request; reviews and considers any changes in the personnel of the Subadviser responsible for performing the Subadviser’s obligations and makes appropriate reports to the Board; reviews and considers any changes in the ownership or senior management of the Subadviser and makes appropriate reports to the Board; performs periodic in-person, telephonic or videoconference diligence meetings, including with respect to compliance matters, with representatives of the Subadviser; assists the Board and management of the Trusts in developing and reviewing information with respect to the initial approval of each Subadvisory Agreement and annual consideration of each Subadvisory Agreement thereafter; prepares recommendations with respect to the continued retention of the Subadviser or the replacement of the Subadviser, including at the request of the Board; identifies potential successors to, or replacements of, the Subadviser or potential additional subadvisers, including performing appropriate due diligence, and developing and presenting to the Board a recommendation as to any such successor, replacement, or additional subadviser, including at the request of the Board; designates and compensates from its own resources such personnel as the Investment Manager may consider necessary or appropriate to the performance of its services; and performs such other review and reporting functions as the Board shall reasonably request consistent with the Investment Management Agreements and applicable law. The Trustees noted the affiliation of the Subadviser with the Investment Manager, noting any potential conflicts of interest. The Trustees also took into account the financial condition of the Investment Manager with respect to its ability to provide the services required under the Investment Management Agreements and the Investment Manager’s undertaking to maintain contractual expense limitations for the Funds. The Trustees also considered the Investment Manager’s risk management processes.
44
| | |
| | | ITEM 11. STATEMENT REGARDING BASIS FOR APPROVAL OF INVESTMENT
ADVISORY CONTRACT (continued) |
| | | |
| | | |
The Trustees also reviewed information relating to the Subadviser’s operations and personnel and the investment philosophy, strategies and techniques (its “Investment Strategy”) used in managing each Fund. Among other things, the Trustees reviewed information on portfolio management and other professional staff, information regarding the Subadviser’s organizational and management structure and the Subadviser’s brokerage policies and practices. The Trustees considered specific information provided regarding the experience of the individuals at the Subadviser with portfolio management responsibility for each Fund, including the information set forth in each Fund’s prospectus and statement of additional information. In the course of their deliberations, the Trustees evaluated, among other things: (a) the services rendered by the Subadviser in the past; (b) the qualifications and experience of the Subadviser’s personnel; and (c) the Subadviser’s compliance program. The Trustees also took into account the financial condition of the Subadviser with respect to its ability to provide the services required under each Subadvisory Agreement. The Trustees also considered the Subadviser’s risk management processes.
PERFORMANCE
The Board considered each Fund’s net performance during relevant time periods as compared to the Fund’s Peer Group and Fund Benchmark, considered the gross performance of each Fund as compared to the Subadviser’s relevant performance composite that utilizes a similar investment strategy and approach, and noted that the Board reviews on a quarterly basis detailed information about both a Fund’s performance results and portfolio composition, as well as the Subadviser’s Investment Strategy. The Board was mindful of the Investment Manager’s expertise, resources, and attention to monitoring the Subadviser’s performance, investment style and risk-adjusted performance with respect to the Funds and its discussions with the management of the Funds’ subadviser during the period regarding the factors that contributed to the performance of the Funds.
With respect to AMG GW&K Municipal Enhanced Yield Fund, among other information relating to the Fund’s performance, the Trustees noted that the Fund’s performance for Class I shares (which share class has the earliest inception date and the largest amount of assets of all the share classes of the Fund) for the 1-year, 3-year, 5-year and 10-year periods ended March 31, 2024, was below, below, below, and above, respectively, the median performance of the Peer Group and above, below,
below, and below, respectively, the performance of the Fund Benchmark, the Bloomberg U.S. Municipal Bond BAA Index. The Trustees took into account management’s discussion of the Fund’s performance, including the reasons for the Fund’s recent outperformance relative to the Fund Benchmark and longer-term underperformance relative to the Fund Benchmark and the Peer Group. The Trustees also took into account the fact that Class I shares of the Fund ranked in the top percentile relative to the Peer Group for the 2023 calendar year and in the top decile relative to the Peer Group for the 2020 and 2019 calendar years. The Trustees concluded that the Fund’s overall performance has been satisfactory in light of the Fund’s investment objective, strategies and policies.
With respect to AMG GW&K Municipal Bond Fund, among other information relating to the Fund’s performance, the Trustees noted that the Fund’s performance for Class I shares (which share class has the largest amount of assets of all the share classes of the Fund) for the 1-year, 3-year, 5-year, and 10-year periods ended March 31, 2024, was below, below, below, and above, respectively, the median performance of the Peer Group and above, below, below, and below, respectively, the performance of the Fund Benchmark, the Bloomberg 10-Year Municipal Bond Index. The Trustees took into account management’s discussion of the Fund’s performance, including the reasons for the Fund’s recent outperformance relative to the Fund Benchmark and longer-term underperformance relative to the Fund Benchmark and the Peer Group. The Trustees also took into account the fact that Class I shares of the Fund ranked in the top third relative to its Peer Group for the 10-year period and that the Fund ranked in the top half of its Peer Group for the 2022 and 2023 calendar years. The Trustees concluded that the Fund’s overall performance has been satisfactory in light of the Fund’s investment objective, strategies and policies.
With respect to AMG GW&K Enhanced Core Bond ESG Fund, among other information relating to the Fund’s performance, the Trustees noted that the Fund’s performance for Class N shares (which share class has one of the earliest inception dates and the largest amount of assets of all the share classes of the Fund with that inception date) for the 1-year, 3-year, 5-year and 10-year periods ended March 31, 2024, was below the median performance of the Peer Group and above, below, above, and below, respectively, the performance of the Fund Benchmark, the Bloomberg U.S. Aggregate Bond Index. The Trustees took into account management’s discussion of the Fund’s performance, including the
reasons for the Fund’s underperformance relative to the Peer Group and more recent outperformance relative to the Fund Benchmark. The Trustees also took into account management’s recommendation to liquidate the Fund effective on or around September 11, 2024, which was approved by the Board.
With respect to AMG GW&K ESG Bond Fund, among other information relating to the Fund’s performance, the Trustees noted that the Fund’s performance for Class N shares (which share class has the earliest inception date and the largest amount of assets of all the share classes of the Fund) for the 1-year, 3-year, 5-year and 10-year periods ended March 31, 2024, was below, above, above, and above, respectively, the median performance of the Peer Group and above the performance of the Fund Benchmark, the Bloomberg U.S. Aggregate Bond Index. The Trustees took into account management’s discussion of the Fund’s performance, including the reasons for the Fund’s outperformance relative to the Fund Benchmark and longer-term outperformance relative to the Peer Group. The Trustees also took into account the fact that the Fund’s subadviser, investment strategy, and Fund Benchmark changed effective March 19, 2021, and that the performance information prior to that date reflected that of the Fund’s prior subadviser and investment strategy. The Trustees considered management’s discussion that the Fund’s performance has been in line with management’s expectations since the current Subadviser assumed subadvisory responsibilities. The Trustees concluded that the Fund’s overall performance has been satisfactory.
With respect to AMG GW&K High Income Fund, among other information relating to the Fund’s performance, the Trustees noted that the Fund’s performance for Class N shares (which share class has the earliest inception date of all the share classes of the Fund) for the 1-year, 3-year, 5-year and
10-year periods ended March 31, 2024, was below, below, above, and below, respectively, the median performance of the Peer Group and below, below, above, and below, respectively, the performance of the Fund Benchmark, the Bloomberg U.S. High Yield 1-5 Year Ba Index. The Trustees took into account management’s discussion of the Fund’s performance, including the reasons for the Fund’s more recent underperformance relative to the Peer Group and the Fund Benchmark and the fact that Class N shares of the Fund ranked in the top quintile relative to its Peer Group for the 5-year period. The Trustees also took into account the fact that the Fund’s subadviser, investment strategy, and Fund Benchmark changed effective December 4, 2020,
45
| | |
| | | ITEM 11. STATEMENT REGARDING BASIS FOR APPROVAL OF INVESTMENT
ADVISORY CONTRACT (continued) |
| | | |
| | | |
and that the performance information prior to that date reflected that of the Fund’s prior subadviser and investment strategy. The Trustees also took into account management’s recommendation to liquidate the Fund effective on or around September 11, 2024, which was approved by the Board.
ADVISORY AND SUBADVISORY FEES; FUND EXPENSES; PROFITABILITY; AND ECONOMIES OF SCALE
In considering the reasonableness of the advisory fee payable to the Investment Manager, the Trustees reviewed information provided by the Investment Manager at the June 12, 2024 meeting and prior meetings setting forth all revenues and other benefits, both direct and indirect (including any so-called “fallout benefits” such as reputational value derived from the Investment Manager serving as Investment Manager to a Fund), received by the Investment Manager and its affiliates attributable to managing each Fund and all the mutual funds in the AMG Funds Family of Funds; the cost of providing such services; the significant risks undertaken as Investment Manager and sponsor of the Funds, including investment, operational, enterprise, entrepreneurial, litigation, regulatory and compliance risks; and the resulting profitability to the Investment Manager and its affiliates from these relationships. The Trustees also considered the amount of the advisory fee retained by the Investment Manager after payment of the subadvisory fee with respect to each Fund. The Trustees also noted payments are made from the Subadviser to the Investment Manager, and other payments are made from the Investment Manager to the Subadviser. The Trustees also considered management’s discussion of the current asset levels of the Funds, and the impact on profitability of both the current asset levels and any future growth of assets of the Funds.
In considering the cost of services to be provided by the Investment Manager under each Investment Management Agreement and the profitability to the Investment Manager of its relationship with each Fund, the Trustees noted the undertaking by the Investment Manager to maintain contractual expense limitations for the Funds. The Board also took into account management’s discussion of the advisory fee structure, and the services the Investment Manager provides in performing its functions under each Investment Management Agreement and supervising the Subadviser. Based on the foregoing, the Trustees concluded that the profitability to the Investment Manager is reasonable and that the Investment Manager is not realizing material benefits from economies of scale that would
warrant adjustments to the advisory fee at this time. Also with respect to economies of scale, the Trustees noted that as each Fund’s assets increase over time, the Fund may realize other economies of scale to the extent the increase in assets is proportionally greater than the increase in certain other expenses.
In considering the reasonableness of the subadvisory fees payable by the Investment Manager to the Subadviser, the Trustees reviewed information regarding the cost to the Subadviser of providing subadvisory services to each Fund and the resulting profitability from these relationships. The Trustees noted that, because the Subadviser is an affiliate of the Investment Manager, a portion of the Subadviser’s revenues or profits might be shared directly or indirectly with the Investment Manager. The Trustees also noted that the subadvisory fees are paid by the Investment Manager out of its advisory fee. The Board also took into account management’s discussion of the subadvisory fee structure, and the services the Subadviser provides in performing its functions under each Subadvisory Agreement. Based on the foregoing, the Trustees concluded that the profitability to the Subadviser is reasonable and that the Subadviser is not realizing material benefits from economies of scale that would warrant adjustments to the subadvisory fees at this time. Also with respect to economies of scale, the Trustees noted that as a Fund’s assets increase over time, the Fund may realize other economies of scale to the extent the increase in assets is proportionally greater than the increase in certain other expenses.
With respect to AMG GW&K Municipal Enhanced Yield Fund, the Trustees noted that the management fees (which include both the advisory and administration fees) and total expenses (net of applicable expense waivers/reimbursements) of Class I shares (the class of shares which is the primary focus of the Fund’s distribution) of the Fund as of March 31, 2024, were rated in the High and the Above Average rating level, respectively, of the Fund’s Peer Group. The Trustees noted that the rating levels corresponded to the Fund’s quintile ranking in its Peer Group. The Trustees took into account the fact that the Investment Manager has contractually agreed, through May 1, 2025, to limit the Fund’s net annual operating expenses (subject to certain excluded expenses) to 0.59%. The Board also took into account management’s discussion of the Fund’s expenses and competitiveness with comparably sized funds and select competitors. The Trustees concluded that, in light of the nature, extent and quality of the services provided by the Investment Manager and the Subadviser (which is an affiliate of
the Investment Manager), the foregoing expense limitation and the considerations noted above with respect to the Investment Manager and the Subadviser, the Fund’s advisory and subadvisory fees are reasonable.
With respect to AMG GW&K Municipal Bond Fund, the Trustees noted that the management fees (which include both the advisory and administration fees) and total expenses (net of applicable expense waivers/reimbursements) of Class I shares (the class of shares which is the primary focus of the Fund’s distribution) of the Fund as of March 31, 2024, were rated in the Below Average and the Low rating level, respectively, of the Fund’s Peer Group. The Trustees noted that the rating levels corresponded to the Fund’s quintile ranking in its Peer Group. The Trustees took into account the fact that the Investment Manager has contractually agreed, through May 1, 2025, to limit the Fund’s net annual operating expenses (subject to certain excluded expenses) to 0.34%. The Trustees concluded that, in light of the nature, extent and quality of the services provided by the Investment Manager and the Subadviser (which is an affiliate of the Investment Manager), the foregoing expense limitation and the considerations noted above with respect to the Investment Manager and the Subadviser, the Fund’s advisory and subadvisory fees are reasonable.
With respect to AMG GW&K Enhanced Core Bond ESG Fund, the Trustees noted that the management fees (which include both the advisory and administration fees) and total expenses (net of applicable expense waivers/reimbursements) of Class I shares (the class of shares which is the primary focus of the Fund’s distribution) of the Fund as of March 31, 2024, were rated in the Average and the Above Average rating level, respectively, of the Fund’s Peer Group. The Trustees noted that the rating levels corresponded to the Fund’s quintile ranking in its Peer Group. The Trustees took into account the fact that the Investment Manager has contractually agreed, through May 1, 2025, to limit the Fund’s net annual operating expenses (subject to certain excluded expenses) to 0.48%. The Trustees also took into account management’s discussion of the Fund’s expenses, including fees and expenses relative to comparably sized funds and select competitors, and the Fund’s small size relative to its peer universe. The Trustees concluded that, in light of the nature, extent and quality of the services provided by the Investment Manager and the Subadviser (which is an affiliate of the Investment Manager), the foregoing expense limitation and the considerations noted
46
| | |
| | | ITEM 11. STATEMENT REGARDING BASIS FOR APPROVAL OF INVESTMENT
ADVISORY CONTRACT (continued) |
| | | |
| | | |
above with respect to the Investment Manager and the Subadviser, the Fund’s advisory and subadvisory fees are reasonable.
With respect to AMG GW&K ESG Bond Fund, the Trustees noted that the management fees (which include both the advisory and administration fees) and total expenses (net of applicable expense waivers/reimbursements) of Class I shares (the class of shares which is the primary focus of the Fund’s distribution) of the Fund as of March 31, 2024, were rated in the Below Average and the Average rating level, respectively, of the Peer Group. The Trustees noted that the rating levels corresponded to the Fund’s quintile ranking in its Peer Group. The Trustees took into account the fact that the Investment Manager has contractually agreed, through May 1, 2025, to limit the Fund’s net annual operating expenses (subject to certain excluded expenses) to 0.43%. The Trustees concluded that, in light of the nature, extent and quality of the services provided by the Investment Manager and the Subadviser (which is an affiliate of the Investment Manager), the foregoing expense limitation and the considerations noted above with respect to the Investment Manager and the Subadviser, the Fund’s advisory and subadvisory fees are reasonable.
With respect to AMG GW&K High Income Fund, the Trustees noted that the management fees (which include both the advisory and administration fees) and total expenses (net of applicable expense
waivers/reimbursements) of Class I shares (the class of shares which is the primary focus of the Fund’s distribution) of the Fund as of March 31, 2024, were rated in the Below Average and the Average rating level, respectively, of the Peer Group. The Trustees noted that the rating level corresponded to the Fund’s quintile ranking in its Peer Group. The Trustees took into account the fact that the Investment Manager has contractually agreed, through May 1, 2025, to limit the Fund’s net annual operating expenses (subject to certain excluded expenses) to 0.59%. The Trustees concluded that, in light of the nature, extent and quality of the services provided by the Investment Manager and the Subadviser (which is an affiliate of the Investment Manager), the foregoing expense limitation and the considerations noted above with respect to the Investment Manager and the Subadviser, the Fund’s advisory and subadvisory fees are reasonable.
PROPOSED LIQUIDATION OF AMG GW&K ENHANCED CORE BOND ESG FUND AND AMG GW&K HIGH INCOME FUND
The Trustees also considered and approved a proposal by management to liquidate AMG GW&K Enhanced Core Bond ESG Fund and AMG GW&K High Income Fund on or around September 11, 2024. The Trustees noted that, although such proposal was approved by the Trustees, renewal of the Investment Management Agreements and Subadvisory Agreements relating to such Funds needed to be
considered since the terms of such agreements otherwise would have expired prior to July 1, 2024.
* * * *
After consideration of the foregoing, the Trustees also reached the following conclusions (in addition to the conclusions discussed above) regarding the Investment Management and Subadvisory Agreements: (a) the Investment Manager and the Subadviser have demonstrated that they possess the capability and resources to perform the duties required of them under each Investment Management Agreement and each Subadvisory Agreement and (b) the Investment Manager and Subadviser maintain appropriate compliance programs.
Based on all of the above-mentioned factors and their related conclusions, with no single factor or conclusion being determinative and with each Trustee not necessarily attributing the same weight to each factor, the Trustees concluded that approval of each Investment Management Agreement and each Subadvisory Agreement would be in the best interests of the applicable Fund and its shareholders. Accordingly, on June 12, 2024, the Trustees, and separately a majority of the Independent Trustees, voted to approve the Investment Management Agreement and the Subadvisory Agreement for each Fund.
47
THIS PAGE INTENTIONALLY LEFT BLANK
| | | | | | | | |
INVESTMENT MANAGER AND ADMINISTRATOR AMG Funds LLC 680 Washington Blvd., Suite 500 Stamford, CT 06901 800.548.4539 DISTRIBUTOR AMG Distributors, Inc. 680 Washington Blvd., Suite 500 Stamford, CT 06901 800.548.4539 SUBADVISER GW&K Investment Management, LLC 222 Berkeley St. Boston, MA 02116 CUSTODIAN The Bank of New York Mellon Mutual Funds Custody 240 Greenwich Street New York, NY 10286 LEGAL COUNSEL Ropes & Gray LLP Prudential Tower, 800 Boylston Street Boston, MA 02199-3600 | | | | TRANSFER AGENT BNY Mellon Investment Servicing (US) Inc. AMG Funds Attn: 534426 AIM 154-0520 500 Ross Street Pittsburgh, PA 15262 800.548.4539 TRUSTEES Jill R. Cuniff Kurt A. Keilhacker Peter W. MacEwen Steven J. Paggioli Eric Rakowski Victoria L. Sassine Garret W. Weston | | | | This report is prepared for the Funds’ shareholders. It is authorized for distribution to prospective investors only when preceded or accompanied by an effective prospectus. To receive a free copy of the prospectus or Statement of Additional Information, which includes additional information about Fund Trustees, please contact us by calling 800.548.4539. Distributed by AMG Distributors, Inc., member FINRA/SIPC. Current net asset values per share for each Fund are available on the Funds’ website at wealth.amg.com. A description of the policies and procedures each Fund uses to vote its proxies is available: (i) without charge, upon request, by calling 800.548.4539, or (ii) on the Securities and Exchange Commission’s (SEC) website at sec.gov. For information regarding each Fund’s proxy voting record for the 12-month period ended June 30, call 800.548.4539 or visit the SEC website at sec.gov. The Funds file their complete schedule of portfolio holdings with the SEC for the first and third quarters of each fiscal year as an exhibit to their reports on Form N-PORT. The Funds’ portfolio holdings on Form N-PORT are available on the SEC’s website at sec.gov and the Funds’ website at wealth.amg.com. To review a complete list of the Funds’ portfolio holdings, or to view the most recent semi-annual report or annual report, please visit wealth.amg.com. |
| | | | | | | | | |
| | | | | | | | |
EQUITY FUNDS AMG Boston Common Global Impact Boston Common Asset Management, LLC AMG Frontier Small Cap Growth Frontier Capital Management Co., LLC AMG GW&K Small Cap Core AMG GW&K Small Cap Value AMG GW&K Small/Mid Cap Core AMG GW&K Small/Mid Cap Growth AMG GW&K International Small Cap GW&K Investment Management, LLC AMG Montrusco Bolton Large Cap Growth Montrusco Bolton Investments, Inc. AMG Renaissance Large Cap Growth The Renaissance Group LLC | | | | AMG River Road Dividend All Cap Value AMG River Road Focused Absolute Value AMG River Road Large Cap Value Select AMG River Road Mid Cap Value AMG River Road Small-Mid Cap Value AMG River Road Small Cap Value River Road Asset Management, LLC AMG TimesSquare Emerging Markets Small Cap AMG TimesSquare Global Small Cap AMG TimesSquare International Small Cap AMG TimesSquare Mid Cap Growth AMG TimesSquare Small Cap Growth TimesSquare Capital Management, LLC AMG Veritas Asia Pacific AMG Veritas China AMG Veritas Global Focus AMG Veritas Global Real Return Veritas Asset Management LLP AMG Yacktman AMG Yacktman Focused AMG Yacktman Global AMG Yacktman Special Opportunities Yacktman Asset Management LP | | | | FIXED INCOME FUNDS AMG Beutel Goodman Core Plus Bond Beutel, Goodman & Company Ltd. AMG GW&K Core Bond ESG AMG GW&K ESG Bond AMG GW&K Municipal Bond AMG GW&K Municipal Enhanced Yield GW&K Investment Management, LLC ALTERNATIVE FUNDS AMG Systematica Managed Futures Strategy Systematica Investments Limited, acting as general partner of Systematica Investments LP |
| | | | | |
| | | | | | | | | |
| | | | | |
| | | | | | | | | |
| | | | | | | | | |
| | | | | | | | | |
| | | | | | | | | |
| | | | | | | | | |
| | | | | | | | | |
| | | | | | | | | |
| | | | | | | | | |
| | |
| | | |
| | |
| wealth.amg.com | | 063024 SAR088 |
Item 12. DISCLOSURE OF PROXY VOTING POLICIES AND PROCEDURES FOR CLOSED-END MANAGEMENT INVESTMENT COMPANIES.
Not applicable.
Item 13. PORTFOLIO MANAGERS OF CLOSED-END MANAGEMENT INVESTMENT COMPANIES.
Not applicable.
Item 14. PURCHASES OF EQUITY SECURITIES BY CLOSED-END MANAGEMENT INVESTMENT COMPANIES AND AFFILIATED PURCHASERS.
Not applicable.
Item 15. SUBMISSION OF MATTERS TO A VOTE OF SECURITY HOLDERS.
Not applicable.
Item 16. CONTROLS AND PROCEDURES.
(a) The Registrant’s principal executive and principal financial officers have concluded, based on their evaluation of the registrant’s disclosure controls and procedures as of a date within 90 days of the filing of this report, that the Registrant’s disclosure controls and procedures are reasonably designed to ensure that information required to be disclosed by the Registrant on Form N-CSR is recorded, processed, summarized and reported within the required time periods and that information required to be disclosed by the registrant in the reports that it files or submits on Form N-CSR is accumulated and communicated to the Registrant’s management, including its principal executive and principal financial officers, as appropriate to allow timely decisions regarding required disclosure.
(b) There were no changes in the Registrant’s internal control over financial reporting during the period covered by this report that have materially affected, or are reasonably likely to materially affect, the internal control over financial reporting.
Item 17. DISCLOSURE OF SECURITIES LENDING ACTIVITIES FOR CLOSED-END MANAGEMENT INVESTMENT COMPANIES.
Not applicable.
Item 18. RECOVERY OF ERRONEOUSLY AWARDED COMPENSATION.
Not applicable.
Item 19. EXHIBITS
SIGNATURES
Pursuant to the requirements of the Securities Exchange Act of 1934 and the Investment Company Act of 1940, the registrant has duly caused this report to be signed on its behalf by the undersigned, thereunto duly authorized.
| | |
| AMG FUNDS III |
| |
| By: | | /s/ Keitha L. Kinne |
| | Keitha L. Kinne, Principal Executive Officer |
| |
| Date: | | September 9, 2024 |
Pursuant to the requirements of the Securities Exchange Act of 1934 and the Investment Company Act of 1940, this report has been signed below by the following persons on behalf of the registrant and in the capacities and on the dates indicated.
| | |
| By: | | /s/ Keitha L. Kinne |
| | Keitha L. Kinne, Principal Executive Officer |
| |
| Date: | | September 9, 2024 |
| |
| By: | | /s/ Thomas Disbrow |
| | Thomas Disbrow, Principal Financial Officer |
| |
| Date: | | September 9, 2024 |