0000720318fmr:C000021092_ClassMember_AsOf_2014Member2014-12-31
UNITED STATES
SECURITIES AND EXCHANGE COMMISSION
Washington, D.C. 20549
FORM N-CSR
CERTIFIED SHAREHOLDER REPORT OF REGISTERED
MANAGEMENT INVESTMENT COMPANIES
Investment Company Act file number 811-03759
Variable Insurance Products Fund IV
(Exact name of registrant as specified in charter)
245 Summer St., Boston, Massachusetts 02210
(Address of principal executive offices) (Zip code)
Nicole Macarchuk, Secretary
245 Summer St.
Boston, Massachusetts 02210
(Name and address of agent for service)
Registrant's telephone number, including area code:
617-563-7000
| |
Date of fiscal year end: | December 31 |
|
|
Date of reporting period: | December 31, 2024 |
Item 1.
Reports to Stockholders
| |
| | ANNUAL SHAREHOLDER REPORT | AS OF DECEMBER 31, 2024 | This report describes changes to the Fund that occurred during the reporting period. |
| | VIP Materials Portfolio VIP Materials Portfolio Investor Class true |
| | | |
This annual shareholder report contains information about VIP Materials Portfolio for the period January 1, 2024 to December 31, 2024. You can find additional information about the Fund at fundresearch.fidelity.com/prospectus/sec. You can also request this information by contacting us at 1-877-208-0098 or by sending an e-mail to funddocuments@fmr.com.
What were your Fund costs for the last year?(based on hypothetical $10,000 investment)
FUND COST (PREVIOUS YEAR)
| | Costs of a $10,000 investment | Costs paid as a percentage of a $10,000 investment | |
| Investor Class | $ 74 | 0.75% | |
What affected the Fund's performance this period?
•U.S. equities gained in 2024, driven by a sturdy economy, the Federal Reserve's long-anticipated pivot to cutting interest rates and the potential for artificial intelligence to drive transformative change.
•Against this backdrop, market selection was the primary detractor from the fund's performance versus the MSCI US IMI Materials 25/50 Linked Index for the fiscal year, especially an overweight in diversified chemicals. Also hurting our result were picks and an overweight in commodity chemicals and stock choices and an underweight in construction materials.
•The biggest individual relative detractor was an overweight in Chemours (-44%). The stock was among our largest holdings this period. The second-biggest relative detractor was an overweight in Dow (-22%). The company was one of the fund's largest holdings this period. Another notable relative detractor was an underweight in Sherwin Williams (+10%). This period we decreased our investment in Sherwin Williams.
•In contrast, the biggest contributor to performance versus the sector index was stock selection in diversified metals & mining. Stock picks in copper also boosted relative performance. Also contributing to our result were stock selection and an underweight in specialty chemicals.
•The top individual relative contributor was our non-index stake in First Quantum Minerals (+59%). The second-largest relative contributor was an underweight in Celanese (-55%). The stock was not held at period end. Another notable relative contributor was an overweight in AptarGroup (+29%). The stock was among the fund's biggest holdings at year-end.
•Notable changes in positioning include higher allocations to the paper & plastic packaging products & materials and construction materials industries.
How did the Fund perform over the past 10 years?
CUMULATIVE PERFORMANCE
December 31, 2014 through December 31, 2024.
Initial investment of $10,000.
Investor Class | $10,000 | $9,091 | $10,187 | $12,838 | $9,802 | $11,095 | $13,476 | $17,977 | $16,195 | $17,422 | $16,979 |
MSCI U.S. IMI Materials 25-50 Index | $10,000 | $8,994 | $10,930 | $13,508 | $11,169 | $13,827 | $16,529 | $21,057 | $18,599 | $21,165 | $21,280 |
S&P 500® Index | $10,000 | $10,138 | $11,351 | $13,829 | $13,223 | $17,386 | $20,585 | $26,494 | $21,696 | $27,399 | $34,254 |
| | 2014 | 2015 | 2016 | 2017 | 2018 | 2019 | 2020 | 2021 | 2022 | 2023 | 2024 |
AVERAGE ANNUAL TOTAL RETURNS:| | 1 Year | 5 Year | 10 Year |
| Investor Class | -2.54% | 8.88% | 5.44% |
| MSCI U.S. IMI Materials 25-50 Index | 0.54% | 9.01% | 7.84% |
| S&P 500® Index | 25.02% | 14.53% | 13.10% |
Visit institutional.fidelity.com for more recent performance information. |
The Fund's past performance is not a good predictor of the Fund's future performance. The graph and table do not reflect the deduction of taxes that a shareholder would pay on fund distributions or redemption of fund shares. |
Key Fund Statistics(as of December 31, 2024)
KEY FACTS | | |
| Fund Size | $62,137,292 | |
| Number of Holdings | 42 | |
| Total Advisory Fee | $474,884 | |
| Portfolio Turnover | 84% | |
What did the Fund invest in?
(as of December 31, 2024)
TOP INDUSTRIES (% of Fund's net assets) |
| Chemicals | 56.4 | |
| Metals & Mining | 21.3 | |
| Containers & Packaging | 12.4 | |
| Construction Materials | 9.2 | |
| Paper & Forest Products | 0.2 | |
| |
| Common Stocks | 99.5 |
| Short-Term Investments and Net Other Assets (Liabilities) | 0.5 |
ASSET ALLOCATION (% of Fund's net assets) |
|
| | Common Stocks - 99.5 |
| | Short-Term Investments and Net Other Assets (Liabilities) - 0.5 |
| |
| United States | 88.8 |
| Canada | 3.7 |
| Zambia | 2.6 |
| Brazil | 2.4 |
| Congo Democratic Republic Of | 2.2 |
| Germany | 0.3 |
GEOGRAPHIC DIVERSIFICATION (% of Fund's net assets) |
|
| | United States - 88.8 |
| | Canada - 3.7 |
| | Zambia - 2.6 |
| | Brazil - 2.4 |
| | Congo Democratic Republic Of - 2.2 |
| | Germany - 0.3 |
| |
TOP HOLDINGS(% of Fund's net assets) | | |
| Linde PLC | 16.9 | |
| Ecolab Inc | 8.4 | |
| Air Products and Chemicals Inc | 6.3 | |
| Corteva Inc | 4.1 | |
| International Paper Co | 3.9 | |
| AptarGroup Inc | 3.7 | |
| CRH PLC | 3.2 | |
| Axalta Coating Systems Ltd | 3.1 | |
| Martin Marietta Materials Inc | 3.1 | |
| Vulcan Materials Co | 2.9 | |
| | 55.6 | |
How has the Fund changed?
This is a summary of certain changes to the Fund since January 1, 2024. For more complete information, you may review the Fund's next prospectus, which we expect to be available by April 30, 2025 at fundresearch.fidelity.com/prospectus/sec or upon request at 1-877-208-0098 or by sending an e-mail to funddocuments@fmr.com.
The fund's transfer agent and pricing & bookkeeping fees were changed to a fixed rate effective December 1, 2023. Effective March 1, 2024, the fund's management contract was amended to incorporate administrative services previously covered under separate services agreements (transfer agent and pricing & bookkeeping). The amended contract incorporates a basic fee rate that may vary by class (subject to a performance adjustment). The Adviser or an affiliate pays certain expenses of managing and operating the fund out of each class's management fee. | |
| Fidelity, the Fidelity Investments Logo and all other Fidelity trademarks or service marks used herein are trademarks or service marks of FMR LLC. Any third-party marks that are used herein are trademarks or service marks of their respective owners. © 2025 FMR LLC. All rights reserved. |
| | For additional information about the Fund; including its prospectus, financial information, holdings and proxy information, scan the QR code or visit fundresearch.fidelity.com/prospectus/sec 1.9914320.100 1842-TSRA-0325 |
| |
| | ANNUAL SHAREHOLDER REPORT | AS OF DECEMBER 31, 2024 | This report describes changes to the Fund that occurred during the reporting period. |
| | VIP Communication Services Portfolio VIP Communication Services Portfolio Investor Class true |
| | | |
This annual shareholder report contains information about VIP Communication Services Portfolio for the period January 1, 2024 to December 31, 2024. You can find additional information about the Fund at fundresearch.fidelity.com/prospectus/sec. You can also request this information by contacting us at 1-877-208-0098 or by sending an e-mail to funddocuments@fmr.com.
What were your Fund costs for the last year?(based on hypothetical $10,000 investment)
FUND COST (PREVIOUS YEAR)
| | Costs of a $10,000 investment | Costs paid as a percentage of a $10,000 investment | |
| Investor Class | $ 81 | 0.69% | |
What affected the Fund's performance this period?
•U.S. equities gained in 2024, driven by a sturdy economy, the Federal Reserve's long-anticipated pivot to cutting interest rates and the potential for artificial intelligence to drive transformative change.
•Against this backdrop, security selection contributed to the fund's performance versus the MSCI U.S. IMI Communication Services 25/50 Index for the fiscal year, led by interactive media & services. An overweight in alternative carriers also boosted relative performance. Also bolstering our relative result were picks in interactive home entertainment.
•The top individual relative contributor was an overweight in Meta Platforms (+66%). We trimmed the position, but the company was among the fund's biggest holdings this period. A non-index stake in Sea gained about 159% and was a second notable relative contributor. This period we decreased our stake in Sea. Another notable relative contributor was an underweight in Comcast (-12%). We reduced our stake in Comcast this period.
•In contrast, the biggest detractor from performance versus the sector index was stock selection in alternative carriers. An underweight in wireless telecommunication services also hampered the fund's result. Also hurting our result were stock picks in passenger ground transportation.
•The largest individual relative detractor was an overweight in Snap (-36%). The second-largest relative detractor was our stake in Charter Communications (-10%). This period we decreased our stake in Charter Communications. Another notable relative detractor was our stake in Trade Desk (-11%). This was a stake we established this period. The company was one of our largest holdings at period end.
•Notable changes in positioning include increased exposure to the interactive home entertainment industry and a lower allocation to cable & satellite.
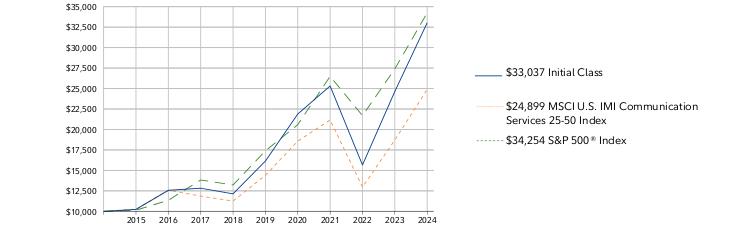
How did the Fund perform over the past 10 years?
CUMULATIVE PERFORMANCE
December 31, 2014 through December 31, 2024.
Initial investment of $10,000.
Investor Class | $10,000 | $10,238 | $12,562 | $12,799 | $12,109 | $16,100 | $21,799 | $25,199 | $15,580 | $24,499 | $32,803 |
MSCI U.S. IMI Communication Services 25-50 Index | $10,000 | $10,273 | $12,579 | $11,860 | $11,255 | $14,400 | $18,578 | $21,154 | $12,959 | $18,713 | $24,899 |
S&P 500® Index | $10,000 | $10,138 | $11,351 | $13,829 | $13,223 | $17,386 | $20,585 | $26,494 | $21,696 | $27,399 | $34,254 |
| | 2014 | 2015 | 2016 | 2017 | 2018 | 2019 | 2020 | 2021 | 2022 | 2023 | 2024 |
AVERAGE ANNUAL TOTAL RETURNS:| | 1 Year | 5 Year | 10 Year |
| Investor Class | 33.89% | 15.30% | 12.61% |
| MSCI U.S. IMI Communication Services 25-50 Index | 33.06% | 11.57% | 9.55% |
| S&P 500® Index | 25.02% | 14.53% | 13.10% |
Visit institutional.fidelity.com for more recent performance information. |
The Fund's past performance is not a good predictor of the Fund's future performance. The graph and table do not reflect the deduction of taxes that a shareholder would pay on fund distributions or redemption of fund shares. |
Key Fund Statistics(as of December 31, 2024)
KEY FACTS | | |
| Fund Size | $237,361,314 | |
| Number of Holdings | 38 | |
| Total Advisory Fee | $1,373,959 | |
| Portfolio Turnover | 73% | |
What did the Fund invest in?
(as of December 31, 2024)
TOP INDUSTRIES (% of Fund's net assets) |
| Interactive Media & Services | 54.0 | |
| Entertainment | 25.2 | |
| Media | 6.8 | |
| Diversified Telecommunication Services | 6.3 | |
| Broadline Retail | 2.6 | |
| Semiconductors & Semiconductor Equipment | 1.5 | |
| Software | 1.2 | |
| Capital Markets | 1.0 | |
| Automobiles | 0.1 | |
| |
| Common Stocks | 98.6 |
| Preferred Stocks | 0.1 |
| Short-Term Investments and Net Other Assets (Liabilities) | 1.3 |
ASSET ALLOCATION (% of Fund's net assets) |
|
| | Common Stocks - 98.6 |
| | Preferred Stocks - 0.1 |
| | Short-Term Investments and Net Other Assets (Liabilities) - 1.3 |
| |
| United States | 97.5 |
| Japan | 0.7 |
| Singapore | 0.7 |
| Taiwan | 0.6 |
| United Kingdom | 0.5 |
GEOGRAPHIC DIVERSIFICATION (% of Fund's net assets) |
|
| | United States - 97.5 |
| | Japan - 0.7 |
| | Singapore - 0.7 |
| | Taiwan - 0.6 |
| | United Kingdom - 0.5 |
| |
TOP HOLDINGS(% of Fund's net assets) | | |
| Alphabet Inc Class A | 25.0 | |
| Meta Platforms Inc Class A | 24.2 | |
| Walt Disney Co/The | 5.0 | |
| Netflix Inc | 4.8 | |
| AT&T Inc | 4.5 | |
| Trade Desk Inc (The) Class A | 2.7 | |
| Amazon.com Inc | 2.6 | |
| Warner Bros Discovery Inc | 2.3 | |
| Take-Two Interactive Software Inc | 2.3 | |
| ROBLOX Corp Class A | 2.3 | |
| | 75.7 | |
How has the Fund changed?
This is a summary of certain changes to the Fund since January 1, 2024. For more complete information, you may review the Fund's next prospectus, which we expect to be available by April 30, 2025 at fundresearch.fidelity.com/prospectus/sec or upon request at 1-877-208-0098 or by sending an e-mail to funddocuments@fmr.com.
The fees associated with this class changed during the reporting year. The variations in class fees are primarily the result of the following changes:- Management fee
- Operating expenses
The fund's transfer agent and pricing & bookkeeping fees were changed to a fixed rate effective December 1, 2023. Effective March 1, 2024, the fund's management contract was amended to incorporate administrative services previously covered under separate services agreements (transfer agent and pricing & bookkeeping). The amended contract incorporates a management fee rate that may vary by class. The Adviser or an affiliate pays certain expenses of managing and operating the fund out of each class's management fee. | |
| Fidelity, the Fidelity Investments Logo and all other Fidelity trademarks or service marks used herein are trademarks or service marks of FMR LLC. Any third-party marks that are used herein are trademarks or service marks of their respective owners. © 2025 FMR LLC. All rights reserved. |
| | For additional information about the Fund; including its prospectus, financial information, holdings and proxy information, scan the QR code or visit fundresearch.fidelity.com/prospectus/sec 1.9914322.100 1844-TSRA-0325 |
| |
| | ANNUAL SHAREHOLDER REPORT | AS OF DECEMBER 31, 2024 | This report describes changes to the Fund that occurred during the reporting period. |
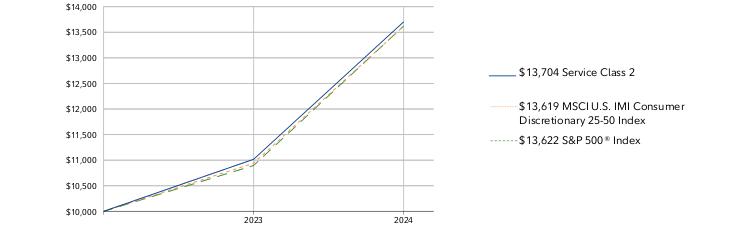
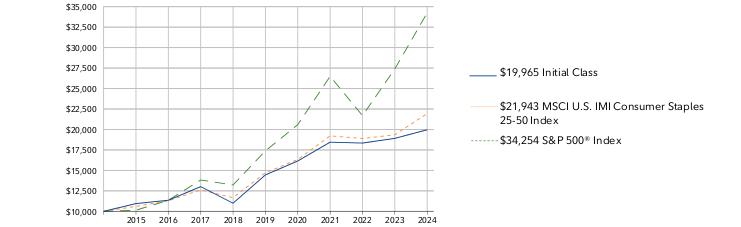
| | VIP Consumer Staples Portfolio VIP Consumer Staples Portfolio Service Class 2 true |
| | | |
This annual shareholder report contains information about VIP Consumer Staples Portfolio for the period January 1, 2024 to December 31, 2024. You can find additional information about the Fund at fundresearch.fidelity.com/prospectus/sec. You can also request this information by contacting us at 1-877-208-0098 or by sending an e-mail to funddocuments@fmr.com.
What were your Fund costs for the last year?(based on hypothetical $10,000 investment)
FUND COST (PREVIOUS YEAR)
| | Costs of a $10,000 investment | Costs paid as a percentage of a $10,000 investment | |
| Service Class 2 | $ 90 | 0.88% | |
What affected the Fund's performance this period?
•U.S. equities gained in 2024, driven by a sturdy economy, the Federal Reserve's long-anticipated pivot to cutting interest rates and the potential for artificial intelligence to drive transformative change.
•Against this backdrop, market selection was the primary detractor from the fund's performance versus the MSCI US IMI Consumer Staples 25/50 Index for the fiscal year, especially an underweight in consumer staples merchandise retail. Also hurting our result were overweights in personal care products and soft drinks & non-alcoholic beverages.
•The largest individual relative detractor this period was avoiding Costco Wholesale, an index component that gained approximately 40%. A second notable relative detractor was an underweight in Walmart (+74%). The stock was one of the fund's biggest holdings. Another notable relative detractor was an overweight in Estee Lauder (-48%). This period we increased our investment in Estee Lauder. The stock was among our largest holdings.
•In contrast, the primary contributor to performance versus the sector index was stock picking in soft drinks & non-alcoholic beverages. Stock selection in consumer staples merchandise retail and distillers & vintners also boosted the fund's relative performance.
•The top individual relative contributor was an underweight in Dollar General (-43%). The stock was not held at period end. The second-largest relative contributor was an underweight in PepsiCo (-8%). The stock was one of our largest holdings this period. Another notable relative contributor was an underweight in Dollar Tree (-47%). The stock was not held at period end.
•Notable changes in positioning include decreased exposure to the tobacco industry and a higher allocation to distillers & vintners.
How did the Fund perform over the life of Fund?
CUMULATIVE PERFORMANCE
August 16, 2023 through December 31, 2024.
Initial investment of $10,000.
Service Class 2 | $10,000 | $9,863 |
MSCI U.S. IMI Consumer Staples 25-50 Index | $10,000 | $10,027 |
S&P 500® Index | $10,000 | $10,896 |
| | 2023 | 2024 |
AVERAGE ANNUAL TOTAL RETURNS:| | 1 Year | Life of Fund A |
| Service Class 2 | 5.29% | 2.77% |
| MSCI U.S. IMI Consumer Staples 25-50 Index | 13.38% | 9.76% |
| S&P 500® Index | 25.02% | 25.15% |
A From August 16, 2023
Visit institutional.fidelity.com for more recent performance information. |
The Fund's past performance is not a good predictor of the Fund's future performance. The graph and table do not reflect the deduction of taxes that a shareholder would pay on fund distributions or redemption of fund shares. |
Key Fund Statistics(as of December 31, 2024)
KEY FACTS | | |
| Fund Size | $235,079,081 | |
| Number of Holdings | 31 | |
| Total Advisory Fee | $1,557,931 | |
| Portfolio Turnover | 46% | |
What did the Fund invest in?
(as of December 31, 2024)
TOP INDUSTRIES (% of Fund's net assets) |
| Beverages | 41.5 | |
| Household Products | 17.7 | |
| Food Products | 16.9 | |
| Consumer Staples Distribution & Retail | 13.5 | |
| Personal Care Products | 7.7 | |
| Tobacco | 2.7 | |
| |
| Common Stocks | 100.0 |
| Short-Term Investments and Net Other Assets (Liabilities) | 0.0 |
ASSET ALLOCATION (% of Fund's net assets) |
|
| | Common Stocks - 100.0 |
| | Short-Term Investments and Net Other Assets (Liabilities) - 0.0 |
| |
| United States | 96.2 |
| United Kingdom | 3.8 |
GEOGRAPHIC DIVERSIFICATION (% of Fund's net assets) |
|
| | United States - 96.2 |
| | United Kingdom - 3.8 |
| |
TOP HOLDINGS(% of Fund's net assets) | | |
| Procter & Gamble Co/The | 13.9 | |
| Coca-Cola Co/The | 13.1 | |
| Keurig Dr Pepper Inc | 10.3 | |
| Walmart Inc | 7.8 | |
| Constellation Brands Inc Class A | 4.8 | |
| Estee Lauder Cos Inc/The Class A | 4.4 | |
| Target Corp | 3.9 | |
| JM Smucker Co | 3.9 | |
| Monster Beverage Corp | 3.7 | |
| Energizer Holdings Inc | 3.5 | |
| | 69.3 | |
How has the Fund changed?
This is a summary of certain changes to the Fund since January 1, 2024. For more complete information, you may review the Fund's next prospectus, which we expect to be available by April 30, 2025 at fundresearch.fidelity.com/prospectus/sec or upon request at 1-877-208-0098 or by sending an e-mail to funddocuments@fmr.com.
The fund's transfer agent and pricing & bookkeeping fees were changed to a fixed rate effective December 1, 2023. Effective March 1, 2024, the fund's management contract was amended to incorporate administrative services previously covered under separate services agreements (transfer agent and pricing & bookkeeping). The amended contract incorporates a management fee rate that may vary by class. The Adviser or an affiliate pays certain expenses of managing and operating the fund out of each class's management fee. | |
| Fidelity, the Fidelity Investments Logo and all other Fidelity trademarks or service marks used herein are trademarks or service marks of FMR LLC. Any third-party marks that are used herein are trademarks or service marks of their respective owners. © 2025 FMR LLC. All rights reserved. |
| | For additional information about the Fund; including its prospectus, financial information, holdings and proxy information, scan the QR code or visit fundresearch.fidelity.com/prospectus/sec 1.9914318.100 7359-TSRA-0325 |
| |
| | ANNUAL SHAREHOLDER REPORT | AS OF DECEMBER 31, 2024 | This report describes changes to the Fund that occurred during the reporting period. |
| | VIP Real Estate Portfolio VIP Real Estate Portfolio Service Class 2 true |
| | | |
This annual shareholder report contains information about VIP Real Estate Portfolio for the period January 1, 2024 to December 31, 2024. You can find additional information about the Fund at fundresearch.fidelity.com/prospectus/sec. You can also request this information by contacting us at 1-877-208-0098 or by sending an e-mail to funddocuments@fmr.com.
What were your Fund costs for the last year?(based on hypothetical $10,000 investment)
FUND COST (PREVIOUS YEAR)
| | Costs of a $10,000 investment | Costs paid as a percentage of a $10,000 investment | |
| Service Class 2 | $ 89 | 0.86% | |
What affected the Fund's performance this period?
•U.S. equities gained in 2024, driven by a sturdy economy, the Federal Reserve's long-anticipated pivot to cutting interest rates and the potential for artificial intelligence to drive transformative change.
•Against this backdrop, security selection was the primary contributor to the fund's performance versus the MSCI US IMI Real Estate 25/50 Linked Index for the fiscal year, especially within the real estate services category. Security selection among health care REITs also boosted the fund's relative performance, as did an underweight in the timber industry.
•The top individual relative contributor was an overweight in CBRE (+41%), one of our biggest holdings. Outsized exposure to Ventas (+22%) helped as well. The company was one of our largest positions in 2024. An overweight in Equinix (+20%) further bolstered performance and was the fund's largest holding at period end.
•In contrast, the primary detractor from performance versus the real estate index was an overweight among industrial REITs. An underweight in the office segment also hampered the fund's result. Further detracting from our result were picks and an overweight in the single-family residential group.
•The biggest individual relative detractor this period was avoiding Iron Mountain, an index component that gained about 54%. Avoiding Simon Property Group, an index component that gained 27%, hurt as well. An overweight in Americold Realty Trust (-26%) also detracted. This period we decreased our position in Americold Realty Trust.
•Notable changes in positioning include increased exposure to the retail and real estate services industries.
How did the Fund perform over the past 10 years?
CUMULATIVE PERFORMANCE
December 31, 2014 through December 31, 2024.
Initial investment of $10,000.
Service Class 2 | $10,000 | $10,349 | $10,914 | $11,326 | $10,595 | $13,026 | $12,142 | $16,834 | $12,172 | $13,498 | $14,342 |
MSCI US IMI Real Estate 25/50 Linked Index | $10,000 | $10,446 | $11,140 | $11,560 | $11,072 | $13,630 | $11,714 | $16,465 | $12,164 | $13,619 | $14,307 |
S&P 500® Index | $10,000 | $10,138 | $11,351 | $13,829 | $13,223 | $17,386 | $20,585 | $26,494 | $21,696 | $27,399 | $34,254 |
| | 2014 | 2015 | 2016 | 2017 | 2018 | 2019 | 2020 | 2021 | 2022 | 2023 | 2024 |
AVERAGE ANNUAL TOTAL RETURNS:| | 1 Year | 5 Year | 10 Year |
| Service Class 2 | 6.25% | 1.94% | 3.67% |
| MSCI US IMI Real Estate 25/50 Linked Index | 5.05% | 0.97% | 3.65% |
| S&P 500® Index | 25.02% | 14.53% | 13.10% |
Visit institutional.fidelity.com for more recent performance information. |
The Fund's past performance is not a good predictor of the Fund's future performance. The graph and table do not reflect the deduction of taxes that a shareholder would pay on fund distributions or redemption of fund shares. |
Key Fund Statistics(as of December 31, 2024)
KEY FACTS | | |
| Fund Size | $357,298,750 | |
| Number of Holdings | 33 | |
| Total Advisory Fee | $2,164,560 | |
| Portfolio Turnover | 37% | |
What did the Fund invest in?
(as of December 31, 2024)
TOP INDUSTRIES (% of Fund's net assets) |
| Specialized REITs | 35.2 | |
| Residential REITs | 14.1 | |
| Retail REITs | 13.8 | |
| Industrial REITs | 12.1 | |
| Real Estate Management & Development | 10.3 | |
| Health Care REITs | 10.0 | |
| Office REITs | 1.9 | |
| Hotel & Resort REITs | 1.6 | |
| |
| Common Stocks | 99.0 |
| Short-Term Investments and Net Other Assets (Liabilities) | 1.0 |
ASSET ALLOCATION (% of Fund's net assets) |
|
| | Common Stocks - 99.0 |
| | Short-Term Investments and Net Other Assets (Liabilities) - 1.0 |
| |
GEOGRAPHIC DIVERSIFICATION (% of Fund's net assets) |
|
TOP HOLDINGS(% of Fund's net assets) | | |
| Equinix Inc | 9.8 | |
| Prologis Inc | 8.1 | |
| American Tower Corp | 7.0 | |
| CBRE Group Inc Class A | 6.6 | |
| Ventas Inc | 6.3 | |
| Public Storage Operating Co | 3.9 | |
| Crown Castle Inc | 3.8 | |
| Welltower Inc | 3.7 | |
| CubeSmart | 3.6 | |
| Sun Communities Inc | 3.3 | |
| | 56.1 | |
How has the Fund changed?
This is a summary of certain changes to the Fund since January 1, 2024. For more complete information, you may review the Fund's next prospectus, which we expect to be available by April 30, 2025 at fundresearch.fidelity.com/prospectus/sec or upon request at 1-877-208-0098 or by sending an e-mail to funddocuments@fmr.com.
The fund's transfer agent and pricing & bookkeeping fees were changed to a fixed rate effective December 1, 2023. Effective March 1, 2024, the fund's management contract was amended to incorporate administrative services previously covered under separate services agreements (transfer agent and pricing & bookkeeping). The amended contract incorporates a management fee rate that may vary by class. The Adviser or an affiliate pays certain expenses of managing and operating the fund out of each class's management fee. | |
| Fidelity, the Fidelity Investments Logo and all other Fidelity trademarks or service marks used herein are trademarks or service marks of FMR LLC. Any third-party marks that are used herein are trademarks or service marks of their respective owners. © 2025 FMR LLC. All rights reserved. |
| | For additional information about the Fund; including its prospectus, financial information, holdings and proxy information, scan the QR code or visit fundresearch.fidelity.com/prospectus/sec 1.9914248.100 1157-TSRA-0325 |
| |
| | ANNUAL SHAREHOLDER REPORT | AS OF DECEMBER 31, 2024 | This report describes changes to the Fund that occurred during the reporting period. |
| | VIP Energy Portfolio VIP Energy Portfolio Investor Class true |
| | | |
This annual shareholder report contains information about VIP Energy Portfolio for the period January 1, 2024 to December 31, 2024. You can find additional information about the Fund at fundresearch.fidelity.com/prospectus/sec. You can also request this information by contacting us at 1-877-208-0098 or by sending an e-mail to funddocuments@fmr.com.
What were your Fund costs for the last year?(based on hypothetical $10,000 investment)
FUND COST (PREVIOUS YEAR)
| | Costs of a $10,000 investment | Costs paid as a percentage of a $10,000 investment | |
| Investor Class | $ 69 | 0.68% | |
What affected the Fund's performance this period?
•U.S. equities gained in 2024, driven by a sturdy economy, the Federal Reserve's long-anticipated pivot to cutting interest rates and the potential for artificial intelligence to drive transformative change.
•Against this backdrop, industry positioning was the primary detractor from the fund's performance versus the MSCI U.S. IMI Energy 25/50 Index for the fiscal year, especially an underweight in oil & gas storage & transportation. Stock selection and an overweight in oil & gas drilling also hampered the fund's result. Also hurting our result were stock picks in integrated oil & gas.
•The largest individual relative detractor this period was avoiding Williams Companies, an index component that gained roughly 62%. Not owning Kinder Morgan, an index component that gained roughly 64%, was the second-largest relative detractor. Another notable relative detractor was an overweight in Valaris (-35%).
•In contrast, the biggest contributor to performance versus the sector index was security selection in independent power producers & energy traders, a group not part of the index. Picks in oil & gas refining & marketing and oil & gas equipment & services also boosted the fund's relative performance.
•The fund's non-index stake in Vistra gained approximately 260% and was the top individual relative contributor. A non-index stake in Energy Transfer gained roughly 54% and was a second notable relative contributor. The company was one of the fund's biggest holdings at period end. An overweight in TechnipFMC (+45%) also helped. The company was among our largest holdings at period end.
•Notable changes in positioning include increased exposure to the oil & gas storage & transportation industry and a lower allocation to oil & gas equipment & services.
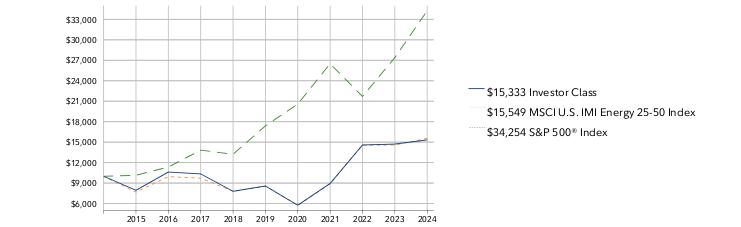
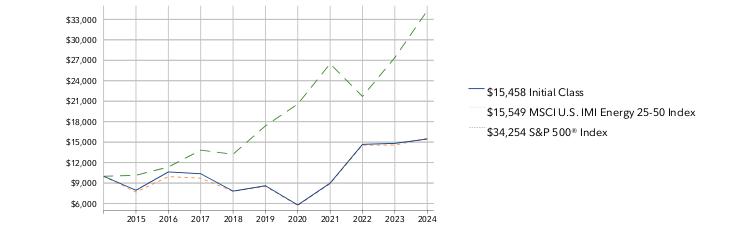
How did the Fund perform over the past 10 years?
CUMULATIVE PERFORMANCE
December 31, 2014 through December 31, 2024.
Initial investment of $10,000.
Investor Class | $10,000 | $7,942 | $10,618 | $10,346 | $7,795 | $8,574 | $5,761 | $8,939 | $14,582 | $14,715 | $15,333 |
MSCI U.S. IMI Energy 25-50 Index | $10,000 | $7,680 | $9,950 | $9,718 | $7,794 | $8,528 | $5,711 | $8,925 | $14,558 | $14,577 | $15,549 |
S&P 500® Index | $10,000 | $10,138 | $11,351 | $13,829 | $13,223 | $17,386 | $20,585 | $26,494 | $21,696 | $27,399 | $34,254 |
| | 2014 | 2015 | 2016 | 2017 | 2018 | 2019 | 2020 | 2021 | 2022 | 2023 | 2024 |
AVERAGE ANNUAL TOTAL RETURNS:| | 1 Year | 5 Year | 10 Year |
| Investor Class | 4.20% | 12.33% | 4.37% |
| MSCI U.S. IMI Energy 25-50 Index | 6.67% | 12.76% | 4.51% |
| S&P 500® Index | 25.02% | 14.53% | 13.10% |
Visit institutional.fidelity.com for more recent performance information. |
The Fund's past performance is not a good predictor of the Fund's future performance. The graph and table do not reflect the deduction of taxes that a shareholder would pay on fund distributions or redemption of fund shares. |
Key Fund Statistics(as of December 31, 2024)
KEY FACTS | | |
| Fund Size | $456,406,141 | |
| Number of Holdings | 38 | |
| Total Advisory Fee | $3,088,735 | |
| Portfolio Turnover | 17% | |
What did the Fund invest in?
(as of December 31, 2024)
TOP INDUSTRIES (% of Fund's net assets) |
| Oil, Gas & Consumable Fuels | 81.8 | |
| Energy Equipment & Services | 14.0 | |
| Independent Power and Renewable Electricity Producers | 2.7 | |
| Machinery | 1.2 | |
| |
| Common Stocks | 99.7 |
| Short-Term Investments and Net Other Assets (Liabilities) | 0.3 |
ASSET ALLOCATION (% of Fund's net assets) |
|
| | Common Stocks - 99.7 |
| | Short-Term Investments and Net Other Assets (Liabilities) - 0.3 |
| |
| United States | 84.1 |
| Canada | 11.9 |
| United Kingdom | 3.6 |
| Norway | 0.2 |
| France | 0.2 |
GEOGRAPHIC DIVERSIFICATION (% of Fund's net assets) |
|
| | United States - 84.1 |
| | Canada - 11.9 |
| | United Kingdom - 3.6 |
| | Norway - 0.2 |
| | France - 0.2 |
| |
TOP HOLDINGS(% of Fund's net assets) | | |
| Exxon Mobil Corp | 24.0 | |
| Cheniere Energy Inc | 5.6 | |
| Chevron Corp | 5.4 | |
| Cenovus Energy Inc | 5.3 | |
| Energy Transfer LP | 5.3 | |
| Canadian Natural Resources Ltd | 4.5 | |
| Schlumberger NV | 4.3 | |
| Marathon Petroleum Corp | 4.2 | |
| TechnipFMC PLC | 3.5 | |
| Occidental Petroleum Corp | 3.5 | |
| | 65.6 | |
How has the Fund changed?
This is a summary of certain changes to the Fund since January 1, 2024. For more complete information, you may review the Fund's next prospectus, which we expect to be available by April 30, 2025 at fundresearch.fidelity.com/prospectus/sec or upon request at 1-877-208-0098 or by sending an e-mail to funddocuments@fmr.com.
The fees associated with this class changed during the reporting year. The variations in class fees are primarily the result of the following changes:- Management fee
- Operating expenses
The fund's transfer agent and pricing & bookkeeping fees were changed to a fixed rate effective December 1, 2023. Effective March 1, 2024, the fund's management contract was amended to incorporate administrative services previously covered under separate services agreements (transfer agent and pricing & bookkeeping). The amended contract incorporates a management fee rate that may vary by class. The Adviser or an affiliate pays certain expenses of managing and operating the fund out of each class's management fee. | |
| Fidelity, the Fidelity Investments Logo and all other Fidelity trademarks or service marks used herein are trademarks or service marks of FMR LLC. Any third-party marks that are used herein are trademarks or service marks of their respective owners. © 2025 FMR LLC. All rights reserved. |
| | For additional information about the Fund; including its prospectus, financial information, holdings and proxy information, scan the QR code or visit fundresearch.fidelity.com/prospectus/sec 1.9914158.100 1478-TSRA-0325 |
| |
| | ANNUAL SHAREHOLDER REPORT | AS OF DECEMBER 31, 2024 | This report describes changes to the Fund that occurred during the reporting period. |
| | VIP Real Estate Portfolio VIP Real Estate Portfolio Investor Class true |
| | | |
This annual shareholder report contains information about VIP Real Estate Portfolio for the period January 1, 2024 to December 31, 2024. You can find additional information about the Fund at fundresearch.fidelity.com/prospectus/sec. You can also request this information by contacting us at 1-877-208-0098 or by sending an e-mail to funddocuments@fmr.com.
What were your Fund costs for the last year?(based on hypothetical $10,000 investment)
FUND COST (PREVIOUS YEAR)
| | Costs of a $10,000 investment | Costs paid as a percentage of a $10,000 investment | |
| Investor Class | $ 71 | 0.69% | |
What affected the Fund's performance this period?
•U.S. equities gained in 2024, driven by a sturdy economy, the Federal Reserve's long-anticipated pivot to cutting interest rates and the potential for artificial intelligence to drive transformative change.
•Against this backdrop, security selection was the primary contributor to the fund's performance versus the MSCI US IMI Real Estate 25/50 Linked Index for the fiscal year, especially within the real estate services category. Security selection among health care REITs also boosted the fund's relative performance, as did an underweight in the timber industry.
•The top individual relative contributor was an overweight in CBRE (+41%), one of our biggest holdings. Outsized exposure to Ventas (+22%) helped as well. The company was one of our largest positions in 2024. An overweight in Equinix (+20%) further bolstered performance and was the fund's largest holding at period end.
•In contrast, the primary detractor from performance versus the real estate index was an overweight among industrial REITs. An underweight in the office segment also hampered the fund's result. Further detracting from our result were picks and an overweight in the single-family residential group.
•The biggest individual relative detractor this period was avoiding Iron Mountain, an index component that gained about 54%. Avoiding Simon Property Group, an index component that gained 27%, hurt as well. An overweight in Americold Realty Trust (-26%) also detracted. This period we decreased our position in Americold Realty Trust.
•Notable changes in positioning include increased exposure to the retail and real estate services industries.
How did the Fund perform over the past 10 years?
CUMULATIVE PERFORMANCE
December 31, 2014 through December 31, 2024.
Initial investment of $10,000.
Investor Class | $10,000 | $10,364 | $10,949 | $11,386 | $10,665 | $13,134 | $12,266 | $17,039 | $12,339 | $13,711 | $14,588 |
MSCI US IMI Real Estate 25/50 Linked Index | $10,000 | $10,446 | $11,140 | $11,560 | $11,072 | $13,630 | $11,714 | $16,465 | $12,164 | $13,619 | $14,307 |
S&P 500® Index | $10,000 | $10,138 | $11,351 | $13,829 | $13,223 | $17,386 | $20,585 | $26,494 | $21,696 | $27,399 | $34,254 |
| | 2014 | 2015 | 2016 | 2017 | 2018 | 2019 | 2020 | 2021 | 2022 | 2023 | 2024 |
AVERAGE ANNUAL TOTAL RETURNS:| | 1 Year | 5 Year | 10 Year |
| Investor Class | 6.40% | 2.12% | 3.85% |
| MSCI US IMI Real Estate 25/50 Linked Index | 5.05% | 0.97% | 3.65% |
| S&P 500® Index | 25.02% | 14.53% | 13.10% |
Visit institutional.fidelity.com for more recent performance information. |
The Fund's past performance is not a good predictor of the Fund's future performance. The graph and table do not reflect the deduction of taxes that a shareholder would pay on fund distributions or redemption of fund shares. |
Key Fund Statistics(as of December 31, 2024)
KEY FACTS | | |
| Fund Size | $357,298,750 | |
| Number of Holdings | 33 | |
| Total Advisory Fee | $2,164,560 | |
| Portfolio Turnover | 37% | |
What did the Fund invest in?
(as of December 31, 2024)
TOP INDUSTRIES (% of Fund's net assets) |
| Specialized REITs | 35.2 | |
| Residential REITs | 14.1 | |
| Retail REITs | 13.8 | |
| Industrial REITs | 12.1 | |
| Real Estate Management & Development | 10.3 | |
| Health Care REITs | 10.0 | |
| Office REITs | 1.9 | |
| Hotel & Resort REITs | 1.6 | |
| |
| Common Stocks | 99.0 |
| Short-Term Investments and Net Other Assets (Liabilities) | 1.0 |
ASSET ALLOCATION (% of Fund's net assets) |
|
| | Common Stocks - 99.0 |
| | Short-Term Investments and Net Other Assets (Liabilities) - 1.0 |
| |
GEOGRAPHIC DIVERSIFICATION (% of Fund's net assets) |
|
TOP HOLDINGS(% of Fund's net assets) | | |
| Equinix Inc | 9.8 | |
| Prologis Inc | 8.1 | |
| American Tower Corp | 7.0 | |
| CBRE Group Inc Class A | 6.6 | |
| Ventas Inc | 6.3 | |
| Public Storage Operating Co | 3.9 | |
| Crown Castle Inc | 3.8 | |
| Welltower Inc | 3.7 | |
| CubeSmart | 3.6 | |
| Sun Communities Inc | 3.3 | |
| | 56.1 | |
How has the Fund changed?
This is a summary of certain changes to the Fund since January 1, 2024. For more complete information, you may review the Fund's next prospectus, which we expect to be available by April 30, 2025 at fundresearch.fidelity.com/prospectus/sec or upon request at 1-877-208-0098 or by sending an e-mail to funddocuments@fmr.com.
The fund's transfer agent and pricing & bookkeeping fees were changed to a fixed rate effective December 1, 2023. Effective March 1, 2024, the fund's management contract was amended to incorporate administrative services previously covered under separate services agreements (transfer agent and pricing & bookkeeping). The amended contract incorporates a management fee rate that may vary by class. The Adviser or an affiliate pays certain expenses of managing and operating the fund out of each class's management fee. | |
| Fidelity, the Fidelity Investments Logo and all other Fidelity trademarks or service marks used herein are trademarks or service marks of FMR LLC. Any third-party marks that are used herein are trademarks or service marks of their respective owners. © 2025 FMR LLC. All rights reserved. |
| | For additional information about the Fund; including its prospectus, financial information, holdings and proxy information, scan the QR code or visit fundresearch.fidelity.com/prospectus/sec 1.9914249.100 1469-TSRA-0325 |
| |
| | ANNUAL SHAREHOLDER REPORT | AS OF DECEMBER 31, 2024 | This report describes changes to the Fund that occurred during the reporting period. |
| | VIP Health Care Portfolio VIP Health Care Portfolio Service Class 2 true |
| | | |
This annual shareholder report contains information about VIP Health Care Portfolio for the period January 1, 2024 to December 31, 2024. You can find additional information about the Fund at fundresearch.fidelity.com/prospectus/sec. You can also request this information by contacting us at 1-877-208-0098 or by sending an e-mail to funddocuments@fmr.com.
What were your Fund costs for the last year?(based on hypothetical $10,000 investment)
FUND COST (PREVIOUS YEAR)
| | Costs of a $10,000 investment | Costs paid as a percentage of a $10,000 investment | |
| Service Class 2 | $ 87 | 0.85% | |
What affected the Fund's performance this period?
•U.S. equities gained in 2024, driven by a sturdy economy, the Federal Reserve's long-anticipated pivot to cutting interest rates and the potential for artificial intelligence to drive transformative change.
•Against this backdrop, security selection was the primary contributor to the fund's performance versus the MSCI U.S. IMI Health Care 25/50 Index for the fiscal year, especially within health care equipment. Stock selection in pharmaceuticals and managed health care also boosted the fund's relative performance.
•The top individual relative contributor was an overweight in Boston Scientific (+54%). The company was the fund's largest holding on average this period. The second-largest relative contributor was our non-index stake in Argenx (+61%). The stock was one of our largest holdings at period end. An overweight in Masimo (+41%) also contributed. The company was among the fund's largest holdings at period end.
•In contrast, the primary detractors from performance versus the sector index were stock picks and an overweight in health care services. Also hurting our result were stock choices in health care facilities and life sciences tools & services.
•The biggest individual relative detractor was an overweight in 10X Genomics (-74%). The second-largest relative detractor was our stake in agilon health (-84%). The stock was not held at period end. A non-index stake in Legend Biotech returned -46% and notably hurt. This period we increased our stake in Legend Biotech.
•Notable changes in positioning include decreased exposure to the health care services industry and a higher allocation to biotechnology.
How did the Fund perform over the life of Fund?
CUMULATIVE PERFORMANCE
April 11, 2019 through December 31, 2024.
Initial investment of $10,000.
Service Class 2 | $10,000 | $11,687 | $14,174 | $15,796 | $13,803 | $14,357 |
MSCI U.S. IMI Health Care 25-50 Index | $10,000 | $11,398 | $13,481 | $16,259 | $15,376 | $15,769 |
S&P 500® Index | $10,000 | $11,346 | $13,433 | $17,289 | $14,158 | $17,880 |
| | 2019 | 2020 | 2021 | 2022 | 2023 | 2024 |
AVERAGE ANNUAL TOTAL RETURNS:| | 1 Year | 5 Year | Life of Fund A |
| Service Class 2 | 4.86% | 5.19% | 7.40% |
| MSCI U.S. IMI Health Care 25-50 Index | 2.75% | 7.29% | 8.79% |
| S&P 500® Index | 25.02% | 14.53% | 15.07% |
A From April 11, 2019
Visit institutional.fidelity.com for more recent performance information. |
The Fund's past performance is not a good predictor of the Fund's future performance. The graph and table do not reflect the deduction of taxes that a shareholder would pay on fund distributions or redemption of fund shares. |
Key Fund Statistics(as of December 31, 2024)
KEY FACTS | | |
| Fund Size | $1,064,998,831 | |
| Number of Holdings | 112 | |
| Total Advisory Fee | $7,050,001 | |
| Portfolio Turnover | 44% | |
What did the Fund invest in?
(as of December 31, 2024)
TOP INDUSTRIES (% of Fund's net assets) |
| Health Care Equipment & Supplies | 30.3 | |
| Biotechnology | 24.7 | |
| Health Care Providers & Services | 20.7 | |
| Pharmaceuticals | 10.9 | |
| Life Sciences Tools & Services | 10.2 | |
| Health Care Technology | 2.4 | |
| Financial Services | 0.1 | |
| |
| Common Stocks | 97.6 |
| Preferred Stocks | 1.5 |
| Preferred Securities | 0.2 |
| Bonds | 0.0 |
| Short-Term Investments and Net Other Assets (Liabilities) | 0.7 |
ASSET ALLOCATION (% of Fund's net assets) |
|
| | Common Stocks - 97.6 |
| | Preferred Stocks - 1.5 |
| | Preferred Securities - 0.2 |
| | Bonds - 0.0 |
| | Short-Term Investments and Net Other Assets (Liabilities) - 0.7 |
| |
| United States | 91.5 |
| Netherlands | 3.6 |
| Belgium | 2.0 |
| Denmark | 1.4 |
| Canada | 0.9 |
| United Kingdom | 0.2 |
| Germany | 0.2 |
| Israel | 0.2 |
| China | 0.0 |
GEOGRAPHIC DIVERSIFICATION (% of Fund's net assets) |
|
| | United States - 91.5 |
| | Netherlands - 3.6 |
| | Belgium - 2.0 |
| | Denmark - 1.4 |
| | Canada - 0.9 |
| | United Kingdom - 0.2 |
| | Germany - 0.2 |
| | Israel - 0.2 |
| | China - 0.0 |
| |
TOP HOLDINGS(% of Fund's net assets) | | |
| UnitedHealth Group Inc | 11.2 | |
| Boston Scientific Corp | 10.8 | |
| Eli Lilly & Co | 5.9 | |
| Danaher Corp | 5.5 | |
| Penumbra Inc | 4.7 | |
| Insulet Corp | 3.5 | |
| Stryker Corp | 3.1 | |
| Masimo Corp | 3.1 | |
| Argenx SE ADR | 2.8 | |
| Thermo Fisher Scientific Inc | 2.1 | |
| | 52.7 | |
How has the Fund changed?
This is a summary of certain changes to the Fund since January 1, 2024. For more complete information, you may review the Fund's next prospectus, which we expect to be available by April 30, 2025 at fundresearch.fidelity.com/prospectus/sec or upon request at 1-877-208-0098 or by sending an e-mail to funddocuments@fmr.com.
The fund's transfer agent and pricing & bookkeeping fees were changed to a fixed rate effective December 1, 2023. Effective March 1, 2024, the fund's management contract was amended to incorporate administrative services previously covered under separate services agreements (transfer agent and pricing & bookkeeping). The amended contract incorporates a management fee rate that may vary by class. The Adviser or an affiliate pays certain expenses of managing and operating the fund out of each class's management fee. | |
| Fidelity, the Fidelity Investments Logo and all other Fidelity trademarks or service marks used herein are trademarks or service marks of FMR LLC. Any third-party marks that are used herein are trademarks or service marks of their respective owners. © 2025 FMR LLC. All rights reserved. |
| | For additional information about the Fund; including its prospectus, financial information, holdings and proxy information, scan the QR code or visit fundresearch.fidelity.com/prospectus/sec 1.9914160.100 1021-TSRA-0325 |
| |
| | ANNUAL SHAREHOLDER REPORT | AS OF DECEMBER 31, 2024 | This report describes changes to the Fund that occurred during the reporting period. |
| | VIP Health Care Portfolio VIP Health Care Portfolio Initial Class true |
| | | |
This annual shareholder report contains information about VIP Health Care Portfolio for the period January 1, 2024 to December 31, 2024. You can find additional information about the Fund at fundresearch.fidelity.com/prospectus/sec. You can also request this information by contacting us at 1-877-208-0098 or by sending an e-mail to funddocuments@fmr.com.
What were your Fund costs for the last year?(based on hypothetical $10,000 investment)
FUND COST (PREVIOUS YEAR)
| | Costs of a $10,000 investment | Costs paid as a percentage of a $10,000 investment | |
| Initial Class | $ 61 | 0.59% | |
What affected the Fund's performance this period?
•U.S. equities gained in 2024, driven by a sturdy economy, the Federal Reserve's long-anticipated pivot to cutting interest rates and the potential for artificial intelligence to drive transformative change.
•Against this backdrop, security selection was the primary contributor to the fund's performance versus the MSCI U.S. IMI Health Care 25/50 Index for the fiscal year, especially within health care equipment. Stock selection in pharmaceuticals and managed health care also boosted the fund's relative performance.
•The top individual relative contributor was an overweight in Boston Scientific (+54%). The company was the fund's largest holding on average this period. The second-largest relative contributor was our non-index stake in Argenx (+61%). The stock was one of our largest holdings at period end. An overweight in Masimo (+41%) also contributed. The company was among the fund's largest holdings at period end.
•In contrast, the primary detractors from performance versus the sector index were stock picks and an overweight in health care services. Also hurting our result were stock choices in health care facilities and life sciences tools & services.
•The biggest individual relative detractor was an overweight in 10X Genomics (-74%). The second-largest relative detractor was our stake in agilon health (-84%). The stock was not held at period end. A non-index stake in Legend Biotech returned -46% and notably hurt. This period we increased our stake in Legend Biotech.
•Notable changes in positioning include decreased exposure to the health care services industry and a higher allocation to biotechnology.
How did the Fund perform over the past 10 years?
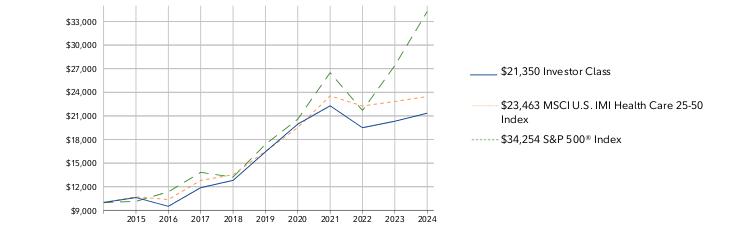
CUMULATIVE PERFORMANCE
December 31, 2014 through December 31, 2024.
Initial investment of $10,000.
Initial Class | $10,000 | $10,637 | $9,527 | $11,913 | $12,850 | $16,495 | $20,055 | $22,408 | $19,627 | $20,463 | $21,514 |
MSCI U.S. IMI Health Care 25-50 Index | $10,000 | $10,723 | $10,374 | $12,806 | $13,525 | $16,504 | $19,521 | $23,544 | $22,265 | $22,834 | $23,463 |
S&P 500® Index | $10,000 | $10,138 | $11,351 | $13,829 | $13,223 | $17,386 | $20,585 | $26,494 | $21,696 | $27,399 | $34,254 |
| | 2014 | 2015 | 2016 | 2017 | 2018 | 2019 | 2020 | 2021 | 2022 | 2023 | 2024 |
AVERAGE ANNUAL TOTAL RETURNS:| | 1 Year | 5 Year | 10 Year |
| Initial Class | 5.14% | 5.46% | 7.96% |
| MSCI U.S. IMI Health Care 25-50 Index | 2.75% | 7.29% | 8.90% |
| S&P 500® Index | 25.02% | 14.53% | 13.10% |
Visit institutional.fidelity.com for more recent performance information. |
The Fund's past performance is not a good predictor of the Fund's future performance. The graph and table do not reflect the deduction of taxes that a shareholder would pay on fund distributions or redemption of fund shares. |
Key Fund Statistics(as of December 31, 2024)
KEY FACTS | | |
| Fund Size | $1,064,998,831 | |
| Number of Holdings | 112 | |
| Total Advisory Fee | $7,050,001 | |
| Portfolio Turnover | 44% | |
What did the Fund invest in?
(as of December 31, 2024)
TOP INDUSTRIES (% of Fund's net assets) |
| Health Care Equipment & Supplies | 30.3 | |
| Biotechnology | 24.7 | |
| Health Care Providers & Services | 20.7 | |
| Pharmaceuticals | 10.9 | |
| Life Sciences Tools & Services | 10.2 | |
| Health Care Technology | 2.4 | |
| Financial Services | 0.1 | |
| |
| Common Stocks | 97.6 |
| Preferred Stocks | 1.5 |
| Preferred Securities | 0.2 |
| Bonds | 0.0 |
| Short-Term Investments and Net Other Assets (Liabilities) | 0.7 |
ASSET ALLOCATION (% of Fund's net assets) |
|
| | Common Stocks - 97.6 |
| | Preferred Stocks - 1.5 |
| | Preferred Securities - 0.2 |
| | Bonds - 0.0 |
| | Short-Term Investments and Net Other Assets (Liabilities) - 0.7 |
| |
| United States | 91.5 |
| Netherlands | 3.6 |
| Belgium | 2.0 |
| Denmark | 1.4 |
| Canada | 0.9 |
| United Kingdom | 0.2 |
| Germany | 0.2 |
| Israel | 0.2 |
| China | 0.0 |
GEOGRAPHIC DIVERSIFICATION (% of Fund's net assets) |
|
| | United States - 91.5 |
| | Netherlands - 3.6 |
| | Belgium - 2.0 |
| | Denmark - 1.4 |
| | Canada - 0.9 |
| | United Kingdom - 0.2 |
| | Germany - 0.2 |
| | Israel - 0.2 |
| | China - 0.0 |
| |
TOP HOLDINGS(% of Fund's net assets) | | |
| UnitedHealth Group Inc | 11.2 | |
| Boston Scientific Corp | 10.8 | |
| Eli Lilly & Co | 5.9 | |
| Danaher Corp | 5.5 | |
| Penumbra Inc | 4.7 | |
| Insulet Corp | 3.5 | |
| Stryker Corp | 3.1 | |
| Masimo Corp | 3.1 | |
| Argenx SE ADR | 2.8 | |
| Thermo Fisher Scientific Inc | 2.1 | |
| | 52.7 | |
How has the Fund changed?
This is a summary of certain changes to the Fund since January 1, 2024. For more complete information, you may review the Fund's next prospectus, which we expect to be available by April 30, 2025 at fundresearch.fidelity.com/prospectus/sec or upon request at 1-877-208-0098 or by sending an e-mail to funddocuments@fmr.com.
The fund's transfer agent and pricing & bookkeeping fees were changed to a fixed rate effective December 1, 2023. Effective March 1, 2024, the fund's management contract was amended to incorporate administrative services previously covered under separate services agreements (transfer agent and pricing & bookkeeping). The amended contract incorporates a management fee rate that may vary by class. The Adviser or an affiliate pays certain expenses of managing and operating the fund out of each class's management fee. | |
| Fidelity, the Fidelity Investments Logo and all other Fidelity trademarks or service marks used herein are trademarks or service marks of FMR LLC. Any third-party marks that are used herein are trademarks or service marks of their respective owners. © 2025 FMR LLC. All rights reserved. |
| | For additional information about the Fund; including its prospectus, financial information, holdings and proxy information, scan the QR code or visit fundresearch.fidelity.com/prospectus/sec 1.9914162.100 942-TSRA-0325 |
| |
| | ANNUAL SHAREHOLDER REPORT | AS OF DECEMBER 31, 2024 | This report describes changes to the Fund that occurred during the reporting period. |
| | VIP Materials Portfolio VIP Materials Portfolio Initial Class true |
| | | |
This annual shareholder report contains information about VIP Materials Portfolio for the period January 1, 2024 to December 31, 2024. You can find additional information about the Fund at fundresearch.fidelity.com/prospectus/sec. You can also request this information by contacting us at 1-877-208-0098 or by sending an e-mail to funddocuments@fmr.com.
What were your Fund costs for the last year?(based on hypothetical $10,000 investment)
FUND COST (PREVIOUS YEAR)
| | Costs of a $10,000 investment | Costs paid as a percentage of a $10,000 investment | |
| Initial Class | $ 66 | 0.67% | |
What affected the Fund's performance this period?
•U.S. equities gained in 2024, driven by a sturdy economy, the Federal Reserve's long-anticipated pivot to cutting interest rates and the potential for artificial intelligence to drive transformative change.
•Against this backdrop, market selection was the primary detractor from the fund's performance versus the MSCI US IMI Materials 25/50 Linked Index for the fiscal year, especially an overweight in diversified chemicals. Also hurting our result were picks and an overweight in commodity chemicals and stock choices and an underweight in construction materials.
•The biggest individual relative detractor was an overweight in Chemours (-44%). The stock was among our largest holdings this period. The second-biggest relative detractor was an overweight in Dow (-22%). The company was one of the fund's largest holdings this period. Another notable relative detractor was an underweight in Sherwin Williams (+10%). This period we decreased our investment in Sherwin Williams.
•In contrast, the biggest contributor to performance versus the sector index was stock selection in diversified metals & mining. Stock picks in copper also boosted relative performance. Also contributing to our result were stock selection and an underweight in specialty chemicals.
•The top individual relative contributor was our non-index stake in First Quantum Minerals (+59%). The second-largest relative contributor was an underweight in Celanese (-55%). The stock was not held at period end. Another notable relative contributor was an overweight in AptarGroup (+29%). The stock was among the fund's biggest holdings at year-end.
•Notable changes in positioning include higher allocations to the paper & plastic packaging products & materials and construction materials industries.
How did the Fund perform over the past 10 years?
CUMULATIVE PERFORMANCE
December 31, 2014 through December 31, 2024.
Initial investment of $10,000.
Initial Class | $10,000 | $9,099 | $10,209 | $12,871 | $9,833 | $11,150 | $13,546 | $18,074 | $16,305 | $17,544 | $17,117 |
MSCI U.S. IMI Materials 25-50 Index | $10,000 | $8,994 | $10,930 | $13,508 | $11,169 | $13,827 | $16,529 | $21,057 | $18,599 | $21,165 | $21,280 |
S&P 500® Index | $10,000 | $10,138 | $11,351 | $13,829 | $13,223 | $17,386 | $20,585 | $26,494 | $21,696 | $27,399 | $34,254 |
| | 2014 | 2015 | 2016 | 2017 | 2018 | 2019 | 2020 | 2021 | 2022 | 2023 | 2024 |
AVERAGE ANNUAL TOTAL RETURNS:| | 1 Year | 5 Year | 10 Year |
| Initial Class | -2.44% | 8.95% | 5.52% |
| MSCI U.S. IMI Materials 25-50 Index | 0.54% | 9.01% | 7.84% |
| S&P 500® Index | 25.02% | 14.53% | 13.10% |
Visit institutional.fidelity.com for more recent performance information. |
The Fund's past performance is not a good predictor of the Fund's future performance. The graph and table do not reflect the deduction of taxes that a shareholder would pay on fund distributions or redemption of fund shares. |
Key Fund Statistics(as of December 31, 2024)
KEY FACTS | | |
| Fund Size | $62,137,292 | |
| Number of Holdings | 42 | |
| Total Advisory Fee | $474,884 | |
| Portfolio Turnover | 84% | |
What did the Fund invest in?
(as of December 31, 2024)
TOP INDUSTRIES (% of Fund's net assets) |
| Chemicals | 56.4 | |
| Metals & Mining | 21.3 | |
| Containers & Packaging | 12.4 | |
| Construction Materials | 9.2 | |
| Paper & Forest Products | 0.2 | |
| |
| Common Stocks | 99.5 |
| Short-Term Investments and Net Other Assets (Liabilities) | 0.5 |
ASSET ALLOCATION (% of Fund's net assets) |
|
| | Common Stocks - 99.5 |
| | Short-Term Investments and Net Other Assets (Liabilities) - 0.5 |
| |
| United States | 88.8 |
| Canada | 3.7 |
| Zambia | 2.6 |
| Brazil | 2.4 |
| Congo Democratic Republic Of | 2.2 |
| Germany | 0.3 |
GEOGRAPHIC DIVERSIFICATION (% of Fund's net assets) |
|
| | United States - 88.8 |
| | Canada - 3.7 |
| | Zambia - 2.6 |
| | Brazil - 2.4 |
| | Congo Democratic Republic Of - 2.2 |
| | Germany - 0.3 |
| |
TOP HOLDINGS(% of Fund's net assets) | | |
| Linde PLC | 16.9 | |
| Ecolab Inc | 8.4 | |
| Air Products and Chemicals Inc | 6.3 | |
| Corteva Inc | 4.1 | |
| International Paper Co | 3.9 | |
| AptarGroup Inc | 3.7 | |
| CRH PLC | 3.2 | |
| Axalta Coating Systems Ltd | 3.1 | |
| Martin Marietta Materials Inc | 3.1 | |
| Vulcan Materials Co | 2.9 | |
| | 55.6 | |
How has the Fund changed?
This is a summary of certain changes to the Fund since January 1, 2024. For more complete information, you may review the Fund's next prospectus, which we expect to be available by April 30, 2025 at fundresearch.fidelity.com/prospectus/sec or upon request at 1-877-208-0098 or by sending an e-mail to funddocuments@fmr.com.
The fund's transfer agent and pricing & bookkeeping fees were changed to a fixed rate effective December 1, 2023. Effective March 1, 2024, the fund's management contract was amended to incorporate administrative services previously covered under separate services agreements (transfer agent and pricing & bookkeeping). The amended contract incorporates a basic fee rate that may vary by class (subject to a performance adjustment). The Adviser or an affiliate pays certain expenses of managing and operating the fund out of each class's management fee. | |
| Fidelity, the Fidelity Investments Logo and all other Fidelity trademarks or service marks used herein are trademarks or service marks of FMR LLC. Any third-party marks that are used herein are trademarks or service marks of their respective owners. © 2025 FMR LLC. All rights reserved. |
| | For additional information about the Fund; including its prospectus, financial information, holdings and proxy information, scan the QR code or visit fundresearch.fidelity.com/prospectus/sec 1.9914319.100 1841-TSRA-0325 |
| |
| | ANNUAL SHAREHOLDER REPORT | AS OF DECEMBER 31, 2024 | This report describes changes to the Fund that occurred during the reporting period. |
| | VIP Financials Portfolio VIP Financials Portfolio Initial Class true |
| | | |
This annual shareholder report contains information about VIP Financials Portfolio for the period January 1, 2024 to December 31, 2024. You can find additional information about the Fund at fundresearch.fidelity.com/prospectus/sec. You can also request this information by contacting us at 1-877-208-0098 or by sending an e-mail to funddocuments@fmr.com.
What were your Fund costs for the last year?(based on hypothetical $10,000 investment)
FUND COST (PREVIOUS YEAR)
| | Costs of a $10,000 investment | Costs paid as a percentage of a $10,000 investment | |
| Initial Class | $ 72 | 0.62% | |
What affected the Fund's performance this period?
•U.S. equities gained in 2024, driven by a sturdy economy, the Federal Reserve's long-anticipated pivot to cutting interest rates and the potential for artificial intelligence to drive transformative change.
•Against this backdrop, industry positioning was the primary contributor to the fund's performance versus the MSCI US IMI Financials 5% Capped Linked Index for the year, especially an overweight in diversified financial services. Stock picks among investment banking & brokerage firms and regional banks also boosted the fund's relative performance.
•The top individual relative contributor was an overweight in Apollo Global Management (+80%). The stock was among our biggest holdings. Outsized exposure to Baldwin Insurance Group (+62%) also helped. Another notable relative contributor was a larger-than-index stake in LPL Financial Holdings (+57%). This was a position we established this period and one of our largest holdings at the end of 2024.
•In contrast, the biggest detractor from performance versus the sector index was security selection in asset management & custody banks. Also hurting our result was stock picking in the financial exchanges & data and property & casualty insurance industries.
•Not owning JPMorgan Chase, an index component that gained roughly 44%, was the largest individual relative detractor. Avoiding American Express, an index component that gained about 60%, also hurt. An outsized allocation to MarketAxess Holdings (-22%) further detracted. This period we increased our stake in MarketAxess Holdings.
•Notable changes in positioning include increased exposure to the consumer finance and diversified financial services industries.
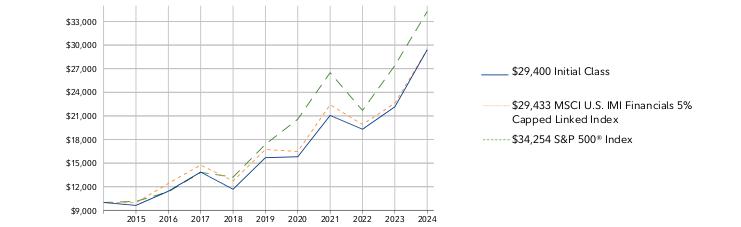
How did the Fund perform over the past 10 years?
CUMULATIVE PERFORMANCE
December 31, 2014 through December 31, 2024.
Initial investment of $10,000.
Initial Class | $10,000 | $9,631 | $11,433 | $13,863 | $11,682 | $15,693 | $15,813 | $21,061 | $19,307 | $22,151 | $29,400 |
MSCI U.S. IMI Financials 5% Capped Linked Index | $10,000 | $9,960 | $12,424 | $14,762 | $12,734 | $16,731 | $16,480 | $22,421 | $19,913 | $22,604 | $29,433 |
S&P 500® Index | $10,000 | $10,138 | $11,351 | $13,829 | $13,223 | $17,386 | $20,585 | $26,494 | $21,696 | $27,399 | $34,254 |
| | 2014 | 2015 | 2016 | 2017 | 2018 | 2019 | 2020 | 2021 | 2022 | 2023 | 2024 |
AVERAGE ANNUAL TOTAL RETURNS:| | 1 Year | 5 Year | 10 Year |
| Initial Class | 32.73% | 13.38% | 11.39% |
| MSCI U.S. IMI Financials 5% Capped Linked Index | 30.21% | 11.96% | 11.40% |
| S&P 500® Index | 25.02% | 14.53% | 13.10% |
Visit institutional.fidelity.com for more recent performance information. |
The Fund's past performance is not a good predictor of the Fund's future performance. The graph and table do not reflect the deduction of taxes that a shareholder would pay on fund distributions or redemption of fund shares. |
Key Fund Statistics(as of December 31, 2024)
KEY FACTS | | |
| Fund Size | $295,521,247 | |
| Number of Holdings | 68 | |
| Total Advisory Fee | $1,447,937 | |
| Portfolio Turnover | 37% | |
What did the Fund invest in?
(as of December 31, 2024)
TOP INDUSTRIES (% of Fund's net assets) |
| Banks | 31.4 | |
| Financial Services | 22.2 | |
| Capital Markets | 20.5 | |
| Insurance | 17.9 | |
| Consumer Finance | 6.8 | |
| Professional Services | 1.0 | |
| |
| Common Stocks | 99.8 |
| Short-Term Investments and Net Other Assets (Liabilities) | 0.2 |
ASSET ALLOCATION (% of Fund's net assets) |
|
| | Common Stocks - 99.8 |
| | Short-Term Investments and Net Other Assets (Liabilities) - 0.2 |
| |
| United States | 94.0 |
| United Kingdom | 3.6 |
| Puerto Rico | 1.5 |
| Grand Cayman (UK Overseas Ter) | 0.6 |
| Mexico | 0.3 |
GEOGRAPHIC DIVERSIFICATION (% of Fund's net assets) |
|
| | United States - 94.0 |
| | United Kingdom - 3.6 |
| | Puerto Rico - 1.5 |
| | Grand Cayman (UK Overseas Ter) - 0.6 |
| | Mexico - 0.3 |
| |
TOP HOLDINGS(% of Fund's net assets) | | |
| Mastercard Inc Class A | 8.8 | |
| Wells Fargo & Co | 6.1 | |
| Bank of America Corp | 5.0 | |
| Citigroup Inc | 4.1 | |
| Reinsurance Group of America Inc | 3.7 | |
| Apollo Global Management Inc | 3.3 | |
| Visa Inc Class A | 2.6 | |
| Morgan Stanley | 2.4 | |
| LPL Financial Holdings Inc | 2.3 | |
| Marsh & McLennan Cos Inc | 2.2 | |
| | 40.5 | |
How has the Fund changed?
This is a summary of certain changes to the Fund since January 1, 2024. For more complete information, you may review the Fund's next prospectus, which we expect to be available by April 30, 2025 at fundresearch.fidelity.com/prospectus/sec or upon request at 1-877-208-0098 or by sending an e-mail to funddocuments@fmr.com.
The fees associated with this class changed during the reporting year. The variations in class fees are primarily the result of the following changes:- Management fee
- Operating expenses
The fund's transfer agent and pricing & bookkeeping fees were changed to a fixed rate effective December 1, 2023. Effective March 1, 2024, the fund's management contract was amended to incorporate administrative services previously covered under separate services agreements (transfer agent and pricing & bookkeeping). The amended contract incorporates a management fee rate that may vary by class. The Adviser or an affiliate pays certain expenses of managing and operating the fund out of each class's management fee. | |
| Fidelity, the Fidelity Investments Logo and all other Fidelity trademarks or service marks used herein are trademarks or service marks of FMR LLC. Any third-party marks that are used herein are trademarks or service marks of their respective owners. © 2025 FMR LLC. All rights reserved. |
| | For additional information about the Fund; including its prospectus, financial information, holdings and proxy information, scan the QR code or visit fundresearch.fidelity.com/prospectus/sec 1.9914232.100 947-TSRA-0325 |
| |
| | ANNUAL SHAREHOLDER REPORT | AS OF DECEMBER 31, 2024 | This report describes changes to the Fund that occurred during the reporting period. |
| | VIP Utilities Portfolio VIP Utilities Portfolio Investor Class true |
| | | |
This annual shareholder report contains information about VIP Utilities Portfolio for the period January 1, 2024 to December 31, 2024. You can find additional information about the Fund at fundresearch.fidelity.com/prospectus/sec. You can also request this information by contacting us at 1-877-208-0098 or by sending an e-mail to funddocuments@fmr.com.
What were your Fund costs for the last year?(based on hypothetical $10,000 investment)
FUND COST (PREVIOUS YEAR)
| | Costs of a $10,000 investment | Costs paid as a percentage of a $10,000 investment | |
| Investor Class | $ 79 | 0.69% | |
What affected the Fund's performance this period?
•U.S. equities gained in 2024, driven by a sturdy economy, the Federal Reserve's long-anticipated pivot to cutting interest rates and the potential for artificial intelligence to drive transformative change.
•Against this backdrop, sector and industry positioning was the primary contributor to the fund's performance versus the MSCI U.S. IMI Utilities 25/50 Index for the fiscal year, led by an overweight in independent power producers & energy traders. Security selection in electric utilities also boosted the fund's relative performance. Also helping our relative result were stock picks and an underweight in multi-utilities.
•The top individual relative contributor was an overweight in Vistra (+262%). The stock was among our biggest holdings. The second-largest relative contributor was an overweight in Constellation Energy (+93%). The company was among the fund's biggest holdings. Another notable relative contributor was an overweight in Entergy (+55%). The company was one of the fund's largest holdings.
•In contrast, the biggest detractor from performance versus the sector index was stock picking in independent power producers & energy traders. Stock picking and an overweight in renewable electricity also hampered the fund's result. Also detracting from our result was security selection in coal & consumable fuels.
•The largest individual relative detractor was our stake in NextEra Energy Partners (-28%). The stock was not held at period end. The second-largest relative detractor was an overweight in AES (-30%). This period we increased our stake in AES. An overweight in Eversource Energy (-2%) also hurt. The company was one of the fund's largest holdings this period.
•Notable changes in positioning include higher allocations to the independent power producers & energy traders and multi-utilities industries.
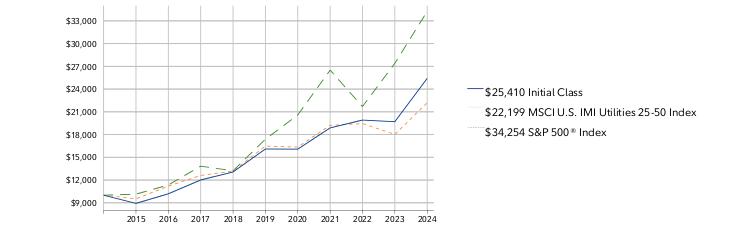
How did the Fund perform over the past 10 years?
CUMULATIVE PERFORMANCE
December 31, 2014 through December 31, 2024.
Initial investment of $10,000.
Investor Class | $10,000 | $8,920 | $10,172 | $11,986 | $13,024 | $16,037 | $16,005 | $18,775 | $19,786 | $19,564 | $25,216 |
MSCI U.S. IMI Utilities 25-50 Index | $10,000 | $9,520 | $11,197 | $12,606 | $13,178 | $16,477 | $16,356 | $19,214 | $19,452 | $18,019 | $22,199 |
S&P 500® Index | $10,000 | $10,138 | $11,351 | $13,829 | $13,223 | $17,386 | $20,585 | $26,494 | $21,696 | $27,399 | $34,254 |
| | 2014 | 2015 | 2016 | 2017 | 2018 | 2019 | 2020 | 2021 | 2022 | 2023 | 2024 |
AVERAGE ANNUAL TOTAL RETURNS:| | 1 Year | 5 Year | 10 Year |
| Investor Class | 28.89% | 9.47% | 9.69% |
| MSCI U.S. IMI Utilities 25-50 Index | 23.20% | 6.14% | 8.30% |
| S&P 500® Index | 25.02% | 14.53% | 13.10% |
Visit institutional.fidelity.com for more recent performance information. |
The Fund's past performance is not a good predictor of the Fund's future performance. The graph and table do not reflect the deduction of taxes that a shareholder would pay on fund distributions or redemption of fund shares. |
Key Fund Statistics(as of December 31, 2024)
KEY FACTS | | |
| Fund Size | $317,106,179 | |
| Number of Holdings | 32 | |
| Total Advisory Fee | $1,503,476 | |
| Portfolio Turnover | 77% | |
What did the Fund invest in?
(as of December 31, 2024)
TOP INDUSTRIES (% of Fund's net assets) |
| Electric Utilities | 61.3 | |
| Multi-Utilities | 23.1 | |
| Independent Power and Renewable Electricity Producers | 7.7 | |
| Gas Utilities | 1.8 | |
| Electrical Equipment | 1.3 | |
| Semiconductors & Semiconductor Equipment | 0.3 | |
| |
| Common Stocks | 95.5 |
| Short-Term Investments and Net Other Assets (Liabilities) | 4.5 |
ASSET ALLOCATION (% of Fund's net assets) |
|
| | Common Stocks - 95.5 |
| | Short-Term Investments and Net Other Assets (Liabilities) - 4.5 |
| |
GEOGRAPHIC DIVERSIFICATION (% of Fund's net assets) |
|
TOP HOLDINGS(% of Fund's net assets) | | |
| NextEra Energy Inc | 9.8 | |
| Duke Energy Corp | 7.3 | |
| Sempra | 6.8 | |
| Constellation Energy Corp | 5.9 | |
| PG&E Corp | 5.8 | |
| Vistra Corp | 5.0 | |
| Entergy Corp | 4.9 | |
| Public Service Enterprise Group Inc | 4.3 | |
| Ameren Corp | 4.3 | |
| Xcel Energy Inc | 4.2 | |
| | 58.3 | |
How has the Fund changed?
This is a summary of certain changes to the Fund since January 1, 2024. For more complete information, you may review the Fund's next prospectus, which we expect to be available by April 30, 2025 at fundresearch.fidelity.com/prospectus/sec or upon request at 1-877-208-0098 or by sending an e-mail to funddocuments@fmr.com.
The fund's transfer agent and pricing & bookkeeping fees were changed to a fixed rate effective December 1, 2023. Effective March 1, 2024, the fund's management contract was amended to incorporate administrative services previously covered under separate services agreements (transfer agent and pricing & bookkeeping). The amended contract incorporates a management fee rate that may vary by class. The Adviser or an affiliate pays certain expenses of managing and operating the fund out of each class's management fee. | |
| Fidelity, the Fidelity Investments Logo and all other Fidelity trademarks or service marks used herein are trademarks or service marks of FMR LLC. Any third-party marks that are used herein are trademarks or service marks of their respective owners. © 2025 FMR LLC. All rights reserved. |
| | For additional information about the Fund; including its prospectus, financial information, holdings and proxy information, scan the QR code or visit fundresearch.fidelity.com/prospectus/sec 1.9914174.100 1480-TSRA-0325 |
| |
| | ANNUAL SHAREHOLDER REPORT | AS OF DECEMBER 31, 2024 | This report describes changes to the Fund that occurred during the reporting period. |
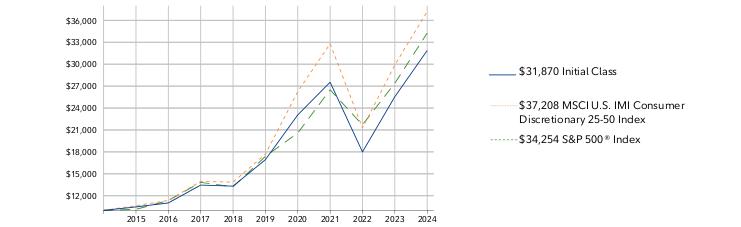
| | VIP Consumer Discretionary Portfolio VIP Consumer Discretionary Portfolio Initial Class true |
| | | |
This annual shareholder report contains information about VIP Consumer Discretionary Portfolio for the period January 1, 2024 to December 31, 2024. You can find additional information about the Fund at fundresearch.fidelity.com/prospectus/sec. You can also request this information by contacting us at 1-877-208-0098 or by sending an e-mail to funddocuments@fmr.com.
What were your Fund costs for the last year?(based on hypothetical $10,000 investment)
FUND COST (PREVIOUS YEAR)
| | Costs of a $10,000 investment | Costs paid as a percentage of a $10,000 investment | |
| Initial Class | $ 69 | 0.62% | |
What affected the Fund's performance this period?
•U.S. equities gained in 2024, driven by a sturdy economy, the Federal Reserve's long-anticipated pivot to cutting interest rates and the potential for artificial intelligence to drive transformative change.
•Against this backdrop, security selection was the primary contributor to the fund's performance versus the MSCI U.S. IMI Consumer Discretionary 25/50 Index for the fiscal year, led by choices in the footwear industry. Security selection in automobile manufacturers and the other specialty retail category also boosted the fund's relative performance.
•The top individual relative contributor was an overweight in Williams-Sonoma (+88%). A second notable relative contributor was an overweight in Dicks Sporting Goods (+58%). The stock was among our largest holdings. An overweight in Deckers Outdoor (+80%) also helped.
•In contrast, the biggest detractor from performance versus the sector index was an overweight in apparel, accessories & luxury goods. Stock picking and an overweight in automotive parts & equipment also hampered the fund's result. Also detracting from our result was an overweight in other specialty retail.
•The biggest individual relative detractor was our stake in Aptiv Irish Holdings (-35%). The stock was not held at period end. The second-largest relative detractor was our stake in lululemon athletica (-24%). This period we decreased our investment in lululemon athletica. Another notable relative detractor was our non-index stake in Dollar Tree (-48%).
•Notable changes in positioning include lower allocations to the apparel, accessories & luxury goods and footwear industries.
How did the Fund perform over the past 10 years?
CUMULATIVE PERFORMANCE
December 31, 2014 through December 31, 2024.
Initial investment of $10,000.
Initial Class | $10,000 | $10,471 | $11,019 | $13,461 | $13,315 | $16,936 | $23,058 | $27,533 | $17,998 | $25,555 | $31,870 |
MSCI U.S. IMI Consumer Discretionary 25-50 Index | $10,000 | $10,643 | $11,358 | $13,959 | $13,862 | $17,694 | $26,241 | $32,799 | $21,278 | $29,891 | $37,208 |
S&P 500® Index | $10,000 | $10,138 | $11,351 | $13,829 | $13,223 | $17,386 | $20,585 | $26,494 | $21,696 | $27,399 | $34,254 |
| | 2014 | 2015 | 2016 | 2017 | 2018 | 2019 | 2020 | 2021 | 2022 | 2023 | 2024 |
AVERAGE ANNUAL TOTAL RETURNS:| | 1 Year | 5 Year | 10 Year |
| Initial Class | 24.71% | 13.48% | 12.29% |
| MSCI U.S. IMI Consumer Discretionary 25-50 Index | 24.48% | 16.03% | 14.04% |
| S&P 500® Index | 25.02% | 14.53% | 13.10% |
Visit institutional.fidelity.com for more recent performance information. |
The Fund's past performance is not a good predictor of the Fund's future performance. The graph and table do not reflect the deduction of taxes that a shareholder would pay on fund distributions or redemption of fund shares. |
Key Fund Statistics(as of December 31, 2024)
KEY FACTS | | |
| Fund Size | $259,189,638 | |
| Number of Holdings | 58 | |
| Total Advisory Fee | $1,473,697 | |
| Portfolio Turnover | 25% | |
What did the Fund invest in?
(as of December 31, 2024)
TOP INDUSTRIES (% of Fund's net assets) |
| Broadline Retail | 25.9 | |
| Specialty Retail | 23.1 | |
| Automobiles | 18.2 | |
| Hotels, Restaurants & Leisure | 17.6 | |
| Textiles, Apparel & Luxury Goods | 6.1 | |
| Household Durables | 4.2 | |
| Automobile Components | 2.8 | |
| Building Products | 0.7 | |
| Consumer Staples Distribution & Retail | 0.6 | |
| |
| Common Stocks | 99.2 |
| Short-Term Investments and Net Other Assets (Liabilities) | 0.8 |
ASSET ALLOCATION (% of Fund's net assets) |
|
| | Common Stocks - 99.2 |
| | Short-Term Investments and Net Other Assets (Liabilities) - 0.8 |
| |
| United States | 94.7 |
| Bailiwick Of Jersey | 2.0 |
| Canada | 1.8 |
| Brazil | 0.7 |
| United Kingdom | 0.4 |
| Switzerland | 0.2 |
| France | 0.2 |
GEOGRAPHIC DIVERSIFICATION (% of Fund's net assets) |
|
| | United States - 94.7 |
| | Bailiwick Of Jersey - 2.0 |
| | Canada - 1.8 |
| | Brazil - 0.7 |
| | United Kingdom - 0.4 |
| | Switzerland - 0.2 |
| | France - 0.2 |
| |
TOP HOLDINGS(% of Fund's net assets) | | |
| Amazon.com Inc | 24.0 | |
| Tesla Inc | 16.8 | |
| Home Depot Inc/The | 4.4 | |
| Lowe's Cos Inc | 4.0 | |
| TJX Cos Inc/The | 2.5 | |
| Hilton Worldwide Holdings Inc | 2.4 | |
| McDonald's Corp | 2.3 | |
| Dick's Sporting Goods Inc | 2.3 | |
| Booking Holdings Inc | 2.2 | |
| Marriott International Inc/MD Class A1 | 1.9 | |
| | 62.8 | |
How has the Fund changed?
This is a summary of certain changes to the Fund since January 1, 2024. For more complete information, you may review the Fund's next prospectus, which we expect to be available by April 30, 2025 at fundresearch.fidelity.com/prospectus/sec or upon request at 1-877-208-0098 or by sending an e-mail to funddocuments@fmr.com.
The fund's transfer agent and pricing & bookkeeping fees were changed to a fixed rate effective December 1, 2023. Effective March 1, 2024, the fund's management contract was amended to incorporate administrative services previously covered under separate services agreements (transfer agent and pricing & bookkeeping). The amended contract incorporates a management fee rate that may vary by class. The Adviser or an affiliate pays certain expenses of managing and operating the fund out of each class's management fee. | |
| Fidelity, the Fidelity Investments Logo and all other Fidelity trademarks or service marks used herein are trademarks or service marks of FMR LLC. Any third-party marks that are used herein are trademarks or service marks of their respective owners. © 2025 FMR LLC. All rights reserved. |
| | For additional information about the Fund; including its prospectus, financial information, holdings and proxy information, scan the QR code or visit fundresearch.fidelity.com/prospectus/sec 1.9914237.100 991-TSRA-0325 |
| |
| | ANNUAL SHAREHOLDER REPORT | AS OF DECEMBER 31, 2024 | This report describes changes to the Fund that occurred during the reporting period. |
| | VIP Consumer Discretionary Portfolio VIP Consumer Discretionary Portfolio Service Class 2 true |
| | | |
This annual shareholder report contains information about VIP Consumer Discretionary Portfolio for the period January 1, 2024 to December 31, 2024. You can find additional information about the Fund at fundresearch.fidelity.com/prospectus/sec. You can also request this information by contacting us at 1-877-208-0098 or by sending an e-mail to funddocuments@fmr.com.
What were your Fund costs for the last year?(based on hypothetical $10,000 investment)
FUND COST (PREVIOUS YEAR)
| | Costs of a $10,000 investment | Costs paid as a percentage of a $10,000 investment | |
| Service Class 2 | $ 97 | 0.86% | |
What affected the Fund's performance this period?
•U.S. equities gained in 2024, driven by a sturdy economy, the Federal Reserve's long-anticipated pivot to cutting interest rates and the potential for artificial intelligence to drive transformative change.
•Against this backdrop, security selection was the primary contributor to the fund's performance versus the MSCI U.S. IMI Consumer Discretionary 25/50 Index for the fiscal year, led by choices in the footwear industry. Security selection in automobile manufacturers and the other specialty retail category also boosted the fund's relative performance.
•The top individual relative contributor was an overweight in Williams-Sonoma (+88%). A second notable relative contributor was an overweight in Dicks Sporting Goods (+58%). The stock was among our largest holdings. An overweight in Deckers Outdoor (+80%) also helped.
•In contrast, the biggest detractor from performance versus the sector index was an overweight in apparel, accessories & luxury goods. Stock picking and an overweight in automotive parts & equipment also hampered the fund's result. Also detracting from our result was an overweight in other specialty retail.
•The biggest individual relative detractor was our stake in Aptiv Irish Holdings (-35%). The stock was not held at period end. The second-largest relative detractor was our stake in lululemon athletica (-24%). This period we decreased our investment in lululemon athletica. Another notable relative detractor was our non-index stake in Dollar Tree (-48%).
•Notable changes in positioning include lower allocations to the apparel, accessories & luxury goods and footwear industries.
How did the Fund perform over the life of Fund?
CUMULATIVE PERFORMANCE
August 16, 2023 through December 31, 2024.
Initial investment of $10,000.
Service Class 2 | $10,000 | $11,018 |
MSCI U.S. IMI Consumer Discretionary 25-50 Index | $10,000 | $10,941 |
S&P 500® Index | $10,000 | $10,896 |
| | 2023 | 2024 |
AVERAGE ANNUAL TOTAL RETURNS:| | 1 Year | Life of Fund A |
| Service Class 2 | 24.38% | 25.69% |
| MSCI U.S. IMI Consumer Discretionary 25-50 Index | 24.48% | 25.13% |
| S&P 500® Index | 25.02% | 25.15% |
A From August 16, 2023
Visit institutional.fidelity.com for more recent performance information. |
The Fund's past performance is not a good predictor of the Fund's future performance. The graph and table do not reflect the deduction of taxes that a shareholder would pay on fund distributions or redemption of fund shares. |
Key Fund Statistics(as of December 31, 2024)
KEY FACTS | | |
| Fund Size | $259,189,638 | |
| Number of Holdings | 58 | |
| Total Advisory Fee | $1,473,697 | |
| Portfolio Turnover | 25% | |
What did the Fund invest in?
(as of December 31, 2024)
TOP INDUSTRIES (% of Fund's net assets) |
| Broadline Retail | 25.9 | |
| Specialty Retail | 23.1 | |
| Automobiles | 18.2 | |
| Hotels, Restaurants & Leisure | 17.6 | |
| Textiles, Apparel & Luxury Goods | 6.1 | |
| Household Durables | 4.2 | |
| Automobile Components | 2.8 | |
| Building Products | 0.7 | |
| Consumer Staples Distribution & Retail | 0.6 | |
| |
| Common Stocks | 99.2 |
| Short-Term Investments and Net Other Assets (Liabilities) | 0.8 |
ASSET ALLOCATION (% of Fund's net assets) |
|
| | Common Stocks - 99.2 |
| | Short-Term Investments and Net Other Assets (Liabilities) - 0.8 |
| |
| United States | 94.7 |
| Bailiwick Of Jersey | 2.0 |
| Canada | 1.8 |
| Brazil | 0.7 |
| United Kingdom | 0.4 |
| Switzerland | 0.2 |
| France | 0.2 |
GEOGRAPHIC DIVERSIFICATION (% of Fund's net assets) |
|
| | United States - 94.7 |
| | Bailiwick Of Jersey - 2.0 |
| | Canada - 1.8 |
| | Brazil - 0.7 |
| | United Kingdom - 0.4 |
| | Switzerland - 0.2 |
| | France - 0.2 |
| |
TOP HOLDINGS(% of Fund's net assets) | | |
| Amazon.com Inc | 24.0 | |
| Tesla Inc | 16.8 | |
| Home Depot Inc/The | 4.4 | |
| Lowe's Cos Inc | 4.0 | |
| TJX Cos Inc/The | 2.5 | |
| Hilton Worldwide Holdings Inc | 2.4 | |
| McDonald's Corp | 2.3 | |
| Dick's Sporting Goods Inc | 2.3 | |
| Booking Holdings Inc | 2.2 | |
| Marriott International Inc/MD Class A1 | 1.9 | |
| | 62.8 | |
How has the Fund changed?
This is a summary of certain changes to the Fund since January 1, 2024. For more complete information, you may review the Fund's next prospectus, which we expect to be available by April 30, 2025 at fundresearch.fidelity.com/prospectus/sec or upon request at 1-877-208-0098 or by sending an e-mail to funddocuments@fmr.com.
The fund's transfer agent and pricing & bookkeeping fees were changed to a fixed rate effective December 1, 2023. Effective March 1, 2024, the fund's management contract was amended to incorporate administrative services previously covered under separate services agreements (transfer agent and pricing & bookkeeping). The amended contract incorporates a management fee rate that may vary by class. The Adviser or an affiliate pays certain expenses of managing and operating the fund out of each class's management fee. | |
| Fidelity, the Fidelity Investments Logo and all other Fidelity trademarks or service marks used herein are trademarks or service marks of FMR LLC. Any third-party marks that are used herein are trademarks or service marks of their respective owners. © 2025 FMR LLC. All rights reserved. |
| | For additional information about the Fund; including its prospectus, financial information, holdings and proxy information, scan the QR code or visit fundresearch.fidelity.com/prospectus/sec 1.9914236.100 7358-TSRA-0325 |
| |
| | ANNUAL SHAREHOLDER REPORT | AS OF DECEMBER 31, 2024 | This report describes changes to the Fund that occurred during the reporting period. |
| | VIP Real Estate Portfolio VIP Real Estate Portfolio Service Class true |
| | | |
This annual shareholder report contains information about VIP Real Estate Portfolio for the period January 1, 2024 to December 31, 2024. You can find additional information about the Fund at fundresearch.fidelity.com/prospectus/sec. You can also request this information by contacting us at 1-877-208-0098 or by sending an e-mail to funddocuments@fmr.com.
What were your Fund costs for the last year?(based on hypothetical $10,000 investment)
FUND COST (PREVIOUS YEAR)
| | Costs of a $10,000 investment | Costs paid as a percentage of a $10,000 investment | |
| Service Class | $ 74 | 0.72% | |
What affected the Fund's performance this period?
•U.S. equities gained in 2024, driven by a sturdy economy, the Federal Reserve's long-anticipated pivot to cutting interest rates and the potential for artificial intelligence to drive transformative change.
•Against this backdrop, security selection was the primary contributor to the fund's performance versus the MSCI US IMI Real Estate 25/50 Linked Index for the fiscal year, especially within the real estate services category. Security selection among health care REITs also boosted the fund's relative performance, as did an underweight in the timber industry.
•The top individual relative contributor was an overweight in CBRE (+41%), one of our biggest holdings. Outsized exposure to Ventas (+22%) helped as well. The company was one of our largest positions in 2024. An overweight in Equinix (+20%) further bolstered performance and was the fund's largest holding at period end.
•In contrast, the primary detractor from performance versus the real estate index was an overweight among industrial REITs. An underweight in the office segment also hampered the fund's result. Further detracting from our result were picks and an overweight in the single-family residential group.
•The biggest individual relative detractor this period was avoiding Iron Mountain, an index component that gained about 54%. Avoiding Simon Property Group, an index component that gained 27%, hurt as well. An overweight in Americold Realty Trust (-26%) also detracted. This period we decreased our position in Americold Realty Trust.
•Notable changes in positioning include increased exposure to the retail and real estate services industries.
How did the Fund perform over the past 10 years?
CUMULATIVE PERFORMANCE
December 31, 2014 through December 31, 2024.
Initial investment of $10,000.
Service Class | $10,000 | $10,361 | $10,945 | $11,381 | $10,663 | $13,125 | $12,258 | $17,014 | $12,321 | $13,687 | $14,559 |
MSCI US IMI Real Estate 25/50 Linked Index | $10,000 | $10,446 | $11,140 | $11,560 | $11,072 | $13,630 | $11,714 | $16,465 | $12,164 | $13,619 | $14,307 |
S&P 500® Index | $10,000 | $10,138 | $11,351 | $13,829 | $13,223 | $17,386 | $20,585 | $26,494 | $21,696 | $27,399 | $34,254 |
| | 2014 | 2015 | 2016 | 2017 | 2018 | 2019 | 2020 | 2021 | 2022 | 2023 | 2024 |
AVERAGE ANNUAL TOTAL RETURNS:| | 1 Year | 5 Year | 10 Year |
| Service Class | 6.38% | 2.10% | 3.83% |
| MSCI US IMI Real Estate 25/50 Linked Index | 5.05% | 0.97% | 3.65% |
| S&P 500® Index | 25.02% | 14.53% | 13.10% |
Visit institutional.fidelity.com for more recent performance information. |
The Fund's past performance is not a good predictor of the Fund's future performance. The graph and table do not reflect the deduction of taxes that a shareholder would pay on fund distributions or redemption of fund shares. |
Key Fund Statistics(as of December 31, 2024)
KEY FACTS | | |
| Fund Size | $357,298,750 | |
| Number of Holdings | 33 | |
| Total Advisory Fee | $2,164,560 | |
| Portfolio Turnover | 37% | |
What did the Fund invest in?
(as of December 31, 2024)
TOP INDUSTRIES (% of Fund's net assets) |
| Specialized REITs | 35.2 | |
| Residential REITs | 14.1 | |
| Retail REITs | 13.8 | |
| Industrial REITs | 12.1 | |
| Real Estate Management & Development | 10.3 | |
| Health Care REITs | 10.0 | |
| Office REITs | 1.9 | |
| Hotel & Resort REITs | 1.6 | |
| |
| Common Stocks | 99.0 |
| Short-Term Investments and Net Other Assets (Liabilities) | 1.0 |
ASSET ALLOCATION (% of Fund's net assets) |
|
| | Common Stocks - 99.0 |
| | Short-Term Investments and Net Other Assets (Liabilities) - 1.0 |
| |
GEOGRAPHIC DIVERSIFICATION (% of Fund's net assets) |
|
TOP HOLDINGS(% of Fund's net assets) | | |
| Equinix Inc | 9.8 | |
| Prologis Inc | 8.1 | |
| American Tower Corp | 7.0 | |
| CBRE Group Inc Class A | 6.6 | |
| Ventas Inc | 6.3 | |
| Public Storage Operating Co | 3.9 | |
| Crown Castle Inc | 3.8 | |
| Welltower Inc | 3.7 | |
| CubeSmart | 3.6 | |
| Sun Communities Inc | 3.3 | |
| | 56.1 | |
How has the Fund changed?
This is a summary of certain changes to the Fund since January 1, 2024. For more complete information, you may review the Fund's next prospectus, which we expect to be available by April 30, 2025 at fundresearch.fidelity.com/prospectus/sec or upon request at 1-877-208-0098 or by sending an e-mail to funddocuments@fmr.com.
The fund's transfer agent and pricing & bookkeeping fees were changed to a fixed rate effective December 1, 2023. Effective March 1, 2024, the fund's management contract was amended to incorporate administrative services previously covered under separate services agreements (transfer agent and pricing & bookkeeping). The amended contract incorporates a management fee rate that may vary by class. The Adviser or an affiliate pays certain expenses of managing and operating the fund out of each class's management fee. | |
| Fidelity, the Fidelity Investments Logo and all other Fidelity trademarks or service marks used herein are trademarks or service marks of FMR LLC. Any third-party marks that are used herein are trademarks or service marks of their respective owners. © 2025 FMR LLC. All rights reserved. |
| | For additional information about the Fund; including its prospectus, financial information, holdings and proxy information, scan the QR code or visit fundresearch.fidelity.com/prospectus/sec 1.9914247.100 1156-TSRA-0325 |
| |
| | ANNUAL SHAREHOLDER REPORT | AS OF DECEMBER 31, 2024 | This report describes changes to the Fund that occurred during the reporting period. |
| | VIP Consumer Discretionary Portfolio VIP Consumer Discretionary Portfolio Investor Class true |
| | | |
This annual shareholder report contains information about VIP Consumer Discretionary Portfolio for the period January 1, 2024 to December 31, 2024. You can find additional information about the Fund at fundresearch.fidelity.com/prospectus/sec. You can also request this information by contacting us at 1-877-208-0098 or by sending an e-mail to funddocuments@fmr.com.
What were your Fund costs for the last year?(based on hypothetical $10,000 investment)
FUND COST (PREVIOUS YEAR)
| | Costs of a $10,000 investment | Costs paid as a percentage of a $10,000 investment | |
| Investor Class | $ 78 | 0.70% | |
What affected the Fund's performance this period?
•U.S. equities gained in 2024, driven by a sturdy economy, the Federal Reserve's long-anticipated pivot to cutting interest rates and the potential for artificial intelligence to drive transformative change.
•Against this backdrop, security selection was the primary contributor to the fund's performance versus the MSCI U.S. IMI Consumer Discretionary 25/50 Index for the fiscal year, led by choices in the footwear industry. Security selection in automobile manufacturers and the other specialty retail category also boosted the fund's relative performance.
•The top individual relative contributor was an overweight in Williams-Sonoma (+88%). A second notable relative contributor was an overweight in Dicks Sporting Goods (+58%). The stock was among our largest holdings. An overweight in Deckers Outdoor (+80%) also helped.
•In contrast, the biggest detractor from performance versus the sector index was an overweight in apparel, accessories & luxury goods. Stock picking and an overweight in automotive parts & equipment also hampered the fund's result. Also detracting from our result was an overweight in other specialty retail.
•The biggest individual relative detractor was our stake in Aptiv Irish Holdings (-35%). The stock was not held at period end. The second-largest relative detractor was our stake in lululemon athletica (-24%). This period we decreased our investment in lululemon athletica. Another notable relative detractor was our non-index stake in Dollar Tree (-48%).
•Notable changes in positioning include lower allocations to the apparel, accessories & luxury goods and footwear industries.
How did the Fund perform over the past 10 years?
CUMULATIVE PERFORMANCE
December 31, 2014 through December 31, 2024.
Initial investment of $10,000.
Investor Class | $10,000 | $10,466 | $11,002 | $13,430 | $13,274 | $16,874 | $22,948 | $27,382 | $17,880 | $25,376 | $31,617 |
MSCI U.S. IMI Consumer Discretionary 25-50 Index | $10,000 | $10,643 | $11,358 | $13,959 | $13,862 | $17,694 | $26,241 | $32,799 | $21,278 | $29,891 | $37,208 |
S&P 500® Index | $10,000 | $10,138 | $11,351 | $13,829 | $13,223 | $17,386 | $20,585 | $26,494 | $21,696 | $27,399 | $34,254 |
| | 2014 | 2015 | 2016 | 2017 | 2018 | 2019 | 2020 | 2021 | 2022 | 2023 | 2024 |
AVERAGE ANNUAL TOTAL RETURNS:| | 1 Year | 5 Year | 10 Year |
| Investor Class | 24.59% | 13.38% | 12.20% |
| MSCI U.S. IMI Consumer Discretionary 25-50 Index | 24.48% | 16.03% | 14.04% |
| S&P 500® Index | 25.02% | 14.53% | 13.10% |
Visit institutional.fidelity.com for more recent performance information. |
The Fund's past performance is not a good predictor of the Fund's future performance. The graph and table do not reflect the deduction of taxes that a shareholder would pay on fund distributions or redemption of fund shares. |
Key Fund Statistics(as of December 31, 2024)
KEY FACTS | | |
| Fund Size | $259,189,638 | |
| Number of Holdings | 58 | |
| Total Advisory Fee | $1,473,697 | |
| Portfolio Turnover | 25% | |
What did the Fund invest in?
(as of December 31, 2024)
TOP INDUSTRIES (% of Fund's net assets) |
| Broadline Retail | 25.9 | |
| Specialty Retail | 23.1 | |
| Automobiles | 18.2 | |
| Hotels, Restaurants & Leisure | 17.6 | |
| Textiles, Apparel & Luxury Goods | 6.1 | |
| Household Durables | 4.2 | |
| Automobile Components | 2.8 | |
| Building Products | 0.7 | |
| Consumer Staples Distribution & Retail | 0.6 | |
| |
| Common Stocks | 99.2 |
| Short-Term Investments and Net Other Assets (Liabilities) | 0.8 |
ASSET ALLOCATION (% of Fund's net assets) |
|
| | Common Stocks - 99.2 |
| | Short-Term Investments and Net Other Assets (Liabilities) - 0.8 |
| |
| United States | 94.7 |
| Bailiwick Of Jersey | 2.0 |
| Canada | 1.8 |
| Brazil | 0.7 |
| United Kingdom | 0.4 |
| Switzerland | 0.2 |
| France | 0.2 |
GEOGRAPHIC DIVERSIFICATION (% of Fund's net assets) |
|
| | United States - 94.7 |
| | Bailiwick Of Jersey - 2.0 |
| | Canada - 1.8 |
| | Brazil - 0.7 |
| | United Kingdom - 0.4 |
| | Switzerland - 0.2 |
| | France - 0.2 |
| |
TOP HOLDINGS(% of Fund's net assets) | | |
| Amazon.com Inc | 24.0 | |
| Tesla Inc | 16.8 | |
| Home Depot Inc/The | 4.4 | |
| Lowe's Cos Inc | 4.0 | |
| TJX Cos Inc/The | 2.5 | |
| Hilton Worldwide Holdings Inc | 2.4 | |
| McDonald's Corp | 2.3 | |
| Dick's Sporting Goods Inc | 2.3 | |
| Booking Holdings Inc | 2.2 | |
| Marriott International Inc/MD Class A1 | 1.9 | |
| | 62.8 | |
How has the Fund changed?
This is a summary of certain changes to the Fund since January 1, 2024. For more complete information, you may review the Fund's next prospectus, which we expect to be available by April 30, 2025 at fundresearch.fidelity.com/prospectus/sec or upon request at 1-877-208-0098 or by sending an e-mail to funddocuments@fmr.com.
The fund's transfer agent and pricing & bookkeeping fees were changed to a fixed rate effective December 1, 2023. Effective March 1, 2024, the fund's management contract was amended to incorporate administrative services previously covered under separate services agreements (transfer agent and pricing & bookkeeping). The amended contract incorporates a management fee rate that may vary by class. The Adviser or an affiliate pays certain expenses of managing and operating the fund out of each class's management fee. | |
| Fidelity, the Fidelity Investments Logo and all other Fidelity trademarks or service marks used herein are trademarks or service marks of FMR LLC. Any third-party marks that are used herein are trademarks or service marks of their respective owners. © 2025 FMR LLC. All rights reserved. |
| | For additional information about the Fund; including its prospectus, financial information, holdings and proxy information, scan the QR code or visit fundresearch.fidelity.com/prospectus/sec 1.9914235.100 1474-TSRA-0325 |
| |
| | ANNUAL SHAREHOLDER REPORT | AS OF DECEMBER 31, 2024 | This report describes changes to the Fund that occurred during the reporting period. |
| | VIP Consumer Staples Portfolio VIP Consumer Staples Portfolio Initial Class true |
| | | |
This annual shareholder report contains information about VIP Consumer Staples Portfolio for the period January 1, 2024 to December 31, 2024. You can find additional information about the Fund at fundresearch.fidelity.com/prospectus/sec. You can also request this information by contacting us at 1-877-208-0098 or by sending an e-mail to funddocuments@fmr.com.
What were your Fund costs for the last year?(based on hypothetical $10,000 investment)
FUND COST (PREVIOUS YEAR)
| | Costs of a $10,000 investment | Costs paid as a percentage of a $10,000 investment | |
| Initial Class | $ 64 | 0.62% | |
What affected the Fund's performance this period?
•U.S. equities gained in 2024, driven by a sturdy economy, the Federal Reserve's long-anticipated pivot to cutting interest rates and the potential for artificial intelligence to drive transformative change.
•Against this backdrop, market selection was the primary detractor from the fund's performance versus the MSCI US IMI Consumer Staples 25/50 Index for the fiscal year, especially an underweight in consumer staples merchandise retail. Also hurting our result were overweights in personal care products and soft drinks & non-alcoholic beverages.
•The largest individual relative detractor this period was avoiding Costco Wholesale, an index component that gained approximately 40%. A second notable relative detractor was an underweight in Walmart (+74%). The stock was one of the fund's biggest holdings. Another notable relative detractor was an overweight in Estee Lauder (-48%). This period we increased our investment in Estee Lauder. The stock was among our largest holdings.
•In contrast, the primary contributor to performance versus the sector index was stock picking in soft drinks & non-alcoholic beverages. Stock selection in consumer staples merchandise retail and distillers & vintners also boosted the fund's relative performance.
•The top individual relative contributor was an underweight in Dollar General (-43%). The stock was not held at period end. The second-largest relative contributor was an underweight in PepsiCo (-8%). The stock was one of our largest holdings this period. Another notable relative contributor was an underweight in Dollar Tree (-47%). The stock was not held at period end.
•Notable changes in positioning include decreased exposure to the tobacco industry and a higher allocation to distillers & vintners.
How did the Fund perform over the past 10 years?
CUMULATIVE PERFORMANCE
December 31, 2014 through December 31, 2024.
Initial investment of $10,000.
Initial Class | $10,000 | $10,946 | $11,353 | $13,018 | $10,994 | $14,448 | $16,150 | $18,450 | $18,336 | $18,912 | $19,965 |
MSCI U.S. IMI Consumer Staples 25-50 Index | $10,000 | $10,604 | $11,282 | $12,626 | $11,660 | $14,715 | $16,339 | $19,218 | $18,896 | $19,353 | $21,943 |
S&P 500® Index | $10,000 | $10,138 | $11,351 | $13,829 | $13,223 | $17,386 | $20,585 | $26,494 | $21,696 | $27,399 | $34,254 |
| | 2014 | 2015 | 2016 | 2017 | 2018 | 2019 | 2020 | 2021 | 2022 | 2023 | 2024 |
AVERAGE ANNUAL TOTAL RETURNS:| | 1 Year | 5 Year | 10 Year |
| Initial Class | 5.57% | 6.68% | 7.16% |
| MSCI U.S. IMI Consumer Staples 25-50 Index | 13.38% | 8.32% | 8.18% |
| S&P 500® Index | 25.02% | 14.53% | 13.10% |
Visit institutional.fidelity.com for more recent performance information. |
The Fund's past performance is not a good predictor of the Fund's future performance. The graph and table do not reflect the deduction of taxes that a shareholder would pay on fund distributions or redemption of fund shares. |
Key Fund Statistics(as of December 31, 2024)
KEY FACTS | | |
| Fund Size | $235,079,081 | |
| Number of Holdings | 31 | |
| Total Advisory Fee | $1,557,931 | |
| Portfolio Turnover | 46% | |
What did the Fund invest in?
(as of December 31, 2024)
TOP INDUSTRIES (% of Fund's net assets) |
| Beverages | 41.5 | |
| Household Products | 17.7 | |
| Food Products | 16.9 | |
| Consumer Staples Distribution & Retail | 13.5 | |
| Personal Care Products | 7.7 | |
| Tobacco | 2.7 | |
| |
| Common Stocks | 100.0 |
| Short-Term Investments and Net Other Assets (Liabilities) | 0.0 |
ASSET ALLOCATION (% of Fund's net assets) |
|
| | Common Stocks - 100.0 |
| | Short-Term Investments and Net Other Assets (Liabilities) - 0.0 |
| |
| United States | 96.2 |
| United Kingdom | 3.8 |
GEOGRAPHIC DIVERSIFICATION (% of Fund's net assets) |
|
| | United States - 96.2 |
| | United Kingdom - 3.8 |
| |
TOP HOLDINGS(% of Fund's net assets) | | |
| Procter & Gamble Co/The | 13.9 | |
| Coca-Cola Co/The | 13.1 | |
| Keurig Dr Pepper Inc | 10.3 | |
| Walmart Inc | 7.8 | |
| Constellation Brands Inc Class A | 4.8 | |
| Estee Lauder Cos Inc/The Class A | 4.4 | |
| Target Corp | 3.9 | |
| JM Smucker Co | 3.9 | |
| Monster Beverage Corp | 3.7 | |
| Energizer Holdings Inc | 3.5 | |
| | 69.3 | |
How has the Fund changed?
This is a summary of certain changes to the Fund since January 1, 2024. For more complete information, you may review the Fund's next prospectus, which we expect to be available by April 30, 2025 at fundresearch.fidelity.com/prospectus/sec or upon request at 1-877-208-0098 or by sending an e-mail to funddocuments@fmr.com.
The fund's transfer agent and pricing & bookkeeping fees were changed to a fixed rate effective December 1, 2023. Effective March 1, 2024, the fund's management contract was amended to incorporate administrative services previously covered under separate services agreements (transfer agent and pricing & bookkeeping). The amended contract incorporates a management fee rate that may vary by class. The Adviser or an affiliate pays certain expenses of managing and operating the fund out of each class's management fee. | |
| Fidelity, the Fidelity Investments Logo and all other Fidelity trademarks or service marks used herein are trademarks or service marks of FMR LLC. Any third-party marks that are used herein are trademarks or service marks of their respective owners. © 2025 FMR LLC. All rights reserved. |
| | For additional information about the Fund; including its prospectus, financial information, holdings and proxy information, scan the QR code or visit fundresearch.fidelity.com/prospectus/sec 1.9914316.100 1839-TSRA-0325 |
| |
| | ANNUAL SHAREHOLDER REPORT | AS OF DECEMBER 31, 2024 | This report describes changes to the Fund that occurred during the reporting period. |
| | VIP Industrials Portfolio VIP Industrials Portfolio Initial Class true |
| | | |
This annual shareholder report contains information about VIP Industrials Portfolio for the period January 1, 2024 to December 31, 2024. You can find additional information about the Fund at fundresearch.fidelity.com/prospectus/sec. You can also request this information by contacting us at 1-877-208-0098 or by sending an e-mail to funddocuments@fmr.com.
What were your Fund costs for the last year?(based on hypothetical $10,000 investment)
FUND COST (PREVIOUS YEAR)
| | Costs of a $10,000 investment | Costs paid as a percentage of a $10,000 investment | |
| Initial Class | $ 68 | 0.61% | |
What affected the Fund's performance this period?
•U.S. equities gained in 2024, driven by a sturdy economy, the Federal Reserve's long-anticipated pivot to cutting interest rates and the potential for artificial intelligence to drive transformative change.
•Against this backdrop, security selection was the primary contributor to the fund's performance versus the MSCI US IMI Industrials 25/50 Linked Index for the year, especially within industrial machinery & supplies & components. An overweight in heavy electrical equipment also boosted relative performance. Also lifting the fund's relative result were stock picking and an overweight in aerospace & defense.
•The top individual relative contributor was an overweight in Howmet Aerospace (+103%). The company was one of our largest holdings. A second notable relative contributor was an overweight in GE Vernova (+135%). This was a stake we established this period. The company was one of the fund's largest holdings at period end. Another notable relative contributor was an overweight in GE Aerospace (+65%). The company was the fund's biggest holding.
•In contrast, the primary detractor from performance versus the sector index was security selection in construction & engineering. Also hurting our result were an overweight in cargo ground transportation and an underweight in passenger airlines.
•The largest individual relative detractor was an overweight in Boeing (-31%). The stock was one of our largest holdings. The second-largest relative detractor was an overweight in Knight-Swift Transportation (-7%). Another notable relative detractor this period was avoiding RTX, an index component that gained 41%.
•Notable changes in positioning include increased exposure to the heavy electrical equipment and trading companies & distributors industries.
How did the Fund perform over the past 10 years?
CUMULATIVE PERFORMANCE
December 31, 2014 through December 31, 2024.
Initial investment of $10,000.
Initial Class | $10,000 | $9,811 | $11,368 | $13,659 | $11,594 | $14,857 | $16,687 | $19,538 | $17,526 | $21,601 | $26,707 |
MSCI U.S. IMI Industrials 25-50 Index | $10,000 | $9,645 | $11,616 | $14,125 | $12,169 | $15,854 | $17,825 | $21,537 | $19,724 | $24,157 | $28,277 |
S&P 500® Index | $10,000 | $10,138 | $11,351 | $13,829 | $13,223 | $17,386 | $20,585 | $26,494 | $21,696 | $27,399 | $34,254 |
| | 2014 | 2015 | 2016 | 2017 | 2018 | 2019 | 2020 | 2021 | 2022 | 2023 | 2024 |
AVERAGE ANNUAL TOTAL RETURNS:| | 1 Year | 5 Year | 10 Year |
| Initial Class | 23.64% | 12.44% | 10.32% |
| MSCI U.S. IMI Industrials 25-50 Index | 17.05% | 12.27% | 10.95% |
| S&P 500® Index | 25.02% | 14.53% | 13.10% |
Visit institutional.fidelity.com for more recent performance information. |
The Fund's past performance is not a good predictor of the Fund's future performance. The graph and table do not reflect the deduction of taxes that a shareholder would pay on fund distributions or redemption of fund shares. |
Key Fund Statistics(as of December 31, 2024)
KEY FACTS | | |
| Fund Size | $239,293,073 | |
| Number of Holdings | 54 | |
| Total Advisory Fee | $1,346,907 | |
| Portfolio Turnover | 33% | |
What did the Fund invest in?
(as of December 31, 2024)
TOP INDUSTRIES (% of Fund's net assets) |
| Aerospace & Defense | 23.5 | |
| Machinery | 21.6 | |
| Electrical Equipment | 14.7 | |
| Building Products | 10.9 | |
| Ground Transportation | 10.7 | |
| Trading Companies & Distributors | 7.0 | |
| Construction & Engineering | 3.8 | |
| Professional Services | 2.8 | |
| Commercial Services & Supplies | 2.6 | |
| Others | 1.4 | |
| |
| Common Stocks | 99.0 |
| Short-Term Investments and Net Other Assets (Liabilities) | 1.0 |
ASSET ALLOCATION (% of Fund's net assets) |
|
| | Common Stocks - 99.0 |
| | Short-Term Investments and Net Other Assets (Liabilities) - 1.0 |
| |
GEOGRAPHIC DIVERSIFICATION (% of Fund's net assets) |
|
TOP HOLDINGS(% of Fund's net assets) | | |
| GE Aerospace | 5.9 | |
| GE Vernova Inc | 5.2 | |
| Howmet Aerospace Inc | 5.0 | |
| Parker-Hannifin Corp | 4.3 | |
| Boeing Co | 4.2 | |
| Ingersoll Rand Inc | 4.0 | |
| Trane Technologies PLC | 4.0 | |
| TransDigm Group Inc | 3.5 | |
| Eaton Corp PLC | 3.5 | |
| Union Pacific Corp | 3.5 | |
| | 43.1 | |
How has the Fund changed?
This is a summary of certain changes to the Fund since January 1, 2024. For more complete information, you may review the Fund's next prospectus, which we expect to be available by April 30, 2025 at fundresearch.fidelity.com/prospectus/sec or upon request at 1-877-208-0098 or by sending an e-mail to funddocuments@fmr.com.
The fees associated with this class changed during the reporting year. The variations in class fees are primarily the result of the following changes:- Management fee
- Operating expenses
The fund's transfer agent and pricing & bookkeeping fees were changed to a fixed rate effective December 1, 2023. Effective March 1, 2024, the fund's management contract was amended to incorporate administrative services previously covered under separate services agreements (transfer agent and pricing & bookkeeping). The amended contract incorporates a management fee rate that may vary by class. The Adviser or an affiliate pays certain expenses of managing and operating the fund out of each class's management fee. | |
| Fidelity, the Fidelity Investments Logo and all other Fidelity trademarks or service marks used herein are trademarks or service marks of FMR LLC. Any third-party marks that are used herein are trademarks or service marks of their respective owners. © 2025 FMR LLC. All rights reserved. |
| | For additional information about the Fund; including its prospectus, financial information, holdings and proxy information, scan the QR code or visit fundresearch.fidelity.com/prospectus/sec 1.9914234.100 970-TSRA-0325 |
| |
| | ANNUAL SHAREHOLDER REPORT | AS OF DECEMBER 31, 2024 | This report describes changes to the Fund that occurred during the reporting period. |
| | VIP Technology Portfolio VIP Technology Portfolio Service Class 2 true |
| | | |
This annual shareholder report contains information about VIP Technology Portfolio for the period January 1, 2024 to December 31, 2024. You can find additional information about the Fund at fundresearch.fidelity.com/prospectus/sec. You can also request this information by contacting us at 1-877-208-0098 or by sending an e-mail to funddocuments@fmr.com.
What were your Fund costs for the last year?(based on hypothetical $10,000 investment)
FUND COST (PREVIOUS YEAR)
| | Costs of a $10,000 investment | Costs paid as a percentage of a $10,000 investment | |
| Service Class 2 | $ 97 | 0.82% | |
What affected the Fund's performance this period?
•U.S. equities gained in 2024, driven by a sturdy economy, the Federal Reserve's long-anticipated pivot to cutting interest rates and the potential for artificial intelligence to drive transformative change.
•Against this backdrop, security selection and industry positioning contributed to the fund's performance versus the MSCI U.S. IMI Information Technology 25/50 Index for the year, led by our choices in the semiconductors category. Stock picks in application software also boosted the fund's relative performance. Also contributing to our result was an underweight in technology hardware, storage & peripherals.
•The fund's top individual relative contributor was an overweight in Nvidia (+171%). Although we trimmed the position a bit this period, the company was the fund's biggest holding, on average, the past 12 months and at year-end. A second notable relative contributor was an overweight in Marvell Technology (+85%). The stock was one of our biggest holdings. Another notable relative contributor this period was avoiding Intel, an index component that returned about -60%.
•In contrast, the biggest detractor from performance versus the industry index was an overweight in internet services & infrastructure. Out-of-index exposure to passenger ground transportation also hampered the fund's result. Further detracting from our result were stock picking and an underweight in communications equipment.
•The largest individual relative detractor was an overweight in ON Semiconductor (-25%). The stock was among our largest holdings. The second-largest relative detractor was an underweight in Broadcom (+110%). This was an investment we established this period. A non-index stake in GlobalFoundries returned -29% and notably hurt. The company was among the fund's biggest holdings.
•Notable changes in positioning include decreased exposure to the systems software industry and a higher allocation to semiconductors.
How did the Fund perform over the life of Fund?
CUMULATIVE PERFORMANCE
August 16, 2023 through December 31, 2024.
Initial investment of $10,000.
Service Class 2 | $10,000 | $11,245 |
MSCI U.S. IMI Information Technology 25-50 Index | $10,000 | $11,516 |
S&P 500® Index | $10,000 | $10,896 |
| | 2023 | 2024 |
AVERAGE ANNUAL TOTAL RETURNS:| | 1 Year | Life of Fund A |
| Service Class 2 | 35.26% | 35.57% |
| MSCI U.S. IMI Information Technology 25-50 Index | 29.38% | 33.55% |
| S&P 500® Index | 25.02% | 25.15% |
A From August 16, 2023
Visit institutional.fidelity.com for more recent performance information. |
The Fund's past performance is not a good predictor of the Fund's future performance. The graph and table do not reflect the deduction of taxes that a shareholder would pay on fund distributions or redemption of fund shares. |
Key Fund Statistics(as of December 31, 2024)
KEY FACTS | | |
| Fund Size | $2,905,464,976 | |
| Number of Holdings | 95 | |
| Total Advisory Fee | $15,690,980 | |
| Portfolio Turnover | 52% | |
What did the Fund invest in?
(as of December 31, 2024)
TOP INDUSTRIES (% of Fund's net assets) |
| Semiconductors & Semiconductor Equipment | 42.1 | |
| Software | 21.7 | |
| Technology Hardware, Storage & Peripherals | 19.8 | |
| IT Services | 5.6 | |
| Communications Equipment | 3.5 | |
| Broadline Retail | 1.8 | |
| Ground Transportation | 1.2 | |
| Electronic Equipment, Instruments & Components | 1.1 | |
| Entertainment | 0.8 | |
| Others | 0.5 | |
| |
| Common Stocks | 96.8 |
| Preferred Stocks | 1.3 |
| Preferred Securities | 0.0 |
| Bonds | 0.0 |
| Short-Term Investments and Net Other Assets (Liabilities) | 1.9 |
ASSET ALLOCATION (% of Fund's net assets) |
|
| | Common Stocks - 96.8 |
| | Preferred Stocks - 1.3 |
| | Preferred Securities - 0.0 |
| | Bonds - 0.0 |
| | Short-Term Investments and Net Other Assets (Liabilities) - 1.9 |
| |
| United States | 91.2 |
| China | 3.4 |
| Canada | 2.1 |
| Taiwan | 2.1 |
| Netherlands | 0.9 |
| India | 0.1 |
| France | 0.1 |
| United Kingdom | 0.1 |
| Israel | 0.0 |
GEOGRAPHIC DIVERSIFICATION (% of Fund's net assets) |
|
| | United States - 91.2 |
| | China - 3.4 |
| | Canada - 2.1 |
| | Taiwan - 2.1 |
| | Netherlands - 0.9 |
| | India - 0.1 |
| | France - 0.1 |
| | United Kingdom - 0.1 |
| | Israel - 0.0 |
| |
TOP HOLDINGS(% of Fund's net assets) | | |
| NVIDIA Corp | 21.4 | |
| Apple Inc | 17.7 | |
| Microsoft Corp | 9.5 | |
| Marvell Technology Inc | 4.4 | |
| Servicenow Inc | 3.7 | |
| Cisco Systems Inc | 3.5 | |
| ON Semiconductor Corp | 3.5 | |
| NXP Semiconductors NV | 3.3 | |
| GlobalFoundries Inc | 2.6 | |
| Salesforce Inc | 2.4 | |
| | 72.0 | |
How has the Fund changed?
This is a summary of certain changes to the Fund since January 1, 2024. For more complete information, you may review the Fund's next prospectus, which we expect to be available by April 30, 2025 at fundresearch.fidelity.com/prospectus/sec or upon request at 1-877-208-0098 or by sending an e-mail to funddocuments@fmr.com.
The fees associated with this class changed during the reporting year. The variations in class fees are primarily the result of the following changes: The fund's transfer agent and pricing & bookkeeping fees were changed to a fixed rate effective December 1, 2023. Effective March 1, 2024, the fund's management contract was amended to incorporate administrative services previously covered under separate services agreements (transfer agent and pricing & bookkeeping). The amended contract incorporates a management fee rate that may vary by class. The Adviser or an affiliate pays certain expenses of managing and operating the fund out of each class's management fee. | |
| Fidelity, the Fidelity Investments Logo and all other Fidelity trademarks or service marks used herein are trademarks or service marks of FMR LLC. Any third-party marks that are used herein are trademarks or service marks of their respective owners. © 2025 FMR LLC. All rights reserved. |
| | For additional information about the Fund; including its prospectus, financial information, holdings and proxy information, scan the QR code or visit fundresearch.fidelity.com/prospectus/sec 1.9914155.100 7361-TSRA-0325 |
| |
| | ANNUAL SHAREHOLDER REPORT | AS OF DECEMBER 31, 2024 | This report describes changes to the Fund that occurred during the reporting period. |
| | VIP Technology Portfolio VIP Technology Portfolio Investor Class true |
| | | |
This annual shareholder report contains information about VIP Technology Portfolio for the period January 1, 2024 to December 31, 2024. You can find additional information about the Fund at fundresearch.fidelity.com/prospectus/sec. You can also request this information by contacting us at 1-877-208-0098 or by sending an e-mail to funddocuments@fmr.com.
What were your Fund costs for the last year?(based on hypothetical $10,000 investment)
FUND COST (PREVIOUS YEAR)
| | Costs of a $10,000 investment | Costs paid as a percentage of a $10,000 investment | |
| Investor Class | $ 77 | 0.65% | |
What affected the Fund's performance this period?
•U.S. equities gained in 2024, driven by a sturdy economy, the Federal Reserve's long-anticipated pivot to cutting interest rates and the potential for artificial intelligence to drive transformative change.
•Against this backdrop, security selection and industry positioning contributed to the fund's performance versus the MSCI U.S. IMI Information Technology 25/50 Index for the year, led by our choices in the semiconductors category. Stock picks in application software also boosted the fund's relative performance. Also contributing to our result was an underweight in technology hardware, storage & peripherals.
•The fund's top individual relative contributor was an overweight in Nvidia (+171%). Although we trimmed the position a bit this period, the company was the fund's biggest holding, on average, the past 12 months and at year-end. A second notable relative contributor was an overweight in Marvell Technology (+85%). The stock was one of our biggest holdings. Another notable relative contributor this period was avoiding Intel, an index component that returned about -60%.
•In contrast, the biggest detractor from performance versus the industry index was an overweight in internet services & infrastructure. Out-of-index exposure to passenger ground transportation also hampered the fund's result. Further detracting from our result were stock picking and an underweight in communications equipment.
•The largest individual relative detractor was an overweight in ON Semiconductor (-25%). The stock was among our largest holdings. The second-largest relative detractor was an underweight in Broadcom (+110%). This was an investment we established this period. A non-index stake in GlobalFoundries returned -29% and notably hurt. The company was among the fund's biggest holdings.
•Notable changes in positioning include decreased exposure to the systems software industry and a higher allocation to semiconductors.
How did the Fund perform over the past 10 years?
CUMULATIVE PERFORMANCE
December 31, 2014 through December 31, 2024.
Initial investment of $10,000.
Investor Class | $10,000 | $10,608 | $11,811 | $17,796 | $16,420 | $24,838 | $40,923 | $52,408 | $33,607 | $53,147 | $72,008 |
MSCI U.S. IMI Information Technology 25-50 Index | $10,000 | $10,510 | $11,965 | $16,417 | $16,394 | $24,403 | $35,676 | $46,556 | $32,786 | $50,046 | $64,750 |
S&P 500® Index | $10,000 | $10,138 | $11,351 | $13,829 | $13,223 | $17,386 | $20,585 | $26,494 | $21,696 | $27,399 | $34,254 |
| | 2014 | 2015 | 2016 | 2017 | 2018 | 2019 | 2020 | 2021 | 2022 | 2023 | 2024 |
AVERAGE ANNUAL TOTAL RETURNS:| | 1 Year | 5 Year | 10 Year |
| Investor Class | 35.49% | 23.72% | 21.83% |
| MSCI U.S. IMI Information Technology 25-50 Index | 29.38% | 21.55% | 20.54% |
| S&P 500® Index | 25.02% | 14.53% | 13.10% |
Visit institutional.fidelity.com for more recent performance information. |
The Fund's past performance is not a good predictor of the Fund's future performance. The graph and table do not reflect the deduction of taxes that a shareholder would pay on fund distributions or redemption of fund shares. |
Key Fund Statistics(as of December 31, 2024)
KEY FACTS | | |
| Fund Size | $2,905,464,976 | |
| Number of Holdings | 95 | |
| Total Advisory Fee | $15,690,980 | |
| Portfolio Turnover | 52% | |
What did the Fund invest in?
(as of December 31, 2024)
TOP INDUSTRIES (% of Fund's net assets) |
| Semiconductors & Semiconductor Equipment | 42.1 | |
| Software | 21.7 | |
| Technology Hardware, Storage & Peripherals | 19.8 | |
| IT Services | 5.6 | |
| Communications Equipment | 3.5 | |
| Broadline Retail | 1.8 | |
| Ground Transportation | 1.2 | |
| Electronic Equipment, Instruments & Components | 1.1 | |
| Entertainment | 0.8 | |
| Others | 0.5 | |
| |
| Common Stocks | 96.8 |
| Preferred Stocks | 1.3 |
| Preferred Securities | 0.0 |
| Bonds | 0.0 |
| Short-Term Investments and Net Other Assets (Liabilities) | 1.9 |
ASSET ALLOCATION (% of Fund's net assets) |
|
| | Common Stocks - 96.8 |
| | Preferred Stocks - 1.3 |
| | Preferred Securities - 0.0 |
| | Bonds - 0.0 |
| | Short-Term Investments and Net Other Assets (Liabilities) - 1.9 |
| |
| United States | 91.2 |
| China | 3.4 |
| Canada | 2.1 |
| Taiwan | 2.1 |
| Netherlands | 0.9 |
| India | 0.1 |
| France | 0.1 |
| United Kingdom | 0.1 |
| Israel | 0.0 |
GEOGRAPHIC DIVERSIFICATION (% of Fund's net assets) |
|
| | United States - 91.2 |
| | China - 3.4 |
| | Canada - 2.1 |
| | Taiwan - 2.1 |
| | Netherlands - 0.9 |
| | India - 0.1 |
| | France - 0.1 |
| | United Kingdom - 0.1 |
| | Israel - 0.0 |
| |
TOP HOLDINGS(% of Fund's net assets) | | |
| NVIDIA Corp | 21.4 | |
| Apple Inc | 17.7 | |
| Microsoft Corp | 9.5 | |
| Marvell Technology Inc | 4.4 | |
| Servicenow Inc | 3.7 | |
| Cisco Systems Inc | 3.5 | |
| ON Semiconductor Corp | 3.5 | |
| NXP Semiconductors NV | 3.3 | |
| GlobalFoundries Inc | 2.6 | |
| Salesforce Inc | 2.4 | |
| | 72.0 | |
How has the Fund changed?
This is a summary of certain changes to the Fund since January 1, 2024. For more complete information, you may review the Fund's next prospectus, which we expect to be available by April 30, 2025 at fundresearch.fidelity.com/prospectus/sec or upon request at 1-877-208-0098 or by sending an e-mail to funddocuments@fmr.com.
The fees associated with this class changed during the reporting year. The variations in class fees are primarily the result of the following changes: The fund's transfer agent and pricing & bookkeeping fees were changed to a fixed rate effective December 1, 2023. Effective March 1, 2024, the fund's management contract was amended to incorporate administrative services previously covered under separate services agreements (transfer agent and pricing & bookkeeping). The amended contract incorporates a management fee rate that may vary by class. The Adviser or an affiliate pays certain expenses of managing and operating the fund out of each class's management fee. | |
| Fidelity, the Fidelity Investments Logo and all other Fidelity trademarks or service marks used herein are trademarks or service marks of FMR LLC. Any third-party marks that are used herein are trademarks or service marks of their respective owners. © 2025 FMR LLC. All rights reserved. |
| | For additional information about the Fund; including its prospectus, financial information, holdings and proxy information, scan the QR code or visit fundresearch.fidelity.com/prospectus/sec 1.9914154.100 1479-TSRA-0325 |
| |
| | ANNUAL SHAREHOLDER REPORT | AS OF DECEMBER 31, 2024 | This report describes changes to the Fund that occurred during the reporting period. |
| | VIP Consumer Staples Portfolio VIP Consumer Staples Portfolio Investor Class true |
| | | |
This annual shareholder report contains information about VIP Consumer Staples Portfolio for the period January 1, 2024 to December 31, 2024. You can find additional information about the Fund at fundresearch.fidelity.com/prospectus/sec. You can also request this information by contacting us at 1-877-208-0098 or by sending an e-mail to funddocuments@fmr.com.
What were your Fund costs for the last year?(based on hypothetical $10,000 investment)
FUND COST (PREVIOUS YEAR)
| | Costs of a $10,000 investment | Costs paid as a percentage of a $10,000 investment | |
| Investor Class | $ 71 | 0.70% | |
What affected the Fund's performance this period?
•U.S. equities gained in 2024, driven by a sturdy economy, the Federal Reserve's long-anticipated pivot to cutting interest rates and the potential for artificial intelligence to drive transformative change.
•Against this backdrop, market selection was the primary detractor from the fund's performance versus the MSCI US IMI Consumer Staples 25/50 Index for the fiscal year, especially an underweight in consumer staples merchandise retail. Also hurting our result were overweights in personal care products and soft drinks & non-alcoholic beverages.
•The largest individual relative detractor this period was avoiding Costco Wholesale, an index component that gained approximately 40%. A second notable relative detractor was an underweight in Walmart (+74%). The stock was one of the fund's biggest holdings. Another notable relative detractor was an overweight in Estee Lauder (-48%). This period we increased our investment in Estee Lauder. The stock was among our largest holdings.
•In contrast, the primary contributor to performance versus the sector index was stock picking in soft drinks & non-alcoholic beverages. Stock selection in consumer staples merchandise retail and distillers & vintners also boosted the fund's relative performance.
•The top individual relative contributor was an underweight in Dollar General (-43%). The stock was not held at period end. The second-largest relative contributor was an underweight in PepsiCo (-8%). The stock was one of our largest holdings this period. Another notable relative contributor was an underweight in Dollar Tree (-47%). The stock was not held at period end.
•Notable changes in positioning include decreased exposure to the tobacco industry and a higher allocation to distillers & vintners.
How did the Fund perform over the past 10 years?
CUMULATIVE PERFORMANCE
December 31, 2014 through December 31, 2024.
Initial investment of $10,000.
Investor Class | $10,000 | $10,941 | $11,342 | $12,989 | $10,965 | $14,400 | $16,085 | $18,354 | $18,227 | $18,788 | $19,813 |
MSCI U.S. IMI Consumer Staples 25-50 Index | $10,000 | $10,604 | $11,282 | $12,626 | $11,660 | $14,715 | $16,339 | $19,218 | $18,896 | $19,353 | $21,943 |
S&P 500® Index | $10,000 | $10,138 | $11,351 | $13,829 | $13,223 | $17,386 | $20,585 | $26,494 | $21,696 | $27,399 | $34,254 |
| | 2014 | 2015 | 2016 | 2017 | 2018 | 2019 | 2020 | 2021 | 2022 | 2023 | 2024 |
AVERAGE ANNUAL TOTAL RETURNS:| | 1 Year | 5 Year | 10 Year |
| Investor Class | 5.45% | 6.59% | 7.08% |
| MSCI U.S. IMI Consumer Staples 25-50 Index | 13.38% | 8.32% | 8.18% |
| S&P 500® Index | 25.02% | 14.53% | 13.10% |
Visit institutional.fidelity.com for more recent performance information. |
The Fund's past performance is not a good predictor of the Fund's future performance. The graph and table do not reflect the deduction of taxes that a shareholder would pay on fund distributions or redemption of fund shares. |
Key Fund Statistics(as of December 31, 2024)
KEY FACTS | | |
| Fund Size | $235,079,081 | |
| Number of Holdings | 31 | |
| Total Advisory Fee | $1,557,931 | |
| Portfolio Turnover | 46% | |
What did the Fund invest in?
(as of December 31, 2024)
TOP INDUSTRIES (% of Fund's net assets) |
| Beverages | 41.5 | |
| Household Products | 17.7 | |
| Food Products | 16.9 | |
| Consumer Staples Distribution & Retail | 13.5 | |
| Personal Care Products | 7.7 | |
| Tobacco | 2.7 | |
| |
| Common Stocks | 100.0 |
| Short-Term Investments and Net Other Assets (Liabilities) | 0.0 |
ASSET ALLOCATION (% of Fund's net assets) |
|
| | Common Stocks - 100.0 |
| | Short-Term Investments and Net Other Assets (Liabilities) - 0.0 |
| |
| United States | 96.2 |
| United Kingdom | 3.8 |
GEOGRAPHIC DIVERSIFICATION (% of Fund's net assets) |
|
| | United States - 96.2 |
| | United Kingdom - 3.8 |
| |
TOP HOLDINGS(% of Fund's net assets) | | |
| Procter & Gamble Co/The | 13.9 | |
| Coca-Cola Co/The | 13.1 | |
| Keurig Dr Pepper Inc | 10.3 | |
| Walmart Inc | 7.8 | |
| Constellation Brands Inc Class A | 4.8 | |
| Estee Lauder Cos Inc/The Class A | 4.4 | |
| Target Corp | 3.9 | |
| JM Smucker Co | 3.9 | |
| Monster Beverage Corp | 3.7 | |
| Energizer Holdings Inc | 3.5 | |
| | 69.3 | |
How has the Fund changed?
This is a summary of certain changes to the Fund since January 1, 2024. For more complete information, you may review the Fund's next prospectus, which we expect to be available by April 30, 2025 at fundresearch.fidelity.com/prospectus/sec or upon request at 1-877-208-0098 or by sending an e-mail to funddocuments@fmr.com.
The fund's transfer agent and pricing & bookkeeping fees were changed to a fixed rate effective December 1, 2023. Effective March 1, 2024, the fund's management contract was amended to incorporate administrative services previously covered under separate services agreements (transfer agent and pricing & bookkeeping). The amended contract incorporates a management fee rate that may vary by class. The Adviser or an affiliate pays certain expenses of managing and operating the fund out of each class's management fee. | |
| Fidelity, the Fidelity Investments Logo and all other Fidelity trademarks or service marks used herein are trademarks or service marks of FMR LLC. Any third-party marks that are used herein are trademarks or service marks of their respective owners. © 2025 FMR LLC. All rights reserved. |
| | For additional information about the Fund; including its prospectus, financial information, holdings and proxy information, scan the QR code or visit fundresearch.fidelity.com/prospectus/sec 1.9914317.100 1840-TSRA-0325 |
| |
| | ANNUAL SHAREHOLDER REPORT | AS OF DECEMBER 31, 2024 | This report describes changes to the Fund that occurred during the reporting period. |
| | VIP Technology Portfolio VIP Technology Portfolio Initial Class true |
| | | |
This annual shareholder report contains information about VIP Technology Portfolio for the period January 1, 2024 to December 31, 2024. You can find additional information about the Fund at fundresearch.fidelity.com/prospectus/sec. You can also request this information by contacting us at 1-877-208-0098 or by sending an e-mail to funddocuments@fmr.com.
What were your Fund costs for the last year?(based on hypothetical $10,000 investment)
FUND COST (PREVIOUS YEAR)
| | Costs of a $10,000 investment | Costs paid as a percentage of a $10,000 investment | |
| Initial Class | $ 68 | 0.58% | |
What affected the Fund's performance this period?
•U.S. equities gained in 2024, driven by a sturdy economy, the Federal Reserve's long-anticipated pivot to cutting interest rates and the potential for artificial intelligence to drive transformative change.
•Against this backdrop, security selection and industry positioning contributed to the fund's performance versus the MSCI U.S. IMI Information Technology 25/50 Index for the year, led by our choices in the semiconductors category. Stock picks in application software also boosted the fund's relative performance. Also contributing to our result was an underweight in technology hardware, storage & peripherals.
•The fund's top individual relative contributor was an overweight in Nvidia (+171%). Although we trimmed the position a bit this period, the company was the fund's biggest holding, on average, the past 12 months and at year-end. A second notable relative contributor was an overweight in Marvell Technology (+85%). The stock was one of our biggest holdings. Another notable relative contributor this period was avoiding Intel, an index component that returned about -60%.
•In contrast, the biggest detractor from performance versus the industry index was an overweight in internet services & infrastructure. Out-of-index exposure to passenger ground transportation also hampered the fund's result. Further detracting from our result were stock picking and an underweight in communications equipment.
•The largest individual relative detractor was an overweight in ON Semiconductor (-25%). The stock was among our largest holdings. The second-largest relative detractor was an underweight in Broadcom (+110%). This was an investment we established this period. A non-index stake in GlobalFoundries returned -29% and notably hurt. The company was among the fund's biggest holdings.
•Notable changes in positioning include decreased exposure to the systems software industry and a higher allocation to semiconductors.
How did the Fund perform over the past 10 years?
CUMULATIVE PERFORMANCE
December 31, 2014 through December 31, 2024.
Initial investment of $10,000.
Initial Class | $10,000 | $10,627 | $11,835 | $17,846 | $16,486 | $24,947 | $41,149 | $52,739 | $33,829 | $53,557 | $72,618 |
MSCI U.S. IMI Information Technology 25-50 Index | $10,000 | $10,510 | $11,965 | $16,417 | $16,394 | $24,403 | $35,676 | $46,556 | $32,786 | $50,046 | $64,750 |
S&P 500® Index | $10,000 | $10,138 | $11,351 | $13,829 | $13,223 | $17,386 | $20,585 | $26,494 | $21,696 | $27,399 | $34,254 |
| | 2014 | 2015 | 2016 | 2017 | 2018 | 2019 | 2020 | 2021 | 2022 | 2023 | 2024 |
AVERAGE ANNUAL TOTAL RETURNS:| | 1 Year | 5 Year | 10 Year |
| Initial Class | 35.59% | 23.82% | 21.93% |
| MSCI U.S. IMI Information Technology 25-50 Index | 29.38% | 21.55% | 20.54% |
| S&P 500® Index | 25.02% | 14.53% | 13.10% |
Visit institutional.fidelity.com for more recent performance information. |
The Fund's past performance is not a good predictor of the Fund's future performance. The graph and table do not reflect the deduction of taxes that a shareholder would pay on fund distributions or redemption of fund shares. |
Key Fund Statistics(as of December 31, 2024)
KEY FACTS | | |
| Fund Size | $2,905,464,976 | |
| Number of Holdings | 95 | |
| Total Advisory Fee | $15,690,980 | |
| Portfolio Turnover | 52% | |
What did the Fund invest in?
(as of December 31, 2024)
TOP INDUSTRIES (% of Fund's net assets) |
| Semiconductors & Semiconductor Equipment | 42.1 | |
| Software | 21.7 | |
| Technology Hardware, Storage & Peripherals | 19.8 | |
| IT Services | 5.6 | |
| Communications Equipment | 3.5 | |
| Broadline Retail | 1.8 | |
| Ground Transportation | 1.2 | |
| Electronic Equipment, Instruments & Components | 1.1 | |
| Entertainment | 0.8 | |
| Others | 0.5 | |
| |
| Common Stocks | 96.8 |
| Preferred Stocks | 1.3 |
| Preferred Securities | 0.0 |
| Bonds | 0.0 |
| Short-Term Investments and Net Other Assets (Liabilities) | 1.9 |
ASSET ALLOCATION (% of Fund's net assets) |
|
| | Common Stocks - 96.8 |
| | Preferred Stocks - 1.3 |
| | Preferred Securities - 0.0 |
| | Bonds - 0.0 |
| | Short-Term Investments and Net Other Assets (Liabilities) - 1.9 |
| |
| United States | 91.2 |
| China | 3.4 |
| Canada | 2.1 |
| Taiwan | 2.1 |
| Netherlands | 0.9 |
| India | 0.1 |
| France | 0.1 |
| United Kingdom | 0.1 |
| Israel | 0.0 |
GEOGRAPHIC DIVERSIFICATION (% of Fund's net assets) |
|
| | United States - 91.2 |
| | China - 3.4 |
| | Canada - 2.1 |
| | Taiwan - 2.1 |
| | Netherlands - 0.9 |
| | India - 0.1 |
| | France - 0.1 |
| | United Kingdom - 0.1 |
| | Israel - 0.0 |
| |
TOP HOLDINGS(% of Fund's net assets) | | |
| NVIDIA Corp | 21.4 | |
| Apple Inc | 17.7 | |
| Microsoft Corp | 9.5 | |
| Marvell Technology Inc | 4.4 | |
| Servicenow Inc | 3.7 | |
| Cisco Systems Inc | 3.5 | |
| ON Semiconductor Corp | 3.5 | |
| NXP Semiconductors NV | 3.3 | |
| GlobalFoundries Inc | 2.6 | |
| Salesforce Inc | 2.4 | |
| | 72.0 | |
How has the Fund changed?
This is a summary of certain changes to the Fund since January 1, 2024. For more complete information, you may review the Fund's next prospectus, which we expect to be available by April 30, 2025 at fundresearch.fidelity.com/prospectus/sec or upon request at 1-877-208-0098 or by sending an e-mail to funddocuments@fmr.com.
The fund's transfer agent and pricing & bookkeeping fees were changed to a fixed rate effective December 1, 2023. Effective March 1, 2024, the fund's management contract was amended to incorporate administrative services previously covered under separate services agreements (transfer agent and pricing & bookkeeping). The amended contract incorporates a management fee rate that may vary by class. The Adviser or an affiliate pays certain expenses of managing and operating the fund out of each class's management fee. | |
| Fidelity, the Fidelity Investments Logo and all other Fidelity trademarks or service marks used herein are trademarks or service marks of FMR LLC. Any third-party marks that are used herein are trademarks or service marks of their respective owners. © 2025 FMR LLC. All rights reserved. |
| | For additional information about the Fund; including its prospectus, financial information, holdings and proxy information, scan the QR code or visit fundresearch.fidelity.com/prospectus/sec 1.9914156.100 913-TSRA-0325 |
| |
| | ANNUAL SHAREHOLDER REPORT | AS OF DECEMBER 31, 2024 | This report describes changes to the Fund that occurred during the reporting period. |
| | VIP Utilities Portfolio VIP Utilities Portfolio Initial Class true |
| | | |
This annual shareholder report contains information about VIP Utilities Portfolio for the period January 1, 2024 to December 31, 2024. You can find additional information about the Fund at fundresearch.fidelity.com/prospectus/sec. You can also request this information by contacting us at 1-877-208-0098 or by sending an e-mail to funddocuments@fmr.com.
What were your Fund costs for the last year?(based on hypothetical $10,000 investment)
FUND COST (PREVIOUS YEAR)
| | Costs of a $10,000 investment | Costs paid as a percentage of a $10,000 investment | |
| Initial Class | $ 69 | 0.61% | |
What affected the Fund's performance this period?
•U.S. equities gained in 2024, driven by a sturdy economy, the Federal Reserve's long-anticipated pivot to cutting interest rates and the potential for artificial intelligence to drive transformative change.
•Against this backdrop, sector and industry positioning was the primary contributor to the fund's performance versus the MSCI U.S. IMI Utilities 25/50 Index for the fiscal year, led by an overweight in independent power producers & energy traders. Security selection in electric utilities also boosted the fund's relative performance. Also helping our relative result were stock picks and an underweight in multi-utilities.
•The top individual relative contributor was an overweight in Vistra (+262%). The stock was among our biggest holdings. The second-largest relative contributor was an overweight in Constellation Energy (+93%). The company was among the fund's biggest holdings. Another notable relative contributor was an overweight in Entergy (+55%). The company was one of the fund's largest holdings.
•In contrast, the biggest detractor from performance versus the sector index was stock picking in independent power producers & energy traders. Stock picking and an overweight in renewable electricity also hampered the fund's result. Also detracting from our result was security selection in coal & consumable fuels.
•The largest individual relative detractor was our stake in NextEra Energy Partners (-28%). The stock was not held at period end. The second-largest relative detractor was an overweight in AES (-30%). This period we increased our stake in AES. An overweight in Eversource Energy (-2%) also hurt. The company was one of the fund's largest holdings this period.
•Notable changes in positioning include higher allocations to the independent power producers & energy traders and multi-utilities industries.
How did the Fund perform over the past 10 years?
CUMULATIVE PERFORMANCE
December 31, 2014 through December 31, 2024.
Initial investment of $10,000.
Initial Class | $10,000 | $8,922 | $10,186 | $12,008 | $13,067 | $16,096 | $16,077 | $18,879 | $19,912 | $19,698 | $25,410 |
MSCI U.S. IMI Utilities 25-50 Index | $10,000 | $9,520 | $11,197 | $12,606 | $13,178 | $16,477 | $16,356 | $19,214 | $19,452 | $18,019 | $22,199 |
S&P 500® Index | $10,000 | $10,138 | $11,351 | $13,829 | $13,223 | $17,386 | $20,585 | $26,494 | $21,696 | $27,399 | $34,254 |
| | 2014 | 2015 | 2016 | 2017 | 2018 | 2019 | 2020 | 2021 | 2022 | 2023 | 2024 |
AVERAGE ANNUAL TOTAL RETURNS:| | 1 Year | 5 Year | 10 Year |
| Initial Class | 29.00% | 9.56% | 9.77% |
| MSCI U.S. IMI Utilities 25-50 Index | 23.20% | 6.14% | 8.30% |
| S&P 500® Index | 25.02% | 14.53% | 13.10% |
Visit institutional.fidelity.com for more recent performance information. |
The Fund's past performance is not a good predictor of the Fund's future performance. The graph and table do not reflect the deduction of taxes that a shareholder would pay on fund distributions or redemption of fund shares. |
Key Fund Statistics(as of December 31, 2024)
KEY FACTS | | |
| Fund Size | $317,106,179 | |
| Number of Holdings | 32 | |
| Total Advisory Fee | $1,503,476 | |
| Portfolio Turnover | 77% | |
What did the Fund invest in?
(as of December 31, 2024)
TOP INDUSTRIES (% of Fund's net assets) |
| Electric Utilities | 61.3 | |
| Multi-Utilities | 23.1 | |
| Independent Power and Renewable Electricity Producers | 7.7 | |
| Gas Utilities | 1.8 | |
| Electrical Equipment | 1.3 | |
| Semiconductors & Semiconductor Equipment | 0.3 | |
| |
| Common Stocks | 95.5 |
| Short-Term Investments and Net Other Assets (Liabilities) | 4.5 |
ASSET ALLOCATION (% of Fund's net assets) |
|
| | Common Stocks - 95.5 |
| | Short-Term Investments and Net Other Assets (Liabilities) - 4.5 |
| |
GEOGRAPHIC DIVERSIFICATION (% of Fund's net assets) |
|
TOP HOLDINGS(% of Fund's net assets) | | |
| NextEra Energy Inc | 9.8 | |
| Duke Energy Corp | 7.3 | |
| Sempra | 6.8 | |
| Constellation Energy Corp | 5.9 | |
| PG&E Corp | 5.8 | |
| Vistra Corp | 5.0 | |
| Entergy Corp | 4.9 | |
| Public Service Enterprise Group Inc | 4.3 | |
| Ameren Corp | 4.3 | |
| Xcel Energy Inc | 4.2 | |
| | 58.3 | |
How has the Fund changed?
This is a summary of certain changes to the Fund since January 1, 2024. For more complete information, you may review the Fund's next prospectus, which we expect to be available by April 30, 2025 at fundresearch.fidelity.com/prospectus/sec or upon request at 1-877-208-0098 or by sending an e-mail to funddocuments@fmr.com.
The fund's transfer agent and pricing & bookkeeping fees were changed to a fixed rate effective December 1, 2023. Effective March 1, 2024, the fund's management contract was amended to incorporate administrative services previously covered under separate services agreements (transfer agent and pricing & bookkeeping). The amended contract incorporates a management fee rate that may vary by class. The Adviser or an affiliate pays certain expenses of managing and operating the fund out of each class's management fee. | |
| Fidelity, the Fidelity Investments Logo and all other Fidelity trademarks or service marks used herein are trademarks or service marks of FMR LLC. Any third-party marks that are used herein are trademarks or service marks of their respective owners. © 2025 FMR LLC. All rights reserved. |
| | For additional information about the Fund; including its prospectus, financial information, holdings and proxy information, scan the QR code or visit fundresearch.fidelity.com/prospectus/sec 1.9914175.100 905-TSRA-0325 |
| |
| | ANNUAL SHAREHOLDER REPORT | AS OF DECEMBER 31, 2024 | This report describes changes to the Fund that occurred during the reporting period. |
| | VIP Industrials Portfolio VIP Industrials Portfolio Investor Class true |
| | | |
This annual shareholder report contains information about VIP Industrials Portfolio for the period January 1, 2024 to December 31, 2024. You can find additional information about the Fund at fundresearch.fidelity.com/prospectus/sec. You can also request this information by contacting us at 1-877-208-0098 or by sending an e-mail to funddocuments@fmr.com.
What were your Fund costs for the last year?(based on hypothetical $10,000 investment)
FUND COST (PREVIOUS YEAR)
| | Costs of a $10,000 investment | Costs paid as a percentage of a $10,000 investment | |
| Investor Class | $ 77 | 0.69% | |
What affected the Fund's performance this period?
•U.S. equities gained in 2024, driven by a sturdy economy, the Federal Reserve's long-anticipated pivot to cutting interest rates and the potential for artificial intelligence to drive transformative change.
•Against this backdrop, security selection was the primary contributor to the fund's performance versus the MSCI US IMI Industrials 25/50 Linked Index for the year, especially within industrial machinery & supplies & components. An overweight in heavy electrical equipment also boosted relative performance. Also lifting the fund's relative result were stock picking and an overweight in aerospace & defense.
•The top individual relative contributor was an overweight in Howmet Aerospace (+103%). The company was one of our largest holdings. A second notable relative contributor was an overweight in GE Vernova (+135%). This was a stake we established this period. The company was one of the fund's largest holdings at period end. Another notable relative contributor was an overweight in GE Aerospace (+65%). The company was the fund's biggest holding.
•In contrast, the primary detractor from performance versus the sector index was security selection in construction & engineering. Also hurting our result were an overweight in cargo ground transportation and an underweight in passenger airlines.
•The largest individual relative detractor was an overweight in Boeing (-31%). The stock was one of our largest holdings. The second-largest relative detractor was an overweight in Knight-Swift Transportation (-7%). Another notable relative detractor this period was avoiding RTX, an index component that gained 41%.
•Notable changes in positioning include increased exposure to the heavy electrical equipment and trading companies & distributors industries.
How did the Fund perform over the past 10 years?
CUMULATIVE PERFORMANCE
December 31, 2014 through December 31, 2024.
Initial investment of $10,000.
Investor Class | $10,000 | $9,803 | $11,346 | $13,620 | $11,558 | $14,797 | $16,601 | $19,428 | $17,404 | $21,444 | $26,491 |
MSCI U.S. IMI Industrials 25-50 Index | $10,000 | $9,645 | $11,616 | $14,125 | $12,169 | $15,854 | $17,825 | $21,537 | $19,724 | $24,157 | $28,277 |
S&P 500® Index | $10,000 | $10,138 | $11,351 | $13,829 | $13,223 | $17,386 | $20,585 | $26,494 | $21,696 | $27,399 | $34,254 |
| | 2014 | 2015 | 2016 | 2017 | 2018 | 2019 | 2020 | 2021 | 2022 | 2023 | 2024 |
AVERAGE ANNUAL TOTAL RETURNS:| | 1 Year | 5 Year | 10 Year |
| Investor Class | 23.54% | 12.35% | 10.23% |
| MSCI U.S. IMI Industrials 25-50 Index | 17.05% | 12.27% | 10.95% |
| S&P 500® Index | 25.02% | 14.53% | 13.10% |
Visit institutional.fidelity.com for more recent performance information. |
The Fund's past performance is not a good predictor of the Fund's future performance. The graph and table do not reflect the deduction of taxes that a shareholder would pay on fund distributions or redemption of fund shares. |
Key Fund Statistics(as of December 31, 2024)
KEY FACTS | | |
| Fund Size | $239,293,073 | |
| Number of Holdings | 54 | |
| Total Advisory Fee | $1,346,907 | |
| Portfolio Turnover | 33% | |
What did the Fund invest in?
(as of December 31, 2024)
TOP INDUSTRIES (% of Fund's net assets) |
| Aerospace & Defense | 23.5 | |
| Machinery | 21.6 | |
| Electrical Equipment | 14.7 | |
| Building Products | 10.9 | |
| Ground Transportation | 10.7 | |
| Trading Companies & Distributors | 7.0 | |
| Construction & Engineering | 3.8 | |
| Professional Services | 2.8 | |
| Commercial Services & Supplies | 2.6 | |
| Others | 1.4 | |
| |
| Common Stocks | 99.0 |
| Short-Term Investments and Net Other Assets (Liabilities) | 1.0 |
ASSET ALLOCATION (% of Fund's net assets) |
|
| | Common Stocks - 99.0 |
| | Short-Term Investments and Net Other Assets (Liabilities) - 1.0 |
| |
GEOGRAPHIC DIVERSIFICATION (% of Fund's net assets) |
|
TOP HOLDINGS(% of Fund's net assets) | | |
| GE Aerospace | 5.9 | |
| GE Vernova Inc | 5.2 | |
| Howmet Aerospace Inc | 5.0 | |
| Parker-Hannifin Corp | 4.3 | |
| Boeing Co | 4.2 | |
| Ingersoll Rand Inc | 4.0 | |
| Trane Technologies PLC | 4.0 | |
| TransDigm Group Inc | 3.5 | |
| Eaton Corp PLC | 3.5 | |
| Union Pacific Corp | 3.5 | |
| | 43.1 | |
How has the Fund changed?
This is a summary of certain changes to the Fund since January 1, 2024. For more complete information, you may review the Fund's next prospectus, which we expect to be available by April 30, 2025 at fundresearch.fidelity.com/prospectus/sec or upon request at 1-877-208-0098 or by sending an e-mail to funddocuments@fmr.com.
The fees associated with this class changed during the reporting year. The variations in class fees are primarily the result of the following changes:- Management fee
- Operating expenses
The fund's transfer agent and pricing & bookkeeping fees were changed to a fixed rate effective December 1, 2023. Effective March 1, 2024, the fund's management contract was amended to incorporate administrative services previously covered under separate services agreements (transfer agent and pricing & bookkeeping). The amended contract incorporates a management fee rate that may vary by class. The Adviser or an affiliate pays certain expenses of managing and operating the fund out of each class's management fee. | |
| Fidelity, the Fidelity Investments Logo and all other Fidelity trademarks or service marks used herein are trademarks or service marks of FMR LLC. Any third-party marks that are used herein are trademarks or service marks of their respective owners. © 2025 FMR LLC. All rights reserved. |
| | For additional information about the Fund; including its prospectus, financial information, holdings and proxy information, scan the QR code or visit fundresearch.fidelity.com/prospectus/sec 1.9914233.100 1475-TSRA-0325 |
| |
| | ANNUAL SHAREHOLDER REPORT | AS OF DECEMBER 31, 2024 | This report describes changes to the Fund that occurred during the reporting period. |
| | VIP Communication Services Portfolio VIP Communication Services Portfolio Initial Class true |
| | | |
This annual shareholder report contains information about VIP Communication Services Portfolio for the period January 1, 2024 to December 31, 2024. You can find additional information about the Fund at fundresearch.fidelity.com/prospectus/sec. You can also request this information by contacting us at 1-877-208-0098 or by sending an e-mail to funddocuments@fmr.com.
What were your Fund costs for the last year?(based on hypothetical $10,000 investment)
FUND COST (PREVIOUS YEAR)
| | Costs of a $10,000 investment | Costs paid as a percentage of a $10,000 investment | |
| Initial Class | $ 71 | 0.61% | |
What affected the Fund's performance this period?
•U.S. equities gained in 2024, driven by a sturdy economy, the Federal Reserve's long-anticipated pivot to cutting interest rates and the potential for artificial intelligence to drive transformative change.
•Against this backdrop, security selection contributed to the fund's performance versus the MSCI U.S. IMI Communication Services 25/50 Index for the fiscal year, led by interactive media & services. An overweight in alternative carriers also boosted relative performance. Also bolstering our relative result were picks in interactive home entertainment.
•The top individual relative contributor was an overweight in Meta Platforms (+66%). We trimmed the position, but the company was among the fund's biggest holdings this period. A non-index stake in Sea gained about 159% and was a second notable relative contributor. This period we decreased our stake in Sea. Another notable relative contributor was an underweight in Comcast (-12%). We reduced our stake in Comcast this period.
•In contrast, the biggest detractor from performance versus the sector index was stock selection in alternative carriers. An underweight in wireless telecommunication services also hampered the fund's result. Also hurting our result were stock picks in passenger ground transportation.
•The largest individual relative detractor was an overweight in Snap (-36%). The second-largest relative detractor was our stake in Charter Communications (-10%). This period we decreased our stake in Charter Communications. Another notable relative detractor was our stake in Trade Desk (-11%). This was a stake we established this period. The company was one of our largest holdings at period end.
•Notable changes in positioning include increased exposure to the interactive home entertainment industry and a lower allocation to cable & satellite.
How did the Fund perform over the past 10 years?
CUMULATIVE PERFORMANCE
December 31, 2014 through December 31, 2024.
Initial investment of $10,000.
Initial Class | $10,000 | $10,234 | $12,568 | $12,826 | $12,138 | $16,142 | $21,888 | $25,313 | $15,660 | $24,648 | $33,037 |
MSCI U.S. IMI Communication Services 25-50 Index | $10,000 | $10,273 | $12,579 | $11,860 | $11,255 | $14,400 | $18,578 | $21,154 | $12,959 | $18,713 | $24,899 |
S&P 500® Index | $10,000 | $10,138 | $11,351 | $13,829 | $13,223 | $17,386 | $20,585 | $26,494 | $21,696 | $27,399 | $34,254 |
| | 2014 | 2015 | 2016 | 2017 | 2018 | 2019 | 2020 | 2021 | 2022 | 2023 | 2024 |
AVERAGE ANNUAL TOTAL RETURNS:| | 1 Year | 5 Year | 10 Year |
| Initial Class | 34.04% | 15.40% | 12.69% |
| MSCI U.S. IMI Communication Services 25-50 Index | 33.06% | 11.57% | 9.55% |
| S&P 500® Index | 25.02% | 14.53% | 13.10% |
Visit institutional.fidelity.com for more recent performance information. |
The Fund's past performance is not a good predictor of the Fund's future performance. The graph and table do not reflect the deduction of taxes that a shareholder would pay on fund distributions or redemption of fund shares. |
Key Fund Statistics(as of December 31, 2024)
KEY FACTS | | |
| Fund Size | $237,361,314 | |
| Number of Holdings | 38 | |
| Total Advisory Fee | $1,373,959 | |
| Portfolio Turnover | 73% | |
What did the Fund invest in?
(as of December 31, 2024)
TOP INDUSTRIES (% of Fund's net assets) |
| Interactive Media & Services | 54.0 | |
| Entertainment | 25.2 | |
| Media | 6.8 | |
| Diversified Telecommunication Services | 6.3 | |
| Broadline Retail | 2.6 | |
| Semiconductors & Semiconductor Equipment | 1.5 | |
| Software | 1.2 | |
| Capital Markets | 1.0 | |
| Automobiles | 0.1 | |
| |
| Common Stocks | 98.6 |
| Preferred Stocks | 0.1 |
| Short-Term Investments and Net Other Assets (Liabilities) | 1.3 |
ASSET ALLOCATION (% of Fund's net assets) |
|
| | Common Stocks - 98.6 |
| | Preferred Stocks - 0.1 |
| | Short-Term Investments and Net Other Assets (Liabilities) - 1.3 |
| |
| United States | 97.5 |
| Japan | 0.7 |
| Singapore | 0.7 |
| Taiwan | 0.6 |
| United Kingdom | 0.5 |
GEOGRAPHIC DIVERSIFICATION (% of Fund's net assets) |
|
| | United States - 97.5 |
| | Japan - 0.7 |
| | Singapore - 0.7 |
| | Taiwan - 0.6 |
| | United Kingdom - 0.5 |
| |
TOP HOLDINGS(% of Fund's net assets) | | |
| Alphabet Inc Class A | 25.0 | |
| Meta Platforms Inc Class A | 24.2 | |
| Walt Disney Co/The | 5.0 | |
| Netflix Inc | 4.8 | |
| AT&T Inc | 4.5 | |
| Trade Desk Inc (The) Class A | 2.7 | |
| Amazon.com Inc | 2.6 | |
| Warner Bros Discovery Inc | 2.3 | |
| Take-Two Interactive Software Inc | 2.3 | |
| ROBLOX Corp Class A | 2.3 | |
| | 75.7 | |
How has the Fund changed?
This is a summary of certain changes to the Fund since January 1, 2024. For more complete information, you may review the Fund's next prospectus, which we expect to be available by April 30, 2025 at fundresearch.fidelity.com/prospectus/sec or upon request at 1-877-208-0098 or by sending an e-mail to funddocuments@fmr.com.
The fees associated with this class changed during the reporting year. The variations in class fees are primarily the result of the following changes:- Management fee
- Operating expenses
The fund's transfer agent and pricing & bookkeeping fees were changed to a fixed rate effective December 1, 2023. Effective March 1, 2024, the fund's management contract was amended to incorporate administrative services previously covered under separate services agreements (transfer agent and pricing & bookkeeping). The amended contract incorporates a management fee rate that may vary by class. The Adviser or an affiliate pays certain expenses of managing and operating the fund out of each class's management fee. | |
| Fidelity, the Fidelity Investments Logo and all other Fidelity trademarks or service marks used herein are trademarks or service marks of FMR LLC. Any third-party marks that are used herein are trademarks or service marks of their respective owners. © 2025 FMR LLC. All rights reserved. |
| | For additional information about the Fund; including its prospectus, financial information, holdings and proxy information, scan the QR code or visit fundresearch.fidelity.com/prospectus/sec 1.9914321.100 1843-TSRA-0325 |
| |
| | ANNUAL SHAREHOLDER REPORT | AS OF DECEMBER 31, 2024 | This report describes changes to the Fund that occurred during the reporting period. |
| | VIP Energy Portfolio VIP Energy Portfolio Initial Class true |
| | | |
This annual shareholder report contains information about VIP Energy Portfolio for the period January 1, 2024 to December 31, 2024. You can find additional information about the Fund at fundresearch.fidelity.com/prospectus/sec. You can also request this information by contacting us at 1-877-208-0098 or by sending an e-mail to funddocuments@fmr.com.
What were your Fund costs for the last year?(based on hypothetical $10,000 investment)
FUND COST (PREVIOUS YEAR)
| | Costs of a $10,000 investment | Costs paid as a percentage of a $10,000 investment | |
| Initial Class | $ 61 | 0.60% | |
What affected the Fund's performance this period?
•U.S. equities gained in 2024, driven by a sturdy economy, the Federal Reserve's long-anticipated pivot to cutting interest rates and the potential for artificial intelligence to drive transformative change.
•Against this backdrop, industry positioning was the primary detractor from the fund's performance versus the MSCI U.S. IMI Energy 25/50 Index for the fiscal year, especially an underweight in oil & gas storage & transportation. Stock selection and an overweight in oil & gas drilling also hampered the fund's result. Also hurting our result were stock picks in integrated oil & gas.
•The largest individual relative detractor this period was avoiding Williams Companies, an index component that gained roughly 62%. Not owning Kinder Morgan, an index component that gained roughly 64%, was the second-largest relative detractor. Another notable relative detractor was an overweight in Valaris (-35%).
•In contrast, the biggest contributor to performance versus the sector index was security selection in independent power producers & energy traders, a group not part of the index. Picks in oil & gas refining & marketing and oil & gas equipment & services also boosted the fund's relative performance.
•The fund's non-index stake in Vistra gained approximately 260% and was the top individual relative contributor. A non-index stake in Energy Transfer gained roughly 54% and was a second notable relative contributor. The company was one of the fund's biggest holdings at period end. An overweight in TechnipFMC (+45%) also helped. The company was among our largest holdings at period end.
•Notable changes in positioning include increased exposure to the oil & gas storage & transportation industry and a lower allocation to oil & gas equipment & services.
How did the Fund perform over the past 10 years?
CUMULATIVE PERFORMANCE
December 31, 2014 through December 31, 2024.
Initial investment of $10,000.
Initial Class | $10,000 | $7,946 | $10,635 | $10,371 | $7,822 | $8,611 | $5,789 | $8,994 | $14,676 | $14,821 | $15,458 |
MSCI U.S. IMI Energy 25-50 Index | $10,000 | $7,680 | $9,950 | $9,718 | $7,794 | $8,528 | $5,711 | $8,925 | $14,558 | $14,577 | $15,549 |
S&P 500® Index | $10,000 | $10,138 | $11,351 | $13,829 | $13,223 | $17,386 | $20,585 | $26,494 | $21,696 | $27,399 | $34,254 |
| | 2014 | 2015 | 2016 | 2017 | 2018 | 2019 | 2020 | 2021 | 2022 | 2023 | 2024 |
AVERAGE ANNUAL TOTAL RETURNS:| | 1 Year | 5 Year | 10 Year |
| Initial Class | 4.30% | 12.41% | 4.45% |
| MSCI U.S. IMI Energy 25-50 Index | 6.67% | 12.76% | 4.51% |
| S&P 500® Index | 25.02% | 14.53% | 13.10% |
Visit institutional.fidelity.com for more recent performance information. |
The Fund's past performance is not a good predictor of the Fund's future performance. The graph and table do not reflect the deduction of taxes that a shareholder would pay on fund distributions or redemption of fund shares. |
Key Fund Statistics(as of December 31, 2024)
KEY FACTS | | |
| Fund Size | $456,406,141 | |
| Number of Holdings | 38 | |
| Total Advisory Fee | $3,088,735 | |
| Portfolio Turnover | 17% | |
What did the Fund invest in?
(as of December 31, 2024)
TOP INDUSTRIES (% of Fund's net assets) |
| Oil, Gas & Consumable Fuels | 81.8 | |
| Energy Equipment & Services | 14.0 | |
| Independent Power and Renewable Electricity Producers | 2.7 | |
| Machinery | 1.2 | |
| |
| Common Stocks | 99.7 |
| Short-Term Investments and Net Other Assets (Liabilities) | 0.3 |
ASSET ALLOCATION (% of Fund's net assets) |
|
| | Common Stocks - 99.7 |
| | Short-Term Investments and Net Other Assets (Liabilities) - 0.3 |
| |
| United States | 84.1 |
| Canada | 11.9 |
| United Kingdom | 3.6 |
| Norway | 0.2 |
| France | 0.2 |
GEOGRAPHIC DIVERSIFICATION (% of Fund's net assets) |
|
| | United States - 84.1 |
| | Canada - 11.9 |
| | United Kingdom - 3.6 |
| | Norway - 0.2 |
| | France - 0.2 |
| |
TOP HOLDINGS(% of Fund's net assets) | | |
| Exxon Mobil Corp | 24.0 | |
| Cheniere Energy Inc | 5.6 | |
| Chevron Corp | 5.4 | |
| Cenovus Energy Inc | 5.3 | |
| Energy Transfer LP | 5.3 | |
| Canadian Natural Resources Ltd | 4.5 | |
| Schlumberger NV | 4.3 | |
| Marathon Petroleum Corp | 4.2 | |
| TechnipFMC PLC | 3.5 | |
| Occidental Petroleum Corp | 3.5 | |
| | 65.6 | |
How has the Fund changed?
This is a summary of certain changes to the Fund since January 1, 2024. For more complete information, you may review the Fund's next prospectus, which we expect to be available by April 30, 2025 at fundresearch.fidelity.com/prospectus/sec or upon request at 1-877-208-0098 or by sending an e-mail to funddocuments@fmr.com.
The fees associated with this class changed during the reporting year. The variations in class fees are primarily the result of the following changes:- Management fee
- Operating expenses
The fund's transfer agent and pricing & bookkeeping fees were changed to a fixed rate effective December 1, 2023. Effective March 1, 2024, the fund's management contract was amended to incorporate administrative services previously covered under separate services agreements (transfer agent and pricing & bookkeeping). The amended contract incorporates a management fee rate that may vary by class. The Adviser or an affiliate pays certain expenses of managing and operating the fund out of each class's management fee. | |
| Fidelity, the Fidelity Investments Logo and all other Fidelity trademarks or service marks used herein are trademarks or service marks of FMR LLC. Any third-party marks that are used herein are trademarks or service marks of their respective owners. © 2025 FMR LLC. All rights reserved. |
| | For additional information about the Fund; including its prospectus, financial information, holdings and proxy information, scan the QR code or visit fundresearch.fidelity.com/prospectus/sec 1.9914159.100 930-TSRA-0325 |
| |
| | ANNUAL SHAREHOLDER REPORT | AS OF DECEMBER 31, 2024 | This report describes changes to the Fund that occurred during the reporting period. |
| | VIP Financials Portfolio VIP Financials Portfolio Investor Class true |
| | | |
This annual shareholder report contains information about VIP Financials Portfolio for the period January 1, 2024 to December 31, 2024. You can find additional information about the Fund at fundresearch.fidelity.com/prospectus/sec. You can also request this information by contacting us at 1-877-208-0098 or by sending an e-mail to funddocuments@fmr.com.
What were your Fund costs for the last year?(based on hypothetical $10,000 investment)
FUND COST (PREVIOUS YEAR)
| | Costs of a $10,000 investment | Costs paid as a percentage of a $10,000 investment | |
| Investor Class | $ 81 | 0.69% | |
What affected the Fund's performance this period?
•U.S. equities gained in 2024, driven by a sturdy economy, the Federal Reserve's long-anticipated pivot to cutting interest rates and the potential for artificial intelligence to drive transformative change.
•Against this backdrop, industry positioning was the primary contributor to the fund's performance versus the MSCI US IMI Financials 5% Capped Linked Index for the year, especially an overweight in diversified financial services. Stock picks among investment banking & brokerage firms and regional banks also boosted the fund's relative performance.
•The top individual relative contributor was an overweight in Apollo Global Management (+80%). The stock was among our biggest holdings. Outsized exposure to Baldwin Insurance Group (+62%) also helped. Another notable relative contributor was a larger-than-index stake in LPL Financial Holdings (+57%). This was a position we established this period and one of our largest holdings at the end of 2024.
•In contrast, the biggest detractor from performance versus the sector index was security selection in asset management & custody banks. Also hurting our result was stock picking in the financial exchanges & data and property & casualty insurance industries.
•Not owning JPMorgan Chase, an index component that gained roughly 44%, was the largest individual relative detractor. Avoiding American Express, an index component that gained about 60%, also hurt. An outsized allocation to MarketAxess Holdings (-22%) further detracted. This period we increased our stake in MarketAxess Holdings.
•Notable changes in positioning include increased exposure to the consumer finance and diversified financial services industries.
How did the Fund perform over the past 10 years?
CUMULATIVE PERFORMANCE
December 31, 2014 through December 31, 2024.
Initial investment of $10,000.
Investor Class | $10,000 | $9,632 | $11,415 | $13,832 | $11,644 | $15,636 | $15,735 | $20,949 | $19,194 | $21,991 | $29,191 |
MSCI U.S. IMI Financials 5% Capped Linked Index | $10,000 | $9,960 | $12,424 | $14,762 | $12,734 | $16,731 | $16,480 | $22,421 | $19,913 | $22,604 | $29,433 |
S&P 500® Index | $10,000 | $10,138 | $11,351 | $13,829 | $13,223 | $17,386 | $20,585 | $26,494 | $21,696 | $27,399 | $34,254 |
| | 2014 | 2015 | 2016 | 2017 | 2018 | 2019 | 2020 | 2021 | 2022 | 2023 | 2024 |
AVERAGE ANNUAL TOTAL RETURNS:| | 1 Year | 5 Year | 10 Year |
| Investor Class | 32.74% | 13.30% | 11.31% |
| MSCI U.S. IMI Financials 5% Capped Linked Index | 30.21% | 11.96% | 11.40% |
| S&P 500® Index | 25.02% | 14.53% | 13.10% |
Visit institutional.fidelity.com for more recent performance information. |
The Fund's past performance is not a good predictor of the Fund's future performance. The graph and table do not reflect the deduction of taxes that a shareholder would pay on fund distributions or redemption of fund shares. |
Key Fund Statistics(as of December 31, 2024)
KEY FACTS | | |
| Fund Size | $295,521,247 | |
| Number of Holdings | 68 | |
| Total Advisory Fee | $1,447,937 | |
| Portfolio Turnover | 37% | |
What did the Fund invest in?
(as of December 31, 2024)
TOP INDUSTRIES (% of Fund's net assets) |
| Banks | 31.4 | |
| Financial Services | 22.2 | |
| Capital Markets | 20.5 | |
| Insurance | 17.9 | |
| Consumer Finance | 6.8 | |
| Professional Services | 1.0 | |
| |
| Common Stocks | 99.8 |
| Short-Term Investments and Net Other Assets (Liabilities) | 0.2 |
ASSET ALLOCATION (% of Fund's net assets) |
|
| | Common Stocks - 99.8 |
| | Short-Term Investments and Net Other Assets (Liabilities) - 0.2 |
| |
| United States | 94.0 |
| United Kingdom | 3.6 |
| Puerto Rico | 1.5 |
| Grand Cayman (UK Overseas Ter) | 0.6 |
| Mexico | 0.3 |
GEOGRAPHIC DIVERSIFICATION (% of Fund's net assets) |
|
| | United States - 94.0 |
| | United Kingdom - 3.6 |
| | Puerto Rico - 1.5 |
| | Grand Cayman (UK Overseas Ter) - 0.6 |
| | Mexico - 0.3 |
| |
TOP HOLDINGS(% of Fund's net assets) | | |
| Mastercard Inc Class A | 8.8 | |
| Wells Fargo & Co | 6.1 | |
| Bank of America Corp | 5.0 | |
| Citigroup Inc | 4.1 | |
| Reinsurance Group of America Inc | 3.7 | |
| Apollo Global Management Inc | 3.3 | |
| Visa Inc Class A | 2.6 | |
| Morgan Stanley | 2.4 | |
| LPL Financial Holdings Inc | 2.3 | |
| Marsh & McLennan Cos Inc | 2.2 | |
| | 40.5 | |
How has the Fund changed?
This is a summary of certain changes to the Fund since January 1, 2024. For more complete information, you may review the Fund's next prospectus, which we expect to be available by April 30, 2025 at fundresearch.fidelity.com/prospectus/sec or upon request at 1-877-208-0098 or by sending an e-mail to funddocuments@fmr.com.
The fees associated with this class changed during the reporting year. The variations in class fees are primarily the result of the following changes:- Management fee
- Operating expenses
The fund's transfer agent and pricing & bookkeeping fees were changed to a fixed rate effective December 1, 2023. Effective March 1, 2024, the fund's management contract was amended to incorporate administrative services previously covered under separate services agreements (transfer agent and pricing & bookkeeping). The amended contract incorporates a management fee rate that may vary by class. The Adviser or an affiliate pays certain expenses of managing and operating the fund out of each class's management fee. | |
| Fidelity, the Fidelity Investments Logo and all other Fidelity trademarks or service marks used herein are trademarks or service marks of FMR LLC. Any third-party marks that are used herein are trademarks or service marks of their respective owners. © 2025 FMR LLC. All rights reserved. |
| | For additional information about the Fund; including its prospectus, financial information, holdings and proxy information, scan the QR code or visit fundresearch.fidelity.com/prospectus/sec 1.9914230.100 1476-TSRA-0325 |
| |
| | ANNUAL SHAREHOLDER REPORT | AS OF DECEMBER 31, 2024 | This report describes changes to the Fund that occurred during the reporting period. |
| | VIP Health Care Portfolio VIP Health Care Portfolio Investor Class true |
| | | |
This annual shareholder report contains information about VIP Health Care Portfolio for the period January 1, 2024 to December 31, 2024. You can find additional information about the Fund at fundresearch.fidelity.com/prospectus/sec. You can also request this information by contacting us at 1-877-208-0098 or by sending an e-mail to funddocuments@fmr.com.
What were your Fund costs for the last year?(based on hypothetical $10,000 investment)
FUND COST (PREVIOUS YEAR)
| | Costs of a $10,000 investment | Costs paid as a percentage of a $10,000 investment | |
| Investor Class | $ 69 | 0.67% | |
What affected the Fund's performance this period?
•U.S. equities gained in 2024, driven by a sturdy economy, the Federal Reserve's long-anticipated pivot to cutting interest rates and the potential for artificial intelligence to drive transformative change.
•Against this backdrop, security selection was the primary contributor to the fund's performance versus the MSCI U.S. IMI Health Care 25/50 Index for the fiscal year, especially within health care equipment. Stock selection in pharmaceuticals and managed health care also boosted the fund's relative performance.
•The top individual relative contributor was an overweight in Boston Scientific (+54%). The company was the fund's largest holding on average this period. The second-largest relative contributor was our non-index stake in Argenx (+61%). The stock was one of our largest holdings at period end. An overweight in Masimo (+41%) also contributed. The company was among the fund's largest holdings at period end.
•In contrast, the primary detractors from performance versus the sector index were stock picks and an overweight in health care services. Also hurting our result were stock choices in health care facilities and life sciences tools & services.
•The biggest individual relative detractor was an overweight in 10X Genomics (-74%). The second-largest relative detractor was our stake in agilon health (-84%). The stock was not held at period end. A non-index stake in Legend Biotech returned -46% and notably hurt. This period we increased our stake in Legend Biotech.
•Notable changes in positioning include decreased exposure to the health care services industry and a higher allocation to biotechnology.
How did the Fund perform over the past 10 years?
CUMULATIVE PERFORMANCE
December 31, 2014 through December 31, 2024.
Initial investment of $10,000.
Investor Class | $10,000 | $10,629 | $9,512 | $11,887 | $12,805 | $16,428 | $19,958 | $22,284 | $19,500 | $20,323 | $21,350 |
MSCI U.S. IMI Health Care 25-50 Index | $10,000 | $10,723 | $10,374 | $12,806 | $13,525 | $16,504 | $19,521 | $23,544 | $22,265 | $22,834 | $23,463 |
S&P 500® Index | $10,000 | $10,138 | $11,351 | $13,829 | $13,223 | $17,386 | $20,585 | $26,494 | $21,696 | $27,399 | $34,254 |
| | 2014 | 2015 | 2016 | 2017 | 2018 | 2019 | 2020 | 2021 | 2022 | 2023 | 2024 |
AVERAGE ANNUAL TOTAL RETURNS:| | 1 Year | 5 Year | 10 Year |
| Investor Class | 5.05% | 5.38% | 7.88% |
| MSCI U.S. IMI Health Care 25-50 Index | 2.75% | 7.29% | 8.90% |
| S&P 500® Index | 25.02% | 14.53% | 13.10% |
Visit institutional.fidelity.com for more recent performance information. |
The Fund's past performance is not a good predictor of the Fund's future performance. The graph and table do not reflect the deduction of taxes that a shareholder would pay on fund distributions or redemption of fund shares. |
Key Fund Statistics(as of December 31, 2024)
KEY FACTS | | |
| Fund Size | $1,064,998,831 | |
| Number of Holdings | 112 | |
| Total Advisory Fee | $7,050,001 | |
| Portfolio Turnover | 44% | |
What did the Fund invest in?
(as of December 31, 2024)
TOP INDUSTRIES (% of Fund's net assets) |
| Health Care Equipment & Supplies | 30.3 | |
| Biotechnology | 24.7 | |
| Health Care Providers & Services | 20.7 | |
| Pharmaceuticals | 10.9 | |
| Life Sciences Tools & Services | 10.2 | |
| Health Care Technology | 2.4 | |
| Financial Services | 0.1 | |
| |
| Common Stocks | 97.6 |
| Preferred Stocks | 1.5 |
| Preferred Securities | 0.2 |
| Bonds | 0.0 |
| Short-Term Investments and Net Other Assets (Liabilities) | 0.7 |
ASSET ALLOCATION (% of Fund's net assets) |
|
| | Common Stocks - 97.6 |
| | Preferred Stocks - 1.5 |
| | Preferred Securities - 0.2 |
| | Bonds - 0.0 |
| | Short-Term Investments and Net Other Assets (Liabilities) - 0.7 |
| |
| United States | 91.5 |
| Netherlands | 3.6 |
| Belgium | 2.0 |
| Denmark | 1.4 |
| Canada | 0.9 |
| United Kingdom | 0.2 |
| Germany | 0.2 |
| Israel | 0.2 |
| China | 0.0 |
GEOGRAPHIC DIVERSIFICATION (% of Fund's net assets) |
|
| | United States - 91.5 |
| | Netherlands - 3.6 |
| | Belgium - 2.0 |
| | Denmark - 1.4 |
| | Canada - 0.9 |
| | United Kingdom - 0.2 |
| | Germany - 0.2 |
| | Israel - 0.2 |
| | China - 0.0 |
| |
TOP HOLDINGS(% of Fund's net assets) | | |
| UnitedHealth Group Inc | 11.2 | |
| Boston Scientific Corp | 10.8 | |
| Eli Lilly & Co | 5.9 | |
| Danaher Corp | 5.5 | |
| Penumbra Inc | 4.7 | |
| Insulet Corp | 3.5 | |
| Stryker Corp | 3.1 | |
| Masimo Corp | 3.1 | |
| Argenx SE ADR | 2.8 | |
| Thermo Fisher Scientific Inc | 2.1 | |
| | 52.7 | |
How has the Fund changed?
This is a summary of certain changes to the Fund since January 1, 2024. For more complete information, you may review the Fund's next prospectus, which we expect to be available by April 30, 2025 at fundresearch.fidelity.com/prospectus/sec or upon request at 1-877-208-0098 or by sending an e-mail to funddocuments@fmr.com.
The fund's transfer agent and pricing & bookkeeping fees were changed to a fixed rate effective December 1, 2023. Effective March 1, 2024, the fund's management contract was amended to incorporate administrative services previously covered under separate services agreements (transfer agent and pricing & bookkeeping). The amended contract incorporates a management fee rate that may vary by class. The Adviser or an affiliate pays certain expenses of managing and operating the fund out of each class's management fee. | |
| Fidelity, the Fidelity Investments Logo and all other Fidelity trademarks or service marks used herein are trademarks or service marks of FMR LLC. Any third-party marks that are used herein are trademarks or service marks of their respective owners. © 2025 FMR LLC. All rights reserved. |
| | For additional information about the Fund; including its prospectus, financial information, holdings and proxy information, scan the QR code or visit fundresearch.fidelity.com/prospectus/sec 1.9914161.100 1477-TSRA-0325 |
| |
| | ANNUAL SHAREHOLDER REPORT | AS OF DECEMBER 31, 2024 | This report describes changes to the Fund that occurred during the reporting period. |
| | VIP Energy Portfolio VIP Energy Portfolio Service Class 2 true |
| | | |
This annual shareholder report contains information about VIP Energy Portfolio for the period January 1, 2024 to December 31, 2024. You can find additional information about the Fund at fundresearch.fidelity.com/prospectus/sec. You can also request this information by contacting us at 1-877-208-0098 or by sending an e-mail to funddocuments@fmr.com.
What were your Fund costs for the last year?(based on hypothetical $10,000 investment)
FUND COST (PREVIOUS YEAR)
| | Costs of a $10,000 investment | Costs paid as a percentage of a $10,000 investment | |
| Service Class 2 | $ 87 | 0.85% | |
What affected the Fund's performance this period?
•U.S. equities gained in 2024, driven by a sturdy economy, the Federal Reserve's long-anticipated pivot to cutting interest rates and the potential for artificial intelligence to drive transformative change.
•Against this backdrop, industry positioning was the primary detractor from the fund's performance versus the MSCI U.S. IMI Energy 25/50 Index for the fiscal year, especially an underweight in oil & gas storage & transportation. Stock selection and an overweight in oil & gas drilling also hampered the fund's result. Also hurting our result were stock picks in integrated oil & gas.
•The largest individual relative detractor this period was avoiding Williams Companies, an index component that gained roughly 62%. Not owning Kinder Morgan, an index component that gained roughly 64%, was the second-largest relative detractor. Another notable relative detractor was an overweight in Valaris (-35%).
•In contrast, the biggest contributor to performance versus the sector index was security selection in independent power producers & energy traders, a group not part of the index. Picks in oil & gas refining & marketing and oil & gas equipment & services also boosted the fund's relative performance.
•The fund's non-index stake in Vistra gained approximately 260% and was the top individual relative contributor. A non-index stake in Energy Transfer gained roughly 54% and was a second notable relative contributor. The company was one of the fund's biggest holdings at period end. An overweight in TechnipFMC (+45%) also helped. The company was among our largest holdings at period end.
•Notable changes in positioning include increased exposure to the oil & gas storage & transportation industry and a lower allocation to oil & gas equipment & services.
How did the Fund perform over the past 10 years?
CUMULATIVE PERFORMANCE
December 31, 2014 through December 31, 2024.
Initial investment of $10,000.
Service Class 2 | $10,000 | $7,925 | $10,581 | $10,287 | $7,739 | $8,499 | $5,705 | $8,833 | $14,385 | $14,486 | $15,069 |
MSCI U.S. IMI Energy 25-50 Index | $10,000 | $7,680 | $9,950 | $9,718 | $7,794 | $8,528 | $5,711 | $8,925 | $14,558 | $14,577 | $15,549 |
S&P 500® Index | $10,000 | $10,138 | $11,351 | $13,829 | $13,223 | $17,386 | $20,585 | $26,494 | $21,696 | $27,399 | $34,254 |
| | 2014 | 2015 | 2016 | 2017 | 2018 | 2019 | 2020 | 2021 | 2022 | 2023 | 2024 |
AVERAGE ANNUAL TOTAL RETURNS:| | 1 Year | 5 Year | 10 Year |
| Service Class 2 | 4.02% | 12.13% | 4.19% |
| MSCI U.S. IMI Energy 25-50 Index | 6.67% | 12.76% | 4.51% |
| S&P 500® Index | 25.02% | 14.53% | 13.10% |
Visit institutional.fidelity.com for more recent performance information. |
The Fund's past performance is not a good predictor of the Fund's future performance. The graph and table do not reflect the deduction of taxes that a shareholder would pay on fund distributions or redemption of fund shares. |
Key Fund Statistics(as of December 31, 2024)
KEY FACTS | | |
| Fund Size | $456,406,141 | |
| Number of Holdings | 38 | |
| Total Advisory Fee | $3,088,735 | |
| Portfolio Turnover | 17% | |
What did the Fund invest in?
(as of December 31, 2024)
TOP INDUSTRIES (% of Fund's net assets) |
| Oil, Gas & Consumable Fuels | 81.8 | |
| Energy Equipment & Services | 14.0 | |
| Independent Power and Renewable Electricity Producers | 2.7 | |
| Machinery | 1.2 | |
| |
| Common Stocks | 99.7 |
| Short-Term Investments and Net Other Assets (Liabilities) | 0.3 |
ASSET ALLOCATION (% of Fund's net assets) |
|
| | Common Stocks - 99.7 |
| | Short-Term Investments and Net Other Assets (Liabilities) - 0.3 |
| |
| United States | 84.1 |
| Canada | 11.9 |
| United Kingdom | 3.6 |
| Norway | 0.2 |
| France | 0.2 |
GEOGRAPHIC DIVERSIFICATION (% of Fund's net assets) |
|
| | United States - 84.1 |
| | Canada - 11.9 |
| | United Kingdom - 3.6 |
| | Norway - 0.2 |
| | France - 0.2 |
| |
TOP HOLDINGS(% of Fund's net assets) | | |
| Exxon Mobil Corp | 24.0 | |
| Cheniere Energy Inc | 5.6 | |
| Chevron Corp | 5.4 | |
| Cenovus Energy Inc | 5.3 | |
| Energy Transfer LP | 5.3 | |
| Canadian Natural Resources Ltd | 4.5 | |
| Schlumberger NV | 4.3 | |
| Marathon Petroleum Corp | 4.2 | |
| TechnipFMC PLC | 3.5 | |
| Occidental Petroleum Corp | 3.5 | |
| | 65.6 | |
How has the Fund changed?
This is a summary of certain changes to the Fund since January 1, 2024. For more complete information, you may review the Fund's next prospectus, which we expect to be available by April 30, 2025 at fundresearch.fidelity.com/prospectus/sec or upon request at 1-877-208-0098 or by sending an e-mail to funddocuments@fmr.com.
The fund's transfer agent and pricing & bookkeeping fees were changed to a fixed rate effective December 1, 2023. Effective March 1, 2024, the fund's management contract was amended to incorporate administrative services previously covered under separate services agreements (transfer agent and pricing & bookkeeping). The amended contract incorporates a management fee rate that may vary by class. The Adviser or an affiliate pays certain expenses of managing and operating the fund out of each class's management fee. | |
| Fidelity, the Fidelity Investments Logo and all other Fidelity trademarks or service marks used herein are trademarks or service marks of FMR LLC. Any third-party marks that are used herein are trademarks or service marks of their respective owners. © 2025 FMR LLC. All rights reserved. |
| | For additional information about the Fund; including its prospectus, financial information, holdings and proxy information, scan the QR code or visit fundresearch.fidelity.com/prospectus/sec 1.9914157.100 1438-TSRA-0325 |
| |
| | ANNUAL SHAREHOLDER REPORT | AS OF DECEMBER 31, 2024 | This report describes changes to the Fund that occurred during the reporting period. |
| | VIP Real Estate Portfolio VIP Real Estate Portfolio Initial Class true |
| | | |
This annual shareholder report contains information about VIP Real Estate Portfolio for the period January 1, 2024 to December 31, 2024. You can find additional information about the Fund at fundresearch.fidelity.com/prospectus/sec. You can also request this information by contacting us at 1-877-208-0098 or by sending an e-mail to funddocuments@fmr.com.
What were your Fund costs for the last year?(based on hypothetical $10,000 investment)
FUND COST (PREVIOUS YEAR)
| | Costs of a $10,000 investment | Costs paid as a percentage of a $10,000 investment | |
| Initial Class | $ 63 | 0.61% | |
What affected the Fund's performance this period?
•U.S. equities gained in 2024, driven by a sturdy economy, the Federal Reserve's long-anticipated pivot to cutting interest rates and the potential for artificial intelligence to drive transformative change.
•Against this backdrop, security selection was the primary contributor to the fund's performance versus the MSCI US IMI Real Estate 25/50 Linked Index for the fiscal year, especially within the real estate services category. Security selection among health care REITs also boosted the fund's relative performance, as did an underweight in the timber industry.
•The top individual relative contributor was an overweight in CBRE (+41%), one of our biggest holdings. Outsized exposure to Ventas (+22%) helped as well. The company was one of our largest positions in 2024. An overweight in Equinix (+20%) further bolstered performance and was the fund's largest holding at period end.
•In contrast, the primary detractor from performance versus the real estate index was an overweight among industrial REITs. An underweight in the office segment also hampered the fund's result. Further detracting from our result were picks and an overweight in the single-family residential group.
•The biggest individual relative detractor this period was avoiding Iron Mountain, an index component that gained about 54%. Avoiding Simon Property Group, an index component that gained 27%, hurt as well. An overweight in Americold Realty Trust (-26%) also detracted. This period we decreased our position in Americold Realty Trust.
•Notable changes in positioning include increased exposure to the retail and real estate services industries.
How did the Fund perform over the past 10 years?
CUMULATIVE PERFORMANCE
December 31, 2014 through December 31, 2024.
Initial investment of $10,000.
Initial Class | $10,000 | $10,371 | $10,967 | $11,413 | $10,703 | $13,188 | $12,325 | $17,130 | $12,418 | $13,807 | $14,708 |
MSCI US IMI Real Estate 25/50 Linked Index | $10,000 | $10,446 | $11,140 | $11,560 | $11,072 | $13,630 | $11,714 | $16,465 | $12,164 | $13,619 | $14,307 |
S&P 500® Index | $10,000 | $10,138 | $11,351 | $13,829 | $13,223 | $17,386 | $20,585 | $26,494 | $21,696 | $27,399 | $34,254 |
| | 2014 | 2015 | 2016 | 2017 | 2018 | 2019 | 2020 | 2021 | 2022 | 2023 | 2024 |
AVERAGE ANNUAL TOTAL RETURNS:| | 1 Year | 5 Year | 10 Year |
| Initial Class | 6.52% | 2.20% | 3.93% |
| MSCI US IMI Real Estate 25/50 Linked Index | 5.05% | 0.97% | 3.65% |
| S&P 500® Index | 25.02% | 14.53% | 13.10% |
Visit institutional.fidelity.com for more recent performance information. |
The Fund's past performance is not a good predictor of the Fund's future performance. The graph and table do not reflect the deduction of taxes that a shareholder would pay on fund distributions or redemption of fund shares. |
Key Fund Statistics(as of December 31, 2024)
KEY FACTS | | |
| Fund Size | $357,298,750 | |
| Number of Holdings | 33 | |
| Total Advisory Fee | $2,164,560 | |
| Portfolio Turnover | 37% | |
What did the Fund invest in?
(as of December 31, 2024)
TOP INDUSTRIES (% of Fund's net assets) |
| Specialized REITs | 35.2 | |
| Residential REITs | 14.1 | |
| Retail REITs | 13.8 | |
| Industrial REITs | 12.1 | |
| Real Estate Management & Development | 10.3 | |
| Health Care REITs | 10.0 | |
| Office REITs | 1.9 | |
| Hotel & Resort REITs | 1.6 | |
| |
| Common Stocks | 99.0 |
| Short-Term Investments and Net Other Assets (Liabilities) | 1.0 |
ASSET ALLOCATION (% of Fund's net assets) |
|
| | Common Stocks - 99.0 |
| | Short-Term Investments and Net Other Assets (Liabilities) - 1.0 |
| |
GEOGRAPHIC DIVERSIFICATION (% of Fund's net assets) |
|
TOP HOLDINGS(% of Fund's net assets) | | |
| Equinix Inc | 9.8 | |
| Prologis Inc | 8.1 | |
| American Tower Corp | 7.0 | |
| CBRE Group Inc Class A | 6.6 | |
| Ventas Inc | 6.3 | |
| Public Storage Operating Co | 3.9 | |
| Crown Castle Inc | 3.8 | |
| Welltower Inc | 3.7 | |
| CubeSmart | 3.6 | |
| Sun Communities Inc | 3.3 | |
| | 56.1 | |
How has the Fund changed?
This is a summary of certain changes to the Fund since January 1, 2024. For more complete information, you may review the Fund's next prospectus, which we expect to be available by April 30, 2025 at fundresearch.fidelity.com/prospectus/sec or upon request at 1-877-208-0098 or by sending an e-mail to funddocuments@fmr.com.
The fund's transfer agent and pricing & bookkeeping fees were changed to a fixed rate effective December 1, 2023. Effective March 1, 2024, the fund's management contract was amended to incorporate administrative services previously covered under separate services agreements (transfer agent and pricing & bookkeeping). The amended contract incorporates a management fee rate that may vary by class. The Adviser or an affiliate pays certain expenses of managing and operating the fund out of each class's management fee. | |
| Fidelity, the Fidelity Investments Logo and all other Fidelity trademarks or service marks used herein are trademarks or service marks of FMR LLC. Any third-party marks that are used herein are trademarks or service marks of their respective owners. © 2025 FMR LLC. All rights reserved. |
| | For additional information about the Fund; including its prospectus, financial information, holdings and proxy information, scan the QR code or visit fundresearch.fidelity.com/prospectus/sec 1.9914246.100 1155-TSRA-0325 |
| |
| | ANNUAL SHAREHOLDER REPORT | AS OF DECEMBER 31, 2024 | This report describes changes to the Fund that occurred during the reporting period. |
| | VIP Financials Portfolio VIP Financials Portfolio Service Class 2 true |
| | | |
This annual shareholder report contains information about VIP Financials Portfolio for the period January 1, 2024 to December 31, 2024. You can find additional information about the Fund at fundresearch.fidelity.com/prospectus/sec. You can also request this information by contacting us at 1-877-208-0098 or by sending an e-mail to funddocuments@fmr.com.
What were your Fund costs for the last year?(based on hypothetical $10,000 investment)
FUND COST (PREVIOUS YEAR)
| | Costs of a $10,000 investment | Costs paid as a percentage of a $10,000 investment | |
| Service Class 2 | $ 100 | 0.86% | |
What affected the Fund's performance this period?
•U.S. equities gained in 2024, driven by a sturdy economy, the Federal Reserve's long-anticipated pivot to cutting interest rates and the potential for artificial intelligence to drive transformative change.
•Against this backdrop, industry positioning was the primary contributor to the fund's performance versus the MSCI US IMI Financials 5% Capped Linked Index for the year, especially an overweight in diversified financial services. Stock picks among investment banking & brokerage firms and regional banks also boosted the fund's relative performance.
•The top individual relative contributor was an overweight in Apollo Global Management (+80%). The stock was among our biggest holdings. Outsized exposure to Baldwin Insurance Group (+62%) also helped. Another notable relative contributor was a larger-than-index stake in LPL Financial Holdings (+57%). This was a position we established this period and one of our largest holdings at the end of 2024.
•In contrast, the biggest detractor from performance versus the sector index was security selection in asset management & custody banks. Also hurting our result was stock picking in the financial exchanges & data and property & casualty insurance industries.
•Not owning JPMorgan Chase, an index component that gained roughly 44%, was the largest individual relative detractor. Avoiding American Express, an index component that gained about 60%, also hurt. An outsized allocation to MarketAxess Holdings (-22%) further detracted. This period we increased our stake in MarketAxess Holdings.
•Notable changes in positioning include increased exposure to the consumer finance and diversified financial services industries.
How did the Fund perform over the life of Fund?
CUMULATIVE PERFORMANCE
August 16, 2023 through December 31, 2024.
Initial investment of $10,000.
Service Class 2 | $10,000 | $11,469 |
MSCI U.S. IMI Financials 5% Capped Linked Index | $10,000 | $11,375 |
S&P 500® Index | $10,000 | $10,896 |
| | 2023 | 2024 |
AVERAGE ANNUAL TOTAL RETURNS:| | 1 Year | Life of Fund A |
| Service Class 2 | 32.46% | 35.45% |
| MSCI U.S. IMI Financials 5% Capped Linked Index | 30.21% | 32.98% |
| S&P 500® Index | 25.02% | 25.15% |
A From August 16, 2023
Visit institutional.fidelity.com for more recent performance information. |
The Fund's past performance is not a good predictor of the Fund's future performance. The graph and table do not reflect the deduction of taxes that a shareholder would pay on fund distributions or redemption of fund shares. |
Key Fund Statistics(as of December 31, 2024)
KEY FACTS | | |
| Fund Size | $295,521,247 | |
| Number of Holdings | 68 | |
| Total Advisory Fee | $1,447,937 | |
| Portfolio Turnover | 37% | |
What did the Fund invest in?
(as of December 31, 2024)
TOP INDUSTRIES (% of Fund's net assets) |
| Banks | 31.4 | |
| Financial Services | 22.2 | |
| Capital Markets | 20.5 | |
| Insurance | 17.9 | |
| Consumer Finance | 6.8 | |
| Professional Services | 1.0 | |
| |
| Common Stocks | 99.8 |
| Short-Term Investments and Net Other Assets (Liabilities) | 0.2 |
ASSET ALLOCATION (% of Fund's net assets) |
|
| | Common Stocks - 99.8 |
| | Short-Term Investments and Net Other Assets (Liabilities) - 0.2 |
| |
| United States | 94.0 |
| United Kingdom | 3.6 |
| Puerto Rico | 1.5 |
| Grand Cayman (UK Overseas Ter) | 0.6 |
| Mexico | 0.3 |
GEOGRAPHIC DIVERSIFICATION (% of Fund's net assets) |
|
| | United States - 94.0 |
| | United Kingdom - 3.6 |
| | Puerto Rico - 1.5 |
| | Grand Cayman (UK Overseas Ter) - 0.6 |
| | Mexico - 0.3 |
| |
TOP HOLDINGS(% of Fund's net assets) | | |
| Mastercard Inc Class A | 8.8 | |
| Wells Fargo & Co | 6.1 | |
| Bank of America Corp | 5.0 | |
| Citigroup Inc | 4.1 | |
| Reinsurance Group of America Inc | 3.7 | |
| Apollo Global Management Inc | 3.3 | |
| Visa Inc Class A | 2.6 | |
| Morgan Stanley | 2.4 | |
| LPL Financial Holdings Inc | 2.3 | |
| Marsh & McLennan Cos Inc | 2.2 | |
| | 40.5 | |
How has the Fund changed?
This is a summary of certain changes to the Fund since January 1, 2024. For more complete information, you may review the Fund's next prospectus, which we expect to be available by April 30, 2025 at fundresearch.fidelity.com/prospectus/sec or upon request at 1-877-208-0098 or by sending an e-mail to funddocuments@fmr.com.
The fees associated with this class changed during the reporting year. The variations in class fees are primarily the result of the following changes:- Management fee
- Operating expenses
The fund's transfer agent and pricing & bookkeeping fees were changed to a fixed rate effective December 1, 2023. Effective March 1, 2024, the fund's management contract was amended to incorporate administrative services previously covered under separate services agreements (transfer agent and pricing & bookkeeping). The amended contract incorporates a management fee rate that may vary by class. The Adviser or an affiliate pays certain expenses of managing and operating the fund out of each class's management fee. | |
| Fidelity, the Fidelity Investments Logo and all other Fidelity trademarks or service marks used herein are trademarks or service marks of FMR LLC. Any third-party marks that are used herein are trademarks or service marks of their respective owners. © 2025 FMR LLC. All rights reserved. |
| | For additional information about the Fund; including its prospectus, financial information, holdings and proxy information, scan the QR code or visit fundresearch.fidelity.com/prospectus/sec 1.9914231.100 7360-TSRA-0325 |
Item 2.
Code of Ethics
As of the end of the period, December 31, 2024, Variable Insurance Products Fund IV (the trust) has adopted a code of ethics, as defined in Item 2 of Form N-CSR, that applies to its President and Treasurer and its Chief Financial Officer. A copy of the code of ethics is filed as an exhibit to this Form N-CSR.
Item 3.
Audit Committee Financial Expert
The Board of Trustees of the trust has determined that Donald F. Donahue is an audit committee financial expert, as defined in Item 3 of Form N-CSR. Mr. Donahue is independent for purposes of Item 3 of Form N-CSR.
Item 4.
Principal Accountant Fees and Services
Fees and Services
The following table presents fees billed by PricewaterhouseCoopers LLP (“PwC”) in each of the last two fiscal years for services rendered to VIP Communication Services Portfolio, VIP Consumer Discretionary Portfolio, VIP Consumer Staples Portfolio, VIP Energy Portfolio, VIP Financials Portfolio, VIP Health Care Portfolio, VIP Industrials Portfolio, VIP Materials Portfolio, VIP Real Estate Portfolio, VIP Technology Portfolio and VIP Utilities Portfolio (the “Funds”):
Services Billed by PwC
December 31, 2024 FeesA
|
| Audit Fees | Audit-Related Fees | Tax Fees | All Other Fees |
VIP Communication Services Portfolio | $33,600 | $2,900 | $6,700 | $1,000 |
VIP Consumer Discretionary Portfolio | $34,800 | $3,000 | $6,700 | $1,100 |
VIP Consumer Staples Portfolio | $34,800 | $3,000 | $6,700 | $1,100 |
VIP Energy Portfolio | $33,600 | $2,900 | $7,500 | $1,000 |
VIP Financials Portfolio | $35,300 | $3,100 | $7,500 | $1,100 |
VIP Health Care Portfolio | $36,400 | $3,200 | $7,300 | $1,100 |
VIP Industrials Portfolio | $33,600 | $2,900 | $6,700 | $1,000 |
VIP Materials Portfolio | $33,600 | $2,900 | $6,700 | $1,000 |
VIP Real Estate Portfolio | $40,800 | $3,600 | $9,200 | $1,300 |
VIP Technology Portfolio | $38,600 | $3,300 | $6,700 | $1,200 |
VIP Utilities Portfolio | $32,500 | $2,900 | $7,500 | $1,000 |
|
| Audit Fees | Audit-Related Fees | Tax Fees | All Other Fees |
VIP Communication Services Portfolio | $33,700 | $3,100 | $6,700 | $1,000 |
VIP Consumer Discretionary Portfolio | $33,700 | $3,100 | $6,700 | $1,000 |
VIP Consumer Staples Portfolio | $33,700 | $3,100 | $6,700 | $1,000 |
VIP Energy Portfolio | $33,700 | $3,100 | $6,700 | $1,000 |
VIP Financials Portfolio | $34,200 | $3,100 | $6,700 | $1,000 |
VIP Health Care Portfolio | $37,400 | $3,400 | $6,700 | $1,100 |
VIP Industrials Portfolio | $33,700 | $3,100 | $7,400 | $1,000 |
VIP Materials Portfolio | $33,700 | $3,100 | $6,700 | $1,000 |
VIP Real Estate Portfolio | $41,000 | $3,800 | $9,200 | $1,300 |
VIP Technology Portfolio | $38,300 | $3,400 | $7,400 | $1,100 |
VIP Utilities Portfolio | $32,600 | $3,000 | $6,700 | $1,000 |
A Amounts may reflect rounding.
The following table(s) present(s) fees billed by PwC that were required to be approved by the Audit Committee for services that relate directly to the operations and financial reporting of the Fund(s) and that are rendered on behalf of Fidelity Management & Research Company LLC ("FMR") and entities controlling, controlled by, or under common control with FMR (not including any sub-adviser whose role is primarily portfolio management and is subcontracted with or overseen by another investment adviser) that provide ongoing services to the Fund(s) (“Fund Service Providers”):
Services Billed by PwC
|
| December 31, 2024A | December 31, 2023 A |
Audit-Related Fees | $9,701,800 | $8,881,200 |
Tax Fees | $61,000 | $1,000 |
All Other Fees | $35,000 | $- |
A Amounts may reflect rounding.
“Audit-Related Fees” represent fees billed for assurance and related services that are reasonably related to the performance of the fund audit or the review of the fund's financial statements and that are not reported under Audit Fees.
“Tax Fees” represent fees billed for tax compliance, tax advice or tax planning that relate directly to the operations and financial reporting of the fund.
“All Other Fees” represent fees billed for services provided to the fund or Fund Service Provider, a significant portion of which are assurance related, that relate directly to the operations and financial reporting of the fund, excluding those services that are reported under Audit Fees, Audit-Related Fees or Tax Fees.
Assurance services must be performed by an independent public accountant.
* * *
The aggregate non-audit fees billed by PwC for services rendered to the Fund(s), FMR (not including any sub-adviser whose role is primarily portfolio management and is subcontracted with or overseen by another investment adviser), and any Fund Service Provider for each of the last two fiscal years of the Fund(s) are as follows:
|
Billed By | December 31, 2024A | December 31, 2023A |
PwC | $15,415,900 | $14,460,700 |
|
|
|
A Amounts may reflect rounding.
The trust's Audit Committee has considered non-audit services that were not pre-approved that were provided by PwC to Fund Service Providers to be compatible with maintaining the independence of PwC in its(their) audit of the Fund(s), taking into account representations from PwC, in accordance with Public Company Accounting Oversight Board rules, regarding its independence from the Fund(s) and its(their) related entities and FMR’s review of the appropriateness and permissibility under applicable law of such non-audit services prior to their provision to the Fund(s) Service Providers.
Audit Committee Pre-Approval Policies and Procedures
The trust’s Audit Committee must pre-approve all audit and non-audit services provided by a fund’s independent registered public accounting firm relating to the operations or financial reporting of the fund. Prior to the commencement of any audit or non-audit services to a fund, the Audit Committee reviews the services to determine whether they are appropriate and permissible under applicable law.
The Audit Committee has adopted policies and procedures to, among other purposes, provide a framework for the Committee’s consideration of non-audit services by the audit firms that audit the Fidelity funds. The policies and procedures require that any non-audit service provided by a fund audit firm to a Fidelity fund and any non-audit service provided by a fund auditor to a Fund Service Provider that relates directly to the operations and financial reporting of a Fidelity fund (“Covered Service”) are subject to approval by the Audit Committee before such service is provided.
All Covered Services must be approved in advance of provision of the service either: (i) by formal resolution of the Audit Committee, or (ii) by oral or written approval of the service by the Chair of the Audit Committee (or if the Chair is unavailable, such other member of the Audit Committee as may be designated by the Chair to act in the Chair’s absence). The approval contemplated by (ii) above is permitted where the Treasurer determines that action on such an engagement is necessary before the next meeting of the Audit Committee.
Non-audit services provided by a fund audit firm to a Fund Service Provider that do not relate directly to the operations and financial reporting of a Fidelity fund are reported to the Audit Committee periodically.
Non-Audit Services Approved Pursuant to Rule 2-01(c)(7)(i)(C) and (ii) of Regulation S-X (“De Minimis Exception”)
There were no non-audit services approved or required to be approved by the Audit Committee pursuant to the De Minimis Exception during the Fund’s(s’) last two fiscal years relating to services provided to (i) the Fund(s) or (ii) any Fund Service Provider that relate directly to the operations and financial reporting of the Fund(s).
The Registrant has not retained, for the preparation of the audit report on the financial statements included in the Form N-CSR, a registered public accounting firm that has a branch or office that is located in a foreign jurisdiction and that the Public Company Accounting Oversight Board (the “PCAOB”) has determined that the PCAOB is unable to inspect or investigate completely because of a position taken by an authority in the foreign jurisdiction.
The Registrant is not a “foreign issuer,” as defined in 17 CFR 240.3b-4.
Item 5.
Audit Committee of Listed Registrants
Not applicable.
Item 6.
Investments
(a)
Not applicable.
(b)
Not applicable.
Item 7.
Financial Statements and Financial Highlights for Open-End Management Investment Companies
Fidelity® Variable Insurance Products:
VIP Technology Portfolio
Annual Report
December 31, 2024
Contents
To view a fund's proxy voting guidelines and proxy voting record for the 12-month period ended June 30, visit http://www.fidelity.com/proxyvotingresults or visit the Securities and Exchange Commission's (SEC) web site at http://www.sec.gov.
You may also call 1-877-208-0098 to request a free copy of the proxy voting guidelines.
Fidelity® Variable Insurance Products are separate account options which are purchased through a variable insurance contract.
Standard & Poor's, S&P and S&P 500 are registered service marks of The McGraw-Hill Companies, Inc. and have been licensed for use by Fidelity Distributors Corporation.
Other third-party marks appearing herein are the property of their respective owners.
All other marks appearing herein are registered or unregistered trademarks or service marks of FMR LLC or an affiliated company. © 2025 FMR LLC. All rights reserved.
This report and the financial statements contained herein are submitted for the general information of the shareholders of the Fund. This report is not authorized for distribution to prospective investors in the Fund unless preceded or accompanied by an effective prospectus.
A fund files its complete schedule of portfolio holdings with the SEC for the first and third quarters of each fiscal year on Form N-PORT. Forms N-PORT are available on the SEC's web site at http://www.sec.gov. A fund's Forms N-PORT may be reviewed and copied at the SEC's Public Reference Room in Washington, DC. Information regarding the operation of the SEC's Public Reference Room may be obtained by calling 1-800-SEC-0330.
For a complete list of a fund's portfolio holdings, view the most recent holdings listing, semiannual report, or annual report on Fidelity's web site at http://www.fidelity.com, http://www.institutional.fidelity.com, or http://www.401k.com, as applicable.
NOT FDIC INSURED •MAY LOSE VALUE •NO BANK GUARANTEE
Neither the Fund nor Fidelity Distributors Corporation is a bank.
Item 7: Financial Statements and Financial Highlights for Open-End Management Investment Companies (Annual Report)
Schedule of Investments December 31, 2024
Showing Percentage of Net Assets
| Common Stocks - 96.8% |
| | | Shares | Value ($) |
| CANADA - 2.1% | | | |
| Information Technology - 2.1% | | | |
| IT Services - 2.1% | | | |
| Shopify Inc Class A (United States) (b) | | 587,000 | 62,415,710 |
| CHINA - 3.3% | | | |
| Health Care - 0.0% | | | |
| Health Care Equipment & Supplies - 0.0% | | | |
| China Medical Technologies Inc ADR (b)(c) | | 300 | 0 |
| Pharmaceuticals - 0.0% | | | |
| Chime Biologics Wuhan Co Ltd (b)(c) | | 94,814 | 1 |
TOTAL HEALTH CARE | | | 1 |
| | | | |
| Information Technology - 3.3% | | | |
| Semiconductors & Semiconductor Equipment - 3.3% | | | |
| NXP Semiconductors NV | | 464,104 | 96,464,016 |
| TOTAL CHINA | | | 96,464,017 |
| FRANCE - 0.1% | | | |
| Information Technology - 0.1% | | | |
| IT Services - 0.1% | | | |
| Capgemini SE | | 24,200 | 3,952,531 |
| INDIA - 0.0% | | | |
| Information Technology - 0.0% | | | |
| Software - 0.0% | | | |
| Pine Labs Pvt Ltd (b)(c)(d) | | 1,314 | 558,949 |
| ISRAEL - 0.0% | | | |
| Information Technology - 0.0% | | | |
| Semiconductors & Semiconductor Equipment - 0.0% | | | |
| Xsight Labs Ltd warrants 1/11/2034 (b)(c)(d) | | 10,921 | 30,797 |
| Xsight Labs Ltd warrants 12/30/2031 (b)(c)(d) | | 9,468 | 14,770 |
| | | | |
| TOTAL ISRAEL | | | 45,567 |
| KOREA (SOUTH) - 0.0% | | | |
| Materials - 0.0% | | | |
| Chemicals - 0.0% | | | |
| LG Chem Ltd | | 3,710 | 618,978 |
| NETHERLANDS - 0.9% | | | |
| Information Technology - 0.9% | | | |
| Semiconductors & Semiconductor Equipment - 0.9% | | | |
| ASML Holding NV | | 35,500 | 24,865,431 |
| TAIWAN - 2.1% | | | |
| Health Care - 0.0% | | | |
| Life Sciences Tools & Services - 0.0% | | | |
| Eden Biologics Inc (b)(c) | | 94,814 | 0 |
| Information Technology - 2.1% | | | |
| Semiconductors & Semiconductor Equipment - 2.1% | | | |
| Taiwan Semiconductor Manufacturing Co Ltd | | 1,901,000 | 61,759,052 |
| TOTAL TAIWAN | | | 61,759,052 |
| UNITED KINGDOM - 0.1% | | | |
| Consumer Discretionary - 0.1% | | | |
| Hotels, Restaurants & Leisure - 0.1% | | | |
| Deliveroo PLC Class A (b)(e)(f) | | 955,100 | 1,696,684 |
| UNITED STATES - 88.2% | | | |
| Communication Services - 0.8% | | | |
| Entertainment - 0.8% | | | |
| Netflix Inc (b) | | 25,432 | 22,668,050 |
| Consumer Discretionary - 2.0% | | | |
| Broadline Retail - 1.8% | | | |
| Amazon.com Inc (b) | | 232,500 | 51,008,175 |
| Hotels, Restaurants & Leisure - 0.2% | | | |
| Airbnb Inc Class A (b) | | 59,600 | 7,832,036 |
| Consumer Staples - 0.0% | | | |
| Consumer Staples Distribution & Retail - 0.0% | | | |
| Maplebear Inc (b) | | 10,890 | 451,064 |
| Industrials - 1.2% | | | |
| Ground Transportation - 1.2% | | | |
| Lyft Inc Class A (b) | | 180,097 | 2,323,251 |
| TuSimple Holdings Inc Class A (b) | | 31,800 | 12,720 |
| Uber Technologies Inc (b) | | 541,424 | 32,658,696 |
| | | | 34,994,667 |
| Information Technology - 84.2% | | | |
| Communications Equipment - 3.5% | | | |
| Cisco Systems Inc | | 1,694,000 | 100,284,800 |
| Electronic Equipment, Instruments & Components - 0.9% | | | |
| Amphenol Corp Class A | | 372,604 | 25,877,348 |
| IT Services - 3.4% | | | |
| IBM Corporation | | 19,603 | 4,309,327 |
| Okta Inc Class A (b) | | 794,457 | 62,603,212 |
| Snowflake Inc Class A (b) | | 209,968 | 32,421,159 |
| | | | 99,333,698 |
| Semiconductors & Semiconductor Equipment - 35.8% | | | |
| Astera Labs Inc (b) | | 177,612 | 23,524,709 |
| Broadcom Inc | | 29,200 | 6,769,728 |
| GlobalFoundries Inc (b) | | 1,747,835 | 74,999,600 |
| Marvell Technology Inc | | 1,159,704 | 128,089,307 |
| Micron Technology Inc | | 644,006 | 54,199,545 |
| NVIDIA Corp | | 4,619,991 | 620,418,591 |
| ON Semiconductor Corp (b) | | 1,590,393 | 100,274,279 |
| Teradyne Inc | | 220,800 | 27,803,136 |
| | | | 1,036,078,895 |
| Software - 20.9% | | | |
| Coreweave Inc Class A (c)(d) | | 9,400 | 8,834,590 |
| Crowdstrike Holdings Inc Class A (b) | | 16,900 | 5,782,504 |
| Datadog Inc Class A (b) | | 393,740 | 56,261,509 |
| HubSpot Inc (b) | | 52,433 | 36,533,741 |
| Manhattan Associates Inc (b) | | 71,855 | 19,418,095 |
| Microsoft Corp | | 654,000 | 275,661,001 |
| OpenAI Global LLC rights (b)(c)(d) | | 1,521,400 | 1,521,400 |
| Palantir Technologies Inc Class A (b) | | 287,600 | 21,751,188 |
| Salesforce Inc | | 206,365 | 68,994,010 |
| Servicenow Inc (b) | | 100,434 | 106,472,092 |
| Zscaler Inc (b) | | 40,100 | 7,234,441 |
| | | | 608,464,571 |
| Technology Hardware, Storage & Peripherals - 19.7% | | | |
| Apple Inc | | 2,056,160 | 514,903,587 |
| Seagate Technology Holdings PLC | | 162,491 | 14,024,598 |
| Super Micro Computer Inc (b) | | 212,900 | 6,489,192 |
| Western Digital Corp (b) | | 640,020 | 38,164,393 |
| | | | 573,581,770 |
TOTAL INFORMATION TECHNOLOGY | | | 2,443,621,082 |
| | | | |
| TOTAL UNITED STATES | | | 2,560,575,074 |
| TOTAL COMMON STOCKS (Cost $1,382,989,461) | | | 2,812,951,993 |
| | | | |
| Convertible Corporate Bonds - 0.0% |
| | | Principal Amount (a) | Value ($) |
| UNITED STATES - 0.0% | | | |
| Information Technology - 0.0% | | | |
| Electronic Equipment, Instruments & Components - 0.0% | | | |
Enevate Corp 10% 5/12/2025 (c)(d) (Cost $55,238) | | 55,238 | 55,962 |
| | | | |
| Convertible Preferred Stocks - 1.3% |
| | | Shares | Value ($) |
| CHINA - 0.1% | | | |
| Communication Services - 0.1% | | | |
| Interactive Media & Services - 0.1% | | | |
| ByteDance Ltd Series E1 (b)(c)(d) | | 9,903 | 2,452,577 |
| INDIA - 0.1% | | | |
| Consumer Discretionary - 0.0% | | | |
| Broadline Retail - 0.0% | | | |
| Meesho Series E1 (c)(d) | | 1,250 | 68,712 |
| Meesho Series F (b)(c)(d) | | 17,100 | 956,403 |
| | | | 1,025,115 |
| Information Technology - 0.1% | | | |
| Software - 0.1% | | | |
| Pine Labs Pvt Ltd Series 1 (b)(c)(d) | | 3,140 | 1,335,693 |
| Pine Labs Pvt Ltd Series A (b)(c)(d) | | 785 | 333,923 |
| Pine Labs Pvt Ltd Series B (b)(c)(d) | | 854 | 363,275 |
| Pine Labs Pvt Ltd Series B2 (b)(c)(d) | | 690 | 293,512 |
| Pine Labs Pvt Ltd Series C (b)(c)(d) | | 1,284 | 546,188 |
| Pine Labs Pvt Ltd Series C1 (b)(c)(d) | | 271 | 115,278 |
| Pine Labs Pvt Ltd Series D (b)(c)(d) | | 289 | 122,935 |
| | | | 3,110,804 |
| TOTAL INDIA | | | 4,135,919 |
| ISRAEL - 0.0% | | | |
| Information Technology - 0.0% | | | |
| Semiconductors & Semiconductor Equipment - 0.0% | | | |
| Xsight Labs Ltd Series D (b)(c)(d) | | 37,800 | 238,518 |
| Xsight Labs Ltd Series E (c)(d) | | 47,339 | 363,564 |
| Xsight Labs Ltd Series E1 (c)(d) | | 36,402 | 332,350 |
| | | | |
| TOTAL ISRAEL | | | 934,432 |
| UNITED STATES - 1.1% | | | |
| Consumer Discretionary - 0.0% | | | |
| Hotels, Restaurants & Leisure - 0.0% | | | |
| Discord Inc Series I (b)(c)(d) | | 200 | 49,404 |
| Consumer Staples - 0.0% | | | |
| Consumer Staples Distribution & Retail - 0.0% | | | |
| GoBrands Inc Series G (b)(c)(d) | | 5,260 | 177,104 |
| Financials - 0.0% | | | |
| Financial Services - 0.0% | | | |
| Akeana Series C (c)(d) | | 14,600 | 184,690 |
| Tenstorrent Holdings Inc Series C1 (b)(c)(d) | | 4,586 | 340,189 |
| Tenstorrent Holdings Inc Series D1 (c)(d) | | 4,200 | 331,170 |
| Tenstorrent Holdings Inc Series D2 (c)(d) | | 1,677 | 127,335 |
| | | | 983,384 |
| Industrials - 0.0% | | | |
| Aerospace & Defense - 0.0% | | | |
| Relativity Space Inc Series E (b)(c)(d) | | 174,268 | 163,812 |
| Information Technology - 1.0% | | | |
| Electronic Equipment, Instruments & Components - 0.2% | | | |
| Enevate Corp Series E (b)(c)(d) | | 3,556,678 | 1,956,173 |
| Vast Data Ltd Series A (b)(c)(d) | | 12,260 | 263,958 |
| Vast Data Ltd Series A1 (b)(c)(d) | | 30,177 | 649,711 |
| Vast Data Ltd Series A2 (b)(c)(d) | | 34,713 | 747,371 |
| Vast Data Ltd Series B (b)(c)(d) | | 27,621 | 594,680 |
| Vast Data Ltd Series C (b)(c)(d) | | 805 | 17,331 |
| Vast Data Ltd Series E (b)(c)(d) | | 26,394 | 568,263 |
| | | | 4,797,487 |
| Semiconductors & Semiconductor Equipment - 0.0% | | | |
| Retym Inc Series C (b)(c)(d) | | 50,104 | 508,556 |
| SiMa Technologies Inc Series B (b)(c)(d) | | 85,000 | 515,950 |
| SiMa Technologies Inc Series B1 (b)(c)(d) | | 36,016 | 256,794 |
| | | | 1,281,300 |
| Software - 0.7% | | | |
| Anthropic PBC Series B (c)(d) | | 78,539 | 2,940,500 |
| Anthropic PBC Series D (c)(d) | | 79,696 | 2,983,818 |
| Coreweave Inc Series C (c)(d) | | 603 | 635,254 |
| Databricks Inc (c)(d) | | 15,590 | 1,442,075 |
| Databricks Inc Series G (b)(c)(d) | | 14,100 | 1,304,250 |
| Databricks Inc Series H (b)(c)(d) | | 36,297 | 3,357,473 |
| Databricks Inc Series I (b)(c)(d) | | 479 | 44,308 |
| Runway AI Inc (c)(d) | | 22,078 | 2,527,931 |
| xAI Corp Series C (c)(d) | | 91,800 | 1,987,470 |
| | | | 17,223,079 |
| Technology Hardware, Storage & Peripherals - 0.1% | | | |
| Lightmatter Inc (c)(d) | | 22,205 | 1,774,180 |
| Lightmatter Inc Series C1 (b)(c)(d) | | 29,615 | 1,913,721 |
| Lightmatter Inc Series C2 (c)(d) | | 4,652 | 306,148 |
| | | | 3,994,049 |
| Materials - 0.1% | | | |
| Metals & Mining - 0.1% | | | |
| Diamond Foundry Inc Series C (b)(c)(d) | | 56,576 | 1,537,170 |
| TOTAL UNITED STATES | | | 30,206,789 |
| TOTAL CONVERTIBLE PREFERRED STOCKS (Cost $37,670,622) | | | 37,729,717 |
| | | | |
| Preferred Securities - 0.0% |
| | | Principal Amount (a) | Value ($) |
| UNITED STATES - 0.0% | | | |
| Information Technology - 0.0% | | | |
| Electronic Equipment, Instruments & Components - 0.0% | | | |
| Enevate Corp 6% (c)(d)(g) | | 197,659 | 174,334 |
| Semiconductors & Semiconductor Equipment - 0.0% | | | |
| SiMa Technologies Inc 10% 12/31/2027 (c)(d) | | 115,336 | 118,209 |
TOTAL INFORMATION TECHNOLOGY | | | 292,543 |
| | | | |
| TOTAL PREFERRED SECURITIES (Cost $312,995) | | | 292,543 |
| | | | |
| Money Market Funds - 2.1% |
| | | Yield (%) | Shares | Value ($) |
Fidelity Cash Central Fund (h) (Cost $59,961,523) | | 4.36 | 59,949,533 | 59,961,523 |
| | | | | |
| TOTAL INVESTMENT IN SECURITIES - 100.2% (Cost $1,480,989,839) | 2,910,991,738 |
NET OTHER ASSETS (LIABILITIES) - (0.2)% | (5,526,762) |
| NET ASSETS - 100.0% | 2,905,464,976 |
| | |
Legend
| (a) | Amount is stated in United States dollars unless otherwise noted. |
| (d) | Restricted securities (including private placements) - Investment in securities not registered under the Securities Act of 1933 (excluding 144A issues). At the end of the period, the value of restricted securities (excluding 144A issues) amounted to $49,038,728 or 1.7% of net assets. |
| (e) | Security exempt from registration under Rule 144A of the Securities Act of 1933. These securities may be resold in transactions exempt from registration, normally to qualified institutional buyers. At the end of the period, the value of these securities amounted to $1,696,684 or 0.1% of net assets. |
| (f) | Security is exempt from registration under Regulation S of the Securities Act of 1933 and may be resold to qualified foreign investors outside of the United States. At the end of the period, the value of securities amounted to $1,696,684 or 0.1% of net assets. |
| (g) | Security is perpetual in nature with no stated maturity date. |
| (h) | Affiliated fund that is generally available only to investment companies and other accounts managed by Fidelity Investments. The rate quoted is the annualized seven-day yield of the fund at period end. A complete unaudited listing of the fund's holdings as of its most recent quarter end is available upon request. In addition, each Fidelity Central Fund's financial statements, which are not covered by the Fund's Report of Independent Registered Public Accounting Firm, are available on the SEC's website or upon request. |
| Additional information on each restricted holding is as follows: |
| Security | Acquisition Date | Acquisition Cost ($) |
| Akeana Series C | 1/23/24 | 186,308 |
| | | |
| Anthropic PBC Series B | 3/22/24 | 2,450,784 |
| | | |
| Anthropic PBC Series D | 5/31/24 | 2,391,239 |
| | | |
| ByteDance Ltd Series E1 | 11/18/20 | 1,085,113 |
| | | |
| Coreweave Inc Class A | 11/29/23 | 2,912,684 |
| | | |
| Coreweave Inc Series C | 5/17/24 | 469,767 |
| | | |
| Databricks Inc | 12/17/24 | 1,442,075 |
| | | |
| Databricks Inc Series G | 2/01/21 | 833,629 |
| | | |
| Databricks Inc Series H | 8/31/21 | 2,667,254 |
| | | |
| Databricks Inc Series I | 9/14/23 | 35,207 |
| | | |
| Diamond Foundry Inc Series C | 3/15/21 | 1,357,824 |
| | | |
| Discord Inc Series I | 9/15/21 | 110,125 |
| | | |
| Enevate Corp 10% 5/12/2025 | 11/12/24 | 55,238 |
| | | |
| Enevate Corp 6% | 11/02/23 - 10/31/24 | 197,659 |
| | | |
| Enevate Corp Series E | 1/29/21 | 3,943,236 |
| | | |
| GoBrands Inc Series G | 3/02/21 | 1,313,513 |
| | | |
| Lightmatter Inc | 10/11/24 | 1,781,518 |
| | | |
| Lightmatter Inc Series C1 | 5/19/23 | 487,368 |
| | | |
| Lightmatter Inc Series C2 | 12/18/23 | 120,960 |
| | | |
| Meesho Series E1 | 4/18/24 | 70,000 |
| | | |
| Meesho Series F | 9/21/21 | 1,311,096 |
| | | |
| OpenAI Global LLC rights | 9/30/24 | 1,521,400 |
| | | |
| Pine Labs Pvt Ltd | 6/30/21 | 489,938 |
| | | |
| Pine Labs Pvt Ltd Series 1 | 6/30/21 | 1,170,780 |
| | | |
| Pine Labs Pvt Ltd Series A | 6/30/21 | 292,695 |
| | | |
| Pine Labs Pvt Ltd Series B | 6/30/21 | 318,422 |
| | | |
| Pine Labs Pvt Ltd Series B2 | 6/30/21 | 257,273 |
| | | |
| Pine Labs Pvt Ltd Series C | 6/30/21 | 478,752 |
| | | |
| Pine Labs Pvt Ltd Series C1 | 6/30/21 | 101,045 |
| | | |
| Pine Labs Pvt Ltd Series D | 6/30/21 | 107,757 |
| | | |
| Relativity Space Inc Series E | 5/27/21 | 3,979,427 |
| | | |
| Retym Inc Series C | 5/17/23 - 6/20/23 | 389,899 |
| | | |
| Runway AI Inc | 9/06/24 | 2,393,648 |
| | | |
| SiMa Technologies Inc 10% 12/31/2027 | 4/08/24 - 10/05/24 | 115,336 |
| | | |
| SiMa Technologies Inc Series B | 5/10/21 | 435,829 |
| | | |
| SiMa Technologies Inc Series B1 | 4/25/22 - 10/17/22 | 255,386 |
| | | |
| Tenstorrent Holdings Inc Series C1 | 4/23/21 | 272,690 |
| | | |
| Tenstorrent Holdings Inc Series D1 | 7/16/24 | 331,071 |
| | | |
| Tenstorrent Holdings Inc Series D2 | 7/17/24 | 127,418 |
| | | |
| Vast Data Ltd Series A | 11/28/23 | 134,860 |
| | | |
| Vast Data Ltd Series A1 | 11/28/23 | 331,947 |
| | | |
| Vast Data Ltd Series A2 | 11/28/23 | 381,843 |
| | | |
| Vast Data Ltd Series B | 11/28/23 | 303,831 |
| | | |
| Vast Data Ltd Series C | 11/28/23 | 8,855 |
| | | |
| Vast Data Ltd Series E | 11/28/23 | 580,668 |
| | | |
| xAI Corp Series C | 11/22/24 | 1,987,470 |
| | | |
| Xsight Labs Ltd Series D | 2/16/21 | 302,249 |
| | | |
| Xsight Labs Ltd Series E | 11/04/24 - 12/30/24 | 378,719 |
| | | |
| Xsight Labs Ltd Series E1 | 1/11/24 | 291,070 |
| | | |
| Xsight Labs Ltd warrants 1/11/2034 | 1/11/24 | 0 |
| | | |
| Xsight Labs Ltd warrants 12/30/2031 | 11/04/24 - 12/30/24 | 0 |
| | | |
Affiliated Central Funds
Fiscal year to date information regarding the Fund's investments in Fidelity Central Funds, including the ownership percentage, is presented below.
| Affiliate | Value, beginning of period ($) | Purchases ($) | Sales Proceeds ($) | Dividend Income ($) | Realized Gain (loss) ($) | Change in Unrealized appreciation (depreciation) ($) | Value, end of period ($) | Shares, end of period | % ownership, end of period |
| Fidelity Cash Central Fund | 114,162,541 | 870,049,585 | 924,252,960 | 2,872,989 | 2,357 | - | 59,961,523 | 59,949,533 | 0.1% |
| Fidelity Securities Lending Cash Central Fund | - | 101,101,494 | 101,101,494 | 36,397 | - | - | - | - | 0.0% |
| Total | 114,162,541 | 971,151,079 | 1,025,354,454 | 2,909,386 | 2,357 | - | 59,961,523 | 59,949,533 | |
| | | | | | | | | | |
Amounts in the dividend income column in the above table include any capital gain distributions from underlying funds, which are presented in the corresponding line item in the Statement of Operations, if applicable.
Amounts in the dividend income column for Fidelity Securities Lending Cash Central Fund represents the income earned on investing cash collateral, less rebates paid to borrowers and any lending agent fees associated with the loan, plus any premium payments received for lending certain types of securities.
Amounts included in the purchases and sales proceeds columns may include in-kind transactions, if applicable.
Investment Valuation
The following is a summary of the inputs used, as of December 31, 2024, involving the Fund's assets and liabilities carried at fair value. The inputs or methodology used for valuing securities may not be an indication of the risk associated with investing in those securities. For more information on valuation inputs, and their aggregation into the levels used below, please refer to the Investment Valuation section in the accompanying Notes to Financial Statements.
| Valuation Inputs at Reporting Date: |
| Description | Total ($) | Level 1 ($) | Level 2 ($) | Level 3 ($) |
Investments in Securities: | | | | |
|
| Common Stocks | | | | |
Communication Services | 22,668,050 | 22,668,050 | - | - |
Consumer Discretionary | 60,536,895 | 60,536,895 | - | - |
Consumer Staples | 451,064 | 451,064 | - | - |
Health Care | 1 | - | - | 1 |
Industrials | 34,994,667 | 34,994,667 | - | - |
Information Technology | 2,693,682,338 | 2,592,144,818 | 90,577,014 | 10,960,506 |
Materials | 618,978 | - | 618,978 | - |
|
| Convertible Corporate Bonds | | | | |
Information Technology | 55,962 | - | - | 55,962 |
|
| Convertible Preferred Stocks | | | | |
Communication Services | 2,452,577 | - | - | 2,452,577 |
Consumer Discretionary | 1,074,519 | - | - | 1,074,519 |
Consumer Staples | 177,104 | - | - | 177,104 |
Financials | 983,384 | - | - | 983,384 |
Industrials | 163,812 | - | - | 163,812 |
Information Technology | 31,341,151 | - | - | 31,341,151 |
Materials | 1,537,170 | - | - | 1,537,170 |
|
| Preferred Securities | | | | |
Information Technology | 292,543 | - | - | 292,543 |
|
| Money Market Funds | 59,961,523 | 59,961,523 | - | - |
| Total Investments in Securities: | 2,910,991,738 | 2,770,757,017 | 91,195,992 | 49,038,729 |
The following is a reconciliation of Investments in Securities for which Level 3 inputs were used in determining value. Beginning balances have been updated to conform to current period presentation, as applicable.
| |
| Investments in Securities: | |
| Beginning Balance | $ | 33,729,857 | |
| Net Realized Gain (Loss) on Investment Securities | | (383,487) | |
| Net Unrealized Gain (Loss) on Investment Securities | | 7,321,657 | |
| Cost of Purchases | | 16,005,770 | |
| Proceeds of Sales | | (1,275,131) | |
| Amortization/Accretion | | - | |
| Transfers into Level 3 | | - | |
| Transfers out of Level 3 | | (6,359,937) | |
| Ending Balance | $ | 49,038,729 | |
| The change in unrealized gain (loss) for the period attributable to Level 3 securities held at December 31, 2024 | $ | 6,925,987 | |
| The information used in the above reconciliation represents fiscal year to date activity for any Investments in Securities identified as using Level 3 inputs at either the beginning or the end of the current fiscal period. Cost of purchases and proceeds of sales may include securities received and/or delivered through in-kind transactions, corporate actions or exchanges. Transfers into Level 3 were attributable to a lack of observable market data resulting from decreases in market activity, decreases in liquidity, security restructurings or corporate actions. Transfers out of Level 3 were attributable to observable market data becoming available for those securities. Transfers in or out of Level 3 represent the beginning value of any Security or Instrument where a change in the pricing level occurred from the beginning to the end of the period. Realized and unrealized gains (losses) disclosed in the reconciliation are included in Net Gain (Loss) on the Fund's Statement of Operations. | |
Financial Statements
| Statement of Assets and Liabilities |
As of December 31, 2024 |
| Assets | | | | |
| Investment in securities, at value - See accompanying schedule: | | | | |
Unaffiliated issuers (cost $1,421,028,316) | $ | 2,851,030,215 | | |
Fidelity Central Funds (cost $59,961,523) | | 59,961,523 | | |
| | | | | |
| | | | | |
| Total Investment in Securities (cost $1,480,989,839) | | | $ | 2,910,991,738 |
| Cash | | | | 11,983 |
| Receivable for fund shares sold | | | | 198,259 |
| Dividends receivable | | | | 944,958 |
| Interest receivable | | | | 762 |
| Distributions receivable from Fidelity Central Funds | | | | 147,834 |
| Prepaid expenses | | | | 2,578 |
Total assets | | | | 2,912,298,112 |
| Liabilities | | | | |
| Payable for fund shares redeemed | $ | 5,218,730 | | |
| Accrued management fee | | 1,547,135 | | |
| Distribution and service plan fees payable | | 5,710 | | |
| Other payables and accrued expenses | | 61,561 | | |
| Total liabilities | | | | 6,833,136 |
| Commitments and contingent liabilities (see Significant Accounting Policies note) | | | | |
| Net Assets | | | $ | 2,905,464,976 |
| Net Assets consist of: | | | | |
| Paid in capital | | | $ | 1,304,415,143 |
| Total accumulated earnings (loss) | | | | 1,601,049,833 |
| Net Assets | | | $ | 2,905,464,976 |
| | | | | |
| Net Asset Value and Maximum Offering Price | | | | |
| Initial Class : | | | | |
Net Asset Value, offering price and redemption price per share ($554,750,405 ÷ 13,275,470 shares) | | | $ | 41.79 |
| Service Class 2 : | | | | |
Net Asset Value, offering price and redemption price per share ($26,587,575 ÷ 638,546 shares) | | | $ | 41.64 |
| Investor Class : | | | | |
Net Asset Value, offering price and redemption price per share ($2,324,126,996 ÷ 56,849,378 shares) | | | $ | 40.88 |
| Statement of Operations |
| Year ended December 31, 2024 |
| Investment Income | | | | |
| Dividends | | | $ | 11,439,674 |
| Interest | | | | 21,591 |
| Income from Fidelity Central Funds (including $36,397 from security lending) | | | | 2,909,386 |
| Total income | | | | 14,370,651 |
| Expenses | | | | |
| Management fee | $ | 15,787,438 | | |
| Transfer agent fees | | 462,792 | | |
| Distribution and service plan fees | | 40,679 | | |
| Accounting fees | | 99,656 | | |
| Custodian fees and expenses | | 37,702 | | |
| Independent trustees' fees and expenses | | 10,754 | | |
| Audit fees | | 60,464 | | |
| Legal | | 6,645 | | |
| Interest | | 1,612 | | |
| Miscellaneous | | 22,810 | | |
| Total expenses before reductions | | 16,530,552 | | |
| Expense reductions | | (96,458) | | |
| Total expenses after reductions | | | | 16,434,094 |
| Net Investment income (loss) | | | | (2,063,443) |
| Realized and Unrealized Gain (Loss) | | | | |
| Net realized gain (loss) on: | | | | |
| Investment Securities: | | | | |
| Unaffiliated issuers | | 236,668,882 | | |
| Fidelity Central Funds | | 2,357 | | |
| Foreign currency transactions | | (13,683) | | |
| Total net realized gain (loss) | | | | 236,657,556 |
| Change in net unrealized appreciation (depreciation) on: | | | | |
| Investment Securities: | | | | |
| Unaffiliated issuers | | 516,272,941 | | |
| Assets and liabilities in foreign currencies | | (3,859) | | |
| Total change in net unrealized appreciation (depreciation) | | | | 516,269,082 |
| Net gain (loss) | | | | 752,926,638 |
| Net increase (decrease) in net assets resulting from operations | | | $ | 750,863,195 |
| Statement of Changes in Net Assets |
| |
| | Year ended December 31, 2024 | | Year ended December 31, 2023 |
| Increase (Decrease) in Net Assets | | | | |
| Operations | | | | |
| Net investment income (loss) | $ | (2,063,443) | $ | 1,336,798 |
| Net realized gain (loss) | | 236,657,556 | | 47,900,338 |
| Change in net unrealized appreciation (depreciation) | | 516,269,082 | | 643,678,134 |
| Net increase (decrease) in net assets resulting from operations | | 750,863,195 | | 692,915,270 |
| Distributions to shareholders | | (104,526,052) | | (44,921,857) |
| | | | | |
| Share transactions - net increase (decrease) | | 165,606,050 | | 318,026,731 |
| Total increase (decrease) in net assets | | 811,943,193 | | 966,020,144 |
| | | | | |
| Net Assets | | | | |
| Beginning of period | | 2,093,521,783 | | 1,127,501,639 |
| End of period | $ | 2,905,464,976 | $ | 2,093,521,783 |
| | | | | |
| | | | | |
Financial Highlights
VIP Technology Portfolio Initial Class |
| |
| Years ended December 31, | | 2024 | | 2023 | | 2022 | | 2021 | | 2020 |
Selected Per-Share Data | | | | | | | | | | |
| Net asset value, beginning of period | $ | 32.11 | $ | 20.94 | $ | 35.65 | $ | 30.99 | $ | 19.08 |
| Income from Investment Operations | | | | | | | | | | |
Net investment income (loss) A,B | | (.01) | | .04 | | .01 | | (.04) | | (.01) |
| Net realized and unrealized gain (loss) | | 11.22 | | 11.94 | | (12.04) | | 8.22 | | 12.36 |
| Total from investment operations | | 11.21 | | 11.98 | | (12.03) | | 8.18 | | 12.35 |
| Distributions from net investment income | | - | | (.04) | | - | | - | | (.02) |
| Distributions from net realized gain | | (1.53) | | (.77) | | (2.68) | | (3.52) | | (.42) |
| Total distributions | | (1.53) | | (.81) | | (2.68) | | (3.52) | | (.44) |
| Net asset value, end of period | $ | 41.79 | $ | 32.11 | $ | 20.94 | $ | 35.65 | $ | 30.99 |
Total Return C,D | | | | 58.32% | | (35.86)% | | 28.16% | | 64.95% |
Ratios to Average Net Assets B,E,F | | | | | | | | | | |
| Expenses before reductions | | .58% | | .62% | | .63% | | .62% | | .63% |
| Expenses net of fee waivers, if any | | | | .61% | | .62% | | .62% | | .63% |
| Expenses net of all reductions | | .58% | | .61% | | .62% | | .62% | | .63% |
| Net investment income (loss) | | (.02)% | | .14% | | .05% | | (.12)% | | (.03)% |
| Supplemental Data | | | | | | | | | | |
| Net assets, end of period (000 omitted) | $ | 554,750 | $ | 386,441 | $ | 185,489 | $ | 356,589 | $ | 286,967 |
Portfolio turnover rate G | | | | 24% | | 21% | | 31% | | 52% |
ACalculated based on average shares outstanding during the period.
BNet investment income (loss) is affected by the timing of the declaration of dividends by any underlying mutual funds or exchange-traded funds (ETFs). Net investment income (loss) of any mutual funds or ETFs is not included in the Fund's net investment income (loss) ratio.
CTotal returns do not reflect charges attributable to your insurance company's separate account. Inclusion of these charges would reduce the total returns shown.
DTotal returns would have been lower if certain expenses had not been reduced during the applicable periods shown.
EFees and expenses of any underlying mutual funds or exchange-traded funds (ETFs) are not included in the Fund's expense ratio. The Fund indirectly bears its proportionate share of these expenses. For additional expense information related to investments in Fidelity Central Funds, please refer to the "Investments in Fidelity Central Funds" note found in the Notes to Financial Statements section of the most recent Annual or Semi-Annual report.
FExpense ratios reflect operating expenses of the class. Expenses before reductions do not reflect amounts reimbursed, waived, or reduced through arrangements with the investment adviser, brokerage services, or other offset arrangements, if applicable, and do not represent the amount paid by the class during periods when reimbursements, waivers or reductions occur.
GAmount does not include the portfolio activity of any underlying mutual funds or exchange-traded funds (ETFs), derivatives or securities that mature within one year from acquisition.
VIP Technology Portfolio Service Class 2 |
| |
| Years ended December 31, | | 2024 | | 2023 A |
Selected Per-Share Data | | | | |
| Net asset value, beginning of period | $ | 32.07 | $ | 28.65 |
| Income from Investment Operations | | | | |
Net investment income (loss) B,C | | (.10) | | (.01) |
| Net realized and unrealized gain (loss) | | 11.20 | | 3.57 |
| Total from investment operations | | 11.10 | | 3.56 |
| Distributions from net investment income | | - | | (.04) |
| Distributions from net realized gain | | (1.53) | | (.10) |
| Total distributions | | (1.53) | | (.14) |
| Net asset value, end of period | $ | 41.64 | $ | 32.07 |
Total Return D,E,F | | | | 12.45% |
Ratios to Average Net Assets C,G,H | | | | |
| Expenses before reductions | | .82% | | .88% I |
| Expenses net of fee waivers, if any | | | | .87% I |
| Expenses net of all reductions | | .82% | | .87% I |
| Net investment income (loss) | | (.26)% | | (.13)% I |
| Supplemental Data | | | | |
| Net assets, end of period (000 omitted) | $ | 26,588 | $ | 5,041 |
Portfolio turnover rate J | | | | 24% |
AFor the period August 16, 2023 (commencement of sale of shares) through December 31, 2023.
BCalculated based on average shares outstanding during the period.
CNet investment income (loss) is affected by the timing of the declaration of dividends by any underlying mutual funds or exchange-traded funds (ETFs). Net investment income (loss) of any mutual funds or ETFs is not included in the Fund's net investment income (loss) ratio.
DTotal returns for periods of less than one year are not annualized.
ETotal returns do not reflect charges attributable to your insurance company's separate account. Inclusion of these charges would reduce the total returns shown.
FTotal returns would have been lower if certain expenses had not been reduced during the applicable periods shown.
GFees and expenses of any underlying mutual funds or exchange-traded funds (ETFs) are not included in the Fund's expense ratio. The Fund indirectly bears its proportionate share of these expenses. For additional expense information related to investments in Fidelity Central Funds, please refer to the "Investments in Fidelity Central Funds" note found in the Notes to Financial Statements section of the most recent Annual or Semi-Annual report.
HExpense ratios reflect operating expenses of the class. Expenses before reductions do not reflect amounts reimbursed, waived, or reduced through arrangements with the investment adviser, brokerage services, or other offset arrangements, if applicable, and do not represent the amount paid by the class during periods when reimbursements, waivers or reductions occur.
IAnnualized.
JAmount does not include the portfolio activity of any underlying mutual funds or exchange-traded funds (ETFs), derivatives or securities that mature within one year from acquisition.
VIP Technology Portfolio Investor Class |
| |
| Years ended December 31, | | 2024 | | 2023 | | 2022 | | 2021 | | 2020 |
Selected Per-Share Data | | | | | | | | | | |
| Net asset value, beginning of period | $ | 31.46 | $ | 20.54 | $ | 35.03 | $ | 30.51 | $ | 18.80 |
| Income from Investment Operations | | | | | | | | | | |
Net investment income (loss) A,B | | (.03) | | .02 | | (.01) | | (.06) | | (.02) |
| Net realized and unrealized gain (loss) | | 10.98 | | 11.69 | | (11.81) | | 8.07 | | 12.16 |
| Total from investment operations | | 10.95 | | 11.71 | | (11.82) | | 8.01 | | 12.14 |
| Distributions from net investment income | | - | | (.02) | | - | | - | | (.02) |
| Distributions from net realized gain | | (1.53) | | (.77) | | (2.67) | | (3.49) | | (.41) |
| Total distributions | | (1.53) | | (.79) | | (2.67) | | (3.49) | | (.43) |
| Net asset value, end of period | $ | 40.88 | $ | 31.46 | $ | 20.54 | $ | 35.03 | $ | 30.51 |
Total Return C,D | | | | 58.14% | | (35.87)% | | 28.06% | | 64.76% |
Ratios to Average Net Assets B,E,F | | | | | | | | | | |
| Expenses before reductions | | .66% | | .70% | | .70% | | .70% | | .71% |
| Expenses net of fee waivers, if any | | | | .69% | | .70% | | .70% | | .71% |
| Expenses net of all reductions | | .65% | | .69% | | .70% | | .70% | | .71% |
| Net investment income (loss) | | (.09)% | | .07% | | (.02)% | | (.20)% | | (.11)% |
| Supplemental Data | | | | | | | | | | |
| Net assets, end of period (000 omitted) | $ | 2,324,127 | $ | 1,702,040 | $ | 942,013 | $ | 1,692,073 | $ | 1,365,091 |
Portfolio turnover rate G | | | | 24% | | 21% | | 31% | | 52% |
ACalculated based on average shares outstanding during the period.
BNet investment income (loss) is affected by the timing of the declaration of dividends by any underlying mutual funds or exchange-traded funds (ETFs). Net investment income (loss) of any mutual funds or ETFs is not included in the Fund's net investment income (loss) ratio.
CTotal returns do not reflect charges attributable to your insurance company's separate account. Inclusion of these charges would reduce the total returns shown.
DTotal returns would have been lower if certain expenses had not been reduced during the applicable periods shown.
EFees and expenses of any underlying mutual funds or exchange-traded funds (ETFs) are not included in the Fund's expense ratio. The Fund indirectly bears its proportionate share of these expenses. For additional expense information related to investments in Fidelity Central Funds, please refer to the "Investments in Fidelity Central Funds" note found in the Notes to Financial Statements section of the most recent Annual or Semi-Annual report.
FExpense ratios reflect operating expenses of the class. Expenses before reductions do not reflect amounts reimbursed, waived, or reduced through arrangements with the investment adviser, brokerage services, or other offset arrangements, if applicable, and do not represent the amount paid by the class during periods when reimbursements, waivers or reductions occur.
GAmount does not include the portfolio activity of any underlying mutual funds or exchange-traded funds (ETFs), derivatives or securities that mature within one year from acquisition.
Notes to Financial Statements
For the period ended December 31, 2024
1. Organization.
VIP Technology Portfolio (the Fund) is a non-diversified fund of Variable Insurance Products Fund IV (the Trust) and is authorized to issue an unlimited number of shares. The Trust is registered under the Investment Company Act of 1940, as amended (the 1940 Act), as an open-end management investment company organized as a Massachusetts business trust. Shares of the Fund may only be purchased by insurance companies for the purpose of funding variable annuity or variable life insurance contracts. The Fund offers the following classes of shares: Initial Class shares, Service Class 2 shares and Investor Class shares. All classes have equal rights and voting privileges, except for matters affecting a single class.
2. Investments in Fidelity Central Funds.
Funds may invest in Fidelity Central Funds, which are open-end investment companies generally available only to other investment companies and accounts managed by the investment adviser and its affiliates. The Schedule of Investments lists any Fidelity Central Funds held as an investment as of period end, but does not include the underlying holdings of each Fidelity Central Fund. An investing fund indirectly bears its proportionate share of the expenses of the underlying Fidelity Central Funds.
Based on its investment objective, each Fidelity Central Fund may invest or participate in various investment vehicles or strategies that are similar to those of the investing fund. These strategies are consistent with the investment objectives of the investing fund and may involve certain economic risks which may cause a decline in value of each of the Fidelity Central Funds and thus a decline in the value of the investing fund.
| Fidelity Central Fund | Investment Manager | Investment Objective | Investment Practices | Expense RatioA |
| Fidelity Money Market Central Funds | Fidelity Management & Research Company LLC (FMR) | Each fund seeks to obtain a high level of current income consistent with the preservation of capital and liquidity. | Short-term Investments | Less than .005% |
A Expenses expressed as a percentage of average net assets and are as of each underlying Central Fund's most recent annual or semi-annual shareholder report.
A complete unaudited list of holdings for each Fidelity Central Fund is available upon request or at the Securities and Exchange Commission website at www.sec.gov. In addition, the financial statements of the Fidelity Central Funds which contain the significant accounting policies (including investment valuation policies) of those funds, and are not covered by the Report of Independent Registered Public Accounting Firm, are available on the Securities and Exchange Commission website or upon request.
3. Significant Accounting Policies.
The Fund is an investment company and applies the accounting and reporting guidance of the Financial Accounting Standards Board (FASB) Accounting Standards Codification Topic 946 Financial Services - Investment Companies. The financial statements have been prepared in conformity with accounting principles generally accepted in the United States of America (GAAP), which require management to make certain estimates and assumptions at the date of the financial statements. Actual results could differ from those estimates. The Fund operates as a single operating segment. The Fund's income, expenses, assets, and performance are regularly monitored and assessed as a whole by the investment adviser and other individuals responsible for oversight functions of the Trust, using the information presented in the financial statements and financial highlights. Subsequent events, if any, through the date that the financial statements were issued have been evaluated in the preparation of the financial statements. The Fund's Schedule of Investments lists any underlying mutual funds or exchange-traded funds (ETFs) but does not include the underlying holdings of these funds. The following summarizes the significant accounting policies of the Fund:
Investment Valuation. Investments are valued as of 4:00 p.m. Eastern time on the last calendar day of the period. The Board of Trustees (the Board) has designated the Fund's investment adviser as the valuation designee responsible for the fair valuation function and performing fair value determinations as needed. The investment adviser has established a Fair Value Committee (the Committee) to carry out the day-to-day fair valuation responsibilities and has adopted policies and procedures to govern the fair valuation process and the activities of the Committee. In accordance with these fair valuation policies and procedures, which have been approved by the Board, the Fund attempts to obtain prices from one or more third party pricing services or brokers to value its investments. When current market prices, quotations or currency exchange rates are not readily available or reliable, investments will be fair valued in good faith by the Committee, in accordance with the policies and procedures. Factors used in determining fair value vary by investment type and may include market or investment specific events, transaction data, estimated cash flows, and market observations of comparable investments. The frequency that the fair valuation procedures are used cannot be predicted and they may be utilized to a significant extent. The Committee manages the Fund's fair valuation practices and maintains the fair valuation policies and procedures. The Fund's investment adviser reports to the Board information regarding the fair valuation process and related material matters.
The Fund categorizes the inputs to valuation techniques used to value its investments into a disclosure hierarchy consisting of three levels as shown below:
Level 1 - unadjusted quoted prices in active markets for identical investments
Level 2 - other significant observable inputs (including quoted prices for similar investments, interest rates, prepayment speeds, etc.)
Level 3 - unobservable inputs (including the Fund's own assumptions based on the best information available)
Valuation techniques used to value the Fund's investments by major category are as follows:
Equity securities, including restricted securities, for which market quotations are readily available, are valued at the last reported sale price or official closing price as reported by a third party pricing service on the primary market or exchange on which they are traded and are categorized as Level 1 in the hierarchy. In the event there were no sales during the day or closing prices are not available, securities are valued at the last quoted bid price or may be valued using the last available price and are generally categorized as Level 2 in the hierarchy. For foreign equity securities, when market or security specific events arise, comparisons to the valuation of American Depositary Receipts (ADRs), futures contracts, Exchange-Traded Funds (ETFs) and certain indexes as well as quoted prices for similar securities may be used and would be categorized as Level 2 in the hierarchy. For equity securities, including restricted securities, where observable inputs are limited, assumptions about market activity and risk are used and these securities may be categorized as Level 3 in the hierarchy. Securities, including private placements or other restricted securities, for which observable inputs are not available are valued using alternate valuation approaches, including the market approach, the income approach and cost approach, and are categorized as Level 3 in the hierarchy. The market approach considers factors including the price of recent investments in the same or a similar security or financial metrics of comparable securities. The income approach considers factors including expected future cash flows, security specific risks and corresponding discount rates. The cost approach considers factors including the value of the security's underlying assets and liabilities.
Debt securities, including restricted securities, are valued based on evaluated prices received from third party pricing services or from brokers who make markets in such securities. Corporate bonds and preferred securities are valued by pricing services who utilize matrix pricing which considers yield or price of bonds of comparable quality, coupon, maturity and type or by broker-supplied prices. When independent prices are unavailable or unreliable, debt securities may be valued utilizing pricing methodologies which consider similar factors that would be used by third party pricing services. Debt securities are generally categorized as Level 2 in the hierarchy but may be Level 3 depending on the circumstances.
Investments in open-end mutual funds, including the Fidelity Central Funds, are valued at their closing net asset value (NAV) each business day and are categorized as Level 1 in the hierarchy.
The following provides information on Level 3 securities held by the Fund that were valued at period end based on unobservable inputs. These amounts exclude valuations provided by a broker.
| Asset Type | Fair Value | Valuation Technique(s) | Unobservable Input | Amount or Range/Weighted Average | Impact to Valuation from an Increase in InputA |
| Common Stocks | $10,960,507 | Market comparable | Enterprise value/Revenue multiple (EV/R) | 11.3 - 19.1 / 18.5 | Increase |
| | | Market approach | Transaction price | $8.00 | Increase |
| | | Recovery value | Recovery value | $0.00 | Increase |
| | | Black scholes | Discount rate | 4.3% | Increase |
| | | | Term | 3.0 | Increase |
| | | | Volatility | 70.0% | Increase |
| Convertible Corporate Bonds | $55,962 | Market approach | Transaction price | $100.00 | Increase |
| | | | Discount rate | 21.7% | Decrease |
| | | | Probability rate | 0.0% - 60.0% / 25.0% | Increase |
| | | Black scholes | Discount rate | 5.0% | Increase |
| | | | Term | 0.4 | Increase |
| | | | Volatility | 100.0% | Increase |
| Convertible Preferred Stocks | $37,729,717 | Market comparable | Enterprise value/Revenue multiple (EV/R) | 0.9 - 51.0 / 20.5 | Increase |
| | | Market approach | Transaction price | $1.10 - $8.00 / $4.12 | Increase |
| | | | Discount rate | 60.0% | Decrease |
| | | | Premium rate | 20.0% | Increase |
| | �� | Black scholes | Discount rate | 4.1% - 4.4% / 4.3% | Increase |
| | | | Term | 2.0 - 5.0 / 3.0 | Increase |
| | | | Volatility | 50.0% - 100.0% / 65.5% | Increase |
| Preferred Securities | $292,543 | Market approach | Transaction price | $100.00 | Increase |
| | | | Discount rate | 35.4% - 37.9% / 36.4% | Decrease |
| | | | Probability rate | 0.0% - 50.0% / 30.1% | Increase |
| | | Black scholes | Discount rate | 4.3% - 5.0% / 4.7% | Increase |
| | | | Term | 0.1 - 0.5 / 0.3 | Increase |
| | | | Volatility | 50.0% - 100.0% / 79.8% | Increase |
A Represents the directional change in the fair value of the Level 3 investments that could have resulted from an increase in the corresponding input as of period end. A decrease to the unobservable input would have had the opposite effect. Significant changes in these inputs may have resulted in a significantly higher or lower fair value measurement at period end.
Changes in valuation techniques may result in transfers in or out of an assigned level within the disclosure hierarchy. The aggregate value of investments by input level as of December 31, 2024, as well as a roll forward of Level 3 investments, is included at the end of the Fund's Schedule of Investments.
Foreign Currency. Certain Funds may use foreign currency contracts to facilitate transactions in foreign-denominated securities. Gains and losses from these transactions may arise from changes in the value of the foreign currency or if the counterparties do not perform under the contracts' terms.
Foreign-denominated assets, including investment securities, and liabilities are translated into U.S. dollars at the exchange rates at period end. Purchases and sales of investment securities, income and dividends received, and expenses denominated in foreign currencies are translated into U.S. dollars at the exchange rate in effect on the transaction date.
The effects of exchange rate fluctuations on investments are included with the net realized and unrealized gain (loss) on investment securities. Other foreign currency transactions resulting in realized and unrealized gain (loss) are disclosed separately.
Investment Transactions and Income. For financial reporting purposes, the Fund's investment holdings and NAV include trades executed through the end of the last business day of the period. The NAV per share for processing shareholder transactions is calculated as of the close of business of the New York Stock Exchange (NYSE), normally 4:00 p.m. Eastern time and includes trades executed through the end of the prior business day. Gains and losses on securities sold are determined on the basis of identified cost and include proceeds received from litigation. Commissions paid to certain brokers with whom the investment adviser, or its affiliates, places trades on behalf of a fund include an amount in addition to trade execution, which may be rebated back to a fund. Any such rebates are included in net realized gain (loss) on investments in the Statement of Operations. Dividend income is recorded on the ex-dividend date, except for certain dividends from foreign securities where the ex-dividend date may have passed, which are recorded as soon as the Fund is informed of the ex-dividend date. Non-cash dividends included in dividend income, if any, are recorded at the fair market value of the securities received. Income and capital gain distributions from Fidelity Central Funds, if any, are recorded on the ex-dividend date. Certain distributions received by the Fund represent a return of capital or capital gain. The Fund determines the components of these distributions subsequent to the ex-dividend date, based upon receipt of tax filings or other correspondence relating to the underlying investment. These distributions are recorded as a reduction of cost of investments and/or as a realized gain. Interest income is accrued as earned and includes coupon interest and amortization of premium and accretion of discount on debt securities as applicable. Investment income is recorded net of foreign taxes withheld where recovery of such taxes is uncertain. Funds may file withholding tax reclaims in certain jurisdictions to recover a portion of amounts previously withheld. Any withholding tax reclaims income is included in the Statement of Operations in dividends. Any receivables for withholding tax reclaims are included in the Statement of Assets and Liabilities in dividends receivable.
Class Allocations and Expenses. Investment income, realized and unrealized capital gains and losses, common expenses of a fund, and certain fund-level expense reductions, if any, are allocated daily on a pro-rata basis to each class based on the relative net assets of each class to the total net assets of a fund. Each class differs with respect to transfer agent and distribution and service plan fees incurred, as applicable. Certain expense reductions may also differ by class, if applicable. For the reporting period, the allocated portion of income and expenses to each class as a percent of its average net assets may vary due to the timing of recording these transactions in relation to fluctuating net assets of the classes. Expenses directly attributable to a fund are charged to that fund. Expenses attributable to more than one fund are allocated among the respective funds on the basis of relative net assets or other appropriate methods. Expenses included in the accompanying financial statements reflect the expenses of that fund and do not include any expenses associated with any underlying mutual funds or exchange-traded funds (ETFs). Although not included in a fund's expenses, a fund indirectly bears its proportionate share of these expenses through the net asset value of each underlying mutual fund or exchange-traded fund (ETF). Expense estimates are accrued in the period to which they relate and adjustments are made when actual amounts are known.
Income Tax Information and Distributions to Shareholders. Each year, the Fund intends to qualify as a regulated investment company under Subchapter M of the Internal Revenue Code, including distributing substantially all of its taxable income and realized gains. As a result, no provision for U.S. Federal income taxes is required. As of December 31, 2024, the Fund did not have any unrecognized tax benefits in the financial statements; nor is the Fund aware of any tax positions for which it is reasonably possible that the total amounts of unrecognized tax benefits will significantly change in the next twelve months. The Fund files a U.S. federal tax return, in addition to state and local tax returns as required. The Fund's federal income tax returns are subject to examination by the Internal Revenue Service (IRS) for a period of three fiscal years after they are filed. State and local tax returns may be subject to examination for an additional fiscal year depending on the jurisdiction. Foreign taxes are provided for based on the Fund's understanding of the tax rules and rates that exist in the foreign markets in which it invests.
Distributions are declared and recorded on the ex-dividend date. Income and capital gain distributions are declared separately for each class. Income and capital gain distributions are determined in accordance with income tax regulations, which may differ from GAAP.
Capital accounts within the financial statements are adjusted for permanent book-tax differences. These adjustments have no impact on net assets or the results of operations. Capital accounts are not adjusted for temporary book-tax differences which will reverse in a subsequent period.
Book-tax differences are primarily due to foreign currency transactions and losses deferred due to wash sales.
As of period end, the cost and unrealized appreciation (depreciation) in securities, and derivatives if applicable, for federal income tax purposes were as follows:
| Gross unrealized appreciation | $1,520,935,307 |
| Gross unrealized depreciation | (98,269,107) |
| Net unrealized appreciation (depreciation) | $1,422,666,200 |
| Tax Cost | $1,488,325,538 |
The tax-based components of distributable earnings as of period end were as follows:
| Undistributed ordinary income | $29,832,329 |
| Undistributed long-term capital gain | $148,553,832 |
| Net unrealized appreciation (depreciation) on securities and other investments | $1,422,663,674 |
The tax character of distributions paid was as follows:
| | December 31, 2024 | December 31, 2023 |
| Ordinary Income | $39,033,385 | $7,959,390 |
| Long-term Capital Gains | 65,492,667 | 36,962,467 |
| Total | $104,526,052 | $44,921,857 |
Restricted Securities (including Private Placements). Funds may invest in securities that are subject to legal or contractual restrictions on resale. These securities generally may be resold in transactions exempt from registration or to the public if the securities are registered. Disposal of these securities may involve time-consuming negotiations and expense, and prompt sale at an acceptable price may be difficult. Information regarding restricted securities held at period end is included at the end of the Schedule of Investments, if applicable.
Commitments. A commitment is an agreement to acquire an investment at a future date (subject to conditions) in connection with a potential public or non-public offering. Commitments outstanding at period end are presented in the table below. Unrealized appreciation (depreciation) on any commitments outstanding at period end is separately presented in the Statement of Assets and Liabilities as Unrealized appreciation (depreciation) on unfunded commitments, and any change in unrealized appreciation (depreciation) on unfunded commitments during the period is separately presented in the Statement of Operations, as applicable based on contractual conditions of each commitment.
| | Investment to be Acquired | Commitment Amount ($) | Unrealized Appreciation (Depreciation)($) |
| VIP Technology Portfolio | Revolute Group Holdings, Ltd. | 2,883,579 | - |
New Accounting Pronouncement. FASB Accounting Standards Update (ASU) 2023-07 Segment Reporting (Topic 280): Improvements to Reportable Segment Disclosures became effective in this reporting period. ASU 2023-07 enhances segment information disclosure in the notes to financial statements.
4. Purchases and Sales of Investments.
Purchases and sales of securities, other than short-term securities and in-kind transactions, as applicable, are noted in the table below.
| | Purchases ($) | Sales ($) |
| VIP Technology Portfolio | 1,398,149,445 | 1,292,030,205 |
5. Fees and Other Transactions with Affiliates.
Management Fee. Fidelity Management & Research Company LLC (the investment adviser) and its affiliates provide the Fund with investment management related services for which the Fund pays a monthly management fee.
Effective March 1, 2024, the Fund's management contract was amended to incorporate administrative services previously covered under separate services agreements (Transfer Agent and Accounting agreements). The amended contract incorporates a management fee rate that may vary by class. The investment adviser or an affiliate pays certain expenses of managing and operating the Fund out of each class's management fee. Each class of the Fund pays a management fee to the investment adviser. The management fee is calculated and paid to the investment adviser every month. When determining a class's management fee, a mandate rate is calculated based on the monthly average net assets of a group of funds advised by FMR within a designated asset class. A discount rate is subtracted from the mandate rate once the Fund's monthly average net assets reach a certain level. The mandate rate and discount rate may vary by class. The annual management fee rate for a class of shares of the Fund is the lesser of (1) the class's mandate rate reduced by the class's discount rate (if applicable) or (2) the amount set forth in the following table.
| | Maximum Management Fee Rate % |
| Initial Class | .58 |
| Service Class 2 | .58 |
| Investor Class | .66 |
One-twelfth of the management fee rate for a class is applied to the average net assets of the class for the month, giving a dollar amount which is the management fee for the class for that month. A different management fee rate may be applicable to each class of the Fund. The difference between classes is the result of separate arrangements for class-level services and/or waivers of certain expenses. It is not the result of any difference in advisory or custodial fees or other expenses related to the management of the Fund's assets, which do not vary by class. For the portion of the reporting period on or after March 1, 2024, the total annualized management fee rates were as follows:
| | Total Management Fee Rate % |
| Initial Class | .57 |
| Service Class 2 | .57 |
| Investor Class | .64 |
Prior to March 1, 2024, the management fee was the sum of an individual fund fee rate that was based on an annual rate of .30% of the Fund's average net assets and an annualized group fee rate that averaged .22% during the period. The group fee rate was based upon the monthly average net assets of a group of registered investment companies with which the investment adviser has management contracts. The group fee rate decreased as assets under management increased and increased as assets under management decreased. For the portion of the reporting period prior to March 1, 2024, the total annualized management fee rate was .52%.
Effective March 1, 2024, the Fund's sub-advisory agreements with FMR Investment Management (UK) Limited, Fidelity Management & Research (Hong Kong) Limited, and Fidelity Management & Research (Japan) Limited were amended to provide that the investment adviser pays each sub-adviser monthly fees equal to 110% of the sub-adviser's costs for providing sub-advisory services.
Distribution and Service Plan Fees. In accordance with Rule 12b-1 of the 1940 Act, the Fund has adopted a separate 12b-1 Plan for Service Class 2 shares. Service Class 2 pays Fidelity Distributors Company LLC (FDC), an affiliate of the investment adviser, a service fee. For the period, the service fee is based on an annual rate of .25% of Service Class 2's average net assets.
For the period, total fees for Service Class 2, all of which was re-allowed to insurance companies for the distribution of shares and providing shareholder support services were $40,679.
Transfer Agent Fees. Fidelity Investments Institutional Operations Company LLC (FIIOC), an affiliate of the investment adviser, is the Fund's transfer, dividend disbursing, and shareholder servicing agent. Effective March 1, 2024, the Fund's management contract was amended to incorporate transfer agent services and associated fees previously covered under a separate services agreement.
During the period January 1, 2024 through February 29, 2024, the transfer agent fees for each class were a fixed annual rate of class-level average net assets as follows:
| | Amount ($) | % of Class-Level Average Net Assets |
| Initial Class | 42,498 | .0630% |
| Service Class 2 | 739 | .0630% |
| Investor Class | 419,555 | .1390% |
| | 462,792 | |
Accounting Fees. Fidelity Service Company, Inc. (FSC), an affiliate of the investment adviser, maintains the Fund's accounting records. Effective March 1, 2024, the Fund's management contract was amended to incorporate accounting services and associated fees previously covered under a separate services agreement.
During the period January 1, 2024 through February 29, 2024, the accounting fees were a fixed annual rate of average net assets as follows:
| | % of Average Net Assets |
| VIP Technology Portfolio | .0269% |
Brokerage Commissions. A portion of portfolio transactions were placed with brokerage firms which are affiliates of the investment adviser. Brokerage commissions are included in net realized gain (loss) and change in net unrealized appreciation (depreciation) in the Statement of Operations. The commissions paid to these affiliated firms were as follows:
| | Amount ($) |
| VIP Technology Portfolio | 11,312 |
Interfund Lending Program. Pursuant to an Exemptive Order issued by the Securities and Exchange Commission (the SEC), the Fund, along with other registered investment companies having management contracts with Fidelity Management & Research Company LLC (FMR), or other affiliated entities of FMR, may participate in an interfund lending program. This program provides an alternative credit facility allowing the Fund to borrow from, or lend money to, other participating affiliated funds at rates that are beneficial to both the borrowing and lending fund. Borrowings under the program are generally for temporary or emergency purposes, including meeting fund shareholder redemptions. The interfund loan rate is determined, as specified in the Exemptive Order, by averaging, (1) the higher of the overnight time deposit rate and the current overnight repurchase agreement rate, and (2) a benchmark rate representing the lowest bank loan rate available to the funds. At period end, there were no interfund loans outstanding. Activity in this program during the period for which loans were outstanding was as follows:
| | Borrower or Lender | Average Loan Balance ($) | Weighted Average Interest Rate | Interest Expense ($) |
| VIP Technology Portfolio | Borrower | 5,214,000 | 5.57% | 1,612 |
Interfund Trades. Funds may purchase from or sell securities to other Fidelity Funds under procedures adopted by the Board. The procedures have been designed to ensure these interfund trades are executed in accordance with Rule 17a-7 of the 1940 Act. Any interfund trades are included within the respective purchases and sales amounts shown in the Purchases and Sales of Investments note. Interfund trades during the period are noted in the table below.
| | Purchases ($) | Sales ($) | Realized Gain (Loss) ($) |
| VIP Technology Portfolio | 149,505,924 | 103,207,431 | 14,094,217 |
6. Committed Line of Credit.
Certain Funds participate with other funds managed by the investment adviser or an affiliate in a $4.25 billion credit facility (the "line of credit") to be utilized for temporary or emergency purposes to fund shareholder redemptions or for other short-term liquidity purposes.
Commitment fees are charged based on the unused amount of the line of credit at an annual rate of .10%, and then allocated to each participating fund based on its pro-rata portion of the line of credit. The commitment fees are reflected in Miscellaneous expenses on the Statement of Operations, and are listed below.
Interest is charged to a participating fund based on its borrowings at an annual rate of .75% plus the highest of (i) daily SOFR plus a .10% spread adjustment, (ii) Federal Funds Effective Rate, or (iii) Overnight Bank Funding Rate. During the period, there were no borrowings on this line of credit.
The line of credit agreement will expire in March 2025 unless extended or renewed.
| | Amount ($) |
| VIP Technology Portfolio | 3,723 |
7. Security Lending.
Funds lend portfolio securities from time to time in order to earn additional income. Lending agents are used, including National Financial Services (NFS), an affiliate of the investment adviser. Pursuant to a securities lending agreement, NFS will receive a fee, which is capped at 9.9% of a fund's daily lending revenue, for its services as lending agent. A fund may lend securities to certain qualified borrowers, including NFS. On the settlement date of the loan, a fund receives collateral (in the form of U.S. Treasury obligations, letters of credit and/or cash) against the loaned securities and maintains collateral in an amount not less than 100% of the market value of the loaned securities during the period of the loan. The market value of the loaned securities is determined at the close of business of a fund and any additional required collateral is delivered to a fund on the next business day. A fund or borrower may terminate the loan at any time, and if the borrower defaults on its obligation to return the securities loaned because of insolvency or other reasons, a fund may apply collateral received from the borrower against the obligation. A fund may experience delays and costs in recovering the securities loaned. Any cash collateral received is invested in the Fidelity Securities Lending Cash Central Fund. Any loaned securities are identified as such in the Schedule of Investments, and the value of loaned securities and cash collateral at period end, as applicable, are presented in the Statement of Assets and Liabilities. Security lending income represents the income earned on investing cash collateral, less rebates paid to borrowers and any lending agent fees associated with the loan, plus any premium payments received for lending certain types of securities. Security lending income is presented in the Statement of Operations as a component of income from Fidelity Central Funds. Affiliated security lending activity, if any, was as follows:
| | Total Security Lending Fees Paid to NFS ($) | Security Lending Income From Securities Loaned to NFS ($) | Value of Securities Loaned to NFS at Period End ($) |
| VIP Technology Portfolio | 3,859 | 53 | - |
8. Expense Reductions.
During the period the investment adviser or an affiliate reimbursed and/or waived a portion of fund-level operating expenses in the amount of $96,458.
9. Distributions to Shareholders.
Distributions to shareholders of each class were as follows:
| | Year ended December 31, 2024 | Year ended December 31, 2023 A |
| VIP Technology Portfolio | | |
| Distributions to shareholders | | |
| Initial Class | $18,999,763 | $7,701,196 |
| Service Class 2 | 519,205 | 21,247 |
| Investor Class | 85,007,084 | 37,199,414 |
Total | $104,526,052 | $44,921,857 |
A Distributions for Service Class 2 are for the period August 16, 2023 (commencement of sale of shares) through December 31, 2023.
10. Share Transactions.
Transactions for each class of shares were as follows and may contain in-kind transactions:
| | Shares | Shares | Dollars | Dollars |
| | Year ended December 31, 2024 | Year ended December 31, 2023 A | Year ended December 31, 2024 | Year ended December 31, 2023 A |
| VIP Technology Portfolio | | | | |
| Initial Class | | | | |
| Shares sold | 2,864,241 | 4,884,121 | $107,076,192 | $136,520,854 |
| Reinvestment of distributions | 511,343 | 305,373 | 18,999,763 | 7,701,196 |
| Shares redeemed | (2,136,090) | (2,011,242) | (79,028,176) | (55,940,646) |
| Net increase (decrease) | 1,239,494 | 3,178,252 | $47,047,779 | $88,281,404 |
| Service Class 2 | | | | |
| Shares sold | 537,853 | 158,667 | $20,083,673 | $4,661,142 |
| Reinvestment of distributions | 12,967 | 680 | 513,875 | 20,758 |
| Shares redeemed | (69,477) | (2,144) | (2,717,504) | (65,483) |
| Net increase (decrease) | 481,343 | 157,203 | $17,880,044 | $4,616,417 |
| Investor Class | | | | |
| Shares sold | 6,283,661 | 10,012,797 | $229,347,123 | $275,860,254 |
| Reinvestment of distributions | 2,345,050 | 1,518,486 | 85,007,084 | 37,199,414 |
| Shares redeemed | (5,879,954) | (3,303,071) | (213,675,980) | (87,930,758) |
| Net increase (decrease) | 2,748,757 | 8,228,212 | $100,678,227 | $225,128,910 |
A Share transactions for Service Class 2 are for the period August 16, 2023 (commencement of sale of shares) through December 31, 2023.
11. Other.
A fund's organizational documents provide former and current trustees and officers with a limited indemnification against liabilities arising in connection with the performance of their duties to the fund. In the normal course of business, a fund may also enter into contracts that provide general indemnifications. A fund's maximum exposure under these arrangements is unknown as this would be dependent on future claims that may be made against a fund. The risk of material loss from such claims is considered remote.
At the end of the period, the investment adviser or its affiliates were owners of record of more than 10% of the outstanding shares as follows:
| Fund | Affiliated % |
| VIP Technology Portfolio | 93% |
12. Risk and Uncertainties.
Many factors affect a fund's performance. Developments that disrupt global economies and financial markets, such as pandemics, epidemics, outbreaks of infectious diseases, war, terrorism, and environmental disasters, may significantly affect a fund's investment performance. The effects of these developments to a fund will be impacted by the types of securities in which a fund invests, the financial condition, industry, economic sector, and geographic location of an issuer, and a fund's level of investment in the securities of that issuer. Significant concentrations in security types, issuers, industries, sectors, and geographic locations may magnify the factors that affect a fund's performance.
Report of Independent Registered Public Accounting Firm
To the Board of Trustees of Variable Insurance Products Fund IV and Shareholders of VIP Technology Portfolio
Opinion on the Financial Statements
We have audited the accompanying statement of assets and liabilities, including the schedule of investments, of VIP Technology Portfolio (one of the funds constituting Variable Insurance Products Fund IV, referred to hereafter as the "Fund") as of December 31, 2024, the related statement of operations for the year ended December 31, 2024, the statement of changes in net assets for each of the two years in the period ended December 31, 2024, including the related notes, and the financial highlights for each of the periods indicated therein (collectively referred to as the "financial statements"). In our opinion, the financial statements present fairly, in all material respects, the financial position of the Fund as of December 31, 2024, the results of its operations for the year then ended, the changes in its net assets for each of the two years in the period ended December 31, 2024 and the financial highlights for each of the periods indicated therein in conformity with accounting principles generally accepted in the United States of America.
Basis for Opinion
These financial statements are the responsibility of the Fund's management. Our responsibility is to express an opinion on the Fund's financial statements based on our audits. We are a public accounting firm registered with the Public Company Accounting Oversight Board (United States) (PCAOB) and are required to be independent with respect to the Fund in accordance with the U.S. federal securities laws and the applicable rules and regulations of the Securities and Exchange Commission and the PCAOB.
We conducted our audits of these financial statements in accordance with the standards of the PCAOB. Those standards require that we plan and perform the audit to obtain reasonable assurance about whether the financial statements are free of material misstatement, whether due to error or fraud.
Our audits included performing procedures to assess the risks of material misstatement of the financial statements, whether due to error or fraud, and performing procedures that respond to those risks. Such procedures included examining, on a test basis, evidence regarding the amounts and disclosures in the financial statements. Our audits also included evaluating the accounting principles used and significant estimates made by management, as well as evaluating the overall presentation of the financial statements. Our procedures included confirmation of securities owned as of December 31, 2024 by correspondence with the custodian and issuers of privately offered securities. We believe that our audits provide a reasonable basis for our opinion.
/s/ PricewaterhouseCoopers LLP
Boston, Massachusetts
February 11, 2025
We have served as the auditor of one or more investment companies in the Fidelity group of funds since 1932.
Distributions
(Unaudited)The dividend and capital gains distributions for the fund(s) are available on Fidelity.com or Institutional.Fidelity.com.
The fund hereby designates as a capital gain dividend with respect to the taxable year ended December 31, 2024, $148,613,348, or, if subsequently determined to be different, the net capital gain of such year.
The fund designates $2,195,200 of distributions paid during the fiscal year ended 2024 as qualifying to be taxed as section 163(j) interest dividends.
Initial Class designates 1% and 23%; Service Class 2 designates 1% and 23%; and Investor Class designates 1% and 23%; of the dividends distributed in February and December, respectively during the fiscal year as qualifying for the dividends-received deduction for corporate shareholders.
Item 8: Changes in and Disagreements with Accountants for Open-End Management Investment Companies
(Unaudited)
Note: This is not applicable for any fund included in this document.
Item 9: Proxy Disclosures for Open-End Management Investment Companies
(Unaudited)
| A special meeting of shareholders was held on July 16, 2024. The results of votes taken among shareholders on the proposal before them are reported below. Each vote reported represents one dollar of net asset value held on the record date for the meeting. |
| Proposal 1 |
| To elect a Board of Trustees. |
| | # of Votes | % of Votes |
| Bettina Doulton |
| Affirmative | 5,501,492,681.85 | 94.15 |
| Withheld | 341,991,035.05 | 5.85 |
| TOTAL | 5,843,483,716.90 | 100.00 |
| Robert A. Lawrence |
| Affirmative | 5,480,901,467.70 | 93.80 |
| Withheld | 362,582,249.21 | 6.20 |
| TOTAL | 5,843,483,716.90 | 100.00 |
| Vijay C. Advani |
| Affirmative | 5,500,352,811.04 | 94.13 |
| Withheld | 343,130,905.86 | 5.87 |
| TOTAL | 5,843,483,716.90 | 100.00 |
| Thomas P. Bostick |
| Affirmative | 5,488,165,362.69 | 93.92 |
| Withheld | 355,318,354.21 | 6.08 |
| TOTAL | 5,843,483,716.90 | 100.00 |
| Donald F. Donahue |
| Affirmative | 5,482,960,893.76 | 93.83 |
| Withheld | 360,522,823.14 | 6.17 |
| TOTAL | 5,843,483,716.90 | 100.00 |
| Vicki L. Fuller |
| Affirmative | 5,492,283,337.89 | 93.99 |
| Withheld | 351,200,379.01 | 6.01 |
| TOTAL | 5,843,483,716.90 | 100.00 |
| Patricia L. Kampling |
| Affirmative | 5,521,992,715.20 | 94.50 |
| Withheld | 321,491,001.70 | 5.50 |
| TOTAL | 5,843,483,716.90 | 100.00 |
| Thomas A. Kennedy |
| Affirmative | 5,484,789,158.10 | 93.86 |
| Withheld | 358,694,558.80 | 6.14 |
| TOTAL | 5,843,483,716.90 | 100.00 |
| Oscar Munoz |
| Affirmative | 5,497,884,744.63 | 94.09 |
| Withheld | 345,598,972.27 | 5.91 |
| TOTAL | 5,843,483,716.90 | 100.00 |
| Karen B. Peetz |
| Affirmative | 5,503,968,240.81 | 94.19 |
| Withheld | 339,515,476.09 | 5.81 |
| TOTAL | 5,843,483,716.90 | 100.00 |
| David M. Thomas |
| Affirmative | 5,466,218,204.40 | 93.54 |
| Withheld | 377,265,512.50 | 6.46 |
| TOTAL | 5,843,483,716.90 | 100.00 |
| Susan Tomasky |
| Affirmative | 5,463,402,825.36 | 93.50 |
| Withheld | 380,080,891.54 | 6.50 |
| TOTAL | 5,843,483,716.90 | 100.00 |
| Michael E. Wiley |
| Affirmative | 5,466,838,155.74 | 93.55 |
| Withheld | 376,645,561.16 | 6.45 |
| TOTAL | 5,843,483,716.90 | 100.00 |
| | | |
| Proposal 1 reflects trust-wide proposal and voting results. |
Item 10: Remuneration Paid to Directors, Officers, and others of Open-End Management Investment Companies
(Unaudited)
Note: This information is disclosed as part of the financial statements for each Fund as part of Item 7: Financial Statements and Financial Highlights for Open-End Management Investment companies.
Item 11: Statement Regarding Basis for Approval of Investment Advisory Contract
(Unaudited)
Note: This is not applicable for any fund included in this document.
1.817385.119
VTECIC-ANN-0325
Fidelity® Variable Insurance Products:
VIP Consumer Discretionary Portfolio
Annual Report
December 31, 2024
Contents
To view a fund's proxy voting guidelines and proxy voting record for the 12-month period ended June 30, visit http://www.fidelity.com/proxyvotingresults or visit the Securities and Exchange Commission's (SEC) web site at http://www.sec.gov.
You may also call 1-877-208-0098 to request a free copy of the proxy voting guidelines.
Fidelity® Variable Insurance Products are separate account options which are purchased through a variable insurance contract.
Standard & Poor's, S&P and S&P 500 are registered service marks of The McGraw-Hill Companies, Inc. and have been licensed for use by Fidelity Distributors Corporation.
Other third-party marks appearing herein are the property of their respective owners.
All other marks appearing herein are registered or unregistered trademarks or service marks of FMR LLC or an affiliated company. © 2025 FMR LLC. All rights reserved.
This report and the financial statements contained herein are submitted for the general information of the shareholders of the Fund. This report is not authorized for distribution to prospective investors in the Fund unless preceded or accompanied by an effective prospectus.
A fund files its complete schedule of portfolio holdings with the SEC for the first and third quarters of each fiscal year on Form N-PORT. Forms N-PORT are available on the SEC's web site at http://www.sec.gov. A fund's Forms N-PORT may be reviewed and copied at the SEC's Public Reference Room in Washington, DC. Information regarding the operation of the SEC's Public Reference Room may be obtained by calling 1-800-SEC-0330.
For a complete list of a fund's portfolio holdings, view the most recent holdings listing, semiannual report, or annual report on Fidelity's web site at http://www.fidelity.com, http://www.institutional.fidelity.com, or http://www.401k.com, as applicable.
NOT FDIC INSURED •MAY LOSE VALUE •NO BANK GUARANTEE
Neither the Fund nor Fidelity Distributors Corporation is a bank.
Item 7: Financial Statements and Financial Highlights for Open-End Management Investment Companies (Annual Report)
VIP Consumer Discretionary Portfolio
Schedule of Investments December 31, 2024
Showing Percentage of Net Assets
| Common Stocks - 99.2% |
| | | Shares | Value ($) |
| BAILIWICK OF JERSEY - 2.0% | | | |
| Consumer Discretionary - 2.0% | | | |
| Automobile Components - 2.0% | | | |
| Aptiv PLC | | 82,370 | 4,981,738 |
| BRAZIL - 0.7% | | | |
| Consumer Discretionary - 0.7% | | | |
| Broadline Retail - 0.7% | | | |
| MercadoLibre Inc (a) | | 1,085 | 1,844,977 |
| CANADA - 1.8% | | | |
| Consumer Discretionary - 1.8% | | | |
| Automobile Components - 0.4% | | | |
| Magna International Inc (United States) | | 27,730 | 1,158,837 |
| Hotels, Restaurants & Leisure - 0.8% | | | |
| Restaurant Brands International Inc | | 31,700 | 2,066,140 |
| Specialty Retail - 0.6% | | | |
| Aritzia Inc Subordinate Voting Shares (a) | | 40,800 | 1,516,819 |
| TOTAL CANADA | | | 4,741,796 |
| FRANCE - 0.2% | | | |
| Consumer Discretionary - 0.2% | | | |
| Textiles, Apparel & Luxury Goods - 0.2% | | | |
| LVMH Moet Hennessy Louis Vuitton SE | | 954 | 627,534 |
| SWITZERLAND - 0.2% | | | |
| Consumer Discretionary - 0.2% | | | |
| Textiles, Apparel & Luxury Goods - 0.2% | | | |
| On Holding AG Class A (a) | | 11,534 | 631,717 |
| UNITED KINGDOM - 0.4% | | | |
| Consumer Discretionary - 0.4% | | | |
| Specialty Retail - 0.4% | | | |
| JD Sports Fashion PLC | | 824,400 | 989,752 |
| UNITED STATES - 93.9% | | | |
| Consumer Discretionary - 92.6% | | | |
| Automobile Components - 0.4% | | | |
| LCI Industries | | 9,100 | 940,848 |
| Automobiles - 18.2% | | | |
| General Motors Co | | 69,520 | 3,703,330 |
| Tesla Inc (a) | | 107,449 | 43,392,205 |
| | | | 47,095,535 |
| Broadline Retail - 25.2% | | | |
| Amazon.com Inc (a) | | 281,842 | 61,833,316 |
| Etsy Inc (a) | | 25,500 | 1,348,695 |
| Ollie's Bargain Outlet Holdings Inc (a) | | 17,120 | 1,878,578 |
| | | | 65,060,589 |
| Hotels, Restaurants & Leisure - 16.8% | | | |
| Aramark | | 26,405 | 985,171 |
| Booking Holdings Inc | | 1,165 | 5,788,209 |
| Caesars Entertainment Inc (a)(b) | | 31,359 | 1,048,018 |
| Chipotle Mexican Grill Inc (a) | | 67,560 | 4,073,868 |
| Churchill Downs Inc | | 15,258 | 2,037,553 |
| Domino's Pizza Inc | | 10,221 | 4,290,367 |
| Hilton Worldwide Holdings Inc | | 25,260 | 6,243,262 |
| Marriott International Inc/MD Class A1 | | 18,109 | 5,051,324 |
| McDonald's Corp | | 20,998 | 6,087,110 |
| Penn Entertainment Inc (a) | | 55,472 | 1,099,455 |
| Red Rock Resorts Inc Class A | | 37,360 | 1,727,526 |
| Royal Caribbean Cruises Ltd | | 12,630 | 2,913,615 |
| Starbucks Corp | | 24,610 | 2,245,663 |
| | | | 43,591,141 |
| Household Durables - 4.2% | | | |
| KB Home | | 19,220 | 1,263,138 |
| PulteGroup Inc | | 23,550 | 2,564,595 |
| Tempur Sealy International Inc | | 83,453 | 4,730,951 |
| TopBuild Corp (a) | | 7,600 | 2,366,184 |
| | | | 10,924,868 |
| Specialty Retail - 22.1% | | | |
| Academy Sports & Outdoors Inc | | 47,146 | 2,712,309 |
| Advance Auto Parts Inc | | 6,700 | 316,843 |
| Dick's Sporting Goods Inc | | 25,793 | 5,902,470 |
| Floor & Decor Holdings Inc Class A (a) | | 30,701 | 3,060,890 |
| Gap Inc/The | | 33,100 | 782,153 |
| Group 1 Automotive Inc | | 5,680 | 2,394,006 |
| Home Depot Inc/The | | 29,261 | 11,382,237 |
| Lowe's Cos Inc | | 42,258 | 10,429,274 |
| O'Reilly Automotive Inc (a) | | 1,055 | 1,251,019 |
| Ross Stores Inc | | 31,980 | 4,837,615 |
| Sally Beauty Holdings Inc (a) | | 75,273 | 786,603 |
| TJX Cos Inc/The | | 53,978 | 6,521,082 |
| Ulta Beauty Inc (a) | | 4,260 | 1,852,802 |
| Wayfair Inc Class A (a) | | 9,866 | 437,261 |
| Williams-Sonoma Inc | | 25,320 | 4,688,758 |
| | | | 57,355,322 |
| Textiles, Apparel & Luxury Goods - 5.7% | | | |
| Capri Holdings Ltd (a) | | 30,570 | 643,804 |
| Deckers Outdoor Corp (a) | | 19,974 | 4,056,520 |
| Lululemon Athletica Inc (a) | | 3,631 | 1,388,531 |
| NIKE Inc Class B | | 41,676 | 3,153,623 |
| PVH Corp | | 19,895 | 2,103,896 |
| Skechers USA Inc Class A (a) | | 9,970 | 670,383 |
| Tapestry Inc (b) | | 44,079 | 2,879,681 |
| | | | 14,896,438 |
TOTAL CONSUMER DISCRETIONARY | | | 239,864,741 |
| | | | |
| Consumer Staples - 0.6% | | | |
| Consumer Staples Distribution & Retail - 0.6% | | | |
| Dollar Tree Inc (a) | | 11,639 | 872,227 |
| Performance Food Group Co (a) | | 6,861 | 580,097 |
| | | | 1,452,324 |
| Industrials - 0.7% | | | |
| Building Products - 0.7% | | | |
| AZEK Co Inc/The Class A (a) | | 40,098 | 1,903,452 |
| TOTAL UNITED STATES | | | 243,220,517 |
| TOTAL COMMON STOCKS (Cost $117,402,584) | | | 257,038,031 |
| | | | |
| Money Market Funds - 2.4% |
| | | Yield (%) | Shares | Value ($) |
| Fidelity Cash Central Fund (c) | | 4.36 | 2,253,742 | 2,254,193 |
| Fidelity Securities Lending Cash Central Fund (c)(d) | | 4.35 | 3,980,416 | 3,980,814 |
| TOTAL MONEY MARKET FUNDS (Cost $6,235,007) | | | | 6,235,007 |
| | | | | |
| TOTAL INVESTMENT IN SECURITIES - 101.6% (Cost $123,637,591) | 263,273,038 |
NET OTHER ASSETS (LIABILITIES) - (1.6)% | (4,083,400) |
| NET ASSETS - 100.0% | 259,189,638 |
| | |
Legend
| (b) | Security or a portion of the security is on loan at period end. |
| (c) | Affiliated fund that is generally available only to investment companies and other accounts managed by Fidelity Investments. The rate quoted is the annualized seven-day yield of the fund at period end. A complete unaudited listing of the fund's holdings as of its most recent quarter end is available upon request. In addition, each Fidelity Central Fund's financial statements, which are not covered by the Fund's Report of Independent Registered Public Accounting Firm, are available on the SEC's website or upon request. |
| (d) | Investment made with cash collateral received from securities on loan. |
Affiliated Central Funds
Fiscal year to date information regarding the Fund's investments in Fidelity Central Funds, including the ownership percentage, is presented below.
| Affiliate | Value, beginning of period ($) | Purchases ($) | Sales Proceeds ($) | Dividend Income ($) | Realized Gain (loss) ($) | Change in Unrealized appreciation (depreciation) ($) | Value, end of period ($) | Shares, end of period | % ownership, end of period |
| Fidelity Cash Central Fund | 902,099 | 34,905,996 | 33,553,966 | 33,151 | 64 | - | 2,254,193 | 2,253,742 | 0.0% |
| Fidelity Securities Lending Cash Central Fund | 6,032,714 | 79,702,608 | 81,754,508 | 4,370 | - | - | 3,980,814 | 3,980,416 | 0.0% |
| Total | 6,934,813 | 114,608,604 | 115,308,474 | 37,521 | 64 | - | 6,235,007 | 6,234,158 | |
| | | | | | | | | | |
Amounts in the dividend income column in the above table include any capital gain distributions from underlying funds, which are presented in the corresponding line item in the Statement of Operations, if applicable.
Amounts in the dividend income column for Fidelity Securities Lending Cash Central Fund represents the income earned on investing cash collateral, less rebates paid to borrowers and any lending agent fees associated with the loan, plus any premium payments received for lending certain types of securities.
Amounts included in the purchases and sales proceeds columns may include in-kind transactions, if applicable.
Investment Valuation
The following is a summary of the inputs used, as of December 31, 2024, involving the Fund's assets and liabilities carried at fair value. The inputs or methodology used for valuing securities may not be an indication of the risk associated with investing in those securities. For more information on valuation inputs, and their aggregation into the levels used below, please refer to the Investment Valuation section in the accompanying Notes to Financial Statements.
| Valuation Inputs at Reporting Date: |
| Description | Total ($) | Level 1 ($) | Level 2 ($) | Level 3 ($) |
Investments in Securities: | | | | |
|
| Common Stocks | | | | |
Consumer Discretionary | 253,682,255 | 253,054,721 | 627,534 | - |
Consumer Staples | 1,452,324 | 1,452,324 | - | - |
Industrials | 1,903,452 | 1,903,452 | - | - |
|
| Money Market Funds | 6,235,007 | 6,235,007 | - | - |
| Total Investments in Securities: | 263,273,038 | 262,645,504 | 627,534 | - |
Financial Statements
| Statement of Assets and Liabilities |
As of December 31, 2024 |
| Assets | | | | |
| Investment in securities, at value (including securities loaned of $3,894,434) - See accompanying schedule: | | | | |
Unaffiliated issuers (cost $117,402,584) | $ | 257,038,031 | | |
Fidelity Central Funds (cost $6,235,007) | | 6,235,007 | | |
| | | | | |
| | | | | |
| Total Investment in Securities (cost $123,637,591) | | | $ | 263,273,038 |
| Receivable for investments sold | | | | 160,639 |
| Receivable for fund shares sold | | | | 131,218 |
| Dividends receivable | | | | 63,296 |
| Distributions receivable from Fidelity Central Funds | | | | 7,060 |
| Prepaid expenses | | | | 239 |
| Other receivables | | | | 1,835 |
Total assets | | | | 263,637,325 |
| Liabilities | | | | |
| Payable for investments purchased | $ | 210,605 | | |
| Payable for fund shares redeemed | | 68,383 | | |
| Accrued management fee | | 143,286 | | |
| Distribution and service plan fees payable | | 189 | | |
| Other payables and accrued expenses | | 44,574 | | |
| Collateral on securities loaned | | 3,980,650 | | |
| Total liabilities | | | | 4,447,687 |
| Net Assets | | | $ | 259,189,638 |
| Net Assets consist of: | | | | |
| Paid in capital | | | $ | 91,876,160 |
| Total accumulated earnings (loss) | | | | 167,313,478 |
| Net Assets | | | $ | 259,189,638 |
| | | | | |
| Net Asset Value and Maximum Offering Price | | | | |
| Initial Class : | | | | |
Net Asset Value, offering price and redemption price per share ($21,578,016 ÷ 519,753 shares) | | | $ | 41.52 |
| Service Class 2 : | | | | |
Net Asset Value, offering price and redemption price per share ($931,966 ÷ 22,523 shares) | | | $ | 41.38 |
| Investor Class : | | | | |
Net Asset Value, offering price and redemption price per share ($236,679,656 ÷ 5,735,732 shares) | | | $ | 41.26 |
| Statement of Operations |
| Year ended December 31, 2024 |
| Investment Income | | | | |
| Dividends | | | $ | 1,753,430 |
| Income from Fidelity Central Funds (including $4,370 from security lending) | | | | 37,521 |
| Total income | | | | 1,790,951 |
| Expenses | | | | |
| Management fee | $ | 1,484,706 | | |
| Transfer agent fees | | 53,451 | | |
| Distribution and service plan fees | | 1,418 | | |
| Accounting fees | | 14,276 | | |
| Custodian fees and expenses | | 18,069 | | |
| Independent trustees' fees and expenses | | 1,023 | | |
| Audit fees | | 49,787 | | |
| Legal | | 2,828 | | |
| Interest | | 3,181 | | |
| Miscellaneous | | 5,458 | | |
| Total expenses before reductions | | 1,634,197 | | |
| Expense reductions | | (11,009) | | |
| Total expenses after reductions | | | | 1,623,188 |
| Net Investment income (loss) | | | | 167,763 |
| Realized and Unrealized Gain (Loss) | | | | |
| Net realized gain (loss) on: | | | | |
| Investment Securities: | | | | |
| Unaffiliated issuers | | 28,491,067 | | |
| Fidelity Central Funds | | 64 | | |
| Foreign currency transactions | | (571) | | |
| Total net realized gain (loss) | | | | 28,490,560 |
| Change in net unrealized appreciation (depreciation) on: | | | | |
| Investment Securities: | | | | |
| Unaffiliated issuers | | 22,713,330 | | |
| Assets and liabilities in foreign currencies | | (311) | | |
| Total change in net unrealized appreciation (depreciation) | | | | 22,713,019 |
| Net gain (loss) | | | | 51,203,579 |
| Net increase (decrease) in net assets resulting from operations | | | $ | 51,371,342 |
| Statement of Changes in Net Assets |
| |
| | Year ended December 31, 2024 | | Year ended December 31, 2023 |
| Increase (Decrease) in Net Assets | | | | |
| Operations | | | | |
| Net investment income (loss) | $ | 167,763 | $ | 144,641 |
| Net realized gain (loss) | | 28,490,560 | | 5,620,576 |
| Change in net unrealized appreciation (depreciation) | | 22,713,019 | | 66,700,918 |
| Net increase (decrease) in net assets resulting from operations | | 51,371,342 | | 72,466,135 |
| Distributions to shareholders | | (798,577) | | (43,907) |
| | | | | |
| Share transactions - net increase (decrease) | | (46,004,568) | | 7,432,768 |
| Total increase (decrease) in net assets | | 4,568,197 | | 79,854,996 |
| | | | | |
| Net Assets | | | | |
| Beginning of period | | 254,621,441 | | 174,766,445 |
| End of period | $ | 259,189,638 | $ | 254,621,441 |
| | | | | |
| | | | | |
Financial Highlights
VIP Consumer Discretionary Portfolio Initial Class |
| |
| Years ended December 31, | | 2024 | | 2023 | | 2022 | | 2021 | | 2020 |
Selected Per-Share Data | | | | | | | | | | |
| Net asset value, beginning of period | $ | 33.40 | $ | 23.54 | $ | 39.33 | $ | 34.37 | $ | 25.27 |
| Income from Investment Operations | | | | | | | | | | |
Net investment income (loss) A,B | | .05 | | .04 | | .01 | | (.04) | | .02 |
| Net realized and unrealized gain (loss) | | 8.19 | | 9.84 | | (12.80) | | 6.56 | | 9.11 |
| Total from investment operations | | 8.24 | | 9.88 | | (12.79) | | 6.52 | | 9.13 |
| Distributions from net investment income | | (.02) | | (.02) | | - | | - | | (.03) |
| Distributions from net realized gain | | (.11) | | - | | (3.00) | | (1.56) | | - |
| Total distributions | | (.12) C | | (.02) | | (3.00) | | (1.56) | | (.03) |
| Net asset value, end of period | $ | 41.52 | $ | 33.40 | $ | 23.54 | $ | 39.33 | $ | 34.37 |
Total Return D,E | | | | 41.99% | | (34.63)% | | 19.41% | | 36.15% |
Ratios to Average Net Assets B,F,G | | | | | | | | | | |
| Expenses before reductions | | .62% | | .65% | | .66% | | .65% | | .67% |
| Expenses net of fee waivers, if any | | | | .65% | | .66% | | .65% | | .67% |
| Expenses net of all reductions | | .62% | | .65% | | .66% | | .65% | | .67% |
| Net investment income (loss) | | .14% | | .13% | | .04% | | (.11)% | | .07% |
| Supplemental Data | | | | | | | | | | |
| Net assets, end of period (000 omitted) | $ | 21,578 | $ | 22,709 | $ | 16,567 | $ | 32,788 | $ | 28,273 |
Portfolio turnover rate H | | | | 35% | | 34% | | 39% | | 52% |
ACalculated based on average shares outstanding during the period.
BNet investment income (loss) is affected by the timing of the declaration of dividends by any underlying mutual funds or exchange-traded funds (ETFs). Net investment income (loss) of any mutual funds or ETFs is not included in the Fund's net investment income (loss) ratio.
CTotal distributions per share do not sum due to rounding.
DTotal returns do not reflect charges attributable to your insurance company's separate account. Inclusion of these charges would reduce the total returns shown.
ETotal returns would have been lower if certain expenses had not been reduced during the applicable periods shown.
FFees and expenses of any underlying mutual funds or exchange-traded funds (ETFs) are not included in the Fund's expense ratio. The Fund indirectly bears its proportionate share of these expenses. For additional expense information related to investments in Fidelity Central Funds, please refer to the "Investments in Fidelity Central Funds" note found in the Notes to Financial Statements section of the most recent Annual or Semi-Annual report.
GExpense ratios reflect operating expenses of the class. Expenses before reductions do not reflect amounts reimbursed, waived, or reduced through arrangements with the investment adviser, brokerage services, or other offset arrangements, if applicable, and do not represent the amount paid by the class during periods when reimbursements, waivers or reductions occur.
HAmount does not include the portfolio activity of any underlying mutual funds or exchange-traded funds (ETFs), derivatives or securities that mature within one year from acquisition.
VIP Consumer Discretionary Portfolio Service Class 2 |
| |
| Years ended December 31, | | 2024 | | 2023 A |
Selected Per-Share Data | | | | |
| Net asset value, beginning of period | $ | 33.37 | $ | 30.31 |
| Income from Investment Operations | | | | |
Net investment income (loss) B,C | | (.04) | | (.01) |
| Net realized and unrealized gain (loss) | | 8.17 | | 3.09 |
| Total from investment operations | | 8.13 | | 3.08 |
| Distributions from net investment income | | (.01) | | (.02) |
| Distributions from net realized gain | | (.11) | | - |
| Total distributions | | (.12) | | (.02) |
| Net asset value, end of period | $ | 41.38 | $ | 33.37 |
Total Return D,E,F | | | | 10.18% |
Ratios to Average Net Assets C,G,H | | | | |
| Expenses before reductions | | .86% | | .91% I |
| Expenses net of fee waivers, if any | | | | .90% I |
| Expenses net of all reductions | | .86% | | .90% I |
| Net investment income (loss) | | (.10)% | | (.09)% I |
| Supplemental Data | | | | |
| Net assets, end of period (000 omitted) | $ | 932 | $ | 266 |
Portfolio turnover rate J | | | | 35% |
AFor the period August 16, 2023 (commencement of sale of shares) through December 31, 2023.
BCalculated based on average shares outstanding during the period.
CNet investment income (loss) is affected by the timing of the declaration of dividends by any underlying mutual funds or exchange-traded funds (ETFs). Net investment income (loss) of any mutual funds or ETFs is not included in the Fund's net investment income (loss) ratio.
DTotal returns for periods of less than one year are not annualized.
ETotal returns do not reflect charges attributable to your insurance company's separate account. Inclusion of these charges would reduce the total returns shown.
FTotal returns would have been lower if certain expenses had not been reduced during the applicable periods shown.
GFees and expenses of any underlying mutual funds or exchange-traded funds (ETFs) are not included in the Fund's expense ratio. The Fund indirectly bears its proportionate share of these expenses. For additional expense information related to investments in Fidelity Central Funds, please refer to the "Investments in Fidelity Central Funds" note found in the Notes to Financial Statements section of the most recent Annual or Semi-Annual report.
HExpense ratios reflect operating expenses of the class. Expenses before reductions do not reflect amounts reimbursed, waived, or reduced through arrangements with the investment adviser, brokerage services, or other offset arrangements, if applicable, and do not represent the amount paid by the class during periods when reimbursements, waivers or reductions occur.
IAnnualized.
JAmount does not include the portfolio activity of any underlying mutual funds or exchange-traded funds (ETFs), derivatives or securities that mature within one year from acquisition.
VIP Consumer Discretionary Portfolio Investor Class |
| |
| Years ended December 31, | | 2024 | | 2023 | | 2022 | | 2021 | | 2020 |
Selected Per-Share Data | | | | | | | | | | |
| Net asset value, beginning of period | $ | 33.22 | $ | 23.41 | $ | 39.17 | $ | 34.24 | $ | 25.20 |
| Income from Investment Operations | | | | | | | | | | |
Net investment income (loss) A,B | | .02 | | .02 | | (.01) | | (.07) | | - |
| Net realized and unrealized gain (loss) | | 8.14 | | 9.79 | | (12.75) | | 6.54 | | 9.06 |
| Total from investment operations | | 8.16 | | 9.81 | | (12.76) | | 6.47 | | 9.06 |
| Distributions from net investment income | | (.01) | | - C | | - | | - | | (.02) |
| Distributions from net realized gain | | (.11) | | - | | (3.00) | | (1.54) | | - |
| Total distributions | | (.12) | | - C | | (3.00) | | (1.54) | | (.02) |
| Net asset value, end of period | $ | 41.26 | $ | 33.22 | $ | 23.41 | $ | 39.17 | $ | 34.24 |
Total Return D,E | | | | 41.92% | | (34.70)% | | 19.32% | | 36.00% |
Ratios to Average Net Assets B,F,G | | | | | | | | | | |
| Expenses before reductions | | .70% | | .73% | | .74% | | .72% | | .75% |
| Expenses net of fee waivers, if any | | | | .72% | | .73% | | .72% | | .75% |
| Expenses net of all reductions | | .70% | | .72% | | .73% | | .72% | | .74% |
| Net investment income (loss) | | .06% | | .06% | | (.03)% | | (.18)% | | (.01)% |
| Supplemental Data | | | | | | | | | | |
| Net assets, end of period (000 omitted) | $ | 236,680 | $ | 231,646 | $ | 158,200 | $ | 295,060 | $ | 236,803 |
Portfolio turnover rate H | | | | 35% | | 34% | | 39% | | 52% |
ACalculated based on average shares outstanding during the period.
BNet investment income (loss) is affected by the timing of the declaration of dividends by any underlying mutual funds or exchange-traded funds (ETFs). Net investment income (loss) of any mutual funds or ETFs is not included in the Fund's net investment income (loss) ratio.
CAmount represents less than $.005 per share.
DTotal returns do not reflect charges attributable to your insurance company's separate account. Inclusion of these charges would reduce the total returns shown.
ETotal returns would have been lower if certain expenses had not been reduced during the applicable periods shown.
FFees and expenses of any underlying mutual funds or exchange-traded funds (ETFs) are not included in the Fund's expense ratio. The Fund indirectly bears its proportionate share of these expenses. For additional expense information related to investments in Fidelity Central Funds, please refer to the "Investments in Fidelity Central Funds" note found in the Notes to Financial Statements section of the most recent Annual or Semi-Annual report.
GExpense ratios reflect operating expenses of the class. Expenses before reductions do not reflect amounts reimbursed, waived, or reduced through arrangements with the investment adviser, brokerage services, or other offset arrangements, if applicable, and do not represent the amount paid by the class during periods when reimbursements, waivers or reductions occur.
HAmount does not include the portfolio activity of any underlying mutual funds or exchange-traded funds (ETFs), derivatives or securities that mature within one year from acquisition.
Notes to Financial Statements
For the period ended December 31, 2024
1. Organization.
VIP Consumer Discretionary Portfolio (the Fund) is a non-diversified fund of Variable Insurance Products Fund IV (the Trust) and is authorized to issue an unlimited number of shares. The Trust is registered under the Investment Company Act of 1940, as amended (the 1940 Act), as an open-end management investment company organized as a Massachusetts business trust. Shares of the Fund may only be purchased by insurance companies for the purpose of funding variable annuity or variable life insurance contracts. The Fund offers the following classes of shares: Initial Class shares, Service Class 2 shares and Investor Class shares. All classes have equal rights and voting privileges, except for matters affecting a single class.
2. Investments in Fidelity Central Funds.
Funds may invest in Fidelity Central Funds, which are open-end investment companies generally available only to other investment companies and accounts managed by the investment adviser and its affiliates. The Schedule of Investments lists any Fidelity Central Funds held as an investment as of period end, but does not include the underlying holdings of each Fidelity Central Fund. An investing fund indirectly bears its proportionate share of the expenses of the underlying Fidelity Central Funds.
Based on its investment objective, each Fidelity Central Fund may invest or participate in various investment vehicles or strategies that are similar to those of the investing fund. These strategies are consistent with the investment objectives of the investing fund and may involve certain economic risks which may cause a decline in value of each of the Fidelity Central Funds and thus a decline in the value of the investing fund.
| Fidelity Central Fund | Investment Manager | Investment Objective | Investment Practices | Expense RatioA |
| Fidelity Money Market Central Funds | Fidelity Management & Research Company LLC (FMR) | Each fund seeks to obtain a high level of current income consistent with the preservation of capital and liquidity. | Short-term Investments | Less than .005% |
A Expenses expressed as a percentage of average net assets and are as of each underlying Central Fund's most recent annual or semi-annual shareholder report.
A complete unaudited list of holdings for each Fidelity Central Fund is available upon request or at the Securities and Exchange Commission website at www.sec.gov. In addition, the financial statements of the Fidelity Central Funds which contain the significant accounting policies (including investment valuation policies) of those funds, and are not covered by the Report of Independent Registered Public Accounting Firm, are available on the Securities and Exchange Commission website or upon request.
3. Significant Accounting Policies.
The Fund is an investment company and applies the accounting and reporting guidance of the Financial Accounting Standards Board (FASB) Accounting Standards Codification Topic 946 Financial Services - Investment Companies. The financial statements have been prepared in conformity with accounting principles generally accepted in the United States of America (GAAP), which require management to make certain estimates and assumptions at the date of the financial statements. Actual results could differ from those estimates. The Fund operates as a single operating segment. The Fund's income, expenses, assets, and performance are regularly monitored and assessed as a whole by the investment adviser and other individuals responsible for oversight functions of the Trust, using the information presented in the financial statements and financial highlights. Subsequent events, if any, through the date that the financial statements were issued have been evaluated in the preparation of the financial statements. The Fund's Schedule of Investments lists any underlying mutual funds or exchange-traded funds (ETFs) but does not include the underlying holdings of these funds. The following summarizes the significant accounting policies of the Fund:
Investment Valuation. Investments are valued as of 4:00 p.m. Eastern time on the last calendar day of the period. The Board of Trustees (the Board) has designated the Fund's investment adviser as the valuation designee responsible for the fair valuation function and performing fair value determinations as needed. The investment adviser has established a Fair Value Committee (the Committee) to carry out the day-to-day fair valuation responsibilities and has adopted policies and procedures to govern the fair valuation process and the activities of the Committee. In accordance with these fair valuation policies and procedures, which have been approved by the Board, the Fund attempts to obtain prices from one or more third party pricing services or brokers to value its investments. When current market prices, quotations or currency exchange rates are not readily available or reliable, investments will be fair valued in good faith by the Committee, in accordance with the policies and procedures. Factors used in determining fair value vary by investment type and may include market or investment specific events, transaction data, estimated cash flows, and market observations of comparable investments. The frequency that the fair valuation procedures are used cannot be predicted and they may be utilized to a significant extent. The Committee manages the Fund's fair valuation practices and maintains the fair valuation policies and procedures. The Fund's investment adviser reports to the Board information regarding the fair valuation process and related material matters.
The Fund categorizes the inputs to valuation techniques used to value its investments into a disclosure hierarchy consisting of three levels as shown below:
Level 1 - unadjusted quoted prices in active markets for identical investments
Level 2 - other significant observable inputs (including quoted prices for similar investments, interest rates, prepayment speeds, etc.)
Level 3 - unobservable inputs (including the Fund's own assumptions based on the best information available)
Valuation techniques used to value the Fund's investments by major category are as follows:
Equity securities, including restricted securities, for which market quotations are readily available, are valued at the last reported sale price or official closing price as reported by a third party pricing service on the primary market or exchange on which they are traded and are categorized as Level 1 in the hierarchy. In the event there were no sales during the day or closing prices are not available, securities are valued at the last quoted bid price or may be valued using the last available price and are generally categorized as Level 2 in the hierarchy. For foreign equity securities, when market or security specific events arise, comparisons to the valuation of American Depositary Receipts (ADRs), futures contracts, Exchange-Traded Funds (ETFs) and certain indexes as well as quoted prices for similar securities may be used and would be categorized as Level 2 in the hierarchy. For equity securities, including restricted securities, where observable inputs are limited, assumptions about market activity and risk are used and these securities may be categorized as Level 3 in the hierarchy.
Investments in open-end mutual funds, including the Fidelity Central Funds, are valued at their closing net asset value (NAV) each business day and are categorized as Level 1 in the hierarchy.
Changes in valuation techniques may result in transfers in or out of an assigned level within the disclosure hierarchy. The aggregate value of investments by input level as of December 31, 2024 is included at the end of the Fund's Schedule of Investments.
Foreign Currency. Certain Funds may use foreign currency contracts to facilitate transactions in foreign-denominated securities. Gains and losses from these transactions may arise from changes in the value of the foreign currency or if the counterparties do not perform under the contracts' terms.
Foreign-denominated assets, including investment securities, and liabilities are translated into U.S. dollars at the exchange rates at period end. Purchases and sales of investment securities, income and dividends received, and expenses denominated in foreign currencies are translated into U.S. dollars at the exchange rate in effect on the transaction date.
The effects of exchange rate fluctuations on investments are included with the net realized and unrealized gain (loss) on investment securities. Other foreign currency transactions resulting in realized and unrealized gain (loss) are disclosed separately.
Investment Transactions and Income. For financial reporting purposes, the Fund's investment holdings and NAV include trades executed through the end of the last business day of the period. The NAV per share for processing shareholder transactions is calculated as of the close of business of the New York Stock Exchange (NYSE), normally 4:00 p.m. Eastern time and includes trades executed through the end of the prior business day. Gains and losses on securities sold are determined on the basis of identified cost and include proceeds received from litigation. Commissions paid to certain brokers with whom the investment adviser, or its affiliates, places trades on behalf of a fund include an amount in addition to trade execution, which may be rebated back to a fund. Any such rebates are included in net realized gain (loss) on investments in the Statement of Operations. Dividend income is recorded on the ex-dividend date, except for certain dividends from foreign securities where the ex-dividend date may have passed, which are recorded as soon as the Fund is informed of the ex-dividend date. Non-cash dividends included in dividend income, if any, are recorded at the fair market value of the securities received. Income and capital gain distributions from Fidelity Central Funds, if any, are recorded on the ex-dividend date. Investment income is recorded net of foreign taxes withheld where recovery of such taxes is uncertain. Funds may file withholding tax reclaims in certain jurisdictions to recover a portion of amounts previously withheld. Any withholding tax reclaims income is included in the Statement of Operations in dividends. Any receivables for withholding tax reclaims are included in the Statement of Assets and Liabilities in dividends receivable.
Class Allocations and Expenses. Investment income, realized and unrealized capital gains and losses, common expenses of a fund, and certain fund-level expense reductions, if any, are allocated daily on a pro-rata basis to each class based on the relative net assets of each class to the total net assets of a fund. Each class differs with respect to transfer agent and distribution and service plan fees incurred, as applicable. Certain expense reductions may also differ by class, if applicable. For the reporting period, the allocated portion of income and expenses to each class as a percent of its average net assets may vary due to the timing of recording these transactions in relation to fluctuating net assets of the classes. Expenses directly attributable to a fund are charged to that fund. Expenses attributable to more than one fund are allocated among the respective funds on the basis of relative net assets or other appropriate methods. Expenses included in the accompanying financial statements reflect the expenses of that fund and do not include any expenses associated with any underlying mutual funds or exchange-traded funds (ETFs). Although not included in a fund's expenses, a fund indirectly bears its proportionate share of these expenses through the net asset value of each underlying mutual fund or exchange-traded fund (ETF). Expense estimates are accrued in the period to which they relate and adjustments are made when actual amounts are known.
Income Tax Information and Distributions to Shareholders. Each year, the Fund intends to qualify as a regulated investment company under Subchapter M of the Internal Revenue Code, including distributing substantially all of its taxable income and realized gains. As a result, no provision for U.S. Federal income taxes is required. As of December 31, 2024, the Fund did not have any unrecognized tax benefits in the financial statements; nor is the Fund aware of any tax positions for which it is reasonably possible that the total amounts of unrecognized tax benefits will significantly change in the next twelve months. The Fund files a U.S. federal tax return, in addition to state and local tax returns as required. The Fund's federal income tax returns are subject to examination by the Internal Revenue Service (IRS) for a period of three fiscal years after they are filed. State and local tax returns may be subject to examination for an additional fiscal year depending on the jurisdiction. Foreign taxes are provided for based on the Fund's understanding of the tax rules and rates that exist in the foreign markets in which it invests.
Distributions are declared and recorded on the ex-dividend date. Income and capital gain distributions are declared separately for each class. Income and capital gain distributions are determined in accordance with income tax regulations, which may differ from GAAP.
Capital accounts within the financial statements are adjusted for permanent book-tax differences. These adjustments have no impact on net assets or the results of operations. Capital accounts are not adjusted for temporary book-tax differences which will reverse in a subsequent period.
Book-tax differences are primarily due to foreign currency transactions and losses deferred due to wash sales.
As of period end, the cost and unrealized appreciation (depreciation) in securities, and derivatives if applicable, for federal income tax purposes were as follows:
| Gross unrealized appreciation | $145,840,104 |
| Gross unrealized depreciation | (6,615,359) |
| Net unrealized appreciation (depreciation) | $139,224,745 |
| Tax Cost | $124,048,293 |
The tax-based components of distributable earnings as of period end were as follows:
| Undistributed ordinary income | $452,635 |
| Undistributed long-term capital gain | $27,637,060 |
| Net unrealized appreciation (depreciation) on securities and other investments | $139,223,782 |
The tax character of distributions paid was as follows:
| | December 31, 2024 | December 31, 2023 |
| Ordinary Income | $520,284 | $43,907 |
| Long-term Capital Gains | 278,293 | - |
| Total | $798,577 | $43,907 |
New Accounting Pronouncement. FASB Accounting Standards Update (ASU) 2023-07 Segment Reporting (Topic 280): Improvements to Reportable Segment Disclosures became effective in this reporting period. ASU 2023-07 enhances segment information disclosure in the notes to financial statements.
4. Purchases and Sales of Investments.
Purchases and sales of securities, other than short-term securities and in-kind transactions, as applicable, are noted in the table below.
| | Purchases ($) | Sales ($) |
| VIP Consumer Discretionary Portfolio | 59,665,961 | 107,766,144 |
5. Fees and Other Transactions with Affiliates.
Management Fee. Fidelity Management & Research Company LLC (the investment adviser) and its affiliates provide the Fund with investment management related services for which the Fund pays a monthly management fee.
Effective March 1, 2024, the Fund's management contract was amended to incorporate administrative services previously covered under separate services agreements (Transfer Agent and Accounting agreements). The amended contract incorporates a management fee rate that may vary by class. The investment adviser or an affiliate pays certain expenses of managing and operating the Fund out of each class's management fee. Each class of the Fund pays a management fee to the investment adviser. The management fee is calculated and paid to the investment adviser every month. When determining a class's management fee, a mandate rate is calculated based on the monthly average net assets of a group of funds advised by FMR within a designated asset class. A discount rate is subtracted from the mandate rate once the Fund's monthly average net assets reach a certain level. The mandate rate and discount rate may vary by class. The annual management fee rate for a class of shares of the Fund is the lesser of (1) the class's mandate rate reduced by the class's discount rate (if applicable) or (2) the amount set forth in the following table.
| | Maximum Management Fee Rate % |
| Initial Class | .58 |
| Service Class 2 | .58 |
| Investor Class | .66 |
One-twelfth of the management fee rate for a class is applied to the average net assets of the class for the month, giving a dollar amount which is the management fee for the class for that month. A different management fee rate may be applicable to each class of the Fund. The difference between classes is the result of separate arrangements for class-level services and/or waivers of certain expenses. It is not the result of any difference in advisory or custodial fees or other expenses related to the management of the Fund's assets, which do not vary by class. For the portion of the reporting period on or after March 1, 2024, the total annualized management fee rates were as follows:
| | Total Management Fee Rate % |
| Initial Class | .58 |
| Service Class 2 | .58 |
| Investor Class | .66 |
Prior to March 1, 2024, the management fee was the sum of an individual fund fee rate that was based on an annual rate of .30% of the Fund's average net assets and an annualized group fee rate that averaged .22% during the period. The group fee rate was based upon the monthly average net assets of a group of registered investment companies with which the investment adviser has management contracts. The group fee rate decreased as assets under management increased and increased as assets under management decreased. For the portion of the reporting period prior to March 1, 2024, the total annualized management fee rate was .52%.
Effective March 1, 2024, the Fund's sub-advisory agreements with FMR Investment Management (UK) Limited, Fidelity Management & Research (Hong Kong) Limited, and Fidelity Management & Research (Japan) Limited were amended to provide that the investment adviser pays each sub-adviser monthly fees equal to 110% of the sub-adviser's costs for providing sub-advisory services.
Distribution and Service Plan Fees. In accordance with Rule 12b-1 of the 1940 Act, the Fund has adopted a separate 12b-1 Plan for Service Class 2 shares. Service Class 2 pays Fidelity Distributors Company LLC (FDC), an affiliate of the investment adviser, a service fee. For the period, the service fee is based on an annual rate of .25% of Service Class 2's average net assets.
For the period, total fees for Service Class 2, all of which was re-allowed to insurance companies for the distribution of shares and providing shareholder support services were $1,418.
Transfer Agent Fees. Fidelity Investments Institutional Operations Company LLC (FIIOC), an affiliate of the investment adviser, is the Fund's transfer, dividend disbursing, and shareholder servicing agent. Effective March 1, 2024, the Fund's management contract was amended to incorporate transfer agent services and associated fees previously covered under a separate services agreement.
During the period January 1, 2024 through February 29, 2024, the transfer agent fees for each class were a fixed annual rate of class-level average net assets as follows:
| | Amount ($) | % of Class-Level Average Net Assets |
| Initial Class | 2,266 | .0630 |
| Service Class 2 | 25 | .0630 |
| Investor Class | 51,160 | .1390 |
| | 53,451 | |
Accounting Fees. Fidelity Service Company, Inc. (FSC), an affiliate of the investment adviser, maintains the Fund's accounting records. Effective March 1, 2024, the Fund's management contract was amended to incorporate accounting services and associated fees previously covered under a separate services agreement.
During the period January 1, 2024 through February 29, 2024, the accounting fees were a fixed annual rate of average net assets as follows:
| | % of Average Net Assets |
| VIP Consumer Discretionary Portfolio | .0353 |
Brokerage Commissions. A portion of portfolio transactions were placed with brokerage firms which are affiliates of the investment adviser. Brokerage commissions are included in net realized gain (loss) and change in net unrealized appreciation (depreciation) in the Statement of Operations. The commissions paid to these affiliated firms were as follows:
| | Amount ($) |
| VIP Consumer Discretionary Portfolio | 1,123 |
Interfund Lending Program. Pursuant to an Exemptive Order issued by the Securities and Exchange Commission (the SEC), the Fund, along with other registered investment companies having management contracts with Fidelity Management & Research Company LLC (FMR), or other affiliated entities of FMR, may participate in an interfund lending program. This program provides an alternative credit facility allowing the Fund to borrow from, or lend money to, other participating affiliated funds at rates that are beneficial to both the borrowing and lending fund. Borrowings under the program are generally for temporary or emergency purposes, including meeting fund shareholder redemptions. The interfund loan rate is determined, as specified in the Exemptive Order, by averaging, (1) the higher of the overnight time deposit rate and the current overnight repurchase agreement rate, and (2) a benchmark rate representing the lowest bank loan rate available to the funds. At period end, there were no interfund loans outstanding. Activity in this program during the period for which loans were outstanding was as follows:
| | Borrower or Lender | Average Loan Balance ($) | Weighted Average Interest Rate | Interest Expense ($) |
VIP Consumer Discretionary Portfolio. | Borrower | 2,917,857 | 5.57% | 3,158 |
Interfund Trades. Funds may purchase from or sell securities to other Fidelity Funds under procedures adopted by the Board. The procedures have been designed to ensure these interfund trades are executed in accordance with Rule 17a-7 of the 1940 Act. Any interfund trades are included within the respective purchases and sales amounts shown in the Purchases and Sales of Investments note. Interfund trades during the period are noted in the table below.
| | Purchases ($) | Sales ($) | Realized Gain (Loss) ($) |
| VIP Consumer Discretionary Portfolio | 7,370,911 | 9,903,036 | 3,480,458 |
6. Committed Line of Credit.
Certain Funds participate with other funds managed by the investment adviser or an affiliate in a $4.25 billion credit facility (the "line of credit") to be utilized for temporary or emergency purposes to fund shareholder redemptions or for other short-term liquidity purposes.
Commitment fees are charged based on the unused amount of the line of credit at an annual rate of .10%, and then allocated to each participating fund based on its pro-rata portion of the line of credit. The commitment fees are reflected in Miscellaneous expenses on the Statement of Operations, and are listed below.
Interest is charged to a participating fund based on its borrowings at an annual rate of .75% plus the highest of (i) daily SOFR plus a .10% spread adjustment, (ii) Federal Funds Effective Rate, or (iii) Overnight Bank Funding Rate. During the period, there were no borrowings on this line of credit.
The line of credit agreement will expire in March 2025 unless extended or renewed.
| | Amount ($) |
| VIP Consumer Discretionary Portfolio | 376 |
7. Security Lending.
Funds lend portfolio securities from time to time in order to earn additional income. Lending agents are used, including National Financial Services (NFS), an affiliate of the investment adviser. Pursuant to a securities lending agreement, NFS will receive a fee, which is capped at 9.9% of a fund's daily lending revenue, for its services as lending agent. A fund may lend securities to certain qualified borrowers, including NFS. On the settlement date of the loan, a fund receives collateral (in the form of U.S. Treasury obligations, letters of credit and/or cash) against the loaned securities and maintains collateral in an amount not less than 100% of the market value of the loaned securities during the period of the loan. The market value of the loaned securities is determined at the close of business of a fund and any additional required collateral is delivered to a fund on the next business day. A fund or borrower may terminate the loan at any time, and if the borrower defaults on its obligation to return the securities loaned because of insolvency or other reasons, a fund may apply collateral received from the borrower against the obligation. A fund may experience delays and costs in recovering the securities loaned. Any cash collateral received is invested in the Fidelity Securities Lending Cash Central Fund. Any loaned securities are identified as such in the Schedule of Investments, and the value of loaned securities and cash collateral at period end, as applicable, are presented in the Statement of Assets and Liabilities. Security lending income represents the income earned on investing cash collateral, less rebates paid to borrowers and any lending agent fees associated with the loan, plus any premium payments received for lending certain types of securities. Security lending income is presented in the Statement of Operations as a component of income from Fidelity Central Funds. Affiliated security lending activity, if any, was as follows:
| | Total Security Lending Fees Paid to NFS ($) | Security Lending Income From Securities Loaned to NFS ($) | Value of Securities Loaned to NFS at Period End ($) |
| VIP Consumer Discretionary Portfolio | 465 | - | - |
8. Bank Borrowings.
The Fund is permitted to have bank borrowings for temporary or emergency purposes to fund shareholder redemptions or for other short-term liquidity requirements. The Fund has established borrowing arrangements with certain banks. The interest rate on the borrowings is the bank's base rate, as revised from time to time. Any open loans, including accrued interest, at period end are presented under the caption "Notes payable" in the Statement of Assets and Liabilities, if applicable. Activity in this program during the period for which loans were outstanding was as follows:| | Average Loan Balance ($) | Weighted Average Interest Rate | Interest Expense ($) |
| VIP Consumer Discretionary Portfolio | 139,000 | 5.83% | 23 |
9. Expense Reductions.
During the period the investment adviser or an affiliate reimbursed and/or waived a portion of fund-level operating expenses in the amount of $11,009.
10. Distributions to Shareholders.
Distributions to shareholders of each class were as follows:
| | Year ended December 31, 2024 | Year ended December 31, 2023A |
| VIP Consumer Discretionary Portfolio | | |
| Distributions to shareholders | | |
| Initial Class | $70,801 | $16,070 |
| Service Class 2 | 1,607 | 125 |
| Investor Class | 726,169 | 27,712 |
Total | $798,577 | $43,907 |
A Distributions for Service Class 2 are for the period August 16, 2023 (commencement of sale of shares) through December 31, 2023.
11. Share Transactions.
Transactions for each class of shares were as follows and may contain in-kind transactions:
| | Shares | Shares | Dollars | Dollars |
| | Year ended December 31, 2024 | Year ended December 31, 2023A | Year ended December 31, 2024 | Year ended December 31, 2023A |
| VIP Consumer Discretionary Portfolio | | | | |
| Initial Class | | | | |
| Shares sold | 35,554 | 173,093 | $1,299,888 | $5,025,457 |
| Reinvestment of distributions | 1,862 | 519 | 70,801 | 16,070 |
| Shares redeemed | (197,605) | (197,557) | (6,926,663) | (5,622,611) |
| Net increase (decrease) | (160,189) | (23,945) | $(5,555,974) | $(581,084) |
| Service Class 2 | | | | |
| Shares sold | 24,921 | 8,140 | $905,683 | $254,397 |
| Reinvestment of distributions | 30 | 2 | 1,221 | 49 |
| Shares redeemed | (10,402) | (168) | (361,296) | (5,269) |
| Net increase (decrease) | 14,549 | 7,974 | $545,608 | $249,177 |
| Investor Class | | | | |
| Shares sold | 368,781 | 1,561,080 | $14,282,903 | $45,112,100 |
| Reinvestment of distributions | 19,093 | 900 | 726,169 | 27,712 |
| Shares redeemed | (1,625,147) | (1,345,615) | (56,003,274) | (37,375,137) |
| Net increase (decrease) | (1,237,273) | 216,365 | $(40,994,202) | $7,764,675 |
A Share transactions for Service Class 2 are for the period August 16, 2023 (commencement of sale of shares) through December 31, 2023.
12. Other.
A fund's organizational documents provide former and current trustees and officers with a limited indemnification against liabilities arising in connection with the performance of their duties to the fund. In the normal course of business, a fund may also enter into contracts that provide general indemnifications. A fund's maximum exposure under these arrangements is unknown as this would be dependent on future claims that may be made against a fund. The risk of material loss from such claims is considered remote.
At the end of the period, the investment adviser or its affiliates were owners of record of more than 10% of the outstanding shares as follows:
| Fund | Affiliated % |
VIP Consumer Discretionary Portfolio. | 100% |
13. Risk and Uncertainties.
Many factors affect a fund's performance. Developments that disrupt global economies and financial markets, such as pandemics, epidemics, outbreaks of infectious diseases, war, terrorism, and environmental disasters, may significantly affect a fund's investment performance. The effects of these developments to a fund will be impacted by the types of securities in which a fund invests, the financial condition, industry, economic sector, and geographic location of an issuer, and a fund's level of investment in the securities of that issuer. Significant concentrations in security types, issuers, industries, sectors, and geographic locations may magnify the factors that affect a fund's performance.
Report of Independent Registered Public Accounting Firm
To the Board of Trustees of Variable Insurance Products Fund IV and Shareholders of VIP Consumer Discretionary Portfolio
Opinion on the Financial Statements
We have audited the accompanying statement of assets and liabilities, including the schedule of investments, of VIP Consumer Discretionary Portfolio (one of the funds constituting Variable Insurance Products Fund IV, referred to hereafter as the "Fund") as of December 31, 2024, the related statement of operations for the year ended December 31, 2024, the statement of changes in net assets for each of the two years in the period ended December 31, 2024, including the related notes, and the financial highlights for each of the periods indicated therein (collectively referred to as the "financial statements"). In our opinion, the financial statements present fairly, in all material respects, the financial position of the Fund as of December 31, 2024, the results of its operations for the year then ended, the changes in its net assets for each of the two years in the period ended December 31, 2024 and the financial highlights for each of the periods indicated therein in conformity with accounting principles generally accepted in the United States of America.
Basis for Opinion
These financial statements are the responsibility of the Fund's management. Our responsibility is to express an opinion on the Fund's financial statements based on our audits. We are a public accounting firm registered with the Public Company Accounting Oversight Board (United States) (PCAOB) and are required to be independent with respect to the Fund in accordance with the U.S. federal securities laws and the applicable rules and regulations of the Securities and Exchange Commission and the PCAOB.
We conducted our audits of these financial statements in accordance with the standards of the PCAOB. Those standards require that we plan and perform the audit to obtain reasonable assurance about whether the financial statements are free of material misstatement, whether due to error or fraud.
Our audits included performing procedures to assess the risks of material misstatement of the financial statements, whether due to error or fraud, and performing procedures that respond to those risks. Such procedures included examining, on a test basis, evidence regarding the amounts and disclosures in the financial statements. Our audits also included evaluating the accounting principles used and significant estimates made by management, as well as evaluating the overall presentation of the financial statements. Our procedures included confirmation of securities owned as of December 31, 2024 by correspondence with the custodian and brokers; when replies were not received from brokers, we performed other auditing procedures. We believe that our audits provide a reasonable basis for our opinion.
/s/ PricewaterhouseCoopers LLP
Boston, Massachusetts
February 11, 2025
We have served as the auditor of one or more investment companies in the Fidelity group of funds since 1932.
Distributions
(Unaudited)The dividend and capital gains distributions for the fund(s) are available on Fidelity.com or Institutional.Fidelity.com.
The fund hereby designates as a capital gain dividend with respect to the taxable year ended December 31, 2024, $27,648,850, or, if subsequently determined to be different, the net capital gain of such year.
Initial Class, Service Class 2, and Investor Class designate 100% of the dividends distributed during the fiscal year as qualifying for the dividends-received deduction for corporate shareholders.
Item 8: Changes in and Disagreements with Accountants for Open-End Management Investment Companies
(Unaudited)
Note: This is not applicable for any fund included in this document.
Item 9: Proxy Disclosures for Open-End Management Investment Companies
(Unaudited)
| A special meeting of shareholders was held on July 16, 2024. The results of votes taken among shareholders on the proposal before them are reported below. Each vote reported represents one dollar of net asset value held on the record date for the meeting. |
| Proposal 1 |
| To elect a Board of Trustees. |
| | # of Votes | % of Votes |
| Bettina Doulton |
| Affirmative | 5,501,492,681.85 | 94.15 |
| Withheld | 341,991,035.05 | 5.85 |
| TOTAL | 5,843,483,716.90 | 100.00 |
| Robert A. Lawrence |
| Affirmative | 5,480,901,467.70 | 93.80 |
| Withheld | 362,582,249.21 | 6.20 |
| TOTAL | 5,843,483,716.90 | 100.00 |
| Vijay C. Advani |
| Affirmative | 5,500,352,811.04 | 94.13 |
| Withheld | 343,130,905.86 | 5.87 |
| TOTAL | 5,843,483,716.90 | 100.00 |
| Thomas P. Bostick |
| Affirmative | 5,488,165,362.69 | 93.92 |
| Withheld | 355,318,354.21 | 6.08 |
| TOTAL | 5,843,483,716.90 | 100.00 |
| Donald F. Donahue |
| Affirmative | 5,482,960,893.76 | 93.83 |
| Withheld | 360,522,823.14 | 6.17 |
| TOTAL | 5,843,483,716.90 | 100.00 |
| Vicki L. Fuller |
| Affirmative | 5,492,283,337.89 | 93.99 |
| Withheld | 351,200,379.01 | 6.01 |
| TOTAL | 5,843,483,716.90 | 100.00 |
| Patricia L. Kampling |
| Affirmative | 5,521,992,715.20 | 94.50 |
| Withheld | 321,491,001.70 | 5.50 |
| TOTAL | 5,843,483,716.90 | 100.00 |
| Thomas A. Kennedy |
| Affirmative | 5,484,789,158.10 | 93.86 |
| Withheld | 358,694,558.80 | 6.14 |
| TOTAL | 5,843,483,716.90 | 100.00 |
| Oscar Munoz |
| Affirmative | 5,497,884,744.63 | 94.09 |
| Withheld | 345,598,972.27 | 5.91 |
| TOTAL | 5,843,483,716.90 | 100.00 |
| Karen B. Peetz |
| Affirmative | 5,503,968,240.81 | 94.19 |
| Withheld | 339,515,476.09 | 5.81 |
| TOTAL | 5,843,483,716.90 | 100.00 |
| David M. Thomas |
| Affirmative | 5,466,218,204.40 | 93.54 |
| Withheld | 377,265,512.50 | 6.46 |
| TOTAL | 5,843,483,716.90 | 100.00 |
| Susan Tomasky |
| Affirmative | 5,463,402,825.36 | 93.50 |
| Withheld | 380,080,891.54 | 6.50 |
| TOTAL | 5,843,483,716.90 | 100.00 |
| Michael E. Wiley |
| Affirmative | 5,466,838,155.74 | 93.55 |
| Withheld | 376,645,561.16 | 6.45 |
| TOTAL | 5,843,483,716.90 | 100.00 |
| | | |
| Proposal 1 reflects trust-wide proposal and voting results. |
Item 10: Remuneration Paid to Directors, Officers, and others of Open-End Management Investment Companies
(Unaudited)
Note: This information is disclosed as part of the financial statements for each Fund as part of Item 7: Financial Statements and Financial Highlights for Open-End Management Investment companies.
Item 11: Statement Regarding Basis for Approval of Investment Advisory Contract
(Unaudited)
Note: This is not applicable for any fund included in this document.
1.817355.119
VCONIC-ANN-0325
Fidelity® Variable Insurance Products:
VIP Real Estate Portfolio
Annual Report
December 31, 2024
Contents
To view a fund's proxy voting guidelines and proxy voting record for the 12-month period ended June 30, visit http://www.fidelity.com/proxyvotingresults or visit the Securities and Exchange Commission's (SEC) web site at http://www.sec.gov.
You may also call 1-877-208-0098 to request a free copy of the proxy voting guidelines.
Fidelity® Variable Insurance Products are separate account options which are purchased through a variable insurance contract.
Standard & Poor's, S&P and S&P 500 are registered service marks of The McGraw-Hill Companies, Inc. and have been licensed for use by Fidelity Distributors Corporation.
Other third-party marks appearing herein are the property of their respective owners.
All other marks appearing herein are registered or unregistered trademarks or service marks of FMR LLC or an affiliated company. © 2025 FMR LLC. All rights reserved.
This report and the financial statements contained herein are submitted for the general information of the shareholders of the Fund. This report is not authorized for distribution to prospective investors in the Fund unless preceded or accompanied by an effective prospectus.
A fund files its complete schedule of portfolio holdings with the SEC for the first and third quarters of each fiscal year on Form N-PORT. Forms N-PORT are available on the SEC's web site at http://www.sec.gov. A fund's Forms N-PORT may be reviewed and copied at the SEC's Public Reference Room in Washington, DC. Information regarding the operation of the SEC's Public Reference Room may be obtained by calling 1-800-SEC-0330.
For a complete list of a fund's portfolio holdings, view the most recent holdings listing, semiannual report, or annual report on Fidelity's web site at http://www.fidelity.com, http://www.institutional.fidelity.com, or http://www.401k.com, as applicable.
NOT FDIC INSURED •MAY LOSE VALUE •NO BANK GUARANTEE
Neither the Fund nor Fidelity Distributors Corporation is a bank.
Item 7: Financial Statements and Financial Highlights for Open-End Management Investment Companies (Annual Report)
VIP Real Estate Portfolio
Schedule of Investments December 31, 2024
Showing Percentage of Net Assets
| Common Stocks - 99.0% |
| | | Shares | Value ($) |
| UNITED STATES - 99.0% | | | |
| Real Estate - 99.0% | | | |
| Health Care REITs - 10.0% | | | |
| Ventas Inc | | 381,310 | 22,455,346 |
| Welltower Inc | | 105,400 | 13,283,562 |
| | | | 35,738,908 |
| Hotel & Resort REITs - 1.6% | | | |
| Ryman Hospitality Properties Inc | | 56,400 | 5,884,776 |
| Industrial REITs - 12.1% | | | |
| Americold Realty Trust Inc | | 130,100 | 2,784,140 |
| EastGroup Properties Inc | | 31,200 | 5,007,288 |
| Prologis Inc | | 274,029 | 28,964,865 |
| Terreno Realty Corp | | 108,800 | 6,434,432 |
| | | | 43,190,725 |
| Office REITs - 1.9% | | | |
| Douglas Emmett Inc | | 368,200 | 6,833,792 |
| Real Estate Management & Development - 10.3% | | | |
| CBRE Group Inc Class A (a) | | 178,400 | 23,422,136 |
| CoStar Group Inc (a) | | 62,200 | 4,452,898 |
| Zillow Group Inc Class C (a) | | 118,400 | 8,767,520 |
| | | | 36,642,554 |
| Residential REITs - 14.1% | | | |
| Equity LifeStyle Properties Inc | | 14,420 | 960,372 |
| Essex Property Trust Inc | | 38,848 | 11,088,773 |
| Invitation Homes Inc | | 303,000 | 9,686,910 |
| Mid-America Apartment Communities Inc | | 59,200 | 9,150,544 |
| Sun Communities Inc | | 95,900 | 11,792,823 |
| UDR Inc | | 179,700 | 7,800,777 |
| | | | 50,480,199 |
| Retail REITs - 13.8% | | | |
| Curbline Properties Corp | | 310,000 | 7,198,200 |
| Federal Realty Investment Trust | | 51,800 | 5,799,010 |
| Macerich Co/The | | 373,700 | 7,444,104 |
| NNN REIT Inc | | 220,300 | 8,999,255 |
| SITE Centers Corp | | 140,950 | 2,155,126 |
| Tanger Inc | | 297,600 | 10,157,088 |
| Urban Edge Properties | | 349,500 | 7,514,250 |
| | | | 49,267,033 |
| Specialized REITs - 35.2% | | | |
| American Tower Corp | | 136,500 | 25,035,465 |
| Crown Castle Inc | | 148,400 | 13,468,784 |
| CubeSmart | | 298,500 | 12,790,725 |
| Digital Realty Trust Inc | | 47,600 | 8,440,908 |
| Equinix Inc | | 37,000 | 34,886,930 |
| Four Corners Property Trust Inc | | 422,800 | 11,474,792 |
| Lamar Advertising Co Class A | | 45,900 | 5,587,866 |
| Public Storage Operating Co | | 46,900 | 14,043,736 |
| | | | 125,729,206 |
TOTAL REAL ESTATE | | | 353,767,193 |
| | | | |
| TOTAL COMMON STOCKS (Cost $281,310,426) | | | 353,767,193 |
| | | | |
| Money Market Funds - 0.6% |
| | | Yield (%) | Shares | Value ($) |
Fidelity Cash Central Fund (b) (Cost $2,032,064) | | 4.36 | 2,031,658 | 2,032,064 |
| | | | | |
| TOTAL INVESTMENT IN SECURITIES - 99.6% (Cost $283,342,490) | 355,799,257 |
NET OTHER ASSETS (LIABILITIES) - 0.4% | 1,499,493 |
| NET ASSETS - 100.0% | 357,298,750 |
| | |
Legend
| (b) | Affiliated fund that is generally available only to investment companies and other accounts managed by Fidelity Investments. The rate quoted is the annualized seven-day yield of the fund at period end. A complete unaudited listing of the fund's holdings as of its most recent quarter end is available upon request. In addition, each Fidelity Central Fund's financial statements, which are not covered by the Fund's Report of Independent Registered Public Accounting Firm, are available on the SEC's website or upon request. |
Affiliated Central Funds
Fiscal year to date information regarding the Fund's investments in Fidelity Central Funds, including the ownership percentage, is presented below.
| Affiliate | Value, beginning of period ($) | Purchases ($) | Sales Proceeds ($) | Dividend Income ($) | Realized Gain (loss) ($) | Change in Unrealized appreciation (depreciation) ($) | Value, end of period ($) | Shares, end of period | % ownership, end of period |
| Fidelity Cash Central Fund | 1,955,778 | 63,242,384 | 63,166,065 | 104,544 | (33) | - | 2,032,064 | 2,031,658 | 0.0% |
| Fidelity Securities Lending Cash Central Fund | - | 10,433,495 | 10,433,495 | 4,776 | - | - | - | - | 0.0% |
| Total | 1,955,778 | 73,675,879 | 73,599,560 | 109,320 | (33) | - | 2,032,064 | 2,031,658 | |
| | | | | | | | | | |
Amounts in the dividend income column in the above table include any capital gain distributions from underlying funds, which are presented in the corresponding line item in the Statement of Operations, if applicable.
Amounts in the dividend income column for Fidelity Securities Lending Cash Central Fund represents the income earned on investing cash collateral, less rebates paid to borrowers and any lending agent fees associated with the loan, plus any premium payments received for lending certain types of securities.
Amounts included in the purchases and sales proceeds columns may include in-kind transactions, if applicable.
Investment Valuation
The following is a summary of the inputs used, as of December 31, 2024, involving the Fund's assets and liabilities carried at fair value. The inputs or methodology used for valuing securities may not be an indication of the risk associated with investing in those securities. For more information on valuation inputs, and their aggregation into the levels used below, please refer to the Investment Valuation section in the accompanying Notes to Financial Statements.
| Valuation Inputs at Reporting Date: |
| Description | Total ($) | Level 1 ($) | Level 2 ($) | Level 3 ($) |
Investments in Securities: | | | | |
|
| Common Stocks | | | | |
Real Estate | 353,767,193 | 353,767,193 | - | - |
|
| Money Market Funds | 2,032,064 | 2,032,064 | - | - |
| Total Investments in Securities: | 355,799,257 | 355,799,257 | - | - |
Financial Statements
| Statement of Assets and Liabilities |
As of December 31, 2024 |
| Assets | | | | |
| Investment in securities, at value - See accompanying schedule: | | | | |
Unaffiliated issuers (cost $281,310,426) | $ | 353,767,193 | | |
Fidelity Central Funds (cost $2,032,064) | | 2,032,064 | | |
| | | | | |
| | | | | |
| Total Investment in Securities (cost $283,342,490) | | | $ | 355,799,257 |
| Receivable for fund shares sold | | | | 917,243 |
| Dividends receivable | | | | 1,126,885 |
| Distributions receivable from Fidelity Central Funds | | | | 3,292 |
| Prepaid expenses | | | | 388 |
| Other receivables | | | | 4,803 |
Total assets | | | | 357,851,868 |
| Liabilities | | | | |
| Payable for fund shares redeemed | $ | 249,646 | | |
| Accrued management fee | | 189,975 | | |
| Distribution and service plan fees payable | | 30,385 | | |
| Audit fee payable | | 45,730 | | |
| Proxy fee payable | | 31,178 | | |
| Other payables and accrued expenses | | 6,204 | | |
| Total liabilities | | | | 553,118 |
| Net Assets | | | $ | 357,298,750 |
| Net Assets consist of: | | | | |
| Paid in capital | | | $ | 281,282,077 |
| Total accumulated earnings (loss) | | | | 76,016,673 |
| Net Assets | | | $ | 357,298,750 |
| | | | | |
| Net Asset Value and Maximum Offering Price | | | | |
| Initial Class : | | | | |
Net Asset Value, offering price and redemption price per share ($60,616,771 ÷ 3,431,200 shares) | | | $ | 17.67 |
| Service Class : | | | | |
Net Asset Value, offering price and redemption price per share ($14,040,137 ÷ 799,377 shares) | | | $ | 17.56 |
| Service Class 2 : | | | | |
Net Asset Value, offering price and redemption price per share ($132,893,650 ÷ 7,694,452 shares) | | | $ | 17.27 |
| Investor Class : | | | | |
Net Asset Value, offering price and redemption price per share ($149,748,192 ÷ 8,541,764 shares) | | | $ | 17.53 |
| Statement of Operations |
| Year ended December 31, 2024 |
| Investment Income | | | | |
| Dividends | | | $ | 9,637,734 |
| Income from Fidelity Central Funds (including $4,776 from security lending) | | | | 109,320 |
| Total income | | | | 9,747,054 |
| Expenses | | | | |
| Management fee | $ | 2,180,817 | | |
| Transfer agent fees | | 56,195 | | |
| Distribution and service plan fees | | 362,294 | | |
| Accounting fees | | 21,144 | | |
| Custodian fees and expenses | | 13,488 | | |
| Independent trustees' fees and expenses | | 1,583 | | |
| Audit fees | | 50,299 | | |
| Legal | | 567 | | |
| Miscellaneous | | 43,806 | | |
| Total expenses before reductions | | 2,730,193 | | |
| Expense reductions | | (16,297) | | |
| Total expenses after reductions | | | | 2,713,896 |
| Net Investment income (loss) | | | | 7,033,158 |
| Realized and Unrealized Gain (Loss) | | | | |
| Net realized gain (loss) on: | | | | |
| Investment Securities: | | | | |
| Unaffiliated issuers | | 11,042,433 | | |
| Fidelity Central Funds | | (33) | | |
| Total net realized gain (loss) | | | | 11,042,400 |
| Change in net unrealized appreciation (depreciation) on investment securities | | | | 4,538,195 |
| Net gain (loss) | | | | 15,580,595 |
| Net increase (decrease) in net assets resulting from operations | | | $ | 22,613,753 |
| Statement of Changes in Net Assets |
| |
| | Year ended December 31, 2024 | | Year ended December 31, 2023 |
| Increase (Decrease) in Net Assets | | | | |
| Operations | | | | |
| Net investment income (loss) | $ | 7,033,158 | $ | 8,042,984 |
| Net realized gain (loss) | | 11,042,400 | | (11,311,869) |
| Change in net unrealized appreciation (depreciation) | | 4,538,195 | | 41,214,134 |
| Net increase (decrease) in net assets resulting from operations | | 22,613,753 | | 37,945,249 |
| Distributions to shareholders | | (8,654,082) | | (22,455,500) |
| Distributions to shareholders from tax return of capital | | (5,865,047) | | - |
| | | | | |
| Total Distributions | | (14,519,129) | | (22,455,500) |
| Share transactions - net increase (decrease) | | (29,015,741) | | 30,532,499 |
| Total increase (decrease) in net assets | | (20,921,117) | | 46,022,248 |
| | | | | |
| Net Assets | | | | |
| Beginning of period | | 378,219,867 | | 332,197,619 |
| End of period | $ | 357,298,750 | $ | 378,219,867 |
| | | | | |
| | | | | |
Financial Highlights
VIP Real Estate Portfolio Initial Class |
| |
| Years ended December 31, | | 2024 | | 2023 | | 2022 | | 2021 | | 2020 |
Selected Per-Share Data | | | | | | | | | | |
| Net asset value, beginning of period | $ | 17.25 | $ | 16.54 | $ | 23.81 | $ | 17.43 | $ | 19.79 |
| Income from Investment Operations | | | | | | | | | | |
Net investment income (loss) A,B | | .36 | | .40 | | .34 | | .23 | | .31 |
| Net realized and unrealized gain (loss) | | .80 | | 1.41 | | (6.76) | | 6.52 | | (1.54) |
| Total from investment operations | | 1.16 | | 1.81 | | (6.42) | | 6.75 | | (1.23) |
| Distributions from net investment income | | (.42) C | | (.40) | | (.25) | | (.22) C | | (.37) |
| Distributions from net realized gain | | (.02) C | | (.70) | | (.59) | | (.15) C | | (.76) |
| Distributions from tax return of capital | | (.30) | | - | | - | | - | | - |
| Total distributions | | (.74) | | (1.10) | | (.85) D | | (.37) | | (1.13) |
| Net asset value, end of period | $ | 17.67 | $ | 17.25 | $ | 16.54 | $ | 23.81 | $ | 17.43 |
Total Return E,F | | | | 11.19% | | (27.51)% | | 38.99% | | (6.55)% |
Ratios to Average Net Assets B,G,H | | | | | | | | | | |
| Expenses before reductions | | .61% | | .64% | | .64% | | .64% | | .66% |
| Expenses net of fee waivers, if any | | | | .64% | | .64% | | .64% | | .66% |
| Expenses net of all reductions | | .61% | | .64% | | .64% | | .64% | | .65% |
| Net investment income (loss) | | 2.06% | | 2.49% | | 1.80% | | 1.11% | | 1.83% |
| Supplemental Data | | | | | | | | | | |
| Net assets, end of period (000 omitted) | $ | 60,617 | $ | 66,471 | $ | 66,060 | $ | 95,219 | $ | 69,612 |
Portfolio turnover rate I | | | | 33% | | 53% | | 31% | | 83% |
ACalculated based on average shares outstanding during the period.
BNet investment income (loss) is affected by the timing of the declaration of dividends by any underlying mutual funds or exchange-traded funds (ETFs). Net investment income (loss) of any mutual funds or ETFs is not included in the Fund's net investment income (loss) ratio.
CThe amount shown reflects reclassifications related to book to tax differences that were made in the year shown.
DTotal distributions per share do not sum due to rounding.
ETotal returns do not reflect charges attributable to your insurance company's separate account. Inclusion of these charges would reduce the total returns shown.
FTotal returns would have been lower if certain expenses had not been reduced during the applicable periods shown.
GFees and expenses of any underlying mutual funds or exchange-traded funds (ETFs) are not included in the Fund's expense ratio. The Fund indirectly bears its proportionate share of these expenses. For additional expense information related to investments in Fidelity Central Funds, please refer to the "Investments in Fidelity Central Funds" note found in the Notes to Financial Statements section of the most recent Annual or Semi-Annual report.
HExpense ratios reflect operating expenses of the class. Expenses before reductions do not reflect amounts reimbursed, waived, or reduced through arrangements with the investment adviser, brokerage services, or other offset arrangements, if applicable, and do not represent the amount paid by the class during periods when reimbursements, waivers or reductions occur.
IAmount does not include the portfolio activity of any underlying mutual funds or exchange-traded funds (ETFs), derivatives or securities that mature within one year from acquisition.
VIP Real Estate Portfolio Service Class |
| |
| Years ended December 31, | | 2024 | | 2023 | | 2022 | | 2021 | | 2020 |
Selected Per-Share Data | | | | | | | | | | |
| Net asset value, beginning of period | $ | 17.16 | $ | 16.46 | $ | 23.70 | $ | 17.35 | $ | 19.70 |
| Income from Investment Operations | | | | | | | | | | |
Net investment income (loss) A,B | | .34 | | .39 | | .32 | | .21 | | .29 |
| Net realized and unrealized gain (loss) | | .79 | | 1.40 | | (6.73) | | 6.48 | | (1.52) |
| Total from investment operations | | 1.13 | | 1.79 | | (6.41) | | 6.69 | | (1.23) |
| Distributions from net investment income | | (.41) C | | (.39) | | (.24) | | (.19) C | | (.36) |
| Distributions from net realized gain | | (.02) C | | (.70) | | (.59) | | (.15) C | | (.76) |
| Distributions from tax return of capital | | (.29) | | - | | - | | - | | - |
| Total distributions | | (.73) D | | (1.09) | | (.83) | | (.34) | | (1.12) |
| Net asset value, end of period | $ | 17.56 | $ | 17.16 | $ | 16.46 | $ | 23.70 | $ | 17.35 |
Total Return E,F | | | | 11.09% | | (27.59)% | | 38.80% | | (6.61)% |
Ratios to Average Net Assets B,G,H | | | | | | | | | | |
| Expenses before reductions | | .72% | | .74% | | .74% | | .74% | | .76% |
| Expenses net of fee waivers, if any | | | | .74% | | .74% | | .74% | | .76% |
| Expenses net of all reductions | | .72% | | .74% | | .74% | | .74% | | .75% |
| Net investment income (loss) | | 1.95% | | 2.39% | | 1.70% | | 1.01% | | 1.73% |
| Supplemental Data | | | | | | | | | | |
| Net assets, end of period (000 omitted) | $ | 14,040 | $ | 12,625 | $ | 12,149 | $ | 15,071 | $ | 14,062 |
Portfolio turnover rate I | | | | 33% | | 53% | | 31% | | 83% |
ACalculated based on average shares outstanding during the period.
BNet investment income (loss) is affected by the timing of the declaration of dividends by any underlying mutual funds or exchange-traded funds (ETFs). Net investment income (loss) of any mutual funds or ETFs is not included in the Fund's net investment income (loss) ratio.
CThe amount shown reflects reclassifications related to book to tax differences that were made in the year shown.
DTotal distributions per share do not sum due to rounding.
ETotal returns do not reflect charges attributable to your insurance company's separate account. Inclusion of these charges would reduce the total returns shown.
FTotal returns would have been lower if certain expenses had not been reduced during the applicable periods shown.
GFees and expenses of any underlying mutual funds or exchange-traded funds (ETFs) are not included in the Fund's expense ratio. The Fund indirectly bears its proportionate share of these expenses. For additional expense information related to investments in Fidelity Central Funds, please refer to the "Investments in Fidelity Central Funds" note found in the Notes to Financial Statements section of the most recent Annual or Semi-Annual report.
HExpense ratios reflect operating expenses of the class. Expenses before reductions do not reflect amounts reimbursed, waived, or reduced through arrangements with the investment adviser, brokerage services, or other offset arrangements, if applicable, and do not represent the amount paid by the class during periods when reimbursements, waivers or reductions occur.
IAmount does not include the portfolio activity of any underlying mutual funds or exchange-traded funds (ETFs), derivatives or securities that mature within one year from acquisition.
VIP Real Estate Portfolio Service Class 2 |
| |
| Years ended December 31, | | 2024 | | 2023 | | 2022 | | 2021 | | 2020 |
Selected Per-Share Data | | | | | | | | | | |
| Net asset value, beginning of period | $ | 16.88 | $ | 16.22 | $ | 23.36 | $ | 17.11 | $ | 19.45 |
| Income from Investment Operations | | | | | | | | | | |
Net investment income (loss) A,B | | .31 | | .35 | | .29 | | .17 | | .26 |
| Net realized and unrealized gain (loss) | | .78 | | 1.38 | | (6.63) | | 6.40 | | (1.51) |
| Total from investment operations | | 1.09 | | 1.73 | | (6.34) | | 6.57 | | (1.25) |
| Distributions from net investment income | | (.39) C | | (.37) | | (.21) | | (.17) C | | (.33) |
| Distributions from net realized gain | | (.02) C | | (.70) | | (.58) | | (.15) C | | (.76) |
| Distributions from tax return of capital | | (.28) | | - | | - | | - | | - |
| Total distributions | | (.70) D | | (1.07) | | (.80) D | | (.32) | | (1.09) |
| Net asset value, end of period | $ | 17.27 | $ | 16.88 | $ | 16.22 | $ | 23.36 | $ | 17.11 |
Total Return E,F | | | | 10.89% | | (27.69)% | | 38.64% | | (6.79)% |
Ratios to Average Net Assets B,G,H | | | | | | | | | | |
| Expenses before reductions | | .87% | | .89% | | .89% | | .89% | | .91% |
| Expenses net of fee waivers, if any | | | | .89% | | .89% | | .89% | | .91% |
| Expenses net of all reductions | | .86% | | .89% | | .89% | | .89% | | .90% |
| Net investment income (loss) | | 1.81% | | 2.24% | | 1.55% | | .86% | | 1.58% |
| Supplemental Data | | | | | | | | | | |
| Net assets, end of period (000 omitted) | $ | 132,894 | $ | 146,734 | $ | 97,994 | $ | 158,332 | $ | 105,694 |
Portfolio turnover rate I | | | | 33% | | 53% | | 31% | | 83% |
ACalculated based on average shares outstanding during the period.
BNet investment income (loss) is affected by the timing of the declaration of dividends by any underlying mutual funds or exchange-traded funds (ETFs). Net investment income (loss) of any mutual funds or ETFs is not included in the Fund's net investment income (loss) ratio.
CThe amount shown reflects reclassifications related to book to tax differences that were made in the year shown.
DTotal distributions per share do not sum due to rounding.
ETotal returns do not reflect charges attributable to your insurance company's separate account. Inclusion of these charges would reduce the total returns shown.
FTotal returns would have been lower if certain expenses had not been reduced during the applicable periods shown.
GFees and expenses of any underlying mutual funds or exchange-traded funds (ETFs) are not included in the Fund's expense ratio. The Fund indirectly bears its proportionate share of these expenses. For additional expense information related to investments in Fidelity Central Funds, please refer to the "Investments in Fidelity Central Funds" note found in the Notes to Financial Statements section of the most recent Annual or Semi-Annual report.
HExpense ratios reflect operating expenses of the class. Expenses before reductions do not reflect amounts reimbursed, waived, or reduced through arrangements with the investment adviser, brokerage services, or other offset arrangements, if applicable, and do not represent the amount paid by the class during periods when reimbursements, waivers or reductions occur.
IAmount does not include the portfolio activity of any underlying mutual funds or exchange-traded funds (ETFs), derivatives or securities that mature within one year from acquisition.
VIP Real Estate Portfolio Investor Class |
| |
| Years ended December 31, | | 2024 | | 2023 | | 2022 | | 2021 | | 2020 |
Selected Per-Share Data | | | | | | | | | | |
| Net asset value, beginning of period | $ | 17.13 | $ | 16.43 | $ | 23.66 | $ | 17.32 | $ | 19.67 |
| Income from Investment Operations | | | | | | | | | | |
Net investment income (loss) A,B | | .35 | | .39 | | .33 | | .21 | | .30 |
| Net realized and unrealized gain (loss) | | .78 | | 1.40 | | (6.73) | | 6.49 | | (1.53) |
| Total from investment operations | | 1.13 | | 1.79 | | (6.40) | | 6.70 | | (1.23) |
| Distributions from net investment income | | (.41) C | | (.39) | | (.24) | | (.21) C | | (.36) |
| Distributions from net realized gain | | (.02) C | | (.70) | | (.59) | | (.15) C | | (.76) |
| Distributions from tax return of capital | | (.29) | | - | | - | | - | | - |
| Total distributions | | (.73) D | | (1.09) | | (.83) | | (.36) | | (1.12) |
| Net asset value, end of period | $ | 17.53 | $ | 17.13 | $ | 16.43 | $ | 23.66 | $ | 17.32 |
Total Return E,F | | | | 11.12% | | (27.58)% | | 38.92% | | (6.61)% |
Ratios to Average Net Assets B,G,H | | | | | | | | | | |
| Expenses before reductions | | .70% | | .72% | | .72% | | .72% | | .74% |
| Expenses net of fee waivers, if any | | | | .71% | | .72% | | .71% | | .74% |
| Expenses net of all reductions | | .69% | | .71% | | .72% | | .71% | | .73% |
| Net investment income (loss) | | 1.98% | | 2.42% | | 1.72% | | 1.03% | | 1.75% |
| Supplemental Data | | | | | | | | | | |
| Net assets, end of period (000 omitted) | $ | 149,748 | $ | 152,390 | $ | 155,995 | $ | 245,326 | $ | 150,117 |
Portfolio turnover rate I | | | | 33% | | 53% | | 31% | | 83% |
ACalculated based on average shares outstanding during the period.
BNet investment income (loss) is affected by the timing of the declaration of dividends by any underlying mutual funds or exchange-traded funds (ETFs). Net investment income (loss) of any mutual funds or ETFs is not included in the Fund's net investment income (loss) ratio.
CThe amount shown reflects reclassifications related to book to tax differences that were made in the year shown.
DTotal distributions per share do not sum due to rounding.
ETotal returns do not reflect charges attributable to your insurance company's separate account. Inclusion of these charges would reduce the total returns shown.
FTotal returns would have been lower if certain expenses had not been reduced during the applicable periods shown.
GFees and expenses of any underlying mutual funds or exchange-traded funds (ETFs) are not included in the Fund's expense ratio. The Fund indirectly bears its proportionate share of these expenses. For additional expense information related to investments in Fidelity Central Funds, please refer to the "Investments in Fidelity Central Funds" note found in the Notes to Financial Statements section of the most recent Annual or Semi-Annual report.
HExpense ratios reflect operating expenses of the class. Expenses before reductions do not reflect amounts reimbursed, waived, or reduced through arrangements with the investment adviser, brokerage services, or other offset arrangements, if applicable, and do not represent the amount paid by the class during periods when reimbursements, waivers or reductions occur.
IAmount does not include the portfolio activity of any underlying mutual funds or exchange-traded funds (ETFs), derivatives or securities that mature within one year from acquisition.
Notes to Financial Statements
For the period ended December 31, 2024
1. Organization.
VIP Real Estate Portfolio (the Fund) is a non-diversified fund of Variable Insurance Products Fund IV (the Trust) and is authorized to issue an unlimited number of shares. The Trust is registered under the Investment Company Act of 1940, as amended (the 1940 Act), as an open-end management investment company organized as a Massachusetts business trust. Shares of the Fund may only be purchased by insurance companies for the purpose of funding variable annuity or variable life insurance contracts. The Fund offers the following classes of shares: Initial Class shares, Service Class shares, Service Class 2 shares and Investor Class shares. All classes have equal rights and voting privileges, except for matters affecting a single class.
2. Investments in Fidelity Central Funds.
Funds may invest in Fidelity Central Funds, which are open-end investment companies generally available only to other investment companies and accounts managed by the investment adviser and its affiliates. The Schedule of Investments lists any Fidelity Central Funds held as an investment as of period end, but does not include the underlying holdings of each Fidelity Central Fund. An investing fund indirectly bears its proportionate share of the expenses of the underlying Fidelity Central Funds.
Based on its investment objective, each Fidelity Central Fund may invest or participate in various investment vehicles or strategies that are similar to those of the investing fund. These strategies are consistent with the investment objectives of the investing fund and may involve certain economic risks which may cause a decline in value of each of the Fidelity Central Funds and thus a decline in the value of the investing fund.
| Fidelity Central Fund | Investment Manager | Investment Objective | Investment Practices | Expense RatioA |
| Fidelity Money Market Central Funds | Fidelity Management & Research Company LLC (FMR) | Each fund seeks to obtain a high level of current income consistent with the preservation of capital and liquidity. | Short-term Investments | Less than .005% |
A Expenses expressed as a percentage of average net assets and are as of each underlying Central Fund's most recent annual or semi-annual shareholder report.
A complete unaudited list of holdings for each Fidelity Central Fund is available upon request or at the Securities and Exchange Commission website at www.sec.gov. In addition, the financial statements of the Fidelity Central Funds which contain the significant accounting policies (including investment valuation policies) of those funds, and are not covered by the Report of Independent Registered Public Accounting Firm, are available on the Securities and Exchange Commission website or upon request.
3. Significant Accounting Policies.
The Fund is an investment company and applies the accounting and reporting guidance of the Financial Accounting Standards Board (FASB) Accounting Standards Codification Topic 946 Financial Services - Investment Companies. The financial statements have been prepared in conformity with accounting principles generally accepted in the United States of America (GAAP), which require management to make certain estimates and assumptions at the date of the financial statements. Actual results could differ from those estimates. The Fund operates as a single operating segment. The Fund's income, expenses, assets, and performance are regularly monitored and assessed as a whole by the investment adviser and other individuals responsible for oversight functions of the Trust, using the information presented in the financial statements and financial highlights. Subsequent events, if any, through the date that the financial statements were issued have been evaluated in the preparation of the financial statements. The Fund's Schedule of Investments lists any underlying mutual funds or exchange-traded funds (ETFs) but does not include the underlying holdings of these funds. The following summarizes the significant accounting policies of the Fund:
Investment Valuation. Investments are valued as of 4:00 p.m. Eastern time on the last calendar day of the period. The Board of Trustees (the Board) has designated the Fund's investment adviser as the valuation designee responsible for the fair valuation function and performing fair value determinations as needed. The investment adviser has established a Fair Value Committee (the Committee) to carry out the day-to-day fair valuation responsibilities and has adopted policies and procedures to govern the fair valuation process and the activities of the Committee. In accordance with these fair valuation policies and procedures, which have been approved by the Board, the Fund attempts to obtain prices from one or more third party pricing services or brokers to value its investments. When current market prices, quotations or currency exchange rates are not readily available or reliable, investments will be fair valued in good faith by the Committee, in accordance with the policies and procedures. Factors used in determining fair value vary by investment type and may include market or investment specific events, transaction data, estimated cash flows, and market observations of comparable investments. The frequency that the fair valuation procedures are used cannot be predicted and they may be utilized to a significant extent. The Committee manages the Fund's fair valuation practices and maintains the fair valuation policies and procedures. The Fund's investment adviser reports to the Board information regarding the fair valuation process and related material matters.
The Fund categorizes the inputs to valuation techniques used to value its investments into a disclosure hierarchy consisting of three levels as shown below:
Level 1 - unadjusted quoted prices in active markets for identical investments
Level 2 - other significant observable inputs (including quoted prices for similar investments, interest rates, prepayment speeds, etc.)
Level 3 - unobservable inputs (including the Fund's own assumptions based on the best information available)
Valuation techniques used to value the Fund's investments by major category are as follows:
Equity securities, including restricted securities, for which market quotations are readily available, are valued at the last reported sale price or official closing price as reported by a third party pricing service on the primary market or exchange on which they are traded and are categorized as Level 1 in the hierarchy. In the event there were no sales during the day or closing prices are not available, securities are valued at the last quoted bid price or may be valued using the last available price and are generally categorized as Level 2 in the hierarchy. For foreign equity securities, when market or security specific events arise, comparisons to the valuation of American Depositary Receipts (ADRs), futures contracts, Exchange-Traded Funds (ETFs) and certain indexes as well as quoted prices for similar securities may be used and would be categorized as Level 2 in the hierarchy. For equity securities, including restricted securities, where observable inputs are limited, assumptions about market activity and risk are used and these securities may be categorized as Level 3 in the hierarchy.
Investments in open-end mutual funds, including the Fidelity Central Funds, are valued at their closing net asset value (NAV) each business day and are categorized as Level 1 in the hierarchy.
Changes in valuation techniques may result in transfers in or out of an assigned level within the disclosure hierarchy. The aggregate value of investments by input level as of December 31, 2024 is included at the end of the Fund's Schedule of Investments.
Investment Transactions and Income. For financial reporting purposes, the Fund's investment holdings and NAV include trades executed through the end of the last business day of the period. The NAV per share for processing shareholder transactions is calculated as of the close of business of the New York Stock Exchange (NYSE), normally 4:00 p.m. Eastern time and includes trades executed through the end of the prior business day. Gains and losses on securities sold are determined on the basis of identified cost. Commissions paid to certain brokers with whom the investment adviser, or its affiliates, places trades on behalf of a fund include an amount in addition to trade execution, which may be rebated back to a fund. Any such rebates are included in net realized gain (loss) on investments in the Statement of Operations. Dividend income is recorded on the ex-dividend date, except for certain dividends from foreign securities where the ex-dividend date may have passed, which are recorded as soon as the Fund is informed of the ex-dividend date. Non-cash dividends included in dividend income, if any, are recorded at the fair market value of the securities received. Income and capital gain distributions from Fidelity Central Funds, if any, are recorded on the ex-dividend date. Certain distributions received by the Fund represent a return of capital or capital gain. The Fund determines the components of these distributions subsequent to the ex-dividend date, based upon receipt of tax filings or other correspondence relating to the underlying investment. These distributions are recorded as a reduction of cost of investments and/or as a realized gain.
Class Allocations and Expenses. Investment income, realized and unrealized capital gains and losses, common expenses of a fund, and certain fund-level expense reductions, if any, are allocated daily on a pro-rata basis to each class based on the relative net assets of each class to the total net assets of a fund. Each class differs with respect to transfer agent and distribution and service plan fees incurred, as applicable. Certain expense reductions may also differ by class, if applicable. For the reporting period, the allocated portion of income and expenses to each class as a percent of its average net assets may vary due to the timing of recording these transactions in relation to fluctuating net assets of the classes. Expenses directly attributable to a fund are charged to that fund. Expenses attributable to more than one fund are allocated among the respective funds on the basis of relative net assets or other appropriate methods. Expenses included in the accompanying financial statements reflect the expenses of that fund and do not include any expenses associated with any underlying mutual funds or exchange-traded funds (ETFs). Although not included in a fund's expenses, a fund indirectly bears its proportionate share of these expenses through the net asset value of each underlying mutual fund or exchange-traded fund (ETF). Expense estimates are accrued in the period to which they relate and adjustments are made when actual amounts are known.
Income Tax Information and Distributions to Shareholders. Each year, the Fund intends to qualify as a regulated investment company under Subchapter M of the Internal Revenue Code, including distributing substantially all of its taxable income and realized gains. As a result, no provision for U.S. Federal income taxes is required. As of December 31, 2024, the Fund did not have any unrecognized tax benefits in the financial statements; nor is the Fund aware of any tax positions for which it is reasonably possible that the total amounts of unrecognized tax benefits will significantly change in the next twelve months. The Fund files a U.S. federal tax return, in addition to state and local tax returns as required. The Fund's federal income tax returns are subject to examination by the Internal Revenue Service (IRS) for a period of three fiscal years after they are filed. State and local tax returns may be subject to examination for an additional fiscal year depending on the jurisdiction.
Distributions are declared and recorded on the ex-dividend date. Income and capital gain distributions are declared separately for each class. Income and capital gain distributions are determined in accordance with income tax regulations, which may differ from GAAP. These differences resulted in distribution reclassifications.
Capital accounts within the financial statements are adjusted for permanent book-tax differences. These adjustments have no impact on net assets or the results of operations. Capital accounts are not adjusted for temporary book-tax differences which will reverse in a subsequent period.
Book-tax differences are primarily due to certain corporate actions, capital loss carryforwards and losses deferred due to wash sales.
As of period end, the cost and unrealized appreciation (depreciation) in securities, and derivatives if applicable, for federal income tax purposes were as follows:
| Gross unrealized appreciation | $94,640,684 |
| Gross unrealized depreciation | (24,859,967) |
| Net unrealized appreciation (depreciation) | $69,780,717 |
| Tax Cost | $286,018,541 |
The tax-based components of distributable earnings as of period end were as follows:
| Net unrealized appreciation (depreciation) on securities and other investments | $69,780,717 |
For the period ended December 31, 2024, the Fund's distribution exceeded the aggregate amount of taxable income and net realized gains resulting in a return of capital for tax purposes. This was due to reductions in taxable income available for distribution after certain distributions had been made.
The tax character of distributions paid was as follows:
| | December 31, 2024 | December 31, 2023 |
| Ordinary Income | $8,164,725 | $8,380,674 |
| Long-term Capital Gains | 489,357 | 14,074,826 |
| Tax Return of Capital | 5,865,047 | - |
| Total | $14,519,129 | $22,455,500 |
New Accounting Pronouncement. FASB Accounting Standards Update (ASU) 2023-07 Segment Reporting (Topic 280): Improvements to Reportable Segment Disclosures became effective in this reporting period. ASU 2023-07 enhances segment information disclosure in the notes to financial statements.
4. Purchases and Sales of Investments.
Purchases and sales of securities, other than short-term securities and in-kind transactions, as applicable, are noted in the table below.
| | Purchases ($) | Sales ($) |
| VIP Real Estate Portfolio | 135,402,693 | 162,259,699 |
5. Fees and Other Transactions with Affiliates.
Management Fee. Fidelity Management & Research Company LLC (the investment adviser) and its affiliates provide the Fund with investment management related services for which the Fund pays a monthly management fee.
Effective March 1, 2024, the Fund's management contract was amended to incorporate administrative services previously covered under separate services agreements (Transfer Agent and Accounting agreements). The amended contract incorporates a management fee rate that may vary by class. The investment adviser or an affiliate pays certain expenses of managing and operating the Fund out of each class's management fee. Each class of the Fund pays a management fee to the investment adviser. The management fee is calculated and paid to the investment adviser every month. When determining a class's management fee, a mandate rate is calculated based on the monthly average net assets of a group of funds advised by FMR within a designated asset class. A discount rate is subtracted from the mandate rate once the Fund's monthly average net assets reach a certain level. The mandate rate and discount rate may vary by class. The annual management fee rate for a class of shares of the Fund is the lesser of (1) the class's mandate rate reduced by the class's discount rate (if applicable) or (2) the amount set forth in the following table.
| | Maximum Management Fee Rate % |
| Initial Class | .58 |
| Service Class | .58 |
| Service Class 2 | .58 |
| Investor Class | .66 |
One-twelfth of the management fee rate for a class is applied to the average net assets of the class for the month, giving a dollar amount which is the management fee for the class for that month. A different management fee rate may be applicable to each class of the Fund. The difference between classes is the result of separate arrangements for class-level services and/or waivers of certain expenses. It is not the result of any difference in advisory or custodial fees or other expenses related to the management of the Fund's assets, which do not vary by class. For the portion of the reporting period on or after March 1, 2024, the total annualized management fee rates were as follows:
| | Total Management Fee Rate % |
| Initial Class | .58 |
| Service Class | .58 |
| Service Class 2 | .58 |
| Investor Class | .66 |
Prior to March 1, 2024, the management fee was the sum of an individual fund fee rate that was based on an annual rate of .30% of the Fund's average net assets and an annualized group fee rate that averaged .22% during the period. The group fee rate was based upon the monthly average net assets of a group of registered investment companies with which the investment adviser has management contracts. The group fee rate decreased as assets under management increased and increased as assets under management decreased. For the portion of the reporting period prior to March 1, 2024, the total annualized management fee rate was .52%.
Effective March 1, 2024, the Fund's sub-advisory agreements with FMR Investment Management (UK) Limited, Fidelity Management & Research (Hong Kong) Limited, and Fidelity Management & Research (Japan) Limited were amended to provide that the investment adviser pays each sub-adviser monthly fees equal to 110% of the sub-adviser's costs for providing sub-advisory services.
Distribution and Service Plan Fees. In accordance with Rule 12b-1 of the 1940 Act, the Fund has adopted separate 12b-1 Plans for each Service Class of shares. Each Service Class pays Fidelity Distributors Company LLC (FDC), an affiliate of the investment adviser, a service fee. For the period, the service fee is based on an annual rate of .10% of Service Class' average net assets and .25% of Service Class 2's average net assets.
For the period, total fees, all of which were re-allowed to insurance companies for the distribution of shares and providing shareholder support services, were as follows:
| Service Class | $13,306 |
| Service Class 2 | 348,988 |
| | $362,294 |
Transfer Agent Fees. Fidelity Investments Institutional Operations Company LLC (FIIOC), an affiliate of the investment adviser, is the Fund's transfer, dividend disbursing, and shareholder servicing agent. Effective March 1, 2024, the Fund's management contract was amended to incorporate transfer agent services and associated fees previously covered under a separate services agreement.
During the period January 1, 2024 through February 29, 2024, the transfer agent fees for each class were a fixed annual rate of class-level average net assets as follows:
| | Amount ($) | % of Class-Level Average Net Assets |
| Initial Class | 6,669 | .0630 |
| Service Class | 1,274 | .0630 |
| Service Class 2 | 14,491 | .0630 |
| Investor Class | 33,761 | .1390 |
| | 56,195 | |
Accounting Fees. Fidelity Service Company, Inc. (FSC), an affiliate of the investment adviser, maintains the Fund's accounting records. Effective March 1, 2024, the Fund's management contract was amended to incorporate accounting services and associated fees previously covered under a separate services agreement.
During the period January 1, 2024 through February 29, 2024, the accounting fees were a fixed annual rate of average net assets as follows:
| | % of Average Net Assets |
| VIP Real Estate Portfolio | .0353 |
Brokerage Commissions. A portion of portfolio transactions were placed with brokerage firms which are affiliates of the investment adviser. Brokerage commissions are included in net realized gain (loss) and change in net unrealized appreciation (depreciation) in the Statement of Operations. The commissions paid to these affiliated firms were as follows:
| | Amount ($) |
| VIP Real Estate Portfolio | 2,038 |
Interfund Trades. Funds may purchase from or sell securities to other Fidelity Funds under procedures adopted by the Board. The procedures have been designed to ensure these interfund trades are executed in accordance with Rule 17a-7 of the 1940 Act. Any interfund trades are included within the respective purchases and sales amounts shown in the Purchases and Sales of Investments note. Interfund trades during the period are noted in the table below.
| | Purchases ($) | Sales ($) | Realized Gain (Loss) ($) |
| VIP Real Estate Portfolio | 11,142,825 | 12,414,730 | 82,174 |
Other. During the period, the investment adviser reimbursed the Fund for certain losses as follows:
| | Amount ($) |
| VIP Real Estate Portfolio | 4,802 |
6. Committed Line of Credit.
Certain Funds participate with other funds managed by the investment adviser or an affiliate in a $4.25 billion credit facility (the "line of credit") to be utilized for temporary or emergency purposes to fund shareholder redemptions or for other short-term liquidity purposes.
Commitment fees are charged based on the unused amount of the line of credit at an annual rate of .10%, and then allocated to each participating fund based on its pro-rata portion of the line of credit. The commitment fees are reflected in Miscellaneous expenses on the Statement of Operations, and are listed below.
Interest is charged to a participating fund based on its borrowings at an annual rate of .75% plus the highest of (i) daily SOFR plus a .10% spread adjustment, (ii) Federal Funds Effective Rate, or (iii) Overnight Bank Funding Rate. During the period, there were no borrowings on this line of credit.
The line of credit agreement will expire in March 2025 unless extended or renewed.
| | Amount ($) |
| VIP Real Estate Portfolio | 569 |
7. Security Lending.
Funds lend portfolio securities from time to time in order to earn additional income. Lending agents are used, including National Financial Services (NFS), an affiliate of the investment adviser. Pursuant to a securities lending agreement, NFS will receive a fee, which is capped at 9.9% of a fund's daily lending revenue, for its services as lending agent. A fund may lend securities to certain qualified borrowers, including NFS. On the settlement date of the loan, a fund receives collateral (in the form of U.S. Treasury obligations, letters of credit and/or cash) against the loaned securities and maintains collateral in an amount not less than 100% of the market value of the loaned securities during the period of the loan. The market value of the loaned securities is determined at the close of business of a fund and any additional required collateral is delivered to a fund on the next business day. A fund or borrower may terminate the loan at any time, and if the borrower defaults on its obligation to return the securities loaned because of insolvency or other reasons, a fund may apply collateral received from the borrower against the obligation. A fund may experience delays and costs in recovering the securities loaned. Any cash collateral received is invested in the Fidelity Securities Lending Cash Central Fund. Any loaned securities are identified as such in the Schedule of Investments, and the value of loaned securities and cash collateral at period end, as applicable, are presented in the Statement of Assets and Liabilities. Security lending income represents the income earned on investing cash collateral, less rebates paid to borrowers and any lending agent fees associated with the loan, plus any premium payments received for lending certain types of securities. Security lending income is presented in the Statement of Operations as a component of income from Fidelity Central Funds. Affiliated security lending activity, if any, was as follows:
| | Total Security Lending Fees Paid to NFS ($) | Security Lending Income From Securities Loaned to NFS ($) | Value of Securities Loaned to NFS at Period End ($) |
| VIP Real Estate Portfolio | 515 | - | - |
8. Expense Reductions.
Through arrangements with the Fund's custodian, credits realized as a result of certain uninvested cash balances were used to reduce the Fund's expenses. During the period, custodian credits reduced the Fund's expenses by $40.
In addition, during the period the investment adviser or an affiliate reimbursed and/or waived a portion of fund-level operating expenses in the amount of $16,257.
9. Distributions to Shareholders.
Distributions to shareholders of each class were as follows:
| | Year ended December 31, 2024 | Year ended December 31, 2023 |
| VIP Real Estate Portfolio | | |
| Distributions to shareholders | | |
| Initial Class | $1,470,307 | $4,249,940 |
| Service Class | 330,209 | 835,505 |
| Service Class 2 | 3,230,643 | 7,307,505 |
| Investor Class | 3,622,922 | 10,062,550 |
Total | $8,654,081 | $22,455,500 |
| Tax Return of Capital | | |
| Initial Class | $996,456 | $- |
| Service Class | 223,790 | - |
| Service Class 2 | 2,189,472 | - |
| Investor Class | 2,455,329 | - |
Total | $5,865,047 | $- |
10. Share Transactions.
Transactions for each class of shares were as follows and may contain in-kind transactions:
| | Shares | Shares | Dollars | Dollars |
| | Year ended December 31, 2024 | Year ended December 31, 2023 | Year ended December 31, 2024 | Year ended December 31, 2023 |
| VIP Real Estate Portfolio | | | | |
| Initial Class | | | | |
| Shares sold | 286,432 | 420,196 | $4,939,915 | $6,729,502 |
| Reinvestment of distributions | 133,196 | 251,029 | 2,466,763 | 4,249,940 |
| Shares redeemed | (841,742) | (812,224) | (14,914,743) | (13,305,910) |
| Net increase (decrease) | (422,114) | (140,999) | $(7,508,065) | $(2,326,468) |
| Service Class | | | | |
| Shares sold | 246,992 | 190,511 | $4,144,348 | $3,038,056 |
| Reinvestment of distributions | 30,011 | 49,656 | 553,999 | 835,505 |
| Shares redeemed | (213,285) | (242,581) | (3,726,005) | (3,902,446) |
| Net increase (decrease) | 63,718 | (2,414) | $972,342 | $(28,885) |
| Service Class 2 | | | | |
| Shares sold | 1,207,599 | 3,603,805 | $21,224,802 | $56,416,922 |
| Reinvestment of distributions | 298,828 | 443,372 | 5,420,115 | 7,307,505 |
| Shares redeemed | (2,502,450) | (1,398,475) | (43,505,342) | (22,062,376) |
| Net increase (decrease) | (996,023) | 2,648,702 | $(16,860,425) | $41,662,051 |
| Investor Class | | | | |
| Shares sold | 734,192 | 457,345 | $13,136,039 | $7,535,478 |
| Reinvestment of distributions | 330,319 | 597,354 | 6,078,252 | 10,062,550 |
| Shares redeemed | (1,419,360) | (1,653,432) | (24,833,884) | (26,372,227) |
| Net increase (decrease) | (354,849) | (598,733) | $(5,619,593) | $(8,774,199) |
11. Other.
A fund's organizational documents provide former and current trustees and officers with a limited indemnification against liabilities arising in connection with the performance of their duties to the fund. In the normal course of business, a fund may also enter into contracts that provide general indemnifications. A fund's maximum exposure under these arrangements is unknown as this would be dependent on future claims that may be made against a fund. The risk of material loss from such claims is considered remote.
At the end of the period, the investment adviser or its affiliates were owners of record of more than 10% and certain otherwise unaffiliated shareholders were owners of record of more than 10% of the outstanding shares as follows:
| Fund | Affiliated % | Number ofUnaffiliated Shareholders | Unaffiliated Shareholders % |
| VIP Real Estate Portfolio | 48 | 1 | 17 |
12. Risk and Uncertainties.
Many factors affect a fund's performance. Developments that disrupt global economies and financial markets, such as pandemics, epidemics, outbreaks of infectious diseases, war, terrorism, and environmental disasters, may significantly affect a fund's investment performance. The effects of these developments to a fund will be impacted by the types of securities in which a fund invests, the financial condition, industry, economic sector, and geographic location of an issuer, and a fund's level of investment in the securities of that issuer. Significant concentrations in security types, issuers, industries, sectors, and geographic locations may magnify the factors that affect a fund's performance.
Report of Independent Registered Public Accounting Firm
To the Board of Trustees of Variable Insurance Products Fund IV and Shareholders of VIP Real Estate Portfolio
Opinion on the Financial Statements
We have audited the accompanying statement of assets and liabilities, including the schedule of investments, of VIP Real Estate Portfolio (one of the funds constituting Variable Insurance Products Fund IV, referred to hereafter as the "Fund") as of December 31, 2024, the related statement of operations for the year ended December 31, 2024, the statement of changes in net assets for each of the two years in the period ended December 31, 2024, including the related notes, and the financial highlights for each of the five years in the period ended December 31, 2024 (collectively referred to as the "financial statements"). In our opinion, the financial statements present fairly, in all material respects, the financial position of the Fund as of December 31, 2024, the results of its operations for the year then ended, the changes in its net assets for each of the two years in the period ended December 31, 2024 and the financial highlights for each of the five years in the period ended December 31, 2024 in conformity with accounting principles generally accepted in the United States of America.
Basis for Opinion
These financial statements are the responsibility of the Fund's management. Our responsibility is to express an opinion on the Fund's financial statements based on our audits. We are a public accounting firm registered with the Public Company Accounting Oversight Board (United States) (PCAOB) and are required to be independent with respect to the Fund in accordance with the U.S. federal securities laws and the applicable rules and regulations of the Securities and Exchange Commission and the PCAOB.
We conducted our audits of these financial statements in accordance with the standards of the PCAOB. Those standards require that we plan and perform the audit to obtain reasonable assurance about whether the financial statements are free of material misstatement, whether due to error or fraud.
Our audits included performing procedures to assess the risks of material misstatement of the financial statements, whether due to error or fraud, and performing procedures that respond to those risks. Such procedures included examining, on a test basis, evidence regarding the amounts and disclosures in the financial statements. Our audits also included evaluating the accounting principles used and significant estimates made by management, as well as evaluating the overall presentation of the financial statements. Our procedures included confirmation of securities owned as of December 31, 2024 by correspondence with the custodian. We believe that our audits provide a reasonable basis for our opinion.
/s/ PricewaterhouseCoopers LLP
Boston, Massachusetts
February 18, 2025
We have served as the auditor of one or more investment companies in the Fidelity group of funds since 1932.
Distributions
(Unaudited)The dividend and capital gains distributions for the fund(s) are available on Fidelity.com or Institutional.Fidelity.com.
The fund hereby designates as a capital gain dividend with respect to the taxable year ended December 31, 2024, $489,357, or, if subsequently determined to be different, the net capital gain of such year.
The fund designates $66,267 of distributions paid during the fiscal year ended 2024 as qualifying to be taxed as section 163(j) interest dividends.
Item 8: Changes in and Disagreements with Accountants for Open-End Management Investment Companies
(Unaudited)
Note: This is not applicable for any fund included in this document.
Item 9: Proxy Disclosures for Open-End Management Investment Companies
(Unaudited)
| A special meeting of shareholders was held on July 16, 2024. The results of votes taken among shareholders on the proposal before them are reported below. Each vote reported represents one dollar of net asset value held on the record date for the meeting. |
| Proposal 1 |
| To elect a Board of Trustees. |
| | # of Votes | % of Votes |
| Bettina Doulton |
| Affirmative | 5,501,492,681.85 | 94.15 |
| Withheld | 341,991,035.05 | 5.85 |
| TOTAL | 5,843,483,716.90 | 100.00 |
| Robert A. Lawrence |
| Affirmative | 5,480,901,467.70 | 93.80 |
| Withheld | 362,582,249.21 | 6.20 |
| TOTAL | 5,843,483,716.90 | 100.00 |
| Vijay C. Advani |
| Affirmative | 5,500,352,811.04 | 94.13 |
| Withheld | 343,130,905.86 | 5.87 |
| TOTAL | 5,843,483,716.90 | 100.00 |
| Thomas P. Bostick |
| Affirmative | 5,488,165,362.69 | 93.92 |
| Withheld | 355,318,354.21 | 6.08 |
| TOTAL | 5,843,483,716.90 | 100.00 |
| Donald F. Donahue |
| Affirmative | 5,482,960,893.76 | 93.83 |
| Withheld | 360,522,823.14 | 6.17 |
| TOTAL | 5,843,483,716.90 | 100.00 |
| Vicki L. Fuller |
| Affirmative | 5,492,283,337.89 | 93.99 |
| Withheld | 351,200,379.01 | 6.01 |
| TOTAL | 5,843,483,716.90 | 100.00 |
| Patricia L. Kampling |
| Affirmative | 5,521,992,715.20 | 94.50 |
| Withheld | 321,491,001.70 | 5.50 |
| TOTAL | 5,843,483,716.90 | 100.00 |
| Thomas A. Kennedy |
| Affirmative | 5,484,789,158.10 | 93.86 |
| Withheld | 358,694,558.80 | 6.14 |
| TOTAL | 5,843,483,716.90 | 100.00 |
| Oscar Munoz |
| Affirmative | 5,497,884,744.63 | 94.09 |
| Withheld | 345,598,972.27 | 5.91 |
| TOTAL | 5,843,483,716.90 | 100.00 |
| Karen B. Peetz |
| Affirmative | 5,503,968,240.81 | 94.19 |
| Withheld | 339,515,476.09 | 5.81 |
| TOTAL | 5,843,483,716.90 | 100.00 |
| David M. Thomas |
| Affirmative | 5,466,218,204.40 | 93.54 |
| Withheld | 377,265,512.50 | 6.46 |
| TOTAL | 5,843,483,716.90 | 100.00 |
| Susan Tomasky |
| Affirmative | 5,463,402,825.36 | 93.50 |
| Withheld | 380,080,891.54 | 6.50 |
| TOTAL | 5,843,483,716.90 | 100.00 |
| Michael E. Wiley |
| Affirmative | 5,466,838,155.74 | 93.55 |
| Withheld | 376,645,561.16 | 6.45 |
| TOTAL | 5,843,483,716.90 | 100.00 |
| | | |
| Proposal 1 reflects trust-wide proposal and voting results. |
Item 10: Remuneration Paid to Directors, Officers, and others of Open-End Management Investment Companies
(Unaudited)
Note: This information is disclosed as part of the financial statements for each Fund as part of Item 7: Financial Statements and Financial Highlights for Open-End Management Investment companies.
Item 11: Statement Regarding Basis for Approval of Investment Advisory Contract
(Unaudited)
Note: This is not applicable for any fund included in this document.
1.781992.122
VIPRE-ANN-0325
Fidelity® Variable Insurance Products:
VIP Health Care Portfolio
Annual Report
December 31, 2024
Contents
To view a fund's proxy voting guidelines and proxy voting record for the 12-month period ended June 30, visit http://www.fidelity.com/proxyvotingresults or visit the Securities and Exchange Commission's (SEC) web site at http://www.sec.gov.
You may also call 1-877-208-0098 to request a free copy of the proxy voting guidelines.
Fidelity® Variable Insurance Products are separate account options which are purchased through a variable insurance contract.
Standard & Poor's, S&P and S&P 500 are registered service marks of The McGraw-Hill Companies, Inc. and have been licensed for use by Fidelity Distributors Corporation.
Other third-party marks appearing herein are the property of their respective owners.
All other marks appearing herein are registered or unregistered trademarks or service marks of FMR LLC or an affiliated company. © 2025 FMR LLC. All rights reserved.
This report and the financial statements contained herein are submitted for the general information of the shareholders of the Fund. This report is not authorized for distribution to prospective investors in the Fund unless preceded or accompanied by an effective prospectus.
A fund files its complete schedule of portfolio holdings with the SEC for the first and third quarters of each fiscal year on Form N-PORT. Forms N-PORT are available on the SEC's web site at http://www.sec.gov. A fund's Forms N-PORT may be reviewed and copied at the SEC's Public Reference Room in Washington, DC. Information regarding the operation of the SEC's Public Reference Room may be obtained by calling 1-800-SEC-0330.
For a complete list of a fund's portfolio holdings, view the most recent holdings listing, semiannual report, or annual report on Fidelity's web site at http://www.fidelity.com, http://www.institutional.fidelity.com, or http://www.401k.com, as applicable.
NOT FDIC INSURED •MAY LOSE VALUE •NO BANK GUARANTEE
Neither the Fund nor Fidelity Distributors Corporation is a bank.
Item 7: Financial Statements and Financial Highlights for Open-End Management Investment Companies (Annual Report)
VIP Health Care Portfolio
Schedule of Investments December 31, 2024
Showing Percentage of Net Assets
| Common Stocks - 97.6% |
| | | Shares | Value ($) |
| BELGIUM - 2.0% | | | |
| Health Care - 2.0% | | | |
| Pharmaceuticals - 2.0% | | | |
| UCB SA | | 105,000 | 20,904,489 |
| CANADA - 0.7% | | | |
| Health Care - 0.7% | | | |
| Biotechnology - 0.7% | | | |
| Xenon Pharmaceuticals Inc (b) | | 190,000 | 7,448,000 |
| DENMARK - 1.4% | | | |
| Health Care - 1.4% | | | |
| Biotechnology - 1.4% | | | |
| Ascendis Pharma A/S ADR (b) | | 110,000 | 15,143,700 |
| Zealand Pharma A/S (b) | | 2,300 | 228,588 |
| | | | |
| TOTAL DENMARK | | | 15,372,288 |
| GERMANY - 0.2% | | | |
| Health Care - 0.2% | | | |
| Biotechnology - 0.2% | | | |
| BioNTech SE ADR (b) | | 18,000 | 2,051,099 |
| NETHERLANDS - 3.6% | | | |
| Health Care - 3.6% | | | |
| Biotechnology - 3.4% | | | |
| Argenx SE ADR (b) | | 48,000 | 29,520,000 |
| Merus NV (b) | | 170,000 | 7,148,500 |
| | | | 36,668,500 |
| Pharmaceuticals - 0.2% | | | |
| Pharvaris NV (b) | | 109,600 | 2,101,032 |
| TOTAL NETHERLANDS | | | 38,769,532 |
| UNITED KINGDOM - 0.2% | | | |
| Health Care - 0.2% | | | |
| Biotechnology - 0.2% | | | |
| Immunocore Holdings PLC ADR (b) | | 82,056 | 2,420,652 |
| UNITED STATES - 89.5% | | | |
| Health Care - 89.5% | | | |
| Biotechnology - 18.0% | | | |
| Acumen Pharmaceuticals Inc (b) | | 180,000 | 309,600 |
| Allogene Therapeutics Inc (b)(c) | | 690,000 | 1,469,700 |
| Alnylam Pharmaceuticals Inc (b) | | 92,500 | 21,766,176 |
| Annexon Inc (b)(c) | | 200,000 | 1,026,000 |
| Apogee Therapeutics Inc (b) | | 9,277 | 420,248 |
| Arcellx Inc (b) | | 90,000 | 6,902,100 |
| Arcus Biosciences Inc (b) | | 110,000 | 1,637,900 |
| Avidity Biosciences Inc (b) | | 80,000 | 2,326,400 |
| Blueprint Medicines Corp (b) | | 24,000 | 2,093,280 |
| Cargo Therapeutics Inc (b) | | 146,125 | 2,107,123 |
| Caris Life Sciences Inc (b)(d)(e) | | 254,430 | 732,758 |
| Cartesian Therapeutics Inc (b) | | 56,954 | 1,020,046 |
| CG oncology Inc | | 80,000 | 2,294,400 |
| Cogent Biosciences Inc (b) | | 340,000 | 2,652,000 |
| Crinetics Pharmaceuticals Inc (b) | | 75,000 | 3,834,750 |
| Cytokinetics Inc (b)(c) | | 128,000 | 6,021,120 |
| Day One Biopharmaceuticals Inc (b)(c) | | 150,000 | 1,900,500 |
| Disc Medicine Inc (b) | | 45,000 | 2,853,000 |
| Dyne Therapeutics Inc (b) | | 110,000 | 2,591,600 |
| Exact Sciences Corp (b)(c) | | 356,000 | 20,003,640 |
| Gilead Sciences Inc | | 116,000 | 10,714,920 |
| Janux Therapeutics Inc (b)(c) | | 104,600 | 5,600,284 |
| Keros Therapeutics Inc (b) | | 128,000 | 2,026,240 |
| Legend Biotech Corp ADR (b)(c) | | 415,000 | 13,504,100 |
| MoonLake Immunotherapeutics Class A (b)(c) | | 108,000 | 5,848,200 |
| Nurix Therapeutics Inc (b) | | 218,000 | 4,107,120 |
| Nuvalent Inc Class A (b) | | 100,000 | 7,828,000 |
| Oruka Therapeutics Inc | | 134,750 | 2,612,803 |
| Oruka Therapeutics Inc (e) | | 25,109 | 486,863 |
| Perspective Therapeutics Inc (b) | | 100,000 | 319,000 |
| Regeneron Pharmaceuticals Inc (b) | | 30,000 | 21,369,900 |
| REVOLUTION Medicines Inc (b) | | 60,000 | 2,624,400 |
| Scholar Rock Holding Corp (b) | | 17,200 | 743,384 |
| Soleno Therapeutics Inc (b) | | 50,000 | 2,247,500 |
| Spyre Therapeutics Inc (b)(c) | | 90,000 | 2,095,200 |
| Summit Therapeutics Inc (b)(c) | | 90,000 | 1,606,050 |
| Upstream Bio Inc (c) | | 137,119 | 2,254,236 |
| Vaxcyte Inc (b) | | 135,000 | 11,051,100 |
| Veracyte Inc (b) | | 57,600 | 2,280,960 |
| Viking Therapeutics Inc (b) | | 50,000 | 2,012,000 |
| Viridian Therapeutics Inc (b) | | 341,695 | 6,550,293 |
| | | | 191,844,894 |
| Health Care Equipment & Supplies - 29.8% | | | |
| Boston Scientific Corp (b) | | 1,280,000 | 114,329,600 |
| Glaukos Corp (b) | | 110,000 | 16,493,400 |
| Inspire Medical Systems Inc (b) | | 62,000 | 11,493,560 |
| Insulet Corp (b) | | 140,000 | 36,549,800 |
| Intuitive Surgical Inc (b) | | 25,000 | 13,049,000 |
| Masimo Corp (b) | | 200,000 | 33,060,000 |
| Medical Microinstruments Inc/Italy warrants 2/16/2031 (b)(d)(e) | | 2,363 | 29,018 |
| Penumbra Inc (b) | | 208,000 | 49,395,840 |
| PROCEPT BioRobotics Corp (b)(c) | | 100,000 | 8,052,000 |
| Stryker Corp | | 92,800 | 33,412,640 |
| | | | 315,864,858 |
| Health Care Providers & Services - 20.7% | | | |
| Alignment Healthcare Inc (b)(c) | | 720,000 | 8,100,000 |
| BrightSpring Health Services Inc (b) | | 400,000 | 6,812,000 |
| Cigna Group/The | | 70,800 | 19,550,712 |
| CVS Health Corp | | 170,000 | 7,631,300 |
| LifeStance Health Group Inc (b) | | 850,000 | 6,264,500 |
| McKesson Corp | | 37,500 | 21,371,625 |
| Molina Healthcare Inc (b) | | 28,000 | 8,149,400 |
| Privia Health Group Inc (b) | | 600,000 | 11,730,000 |
| Surgery Partners Inc (b)(c) | | 572,900 | 12,128,293 |
| UnitedHealth Group Inc | | 235,000 | 118,877,100 |
| | | | 220,614,930 |
| Health Care Technology - 2.1% | | | |
| Phreesia Inc (b) | | 221,600 | 5,575,456 |
| Veeva Systems Inc Class A (b) | | 82,000 | 17,240,500 |
| | | | 22,815,956 |
| Life Sciences Tools & Services - 10.2% | | | |
| 10X Genomics Inc Class A (b) | | 421,800 | 6,057,048 |
| Bruker Corp | | 170,000 | 9,965,400 |
| Danaher Corp | | 254,000 | 58,305,700 |
| IQVIA Holdings Inc (b) | | 16,000 | 3,144,160 |
| Thermo Fisher Scientific Inc | | 42,800 | 22,265,844 |
| West Pharmaceutical Services Inc | | 28,500 | 9,335,460 |
| | | | 109,073,612 |
| Pharmaceuticals - 8.7% | | | |
| Contineum Therapeutics Inc Class A | | 40,000 | 586,000 |
| Eli Lilly & Co | | 81,500 | 62,918,000 |
| Enliven Therapeutics Inc (b) | | 90,000 | 2,025,000 |
| Merck & Co Inc | | 145,000 | 14,424,600 |
| Neumora Therapeutics Inc (b) | | 69,142 | 732,905 |
| Rapport Therapeutics Inc (b)(c) | | 40,000 | 709,600 |
| Royalty Pharma PLC Class A | | 260,000 | 6,632,600 |
| Septerna Inc (c) | | 33,100 | 757,990 |
| Structure Therapeutics Inc ADR (b)(c) | | 101,500 | 2,752,680 |
| Third Harmonic Bio Inc (b)(c) | | 100,000 | 1,029,000 |
| | | | 92,568,375 |
| TOTAL UNITED STATES | | | 952,782,625 |
| TOTAL COMMON STOCKS (Cost $680,551,226) | | | 1,039,748,685 |
| | | | |
| Convertible Corporate Bonds - 0.0% |
| | | Principal Amount (a) | Value ($) |
| UNITED STATES - 0.0% | | | |
| Health Care - 0.0% | | | |
| Health Care Technology - 0.0% | | | |
| Wugen Inc 10% 6/14/2025 (d)(e) | | 353,945 | 372,881 |
| Pharmaceuticals - 0.0% | | | |
| Galvanize Therapeutics 6% 2/28/2027 (d)(e) | | 494,400 | 547,548 |
TOTAL HEALTH CARE | | | 920,429 |
| | | | |
| TOTAL CONVERTIBLE CORPORATE BONDS (Cost $848,345) | | | 920,429 |
| | | | |
| Convertible Preferred Stocks - 1.5% |
| | | Shares | Value ($) |
| CHINA - 0.0% | | | |
| Health Care - 0.0% | | | |
| Health Care Providers & Services - 0.0% | | | |
| dMed Biopharmaceutical Co Ltd Series C (b)(d)(e) | | 45,182 | 379,077 |
| ISRAEL - 0.2% | | | |
| Health Care - 0.2% | | | |
| Health Care Equipment & Supplies - 0.2% | | | |
| InSightec Ltd Series G (d)(e) | | 1,824,838 | 1,605,857 |
| UNITED STATES - 1.3% | | | |
| Financials - 0.1% | | | |
| Financial Services - 0.1% | | | |
| Saluda Medical Inc Series E (b)(d)(e) | | 163,717 | 1,106,727 |
| Health Care - 1.2% | | | |
| Biotechnology - 0.8% | | | |
| Asimov Inc Series B (b)(d)(e) | | 13,047 | 367,143 |
| Caris Life Sciences Inc Series D (b)(d)(e) | | 398,133 | 1,146,623 |
| Cleerly Inc Series C (b)(d)(e) | | 179,891 | 2,113,720 |
| Element Biosciences Inc Series C (b)(d)(e) | | 72,178 | 699,405 |
| Element Biosciences Inc Series D (d)(e) | | 73,131 | 514,842 |
| Element Biosciences Inc Series D1 (d)(e) | | 73,131 | 514,842 |
| ElevateBio LLC Series C (b)(d)(e) | | 31,200 | 90,480 |
| Endeavor BioMedicines Inc Series C (d)(e) | | 208,016 | 1,356,264 |
| Inscripta Inc Series E (b)(d)(e) | | 157,568 | 472,704 |
| | | | 7,276,023 |
| Health Care Equipment & Supplies - 0.1% | | | |
| Medical Microinstruments Inc/Italy Series C (d)(e) | | 47,257 | 1,560,899 |
| Health Care Technology - 0.3% | | | |
| Aledade Inc Series B1 (b)(d)(e) | | 24,966 | 928,735 |
| Aledade Inc Series E1 (b)(d)(e) | | 10,776 | 400,867 |
| Candid Therapeutics (d)(e) | | 491,360 | 540,496 |
| Omada Health Inc Series E (b)(d)(e) | | 281,490 | 1,213,222 |
| Wugen Inc Series B (b)(d)(e) | | 57,585 | 219,975 |
| | | | 3,303,295 |
| Pharmaceuticals - 0.0% | | | |
| Galvanize Therapeutics Series B (b)(d)(e) | | 505,495 | 379,121 |
TOTAL HEALTH CARE | | | 12,519,338 |
| | | | |
| TOTAL UNITED STATES | | | 13,626,065 |
| TOTAL CONVERTIBLE PREFERRED STOCKS (Cost $22,314,250) | | | 15,610,999 |
| | | | |
| Preferred Securities - 0.2% |
| | | Principal Amount (a) | Value ($) |
| CANADA - 0.2% | | | |
| Health Care - 0.2% | | | |
| Health Care Equipment & Supplies - 0.2% | | | |
Kardium Inc/CA 10% 12/31/2026 (d)(e) (Cost $1,929,405) | | 1,929,405 | 1,870,708 |
| | | | |
| Money Market Funds - 2.7% |
| | | Yield (%) | Shares | Value ($) |
| Fidelity Cash Central Fund (f) | | 4.36 | 5,375,068 | 5,376,143 |
| Fidelity Securities Lending Cash Central Fund (f)(g) | | 4.35 | 23,218,354 | 23,220,676 |
| TOTAL MONEY MARKET FUNDS (Cost $28,596,819) | | | | 28,596,819 |
| | | | | |
| TOTAL INVESTMENT IN SECURITIES - 102.0% (Cost $734,240,045) | 1,086,747,640 |
NET OTHER ASSETS (LIABILITIES) - (2.0)% | (21,748,809) |
| NET ASSETS - 100.0% | 1,064,998,831 |
| | |
Legend
| (a) | Amount is stated in United States dollars unless otherwise noted. |
| (c) | Security or a portion of the security is on loan at period end. |
| (e) | Restricted securities (including private placements) - Investment in securities not registered under the Securities Act of 1933 (excluding 144A issues). At the end of the period, the value of restricted securities (excluding 144A issues) amounted to $19,650,775 or 1.8% of net assets. |
| (f) | Affiliated fund that is generally available only to investment companies and other accounts managed by Fidelity Investments. The rate quoted is the annualized seven-day yield of the fund at period end. A complete unaudited listing of the fund's holdings as of its most recent quarter end is available upon request. In addition, each Fidelity Central Fund's financial statements, which are not covered by the Fund's Report of Independent Registered Public Accounting Firm, are available on the SEC's website or upon request. |
| (g) | Investment made with cash collateral received from securities on loan. |
| Additional information on each restricted holding is as follows: |
| Security | Acquisition Date | Acquisition Cost ($) |
| Aledade Inc Series B1 | 5/07/21 | 955,966 |
| | | |
| Aledade Inc Series E1 | 5/20/22 | 536,800 |
| | | |
| Asimov Inc Series B | 10/29/21 | 1,209,205 |
| | | |
| Candid Therapeutics | 8/27/24 | 589,632 |
| | | |
| Caris Life Sciences Inc | 10/06/22 | 1,424,808 |
| | | |
| Caris Life Sciences Inc Series D | 5/11/21 | 3,224,877 |
| | | |
| Cleerly Inc Series C | 7/08/22 | 2,119,224 |
| | | |
| dMed Biopharmaceutical Co Ltd Series C | 12/01/20 | 641,727 |
| | | |
| Element Biosciences Inc Series C | 6/21/21 | 1,483,741 |
| | | |
| Element Biosciences Inc Series D | 6/28/24 | 573,588 |
| | | |
| Element Biosciences Inc Series D1 | 6/28/24 | 573,588 |
| | | |
| ElevateBio LLC Series C | 3/09/21 | 130,884 |
| | | |
| Endeavor BioMedicines Inc Series C | 4/22/24 | 1,357,221 |
| | | |
| Galvanize Therapeutics 6% 2/28/2027 | 2/28/24 | 494,400 |
| | | |
| Galvanize Therapeutics Series B | 3/29/22 | 875,156 |
| | | |
| Inscripta Inc Series E | 3/30/21 | 1,391,325 |
| | | |
| InSightec Ltd Series G | 6/17/24 | 1,620,091 |
| | | |
| Kardium Inc/CA 10% 12/31/2026 | 5/31/24 - 9/30/24 | 1,929,405 |
| | | |
| Medical Microinstruments Inc/Italy Series C | 2/16/24 | 1,575,251 |
| | | |
| Medical Microinstruments Inc/Italy warrants 2/16/2031 | 2/16/24 | 0 |
| | | |
| Omada Health Inc Series E | 12/22/21 | 1,687,589 |
| | | |
| Oruka Therapeutics Inc | 9/12/24 | 577,507 |
| | | |
| Saluda Medical Inc Series E | 4/06/23 | 1,321,818 |
| | | |
| Wugen Inc 10% 6/14/2025 | 6/14/24 | 353,945 |
| | | |
| Wugen Inc Series B | 7/09/21 | 446,566 |
| | | |
Affiliated Central Funds
Fiscal year to date information regarding the Fund's investments in Fidelity Central Funds, including the ownership percentage, is presented below.
| Affiliate | Value, beginning of period ($) | Purchases ($) | Sales Proceeds ($) | Dividend Income ($) | Realized Gain (loss) ($) | Change in Unrealized appreciation (depreciation) ($) | Value, end of period ($) | Shares, end of period | % ownership, end of period |
| Fidelity Cash Central Fund | 6,859,554 | 167,615,642 | 169,098,771 | 232,325 | (282) | - | 5,376,143 | 5,375,068 | 0.0% |
| Fidelity Securities Lending Cash Central Fund | 34,271,248 | 265,819,189 | 276,869,761 | 81,716 | - | - | 23,220,676 | 23,218,354 | 0.1% |
| Total | 41,130,802 | 433,434,831 | 445,968,532 | 314,041 | (282) | - | 28,596,819 | 28,593,422 | |
| | | | | | | | | | |
Amounts in the dividend income column in the above table include any capital gain distributions from underlying funds, which are presented in the corresponding line item in the Statement of Operations, if applicable.
Amounts in the dividend income column for Fidelity Securities Lending Cash Central Fund represents the income earned on investing cash collateral, less rebates paid to borrowers and any lending agent fees associated with the loan, plus any premium payments received for lending certain types of securities.
Amounts included in the purchases and sales proceeds columns may include in-kind transactions, if applicable.
Investment Valuation
The following is a summary of the inputs used, as of December 31, 2024, involving the Fund's assets and liabilities carried at fair value. The inputs or methodology used for valuing securities may not be an indication of the risk associated with investing in those securities. For more information on valuation inputs, and their aggregation into the levels used below, please refer to the Investment Valuation section in the accompanying Notes to Financial Statements.
| Valuation Inputs at Reporting Date: |
| Description | Total ($) | Level 1 ($) | Level 2 ($) | Level 3 ($) |
Investments in Securities: | | | | |
|
| Common Stocks | | | | |
Health Care | 1,039,748,685 | 1,038,986,909 | - | 761,776 |
|
| Convertible Corporate Bonds | | | | |
Health Care | 920,429 | - | - | 920,429 |
|
| Convertible Preferred Stocks | | | | |
Financials | 1,106,727 | - | - | 1,106,727 |
Health Care | 14,504,272 | - | - | 14,504,272 |
|
| Preferred Securities | | | | |
Health Care | 1,870,708 | - | - | 1,870,708 |
|
| Money Market Funds | 28,596,819 | 28,596,819 | - | - |
| Total Investments in Securities: | 1,086,747,640 | 1,067,583,728 | - | 19,163,912 |
| | | | | |
|
| Net Unrealized Depreciation on Unfunded Commitments | (18,795) | - | - | (18,795) |
| Total | (18,795) | - | - | (18,795) |
The following is a reconciliation of Investments in Securities for which Level 3 inputs were used in determining value. Beginning balances have been updated to conform to current period presentation, as applicable.
| |
| Investments in Securities: | |
| Beginning Balance | $ | 11,578,871 | |
| Net Realized Gain (Loss) on Investment Securities | | - | |
| Net Unrealized Gain (Loss) on Investment Securities | | (1,482,081) | |
| Cost of Purchases | | 9,067,122 | |
| Proceeds of Sales | | - | |
| Amortization/Accretion | | - | |
| Transfers into Level 3 | | - | |
| Transfers out of Level 3 | | - | |
| Ending Balance | $ | 19,163,912 | |
| The change in unrealized gain (loss) for the period attributable to Level 3 securities held at December 31, 2024 | $ | (1,482,081) | |
| The information used in the above reconciliation represents fiscal year to date activity for any Investments in Securities identified as using Level 3 inputs at either the beginning or the end of the current fiscal period. Cost of purchases and proceeds of sales may include securities received and/or delivered through in-kind transactions, corporate actions or exchanges. Transfers into Level 3 were attributable to a lack of observable market data resulting from decreases in market activity, decreases in liquidity, security restructurings or corporate actions. Transfers out of Level 3 were attributable to observable market data becoming available for those securities. Transfers in or out of Level 3 represent the beginning value of any Security or Instrument where a change in the pricing level occurred from the beginning to the end of the period. Realized and unrealized gains (losses) disclosed in the reconciliation are included in Net Gain (Loss) on the Fund's Statement of Operations. | |
Financial Statements
| Statement of Assets and Liabilities |
As of December 31, 2024 |
| Assets | | | | |
| Investment in securities, at value (including securities loaned of $22,865,012) - See accompanying schedule: | | | | |
Unaffiliated issuers (cost $705,643,226) | $ | 1,058,150,821 | | |
Fidelity Central Funds (cost $28,596,819) | | 28,596,819 | | |
| | | | | |
| | | | | |
| Total Investment in Securities (cost $734,240,045) | | | $ | 1,086,747,640 |
| Receivable for investments sold | | | | 2,072,183 |
| Receivable for fund shares sold | | | | 217,819 |
| Dividends receivable | | | | 506,638 |
| Interest receivable | | | | 92,676 |
| Distributions receivable from Fidelity Central Funds | | | | 26,562 |
| Prepaid expenses | | | | 1,176 |
| Other receivables | | | | 122,568 |
Total assets | | | | 1,089,787,262 |
| Liabilities | | | | |
| Payable for investments purchased | $ | 389,568 | | |
| Unrealized depreciation on unfunded commitments | | 18,795 | | |
| Payable for fund shares redeemed | | 455,909 | | |
| Accrued management fee | | 580,784 | | |
| Distribution and service plan fees payable | | 65,877 | | |
| Other payables and accrued expenses | | 62,520 | | |
| Collateral on securities loaned | | 23,214,978 | | |
| Total liabilities | | | | 24,788,431 |
| Commitments and contingent liabilities (see Significant Accounting Policies note) | | | | |
| Net Assets | | | $ | 1,064,998,831 |
| Net Assets consist of: | | | | |
| Paid in capital | | | $ | 642,780,292 |
| Total accumulated earnings (loss) | | | | 422,218,539 |
| Net Assets | | | $ | 1,064,998,831 |
| | | | | |
| Net Asset Value and Maximum Offering Price | | | | |
| Initial Class : | | | | |
Net Asset Value, offering price and redemption price per share ($110,555,311 ÷ 3,068,071 shares) | | | $ | 36.03 |
| Service Class 2 : | | | | |
Net Asset Value, offering price and redemption price per share ($309,392,815 ÷ 8,687,622 shares) | | | $ | 35.61 |
| Investor Class : | | | | |
Net Asset Value, offering price and redemption price per share ($645,050,705 ÷ 18,140,568 shares) | | | $ | 35.56 |
| Statement of Operations |
| Year ended December 31, 2024 |
| Investment Income | | | | |
| Dividends | | | $ | 6,619,538 |
| Interest | | | | 44,543 |
| Income from Fidelity Central Funds (including $81,716 from security lending) | | | | 314,041 |
| Total income | | | | 6,978,122 |
| Expenses | | | | |
| Management fee | $ | 7,101,271 | | |
| Transfer agent fees | | 216,985 | | |
| Distribution and service plan fees | | 781,876 | | |
| Accounting fees | | 55,922 | | |
| Custodian fees and expenses | | 49,376 | | |
| Independent trustees' fees and expenses | | 5,049 | | |
| Audit fees | | 44,597 | | |
| Legal | | 5,606 | | |
| Miscellaneous | | 26,272 | | |
| Total expenses before reductions | | 8,286,954 | | |
| Expense reductions | | (51,270) | | |
| Total expenses after reductions | | | | 8,235,684 |
| Net Investment income (loss) | | | | (1,257,562) |
| Realized and Unrealized Gain (Loss) | | | | |
| Net realized gain (loss) on: | | | | |
| Investment Securities: | | | | |
| Unaffiliated issuers | | 101,812,896 | | |
| Fidelity Central Funds | | (282) | | |
| Foreign currency transactions | | 5,610 | | |
| Total net realized gain (loss) | | | | 101,818,224 |
| Change in net unrealized appreciation (depreciation) on: | | | | |
| Investment Securities: | | | | |
| Unaffiliated issuers | | (39,744,603) | | |
| Unfunded commitments | | (18,795) | | |
| Assets and liabilities in foreign currencies | | (34,825) | | |
| Total change in net unrealized appreciation (depreciation) | | | | (39,798,223) |
| Net gain (loss) | | | | 62,020,001 |
| Net increase (decrease) in net assets resulting from operations | | | $ | 60,762,439 |
| Statement of Changes in Net Assets |
| |
| | Year ended December 31, 2024 | | Year ended December 31, 2023 |
| Increase (Decrease) in Net Assets | | | | |
| Operations | | | | |
| Net investment income (loss) | $ | (1,257,562) | $ | (1,335,295) |
| Net realized gain (loss) | | 101,818,224 | | 10,752,528 |
| Change in net unrealized appreciation (depreciation) | | (39,798,223) | | 35,314,846 |
| Net increase (decrease) in net assets resulting from operations | | 60,762,439 | | 44,732,079 |
| Share transactions - net increase (decrease) | | (141,342,473) | | (92,736,495) |
| Total increase (decrease) in net assets | | (80,580,034) | | (48,004,416) |
| | | | | |
| Net Assets | | | | |
| Beginning of period | | 1,145,578,865 | | 1,193,583,281 |
| End of period | $ | 1,064,998,831 | $ | 1,145,578,865 |
| | | | | |
| | | | | |
Financial Highlights
VIP Health Care Portfolio Initial Class |
| |
| Years ended December 31, | | 2024 | | 2023 | | 2022 | | 2021 | | 2020 |
Selected Per-Share Data | | | | | | | | | | |
| Net asset value, beginning of period | $ | 34.27 | $ | 32.87 | $ | 40.05 | $ | 38.41 | $ | 33.32 |
| Income from Investment Operations | | | | | | | | | | |
Net investment income (loss) A,B | | - C | | - C | | (.02) | | (.01) | | .06 |
| Net realized and unrealized gain (loss) | | 1.76 | | 1.40 | | (4.96) | | 4.39 | | 6.90 |
| Total from investment operations | | 1.76 | | 1.40 | | (4.98) | | 4.38 | | 6.96 |
| Distributions from net investment income | | - | | - | | - | | (.04) | | (.19) |
| Distributions from net realized gain | | - | | - | | (2.20) | | (2.71) | | (1.67) |
| Total distributions | | - | | - | | (2.20) | | (2.74) D | | (1.87) D |
| Net asset value, end of period | $ | 36.03 | $ | 34.27 | $ | 32.87 | $ | 40.05 | $ | 38.41 |
Total Return E,F | | | | 4.26% | | (12.41)% | | 11.73% | | 21.58% |
Ratios to Average Net Assets B,G,H | | | | | | | | | | |
| Expenses before reductions | | .60% | | .63% | | .63% | | .63% | | .64% |
| Expenses net of fee waivers, if any | | | | .62% | | .63% | | .63% | | .64% |
| Expenses net of all reductions | | .59% | | .62% | | .63% | | .63% | | .64% |
| Net investment income (loss) | | .01% | | (.01)% | | (.06)% | | (.04)% | | .18% |
| Supplemental Data | | | | | | | | | | |
| Net assets, end of period (000 omitted) | $ | 110,555 | $ | 121,129 | $ | 132,871 | $ | 172,092 | $ | 168,627 |
Portfolio turnover rate I | | | | 49% | | 43% | | 32% | | 51% |
ACalculated based on average shares outstanding during the period.
BNet investment income (loss) is affected by the timing of the declaration of dividends by any underlying mutual funds or exchange-traded funds (ETFs). Net investment income (loss) of any mutual funds or ETFs is not included in the Fund's net investment income (loss) ratio.
CAmount represents less than $.005 per share.
DTotal distributions per share do not sum due to rounding.
ETotal returns do not reflect charges attributable to your insurance company's separate account. Inclusion of these charges would reduce the total returns shown.
FTotal returns would have been lower if certain expenses had not been reduced during the applicable periods shown.
GFees and expenses of any underlying mutual funds or exchange-traded funds (ETFs) are not included in the Fund's expense ratio. The Fund indirectly bears its proportionate share of these expenses. For additional expense information related to investments in Fidelity Central Funds, please refer to the "Investments in Fidelity Central Funds" note found in the Notes to Financial Statements section of the most recent Annual or Semi-Annual report.
HExpense ratios reflect operating expenses of the class. Expenses before reductions do not reflect amounts reimbursed, waived, or reduced through arrangements with the investment adviser, brokerage services, or other offset arrangements, if applicable, and do not represent the amount paid by the class during periods when reimbursements, waivers or reductions occur.
IAmount does not include the portfolio activity of any underlying mutual funds or exchange-traded funds (ETFs), derivatives or securities that mature within one year from acquisition.
VIP Health Care Portfolio Service Class 2 |
| |
| Years ended December 31, | | 2024 | | 2023 | | 2022 | | 2021 | | 2020 |
Selected Per-Share Data | | | | | | | | | | |
| Net asset value, beginning of period | $ | 33.96 | $ | 32.65 | $ | 39.89 | $ | 38.29 | $ | 33.27 |
| Income from Investment Operations | | | | | | | | | | |
Net investment income (loss) A,B | | (.09) | | (.08) | | (.10) | | (.11) | | (.03) |
| Net realized and unrealized gain (loss) | | 1.74 | | 1.39 | | (4.94) | | 4.38 | | 6.88 |
| Total from investment operations | | 1.65 | | 1.31 | | (5.04) | | 4.27 | | 6.85 |
| Distributions from net investment income | | - | | - | | - | | (.02) | | (.16) |
| Distributions from net realized gain | | - | | - | | (2.20) | | (2.65) | | (1.67) |
| Total distributions | | - | | - | | (2.20) | | (2.67) | | (1.83) |
| Net asset value, end of period | $ | 35.61 | $ | 33.96 | $ | 32.65 | $ | 39.89 | $ | 38.29 |
Total Return C,D | | | | 4.01% | | (12.62)% | | 11.45% | | 21.28% |
Ratios to Average Net Assets B,E,F | | | | | | | | | | |
| Expenses before reductions | | .85% | | .88% | | .88% | | .88% | | .89% |
| Expenses net of fee waivers, if any | | | | .87% | | .88% | | .87% | | .89% |
| Expenses net of all reductions | | .85% | | .87% | | .88% | | .87% | | .88% |
| Net investment income (loss) | | (.25)% | | (.26)% | | (.31)% | | (.28)% | | (.07)% |
| Supplemental Data | | | | | | | | | | |
| Net assets, end of period (000 omitted) | $ | 309,393 | $ | 292,411 | $ | 246,472 | $ | 275,392 | $ | 143,771 |
Portfolio turnover rate G | | | | 49% | | 43% | | 32% | | 51% |
ACalculated based on average shares outstanding during the period.
BNet investment income (loss) is affected by the timing of the declaration of dividends by any underlying mutual funds or exchange-traded funds (ETFs). Net investment income (loss) of any mutual funds or ETFs is not included in the Fund's net investment income (loss) ratio.
CTotal returns do not reflect charges attributable to your insurance company's separate account. Inclusion of these charges would reduce the total returns shown.
DTotal returns would have been lower if certain expenses had not been reduced during the applicable periods shown.
EFees and expenses of any underlying mutual funds or exchange-traded funds (ETFs) are not included in the Fund's expense ratio. The Fund indirectly bears its proportionate share of these expenses. For additional expense information related to investments in Fidelity Central Funds, please refer to the "Investments in Fidelity Central Funds" note found in the Notes to Financial Statements section of the most recent Annual or Semi-Annual report.
FExpense ratios reflect operating expenses of the class. Expenses before reductions do not reflect amounts reimbursed, waived, or reduced through arrangements with the investment adviser, brokerage services, or other offset arrangements, if applicable, and do not represent the amount paid by the class during periods when reimbursements, waivers or reductions occur.
GAmount does not include the portfolio activity of any underlying mutual funds or exchange-traded funds (ETFs), derivatives or securities that mature within one year from acquisition.
VIP Health Care Portfolio Investor Class |
| |
| Years ended December 31, | | 2024 | | 2023 | | 2022 | | 2021 | | 2020 |
Selected Per-Share Data | | | | | | | | | | |
| Net asset value, beginning of period | $ | 33.85 | $ | 32.48 | $ | 39.64 | $ | 38.04 | $ | 33.02 |
| Income from Investment Operations | | | | | | | | | | |
Net investment income (loss) A,B | | (.03) | | (.03) | | (.04) | | (.04) | | .03 |
| Net realized and unrealized gain (loss) | | 1.74 | | 1.40 | | (4.92) | | 4.35 | | 6.83 |
| Total from investment operations | | 1.71 | | 1.37 | | (4.96) | | 4.31 | | 6.86 |
| Distributions from net investment income | | - | | - | | - | | (.03) | | (.17) |
| Distributions from net realized gain | | - | | - | | (2.20) | | (2.68) | | (1.67) |
| Total distributions | | - | | - | | (2.20) | | (2.71) | | (1.84) |
| Net asset value, end of period | $ | 35.56 | $ | 33.85 | $ | 32.48 | $ | 39.64 | $ | 38.04 |
Total Return C,D | | | | 4.22% | | (12.49)% | | 11.66% | | 21.49% |
Ratios to Average Net Assets B,E,F | | | | | | | | | | |
| Expenses before reductions | | .67% | | .70% | | .70% | | .70% | | .72% |
| Expenses net of fee waivers, if any | | | | .70% | | .70% | | .70% | | .72% |
| Expenses net of all reductions | | .67% | | .70% | | .70% | | .70% | | .71% |
| Net investment income (loss) | | (.07)% | | (.08)% | | (.14)% | | (.11)% | | .10% |
| Supplemental Data | | | | | | | | | | |
| Net assets, end of period (000 omitted) | $ | 645,051 | $ | 732,038 | $ | 814,240 | $ | 975,143 | $ | 914,765 |
Portfolio turnover rate G | | | | 49% | | 43% | | 32% | | 51% |
ACalculated based on average shares outstanding during the period.
BNet investment income (loss) is affected by the timing of the declaration of dividends by any underlying mutual funds or exchange-traded funds (ETFs). Net investment income (loss) of any mutual funds or ETFs is not included in the Fund's net investment income (loss) ratio.
CTotal returns do not reflect charges attributable to your insurance company's separate account. Inclusion of these charges would reduce the total returns shown.
DTotal returns would have been lower if certain expenses had not been reduced during the applicable periods shown.
EFees and expenses of any underlying mutual funds or exchange-traded funds (ETFs) are not included in the Fund's expense ratio. The Fund indirectly bears its proportionate share of these expenses. For additional expense information related to investments in Fidelity Central Funds, please refer to the "Investments in Fidelity Central Funds" note found in the Notes to Financial Statements section of the most recent Annual or Semi-Annual report.
FExpense ratios reflect operating expenses of the class. Expenses before reductions do not reflect amounts reimbursed, waived, or reduced through arrangements with the investment adviser, brokerage services, or other offset arrangements, if applicable, and do not represent the amount paid by the class during periods when reimbursements, waivers or reductions occur.
GAmount does not include the portfolio activity of any underlying mutual funds or exchange-traded funds (ETFs), derivatives or securities that mature within one year from acquisition.
Notes to Financial Statements
For the period ended December 31, 2024
1. Organization.
VIP Health Care Portfolio (the Fund) is a non-diversified fund of Variable Insurance Products Fund IV (the Trust) and is authorized to issue an unlimited number of shares. The Trust is registered under the Investment Company Act of 1940, as amended (the 1940 Act), as an open-end management investment company organized as a Massachusetts business trust. Shares of the Fund may only be purchased by insurance companies for the purpose of funding variable annuity or variable life insurance contracts. The Fund offers the following classes of shares: Initial Class shares, Service Class 2 shares and Investor Class shares. All classes have equal rights and voting privileges, except for matters affecting a single class.
2. Investments in Fidelity Central Funds.
Funds may invest in Fidelity Central Funds, which are open-end investment companies generally available only to other investment companies and accounts managed by the investment adviser and its affiliates. The Schedule of Investments lists any Fidelity Central Funds held as an investment as of period end, but does not include the underlying holdings of each Fidelity Central Fund. An investing fund indirectly bears its proportionate share of the expenses of the underlying Fidelity Central Funds.
Based on its investment objective, each Fidelity Central Fund may invest or participate in various investment vehicles or strategies that are similar to those of the investing fund. These strategies are consistent with the investment objectives of the investing fund and may involve certain economic risks which may cause a decline in value of each of the Fidelity Central Funds and thus a decline in the value of the investing fund.
| Fidelity Central Fund | Investment Manager | Investment Objective | Investment Practices | Expense RatioA |
| Fidelity Money Market Central Funds | Fidelity Management & Research Company LLC (FMR) | Each fund seeks to obtain a high level of current income consistent with the preservation of capital and liquidity. | Short-term Investments | Less than .005% |
A Expenses expressed as a percentage of average net assets and are as of each underlying Central Fund's most recent annual or semi-annual shareholder report.
A complete unaudited list of holdings for each Fidelity Central Fund is available upon request or at the Securities and Exchange Commission website at www.sec.gov. In addition, the financial statements of the Fidelity Central Funds which contain the significant accounting policies (including investment valuation policies) of those funds, and are not covered by the Report of Independent Registered Public Accounting Firm, are available on the Securities and Exchange Commission website or upon request.
3. Significant Accounting Policies.
The Fund is an investment company and applies the accounting and reporting guidance of the Financial Accounting Standards Board (FASB) Accounting Standards Codification Topic 946 Financial Services - Investment Companies. The financial statements have been prepared in conformity with accounting principles generally accepted in the United States of America (GAAP), which require management to make certain estimates and assumptions at the date of the financial statements. Actual results could differ from those estimates. The Fund operates as a single operating segment. The Fund's income, expenses, assets, and performance are regularly monitored and assessed as a whole by the investment adviser and other individuals responsible for oversight functions of the Trust, using the information presented in the financial statements and financial highlights. Subsequent events, if any, through the date that the financial statements were issued have been evaluated in the preparation of the financial statements. The Fund's Schedule of Investments lists any underlying mutual funds or exchange-traded funds (ETFs) but does not include the underlying holdings of these funds. The following summarizes the significant accounting policies of the Fund:
Investment Valuation. Investments are valued as of 4:00 p.m. Eastern time on the last calendar day of the period. The Board of Trustees (the Board) has designated the Fund's investment adviser as the valuation designee responsible for the fair valuation function and performing fair value determinations as needed. The investment adviser has established a Fair Value Committee (the Committee) to carry out the day-to-day fair valuation responsibilities and has adopted policies and procedures to govern the fair valuation process and the activities of the Committee. In accordance with these fair valuation policies and procedures, which have been approved by the Board, the Fund attempts to obtain prices from one or more third party pricing services or brokers to value its investments. When current market prices, quotations or currency exchange rates are not readily available or reliable, investments will be fair valued in good faith by the Committee, in accordance with the policies and procedures. Factors used in determining fair value vary by investment type and may include market or investment specific events, transaction data, estimated cash flows, and market observations of comparable investments. The frequency that the fair valuation procedures are used cannot be predicted and they may be utilized to a significant extent. The Committee manages the Fund's fair valuation practices and maintains the fair valuation policies and procedures. The Fund's investment adviser reports to the Board information regarding the fair valuation process and related material matters.
The Fund categorizes the inputs to valuation techniques used to value its investments into a disclosure hierarchy consisting of three levels as shown below:
Level 1 - unadjusted quoted prices in active markets for identical investments
Level 2 - other significant observable inputs (including quoted prices for similar investments, interest rates, prepayment speeds, etc.)
Level 3 - unobservable inputs (including the Fund's own assumptions based on the best information available)
Valuation techniques used to value the Fund's investments by major category are as follows:
Equity securities, including restricted securities, for which market quotations are readily available, are valued at the last reported sale price or official closing price as reported by a third party pricing service on the primary market or exchange on which they are traded and are categorized as Level 1 in the hierarchy. In the event there were no sales during the day or closing prices are not available, securities are valued at the last quoted bid price or may be valued using the last available price and are generally categorized as Level 2 in the hierarchy. For foreign equity securities, when market or security specific events arise, comparisons to the valuation of American Depositary Receipts (ADRs), futures contracts, Exchange-Traded Funds (ETFs) and certain indexes as well as quoted prices for similar securities may be used and would be categorized as Level 2 in the hierarchy. For equity securities, including restricted securities, where observable inputs are limited, assumptions about market activity and risk are used and these securities may be categorized as Level 3 in the hierarchy. Securities, including private placements or other restricted securities, for which observable inputs are not available are valued using alternate valuation approaches, including the market approach, the income approach and cost approach, and are categorized as Level 3 in the hierarchy. The market approach considers factors including the price of recent investments in the same or a similar security or financial metrics of comparable securities. The income approach considers factors including expected future cash flows, security specific risks and corresponding discount rates. The cost approach considers factors including the value of the security's underlying assets and liabilities.
Debt securities, including restricted securities, are valued based on evaluated prices received from third party pricing services or from brokers who make markets in such securities. Corporate bonds and preferred securities are valued by pricing services who utilize matrix pricing which considers yield or price of bonds of comparable quality, coupon, maturity and type or by broker-supplied prices. When independent prices are unavailable or unreliable, debt securities may be valued utilizing pricing methodologies which consider similar factors that would be used by third party pricing services. Debt securities are generally categorized as Level 2 in the hierarchy but may be Level 3 depending on the circumstances.
Investments in open-end mutual funds, including the Fidelity Central Funds, are valued at their closing net asset value (NAV) each business day and are categorized as Level 1 in the hierarchy.
The following provides information on Level 3 securities held by the Fund that were valued at period end based on unobservable inputs. These amounts exclude valuations provided by a broker.
| Asset Type | Fair Value | Valuation Technique(s) | Unobservable Input | Amount or Range/Weighted Average | Impact to Valuation from an Increase in InputA |
| Common Stocks | $761,776 | Market comparable | Enterprise value/Revenue multiple (EV/R) | 5.5 | Increase |
| | | Market approach | Transaction price | $33.33 | Increase |
| | | Black scholes | Discount rate | 4.4% | Increase |
| | | | Term | 5.0 | Increase |
| | | | Volatility | 70.0% | Increase |
| Convertible Corporate Bonds | $920,429 | Market comparable | Enterprise value/Revenue multiple (EV/R) | 6.5 | Increase |
| | | | Discount rate | 25.0% | Decrease |
| | | | Probability rate | 0.0% - 25.0% / 13.8% | Increase |
| | | Market approach | Transaction price | $100.00 | Increase |
| | | | Discount rate | 23.5% | Decrease |
| | | | Probability rate | 0.0% - 50.0% / 25.0% | Increase |
| | | Black scholes | Discount rate | 4.3% | Increase |
| | | | Term | 0.7 | Increase |
| | | | Volatility | 55.0% | Increase |
| Convertible Preferred Stocks | $15,610,999 | Market comparable | Enterprise value/Revenue multiple (EV/R) | 3.0 - 13.5 / 4.4 | Increase |
| | | Market approach | Transaction price | $1.20 - $33.33 / $13.45 | Increase |
| | | | Discount rate | 10.0% - 70.0% / 20.1% | Decrease |
| | | Black scholes | Discount rate | 4.3% - 4.4% / 4.3% | Increase |
| | | | Term | 1.5 - 5.0 / 2.8 | Increase |
| | | | Volatility | 45.0% - 90.0% / 67.3% | Increase |
| Preferred Securities | $1,870,708 | Market approach | Transaction price | $100.00 | Increase |
| | | | Discount rate | 36.1% | Decrease |
| | | | Probability rate | 0.0% - 50.0% / 25.0% | Increase |
| | | Black scholes | Discount rate | 4.3% | Increase |
| | | | Term | 2.0 | Increase |
| | | | Volatility | 70.0% | Increase |
A Represents the directional change in the fair value of the Level 3 investments that could have resulted from an increase in the corresponding input as of period end. A decrease to the unobservable input would have had the opposite effect. Significant changes in these inputs may have resulted in a significantly higher or lower fair value measurement at period end.
Changes in valuation techniques may result in transfers in or out of an assigned level within the disclosure hierarchy. The aggregate value of investments by input level as of December 31, 2024, as well as a roll forward of Level 3 investments, is included at the end of the Fund's Schedule of Investments.
Foreign Currency. Certain Funds may use foreign currency contracts to facilitate transactions in foreign-denominated securities. Gains and losses from these transactions may arise from changes in the value of the foreign currency or if the counterparties do not perform under the contracts' terms.
Foreign-denominated assets, including investment securities, and liabilities are translated into U.S. dollars at the exchange rates at period end. Purchases and sales of investment securities, income and dividends received, and expenses denominated in foreign currencies are translated into U.S. dollars at the exchange rate in effect on the transaction date.
The effects of exchange rate fluctuations on investments are included with the net realized and unrealized gain (loss) on investment securities. Other foreign currency transactions resulting in realized and unrealized gain (loss) are disclosed separately.
Investment Transactions and Income. For financial reporting purposes, the Fund's investment holdings and NAV include trades executed through the end of the last business day of the period. The NAV per share for processing shareholder transactions is calculated as of the close of business of the New York Stock Exchange (NYSE), normally 4:00 p.m. Eastern time and includes trades executed through the end of the prior business day. Gains and losses on securities sold are determined on the basis of identified cost and include proceeds received from litigation. Commissions paid to certain brokers with whom the investment adviser, or its affiliates, places trades on behalf of a fund include an amount in addition to trade execution, which may be rebated back to a fund. Any such rebates are included in net realized gain (loss) on investments in the Statement of Operations. Dividend income is recorded on the ex-dividend date, except for certain dividends from foreign securities where the ex-dividend date may have passed, which are recorded as soon as the Fund is informed of the ex-dividend date. Non-cash dividends included in dividend income, if any, are recorded at the fair market value of the securities received. Income and capital gain distributions from Fidelity Central Funds, if any, are recorded on the ex-dividend date. Interest income is accrued as earned and includes coupon interest and amortization of premium and accretion of discount on debt securities as applicable. Investment income is recorded net of foreign taxes withheld where recovery of such taxes is uncertain. Funds may file withholding tax reclaims in certain jurisdictions to recover a portion of amounts previously withheld. Any withholding tax reclaims income is included in the Statement of Operations in dividends. Any receivables for withholding tax reclaims are included in the Statement of Assets and Liabilities in dividends receivable.
Class Allocations and Expenses. Investment income, realized and unrealized capital gains and losses, common expenses of a fund, and certain fund-level expense reductions, if any, are allocated daily on a pro-rata basis to each class based on the relative net assets of each class to the total net assets of a fund. Each class differs with respect to transfer agent and distribution and service plan fees incurred, as applicable. Certain expense reductions may also differ by class, if applicable. For the reporting period, the allocated portion of income and expenses to each class as a percent of its average net assets may vary due to the timing of recording these transactions in relation to fluctuating net assets of the classes. Expenses directly attributable to a fund are charged to that fund. Expenses attributable to more than one fund are allocated among the respective funds on the basis of relative net assets or other appropriate methods. Expenses included in the accompanying financial statements reflect the expenses of that fund and do not include any expenses associated with any underlying mutual funds or exchange-traded funds (ETFs). Although not included in a fund's expenses, a fund indirectly bears its proportionate share of these expenses through the net asset value of each underlying mutual fund or exchange-traded fund (ETF). Expense estimates are accrued in the period to which they relate and adjustments are made when actual amounts are known.
Income Tax Information and Distributions to Shareholders. Each year, the Fund intends to qualify as a regulated investment company under Subchapter M of the Internal Revenue Code, including distributing substantially all of its taxable income and realized gains. As a result, no provision for U.S. Federal income taxes is required. As of December 31, 2024, the Fund did not have any unrecognized tax benefits in the financial statements; nor is the Fund aware of any tax positions for which it is reasonably possible that the total amounts of unrecognized tax benefits will significantly change in the next twelve months. The Fund files a U.S. federal tax return, in addition to state and local tax returns as required. The Fund's federal income tax returns are subject to examination by the Internal Revenue Service (IRS) for a period of three fiscal years after they are filed. State and local tax returns may be subject to examination for an additional fiscal year depending on the jurisdiction. Foreign taxes are provided for based on the Fund's understanding of the tax rules and rates that exist in the foreign markets in which it invests.
Distributions are declared and recorded on the ex-dividend date. Income and capital gain distributions are declared separately for each class. Income and capital gain distributions are determined in accordance with income tax regulations, which may differ from GAAP.
Capital accounts within the financial statements are adjusted for permanent book-tax differences. These adjustments have no impact on net assets or the results of operations. Capital accounts are not adjusted for temporary book-tax differences which will reverse in a subsequent period.
Book-tax differences are primarily due to foreign currency transactions, passive foreign investment companies (PFIC), net operating losses, capital loss carryforwards, partnerships and losses deferred due to wash sales.
As of period end, the cost and unrealized appreciation (depreciation) in securities, and derivatives if applicable, for federal income tax purposes were as follows:
| Gross unrealized appreciation | $424,021,831 |
| Gross unrealized depreciation | (75,277,514) |
| Net unrealized appreciation (depreciation) | $348,744,317 |
| Tax Cost | $738,003,323 |
The tax-based components of distributable earnings as of period end were as follows:
| Undistributed long-term capital gain | $73,497,428 |
| Net unrealized appreciation (depreciation) on securities and other investments | $348,739,906 |
Restricted Securities (including Private Placements). Funds may invest in securities that are subject to legal or contractual restrictions on resale. These securities generally may be resold in transactions exempt from registration or to the public if the securities are registered. Disposal of these securities may involve time-consuming negotiations and expense, and prompt sale at an acceptable price may be difficult. Information regarding restricted securities held at period end is included at the end of the Schedule of Investments, if applicable.
New Accounting Pronouncement. FASB Accounting Standards Update (ASU) 2023-07 Segment Reporting (Topic 280): Improvements to Reportable Segment Disclosures became effective in this reporting period. ASU 2023-07 enhances segment information disclosure in the notes to financial statements.
Commitments. A commitment is an agreement to acquire an investment at a future date (subject to conditions) in connection with a potential public or non-public offering. Commitments outstanding at period end are presented in the table below. Unrealized appreciation (depreciation) on any commitments outstanding at period end is separately presented in the Statement of Assets and Liabilities as Unrealized appreciation (depreciation) on unfunded commitments, and any change in unrealized appreciation (depreciation) on unfunded commitments during the period is separately presented in the Statement of Operations, as applicable based on contractual conditions of each commitment.
| | Investment to be Acquired | Commitment Amount ($) | Unrealized Appreciation (Depreciation)($) |
| VIP Health Care Portfolio | Jade Biosciences, Inc. | 484,704 | (18,795) |
4. Purchases and Sales of Investments.
Purchases and sales of securities, other than short-term securities and in-kind transactions, as applicable, are noted in the table below.
| | Purchases ($) | Sales ($) |
| VIP Health Care Portfolio | 511,206,102 | 651,492,121 |
5. Fees and Other Transactions with Affiliates.
Management Fee. Fidelity Management & Research Company LLC (the investment adviser) and its affiliates provide the Fund with investment management related services for which the Fund pays a monthly management fee.
Effective March 1, 2024, the Fund's management contract was amended to incorporate administrative services previously covered under separate services agreements (Transfer Agent and Accounting agreements). The amended contract incorporates a management fee rate that may vary by class. The investment adviser or an affiliate pays certain expenses of managing and operating the Fund out of each class's management fee. Each class of the Fund pays a management fee to the investment adviser. The management fee is calculated and paid to the investment adviser every month. When determining a class's management fee, a mandate rate is calculated based on the monthly average net assets of a group of funds advised by FMR within a designated asset class. A discount rate is subtracted from the mandate rate once the Fund's monthly average net assets reach a certain level. The mandate rate and discount rate may vary by class. The annual management fee rate for a class of shares of the Fund is the lesser of (1) the class's mandate rate reduced by the class's discount rate (if applicable) or (2) the amount set forth in the following table.
| | Maximum Management Fee Rate % |
| Initial Class | .58 |
| Service Class 2 | .58 |
| Investor Class | .66 |
One-twelfth of the management fee rate for a class is applied to the average net assets of the class for the month, giving a dollar amount which is the management fee for the class for that month. A different management fee rate may be applicable to each class of the Fund. The difference between classes is the result of separate arrangements for class-level services and/or waivers of certain expenses. It is not the result of any difference in advisory or custodial fees or other expenses related to the management of the Fund's assets, which do not vary by class. For the portion of the reporting period on or after March 1, 2024, the total annualized management fee rates were as follows:
| | Total Management Fee Rate % |
| Initial Class | .58 |
| Service Class 2 | .58 |
| Investor Class | .66 |
Prior to March 1, 2024, the management fee was the sum of an individual fund fee rate that was based on an annual rate of .30% of the Fund's average net assets and an annualized group fee rate that averaged .22% during the period. The group fee rate was based upon the monthly average net assets of a group of registered investment companies with which the investment adviser has management contracts. The group fee rate decreased as assets under management increased and increased as assets under management decreased. For the portion of the reporting period prior to March 1, 2024, the total annualized management fee rate was .52%.
Effective March 1, 2024, the Fund's sub-advisory agreements with FMR Investment Management (UK) Limited, Fidelity Management & Research (Hong Kong) Limited, and Fidelity Management & Research (Japan) Limited were amended to provide that the investment adviser pays each sub-adviser monthly fees equal to 110% of the sub-adviser's costs for providing sub-advisory services.
Distribution and Service Plan Fees. In accordance with Rule 12b-1 of the 1940 Act, the Fund has adopted separate 12b-1 Plans for each Service Class of shares. Each Service Class pays Fidelity Distributors Company LLC (FDC), an affiliate of the investment adviser, a service fee. For the period, the service fee is based on an annual rate of .25% of Service Class 2's average net assets.
For the period, total fees, all of which were re-allowed to insurance companies for the distribution of shares and providing shareholder support services, were as follows:
Transfer Agent Fees. Fidelity Investments Institutional Operations Company LLC (FIIOC), an affiliate of the investment adviser, is the Fund's transfer, dividend disbursing, and shareholder servicing agent. Effective March 1, 2024, the Fund's management contract was amended to incorporate transfer agent services and associated fees previously covered under a separate services agreement.
During the period January 1, 2024 through February 29, 2024, the transfer agent fees for each class were a fixed annual rate of class-level average net assets as follows:
| | Amount ($) | % of Class-Level Average Net Assets |
| Initial Class | 13,016 | .0630 |
| Service Class 2 | 31,628 | .0630 |
| Investor Class | 172,341 | .1390 |
| | 216,985 | |
Accounting Fees. Fidelity Service Company, Inc. (FSC), an affiliate of the investment adviser, maintains the Fund's accounting records. Effective March 1, 2024, the Fund's management contract was amended to incorporate accounting services and associated fees previously covered under a separate services agreement.
During the period January 1, 2024 through February 29, 2024, the accounting fees were a fixed annual rate of average net assets as follows:
| | % of Average Net Assets |
| VIP Health Care Portfolio | .0287 |
Brokerage Commissions. A portion of portfolio transactions were placed with brokerage firms which are affiliates of the investment adviser. Brokerage commissions are included in net realized gain (loss) and change in net unrealized appreciation (depreciation) in the Statement of Operations. The commissions paid to these affiliated firms were as follows:
| | Amount ($) |
| VIP Health Care Portfolio | 8,582 |
Interfund Trades. Funds may purchase from or sell securities to other Fidelity Funds under procedures adopted by the Board. The procedures have been designed to ensure these interfund trades are executed in accordance with Rule 17a-7 of the 1940 Act. Any interfund trades are included within the respective purchases and sales amounts shown in the Purchases and Sales of Investments note. Interfund trades during the period are noted in the table below.
| | Purchases ($) | Sales ($) | Realized Gain (Loss) ($) |
| VIP Health Care Portfolio | 38,368,194 | 58,057,440 | 5,014,424 |
6. Committed Line of Credit.
Certain Funds participate with other funds managed by the investment adviser or an affiliate in a $4.25 billion credit facility (the "line of credit") to be utilized for temporary or emergency purposes to fund shareholder redemptions or for other short-term liquidity purposes.
Commitment fees are charged based on the unused amount of the line of credit at an annual rate of .10%, and then allocated to each participating fund based on its pro-rata portion of the line of credit. The commitment fees are reflected in Miscellaneous expenses on the Statement of Operations, and are listed below.
Interest is charged to a participating fund based on its borrowings at an annual rate of .75% plus the highest of (i) daily SOFR plus a .10% spread adjustment, (ii) Federal Funds Effective Rate, or (iii) Overnight Bank Funding Rate. During the period, there were no borrowings on this line of credit.
The line of credit agreement will expire in March 2025 unless extended or renewed.| | Amount ($) |
| VIP Health Care Portfolio | 1,840 |
7. Security Lending.
Funds lend portfolio securities from time to time in order to earn additional income. Lending agents are used, including National Financial Services (NFS), an affiliate of the investment adviser. Pursuant to a securities lending agreement, NFS will receive a fee, which is capped at 9.9% of a fund's daily lending revenue, for its services as lending agent. A fund may lend securities to certain qualified borrowers, including NFS. On the settlement date of the loan, a fund receives collateral (in the form of U.S. Treasury obligations, letters of credit and/or cash) against the loaned securities and maintains collateral in an amount not less than 100% of the market value of the loaned securities during the period of the loan. The market value of the loaned securities is determined at the close of business of a fund and any additional required collateral is delivered to a fund on the next business day. A fund or borrower may terminate the loan at any time, and if the borrower defaults on its obligation to return the securities loaned because of insolvency or other reasons, a fund may apply collateral received from the borrower against the obligation. A fund may experience delays and costs in recovering the securities loaned. Any cash collateral received is invested in the Fidelity Securities Lending Cash Central Fund. Any loaned securities are identified as such in the Schedule of Investments, and the value of loaned securities and cash collateral at period end, as applicable, are presented in the Statement of Assets and Liabilities. Security lending income represents the income earned on investing cash collateral, less rebates paid to borrowers and any lending agent fees associated with the loan, plus any premium payments received for lending certain types of securities. Security lending income is presented in the Statement of Operations as a component of income from Fidelity Central Funds. Affiliated security lending activity, if any, was as follows:
| | Total Security Lending Fees Paid to NFS ($) | Security Lending Income From Securities Loaned to NFS ($) | Value of Securities Loaned to NFS at Period End ($) |
| VIP Health Care Portfolio | 8,884 | 182 | - |
8. Expense Reductions.
During the period the investment adviser or an affiliate reimbursed and/or waived a portion of fund-level operating expenses in the amount of $51,270.
9. Share Transactions.
Transactions for each class of shares were as follows and may contain in-kind transactions:
| | Shares | Shares | Dollars | Dollars |
| | Year ended December 31, 2024 | Year ended December 31, 2023 | Year ended December 31, 2024 | Year ended December 31, 2023 |
| VIP Health Care Portfolio | | | | |
| Initial Class | | | | |
| Shares sold | 244,009 | 212,796 | $8,778,536 | $7,025,917 |
| Shares redeemed | (710,335) | (721,068) | (25,950,391) | (23,782,024) |
| Net increase (decrease) | (466,326) | (508,272) | $(17,171,855) | $(16,756,107) |
| Service Class 2 | | | | |
| Shares sold | 1,439,718 | 1,989,981 | $51,897,828 | $64,950,522 |
| Shares redeemed | (1,363,684) | (928,292) | (49,794,229) | (30,183,005) |
| Net increase (decrease) | 76,034 | 1,061,689 | $2,103,599 | $34,767,517 |
| Investor Class | | | | |
| Shares sold | 350,420 | 481,184 | $12,633,468 | $15,968,269 |
| Shares redeemed | (3,838,419) | (3,918,715) | (138,907,685) | (126,716,174) |
| Net increase (decrease) | (3,487,999) | (3,437,531) | $(126,274,217) | $(110,747,905) |
10. Other.
A fund's organizational documents provide former and current trustees and officers with a limited indemnification against liabilities arising in connection with the performance of their duties to the fund. In the normal course of business, a fund may also enter into contracts that provide general indemnifications. A fund's maximum exposure under these arrangements is unknown as this would be dependent on future claims that may be made against a fund. The risk of material loss from such claims is considered remote.
At the end of the period, the investment adviser or its affiliates were owners of record of more than 10% and certain otherwise unaffiliated shareholders were owners of record of more than 10% of the outstanding shares as follows:
| Fund | Affiliated% | Number of Unaffiliated Shareholders | Unaffiliated Shareholders % |
| VIP Health Care Portfolio | 69% | 1 | 26% |
11. Risk and Uncertainties.
Many factors affect a fund's performance. Developments that disrupt global economies and financial markets, such as pandemics, epidemics, outbreaks of infectious diseases, war, terrorism, and environmental disasters, may significantly affect a fund's investment performance. The effects of these developments to a fund will be impacted by the types of securities in which a fund invests, the financial condition, industry, economic sector, and geographic location of an issuer, and a fund's level of investment in the securities of that issuer. Significant concentrations in security types, issuers, industries, sectors, and geographic locations may magnify the factors that affect a fund's performance.
Report of Independent Registered Public Accounting Firm
To the Board of Trustees of Variable Insurance Products Fund IV and Shareholders of VIP Health Care Portfolio
Opinion on the Financial Statements
We have audited the accompanying statement of assets and liabilities, including the schedule of investments, of VIP Health Care Portfolio (one of the funds constituting Variable Insurance Products Fund IV, referred to hereafter as the "Fund") as of December 31, 2024, the related statement of operations for the year ended December 31, 2024, the statement of changes in net assets for each of the two years in the period ended December 31, 2024, including the related notes, and the financial highlights for each of the five years in the period ended December 31, 2024 (collectively referred to as the "financial statements"). In our opinion, the financial statements present fairly, in all material respects, the financial position of the Fund as of December 31, 2024, the results of its operations for the year then ended, the changes in its net assets for each of the two years in the period ended December 31, 2024 and the financial highlights for each of the five years in the period ended December 31, 2024 in conformity with accounting principles generally accepted in the United States of America.
Basis for Opinion
These financial statements are the responsibility of the Fund's management. Our responsibility is to express an opinion on the Fund's financial statements based on our audits. We are a public accounting firm registered with the Public Company Accounting Oversight Board (United States) (PCAOB) and are required to be independent with respect to the Fund in accordance with the U.S. federal securities laws and the applicable rules and regulations of the Securities and Exchange Commission and the PCAOB.
We conducted our audits of these financial statements in accordance with the standards of the PCAOB. Those standards require that we plan and perform the audit to obtain reasonable assurance about whether the financial statements are free of material misstatement, whether due to error or fraud.
Our audits included performing procedures to assess the risks of material misstatement of the financial statements, whether due to error or fraud, and performing procedures that respond to those risks. Such procedures included examining, on a test basis, evidence regarding the amounts and disclosures in the financial statements. Our audits also included evaluating the accounting principles used and significant estimates made by management, as well as evaluating the overall presentation of the financial statements. Our procedures included confirmation of securities owned as of December 31, 2024 by correspondence with the custodian, issuers of privately offered securities and brokers; when replies were not received from brokers, we performed other auditing procedures. We believe that our audits provide a reasonable basis for our opinion.
/s/ PricewaterhouseCoopers LLP
Boston, Massachusetts
February 14, 2025
We have served as the auditor of one or more investment companies in the Fidelity group of funds since 1932.
Distributions
(Unaudited)The dividend and capital gains distributions for the fund(s) are available on Fidelity.com or Institutional.Fidelity.com.
The fund hereby designates as a capital gain dividend with respect to the taxable year ended December 31, 2024, $73,497,428, or, if subsequently determined to be different, the net capital gain of such year.
Item 8: Changes in and Disagreements with Accountants for Open-End Management Investment Companies
(Unaudited)
Note: This is not applicable for any fund included in this document.
Item 9: Proxy Disclosures for Open-End Management Investment Companies
(Unaudited)
| A special meeting of shareholders was held on July 16, 2024. The results of votes taken among shareholders on the proposal before them are reported below. Each vote reported represents one dollar of net asset value held on the record date for the meeting. |
| Proposal 1 |
| To elect a Board of Trustees. |
| | # of Votes | % of Votes |
| Bettina Doulton |
| Affirmative | 5,501,492,681.85 | 94.15 |
| Withheld | 341,991,035.05 | 5.85 |
| TOTAL | 5,843,483,716.90 | 100.00 |
| Robert A. Lawrence |
| Affirmative | 5,480,901,467.70 | 93.80 |
| Withheld | 362,582,249.20 | 6.20 |
| TOTAL | 5,843,483,716.90 | 100.00 |
| Vijay C. Advani |
| Affirmative | 5,500,352,811.04 | 94.13 |
| Withheld | 343,130,905.86 | 5.87 |
| TOTAL | 5,843,483,716.90 | 100.00 |
| Thomas P. Bostick |
| Affirmative | 5,488,165,362.69 | 93.92 |
| Withheld | 355,318,354.21 | 6.08 |
| TOTAL | 5,843,483,716.90 | 100.00 |
| Donald F. Donahue |
| Affirmative | 5,482,960,893.76 | 93.83 |
| Withheld | 360,522,823.14 | 6.17 |
| TOTAL | 5,843,483,716.90 | 100.00 |
| Vicki L. Fuller |
| Affirmative | 5,492,283,337.89 | 93.99 |
| Withheld | 351,200,379.01 | 6.01 |
| TOTAL | 5,843,483,716.90 | 100.00 |
| Patricia L. Kampling |
| Affirmative | 5,521,992,715.20 | 94.50 |
| Withheld | 321,491,001.70 | 5.50 |
| TOTAL | 5,843,483,716.90 | 100.00 |
| Thomas A. Kennedy |
| Affirmative | 5,484,789,158.10 | 93.86 |
| Withheld | 358,694,558.80 | 6.14 |
| TOTAL | 5,843,483,716.90 | 100.00 |
| Oscar Munoz |
| Affirmative | 5,497,884,744.63 | 94.09 |
| Withheld | 345,598,972.27 | 5.91 |
| TOTAL | 5,843,483,716.90 | 100.00 |
| Karen B. Peetz |
| Affirmative | 5,503,968,240.81 | 94.19 |
| Withheld | 339,515,476.09 | 5.81 |
| TOTAL | 5,843,483,716.90 | 100.00 |
| David M. Thomas |
| Affirmative | 5,466,218,204.40 | 93.54 |
| Withheld | 377,265,512.50 | 6.46 |
| TOTAL | 5,843,483,716.90 | 100.00 |
| Susan Tomasky |
| Affirmative | 5,463,402,825.36 | 93.50 |
| Withheld | 380,080,891.54 | 6.50 |
| TOTAL | 5,843,483,716.90 | 100.00 |
| Michael E. Wiley |
| Affirmative | 5,466,838,155.74 | 93.55 |
| Withheld | 376,645,561.16 | 6.45 |
| TOTAL | 5,843,483,716.90 | 100.00 |
| | | |
| Proposal 1 reflects trust-wide proposal and voting results. |
Item 10: Remuneration Paid to Directors, Officers, and others of Open-End Management Investment Companies
(Unaudited)
Note: This information is disclosed as part of the financial statements for each Fund as part of Item 7: Financial Statements and Financial Highlights for Open-End Management Investment companies.
Item 11: Statement Regarding Basis for Approval of Investment Advisory Contract
(Unaudited)
Note: This is not applicable for any fund included in this document.
1.817373.119
VHCIC-ANN-0325
Fidelity® Variable Insurance Products:
VIP Energy Portfolio
Annual Report
December 31, 2024
Contents
To view a fund's proxy voting guidelines and proxy voting record for the 12-month period ended June 30, visit http://www.fidelity.com/proxyvotingresults or visit the Securities and Exchange Commission's (SEC) web site at http://www.sec.gov.
You may also call 1-877-208-0098 to request a free copy of the proxy voting guidelines.
Fidelity® Variable Insurance Products are separate account options which are purchased through a variable insurance contract.
Standard & Poor's, S&P and S&P 500 are registered service marks of The McGraw-Hill Companies, Inc. and have been licensed for use by Fidelity Distributors Corporation.
Other third-party marks appearing herein are the property of their respective owners.
All other marks appearing herein are registered or unregistered trademarks or service marks of FMR LLC or an affiliated company. © 2025 FMR LLC. All rights reserved.
This report and the financial statements contained herein are submitted for the general information of the shareholders of the Fund. This report is not authorized for distribution to prospective investors in the Fund unless preceded or accompanied by an effective prospectus.
A fund files its complete schedule of portfolio holdings with the SEC for the first and third quarters of each fiscal year on Form N-PORT. Forms N-PORT are available on the SEC's web site at http://www.sec.gov. A fund's Forms N-PORT may be reviewed and copied at the SEC's Public Reference Room in Washington, DC. Information regarding the operation of the SEC's Public Reference Room may be obtained by calling 1-800-SEC-0330.
For a complete list of a fund's portfolio holdings, view the most recent holdings listing, semiannual report, or annual report on Fidelity's web site at http://www.fidelity.com, http://www.institutional.fidelity.com, or http://www.401k.com, as applicable.
NOT FDIC INSURED •MAY LOSE VALUE •NO BANK GUARANTEE
Neither the Fund nor Fidelity Distributors Corporation is a bank.
Item 7: Financial Statements and Financial Highlights for Open-End Management Investment Companies (Annual Report)
Schedule of Investments December 31, 2024
Showing Percentage of Net Assets
| Common Stocks - 99.7% |
| | | Shares | Value ($) |
| CANADA - 11.9% | | | |
| Energy - 11.9% | | | |
| Oil, Gas & Consumable Fuels - 11.9% | | | |
| Canadian Natural Resources Ltd | | 660,260 | 20,384,945 |
| Cenovus Energy Inc | | 1,585,900 | 24,040,322 |
| Imperial Oil Ltd | | 89,800 | 5,534,371 |
| Suncor Energy Inc | | 124,920 | 4,459,039 |
| | | | |
| TOTAL CANADA | | | 54,418,677 |
| FRANCE - 0.2% | | | |
| Energy - 0.2% | | | |
| Energy Equipment & Services - 0.2% | | | |
| Vallourec SACA (a) | | 43,000 | 731,372 |
| NORWAY - 0.2% | | | |
| Energy - 0.2% | | | |
| Energy Equipment & Services - 0.2% | | | |
| Odfjell Drilling Ltd | | 196,300 | 884,638 |
| UNITED KINGDOM - 3.6% | | | |
| Energy - 3.6% | | | |
| Energy Equipment & Services - 3.6% | | | |
| Subsea 7 SA | | 25,500 | 403,443 |
| TechnipFMC PLC | | 552,926 | 16,001,678 |
| | | | |
| TOTAL UNITED KINGDOM | | | 16,405,121 |
| UNITED STATES - 83.8% | | | |
| Energy - 79.9% | | | |
| Energy Equipment & Services - 10.0% | | | |
| Baker Hughes Co Class A | | 162,000 | 6,645,240 |
| National Energy Services Reunited Corp (a)(b) | | 980,055 | 8,781,293 |
| Noble Corp PLC | | 52,600 | 1,651,640 |
| Oceaneering International Inc (a)(b) | | 45,000 | 1,173,599 |
| Schlumberger NV | | 514,549 | 19,727,809 |
| Valaris Ltd (a)(b) | | 176,100 | 7,790,664 |
| | | | 45,770,245 |
| Oil, Gas & Consumable Fuels - 69.9% | | | |
| Antero Resources Corp (a) | | 227,460 | 7,972,473 |
| Cheniere Energy Inc | | 118,590 | 25,481,433 |
| Chevron Corp | | 168,969 | 24,473,470 |
| Chord Energy Corp | | 19,115 | 2,234,926 |
| ConocoPhillips | | 137,209 | 13,607,017 |
| Diamondback Energy Inc | | 85,200 | 13,958,316 |
| Energy Transfer LP | | 1,226,630 | 24,029,682 |
| EOG Resources Inc | | 19,502 | 2,390,555 |
| Exxon Mobil Corp | | 1,019,825 | 109,702,575 |
| Hess Corp | | 95,900 | 12,755,659 |
| Marathon Petroleum Corp | | 137,776 | 19,219,752 |
| Northern Oil & Gas Inc | | 31,350 | 1,164,966 |
| Occidental Petroleum Corp | | 319,870 | 15,804,777 |
| Ovintiv Inc | | 232,360 | 9,410,580 |
| Permian Resources Corp Class A | | 221,200 | 3,180,856 |
| Phillips 66 | | 40,832 | 4,651,990 |
| Range Resources Corp | | 190,260 | 6,845,555 |
| SM Energy Co | | 42,770 | 1,657,765 |
| Targa Resources Corp | | 28,100 | 5,015,850 |
| Valero Energy Corp | | 123,520 | 15,142,317 |
| | | | 318,700,514 |
| Industrials - 1.2% | | | |
| Machinery - 1.2% | | | |
| Chart Industries Inc (a) | | 28,800 | 5,496,192 |
| Utilities - 2.7% | | | |
| Independent Power and Renewable Electricity Producers - 2.7% | | | |
| Vistra Corp | | 90,729 | 12,508,807 |
| TOTAL UNITED STATES | | | 382,475,758 |
| TOTAL COMMON STOCKS (Cost $269,874,824) | | | 454,915,566 |
| | | | |
| Money Market Funds - 1.2% |
| | | Yield (%) | Shares | Value ($) |
| Fidelity Cash Central Fund (c) | | 4.36 | 1,125,034 | 1,125,259 |
| Fidelity Securities Lending Cash Central Fund (c)(d) | | 4.35 | 4,665,084 | 4,665,551 |
| TOTAL MONEY MARKET FUNDS (Cost $5,790,810) | | | | 5,790,810 |
| | | | | |
| TOTAL INVESTMENT IN SECURITIES - 100.9% (Cost $275,665,634) | 460,706,376 |
NET OTHER ASSETS (LIABILITIES) - (0.9)% | (4,300,235) |
| NET ASSETS - 100.0% | 456,406,141 |
| | |
Legend
| (b) | Security or a portion of the security is on loan at period end. |
| (c) | Affiliated fund that is generally available only to investment companies and other accounts managed by Fidelity Investments. The rate quoted is the annualized seven-day yield of the fund at period end. A complete unaudited listing of the fund's holdings as of its most recent quarter end is available upon request. In addition, each Fidelity Central Fund's financial statements, which are not covered by the Fund's Report of Independent Registered Public Accounting Firm, are available on the SEC's website or upon request. |
| (d) | Investment made with cash collateral received from securities on loan. |
Affiliated Central Funds
Fiscal year to date information regarding the Fund's investments in Fidelity Central Funds, including the ownership percentage, is presented below.
| Affiliate | Value, beginning of period ($) | Purchases ($) | Sales Proceeds ($) | Dividend Income ($) | Realized Gain (loss) ($) | Change in Unrealized appreciation (depreciation) ($) | Value, end of period ($) | Shares, end of period | % ownership, end of period |
| Fidelity Cash Central Fund | 556,366 | 64,376,989 | 63,807,742 | 49,889 | (354) | - | 1,125,259 | 1,125,034 | 0.0% |
| Fidelity Securities Lending Cash Central Fund | 5,445,626 | 241,601,866 | 242,381,941 | 24,120 | - | - | 4,665,551 | 4,665,084 | 0.0% |
| Total | 6,001,992 | 305,978,855 | 306,189,683 | 74,009 | (354) | - | 5,790,810 | 5,790,118 | |
| | | | | | | | | | |
Amounts in the dividend income column in the above table include any capital gain distributions from underlying funds, which are presented in the corresponding line item in the Statement of Operations, if applicable.
Amounts in the dividend income column for Fidelity Securities Lending Cash Central Fund represents the income earned on investing cash collateral, less rebates paid to borrowers and any lending agent fees associated with the loan, plus any premium payments received for lending certain types of securities.
Amounts included in the purchases and sales proceeds columns may include in-kind transactions, if applicable.
Investment Valuation
The following is a summary of the inputs used, as of December 31, 2024, involving the Fund's assets and liabilities carried at fair value. The inputs or methodology used for valuing securities may not be an indication of the risk associated with investing in those securities. For more information on valuation inputs, and their aggregation into the levels used below, please refer to the Investment Valuation section in the accompanying Notes to Financial Statements.
| Valuation Inputs at Reporting Date: |
| Description | Total ($) | Level 1 ($) | Level 2 ($) | Level 3 ($) |
Investments in Securities: | | | | |
|
| Common Stocks | | | | |
Energy | 436,910,567 | 436,910,567 | - | - |
Industrials | 5,496,192 | 5,496,192 | - | - |
Utilities | 12,508,807 | 12,508,807 | - | - |
|
| Money Market Funds | 5,790,810 | 5,790,810 | - | - |
| Total Investments in Securities: | 460,706,376 | 460,706,376 | - | - |
Financial Statements
| Statement of Assets and Liabilities |
As of December 31, 2024 |
| Assets | | | | |
| Investment in securities, at value (including securities loaned of $4,700,993) - See accompanying schedule: | | | | |
Unaffiliated issuers (cost $269,874,824) | $ | 454,915,566 | | |
Fidelity Central Funds (cost $5,790,810) | | 5,790,810 | | |
| | | | | |
| | | | | |
| Total Investment in Securities (cost $275,665,634) | | | $ | 460,706,376 |
| Foreign currency held at value (cost $155,197) | | | | 155,197 |
| Receivable for investments sold | | | | 44,201 |
| Receivable for fund shares sold | | | | 132,055 |
| Dividends receivable | | | | 496,713 |
| Distributions receivable from Fidelity Central Funds | | | | 5,756 |
| Prepaid expenses | | | | 529 |
| Other receivables | | | | 8,236 |
Total assets | | | | 461,549,063 |
| Liabilities | | | | |
| Payable for fund shares redeemed | $ | 154,291 | | |
| Accrued management fee | | 239,351 | | |
| Distribution and service plan fees payable | | 45,108 | | |
| Other payables and accrued expenses | | 40,497 | | |
| Collateral on securities loaned | | 4,663,675 | | |
| Total liabilities | | | | 5,142,922 |
| Net Assets | | | $ | 456,406,141 |
| Net Assets consist of: | | | | |
| Paid in capital | | | $ | 302,003,533 |
| Total accumulated earnings (loss) | | | | 154,402,608 |
| Net Assets | | | $ | 456,406,141 |
| | | | | |
| Net Asset Value and Maximum Offering Price | | | | |
| Initial Class : | | | | |
Net Asset Value, offering price and redemption price per share ($40,600,090 ÷ 1,611,946 shares) | | | $ | 25.19 |
| Service Class 2 : | | | | |
Net Asset Value, offering price and redemption price per share ($214,946,048 ÷ 8,587,007 shares) | | | $ | 25.03 |
| Investor Class : | | | | |
Net Asset Value, offering price and redemption price per share ($200,860,003 ÷ 7,992,786 shares) | | | $ | 25.13 |
| Statement of Operations |
| Year ended December 31, 2024 |
| Investment Income | | | | |
| Dividends | | | $ | 13,049,420 |
| Income from Fidelity Central Funds (including $24,120 from security lending) | | | | 74,009 |
| Total income | | | | 13,123,429 |
| Expenses | | | | |
| Management fee | $ | 3,111,948 | | |
| Transfer agent fees | | 84,410 | | |
| Distribution and service plan fees | | 561,386 | | |
| Accounting fees | | 28,918 | | |
| Custodian fees and expenses | | 41,641 | | |
| Independent trustees' fees and expenses | | 2,292 | | |
| Audit fees | | 41,607 | | |
| Legal | | 3,131 | | |
| Miscellaneous | | 10,453 | | |
| Total expenses before reductions | | 3,885,786 | | |
| Expense reductions | | (23,213) | | |
| Total expenses after reductions | | | | 3,862,573 |
| Net Investment income (loss) | | | | 9,260,856 |
| Realized and Unrealized Gain (Loss) | | | | |
| Net realized gain (loss) on: | | | | |
| Investment Securities: | | | | |
| Unaffiliated issuers | | 32,899,914 | | |
| Fidelity Central Funds | | (354) | | |
| Foreign currency transactions | | 5,178 | | |
| Total net realized gain (loss) | | | | 32,904,738 |
| Change in net unrealized appreciation (depreciation) on: | | | | |
| Investment Securities: | | | | |
| Unaffiliated issuers | | (20,885,153) | | |
| Assets and liabilities in foreign currencies | | (12,236) | | |
| Total change in net unrealized appreciation (depreciation) | | | | (20,897,389) |
| Net gain (loss) | | | | 12,007,349 |
| Net increase (decrease) in net assets resulting from operations | | | $ | 21,268,205 |
| Statement of Changes in Net Assets |
| |
| | Year ended December 31, 2024 | | Year ended December 31, 2023 |
| Increase (Decrease) in Net Assets | | | | |
| Operations | | | | |
| Net investment income (loss) | $ | 9,260,856 | $ | 12,392,507 |
| Net realized gain (loss) | | 32,904,738 | | 46,796,237 |
| Change in net unrealized appreciation (depreciation) | | (20,897,389) | | (72,571,176) |
| Net increase (decrease) in net assets resulting from operations | | 21,268,205 | | (13,382,432) |
| Distributions to shareholders | | (10,761,828) | | (15,602,724) |
| | | | | |
| Share transactions - net increase (decrease) | | (78,705,302) | | (224,272,519) |
| Total increase (decrease) in net assets | | (68,198,925) | | (253,257,675) |
| | | | | |
| Net Assets | | | | |
| Beginning of period | | 524,605,066 | | 777,862,741 |
| End of period | $ | 456,406,141 | $ | 524,605,066 |
| | | | | |
| | | | | |
Financial Highlights
VIP Energy Portfolio Initial Class |
| |
| Years ended December 31, | | 2024 | | 2023 | | 2022 | | 2021 | | 2020 |
Selected Per-Share Data | | | | | | | | | | |
| Net asset value, beginning of period | $ | 24.73 | $ | 25.16 | $ | 15.77 | $ | 10.41 | $ | 15.91 |
| Income from Investment Operations | | | | | | | | | | |
Net investment income (loss) A,B | | .52 | | .52 | | .69 | | .48 C | | .41 |
| Net realized and unrealized gain (loss) | | .55 | | (.27) | | 9.26 | | 5.24 | | (5.62) |
| Total from investment operations | | 1.07 | | .25 | | 9.95 | | 5.72 | | (5.21) |
| Distributions from net investment income | | (.61) | | (.68) | | (.56) | | (.36) | | (.29) |
| Total distributions | | (.61) | | (.68) | | (.56) | | (.36) | | (.29) |
| Net asset value, end of period | $ | 25.19 | $ | 24.73 | $ | 25.16 | $ | 15.77 | $ | 10.41 |
Total Return D,E | | | | .98% | | 63.18% | | 55.35% | | (32.76)% |
Ratios to Average Net Assets B,F,G | | | | | | | | | | |
| Expenses before reductions | | .60% | | .65% | | .64% | | .65% | | .69% |
| Expenses net of fee waivers, if any | | | | .64% | | .64% | | .65% | | .69% |
| Expenses net of all reductions | | .60% | | .64% | | .64% | | .65% | | .68% |
| Net investment income (loss) | | 1.94% | | 2.09% | | 3.02% | | 3.35% C | | 3.98% |
| Supplemental Data | | | | | | | | | | |
| Net assets, end of period (000 omitted) | $ | 40,600 | $ | 50,598 | $ | 101,150 | $ | 30,777 | $ | 16,336 |
Portfolio turnover rate H | | | | 24% | | 50% | | 65% | | 71% |
ACalculated based on average shares outstanding during the period.
BNet investment income (loss) is affected by the timing of the declaration of dividends by any underlying mutual funds or exchange-traded funds (ETFs). Net investment income (loss) of any mutual funds or ETFs is not included in the Fund's net investment income (loss) ratio.
CNet investment income per share reflects one or more large, non-recurring dividend(s) which amounted to $.05 per share. Excluding such non-recurring dividend(s), the ratio of net investment income (loss) to average net assets would have been 2.97%.
DTotal returns do not reflect charges attributable to your insurance company's separate account. Inclusion of these charges would reduce the total returns shown.
ETotal returns would have been lower if certain expenses had not been reduced during the applicable periods shown.
FFees and expenses of any underlying mutual funds or exchange-traded funds (ETFs) are not included in the Fund's expense ratio. The Fund indirectly bears its proportionate share of these expenses. For additional expense information related to investments in Fidelity Central Funds, please refer to the "Investments in Fidelity Central Funds" note found in the Notes to Financial Statements section of the most recent Annual or Semi-Annual report.
GExpense ratios reflect operating expenses of the class. Expenses before reductions do not reflect amounts reimbursed, waived, or reduced through arrangements with the investment adviser, brokerage services, or other offset arrangements, if applicable, and do not represent the amount paid by the class during periods when reimbursements, waivers or reductions occur.
HAmount does not include the portfolio activity of any underlying mutual funds or exchange-traded funds (ETFs), derivatives or securities that mature within one year from acquisition.
VIP Energy Portfolio Service Class 2 |
| |
| Years ended December 31, | | 2024 | | 2023 | | 2022 | | 2021 | | 2020 |
Selected Per-Share Data | | | | | | | | | | |
| Net asset value, beginning of period | $ | 24.59 | $ | 25.03 | $ | 15.69 | $ | 10.37 | $ | 15.84 |
| Income from Investment Operations | | | | | | | | | | |
Net investment income (loss) A,B | | .45 | | .46 | | .62 | | .44 C | | .37 |
| Net realized and unrealized gain (loss) | | .55 | | (.29) | | 9.23 | | 5.21 | | (5.58) |
| Total from investment operations | | 1.00 | | .17 | | 9.85 | | 5.65 | | (5.21) |
| Distributions from net investment income | | (.56) | | (.61) | | (.51) | | (.33) | | (.26) |
| Total distributions | | (.56) | | (.61) | | (.51) | | (.33) | | (.26) |
| Net asset value, end of period | $ | 25.03 | $ | 24.59 | $ | 25.03 | $ | 15.69 | $ | 10.37 |
Total Return D,E | | | | .70% | | 62.87% | | 54.83% | | (32.88)% |
Ratios to Average Net Assets B,F,G | | | | | | | | | | |
| Expenses before reductions | | .86% | | .90% | | .89% | | .90% | | .94% |
| Expenses net of fee waivers, if any | | | | .89% | | .88% | | .90% | | .94% |
| Expenses net of all reductions | | .85% | | .89% | | .88% | | .90% | | .93% |
| Net investment income (loss) | | 1.68% | | 1.84% | | 2.77% | | 3.10% C | | 3.73% |
| Supplemental Data | | | | | | | | | | |
| Net assets, end of period (000 omitted) | $ | 214,946 | $ | 214,391 | $ | 259,298 | $ | 120,827 | $ | 64,986 |
Portfolio turnover rate H | | | | 24% | | 50% | | 65% | | 71% |
ACalculated based on average shares outstanding during the period.
BNet investment income (loss) is affected by the timing of the declaration of dividends by any underlying mutual funds or exchange-traded funds (ETFs). Net investment income (loss) of any mutual funds or ETFs is not included in the Fund's net investment income (loss) ratio.
CNet investment income per share reflects one or more large, non-recurring dividend(s) which amounted to $.05 per share. Excluding such non-recurring dividend(s), the ratio of net investment income (loss) to average net assets would have been 2.72%.
DTotal returns do not reflect charges attributable to your insurance company's separate account. Inclusion of these charges would reduce the total returns shown.
ETotal returns would have been lower if certain expenses had not been reduced during the applicable periods shown.
FFees and expenses of any underlying mutual funds or exchange-traded funds (ETFs) are not included in the Fund's expense ratio. The Fund indirectly bears its proportionate share of these expenses. For additional expense information related to investments in Fidelity Central Funds, please refer to the "Investments in Fidelity Central Funds" note found in the Notes to Financial Statements section of the most recent Annual or Semi-Annual report.
GExpense ratios reflect operating expenses of the class. Expenses before reductions do not reflect amounts reimbursed, waived, or reduced through arrangements with the investment adviser, brokerage services, or other offset arrangements, if applicable, and do not represent the amount paid by the class during periods when reimbursements, waivers or reductions occur.
HAmount does not include the portfolio activity of any underlying mutual funds or exchange-traded funds (ETFs), derivatives or securities that mature within one year from acquisition.
VIP Energy Portfolio Investor Class |
| |
| Years ended December 31, | | 2024 | | 2023 | | 2022 | | 2021 | | 2020 |
Selected Per-Share Data | | | | | | | | | | |
| Net asset value, beginning of period | $ | 24.67 | $ | 25.10 | $ | 15.73 | $ | 10.39 | $ | 15.88 |
| Income from Investment Operations | | | | | | | | | | |
Net investment income (loss) A,B | | .50 | | .50 | | .67 | | .47 C | | .39 |
| Net realized and unrealized gain (loss) | | .54 | | (.27) | | 9.25 | | 5.22 | | (5.60) |
| Total from investment operations | | 1.04 | | .23 | | 9.92 | | 5.69 | | (5.21) |
| Distributions from net investment income | | (.58) | | (.66) | | (.55) | | (.35) | | (.28) |
| Total distributions | | (.58) | | (.66) | | (.55) | | (.35) | | (.28) |
| Net asset value, end of period | $ | 25.13 | $ | 24.67 | $ | 25.10 | $ | 15.73 | $ | 10.39 |
Total Return D,E | | | | .91% | | 63.13% | | 55.16% | | (32.80)% |
Ratios to Average Net Assets B,F,G | | | | | | | | | | |
| Expenses before reductions | | .68% | | .72% | | .71% | | .72% | | .76% |
| Expenses net of fee waivers, if any | | | | .72% | | .71% | | .72% | | .76% |
| Expenses net of all reductions | | .68% | | .72% | | .71% | | .72% | | .75% |
| Net investment income (loss) | | 1.86% | | 2.01% | | 2.94% | | 3.28% C | | 3.90% |
| Supplemental Data | | | | | | | | | | |
| Net assets, end of period (000 omitted) | $ | 200,860 | $ | 259,615 | $ | 417,415 | $ | 162,978 | $ | 70,268 |
Portfolio turnover rate H | | | | 24% | | 50% | | 65% | | 71% |
ACalculated based on average shares outstanding during the period.
BNet investment income (loss) is affected by the timing of the declaration of dividends by any underlying mutual funds or exchange-traded funds (ETFs). Net investment income (loss) of any mutual funds or ETFs is not included in the Fund's net investment income (loss) ratio.
CNet investment income per share reflects one or more large, non-recurring dividend(s) which amounted to $.05 per share. Excluding such non-recurring dividend(s), the ratio of net investment income (loss) to average net assets would have been 2.90%.
DTotal returns do not reflect charges attributable to your insurance company's separate account. Inclusion of these charges would reduce the total returns shown.
ETotal returns would have been lower if certain expenses had not been reduced during the applicable periods shown.
FFees and expenses of any underlying mutual funds or exchange-traded funds (ETFs) are not included in the Fund's expense ratio. The Fund indirectly bears its proportionate share of these expenses. For additional expense information related to investments in Fidelity Central Funds, please refer to the "Investments in Fidelity Central Funds" note found in the Notes to Financial Statements section of the most recent Annual or Semi-Annual report.
GExpense ratios reflect operating expenses of the class. Expenses before reductions do not reflect amounts reimbursed, waived, or reduced through arrangements with the investment adviser, brokerage services, or other offset arrangements, if applicable, and do not represent the amount paid by the class during periods when reimbursements, waivers or reductions occur.
HAmount does not include the portfolio activity of any underlying mutual funds or exchange-traded funds (ETFs), derivatives or securities that mature within one year from acquisition.
Notes to Financial Statements
For the period ended December 31, 2024
1. Organization.
VIP Energy Portfolio (the Fund) is a non-diversified fund of Variable Insurance Products Fund IV (the Trust) and is authorized to issue an unlimited number of shares. The Trust is registered under the Investment Company Act of 1940, as amended (the 1940 Act), as an open-end management investment company organized as a Massachusetts business trust. Shares of the Fund may only be purchased by insurance companies for the purpose of funding variable annuity or variable life insurance contracts. The Fund offers the following classes of shares: Initial Class shares, Service Class 2 shares and Investor Class shares. All classes have equal rights and voting privileges, except for matters affecting a single class.
2. Investments in Fidelity Central Funds.
Funds may invest in Fidelity Central Funds, which are open-end investment companies generally available only to other investment companies and accounts managed by the investment adviser and its affiliates. The Schedule of Investments lists any Fidelity Central Funds held as an investment as of period end, but does not include the underlying holdings of each Fidelity Central Fund. An investing fund indirectly bears its proportionate share of the expenses of the underlying Fidelity Central Funds.
Based on its investment objective, each Fidelity Central Fund may invest or participate in various investment vehicles or strategies that are similar to those of the investing fund. These strategies are consistent with the investment objectives of the investing fund and may involve certain economic risks which may cause a decline in value of each of the Fidelity Central Funds and thus a decline in the value of the investing fund.
| Fidelity Central Fund | Investment Manager | Investment Objective | Investment Practices | Expense RatioA |
| Fidelity Money Market Central Funds | Fidelity Management & Research Company LLC (FMR) | Each fund seeks to obtain a high level of current income consistent with the preservation of capital and liquidity. | Short-term Investments | Less than .005% |
A Expenses expressed as a percentage of average net assets and are as of each underlying Central Fund's most recent annual or semi-annual shareholder report.
A complete unaudited list of holdings for each Fidelity Central Fund is available upon request or at the Securities and Exchange Commission website at www.sec.gov. In addition, the financial statements of the Fidelity Central Funds which contain the significant accounting policies (including investment valuation policies) of those funds, and are not covered by the Report of Independent Registered Public Accounting Firm, are available on the Securities and Exchange Commission website or upon request.
3. Significant Accounting Policies.
The Fund is an investment company and applies the accounting and reporting guidance of the Financial Accounting Standards Board (FASB) Accounting Standards Codification Topic 946 Financial Services - Investment Companies. The financial statements have been prepared in conformity with accounting principles generally accepted in the United States of America (GAAP), which require management to make certain estimates and assumptions at the date of the financial statements. Actual results could differ from those estimates. The Fund operates as a single operating segment. The Fund's income, expenses, assets, and performance are regularly monitored and assessed as a whole by the investment adviser and other individuals responsible for oversight functions of the Trust, using the information presented in the financial statements and financial highlights. Subsequent events, if any, through the date that the financial statements were issued have been evaluated in the preparation of the financial statements. The Fund's Schedule of Investments lists any underlying mutual funds or exchange-traded funds (ETFs) but does not include the underlying holdings of these funds. The following summarizes the significant accounting policies of the Fund:
Investment Valuation. Investments are valued as of 4:00 p.m. Eastern time on the last calendar day of the period. The Board of Trustees (the Board) has designated the Fund's investment adviser as the valuation designee responsible for the fair valuation function and performing fair value determinations as needed. The investment adviser has established a Fair Value Committee (the Committee) to carry out the day-to-day fair valuation responsibilities and has adopted policies and procedures to govern the fair valuation process and the activities of the Committee. In accordance with these fair valuation policies and procedures, which have been approved by the Board, the Fund attempts to obtain prices from one or more third party pricing services or brokers to value its investments. When current market prices, quotations or currency exchange rates are not readily available or reliable, investments will be fair valued in good faith by the Committee, in accordance with the policies and procedures. Factors used in determining fair value vary by investment type and may include market or investment specific events, transaction data, estimated cash flows, and market observations of comparable investments. The frequency that the fair valuation procedures are used cannot be predicted and they may be utilized to a significant extent. The Committee manages the Fund's fair valuation practices and maintains the fair valuation policies and procedures. The Fund's investment adviser reports to the Board information regarding the fair valuation process and related material matters.
The Fund categorizes the inputs to valuation techniques used to value its investments into a disclosure hierarchy consisting of three levels as shown below:
Level 1 - unadjusted quoted prices in active markets for identical investments
Level 2 - other significant observable inputs (including quoted prices for similar investments, interest rates, prepayment speeds, etc.)
Level 3 - unobservable inputs (including the Fund's own assumptions based on the best information available)
Valuation techniques used to value the Fund's investments by major category are as follows:
Equity securities, including restricted securities, for which market quotations are readily available, are valued at the last reported sale price or official closing price as reported by a third party pricing service on the primary market or exchange on which they are traded and are categorized as Level 1 in the hierarchy. In the event there were no sales during the day or closing prices are not available, securities are valued at the last quoted bid price or may be valued using the last available price and are generally categorized as Level 2 in the hierarchy. For foreign equity securities, when market or security specific events arise, comparisons to the valuation of American Depositary Receipts (ADRs), futures contracts, Exchange-Traded Funds (ETFs) and certain indexes as well as quoted prices for similar securities may be used and would be categorized as Level 2 in the hierarchy. For equity securities, including restricted securities, where observable inputs are limited, assumptions about market activity and risk are used and these securities may be categorized as Level 3 in the hierarchy.
Investments in open-end mutual funds, including the Fidelity Central Funds, are valued at their closing net asset value (NAV) each business day and are categorized as Level 1 in the hierarchy.
Changes in valuation techniques may result in transfers in or out of an assigned level within the disclosure hierarchy. The aggregate value of investments by input level as of December 31, 2024 is included at the end of the Fund's Schedule of Investments.
Foreign Currency. Certain Funds may use foreign currency contracts to facilitate transactions in foreign-denominated securities. Gains and losses from these transactions may arise from changes in the value of the foreign currency or if the counterparties do not perform under the contracts' terms.
Foreign-denominated assets, including investment securities, and liabilities are translated into U.S. dollars at the exchange rates at period end. Purchases and sales of investment securities, income and dividends received, and expenses denominated in foreign currencies are translated into U.S. dollars at the exchange rate in effect on the transaction date.
The effects of exchange rate fluctuations on investments are included with the net realized and unrealized gain (loss) on investment securities. Other foreign currency transactions resulting in realized and unrealized gain (loss) are disclosed separately.
Investment Transactions and Income. For financial reporting purposes, the Fund's investment holdings and NAV include trades executed through the end of the last business day of the period. The NAV per share for processing shareholder transactions is calculated as of the close of business of the New York Stock Exchange (NYSE), normally 4:00 p.m. Eastern time and includes trades executed through the end of the prior business day. Gains and losses on securities sold are determined on the basis of identified cost and include proceeds received from litigation. Commissions paid to certain brokers with whom the investment adviser, or its affiliates, places trades on behalf of a fund include an amount in addition to trade execution, which may be rebated back to a fund. Any such rebates are included in net realized gain (loss) on investments in the Statement of Operations. Dividend income is recorded on the ex-dividend date, except for certain dividends from foreign securities where the ex-dividend date may have passed, which are recorded as soon as the Fund is informed of the ex-dividend date. Non-cash dividends included in dividend income, if any, are recorded at the fair market value of the securities received. Income and capital gain distributions from Fidelity Central Funds, if any, are recorded on the ex-dividend date. Certain distributions received by the Fund represent a return of capital or capital gain. The Fund determines the components of these distributions subsequent to the ex-dividend date, based upon receipt of tax filings or other correspondence relating to the underlying investment. These distributions are recorded as a reduction of cost of investments and/or as a realized gain. Investment income is recorded net of foreign taxes withheld where recovery of such taxes is uncertain.
Class Allocations and Expenses. Investment income, realized and unrealized capital gains and losses, common expenses of a fund, and certain fund-level expense reductions, if any, are allocated daily on a pro-rata basis to each class based on the relative net assets of each class to the total net assets of a fund. Each class differs with respect to transfer agent and distribution and service plan fees incurred, as applicable. Certain expense reductions may also differ by class, if applicable. For the reporting period, the allocated portion of income and expenses to each class as a percent of its average net assets may vary due to the timing of recording these transactions in relation to fluctuating net assets of the classes. Expenses directly attributable to a fund are charged to that fund. Expenses attributable to more than one fund are allocated among the respective funds on the basis of relative net assets or other appropriate methods. Expenses included in the accompanying financial statements reflect the expenses of that fund and do not include any expenses associated with any underlying mutual funds or exchange-traded funds (ETFs). Although not included in a fund's expenses, a fund indirectly bears its proportionate share of these expenses through the net asset value of each underlying mutual fund or exchange-traded fund (ETF). Expense estimates are accrued in the period to which they relate and adjustments are made when actual amounts are known.
Income Tax Information and Distributions to Shareholders. Each year, the Fund intends to qualify as a regulated investment company under Subchapter M of the Internal Revenue Code, including distributing substantially all of its taxable income and realized gains. As a result, no provision for U.S. Federal income taxes is required. As of December 31, 2024, the Fund did not have any unrecognized tax benefits in the financial statements; nor is the Fund aware of any tax positions for which it is reasonably possible that the total amounts of unrecognized tax benefits will significantly change in the next twelve months. The Fund files a U.S. federal tax return, in addition to state and local tax returns as required. The Fund's federal income tax returns are subject to examination by the Internal Revenue Service (IRS) for a period of three fiscal years after they are filed. State and local tax returns may be subject to examination for an additional fiscal year depending on the jurisdiction. Foreign taxes are provided for based on the Fund's understanding of the tax rules and rates that exist in the foreign markets in which it invests.
Distributions are declared and recorded on the ex-dividend date. Income and capital gain distributions are declared separately for each class. Income and capital gain distributions are determined in accordance with income tax regulations, which may differ from GAAP.
Capital accounts within the financial statements are adjusted for permanent book-tax differences. These adjustments have no impact on net assets or the results of operations. Capital accounts are not adjusted for temporary book-tax differences which will reverse in a subsequent period.
Book-tax differences are primarily due to foreign currency transactions, partnerships, capital loss carryforwards and losses deferred due to wash sales.
As of period end, the cost and unrealized appreciation (depreciation) in securities, and derivatives if applicable, for federal income tax purposes were as follows:
| Gross unrealized appreciation | $192,480,266 |
| Gross unrealized depreciation | (10,407,658) |
| Net unrealized appreciation (depreciation) | $182,072,608 |
| Tax Cost | $278,633,768 |
The tax-based components of distributable earnings as of period end were as follows:
| Undistributed ordinary income | $2,319,905 |
| Capital loss carryforward | $(29,100,930) |
| Net unrealized appreciation (depreciation) on securities and other investments | $181,183,631 |
Capital loss carryforwards are only available to offset future capital gains of the Fund to the extent provided by regulations and may be limited. The capital loss carryforward information presented below, including any applicable limitation, is estimated as of fiscal period end and is subject to adjustment.
Short-term | $(29,100,930) |
Long-term | - |
| Total capital loss carryforward | $(29,100,930) |
The tax character of distributions paid was as follows:
| | December 31, 2024 | December 31, 2023 |
| Ordinary Income | $10,761,828 | $15,602,724 |
New Accounting Pronouncement. FASB Accounting Standards Update (ASU) 2023-07 Segment Reporting (Topic 280): Improvements to Reportable Segment Disclosures became effective in this reporting period. ASU 2023-07 enhances segment information disclosure in the notes to financial statements.
4. Purchases and Sales of Investments.
Purchases and sales of securities, other than short-term securities and in-kind transactions, as applicable, are noted in the table below.
| | Purchases ($) | Sales ($) |
| VIP Energy Portfolio | 85,645,202 | 165,994,608 |
5. Fees and Other Transactions with Affiliates.
Management Fee. Fidelity Management & Research Company LLC (the investment adviser) and its affiliates provide the Fund with investment management related services for which the Fund pays a monthly management fee.
Effective March 1, 2024, the Fund's management contract was amended to incorporate administrative services previously covered under separate services agreements (Transfer Agent and Accounting agreements). The amended contract incorporates a management fee rate that may vary by class. The investment adviser or an affiliate pays certain expenses of managing and operating the Fund out of each class's management fee. Each class of the Fund pays a management fee to the investment adviser. The management fee is calculated and paid to the investment adviser every month. When determining a class's management fee, a mandate rate is calculated based on the monthly average net assets of a group of funds advised by FMR within a designated asset class. A discount rate is subtracted from the mandate rate once the Fund's monthly average net assets reach a certain level. The mandate rate and discount rate may vary by class. The annual management fee rate for a class of shares of the Fund is the lesser of (1) the class's mandate rate reduced by the class's discount rate (if applicable) or (2) the amount set forth in the following table.
| | Maximum Management Fee Rate % |
| Initial Class | .58 |
| Service Class 2 | .58 |
| Investor Class | .66 |
One-twelfth of the management fee rate for a class is applied to the average net assets of the class for the month, giving a dollar amount which is the management fee for the class for that month. A different management fee rate may be applicable to each class of the Fund. The difference between classes is the result of separate arrangements for class-level services and/or waivers of certain expenses. It is not the result of any difference in advisory or custodial fees or other expenses related to the management of the Fund's assets, which do not vary by class. For the portion of the reporting period on or after March 1, 2024, the total annualized management fee rates were as follows:
| | Total Management Fee Rate % |
| Initial Class | .58 |
| Service Class 2 | .58 |
| Investor Class | .66 |
Prior to March 1, 2024, the management fee was the sum of an individual fund fee rate that was based on an annual rate of .30% of the Fund's average net assets and an annualized group fee rate that averaged .22% during the period. The group fee rate was based upon the monthly average net assets of a group of registered investment companies with which the investment adviser has management contracts. The group fee rate decreased as assets under management increased and increased as assets under management decreased. For the portion of the reporting period prior to March 1, 2024, the total annualized management fee rate was .52%.
Effective March 1, 2024, the Fund's sub-advisory agreements with FMR Investment Management (UK) Limited, Fidelity Management & Research (Hong Kong) Limited, and Fidelity Management & Research (Japan) Limited were amended to provide that the investment adviser pays each sub-adviser monthly fees equal to 110% of the sub-adviser's costs for providing sub-advisory services.
Distribution and Service Plan Fees. In accordance with Rule 12b-1 of the 1940 Act, the Fund has adopted a separate 12b-1 Plan for Service Class 2 shares. Service Class 2 pays Fidelity Distributors Company LLC (FDC), an affiliate of the investment adviser, a service fee. For the period, the service fee is based on an annual rate of .25% of Service Class 2's average net assets.
For the period, total fees for Service Class 2, all of which was re-allowed to insurance companies for the distribution of shares and providing shareholder support services were $561,386.
Transfer Agent Fees. Fidelity Investments Institutional Operations Company LLC (FIIOC), an affiliate of the investment adviser, is the Fund's transfer, dividend disbursing, and shareholder servicing agent. Effective March 1, 2024, the Fund's management contract was amended to incorporate transfer agent services and associated fees previously covered under a separate services agreement.
During the period January 1, 2024 through February 29, 2024, the transfer agent fees for each class were a fixed annual rate of class-level average net assets as follows:
| | Amount ($) | % of Class-Level Average Net Assets |
| Initial Class | 5,071 | .0630 |
| Service Class 2 | 22,099 | .0630 |
| Investor Class | 57,240 | .1390 |
| | 84,410 | |
Accounting Fees. Fidelity Service Company, Inc. (FSC), an affiliate of the investment adviser, maintains the Fund's accounting records. Effective March 1, 2024, the Fund's management contract was amended to incorporate accounting services and associated fees previously covered under a separate services agreement.
During the period January 1, 2024 through February 29, 2024, the accounting fees were a fixed annual rate of average net assets as follows:
| | % of Average Net Assets |
| VIP Energy Portfolio | .0343 |
Brokerage Commissions. A portion of portfolio transactions were placed with brokerage firms which are affiliates of the investment adviser. Brokerage commissions are included in net realized gain (loss) and change in net unrealized appreciation (depreciation) in the Statement of Operations. The commissions paid to these affiliated firms were as follows:
| | Amount ($) |
| VIP Energy Portfolio | 3,308 |
Interfund Trades. Funds may purchase from or sell securities to other Fidelity Funds under procedures adopted by the Board. The procedures have been designed to ensure these interfund trades are executed in accordance with Rule 17a-7 of the 1940 Act. Any interfund trades are included within the respective purchases and sales amounts shown in the Purchases and Sales of Investments note. Interfund trades during the period are noted in the table below.
| | Purchases ($) | Sales ($) | Realized Gain (Loss) ($) |
| VIP Energy Portfolio | 5,171,538 | 5,058,615 | 953,812 |
6. Committed Line of Credit.
Certain Funds participate with other funds managed by the investment adviser or an affiliate in a $4.25 billion credit facility (the "line of credit") to be utilized for temporary or emergency purposes to fund shareholder redemptions or for other short-term liquidity purposes.
Commitment fees are charged based on the unused amount of the line of credit at an annual rate of .10%, and then allocated to each participating fund based on its pro-rata portion of the line of credit. The commitment fees are reflected in Miscellaneous expenses on the Statement of Operations, and are listed below.
Interest is charged to a participating fund based on its borrowings at an annual rate of .75% plus the highest of (i) daily SOFR plus a .10% spread adjustment, (ii) Federal Funds Effective Rate, or (iii) Overnight Bank Funding Rate. During the period, there were no borrowings on this line of credit.
The line of credit agreement will expire in March 2025 unless extended or renewed.
| | Amount ($) |
| VIP Energy Portfolio | 867 |
7. Security Lending.
Funds lend portfolio securities from time to time in order to earn additional income. Lending agents are used, including National Financial Services (NFS), an affiliate of the investment adviser. Pursuant to a securities lending agreement, NFS will receive a fee, which is capped at 9.9% of a fund's daily lending revenue, for its services as lending agent. A fund may lend securities to certain qualified borrowers, including NFS. On the settlement date of the loan, a fund receives collateral (in the form of U.S. Treasury obligations, letters of credit and/or cash) against the loaned securities and maintains collateral in an amount not less than 100% of the market value of the loaned securities during the period of the loan. The market value of the loaned securities is determined at the close of business of a fund and any additional required collateral is delivered to a fund on the next business day. A fund or borrower may terminate the loan at any time, and if the borrower defaults on its obligation to return the securities loaned because of insolvency or other reasons, a fund may apply collateral received from the borrower against the obligation. A fund may experience delays and costs in recovering the securities loaned. Any cash collateral received is invested in the Fidelity Securities Lending Cash Central Fund. Any loaned securities are identified as such in the Schedule of Investments, and the value of loaned securities and cash collateral at period end, as applicable, are presented in the Statement of Assets and Liabilities. Security lending income represents the income earned on investing cash collateral, less rebates paid to borrowers and any lending agent fees associated with the loan, plus any premium payments received for lending certain types of securities. Security lending income is presented in the Statement of Operations as a component of income from Fidelity Central Funds. Affiliated security lending activity, if any, was as follows:
| | Total Security Lending Fees Paid to NFS ($) | Security Lending Income From Securities Loaned to NFS ($) | Value of Securities Loaned to NFS at Period End ($) |
| VIP Energy Portfolio | 2,662 | - | - |
8. Expense Reductions.
During the period the investment adviser or an affiliate reimbursed and/or waived a portion of fund-level operating expenses in the amount of $23,213.
9. Distributions to Shareholders.
Distributions to shareholders of each class were as follows:
| | Year ended December 31, 2024 | Year ended December 31, 2023 |
| VIP Energy Portfolio | | |
| Distributions to shareholders | | |
| Initial Class | $1,052,941 | $1,754,288 |
| Service Class 2 | 4,693,702 | 5,650,488 |
| Investor Class | 5,015,185 | 8,197,948 |
Total | $10,761,828 | $15,602,724 |
10. Share Transactions.
Transactions for each class of shares were as follows and may contain in-kind transactions:
| | Shares | Shares | Dollars | Dollars |
| | Year ended December 31, 2024 | Year ended December 31, 2023 | Year ended December 31, 2024 | Year ended December 31, 2023 |
| VIP Energy Portfolio | | | | |
| Initial Class | | | | |
| Shares sold | 242,182 | 944,833 | $6,739,312 | $24,775,086 |
| Reinvestment of distributions | 41,148 | 70,770 | 1,052,941 | 1,754,288 |
| Shares redeemed | (717,682) | (2,989,083) | (18,798,653) | (72,497,431) |
| Net increase (decrease) | (434,352) | (1,973,480) | $(11,006,400) | $(45,968,057) |
| Service Class 2 | | | | |
| Shares sold | 2,122,685 | 2,558,652 | $56,304,539 | $64,485,576 |
| Reinvestment of distributions | 184,277 | 229,217 | 4,693,702 | 5,650,488 |
| Shares redeemed | (2,438,807) | (4,429,982) | (64,015,182) | (107,489,362) |
| Net increase (decrease) | (131,845) | (1,642,113) | $(3,016,941) | $(37,353,298) |
| Investor Class | | | | |
| Shares sold | 938,328 | 1,726,184 | $26,062,099 | $44,924,306 |
| Reinvestment of distributions | 196,659 | 331,500 | 5,015,185 | 8,197,948 |
| Shares redeemed | (3,666,372) | (8,160,589) | (95,759,245) | (194,073,418) |
| Net increase (decrease) | (2,531,385) | (6,102,905) | $(64,681,961) | $(140,951,164) |
11. Other.
A fund's organizational documents provide former and current trustees and officers with a limited indemnification against liabilities arising in connection with the performance of their duties to the fund. In the normal course of business, a fund may also enter into contracts that provide general indemnifications. A fund's maximum exposure under these arrangements is unknown as this would be dependent on future claims that may be made against a fund. The risk of material loss from such claims is considered remote.
At the end of the period, the investment adviser or its affiliates were owners of record of more than 10% and certain otherwise unaffiliated shareholders were owners of record of more than 10% of the outstanding shares as follows:
| Fund | Affiliated % | Number of Unaffiliated Shareholders | Unaffiliated Shareholders % |
| VIP Energy Portfolio | 52% | 1 | 26% |
12. Risk and Uncertainties.
Many factors affect a fund's performance. Developments that disrupt global economies and financial markets, such as pandemics, epidemics, outbreaks of infectious diseases, war, terrorism, and environmental disasters, may significantly affect a fund's investment performance. The effects of these developments to a fund will be impacted by the types of securities in which a fund invests, the financial condition, industry, economic sector, and geographic location of an issuer, and a fund's level of investment in the securities of that issuer. Significant concentrations in security types, issuers, industries, sectors, and geographic locations may magnify the factors that affect a fund's performance.
Report of Independent Registered Public Accounting Firm
To the Board of Trustees of Variable Insurance Products Fund IV and Shareholders of VIP Energy Portfolio
Opinion on the Financial Statements
We have audited the accompanying statement of assets and liabilities, including the schedule of investments, of VIP Energy Portfolio (one of the funds constituting Variable Insurance Products Fund IV, referred to hereafter as the "Fund") as of December 31, 2024, the related statement of operations for the year ended December 31, 2024, the statement of changes in net assets for each of the two years in the period ended December 31, 2024, including the related notes, and the financial highlights for each of the five years in the period ended December 31, 2024 (collectively referred to as the "financial statements"). In our opinion, the financial statements present fairly, in all material respects, the financial position of the Fund as of December 31, 2024, the results of its operations for the year then ended, the changes in its net assets for each of the two years in the period ended December 31, 2024 and the financial highlights for each of the five years in the period ended December 31, 2024 in conformity with accounting principles generally accepted in the United States of America.
Basis for Opinion
These financial statements are the responsibility of the Fund's management. Our responsibility is to express an opinion on the Fund's financial statements based on our audits. We are a public accounting firm registered with the Public Company Accounting Oversight Board (United States) (PCAOB) and are required to be independent with respect to the Fund in accordance with the U.S. federal securities laws and the applicable rules and regulations of the Securities and Exchange Commission and the PCAOB.
We conducted our audits of these financial statements in accordance with the standards of the PCAOB. Those standards require that we plan and perform the audit to obtain reasonable assurance about whether the financial statements are free of material misstatement, whether due to error or fraud.
Our audits included performing procedures to assess the risks of material misstatement of the financial statements, whether due to error or fraud, and performing procedures that respond to those risks. Such procedures included examining, on a test basis, evidence regarding the amounts and disclosures in the financial statements. Our audits also included evaluating the accounting principles used and significant estimates made by management, as well as evaluating the overall presentation of the financial statements. Our procedures included confirmation of securities owned as of December 31, 2024 by correspondence with the custodian and brokers. We believe that our audits provide a reasonable basis for our opinion.
/s/ PricewaterhouseCoopers LLP
Boston, Massachusetts
February 11, 2025
We have served as the auditor of one or more investment companies in the Fidelity group of funds since 1932.
Distributions
(Unaudited)The dividend and capital gains distributions for the fund(s) are available on Fidelity.com or Institutional.Fidelity.com.
Initial Class, Service Class 2, and Investor Class designate 100% of the dividends distributed during the fiscal year as qualifying for the dividends-received deduction for corporate shareholders.
Item 8: Changes in and Disagreements with Accountants for Open-End Management Investment Companies
(Unaudited)
Note: This is not applicable for any fund included in this document.
Item 9: Proxy Disclosures for Open-End Management Investment Companies
(Unaudited)
| A special meeting of shareholders was held on July 16, 2024. The results of votes taken among shareholders on the proposal before them are reported below. Each vote reported represents one dollar of net asset value held on the record date for the meeting. |
| Proposal 1 |
| To elect a Board of Trustees. |
| | # of Votes | % of Votes |
| Bettina Doulton |
| Affirmative | 5,501,492,681.85 | 94.15 |
| Withheld | 341,991,035.05 | 5.85 |
| TOTAL | 5,843,483,716.90 | 100.00 |
| Robert A. Lawrence |
| Affirmative | 5,480,901,467.70 | 93.80 |
| Withheld | 362,582,249.21 | 6.20 |
| TOTAL | 5,843,483,716.90 | 100.00 |
| Vijay C. Advani |
| Affirmative | 5,500,352,811.04 | 94.13 |
| Withheld | 343,130,905.86 | 5.87 |
| TOTAL | 5,843,483,716.90 | 100.00 |
| Thomas P. Bostick |
| Affirmative | 5,488,165,362.69 | 93.92 |
| Withheld | 355,318,354.21 | 6.08 |
| TOTAL | 5,843,483,716.90 | 100.00 |
| Donald F. Donahue |
| Affirmative | 5,482,960,893.76 | 93.83 |
| Withheld | 360,522,823.14 | 6.17 |
| TOTAL | 5,843,483,716.90 | 100.00 |
| Vicki L. Fuller |
| Affirmative | 5,492,283,337.89 | 93.99 |
| Withheld | 351,200,379.01 | 6.01 |
| TOTAL | 5,843,483,716.90 | 100.00 |
| Patricia L. Kampling |
| Affirmative | 5,521,992,715.20 | 94.50 |
| Withheld | 321,491,001.70 | 5.50 |
| TOTAL | 5,843,483,716.90 | 100.00 |
| Thomas A. Kennedy |
| Affirmative | 5,484,789,158.10 | 93.86 |
| Withheld | 358,694,558.80 | 6.14 |
| TOTAL | 5,843,483,716.90 | 100.00 |
| Oscar Munoz |
| Affirmative | 5,497,884,744.63 | 94.09 |
| Withheld | 345,598,972.27 | 5.91 |
| TOTAL | 5,843,483,716.90 | 100.00 |
| Karen B. Peetz |
| Affirmative | 5,503,968,240.81 | 94.19 |
| Withheld | 339,515,476.09 | 5.81 |
| TOTAL | 5,843,483,716.90 | 100.00 |
| David M. Thomas |
| Affirmative | 5,466,218,204.40 | 93.54 |
| Withheld | 377,265,512.50 | 6.46 |
| TOTAL | 5,843,483,716.90 | 100.00 |
| Susan Tomasky |
| Affirmative | 5,463,402,825.36 | 93.50 |
| Withheld | 380,080,891.54 | 6.50 |
| TOTAL | 5,843,483,716.90 | 100.00 |
| Michael E. Wiley |
| Affirmative | 5,466,838,155.74 | 93.55 |
| Withheld | 376,645,561.16 | 6.45 |
| TOTAL | 5,843,483,716.90 | 100.00 |
| | | |
| Proposal 1 reflects trust-wide proposal and voting results. |
Item 10: Remuneration Paid to Directors, Officers, and others of Open-End Management Investment Companies
(Unaudited)
Note: This information is disclosed as part of the financial statements for each Fund as part of Item 7: Financial Statements and Financial Highlights for Open-End Management Investment companies.
Item 11: Statement Regarding Basis for Approval of Investment Advisory Contract
(Unaudited)
Note: This is not applicable for any fund included in this document.
1.817379.119
VNRIC-ANN-0325
Fidelity® Variable Insurance Products:
VIP Financials Portfolio
Annual Report
December 31, 2024
Contents
To view a fund's proxy voting guidelines and proxy voting record for the 12-month period ended June 30, visit http://www.fidelity.com/proxyvotingresults or visit the Securities and Exchange Commission's (SEC) web site at http://www.sec.gov.
You may also call 1-877-208-0098 to request a free copy of the proxy voting guidelines.
Fidelity® Variable Insurance Products are separate account options which are purchased through a variable insurance contract.
Standard & Poor's, S&P and S&P 500 are registered service marks of The McGraw-Hill Companies, Inc. and have been licensed for use by Fidelity Distributors Corporation.
Other third-party marks appearing herein are the property of their respective owners.
All other marks appearing herein are registered or unregistered trademarks or service marks of FMR LLC or an affiliated company. © 2025 FMR LLC. All rights reserved.
This report and the financial statements contained herein are submitted for the general information of the shareholders of the Fund. This report is not authorized for distribution to prospective investors in the Fund unless preceded or accompanied by an effective prospectus.
A fund files its complete schedule of portfolio holdings with the SEC for the first and third quarters of each fiscal year on Form N-PORT. Forms N-PORT are available on the SEC's web site at http://www.sec.gov. A fund's Forms N-PORT may be reviewed and copied at the SEC's Public Reference Room in Washington, DC. Information regarding the operation of the SEC's Public Reference Room may be obtained by calling 1-800-SEC-0330.
For a complete list of a fund's portfolio holdings, view the most recent holdings listing, semiannual report, or annual report on Fidelity's web site at http://www.fidelity.com, http://www.institutional.fidelity.com, or http://www.401k.com, as applicable.
NOT FDIC INSURED •MAY LOSE VALUE •NO BANK GUARANTEE
Neither the Fund nor Fidelity Distributors Corporation is a bank.
Item 7: Financial Statements and Financial Highlights for Open-End Management Investment Companies (Annual Report)
Schedule of Investments December 31, 2024
Showing Percentage of Net Assets
| Common Stocks - 99.8% |
| | | Shares | Value ($) |
| GRAND CAYMAN (UK OVERSEAS TER) - 0.6% | | | |
| Financials - 0.6% | | | |
| Capital Markets - 0.6% | | | |
| Patria Investments Ltd Class A (a) | | 156,700 | 1,822,421 |
| MEXICO - 0.3% | | | |
| Financials - 0.3% | | | |
| Capital Markets - 0.3% | | | |
| Bolsa Mexicana de Valores SAB de CV | | 698,400 | 1,117,386 |
| PUERTO RICO - 1.5% | | | |
| Financials - 1.5% | | | |
| Banks - 1.5% | | | |
| Popular Inc | | 46,700 | 4,392,602 |
| UNITED KINGDOM - 3.6% | | | |
| Financials - 3.6% | | | |
| Insurance - 3.6% | | | |
| Beazley PLC | | 205,279 | 2,098,313 |
| Direct Line Insurance Group PLC | | 726,100 | 2,319,780 |
| Hiscox Ltd | | 271,200 | 3,676,951 |
| Lancashire Holdings Ltd | | 298,547 | 2,463,019 |
| | | | |
| TOTAL UNITED KINGDOM | | | 10,558,063 |
| UNITED STATES - 93.8% | | | |
| Financials - 92.8% | | | |
| Banks - 29.9% | | | |
| Associated Banc-Corp | | 109,300 | 2,612,270 |
| Bank of America Corp | | 332,900 | 14,630,955 |
| BOK Financial Corp | | 23,845 | 2,538,300 |
| Cadence Bank | | 34,910 | 1,202,650 |
| Citigroup Inc | | 171,200 | 12,050,768 |
| East West Bancorp Inc | | 35,500 | 3,399,480 |
| Eastern Bankshares Inc | | 165,200 | 2,849,700 |
| First Hawaiian Inc | | 71,600 | 1,858,020 |
| First Interstate BancSystem Inc Class A | | 92,169 | 2,992,727 |
| Heartland Financial USA Inc | | 14,900 | 913,445 |
| Huntington Bancshares Inc/OH | | 670 | 10,901 |
| KeyCorp | | 98,300 | 1,684,862 |
| M&T Bank Corp | | 27,430 | 5,157,114 |
| Old National Bancorp/IN | | 151,400 | 3,286,137 |
| TriCo Bancshares | | 35,100 | 1,533,870 |
| UMB Financial Corp (a) | | 26,600 | 3,002,076 |
| US Bancorp | | 116,200 | 5,557,846 |
| Wells Fargo & Co | | 257,477 | 18,085,184 |
| WesBanco Inc | | 61,700 | 2,007,718 |
| Wintrust Financial Corp | | 9,400 | 1,172,274 |
| Zions Bancorp NA | | 29,800 | 1,616,650 |
| | | | 88,162,947 |
| Capital Markets - 19.6% | | | |
| AllianceBernstein Holding LP | | 113,900 | 4,224,551 |
| Blue Owl Capital Inc Class A | | 84,200 | 1,958,492 |
| Bridge Investment Group Holdings Inc Class A | | 199,800 | 1,678,319 |
| Carlyle Group Inc/The | | 55,800 | 2,817,342 |
| Lazard Inc Class A | | 37,900 | 1,951,092 |
| LPL Financial Holdings Inc | | 20,600 | 6,726,106 |
| MarketAxess Holdings Inc | | 18,800 | 4,249,552 |
| Moody's Corp | | 9,300 | 4,402,341 |
| Morgan Stanley | | 56,400 | 7,090,608 |
| Northern Trust Corp | | 44,100 | 4,520,250 |
| Perella Weinberg Partners Class A | | 81,203 | 1,935,880 |
| Raymond James Financial Inc | | 20,550 | 3,192,032 |
| State Street Corp | | 61,600 | 6,046,040 |
| Stifel Financial Corp | | 23,800 | 2,524,704 |
| Virtu Financial Inc Class A | | 127,400 | 4,545,632 |
| | | | 57,862,941 |
| Consumer Finance - 6.8% | | | |
| Discover Financial Services | | 33,500 | 5,803,205 |
| FirstCash Holdings Inc | | 39,338 | 4,075,417 |
| OneMain Holdings Inc | | 88,500 | 4,613,505 |
| SLM Corp | | 201,000 | 5,543,580 |
| | | | 20,035,707 |
| Financial Services - 22.2% | | | |
| Apollo Global Management Inc | | 58,200 | 9,612,312 |
| Corebridge Financial Inc | | 111,300 | 3,331,209 |
| Corpay Inc (b) | | 6,100 | 2,064,362 |
| Essent Group Ltd | | 78,500 | 4,273,540 |
| Fiserv Inc (b) | | 22,200 | 4,560,324 |
| Global Payments Inc | | 29,700 | 3,328,182 |
| Mastercard Inc Class A | | 48,900 | 25,749,273 |
| NMI Holdings Inc (b) | | 16,800 | 617,568 |
| Visa Inc Class A | | 24,700 | 7,806,188 |
| Voya Financial Inc | | 62,600 | 4,308,758 |
| | | | 65,651,716 |
| Insurance - 14.3% | | | |
| American Financial Group Inc/OH | | 31,100 | 4,258,523 |
| Arthur J Gallagher & Co | | 17,200 | 4,882,220 |
| Assurant Inc | | 19,300 | 4,115,146 |
| Baldwin Insurance Group Inc/The Class A (b) | | 82,747 | 3,207,274 |
| Chubb Ltd | | 23,200 | 6,410,160 |
| Fidelity National Financial Inc/US (a) | | 35,700 | 2,004,198 |
| Marsh & McLennan Cos Inc | | 30,600 | 6,499,746 |
| Reinsurance Group of America Inc | | 51,002 | 10,895,557 |
| | | | 42,272,824 |
| Industrials - 1.0% | | | |
| Professional Services - 1.0% | | | |
| Dun & Bradstreet Holdings Inc | | 248,400 | 3,095,064 |
| TOTAL UNITED STATES | | | 277,081,199 |
| TOTAL COMMON STOCKS (Cost $213,185,958) | | | 294,971,671 |
| | | | |
| Money Market Funds - 3.0% |
| | | Yield (%) | Shares | Value ($) |
| Fidelity Cash Central Fund (c) | | 4.36 | 3,680,180 | 3,680,917 |
| Fidelity Securities Lending Cash Central Fund (c)(d) | | 4.35 | 5,263,724 | 5,264,250 |
| TOTAL MONEY MARKET FUNDS (Cost $8,945,166) | | | | 8,945,167 |
| | | | | |
| TOTAL INVESTMENT IN SECURITIES - 102.8% (Cost $222,131,124) | 303,916,838 |
NET OTHER ASSETS (LIABILITIES) - (2.8)% | (8,395,591) |
| NET ASSETS - 100.0% | 295,521,247 |
| | |
Legend
| (a) | Security or a portion of the security is on loan at period end. |
| (c) | Affiliated fund that is generally available only to investment companies and other accounts managed by Fidelity Investments. The rate quoted is the annualized seven-day yield of the fund at period end. A complete unaudited listing of the fund's holdings as of its most recent quarter end is available upon request. In addition, each Fidelity Central Fund's financial statements, which are not covered by the Fund's Report of Independent Registered Public Accounting Firm, are available on the SEC's website or upon request. |
| (d) | Investment made with cash collateral received from securities on loan. |
Affiliated Central Funds
Fiscal year to date information regarding the Fund's investments in Fidelity Central Funds, including the ownership percentage, is presented below.
| Affiliate | Value, beginning of period ($) | Purchases ($) | Sales Proceeds ($) | Dividend Income ($) | Realized Gain (loss) ($) | Change in Unrealized appreciation (depreciation) ($) | Value, end of period ($) | Shares, end of period | % ownership, end of period |
| Fidelity Cash Central Fund | 326,031 | 45,843,952 | 42,489,080 | 38,125 | 13 | 1 | 3,680,917 | 3,680,180 | 0.0% |
| Fidelity Securities Lending Cash Central Fund | - | 42,250,273 | 36,986,023 | 4,163 | - | - | 5,264,250 | 5,263,724 | 0.0% |
| Total | 326,031 | 88,094,225 | 79,475,103 | 42,288 | 13 | 1 | 8,945,167 | 8,943,904 | |
| | | | | | | | | | |
Amounts in the dividend income column in the above table include any capital gain distributions from underlying funds, which are presented in the corresponding line item in the Statement of Operations, if applicable.
Amounts in the dividend income column for Fidelity Securities Lending Cash Central Fund represents the income earned on investing cash collateral, less rebates paid to borrowers and any lending agent fees associated with the loan, plus any premium payments received for lending certain types of securities.
Amounts included in the purchases and sales proceeds columns may include in-kind transactions, if applicable.
Investment Valuation
The following is a summary of the inputs used, as of December 31, 2024, involving the Fund's assets and liabilities carried at fair value. The inputs or methodology used for valuing securities may not be an indication of the risk associated with investing in those securities. For more information on valuation inputs, and their aggregation into the levels used below, please refer to the Investment Valuation section in the accompanying Notes to Financial Statements.
| Valuation Inputs at Reporting Date: |
| Description | Total ($) | Level 1 ($) | Level 2 ($) | Level 3 ($) |
Investments in Securities: | | | | |
|
| Common Stocks | | | | |
Financials | 291,876,607 | 291,876,607 | - | - |
Industrials | 3,095,064 | 3,095,064 | - | - |
|
| Money Market Funds | 8,945,167 | 8,945,167 | - | - |
| Total Investments in Securities: | 303,916,838 | 303,916,838 | - | - |
Financial Statements
| Statement of Assets and Liabilities |
As of December 31, 2024 |
| Assets | | | | |
| Investment in securities, at value (including securities loaned of $5,157,174) - See accompanying schedule: | | | | |
Unaffiliated issuers (cost $213,185,958) | $ | 294,971,671 | | |
Fidelity Central Funds (cost $8,945,166) | | 8,945,167 | | |
| | | | | |
| | | | | |
| Total Investment in Securities (cost $222,131,124) | | | $ | 303,916,838 |
| Receivable for fund shares sold | | | | 68,873 |
| Dividends receivable | | | | 184,081 |
| Distributions receivable from Fidelity Central Funds | | | | 5,233 |
| Prepaid expenses | | | | 242 |
| Other receivables | | | | 211 |
Total assets | | | | 304,175,478 |
| Liabilities | | | | |
| Payable for investments purchased | $ | 2,516,002 | | |
| Payable for fund shares redeemed | | 664,846 | | |
| Accrued management fee | | 162,351 | | |
| Distribution and service plan fees payable | | 496 | | |
| Other payables and accrued expenses | | 46,286 | | |
| Collateral on securities loaned | | 5,264,250 | | |
| Total liabilities | | | | 8,654,231 |
| Net Assets | | | $ | 295,521,247 |
| Net Assets consist of: | | | | |
| Paid in capital | | | $ | 204,589,846 |
| Total accumulated earnings (loss) | | | | 90,931,401 |
| Net Assets | | | $ | 295,521,247 |
| | | | | |
| Net Asset Value and Maximum Offering Price | | | | |
| Initial Class : | | | | |
Net Asset Value, offering price and redemption price per share ($33,782,534 ÷ 1,789,957 shares) | | | $ | 18.87 |
| Service Class 2 : | | | | |
Net Asset Value, offering price and redemption price per share ($2,532,974 ÷ 134,808 shares) | | | $ | 18.79 |
| Investor Class : | | | | |
Net Asset Value, offering price and redemption price per share ($259,205,739 ÷ 13,827,657 shares) | | | $ | 18.75 |
| Statement of Operations |
| Year ended December 31, 2024 |
| Investment Income | | | | |
| Dividends | | | $ | 5,919,528 |
| Income from Fidelity Central Funds (including $4,163 from security lending) | | | | 42,288 |
| Total income | | | | 5,961,816 |
| Expenses | | | | |
| Management fee | $ | 1,456,735 | | |
| Transfer agent fees | | 44,396 | | |
| Distribution and service plan fees | | 2,490 | | |
| Accounting fees | | 12,058 | | |
| Custodian fees and expenses | | 25,850 | | |
| Independent trustees' fees and expenses | | 948 | | |
| Audit fees | | 43,437 | | |
| Legal | | 1,149 | | |
| Miscellaneous | | 4,949 | | |
| Total expenses before reductions | | 1,592,012 | | |
| Expense reductions | | (8,798) | | |
| Total expenses after reductions | | | | 1,583,214 |
| Net Investment income (loss) | | | | 4,378,602 |
| Realized and Unrealized Gain (Loss) | | | | |
| Net realized gain (loss) on: | | | | |
| Investment Securities: | | | | |
| Unaffiliated issuers | | 14,443,267 | | |
| Fidelity Central Funds | | 13 | | |
| Foreign currency transactions | | (1,897) | | |
| Total net realized gain (loss) | | | | 14,441,383 |
| Change in net unrealized appreciation (depreciation) on: | | | | |
| Investment Securities: | | | | |
| Unaffiliated issuers | | 44,401,573 | | |
| Fidelity Central Funds | | 1 | | |
| Assets and liabilities in foreign currencies | | (688) | | |
| Total change in net unrealized appreciation (depreciation) | | | | 44,400,886 |
| Net gain (loss) | | | | 58,842,269 |
| Net increase (decrease) in net assets resulting from operations | | | $ | 63,220,871 |
| Statement of Changes in Net Assets |
| |
| | Year ended December 31, 2024 | | Year ended December 31, 2023 |
| Increase (Decrease) in Net Assets | | | | |
| Operations | | | | |
| Net investment income (loss) | $ | 4,378,602 | $ | 4,513,681 |
| Net realized gain (loss) | | 14,441,383 | | 4,284,448 |
| Change in net unrealized appreciation (depreciation) | | 44,400,886 | | 13,124,715 |
| Net increase (decrease) in net assets resulting from operations | | 63,220,871 | | 21,922,844 |
| Distributions to shareholders | | (13,571,578) | | (14,638,713) |
| | | | | |
| Share transactions - net increase (decrease) | | 43,779,566 | | (31,707,438) |
| Total increase (decrease) in net assets | | 93,428,859 | | (24,423,307) |
| | | | | |
| Net Assets | | | | |
| Beginning of period | | 202,092,388 | | 226,515,695 |
| End of period | $ | 295,521,247 | $ | 202,092,388 |
| | | | | |
| | | | | |
Financial Highlights
VIP Financials Portfolio Initial Class |
| |
| Years ended December 31, | | 2024 | | 2023 | | 2022 | | 2021 | | 2020 |
Selected Per-Share Data | | | | | | | | | | |
| Net asset value, beginning of period | $ | 15.02 | $ | 14.01 | $ | 15.82 | $ | 12.38 | $ | 13.62 |
| Income from Investment Operations | | | | | | | | | | |
Net investment income (loss) A,B | | .33 | | .33 | | .30 | | .32 | | .26 |
| Net realized and unrealized gain (loss) | | 4.47 | | 1.68 | | (1.57) | | 3.71 | | (.16) |
| Total from investment operations | | 4.80 | | 2.01 | | (1.27) | | 4.03 | | .10 |
| Distributions from net investment income | | (.30) | | (.37) | | (.29) | | (.27) | | (.26) |
| Distributions from net realized gain | | (.65) | | (.62) | | (.25) | | (.32) | | (1.08) |
| Total distributions | | (.95) | | (1.00) C | | (.54) | | (.59) | | (1.34) |
| Net asset value, end of period | $ | 18.87 | $ | 15.02 | $ | 14.01 | $ | 15.82 | $ | 12.38 |
Total Return D,E | | | | 14.73% | | (8.33)% | | 33.19% | | .77% |
Ratios to Average Net Assets B,F,G | | | | | | | | | | |
| Expenses before reductions | | .62% | | .67% | | .65% | | .65% | | .69% |
| Expenses net of fee waivers, if any | | | | .66% | | .65% | | .65% | | .69% |
| Expenses net of all reductions | | .62% | | .66% | | .65% | | .65% | | .68% |
| Net investment income (loss) | | 1.97% | | 2.44% | | 2.06% | | 2.08% | | 2.47% |
| Supplemental Data | | | | | | | | | | |
| Net assets, end of period (000 omitted) | $ | 33,783 | $ | 23,853 | $ | 29,116 | $ | 35,491 | $ | 20,134 |
Portfolio turnover rate H | | | | 56% | | 53% | | 40% | | 68% |
ACalculated based on average shares outstanding during the period.
BNet investment income (loss) is affected by the timing of the declaration of dividends by any underlying mutual funds or exchange-traded funds (ETFs). Net investment income (loss) of any mutual funds or ETFs is not included in the Fund's net investment income (loss) ratio.
CTotal distributions per share do not sum due to rounding.
DTotal returns do not reflect charges attributable to your insurance company's separate account. Inclusion of these charges would reduce the total returns shown.
ETotal returns would have been lower if certain expenses had not been reduced during the applicable periods shown.
FFees and expenses of any underlying mutual funds or exchange-traded funds (ETFs) are not included in the Fund's expense ratio. The Fund indirectly bears its proportionate share of these expenses. For additional expense information related to investments in Fidelity Central Funds, please refer to the "Investments in Fidelity Central Funds" note found in the Notes to Financial Statements section of the most recent Annual or Semi-Annual report.
GExpense ratios reflect operating expenses of the class. Expenses before reductions do not reflect amounts reimbursed, waived, or reduced through arrangements with the investment adviser, brokerage services, or other offset arrangements, if applicable, and do not represent the amount paid by the class during periods when reimbursements, waivers or reductions occur.
HAmount does not include the portfolio activity of any underlying mutual funds or exchange-traded funds (ETFs), derivatives or securities that mature within one year from acquisition.
VIP Financials Portfolio Service Class 2 |
| |
| Years ended December 31, | | 2024 | | 2023 A |
Selected Per-Share Data | | | | |
| Net asset value, beginning of period | $ | 15.00 | $ | 13.36 |
| Income from Investment Operations | | | | |
Net investment income (loss) B,C | | .30 | | .12 |
| Net realized and unrealized gain (loss) | | 4.45 | | 1.82 |
| Total from investment operations | | 4.75 | | 1.94 |
| Distributions from net investment income | | (.32) | | (.30) |
| Distributions from net realized gain | | (.65) | | - |
| Total distributions | | (.96) D | | (.30) |
| Net asset value, end of period | $ | 18.79 | $ | 15.00 |
Total Return E,F,G | | | | 14.69% |
Ratios to Average Net Assets C,H,I | | | | |
| Expenses before reductions | | .86% | | .92% J |
| Expenses net of fee waivers, if any | | | | .92% J |
| Expenses net of all reductions | | .86% | | .92% J |
| Net investment income (loss) | | 1.73% | | 2.30% J |
| Supplemental Data | | | | |
| Net assets, end of period (000 omitted) | $ | 2,533 | $ | 190 |
Portfolio turnover rate K | | | | 56% |
AFor the period August 16, 2023 (commencement of sale of shares) through December 31, 2023.
BCalculated based on average shares outstanding during the period.
CNet investment income (loss) is affected by the timing of the declaration of dividends by any underlying mutual funds or exchange-traded funds (ETFs). Net investment income (loss) of any mutual funds or ETFs is not included in the Fund's net investment income (loss) ratio.
DTotal distributions per share do not sum due to rounding.
ETotal returns for periods of less than one year are not annualized.
FTotal returns do not reflect charges attributable to your insurance company's separate account. Inclusion of these charges would reduce the total returns shown.
GTotal returns would have been lower if certain expenses had not been reduced during the applicable periods shown.
HFees and expenses of any underlying mutual funds or exchange-traded funds (ETFs) are not included in the Fund's expense ratio. The Fund indirectly bears its proportionate share of these expenses. For additional expense information related to investments in Fidelity Central Funds, please refer to the "Investments in Fidelity Central Funds" note found in the Notes to Financial Statements section of the most recent Annual or Semi-Annual report.
IExpense ratios reflect operating expenses of the class. Expenses before reductions do not reflect amounts reimbursed, waived, or reduced through arrangements with the investment adviser, brokerage services, or other offset arrangements, if applicable, and do not represent the amount paid by the class during periods when reimbursements, waivers or reductions occur.
JAnnualized.
KAmount does not include the portfolio activity of any underlying mutual funds or exchange-traded funds (ETFs), derivatives or securities that mature within one year from acquisition.
VIP Financials Portfolio Investor Class |
| |
| Years ended December 31, | | 2024 | | 2023 | | 2022 | | 2021 | | 2020 |
Selected Per-Share Data | | | | | | | | | | |
| Net asset value, beginning of period | $ | 14.92 | $ | 13.93 | $ | 15.73 | $ | 12.31 | $ | 13.56 |
| Income from Investment Operations | | | | | | | | | | |
Net investment income (loss) A,B | | .32 | | .32 | | .29 | | .30 | | .25 |
| Net realized and unrealized gain (loss) | | 4.45 | | 1.65 | | (1.56) | | 3.70 | | (.16) |
| Total from investment operations | | 4.77 | | 1.97 | | (1.27) | | 4.00 | | .09 |
| Distributions from net investment income | | (.29) | | (.36) | | (.28) | | (.26) | | (.25) |
| Distributions from net realized gain | | (.65) | | (.62) | | (.25) | | (.32) | | (1.08) |
| Total distributions | | (.94) | | (.98) | | (.53) | | (.58) | | (1.34) C |
| Net asset value, end of period | $ | 18.75 | $ | 14.92 | $ | 13.93 | $ | 15.73 | $ | 12.31 |
Total Return D,E | | | | 14.57% | | (8.37)% | | 33.14% | | .63% |
Ratios to Average Net Assets B,F,G | | | | | | | | | | |
| Expenses before reductions | | .70% | | .75% | | .73% | | .72% | | .76% |
| Expenses net of fee waivers, if any | | | | .74% | | .73% | | .72% | | .76% |
| Expenses net of all reductions | | .69% | | .74% | | .73% | | .72% | | .75% |
| Net investment income (loss) | | 1.89% | | 2.37% | | 1.99% | | 2.01% | | 2.39% |
| Supplemental Data | | | | | | | | | | |
| Net assets, end of period (000 omitted) | $ | 259,206 | $ | 178,049 | $ | 197,400 | $ | 246,455 | $ | 121,359 |
Portfolio turnover rate H | | | | 56% | | 53% | | 40% | | 68% |
ACalculated based on average shares outstanding during the period.
BNet investment income (loss) is affected by the timing of the declaration of dividends by any underlying mutual funds or exchange-traded funds (ETFs). Net investment income (loss) of any mutual funds or ETFs is not included in the Fund's net investment income (loss) ratio.
CTotal distributions per share do not sum due to rounding.
DTotal returns do not reflect charges attributable to your insurance company's separate account. Inclusion of these charges would reduce the total returns shown.
ETotal returns would have been lower if certain expenses had not been reduced during the applicable periods shown.
FFees and expenses of any underlying mutual funds or exchange-traded funds (ETFs) are not included in the Fund's expense ratio. The Fund indirectly bears its proportionate share of these expenses. For additional expense information related to investments in Fidelity Central Funds, please refer to the "Investments in Fidelity Central Funds" note found in the Notes to Financial Statements section of the most recent Annual or Semi-Annual report.
GExpense ratios reflect operating expenses of the class. Expenses before reductions do not reflect amounts reimbursed, waived, or reduced through arrangements with the investment adviser, brokerage services, or other offset arrangements, if applicable, and do not represent the amount paid by the class during periods when reimbursements, waivers or reductions occur.
HAmount does not include the portfolio activity of any underlying mutual funds or exchange-traded funds (ETFs), derivatives or securities that mature within one year from acquisition.
Notes to Financial Statements
For the period ended December 31, 2024
1. Organization.
VIP Financials Portfolio (the Fund) is a fund of Variable Insurance Products Fund IV (the Trust) and is authorized to issue an unlimited number of shares. The Trust is registered under the Investment Company Act of 1940, as amended (the 1940 Act), as an open-end management investment company organized as a Massachusetts business trust. Shares of the Fund may only be purchased by insurance companies for the purpose of funding variable annuity or variable life insurance contracts. The Fund offers the following classes of shares: Initial Class shares, Service Class 2 shares and Investor Class shares. All classes have equal rights and voting privileges, except for matters affecting a single class.
2. Investments in Fidelity Central Funds.
Funds may invest in Fidelity Central Funds, which are open-end investment companies generally available only to other investment companies and accounts managed by the investment adviser and its affiliates. The Schedule of Investments lists any Fidelity Central Funds held as an investment as of period end, but does not include the underlying holdings of each Fidelity Central Fund. An investing fund indirectly bears its proportionate share of the expenses of the underlying Fidelity Central Funds.
Based on its investment objective, each Fidelity Central Fund may invest or participate in various investment vehicles or strategies that are similar to those of the investing fund. These strategies are consistent with the investment objectives of the investing fund and may involve certain economic risks which may cause a decline in value of each of the Fidelity Central Funds and thus a decline in the value of the investing fund.
| Fidelity Central Fund | Investment Manager | Investment Objective | Investment Practices | Expense RatioA |
| Fidelity Money Market Central Funds | Fidelity Management & Research Company LLC (FMR) | Each fund seeks to obtain a high level of current income consistent with the preservation of capital and liquidity. | Short-term Investments | Less than .005% |
A Expenses expressed as a percentage of average net assets and are as of each underlying Central Fund's most recent annual or semi-annual shareholder report.
A complete unaudited list of holdings for each Fidelity Central Fund is available upon request or at the Securities and Exchange Commission website at www.sec.gov. In addition, the financial statements of the Fidelity Central Funds which contain the significant accounting policies (including investment valuation policies) of those funds, and are not covered by the Report of Independent Registered Public Accounting Firm, are available on the Securities and Exchange Commission website or upon request.
3. Significant Accounting Policies.
The Fund is an investment company and applies the accounting and reporting guidance of the Financial Accounting Standards Board (FASB) Accounting Standards Codification Topic 946 Financial Services - Investment Companies. The financial statements have been prepared in conformity with accounting principles generally accepted in the United States of America (GAAP), which require management to make certain estimates and assumptions at the date of the financial statements. Actual results could differ from those estimates. The Fund operates as a single operating segment. The Fund's income, expenses, assets, and performance are regularly monitored and assessed as a whole by the investment adviser and other individuals responsible for oversight functions of the Trust, using the information presented in the financial statements and financial highlights. Subsequent events, if any, through the date that the financial statements were issued have been evaluated in the preparation of the financial statements. The Fund's Schedule of Investments lists any underlying mutual funds or exchange-traded funds (ETFs) but does not include the underlying holdings of these funds. The following summarizes the significant accounting policies of the Fund:
Investment Valuation. Investments are valued as of 4:00 p.m. Eastern time on the last calendar day of the period. The Board of Trustees (the Board) has designated the Fund's investment adviser as the valuation designee responsible for the fair valuation function and performing fair value determinations as needed. The investment adviser has established a Fair Value Committee (the Committee) to carry out the day-to-day fair valuation responsibilities and has adopted policies and procedures to govern the fair valuation process and the activities of the Committee. In accordance with these fair valuation policies and procedures, which have been approved by the Board, the Fund attempts to obtain prices from one or more third party pricing services or brokers to value its investments. When current market prices, quotations or currency exchange rates are not readily available or reliable, investments will be fair valued in good faith by the Committee, in accordance with the policies and procedures. Factors used in determining fair value vary by investment type and may include market or investment specific events, transaction data, estimated cash flows, and market observations of comparable investments. The frequency that the fair valuation procedures are used cannot be predicted and they may be utilized to a significant extent. The Committee manages the Fund's fair valuation practices and maintains the fair valuation policies and procedures. The Fund's investment adviser reports to the Board information regarding the fair valuation process and related material matters.
The Fund categorizes the inputs to valuation techniques used to value its investments into a disclosure hierarchy consisting of three levels as shown below:
Level 1 - unadjusted quoted prices in active markets for identical investments
Level 2 - other significant observable inputs (including quoted prices for similar investments, interest rates, prepayment speeds, etc.)
Level 3 - unobservable inputs (including the Fund's own assumptions based on the best information available)
Valuation techniques used to value the Fund's investments by major category are as follows:
Equity securities, including restricted securities, for which market quotations are readily available, are valued at the last reported sale price or official closing price as reported by a third party pricing service on the primary market or exchange on which they are traded and are categorized as Level 1 in the hierarchy. In the event there were no sales during the day or closing prices are not available, securities are valued at the last quoted bid price or may be valued using the last available price and are generally categorized as Level 2 in the hierarchy. For foreign equity securities, when market or security specific events arise, comparisons to the valuation of American Depositary Receipts (ADRs), futures contracts, Exchange-Traded Funds (ETFs) and certain indexes as well as quoted prices for similar securities may be used and would be categorized as Level 2 in the hierarchy. For equity securities, including restricted securities, where observable inputs are limited, assumptions about market activity and risk are used and these securities may be categorized as Level 3 in the hierarchy.
Investments in open-end mutual funds, including the Fidelity Central Funds, are valued at their closing net asset value (NAV) each business day and are categorized as Level 1 in the hierarchy.
Changes in valuation techniques may result in transfers in or out of an assigned level within the disclosure hierarchy. The aggregate value of investments by input level as of December 31, 2024 is included at the end of the Fund's Schedule of Investments.
Foreign Currency. Certain Funds may use foreign currency contracts to facilitate transactions in foreign-denominated securities. Gains and losses from these transactions may arise from changes in the value of the foreign currency or if the counterparties do not perform under the contracts' terms.
Foreign-denominated assets, including investment securities, and liabilities are translated into U.S. dollars at the exchange rates at period end. Purchases and sales of investment securities, income and dividends received, and expenses denominated in foreign currencies are translated into U.S. dollars at the exchange rate in effect on the transaction date.
The effects of exchange rate fluctuations on investments are included with the net realized and unrealized gain (loss) on investment securities. Other foreign currency transactions resulting in realized and unrealized gain (loss) are disclosed separately.
Investment Transactions and Income. For financial reporting purposes, the Fund's investment holdings and NAV include trades executed through the end of the last business day of the period. The NAV per share for processing shareholder transactions is calculated as of the close of business of the New York Stock Exchange (NYSE), normally 4:00 p.m. Eastern time and includes trades executed through the end of the prior business day. Gains and losses on securities sold are determined on the basis of identified cost and include proceeds received from litigation. Commissions paid to certain brokers with whom the investment adviser, or its affiliates, places trades on behalf of a fund include an amount in addition to trade execution, which may be rebated back to a fund. Any such rebates are included in net realized gain (loss) on investments in the Statement of Operations. Dividend income is recorded on the ex-dividend date, except for certain dividends from foreign securities where the ex-dividend date may have passed, which are recorded as soon as the Fund is informed of the ex-dividend date. Non-cash dividends included in dividend income, if any, are recorded at the fair market value of the securities received. Income and capital gain distributions from Fidelity Central Funds, if any, are recorded on the ex-dividend date. Certain distributions received by the Fund represent a return of capital or capital gain. The Fund determines the components of these distributions subsequent to the ex-dividend date, based upon receipt of tax filings or other correspondence relating to the underlying investment. These distributions are recorded as a reduction of cost of investments and/or as a realized gain. Investment income is recorded net of foreign taxes withheld where recovery of such taxes is uncertain.
Class Allocations and Expenses. Investment income, realized and unrealized capital gains and losses, common expenses of a fund, and certain fund-level expense reductions, if any, are allocated daily on a pro-rata basis to each class based on the relative net assets of each class to the total net assets of a fund. Each class differs with respect to transfer agent and distribution and service plan fees incurred, as applicable. Certain expense reductions may also differ by class, if applicable. For the reporting period, the allocated portion of income and expenses to each class as a percent of its average net assets may vary due to the timing of recording these transactions in relation to fluctuating net assets of the classes. Expenses directly attributable to a fund are charged to that fund. Expenses attributable to more than one fund are allocated among the respective funds on the basis of relative net assets or other appropriate methods. Expenses included in the accompanying financial statements reflect the expenses of that fund and do not include any expenses associated with any underlying mutual funds or exchange-traded funds (ETFs). Although not included in a fund's expenses, a fund indirectly bears its proportionate share of these expenses through the net asset value of each underlying mutual fund or exchange-traded fund (ETF). Expense estimates are accrued in the period to which they relate and adjustments are made when actual amounts are known.
Income Tax Information and Distributions to Shareholders. Each year, the Fund intends to qualify as a regulated investment company under Subchapter M of the Internal Revenue Code, including distributing substantially all of its taxable income and realized gains. As a result, no provision for U.S. Federal income taxes is required. As of December 31, 2024, the Fund did not have any unrecognized tax benefits in the financial statements; nor is the Fund aware of any tax positions for which it is reasonably possible that the total amounts of unrecognized tax benefits will significantly change in the next twelve months. The Fund files a U.S. federal tax return, in addition to state and local tax returns as required. The Fund's federal income tax returns are subject to examination by the Internal Revenue Service (IRS) for a period of three fiscal years after they are filed. State and local tax returns may be subject to examination for an additional fiscal year depending on the jurisdiction. Foreign taxes are provided for based on the Fund's understanding of the tax rules and rates that exist in the foreign markets in which it invests.
Distributions are declared and recorded on the ex-dividend date. Income and capital gain distributions are declared separately for each class. Income and capital gain distributions are determined in accordance with income tax regulations, which may differ from GAAP.
Capital accounts within the financial statements are adjusted for permanent book-tax differences. These adjustments have no impact on net assets or the results of operations. Capital accounts are not adjusted for temporary book-tax differences which will reverse in a subsequent period.
Book-tax differences are primarily due to foreign currency transactions, partnerships and losses deferred due to wash sales.
As of period end, the cost and unrealized appreciation (depreciation) in securities, and derivatives if applicable, for federal income tax purposes were as follows:
| Gross unrealized appreciation | $84,941,920 |
| Gross unrealized depreciation | (4,307,608) |
| Net unrealized appreciation (depreciation) | $80,634,312 |
| Tax Cost | $223,282,526 |
The tax-based components of distributable earnings as of period end were as follows:
| Undistributed ordinary income | $1,462,633 |
| Undistributed long-term capital gain | $8,835,329 |
| Net unrealized appreciation (depreciation) on securities and other investments | $80,633,441 |
The tax character of distributions paid was as follows:
| | December 31, 2024 | December 31, 2023 |
| Ordinary Income | $8,587,933 | $ 4,782,462 |
| Long-term Capital Gains | 4,983,645 | 9,856,251 |
| Total | $13,571,578 | $ 14,638,713 |
New Accounting Pronouncement. FASB Accounting Standards Update (ASU) 2023-07 Segment Reporting (Topic 280): Improvements to Reportable Segment Disclosures became effective in this reporting period. ASU 2023-07 enhances segment information disclosure in the notes to financial statements.
4. Purchases and Sales of Investments.
Purchases and sales of securities, other than short-term securities and in-kind transactions, as applicable, are noted in the table below.
| | Purchases ($) | Sales ($) |
| VIP Financials Portfolio | 119,935,217 | 85,394,367 |
5. Fees and Other Transactions with Affiliates.
Management Fee. Fidelity Management & Research Company LLC (the investment adviser) and its affiliates provide the Fund with investment management related services for which the Fund pays a monthly management fee.
Effective March 1, 2024, the Fund's management contract was amended to incorporate administrative services previously covered under separate services agreements (Transfer Agent and Accounting agreements). The amended contract incorporates a management fee rate that may vary by class. The investment adviser or an affiliate pays certain expenses of managing and operating the Fund out of each class's management fee. Each class of the Fund pays a management fee to the investment adviser. The management fee is calculated and paid to the investment adviser every month. When determining a class's management fee, a mandate rate is calculated based on the monthly average net assets of a group of funds advised by FMR within a designated asset class. A discount rate is subtracted from the mandate rate once the Fund's monthly average net assets reach a certain level. The mandate rate and discount rate may vary by class. The annual management fee rate for a class of shares of the Fund is the lesser of (1) the class's mandate rate reduced by the class's discount rate (if applicable) or (2) the amount set forth in the following table.
| | Maximum Management Fee Rate % |
| Initial Class | .58 |
| Service Class 2 | .58 |
| Investor Class | .66 |
One-twelfth of the management fee rate for a class is applied to the average net assets of the class for the month, giving a dollar amount which is the management fee for the class for that month. A different management fee rate may be applicable to each class of the Fund. The difference between classes is the result of separate arrangements for class-level services and/or waivers of certain expenses. It is not the result of any difference in advisory or custodial fees or other expenses related to the management of the Fund's assets, which do not vary by class. For the portion of the reporting period on or after March 1, 2024, the total annualized management fee rates were as follows:
| | Total Management Fee Rate % |
| Initial Class | .58 |
| Service Class 2 | .58 |
| Investor Class | .66 |
Prior to March 1, 2024, the management fee was the sum of an individual fund fee rate that was based on an annual rate of .30% of the Fund's average net assets and an annualized group fee rate that averaged .22% during the period. The group fee rate was based upon the monthly average net assets of a group of registered investment companies with which the investment adviser has management contracts. The group fee rate decreased as assets under management increased and increased as assets under management decreased. For the portion of the reporting period prior to March 1, 2024, the total annualized management fee rate was .52%.
Effective March 1, 2024, the Fund's sub-advisory agreements with FMR Investment Management (UK) Limited, Fidelity Management & Research (Hong Kong) Limited, and Fidelity Management & Research (Japan) Limited were amended to provide that the investment adviser pays each sub-adviser monthly fees equal to 110% of the sub-adviser's costs for providing sub-advisory services.
Distribution and Service Plan Fees. In accordance with Rule 12b-1 of the 1940 Act, the Fund has adopted a separate 12b-1 Plan for Service Class 2 shares. Service Class 2 pays Fidelity Distributors Company LLC (FDC), an affiliate of the investment adviser, a service fee. For the period, the service fee is based on an annual rate of .25% of Service Class 2's average net assets.
For the period, total fees for Service Class 2, all of which was re-allowed to insurance companies for the distribution of shares and providing shareholder support services were $2,490.
Transfer Agent Fees. Fidelity Investments Institutional Operations Company LLC (FIIOC), an affiliate of the investment adviser, is the Fund's transfer, dividend disbursing, and shareholder servicing agent. Effective March 1, 2024, the Fund's management contract was amended to incorporate transfer agent services and associated fees previously covered under a separate services agreement.
During the period January 1, 2024 through February 29, 2024, the transfer agent fees for each class were a fixed annual rate of class-level average net assets as follows:
| | Amount ($) | % of Class-Level Average Net Assets |
| Initial Class | 2,527 | .0630 |
| Service Class 2 | 28 | .0630 |
| Investor Class | 41,841 | .1390 |
| | 44,396 | |
Accounting Fees. Fidelity Service Company, Inc. (FSC), an affiliate of the investment adviser, maintains the Fund's accounting records. Effective March 1, 2024, the Fund's management contract was amended to incorporate accounting services and associated fees previously covered under a separate services agreement.
During the period January 1, 2024 through February 29, 2024, the accounting fees were a fixed annual rate of average net assets as follows:
| | % of Average Net Assets |
| VIP Financials Portfolio | .0353 |
Brokerage Commissions. A portion of portfolio transactions were placed with brokerage firms which are affiliates of the investment adviser. Brokerage commissions are included in net
realized gain (loss) and change in net unrealized appreciation (depreciation) in the Statement of Operations. The commissions paid to these affiliated firms were as follows:
| | Amount ($) |
| VIP Financials Portfolio | 2,207 |
Interfund Trades. Funds may purchase from or sell securities to other Fidelity Funds under procedures adopted by the Board. The procedures have been designed to ensure these interfund trades are executed in accordance with Rule 17a-7 of the 1940 Act. Any interfund trades are included within the respective purchases and sales amounts shown in the Purchases and Sales of Investments note. Interfund trades during the period are noted in the table below.
| | Purchases ($) | Sales ($) | Realized Gain (Loss) ($) |
| VIP Financials Portfolio | 7,954,312 | 4,956,628 | 899,040 |
6. Committed Line of Credit.
Certain Funds participate with other funds managed by the investment adviser or an affiliate in a $4.25 billion credit facility (the "line of credit") to be utilized for temporary or emergency purposes to fund shareholder redemptions or for other short-term liquidity purposes.
Commitment fees are charged based on the unused amount of the line of credit at an annual rate of .10%, and then allocated to each participating fund based on its pro-rata portion of the line of credit. The commitment fees are reflected in Miscellaneous expenses on the Statement of Operations, and are listed below.
Interest is charged to a participating fund based on its borrowings at an annual rate of .75% plus the highest of (i) daily SOFR plus a .10% spread adjustment, (ii) Federal Funds Effective Rate, or (iii) Overnight Bank Funding Rate. During the period, there were no borrowings on this line of credit.
The line of credit agreement will expire in March 2025 unless extended or renewed.
| | Amount ($) |
| VIP Financials Portfolio | 327 |
7. Security Lending.
Funds lend portfolio securities from time to time in order to earn additional income. Lending agents are used, including National Financial Services (NFS), an affiliate of the investment adviser. Pursuant to a securities lending agreement, NFS will receive a fee, which is capped at 9.9% of a fund's daily lending revenue, for its services as lending agent. A fund may lend securities to certain qualified borrowers, including NFS. On the settlement date of the loan, a fund receives collateral (in the form of U.S. Treasury obligations, letters of credit and/or cash) against the loaned securities and maintains collateral in an amount not less than 100% of the market value of the loaned securities during the period of the loan. The market value of the loaned securities is determined at the close of business of a fund and any additional required collateral is delivered to a fund on the next business day. A fund or borrower may terminate the loan at any time, and if the borrower defaults on its obligation to return the securities loaned because of insolvency or other reasons, a fund may apply collateral received from the borrower against the obligation. A fund may experience delays and costs in recovering the securities loaned. Any cash collateral received is invested in the Fidelity Securities Lending Cash Central Fund. Any loaned securities are identified as such in the Schedule of Investments, and the value of loaned securities and cash collateral at period end, as applicable, are presented in the Statement of Assets and Liabilities. Security lending income represents the income earned on investing cash collateral, less rebates paid to borrowers and any lending agent fees associated with the loan, plus any premium payments received for lending certain types of securities. Security lending income is presented in the Statement of Operations as a component of income from Fidelity Central Funds. Affiliated security lending activity, if any, was as follows:
| | Total Security Lending Fees Paid to NFS ($) | Security Lending Income From Securities Loaned to NFS ($) | Value of Securities Loaned to NFS at Period End ($) |
| VIP Financials Portfolio | 463 | - | - |
8. Expense Reductions.
During the period the investment adviser or an affiliate reimbursed and/or waived a portion of fund-level operating expenses in the amount of $8,798.
9. Distributions to Shareholders.
Distributions to shareholders of each class were as follows:
| | Year ended December 31, 2024 | Year ended December 31, 2023A |
| VIP Financials Portfolio | | |
| Distributions to shareholders | | |
| Initial Class | $1,569,580 | $1,820,078 |
| Service Class 2 | 72,633 | 3,079 |
| Investor Class | 11,929,365 | 12,815,556 |
Total | $13,571,578 | $14,638,713 |
A Distributions for Service Class 2 are for the period August 16, 2023 (commencement of sale of shares) through December 31, 2023.
10. Share Transactions.
Transactions for each class of shares were as follows and may contain in-kind transactions:
| | Shares | Shares | Dollars | Dollars |
| | Year ended December 31, 2024 | Year ended December 31, 2023A | Year ended December 31, 2024 | Year ended December 31, 2023A |
| VIP Financials Portfolio | | | | |
| Initial Class | | | | |
| Shares sold | 495,180 | 242,237 | $9,097,500 | $3,366,672 |
| Reinvestment of distributions | 91,573 | 125,808 | 1,569,580 | 1,820,078 |
| Shares redeemed | (385,216) | (857,656) | (6,268,544) | (11,135,817) |
| Net increase (decrease) | 201,537 | (489,611) | $4,398,536 | $(5,949,067) |
| Service Class 2 | | | | |
| Shares sold | 135,005 | 14,502 | $2,375,510 | $198,005 |
| Reinvestment of distributions | 3,449 | 63 | 65,417 | 871 |
| Shares redeemed | (16,319) | (1,892) | (293,265) | (27,904) |
| Net increase (decrease) | 122,135 | 12,673 | $2,147,662 | $170,972 |
| Investor Class | | | | |
| Shares sold | 3,159,866 | 2,026,650 | $56,895,955 | $28,428,804 |
| Reinvestment of distributions | 699,691 | 891,700 | 11,929,365 | 12,815,556 |
| Shares redeemed | (1,962,486) | (5,159,906) | (31,591,952) | (67,173,703) |
| Net increase (decrease) | 1,897,071 | (2,241,556) | $37,233,368 | $(25,929,343) |
A Share transactions for Service Class 2 are for the period August 16, 2023 (commencement of sale of shares) through December 31, 2023.
11. Other.
A fund's organizational documents provide former and current trustees and officers with a limited indemnification against liabilities arising in connection with the performance of their duties to the fund. In the normal course of business, a fund may also enter into contracts that provide general indemnifications. A fund's maximum exposure under these arrangements is unknown as this would be dependent on future claims that may be made against a fund. The risk of material loss from such claims is considered remote.
At the end of the period, the investment adviser or its affiliates were owners of record of more than 10% of the outstanding shares as follows:
| Fund | Affiliated % |
| VIP Financials Portfolio | 99% |
12. Risk and Uncertainties.
Many factors affect a fund's performance. Developments that disrupt global economies and financial markets, such as pandemics, epidemics, outbreaks of infectious diseases, war, terrorism, and environmental disasters, may significantly affect a fund's investment performance. The effects of these developments to a fund will be impacted by the types of securities in which a fund invests, the financial condition, industry, economic sector, and geographic location of an issuer, and a fund's level of investment in the securities of that issuer. Significant concentrations in security types, issuers, industries, sectors, and geographic locations may magnify the factors that affect a fund's performance.
Report of Independent Registered Public Accounting Firm
To the Board of Trustees of Variable Insurance Products Fund IV and Shareholders of VIP Financials Portfolio
Opinion on the Financial Statements
We have audited the accompanying statement of assets and liabilities, including the schedule of investments, of VIP Financials Portfolio (one of the funds constituting Variable Insurance Products Fund IV, referred to hereafter as the "Fund") as of December 31, 2024, the related statement of operations for the year ended December 31, 2024, the statement of changes in net assets for each of the two years in the period ended December 31, 2024, including the related notes, and the financial highlights for each of the periods indicated therein (collectively referred to as the "financial statements"). In our opinion, the financial statements present fairly, in all material respects, the financial position of the Fund as of December 31, 2024, the results of its operations for the year then ended, the changes in its net assets for each of the two years in the period ended December 31, 2024 and the financial highlights for each of the periods indicated therein in conformity with accounting principles generally accepted in the United States of America.
Basis for Opinion
These financial statements are the responsibility of the Fund's management. Our responsibility is to express an opinion on the Fund's financial statements based on our audits. We are a public accounting firm registered with the Public Company Accounting Oversight Board (United States) (PCAOB) and are required to be independent with respect to the Fund in accordance with the U.S. federal securities laws and the applicable rules and regulations of the Securities and Exchange Commission and the PCAOB.
We conducted our audits of these financial statements in accordance with the standards of the PCAOB. Those standards require that we plan and perform the audit to obtain reasonable assurance about whether the financial statements are free of material misstatement, whether due to error or fraud.
Our audits included performing procedures to assess the risks of material misstatement of the financial statements, whether due to error or fraud, and performing procedures that respond to those risks. Such procedures included examining, on a test basis, evidence regarding the amounts and disclosures in the financial statements. Our audits also included evaluating the accounting principles used and significant estimates made by management, as well as evaluating the overall presentation of the financial statements. Our procedures included confirmation of securities owned as of December 31, 2024 by correspondence with the custodian and brokers; when replies were not received from brokers, we performed other auditing procedures. We believe that our audits provide a reasonable basis for our opinion.
/s/ PricewaterhouseCoopers LLP
Boston, Massachusetts
February 11, 2025
We have served as the auditor of one or more investment companies in the Fidelity group of funds since 1932.
Distributions
(Unaudited)The dividend and capital gains distributions for the fund(s) are available on Fidelity.com or Institutional.Fidelity.com.
The fund hereby designates as a capital gain dividend with respect to the taxable year ended December 31,2024 $8,835,330, or, if subsequently determined to be different, the net capital gain of such year.
The fund designates $29,169 of distributions paid during the fiscal year ended December 31,2024 as qualifying to be taxed as section 163(j) interest dividends.
Initial Class designates 96% and 61%; Service Class 2 designates 99% and 59%; and Investor Class designates 99% and 62%; of the dividends distributed in February and December, respectively during the fiscal year as qualifying for the dividends-received deduction for corporate shareholders.
Item 8: Changes in and Disagreements with Accountants for Open-End Management Investment Companies
(Unaudited)
Note: This is not applicable for any fund included in this document.
Item 9: Proxy Disclosures for Open-End Management Investment Companies
(Unaudited)
| A special meeting of shareholders was held on July 16, 2024. The results of votes taken among shareholders on the proposal before them are reported below. Each vote reported represents one dollar of net asset value held on the record date for the meeting. |
| Proposal 1 |
| To elect a Board of Trustees. |
| | # of Votes | % of Votes |
| Bettina Doulton |
| Affirmative | 5,501,492,681.85 | 94.15 |
| Withheld | 341,991,035.05 | 5.85 |
| TOTAL | 5,843,483,716.90 | 100.00 |
| Robert A. Lawrence |
| Affirmative | 5,480,901,467.70 | 93.80 |
| Withheld | 362,582,249.21 | 6.20 |
| TOTAL | 5,843,483,716.90 | 100.00 |
| Vijay C. Advani |
| Affirmative | 5,500,352,811.04 | 94.13 |
| Withheld | 343,130,905.86 | 5.87 |
| TOTAL | 5,843,483,716.90 | 100.00 |
| Thomas P. Bostick |
| Affirmative | 5,488,165,362.69 | 93.92 |
| Withheld | 355,318,354.21 | 6.08 |
| TOTAL | 5,843,483,716.90 | 100.00 |
| Donald F. Donahue |
| Affirmative | 5,482,960,893.76 | 93.83 |
| Withheld | 360,522,823.14 | 6.17 |
| TOTAL | 5,843,483,716.90 | 100.00 |
| Vicki L. Fuller |
| Affirmative | 5,492,283,337.89 | 93.99 |
| Withheld | 351,200,379.01 | 6.01 |
| TOTAL | 5,843,483,716.90 | 100.00 |
| Patricia L. Kampling |
| Affirmative | 5,521,992,715.20 | 94.50 |
| Withheld | 321,491,001.70 | 5.50 |
| TOTAL | 5,843,483,716.90 | 100.00 |
| Thomas A. Kennedy |
| Affirmative | 5,484,789,158.10 | 93.86 |
| Withheld | 358,694,558.80 | 6.14 |
| TOTAL | 5,843,483,716.90 | 100.00 |
| Oscar Munoz |
| Affirmative | 5,497,884,744.63 | 94.09 |
| Withheld | 345,598,972.27 | 5.91 |
| TOTAL | 5,843,483,716.90 | 100.00 |
| Karen B. Peetz |
| Affirmative | 5,503,968,240.81 | 94.19 |
| Withheld | 339,515,476.09 | 5.81 |
| TOTAL | 5,843,483,716.90 | 100.00 |
| David M. Thomas |
| Affirmative | 5,466,218,204.40 | 93.54 |
| Withheld | 377,265,512.50 | 6.46 |
| TOTAL | 5,843,483,716.90 | 100.00 |
| Susan Tomasky |
| Affirmative | 5,463,402,825.36 | 93.50 |
| Withheld | 380,080,891.54 | 6.50 |
| TOTAL | 5,843,483,716.90 | 100.00 |
| Michael E. Wiley |
| Affirmative | 5,466,838,155.74 | 93.55 |
| Withheld | 376,645,561.16 | 6.45 |
| TOTAL | 5,843,483,716.90 | 100.00 |
| | | |
| Proposal 1 reflects trust-wide proposal and voting results. |
Item 10: Remuneration Paid to Directors, Officers, and others of Open-End Management Investment Companies
(Unaudited)
Note: This information is disclosed as part of the financial statements for each Fund as part of Item 7: Financial Statements and Financial Highlights for Open-End Management Investment companies.
Item 11: Statement Regarding Basis for Approval of Investment Advisory Contract
(Unaudited)
Note: This is not applicable for any fund included in this document.
1.817367.120
VFSIC-ANN-0325
Fidelity® Variable Insurance Products:
VIP Communication Services Portfolio
Annual Report
December 31, 2024
Contents
To view a fund's proxy voting guidelines and proxy voting record for the 12-month period ended June 30, visit http://www.fidelity.com/proxyvotingresults or visit the Securities and Exchange Commission's (SEC) web site at http://www.sec.gov.
You may also call 1-877-208-0098 to request a free copy of the proxy voting guidelines.
Fidelity® Variable Insurance Products are separate account options which are purchased through a variable insurance contract.
Standard & Poor's, S&P and S&P 500 are registered service marks of The McGraw-Hill Companies, Inc. and have been licensed for use by Fidelity Distributors Corporation.
Other third-party marks appearing herein are the property of their respective owners.
All other marks appearing herein are registered or unregistered trademarks or service marks of FMR LLC or an affiliated company. © 2025 FMR LLC. All rights reserved.
This report and the financial statements contained herein are submitted for the general information of the shareholders of the Fund. This report is not authorized for distribution to prospective investors in the Fund unless preceded or accompanied by an effective prospectus.
A fund files its complete schedule of portfolio holdings with the SEC for the first and third quarters of each fiscal year on Form N-PORT. Forms N-PORT are available on the SEC's web site at http://www.sec.gov. A fund's Forms N-PORT may be reviewed and copied at the SEC's Public Reference Room in Washington, DC. Information regarding the operation of the SEC's Public Reference Room may be obtained by calling 1-800-SEC-0330.
For a complete list of a fund's portfolio holdings, view the most recent holdings listing, semiannual report, or annual report on Fidelity's web site at http://www.fidelity.com, http://www.institutional.fidelity.com, or http://www.401k.com, as applicable.
NOT FDIC INSURED •MAY LOSE VALUE •NO BANK GUARANTEE
Neither the Fund nor Fidelity Distributors Corporation is a bank.
Item 7: Financial Statements and Financial Highlights for Open-End Management Investment Companies (Annual Report)
VIP Communication Services Portfolio
Schedule of Investments December 31, 2024
Showing Percentage of Net Assets
| Common Stocks - 98.6% |
| | | Shares | Value ($) |
| JAPAN - 0.7% | | | |
| Communication Services - 0.7% | | | |
| Entertainment - 0.7% | | | |
| Nintendo Co Ltd | | 30,100 | 1,753,078 |
| SINGAPORE - 0.7% | | | |
| Communication Services - 0.7% | | | |
| Entertainment - 0.7% | | | |
| Sea Ltd Class A ADR (a) | | 15,600 | 1,655,160 |
| TAIWAN - 0.6% | | | |
| Information Technology - 0.6% | | | |
| Semiconductors & Semiconductor Equipment - 0.6% | | | |
| Taiwan Semiconductor Manufacturing Co Ltd ADR | | 7,400 | 1,461,426 |
| UNITED KINGDOM - 0.5% | | | |
| Communication Services - 0.5% | | | |
| Media - 0.5% | | | |
| WPP PLC ADR | | 22,400 | 1,151,360 |
| UNITED STATES - 96.1% | | | |
| Communication Services - 90.4% | | | |
| Diversified Telecommunication Services - 6.3% | | | |
| AT&T Inc | | 468,400 | 10,665,468 |
| GCI Liberty Inc Class A (a)(b)(c) | | 21,982 | 0 |
| Verizon Communications Inc | | 108,600 | 4,342,914 |
| | | | 15,008,382 |
| Entertainment - 23.8% | | | |
| Liberty Media Corp-Liberty Formula One Class C (a) | | 52,200 | 4,836,852 |
| Live Nation Entertainment Inc (a) | | 37,000 | 4,791,500 |
| Marcus Corp/The | | 3,237 | 69,596 |
| Netflix Inc (a) | | 12,910 | 11,506,941 |
| ROBLOX Corp Class A (a) | | 92,500 | 5,352,050 |
| Roku Inc Class A (a) | | 14,300 | 1,063,062 |
| Spotify Technology SA (a) | | 3,900 | 1,744,782 |
| Take-Two Interactive Software Inc (a) | | 29,100 | 5,356,728 |
| TKO Group Holdings Inc Class A (a) | | 33,000 | 4,689,630 |
| Walt Disney Co/The | | 104,423 | 11,627,501 |
| Warner Bros Discovery Inc (a) | | 510,500 | 5,395,985 |
| | | | 56,434,627 |
| Interactive Media & Services - 54.0% | | | |
| Alphabet Inc Class A | | 312,000 | 59,061,600 |
| Meta Platforms Inc Class A | | 98,200 | 57,497,082 |
| Pinterest Inc Class A (a) | | 92,400 | 2,679,600 |
| Reddit Inc Class A | | 21,700 | 3,546,648 |
| Snap Inc Class A (a) | | 414,700 | 4,466,319 |
| Trump Media & Technology Group Corp (a)(d) | | 19,500 | 664,950 |
| | | | 127,916,199 |
| Media - 6.3% | | | |
| Charter Communications Inc Class A (a) | | 1,900 | 651,263 |
| Comcast Corp Class A | | 64,100 | 2,405,673 |
| Fox Corp Class A | | 62,300 | 3,026,534 |
| Liberty Broadband Corp Class A (a) | | 21,919 | 1,629,897 |
| Magnite Inc (a) | | 23,100 | 367,752 |
| Paramount Global Class B (d) | | 46,600 | 487,436 |
| Trade Desk Inc (The) Class A (a) | | 54,100 | 6,358,373 |
| | | | 14,926,928 |
TOTAL COMMUNICATION SERVICES | | | 214,286,136 |
| | | | |
| Consumer Discretionary - 2.6% | | | |
| Broadline Retail - 2.6% | | | |
| Amazon.com Inc (a) | | 28,300 | 6,208,737 |
| Financials - 1.0% | | | |
| Capital Markets - 1.0% | | | |
| Coinbase Global Inc Class A (a) | | 9,900 | 2,458,170 |
| Information Technology - 2.1% | | | |
| Semiconductors & Semiconductor Equipment - 0.9% | | | |
| Broadcom Inc | | 9,700 | 2,248,848 |
| Software - 1.2% | | | |
| AppLovin Corp Class A (a) | | 8,400 | 2,720,172 |
TOTAL INFORMATION TECHNOLOGY | | | 4,969,020 |
| | | | |
| TOTAL UNITED STATES | | | 227,922,063 |
| TOTAL COMMON STOCKS (Cost $145,078,967) | | | 233,943,087 |
| | | | |
| Convertible Preferred Stocks - 0.1% |
| | | Shares | Value ($) |
| UNITED STATES - 0.1% | | | |
| Consumer Discretionary - 0.1% | | | |
| Automobiles - 0.1% | | | |
Waymo LLC (b)(c) (Cost $221,544) | | 2,833 | 219,925 |
| | | | |
| Money Market Funds - 1.3% |
| | | Yield (%) | Shares | Value ($) |
| Fidelity Cash Central Fund (e) | | 4.36 | 1,965,089 | 1,965,483 |
| Fidelity Securities Lending Cash Central Fund (e)(f) | | 4.35 | 1,178,838 | 1,178,955 |
| TOTAL MONEY MARKET FUNDS (Cost $3,144,437) | | | | 3,144,438 |
| | | | | |
| TOTAL INVESTMENT IN SECURITIES - 100.0% (Cost $148,444,948) | 237,307,450 |
NET OTHER ASSETS (LIABILITIES) - 0.0% | 53,864 |
| NET ASSETS - 100.0% | 237,361,314 |
| | |
Legend
| (c) | Restricted securities (including private placements) - Investment in securities not registered under the Securities Act of 1933 (excluding 144A issues). At the end of the period, the value of restricted securities (excluding 144A issues) amounted to $219,925 or 0.1% of net assets. |
| (d) | Security or a portion of the security is on loan at period end. |
| (e) | Affiliated fund that is generally available only to investment companies and other accounts managed by Fidelity Investments. The rate quoted is the annualized seven-day yield of the fund at period end. A complete unaudited listing of the fund's holdings as of its most recent quarter end is available upon request. In addition, each Fidelity Central Fund's financial statements, which are not covered by the Fund's Report of Independent Registered Public Accounting Firm, are available on the SEC's website or upon request. |
| (f) | Investment made with cash collateral received from securities on loan. |
| Additional information on each restricted holding is as follows: |
| Security | Acquisition Date | Acquisition Cost ($) |
| GCI Liberty Inc Class A | 5/23/23 | 0 |
| | | |
| Waymo LLC | 10/18/24 | 221,544 |
| | | |
Affiliated Central Funds
Fiscal year to date information regarding the Fund's investments in Fidelity Central Funds, including the ownership percentage, is presented below.
| Affiliate | Value, beginning of period ($) | Purchases ($) | Sales Proceeds ($) | Dividend Income ($) | Realized Gain (loss) ($) | Change in Unrealized appreciation (depreciation) ($) | Value, end of period ($) | Shares, end of period | % ownership, end of period |
| Fidelity Cash Central Fund | 316,053 | 104,931,998 | 103,283,263 | 101,178 | 694 | 1 | 1,965,483 | 1,965,089 | 0.0% |
| Fidelity Securities Lending Cash Central Fund | 2,430,530 | 41,144,699 | 42,396,274 | 4,647 | - | - | 1,178,955 | 1,178,838 | 0.0% |
| Total | 2,746,583 | 146,076,697 | 145,679,537 | 105,825 | 694 | 1 | 3,144,438 | 3,143,927 | |
| | | | | | | | | | |
Amounts in the dividend income column in the above table include any capital gain distributions from underlying funds, which are presented in the corresponding line item in the Statement of Operations, if applicable.
Amounts in the dividend income column for Fidelity Securities Lending Cash Central Fund represents the income earned on investing cash collateral, less rebates paid to borrowers and any lending agent fees associated with the loan, plus any premium payments received for lending certain types of securities.
Amounts included in the purchases and sales proceeds columns may include in-kind transactions, if applicable.
Investment Valuation
The following is a summary of the inputs used, as of December 31, 2024, involving the Fund's assets and liabilities carried at fair value. The inputs or methodology used for valuing securities may not be an indication of the risk associated with investing in those securities. For more information on valuation inputs, and their aggregation into the levels used below, please refer to the Investment Valuation section in the accompanying Notes to Financial Statements.
| Valuation Inputs at Reporting Date: |
| Description | Total ($) | Level 1 ($) | Level 2 ($) | Level 3 ($) |
Investments in Securities: | | | | |
|
| Common Stocks | | | | |
Communication Services | 218,845,734 | 217,092,656 | 1,753,078 | - |
Consumer Discretionary | 6,208,737 | 6,208,737 | - | - |
Financials | 2,458,170 | 2,458,170 | - | - |
Information Technology | 6,430,446 | 6,430,446 | - | - |
|
| Convertible Preferred Stocks | | | | |
Consumer Discretionary | 219,925 | - | - | 219,925 |
|
| Money Market Funds | 3,144,438 | 3,144,438 | - | - |
| Total Investments in Securities: | 237,307,450 | 235,334,447 | 1,753,078 | 219,925 |
Financial Statements
| Statement of Assets and Liabilities |
As of December 31, 2024 |
| Assets | | | | |
| Investment in securities, at value (including securities loaned of $1,147,930) - See accompanying schedule: | | | | |
Unaffiliated issuers (cost $145,300,511) | $ | 234,163,012 | | |
Fidelity Central Funds (cost $3,144,437) | | 3,144,438 | | |
| | | | | |
| | | | | |
| Total Investment in Securities (cost $148,444,948) | | | $ | 237,307,450 |
| Cash | | | | 9,244 |
| Foreign currency held at value (cost $233) | | | | 230 |
| Receivable for investments sold | | | | 1,547,673 |
| Receivable for fund shares sold | | | | 88,265 |
| Dividends receivable | | | | 50,582 |
| Distributions receivable from Fidelity Central Funds | | | | 9,083 |
| Prepaid expenses | | | | 211 |
| Other receivables | | | | 528 |
Total assets | | | | 239,013,266 |
| Liabilities | | | | |
| Payable for investments purchased | $ | 284,595 | | |
| Payable for fund shares redeemed | | 14,771 | | |
| Accrued management fee | | 130,621 | | |
| Audit fee payable | | 36,806 | | |
| Other payables and accrued expenses | | 6,284 | | |
| Collateral on securities loaned | | 1,178,875 | | |
| Total liabilities | | | | 1,651,952 |
| Net Assets | | | $ | 237,361,314 |
| Net Assets consist of: | | | | |
| Paid in capital | | | $ | 129,358,465 |
| Total accumulated earnings (loss) | | | | 108,002,849 |
| Net Assets | | | $ | 237,361,314 |
| | | | | |
| Net Asset Value and Maximum Offering Price | | | | |
| Initial Class : | | | | |
Net Asset Value, offering price and redemption price per share ($24,655,307 ÷ 1,049,609 shares) | | | $ | 23.49 |
| Investor Class : | | | | |
Net Asset Value, offering price and redemption price per share ($212,706,007 ÷ 9,162,999 shares) | | | $ | 23.21 |
| Statement of Operations |
| Year ended December 31, 2024 |
| Investment Income | | | | |
| Dividends | | | $ | 1,368,268 |
| Income from Fidelity Central Funds (including $4,647 from security lending) | | | | 105,825 |
| Total income | | | | 1,474,093 |
| Expenses | | | | |
| Management fee | $ | 1,382,958 | | |
| Transfer agent fees | | 44,494 | | |
| Accounting fees | | 12,084 | | |
| Custodian fees and expenses | | 9,993 | | |
| Independent trustees' fees and expenses | | 931 | | |
| Audit fees | | 40,788 | | |
| Legal | | 1,271 | | |
| Interest | | 4,799 | | |
| Miscellaneous | | 3,191 | | |
| Total expenses before reductions | | 1,500,509 | | |
| Expense reductions | | (8,999) | | |
| Total expenses after reductions | | | | 1,491,510 |
| Net Investment income (loss) | | | | (17,417) |
| Realized and Unrealized Gain (Loss) | | | | |
| Net realized gain (loss) on: | | | | |
| Investment Securities: | | | | |
| Unaffiliated issuers | | 25,654,155 | | |
| Fidelity Central Funds | | 694 | | |
| Foreign currency transactions | | 6,159 | | |
| Total net realized gain (loss) | | | | 25,661,008 |
| Change in net unrealized appreciation (depreciation) on: | | | | |
| Investment Securities: | | | | |
| Unaffiliated issuers | | 36,167,769 | | |
| Fidelity Central Funds | | 1 | | |
| Unfunded commitments | | 18,834 | | |
| Assets and liabilities in foreign currencies | | (33) | | |
| Total change in net unrealized appreciation (depreciation) | | | | 36,186,571 |
| Net gain (loss) | | | | 61,847,579 |
| Net increase (decrease) in net assets resulting from operations | | | $ | 61,830,162 |
| Statement of Changes in Net Assets |
| |
| | Year ended December 31, 2024 | | Year ended December 31, 2023 |
| Increase (Decrease) in Net Assets | | | | |
| Operations | | | | |
| Net investment income (loss) | $ | (17,417) | $ | (431,827) |
| Net realized gain (loss) | | 25,661,008 | | 193,770 |
| Change in net unrealized appreciation (depreciation) | | 36,186,571 | | 57,607,844 |
| Net increase (decrease) in net assets resulting from operations | | 61,830,162 | | 57,369,787 |
| Distributions to shareholders | | (4,642,835) | | - |
| | | | | |
| Share transactions - net increase (decrease) | | (16,654,338) | | 63,903,344 |
| Total increase (decrease) in net assets | | 40,532,989 | | 121,273,131 |
| | | | | |
| Net Assets | | | | |
| Beginning of period | | 196,828,325 | | 75,555,194 |
| End of period | $ | 237,361,314 | $ | 196,828,325 |
| | | | | |
| | | | | |
Financial Highlights
VIP Communication Services Portfolio Initial Class |
| |
| Years ended December 31, | | 2024 | | 2023 | | 2022 | | 2021 | | 2020 |
Selected Per-Share Data | | | | | | | | | | |
| Net asset value, beginning of period | $ | 17.88 | $ | 11.36 | $ | 19.25 | $ | 17.39 | $ | 12.98 |
| Income from Investment Operations | | | | | | | | | | |
Net investment income (loss) A,B | | .01 | | (.04) C | | (.04) | | (.07) | | (.05) |
| Net realized and unrealized gain (loss) | | 6.05 | | 6.56 | | (7.05) | | 2.74 | | 4.62 |
| Total from investment operations | | 6.06 | | 6.52 | | (7.09) | | 2.67 | | 4.57 |
| Distributions from net realized gain | | (.45) | | - | | (.80) | | (.81) | | (.16) |
| Total distributions | | (.45) | | - | | (.80) | | (.81) | | (.16) |
| Net asset value, end of period | $ | 23.49 | $ | 17.88 | $ | 11.36 | $ | 19.25 | $ | 17.39 |
Total Return D,E | | | | 57.39% | | (38.14)% | | 15.65% | | 35.60% |
Ratios to Average Net Assets B,F,G | | | | | | | | | | |
| Expenses before reductions | | .61% | | .66% | | .68% | | .66% | | .70% |
| Expenses net of fee waivers, if any | | | | .66% | | .68% | | .66% | | .70% |
| Expenses net of all reductions | | .61% | | .66% | | .68% | | .66% | | .70% |
| Net investment income (loss) | | .07% | | (.24)% C | | (.29)% | | (.34)% | | (.39)% |
| Supplemental Data | | | | | | | | | | |
| Net assets, end of period (000 omitted) | $ | 24,655 | $ | 23,566 | $ | 8,116 | $ | 18,332 | $ | 13,370 |
Portfolio turnover rate H | | | | 41% | | 37% | | 66% | | 66% |
ACalculated based on average shares outstanding during the period.
BNet investment income (loss) is affected by the timing of the declaration of dividends by any underlying mutual funds or exchange-traded funds (ETFs). Net investment income (loss) of any mutual funds or ETFs is not included in the Fund's net investment income (loss) ratio.
CNet investment income per share reflects one or more large, non-recurring dividend(s) which amounted to $.01 per share. Excluding such non-recurring dividend(s), the ratio of net investment income (loss) to average net assets would have been (.31)%.
DTotal returns do not reflect charges attributable to your insurance company's separate account. Inclusion of these charges would reduce the total returns shown.
ETotal returns would have been lower if certain expenses had not been reduced during the applicable periods shown.
FFees and expenses of any underlying mutual funds or exchange-traded funds (ETFs) are not included in the Fund's expense ratio. The Fund indirectly bears its proportionate share of these expenses. For additional expense information related to investments in Fidelity Central Funds, please refer to the "Investments in Fidelity Central Funds" note found in the Notes to Financial Statements section of the most recent Annual or Semi-Annual report.
GExpense ratios reflect operating expenses of the class. Expenses before reductions do not reflect amounts reimbursed, waived, or reduced through arrangements with the investment adviser, brokerage services, or other offset arrangements, if applicable, and do not represent the amount paid by the class during periods when reimbursements, waivers or reductions occur.
HAmount does not include the portfolio activity of any underlying mutual funds or exchange-traded funds (ETFs), derivatives or securities that mature within one year from acquisition.
VIP Communication Services Portfolio Investor Class |
| |
| Years ended December 31, | | 2024 | | 2023 | | 2022 | | 2021 | | 2020 |
Selected Per-Share Data | | | | | | | | | | |
| Net asset value, beginning of period | $ | 17.69 | $ | 11.25 | $ | 19.08 | $ | 17.23 | $ | 12.88 |
| Income from Investment Operations | | | | | | | | | | |
Net investment income (loss) A,B | | - C | | (.05) D | | (.05) | | (.08) | | (.06) |
| Net realized and unrealized gain (loss) | | 5.97 | | 6.49 | | (6.98) | | 2.72 | | 4.57 |
| Total from investment operations | | 5.97 | | 6.44 | | (7.03) | | 2.64 | | 4.51 |
| Distributions from net realized gain | | (.45) | | - | | (.80) | | (.79) | | (.16) |
| Total distributions | | (.45) | | - | | (.80) | | (.79) | | (.16) |
| Net asset value, end of period | $ | 23.21 | $ | 17.69 | $ | 11.25 | $ | 19.08 | $ | 17.23 |
Total Return E,F | | | | 57.24% | | (38.17)% | | 15.60% | | 35.40% |
Ratios to Average Net Assets A,G,H | | | | | | | | | | |
| Expenses before reductions | | .69% | | .74% | | .76% | | .73% | | .78% |
| Expenses net of fee waivers, if any | | | | .73% | | .75% | | .73% | | .78% |
| Expenses net of all reductions | | .69% | | .73% | | .75% | | .73% | | .78% |
| Net investment income (loss) | | (.02)% | | (.32)% D | | (.36)% | | (.41)% | | (.46)% |
| Supplemental Data | | | | | | | | | | |
| Net assets, end of period (000 omitted) | $ | 212,706 | $ | 173,263 | $ | 67,439 | $ | 135,821 | $ | 102,631 |
Portfolio turnover rate I | | | | 41% | | 37% | | 66% | | 66% |
ANet investment income (loss) is affected by the timing of the declaration of dividends by any underlying mutual funds or exchange-traded funds (ETFs). Net investment income (loss) of any mutual funds or ETFs is not included in the Fund's net investment income (loss) ratio.
BCalculated based on average shares outstanding during the period.
CAmount represents less than $.005 per share.
DNet investment income per share reflects one or more large, non-recurring dividend(s) which amounted to $.01 per share. Excluding such non-recurring dividend(s), the ratio of net investment income (loss) to average net assets would have been (.38)%.
ETotal returns do not reflect charges attributable to your insurance company's separate account. Inclusion of these charges would reduce the total returns shown.
FTotal returns would have been lower if certain expenses had not been reduced during the applicable periods shown.
GFees and expenses of any underlying mutual funds or exchange-traded funds (ETFs) are not included in the Fund's expense ratio. The Fund indirectly bears its proportionate share of these expenses. For additional expense information related to investments in Fidelity Central Funds, please refer to the "Investments in Fidelity Central Funds" note found in the Notes to Financial Statements section of the most recent Annual or Semi-Annual report.
HExpense ratios reflect operating expenses of the class. Expenses before reductions do not reflect amounts reimbursed, waived, or reduced through arrangements with the investment adviser, brokerage services, or other offset arrangements, if applicable, and do not represent the amount paid by the class during periods when reimbursements, waivers or reductions occur.
IAmount does not include the portfolio activity of any underlying mutual funds or exchange-traded funds (ETFs), derivatives or securities that mature within one year from acquisition.
Notes to Financial Statements
For the period ended December 31, 2024
1. Organization.
VIP Communication Services Portfolio (the Fund) is a non-diversified fund of Variable Insurance Products Fund IV (the Trust) and is authorized to issue an unlimited number of shares. The Trust is registered under the Investment Company Act of 1940, as amended (the 1940 Act), as an open-end management investment company organized as a Massachusetts business trust. Shares of the Fund may only be purchased by insurance companies for the purpose of funding variable annuity or variable life insurance contracts. The Fund offers the following classes of shares: Initial Class shares and Investor Class shares. All classes have equal rights and voting privileges, except for matters affecting a single class.
2. Investments in Fidelity Central Funds.
Funds may invest in Fidelity Central Funds, which are open-end investment companies generally available only to other investment companies and accounts managed by the investment adviser and its affiliates. The Schedule of Investments lists any Fidelity Central Funds held as an investment as of period end, but does not include the underlying holdings of each Fidelity Central Fund. An investing fund indirectly bears its proportionate share of the expenses of the underlying Fidelity Central Funds.
Based on its investment objective, each Fidelity Central Fund may invest or participate in various investment vehicles or strategies that are similar to those of the investing fund. These strategies are consistent with the investment objectives of the investing fund and may involve certain economic risks which may cause a decline in value of each of the Fidelity Central Funds and thus a decline in the value of the investing fund.
| Fidelity Central Fund | Investment Manager | Investment Objective | Investment Practices | Expense RatioA |
| Fidelity Money Market Central Funds | Fidelity Management & Research Company LLC (FMR) | Each fund seeks to obtain a high level of current income consistent with the preservation of capital and liquidity. | Short-term Investments | Less than .005% |
A Expenses expressed as a percentage of average net assets and are as of each underlying Central Fund's most recent annual or semi-annual shareholder report.
A complete unaudited list of holdings for each Fidelity Central Fund is available upon request or at the Securities and Exchange Commission website at www.sec.gov. In addition, the financial statements of the Fidelity Central Funds which contain the significant accounting policies (including investment valuation policies) of those funds, and are not covered by the Report of Independent Registered Public Accounting Firm, are available on the Securities and Exchange Commission website or upon request.
3. Significant Accounting Policies.
The Fund is an investment company and applies the accounting and reporting guidance of the Financial Accounting Standards Board (FASB) Accounting Standards Codification Topic 946 Financial Services - Investment Companies. The financial statements have been prepared in conformity with accounting principles generally accepted in the United States of America (GAAP), which require management to make certain estimates and assumptions at the date of the financial statements. Actual results could differ from those estimates. The Fund operates as a single operating segment. The Fund's income, expenses, assets, and performance are regularly monitored and assessed as a whole by the investment adviser and other individuals responsible for oversight functions of the Trust, using the information presented in the financial statements and financial highlights. Subsequent events, if any, through the date that the financial statements were issued have been evaluated in the preparation of the financial statements. The Fund's Schedule of Investments lists any underlying mutual funds or exchange-traded funds (ETFs) but does not include the underlying holdings of these funds. The following summarizes the significant accounting policies of the Fund:
Investment Valuation. Investments are valued as of 4:00 p.m. Eastern time on the last calendar day of the period. The Board of Trustees (the Board) has designated the Fund's investment adviser as the valuation designee responsible for the fair valuation function and performing fair value determinations as needed. The investment adviser has established a Fair Value Committee (the Committee) to carry out the day-to-day fair valuation responsibilities and has adopted policies and procedures to govern the fair valuation process and the activities of the Committee. In accordance with these fair valuation policies and procedures, which have been approved by the Board, the Fund attempts to obtain prices from one or more third party pricing services or brokers to value its investments. When current market prices, quotations or currency exchange rates are not readily available or reliable, investments will be fair valued in good faith by the Committee, in accordance with the policies and procedures. Factors used in determining fair value vary by investment type and may include market or investment specific events, transaction data, estimated cash flows, and market observations of comparable investments. The frequency that the fair valuation procedures are used cannot be predicted and they may be utilized to a significant extent. The Committee manages the Fund's fair valuation practices and maintains the fair valuation policies and procedures. The Fund's investment adviser reports to the Board information regarding the fair valuation process and related material matters.
The Fund categorizes the inputs to valuation techniques used to value its investments into a disclosure hierarchy consisting of three levels as shown below:
Level 1 - unadjusted quoted prices in active markets for identical investments
Level 2 - other significant observable inputs (including quoted prices for similar investments, interest rates, prepayment speeds, etc.)
Level 3 - unobservable inputs (including the Fund's own assumptions based on the best information available)
Valuation techniques used to value the Fund's investments by major category are as follows:
Equity securities, including restricted securities, for which market quotations are readily available, are valued at the last reported sale price or official closing price as reported by a third party pricing service on the primary market or exchange on which they are traded and are categorized as Level 1 in the hierarchy. In the event there were no sales during the day or closing prices are not available, securities are valued at the last quoted bid price or may be valued using the last available price and are generally categorized as Level 2 in the hierarchy. For foreign equity securities, when market or security specific events arise, comparisons to the valuation of American Depositary Receipts (ADRs), futures contracts, Exchange-Traded Funds (ETFs) and certain indexes as well as quoted prices for similar securities may be used and would be categorized as Level 2 in the hierarchy. For equity securities, including restricted securities, where observable inputs are limited, assumptions about market activity and risk are used and these securities may be categorized as Level 3 in the hierarchy.
Investments in open-end mutual funds, including the Fidelity Central Funds, are valued at their closing net asset value (NAV) each business day and are categorized as Level 1 in the hierarchy.
Changes in valuation techniques may result in transfers in or out of an assigned level within the disclosure hierarchy. The aggregate value of investments by input level as of December 31, 2024 is included at the end of the Fund's Schedule of Investments.
Foreign Currency. Certain Funds may use foreign currency contracts to facilitate transactions in foreign-denominated securities. Gains and losses from these transactions may arise from changes in the value of the foreign currency or if the counterparties do not perform under the contracts' terms.
Foreign-denominated assets, including investment securities, and liabilities are translated into U.S. dollars at the exchange rates at period end. Purchases and sales of investment securities, income and dividends received, and expenses denominated in foreign currencies are translated into U.S. dollars at the exchange rate in effect on the transaction date.
The effects of exchange rate fluctuations on investments are included with the net realized and unrealized gain (loss) on investment securities. Other foreign currency transactions resulting in realized and unrealized gain (loss) are disclosed separately.
Investment Transactions and Income. For financial reporting purposes, the Fund's investment holdings and NAV include trades executed through the end of the last business day of the period. The NAV per share for processing shareholder transactions is calculated as of the close of business of the New York Stock Exchange (NYSE), normally 4:00 p.m. Eastern time and includes trades executed through the end of the prior business day. Gains and losses on securities sold are determined on the basis of identified cost and include proceeds received from litigation. Commissions paid to certain brokers with whom the investment adviser, or its affiliates, places trades on behalf of a fund include an amount in addition to trade execution, which may be rebated back to a fund. Any such rebates are included in net realized gain (loss) on investments in the Statement of Operations. Dividend income is recorded on the ex-dividend date, except for certain dividends from foreign securities where the ex-dividend date may have passed, which are recorded as soon as the Fund is informed of the ex-dividend date. Non-cash dividends included in dividend income, if any, are recorded at the fair market value of the securities received. Income and capital gain distributions from Fidelity Central Funds, if any, are recorded on the ex-dividend date. Investment income is recorded net of foreign taxes withheld where recovery of such taxes is uncertain. Funds may file withholding tax reclaims in certain jurisdictions to recover a portion of amounts previously withheld. Any withholding tax reclaims income is included in the Statement of Operations in dividends. Any receivables for withholding tax reclaims are included in the Statement of Assets and Liabilities in dividends receivable.
Class Allocations and Expenses. Investment income, realized and unrealized capital gains and losses, common expenses of a fund, and certain fund-level expense reductions, if any, are allocated daily on a pro-rata basis to each class based on the relative net assets of each class to the total net assets of a fund. Each class differs with respect to transfer agent and distribution and service plan fees incurred, as applicable. Certain expense reductions may also differ by class, if applicable. For the reporting period, the allocated portion of income and expenses to each class as a percent of its average net assets may vary due to the timing of recording these transactions in relation to fluctuating net assets of the classes. Expenses directly attributable to a fund are charged to that fund. Expenses attributable to more than one fund are allocated among the respective funds on the basis of relative net assets or other appropriate methods. Expenses included in the accompanying financial statements reflect the expenses of that fund and do not include any expenses associated with any underlying mutual funds or exchange-traded funds (ETFs). Although not included in a fund's expenses, a fund indirectly bears its proportionate share of these expenses through the net asset value of each underlying mutual fund or exchange-traded fund (ETF). Expense estimates are accrued in the period to which they relate and adjustments are made when actual amounts are known.
Income Tax Information and Distributions to Shareholders. Each year, the Fund intends to qualify as a regulated investment company under Subchapter M of the Internal Revenue Code, including distributing substantially all of its taxable income and realized gains. As a result, no provision for U.S. Federal income taxes is required. As of December 31, 2024, the Fund did not have any unrecognized tax benefits in the financial statements; nor is the Fund aware of any tax positions for which it is reasonably possible that the total amounts of unrecognized tax benefits will significantly change in the next twelve months. The Fund files a U.S. federal tax return, in addition to state and local tax returns as required. The Fund's federal income tax returns are subject to examination by the Internal Revenue Service (IRS) for a period of three fiscal years after they are filed. State and local tax returns may be subject to examination for an additional fiscal year depending on the jurisdiction. Foreign taxes are provided for based on the Fund's understanding of the tax rules and rates that exist in the foreign markets in which it invests.
Distributions are declared and recorded on the ex-dividend date. Income and capital gain distributions are declared separately for each class. Income and capital gain distributions are determined in accordance with income tax regulations, which may differ from GAAP.
Capital accounts within the financial statements are adjusted for permanent book-tax differences. These adjustments have no impact on net assets or the results of operations. Capital accounts are not adjusted for temporary book-tax differences which will reverse in a subsequent period.
Book-tax differences are primarily due to foreign currency transactions and losses deferred due to wash sales.
As of period end, the cost and unrealized appreciation (depreciation) in securities, and derivatives if applicable, for federal income tax purposes were as follows:
| Gross unrealized appreciation | $92,669,689 |
| Gross unrealized depreciation | (4,771,525) |
| Net unrealized appreciation (depreciation) | $87,898,164 |
| Tax Cost | $149,409,286 |
The tax-based components of distributable earnings as of period end were as follows:
| Undistributed ordinary income | $627,667 |
| Undistributed long-term capital gain | $19,477,695 |
| Net unrealized appreciation (depreciation) on securities and other investments | $87,897,487 |
The tax character of distributions paid was as follows:
| | December 31, 2024 | December 31, 2023 |
| Ordinary Income | $3,006,161 | $- |
| Long-term Capital Gains | 1,636,674 | - |
| Total | $4,642,835 | $- |
Restricted Securities (including Private Placements). Funds may invest in securities that are subject to legal or contractual restrictions on resale. These securities generally may be resold in transactions exempt from registration or to the public if the securities are registered. Disposal of these securities may involve time-consuming negotiations and expense, and prompt sale at an acceptable price may be difficult. Information regarding restricted securities held at period end is included at the end of the Schedule of Investments, if applicable.
Special Purpose Acquisition Companies. Funds may invest in stock, warrants, and other securities of special purpose acquisition companies (SPACs) or similar special purpose entities. A SPAC is a publicly traded company that raises investment capital via an initial public offering (IPO) for the purpose of acquiring the equity securities of one or more existing companies via merger, business combination, acquisition or other similar transactions within a designated time frame.
Private Investment in Public Equity. Funds may acquire equity securities of an issuer through a private investment in a public equity (PIPE) transaction, including through commitments to purchase securities on a when-issued basis. A PIPE typically involves the purchase of securities directly from a publicly traded company in a private placement transaction. Securities purchased through PIPE transactions will be restricted from trading and considered illiquid until a resale registration statement for the shares is filed and declared effective.
At the current and/or prior period end, the Fund had commitments to purchase when-issued securities through PIPE transactions with SPACs. The commitments are contingent upon the SPACs acquiring the securities of target companies. Unrealized appreciation (depreciation) on any commitments outstanding at period end is separately presented in the Consolidated Statement of Assets and Liabilities as Unrealized appreciation (depreciation) on unfunded commitments, and any change in unrealized appreciation (depreciation) on unfunded commitments during the period is separately presented in the Consolidated Statement of Operations, as applicable.
New Accounting Pronouncement. FASB Accounting Standards Update (ASU) 2023-07 Segment Reporting (Topic 280): Improvements to Reportable Segment Disclosures became effective in this reporting period. ASU 2023-07 enhances segment information disclosure in the notes to financial statements.
4. Purchases and Sales of Investments.
Purchases and sales of securities, other than short-term securities and in-kind transactions, as applicable, are noted in the table below.
| | Purchases ($) | Sales ($) |
| VIP Communication Services Portfolio | 156,557,562 | 180,471,417 |
5.Fees and Other Transactions with Affiliates.
Management Fee. Fidelity Management & Research Company LLC (the investment adviser) and its affiliates provide the Fund with investment management related services for which the Fund pays a monthly management fee.
Effective March 1, 2024, the Fund's management contract was amended to incorporate administrative services previously covered under separate services agreements (Transfer Agent and Accounting agreements). The amended contract incorporates a management fee rate that may vary by class. The investment adviser or an affiliate pays certain expenses of managing and operating the Fund out of each class's management fee. Each class of the Fund pays a management fee to the investment adviser. The management fee is calculated and paid to the investment adviser every month. When determining a class's management fee, a mandate rate is calculated based on the monthly average net assets of a group of funds advised by FMR within a designated asset class. A discount rate is subtracted from the mandate rate once the Fund's monthly average net assets reach a certain level. The mandate rate and discount rate may vary by class. The annual management fee rate for a class of shares of the Fund is the lesser of (1) the class's mandate rate reduced by the class's discount rate (if applicable) or (2) the amount set forth in the following table.
| | Maximum Management Fee Rate % |
| Initial Class | .58 |
| Investor Class | .66 |
One-twelfth of the management fee rate for a class is applied to the average net assets of the class for the month, giving a dollar amount which is the management fee for the class for that month. A different management fee rate may be applicable to each class of the Fund. The difference between classes is the result of separate arrangements for class-level services and/or waivers of certain expenses. It is not the result of any difference in advisory or custodial fees or other expenses related to the management of the Fund's assets, which do not vary by class. For the portion of the reporting period on or after March 1, 2024, the total annualized management fee rates were as follows:
| | Total Management Fee Rate % |
| Initial Class | .58 |
| Investor Class | .66 |
Prior to March 1, 2024, the management fee was the sum of an individual fund fee rate that was based on an annual rate of .30% of the Fund's average net assets and an annualized group fee rate that averaged .22% during the period. The group fee rate was based upon the monthly average net assets of a group of registered investment companies with which the investment adviser has management contracts. The group fee rate decreased as assets under management increased and increased as assets under management decreased. For the portion of the reporting period prior to March 1, 2024, the total annualized management fee rate was .52%.
Effective March 1, 2024, the Fund's sub-advisory agreements with FMR Investment Management (UK) Limited, Fidelity Management & Research (Hong Kong) Limited, and Fidelity Management & Research (Japan) Limited were amended to provide that the investment adviser pays each sub-adviser monthly fees equal to 110% of the sub-adviser's costs for providing sub-advisory services.
Transfer Agent Fees. Fidelity Investments Institutional Operations Company LLC (FIIOC), an affiliate of the investment adviser, is the Fund's transfer, dividend disbursing, and shareholder servicing agent. Effective March 1, 2024, the Fund's management contract was amended to incorporate transfer agent services and associated fees previously covered under a separate services agreement.
During the period January 1, 2024 through February 29, 2024, the transfer agent fees for each class were a fixed annual rate of class-level average net assets as follows:
| | Amount ($) | % of Class-Level Average Net Assets |
| Initial Class | 2,562 | .0630 |
| Investor Class | 41,932 | .1390 |
| | 44,494 | |
Accounting Fees. Fidelity Service Company, Inc. (FSC), an affiliate of the investment adviser, maintains the Fund's accounting records. Effective March 1, 2024, the Fund's management contract was amended to incorporate accounting services and associated fees previously covered under a separate services agreement.
During the period January 1, 2024 through February 29, 2024, the accounting fees were a fixed annual rate of average net assets as follows:
| | % of Average Net Assets |
| VIP Communication Services Portfolio | .0353 |
Brokerage Commissions. A portion of portfolio transactions were placed with brokerage firms which are affiliates of the investment adviser. Brokerage commissions are included in net realized gain (loss) and change in net unrealized appreciation (depreciation) in the Statement of Operations. The commissions paid to these affiliated firms were as follows:
| | Amount ($) |
| VIP Communication Services Portfolio | 4,796 |
Interfund Lending Program. Pursuant to an Exemptive Order issued by the Securities and Exchange Commission (the SEC), the Fund, along with other registered investment companies having management contracts with Fidelity Management & Research Company LLC (FMR), or other affiliated entities of FMR, may participate in an interfund lending program. This program provides an alternative credit facility allowing the Fund to borrow from, or lend money to, other participating affiliated funds at rates that are beneficial to both the borrowing and lending fund. Borrowings under the program are generally for temporary or emergency purposes, including meeting fund shareholder redemptions. The interfund loan rate is determined, as specified in the Exemptive Order, by averaging, (1) the higher of the overnight time deposit rate and the current overnight repurchase agreement rate, and (2) a benchmark rate representing the lowest bank loan rate available to the funds. At period end, there were no interfund loans outstanding. Activity in this program during the period for which loans were outstanding was as follows:
| | Borrower or Lender | Average Loan Balance ($) | Weighted Average Interest Rate | Interest Expense ($) |
VIP Communication Services Portfolio | Borrower | 4,168,000 | 5.57% | 4,514 |
Interfund Trades. Funds may purchase from or sell securities to other Fidelity Funds under procedures adopted by the Board. The procedures have been designed to ensure these interfund trades are executed in accordance with Rule 17a-7 of the 1940 Act. Any interfund trades are included within the respective purchases and sales amounts shown in the Purchases and Sales of Investments note. Interfund trades during the period are noted in the table below.
| | Purchases ($) | Sales ($) | Realized Gain (Loss) ($) |
| VIP Communication Services Portfolio | 4,815,605 | 16,120,036 | 2,938,666 |
6. Committed Line of Credit.
Certain Funds participate with other funds managed by the investment adviser or an affiliate in a $4.25 billion credit facility (the "line of credit") to be utilized for temporary or emergency purposes to fund shareholder redemptions or for other short-term liquidity purposes.
Commitment fees are charged based on the unused amount of the line of credit at an annual rate of .10%, and then allocated to each participating fund based on its pro-rata portion of the line of credit. The commitment fees are reflected in Miscellaneous expenses on the Statement of Operations, and are listed below.
Interest is charged to a participating fund based on its borrowings at an annual rate of .75% plus the highest of (i) daily SOFR plus a .10% spread adjustment, (ii) Federal Funds Effective Rate, or (iii) Overnight Bank Funding Rate. During the period, there were no borrowings on this line of credit.
The line of credit agreement will expire in March 2025 unless extended or renewed.
| | Amount ($) |
| VIP Communication Services Portfolio | 329 |
7. Security Lending.
Funds lend portfolio securities from time to time in order to earn additional income. Lending agents are used, including National Financial Services (NFS), an affiliate of the investment adviser. Pursuant to a securities lending agreement, NFS will receive a fee, which is capped at 9.9% of a fund's daily lending revenue, for its services as lending agent. A fund may lend securities to certain qualified borrowers, including NFS. On the settlement date of the loan, a fund receives collateral (in the form of U.S. Treasury obligations, letters of credit and/or cash) against the loaned securities and maintains collateral in an amount not less than 100% of the market value of the loaned securities during the period of the loan. The market value of the loaned securities is determined at the close of business of a fund and any additional required collateral is delivered to a fund on the next business day. A fund or borrower may terminate the loan at any time, and if the borrower defaults on its obligation to return the securities loaned because of insolvency or other reasons, a fund may apply collateral received from the borrower against the obligation. A fund may experience delays and costs in recovering the securities loaned. Any cash collateral received is invested in the Fidelity Securities Lending Cash Central Fund. Any loaned securities are identified as such in the Schedule of Investments, and the value of loaned securities and cash collateral at period end, as applicable, are presented in the Statement of Assets and Liabilities. Security lending income represents the income earned on investing cash collateral, less rebates paid to borrowers and any lending agent fees associated with the loan, plus any premium payments received for lending certain types of securities. Security lending income is presented in the Statement of Operations as a component of income from Fidelity Central Funds. Affiliated security lending activity, if any, was as follows:
| | Total Security Lending Fees Paid to NFS ($) | Security Lending Income From Securities Loaned to NFS ($) | Value of Securities Loaned to NFS at Period End ($) |
| VIP Communication Services Portfolio | 477 | - | - |
8. Bank Borrowings.
The Fund is permitted to have bank borrowings for temporary or emergency purposes to fund shareholder redemptions or for other short-term liquidity requirements. The Fund has established borrowing arrangements with certain banks. The interest rate on the borrowings is the bank's base rate, as revised from time to time. Any open loans, including accrued interest, at period end are presented under the caption "Notes payable" in the Statement of Assets and Liabilities, if applicable. Activity in this program during the period for which loans were outstanding was as follows:| | Average Loan Balance ($) | Weighted Average Interest Rate | Interest Expense ($) |
| VIP Communication Services Portfolio | 1,757,000 | 5.83% | 285 |
9. Expense Reductions.
During the period the investment adviser or an affiliate reimbursed and/or waived a portion of fund-level operating expenses in the amount of $8,999.
10. Distributions to Shareholders.
Distributions to shareholders of each class were as follows:
| | Year ended December 31, 2024 | Year ended December 31, 2023 |
| VIP Communication Services Portfolio | | |
| Distributions to shareholders | | |
| Initial Class | 511,233 | - |
| Investor Class | 4,131,602 | - |
Total | $4,642,835 | $- |
11. Share Transactions.
Transactions for each class of shares were as follows and may contain in-kind transactions:
| | Shares | Shares | Dollars | Dollars |
| | Year ended December 31, 2024 | Year ended December 31, 2023 | Year ended December 31, 2024 | Year ended December 31, 2023 |
| VIP Communication Services Portfolio | | | | |
| Initial Class | | | | |
| Shares sold | 194,670 | 839,661 | $4,045,746 | $12,501,860 |
| Reinvestment of distributions | 23,120 | - | 511,233 | - |
| Shares redeemed | (485,894) | (236,252) | (10,020,408) | (3,486,397) |
| Net increase (decrease) | (268,104) | 603,409 | $(5,463,429) | $9,015,463 |
| Investor Class | | | | |
| Shares sold | 1,810,384 | 5,204,519 | $37,925,862 | $76,243,601 |
| Reinvestment of distributions | 187,872 | - | 4,131,602 | - |
| Shares redeemed | (2,628,644) | (1,406,419) | (53,248,373) | (21,355,720) |
| Net increase (decrease) | (630,388) | 3,798,100 | $(11,190,909) | $54,887,881 |
12. Other.
A fund's organizational documents provide former and current trustees and officers with a limited indemnification against liabilities arising in connection with the performance of their duties to the fund. In the normal course of business, a fund may also enter into contracts that provide general indemnifications. A fund's maximum exposure under these arrangements is unknown as this would be dependent on future claims that may be made against a fund. The risk of material loss from such claims is considered remote.
At the end of the period, the investment adviser or its affiliates were owners of record of more than 10% of the outstanding shares as follows:
| Fund | Affiliated % |
VIP Communication Services Portfolio | 100% |
13. Risk and Uncertainties.
Many factors affect a fund's performance. Developments that disrupt global economies and financial markets, such as pandemics, epidemics, outbreaks of infectious diseases, war, terrorism, and environmental disasters, may significantly affect a fund's investment performance. The effects of these developments to a fund will be impacted by the types of securities in which a fund invests, the financial condition, industry, economic sector, and geographic location of an issuer, and a fund's level of investment in the securities of that issuer. Significant concentrations in security types, issuers, industries, sectors, and geographic locations may magnify the factors that affect a fund's performance.
Report of Independent Registered Public Accounting Firm
To the Board of Trustees of Variable Insurance Products Fund IV and Shareholders of VIP Communication Services Portfolio
Opinion on the Financial Statements
We have audited the accompanying statement of assets and liabilities, including the schedule of investments, of VIP Communication Services Portfolio (one of the funds constituting Variable Insurance Products Fund IV, referred to hereafter as the "Fund") as of December 31, 2024, the related statement of operations for the year ended December 31, 2024, the statement of changes in net assets for each of the two years in the period ended December 31, 2024, including the related notes, and the financial highlights for each of the five years in the period ended December 31, 2024 (collectively referred to as the "financial statements"). In our opinion, the financial statements present fairly, in all material respects, the financial position of the Fund as of December 31, 2024, the results of its operations for the year then ended, the changes in its net assets for each of the two years in the period ended December 31, 2024 and the financial highlights for each of the five years in the period ended December 31, 2024 in conformity with accounting principles generally accepted in the United States of America.
Basis for Opinion
These financial statements are the responsibility of the Fund's management. Our responsibility is to express an opinion on the Fund's financial statements based on our audits. We are a public accounting firm registered with the Public Company Accounting Oversight Board (United States) (PCAOB) and are required to be independent with respect to the Fund in accordance with the U.S. federal securities laws and the applicable rules and regulations of the Securities and Exchange Commission and the PCAOB.
We conducted our audits of these financial statements in accordance with the standards of the PCAOB. Those standards require that we plan and perform the audit to obtain reasonable assurance about whether the financial statements are free of material misstatement, whether due to error or fraud.
Our audits included performing procedures to assess the risks of material misstatement of the financial statements, whether due to error or fraud, and performing procedures that respond to those risks. Such procedures included examining, on a test basis, evidence regarding the amounts and disclosures in the financial statements. Our audits also included evaluating the accounting principles used and significant estimates made by management, as well as evaluating the overall presentation of the financial statements. Our procedures included confirmation of securities owned as of December 31, 2024 by correspondence with the custodian, issuers of privately offered securities and brokers; when replies were not received from brokers, we performed other auditing procedures. We believe that our audits provide a reasonable basis for our opinion.
/s/ PricewaterhouseCoopers LLP
Boston, Massachusetts
February 11, 2025
We have served as the auditor of one or more investment companies in the Fidelity group of funds since 1932.
Distributions
(Unaudited)The dividend and capital gains distributions for the fund(s) are available on Fidelity.com or Institutional.Fidelity.com.
The fund hereby designates as a capital gain dividend with respect to the taxable year ended December 31, 2024, $19,499,467, or, if subsequently determined to be different, the net capital gain of such year.
The fund designates $69,740 of distributions paid during the fiscal year ended 2024 as qualifying to be taxed as section 163(j) interest dividends.
Initial Class and Investor Class designate 43% of the dividends distributed during the fiscal year as qualifying for the dividends-received deduction for corporate shareholders.
Item 8: Changes in and Disagreements with Accountants for Open-End Management Investment Companies
(Unaudited)
Note: This is not applicable for any fund included in this document.
Item 9: Proxy Disclosures for Open-End Management Investment Companies
(Unaudited)
| A special meeting of shareholders was held on July 16, 2024. The results of votes taken among shareholders on the proposal before them are reported below. Each vote reported represents one dollar of net asset value held on the record date for the meeting. |
| Proposal 1 |
| To elect a Board of Trustees. |
| | # of Votes | % of Votes |
| Bettina Doulton |
| Affirmative | 5,501,492,681.85 | 94.15 |
| Withheld | 341,991,035.05 | 5.85 |
| TOTAL | 5,843,483,716.90 | 100.00 |
| Robert A. Lawrence |
| Affirmative | 5,480,901,467.70 | 93.80 |
| Withheld | 362,582,249.21 | 6.20 |
| TOTAL | 5,843,483,716.90 | 100.00 |
| Vijay C. Advani |
| Affirmative | 5,500,352,811.04 | 94.13 |
| Withheld | 343,130,905.86 | 5.87 |
| TOTAL | 5,843,483,716.90 | 100.00 |
| Thomas P. Bostick |
| Affirmative | 5,488,165,362.69 | 93.92 |
| Withheld | 355,318,354.21 | 6.08 |
| TOTAL | 5,843,483,716.90 | 100.00 |
| Donald F. Donahue |
| Affirmative | 5,482,960,893.76 | 93.83 |
| Withheld | 360,522,823.14 | 6.17 |
| TOTAL | 5,843,483,716.90 | 100.00 |
| Vicki L. Fuller |
| Affirmative | 5,492,283,337.89 | 93.99 |
| Withheld | 351,200,379.01 | 6.01 |
| TOTAL | 5,843,483,716.90 | 100.00 |
| Patricia L. Kampling |
| Affirmative | 5,521,992,715.20 | 94.50 |
| Withheld | 321,491,001.70 | 5.50 |
| TOTAL | 5,843,483,716.90 | 100.00 |
| Thomas A. Kennedy |
| Affirmative | 5,484,789,158.10 | 93.86 |
| Withheld | 358,694,558.80 | 6.14 |
| TOTAL | 5,843,483,716.90 | 100.00 |
| Oscar Munoz |
| Affirmative | 5,497,884,744.63 | 94.09 |
| Withheld | 345,598,972.27 | 5.91 |
| TOTAL | 5,843,483,716.90 | 100.00 |
| Karen B. Peetz |
| Affirmative | 5,503,968,240.81 | 94.19 |
| Withheld | 339,515,476.09 | 5.81 |
| TOTAL | 5,843,483,716.90 | 100.00 |
| David M. Thomas |
| Affirmative | 5,466,218,204.40 | 93.54 |
| Withheld | 377,265,512.50 | 6.46 |
| TOTAL | 5,843,483,716.90 | 100.00 |
| Susan Tomasky |
| Affirmative | 5,463,402,825.36 | 93.50 |
| Withheld | 380,080,891.54 | 6.50 |
| TOTAL | 5,843,483,716.90 | 100.00 |
| Michael E. Wiley |
| Affirmative | 5,466,838,155.74 | 93.55 |
| Withheld | 376,645,561.16 | 6.45 |
| TOTAL | 5,843,483,716.90 | 100.00 |
| | | |
| Proposal 1 reflects trust-wide proposal and voting results. |
Item 10: Remuneration Paid to Directors, Officers, and others of Open-End Management Investment Companies
(Unaudited)
Note: This information is disclosed as part of the financial statements for each Fund as part of Item 7: Financial Statements and Financial Highlights for Open-End Management Investment companies.
Item 11: Statement Regarding Basis for Approval of Investment Advisory Contract
(Unaudited)
Note: This is not applicable for any fund included in this document.
1.851004.117
VTELP-ANN-0325
Fidelity® Variable Insurance Products:
VIP Consumer Staples Portfolio
Annual Report
December 31, 2024
Contents
To view a fund's proxy voting guidelines and proxy voting record for the 12-month period ended June 30, visit http://www.fidelity.com/proxyvotingresults or visit the Securities and Exchange Commission's (SEC) web site at http://www.sec.gov.
You may also call 1-877-208-0098 to request a free copy of the proxy voting guidelines.
Fidelity® Variable Insurance Products are separate account options which are purchased through a variable insurance contract.
Standard & Poor's, S&P and S&P 500 are registered service marks of The McGraw-Hill Companies, Inc. and have been licensed for use by Fidelity Distributors Corporation.
Other third-party marks appearing herein are the property of their respective owners.
All other marks appearing herein are registered or unregistered trademarks or service marks of FMR LLC or an affiliated company. © 2025 FMR LLC. All rights reserved.
This report and the financial statements contained herein are submitted for the general information of the shareholders of the Fund. This report is not authorized for distribution to prospective investors in the Fund unless preceded or accompanied by an effective prospectus.
A fund files its complete schedule of portfolio holdings with the SEC for the first and third quarters of each fiscal year on Form N-PORT. Forms N-PORT are available on the SEC's web site at http://www.sec.gov. A fund's Forms N-PORT may be reviewed and copied at the SEC's Public Reference Room in Washington, DC. Information regarding the operation of the SEC's Public Reference Room may be obtained by calling 1-800-SEC-0330.
For a complete list of a fund's portfolio holdings, view the most recent holdings listing, semiannual report, or annual report on Fidelity's web site at http://www.fidelity.com, http://www.institutional.fidelity.com, or http://www.401k.com, as applicable.
NOT FDIC INSURED •MAY LOSE VALUE •NO BANK GUARANTEE
Neither the Fund nor Fidelity Distributors Corporation is a bank.
Item 7: Financial Statements and Financial Highlights for Open-End Management Investment Companies (Annual Report)
VIP Consumer Staples Portfolio
Schedule of Investments December 31, 2024
Showing Percentage of Net Assets
| Common Stocks - 100.0% |
| | | Shares | Value ($) |
| UNITED KINGDOM - 3.8% | | | |
| Consumer Staples - 3.8% | | | |
| Beverages - 1.8% | | | |
| Diageo PLC | | 129,616 | 4,118,916 |
| Food Products - 1.3% | | | |
| Nomad Foods Ltd | | 179,241 | 3,007,664 |
| Tobacco - 0.7% | | | |
| British American Tobacco PLC ADR | | 50,300 | 1,826,895 |
| TOTAL UNITED KINGDOM | | | 8,953,475 |
| UNITED STATES - 96.2% | | | |
| Consumer Staples - 96.2% | | | |
| Beverages - 39.7% | | | |
| Boston Beer Co Inc/The Class A (b) | | 27,450 | 8,234,451 |
| Brown-Forman Corp Class B (a) | | 50,800 | 1,929,384 |
| Celsius Holdings Inc (b) | | 48,700 | 1,282,758 |
| Coca-Cola Co/The | | 489,738 | 30,491,088 |
| Constellation Brands Inc Class A | | 51,516 | 11,385,036 |
| Keurig Dr Pepper Inc | | 750,173 | 24,095,557 |
| Monster Beverage Corp (b) | | 164,178 | 8,629,196 |
| PepsiCo Inc | | 46,202 | 7,025,476 |
| | | | 93,072,946 |
| Consumer Staples Distribution & Retail - 13.5% | | | |
| Albertsons Cos Inc | | 218,300 | 4,287,412 |
| Target Corp | | 67,913 | 9,180,479 |
| Walmart Inc | | 203,027 | 18,343,490 |
| | | | 31,811,381 |
| Food Products - 15.6% | | | |
| Archer-Daniels-Midland Co | | 121,200 | 6,123,024 |
| Bunge Global SA | | 29,907 | 2,325,568 |
| JM Smucker Co | | 82,300 | 9,062,876 |
| Kraft Heinz Co/The | | 101,500 | 3,117,065 |
| Lamb Weston Holdings Inc | | 38,052 | 2,543,015 |
| Mondelez International Inc | | 120,861 | 7,219,028 |
| Simply Good Foods Co/The (b) | | 12,500 | 487,250 |
| TreeHouse Foods Inc (b) | | 121,516 | 4,268,857 |
| Tyson Foods Inc Class A | | 25,834 | 1,483,905 |
| | | | 36,630,588 |
| Household Products - 17.7% | | | |
| Energizer Holdings Inc | | 238,987 | 8,338,256 |
| Procter & Gamble Co/The | | 193,275 | 32,402,554 |
| Reynolds Consumer Products Inc | | 29,000 | 782,710 |
| | | | 41,523,520 |
| Personal Care Products - 7.7% | | | |
| Estee Lauder Cos Inc/The Class A | | 136,545 | 10,238,144 |
| Kenvue Inc | | 372,186 | 7,946,171 |
| | | | 18,184,315 |
| Tobacco - 2.0% | | | |
| JUUL Labs Inc Class A (b)(c)(d) | | 746,394 | 753,858 |
| Philip Morris International Inc | | 33,043 | 3,976,725 |
| | | | 4,730,583 |
| TOTAL UNITED STATES | | | 225,953,333 |
| TOTAL COMMON STOCKS (Cost $184,945,782) | | | 234,906,808 |
| | | | |
| Money Market Funds - 0.8% |
| | | Yield (%) | Shares | Value ($) |
Fidelity Securities Lending Cash Central Fund (e)(f) (Cost $1,952,345) | | 4.35 | 1,952,149 | 1,952,345 |
| | | | | |
| TOTAL INVESTMENT IN SECURITIES - 100.8% (Cost $186,898,127) | 236,859,153 |
NET OTHER ASSETS (LIABILITIES) - (0.8)% | (1,780,072) |
| NET ASSETS - 100.0% | 235,079,081 |
| | |
Legend
| (a) | Security or a portion of the security is on loan at period end. |
| (d) | Restricted securities (including private placements) - Investment in securities not registered under the Securities Act of 1933 (excluding 144A issues). At the end of the period, the value of restricted securities (excluding 144A issues) amounted to $753,858 or 0.3% of net assets. |
| (e) | Investment made with cash collateral received from securities on loan. |
| (f) | Affiliated fund that is generally available only to investment companies and other accounts managed by Fidelity Investments. The rate quoted is the annualized seven-day yield of the fund at period end. A complete unaudited listing of the fund's holdings as of its most recent quarter end is available upon request. In addition, each Fidelity Central Fund's financial statements, which are not covered by the Fund's Report of Independent Registered Public Accounting Firm, are available on the SEC's website or upon request. |
| Additional information on each restricted holding is as follows: |
| Security | Acquisition Date | Acquisition Cost ($) |
| JUUL Labs Inc Class A | 2/23/24 | 757,568 |
| | | |
Affiliated Central Funds
Fiscal year to date information regarding the Fund's investments in Fidelity Central Funds, including the ownership percentage, is presented below.
| Affiliate | Value, beginning of period ($) | Purchases ($) | Sales Proceeds ($) | Dividend Income ($) | Realized Gain (loss) ($) | Change in Unrealized appreciation (depreciation) ($) | Value, end of period ($) | Shares, end of period | % ownership, end of period |
| Fidelity Cash Central Fund | - | 25,255,341 | 25,255,341 | 27,333 | - | - | - | - | 0.0% |
| Fidelity Securities Lending Cash Central Fund | 851,026 | 37,607,905 | 36,506,586 | 1,357 | - | - | 1,952,345 | 1,952,149 | 0.0% |
| Total | 851,026 | 62,863,246 | 61,761,927 | 28,690 | - | - | 1,952,345 | 1,952,149 | |
| | | | | | | | | | |
Amounts in the dividend income column in the above table include any capital gain distributions from underlying funds, which are presented in the corresponding line item in the Statement of Operations, if applicable.
Amounts in the dividend income column for Fidelity Securities Lending Cash Central Fund represents the income earned on investing cash collateral, less rebates paid to borrowers and any lending agent fees associated with the loan, plus any premium payments received for lending certain types of securities.
Amounts included in the purchases and sales proceeds columns may include in-kind transactions, if applicable.
Investment Valuation
The following is a summary of the inputs used, as of December 31, 2024, involving the Fund's assets and liabilities carried at fair value. The inputs or methodology used for valuing securities may not be an indication of the risk associated with investing in those securities. For more information on valuation inputs, and their aggregation into the levels used below, please refer to the Investment Valuation section in the accompanying Notes to Financial Statements.
| Valuation Inputs at Reporting Date: |
| Description | Total ($) | Level 1 ($) | Level 2 ($) | Level 3 ($) |
Investments in Securities: | | | | |
|
| Common Stocks | | | | |
Consumer Staples | 234,906,808 | 230,034,034 | 4,118,916 | 753,858 |
|
| Money Market Funds | 1,952,345 | 1,952,345 | - | - |
| Total Investments in Securities: | 236,859,153 | 231,986,379 | 4,118,916 | 753,858 |
Financial Statements
| Statement of Assets and Liabilities |
As of December 31, 2024 |
| Assets | | | | |
| Investment in securities, at value (including securities loaned of $1,925,586) - See accompanying schedule: | | | | |
Unaffiliated issuers (cost $184,945,782) | $ | 234,906,808 | | |
Fidelity Central Funds (cost $1,952,345) | | 1,952,345 | | |
| | | | | |
| | | | | |
| Total Investment in Securities (cost $186,898,127) | | | $ | 236,859,153 |
| Foreign currency held at value (cost $129) | | | | 128 |
| Receivable for investments sold | | | | 585,454 |
| Receivable for fund shares sold | | | | 4,854 |
| Dividends receivable | | | | 264,963 |
| Distributions receivable from Fidelity Central Funds | | | | 692 |
| Prepaid expenses | | | | 269 |
Total assets | | | | 237,715,513 |
| Liabilities | | | | |
| Payable to custodian bank | $ | 466,174 | | |
| Payable for fund shares redeemed | | 38,891 | | |
| Accrued management fee | | 131,491 | | |
| Distribution and service plan fees payable | | 164 | | |
| Other payables and accrued expenses | | 47,762 | | |
| Collateral on securities loaned | | 1,951,950 | | |
| Total liabilities | | | | 2,636,432 |
| Net Assets | | | $ | 235,079,081 |
| Net Assets consist of: | | | | |
| Paid in capital | | | $ | 173,257,902 |
| Total accumulated earnings (loss) | | | | 61,821,179 |
| Net Assets | | | $ | 235,079,081 |
| | | | | |
| Net Asset Value and Maximum Offering Price | | | | |
| Initial Class : | | | | |
Net Asset Value, offering price and redemption price per share ($22,400,533 ÷ 1,147,762 shares) | | | $ | 19.52 |
| Service Class 2 : | | | | |
Net Asset Value, offering price and redemption price per share ($785,262 ÷ 40,375 shares) | | | $ | 19.45 |
| Investor Class : | | | | |
Net Asset Value, offering price and redemption price per share ($211,893,286 ÷ 10,921,979 shares) | | | $ | 19.40 |
| Statement of Operations |
| Year ended December 31, 2024 |
| Investment Income | | | | |
| Dividends | | | $ | 6,660,010 |
| Income from Fidelity Central Funds (including $1,357 from security lending) | | | | 28,690 |
| Total income | | | | 6,688,700 |
| Expenses | | | | |
| Management fee | $ | 1,569,540 | | |
| Transfer agent fees | | 56,778 | | |
| Distribution and service plan fees | | 1,390 | | |
| Accounting fees | | 15,225 | | |
| Custodian fees and expenses | | 28,981 | | |
| Independent trustees' fees and expenses | | 1,098 | | |
| Audit fees | | 45,088 | | |
| Legal | | 2,945 | | |
| Miscellaneous | | 7,309 | | |
| Total expenses before reductions | | 1,728,354 | | |
| Expense reductions | | (11,609) | | |
| Total expenses after reductions | | | | 1,716,745 |
| Net Investment income (loss) | | | | 4,971,955 |
| Realized and Unrealized Gain (Loss) | | | | |
| Net realized gain (loss) on: | | | | |
| Investment Securities: | | | | |
| Unaffiliated issuers | | 13,441,517 | | |
| Foreign currency transactions | | (2,320) | | |
| Total net realized gain (loss) | | | | 13,439,197 |
| Change in net unrealized appreciation (depreciation) on: | | | | |
| Investment Securities: | | | | |
| Unaffiliated issuers | | (4,892,354) | | |
| Assets and liabilities in foreign currencies | | 24 | | |
| Total change in net unrealized appreciation (depreciation) | | | | (4,892,330) |
| Net gain (loss) | | | | 8,546,867 |
| Net increase (decrease) in net assets resulting from operations | | | $ | 13,518,822 |
| Statement of Changes in Net Assets |
| |
| | Year ended December 31, 2024 | | Year ended December 31, 2023 |
| Increase (Decrease) in Net Assets | | | | |
| Operations | | | | |
| Net investment income (loss) | $ | 4,971,955 | $ | 5,182,711 |
| Net realized gain (loss) | | 13,439,197 | | 8,620,798 |
| Change in net unrealized appreciation (depreciation) | | (4,892,330) | | (6,155,561) |
| Net increase (decrease) in net assets resulting from operations | | 13,518,822 | | 7,647,948 |
| Distributions to shareholders | | (11,776,963) | | (8,672,433) |
| | | | | |
| Share transactions - net increase (decrease) | | (28,377,714) | | (29,065,755) |
| Total increase (decrease) in net assets | | (26,635,855) | | (30,090,240) |
| | | | | |
| Net Assets | | | | |
| Beginning of period | | 261,714,936 | | 291,805,176 |
| End of period | $ | 235,079,081 | $ | 261,714,936 |
| | | | | |
| | | | | |
Financial Highlights
VIP Consumer Staples Portfolio Initial Class |
| |
| Years ended December 31, | | 2024 | | 2023 | | 2022 | | 2021 | | 2020 |
Selected Per-Share Data | | | | | | | | | | |
| Net asset value, beginning of period | $ | 19.40 | $ | 19.46 | $ | 21.13 | $ | 19.84 | $ | 18.76 |
| Income from Investment Operations | | | | | | | | | | |
Net investment income (loss) A,B | | .41 | | .38 | | .35 | | .38 | | .35 |
| Net realized and unrealized gain (loss) | | .65 | | .21 | | (.48) | | 2.27 | | 1.78 |
| Total from investment operations | | 1.06 | | .59 | | (.13) | | 2.65 | | 2.13 |
| Distributions from net investment income | | (.48) C | | (.39) | | (.35) | | (.40) | | (.35) |
| Distributions from net realized gain | | (.47) C | | (.27) | | (1.19) | | (.96) | | (.71) |
| Total distributions | | (.94) D | | (.65) D | | (1.54) | | (1.36) | | (1.05) D |
| Net asset value, end of period | $ | 19.52 | $ | 19.40 | $ | 19.46 | $ | 21.13 | $ | 19.84 |
Total Return E,F | | | | 3.14% | | (.62)% | | 14.24% | | 11.78% |
Ratios to Average Net Assets B,G,H | | | | | | | | | | |
| Expenses before reductions | | .62% | | .65% | | .65% | | .65% | | .67% |
| Expenses net of fee waivers, if any | | | | .65% | | .65% | | .65% | | .66% |
| Expenses net of all reductions | | .62% | | .65% | | .65% | | .65% | | .66% |
| Net investment income (loss) | | 2.06% | | 1.94% | | 1.84% | | 1.89% | | 1.94% |
| Supplemental Data | | | | | | | | | | |
| Net assets, end of period (000 omitted) | $ | 22,401 | $ | 23,583 | $ | 26,707 | $ | 22,366 | $ | 20,009 |
Portfolio turnover rate I | | | | 53% | | 46% | | 64% | | 51% |
ACalculated based on average shares outstanding during the period.
BNet investment income (loss) is affected by the timing of the declaration of dividends by any underlying mutual funds or exchange-traded funds (ETFs). Net investment income (loss) of any mutual funds or ETFs is not included in the Fund's net investment income (loss) ratio.
CThe amount shown reflects reclassifications related to book to tax differences that were made in the year shown.
DTotal distributions per share do not sum due to rounding.
ETotal returns do not reflect charges attributable to your insurance company's separate account. Inclusion of these charges would reduce the total returns shown.
FTotal returns would have been lower if certain expenses had not been reduced during the applicable periods shown.
GFees and expenses of any underlying mutual funds or exchange-traded funds (ETFs) are not included in the Fund's expense ratio. The Fund indirectly bears its proportionate share of these expenses. For additional expense information related to investments in Fidelity Central Funds, please refer to the "Investments in Fidelity Central Funds" note found in the Notes to Financial Statements section of the most recent Annual or Semi-Annual report.
HExpense ratios reflect operating expenses of the class. Expenses before reductions do not reflect amounts reimbursed, waived, or reduced through arrangements with the investment adviser, brokerage services, or other offset arrangements, if applicable, and do not represent the amount paid by the class during periods when reimbursements, waivers or reductions occur.
IAmount does not include the portfolio activity of any underlying mutual funds or exchange-traded funds (ETFs), derivatives or securities that mature within one year from acquisition.
VIP Consumer Staples Portfolio Service Class 2 |
| |
| Years ended December 31, | | 2024 | | 2023 A |
Selected Per-Share Data | | | | |
| Net asset value, beginning of period | $ | 19.38 | $ | 20.26 |
| Income from Investment Operations | | | | |
Net investment income (loss) B,C | | .36 | | .15 |
| Net realized and unrealized gain (loss) | | .65 | | (.45) D |
| Total from investment operations | | 1.01 | | (.30) |
| Distributions from net investment income | | (.47) E | | (.32) |
| Distributions from net realized gain | | (.47) E | | (.27) |
| Total distributions | | (.94) | | (.58) F |
| Net asset value, end of period | $ | 19.45 | $ | 19.38 |
Total Return G,H,I | | | | (1.37)% |
Ratios to Average Net Assets C,J,K | | | | |
| Expenses before reductions | | .88% | | .91% L |
| Expenses net of fee waivers, if any | | | | .91% L |
| Expenses net of all reductions | | .88% | | .91% L |
| Net investment income (loss) | | 1.81% | | 2.11% L |
| Supplemental Data | | | | |
| Net assets, end of period (000 omitted) | $ | 785 | $ | 339 |
Portfolio turnover rate M | | | | 53% L |
AFor the period August 16, 2023 (commencement of sale of shares) through December 31, 2023.
BCalculated based on average shares outstanding during the period.
CNet investment income (loss) is affected by the timing of the declaration of dividends by any underlying mutual funds or exchange-traded funds (ETFs). Net investment income (loss) of any mutual funds or ETFs is not included in the Fund's net investment income (loss) ratio.
DThe amount shown for a share outstanding does not correspond with the aggregate net gain (loss) on investments for the period due to the timing of sales and repurchases of shares in relation to fluctuating market values of the investments of the Fund.
EThe amount shown reflects reclassifications related to book to tax differences that were made in the year shown.
FTotal distributions per share do not sum due to rounding.
GTotal returns for periods of less than one year are not annualized.
HTotal returns do not reflect charges attributable to your insurance company's separate account. Inclusion of these charges would reduce the total returns shown.
ITotal returns would have been lower if certain expenses had not been reduced during the applicable periods shown.
JFees and expenses of any underlying mutual funds or exchange-traded funds (ETFs) are not included in the Fund's expense ratio. The Fund indirectly bears its proportionate share of these expenses. For additional expense information related to investments in Fidelity Central Funds, please refer to the "Investments in Fidelity Central Funds" note found in the Notes to Financial Statements section of the most recent Annual or Semi-Annual report.
KExpense ratios reflect operating expenses of the class. Expenses before reductions do not reflect amounts reimbursed, waived, or reduced through arrangements with the investment adviser, brokerage services, or other offset arrangements, if applicable, and do not represent the amount paid by the class during periods when reimbursements, waivers or reductions occur.
LAnnualized.
MAmount does not include the portfolio activity of any underlying mutual funds or exchange-traded funds (ETFs), derivatives or securities that mature within one year from acquisition.
VIP Consumer Staples Portfolio Investor Class |
| |
| Years ended December 31, | | 2024 | | 2023 | | 2022 | | 2021 | | 2020 |
Selected Per-Share Data | | | | | | | | | | |
| Net asset value, beginning of period | $ | 19.29 | $ | 19.35 | $ | 21.02 | $ | 19.75 | $ | 18.68 |
| Income from Investment Operations | | | | | | | | | | |
Net investment income (loss) A,B | | .39 | | .36 | | .34 | | .37 | | .33 |
| Net realized and unrealized gain (loss) | | .65 | | .22 | | (.48) | | 2.24 | | 1.78 |
| Total from investment operations | | 1.04 | | .58 | | (.14) | | 2.61 | | 2.11 |
| Distributions from net investment income | | (.46) C | | (.37) | | (.34) | | (.38) | | (.33) |
| Distributions from net realized gain | | (.47) C | | (.27) | | (1.19) | | (.96) | | (.71) |
| Total distributions | | (.93) | | (.64) | | (1.53) | | (1.34) | | (1.04) |
| Net asset value, end of period | $ | 19.40 | $ | 19.29 | $ | 19.35 | $ | 21.02 | $ | 19.75 |
Total Return D,E | | | | 3.08% | | (.69)% | | 14.11% | | 11.70% |
Ratios to Average Net Assets B,F,G | | | | | | | | | | |
| Expenses before reductions | | .70% | | .73% | | .73% | | .73% | | .74% |
| Expenses net of fee waivers, if any | | | | .72% | | .73% | | .73% | | .74% |
| Expenses net of all reductions | | .70% | | .72% | | .73% | | .73% | | .73% |
| Net investment income (loss) | | 1.99% | | 1.86% | | 1.76% | | 1.81% | | 1.86% |
| Supplemental Data | | | | | | | | | | |
| Net assets, end of period (000 omitted) | $ | 211,893 | $ | 237,792 | $ | 265,098 | $ | 237,025 | $ | 224,492 |
Portfolio turnover rate H | | | | 53% | | 46% | | 64% | | 51% |
ACalculated based on average shares outstanding during the period.
BNet investment income (loss) is affected by the timing of the declaration of dividends by any underlying mutual funds or exchange-traded funds (ETFs). Net investment income (loss) of any mutual funds or ETFs is not included in the Fund's net investment income (loss) ratio.
CThe amount shown reflects reclassifications related to book to tax differences that were made in the year shown.
DTotal returns do not reflect charges attributable to your insurance company's separate account. Inclusion of these charges would reduce the total returns shown.
ETotal returns would have been lower if certain expenses had not been reduced during the applicable periods shown.
FFees and expenses of any underlying mutual funds or exchange-traded funds (ETFs) are not included in the Fund's expense ratio. The Fund indirectly bears its proportionate share of these expenses. For additional expense information related to investments in Fidelity Central Funds, please refer to the "Investments in Fidelity Central Funds" note found in the Notes to Financial Statements section of the most recent Annual or Semi-Annual report.
GExpense ratios reflect operating expenses of the class. Expenses before reductions do not reflect amounts reimbursed, waived, or reduced through arrangements with the investment adviser, brokerage services, or other offset arrangements, if applicable, and do not represent the amount paid by the class during periods when reimbursements, waivers or reductions occur.
HAmount does not include the portfolio activity of any underlying mutual funds or exchange-traded funds (ETFs), derivatives or securities that mature within one year from acquisition.
Notes to Financial Statements
For the period ended December 31, 2024
1. Organization.
VIP Consumer Staples Portfolio (the Fund) is a non-diversified fund of Variable Insurance Products Fund IV (the Trust) and is authorized to issue an unlimited number of shares. The Trust is registered under the Investment Company Act of 1940, as amended (the 1940 Act), as an open-end management investment company organized as a Massachusetts business trust. Shares of the Fund may only be purchased by insurance companies for the purpose of funding variable annuity or variable life insurance contracts. The Fund offers the following classes of shares: Initial Class shares, Service Class 2 shares and Investor Class shares. All classes have equal rights and voting privileges, except for matters affecting a single class.
2. Investments in Fidelity Central Funds.
Funds may invest in Fidelity Central Funds, which are open-end investment companies generally available only to other investment companies and accounts managed by the investment adviser and its affiliates. The Schedule of Investments lists any Fidelity Central Funds held as an investment as of period end, but does not include the underlying holdings of each Fidelity Central Fund. An investing fund indirectly bears its proportionate share of the expenses of the underlying Fidelity Central Funds.
Based on its investment objective, each Fidelity Central Fund may invest or participate in various investment vehicles or strategies that are similar to those of the investing fund. These strategies are consistent with the investment objectives of the investing fund and may involve certain economic risks which may cause a decline in value of each of the Fidelity Central Funds and thus a decline in the value of the investing fund.
| Fidelity Central Fund | Investment Manager | Investment Objective | Investment Practices | Expense RatioA |
| Fidelity Money Market Central Funds | Fidelity Management & Research Company LLC (FMR) | Each fund seeks to obtain a high level of current income consistent with the preservation of capital and liquidity. | Short-term Investments | Less than .005% |
A Expenses expressed as a percentage of average net assets and are as of each underlying Central Fund's most recent annual or semi-annual shareholder report.
A complete unaudited list of holdings for each Fidelity Central Fund is available upon request or at the Securities and Exchange Commission website at www.sec.gov. In addition, the financial statements of the Fidelity Central Funds which contain the significant accounting policies (including investment valuation policies) of those funds, and are not covered by the Report of Independent Registered Public Accounting Firm, are available on the Securities and Exchange Commission website or upon request.
3. Significant Accounting Policies.
The Fund is an investment company and applies the accounting and reporting guidance of the Financial Accounting Standards Board (FASB) Accounting Standards Codification Topic 946 Financial Services - Investment Companies. The financial statements have been prepared in conformity with accounting principles generally accepted in the United States of America (GAAP), which require management to make certain estimates and assumptions at the date of the financial statements. Actual results could differ from those estimates. The Fund operates as a single operating segment. The Fund's income, expenses, assets, and performance are regularly monitored and assessed as a whole by the investment adviser and other individuals responsible for oversight functions of the Trust, using the information presented in the financial statements and financial highlights. Subsequent events, if any, through the date that the financial statements were issued have been evaluated in the preparation of the financial statements. The Fund's Schedule of Investments lists any underlying mutual funds or exchange-traded funds (ETFs) but does not include the underlying holdings of these funds. The following summarizes the significant accounting policies of the Fund:
Investment Valuation. Investments are valued as of 4:00 p.m. Eastern time on the last calendar day of the period. The Board of Trustees (the Board) has designated the Fund's investment adviser as the valuation designee responsible for the fair valuation function and performing fair value determinations as needed. The investment adviser has established a Fair Value Committee (the Committee) to carry out the day-to-day fair valuation responsibilities and has adopted policies and procedures to govern the fair valuation process and the activities of the Committee. In accordance with these fair valuation policies and procedures, which have been approved by the Board, the Fund attempts to obtain prices from one or more third party pricing services or brokers to value its investments. When current market prices, quotations or currency exchange rates are not readily available or reliable, investments will be fair valued in good faith by the Committee, in accordance with the policies and procedures. Factors used in determining fair value vary by investment type and may include market or investment specific events, transaction data, estimated cash flows, and market observations of comparable investments. The frequency that the fair valuation procedures are used cannot be predicted and they may be utilized to a significant extent. The Committee manages the Fund's fair valuation practices and maintains the fair valuation policies and procedures. The Fund's investment adviser reports to the Board information regarding the fair valuation process and related material matters.
The Fund categorizes the inputs to valuation techniques used to value its investments into a disclosure hierarchy consisting of three levels as shown below:
Level 1 - unadjusted quoted prices in active markets for identical investments
Level 2 - other significant observable inputs (including quoted prices for similar investments, interest rates, prepayment speeds, etc.)
Level 3 - unobservable inputs (including the Fund's own assumptions based on the best information available)
Valuation techniques used to value the Fund's investments by major category are as follows:
Equity securities, including restricted securities, for which market quotations are readily available, are valued at the last reported sale price or official closing price as reported by a third party pricing service on the primary market or exchange on which they are traded and are categorized as Level 1 in the hierarchy. In the event there were no sales during the day or closing prices are not available, securities are valued at the last quoted bid price or may be valued using the last available price and are generally categorized as Level 2 in the hierarchy. For foreign equity securities, when market or security specific events arise, comparisons to the valuation of American Depositary Receipts (ADRs), futures contracts, Exchange-Traded Funds (ETFs) and certain indexes as well as quoted prices for similar securities may be used and would be categorized as Level 2 in the hierarchy. For equity securities, including restricted securities, where observable inputs are limited, assumptions about market activity and risk are used and these securities may be categorized as Level 3 in the hierarchy.
Investments in open-end mutual funds, including the Fidelity Central Funds, are valued at their closing net asset value (NAV) each business day and are categorized as Level 1 in the hierarchy.
Changes in valuation techniques may result in transfers in or out of an assigned level within the disclosure hierarchy. The aggregate value of investments by input level as of December 31, 2024 is included at the end of the Fund's Schedule of Investments.
Foreign Currency. Certain Funds may use foreign currency contracts to facilitate transactions in foreign-denominated securities. Gains and losses from these transactions may arise from changes in the value of the foreign currency or if the counterparties do not perform under the contracts' terms.
Foreign-denominated assets, including investment securities, and liabilities are translated into U.S. dollars at the exchange rates at period end. Purchases and sales of investment securities, income and dividends received, and expenses denominated in foreign currencies are translated into U.S. dollars at the exchange rate in effect on the transaction date.
The effects of exchange rate fluctuations on investments are included with the net realized and unrealized gain (loss) on investment securities. Other foreign currency transactions resulting in realized and unrealized gain (loss) are disclosed separately.
Investment Transactions and Income. For financial reporting purposes, the Fund's investment holdings and NAV include trades executed through the end of the last business day of the period. The NAV per share for processing shareholder transactions is calculated as of the close of business of the New York Stock Exchange (NYSE), normally 4:00 p.m. Eastern time and includes trades executed through the end of the prior business day. Gains and losses on securities sold are determined on the basis of identified cost and include proceeds received from litigation. Commissions paid to certain brokers with whom the investment adviser, or its affiliates, places trades on behalf of a fund include an amount in addition to trade execution, which may be rebated back to a fund. Any such rebates are included in net realized gain (loss) on investments in the Statement of Operations. Dividend income is recorded on the ex-dividend date, except for certain dividends from foreign securities where the ex-dividend date may have passed, which are recorded as soon as the Fund is informed of the ex-dividend date. Non-cash dividends included in dividend income, if any, are recorded at the fair market value of the securities received. Income and capital gain distributions from Fidelity Central Funds, if any, are recorded on the ex-dividend date. Certain distributions received by the Fund represent a return of capital or capital gain. The Fund determines the components of these distributions subsequent to the ex-dividend date, based upon receipt of tax filings or other correspondence relating to the underlying investment. These distributions are recorded as a reduction of cost of investments and/or as a realized gain. Investment income is recorded net of foreign taxes withheld where recovery of such taxes is uncertain. Funds may file withholding tax reclaims in certain jurisdictions to recover a portion of amounts previously withheld. Any withholding tax reclaims income is included in the Statement of Operations in dividends. Any receivables for withholding tax reclaims are included in the Statement of Assets and Liabilities in dividends receivable.
Class Allocations and Expenses. Investment income, realized and unrealized capital gains and losses, common expenses of a fund, and certain fund-level expense reductions, if any, are allocated daily on a pro-rata basis to each class based on the relative net assets of each class to the total net assets of a fund. Each class differs with respect to transfer agent and distribution and service plan fees incurred, as applicable. Certain expense reductions may also differ by class, if applicable. For the reporting period, the allocated portion of income and expenses to each class as a percent of its average net assets may vary due to the timing of recording these transactions in relation to fluctuating net assets of the classes. Expenses directly attributable to a fund are charged to that fund. Expenses attributable to more than one fund are allocated among the respective funds on the basis of relative net assets or other appropriate methods. Expenses included in the accompanying financial statements reflect the expenses of that fund and do not include any expenses associated with any underlying mutual funds or exchange-traded funds (ETFs). Although not included in a fund's expenses, a fund indirectly bears its proportionate share of these expenses through the net asset value of each underlying mutual fund or exchange-traded fund (ETF). Expense estimates are accrued in the period to which they relate and adjustments are made when actual amounts are known.
Income Tax Information and Distributions to Shareholders. Each year, the Fund intends to qualify as a regulated investment company under Subchapter M of the Internal Revenue Code, including distributing substantially all of its taxable income and realized gains. As a result, no provision for U.S. Federal income taxes is required. As of December 31, 2024, the Fund did not have any unrecognized tax benefits in the financial statements; nor is the Fund aware of any tax positions for which it is reasonably possible that the total amounts of unrecognized tax benefits will significantly change in the next twelve months. The Fund files a U.S. federal tax return, in addition to state and local tax returns as required. The Fund's federal income tax returns are subject to examination by the Internal Revenue Service (IRS) for a period of three fiscal years after they are filed. State and local tax returns may be subject to examination for an additional fiscal year depending on the jurisdiction. Foreign taxes are provided for based on the Fund's understanding of the tax rules and rates that exist in the foreign markets in which it invests.
Distributions are declared and recorded on the ex-dividend date. Income and capital gain distributions are declared separately for each class. Income and capital gain distributions are determined in accordance with income tax regulations, which may differ from GAAP. These differences resulted in distribution reclassifications.
Capital accounts within the financial statements are adjusted for permanent book-tax differences. These adjustments have no impact on net assets or the results of operations. Capital accounts are not adjusted for temporary book-tax differences which will reverse in a subsequent period.
Book-tax differences are primarily due to foreign currency transactions and losses deferred due to wash sales and excise tax regulations.
As of period end, the cost and unrealized appreciation (depreciation) in securities, and derivatives if applicable, for federal income tax purposes were as follows:
| Gross unrealized appreciation | $61,148,538 |
| Gross unrealized depreciation | (13,215,327) |
| Net unrealized appreciation (depreciation) | $47,933,211 |
| Tax Cost | $188,925,942 |
The tax-based components of distributable earnings as of period end were as follows:
| Undistributed ordinary income | $450,606 |
| Undistributed long-term capital gain | $13,437,452 |
| Net unrealized appreciation (depreciation) on securities and other investments | $47,933,122 |
The tax character of distributions paid was as follows:
| | December 31, 2024 | December 31, 2023 |
| Ordinary Income | $5,857,949 | $8,672,433 |
| Long-term Capital Gains | 5,919,014 | - |
| Total | $11,776,963 | $8,672,433 |
Restricted Securities (including Private Placements). Funds may invest in securities that are subject to legal or contractual restrictions on resale. These securities generally may be resold in transactions exempt from registration or to the public if the securities are registered. Disposal of these securities may involve time-consuming negotiations and expense, and prompt sale at an acceptable price may be difficult. Information regarding restricted securities held at period end is included at the end of the Schedule of Investments, if applicable.
New Accounting Pronouncement. FASB Accounting Standards Update (ASU) 2023-07 Segment Reporting (Topic 280): Improvements to Reportable Segment Disclosures became effective in this reporting period. ASU 2023-07 enhances segment information disclosure in the notes to financial statements.
4. Purchases and Sales of Investments.
Purchases and sales of securities, other than short-term securities and in-kind transactions, as applicable, are noted in the table below.
| | Purchases ($) | Sales ($) |
| VIP Consumer Staples Portfolio | 115,573,337 | 150,539,666 |
5. Fees and Other Transactions with Affiliates.
Management Fee. Fidelity Management & Research Company LLC (the investment adviser) and its affiliates provide the Fund with investment management related services for which the Fund pays a monthly management fee.
Effective March 1, 2024, the Fund's management contract was amended to incorporate administrative services previously covered under separate services agreements (Transfer Agent and Accounting agreements). The amended contract incorporates a management fee rate that may vary by class. The investment adviser or an affiliate pays certain expenses of managing and operating the Fund out of each class's management fee. Each class of the Fund pays a management fee to the investment adviser. The management fee is calculated and paid to the investment adviser every month. When determining a class's management fee, a mandate rate is calculated based on the monthly average net assets of a group of funds advised by FMR within a designated asset class. A discount rate is subtracted from the mandate rate once the Fund's monthly average net assets reach a certain level. The mandate rate and discount rate may vary by class. The annual management fee rate for a class of shares of the Fund is the lesser of (1) the class's mandate rate reduced by the class's discount rate (if applicable) or (2) the amount set forth in the following table.
| | Maximum Management Fee Rate % |
| Initial Class | .58 |
| Service Class 2 | .58 |
| Investor Class | .66 |
One-twelfth of the management fee rate for a class is applied to the average net assets of the class for the month, giving a dollar amount which is the management fee for the class for that month. A different management fee rate may be applicable to each class of the Fund. The difference between classes is the result of separate arrangements for class-level services and/or waivers of certain expenses. It is not the result of any difference in advisory or custodial fees or other expenses related to the management of the Fund's assets, which do not vary by class. For the portion of the reporting period on or after March 1, 2024, the total annualized management fee rates were as follows:
| | Total Management Fee Rate % |
| Initial Class | .58 |
| Service Class 2 | .58 |
| Investor Class | .66 |
Prior to March 1, 2024, the management fee was the sum of an individual fund fee rate that was based on an annual rate of .30% of the Fund's average net assets and an annualized group fee rate that averaged .22% during the period. The group fee rate was based upon the monthly average net assets of a group of registered investment companies with which the investment adviser has management contracts. The group fee rate decreased as assets under management increased and increased as assets under management decreased. For the portion of the reporting period prior to March 1, 2024, the total annualized management fee rate was .52%.
Effective March 1, 2024, the Fund's sub-advisory agreements with FMR Investment Management (UK) Limited, Fidelity Management & Research (Hong Kong) Limited, and Fidelity Management & Research (Japan) Limited were amended to provide that the investment adviser pays each sub-adviser monthly fees equal to 110% of the sub-adviser's costs for providing sub-advisory services.
Distribution and Service Plan Fees. In accordance with Rule 12b-1 of the 1940 Act, the Fund has adopted a separate 12b-1 Plan for Service Class 2 shares. Service Class 2 pays Fidelity Distributors Company LLC (FDC), an affiliate of the investment adviser, a service fee. For the period, the service fee is based on an annual rate of .25% of Service Class 2's average net assets.
For the period, total fees for Service Class 2, all of which was re-allowed to insurance companies for the distribution of shares and providing shareholder support services were $1,390.
Transfer Agent Fees. Fidelity Investments Institutional Operations Company LLC (FIIOC), an affiliate of the investment adviser, is the Fund's transfer, dividend disbursing, and shareholder servicing agent. Effective March 1, 2024, the Fund's management contract was amended to incorporate transfer agent services and associated fees previously covered under a separate services agreement.
During the period January 1, 2024 through February 29, 2024, the transfer agent fees for each class were a fixed annual rate of class-level average net assets as follows:
| | Amount ($) | % of Class-Level Average Net Assets |
| Initial Class | 2,436 | .0630 |
| Service Class 2 | 53 | .0630 |
| Investor Class | 54,289 | .1390 |
| | 56,778 | |
Accounting Fees. Fidelity Service Company, Inc. (FSC), an affiliate of the investment adviser, maintains the Fund's accounting records. Effective March 1, 2024, the Fund's management contract was amended to incorporate accounting services and associated fees previously covered under a separate services agreement.
During the period January 1, 2024 through February 29, 2024, the accounting fees were a fixed annual rate of average net assets as follows:
| | % of Average Net Assets |
| VIP Consumer Staples Portfolio | .0354 |
Brokerage Commissions. A portion of portfolio transactions were placed with brokerage firms which are affiliates of the investment adviser. Brokerage commissions are included in net realized gain (loss) and change in net unrealized appreciation (depreciation) in the Statement of Operations. The commissions paid to these affiliated firms were as follows:
| | Amount ($) |
| VIP Consumer Staples Portfolio | 2,760 |
Interfund Trades. Funds may purchase from or sell securities to other Fidelity Funds under procedures adopted by the Board. The procedures have been designed to ensure these interfund trades are executed in accordance with Rule 17a-7 of the 1940 Act. Any interfund trades are included within the respective purchases and sales amounts shown in the Purchases and Sales of Investments note. Interfund trades during the period are noted in the table below.
| | Purchases ($) | Sales ($) | Realized Gain (Loss) ($) |
| VIP Consumer Staples Portfolio | 6,850,653 | 9,093,586 | 639,068 |
6. Committed Line of Credit.
Certain Funds participate with other funds managed by the investment adviser or an affiliate in a $4.25 billion credit facility (the "line of credit") to be utilized for temporary or emergency purposes to fund shareholder redemptions or for other short-term liquidity purposes.
Commitment fees are charged based on the unused amount of the line of credit at an annual rate of .10%, and then allocated to each participating fund based on its pro-rata portion of the line of credit. The commitment fees are reflected in Miscellaneous expenses on the Statement of Operations, and are listed below.
Interest is charged to a participating fund based on its borrowings at an annual rate of .75% plus the highest of (i) daily SOFR plus a .10% spread adjustment, (ii) Federal Funds Effective Rate, or (iii) Overnight Bank Funding Rate. During the period, there were no borrowings on this line of credit.
The line of credit agreement will expire in March 2025 unless extended or renewed.
| | Amount ($) |
| VIP Consumer Staples Portfolio | 407 |
7. Security Lending.
Funds lend portfolio securities from time to time in order to earn additional income. Lending agents are used, including National Financial Services (NFS), an affiliate of the investment adviser. Pursuant to a securities lending agreement, NFS will receive a fee, which is capped at 9.9% of a fund's daily lending revenue, for its services as lending agent. A fund may lend securities to certain qualified borrowers, including NFS. On the settlement date of the loan, a fund receives collateral (in the form of U.S. Treasury obligations, letters of credit and/or cash) against the loaned securities and maintains collateral in an amount not less than 100% of the market value of the loaned securities during the period of the loan. The market value of the loaned securities is determined at the close of business of a fund and any additional required collateral is delivered to a fund on the next business day. A fund or borrower may terminate the loan at any time, and if the borrower defaults on its obligation to return the securities loaned because of insolvency or other reasons, a fund may apply collateral received from the borrower against the obligation. A fund may experience delays and costs in recovering the securities loaned. Any cash collateral received is invested in the Fidelity Securities Lending Cash Central Fund. Any loaned securities are identified as such in the Schedule of Investments, and the value of loaned securities and cash collateral at period end, as applicable, are presented in the Statement of Assets and Liabilities. Security lending income represents the income earned on investing cash collateral, less rebates paid to borrowers and any lending agent fees associated with the loan, plus any premium payments received for lending certain types of securities. Security lending income is presented in the Statement of Operations as a component of income from Fidelity Central Funds. Affiliated security lending activity, if any, was as follows:
| | Total Security Lending Fees Paid to NFS ($) | Security Lending Income From Securities Loaned to NFS ($) | Value of Securities Loaned to NFS at Period End ($) |
| VIP Consumer Staples Portfolio | 141 | 27 | - |
8. Expense Reductions.
During the period the investment adviser or an affiliate reimbursed and/or waived a portion of fund-level operating expenses in the amount of $11,609.
9. Distributions to Shareholders.
Distributions to shareholders of each class were as follows:
| | Year ended December 31, 2024 | Year ended December 31, 2023 |
| VIP Consumer Staples Portfolio | | |
| Distributions to shareholders | | |
| Initial Class | $1,098,844 | $797,250 |
| Service Class 2 | 31,542 | 8,710 |
| Investor Class | 10,646,577 | 7,866,473 |
Total | $11,776,963 | $8,672,433 |
10. Share Transactions.
Transactions for each class of shares were as follows and may contain in-kind transactions:
| | Shares | Shares | Dollars | Dollars |
| | Year ended December 31, 2024 | Year ended December 31, 2023 | Year ended December 31, 2024 | Year ended December 31, 2023 |
| VIP Consumer Staples Portfolio | | | | |
| Initial Class | | | | |
| Shares sold | 194,171 | 257,903 | $3,839,736 | $5,092,374 |
| Reinvestment of distributions | 56,616 | 42,208 | 1,098,844 | 797,250 |
| Shares redeemed | (318,752) | (456,611) | (6,279,377) | (8,940,246) |
| Net increase (decrease) | (67,965) | (156,500) | $(1,340,797) | $(3,050,622) |
| Service Class 2 | | | | |
| Shares sold | 54,570 | 18,717 | $1,078,918 | $370,201 |
| Reinvestment of distributions | 1,382 | 311 | 26,903 | 5,833 |
| Shares redeemed | (33,093) | (1,512) | (640,915) | (28,778) |
| Net increase (decrease) | 22,859 | 17,516 | $464,906 | $347,256 |
| Investor Class | | | | |
| Shares sold | 363,998 | 995,260 | $7,317,181 | $19,669,017 |
| Reinvestment of distributions | 552,601 | 418,936 | 10,646,577 | 7,866,473 |
| Shares redeemed | (2,323,920) | (2,782,322) | (45,465,581) | (53,897,879) |
| Net increase (decrease) | (1,407,321) | (1,368,126) | $(27,501,823) | $(26,362,389) |
11. Other.
A fund's organizational documents provide former and current trustees and officers with a limited indemnification against liabilities arising in connection with the performance of their duties to the fund. In the normal course of business, a fund may also enter into contracts that provide general indemnifications. A fund's maximum exposure under these arrangements is unknown as this would be dependent on future claims that may be made against a fund. The risk of material loss from such claims is considered remote.
At the end of the period, the investment adviser or its affiliates were owners of record of more than 10% of the outstanding shares as follows:
| Fund | Affiliated % |
| VIP Consumer Staples Portfolio | 97% |
12. Risk and Uncertainties.
Many factors affect a fund's performance. Developments that disrupt global economies and financial markets, such as pandemics, epidemics, outbreaks of infectious diseases, war, terrorism, and environmental disasters, may significantly affect a fund's investment performance. The effects of these developments to a fund will be impacted by the types of securities in which a fund invests, the financial condition, industry, economic sector, and geographic location of an issuer, and a fund's level of investment in the securities of that issuer. Significant concentrations in security types, issuers, industries, sectors, and geographic locations may magnify the factors that affect a fund's performance.
Report of Independent Registered Public Accounting Firm
To the Board of Trustees of Variable Insurance Products Fund IV and Shareholders of VIP Consumer Staples Portfolio
Opinion on the Financial Statements
We have audited the accompanying statement of assets and liabilities, including the schedule of investments, of VIP Consumer Staples Portfolio (one of the funds constituting Variable Insurance Products Fund IV, referred to hereafter as the "Fund") as of December 31, 2024, the related statement of operations for the year ended December 31, 2024, the statement of changes in net assets for each of the two years in the period ended December 31, 2024, including the related notes, and the financial highlights for each of the periods indicated therein (collectively referred to as the "financial statements"). In our opinion, the financial statements present fairly, in all material respects, the financial position of the Fund as of December 31, 2024, the results of its operations for the year then ended, the changes in its net assets for each of the two years in the period ended December 31, 2024 and the financial highlights for each of the periods indicated therein in conformity with accounting principles generally accepted in the United States of America.
Basis for Opinion
These financial statements are the responsibility of the Fund's management. Our responsibility is to express an opinion on the Fund's financial statements based on our audits. We are a public accounting firm registered with the Public Company Accounting Oversight Board (United States) (PCAOB) and are required to be independent with respect to the Fund in accordance with the U.S. federal securities laws and the applicable rules and regulations of the Securities and Exchange Commission and the PCAOB.
We conducted our audits of these financial statements in accordance with the standards of the PCAOB. Those standards require that we plan and perform the audit to obtain reasonable assurance about whether the financial statements are free of material misstatement, whether due to error or fraud.
Our audits included performing procedures to assess the risks of material misstatement of the financial statements, whether due to error or fraud, and performing procedures that respond to those risks. Such procedures included examining, on a test basis, evidence regarding the amounts and disclosures in the financial statements. Our audits also included evaluating the accounting principles used and significant estimates made by management, as well as evaluating the overall presentation of the financial statements. Our procedures included confirmation of securities owned as of December 31, 2024 by correspondence with the custodian, issuers of privately offered securities and brokers; when replies were not received from brokers, we performed other auditing procedures. We believe that our audits provide a reasonable basis for our opinion.
/s/ PricewaterhouseCoopers LLP
Boston, Massachusetts
February 12, 2025
We have served as the auditor of one or more investment companies in the Fidelity group of funds since 1932.
Distributions
(Unaudited)The dividend and capital gains distributions for the fund(s) are available on Fidelity.com or Institutional.Fidelity.com.
The fund hereby designates as a capital gain dividend with respect to the taxable year ended December 31, 2024, $13,447,997, or, if subsequently determined to be different, the net capital gain of such year.
Initial Class designates 1% and 100%; Investor Class designates 1% and 100%; and Service Class 2 designates 1% and 100% of the dividends distributed in February and December 2024, respectively during the fiscal year as qualifying for the dividends-received deduction for corporate shareholders.
Item 8: Changes in and Disagreements with Accountants for Open-End Management Investment Companies
(Unaudited)
Note: This is not applicable for any fund included in this document.
Item 9: Proxy Disclosures for Open-End Management Investment Companies
(Unaudited)
| A special meeting of shareholders was held on July 16, 2024. The results of votes taken among shareholders on the proposal before them are reported below. Each vote reported represents one dollar of net asset value held on the record date for the meeting. |
| Proposal 1 |
| To elect a Board of Trustees. |
| | # of Votes | % of Votes |
| Bettina Doulton |
| Affirmative | 5,501,492,681.85 | 94.15 |
| Withheld | 341,991,035.05 | 5.85 |
| TOTAL | 5,843,483,716.90 | 100.00 |
| Robert A. Lawrence |
| Affirmative | 5,480,901,467.70 | 93.80 |
| Withheld | 362,582,249.21 | 6.20 |
| TOTAL | 5,843,483,716.90 | 100.00 |
| Vijay C. Advani |
| Affirmative | 5,500,352,811.04 | 94.13 |
| Withheld | 343,130,905.86 | 5.87 |
| TOTAL | 5,843,483,716.90 | 100.00 |
| Thomas P. Bostick |
| Affirmative | 5,488,165,362.69 | 93.92 |
| Withheld | 355,318,354.21 | 6.08 |
| TOTAL | 5,843,483,716.90 | 100.00 |
| Donald F. Donahue |
| Affirmative | 5,482,960,893.76 | 93.83 |
| Withheld | 360,522,823.14 | 6.17 |
| TOTAL | 5,843,483,716.90 | 100.00 |
| Vicki L. Fuller |
| Affirmative | 5,492,283,337.89 | 93.99 |
| Withheld | 351,200,379.01 | 6.01 |
| TOTAL | 5,843,483,716.90 | 100.00 |
| Patricia L. Kampling |
| Affirmative | 5,521,992,715.20 | 94.50 |
| Withheld | 321,491,001.70 | 5.50 |
| TOTAL | 5,843,483,716.90 | 100.00 |
| Thomas A. Kennedy |
| Affirmative | 5,484,789,158.10 | 93.86 |
| Withheld | 358,694,558.80 | 6.14 |
| TOTAL | 5,843,483,716.90 | 100.00 |
| Oscar Munoz |
| Affirmative | 5,497,884,744.63 | 94.09 |
| Withheld | 345,598,972.27 | 5.91 |
| TOTAL | 5,843,483,716.90 | 100.00 |
| Karen B. Peetz |
| Affirmative | 5,503,968,240.81 | 94.19 |
| Withheld | 339,515,476.09 | 5.81 |
| TOTAL | 5,843,483,716.90 | 100.00 |
| David M. Thomas |
| Affirmative | 5,466,218,204.40 | 93.54 |
| Withheld | 377,265,512.50 | 6.46 |
| TOTAL | 5,843,483,716.90 | 100.00 |
| Susan Tomasky |
| Affirmative | 5,463,402,825.36 | 93.50 |
| Withheld | 380,080,891.54 | 6.50 |
| TOTAL | 5,843,483,716.90 | 100.00 |
| Michael E. Wiley |
| Affirmative | 5,466,838,155.74 | 93.55 |
| Withheld | 376,645,561.16 | 6.45 |
| TOTAL | 5,843,483,716.90 | 100.00 |
| | | |
| Proposal 1 reflects trust-wide proposal and voting results. |
Item 10: Remuneration Paid to Directors, Officers, and others of Open-End Management Investment Companies
(Unaudited)
Note: This information is disclosed as part of the financial statements for each Fund as part of Item 7: Financial Statements and Financial Highlights for Open-End Management Investment companies.
Item 11: Statement Regarding Basis for Approval of Investment Advisory Contract
(Unaudited)
Note: This is not applicable for any fund included in this document.
1.850994.117
VCSP-ANN-0325
Fidelity® Variable Insurance Products:
VIP Materials Portfolio
Annual Report
December 31, 2024
Contents
To view a fund's proxy voting guidelines and proxy voting record for the 12-month period ended June 30, visit http://www.fidelity.com/proxyvotingresults or visit the Securities and Exchange Commission's (SEC) web site at http://www.sec.gov.
You may also call 1-877-208-0098 to request a free copy of the proxy voting guidelines.
Fidelity® Variable Insurance Products are separate account options which are purchased through a variable insurance contract.
Standard & Poor's, S&P and S&P 500 are registered service marks of The McGraw-Hill Companies, Inc. and have been licensed for use by Fidelity Distributors Corporation.
Other third-party marks appearing herein are the property of their respective owners.
All other marks appearing herein are registered or unregistered trademarks or service marks of FMR LLC or an affiliated company. © 2025 FMR LLC. All rights reserved.
This report and the financial statements contained herein are submitted for the general information of the shareholders of the Fund. This report is not authorized for distribution to prospective investors in the Fund unless preceded or accompanied by an effective prospectus.
A fund files its complete schedule of portfolio holdings with the SEC for the first and third quarters of each fiscal year on Form N-PORT. Forms N-PORT are available on the SEC's web site at http://www.sec.gov. A fund's Forms N-PORT may be reviewed and copied at the SEC's Public Reference Room in Washington, DC. Information regarding the operation of the SEC's Public Reference Room may be obtained by calling 1-800-SEC-0330.
For a complete list of a fund's portfolio holdings, view the most recent holdings listing, semiannual report, or annual report on Fidelity's web site at http://www.fidelity.com, http://www.institutional.fidelity.com, or http://www.401k.com, as applicable.
NOT FDIC INSURED •MAY LOSE VALUE •NO BANK GUARANTEE
Neither the Fund nor Fidelity Distributors Corporation is a bank.
Item 7: Financial Statements and Financial Highlights for Open-End Management Investment Companies (Annual Report)
Schedule of Investments December 31, 2024
Showing Percentage of Net Assets
| Common Stocks - 99.5% |
| | | Shares | Value ($) |
| BRAZIL - 2.4% | | | |
| Materials - 2.4% | | | |
| Metals & Mining - 2.4% | | | |
| Wheaton Precious Metals Corp | | 26,400 | 1,485,981 |
| CANADA - 3.7% | | | |
| Materials - 3.7% | | | |
| Metals & Mining - 3.5% | | | |
| Agnico Eagle Mines Ltd/CA | | 8,600 | 672,828 |
| Alamos Gold Inc Class A | | 14,500 | 267,515 |
| Altius Minerals Corp | | 19,400 | 359,267 |
| Teck Resources Ltd Class B (United States) | | 20,800 | 843,024 |
| | | | 2,142,634 |
| Paper & Forest Products - 0.2% | | | |
| Interfor Corp (a) | | 13,000 | 151,845 |
| TOTAL CANADA | | | 2,294,479 |
| CONGO DEMOCRATIC REPUBLIC OF - 2.2% | | | |
| Materials - 2.2% | | | |
| Metals & Mining - 2.2% | | | |
| Ivanhoe Mine Ltd Class A (a) | | 117,700 | 1,396,892 |
| GERMANY - 0.3% | | | |
| Materials - 0.3% | | | |
| Chemicals - 0.3% | | | |
| Orion SA | | 12,100 | 191,059 |
| UNITED STATES - 88.3% | | | |
| Materials - 88.3% | | | |
| Chemicals - 56.1% | | | |
| Air Products and Chemicals Inc | | 13,588 | 3,941,064 |
| Axalta Coating Systems Ltd (a) | | 56,300 | 1,926,586 |
| Balchem Corp | | 10,600 | 1,727,747 |
| Cabot Corp | | 11,500 | 1,050,065 |
| Chemours Co/The | | 73,200 | 1,237,080 |
| Corteva Inc | | 44,900 | 2,557,504 |
| Dow Inc | | 44,600 | 1,789,798 |
| DuPont de Nemours Inc | | 5,500 | 419,375 |
| Ecolab Inc | | 22,200 | 5,201,904 |
| Element Solutions Inc | | 70,300 | 1,787,729 |
| Linde PLC | | 25,000 | 10,466,750 |
| Perimeter Solutions Inc | | 20,900 | 267,102 |
| Sherwin-Williams Co/The | | 3,900 | 1,325,727 |
| Tronox Holdings PLC | | 106,640 | 1,073,865 |
| Westlake Corp | | 700 | 80,255 |
| | | | 34,852,551 |
| Construction Materials - 9.2% | | | |
| CRH PLC | | 21,000 | 1,942,920 |
| Martin Marietta Materials Inc | | 3,726 | 1,924,479 |
| Vulcan Materials Co | | 7,100 | 1,826,333 |
| | | | 5,693,732 |
| Containers & Packaging - 12.4% | | | |
| AptarGroup Inc | | 14,500 | 2,277,950 |
| Avery Dennison Corp | | 5,600 | 1,047,928 |
| Crown Holdings Inc | | 9,400 | 777,286 |
| Greif Inc Class A | | 4,300 | 262,816 |
| International Paper Co | | 45,200 | 2,432,664 |
| Smurfit WestRock PLC | | 16,500 | 888,690 |
| | | | 7,687,334 |
| Metals & Mining - 10.6% | | | |
| Alcoa Corp | | 7,700 | 290,906 |
| Arch Resources Inc Class A | | 2,900 | 409,538 |
| ATI Inc (a) | | 23,400 | 1,287,936 |
| Commercial Metals Co | | 11,000 | 545,600 |
| Freeport-McMoRan Inc | | 23,940 | 911,635 |
| Hecla Mining Co | | 78,400 | 384,944 |
| Nucor Corp | | 14,700 | 1,715,637 |
| Steel Dynamics Inc | | 9,300 | 1,060,851 |
| | | | 6,607,047 |
| TOTAL UNITED STATES | | | 54,840,664 |
| ZAMBIA - 2.6% | | | |
| Materials - 2.6% | | | |
| Metals & Mining - 2.6% | | | |
| First Quantum Minerals Ltd (a) | | 124,120 | 1,600,016 |
| TOTAL COMMON STOCKS (Cost $54,214,987) | | | 61,809,091 |
| | | | |
| Money Market Funds - 0.5% |
| | | Yield (%) | Shares | Value ($) |
Fidelity Cash Central Fund (b) (Cost $341,485) | | 4.36 | 341,417 | 341,485 |
| | | | | |
| TOTAL INVESTMENT IN SECURITIES - 100.0% (Cost $54,556,472) | 62,150,576 |
NET OTHER ASSETS (LIABILITIES) - 0.0% | (13,284) |
| NET ASSETS - 100.0% | 62,137,292 |
| | |
Legend
| (b) | Affiliated fund that is generally available only to investment companies and other accounts managed by Fidelity Investments. The rate quoted is the annualized seven-day yield of the fund at period end. A complete unaudited listing of the fund's holdings as of its most recent quarter end is available upon request. In addition, each Fidelity Central Fund's financial statements, which are not covered by the Fund's Report of Independent Registered Public Accounting Firm, are available on the SEC's website or upon request. |
Affiliated Central Funds
Fiscal year to date information regarding the Fund's investments in Fidelity Central Funds, including the ownership percentage, is presented below.
| Affiliate | Value, beginning of period ($) | Purchases ($) | Sales Proceeds ($) | Dividend Income ($) | Realized Gain (loss) ($) | Change in Unrealized appreciation (depreciation) ($) | Value, end of period ($) | Shares, end of period | % ownership, end of period |
| Fidelity Cash Central Fund | 312,131 | 20,796,202 | 20,766,886 | 23,763 | 38 | - | 341,485 | 341,417 | 0.0% |
| Fidelity Securities Lending Cash Central Fund | 2,427,410 | 29,080,675 | 31,508,085 | 2,346 | - | - | - | - | 0.0% |
| Total | 2,739,541 | 49,876,877 | 52,274,971 | 26,109 | 38 | - | 341,485 | 341,417 | |
| | | | | | | | | | |
Amounts in the dividend income column in the above table include any capital gain distributions from underlying funds, which are presented in the corresponding line item in the Statement of Operations, if applicable.
Amounts in the dividend income column for Fidelity Securities Lending Cash Central Fund represents the income earned on investing cash collateral, less rebates paid to borrowers and any lending agent fees associated with the loan, plus any premium payments received for lending certain types of securities.
Amounts included in the purchases and sales proceeds columns may include in-kind transactions, if applicable.
Investment Valuation
The following is a summary of the inputs used, as of December 31, 2024, involving the Fund's assets and liabilities carried at fair value. The inputs or methodology used for valuing securities may not be an indication of the risk associated with investing in those securities. For more information on valuation inputs, and their aggregation into the levels used below, please refer to the Investment Valuation section in the accompanying Notes to Financial Statements.
| Valuation Inputs at Reporting Date: |
| Description | Total ($) | Level 1 ($) | Level 2 ($) | Level 3 ($) |
Investments in Securities: | | | | |
|
| Common Stocks | | | | |
Materials | 61,809,091 | 61,809,091 | - | - |
|
| Money Market Funds | 341,485 | 341,485 | - | - |
| Total Investments in Securities: | 62,150,576 | 62,150,576 | - | - |
Financial Statements
| Statement of Assets and Liabilities |
As of December 31, 2024 |
| Assets | | | | |
| Investment in securities, at value - See accompanying schedule: | | | | |
Unaffiliated issuers (cost $54,214,987) | $ | 61,809,091 | | |
Fidelity Central Funds (cost $341,485) | | 341,485 | | |
| | | | | |
| | | | | |
| Total Investment in Securities (cost $54,556,472) | | | $ | 62,150,576 |
| Cash | | | | 1,608 |
| Foreign currency held at value (cost $1) | | | | 1 |
| Receivable for fund shares sold | | | | 9,435 |
| Dividends receivable | | | | 54,141 |
| Distributions receivable from Fidelity Central Funds | | | | 1,319 |
| Prepaid expenses | | | | 89 |
| Other receivables | | | | 2 |
Total assets | | | | 62,217,171 |
| Liabilities | | | | |
| Payable for fund shares redeemed | $ | 183 | | |
| Accrued management fee | | 36,361 | | |
| Audit fee payable | | 36,806 | | |
| Custody fee payable | | 5,242 | | |
| Other payables and accrued expenses | | 1,287 | | |
| Total liabilities | | | | 79,879 |
| Net Assets | | | $ | 62,137,292 |
| Net Assets consist of: | | | | |
| Paid in capital | | | $ | 44,554,808 |
| Total accumulated earnings (loss) | | | | 17,582,484 |
| Net Assets | | | $ | 62,137,292 |
| | | | | |
| Net Asset Value and Maximum Offering Price | | | | |
| Initial Class : | | | | |
Net Asset Value, offering price and redemption price per share ($8,251,926 ÷ 499,269 shares) | | | $ | 16.53 |
| Investor Class : | | | | |
Net Asset Value, offering price and redemption price per share ($53,885,366 ÷ 3,262,194 shares) | | | $ | 16.52 |
| Statement of Operations |
| Year ended December 31, 2024 |
| Investment Income | | | | |
| Dividends | | | $ | 1,202,691 |
| Income from Fidelity Central Funds (including $2,346 from security lending) | | | | 26,109 |
| Total income | | | | 1,228,800 |
| Expenses | | | | |
| Management fee | $ | 478,435 | | |
| Transfer agent fees | | 16,451 | | |
| Accounting fees | | 4,575 | | |
| Custodian fees and expenses | | 19,481 | | |
| Independent trustees' fees and expenses | | 340 | | |
| Audit fees | | 45,707 | | |
| Legal | | 321 | | |
| Miscellaneous | | 2,287 | | |
| Total expenses before reductions | | 567,597 | | |
| Expense reductions | | (3,551) | | |
| Total expenses after reductions | | | | 564,046 |
| Net Investment income (loss) | | | | 664,754 |
| Realized and Unrealized Gain (Loss) | | | | |
| Net realized gain (loss) on: | | | | |
| Investment Securities: | | | | |
| Unaffiliated issuers | | 9,928,430 | | |
| Fidelity Central Funds | | 38 | | |
| Foreign currency transactions | | 1,733 | | |
| Total net realized gain (loss) | | | | 9,930,201 |
| Change in net unrealized appreciation (depreciation) on: | | | | |
| Investment Securities: | | | | |
| Unaffiliated issuers | | (11,838,614) | | |
| Assets and liabilities in foreign currencies | | (1,106) | | |
| Total change in net unrealized appreciation (depreciation) | | | | (11,839,720) |
| Net gain (loss) | | | | (1,909,519) |
| Net increase (decrease) in net assets resulting from operations | | | $ | (1,244,765) |
| Statement of Changes in Net Assets |
| |
| | Year ended December 31, 2024 | | Year ended December 31, 2023 |
| Increase (Decrease) in Net Assets | | | | |
| Operations | | | | |
| Net investment income (loss) | $ | 664,754 | $ | 1,201,846 |
| Net realized gain (loss) | | 9,930,201 | | 453,863 |
| Change in net unrealized appreciation (depreciation) | | (11,839,720) | | 4,286,732 |
| Net increase (decrease) in net assets resulting from operations | | (1,244,765) | | 5,942,441 |
| Distributions to shareholders | | (1,076,801) | | (1,291,830) |
| | | | | |
| Share transactions - net increase (decrease) | | (17,522,483) | | (20,083,038) |
| Total increase (decrease) in net assets | | (19,844,049) | | (15,432,427) |
| | | | | |
| Net Assets | | | | |
| Beginning of period | | 81,981,341 | | 97,413,768 |
| End of period | $ | 62,137,292 | $ | 81,981,341 |
| | | | | |
| | | | | |
Financial Highlights
VIP Materials Portfolio Initial Class |
| |
| Years ended December 31, | | 2024 | | 2023 | | 2022 | | 2021 | | 2020 |
Selected Per-Share Data | | | | | | | | | | |
| Net asset value, beginning of period | $ | 17.20 | $ | 16.24 | $ | 18.76 | $ | 14.17 | $ | 11.74 |
| Income from Investment Operations | | | | | | | | | | |
Net investment income (loss) A,B | | .17 | | .23 | | .18 | | .14 | | .07 |
| Net realized and unrealized gain (loss) | | (.57) | | .99 | | (2.00) | | 4.58 | | 2.44 |
| Total from investment operations | | (.40) | | 1.22 | | (1.82) | | 4.72 | | 2.51 |
| Distributions from net investment income | | (.21) | | (.24) | | (.19) | | (.13) | | (.08) |
| Distributions from net realized gain | | (.06) | | (.03) | | (.51) | | - | | - |
| Total distributions | | (.27) | | (.26) C | | (.70) | | (.13) | | (.08) |
| Net asset value, end of period | $ | 16.53 | $ | 17.20 | $ | 16.24 | $ | 18.76 | $ | 14.17 |
Total Return D,E | | | | 7.60% | | (9.79)% | | 33.42% | | 21.49% |
Ratios to Average Net Assets B,F,G | | | | | | | | | | |
| Expenses before reductions | | .67% | | .69% | | .69% | | .68% | | .77% |
| Expenses net of fee waivers, if any | | | | .68% | | .68% | | .68% | | .77% |
| Expenses net of all reductions | | .67% | | .68% | | .68% | | .68% | | .76% |
| Net investment income (loss) | | .94% | | 1.36% | | 1.09% | | .84% | | .59% |
| Supplemental Data | | | | | | | | | | |
| Net assets, end of period (000 omitted) | $ | 8,252 | $ | 12,416 | $ | 14,941 | $ | 19,714 | $ | 9,924 |
Portfolio turnover rate H | | | | 60% | | 63% | | 99% | | 83% |
ACalculated based on average shares outstanding during the period.
BNet investment income (loss) is affected by the timing of the declaration of dividends by any underlying mutual funds or exchange-traded funds (ETFs). Net investment income (loss) of any mutual funds or ETFs is not included in the Fund's net investment income (loss) ratio.
CTotal distributions per share do not sum due to rounding.
DTotal returns do not reflect charges attributable to your insurance company's separate account. Inclusion of these charges would reduce the total returns shown.
ETotal returns would have been lower if certain expenses had not been reduced during the applicable periods shown.
FFees and expenses of any underlying mutual funds or exchange-traded funds (ETFs) are not included in the Fund's expense ratio. The Fund indirectly bears its proportionate share of these expenses. For additional expense information related to investments in Fidelity Central Funds, please refer to the "Investments in Fidelity Central Funds" note found in the Notes to Financial Statements section of the most recent Annual or Semi-Annual report.
GExpense ratios reflect operating expenses of the class. Expenses before reductions do not reflect amounts reimbursed, waived, or reduced through arrangements with the investment adviser, brokerage services, or other offset arrangements, if applicable, and do not represent the amount paid by the class during periods when reimbursements, waivers or reductions occur.
HAmount does not include the portfolio activity of any underlying mutual funds or exchange-traded funds (ETFs), derivatives or securities that mature within one year from acquisition.
VIP Materials Portfolio Investor Class |
| |
| Years ended December 31, | | 2024 | | 2023 | | 2022 | | 2021 | | 2020 |
Selected Per-Share Data | | | | | | | | | | |
| Net asset value, beginning of period | $ | 17.20 | $ | 16.23 | $ | 18.76 | $ | 14.16 | $ | 11.73 |
| Income from Investment Operations | | | | | | | | | | |
Net investment income (loss) A,B | | .15 | | .22 | | .17 | | .13 | | .06 |
| Net realized and unrealized gain (loss) | | (.57) | | 1.00 | | (2.01) | | 4.59 | | 2.45 |
| Total from investment operations | | (.42) | | 1.22 | | (1.84) | | 4.72 | | 2.51 |
| Distributions from net investment income | | (.20) | | (.22) | | (.18) | | (.12) | | (.08) |
| Distributions from net realized gain | | (.06) | | (.03) | | (.51) | | - | | - |
| Total distributions | | (.26) | | (.25) | | (.69) | | (.12) | | (.08) |
| Net asset value, end of period | $ | 16.52 | $ | 17.20 | $ | 16.23 | $ | 18.76 | $ | 14.16 |
Total Return C,D | | | | 7.58% | | (9.91)% | | 33.40% | | 21.45% |
Ratios to Average Net Assets B,E,F | | | | | | | | | | |
| Expenses before reductions | | .76% | | .76% | | .76% | | .76% | | .85% |
| Expenses net of fee waivers, if any | | | | .76% | | .76% | | .76% | | .85% |
| Expenses net of all reductions | | .75% | | .76% | | .76% | | .76% | | .84% |
| Net investment income (loss) | | .86% | | 1.29% | | 1.01% | | .77% | | .52% |
| Supplemental Data | | | | | | | | | | |
| Net assets, end of period (000 omitted) | $ | 53,885 | $ | 69,566 | $ | 82,473 | $ | 94,673 | $ | 48,022 |
Portfolio turnover rate G | | | | 60% | | 63% | | 99% | | 83% |
ACalculated based on average shares outstanding during the period.
BNet investment income (loss) is affected by the timing of the declaration of dividends by any underlying mutual funds or exchange-traded funds (ETFs). Net investment income (loss) of any mutual funds or ETFs is not included in the Fund's net investment income (loss) ratio.
CTotal returns do not reflect charges attributable to your insurance company's separate account. Inclusion of these charges would reduce the total returns shown.
DTotal returns would have been lower if certain expenses had not been reduced during the applicable periods shown.
EFees and expenses of any underlying mutual funds or exchange-traded funds (ETFs) are not included in the Fund's expense ratio. The Fund indirectly bears its proportionate share of these expenses. For additional expense information related to investments in Fidelity Central Funds, please refer to the "Investments in Fidelity Central Funds" note found in the Notes to Financial Statements section of the most recent Annual or Semi-Annual report.
FExpense ratios reflect operating expenses of the class. Expenses before reductions do not reflect amounts reimbursed, waived, or reduced through arrangements with the investment adviser, brokerage services, or other offset arrangements, if applicable, and do not represent the amount paid by the class during periods when reimbursements, waivers or reductions occur.
GAmount does not include the portfolio activity of any underlying mutual funds or exchange-traded funds (ETFs), derivatives or securities that mature within one year from acquisition.
Notes to Financial Statements
For the period ended December 31, 2024
1. Organization.
VIP Materials Portfolio (the Fund) is a non-diversified fund of Variable Insurance Products Fund IV (the Trust) and is authorized to issue an unlimited number of shares. The Trust is registered under the Investment Company Act of 1940, as amended (the 1940 Act), as an open-end management investment company organized as a Massachusetts business trust. Shares of the Fund may only be purchased by insurance companies for the purpose of funding variable annuity or variable life insurance contracts. The Fund offers the following classes of shares: Initial Class shares and Investor Class shares. All classes have equal rights and voting privileges, except for matters affecting a single class.
2. Investments in Fidelity Central Funds.
Funds may invest in Fidelity Central Funds, which are open-end investment companies generally available only to other investment companies and accounts managed by the investment adviser and its affiliates. The Schedule of Investments lists any Fidelity Central Funds held as an investment as of period end, but does not include the underlying holdings of each Fidelity Central Fund. An investing fund indirectly bears its proportionate share of the expenses of the underlying Fidelity Central Funds.
Based on its investment objective, each Fidelity Central Fund may invest or participate in various investment vehicles or strategies that are similar to those of the investing fund. These strategies are consistent with the investment objectives of the investing fund and may involve certain economic risks which may cause a decline in value of each of the Fidelity Central Funds and thus a decline in the value of the investing fund.
| Fidelity Central Fund | Investment Manager | Investment Objective | Investment Practices | Expense RatioA |
| Fidelity Money Market Central Funds | Fidelity Management & Research Company LLC (FMR) | Each fund seeks to obtain a high level of current income consistent with the preservation of capital and liquidity. | Short-term Investments | Less than .005% |
A Expenses expressed as a percentage of average net assets and are as of each underlying Central Fund's most recent annual or semi-annual shareholder report.
A complete unaudited list of holdings for each Fidelity Central Fund is available upon request or at the Securities and Exchange Commission website at www.sec.gov. In addition, the financial statements of the Fidelity Central Funds which contain the significant accounting policies (including investment valuation policies) of those funds, and are not covered by the Report of Independent Registered Public Accounting Firm, are available on the Securities and Exchange Commission website or upon request.
3. Significant Accounting Policies.
The Fund is an investment company and applies the accounting and reporting guidance of the Financial Accounting Standards Board (FASB) Accounting Standards Codification Topic 946 Financial Services - Investment Companies. The financial statements have been prepared in conformity with accounting principles generally accepted in the United States of America (GAAP), which require management to make certain estimates and assumptions at the date of the financial statements. Actual results could differ from those estimates. The Fund operates as a single operating segment. The Fund's income, expenses, assets, and performance are regularly monitored and assessed as a whole by the investment adviser and other individuals responsible for oversight functions of the Trust, using the information presented in the financial statements and financial highlights. Subsequent events, if any, through the date that the financial statements were issued have been evaluated in the preparation of the financial statements. The Fund's Schedule of Investments lists any underlying mutual funds or exchange-traded funds (ETFs) but does not include the underlying holdings of these funds. The following summarizes the significant accounting policies of the Fund:
Investment Valuation. Investments are valued as of 4:00 p.m. Eastern time on the last calendar day of the period. The Board of Trustees (the Board) has designated the Fund's investment adviser as the valuation designee responsible for the fair valuation function and performing fair value determinations as needed. The investment adviser has established a Fair Value Committee (the Committee) to carry out the day-to-day fair valuation responsibilities and has adopted policies and procedures to govern the fair valuation process and the activities of the Committee. In accordance with these fair valuation policies and procedures, which have been approved by the Board, the Fund attempts to obtain prices from one or more third party pricing services or brokers to value its investments. When current market prices, quotations or currency exchange rates are not readily available or reliable, investments will be fair valued in good faith by the Committee, in accordance with the policies and procedures. Factors used in determining fair value vary by investment type and may include market or investment specific events, transaction data, estimated cash flows, and market observations of comparable investments. The frequency that the fair valuation procedures are used cannot be predicted and they may be utilized to a significant extent. The Committee manages the Fund's fair valuation practices and maintains the fair valuation policies and procedures. The Fund's investment adviser reports to the Board information regarding the fair valuation process and related material matters.
The Fund categorizes the inputs to valuation techniques used to value its investments into a disclosure hierarchy consisting of three levels as shown below:
Level 1 - unadjusted quoted prices in active markets for identical investments
Level 2 - other significant observable inputs (including quoted prices for similar investments, interest rates, prepayment speeds, etc.)
Level 3 - unobservable inputs (including the Fund's own assumptions based on the best information available)
Valuation techniques used to value the Fund's investments by major category are as follows:
Equity securities, including restricted securities, for which market quotations are readily available, are valued at the last reported sale price or official closing price as reported by a third party pricing service on the primary market or exchange on which they are traded and are categorized as Level 1 in the hierarchy. In the event there were no sales during the day or closing prices are not available, securities are valued at the last quoted bid price or may be valued using the last available price and are generally categorized as Level 2 in the hierarchy. For foreign equity securities, when market or security specific events arise, comparisons to the valuation of American Depositary Receipts (ADRs), futures contracts, Exchange-Traded Funds (ETFs) and certain indexes as well as quoted prices for similar securities may be used and would be categorized as Level 2 in the hierarchy. For equity securities, including restricted securities, where observable inputs are limited, assumptions about market activity and risk are used and these securities may be categorized as Level 3 in the hierarchy.
Investments in open-end mutual funds, including the Fidelity Central Funds, are valued at their closing net asset value (NAV) each business day and are categorized as Level 1 in the hierarchy.
Changes in valuation techniques may result in transfers in or out of an assigned level within the disclosure hierarchy. The aggregate value of investments by input level as of December 31, 2024 is included at the end of the Fund's Schedule of Investments.
Foreign Currency. Certain Funds may use foreign currency contracts to facilitate transactions in foreign-denominated securities. Gains and losses from these transactions may arise from changes in the value of the foreign currency or if the counterparties do not perform under the contracts' terms.
Foreign-denominated assets, including investment securities, and liabilities are translated into U.S. dollars at the exchange rates at period end. Purchases and sales of investment securities, income and dividends received, and expenses denominated in foreign currencies are translated into U.S. dollars at the exchange rate in effect on the transaction date.
The effects of exchange rate fluctuations on investments are included with the net realized and unrealized gain (loss) on investment securities. Other foreign currency transactions resulting in realized and unrealized gain (loss) are disclosed separately.
Investment Transactions and Income. For financial reporting purposes, the Fund's investment holdings and NAV include trades executed through the end of the last business day of the period. The NAV per share for processing shareholder transactions is calculated as of the close of business of the New York Stock Exchange (NYSE), normally 4:00 p.m. Eastern time and includes trades executed through the end of the prior business day. Gains and losses on securities sold are determined on the basis of identified cost and include proceeds received from litigation. Commissions paid to certain brokers with whom the investment adviser, or its affiliates, places trades on behalf of a fund include an amount in addition to trade execution, which may be rebated back to a fund. Any such rebates are included in net realized gain (loss) on investments in the Statement of Operations. Dividend income is recorded on the ex-dividend date, except for certain dividends from foreign securities where the ex-dividend date may have passed, which are recorded as soon as the Fund is informed of the ex-dividend date. Non-cash dividends included in dividend income, if any, are recorded at the fair market value of the securities received. Income and capital gain distributions from Fidelity Central Funds, if any, are recorded on the ex-dividend date. Investment income is recorded net of foreign taxes withheld where recovery of such taxes is uncertain. Funds may file withholding tax reclaims in certain jurisdictions to recover a portion of amounts previously withheld. Any withholding tax reclaims income is included in the Statement of Operations in dividends. Any receivables for withholding tax reclaims are included in the Statement of Assets and Liabilities in dividends receivable.
Class Allocations and Expenses. Investment income, realized and unrealized capital gains and losses, common expenses of a fund, and certain fund-level expense reductions, if any, are allocated daily on a pro-rata basis to each class based on the relative net assets of each class to the total net assets of a fund. Each class differs with respect to transfer agent and distribution and service plan fees incurred, as applicable. Certain expense reductions may also differ by class, if applicable. For the reporting period, the allocated portion of income and expenses to each class as a percent of its average net assets may vary due to the timing of recording these transactions in relation to fluctuating net assets of the classes. Expenses directly attributable to a fund are charged to that fund. Expenses attributable to more than one fund are allocated among the respective funds on the basis of relative net assets or other appropriate methods. Expenses included in the accompanying financial statements reflect the expenses of that fund and do not include any expenses associated with any underlying mutual funds or exchange-traded funds (ETFs). Although not included in a fund's expenses, a fund indirectly bears its proportionate share of these expenses through the net asset value of each underlying mutual fund or exchange-traded fund (ETF). Expense estimates are accrued in the period to which they relate and adjustments are made when actual amounts are known.
Income Tax Information and Distributions to Shareholders. Each year, the Fund intends to qualify as a regulated investment company under Subchapter M of the Internal Revenue Code, including distributing substantially all of its taxable income and realized gains. As a result, no provision for U.S. Federal income taxes is required. As of December 31, 2024, the Fund did not have any unrecognized tax benefits in the financial statements; nor is the Fund aware of any tax positions for which it is reasonably possible that the total amounts of unrecognized tax benefits will significantly change in the next twelve months. The Fund files a U.S. federal tax return, in addition to state and local tax returns as required. The Fund's federal income tax returns are subject to examination by the Internal Revenue Service (IRS) for a period of three fiscal years after they are filed. State and local tax returns may be subject to examination for an additional fiscal year depending on the jurisdiction. Foreign taxes are provided for based on the Fund's understanding of the tax rules and rates that exist in the foreign markets in which it invests.
Distributions are declared and recorded on the ex-dividend date. Income and capital gain distributions are declared separately for each class. Income and capital gain distributions are determined in accordance with income tax regulations, which may differ from GAAP.
Capital accounts within the financial statements are adjusted for permanent book-tax differences. These adjustments have no impact on net assets or the results of operations. Capital accounts are not adjusted for temporary book-tax differences which will reverse in a subsequent period.
Book-tax differences are primarily due to foreign currency transactions and losses deferred due to wash sales.
As of period end, the cost and unrealized appreciation (depreciation) in securities, and derivatives if applicable, for federal income tax purposes were as follows:
| Gross unrealized appreciation | $11,083,582 |
| Gross unrealized depreciation | (3,672,085) |
| Net unrealized appreciation (depreciation) | $7,411,497 |
| Tax Cost | $54,739,079 |
The tax-based components of distributable earnings as of period end were as follows:
| Undistributed ordinary income | $140,557 |
| Undistributed long-term capital gain | $10,032,637 |
| Net unrealized appreciation (depreciation) on securities and other investments | $7,409,289 |
The tax character of distributions paid was as follows:
| | December 31, 2024 | December 31, 2023 |
| Ordinary Income | $818,338 | $1,121,824 |
| Long-term Capital Gains | 258,462 | 170,006 |
| Total | $1,076,800 | $1,291,830 |
New Accounting Pronouncement. FASB Accounting Standards Update (ASU) 2023-07 Segment Reporting (Topic 280): Improvements to Reportable Segment Disclosures became effective in this reporting period. ASU 2023-07 enhances segment information disclosure in the notes to financial statements.
4. Purchases and Sales of Investments.
Purchases and sales of securities, other than short-term securities and in-kind transactions, as applicable, are noted in the table below.
| | Purchases ($) | Sales ($) |
| VIP Materials Portfolio | 63,872,830 | 81,689,692 |
5. Fees and Other Transactions with Affiliates.
Management Fee. Fidelity Management & Research Company LLC (the investment adviser) and its affiliates provide the Fund with investment management related services for which the Fund pays a monthly management fee.
Effective March 1, 2024, the Fund's management contract was amended to incorporate administrative services previously covered under separate services agreements (Transfer Agent and Accounting agreements). The amended contract incorporates a management fee rate that may vary by class. The investment adviser or an affiliate pays certain expenses of managing and operating the Fund out of each class's management fee. Each class of the Fund pays a management fee to the investment adviser. The management fee is calculated and paid to the investment adviser every month. When determining a class's management fee, a mandate rate is calculated based on the monthly average net assets of a group of funds advised by FMR within a designated asset class. A discount rate is subtracted from the mandate rate once the Fund's monthly average net assets reach a certain level. The mandate rate and discount rate may vary by class. The annual management fee rate for a class of shares of the Fund is the lesser of (1) the class's mandate rate reduced by the class's discount rate (if applicable) or (2) the amount set forth in the following table.
| | Maximum Management Fee Rate % |
| Initial Class | .58 |
| Investor Class | .66 |
One-twelfth of the management fee rate for a class is applied to the average net assets of the class for the month, giving a dollar amount which is the management fee for the class for that month. A different management fee rate may be applicable to each class of the Fund. The difference between classes is the result of separate arrangements for class-level services and/or waivers of certain expenses. It is not the result of any difference in advisory or custodial fees or other expenses related to the management of the Fund's assets, which do not vary by class. For the portion of the reporting period on or after March 1, 2024, the total annualized management fee rates were as follows:
| | Total Management Fee Rate % |
| Initial Class | .58 |
| Investor Class | .66 |
Prior to March 1, 2024, the management fee was the sum of an individual fund fee rate that was based on an annual rate of .30% of the Fund's average net assets and an annualized group fee rate that averaged .22% during the period. The group fee rate was based upon the monthly average net assets of a group of registered investment companies with which the investment adviser has management contracts. The group fee rate decreased as assets under management increased and increased as assets under management decreased. For the portion of the reporting period prior to March 1, 2024, the total annualized management fee rate was .52%.
Effective March 1, 2024, the Fund's sub-advisory agreements with FMR Investment Management (UK) Limited, Fidelity Management & Research (Hong Kong) Limited, and Fidelity Management & Research (Japan) Limited were amended to provide that the investment adviser pays each sub-adviser monthly fees equal to 110% of the sub-adviser's costs for providing sub-advisory services.
Transfer Agent Fees. Fidelity Investments Institutional Operations Company LLC (FIIOC), an affiliate of the investment adviser, is the Fund's transfer, dividend disbursing, and shareholder servicing agent. Effective March 1, 2024, the Fund's management contract was amended to incorporate transfer agent services and associated fees previously covered under a separate services agreement.
During the period January 1, 2024 through February 29, 2024, the transfer agent fees for each class were a fixed annual rate of class-level average net assets as follows:
| | Amount ($) | % of Class-Level Average Net Assets |
| Initial Class | 1,255 | .0630 |
| Investor Class | 15,196 | .1390 |
| | 16,451 | |
Accounting Fees. Fidelity Service Company, Inc. (FSC), an affiliate of the investment adviser, maintains the Fund's accounting records. Effective March 1, 2024, the Fund's management contract was amended to incorporate accounting services and associated fees previously covered under a separate services agreement.
During the period January 1, 2024 through February 29, 2024, the accounting fees were a fixed annual rate of average net assets as follows:
| | % of Average Net Assets |
| VIP Materials Portfolio | .0354 |
Brokerage Commissions. A portion of portfolio transactions were placed with brokerage firms which are affiliates of the investment adviser. Brokerage commissions are included in net realized gain (loss) and change in net unrealized appreciation (depreciation) in the Statement of Operations. The commissions paid to these affiliated firms were as follows:
| | Amount ($) |
| VIP Materials Portfolio | 1,410 |
Interfund Trades. Funds may purchase from or sell securities to other Fidelity Funds under procedures adopted by the Board. The procedures have been designed to ensure these interfund trades are executed in accordance with Rule 17a-7 of the 1940 Act. Any interfund trades are included within the respective purchases and sales amounts shown in the Purchases and Sales of Investments note. Interfund trades during the period are noted in the table below.
| | Purchases ($) | Sales ($) | Realized Gain (Loss) ($) |
| VIP Materials Portfolio | 2,191,524 | 2,666,057 | 486,660 |
6. Committed Line of Credit.
Certain Funds participate with other funds managed by the investment adviser or an affiliate in a $4.25 billion credit facility (the "line of credit") to be utilized for temporary or emergency purposes to fund shareholder redemptions or for other short-term liquidity purposes.
Commitment fees are charged based on the unused amount of the line of credit at an annual rate of .10%, and then allocated to each participating fund based on its pro-rata portion of the line of credit. The commitment fees are reflected in Miscellaneous expenses on the Statement of Operations, and are listed below.
Interest is charged to a participating fund based on its borrowings at an annual rate of .75% plus the highest of (i) daily SOFR plus a .10% spread adjustment, (ii) Federal Funds Effective Rate, or (iii) Overnight Bank Funding Rate. During the period, there were no borrowings on this line of credit.
The line of credit agreement will expire in March 2025 unless extended or renewed.
| Amount ($) |
| VIP Materials Portfolio | 127 |
7. Security Lending.
Funds lend portfolio securities from time to time in order to earn additional income. Lending agents are used, including National Financial Services (NFS), an affiliate of the investment adviser. Pursuant to a securities lending agreement, NFS will receive a fee, which is capped at 9.9% of a fund's daily lending revenue, for its services as lending agent. A fund may lend securities to certain qualified borrowers, including NFS. On the settlement date of the loan, a fund receives collateral (in the form of U.S. Treasury obligations, letters of credit and/or cash) against the loaned securities and maintains collateral in an amount not less than 100% of the market value of the loaned securities during the period of the loan. The market value of the loaned securities is determined at the close of business of a fund and any additional required collateral is delivered to a fund on the next business day. A fund or borrower may terminate the loan at any time, and if the borrower defaults on its obligation to return the securities loaned because of insolvency or other reasons, a fund may apply collateral received from the borrower against the obligation. A fund may experience delays and costs in recovering the securities loaned. Any cash collateral received is invested in the Fidelity Securities Lending Cash Central Fund. Any loaned securities are identified as such in the Schedule of Investments, and the value of loaned securities and cash collateral at period end, as applicable, are presented in the Statement of Assets and Liabilities. Security lending income represents the income earned on investing cash collateral, less rebates paid to borrowers and any lending agent fees associated with the loan, plus any premium payments received for lending certain types of securities. Security lending income is presented in the Statement of Operations as a component of income from Fidelity Central Funds. Affiliated security lending activity, if any, was as follows:
| | Total Security Lending Fees Paid to NFS ($) | Security Lending Income From Securities Loaned to NFS ($) | Value of Securities Loaned to NFS at Period End ($) |
| VIP Materials Portfolio | 242 | 1 | - |
8. Expense Reductions.
During the period the investment adviser or an affiliate reimbursed and/or waived a portion of fund-level operating expenses in the amount of $3,551.
9. Distributions to Shareholders.
Distributions to shareholders of each class were as follows:
| | Year ended December 31, 2024 | Year ended December 31, 2023 |
| VIP Materials Portfolio | | |
| Distributions to shareholders | | |
| Initial Class | 162,276 | 203,537 |
| Investor Class | 914,525 | 1,088,293 |
Total | $1,076,801 | $1,291,830 |
10. Share Transactions.
Transactions for each class of shares were as follows and may contain in-kind transactions:
| | Shares | Shares | Dollars | Dollars |
| | Year ended December 31, 2024 | Year ended December 31, 2023 | Year ended December 31, 2024 | Year ended December 31, 2023 |
| VIP Materials Portfolio | | | | |
| Initial Class | | | | |
| Shares sold | 36,161 | 73,273 | $657,825 | $1,259,347 |
| Reinvestment of distributions | 9,322 | 12,258 | 162,276 | 203,538 |
| Shares redeemed | (267,977) | (283,986) | (4,764,984) | (4,708,427) |
| Net increase (decrease) | (222,494) | (198,455) | $(3,944,883) | $(3,245,542) |
| Investor Class | | | | |
| Shares sold | 408,405 | 712,297 | $7,471,639 | $12,232,417 |
| Reinvestment of distributions | 52,444 | 65,565 | 914,525 | 1,088,293 |
| Shares redeemed | (1,244,180) | (1,813,905) | (21,963,764) | (30,158,206) |
| Net increase (decrease) | (783,331) | (1,036,043) | $(13,577,600) | $(16,837,496) |
11. Other.
A fund's organizational documents provide former and current trustees and officers with a limited indemnification against liabilities arising in connection with the performance of their duties to the fund. In the normal course of business, a fund may also enter into contracts that provide general indemnifications. A fund's maximum exposure under these arrangements is unknown as this would be dependent on future claims that may be made against a fund. The risk of material loss from such claims is considered remote.
At the end of the period, the investment adviser or its affiliates were owners of record of more than 10% of the outstanding shares as follows:
| Fund | Affiliated % |
| VIP Materials Portfolio | 100% |
12. Risk and Uncertainties.
Many factors affect a fund's performance. Developments that disrupt global economies and financial markets, such as pandemics, epidemics, outbreaks of infectious diseases, war, terrorism, and environmental disasters, may significantly affect a fund's investment performance. The effects of these developments to a fund will be impacted by the types of securities in which a fund invests, the financial condition, industry, economic sector, and geographic location of an issuer, and a fund's level of investment in the securities of that issuer. Significant concentrations in security types, issuers, industries, sectors, and geographic locations may magnify the factors that affect a fund's performance.
Report of Independent Registered Public Accounting Firm
To the Board of Trustees of Variable Insurance Products Fund IV and Shareholders of VIP Materials Portfolio
Opinion on the Financial Statements
We have audited the accompanying statement of assets and liabilities, including the schedule of investments, of VIP Materials Portfolio (one of the funds constituting Variable Insurance Products Fund IV, referred to hereafter as the "Fund") as of December 31, 2024, the related statement of operations for the year ended December 31, 2024, the statement of changes in net assets for each of the two years in the period ended December 31, 2024, including the related notes, and the financial highlights for each of the five years in the period ended December 31, 2024 (collectively referred to as the "financial statements"). In our opinion, the financial statements present fairly, in all material respects, the financial position of the Fund as of December 31, 2024, the results of its operations for the year then ended, the changes in its net assets for each of the two years in the period ended December 31, 2024 and the financial highlights for each of the five years in the period ended December 31, 2024 in conformity with accounting principles generally accepted in the United States of America.
Basis for Opinion
These financial statements are the responsibility of the Fund's management. Our responsibility is to express an opinion on the Fund's financial statements based on our audits. We are a public accounting firm registered with the Public Company Accounting Oversight Board (United States) (PCAOB) and are required to be independent with respect to the Fund in accordance with the U.S. federal securities laws and the applicable rules and regulations of the Securities and Exchange Commission and the PCAOB.
We conducted our audits of these financial statements in accordance with the standards of the PCAOB. Those standards require that we plan and perform the audit to obtain reasonable assurance about whether the financial statements are free of material misstatement, whether due to error or fraud.
Our audits included performing procedures to assess the risks of material misstatement of the financial statements, whether due to error or fraud, and performing procedures that respond to those risks. Such procedures included examining, on a test basis, evidence regarding the amounts and disclosures in the financial statements. Our audits also included evaluating the accounting principles used and significant estimates made by management, as well as evaluating the overall presentation of the financial statements. Our procedures included confirmation of securities owned as of December 31, 2024 by correspondence with the custodian. We believe that our audits provide a reasonable basis for our opinion.
/s/ PricewaterhouseCoopers LLP
Boston, Massachusetts
February 12, 2025
We have served as the auditor of one or more investment companies in the Fidelity group of funds since 1932.
Distributions
(Unaudited)The dividend and capital gains distributions for the fund(s) are available on Fidelity.com or Institutional.Fidelity.com.
The fund hereby designates as a capital gain dividend with respect to the taxable year ended December 31, 2024, $10,041,321, or, if subsequently determined to be different, the net capital gain of such year.
The fund designates $2,984 of distributions paid during the fiscal year ended 2024 as qualifying to be taxed as section 163(j) interest dividends.
Initial class designates 45% and 98%; and Investor class designates 46% and 100% of the dividends distributed in February and December, respectively, during the fiscal year as qualifying for the dividends-received deduction for corporate shareholders.
Item 8: Changes in and Disagreements with Accountants for Open-End Management Investment Companies
(Unaudited)
Note: This is not applicable for any fund included in this document.
Item 9: Proxy Disclosures for Open-End Management Investment Companies
(Unaudited)
| A special meeting of shareholders was held on July 16, 2024. The results of votes taken among shareholders on the proposal before them are reported below. Each vote reported represents one dollar of net asset value held on the record date for the meeting. |
| Proposal 1 |
| To elect a Board of Trustees. |
| | # of Votes | % of Votes |
| Bettina Doulton |
| Affirmative | 5,501,492,681.85 | 94.15 |
| Withheld | 341,991,035.05 | 5.85 |
| TOTAL | 5,843,483,716.90 | 100.00 |
| Robert A. Lawrence |
| Affirmative | 5,480,901,467.70 | 93.80 |
| Withheld | 362,582,249.21 | 6.20 |
| TOTAL | 5,843,483,716.90 | 100.00 |
| Vijay C. Advani |
| Affirmative | 5,500,352,811.04 | 94.13 |
| Withheld | 343,130,905.86 | 5.87 |
| TOTAL | 5,843,483,716.90 | 100.00 |
| Thomas P. Bostick |
| Affirmative | 5,488,165,362.69 | 93.92 |
| Withheld | 355,318,354.21 | 6.08 |
| TOTAL | 5,843,483,716.90 | 100.00 |
| Donald F. Donahue |
| Affirmative | 5,482,960,893.76 | 93.83 |
| Withheld | 360,522,823.14 | 6.17 |
| TOTAL | 5,843,483,716.90 | 100.00 |
| Vicki L. Fuller |
| Affirmative | 5,492,283,337.89 | 93.99 |
| Withheld | 351,200,379.01 | 6.01 |
| TOTAL | 5,843,483,716.90 | 100.00 |
| Patricia L. Kampling |
| Affirmative | 5,521,992,715.20 | 94.50 |
| Withheld | 321,491,001.70 | 5.50 |
| TOTAL | 5,843,483,716.90 | 100.00 |
| Thomas A. Kennedy |
| Affirmative | 5,484,789,158.10 | 93.86 |
| Withheld | 358,694,558.80 | 6.14 |
| TOTAL | 5,843,483,716.90 | 100.00 |
| Oscar Munoz |
| Affirmative | 5,497,884,744.63 | 94.09 |
| Withheld | 345,598,972.27 | 5.91 |
| TOTAL | 5,843,483,716.90 | 100.00 |
| Karen B. Peetz |
| Affirmative | 5,503,968,240.81 | 94.19 |
| Withheld | 339,515,476.09 | 5.81 |
| TOTAL | 5,843,483,716.90 | 100.00 |
| David M. Thomas |
| Affirmative | 5,466,218,204.40 | 93.54 |
| Withheld | 377,265,512.50 | 6.46 |
| TOTAL | 5,843,483,716.90 | 100.00 |
| Susan Tomasky |
| Affirmative | 5,463,402,825.36 | 93.50 |
| Withheld | 380,080,891.54 | 6.50 |
| TOTAL | 5,843,483,716.90 | 100.00 |
| Michael E. Wiley |
| Affirmative | 5,466,838,155.74 | 93.55 |
| Withheld | 376,645,561.16 | 6.45 |
| TOTAL | 5,843,483,716.90 | 100.00 |
| | | |
| Proposal 1 reflects trust-wide proposal and voting results. |
Item 10: Remuneration Paid to Directors, Officers, and others of Open-End Management Investment Companies
(Unaudited)
Note: This information is disclosed as part of the financial statements for each Fund as part of Item 7: Financial Statements and Financial Highlights for Open-End Management Investment companies.
Item 11: Statement Regarding Basis for Approval of Investment Advisory Contract
(Unaudited)
Note: This is not applicable for any fund included in this document.
1.850999.117
VMATP-ANN-0325
Fidelity® Variable Insurance Products:
VIP Utilities Portfolio
Annual Report
December 31, 2024
Contents
To view a fund's proxy voting guidelines and proxy voting record for the 12-month period ended June 30, visit http://www.fidelity.com/proxyvotingresults or visit the Securities and Exchange Commission's (SEC) web site at http://www.sec.gov.
You may also call 1-877-208-0098 to request a free copy of the proxy voting guidelines.
Fidelity® Variable Insurance Products are separate account options which are purchased through a variable insurance contract.
Standard & Poor's, S&P and S&P 500 are registered service marks of The McGraw-Hill Companies, Inc. and have been licensed for use by Fidelity Distributors Corporation.
Other third-party marks appearing herein are the property of their respective owners.
All other marks appearing herein are registered or unregistered trademarks or service marks of FMR LLC or an affiliated company. © 2025 FMR LLC. All rights reserved.
This report and the financial statements contained herein are submitted for the general information of the shareholders of the Fund. This report is not authorized for distribution to prospective investors in the Fund unless preceded or accompanied by an effective prospectus.
A fund files its complete schedule of portfolio holdings with the SEC for the first and third quarters of each fiscal year on Form N-PORT. Forms N-PORT are available on the SEC's web site at http://www.sec.gov. A fund's Forms N-PORT may be reviewed and copied at the SEC's Public Reference Room in Washington, DC. Information regarding the operation of the SEC's Public Reference Room may be obtained by calling 1-800-SEC-0330.
For a complete list of a fund's portfolio holdings, view the most recent holdings listing, semiannual report, or annual report on Fidelity's web site at http://www.fidelity.com, http://www.institutional.fidelity.com, or http://www.401k.com, as applicable.
NOT FDIC INSURED •MAY LOSE VALUE •NO BANK GUARANTEE
Neither the Fund nor Fidelity Distributors Corporation is a bank.
Item 7: Financial Statements and Financial Highlights for Open-End Management Investment Companies (Annual Report)
Schedule of Investments December 31, 2024
Showing Percentage of Net Assets
| Common Stocks - 95.5% |
| | | Shares | Value ($) |
| UNITED STATES - 95.5% | | | |
| Industrials - 1.3% | | | |
| Electrical Equipment - 1.3% | | | |
| Fluence Energy Inc Class A (a)(b) | | 64,406 | 1,022,767 |
| GE Vernova Inc | | 9,100 | 2,993,263 |
| | | | 4,016,030 |
| Information Technology - 0.3% | | | |
| Semiconductors & Semiconductor Equipment - 0.3% | | | |
| First Solar Inc (a) | | 5,900 | 1,039,816 |
| Utilities - 93.9% | | | |
| Electric Utilities - 61.3% | | | |
| Constellation Energy Corp | | 83,098 | 18,589,854 |
| Duke Energy Corp | | 214,479 | 23,107,967 |
| Edison International | | 159,058 | 12,699,191 |
| Entergy Corp | | 204,052 | 15,471,223 |
| Evergy Inc | | 132,100 | 8,130,755 |
| Eversource Energy | | 154,700 | 8,884,421 |
| Exelon Corp | | 272,800 | 10,268,192 |
| FirstEnergy Corp | | 184,100 | 7,323,498 |
| NextEra Energy Inc | | 435,588 | 31,227,304 |
| NRG Energy Inc | | 62,767 | 5,662,839 |
| PG&E Corp | | 910,938 | 18,382,729 |
| Pinnacle West Capital Corp | | 14,860 | 1,259,681 |
| PPL Corp | | 229,199 | 7,439,800 |
| Southern Co/The | | 96,262 | 7,924,288 |
| TXNM Energy Inc | | 93,684 | 4,606,441 |
| Xcel Energy Inc | | 195,490 | 13,199,485 |
| | | | 194,177,668 |
| Gas Utilities - 1.8% | | | |
| Southwest Gas Holdings Inc | | 31,922 | 2,257,205 |
| UGI Corp | | 123,700 | 3,492,051 |
| | | | 5,749,256 |
| Independent Power and Renewable Electricity Producers - 7.7% | | | |
| AES Corp/The | | 567,100 | 7,298,577 |
| Talen Energy Corp (a) | | 6,981 | 1,406,462 |
| Vistra Corp | | 114,493 | 15,785,150 |
| | | | 24,490,189 |
| Multi-Utilities - 23.1% | | | |
| Ameren Corp | | 152,600 | 13,602,764 |
| CenterPoint Energy Inc | | 390,070 | 12,376,921 |
| Dominion Energy Inc | | 62,090 | 3,344,167 |
| NiSource Inc | | 238,838 | 8,779,685 |
| Public Service Enterprise Group Inc | | 161,069 | 13,608,720 |
| Sempra | | 246,083 | 21,586,401 |
| | | | 73,298,658 |
TOTAL UTILITIES | | | 297,715,771 |
| | | | |
| TOTAL UNITED STATES | | | 302,771,617 |
| TOTAL COMMON STOCKS (Cost $226,597,142) | | | 302,771,617 |
| | | | |
| Money Market Funds - 4.7% |
| | | Yield (%) | Shares | Value ($) |
| Fidelity Cash Central Fund (c) | | 4.36 | 13,918,144 | 13,920,928 |
| Fidelity Securities Lending Cash Central Fund (c)(d) | | 4.35 | 1,078,592 | 1,078,700 |
| TOTAL MONEY MARKET FUNDS (Cost $14,999,628) | | | | 14,999,628 |
| | | | | |
| TOTAL INVESTMENT IN SECURITIES - 100.2% (Cost $241,596,770) | 317,771,245 |
NET OTHER ASSETS (LIABILITIES) - (0.2)% | (665,066) |
| NET ASSETS - 100.0% | 317,106,179 |
| | |
Legend
| (b) | Security or a portion of the security is on loan at period end. |
| (c) | Affiliated fund that is generally available only to investment companies and other accounts managed by Fidelity Investments. The rate quoted is the annualized seven-day yield of the fund at period end. A complete unaudited listing of the fund's holdings as of its most recent quarter end is available upon request. In addition, each Fidelity Central Fund's financial statements, which are not covered by the Fund's Report of Independent Registered Public Accounting Firm, are available on the SEC's website or upon request. |
| (d) | Investment made with cash collateral received from securities on loan. |
Affiliated Central Funds
Fiscal year to date information regarding the Fund's investments in Fidelity Central Funds, including the ownership percentage, is presented below.
| Affiliate | Value, beginning of period ($) | Purchases ($) | Sales Proceeds ($) | Dividend Income ($) | Realized Gain (loss) ($) | Change in Unrealized appreciation (depreciation) ($) | Value, end of period ($) | Shares, end of period | % ownership, end of period |
| Fidelity Cash Central Fund | 654,656 | 127,450,043 | 114,183,695 | 167,576 | (76) | - | 13,920,928 | 13,918,144 | 0.0% |
| Fidelity Securities Lending Cash Central Fund | 1,783,550 | 39,923,207 | 40,628,057 | 1,305 | - | - | 1,078,700 | 1,078,592 | 0.0% |
| Total | 2,438,206 | 167,373,250 | 154,811,752 | 168,881 | (76) | - | 14,999,628 | 14,996,736 | |
| | | | | | | | | | |
Amounts in the dividend income column in the above table include any capital gain distributions from underlying funds, which are presented in the corresponding line item in the Statement of Operations, if applicable.
Amounts in the dividend income column for Fidelity Securities Lending Cash Central Fund represents the income earned on investing cash collateral, less rebates paid to borrowers and any lending agent fees associated with the loan, plus any premium payments received for lending certain types of securities.
Amounts included in the purchases and sales proceeds columns may include in-kind transactions, if applicable.
Investment Valuation
The following is a summary of the inputs used, as of December 31, 2024, involving the Fund's assets and liabilities carried at fair value. The inputs or methodology used for valuing securities may not be an indication of the risk associated with investing in those securities. For more information on valuation inputs, and their aggregation into the levels used below, please refer to the Investment Valuation section in the accompanying Notes to Financial Statements.
| Valuation Inputs at Reporting Date: |
| Description | Total ($) | Level 1 ($) | Level 2 ($) | Level 3 ($) |
Investments in Securities: | | | | |
|
| Common Stocks | | | | |
Industrials | 4,016,030 | 4,016,030 | - | - |
Information Technology | 1,039,816 | 1,039,816 | - | - |
Utilities | 297,715,771 | 297,715,771 | - | - |
|
| Money Market Funds | 14,999,628 | 14,999,628 | - | - |
| Total Investments in Securities: | 317,771,245 | 317,771,245 | - | - |
Financial Statements
| Statement of Assets and Liabilities |
As of December 31, 2024 |
| Assets | | | | |
| Investment in securities, at value (including securities loaned of $1,022,672) - See accompanying schedule: | | | | |
Unaffiliated issuers (cost $226,597,142) | $ | 302,771,617 | | |
Fidelity Central Funds (cost $14,999,628) | | 14,999,628 | | |
| | | | | |
| | | | | |
| Total Investment in Securities (cost $241,596,770) | | | $ | 317,771,245 |
| Receivable for investments sold | | | | 93,065 |
| Receivable for fund shares sold | | | | 230,909 |
| Dividends receivable | | | | 282,047 |
| Distributions receivable from Fidelity Central Funds | | | | 36,376 |
| Prepaid expenses | | | | 225 |
Total assets | | | | 318,413,867 |
| Liabilities | | | | |
| Payable for fund shares redeemed | $ | 12,449 | | |
| Accrued management fee | | 172,560 | | |
| Other payables and accrued expenses | | 43,979 | | |
| Collateral on securities loaned | | 1,078,700 | | |
| Total liabilities | | | | 1,307,688 |
| Net Assets | | | $ | 317,106,179 |
| Net Assets consist of: | | | | |
| Paid in capital | | | $ | 233,409,179 |
| Total accumulated earnings (loss) | | | | 83,697,000 |
| Net Assets | | | $ | 317,106,179 |
| | | | | |
| Net Asset Value and Maximum Offering Price | | | | |
| Initial Class : | | | | |
Net Asset Value, offering price and redemption price per share ($47,663,794 ÷ 1,972,118 shares) | | | $ | 24.17 |
| Investor Class : | | | | |
Net Asset Value, offering price and redemption price per share ($269,442,385 ÷ 11,249,913 shares) | | | $ | 23.95 |
| Statement of Operations |
| Year ended December 31, 2024 |
| Investment Income | | | | |
| Dividends | | | $ | 6,792,266 |
| Income from Fidelity Central Funds (including $1,305 from security lending) | | | | 168,881 |
| Total income | | | | 6,961,147 |
| Expenses | | | | |
| Management fee | $ | 1,512,455 | | |
| Transfer agent fees | | 41,085 | | |
| Accounting fees | | 11,462 | | |
| Custodian fees and expenses | | 13,356 | | |
| Independent trustees' fees and expenses | | 991 | | |
| Audit fees | | 40,343 | | |
| Legal | | 441 | | |
| Miscellaneous | | 6,979 | | |
| Total expenses before reductions | | 1,627,112 | | |
| Expense reductions | | (8,979) | | |
| Total expenses after reductions | | | | 1,618,133 |
| Net Investment income (loss) | | | | 5,343,014 |
| Realized and Unrealized Gain (Loss) | | | | |
| Net realized gain (loss) on: | | | | |
| Investment Securities: | | | | |
| Unaffiliated issuers | | 11,094,880 | | |
| Fidelity Central Funds | | (76) | | |
| Foreign currency transactions | | 1,153 | | |
| Total net realized gain (loss) | | | | 11,095,957 |
| Change in net unrealized appreciation (depreciation) on: | | | | |
| Investment Securities: | | | | |
| Unaffiliated issuers | | 38,038,186 | | |
| Assets and liabilities in foreign currencies | | (192) | | |
| Total change in net unrealized appreciation (depreciation) | | | | 38,037,994 |
| Net gain (loss) | | | | 49,133,951 |
| Net increase (decrease) in net assets resulting from operations | | | $ | 54,476,965 |
| Statement of Changes in Net Assets |
| |
| | Year ended December 31, 2024 | | Year ended December 31, 2023 |
| Increase (Decrease) in Net Assets | | | | |
| Operations | | | | |
| Net investment income (loss) | $ | 5,343,014 | $ | 4,900,769 |
| Net realized gain (loss) | | 11,095,957 | | 9,052,304 |
| Change in net unrealized appreciation (depreciation) | | 38,037,994 | | (19,619,540) |
| Net increase (decrease) in net assets resulting from operations | | 54,476,965 | | (5,666,467) |
| Distributions to shareholders | | (17,521,898) | | (11,906,248) |
| | | | | |
| Share transactions - net increase (decrease) | | 73,300,062 | | (59,879,890) |
| Total increase (decrease) in net assets | | 110,255,129 | | (77,452,605) |
| | | | | |
| Net Assets | | | | |
| Beginning of period | | 206,851,050 | | 284,303,655 |
| End of period | $ | 317,106,179 | $ | 206,851,050 |
| | | | | |
| | | | | |
Financial Highlights
VIP Utilities Portfolio Initial Class |
| |
| Years ended December 31, | | 2024 | | 2023 | | 2022 | | 2021 | | 2020 |
Selected Per-Share Data | | | | | | | | | | |
| Net asset value, beginning of period | $ | 20.23 | $ | 21.53 | $ | 20.80 | $ | 18.05 | $ | 18.79 |
| Income from Investment Operations | | | | | | | | | | |
Net investment income (loss) A,B | | .51 | | .44 | | .38 | | .40 | | .34 |
| Net realized and unrealized gain (loss) | | 5.05 | | (.71) | | .75 | | 2.71 | | (.35) |
| Total from investment operations | | 5.56 | | (.27) | | 1.13 | | 3.11 | | (.01) |
| Distributions from net investment income | | (.45) | | (.46) | | (.34) | | (.36) | | (.45) |
| Distributions from net realized gain | | (1.17) | | (.58) | | (.06) | | - | | (.28) |
| Total distributions | | (1.62) | | (1.03) C | | (.40) | | (.36) | | (.73) |
| Net asset value, end of period | $ | 24.17 | $ | 20.23 | $ | 21.53 | $ | 20.80 | $ | 18.05 |
Total Return D,E | | | | (1.08)% | | 5.47% | | 17.43% | | (.12)% |
Ratios to Average Net Assets A,F,G | | | | | | | | | | |
| Expenses before reductions | | .61% | | .65% | | .64% | | .65% | | .67% |
| Expenses net of fee waivers, if any | | | | .64% | | .64% | | .65% | | .67% |
| Expenses net of all reductions | | .61% | | .64% | | .64% | | .65% | | .66% |
| Net investment income (loss) | | 2.29% | | 2.18% | | 1.81% | | 2.09% | | 1.96% |
| Supplemental Data | | | | | | | | | | |
| Net assets, end of period (000 omitted) | $ | 47,664 | $ | 33,579 | $ | 48,029 | $ | 29,279 | $ | 26,868 |
Portfolio turnover rate H | | | | 71% | | 53% | | 32% | | 66% |
ANet investment income (loss) is affected by the timing of the declaration of dividends by any underlying mutual funds or exchange-traded funds (ETFs). Net investment income (loss) of any mutual funds or ETFs is not included in the Fund's net investment income (loss) ratio.
BCalculated based on average shares outstanding during the period.
CTotal distributions per share do not sum due to rounding.
DTotal returns do not reflect charges attributable to your insurance company's separate account. Inclusion of these charges would reduce the total returns shown.
ETotal returns would have been lower if certain expenses had not been reduced during the applicable periods shown.
FFees and expenses of any underlying mutual funds or exchange-traded funds (ETFs) are not included in the Fund's expense ratio. The Fund indirectly bears its proportionate share of these expenses. For additional expense information related to investments in Fidelity Central Funds, please refer to the "Investments in Fidelity Central Funds" note found in the Notes to Financial Statements section of the most recent Annual or Semi-Annual report.
GExpense ratios reflect operating expenses of the class. Expenses before reductions do not reflect amounts reimbursed, waived, or reduced through arrangements with the investment adviser, brokerage services, or other offset arrangements, if applicable, and do not represent the amount paid by the class during periods when reimbursements, waivers or reductions occur.
HAmount does not include the portfolio activity of any underlying mutual funds or exchange-traded funds (ETFs), derivatives or securities that mature within one year from acquisition.
VIP Utilities Portfolio Investor Class |
| |
| Years ended December 31, | | 2024 | | 2023 | | 2022 | | 2021 | | 2020 |
Selected Per-Share Data | | | | | | | | | | |
| Net asset value, beginning of period | $ | 20.07 | $ | 21.36 | $ | 20.64 | $ | 17.92 | $ | 18.66 |
| Income from Investment Operations | | | | | | | | | | |
Net investment income (loss) A,B | | .49 | | .42 | | .36 | | .38 | | .32 |
| Net realized and unrealized gain (loss) | | 5.00 | | (.69) | | .74 | | 2.69 | | (.35) |
| Total from investment operations | | 5.49 | | (.27) | | 1.10 | | 3.07 | | (.03) |
| Distributions from net investment income | | (.45) | | (.44) | | (.32) | | (.35) | | (.44) |
| Distributions from net realized gain | | (1.17) | | (.58) | | (.06) | | - | | (.28) |
| Total distributions | | (1.61) C | | (1.02) | | (.38) | | (.35) | | (.71) C |
| Net asset value, end of period | $ | 23.95 | $ | 20.07 | $ | 21.36 | $ | 20.64 | $ | 17.92 |
Total Return D,E | | | | (1.12)% | | 5.39% | | 17.30% | | (.20)% |
Ratios to Average Net Assets B,F,G | | | | | | | | | | |
| Expenses before reductions | | .69% | | .73% | | .72% | | .73% | | .75% |
| Expenses net of fee waivers, if any | | | | .72% | | .72% | | .73% | | .75% |
| Expenses net of all reductions | | .69% | | .72% | | .72% | | .73% | | .74% |
| Net investment income (loss) | | 2.21% | | 2.11% | | 1.74% | | 2.01% | | 1.89% |
| Supplemental Data | | | | | | | | | | |
| Net assets, end of period (000 omitted) | $ | 269,442 | $ | 173,272 | $ | 236,275 | $ | 168,490 | $ | 151,484 |
Portfolio turnover rate H | | | | 71% | | 53% | | 32% | | 66% |
ACalculated based on average shares outstanding during the period.
BNet investment income (loss) is affected by the timing of the declaration of dividends by any underlying mutual funds or exchange-traded funds (ETFs). Net investment income (loss) of any mutual funds or ETFs is not included in the Fund's net investment income (loss) ratio.
CTotal distributions per share do not sum due to rounding.
DTotal returns do not reflect charges attributable to your insurance company's separate account. Inclusion of these charges would reduce the total returns shown.
ETotal returns would have been lower if certain expenses had not been reduced during the applicable periods shown.
FFees and expenses of any underlying mutual funds or exchange-traded funds (ETFs) are not included in the Fund's expense ratio. The Fund indirectly bears its proportionate share of these expenses. For additional expense information related to investments in Fidelity Central Funds, please refer to the "Investments in Fidelity Central Funds" note found in the Notes to Financial Statements section of the most recent Annual or Semi-Annual report.
GExpense ratios reflect operating expenses of the class. Expenses before reductions do not reflect amounts reimbursed, waived, or reduced through arrangements with the investment adviser, brokerage services, or other offset arrangements, if applicable, and do not represent the amount paid by the class during periods when reimbursements, waivers or reductions occur.
HAmount does not include the portfolio activity of any underlying mutual funds or exchange-traded funds (ETFs), derivatives or securities that mature within one year from acquisition.
Notes to Financial Statements
For the period ended December 31, 2024
1. Organization.
VIP Utilities Portfolio (the Fund) is a non-diversified fund of Variable Insurance Products Fund IV (the Trust) and is authorized to issue an unlimited number of shares. The Trust is registered under the Investment Company Act of 1940, as amended (the 1940 Act), as an open-end management investment company organized as a Massachusetts business trust. Shares of the Fund may only be purchased by insurance companies for the purpose of funding variable annuity or variable life insurance contracts. The Fund offers the following classes of shares: Initial Class shares and Investor Class shares. All classes have equal rights and voting privileges, except for matters affecting a single class.
2. Investments in Fidelity Central Funds.
Funds may invest in Fidelity Central Funds, which are open-end investment companies generally available only to other investment companies and accounts managed by the investment adviser and its affiliates. The Schedule of Investments lists any Fidelity Central Funds held as an investment as of period end, but does not include the underlying holdings of each Fidelity Central Fund. An investing fund indirectly bears its proportionate share of the expenses of the underlying Fidelity Central Funds.
Based on its investment objective, each Fidelity Central Fund may invest or participate in various investment vehicles or strategies that are similar to those of the investing fund. These strategies are consistent with the investment objectives of the investing fund and may involve certain economic risks which may cause a decline in value of each of the Fidelity Central Funds and thus a decline in the value of the investing fund.
| Fidelity Central Fund | Investment Manager | Investment Objective | Investment Practices | Expense RatioA |
| Fidelity Money Market Central Funds | Fidelity Management & Research Company LLC (FMR) | Each fund seeks to obtain a high level of current income consistent with the preservation of capital and liquidity. | Short-term Investments | Less than .005% |
A Expenses expressed as a percentage of average net assets and are as of each underlying Central Fund's most recent annual or semi-annual shareholder report.
A complete unaudited list of holdings for each Fidelity Central Fund is available upon request or at the Securities and Exchange Commission website at www.sec.gov. In addition, the financial statements of the Fidelity Central Funds which contain the significant accounting policies (including investment valuation policies) of those funds, and are not covered by the Report of Independent Registered Public Accounting Firm, are available on the Securities and Exchange Commission website or upon request.
3. Significant Accounting Policies.
The Fund is an investment company and applies the accounting and reporting guidance of the Financial Accounting Standards Board (FASB) Accounting Standards Codification Topic 946 Financial Services - Investment Companies. The financial statements have been prepared in conformity with accounting principles generally accepted in the United States of America (GAAP), which require management to make certain estimates and assumptions at the date of the financial statements. Actual results could differ from those estimates. The Fund operates as a single operating segment. The Fund's income, expenses, assets, and performance are regularly monitored and assessed as a whole by the investment adviser and other individuals responsible for oversight functions of the Trust, using the information presented in the financial statements and financial highlights. Subsequent events, if any, through the date that the financial statements were issued have been evaluated in the preparation of the financial statements. The Fund's Schedule of Investments lists any underlying mutual funds or exchange-traded funds (ETFs) but does not include the underlying holdings of these funds. The following summarizes the significant accounting policies of the Fund:
Investment Valuation. Investments are valued as of 4:00 p.m. Eastern time on the last calendar day of the period. The Board of Trustees (the Board) has designated the Fund's investment adviser as the valuation designee responsible for the fair valuation function and performing fair value determinations as needed. The investment adviser has established a Fair Value Committee (the Committee) to carry out the day-to-day fair valuation responsibilities and has adopted policies and procedures to govern the fair valuation process and the activities of the Committee. In accordance with these fair valuation policies and procedures, which have been approved by the Board, the Fund attempts to obtain prices from one or more third party pricing services or brokers to value its investments. When current market prices, quotations or currency exchange rates are not readily available or reliable, investments will be fair valued in good faith by the Committee, in accordance with the policies and procedures. Factors used in determining fair value vary by investment type and may include market or investment specific events, transaction data, estimated cash flows, and market observations of comparable investments. The frequency that the fair valuation procedures are used cannot be predicted and they may be utilized to a significant extent. The Committee manages the Fund's fair valuation practices and maintains the fair valuation policies and procedures. The Fund's investment adviser reports to the Board information regarding the fair valuation process and related material matters.
The Fund categorizes the inputs to valuation techniques used to value its investments into a disclosure hierarchy consisting of three levels as shown below:
Level 1 - unadjusted quoted prices in active markets for identical investments
Level 2 - other significant observable inputs (including quoted prices for similar investments, interest rates, prepayment speeds, etc.)
Level 3 - unobservable inputs (including the Fund's own assumptions based on the best information available)
Valuation techniques used to value the Fund's investments by major category are as follows:
Equity securities, including restricted securities, for which market quotations are readily available, are valued at the last reported sale price or official closing price as reported by a third party pricing service on the primary market or exchange on which they are traded and are categorized as Level 1 in the hierarchy. In the event there were no sales during the day or closing prices are not available, securities are valued at the last quoted bid price or may be valued using the last available price and are generally categorized as Level 2 in the hierarchy. For foreign equity securities, when market or security specific events arise, comparisons to the valuation of American Depositary Receipts (ADRs), futures contracts, Exchange-Traded Funds (ETFs) and certain indexes as well as quoted prices for similar securities may be used and would be categorized as Level 2 in the hierarchy. For equity securities, including restricted securities, where observable inputs are limited, assumptions about market activity and risk are used and these securities may be categorized as Level 3 in the hierarchy.
Investments in open-end mutual funds, including the Fidelity Central Funds, are valued at their closing net asset value (NAV) each business day and are categorized as Level 1 in the hierarchy.
Changes in valuation techniques may result in transfers in or out of an assigned level within the disclosure hierarchy. The aggregate value of investments by input level as of December 31, 2024 is included at the end of the Fund's Schedule of Investments.
Foreign Currency. Certain Funds may use foreign currency contracts to facilitate transactions in foreign-denominated securities. Gains and losses from these transactions may arise from changes in the value of the foreign currency or if the counterparties do not perform under the contracts' terms.
Foreign-denominated assets, including investment securities, and liabilities are translated into U.S. dollars at the exchange rates at period end. Purchases and sales of investment securities, income and dividends received, and expenses denominated in foreign currencies are translated into U.S. dollars at the exchange rate in effect on the transaction date.
The effects of exchange rate fluctuations on investments are included with the net realized and unrealized gain (loss) on investment securities. Other foreign currency transactions resulting in realized and unrealized gain (loss) are disclosed separately.
Investment Transactions and Income. For financial reporting purposes, the Fund's investment holdings and NAV include trades executed through the end of the last business day of the period. The NAV per share for processing shareholder transactions is calculated as of the close of business of the New York Stock Exchange (NYSE), normally 4:00 p.m. Eastern time and includes trades executed through the end of the prior business day. Gains and losses on securities sold are determined on the basis of identified cost and include proceeds received from litigation. Commissions paid to certain brokers with whom the investment adviser, or its affiliates, places trades on behalf of a fund include an amount in addition to trade execution, which may be rebated back to a fund. Any such rebates are included in net realized gain (loss) on investments in the Statement of Operations. Dividend income is recorded on the ex-dividend date, except for certain dividends from foreign securities where the ex-dividend date may have passed, which are recorded as soon as the Fund is informed of the ex-dividend date. Non-cash dividends included in dividend income, if any, are recorded at the fair market value of the securities received. Income and capital gain distributions from Fidelity Central Funds, if any, are recorded on the ex-dividend date. Certain distributions received by the Fund represent a return of capital or capital gain. The Fund determines the components of these distributions subsequent to the ex-dividend date, based upon receipt of tax filings or other correspondence relating to the underlying investment. These distributions are recorded as a reduction of cost of investments and/or as a realized gain. Investment income is recorded net of foreign taxes withheld where recovery of such taxes is uncertain. Funds may file withholding tax reclaims in certain jurisdictions to recover a portion of amounts previously withheld. Any withholding tax reclaims income is included in the Statement of Operations in dividends. Any receivables for withholding tax reclaims are included in the Statement of Assets and Liabilities in dividends receivable.
Class Allocations and Expenses. Investment income, realized and unrealized capital gains and losses, common expenses of a fund, and certain fund-level expense reductions, if any, are allocated daily on a pro-rata basis to each class based on the relative net assets of each class to the total net assets of a fund. Each class differs with respect to transfer agent and distribution and service plan fees incurred, as applicable. Certain expense reductions may also differ by class, if applicable. For the reporting period, the allocated portion of income and expenses to each class as a percent of its average net assets may vary due to the timing of recording these transactions in relation to fluctuating net assets of the classes. Expenses directly attributable to a fund are charged to that fund. Expenses attributable to more than one fund are allocated among the respective funds on the basis of relative net assets or other appropriate methods. Expenses included in the accompanying financial statements reflect the expenses of that fund and do not include any expenses associated with any underlying mutual funds or exchange-traded funds (ETFs). Although not included in a fund's expenses, a fund indirectly bears its proportionate share of these expenses through the net asset value of each underlying mutual fund or exchange-traded fund (ETF). Expense estimates are accrued in the period to which they relate and adjustments are made when actual amounts are known.
Income Tax Information and Distributions to Shareholders. Each year, the Fund intends to qualify as a regulated investment company under Subchapter M of the Internal Revenue Code, including distributing substantially all of its taxable income and realized gains. As a result, no provision for U.S. Federal income taxes is required. As of December 31, 2024, the Fund did not have any unrecognized tax benefits in the financial statements; nor is the Fund aware of any tax positions for which it is reasonably possible that the total amounts of unrecognized tax benefits will significantly change in the next twelve months. The Fund files a U.S. federal tax return, in addition to state and local tax returns as required. The Fund's federal income tax returns are subject to examination by the Internal Revenue Service (IRS) for a period of three fiscal years after they are filed. State and local tax returns may be subject to examination for an additional fiscal year depending on the jurisdiction. Foreign taxes are provided for based on the Fund's understanding of the tax rules and rates that exist in the foreign markets in which it invests.
Distributions are declared and recorded on the ex-dividend date. Income and capital gain distributions are declared separately for each class. Income and capital gain distributions are determined in accordance with income tax regulations, which may differ from GAAP.
Capital accounts within the financial statements are adjusted for permanent book-tax differences. These adjustments have no impact on net assets or the results of operations. Capital accounts are not adjusted for temporary book-tax differences which will reverse in a subsequent period.
Book-tax differences are primarily due to foreign currency transactions and losses deferred due to wash sales.
As of period end, the cost and unrealized appreciation (depreciation) in securities, and derivatives if applicable, for federal income tax purposes were as follows:
| Gross unrealized appreciation | $80,300,471 |
| Gross unrealized depreciation | (4,724,149) |
| Net unrealized appreciation (depreciation) | $75,576,322 |
| Tax Cost | $242,194,923 |
The tax-based components of distributable earnings as of period end were as follows:
| Undistributed ordinary income | $1,551,008 |
| Undistributed long-term capital gain | $6,569,904 |
| Net unrealized appreciation (depreciation) on securities and other investments | $75,576,087 |
The tax character of distributions paid was as follows:
| | December 31, 2024 | December 31, 2023 |
| Ordinary Income | $8,676,139 | $4,757,256 |
| Long-term Capital Gains | 8,845,759 | 7,148,992 |
| Total | $17,521,898 | $11,906,248 |
New Accounting Pronouncement. FASB Accounting Standards Update (ASU) 2023-07 Segment Reporting (Topic 280): Improvements to Reportable Segment Disclosures became effective in this reporting period. ASU 2023-07 enhances segment information disclosure in the notes to financial statements.
4. Purchases and Sales of Investments.
Purchases and sales of securities, other than short-term securities and in-kind transactions, as applicable, are noted in the table below.
| | Purchases ($) | Sales ($) |
| VIP Utilities Portfolio | 237,371,937 | 184,790,547 |
5. Fees and Other Transactions with Affiliates.
Management Fee. Fidelity Management & Research Company LLC (the investment adviser) and its affiliates provide the Fund with investment management related services for which the Fund pays a monthly management fee.
Effective March 1, 2024, the Fund's management contract was amended to incorporate administrative services previously covered under separate services agreements (Transfer Agent and Accounting agreements). The amended contract incorporates a management fee rate that may vary by class. The investment adviser or an affiliate pays certain expenses of managing and operating the Fund out of each class's management fee. Each class of the Fund pays a management fee to the investment adviser. The management fee is calculated and paid to the investment adviser every month. When determining a class's management fee, a mandate rate is calculated based on the monthly average net assets of a group of funds advised by FMR within a designated asset class. A discount rate is subtracted from the mandate rate once the Fund's monthly average net assets reach a certain level. The mandate rate and discount rate may vary by class. The annual management fee rate for a class of shares of the Fund is the lesser of (1) the class's mandate rate reduced by the class's discount rate (if applicable) or (2) the amount set forth in the following table.
| | Maximum Management Fee Rate % |
| Initial Class | .58 |
| Investor Class | .66 |
One-twelfth of the management fee rate for a class is applied to the average net assets of the class for the month, giving a dollar amount which is the management fee for the class for that month. A different management fee rate may be applicable to each class of the Fund. The difference between classes is the result of separate arrangements for class-level services and/or waivers of certain expenses. It is not the result of any difference in advisory or custodial fees or other expenses related to the management of the Fund's assets, which do not vary by class. For the portion of the reporting period on or after March 1, 2024, the total annualized management fee rates were as follows:
| | Total Management Fee Rate % |
| Initial Class | .58 |
| Investor Class | .66 |
Prior to March 1, 2024, the management fee was the sum of an individual fund fee rate that was based on an annual rate of .30% of the Fund's average net assets and an annualized group fee rate that averaged .22% during the period. The group fee rate was based upon the monthly average net assets of a group of registered investment companies with which the investment adviser has management contracts. The group fee rate decreased as assets under management increased and increased as assets under management decreased. For the portion of the reporting period prior to March 1, 2024, the total annualized management fee rate was .52%.
Effective March 1, 2024, the Fund's sub-advisory agreements with FMR Investment Management (UK) Limited, Fidelity Management & Research (Hong Kong) Limited, and Fidelity Management & Research (Japan) Limited were amended to provide that the investment adviser pays each sub-adviser monthly fees equal to 110% of the sub-adviser's costs for providing sub-advisory services.
Transfer Agent Fees. Fidelity Investments Institutional Operations Company LLC (FIIOC), an affiliate of the investment adviser, is the Fund's transfer, dividend disbursing, and shareholder servicing agent. Effective March 1, 2024, the Fund's management contract was amended to incorporate transfer agent services and associated fees previously covered under a separate services agreement.
During the period January 1, 2024 through February 29, 2024, the transfer agent fees for each class were a fixed annual rate of class-level average net assets as follows:
| | Amount ($) | % of Class-Level Average Net Assets |
| Initial Class | 3,356 | .0630 |
| Investor Class | 37,729 | .1390 |
| | 41,085 | |
Accounting Fees. Fidelity Service Company, Inc. (FSC), an affiliate of the investment adviser, maintains the Fund's accounting records. Effective March 1, 2024, the Fund's management contract was amended to incorporate accounting services and associated fees previously covered under a separate services agreement.
During the period January 1, 2024 through February 29, 2024, the accounting fees were a fixed annual rate of average net assets as follows:
| | % of Average Net Assets |
| VIP Utilities Portfolio | .0353 |
Brokerage Commissions. A portion of portfolio transactions were placed with brokerage firms which are affiliates of the investment adviser. Brokerage commissions are included in net realized gain (loss) and change in net unrealized appreciation (depreciation) in the Statement of Operations. The commissions paid to these affiliated firms were as follows:
| | Amount ($) |
| VIP Utilities Portfolio | 3,014 |
Interfund Trades. Funds may purchase from or sell securities to other Fidelity Funds under procedures adopted by the Board. The procedures have been designed to ensure these interfund trades are executed in accordance with Rule 17a-7 of the 1940 Act. Any interfund trades are included within the respective purchases and sales amounts shown in the Purchases and Sales of Investments note. Interfund trades during the period are noted in the table below.
| | Purchases ($) | Sales ($) | Realized Gain (Loss) ($) |
| VIP Utilities Portfolio | 14,719,107 | 8,251,074 | 182,626 |
6. Committed Line of Credit.
Certain Funds participate with other funds managed by the investment adviser or an affiliate in a $4.25 billion credit facility (the "line of credit") to be utilized for temporary or emergency purposes to fund shareholder redemptions or for other short-term liquidity purposes.
Commitment fees are charged based on the unused amount of the line of credit at an annual rate of .10%, and then allocated to each participating fund based on its pro-rata portion of the line of credit. The commitment fees are reflected in Miscellaneous expenses on the Statement of Operations, and are listed below.
Interest is charged to a participating fund based on its borrowings at an annual rate of .75% plus the highest of (i) daily SOFR plus a .10% spread adjustment, (ii) Federal Funds Effective Rate, or (iii) Overnight Bank Funding Rate. During the period, there were no borrowings on this line of credit.
The line of credit agreement will expire in March 2025 unless extended or renewed.| | Amount ($) |
| VIP Utilities Portfolio | 340 |
7. Security Lending.
Funds lend portfolio securities from time to time in order to earn additional income. Lending agents are used, including National Financial Services (NFS), an affiliate of the investment adviser. Pursuant to a securities lending agreement, NFS will receive a fee, which is capped at 9.9% of a fund's daily lending revenue, for its services as lending agent. A fund may lend securities to certain qualified borrowers, including NFS. On the settlement date of the loan, a fund receives collateral (in the form of U.S. Treasury obligations, letters of credit and/or cash) against the loaned securities and maintains collateral in an amount not less than 100% of the market value of the loaned securities during the period of the loan. The market value of the loaned securities is determined at the close of business of a fund and any additional required collateral is delivered to a fund on the next business day. A fund or borrower may terminate the loan at any time, and if the borrower defaults on its obligation to return the securities loaned because of insolvency or other reasons, a fund may apply collateral received from the borrower against the obligation. A fund may experience delays and costs in recovering the securities loaned. Any cash collateral received is invested in the Fidelity Securities Lending Cash Central Fund. Any loaned securities are identified as such in the Schedule of Investments, and the value of loaned securities and cash collateral at period end, as applicable, are presented in the Statement of Assets and Liabilities. Security lending income represents the income earned on investing cash collateral, less rebates paid to borrowers and any lending agent fees associated with the loan, plus any premium payments received for lending certain types of securities. Security lending income is presented in the Statement of Operations as a component of income from Fidelity Central Funds. Affiliated security lending activity, if any, was as follows:
| | Total Security Lending Fees Paid to NFS ($) | Security Lending Income From Securities Loaned to NFS ($) | Value of Securities Loaned to NFS at Period End ($) |
| VIP Utilities Portfolio | 137 | - | - |
8. Expense Reductions.
During the period the investment adviser or an affiliate reimbursed and/or waived a portion of fund-level operating expenses in the amount of $8,979.
9. Distributions to Shareholders.
Distributions to shareholders of each class were as follows:
| | Year ended December 31, 2024 | Year ended December 31, 2023 |
| VIP Utilities Portfolio | | |
| Distributions to shareholders | | |
| Initial Class | 2,783,546 | 1,913,813 |
| Investor Class | 14,738,352 | 9,992,435 |
Total | $17,521,898 | $11,906,248 |
10. Share Transactions.
Transactions for each class of shares were as follows and may contain in-kind transactions:
| | Shares | Shares | Dollars | Dollars |
| | Year ended December 31, 2024 | Year ended December 31, 2023 | Year ended December 31, 2024 | Year ended December 31, 2023 |
| VIP Utilities Portfolio | | | | |
| Initial Class | | | | |
| Shares sold | 569,725 | 295,339 | $13,487,281 | $5,956,497 |
| Reinvestment of distributions | 133,195 | 96,430 | 2,783,546 | 1,913,812 |
| Shares redeemed | (390,410) | (963,459) | (8,582,084) | (19,590,574) |
| Net increase (decrease) | 312,510 | (571,690) | $7,688,743 | $(11,720,265) |
| Investor Class | | | | |
| Shares sold | 3,696,454 | 948,915 | $89,228,575 | $19,180,380 |
| Reinvestment of distributions | 705,642 | 507,325 | 14,738,352 | 9,992,435 |
| Shares redeemed | (1,784,442) | (3,884,303) | (38,355,608) | (77,332,440) |
| Net increase (decrease) | 2,617,654 | (2,428,063) | $65,611,319 | $(48,159,625) |
11. Other.
A fund's organizational documents provide former and current trustees and officers with a limited indemnification against liabilities arising in connection with the performance of their duties to the fund. In the normal course of business, a fund may also enter into contracts that provide general indemnifications. A fund's maximum exposure under these arrangements is unknown as this would be dependent on future claims that may be made against a fund. The risk of material loss from such claims is considered remote.
At the end of the period, the investment adviser or its affiliates were owners of record of more than 10% of the outstanding shares as follows:
| Fund | Affiliated % |
| VIP Utilities Portfolio | 95% |
12. Risk and Uncertainties.
Many factors affect a fund's performance. Developments that disrupt global economies and financial markets, such as pandemics, epidemics, outbreaks of infectious diseases, war, terrorism, and environmental disasters, may significantly affect a fund's investment performance. The effects of these developments to a fund will be impacted by the types of securities in which a fund invests, the financial condition, industry, economic sector, and geographic location of an issuer, and a fund's level of investment in the securities of that issuer. Significant concentrations in security types, issuers, industries, sectors, and geographic locations may magnify the factors that affect a fund's performance.
Report of Independent Registered Public Accounting Firm
To the Board of Trustees of Variable Insurance Products Fund IV and Shareholders of VIP Utilities Portfolio
Opinion on the Financial Statements
We have audited the accompanying statement of assets and liabilities, including the schedule of investments, of VIP Utilities Portfolio (one of the funds constituting Variable Insurance Products Fund IV, referred to hereafter as the "Fund") as of December 31, 2024, the related statement of operations for the year ended December 31, 2024, the statement of changes in net assets for each of the two years in the period ended December 31, 2024, including the related notes, and the financial highlights for each of the five years in the period ended December 31, 2024 (collectively referred to as the "financial statements"). In our opinion, the financial statements present fairly, in all material respects, the financial position of the Fund as of December 31, 2024, the results of its operations for the year then ended, the changes in its net assets for each of the two years in the period ended December 31, 2024 and the financial highlights for each of the five years in the period ended December 31, 2024 in conformity with accounting principles generally accepted in the United States of America.
Basis for Opinion
These financial statements are the responsibility of the Fund's management. Our responsibility is to express an opinion on the Fund's financial statements based on our audits. We are a public accounting firm registered with the Public Company Accounting Oversight Board (United States) (PCAOB) and are required to be independent with respect to the Fund in accordance with the U.S. federal securities laws and the applicable rules and regulations of the Securities and Exchange Commission and the PCAOB.
We conducted our audits of these financial statements in accordance with the standards of the PCAOB. Those standards require that we plan and perform the audit to obtain reasonable assurance about whether the financial statements are free of material misstatement, whether due to error or fraud.
Our audits included performing procedures to assess the risks of material misstatement of the financial statements, whether due to error or fraud, and performing procedures that respond to those risks. Such procedures included examining, on a test basis, evidence regarding the amounts and disclosures in the financial statements. Our audits also included evaluating the accounting principles used and significant estimates made by management, as well as evaluating the overall presentation of the financial statements. Our procedures included confirmation of securities owned as of December 31, 2024 by correspondence with the custodian and brokers. We believe that our audits provide a reasonable basis for our opinion.
/s/ PricewaterhouseCoopers LLP
Boston, Massachusetts
February 11, 2025
We have served as the auditor of one or more investment companies in the Fidelity group of funds since 1932.
Distributions
(Unaudited)The dividend and capital gains distributions for the fund(s) are available on Fidelity.com or Institutional.Fidelity.com.
The fund hereby designates as a capital gain dividend with respect to the taxable year ended December 31, 2024, $6,582,258, or, if subsequently determined to be different, the net capital gain of such year.
The fund designates $124,044 of distributions paid during the fiscal year ended 2024 as qualifying to be taxed as section 163(j) interest dividends.
Initial class designates 100% and 87% and Investor class designates 100% and 87% of the dividends distributed in February and December 2024 respectively during the fiscal year as qualifying for the dividends-received deduction for corporate shareholders.
Item 8: Changes in and Disagreements with Accountants for Open-End Management Investment Companies
(Unaudited)
Note: This is not applicable for any fund included in this document.
Item 9: Proxy Disclosures for Open-End Management Investment Companies
(Unaudited)
| A special meeting of shareholders was held on July 16, 2024. The results of votes taken among shareholders on the proposal before them are reported below. Each vote reported represents one dollar of net asset value held on the record date for the meeting. |
| Proposal 1 |
| To elect a Board of Trustees. |
| | # of Votes | % of Votes |
| Bettina Doulton |
| Affirmative | 5,501,492,681.85 | 94.15 |
| Withheld | 341,991,035.05 | 5.85 |
| TOTAL | 5,843,483,716.90 | 100.00 |
| Robert A. Lawrence |
| Affirmative | 5,480,901,467.70 | 93.80 |
| Withheld | 362,582,249.21 | 6.20 |
| TOTAL | 5,843,483,716.90 | 100.00 |
| Vijay C. Advani |
| Affirmative | 5,500,352,811.04 | 94.13 |
| Withheld | 343,130,905.86 | 5.87 |
| TOTAL | 5,843,483,716.90 | 100.00 |
| Thomas P. Bostick |
| Affirmative | 5,488,165,362.69 | 93.92 |
| Withheld | 355,318,354.21 | 6.08 |
| TOTAL | 5,843,483,716.90 | 100.00 |
| Donald F. Donahue |
| Affirmative | 5,482,960,893.76 | 93.83 |
| Withheld | 360,522,823.14 | 6.17 |
| TOTAL | 5,843,483,716.90 | 100.00 |
| Vicki L. Fuller |
| Affirmative | 5,492,283,337.89 | 93.99 |
| Withheld | 351,200,379.01 | 6.01 |
| TOTAL | 5,843,483,716.90 | 100.00 |
| Patricia L. Kampling |
| Affirmative | 5,521,992,715.20 | 94.50 |
| Withheld | 321,491,001.70 | 5.50 |
| TOTAL | 5,843,483,716.90 | 100.00 |
| Thomas A. Kennedy |
| Affirmative | 5,484,789,158.10 | 93.86 |
| Withheld | 358,694,558.80 | 6.14 |
| TOTAL | 5,843,483,716.90 | 100.00 |
| Oscar Munoz |
| Affirmative | 5,497,884,744.63 | 94.09 |
| Withheld | 345,598,972.27 | 5.91 |
| TOTAL | 5,843,483,716.90 | 100.00 |
| Karen B. Peetz |
| Affirmative | 5,503,968,240.81 | 94.19 |
| Withheld | 339,515,476.09 | 5.81 |
| TOTAL | 5,843,483,716.90 | 100.00 |
| David M. Thomas |
| Affirmative | 5,466,218,204.40 | 93.54 |
| Withheld | 377,265,512.50 | 6.46 |
| TOTAL | 5,843,483,716.90 | 100.00 |
| Susan Tomasky |
| Affirmative | 5,463,402,825.36 | 93.50 |
| Withheld | 380,080,891.54 | 6.50 |
| TOTAL | 5,843,483,716.90 | 100.00 |
| Michael E. Wiley |
| Affirmative | 5,466,838,155.74 | 93.55 |
| Withheld | 376,645,561.16 | 6.45 |
| TOTAL | 5,843,483,716.90 | 100.00 |
| | | |
| Proposal 1 reflects trust-wide proposal and voting results. |
Item 10: Remuneration Paid to Directors, Officers, and others of Open-End Management Investment Companies
(Unaudited)
Note: This information is disclosed as part of the financial statements for each Fund as part of Item 7: Financial Statements and Financial Highlights for Open-End Management Investment companies.
Item 11: Statement Regarding Basis for Approval of Investment Advisory Contract
(Unaudited)
Note: This is not applicable for any fund included in this document.
1.817391.119
VTELIC-ANN-0325
Fidelity® Variable Insurance Products:
VIP Industrials Portfolio
Annual Report
December 31, 2024
Contents
To view a fund's proxy voting guidelines and proxy voting record for the 12-month period ended June 30, visit http://www.fidelity.com/proxyvotingresults or visit the Securities and Exchange Commission's (SEC) web site at http://www.sec.gov.
You may also call 1-877-208-0098 to request a free copy of the proxy voting guidelines.
Fidelity® Variable Insurance Products are separate account options which are purchased through a variable insurance contract.
Standard & Poor's, S&P and S&P 500 are registered service marks of The McGraw-Hill Companies, Inc. and have been licensed for use by Fidelity Distributors Corporation.
Other third-party marks appearing herein are the property of their respective owners.
All other marks appearing herein are registered or unregistered trademarks or service marks of FMR LLC or an affiliated company. © 2025 FMR LLC. All rights reserved.
This report and the financial statements contained herein are submitted for the general information of the shareholders of the Fund. This report is not authorized for distribution to prospective investors in the Fund unless preceded or accompanied by an effective prospectus.
A fund files its complete schedule of portfolio holdings with the SEC for the first and third quarters of each fiscal year on Form N-PORT. Forms N-PORT are available on the SEC's web site at http://www.sec.gov. A fund's Forms N-PORT may be reviewed and copied at the SEC's Public Reference Room in Washington, DC. Information regarding the operation of the SEC's Public Reference Room may be obtained by calling 1-800-SEC-0330.
For a complete list of a fund's portfolio holdings, view the most recent holdings listing, semiannual report, or annual report on Fidelity's web site at http://www.fidelity.com, http://www.institutional.fidelity.com, or http://www.401k.com, as applicable.
NOT FDIC INSURED •MAY LOSE VALUE •NO BANK GUARANTEE
Neither the Fund nor Fidelity Distributors Corporation is a bank.
Item 7: Financial Statements and Financial Highlights for Open-End Management Investment Companies (Annual Report)
VIP Industrials Portfolio
Schedule of Investments December 31, 2024
Showing Percentage of Net Assets
| Common Stocks - 99.0% |
| | | Shares | Value ($) |
| UNITED STATES - 99.0% | | | |
| Industrials - 98.2% | | | |
| Aerospace & Defense - 23.5% | | | |
| Axon Enterprise Inc (a) | | 3,200 | 1,901,824 |
| Boeing Co (a) | | 56,639 | 10,025,103 |
| GE Aerospace | | 84,156 | 14,036,380 |
| General Dynamics Corp | | 16,000 | 4,215,840 |
| HEICO Corp Class A | | 13,800 | 2,567,904 |
| Howmet Aerospace Inc | | 109,188 | 11,941,892 |
| Huntington Ingalls Industries Inc | | 5,300 | 1,001,541 |
| Loar Holdings Inc (b) | | 200 | 14,782 |
| Lockheed Martin Corp | | 3,248 | 1,578,333 |
| Rocket Lab USA Inc Class A (a) | | 16,300 | 415,161 |
| Standardaero Inc (b) | | 1,100 | 27,236 |
| TransDigm Group Inc | | 6,700 | 8,490,776 |
| | | | 56,216,772 |
| Air Freight & Logistics - 0.6% | | | |
| CH Robinson Worldwide Inc | | 4,700 | 485,604 |
| FedEx Corp | | 3,900 | 1,097,187 |
| | | | 1,582,791 |
| Building Products - 10.9% | | | |
| AZEK Co Inc/The Class A (a) | | 90,300 | 4,286,541 |
| Carlisle Cos Inc | | 7,396 | 2,727,941 |
| Fortune Brands Innovations Inc | | 60,500 | 4,133,965 |
| Johnson Controls International plc | | 40,364 | 3,185,931 |
| Simpson Manufacturing Co Inc | | 14,030 | 2,326,594 |
| Trane Technologies PLC | | 25,224 | 9,316,484 |
| | | | 25,977,456 |
| Commercial Services & Supplies - 2.6% | | | |
| Cintas Corp | | 10,800 | 1,973,160 |
| Waste Connections Inc (United States) | | 25,800 | 4,426,764 |
| | | | 6,399,924 |
| Construction & Engineering - 3.8% | | | |
| Comfort Systems USA Inc | | 4,400 | 1,865,864 |
| Quanta Services Inc | | 16,300 | 5,151,615 |
| WillScot Holdings Corp (a) | | 60,000 | 2,007,000 |
| | | | 9,024,479 |
| Electrical Equipment - 14.7% | | | |
| AMETEK Inc | | 40,500 | 7,300,530 |
| Eaton Corp PLC | | 25,324 | 8,404,276 |
| GE Vernova Inc | | 38,089 | 12,528,615 |
| Regal Rexnord Corp | | 33,271 | 5,161,330 |
| Vertiv Holdings Co Class A | | 15,600 | 1,772,316 |
| | | | 35,167,067 |
| Ground Transportation - 10.7% | | | |
| CSX Corp | | 25,936 | 836,955 |
| Knight-Swift Transportation Holdings Inc | | 79,400 | 4,211,376 |
| Old Dominion Freight Line Inc | | 21,100 | 3,722,040 |
| Uber Technologies Inc (a) | | 80,200 | 4,837,664 |
| Union Pacific Corp | | 36,400 | 8,300,656 |
| XPO Inc (a) | | 28,000 | 3,672,200 |
| | | | 25,580,891 |
| Machinery - 21.6% | | | |
| Caterpillar Inc | | 8,000 | 2,902,080 |
| Chart Industries Inc (a) | | 24,880 | 4,748,099 |
| Deere & Co | | 9,200 | 3,898,040 |
| Dover Corp | | 38,340 | 7,192,584 |
| Ingersoll Rand Inc | | 105,032 | 9,501,195 |
| ITT Inc | | 48,600 | 6,943,968 |
| Parker-Hannifin Corp | | 16,180 | 10,290,965 |
| Westinghouse Air Brake Technologies Corp | | 32,800 | 6,218,552 |
| | | | 51,695,483 |
| Professional Services - 2.8% | | | |
| KBR Inc | | 48,800 | 2,826,984 |
| Leidos Holdings Inc | | 26,528 | 3,821,624 |
| | | | 6,648,608 |
| Trading Companies & Distributors - 7.0% | | | |
| Core & Main Inc Class A (a) | | 60,800 | 3,095,328 |
| FTAI Aviation Ltd | | 20,900 | 3,010,436 |
| United Rentals Inc | | 7,400 | 5,212,856 |
| Watsco Inc | | 4,500 | 2,132,505 |
| WW Grainger Inc | | 3,064 | 3,229,609 |
| | | | 16,680,734 |
TOTAL INDUSTRIALS | | | 234,974,205 |
| | | | |
| Materials - 0.8% | | | |
| Construction Materials - 0.8% | | | |
| Eagle Materials Inc | | 7,832 | 1,932,624 |
| TOTAL UNITED STATES | | | 236,906,829 |
| TOTAL COMMON STOCKS (Cost $171,782,335) | | | 236,906,829 |
| | | | |
| Money Market Funds - 1.0% |
| | | Yield (%) | Shares | Value ($) |
| Fidelity Cash Central Fund (c) | | 4.36 | 2,375,909 | 2,376,385 |
| Fidelity Securities Lending Cash Central Fund (c)(d) | | 4.35 | 33,597 | 33,599 |
| TOTAL MONEY MARKET FUNDS (Cost $2,409,984) | | | | 2,409,984 |
| | | | | |
| TOTAL INVESTMENT IN SECURITIES - 100.0% (Cost $174,192,319) | 239,316,813 |
NET OTHER ASSETS (LIABILITIES) - 0.0% | (23,740) |
| NET ASSETS - 100.0% | 239,293,073 |
| | |
Legend
| (b) | Security or a portion of the security is on loan at period end. |
| (c) | Affiliated fund that is generally available only to investment companies and other accounts managed by Fidelity Investments. The rate quoted is the annualized seven-day yield of the fund at period end. A complete unaudited listing of the fund's holdings as of its most recent quarter end is available upon request. In addition, each Fidelity Central Fund's financial statements, which are not covered by the Fund's Report of Independent Registered Public Accounting Firm, are available on the SEC's website or upon request. |
| (d) | Investment made with cash collateral received from securities on loan. |
Affiliated Central Funds
Fiscal year to date information regarding the Fund's investments in Fidelity Central Funds, including the ownership percentage, is presented below.
| Affiliate | Value, beginning of period ($) | Purchases ($) | Sales Proceeds ($) | Dividend Income ($) | Realized Gain (loss) ($) | Change in Unrealized appreciation (depreciation) ($) | Value, end of period ($) | Shares, end of period | % ownership, end of period |
| Fidelity Cash Central Fund | 1,179,923 | 57,286,106 | 56,089,721 | 61,255 | 77 | - | 2,376,385 | 2,375,909 | 0.0% |
| Fidelity Securities Lending Cash Central Fund | - | 30,230,471 | 30,196,872 | 1,981 | - | - | 33,599 | 33,597 | 0.0% |
| Total | 1,179,923 | 87,516,577 | 86,286,593 | 63,236 | 77 | - | 2,409,984 | 2,409,506 | |
| | | | | | | | | | |
Amounts in the dividend income column in the above table include any capital gain distributions from underlying funds, which are presented in the corresponding line item in the Statement of Operations, if applicable.
Amounts in the dividend income column for Fidelity Securities Lending Cash Central Fund represents the income earned on investing cash collateral, less rebates paid to borrowers and any lending agent fees associated with the loan, plus any premium payments received for lending certain types of securities.
Amounts included in the purchases and sales proceeds columns may include in-kind transactions, if applicable.
Investment Valuation
The following is a summary of the inputs used, as of December 31, 2024, involving the Fund's assets and liabilities carried at fair value. The inputs or methodology used for valuing securities may not be an indication of the risk associated with investing in those securities. For more information on valuation inputs, and their aggregation into the levels used below, please refer to the Investment Valuation section in the accompanying Notes to Financial Statements.
| Valuation Inputs at Reporting Date: |
| Description | Total ($) | Level 1 ($) | Level 2 ($) | Level 3 ($) |
Investments in Securities: | | | | |
|
| Common Stocks | | | | |
Industrials | 234,974,205 | 234,974,205 | - | - |
Materials | 1,932,624 | 1,932,624 | - | - |
|
| Money Market Funds | 2,409,984 | 2,409,984 | - | - |
| Total Investments in Securities: | 239,316,813 | 239,316,813 | - | - |
Financial Statements
| Statement of Assets and Liabilities |
As of December 31, 2024 |
| Assets | | | | |
| Investment in securities, at value (including securities loaned of $32,151) - See accompanying schedule: | | | | |
Unaffiliated issuers (cost $171,782,335) | $ | 236,906,829 | | |
Fidelity Central Funds (cost $2,409,984) | | 2,409,984 | | |
| | | | | |
| | | | | |
| Total Investment in Securities (cost $174,192,319) | | | $ | 239,316,813 |
| Cash | | | | 21,273 |
| Receivable for fund shares sold | | | | 68,409 |
| Dividends receivable | | | | 102,504 |
| Distributions receivable from Fidelity Central Funds | | | | 6,964 |
| Prepaid expenses | | | | 232 |
Total assets | | | | 239,516,195 |
| Liabilities | | | | |
| Payable for fund shares redeemed | $ | 13,536 | | |
| Accrued management fee | | 135,057 | | |
| Audit fee payable | | 36,806 | | |
| Other payables and accrued expenses | | 4,123 | | |
| Collateral on securities loaned | | 33,600 | | |
| Total liabilities | | | | 223,122 |
| Net Assets | | | $ | 239,293,073 |
| Net Assets consist of: | | | | |
| Paid in capital | | | $ | 167,281,195 |
| Total accumulated earnings (loss) | | | | 72,011,878 |
| Net Assets | | | $ | 239,293,073 |
| | | | | |
| Net Asset Value and Maximum Offering Price | | | | |
| Initial Class : | | | | |
Net Asset Value, offering price and redemption price per share ($34,210,976 ÷ 1,349,754 shares) | | | $ | 25.35 |
| Investor Class : | | | | |
Net Asset Value, offering price and redemption price per share ($205,082,097 ÷ 8,194,077 shares) | | | $ | 25.03 |
| Statement of Operations |
| Year ended December 31, 2024 |
| Investment Income | | | | |
| Dividends | | | $ | 1,718,397 |
| Special dividends | | | | 211,228 |
| Income from Fidelity Central Funds (including $1,981 from security lending) | | | | 63,236 |
| Total income | | | | 1,992,861 |
| Expenses | | | | |
| Management fee | $ | 1,355,112 | | |
| Transfer agent fees | | 39,298 | | |
| Accounting fees | | 10,900 | | |
| Custodian fees and expenses | | 10,736 | | |
| Independent trustees' fees and expenses | | 899 | | |
| Audit fees | | 40,787 | | |
| Legal | | 2,320 | | |
| Miscellaneous | | 5,230 | | |
| Total expenses before reductions | | 1,465,282 | | |
| Expense reductions | | (8,205) | | |
| Total expenses after reductions | | | | 1,457,077 |
| Net Investment income (loss) | | | | 535,784 |
| Realized and Unrealized Gain (Loss) | | | | |
| Net realized gain (loss) on: | | | | |
| Investment Securities: | | | | |
| Unaffiliated issuers | | 9,536,887 | | |
| Fidelity Central Funds | | 77 | | |
| Total net realized gain (loss) | | | | 9,536,964 |
| Change in net unrealized appreciation (depreciation) on investment securities | | | | 30,970,420 |
| Net gain (loss) | | | | 40,507,384 |
| Net increase (decrease) in net assets resulting from operations | | | $ | 41,043,168 |
| Statement of Changes in Net Assets |
| |
| | Year ended December 31, 2024 | | Year ended December 31, 2023 |
| Increase (Decrease) in Net Assets | | | | |
| Operations | | | | |
| Net investment income (loss) | $ | 535,784 | $ | 427,215 |
| Net realized gain (loss) | | 9,536,964 | | 20,308,279 |
| Change in net unrealized appreciation (depreciation) | | 30,970,420 | | 13,074,598 |
| Net increase (decrease) in net assets resulting from operations | | 41,043,168 | | 33,810,092 |
| Distributions to shareholders | | (17,067,778) | | (404,818) |
| | | | | |
| Share transactions - net increase (decrease) | | 31,543,101 | | (3,303,258) |
| Total increase (decrease) in net assets | | 55,518,491 | | 30,102,016 |
| | | | | |
| Net Assets | | | | |
| Beginning of period | | 183,774,582 | | 153,672,566 |
| End of period | $ | 239,293,073 | $ | 183,774,582 |
| | | | | |
| | | | | |
Financial Highlights
VIP Industrials Portfolio Initial Class |
| |
| Years ended December 31, | | 2024 | | 2023 | | 2022 | | 2021 | | 2020 |
Selected Per-Share Data | | | | | | | | | | |
| Net asset value, beginning of period | $ | 22.40 | $ | 18.23 | $ | 23.44 | $ | 23.29 | $ | 21.98 |
| Income from Investment Operations | | | | | | | | | | |
Net investment income (loss) A,B | | .08 C | | .06 D | | .05 E | | (.02) | | .03 |
| Net realized and unrealized gain (loss) | | 4.94 | | 4.17 | | (2.43) | | 3.57 | | 2.57 |
| Total from investment operations | | 5.02 | | 4.23 | | (2.38) | | 3.55 | | 2.60 |
| Distributions from net investment income | | (.17) | | (.06) | | (.03) | | - | | (.10) F |
| Distributions from net realized gain | | (1.90) | | - | | (2.79) | | (3.40) | | (1.19) F |
| Total distributions | | (2.07) | | (.06) | | (2.83) G | | (3.40) | | (1.29) |
| Net asset value, end of period | $ | 25.35 | $ | 22.40 | $ | 18.23 | $ | 23.44 | $ | 23.29 |
Total Return H,I | | | | 23.25% | | (10.30)% | | 17.09% | | 12.32% |
Ratios to Average Net Assets B,J,K | | | | | | | | | | |
| Expenses before reductions | | .61% | | .66% | | .66% | | .66% | | .68% |
| Expenses net of fee waivers, if any | | | | .66% | | .66% | | .66% | | .68% |
| Expenses net of all reductions | | .61% | | .66% | | .66% | | .66% | | .67% |
| Net investment income (loss) | | .32% C | | .33% D | | .28% E | | (.08)% | | .17% |
| Supplemental Data | | | | | | | | | | |
| Net assets, end of period (000 omitted) | $ | 34,211 | $ | 28,377 | $ | 25,557 | $ | 31,026 | $ | 29,873 |
Portfolio turnover rate L | | | | 162% | | 83% | | 197% | | 240% |
ACalculated based on average shares outstanding during the period.
BNet investment income (loss) is affected by the timing of the declaration of dividends by any underlying mutual funds or exchange-traded funds (ETFs). Net investment income (loss) of any mutual funds or ETFs is not included in the Fund's net investment income (loss) ratio.
CNet investment income per share reflects one or more large, non-recurring dividend(s) which amounted to $.02 per share. Excluding such non-recurring dividend(s), the ratio of net investment income (loss) to average net assets would have been .22%.
DNet investment income per share reflects one or more large, non-recurring dividend(s) which amounted to $.03 per share. Excluding such non-recurring dividend(s), the ratio of net investment income (loss) to average net assets would have been .18%.
ENet investment income per share reflects one or more large, non-recurring dividend(s) which amounted to $.02 per share. Excluding such non-recurring dividend(s), the ratio of net investment income (loss) to average net assets would have been .15%.
FThe amount shown reflects reclassifications related to book to tax differences that were made in the year shown.
GTotal distributions per share do not sum due to rounding.
HTotal returns do not reflect charges attributable to your insurance company's separate account. Inclusion of these charges would reduce the total returns shown.
ITotal returns would have been lower if certain expenses had not been reduced during the applicable periods shown.
JFees and expenses of any underlying mutual funds or exchange-traded funds (ETFs) are not included in the Fund's expense ratio. The Fund indirectly bears its proportionate share of these expenses. For additional expense information related to investments in Fidelity Central Funds, please refer to the "Investments in Fidelity Central Funds" note found in the Notes to Financial Statements section of the most recent Annual or Semi-Annual report.
KExpense ratios reflect operating expenses of the class. Expenses before reductions do not reflect amounts reimbursed, waived, or reduced through arrangements with the investment adviser, brokerage services, or other offset arrangements, if applicable, and do not represent the amount paid by the class during periods when reimbursements, waivers or reductions occur.
LAmount does not include the portfolio activity of any underlying mutual funds or exchange-traded funds (ETFs), derivatives or securities that mature within one year from acquisition.
VIP Industrials Portfolio Investor Class |
| |
| Years ended December 31, | | 2024 | | 2023 | | 2022 | | 2021 | | 2020 |
Selected Per-Share Data | | | | | | | | | | |
| Net asset value, beginning of period | $ | 22.15 | $ | 18.02 | $ | 23.22 | $ | 23.10 | $ | 21.82 |
| Income from Investment Operations | | | | | | | | | | |
Net investment income (loss) A,B | | .06 C | | .05 D | | .04 E | | (.04) | | .02 |
| Net realized and unrealized gain (loss) | | 4.88 | | 4.13 | | (2.43) | | 3.55 | | 2.53 |
| Total from investment operations | | 4.94 | | 4.18 | | (2.39) | | 3.51 | | 2.55 |
| Distributions from net investment income | | (.16) | | (.05) | | (.02) | | - | | (.08) F |
| Distributions from net realized gain | | (1.90) | | - | | (2.79) | | (3.39) | | (1.19) F |
| Total distributions | | (2.06) | | (.05) | | (2.81) | | (3.39) | | (1.27) |
| Net asset value, end of period | $ | 25.03 | $ | 22.15 | $ | 18.02 | $ | 23.22 | $ | 23.10 |
Total Return G,H | | | | 23.21% | | (10.42)% | | 17.03% | | 12.19% |
Ratios to Average Net Assets B,I,J | | | | | | | | | | |
| Expenses before reductions | | .69% | | .74% | | .74% | | .74% | | .76% |
| Expenses net of fee waivers, if any | | | | .73% | | .73% | | .74% | | .76% |
| Expenses net of all reductions | | .69% | | .73% | | .73% | | .74% | | .75% |
| Net investment income (loss) | | .24% C | | .26% D | | .20% E | | (.16)% | | .10% |
| Supplemental Data | | | | | | | | | | |
| Net assets, end of period (000 omitted) | $ | 205,082 | $ | 155,397 | $ | 128,115 | $ | 146,886 | $ | 135,328 |
Portfolio turnover rate K | | | | 162% | | 83% | | 197% | | 240% |
ACalculated based on average shares outstanding during the period.
BNet investment income (loss) is affected by the timing of the declaration of dividends by any underlying mutual funds or exchange-traded funds (ETFs). Net investment income (loss) of any mutual funds or ETFs is not included in the Fund's net investment income (loss) ratio.
CNet investment income per share reflects one or more large, non-recurring dividend(s) which amounted to $.02 per share. Excluding such non-recurring dividend(s), the ratio of net investment income (loss) to average net assets would have been .14%.
DNet investment income per share reflects one or more large, non-recurring dividend(s) which amounted to $.03 per share. Excluding such non-recurring dividend(s), the ratio of net investment income (loss) to average net assets would have been .11%.
ENet investment income per share reflects one or more large, non-recurring dividend(s) which amounted to $.02 per share. Excluding such non-recurring dividend(s), the ratio of net investment income (loss) to average net assets would have been .08%.
FThe amount shown reflects reclassifications related to book to tax differences that were made in the year shown.
GTotal returns do not reflect charges attributable to your insurance company's separate account. Inclusion of these charges would reduce the total returns shown.
HTotal returns would have been lower if certain expenses had not been reduced during the applicable periods shown.
IFees and expenses of any underlying mutual funds or exchange-traded funds (ETFs) are not included in the Fund's expense ratio. The Fund indirectly bears its proportionate share of these expenses. For additional expense information related to investments in Fidelity Central Funds, please refer to the "Investments in Fidelity Central Funds" note found in the Notes to Financial Statements section of the most recent Annual or Semi-Annual report.
JExpense ratios reflect operating expenses of the class. Expenses before reductions do not reflect amounts reimbursed, waived, or reduced through arrangements with the investment adviser, brokerage services, or other offset arrangements, if applicable, and do not represent the amount paid by the class during periods when reimbursements, waivers or reductions occur.
KAmount does not include the portfolio activity of any underlying mutual funds or exchange-traded funds (ETFs), derivatives or securities that mature within one year from acquisition.
Notes to Financial Statements
For the period ended December 31, 2024
1. Organization.
VIP Industrials Portfolio (the Fund) is a non-diversified fund of Variable Insurance Products Fund IV (the Trust) and is authorized to issue an unlimited number of shares. The Trust is registered under the Investment Company Act of 1940, as amended (the 1940 Act), as an open-end management investment company organized as a Massachusetts business trust. Shares of the Fund may only be purchased by insurance companies for the purpose of funding variable annuity or variable life insurance contracts. The Fund offers the following classes of shares: Initial Class shares and Investor Class shares. All classes have equal rights and voting privileges, except for matters affecting a single class.
2. Investments in Fidelity Central Funds.
Funds may invest in Fidelity Central Funds, which are open-end investment companies generally available only to other investment companies and accounts managed by the investment adviser and its affiliates. The Schedule of Investments lists any Fidelity Central Funds held as an investment as of period end, but does not include the underlying holdings of each Fidelity Central Fund. An investing fund indirectly bears its proportionate share of the expenses of the underlying Fidelity Central Funds.
Based on its investment objective, each Fidelity Central Fund may invest or participate in various investment vehicles or strategies that are similar to those of the investing fund. These strategies are consistent with the investment objectives of the investing fund and may involve certain economic risks which may cause a decline in value of each of the Fidelity Central Funds and thus a decline in the value of the investing fund.
| Fidelity Central Fund | Investment Manager | Investment Objective | Investment Practices | Expense RatioA |
| Fidelity Money Market Central Funds | Fidelity Management & Research Company LLC (FMR) | Each fund seeks to obtain a high level of current income consistent with the preservation of capital and liquidity. | Short-term Investments | Less than .005% |
A Expenses expressed as a percentage of average net assets and are as of each underlying Central Fund's most recent annual or semi-annual shareholder report.
A complete unaudited list of holdings for each Fidelity Central Fund is available upon request or at the Securities and Exchange Commission website at www.sec.gov. In addition, the financial statements of the Fidelity Central Funds which contain the significant accounting policies (including investment valuation policies) of those funds, and are not covered by the Report of Independent Registered Public Accounting Firm, are available on the Securities and Exchange Commission website or upon request.
3. Significant Accounting Policies.
The Fund is an investment company and applies the accounting and reporting guidance of the Financial Accounting Standards Board (FASB) Accounting Standards Codification Topic 946 Financial Services - Investment Companies. The financial statements have been prepared in conformity with accounting principles generally accepted in the United States of America (GAAP), which require management to make certain estimates and assumptions at the date of the financial statements. Actual results could differ from those estimates. The Fund operates as a single operating segment. The Fund's income, expenses, assets, and performance are regularly monitored and assessed as a whole by the investment adviser and other individuals responsible for oversight functions of the Trust, using the information presented in the financial statements and financial highlights. Subsequent events, if any, through the date that the financial statements were issued have been evaluated in the preparation of the financial statements. The Fund's Schedule of Investments lists any underlying mutual funds or exchange-traded funds (ETFs) but does not include the underlying holdings of these funds. The following summarizes the significant accounting policies of the Fund:
Investment Valuation. Investments are valued as of 4:00 p.m. Eastern time on the last calendar day of the period. The Board of Trustees (the Board) has designated the Fund's investment adviser as the valuation designee responsible for the fair valuation function and performing fair value determinations as needed. The investment adviser has established a Fair Value Committee (the Committee) to carry out the day-to-day fair valuation responsibilities and has adopted policies and procedures to govern the fair valuation process and the activities of the Committee. In accordance with these fair valuation policies and procedures, which have been approved by the Board, the Fund attempts to obtain prices from one or more third party pricing services or brokers to value its investments. When current market prices, quotations or currency exchange rates are not readily available or reliable, investments will be fair valued in good faith by the Committee, in accordance with the policies and procedures. Factors used in determining fair value vary by investment type and may include market or investment specific events, transaction data, estimated cash flows, and market observations of comparable investments. The frequency that the fair valuation procedures are used cannot be predicted and they may be utilized to a significant extent. The Committee manages the Fund's fair valuation practices and maintains the fair valuation policies and procedures. The Fund's investment adviser reports to the Board information regarding the fair valuation process and related material matters.
The Fund categorizes the inputs to valuation techniques used to value its investments into a disclosure hierarchy consisting of three levels as shown below:
Level 1 - unadjusted quoted prices in active markets for identical investments
Level 2 - other significant observable inputs (including quoted prices for similar investments, interest rates, prepayment speeds, etc.)
Level 3 - unobservable inputs (including the Fund's own assumptions based on the best information available)
Valuation techniques used to value the Fund's investments by major category are as follows:
Equity securities, including restricted securities, for which market quotations are readily available, are valued at the last reported sale price or official closing price as reported by a third party pricing service on the primary market or exchange on which they are traded and are categorized as Level 1 in the hierarchy. In the event there were no sales during the day or closing prices are not available, securities are valued at the last quoted bid price or may be valued using the last available price and are generally categorized as Level 2 in the hierarchy. For foreign equity securities, when market or security specific events arise, comparisons to the valuation of American Depositary Receipts (ADRs), futures contracts, Exchange-Traded Funds (ETFs) and certain indexes as well as quoted prices for similar securities may be used and would be categorized as Level 2 in the hierarchy. For equity securities, including restricted securities, where observable inputs are limited, assumptions about market activity and risk are used and these securities may be categorized as Level 3 in the hierarchy.
Investments in open-end mutual funds, including the Fidelity Central Funds, are valued at their closing net asset value (NAV) each business day and are categorized as Level 1 in the hierarchy.
Changes in valuation techniques may result in transfers in or out of an assigned level within the disclosure hierarchy. The aggregate value of investments by input level as of December 31, 2024 is included at the end of the Fund's Schedule of Investments.
Investment Transactions and Income. For financial reporting purposes, the Fund's investment holdings and NAV include trades executed through the end of the last business day of the period. The NAV per share for processing shareholder transactions is calculated as of the close of business of the New York Stock Exchange (NYSE), normally 4:00 p.m. Eastern time and includes trades executed through the end of the prior business day. Gains and losses on securities sold are determined on the basis of identified cost and include proceeds received from litigation. Commissions paid to certain brokers with whom the investment adviser, or its affiliates, places trades on behalf of a fund include an amount in addition to trade execution, which may be rebated back to a fund. Any such rebates are included in net realized gain (loss) on investments in the Statement of Operations. Dividend income is recorded on the ex-dividend date, except for certain dividends from foreign securities where the ex-dividend date may have passed, which are recorded as soon as the Fund is informed of the ex-dividend date. Non-cash dividends included in dividend income, if any, are recorded at the fair market value of the securities received. Income and capital gain distributions from Fidelity Central Funds, if any, are recorded on the ex-dividend date. Certain distributions received by the Fund represent a return of capital or capital gain. The Fund determines the components of these distributions subsequent to the ex-dividend date, based upon receipt of tax filings or other correspondence relating to the underlying investment. These distributions are recorded as a reduction of cost of investments and/or as a realized gain. Large, non-recurring dividends recognized by the Fund are presented separately on the Statement of Operations as "Special Dividends" and the impact of these dividends is presented in the Financial Highlights.
Class Allocations and Expenses. Investment income, realized and unrealized capital gains and losses, common expenses of a fund, and certain fund-level expense reductions, if any, are allocated daily on a pro-rata basis to each class based on the relative net assets of each class to the total net assets of a fund. Each class differs with respect to transfer agent and distribution and service plan fees incurred, as applicable. Certain expense reductions may also differ by class, if applicable. For the reporting period, the allocated portion of income and expenses to each class as a percent of its average net assets may vary due to the timing of recording these transactions in relation to fluctuating net assets of the classes. Expenses directly attributable to a fund are charged to that fund. Expenses attributable to more than one fund are allocated among the respective funds on the basis of relative net assets or other appropriate methods. Expenses included in the accompanying financial statements reflect the expenses of that fund and do not include any expenses associated with any underlying mutual funds or exchange-traded funds (ETFs). Although not included in a fund's expenses, a fund indirectly bears its proportionate share of these expenses through the net asset value of each underlying mutual fund or exchange-traded fund (ETF). Expense estimates are accrued in the period to which they relate and adjustments are made when actual amounts are known.
Income Tax Information and Distributions to Shareholders. Each year, the Fund intends to qualify as a regulated investment company under Subchapter M of the Internal Revenue Code, including distributing substantially all of its taxable income and realized gains. As a result, no provision for U.S. Federal income taxes is required. As of December 31, 2024, the Fund did not have any unrecognized tax benefits in the financial statements; nor is the Fund aware of any tax positions for which it is reasonably possible that the total amounts of unrecognized tax benefits will significantly change in the next twelve months. The Fund files a U.S. federal tax return, in addition to state and local tax returns as required. The Fund's federal income tax returns are subject to examination by the Internal Revenue Service (IRS) for a period of three fiscal years after they are filed. State and local tax returns may be subject to examination for an additional fiscal year depending on the jurisdiction.
Distributions are declared and recorded on the ex-dividend date. Income and capital gain distributions are declared separately for each class. Income and capital gain distributions are determined in accordance with income tax regulations, which may differ from GAAP.
Capital accounts within the financial statements are adjusted for permanent book-tax differences. These adjustments have no impact on net assets or the results of operations. Capital accounts are not adjusted for temporary book-tax differences which will reverse in a subsequent period.
Book-tax differences are primarily due to passive foreign investment companies (PFIC) and losses deferred due to wash sales.
As of period end, the cost and unrealized appreciation (depreciation) in securities, and derivatives if applicable, for federal income tax purposes were as follows:
| Gross unrealized appreciation | $68,220,872 |
| Gross unrealized depreciation | (4,533,435) |
| Net unrealized appreciation (depreciation) | $63,687,437 |
| Tax Cost | $175,629,376 |
The tax-based components of distributable earnings as of period end were as follows:
| Undistributed ordinary income | $57,440 |
| Undistributed long-term capital gain | $8,267,001 |
| Net unrealized appreciation (depreciation) on securities and other investments | $63,687,437 |
The tax character of distributions paid was as follows:
| | December 31, 2024 | December 31, 2023 |
| Ordinary Income | $3,009,800 | $ 404,818 |
| Long-term Capital Gains | 14,057,978 | - |
| Total | $17,067,778 | $ 404,818 |
New Accounting Pronouncement. FASB Accounting Standards Update (ASU) 2023-07 Segment Reporting (Topic 280): Improvements to Reportable Segment Disclosures became effective in this reporting period. ASU 2023-07 enhances segment information disclosure in the notes to financial statements.
4. Purchases and Sales of Investments.
Purchases and sales of securities, other than short-term securities and in-kind transactions, as applicable, are noted in the table below.
| | Purchases ($) | Sales ($) |
| VIP Industrials Portfolio | 83,925,417 | 69,918,412 |
5. Fees and Other Transactions with Affiliates.
Management Fee. Fidelity Management & Research Company LLC (the investment adviser) and its affiliates provide the Fund with investment management related services for which the Fund pays a monthly management fee.
Effective March 1, 2024, the Fund's management contract was amended to incorporate administrative services previously covered under separate services agreements (Transfer Agent and Accounting agreements). The amended contract incorporates a management fee rate that may vary by class. The investment adviser or an affiliate pays certain expenses of managing and operating the Fund out of each class's management fee. Each class of the Fund pays a management fee to the investment adviser. The management fee is calculated and paid to the investment adviser every month. When determining a class's management fee, a mandate rate is calculated based on the monthly average net assets of a group of funds advised by FMR within a designated asset class. A discount rate is subtracted from the mandate rate once the Fund's monthly average net assets reach a certain level. The mandate rate and discount rate may vary by class. The annual management fee rate for a class of shares of the Fund is the lesser of (1) the class's mandate rate reduced by the class's discount rate (if applicable) or (2) the amount set forth in the following table.
| | Maximum Management Fee Rate % |
| Initial Class | .58 |
| Investor Class | .66 |
One-twelfth of the management fee rate for a class is applied to the average net assets of the class for the month, giving a dollar amount which is the management fee for the class for that month. A different management fee rate may be applicable to each class of the Fund. The difference between classes is the result of separate arrangements for class-level services and/or waivers of certain expenses. It is not the result of any difference in advisory or custodial fees or other expenses related to the management of the Fund's assets, which do not vary by class. For the portion of the reporting period on or after March 1, 2024, the total annualized management fee rates were as follows:
| | Total Management Fee Rate % |
| Initial Class | .58 |
| Investor Class | .66 |
Prior to March 1, 2024, the management fee was the sum of an individual fund fee rate that was based on an annual rate of .30% of the Fund's average net assets and an annualized group fee rate that averaged .22% during the period. The group fee rate was based upon the monthly average net assets of a group of registered investment companies with which the investment adviser has management contracts. The group fee rate decreased as assets under management increased and increased as assets under management decreased. For the portion of the reporting period prior to March 1, 2024, the total annualized management fee rate was .52%.
Effective March 1, 2024, the Fund's sub-advisory agreements with FMR Investment Management (UK) Limited, Fidelity Management & Research (Hong Kong) Limited, and Fidelity Management & Research (Japan) Limited were amended to provide that the investment adviser pays each sub-adviser monthly fees equal to 110% of the sub-adviser's costs for providing sub-advisory services.
Transfer Agent Fees. Fidelity Investments Institutional Operations Company LLC (FIIOC), an affiliate of the investment adviser, is the Fund's transfer, dividend disbursing, and shareholder servicing agent. Effective March 1, 2024, the Fund's management contract was amended to incorporate transfer agent services and associated fees previously covered under a separate services agreement.
During the period January 1, 2024 through February 29, 2024, the transfer agent fees for each class were a fixed annual rate of class-level average net assets as follows:
| | Amount ($) | % of Class-Level Average Net Assets |
| Initial Class | 3,003 | .0630 |
| Investor Class | 36,295 | .1390 |
| | 39,298 | |
Accounting Fees. Fidelity Service Company, Inc. (FSC), an affiliate of the investment adviser, maintains the Fund's accounting records. Effective March 1, 2024, the Fund's management contract was amended to incorporate accounting services and associated fees previously covered under a separate services agreement.
During the period January 1, 2024 through February 29, 2024, the accounting fees were a fixed annual rate of average net assets as follows:
| | % of Average Net Assets |
| VIP Industrials Portfolio | .0353 |
Brokerage Commissions. A portion of portfolio transactions were placed with brokerage firms which are affiliates of the investment adviser. Brokerage commissions are included in net realized gain (loss) and change in net unrealized appreciation (depreciation) in the Statement of Operations. The commissions paid to these affiliated firms were as follows:
| | Amount ($) |
| VIP Industrials Portfolio | 631 |
Interfund Trades. Funds may purchase from or sell securities to other Fidelity Funds under procedures adopted by the Board. The procedures have been designed to ensure these interfund trades are executed in accordance with Rule 17a-7 of the 1940 Act. Any interfund trades are included within the respective purchases and sales amounts shown in the Purchases and Sales of Investments note. Interfund trades during the period are noted in the table below.
| | Purchases ($) | Sales ($) | Realized Gain (Loss) ($) |
| VIP Industrials Portfolio | 4,661,380 | 4,782,239 | 214,348 |
6. Committed Line of Credit.
Certain Funds participate with other funds managed by the investment adviser or an affiliate in a $4.25 billion credit facility (the "line of credit") to be utilized for temporary or emergency purposes to fund shareholder redemptions or for other short-term liquidity purposes.
Commitment fees are charged based on the unused amount of the line of credit at an annual rate of .10%, and then allocated to each participating fund based on its pro-rata portion of the line of credit. The commitment fees are reflected in Miscellaneous expenses on the Statement of Operations, and are listed below.
Interest is charged to a participating fund based on its borrowings at an annual rate of .75% plus the highest of (i) daily SOFR plus a .10% spread adjustment, (ii) Federal Funds Effective Rate, or (iii) Overnight Bank Funding Rate. During the period, there were no borrowings on this line of credit.
The line of credit agreement will expire in March 2025 unless extended or renewed.
| | Amount ($) |
| VIP Industrials Portfolio | 311 |
7. Security Lending.
Funds lend portfolio securities from time to time in order to earn additional income. Lending agents are used, including National Financial Services (NFS), an affiliate of the investment adviser. Pursuant to a securities lending agreement, NFS will receive a fee, which is capped at 9.9% of a fund's daily lending revenue, for its services as lending agent. A fund may lend securities to certain qualified borrowers, including NFS. On the settlement date of the loan, a fund receives collateral (in the form of U.S. Treasury obligations, letters of credit and/or cash) against the loaned securities and maintains collateral in an amount not less than 100% of the market value of the loaned securities during the period of the loan. The market value of the loaned securities is determined at the close of business of a fund and any additional required collateral is delivered to a fund on the next business day. A fund or borrower may terminate the loan at any time, and if the borrower defaults on its obligation to return the securities loaned because of insolvency or other reasons, a fund may apply collateral received from the borrower against the obligation. A fund may experience delays and costs in recovering the securities loaned. Any cash collateral received is invested in the Fidelity Securities Lending Cash Central Fund. Any loaned securities are identified as such in the Schedule of Investments, and the value of loaned securities and cash collateral at period end, as applicable, are presented in the Statement of Assets and Liabilities. Security lending income represents the income earned on investing cash collateral, less rebates paid to borrowers and any lending agent fees associated with the loan, plus any premium payments received for lending certain types of securities. Security lending income is presented in the Statement of Operations as a component of income from Fidelity Central Funds. Affiliated security lending activity, if any, was as follows:
| | Total Security Lending Fees Paid to NFS ($) | Security Lending Income From Securities Loaned to NFS ($) | Value of Securities Loaned to NFS at Period End ($) |
| VIP Industrials Portfolio | 205 | - | - |
8. Expense Reductions.
During the period the investment adviser or an affiliate reimbursed and/or waived a portion of fund-level operating expenses in the amount of $8,205.
9. Distributions to Shareholders.
Distributions to shareholders of each class were as follows:
| | Year ended December 31, 2024 | Year ended December 31, 2023 |
| VIP Industrials Portfolio | | |
| Distributions to shareholders | | |
| Initial Class | 2,588,088 | 80,284 |
| Investor Class | 14,479,690 | 324,534 |
Total | $17,067,778 | $404,818 |
10. Share Transactions.
Transactions for each class of shares were as follows and may contain in-kind transactions:
| | Shares | Shares | Dollars | Dollars |
| | Year ended December 31, 2024 | Year ended December 31, 2023 | Year ended December 31, 2024 | Year ended December 31, 2023 |
| VIP Industrials Portfolio | | | | |
| Initial Class | | | | |
| Shares sold | 205,460 | 127,931 | $5,105,951 | $2,538,013 |
| Reinvestment of distributions | 114,210 | 3,985 | 2,588,088 | 80,284 |
| Shares redeemed | (236,572) | (267,518) | (5,571,825) | (5,139,808) |
| Net increase (decrease) | 83,098 | (135,602) | $2,122,214 | $(2,521,511) |
| Investor Class | | | | |
| Shares sold | 1,964,464 | 1,021,715 | $48,519,896 | $20,318,711 |
| Reinvestment of distributions | 645,517 | 16,313 | 14,479,690 | 324,534 |
| Shares redeemed | (1,430,375) | (1,131,722) | (33,578,699) | (21,424,992) |
| Net increase (decrease) | 1,179,606 | (93,694) | $29,420,887 | $(781,747) |
11. Other.
A fund's organizational documents provide former and current trustees and officers with a limited indemnification against liabilities arising in connection with the performance of their duties to the fund. In the normal course of business, a fund may also enter into contracts that provide general indemnifications. A fund's maximum exposure under these arrangements is unknown as this would be dependent on future claims that may be made against a fund. The risk of material loss from such claims is considered remote.
At the end of the period, the investment adviser or its affiliates were owners of record of more than 10% of the outstanding shares as follows:
| Fund | Affiliated % |
| VIP Industrials Portfolio | 100% |
12. Risk and Uncertainties.
Many factors affect a fund's performance. Developments that disrupt global economies and financial markets, such as pandemics, epidemics, outbreaks of infectious diseases, war, terrorism, and environmental disasters, may significantly affect a fund's investment performance. The effects of these developments to a fund will be impacted by the types of securities in which a fund invests, the financial condition, industry, economic sector, and geographic location of an issuer, and a fund's level of investment in the securities of that issuer. Significant concentrations in security types, issuers, industries, sectors, and geographic locations may magnify the factors that affect a fund's performance.
Report of Independent Registered Public Accounting Firm
To the Board of Trustees of Variable Insurance Products Fund IV and Shareholders of VIP Industrials Portfolio
Opinion on the Financial Statements
We have audited the accompanying statement of assets and liabilities, including the schedule of investments, of VIP Industrials Portfolio (one of the funds constituting Variable Insurance Products Fund IV, referred to hereafter as the "Fund") as of December 31, 2024, the related statement of operations for the year ended December 31, 2024, the statement of changes in net assets for each of the two years in the period ended December 31, 2024, including the related notes, and the financial highlights for each of the five years in the period ended December 31, 2024 (collectively referred to as the "financial statements"). In our opinion, the financial statements present fairly, in all material respects, the financial position of the Fund as of December 31, 2024, the results of its operations for the year then ended, the changes in its net assets for each of the two years in the period ended December 31, 2024 and the financial highlights for each of the five years in the period ended December 31, 2024 in conformity with accounting principles generally accepted in the United States of America.
Basis for Opinion
These financial statements are the responsibility of the Fund's management. Our responsibility is to express an opinion on the Fund's financial statements based on our audits. We are a public accounting firm registered with the Public Company Accounting Oversight Board (United States) (PCAOB) and are required to be independent with respect to the Fund in accordance with the U.S. federal securities laws and the applicable rules and regulations of the Securities and Exchange Commission and the PCAOB.
We conducted our audits of these financial statements in accordance with the standards of the PCAOB. Those standards require that we plan and perform the audit to obtain reasonable assurance about whether the financial statements are free of material misstatement, whether due to error or fraud.
Our audits included performing procedures to assess the risks of material misstatement of the financial statements, whether due to error or fraud, and performing procedures that respond to those risks. Such procedures included examining, on a test basis, evidence regarding the amounts and disclosures in the financial statements. Our audits also included evaluating the accounting principles used and significant estimates made by management, as well as evaluating the overall presentation of the financial statements. Our procedures included confirmation of securities owned as of December 31, 2024 by correspondence with the custodian. We believe that our audits provide a reasonable basis for our opinion.
/s/ PricewaterhouseCoopers LLP
Boston, Massachusetts
February 11, 2025
We have served as the auditor of one or more investment companies in the Fidelity group of funds since 1932.
Distributions
(Unaudited)The dividend and capital gains distributions for the fund(s) are available on Fidelity.com or Institutional.Fidelity.com.
The fund hereby designates as a capital gain dividend with respect to the taxable year ended December 31,2024, $8,277,042, or, if subsequently determined to be different, the net capital gain of such year.
The fund designates $22,437 of distributions paid during the fiscal year ended 2024 as qualifying to be taxed as section 163(j) interest dividends.
Initial Class designates 94%, 55%; Investor Class designates 99%, 57%; of the dividends distributed in February and December 2024, respectively during the fiscal year as qualifying for the dividends-received deduction for corporate shareholders.
Item 8: Changes in and Disagreements with Accountants for Open-End Management Investment Companies
(Unaudited)
Note: This is not applicable for any fund included in this document.
Item 9: Proxy Disclosures for Open-End Management Investment Companies
(Unaudited)
| A special meeting of shareholders was held on July 16, 2024. The results of votes taken among shareholders on the proposal before them are reported below. Each vote reported represents one dollar of net asset value held on the record date for the meeting. |
| Proposal 1 |
| To elect a Board of Trustees. |
| | # of Votes | % of Votes |
| Bettina Doulton |
| Affirmative | 5,501,492,681.85 | 94.15 |
| Withheld | 341,991,035.05 | 5.85 |
| TOTAL | 5,843,483,716.90 | 100.00 |
| Robert A. Lawrence |
| Affirmative | 5,480,901,467.70 | 93.80 |
| Withheld | 362,582,249.21 | 6.20 |
| TOTAL | 5,843,483,716.90 | 100.00 |
| Vijay C. Advani |
| Affirmative | 5,500,352,811.04 | 94.13 |
| Withheld | 343,130,905.86 | 5.87 |
| TOTAL | 5,843,483,716.90 | 100.00 |
| Thomas P. Bostick |
| Affirmative | 5,488,165,362.69 | 93.92 |
| Withheld | 355,318,354.21 | 6.08 |
| TOTAL | 5,843,483,716.90 | 100.00 |
| Donald F. Donahue |
| Affirmative | 5,482,960,893.76 | 93.83 |
| Withheld | 360,522,823.14 | 6.17 |
| TOTAL | 5,843,483,716.90 | 100.00 |
| Vicki L. Fuller |
| Affirmative | 5,492,283,337.89 | 93.99 |
| Withheld | 351,200,379.01 | 6.01 |
| TOTAL | 5,843,483,716.90 | 100.00 |
| Patricia L. Kampling |
| Affirmative | 5,521,992,715.20 | 94.50 |
| Withheld | 321,491,001.70 | 5.50 |
| TOTAL | 5,843,483,716.90 | 100.00 |
| Thomas A. Kennedy |
| Affirmative | 5,484,789,158.10 | 93.86 |
| Withheld | 358,694,558.80 | 6.14 |
| TOTAL | 5,843,483,716.90 | 100.00 |
| Oscar Munoz |
| Affirmative | 5,497,884,744.63 | 94.09 |
| Withheld | 345,598,972.27 | 5.91 |
| TOTAL | 5,843,483,716.90 | 100.00 |
| Karen B. Peetz |
| Affirmative | 5,503,968,240.81 | 94.19 |
| Withheld | 339,515,476.09 | 5.81 |
| TOTAL | 5,843,483,716.90 | 100.00 |
| David M. Thomas |
| Affirmative | 5,466,218,204.40 | 93.54 |
| Withheld | 377,265,512.50 | 6.46 |
| TOTAL | 5,843,483,716.90 | 100.00 |
| Susan Tomasky |
| Affirmative | 5,463,402,825.36 | 93.50 |
| Withheld | 380,080,891.54 | 6.50 |
| TOTAL | 5,843,483,716.90 | 100.00 |
| Michael E. Wiley |
| Affirmative | 5,466,838,155.74 | 93.55 |
| Withheld | 376,645,561.16 | 6.45 |
| TOTAL | 5,843,483,716.90 | 100.00 |
| | | |
| Proposal 1 reflects trust-wide proposal and voting results. |
Item 10: Remuneration Paid to Directors, Officers, and others of Open-End Management Investment Companies
(Unaudited)
Note: This information is disclosed as part of the financial statements for each Fund as part of Item 7: Financial Statements and Financial Highlights for Open-End Management Investment companies.
Item 11: Statement Regarding Basis for Approval of Investment Advisory Contract
(Unaudited)
Note: This is not applicable for any fund included in this document.
1.817361.119
VCYLIC-ANN-0325
Item 8.
Changes in and Disagreements with Accountants for Open-End Management Investment Companies
See Item 7.
Item 9.
Proxy Disclosures for Open-End Management Investment Companies
See Item 7.
Item 10.
Remuneration Paid to Directors, Officers, and Others of Open-End Management Investment Companies
See Item 7.
Item 11.
Statement Regarding Basis for Approval of Investment Advisory Contract
See Item 7.
Item 12.
Disclosure of Proxy Voting Policies and Procedures for Closed-End Management Investment Companies
Not applicable.
Item 13.
Portfolio Managers of Closed-End Management Investment Companies
Not applicable.
Item 14.
Purchase of Equity Securities by Closed-End Management Investment Company and Affiliated Purchasers
Not applicable.
Item 15.
Submission of Matters to a Vote of Security Holders
There were no material changes to the procedures by which shareholders may recommend nominees to the trust’s Board of Trustees.
Item 16.
Controls and Procedures
(a)(i) The President and Treasurer and the Chief Financial Officer have concluded that the trust’s disclosure controls and procedures (as defined in Rule 30a-3(c) under the Investment Company Act) provide reasonable assurances that material information relating to the trust is made known to them by the appropriate persons, based on their evaluation of these controls and procedures as of a date within 90 days of the filing date of this report.
(a)(ii) There was no change in the trust’s internal control over financial reporting (as defined in Rule 30a-3(d) under the Investment Company Act) that occurred during the period covered by this report that has materially affected, or is reasonably likely to materially affect, the trust’s internal control over financial reporting.
Item 17.
Disclosure of Securities Lending Activities for Closed-End Management Investment Companies
Not applicable.
Item 18.
Recovery of Erroneously Awarded Compensation
(a)
Not applicable.
(b)
Not applicable.
Item 19.
Exhibits
SIGNATURES
Pursuant to the requirements of the Securities Exchange Act of 1934 and the Investment Company Act of 1940, the registrant has duly caused this report to be signed on its behalf by the undersigned, thereunto duly authorized.
Variable Insurance Products Fund IV
|
By: | /s/Stacie M. Smith |
| Stacie M. Smith |
| President and Treasurer (Principal Executive Officer) |
|
|
Date: | February 21, 2025 |
Pursuant to the requirements of the Securities Exchange Act of 1934 and the Investment Company Act of 1940, this report has been signed below by the following persons on behalf of the registrant and in the capacities and on the dates indicated.
|
By: | /s/Stacie M. Smith |
| Stacie M. Smith |
| President and Treasurer (Principal Executive Officer) |
|
|
Date: | February 21, 2025 |
|
By: | /s/Stephanie Caron |
| Stephanie Caron |
| Chief Financial Officer (Principal Financial Officer) |
|
|
Date: | February 21, 2025 |