As filed with the Securities and Exchange Commission on September 5, 2008
UNITED STATES
SECURITIES AND EXCHANGE COMMISSION
Washington, D.C. 20549
FORM N-CSR
CERTIFIED SHAREHOLDER REPORT OF REGISTERED
MANAGEMENT INVESTMENT COMPANIES
Investment Company Act file number 811-03758
MATRIX ADVISORS VALUE FUND, INC.
747 Third Avenue, 31st Floor, New York, NY 10017
David A. Katz
747 Third Avenue, 31st Floor
New York, NY 10017
1(800) 366-6223
Copies to:
Carol Gehl
Godfrey & Kahn, S.C.
780 N. Water Street
Milwaukee, WI 53202
Date of fiscal year end: June 30
Date of reporting period: June 30, 2008
Item 1. Report to Stockholders.
MATRIX ADVISORS
VALUE FUND, INC.
July 21, 2008
Dear Fellow Shareholder,
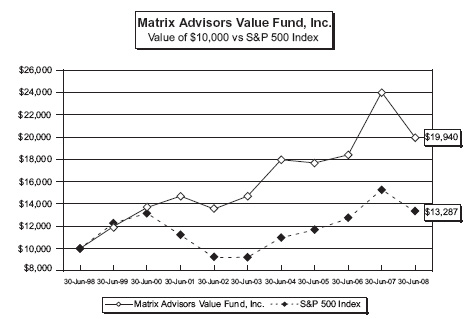
The Fund ended a difficult fiscal year with a frustrating quarter, declining by -2.35%, thus ending the quarter and it’s fiscal year with a Net Asset Value of $44.14. This represents a decline of -9.60% for the first six months of 2008 and a decline of -16.98% for the Fund’s 2008 fiscal year. These results compare to the S&P 500’s -2.73%, -11.91%, and - 13.12% over the same periods.
Disclosure Note: For your information, for the period ended June 30, 2008, the Fund’s average annual total returns for the one-year, five-years, ten-years and for the period from July 1, 1996, the inception of Matrix Asset Advisors’ involvement with the Fund were -16.98%, 6.29%, 7.15% and 8.87%, respectively. For the same periods the returns for the S&P 500 Index were -13.12%, 7.58%, 2.88% and 7.23%. Gross Expense Ratio: 1.31% Net Expense Ratio: 1.11%* * The Advisor has contractually agreed to reimburse expenses for an indefinite period. In addition, the Advisor will voluntarily reimburse the Fund for expenses in excess of 0.99%, not including acquired fund fees and expenses. Performance data quoted represents past performance; past performance does not guarantee future results. The investment return and principal value of an investment will fluctuate so that an investor’s shares, when redeemed, may be worth more or less than their original cost. Current performance of the fund may be lower or higher than the performance quoted. Performance data current to the most recent month end may be obtained by calling 800-366-6223 or by visiting www.matrixadvisorsvaluefund.com. The funds impose a 1.00% redemption fee on shares held for 60 days or less. Performance data does not reflect the redemption fee. If reflected, total returns would be reduced. Investment performance reflects fee waivers in effect. In the absence of such waivers, total return would be reduced. Matrix Asset Advisors became the sub-advisor on July 1, 1996 and Advisor to the Fund on May 11, 1997. Prior to those dates, the Fund was managed by another advisor. |
While this has been a challenging market, our lengthy experience as equity managers tells us that there should be a significant number of opportunities to be realized now. We strongly believe that astute steps taken now can and should bear fruit in a more normalized market climate.
We urge you to read the enclosed commentary as we discuss the underpinnings of the current market environment, and the prospects of improvement going forward.
1
MATRIX ADVISORS
VALUE FUND, INC.
Our conviction regarding the prospects of the Fund has only increased during this turbulent period. Our Matrix staff continues to invest in the Fund, and we are grateful for your ongoing trust and support. We are confident that you will conclude that your trust was well placed.
Best regards.
Sincerely,

David A. Katz, CFA
Fund Manager
Mutual fund investing involves risk. Principal loss is possible.
2
MATRIX ADVISORS
VALUE FUND, INC.
Average Annualized Total Return Periods Ended June 30, 2008 | |||||
| One Year | Five Years | Ten Years | |||
| Matrix Advisors Value Fund, Inc. | -16.98% | 6.29% | 7.15% | ||
| S&P 500 Index* | -13.12% | 7.58% | 2.88% | ||
Performance data quoted represents past performance and does not guarantee future results . The investment return and principal value of an investment will fluctuate so that an investor' s shares, when redeemed, may be worth more or less than their original cost. Current performance of the Fund may be lower or higher than the performance quoted. Performance data current to the most recent month end may be obtained by visiting www.matrixadvisorsvaluefund.com. The Fund imposes a redemption fee of 1.00% on shares held for 60 days or less. The performance cited above does not reflect this redemption fee; if deducted the total returns would be reduced. Performance figures reflect fee waiver in effect and in the absence of fee waivers, total returns would be lower.
| * | The S&P 500 is an unmanaged index which is widely regarded as the standard for measuring large-cap U.S. stock market performance. The index does not incur expenses and is not available for investment. |
3
MATRIX ADVISORS
VALUE FUND, INC.
Capital Markets Commentary and 2008 Annual Report:
“Just when I thought I was out . . . they pull me back in.”
| –Michael Corle one, The Godfather: Part III |
For those of us who thought that the market was about to get itself out of the mire of the previous nine months, the second quarter ended with the disappointment of June, when the market was pulled back to the fears that abounded in the first quarter.
The Fund’s fiscal year ended with the third consecutive negative quarter for the S&P 500 Index, which declined by -2.73%. While the Fund was able to outperform the Index for the second straight quarter, it too had negative performance, declining by -2.35% for the quarter. The Fund declined -9.60% for the first six months of 2008 compared to the S&P 500’s decline of - -11.91%.
Annual Review
It was a very challenging fiscal year for the Fund. Following a very strong fiscal year last year, the Fund declined by -16.98% for the most recent fiscal year, compared with a decline in the S&P 500 Index of -13.12%.
The year began with the sell-off of large financial stocks, a decline that accelerated and intensified throughout much of the fiscal year. The decline in financials was the most severe of any market sector, and set the tone for the entire market during the past 12 months.
The Fund’s financial holdings are modestly overly weighted to the overall market weighting in financials. Furthermore they deliberately skewed towards the largest banks and investment banking firms, rather than smaller competitors. The rationale was a concern that a slowing housing market would much more severely impact smaller banks, many of which had been more mortgage dependent than their larger, more diversified competitors.
While this strategy succeeded in avoiding the dramatic negativity of many of the smaller banks, it did not shield the Fund from the negativity experienced by the largest institutions. In fairness, the institutions themselves were unhappily surprised by the strength of the negative impact of their mortgage-backed securities portfolios.
Having said that, it was these largest institutions that first encountered difficulties with their mortgage-related investments. This accounts for their relative weakness – and the Fund’s relative underperformance – in the first six months of the fiscal year.
Subsequently, smaller financial institutions began to experience mortgage-related travails and their stock prices suffered severely. While the larger institutions were well into the process of writing down mortgage related exposure, they continued to suffer significant market declines. Nevertheless, successful stock selection in other market sectors enabled the Fund to outperform the market during the second six months of the fiscal year.
Overall, however, the Fund was most negatively impacted by the year long weaknes in its financial stocks, both relatively and absolutely.
4
MATRIX ADVISORS
VALUE FUND, INC.
The fears underlying the weaknes in financial stocks during the past 12 months, compounded by high oil and gasoline prices, in turn led to fears of a consumer retrenchment which would push the economy into recession.
Despite all the negativity, the current environment resembles a fairly typical economic and market downturn. Based on historical patterns, this indicates the possibility that the market could rally in the second half of calendar 2008 based on the expectation of economic recovery in the early part of 2009.
Quarterly Review
It was indeed a quarter of stark contrasts. The strength of April and May enabled the Fund to erase the vast majority of its first quarter decline. Unfortunately, come June the market – and the Fund along with it – felt the sting of runaway oil prices, growing concerns about inflation, and renewed anxieties about the financial system and the overal direction of the economy.
June was sufficiently negative as to drive the market into bear market territory (defined as a 20% drop from the most recent peak level) . As might be expected, it also brought a rise in anxiety about continued and intensified market declines. This negative sentiment has carried over and even intensified in the early weeks of the third quarter.
Again , while the Fund managed to once again outperform the S&P 500 Index for the quarter, better relative performance was of cold comfort in the face of a modest absolute decline.
Of note is that while equities fared negatively across the board in the United States, they performed even worse in markets overseas. International markets had been highly touted, and were even thought by some to be immune from stress in U.S. equities (a sentiment that we found to be unrealisitc).
Nevertheless, these markets have fared very poorly over the past nine months, with recent darlings China and India among the hardest hit . European markets have significantly lagged the U.S. as well.
One of the silver linings in the prospects for the U.S. market for the second half of 2008 may lie in the reckoning being felt abroad. We at Matrix have frequently stated our conviction that the U.S. market has been disparaged and oversold compared with its international peers. We believe that the U.S. has not only been the first to feel the pain of economic contraction, but also has responded first, and is likely to recover economically first.
Despite the most recent market travails, we believe that 2008 should be a positive year for the market. We base this on the beliefs that: a variety of factors should result in lower commodity prices; the market should favorably anticipate 2009 economic recovery; and in the fashion of the historic pattern, the second half of a Presidential election year has been almost invariably positive.
Fund Performance
Unlike recent quarters where there had been a uniformity of performance across economic sectors, there were significant disparities among the Fund’s sectors this past quarter.
As might be expected given the steep climb in the price of crude oil, the Fund’s energy stocks performed quite well, with Chevron, Conoco and Devon all posting mid teens to mid twenties percentage gains. Also strong was the healthcare sector, where the two largest holdings, Covidien and Wyeth, each had a strong quarter.
5
MATRIX ADVISORS
VALUE FUND, INC.
Despite the significant weaknes of the technology intensive NASDAQ composite during the quarter, technology stocks posted attractive results. Leadership came from a resurgent Dell , and from Symantec, Novellus and Taiwan Semic onductor.
Perhaps most counter-intuitively of all , retail stocks as a group had positive performance. Here strength from a re-invigorated Wal-Mart and from Staples outweighed weakness in Office Depot and a recently added Walgreen’s.
The countervailing weakness in the Fund’s portfolio came primarily from the still struggling financial sector. Here, continued concerns about the future strength of financial institutions, in the wake of additional projected asset write downs and new capital, sent financial shares sharply lower for the quarter.
In addition, there was weakness in various facets of the Old Economy sector, including industrial stocks, led downward by General Electric and Tyco International, based on fears of a global economic slowdown.
As befits the Fund’s history of being opportunistic in turbulent markets, it was active in fine tuning its holdings during the quarter. We sold about two thirds of our position in drug giant Pfizer, and used the proceeds to begin equal-sized positions in Amgen and Bristol Myers. The thesis here was that the difficulties facing the pharmaceutical industry – patent expirations of blockbuster drugs, a Federal Drug Administration that is moving very slowly to approve new drugs, and political headwinds from Washington concerning prescription prices –would very likely result in significant consolidation within the industry.
In such an environment we believe that one would be best advised to own companies most likely to be acquired, rather than the acquiring companies. As large as they are, both Amgen and Bristol Myers fit within the profile of companies that could be very attractive targets.
Pfizer, on the other hand, as the largest drug company in the U.S. and possibly the world, would be an acquirer. Nevertheless, because of its own low valuation, we decided to maintain some continued position in Pfizer. Ultimately, we were more comfortable not increasing the Fund’s overall exposure to the drug sector, but rather spreading it among more holdings.
The Fund began a position in two companies in different industries that share an important similarity. The stocks of both Carnival Cruise Lines, the largest cruise line company in the world, and Valero Energy, the largest oil refiner in America, have been adversely impacted by the steep recent price rise of crude oil. In each case, a moderating crude oil price should be a significant earnings and stock price boon to these two leading companies. We believe that each of these purchases should represent good opportunities for the Fund.
Finally, the Fund sold its position in Taiwan Semiconductor Manufacturing Company ( TSM), which was a profit able short term investment. While its profit was fairly modest in absolute terms, in the current environment owning TSM was a very positive experience. Since we are seeing so many opportunities in strong companies with highly distressed stock prices, and since TSM might start to act like many stocks these days and reverse its gains, we thought it wisest to realize them. While TSM is a short term gain, we fully expect that we should be able to offset it at some point later this year.
6
MATRIX ADVISORS
VALUE FUND, INC.
As we contemplate the second half of the year, we recognize that the economy and the stock market are beset with difficult issues. Investor sentiment is at its lowest level in the past 14 years. In such an environment, perspective is usually in short supply . There is little sense of light at the end of the tunnel, and a feeling that the market will be besieged with bad news indefinitely.
Nevertheless, we believe that the market can and should rally as the year progresses. And it is typically such environments as the current one that spawn market recoveries.
Through this difficult period, the Fund maintains its focus on high quality companies, particularly multi-national industry leaders. In our view, these companies may offer a relatively good downside hedge in the current environment, and could benefit disproportionately from the more beneficial market scenario that we believe may occur later this year.
In the current issue of Ideas About Investing, we look at one of the major contributors to current market negativity – high oil prices – and explore the possibility (in our view, the likelihood) that price relief may be in the offing.
Summer is nature’s way of telling us to slow down and to relax. Air conditioning notwithstanding, we all feel, in the heat of the summer, the urge to head somewhere cool, wet and comfortable. No matter how you let summer work its magic, we hope that it brings you contentment, and even some much to be desired serenity.
Regardless of the lure of the season, we remain focused and vigilant, and as always, profoundly grateful for your trust and support.
Best regards.
The Fund may invest in smaller companies which involves additional risks such as limited liquidity and greater volatility.
The S&P500 Index is a broad based unmanaged index of 500 stocks, which is widely recognized as representative of the equity market in general. The NASDAQ Composite Index is a market capitalization-weighted index that is designed to represent the performance of the National Market System which includes over 5,000 stocks traded only over-the-counter and not on an exchange. You cannot invest directly in an index.
Please refer to the Schedule of Investments in this report for details on fund holdings. Fund holdings are subject to change at any time and are not recommendations to buy or sell any security.
The information provided herein represents the opinion of the Matrix Advisors Value Fund management and is not intended to be a forecast of future events, a guarantee of future results, nor investment advice. (8/08)
7
MATRIX ADVISORS
VALUE FUND, INC.
Ideas About Investing
A Quarterly Quest for Investment Enlightenment
Just as Icarus flew so high towards the sun as to cause his wax wings to melt, the rising price of crude oil contains within itself the seeds of its own correction.
Back in the late 1990’s when we urged our clients to fear the runaway price rise of the Internet stocks, we used the analogy to the South Seas Investment Bubble of the early 1700’s. Today, when we discuss the likelihood that commodity prices, particularly oil prices, represent a bubble, we need not, unfortunately, look back beyond the last 10 years for relevant analogies.
In the past decade we have not only witnessed the Internet bubble, but we are still smarting from a housing bubble that has impacted most markets, particularly those that had the strongest upward price movements.
Now we have commodities to contend with. While the prices of most commodities have risen dramatically, the one with the most direct impact to the most people is the price of crude oil. The trajectory of the price of crude oil during the past 18 months bears an eerie similarity to the trajectory of the NASDAQ in the late 1990’s and to the prices of the homebuilder stocks in the early part of this decade.
If anything, oil’s price rise has been even more intense.
The question of course is where does this all go? Are we in a bubble or have geo-political or fundamental considerations changed such that we should accept that $140 – $150 per barrel is the new norm?
Without stating our conclusion too quickly , we would remind you of the four most dangerous words in investing: “This time it's different.”
In the case of crude, there are no shortage of commentators who assure us that worldwide demand is voracious, insatiable, and of course growing. Therein of course lies the primary rationale for the tenaciously high – and going higher – price of oil.
But wait a minute. Projections of rising world demand for oil significantly pre-date the hyper-move in the price of crude. And more recent projections of demand show it falling, not accelerating.
The same goes for the rationale that the emerging economies are tremendous markets, the development of which will change everything. Maybe so, but those perceptions and conclusions also predated the runaway price of commodities.
Most troubling of all is what we would call the Chinese Wall type of thinking on this issue. The Chinese Wall, named in honor of the Great Wall of China, is financial parlance intended to denote a complete separation, whereby different activities can take place irrespective of each other.
In the matter of oil prices the Chinese Wall thinking says that regardless of the travails of the economies of developed nations, the needs for commodities in the emerging economies will continue unabated.
Really? How can that possibly be? Emerging markets are emerging precisely because they are lower cost providers to emerged, developed nations. If American consumers slow down, they will inevitably be buying fewer of the products manufactured in emerging nations. Consumers catching a cold in the U.S. can cause pneumonia in the Far East.
8
MATRIX ADVISORS
VALUE FUND, INC.
Actually, based on their steep sell-offs this year, international stock markets may already be signaling such concerns.
We are reminded of the discussions we would occasionally have with clients concerning real estate prices in certain white hot markets. Inevitably, the rationale was that the long term demographics of their particular area were compelling, even overwhelming.
Yes, we would counter. We agree. Over the long term, we share your conclusion. But markets can choke over the short term on too much inventory and too much price appreciation. Nothing is linear, everything is cyclical.
And this becomes the essence of our conclusion about commodity prices. The long-term development of certain emerging countries, even if they ultimately are of geo-politically “game changing” significance, does not rule out their overheating and retrenching in the near term. Particularly following the kind of developmental trajectory they have already experienced.
There is a growing disconnect between oil prices and supply/demand fundamentals. Oil professionals say that oil is no longer traded as an industrial commodity. It is now a stand alone investment vehicle.
The growing disconnect is of course fueled (as it were) by speculation. Not by nefarious speculators, but by the same thinking (and very likely many of the same people) that enshrined the Internet stocks. By momentum trading by investors who, having climbed aboard the rocket ship, have a vested interest in keeping it powered.
But as with these other two bubbles, this one might be destined not to end in pretty fashion. Actually, we should qualify that. Its end would not be pretty for those who have rushed in at elevated price levels .
However, unlike the bursting of the Internet and the real estate bubbles, the bursting of the oil bubble, and the commodities bubble in general, should have very positive effects on the economy and the stock market.
What would cause the bubble to pop? This is a hard question to answer, if only because rational people have a hard time divining the limits of irrationality. But as in all bubbles, the very success that creates the bubble contains its end.
Will it be demand destruction spreading to the emerging economies? Will it come from government actions designed both to increase supply over the short term and alternatives over the long term?
One very likely contributor to the bursting of the oil price bubble would be the changing behavior that is currently taking place as a result of high prices. As prime recent examples, there is a dramatic shift away from large SUVs to smaller hybrid cars; driving patterns are changing, as gasoline consumers become more discriminating and deliberate; there is intense private sector interest in alternative sources of energy, such as solar, wind and fuel cells; Boone Pickens, a renowned oil man is launching a private initiative to become more energy independent focusing on natural gas.
9
MATRIX ADVISORS
VALUE FUND, INC.
There are also pressures to increase the supply of oil by releasing strategic reserves, or by opening up more offshore areas for drilling. Interestingly, while many if not most of these ideas will only bear fruit in the more distant future, they do have the power to change investor psychology and perception now – which could have an immense impact on oil prices in the short term.
It could be any or all of these. Again, the root of the destruction of the bubble is contained within its own excessive success.
Investing history has shown over and over again that too much of a good thing is, well, too much. Trees do not grow to the sky; linear projections tend to be highly unrealistic, and Icarus learned the hard way about regression to the mean.
10
MATRIX ADVISORS
VALUE FUND, INC.
Expense Example (Unaudited)
As a shareholder of the Fund, you incur two types of costs: (1) transaction costs; and (2) ongoing costs, including management fees; and other Fund expenses. This Example is intended to help you understand your ongoing costs (in dollars) of investing in the Fund and to compare these costs with the ongoing costs of investing in other mutual funds.
The Example is based on an investment of $1,000 invested at the beginning of the period indicated and held for the entire period from December 31, 2007 o t June 30, 2008.
Actual Expenses
The information in the table under the heading “Actual Performance” provides information about actual account values and actual expenses. You may use the information in these columns together with the amount you invested, to estimate the expenses that you paid over the period. Simply divide your account value by $1,000 (for example, an $8,600 account value divided by $1,000 = 8.6), then multiply the result by the number in the row entitled “Expenses Paid During Period” to estimate the expenses you paid on your account durin g this period.
Hypothetical Example for Comparison Purposes
The information in the table under the heading “Hypothetical Performance (5% return before expenses)” provides information about hypothetical account values and hypothetical expenses based on the Fund’s actual expense ratios and assumed rates of return of 5% per year before expenses, which are not the Fund’s actual returns. The hypothetical account values and expenses may not be used to estimate the actual ending account balance or expenses you paid for the period. You may use this information to compare the ongoing costs of investing in the Fund and other funds. To do so, compare this 5% hypothetical example with the 5% hypothetical examples that appear in the shareholder reports of the other funds.
Please note that the expenses shown in the table are meant to highlight your ongoing costs only and do not reflect any transaction costs, such as redemption fees. Therefore, the information under the heading “Hypothetical Performance (5% return before expenses)” is useful in comparing ongoing costs only, and will not help you determine the relative total costs of owning different funds. In addition, if these transactional costs were included, your costs would have been higher.
| EXPENSE EXAMPLE | ACTUAL PERFORMANCE | HYPOTHETICAL PERFORMANCE (5% RETURN BEFORE EXPENSES) |
| Beginning Account Value (12/31/07) | |||||||
| $ | 1,000.00 | $ | 1,000.00 | ||||
| Ending Account Value(6/30/08) | $ | 904.00 | $ | 1,019.94 | |||
Expenses Paid During Period1 | $ | 4.69 | $ | 4.97 | |||
1 Expenses are equal to the Fund’s annualized expense ratio 0.99% multiplied by the average account value over the period, multiplied by 182/366 (to reflect the one-half year period). | |||||||
11
MATRIX ADVISORS
VALUE FUND, INC.
| SECTOR BREAKDOWN | ||
| Consumer Durables | 16.2% | |
| Consumer Non-durables | 5.6% | |
| Energy | 14.6% | |
| Finance | 13.1% | |
| Industrial | 12.1% | |
| Medical | 10.8% | |
| Technology | 26.4% | |
| 98.8% | ||
| Cash | 1.2% | |
| Total Investments | 100.0% | |
| The table above lists sector allocations as a percentage of the Fund’s total investments as of June 30, 2008. | ||
12
MATRIX ADVISORS
VALUE FUND, INC.
| Schedule of Investments | |||||||
| June 30, 2008 | |||||||
| SHARES | VALUE | ||||||
| COMMON STOCKS – 99.4% | |||||||
| ADVERTISING: 0.8% | |||||||
| 20,500 | Omnicom Group, Inc. | $ | 920,040 | ||||
| BANK (MONEY CENTER): 3.4% | |||||||
| 79,000 | Citigroup, Inc. | 1,324,040 | |||||
| 83,000 | J.P. Morgan Chase& Co. | 2,847,730 | |||||
| 4,171,770 | |||||||
| BANK (SUPER REGIONAL): 2.1% | |||||||
| 105,784 | Bank of America Corp | 2,525,064 | |||||
| BIOTECHNOLOGY: 1.0% | |||||||
| 26,500 | Amgen, Inc.* | 1,249,740 | |||||
| CABLE TELEVISION: 3.2% | |||||||
| 207,000 | Comcast Corp. | 3,883,320 | |||||
| COMPUTERS AND PERIPHERALS: 4.0% | |||||||
| 221,000 | Dell, Inc.* . . | 4,835,480 | |||||
| COMPUTER SOFTWARE AND SERVICES: 4.9% | |||||||
| 158,000 | Microsoft Corp. | 4,346,580 | |||||
| 83,000 | Symantec Corp.* | 1,606,050 | |||||
| 5,952,630 | |||||||
| DIVERSIFIED OPERATIONS: 9.2% | |||||||
| 51,000 | 3M Co. | 3,549,090 | |||||
| 138,000 | General Electric Co. | 3,683,220 | |||||
| 98,500 | Tyco International Ltd. | 3,943,940 | |||||
| 11,176,250 | |||||||
| DRUG: 5.8% | |||||||
| 62,400 | Bristol-Myers Squibb Co. | 1,281,072 | |||||
| 56,200 | Pfizer, Inc. | 981,814 | |||||
| 99,300 | Wyeth | 4,762,428 | |||||
| 7,025,314 | |||||||
| DRUG STORE: 1.5% | |||||||
| 57,300 | Walgreen Co. | 1,862,823 | |||||
| The accompanying notes to financial statements are an integral part of this schedule. | |||||||
13
MATRIX ADVISORS
VALUE FUND, INC.
| Schedule of Investments | |||||||
| June 30, 2008 – Continued | |||||||
| SHARES | VALUE | ||||||
| ELECTRONIC COMPONENTS: 2.0% | |||||||
| 69,575 | Tyco Electronics Ltd. | $ | 2,492,176 | ||||
| FINANCIAL SERVICES: 3.6% | |||||||
| 178,500 | Western UnionCo. | 4,412,520 | |||||
| HOTEL/GAMING/CRUISE LINES: 0.7% | |||||||
| 26,000 | Carnival Corp. | 856,960 | |||||
| HUMAN RESOURCES: 3.0% | |||||||
| 177,000 | Monster Worldwide, Inc.* | 3,647,970 | |||||
| HYPERMARKETS& SUPERCENTERS: 4.1% | |||||||
| 89,700 | Wal-Mart Stores, Inc. | 5,041,140 | |||||
| INSURANCE (DIVERSIFIED): 1.9% | |||||||
| 89,000 | American International Group, Inc. | 2,354,940 | |||||
| INTERNET: 0.1% | |||||||
| 5,000 | Yahoo!, Inc.* | 103,848 | |||||
| MEDICAL SUPPLIES: 4.0% | |||||||
| 103,000 | Covidien Ltd. | 4,932,670 | |||||
| MULTIMEDIA: 3.5% | |||||||
| 289,000 | Time Warner, Inc. | 4,277,200 | |||||
| OIL/GAS (DOMESTIC): 4.4% | |||||||
| 45,000 | Devon Energy Corp. | 5,407,200 | |||||
| PETROLEUM (INTEGRATED): 9.6% | |||||||
| 57,700 | ChevronTexaco Corp. | 5,719,801 | |||||
| 63,800 | ConocoPhillips | 6,022,082 | |||||
| 11,741,883 | |||||||
| PETROLEUM (REFINING): 0.7% | |||||||
| 19,500 | Valero Energy Corp. | 803,010 | |||||
| PRINTING/PUBLISHING: 3.6% | |||||||
| 110,200 | The McGraw-Hill Companies, Inc. | 4,421,224 | |||||
| The accompanying notes to financial statements are an integral part of this schedule. | |||||||
14
MATRIX ADVISORS
VALUE FUND, INC.
| Schedule of Investments | |||||||
| June 30, 2008 – Continued | |||||||
| SHARES | VALUE | ||||||
| RETAIL (SPECIAL LINES): 4.6% | |||||||
| 151,000 | Office Depot, Inc.* | $ | 1,651,940 | ||||
| 165,000 | Staples, Inc. | 3,918,750 | |||||
| 5,570,690 | |||||||
| SECURITIES BROKERAGE: 5.7 % | |||||||
| 89,000 | Merrill Lynch & Co., Inc. | 2,822,190 | |||||
| 115,500 | Morgan Stanley | 4,166,085 | |||||
| 6,988,275 | |||||||
| SEMICONDUCTOR: 5.4% | |||||||
| 115,500 | Analog Devices,Inc. | 3,669,435 | |||||
| 138,000 | Intel Corp. | 2,964,240 | |||||
| 6,633,675 | |||||||
| SEMICONDUCTOR (CAPITAL EQUIPMENT): 3.3% | |||||||
| 191,000 | Novellus Systems, Inc.* | 4,047,290 | |||||
| TELECOMMUNICATIONS (EQUIPMENT): 3.3% | |||||||
| 173,000 | Cisco Syste ms, Inc.* | 4,023,980 | |||||
TOTAL COMMON STOCKS (Cost$116,850,015) | 121,359,082 | ||||||
| INVESTMENTS: 1.2% | |||||||
| 1,487,095 | Fidelity Institutional Money Market Portfolio | 1,487,095 | |||||
| TOTAL SHORT TERM INVESTMENTS (Cost $1,487,095) | 1,487,095 | ||||||
TOTAL INVESTMENTS (Cost $118,337,110): 100.6% | 122,846,177 | ||||||
LIABILITIES IN EXCESS OF OTHER ASSETS: (0.6%) | (748,843 | ) | |||||
TOTAL NET ASSETS: 100.0% | $ | 122,097,334 | |||||
| * Non-Income Producing. | |||||||
The accompanying notes to financial statements are an integral part of this schedule. | |||||||
15
MATRIX ADVISORS
VALUE FUND, INC.
| Statement of Assets and Liabilities | ||||
| At June 30, 2008 | ||||
| ASSETS | ||||
| Investments in securities, at value (cost $118,337,110) | $ | 122,846,177 | ||
| Receivables: | ||||
| Securiteis sold | 2,123,526 | |||
| Fund shares sold | 98,761 | |||
| Dividends and interest | 62,070 | |||
| Prepaid expenses and other assets | 14,005 | |||
| Total assets | 125,144,539 | |||
| LIABILITIES | ||||
| Payable to Advisor | 92,288 | |||
| Payable for investments purchased | 2,532,259 | |||
| Payable for Fund shares repurchased | 335,945 | |||
| Accrued expenses and other liabilities | 86,713 | |||
| Total liabilities | 3,047,205 | |||
| NET ASSETS | $ | 122,097,334 | ||
| Number of shares, $0.01 par value, issued | ||||
| and outstanding (unlimited shares authorized) | 2,765,991 | |||
| Net Asset Value, Offering Price and Redemption Price Per Share | $ | 44.14 | ||
| COMPOSITION OF NET ASSETS | ||||
| Paid -in capital | $ | 122,007,815 | ||
| Undistributed net investment income | 705,874 | |||
| Accumulated net realized gain (loss) on investments | (5,125,422) | |||
| Net unrealized appreciation on investments | 4,509,067 | |||
| NET ASSETS | $ | 122,097,334 | ||
The accompanying notes to financial statements are an integral part of this schedule.
16
MATRIX ADVISORS
VALUE FUND, INC.
| Statement of Operations | ||||||||
| For the Year Ended June 30, 2008 | ||||||||
| INVESTMENT INCOME | ||||||||
| INCOME | ||||||||
| Dividend income (Net of foreign tax withheld of $5,213) | $ | 3,107,771 | ||||||
| Interest income | 71,012 | |||||||
| Total income | 3,178,783 | |||||||
| EXPENSES | ||||||||
| Advisory fees | 1,669,612 | |||||||
| Administration fees | 216,929 | |||||||
| Shareholder servicing fees and accounting fees | 109,248 | |||||||
| Professional fees | 36,385 | |||||||
| Chief Compliance Officer fees | 49,442 | |||||||
| Custodian fees | 35,468 | |||||||
| Reports to shareholders | 32,961 | |||||||
| Federal and State registration fees | 30,376 | |||||||
| Directors fees and expenses | 19,688 | |||||||
| Other expenses | 8,782 | |||||||
| Total operating expenses . | 2,208,891 | |||||||
| Less: Expense reimbursement by Advisor | (565,879 | ) | ||||||
| Net operating expenses | 1,643,012 | |||||||
| Interest Expense | 9,878 | |||||||
| Net expenses | 1,652,890 | |||||||
| Net investment income | 1,525,893 | |||||||
| REALIZED AND UNREALIZED GAIN ON INVESTMENTS | ||||||||
| Net realized gain from security transactions | 1,027,273 | |||||||
| Net change in unrealized appreciation (depreciation) on investments | (34,055,448 | ) | ||||||
| Net realized and unrealiz ed gain on investments | (33,028,175 | ) | ||||||
| Net decrease in net assets resulting from operations | $ | (31,502,282 | ) | |||||
The accompanying notes to financial statements are an integral part of this schedule.
17
MATRIX ADVISORS
VALUE FUND, INC.
| Statement of Changes in Net Assets | YEAR ENDED JUNE 30, 2008 | YEAR ENDED JUNE 30, 2007 | ||||||
| INCREASE (DECREASE) IN NET ASSETS | ||||||||
| OPERATIONS: | ||||||||
| Net investment income | $ | 1,525,893 | $ | 1,260,058 | ||||
| Net realized gain on investments | 1,027,273 | 26,707,040 | ||||||
| Net change in unrealized appreciation (depreciation) of investments | (34,055,448 | ) | 19,917,320 | |||||
| Net increase in net assets resulting from operations | (31,502,282 | ) | 47,884,418 | |||||
| DISTRIBUTIONS TO SHAREHOLDERS | ||||||||
| Net investment income | (1,569,759 | ) | (1,553,193 | ) | ||||
| Realized gain on investments | (32,230,798 | ) | (10,061,360 | ) | ||||
Total distributions to shareholders . | (33,800,557 | ) | (11,614,553 | ) | ||||
| CAPITAL SHARE TRANSACTIONS: | ||||||||
| Proceeds from shares sold | 28,191,961 | 78,583,712 | ||||||
| Proceeds from reinvestment of distribution | ||||||||
| Cost of shares redeemed | (103,978,738 | ) | (56,188,748 | ) | ||||
| Redemption fees | 15,432 | 10,250 | ||||||
| Net increase (decrease) from capital share transactions | (42,837,025 | ) | 33,445,659 | |||||
| Total increase (decrease) in net assets | (108,139,864 | ) | 69,715,524 | |||||
| NET ASSETS | ||||||||
| Beginning of year | 230,237,198 | 160,521,674 | ||||||
| End of year (includes Undistributed net investment income | ||||||||
| of $705,874 and $750,064, respectively) | $ | 122,097,334 | $ | 230,237,198 | ||||
| CHANGE IN SHARES | ||||||||
Shares outstanding, beginning of year . | 3,622,534 | 3,093,445 | ||||||
| Shares sold | 526,221 | 1,308,770 | ||||||
| Shares issued on reinvestment of distributions | 612,178 | 199,035 | ||||||
| Shares redeemed | (1,994,942 | ) | (978,716 | ) | ||||
| Shares outstanding, end of year | 2,765,991 | 3,622,534 | ||||||
The accompanying notes to financial statements are an integral part of this schedule.
18
MATRIX ADVISORS
VALUE FUND, INC.
| Financial Highlights | ||||||||||||||||||||
| For a capital share outstanding throughout each year | ||||||||||||||||||||
| YEARS ENDED JUNE 30, | ||||||||||||||||||||
| 2008 | 2007 | 2006 | 2005 | 2004 | ||||||||||||||||
| Net asset value, beginning of year | $ | 63.56 | $ | 51.89 | $ | 51.94 | $ | 54.02 | $ | 44.39 | ||||||||||
| Income from investment operations: | ||||||||||||||||||||
| Net investment income | 0.53 | 0.36 | 0.43 | 0.54 | 0.18 | (c) | ||||||||||||||
| Net realized and unrealized | ||||||||||||||||||||
| gain (loss) on investments | (9.77 | ) | 14.96 | 1.69 | (1.39 | ) | 9.65 | (c) | ||||||||||||
| Total from investment operations | (9.24 | ) | 15.32 | 2.12 | (0.85 | ) | 9.83 | |||||||||||||
| Less distributions: | ||||||||||||||||||||
| Dividends from net investment income | (0.48 | ) | (0.49 | ) | (0.35 | ) | (0.42 | ) | (0.21 | ) | ||||||||||
| Distributions from realized gains | (9.70 | ) | (3.16 | ) | (1.82 | ) | (0.81 | ) | 0.00 | |||||||||||
| Total distributions | (10.18 | ) | (3.65 | ) | (2.17 | ) | (1.23 | ) | (0.21 | ) | ||||||||||
| Paid-in capital from redemption Fees (Note 2) | — | (a) | — | (a) | — | (a) | — | (a) | 0.01 | |||||||||||
| Net asset value, end of year | $ | 44.14 | $ | 63.56 | $ | 51.89 | $ | 51.94 | $ | 54.02 | ||||||||||
| Total return | (16.98 | %) | 30.54 | % | 4.09 | % | (1.61 | %) | 22.21 | % | ||||||||||
| Ratios/supplemental data: | ||||||||||||||||||||
| Net assets, end of period (millions) | $ | 122.1 | $ | 230.2 | $ | 160.5 | $ | 240.4 | $ | 315.9 | ||||||||||
| Ratio of operating expenses To average net assets: | ||||||||||||||||||||
| Before expense reimbursement | 1.33 | % | 1.30 | % | 1.32 | % | 1.29 | % | 1.26 | % | ||||||||||
| After expense reimbursement | 0.99 | % | 0.99 | % | 0.99 | % | 0.99 | % | 0.99 | % | ||||||||||
| Interest Expense | 0.01 | % | 0.00 | %(b) | — | — | — | |||||||||||||
| Ratio of net investment income | ||||||||||||||||||||
| to average net assets: | ||||||||||||||||||||
| Before expense reimbursement | 0.58 | % | 0.37 | % | 0.27 | % | 0.69 | % | 0.24 | % | ||||||||||
| After expense reimbursement | 0.92 | % | 0.68 | % | 0.60 | % | 0.99 | % | 0.51 | % | ||||||||||
| Portfolio turnover rate | 43 | % | 52 | % | 28 | % | 18 | % | 17 | % | ||||||||||
| (a) less than 0.01. | |||||||||
| (b) Interest expense was less than 0.01% | |||||||||
(c) Numbers have been r e stated from $0.94 to $0.18 and from $8.89 to $9.65, respectively. This has no impact on the Fund’s net assets, net asset value or total return. | |||||||||
The accompanying notes to financial statements are an integral part of this schedule.
19
MATRIX ADVISORS
VALUE FUND, INC.
Notes to the Financial Statements
NOTE 1 – ORGANIZATION
Matrix Advisors Value Fund, Inc. (the “Fund”) is a Maryland corporation registered under the Investment Company Act of 1940 (the “1940 Act”) as a diversified, open-end management investment company. The Fund commenced operations September 16, 1983. The objective of the Fund is to achieve a total rate of return composed of capital appreciation and current income.
NOTE 2 – SIGNIFICANT ACCOUNTING POLICIES
The Fund consistently follows the accounting policies set forth below which are in conformity with accounting principles generally accepted in the United States of America.
A. Security Valuation.
Securities traded on a national securities exchange are valued at the last reported sales price at the close of regular trading on each day the exchanges are open for trading. Securities listed on the NASDAQ Global Market and the NASDAQ Global Select Market and the NASDAQ Capital Market are valued using the NASDAQ Official Closing Price, which may not necessarily represent the last sale price. Quotations of foreign securities in a foreign currency shall be valued daily in U.S. dollars on the basis of the foreign currency exchange rates prevailing at the time such valuation is determined. Foreign currency exchange rate s generally shall be determined prior to the close of the New York Stock Exchange (the “NYSE”). Securities traded on an exchange for which there have been no sales are valued at the mean between the bid and asked price. Securities for which quotations are not readily available are stated at their respective fair values as determined in good faith by a valuation committee of the Investment Advisor in accordance with procedures approved by the Board of Directors of the Fund. In determining fair value, the Fund takes into account all relevant factors and available information. Consequently, the price of the security used by the Fund to calculate its NAV may differ from quoted or published prices for the same security. Fair value pricing involves subjective judgments and there is no single standard for determining a security’s fair value. As a result, different mutual funds could reasonably arrive at a different fair value for the same security. It is possible that the fair value determined for a security is materially different from the value that could be realized upon the sale of that security or from the values that other mutual funds may determine. Investments in other funds are valued at their respective net asset values as determined by those funds, in accordance with the Investment Company Act of 1940.
Foreign securities are recorded in the financial statements after translation to U.S. dollars based on the applicable exchange rate at the end of the period. The Fund does not isolate that portion of the results of operations arising as a result of changes in the currency exchange rate from the fluctuations arising as a result of changes in the market prices of investments during the period.
20
MATRIX ADVISORS
VALUE FUND, INC.
Notes to the Financial Statements Continued
B. Shares Valuation.
The net asset value ( “ NAV”) per share of the Fund is calculated by dividing the sum of the value of the securities held by the Fund, plus cash or other assets, minus all liabilities (including estimated accrued expenses) by the total number of shares outstanding of the Fund, rounded to the nearest cent. The Fund’s shares will not be priced on the days on which the NYSE is closed for trading. The offering and redemption price per share of the Fund is equal to the Fund’s net asset value per share. The Fund will asses a 1.00% fee on redemption of Fund shares purchased and held for 60 days or less. These fees are deducted from the redemption proceeds otherwise payable to the shareholder. The Fund will retain the fee charged as paid-in capital and such fees become part of that Fund’s daily NAV calculation.
C. Federal Income Taxes.
The Fund has elected to be treated as a “regulated investment company” under Subchapter M of the Internal Revenue Code. The Fund intends to distribute substantially all of its taxable income and any capital gains less any applicable capital loss carryforwards. Accordingly, no provision for Federal income taxes has been made in the accompanying financial statements.
D. Use of Estimates.
The preparation of financial statements in conformity with accounting principles generally accepted in the United States of America requires management to make estimates and assumptions that affect the reported amounts of assets and liabilities and disclosure of contingent assets and liabilities at the date of the financial statements and the reported amounts of revenues and expenses during the reporting period. Actual results could differ from these estimates.
E. Reclassification of Capital Accounts .
Accounting principles generally accepted in the United States of America require that certain components of net assets relating to permanent differences be reclassified between financial and tax reporting. These reclassifications have no effect on net asets or net asset value per share. For the year ended June 30, 2008, the Fund reclassified $324 from undistributed net investment income to accumulated gains or losses.
F. Security Transactions, Investment Income, and Distributions.
Security transactions are accounted for on the trade date. Dividend income and distributions to shareholders are recorded on the ex-dividend date, and interest income is recognized on the accrual basis. Realized gains and losses are evaluated on the basis of identified costs. Premiums and discounts on the purchase of securities are amortized/accreted using the effective interest method. Accounting principles generally accepted in the United States of America require that permanent financial reporting and tax differences be reclassified in the capital accounts.
21
MATRIX ADVISORS
VALUE FUND, INC.
Notes to the Financial Statements Continued
G. Indemnificati on Obligations.
Under the Fund’s organizational documents, its current and former Officers and Directors are indemnified against certain liabilities arising out of the performance of their duties to the Fund. In addition, in the normal course of business, the Fund enters into contracts that contain a variety of representations and warranties that provide general indemnifications. The Fund’s maximum exposure under these arrangements is unknown as this would involve future claims that may be made against the Fund that has not yet occurred or that would be covered by other parties.
H. Line of Credit.
The Fund has a Loan Agreement with U.S. Bank N.A. Under the terms of the Loan Agreement, the Fund’s borrowings cannot exceed the lesser of $15,000,000 or 33 1/3% of the net assets of the Fund. The interest rate paid on the Loan equals the prime rate per annum, payable monthly.
Borrowing activity under the Loan Agreement for the year ended June 30, 2008, was as follows:
Maximum Amount Outstanding | Interest Expense | Amount Outstanding at June 30, 2008 | Average Amount Outstanding | Average Interest Rate |
| $6,826,000 | $9,878 | $0 | $173,127 | 5.71% |
NOTE 3 – INVESTMENT ADVISORY AND OTHER AGREEMENTS
The Fund has a management agreement with Matrix Asset Advisors, Inc. (the “Advisor”, “Matrix”) to serve as investment advisor. Certain Officers of the Advisor are also Officers of the Fund. Under the terms of the agreement, the Fund has agreed to pay the Advisor as compensation for all services rendered, staff and facilities provided and expenses paid or assumed, an annual fee, accrued daily, paid monthly, of 1.00% of the Fund’s average daily net assets.
The Advisor has contractually agreed to reduce its fees and/or pay expenses of the Fund to ensure that the Fund’s total annual operating expenses (excluding interest and tax expenses) will not exceed 1.10% of the Fund’s average daily net assets. For the year ended June 30, 2008, the Advisor voluntarily reimbursed the Fund for expenses in excess of 0.99%. Matrix voluntarily waived $565,879. Any reduction in advisory fees or payment of expenses made by the Advisor may be reimbursed by the Fund if the Advisor requests in subsequent fiscal years. This reimbursement may be requested if the aggregate amount actually paid by the Fund toward operating expenses for such fiscal year (taking into account the reimbursement) does not exceed the applicable limitation on Fund expenses. The Advisor is permitted to be reimbursed for fee reductions and/or expense payments made in the prior three fiscal years. Any such reimbursement will be reviewed by the Directors. The Fund must pay its current ordinary operating expenses before the Advisor is entitled to any reimbursement of fees and/or expenses.
22
MATRIX ADVISORS
VALUE FUND, INC.
Notes to the Financial Statements Conti nued
At June 30, 2008, the cumulative amount available for reimbursement that has been paid and/or waived is $1,797,619. Currently, the Advisor has agreed not to seek reimbursement of such fee reductions and/or expense payments. The advisor may recapture a portion of this amount no later than the dates stated below:
J u ne 30, | ||
| 2009 | 2010 | 2011 |
| $649,605 | $582,135 | $565,879 |
U.S . Bancorp Fund Services, LLC (the “Administrator”) acts as the Fund’s Administrator under an Administration Agreement. The Administrator prepares various federal and state regulatory filings, reports and returns for the Fund; prepares reports and materials to be supplied to the Directors; monitors the activities of the Fund’s custodian, transfer agent and accountants; coordinates the preparation and payment of Fund expenses and reviews the Fund’s expense accruals. For the year ended June 30, 2008, U.S. Bancorp Fund Services, LLC was paid $216,929, in its capacity as Fund Administrator. U.S. Bancorp Fund Services, LLC also serves as the Fund Accountant and Transfer Agent. U.S . Bank, N.A. serves as the Fund’s Custodian. Quasar Distributors , LLC, an affiliate of U.S. Bancorp Fund Services, LLC and U.S. Bank, N.A. serves as the Fund’s principal underwriter.
An employee of U.S. Bancorp Fund Services, LLC serves as the Fund’s Chief Compliance Officer. The Chief Compliance Officer receives no compensation from the Fund for his services; however, the Administrator was paid $49,442 for year ended June 30, 2008 for the services of the CCO.
NOTE 4 – INVESTMENT TRANSACTIONS
The cost of purchases and the proceeds from sales of securities, other than short-term obligations and U.S. Government securities, for the year ended June 30, 2008, are as follows:
| Purchases | Sales | |
| Common Stock | $70,943,500 | $139,562,988 |
NOTE 5 – DISTRIBUTIONS TO SHAREHOLDERS
As of June 30, 2008, the components of distributable earnings on a tax basis were as follows:
| Cost of investments for tax purposes | $ | 118,341,329 | ||
| Gross tax unrealized appreciation | 13,353,087 | |||
| Gross tax unrealized depreciation | (8,848,239 | ) | ||
| Net tax unrealized appreciation on investments | $ | 4,504,848 | ||
| Undistributed ordinary income | $ | 705,874 | ||
| Undistributed long-term capital gains | 5,425 | |||
| Total Distributable Earnings | $ | 711,299 | ||
| Other accumulated losses | $ | (5,126,628 | ) | |
| Total Accumulated Earnings/Losses | $ | 89,519 |
23
MATRIX ADVISORS
VALUE FUND, INC.
Notes to the Financial Statements Continued
The difference between book basis and tax basis unrealized appreciation on investments is wash sale deferrals.
Under current tax law, capital losses realized after October 31 may be deferred and treated as occuring on the first day of the following fiscal year. At June 30, 2008, Matrix Advisors Value Fund, Inc. deferred, on a tax basis, $5,126,628 of Post-October Losses.
The tax character of distributions paid during the fiscal years ended June 30, 2008 and June 30, 2007 were as follows:
| June 30, 2008 | June 30, 2007 | |||||||
| Distributions Paid From: | ||||||||
| Ordinary Income* | $ | 7,902,169 | $ | 1,693,929 | ||||
| Long-Term Capital Gain | $ | 25,898,388 | $ | 9,920,624 | ||||
| $ | 33,800,557 | $ | 11,614,553 | |||||
| * | For tax purposes, short-term capital gains are considered ordinary income. |
NOTE 6 – ACCOUNTING PRONOUNCEMENTS
In September, 2006, the Financial Accounting Standards Board (FASB) issued Statement of Financial Accounting Standards (“SFAS”) No. 157, “Fair Value Measurements” , which will expand the disclosure requirements for fair value measurements. The new standard defines fair value as the price that would be received upon the sale of an asset or transfer of a liability in an orderly transaction between market participants. As a basis for considering market participant assumptions in fair value measurements, this Statement also establishes a fair value hierarchy that distinguishes between (1) market participant assumptions developed based on market data obtained from sources independent of the reporting entity (observable inputs) and (2) the reporting entity’s own assumptions about market participant assumptions developed based on the best information available in the circumstances (unobservable inputs). SFAS 157 is effective for financial statements issued for fiscal years beginning after November 15, 2007 and earlier adoption is permitted. Management is currently evaluating the impact of adoption of SFAS No. 157 on its financial statements.
On July 13, 2006, the Financial Accounting Standards Board (FASB) released FASB Interpretation No. 48 “Accounting for Uncertainty in Income Taxes” (“FIN 48”). FIN 48 provides guidance for how uncertain tax positions should be recognized, measured, presented and disclosed in the financial statements. FIN 48 requires the evaluation of tax positions taken or expected to be taken in the course of preparing the Funds’ tax returns to determine whether the tax positions are “more-likely-than-not” of being sustained by the applicable tax authority. Tax positions not deemed to meet the more-likely-than-not threshold would be recorded as a tax benefit or expense in the current year. Adoption of FIN 48 is required as of the date of the last Net Asset Value “ ( NAV”)
24
MATRIX ADVISORS
VALUE FUND, INC.
Notes to the Financial Statements Continued
calculation in the first required financial statement reporting period for fiscal years beginning after December 15, 2006 and is to be applied to all open tax years as of the effective date. The Fund has adopted FIN 48 effective December 31, 2007. Management of the Funds has reviewed the tax positions for the open tax years ending June 30, 2005 through 2008 and has determined that the implementation of FIN 48 did not have a material impact on the Fund’s financial statements.
In March 2008, Statement of Financial Accounting Standards No. 161, “Disclosures about Derivative Instruments and Hedging Activities” (“SFAS 161”) was issued and is effective for fiscal years beginning after November 15, 2008. SFAS 161 is intended to improve financial reporting for derivative instruments by requiring enhanced disclosure that enables investors to understand how and why an entity uses derivatives, how derivatives are accounted for, and how derivative instruments affect an entity’s results of operation and financial position. Management is currently evaluating the implications of SFAS 161. The impact on the Fund’s financial statement disclosures, if any, is currently being assessed.
25
MATRIX ADVISORS
VALUE FUND, INC.
REPORT OF INDEPENDENT REGISTERED PUBLIC ACCOUNTING FIRM
To the Board of Directors and
Shareholders of Matrix Advisors Value Fund, Inc. New York, New York
We have audited the accompanying statement of assets and liabilities, including the schedule of investments, of Matrix Advisors Value Fund, Inc. as of June 30, 2008 and the related statement of operations for the year then ended, the statement of changes in net assets for each of the two years in the period then ended and the financial highlights for each of the five years in the period then ended. These financial statements and financial highlights are the responsibility of the Fund’s management. Our responsibility is to express an opinion on these financial statements and financial highlights based on our audits.
We conducted our audits in accordance with the standards of the Public Company Accounting Oversight Board (United States). Those standards require that we plan and perform the audit to obtain reasonable assurance about whether the financial statements and financial highlights are free of material misstatement. The Fund is not required to have, nor were we engaged to perform, an audit of its internal control over financial reporting. Our audits included consideration of internal control over financial reporting as a basis for designing audit procedures that are appropriate in the circumstances, but not for the purpose of expressing an opinion on the effectiveness of the Fund’s internal control over financial reporting. Accordingly, we express no such opinion. An audit includes examining, on a test basis, evidence supporting the amounts and disclosures in the financial statements and financial highlights assessing the accounting principles used and significant estimates made by management, as well as evaluating the overall financial statement presentation. Our procedures included confirmation of securities owned as of June 30, 2008, by correspondence with the custodian and brokers, or by other appropriate auditing procedures where replies from brokers were not received. We believe that our audit provides a reasonable basis for our opinion.
In our opinion, the financial statements and financial highlights referred to above present fairly, in all material respects, the financial position of Matrix Advisors Value Fund, Inc. as of June 30, 2008, the results of its operations for the year then ended, the changes in its net assets for each of the two years in the period then ended and the financial highlights for each of the five years in the period then ended in conformity with auditing standards generally accepted in the United States of America.
TAIT WELLER & BAKER LLP
Philadelphia, Pennsylvania August 25, 2008
MATRIX ADVISORS
VALUE FUND, INC.
Additional Information (Unaudited)
PROXY VOTING INFORMATION
��
The Advisor votes proxies relating to portfolio securities in accordance with procedures that have been approved by the Board of Directors of the Fund. You may obtain a description of these procedures and how the Fund voted proxies relating to the portfolio securities during the most recent 12-month period ended June 30, free of charge, by calling toll-free 1-800-366-6223. This information is also available through the Securities and Exchange Commission’s (SEC) website at http:/ /www.sec.gov.
FORM N-Q DISCLOSURE
The Fund files its complete schedule of portfolio holdings with the Securities and Exchange Commission for the first and third quarters of each fiscal year on Form N-Q. The Fund’s Form N-Q is available on the Securities and Exchange Commisison’s website at http://www.sec.gov. The Fund’s Form N-Q may be reviewed and copied at the Commission’s Public Reference Room in Washington, DC, and information on the operation of the Public Reference Room may be obtained by calling 1-800-SEC-0330. This information is also available, without charge, by calling toll-free, 1-800-366-6223.
| TAX NOTICE (UNAUDITED) |
The percentage of dividend income distributed for the year ended June 30, 2008, which is designated as qualified dividend income under the Jobs and Growth Tax Relief Reconciliation Act of 2003, is 64.60%. |
The percentage of dividend income distributed for the year ended June 30, 2008 designated as qualified dividends received deduction available to corporate shareholders, is 60.40%. |
| Additoinal Information Applicable to Foreign Shareholders only: |
The fund designated as long-term capital gain dividend, pursuant to Internal Revenue Code Section 852(b)(3). |
The Fund hereby designates 3.10% of its ordinary income distributions for the fiscal year as interest-related dividends under Internal Revenue Code Section 871(k)(1)(c). |
The percentage of ordinary income distributions that are designated as short-term capital gain distributions under Internal Revenue Code Section 871(k)(2)(c) for the Fund was 80.10%. |
27
MATRIX ADVISORS
VALUE FUND, INC.
Additional Information (Unaudited), Continued
DIRECTOR AND OFFICER INFORMATION
The Board of Directors is responsible for the overall management of the Fund’s business. The Board approves all significant agreements between the Fund and persons or companies furnishing services to it , including the agreements with the Advisor, Administrator, Custodian and Transfer Agent. The Board of Directors delegates the day-to-day operations of the Fund to its Officers, subject to the Fund’s investment objective and policies and to general supervision by the Board. The Statement of Additional Information includes additional information about the Fund’s Directors and is available, without charge, by calling 1-800-366-6223.
The Directors and Officers of the Fund, their business addresses and principal occupations during the past five years are:
| Number | |||||
| of Portfolios | |||||
| Principal | In Fund | Other | |||
| Name, | Position(s) | Occupation(s) | Complex | Directorships | |
| Address, | Held with | Date | During the | Overseen | Held by |
| and Yearof Birth | the Fund | Elected† | Past 5 Years | by Director | Director |
| David A. Katz, CFA | Director; | Since | Chief Investment Officer | 1 | None |
| 747 Third Avenue | President, | 1997 | (1986 to present) and | ||
| New York, NY 10017 | and Treasurer | President (1990 to present) | |||
| (Born 1962) | of Matrix Asset Advisors, the | ||||
| Fund’s Advisor, and portfolio | |||||
| Manager of the Fund (1996 | |||||
| to present). | |||||
| Robert M. Rosencrans * | Director | Since | Retired; formerly , President of | 1 | None |
| 747 Third Avenue | 1985 | Columbia International, Inc. | |||
| New York, NY 10017 | (cable television developer and | ||||
| (Born 1927) | operator) ( 1984 to 2005). | ||||
| T. Michael Tucker * | Director | Since | Consultant, Carr Riggs & | 1 | None |
| 747 Third Avenue | 1997 | Ingram, LLP ( 2005 to | |||
| New York, NY 10017 | present); formerly , Owner of | ||||
| (Born 1942) | T. Michael Tucker, a certified | ||||
| Public accounting firm (1977 | |||||
| to 2005). | |||||
| Larry D. Kieszek * | Director and | Since | Partner of Purvis, Gray & | 1 | None |
| 747 Third Avenue | Chairman | 1997 | Company, a certified public | ||
| New York, NY 10017 | accounting firm (1974 to | ||||
| (Born 1950) | present). |
28
MATRIX ADVISORS
VALUE FUND, INC.
Additional Information (Unaudited), Continued | |||||
| Number | |||||
| of Portfolios | |||||
| Principal | In Fund | Other | |||
| Name, | Position(s) | Occupation(s) | Complex | Directorships | |
| Address, | Held with | Date | During the | Overseen | Held by |
| and Year of Birth | the Fund | Elected† | Past 5 Years | by Director | Director |
| Douglas S.Altabef | Executive | Since | Senior Managing Director | N/A | N/A |
| 747 Third Avenue | Vice | 2000 | of Matrix Asset Advisors, | ||
| New York, NY 10017 | President and | the Fund’s Advisor (1996 to | |||
| (Born 1951) | Secretary | present). | |||
| Steven G. Roukis, CFA | Senior Vice | Since | Managing Director of Matrix | N/A | N/A |
| 747 Third Avenue | President | 2000 | Asset Advisors, the Fund’s | ||
| New York, NY 10017 | Advisor (2005 to present); | ||||
| (Born 1967) | formerly, Director of | ||||
| Research, Senior Vice | |||||
| President-Equity Research | |||||
| of Matrix Asset Advisors and | |||||
| various other positions with in | |||||
| research (1994 – 2005). | |||||
| Jordan F. Posner | Senior Vice | Since | Managing Director of Matrix | N/A | N/A |
| 747 Third Avenue | President | 2006 | Asset Advisors, the Fund’s | ||
| New York , NY 10017 | Advisor ( 2005 to present) ; | ||||
| (Born 1957) | formerly , Partner of David J. | ||||
| Greene & Co., an investment | |||||
| firm (1993 – 2005). | |||||
| Lon F. Birnholz | Senior Vice | Since | Managing Director of Matrix | N/A | N/A |
| 747 Third Avenue | President | 2006 | Asset Advisors , the Fund’s | ||
| New York , NY 10017 | Advisor (1999 to present) . | ||||
| (Born 1960) | |||||
| Conall Duffin | Assistant Vice | Since | Marketing Associate, Matrix | N/A | N/A |
| 747 Third Avenue | President and | 2002 | Asset Advisors , the Fund’s | ||
| New York , NY 10017 | Assistant | Advisor (2001 to present) . | |||
| (Born 1975) | Secretary | ||||
29
MATRIX ADVISORS
VALUE FUND, INC.
Additional Information (Unaudited), Continued | |||||
| Number | |||||
| of Portfolios | |||||
| Principal | In Fund | Other | |||
| Name, | Position(s) | Occupation(s) | Complex | Directorships | |
| Address, | Held with | Date | During the | Overseen | Held by |
| And Year of Birth | the Fund | Elected† | Past 5 Years | by Director | Director |
| Robert M. Slotky | Vice | Since | Senior Vice President, U.S. | N/A | N/A |
| 2020 E. Financial Way | President, | 2004 | Bancorp Fund Services, LLC | ||
| Glendora, CA 91741 | Chief | since July 2001. | |||
| (Born 1947) | Compliance | ||||
| Officer | |||||
| AML | Since | ||||
| Compliance | 2006 | ||||
| Officer | |||||
| * Not an “interested person”, as that is defined by the 1940 Act. | |||||
| † Directors and Officers of the Fund serve until their resignation, removal or retirement., | |||||
30
Board of Directors David A. Katz, CFA Larry D. Kieszek Robert M. Rosencrans T. Michael Tucker • Investment Advisor Matrix Asset Advisors, Inc. 747 Third Avenue, 31st Floor New York, NY 10017 (800) 366-6223 • Custodian U.S. Bank, N.A. 1555 N. River Center Drive, Ste. 302 Milwaukee, WI 53212 • Transfer Agent U.S. Bancorp Fund Services, LLC 615 East Michigan Street Milwaukee, WI 53202 • Administrator U.S. Bancorp Fund Services, LLC 2020 East Financial Way, Ste. 100 Glendora, CA 91741 • Independent Registered Public Accounting Firm Tait, Weller & Baker, LLP 1818 Market Street, Ste. 2400 Philadelphia, PA 19103 • Distributor Quasar Distributors, LLC 615 East Michigan Street Milwaukee, WI 53202-5207 This report is intended for shareholders of the Fund and may not be used as sales literature unless preceded or accompanied by a current prospectus. Past performance results shown in this report should not be considered a representation of future performance. Share price and returns will fluctuate so that shares, when redeemed, may be worth more or less than their original cost. Statements and other information herein are dated and are subject to change. |  |
EX.99.CODE ETH
Item 2. Code of Ethics.
The registrant has adopted a code of ethics that applies to the registrant’s principal executive officer and principal financial officer. The registrant has not made any amendments to its code of ethics during the period covered by this report. The registrant has not granted any waivers from any provisions of the code of ethics during the period covered by this report.
The registrant undertakes to provide to any person without charge, upon request, a copy of its code of ethics by mail when they call the registrant at 1-800-366-6223.
Item 3. Audit Committee Financial Expert.
The registrant’s board of [trustees/directors] has determined that there is at least one audit committee financial expert serving on its audit committee. Messrs. Kieszek and Tucker are “audit committee financial expert(s)” and are considered to be “independent” as each term is defined in Item 3 of Form N-CSR.
Item 4. Principal Accountant Fees and Services.
The registrant has engaged its principal accountant to perform audit services, audit-related services, tax services and other services during the past two fiscal years. “Audit services” refer to performing an audit of the registrant's annual financial statements or services that are normally provided by the accountant in connection with statutory and regulatory filings or engagements for those fiscal years. “Audit-related services” refer to the assurance and related services by the principal accountant that are reasonably related to the performance of the audit. “Tax services” refer to professional services rendered by the principal accountant for tax compliance, tax advice, and tax planning. There were no “Other services” provided by the principal accountant. The following table details the aggregate fees billed or expected to be billed for each of the last two fiscal years for audit fees, audit-related fees, tax fees and other fees by the principal accountant.
| FYE 6/30/2008 | FYE 6/30/2007 | |
| Audit Fees | $17,500 | $16,500 |
| Audit-Related Fees | -- | |
| Tax Fees | $2,000 | $2,500 |
| All Other Fees | -- |
The audit committee has adopted pre-approval policies and procedures that require the audit committee to pre-approve all audit and non-audit services of the registrant, including services provided to any entity affiliated with the registrant.
The percentages of fees billed by Tait, Weller & Baker LLP applicable to non-audit services pursuant to waiver of pre-approval requirement were as follows:
| FYE 6/30/2008 | FYE 6/30/2007 | |
| Audit-Related Fees | 0% | 0% |
| Tax Fees | 0% | 0% |
| All Other Fees | 0% | 0% |
All of the principal accountant’s hours spent on auditing the registrant’s financial statements were attributed to work performed by full-time permanent employees of the principal accountant. (If more than 50 percent of the accountant’s hours were spent to audit the registrant's financial statements for the most recent fiscal year, state how many hours were attributed to work performed by persons other than the principal accountant's full-time, permanent employees.)
The following table indicates the non-audit fees billed or expected to be billed by the registrant’s accountant for services to the registrant and to the registrant’s investment adviser (and any other controlling entity, etc.—not sub-adviser) for the last two years. The audit committee of the board of trustees/directors has considered whether the provision of non-audit services that were rendered to the registrant's investment adviser is compatible with maintaining the principal accountant's independence and has concluded that the provision of such non-audit services by the accountant has not compromised the accountant’s independence.
| Non-Audit Related Fees | FYE 6/30/2008 | FYE 6/30/2007 |
| Registrant | -- | -- |
| Registrant’s Investment Adviser | -- | -- |
Item 5. Audit Committee of Listed Registrants.
Not applicable to registrants who are not listed issuers (as defined in Rule 10A-3 under the Securities Exchange Act of 1934).
Item 6. Schedule of Investments.
Schedule of Investments is included as part of the report to shareholders filed under Item 1 of this Form.
Item 7. Disclosure of Proxy Voting Policies and Procedures for Closed-End Management Investment Companies.
Not applicable to open-end investment companies.
Item 8. Portfolio Managers of Closed-End Management Investment Companies.
Not applicable to open-end investment companies.
Item 9. Purchases of Equity Securities by Closed-End Management Investment Company and Affiliated Purchasers.
Not applicable to open-end investment companies.
Item 10. Submission of Matters to a Vote of Security Holders.
There have been no material changes to the procedures by which shareholders may recommend nominees to the registrant’s board of directors.
Item 11. Controls and Procedures.
| (a) | The Registrant’s President/Chief Executive Officer and Treasurer/Chief Financial Officer have reviewed the Registrant's disclosure controls and procedures (as defined in Rule 30a-3(c) under the Investment Company Act of 1940 (the “Act”)) as of a date within 90 days of the filing of this report, as required by Rule 30a-3(b) under the Act and Rules 13a-15(b) or 15d-15(b) under the Securities Exchange Act of 1934. Based on their review, such officers have concluded that the disclosure controls and procedures are effective in ensuring that information required to be disclosed in this report is appropriately recorded, processed, summarized and reported and made known to them by others within the Registrant and by the Registrant’s service provider. |
| (b) | There were no changes in the Registrant's internal control over financial reporting (as defined in Rule 30a-3(d) under the Act) that occurred during the second fiscal quarter of the period covered by this report that has materially affected, or is reasonably likely to materially affect, the Registrant's internal control over financial reporting. |
Item 12. Exhibits.
| (a) | (1) Any code of ethics or amendment thereto, that is subject of the disclosure required by Item 2, to the extent that the registrant intends to satisfy Item 2 requirements through filing an exhibit. Incorporated by reference to the Registrant’s Form N-CSR filed September 2, 2004.” |
| (2) Certifications pursuant to Section 302 of the Sarbanes-Oxley Act of 2002. Filed herewith. | |
| (3) Any written solicitation to purchase securities under Rule 23c-1 under the Act sent or given during the period covered by the report by or on behalf of the registrant to 10 or more persons. Not applicable to open-end investment companies. |
| (b) | Certification pursuant to Section 906 of the Sarbanes-Oxley Act of 2002. Furnished herewith. |
SIGNATURES
Pursuant to the requirements of the Securities Exchange Act of 1934 and the Investment Company Act of 1940, the registrant has duly caused this report to be signed on its behalf by the undersigned, thereunto duly authorized.
Matrix Advisors Value Fund, Inc. &# 160;
By David A. Katz
David A. Katz, President
Date 9/3/08
Pursuant to the requirements of the Securities Exchange Act of 1934 and the Investment Company Act of 1940, this report has been signed below by the following persons on behalf of the registrant and in the capacities and on the dates indicated.
By David A. Katz
David A. Katz, President/Treasurer
Date 9/3/08