EXHIBIT 99.1
Nobel Learning Communities, Inc.
George H. Bernstein – President and CEO
Tom Frank – Chief Financial Officer

Nobel Learning Communities, Inc.
The following presentation contains forward-looking statements, within the meaning of the Private Securities Litigation Reform Act of 1995, about such things as the Company’s business, projected revenues, expenditures and operating and capital requirements. Statements that are not historical facts are forward-looking statements, and are subject to certain risks, uncertainties and assumptions, such as factors that could cause actual results to vary materially. Among the factors that could impact our ability to achieve our stated goals are competitive conditions in the pre-elementary and elementary school education and services industry, including advertising and tuition price sensitivity; various factors affecting occupancy levels, including, but not limited to, the reduction in or changes to the general labor force that would reduce the need or demand for private schools; the establishment of governmentally mandated universal pre-K programs that do not allow for participation by for-profit operators; our inability successfully to defend against or counter negative publicity associated with claims involving alleged incidents at our schools; and the acceptance of our newly developed schools and businesses and performance of recently acquired businesses. Forward-looking statements should not be relied upon except as statements of our present intentions and expectations that may or may not occur.
Company Presentation Q2, 2005
© 2005 Nobel Learning Communities, Inc.
2
NLCI Presentation Agenda
Company History
Management Team and Board of Directors Education Industry Overview Company Vision and Strategy School Portfolio Marketing Programs Financial Review
Company Presentation Q2, 2005 2005 Nobel Learning Communities, Inc.
3
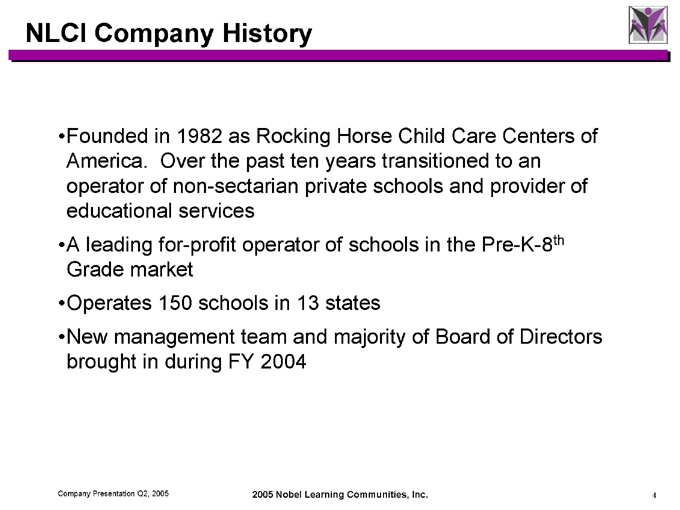
NLCI Company History
Founded in 1982 as Rocking Horse Child Care Centers of America. Over the past ten years transitioned to an operator of non-sectarian private schools and provider of educational services A leading for-profit operator of schools in the Pre-K-8th Grade market Operates 150 schools in 13 states New management team and majority of Board of Directors brought in during FY 2004
Company Presentation Q2, 2005 2005 Nobel Learning Communities, Inc.
4
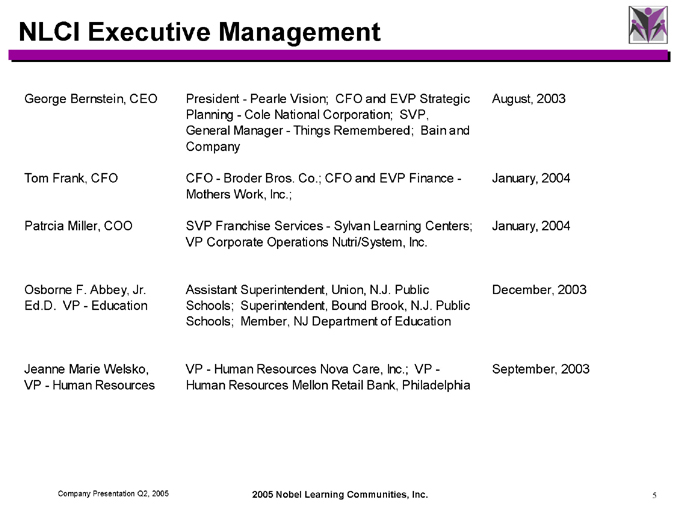
NLCI Executive Management
George Bernstein, CEO President—Pearle Vision; CFO and EVP Strategic Planning—Cole National Corporation; SVP, General Manager—Things Remembered; Bain and Company August, 2003
Tom Frank, CFO CFO—Broder Bros. Co.; CFO and EVP Finance—Mothers Work, Inc.; January, 2004
Patrcia Miller, COO SVP Franchise Services—Sylvan Learning Centers; VP Corporate Operations Nutri/System, Inc. January, 2004
Osborne F. Abbey, Jr. Assistant Superintendent, Union, N.J. Public December, 2003
Ed.D. VP—Education Schools; Superintendent, Bound Brook, N.J. Public Schools; Member, NJ Department of Education
Jeanne Marie Welsko, VP—Human Resources Nova Care, Inc.; VP—September, 2003
VP—Human Resources Human Resources Mellon Retail Bank, Philadelphia
Company Presentation Q2, 2005 2005 Nobel Learning Communities, Inc.
5
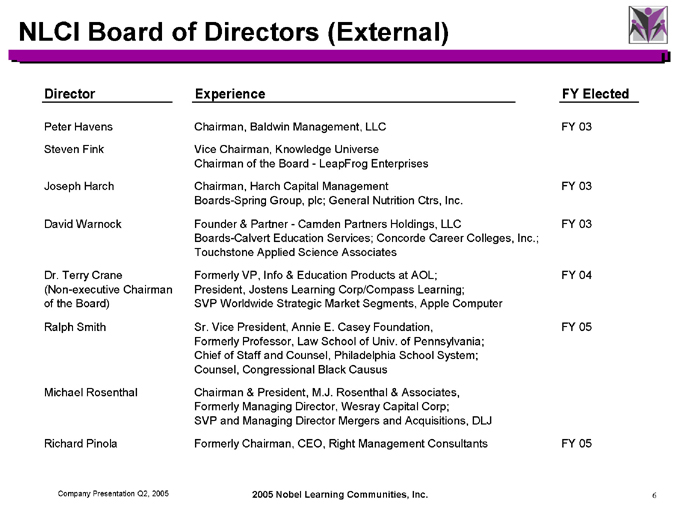
NLCI Board of Directors (External)
Director Experience FY Elected
Peter Havens Chairman, Baldwin Management, LLC FY 03
Steven Fink Vice Chairman, Knowledge Universe Chairman of the Board—LeapFrog Enterprises
Joseph Harch Chairman, Harch Capital Management Boards-Spring Group, plc; General Nutrition Ctrs, Inc. FY 03
David Warnock Founder & Partner—Camden Partners Holdings, LLC Boards-Calvert Education Services; Concorde Career Colleges, Inc.; Touchstone Applied Science Associates FY 03
Dr. Terry Crane (Non-executive Chairman of the Board) Formerly VP, Info & Education Products at AOL; President, Jostens Learning Corp/Compass Learning; SVP Worldwide Strategic Market Segments, Apple Computer FY 04
Ralph Smith Sr. Vice President, Annie E. Casey Foundation, Formerly Professor, Law School of Univ. of Pennsylvania; Chief of Staff and Counsel, Philadelphia School System; Counsel, Congressional Black Causus FY 05
Michael Rosenthal Chairman & President, M.J. Rosenthal & Associates, Formerly Managing Director, Wesray Capital Corp; SVP and Managing Director Mergers and Acquisitions, DLJ
Richard Pinola Formerly Chairman, CEO, Right Management Consultants FY 05
Company Presentation Q2, 2005 2005 Nobel Learning Communities, Inc.
6
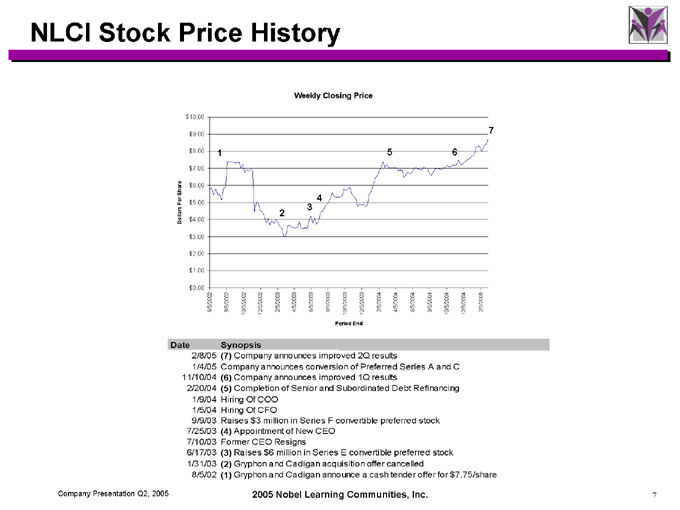
NLCI Stock Price History
Weekly Closing Price
Dollars Per Share $0.00 $10.00 $9.00 $8.00 $7.00 $6.00 $5.00 $4.00 $3.00 $2.00 $1.00
6/3/2002
8/3/2002 10/3/2002 12/3/2002 2/3/2003 4/3/2003 6/3/2003 8/3/2003 10/3/2003 12/3/2003 2/3/2004 4/3/2004 6/3/2004 8/3/2004 10/3/2004 12/3/2004 2/3/2005
Period End
Date Synopsis
2/8/05 (7) Company announces improved 2Q results
1/4/05 Company announces conversion of Preferred Series A and C
11/10/04 (6) Company announces improved 1Q results
2/20/04 (5) Completion of Senior and Subordinated Debt Refinancing
1/9/04 Hiring Of COO
1/5/04 Hiring Of CFO
9/9/03 Raises $3 million in Series F convertible preferred stock
7/25/03 (4) Appointment of New CEO
7/10/03 Former CEO Resigns
6/17/03 (3) Raises $6 million in Series E convertible preferred stock
1/31/03 (2) Gryphon and Cadigan acquisition offer cancelled
8/5/02 (1) Gryphon and Cadigan announce a cash tender offer for $7.75/share
Company Presentation Q2, 2005 2005 Nobel Learning Communities, Inc.
7
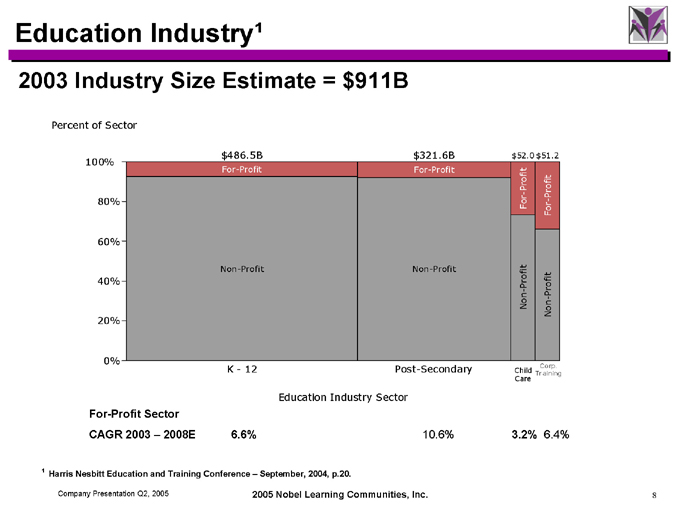
Education Industry1
2003 Industry Size Estimate = $911B
Percent of Sector
100% 80% 60% 40% 20% 0% $486.5B $321.6B $52.0 $51.2
K—12
Post-Secondary
Child Care
Corp. Training
Non-Profit
Non-Profit
Non-Profit
Non-Profit
For-Profit
For-Profit
For-Profit
For-Profit
Education Industry Sector
For-Profit Sector
CAGR 2003 – 2008E 6.6% 10.6% 3.2% 6.4%
¹ Harris Nesbitt Education and Training Conference – September, 2004, p.20.
Company Presentation Q2, 2005 2005 Nobel Learning Communities, Inc.
8
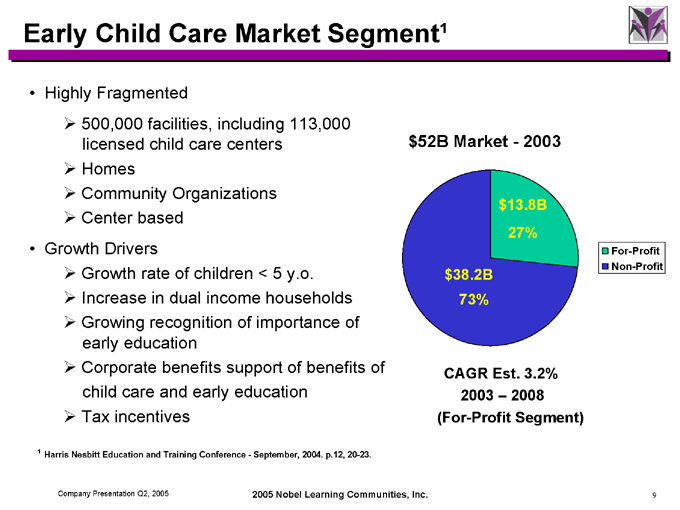
Early Child Care Market Segment1
Highly Fragmented
500,000 facilities, including 113,000 licensed child care centers Homes Community Organizations Center based
Growth Drivers
Growth rate of children < 5 y.o. Increase in dual income households Growing recognition of importance of early education Corporate benefits support of benefits of child care and early education Tax incentives $52B Market—2003 $38.2B
73% $13.8B
27%
For-Profit
Non-Profit
CAGR Est. 3.2% 2003 – 2008
(For-Profit Segment)
¹ Harris Nesbitt Education and Training Conference—September, 2004. p.12, 20-23.
Company Presentation Q2, 2005 2005 Nobel Learning Communities, Inc.
9
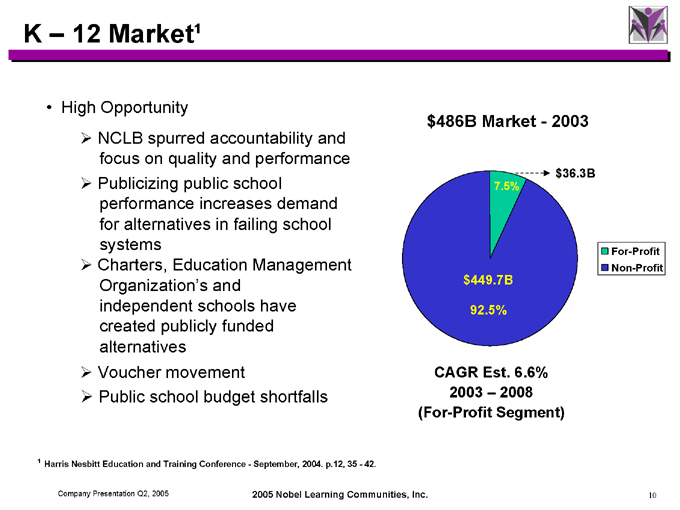
K – 12 Market¹
High Opportunity
NCLB spurred accountability and focus on quality and performance Publicizing public school performance increases demand for alternatives in failing school systems Charters, Education Management Organization’s and independent schools have created publicly funded alternatives Voucher movement Public school budget shortfalls $486B Market—2003 $36.3B
7.5% $449.7B
92.5%
For-Profit
Non-Profit
CAGR Est. 6.6% 2003 – 2008
(For-Profit Segment)
¹ Harris Nesbitt Education and Training Conference—September, 2004. p.12, 35—42.
Company Presentation Q2, 2005 2005 Nobel Learning Communities, Inc.
10
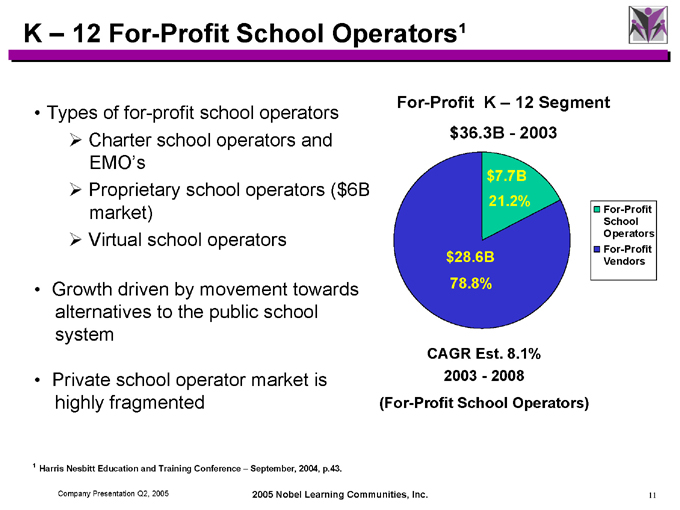
K – 12 For-Profit School Operators1
Types of for-profit school operators
Charter school operators and EMO’s Proprietary school operators ($6B market) Virtual school operators
Growth driven by movement towards alternatives to the public school system
Private school operator market is highly fragmented
For-Profit K – 12 Segment $36.3B—2003 $7.7B
21.2% $28.6B
78.8%
CAGR Est. 8.1%
2003—2008
(For-Profit School Operators)
For-Profit School Operators
For-Profit Vendors
¹ Harris Nesbitt Education and Training Conference – September, 2004, p.43.
Company Presentation Q2, 2005 2005 Nobel Learning Communities, Inc.
11
NLCI Vision
To be the leading provider of infant to 8th grade private education through
learning communities that support the educational, enrichment and wellness
needs of students and their families.
Company Presentation Q2, 2005 2005 Nobel Learning Communities, Inc.
12
NLCI Differentiation
Delivery of curriculum based education programs for infant to eighth grade:
In safe, nurturing and non-sectarian learning communities with small classes and well trained teachers; Through clusters of pre-elementary schools, elementary schools and learning support programs;
Integrating non-cognitive skills needed to succeed in the 21st century work-force; Which offer exceptional value in terms of price to educational outcomes; And offer enrichment programs to meet the lifestyle needs of families before school, after school and throughout the summer.
Company Presentation Q2, 2005 2005 Nobel Learning Communities, Inc.
13
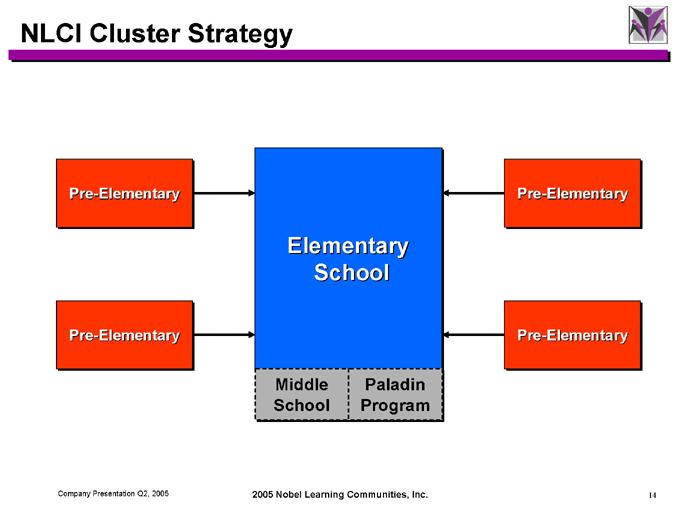
NLCI Cluster Strategy
Pre-Elementary
Pre-Elementary
Elementary School
Middle School
Paladin Program
Pre-Elementary
Pre-Elementary
Company Presentation Q2, 2005 2005 Nobel Learning Communities, Inc.
14
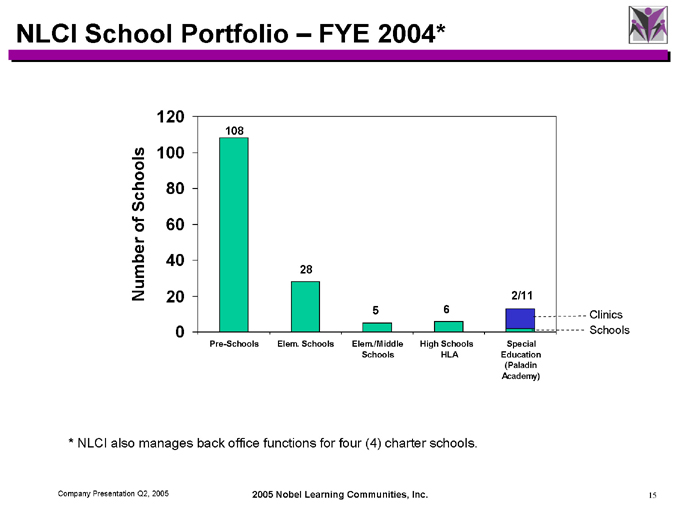
NLCI School Portfolio – FYE 2004*
Number of Schools
120 100 80 60 40 20 0
Pre-Schools
Elem. Schools
Elem./Middle Schools
High Schools HLA
Special Education (Paladin Academy)
108
28
5
6
2/11
Clinics
Schools
* NLCI also manages back office functions for four (4) charter schools.
Company Presentation Q2, 2005 2005 Nobel Learning Communities, Inc.
15
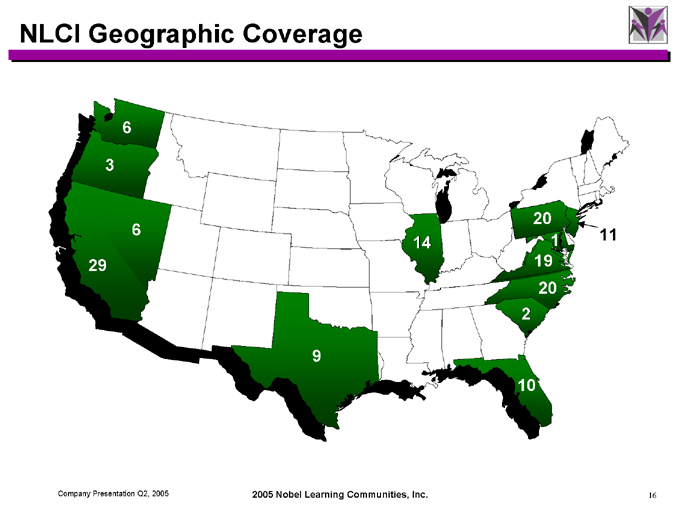
NLCI Geographic Coverage
6
3
29
6
9
14
20
1
11
19
20
2
10
Company Presentation Q2, 2005 2005 Nobel Learning Communities, Inc.
16
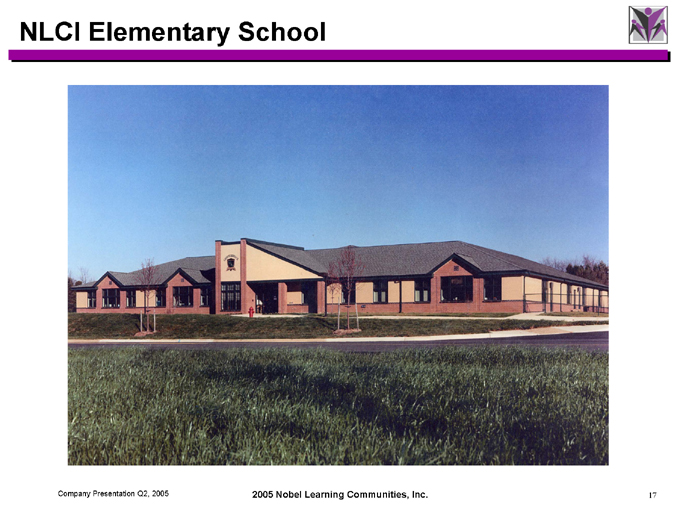
NLCI Elementary School
Company Presentation Q2, 2005 2005 Nobel Learning Communities, Inc.
17
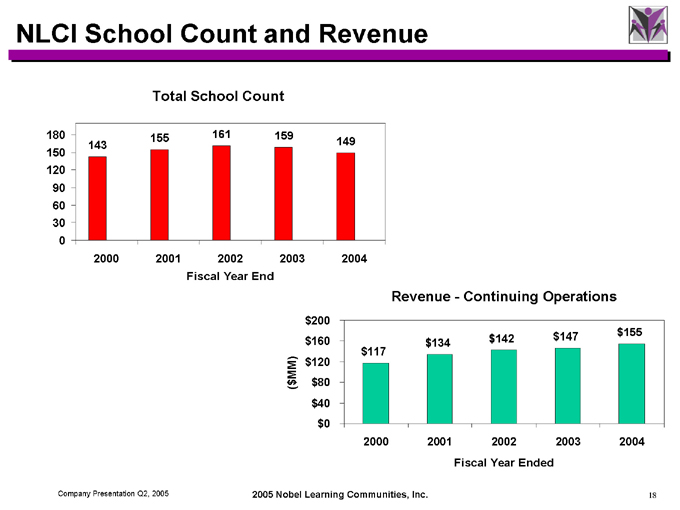
NLCI School Count and Revenue
Total School Count
180 150 120 90 60 30 0
143
155
161
159
149
2000 2001 2002 2003 2004
Fiscal Year End
Revenue—Continuing Operations
($ MM) $200 $160 $120 $80 $40 $0 $117 $134 $142 $147 $155
2000 2001 2002 2003 2004
Fiscal Year Ended
Company Presentation Q2, 2005 2005 Nobel Learning Communities, Inc.
18
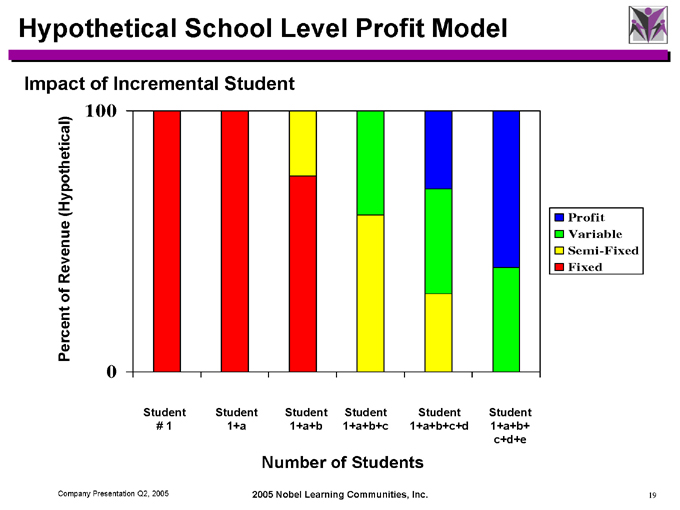
Hypothetical School Level Profit Model
Impact of Incremental Student
Percent of Revenue (Hypothetical)
100
0
Student # 1
Student 1+a
Student 1+a+b
Student 1+a+b+c
Student 1+a+b+c+d
Student 1+a+b+ c+d+e
Profit
Variable
Semi-Fixed
Fixed
Number of Students
Company Presentation Q2, 2005 2005 Nobel Learning Communities, Inc.
19
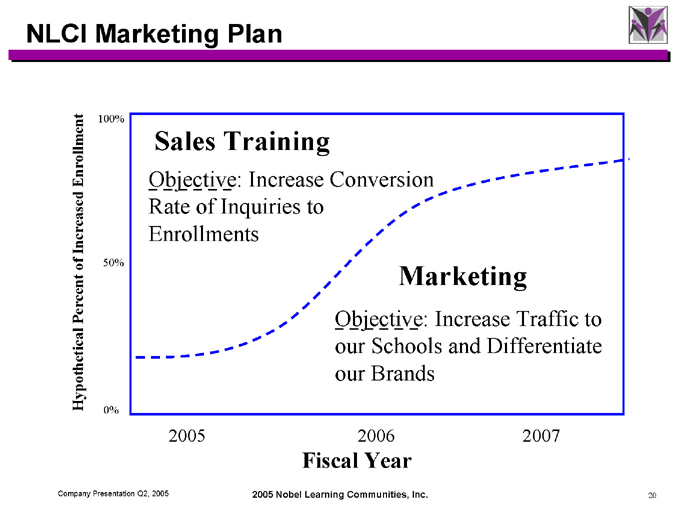
NLCI Marketing Plan
Hypothetical Percent of Increased Enrollment
100%
50%
0%
Sales Training
Objective: Increase Conversion
Rate of Inquiries to Enrollments
Marketing
Objective: Increase Traffic to our Schools and Differentiate our Brands
2005
2006
2007
Fiscal Year
Company Presentation Q2, 2005 2005 Nobel Learning Communities, Inc.
20
NLCI New Marketing Programs
Parent centered sales approach School marketing materials Development of customer database Internet marketing and lead generation Targeted direct mail programs Customer loyalty program (in test) Local Cluster marketing plan (in test)
Company Presentation Q2, 2005 2005 Nobel Learning Communities, Inc.
21
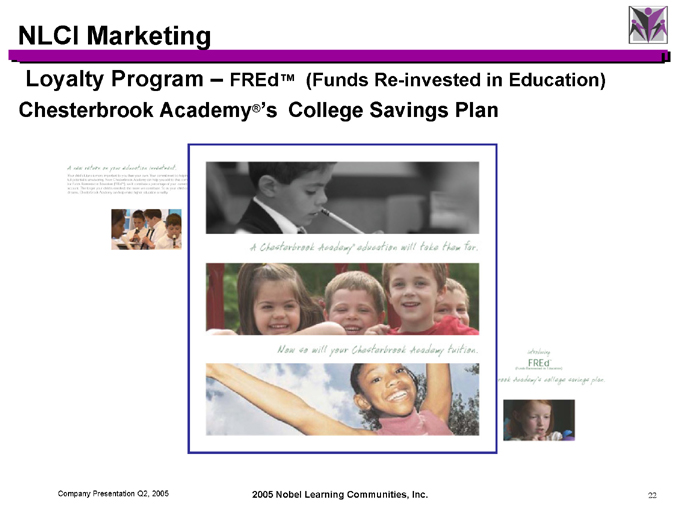
NLCI Marketing
Loyalty Program – FREd™ (Funds Re-invested in Education)
Chesterbrook Academy®’s College Savings Plan
Company Presentation Q2, 2005 2005 Nobel Learning Communities, Inc.
22
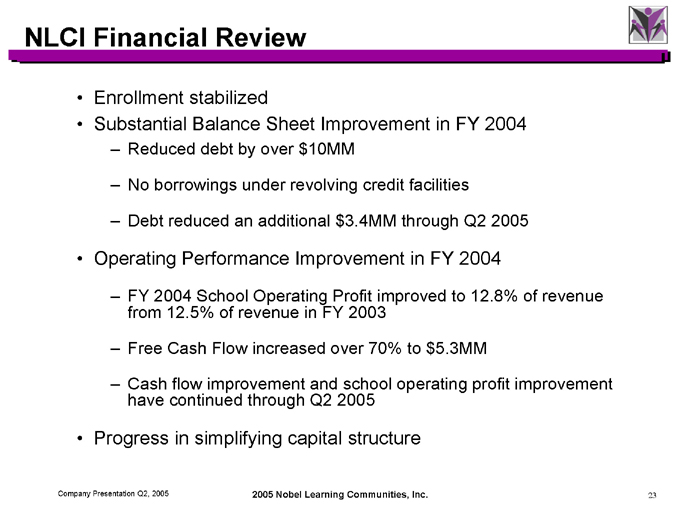
NLCI Financial Review
Enrollment stabilized
Substantial Balance Sheet Improvement in FY 2004
Reduced debt by over $10MM
No borrowings under revolving credit facilities
Debt reduced an additional $3.4MM through Q2 2005
Operating Performance Improvement in FY 2004
FY 2004 School Operating Profit improved to 12.8% of revenue from 12.5% of revenue in FY 2003
Free Cash Flow increased over 70% to $5.3MM
Cash flow improvement and school operating profit improvement have continued through Q2 2005
Progress in simplifying capital structure
Company Presentation Q2, 2005 2005 Nobel Learning Communities, Inc.
23
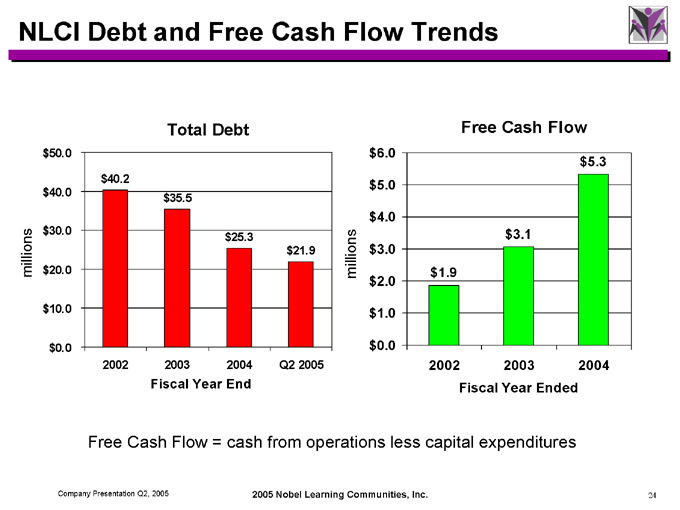
NLCI Debt and Free Cash Flow Trends
Total Debt millions $50.0 $40.0 $30.0 $20.0 $10.0 $0.0
2002 2003 2004 Q2 2005 $40.2 $35.5 $25.3 $21.9
Fiscal Year End
Free Cash Flow millions $6.0 $5.0 $4.0 $3.0 $2.0 $1.0 $0.0
2002 2003 2004
Fiscal Year Ended $1.9 $3.1 $5.3
Free Cash Flow = cash from operations less capital expenditures
Company Presentation Q2, 2005 2005 Nobel Learning Communities, Inc.
24
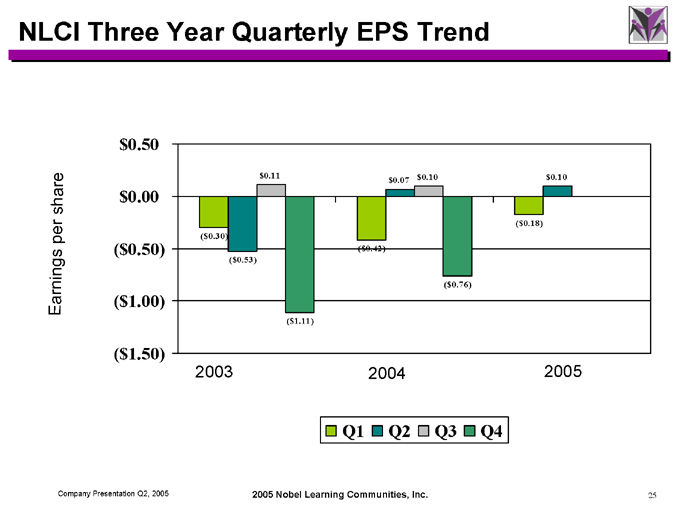
NLCI Three Year Quarterly EPS Trend
Earnings per share
$0.50
$0.00
($ 0.50)
($ 1.00)
($ 1.50)
2003 2004 2005
($ 0.30)
($ 0.53) $0.11
($ 1.11)
($ 0.42) $0.07 $0.10
($ 0.76)
($ 0.18) $0.10
Q1
Q2
Q3
Q4
Company Presentation Q2, 2005 2005 Nobel Learning Communities, Inc.
25
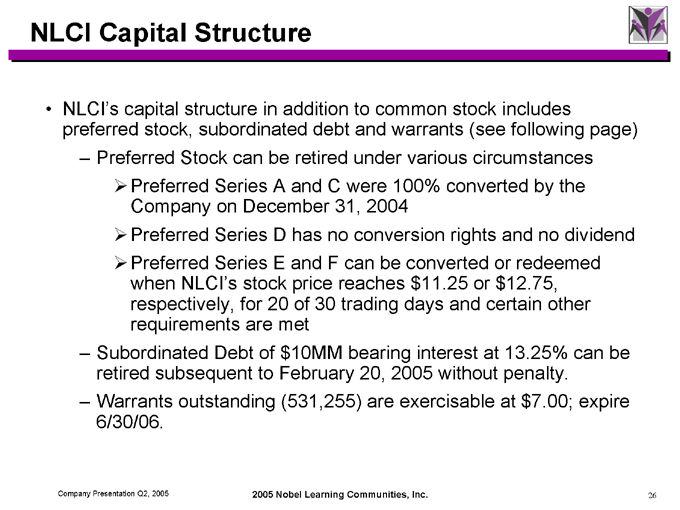
NLCI Capital Structure
NLCI’s capital structure in addition to common stock includes preferred stock, subordinated debt and warrants (see following page)
Preferred Stock can be retired under various circumstances
Preferred Series A and C were 100% converted by the Company on December 31, 2004 Preferred Series D has no conversion rights and no dividend Preferred Series E and F can be converted or redeemed when NLCI’s stock price reaches $11.25 or $12.75, respectively, for 20 of 30 trading days and certain other requirements are met
Subordinated Debt of $10MM bearing interest at 13.25% can be retired subsequent to February 20, 2005 without penalty. Warrants outstanding (531,255) are exercisable at $7.00; expire 6/30/06.
Company Presentation Q2, 2005 2005 Nobel Learning Communities, Inc.
26
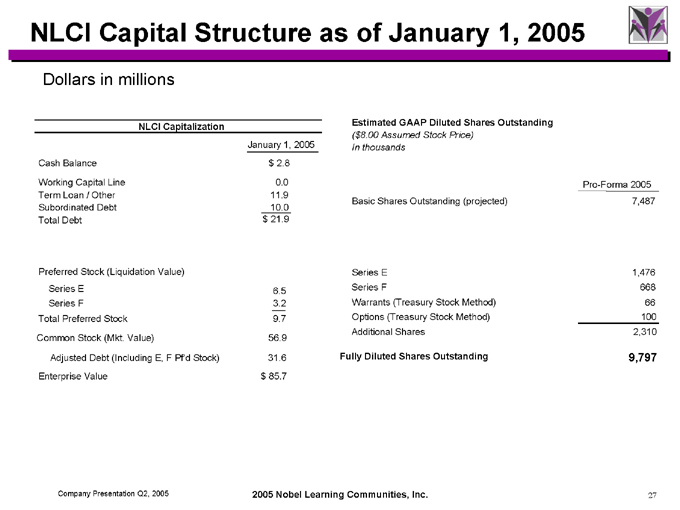
NLCI Capital Structure as of January 1, 2005
Dollars in millions
NLCI Capitalization
January 1, 2005
Cash Balance $ 2.8
Working Capital Line 0.0
Term Loan / Other 11.9
Subordinated Debt 10.0
Total Debt $ 21.9
Preferred Stock (Liquidation Value)
Series E 6.5
Series F 3.2
Total Preferred Stock 9.7
Common Stock (Mkt. Value) 56.9
Adjusted Debt (Including E, F Pf’d Stock) 31.6
Enterprise Value $ 85.7
Estimated GAAP Diluted Shares Outstanding
($8.00 Assumed Stock Price) In thousands
Pro-Forma 2005
Basic Shares Outstanding (projected) 7,487
Series E 1,476
Series F 668
Warrants (Treasury Stock Method) 66
Options (Treasury Stock Method) 100
Additional Shares 2,310
Fully Diluted Shares Outstanding 9,797
Company Presentation Q2, 2005 2005 Nobel Learning Communities, Inc.
27
NLCI Company Direction
Drive profitability and cash flow through improved occupancy and utilization of existing schools Accelerate revenue growth by filling existing clusters and expanding the cluster concept through both build and acquisition opportunities Broaden curriculum and expand outcome measurements to include non-cognitive skills required to succeed in the 21st century work force
Simplify the Company’s capital structure
Company Presentation Q2, 2005 2005 Nobel Learning Communities, Inc.
28
Appendix
Summary Financial Statements
Company Presentation Q2, 2005 2005 Nobel Learning Communities, Inc.
29
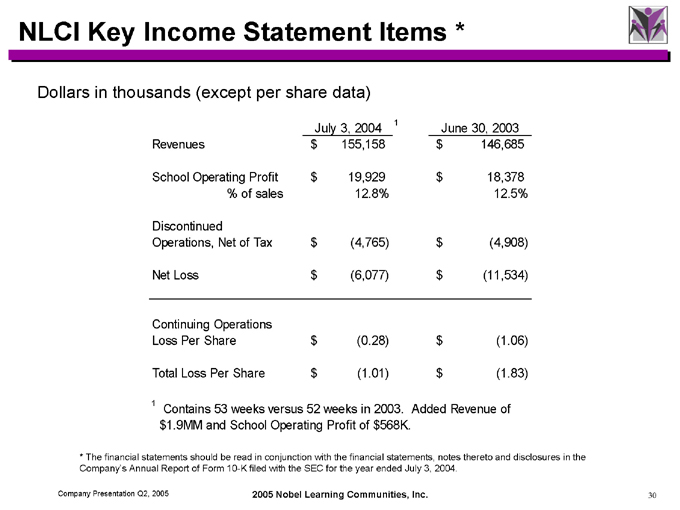
NLCI Key Income Statement Items *
Dollars in thousands (except per share data)
July 3, 2004 1 June 30, 2003
Revenues $ 155,158 $ 146,685
School Operating Profit $ 19,929 $ 18,378
% of sales 12.8% 12.5%
Discontinued
Operations, Net of Tax $ (4,765) $ (4,908)
Net Loss $ (6,077) $ (11,534)
Continuing Operations
Loss Per Share $ (0.28) $ (1.06)
Total Loss Per Share $ (1.01) $ (1.83)
1 Contains 53 weeks versus 52 weeks in 2003. Added Revenue of $1.9MM and School Operating Profit of $568K.
* The financial statements should be read in conjunction with the financial statements, notes thereto and disclosures in the Company’s Annual Report of Form 10-K filed with the SEC for the year ended July 3, 2004.
Company Presentation Q2, 2005 2005 Nobel Learning Communities, Inc.
30
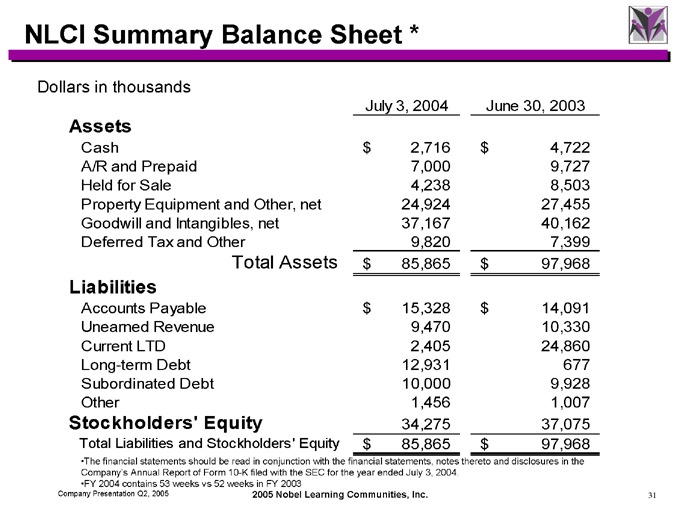
NLCI Summary Balance Sheet *
Dollars in thousands
July 3, 2004 June 30, 2003
Assets
Cash $ 2,716 $ 4,722
A/R and Prepaid 7,000 9,727
Held for Sale 4,238 8,503
Property Equipment and Other, net 24,924 27,455
Goodwill and Intangibles, net 37,167 40,162
Deferred Tax and Other 9,820 7,399
Total Assets $ 85,865 $ 97,968
Liabilities
Accounts Payable $ 15,328 $ 14,091
Unearned Revenue 9,470 10,330
Current LTD 2,405 24,860
Long-term Debt 12,931 677
Subordinated Debt 10,000 9,928
Other 1,456 1,007
Stockholders’ Equity 34,275 37,075
Total Liabilities and Stockholders’ Equity $ 85,865 $ 97,968
The financial statements should be read in conjunction with the financial statements, notes thereto and disclosures in the Company’s Annual Report of Form 10-K filed with the SEC for the year ended July 3, 2004.
FY 2004 contains 53 weeks vs 52 weeks in FY 2003
Company Presentation Q2, 2005 2005 Nobel Learning Communities, Inc.
31
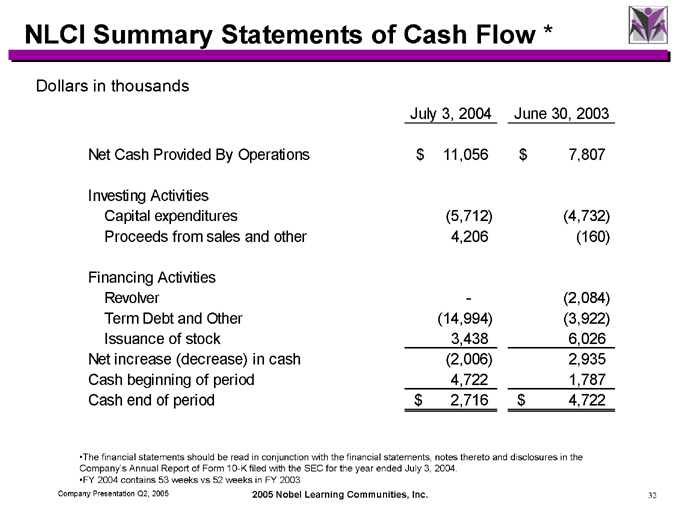
NLCI Summary Statements of Cash Flow *
Dollars in thousands
July 3, 2004 June 30, 2003
Net Cash Provided By Operations $ 11,056 $ 7,807
Investing Activities
Capital expenditures (5,712) (4,732)
Proceeds from sales and other 4,206 (160)
Financing Activities
Revolver—(2,084)
Term Debt and Other (14,994) (3,922)
Issuance of stock 3,438 6,026
Net increase (decrease) in cash (2,006) 2,935
Cash beginning of period 4,722 1,787
Cash end of period $ 2,716 $ 4,722
The financial statements should be read in conjunction with the financial statements, notes thereto and disclosures in the Company’s Annual Report of Form 10-K filed with the SEC for the year ended July 3, 2004.
FY 2004 contains 53 weeks vs 52 weeks in FY 2003
Company Presentation Q2, 2005 2005 Nobel Learning Communities, Inc.
32
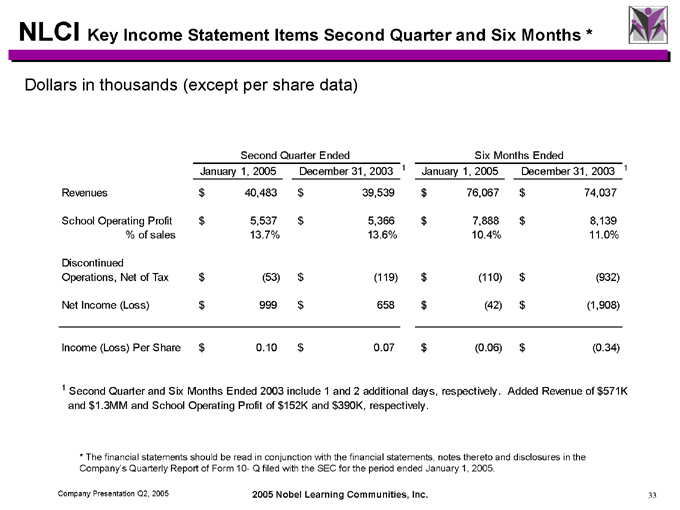
NLCI Key Income Statement Items Second Quarter and Six Months *
Dollars in thousands (except per share data)
Second Quarter Ended Six Months Ended
January 1, 2005 December 31, 20031 January 1, 2005 December 31, 20031
Revenues $ 40,483 $ 39,539 $ 76,067 $ 74,037
School Operating Profit $ 5,537 $ 5,366 $ 7,888 $ 8,139
% of sales 13.7% 13.6% 10.4% 11.0%
Discontinued
Operations, Net of Tax $ (53) $ (119) $ (110) $ (932)
Net Income (Loss) $ 999 $ 658 $ (42) $ (1,908)
Income (Loss) Per Share $ 0.10 $ 0.07 $ (0.06) $ (0.34)
1 Second Quarter and Six Months Ended 2003 include 1 and 2 additional days, respectively. Added Revenue of $571K and $1.3MM and School Operating Profit of $152K and $390K, respectively.
* The financial statements should be read in conjunction with the financial statements, notes thereto and disclosures in the Company’s Quarterly Report of Form 10- Q filed with the SEC for the period ended January 1, 2005.
Company Presentation Q2, 2005 2005 Nobel Learning Communities, Inc.
33
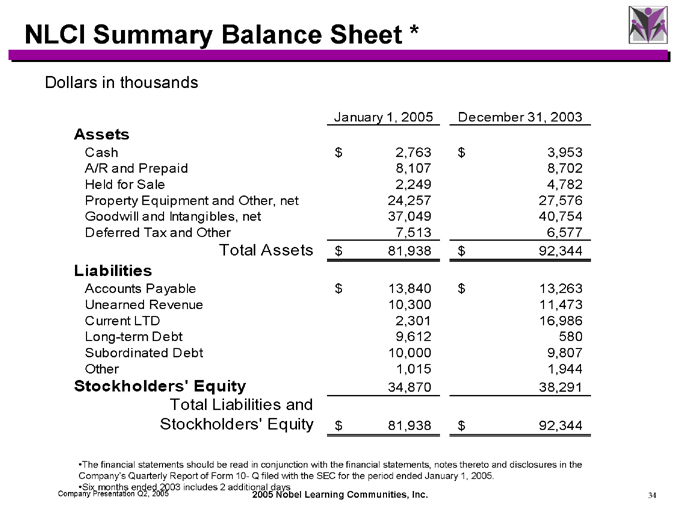
NLCI Summary Balance Sheet *
Dollars in thousands
January 1, 2005 December 31, 2003
Assets
Cash $ 2,763 $ 3,953
A/R and Prepaid 8,107 8,702
Held for Sale 2,249 4,782
Property Equipment and Other, net 24,257 27,576
Goodwill and Intangibles, net 37,049 40,754
Deferred Tax and Other 7,513 6,577
Total Assets $ 81,938 $ 92,344
Liabilities
Accounts Payable $ 13,840 $ 13,263
Unearned Revenue 10,300 11,473
Current LTD 2,301 16,986
Long-term Debt 9,612 580
Subordinated Debt 10,000 9,807
Other 1,015 1,944
Stockholders’ Equity 34,870 38,291
Total Liabilities and
Stockholders’ Equity $ 81,938 $ 92,344
The financial statements should be read in conjunction with the financial statements, notes thereto and disclosures in the Company’s Quarterly Report of Form 10- Q filed with the SEC for the period ended January 1, 2005. Six months ended 2003 includes 2 additional days
Company Presentation Q2, 2005 2005 Nobel Learning Communities, Inc.
34
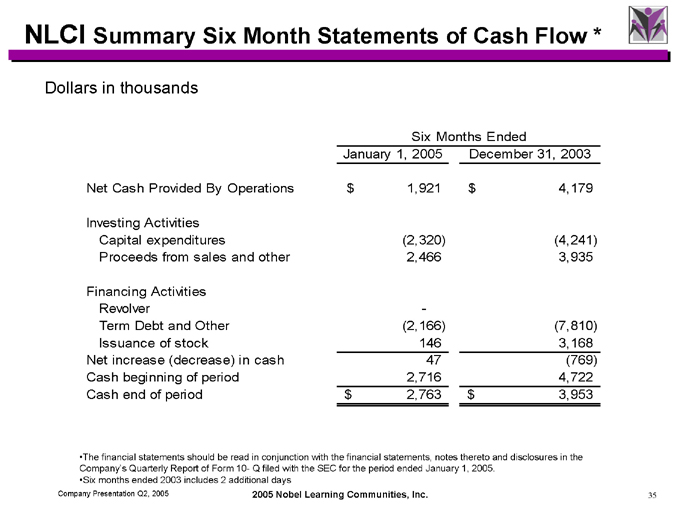
NLCI Summary Six Month Statements of Cash Flow *
Dollars in thousands
Six Months Ended
January 1, 2005 December 31, 2003
Net Cash Provided By Operations $ 1,921 $ 4,179
Investing Activities
Capital expenditures (2,320) (4,241)
Proceeds from sales and other 2,466 3,935
Financing Activities
Revolver—
Term Debt and Other (2,166) (7,810)
Issuance of stock 146 3,168
Net increase (decrease) in cash 47 (769)
Cash beginning of period 2,716 4,722
Cash end of period $ 2,763 $ 3,953
The financial statements should be read in conjunction with the financial statements, notes thereto and disclosures in the Company’s Quarterly Report of Form 10- Q filed with the SEC for the period ended January 1, 2005. Six months ended 2003 includes 2 additional days
Company Presentation Q2, 2005 2005 Nobel Learning Communities, Inc.
35
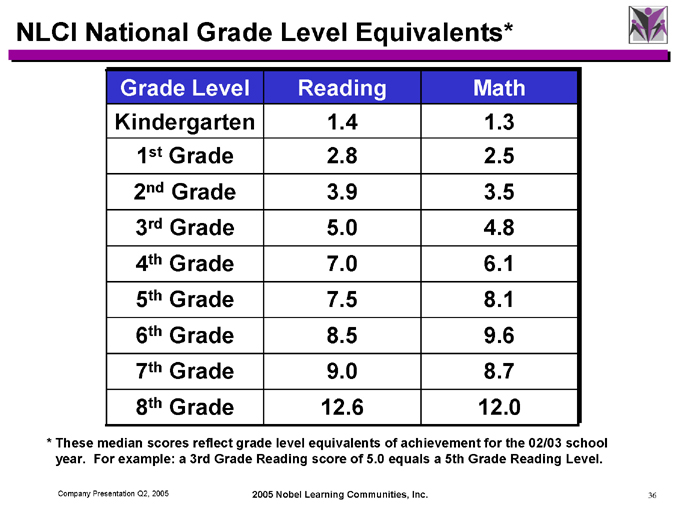
NLCI National Grade Level Equivalents*
Grade Level Reading Math
Kindergarten 1.4 1.3
1st Grade 2.8 2.5
2nd Grade 3.9 3.5
3rd Grade 5.0 4.8
4th Grade 7.0 6.1
5th Grade 7.5 8.1
6th Grade 8.5 9.6
7th Grade 9.0 8.7
8th Grade 12.6 12.0
* These median scores reflect grade level equivalents of achievement for the 02/03 school year. For example: a 3rd Grade Reading score of 5.0 equals a 5th Grade Reading Level.
Company Presentation Q2, 2005 2005 Nobel Learning Communities, Inc.
36
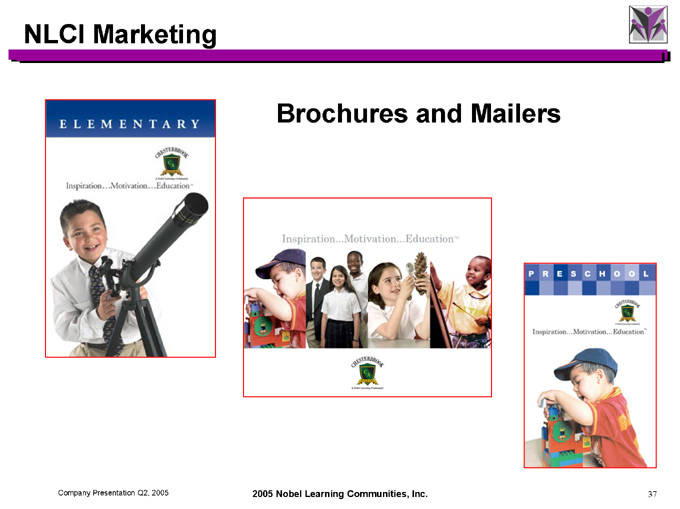
NLCI Marketing
ELEMENTARY
Brochures and Mailers
Inspiration…
Motivation…
EducationTM
Inspiration…
Motivation…
EducationTM
Inspiration…
Motivation…
EducationTM
PRESCHOOL
Company Presentation Q2, 2005 2005 Nobel Learning Communities, Inc.
37
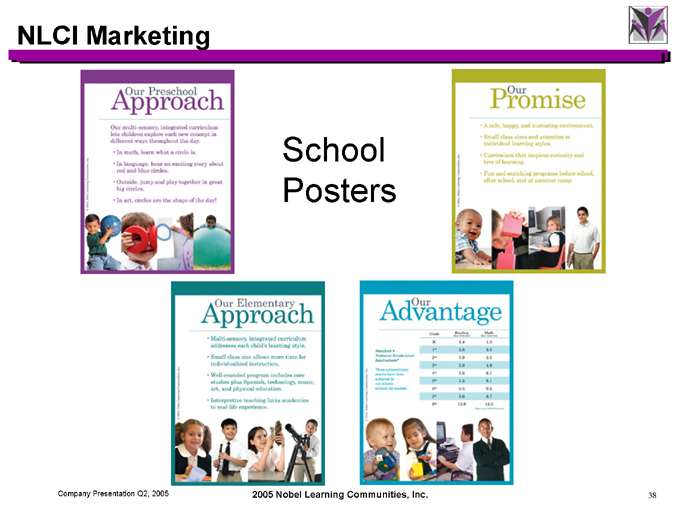
NLCI Marketing
Our Preschool Approach
School Posters
Our Promise
Our Elementary Approach
Our Advantage
Company Presentation Q2, 2005 2005 Nobel Learning Communities, Inc.
38
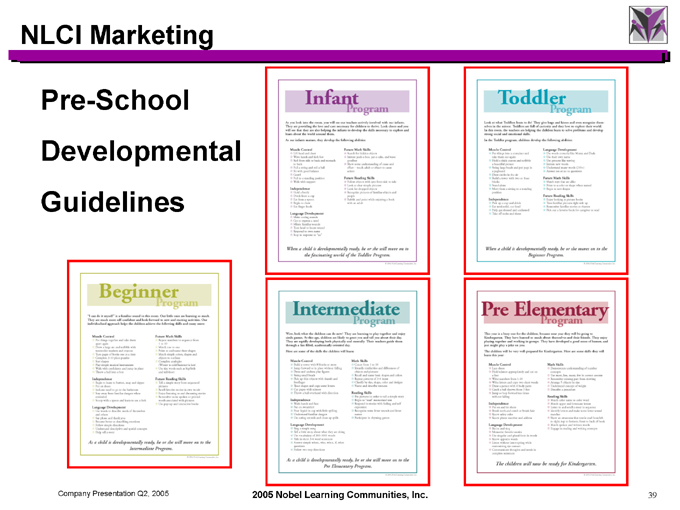
NLCI Marketing
Pre-School Developmental Guidelines
Biginner Program
Infant Program
Intermediate Program
Toddler Program
Pre Elementary Program
Company Presentation Q2, 2005 2005 Nobel Learning Communities, Inc.
39
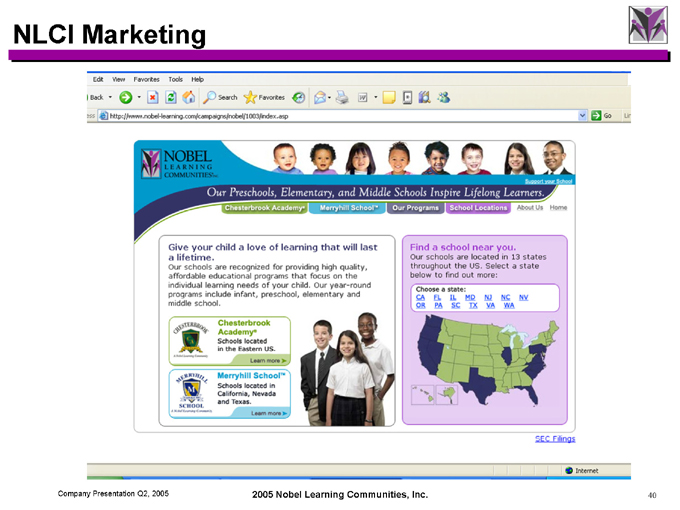
NLCI Marketing
Company Presentation Q2, 2005 2005 Nobel Learning Communities, Inc.
40