Table of Contents
UNITED STATES
SECURITIES AND EXCHANGE COMMISSION
Washington, D.C. 20549
Form 10-K
(Mark One)
| x | ANNUAL REPORT PURSUANT TO SECTION 13 OR 15(d) OF THE SECURITIES EXCHANGE ACT OF 1934 |
For the fiscal year ended July 3, 2010
or
| ¨ | TRANSITION REPORT PURSUANT TO SECTION 13 OR 15(d) OF THE SECURITIES EXCHANGE ACT OF 1934 |
For the transition period from to
Commission file number 1-10031
NOBEL LEARNING COMMUNITIES, INC.
(Exact name of registrant as specified in its charter)
| Delaware | 22-2465204 | |
(State or Other Jurisdiction of Incorporation or Organization) | (I.R.S. Employer Identification No.) | |
1615 West Chester Pike, Suite 200 West Chester, PA | 19382 | |
| (Address of Principal Executive Offices) | (Zip Code) |
Registrant’s telephone number, including area code: (484) 947-2000
Securities registered pursuant to Section 12(b) of the Act:
Title of Each Class | Name of Each Exchange on Which Registered | |
Common Stock, par value $.001 per share Series A Junior Preferred Stock Purchase Rights | Nasdaq Stock Market LLC (Nasdaq Global Market) Nasdaq Stock Market LLC (Nasdaq Global Market) |
Securities registered pursuant to Section 12(g) of the Act: None
Indicate by check mark if the registrant is a well-known seasoned issuer, as defined in Rule 405 of the Securities Act. Yes ¨ No x
Indicate by check mark if the registrant is not required to file reports pursuant to Section 13 or Section 15(d) of the Act. Yes ¨ No x
Indicate by check mark whether the registrant (1) has filed all reports required to be filed by Section 13 or 15(d) of the Securities Exchange Act of 1934 during the preceding 12 months (or for such shorter period that the registrant was required to file such reports) and (2) has been subject to such filing requirements for the past 90 days. Yes x No ¨
Indicate by check mark whether the registrant has submitted electronically and posted on its corporate Web site, if any, every Interactive Data File required to be submitted and posted pursuant to Rule 405 of Regulation S-T (§232.405 of this chapter) during the preceding 12 months (or for such shorter period that the registrant was required to submit and post such files). ¨ Yes ¨ No
Indicate by check mark if disclosure of delinquent filers pursuant to Item 405 of Regulation S-K (§229.405 of this chapter) is not contained herein and will not be contained, to the best of registrant’s knowledge, in definitive proxy or information statements incorporated by reference in Part III of this Form 10-K or any amendment to this Form 10-K. ¨
Indicate by check mark whether the registrant is a large accelerated filer, an accelerated filer, a non-accelerated filer or a smaller reporting company. See definition of “large accelerated filer”, “accelerated filer” and “smaller reporting company” in Rule 12b-2 of the Exchange Act).
Large accelerated filer ¨ Accelerated filer x Non-accelerated filer ¨ Small reporting company ¨
Indicate by check mark whether the registrant is a shell company (as defined in Rule 12b-2 of the Act). Yes ¨ No x
The aggregate market value of the voting and non-voting common stock held by non-affiliates of the registrant as of December 26, 2009 (the last business day of the registrant’s most recently completed second fiscal quarter) was approximately $77,783,000 (based upon the closing sale price of these shares on such date as reported by the Nasdaq Global Market). The number of shares of the registrant’s common stock, par value $0.001 per share, outstanding at September 9, 2010, was 10,550,701
DOCUMENTS INCORPORATED BY REFERENCE
Portions of the definitive Proxy Statement for the Annual Meeting of Stockholders to be held on November 10, 2010 (the “Proxy Statement”) and to be filed within 120 days after the registrant’s fiscal year ended July 3, 2010 are incorporated by reference in Part III.
Table of Contents
Item No. | Page | |||
| PART I | ||||
1. | 1 | |||
1A. | 10 | |||
1B. | 17 | |||
2. | 17 | |||
3. | 17 | |||
4. | 18 | |||
| PART II | ||||
5. | 19 | |||
6. | 21 | |||
7. | Management’s Discussion and Analysis of Financial Condition and Results of Operations | 23 | ||
7A. | 54 | |||
8. | 55 | |||
9. | Changes in and Disagreements with Accountants on Accounting and Financial Disclosure | 55 | ||
9A. | 55 | |||
9B. | 58 | |||
| PART III | ||||
10. | 59 | |||
11. | 59 | |||
12. | Security Ownership of Certain Beneficial Owners and Management and Related Stockholder Matters | 59 | ||
13. | Certain Relationships and Related Transactions, and Director Independence | 59 | ||
14. | 59 | |||
| PART IV | ||||
15. | 60 | |||
i
Table of Contents
CAUTIONARY STATEMENTS ABOUT FORWARD-LOOKING INFORMATION
Statements included or incorporated herein which are not historical facts are forward-looking statements pursuant to the safe harbor provisions of the Private Securities Litigation Reform Act of 1995. When the Company uses words such as “believes,” “expects,” “anticipates,” “plans,” “estimates,” “projects,” “may,” “intends,” “seeks” or similar expressions, the Company is making forward-looking statements, but these terms are not the exclusive means of identifying forward-looking statements.
Forward-looking statements reflect management’s current views with respect to future events and financial performance and are based on currently available competitive, financial and economic data and management’s assumptions regarding future events. While management believes that its assumptions are reasonable, forward-looking statements are subject to various known and unknown risks and uncertainties and actual results may differ materially from those expressed or implied herein. In connection with the “safe harbor provisions” of the Private Securities Litigation Reform Act of 1995, the Company notes that certain factors, among others, which could cause future results to differ materially from the forward-looking statements, expectations and assumptions expressed or implied herein are discussed in greater detail under Item 7; “Management’s Discussion and Analysis of Financial Condition and Results of Operations” and Item 1A “Risk Factors.” In addition, potential risks and uncertainties include, among others, unemployment rates impacting our current or future enrollments; changes in general economic conditions; the implementation and results of our ongoing strategic initiatives; our ability to compete with new or existing competitors; dependence on senior management and other key personnel; the litigation with the Department of Justice relating to alleged violations of the American with Disabilities Act; and the high concentration of ownership of the Company’s stock among its four largest stockholders. Readers are cautioned that the forward-looking statements reflect management’s analysis only as of the date hereof and the Company assumes no obligation to update or revise these statements or to update the reasons why actual results could differ from those projected in the forward-looking statements, whether as a result of new information, future developments or otherwise.
ii
Table of Contents
| ITEM 1. | BUSINESS. |
General
Nobel Learning Communities, Inc. (collectively with its subsidiaries, the “Company” or “Nobel Learning Communities”) is a national network of nonsectarian private schools, including preschools, elementary schools, middle schools and specialty high schools in 15 states and the District of Columbia. In addition, the Company operates a K-12 distance learning online college prep school. Nobel Learning Communities provides high-quality private education, with small schools and class sizes and attention to individual learning styles. We also offer an array of supplemental educational services, including before-and-after-school programs, the Camp Zone® summer program, learning support programs and camps. Our schools operate under various brand names and are located in the District of Columbia, Arizona, California, Florida, Illinois, Maryland, Nevada, New Jersey, North Carolina, Ohio, Oregon, Pennsylvania, South Carolina, Texas, Virginia, and Washington. As of September 9, 2010, the Company operated 184 schools.
The following trademarks are in use by the Company, all of which have either been registered or are in the process of being registered in the United States Patent and Trademark Office: Chesterbrook Academy®, Merryhill School®, Discovery Isle Child Development Center, Enchanted Care Learning Center, Camelback Desert Schools, The Honor Roll School®, Camp Zone®, Paladin Academy®, Rocking Horse Child Care Centers®, Southern Highlands Preparatory School, Montessori Corner, HighPointe Children’s Academy, Houston Learning Academy™ and Laurel Springs School. We believe that certain of our service marks have substantial value in our marketing in the respective areas in which our schools operate.
Our corporate office is located at 1615 West Chester Pike, Suite 200, West Chester, PA 19382-6223. Our telephone number is (484) 947-2000. Nobel Learning Communities, Inc., a Delaware corporation, was formed on March 30, 1983.
Educational Program and Delivery Model
We deliver research-based, standards-driven curricula in all its schools. The content of our curricula is closely monitored by our Education Department to ensure that changes to national and state standards are reflected in our own national K-12 standards. Our Education Department continually evaluates programs and practices related to early childhood development so that the curriculum reflects the latest and best research-based content for preschoolers. The framework for delivery of this content embraces student-centered learning. Classroom learning is often organized around guided centers, cooperative learning activities, and project-based learning.
Accreditation
We seek to ensure that our schools meet or exceed the standards of appropriate accrediting agencies through an internal quality assurance program. Although not mandated by any governmental or regulatory authority, many of our schools are accredited, or are currently seeking accreditation through the Commission on International and Trans-Regional Accreditation (CITA)/AdvancED and/or with various regional accreditation agencies throughout the United States. Regional accreditation agencies include Middle States Association of Colleges and Schools, North Central Association of Colleges and Schools, Southern Association of Colleges and Schools and Western Association of Colleges and Schools. The company also maintains corporate accreditation through CITA/AdvancED; and is accredited through June 30, 2014.
Preschool Educational Program
Links to Learning, our preschool curriculum, is an integrated series of programs for children ages six weeks to five years that engages the young learner’s senses, mind and body. The components of each program build
1
Table of Contents
upon each other as children grow and develop, ensuring an excellent preparation for elementary school. The program draws from the collective expertise of renowned early-age educators such as Dewey, Piaget and Vygotsky. The Links to Learning Curriculum builds new learning on past experiences, and encourages each child’s interest in discovery and hands-on learning. Links to Learning was created by the Nobel Learning Education Department, a team of highly skilled experts with extensive knowledge of early-age education.
Links to Learning divides skills into distinct academic areas. These areas are: Language and Literacy, Mathematics, The World and Me, My Community and Environment, Art, Music, Wellness and Spanish.
The Links to Learning program features a strong parent communication component. Nobel Learning believes that when parents and teachers work as partners in a child’s education, the learning experience is richer and more meaningful. Parents receive materials each month, containing an overview of the developmental skills that the child has worked on that month. The materials contain samples of their children’s work that was completed in class, as well as a letter outlining suggested activities that can be done with their child at home. The materials also provide a preview of the next month’s skills and lessons. Teachers post weekly and daily skills lists outside the classroom as further support to these activities.
The Links to Learning Curriculum focuses on two vital goals: developing a child’s lifelong love of learning and ensuring that he/she is ready for kindergarten and elementary school. Our Education Department studied the kindergarten standards in all of the states in which there are kindergarten classes and carefully designed the preschool program to meet or to exceed pre-kindergarten expectations. Each preschool has a “Links to Kindergarten” section on its school website so that parents can be assured of a successful transition to kindergarten by matching to the appropriate state standards.
Elementary and Middle School Educational Program
Standards-Based Content
In 2007 Nobel Learning created a standards-based curriculum for kindergarten through eighth grades. To do so, the members of the Education Department researched the standards in 46 states and merged them into one set of national standards. This was done for critical content areas: language arts, writing, math, science, social studies, technology, physical education, wellness, art, music, Spanish, and study skills. Each content area has standards with corresponding objectives of what students need to know and be able to do. Each grade level has a comprehensive curriculum binder that takes each of the content areas and divides the standards and objectives into four quarterly pacing guides. The pacing guides then create a synchronous curriculum for the Company’s national network of schools which provides unique collaborative learning opportunities, such as Learning Without Walls projects and Giving Without Walls, our student-driven social entrepreneurship programs.
Delivery System
The content of the Nobel Learning curriculum is dictated by state standards. The core curriculum contains the content of what we teach. Then, through planning instruction, lessons and personalized learning plans, we integrate 21st century themes and skills into the delivery of that content. The content delivery model includes traditional classroom instruction, as well as 21st century skills projects in grades 1 through 8. These projects are based on the framework provided by the Partnership for the 21st Century Skills organization. Nobel Learning is a professional development affiliate of the Partnership for 21st Century Skills (www.21stcenturyskills.com),the leading advocacy organization focused on infusing 21st century skills into education.
Through project-based learning, we are able to enrich and sometimes accelerate the delivery of our curriculum. All students in grades 1 through 8, in collaboration with their teachers and parents create a Personal Learning Plan for each school year. The Personal Learning Plan is an opportunity for the teacher, parents and student to work together on goals related to their current and future academic success. Our project based learning programs include “Giving Without Walls” projects which allow our 1st through 8th grade students to be active
2
Table of Contents
participants in service-learning opportunities. Student-led service-learning projects integrate meaningful community service with instruction and reflection to enrich the learning experience, teach civic responsibility, and encourage lifelong civic engagement.
“Learning Without Walls” is another project-based learning program that is offered for grades 4 through 8. These projects require students to use 21st Century skills while working with our network schools across the country. The projects challenge students to explore highly relevant, curriculum-based topics, use a variety of technology tools to research their topic and collaborate with students in different parts of the country as they work through the project timeline. The ability to share, to interact, and to work in small regional or larger national teams offers a rich learning environment, in which students are challenged to apply their knowledge in authentic ways to solve real problems.
Assessment
It is essential to continuously monitor students’ academic performance to ensure that they meet or exceed grade-level benchmarks for proficiency. All students in grades 1 through 8 participate in SAT10 testing each spring. Those test results are used to monitor student progress and set achievement goals. In addition, we use an online assessment program in reading and math to give teachers weekly feedback on how each student is performing relative to the recent lessons and concepts in order to personalize lessons and instruction programs for each student based on his or her current needs.
Teachers
We recognize that investing in the quality of our teachers’ capabilities and professionalism is essential to sustaining our students’ high level of academic achievement and our profitability. We sponsor professional development days covering various aspects of teaching and education, using both internal trainers and external consultants. Our educators serve on Company task forces and committees that review and revise curricular guidelines, programs, support materials and teaching methods.
Training
In support of teachers’ professional development, during the 2008/2009 school year we implemented Education Connections. Education Connections is an intranet site dedicated to providing training resources and support for our teachers. The intranet site includes a teacher communication and support area, exemplary lesson plan library, grade level curriculum support and other valuable resources to support and enhance our teachers’ professional development, professional relationships, and satisfaction.
School-based leadership teams (Principals and Assistant Principals) also actively engage in professional development and self-improvement. Staff training is provided by our education department and other experts within the education industry. Through participation in our annual National Principal Conference, seasoned administrators as well as new recruits are kept abreast of up-to-date research, changing trends and sound pedagogical practices. Our Executive Directors and many of our highest performing principals are utilized as trainers to help with professional development and curriculum implementation in our schools.
School Operations
Standards
In order to maintain appropriate standards, our schools share consistent educational goals and operating procedures. While we have a national curriculum, Principals may tailor curricula, within the standards of Nobel Learning Communities’ Education Department guidelines, to meet local and state requirements. Members of our management team visit schools on a regular basis to review program, facility and staff quality. Hiring and retaining quality personnel at our schools and in operational management positions is a critical success factor in driving success in both operational and financial performance.
3
Table of Contents
Our school Principals and Assistant Principals are responsible for all facets of school operations, including curriculum implementation, ensuring student achievement and success, personnel and financial management, community outreach, student discipline and implementing local sales and marketing strategies. The Principals and Assistant Principals are supported by our regional operations, education and human resources teams and our centralized marketing, real estate, facilities and finance organizations.
We operate and review our performance based on both geographic cluster and individual school based performance criteria. Each school has an annual budget and financial and operating information is collected daily. Certain measures of school and cluster performance are reviewed weekly and others are reviewed monthly or quarterly. We determine whether to monitor a particular aspect of performance based on its impact on our operational and financial objectives. For example, net revenue, tuition revenue, certain operating costs and student census information are monitored weekly in relation to our objectives.
Executive Directors
Executive Directors oversee the Principals and schools and report to a Regional Vice President. Executive Directors, along with our Education Department, are responsible for ensuring the qualifications of Principals and Assistant Principals, as well as training and development. School Principals and Executive Directors work closely with regional Education Managers and corporate management, particularly in the regular assessment of program quality and school performance.
We hire qualified candidates and attempt to promote from within when possible. Candidate credentials are reviewed through employment references, criminal background checks and appropriate education verification in order to establish an understanding of the candidates’ skills, professionalism and character. After hiring, it is our policy that employees receive regular performance feedback including a formal annual performance evaluation. Our Principals and Executive Directors may be eligible for incentive compensation based on the performance of their schools.
Private Pay Schools
General Education Schools
The Company operates a complementary dual track strategy. Track 1 is the preschool strategy track in which the Company operates preschools that are generally clustered in geographic areas. Clusters of preschools are placed in geographic markets where the economy and population meet our demographic profile. Track 2 is the K-12 strategy track. This track primarily includes brick and mortar schools which typically start at kindergarten and may go through grade 8. We also operate a K-12 distance learning and online school. We believe that both the preschool strategy track and the K-12 strategy track provide the company with multiple growth opportunities. In markets where our strategy tracks are integrated, students from our preschools can easily matriculate into our elementary/middle school programs.
Many of our preschools and elementary schools allow for early drop-off and late pick-up to accommodate busy parent schedules. In most preschool locations, programs are available for children starting at six weeks of age. We believe that parents can feel comfortable leaving their children at one of our schools knowing the children will receive both a quality education and engage in well-supervised developmental, recreational and enrichment activities.
Our schools also offer athletic activities and supplemental programs, which include day field trips coordinated with our curriculum to zoos, libraries, museums and theaters and, at the middle schools, overnight trips to such places as national parks and historical locations, and select summer trips to European destinations. Schools arrange classroom presentations by parents, community leaders and other volunteers to supplement instruction. We also organize programs that allow students to present to community groups and organizations. To enhance the child’s physical, social, emotional and intellectual growth, schools may provide extra-curricular
4
Table of Contents
experiences (some fee-based) tailored to particular families’ interests. These activities include but are not limited to dance, gymnastics, instrumental music lessons and computer-based technology programs. Additionally, students expand their horizons through participation in science fairs, drama clubs and local and regional academic competitions. Most of our preschools and elementary schools complement their educational programs with enrichment programs, arts programs, before-and-after-school programs and summer programs or camps. In addition to those revenue generating programs, our schools seek to improve margins by providing ancillary services and products, such as portrait photos, books and uniform sales.
Laurel Springs Distance Learning and Online College Prep K-12
In September, 2009, we Acquired Laurel Springs School, a K-12 distance learning private school. Curriculum is delivered to students via text, online and through project-based learning symposiums. Laurel Springs’ students are supported by teachers and staff who work with students on a one-to-one basis. Laurel Springs focuses on the college prep student who wishes to grow and excel academically and personally while keeping a flexible and self-paced schedule. Most students at Laurel Springs are full time, but some students take a course or two while concurrently enrolled in another school. Many of these part time students take courses to get ahead of their traditional course and/or grade path or take courses which are not offered in their school. Courses are mastery based, so students can move through a course at their own pace once they pass a series of assessments.
Marketing
Our primary sources for generating new enrollments include word-of-mouth recommendations from current parents, interactive marketing including search engine marketing, direct mail campaigns, yellow page listings and public relations programs. We utilize a paid search engine marketing program that is customized to generate and track new leads for each individual market and product type. We also market to our own database of parent inquiries through ongoing direct mail and e-mail communications.
Marketing efforts towards continuous improvement of customer acquisition and retention are directed by a central marketing team. Working in conjunction with school operations management and the education team, marketing formulates consistent brand positioning and communication strategies that can be customized to each local area and type of school. The efforts of central marketing are supplemented by community-based activities conducted by our local Executive Directors and Principals.
Our annual marketing calendar is synchronized with the typical customer demand cycle for enrollment. Although marketing campaigns and demand take place throughout the year, we direct the most marketing resources towards our preschool enrollments in late summer and early winter and towards our K+ schools during fall and winter.
The Company has implemented a number of marketing communication tools to strengthen our communications with existing customers and increase customer retention and length of stay. These tools include, but are not limited to, e-mail newsletters, enhanced school specific websites, updated in-school and in-classroom communication materials and parent satisfaction surveys.
Corporate Development—Strategy and Implementation
Our growth strategy in the private education market includes internal growth of our enrollment at existing schools, expansion of current facilities, new school development in both existing and new markets and strategic acquisitions.
Much of our focus is on increasing occupancy and ancillary program revenue in our existing schools and leveraging the investment in those assets. Management has implemented training programs designed to
5
Table of Contents
strengthen Principals’ and Executive Directors’ sales, marketing and customer service skills and invests in school administrative staffing. In addition, to broaden the potential career path opportunities for employees, we have provided employees the ability to move between locations as appropriate opportunities arise. The similar business and education model our schools operate under permits the Company to execute on this career path strategy. As our growth has increased, we now have a number of examples where our Principals or Assistant Principals have transferred to other schools in different geographic markets.
In addition to the focus on improving the performance of existing schools, the Company also identifies opportunities to develop and open new schools and to acquire schools that are consistent with our demographic profile in contiguous geographic markets.
We regularly analyze the performance of our existing school and real estate portfolio to identify schools that are underperforming and/or do not fit our business model or demographic and geographic cluster strategy. We then develop plans either to improve these schools or remove them from our portfolio. This represents an important activity in reallocating capital to the balance of our schools in order to ensure the continued improvement of our program offerings and overall company performance.
New School Development
During Fiscal 2010, we opened four new preschools. For new school development, we typically engage a developer or contractor to build a facility to our specifications. We also look to occupy existing buildings that are appropriate for our schools and that are located in growth areas that meet our demographic requirements. The Company continues, as part of its strategy, to focus on private pay markets supported by complementary demographics. Our new school development strategy builds upon our practice of clustering schools by geographic area. Clusters of schools are placed in geographic markets where the economy and population meet our demographic profile. In several markets, students from our preschools can easily matriculate into our elementary/middle school programs. In addition, we can potentially convert students from our specialty and before-and-after programs to our general education programs. We believe many of our existing markets have opportunity to add new preschools and we seek to acquire K-8 schools in our existing and new geographic markets.
Acquisitions
We expect to use acquisitions to expand our business. Key acquisition criteria include reputation, location in markets meeting our target demographics, growth prospects, quality of personnel and the ability to integrate into existing market clusters or become the platform for new market clusters. Acquisitions are primarily focused on schools that fit our demographic and cluster strategy and which serve the preschool and/or kindergarten through eighth grade markets. From time to time we evaluate opportunities which, while related in educational content, may provide the Company entry into a variety of other business models. These may include companies that have business models that focus on extending our platform through high school, on-line K-12 schools, on-line course delivery, enrichment programs, summer camps, technology based before-and-after school programs, and concepts with a focus on international students.
During the first quarter of Fiscal 2010, the Company acquired the Laurel Springs School (“Laurel Springs”), an online and distance learning school (www.laurelsprings.com). Laurel Springs’ educational program spans the entire K-12 market and has a fully accredited curriculum that includes Honors AP Courses, a Gifted and Talented program, a chapter of the National Honors Society and a strong college preparatory program. Laurel Springs’ student body includes elite athletes, entertainers, and home schooled students. Laurel Springs has served students from all fifty states and a number of foreign countries. The acquisition of Laurel Springs extends our educational programs through high school and provides a distance learning and online K-12 platform.
6
Table of Contents
Also, during the first quarter of Fiscal 2010, the Company completed the acquisition of Gifted Child Studies, Inc. (“GCS”). GCS added one elementary school to the Company’s existing market coverage in the San Diego, California market.
During the fourth quarter of Fiscal 2009, we acquired three Montessori schools in central New Jersey collectively referred to as “Montessori Corner”, the addition of these schools added one elementary school and two preschools to the three Montessori method schools already in the Company’s portfolio of schools. Also during the fourth quarter of Fiscal 2009, the Company acquired the Highpointe Children’s Academy (“Highpointe”). The addition of Highpointe added a preschool and an elementary school and expanded the Company’s existing market coverage in the Dallas, Texas market. During the third quarter of Fiscal 2009 the Company acquired Country Tyme Preschool, which expanded the Company’s existing market coverage in the Southeastern Pennsylvania market. During the first quarter of Fiscal 2009, the Company acquired Southern Highlands Preparatory Schools (“SHPS”) which included a preschool and elementary school and expanded the Company’s existing market coverage in the Las Vegas, Nevada market. SHPS has become a destination middle school for many of our elementary school students from one of our Merryhill elementary schools in that market. Additionally, during the first quarter of Fiscal 2009 the Company acquired Ivy Kids Learning Center School (“Ivy Kids”) which has subsequently been rebranded under the Company’s existing “The Honor Roll School®” brand. The Ivy Kids acquisition expanded the Company’s existing market coverage in the Houston, Texas market by adding one preschool to a market in which the Company currently operates.
During Fiscal 2008, we acquired Enchanted Care Learning Centers, the acquisition included six standalone facilities offering before-and-after school programs for elementary school-age children under the Kid’s Campus trade name. This acquisition provides the Company opportunities in existing and new geographic markets to further develop its growth strategy. In addition, the Fiscal 2008 acquisition of the Ivy Glen Schools in the Dallas market also provided the company with one standalone before-and-after school program. During Fiscal 2008, the Company further enhanced the value of the Discovery Isle acquisition and the Discovery Isle brand by acquiring two additional schools in the southern California market previously branded as Teddy Bear Treehouse Schools, which were quickly re-branded as Discovery Isle schools. Also during Fiscal 2008, the Company acquired four Learning Ladder preschools, three of which were rebranded under the Company’s existing Chesterbrook Academy brand, and the fourth of which was closed shortly after completing the acquisition. During the fiscal year ended June 30, 2007 (“Fiscal 2007”), we entered a new geographic market with the acquisition of the six Discovery Isle preschools in San Diego, California. In this case, the acquisition provided the Company the opportunity to expand the Discovery Isle preschool brand through the development or acquisition of additional preschools and elementary and/or middle schools that could utilize the Discovery Isle preschools as a feeder system for elementary school students.
7
Table of Contents
The table below summarizes the Company’s recent history of acquisitions:
| Number of facilities acquired | Market | |||||||||||
Name of Acquisition | Fiscal Year | Preschool | PreK & K - 8 | Before-and-After (2) | Description | (N)ew or (E)xisting | ||||||
Laurel Springs School | 2010 | — | — | — | Distance Learning | N | ||||||
Gifted Child Studies, Inc. | 2010 | — | 1 | — | San Diego, CA | E | ||||||
Montessori Corner | 2009 | 2 | 1 | — | Princeton, NJ | N | ||||||
HighPointe Childrens Academy | 2009 | — | 1 | — | Dallas, TX | E | ||||||
Country Tyme | 2009 | 1 | — | — | Limerick, PA | E | ||||||
Southern Highlands Preparatory Schools | 2009 | 1 | 1 | — | Las Vegas, NV | E | ||||||
Ivy Kids Early Learning Center | 2009 | 1 | — | — | Missouri City, TX | E | ||||||
Camelback Desert Schools (1) | 2008 | — | 2 | — | Phoenix, AZ | N | ||||||
Enchanted Care Learning Centers (2) | 2008 | 9 | — | 6 | Columbus, OH | N | ||||||
Ivy Glen Schools | 2008 | 3 | — | 1 | Dallas, TX | E | ||||||
Teddy Bear Treehouse | 2008 | 2 | — | — | San Diego, CA | E | ||||||
Learning Ladder (3) | 2008 | 4 | — | — | Lancaster, PA | E | ||||||
Discovery Isle | 2007 | 6 | — | — | San Diego, CA | N | ||||||
| (1) | During the fourth quarter of Fiscal 2009, the Company closed one Camelback Desert School. The results of this school are included in Net income (loss) from discontinued operations in the periods presented in this Form 10K. |
| (2) | Before-and-After facilities are integral to adjacent school facilities and as such are not incremental to total school count |
| (3) | In conjunction with the acquisition of Learning Ladder schools the Company determined one location would be closed. This location was closed during the same quarter that this acquisition was completed. |
Seasonality
Our elementary/middle schools historically have lower operating revenues in the summer due to the end of the traditional academic year and seasonally lower enrollment and related fees in summer programs. Summer revenues of preschools are, to a lesser degree, subject to the same seasonality. Management seeks to reduce the seasonal fluctuations of the Company’s revenue stream by adding to its schools a mix of products and services, such as camp programs, in the lower revenue seasons.
Industry and Competition
Education reform movements in the United States are providing new alternatives to the public schools. These reforms include charter schools, private management of public schools, home schooling, private schools, virtual charter schools, state run virtual schools, virtual private schools and voucher programs. Our strategy is to provide parents a high quality alternative to public schools and traditional child care through our privately owned and operated schools, utilizing proven curriculum in a safe and challenging environment. We consider each of these alternatives to be competition for our schools and the expansion or contraction of funding and/or public support of these alternatives may impact the demand for our product, available real estate and our ability to increase or maintain our operating margins. Additionally, throughout this document, references are made to the child care industry, child care and child care competitors. Many of the companies with which we compete with offer child care services and many of our potential customers need child care services. In many cases, our curriculum-based preschools are suitable substitutes that can satisfy the child care demand while offering the additional educational developmental programs and services delivered in our preschools.
8
Table of Contents
Furthermore, we compete with other for-profit private schools, charter schools, non-profit schools, sectarian schools, private virtual schools, public virtual schools and home schooling. We also face competition with respect to preschool services and before- and-after-school programs from public schools, government-based providers and religiously affiliated community-based or other non-profit programs that may offer such services at little or no cost to parents. We anticipate that, given the perceived potential of the education market, well-financed competition may emerge, including possible competition from the large for-profit child care companies and international school operators. We believe the only large for-profit competitors that integrate preschool, elementary education and school age programs in the U.S. and that currently compete beyond a regional level are privately held Knowledge Learning Corp., Bright Horizons Family Solutions, Inc. and Mini-Skools, Challenger Schools and Learning Care Group. We also face regional competition in each of our markets from operators of individually owned private schools. Finally, public school systems may become stronger competitors at the preschool level if additional states pass or expand universal pre-K legislation that provides public funds for preschool for three and four year olds and does not allow for-profit preschool operators to participate in these programs, or fund payments to for-profit operators at lower than market prices or costs.
While price is an important factor in competing in both the preschool and elementary school markets, we believe that other competitive factors are also important, including trained teachers, location, professionally developed educational programs, qualified and trained school administrators, well-equipped facilities, relationships with local employers and a broad range of ancillary services, including before-and-after-school programs, transportation and infant care. Some of these services are not offered by some of our competitors. We conduct annual tuition rate surveys and believe we are competitively priced in each of our markets.
Regulation
Our schools are subject to national, state and local regulations and licensing requirements. We have policies and procedures in place to assist in complying with such regulations and requirements. These regulations and the administrative bodies in charge of these regulations vary from jurisdiction to jurisdiction and may apply differently within the same jurisdiction to a preschool, elementary or middle school. The regulatory and licensing requirements tend to be more stringent with respect to preschools, as government agencies generally review the fitness and adequacy of buildings and equipment, the ratio of staff personnel to enrolled children, staff training, record keeping, children’s dietary program, daily curriculum and compliance with health and safety standards. In most jurisdictions, these agencies conduct scheduled and unscheduled inspections of the schools and licenses must be renewed periodically. Most jurisdictions establish requirements for background checks or other clearance procedures for new employees of schools. Repeated failures of a school to comply with applicable regulations can subject the school to sanctions, which might include probation or, in more serious cases, suspension or revocation of the school’s license to operate and could also lead to investigations of our other schools located in the same jurisdiction. In addition, this type of action could lead to negative publicity extending beyond that jurisdiction and potentially affecting our other locations. We believe that our operations are in substantial compliance with all material regulations applicable to our business. However, there is no assurance that a licensing authority will not determine a particular school to be in violation of applicable regulations and take action against that school and possibly other schools in the same jurisdiction. In addition, there may be unforeseen changes in regulations and licensing requirements, such as changes in the required ratio of child center staff personnel to enrolled children that could have a material adverse effect on our operations. States in which we operate routinely review the adequacy of regulatory and licensing requirements and implement changes, which may significantly increase our costs to operate in those states.
Environmental Compliance
We are not aware of any existing environmental conditions that currently or in the future could reasonably be expected to have a material adverse effect on our financial position, operating results or cash flows and we have not incurred material expenditures to address environmental conditions at any school. Although we have periodically conducted limited environmental investigations and remedial activities at some of our schools, we
9
Table of Contents
have not undertaken an in-depth environmental review of all of our schools and accordingly, there may be material environmental liabilities of which we are unaware. In addition, no assurances can be given that future laws or regulations will not impose any material environmental liability.
Insurance
We currently maintain comprehensive general liability, workers’ compensation, automobile liability, property, excess umbrella liability, terrorism, student accident insurance and directors’ and officers’ liability insurance. The policies provide a variety of coverages and limits. Companies involved in the education and care of children, however, may not be able to obtain insurance for the total risks inherent in their operations. In particular, general liability coverage can have sublimits per claim for child abuse. Although we believe we have adequate insurance coverage at this time, claims in excess of, or not included within, our coverage may be asserted. In addition, there can be no assurance that in future years we will not become subject to lower limits or a substantial increase in insurance premiums.
Employees
As of September 9, 2010, we employed approximately 4,700 persons. None of the Company’s employees are represented by a labor union. We believe that our relationship with our employees is satisfactory.
Recently the child care industry in general saw an increase in organized labor contracts with child care workers and preschool teachers, especially in states such as Washington and California. While there have been no specific attempts to organize our teachers or other employees, there is no assurance that in future years we or the industry will not be subject to some form of labor organization attempt.
Available Information
All periodic and current reports, registration statements, code of conduct and other material that the Company is required to file with the Securities and Exchange Commission (“SEC”), including the Company’s annual reports on Form 10-K, quarterly reports on Form 10-Q, current reports on Form 8-K and amendments to those reports filed or furnished pursuant to Section 13(a) of the Securities and Exchange Act of 1934 (“the 1934 Act Reports”), are available through the Company’s investor relations page at www.nobellearningcommunities.com. Such documents are available as soon as reasonably practicable after electronic filing of the material with the SEC. The Company’s Internet website and the information contained therein or connected thereto are not intended to be incorporated into this Annual Report on Form 10-K.
The public may also read and copy any materials filed by the Company with the SEC at the SEC’s Public Reference Room at 100 F Street, NE, Washington, DC 20549. The public may obtain information on the operation of the Public Reference Room by calling the SEC at 1-800-SEC-0330. The SEC maintains an Internet site at www.SEC.gov, which contains reports, proxy and information statements, and other information regarding issuers that file electronically with the SEC.
Each of the following risks, individually or in a group, could have a material adverse affect on the Company’s business, results of operations, financial condition or cash flows.
Changing economic conditions, including unemployment rates, as demand for the Company’s products and services are a lagging indicator of the economy
The Company’s revenue and net income are subject to general economic conditions. The Company’s revenues depend, in part, on the number of dual-income families and working single parents who require child
10
Table of Contents
development, child care or educational services. A deterioration of general economic conditions, including a soft housing market and rising unemployment may adversely impact the Company because of the tendency of out-of-work parents to diminish or discontinue utilization of these services. In addition, the Company may not be able to increase tuition at a rate consistent with increases in wages, health insurance and other operating costs or continue tuition increases at historical rates experienced in the industry. Finally, there can be no assurance that demographic trends, including the number of dual-income families in the work force, will continue to lead to increased market share.
Changing social and economic conditions and their impact on public school systems
Recently, the general economy and budget constraints have caused some public school systems to study moving to a four day school week, year round school calendar or shorter school year. To the extent that there are any material changes to the traditional school year schedule, it may impact our business. There is uncertainty as to whether these changes will be implemented in any of our markets and if so, what the impact on our business may be. Additionally, due to state and local economic pressures due to the general economy, many public school systems are changing their policy relating to providing transportation for children within the school district who attend private school. While we have few schools whose students receive transportation through public school systems, there may be some impact on students in some of our schools, should the public school systems change their transportation policies. Finally, in reaction to the recession and budget cuts, many public school systems are re-evaluating policies and programs such as class size, subjects offered, transportation and athletic programs. While we do not yet know the impact of decisions made by numerous local school systems, it is possible that changes in public school programs or policies could impact our schools and enrollments. It is unclear whether any potential impact will be positive or negative to our business.
The Company’s ability to hire and retain qualified Executive Directors, Principals, Teachers and Teachers’ Aides
The Company may experience difficulty in attracting and retaining qualified personnel in various markets necessary to meet growth opportunities. Hiring and retaining qualified personnel may require increased salaries and enhanced benefits in more competitive markets. Difficulties in hiring and retaining qualified personnel may also impact the Company’s ability to obtain additional enrollments, and retain existing enrollment at its preschools and elementary schools. In addition, while the Company’s wage ranges are generally materially above minimum wage, any future changes to federal and state changes to the minimum wage laws may reduce the qualified applicant pool or increase our wage costs.
Recently the child care and preschool industries in general saw an increase in organized labor contacts with child care workers and preschool teachers, especially in states such as Washington and California. While there have been no specific attempts to organize our teachers or other employees, there is no assurance that in future years we or the industry will not be subject to some form of labor organization attempt.
The Company’s ability to retain key individuals in acquired schools and/or successfully identify, acquire, grow and integrate acquired schools’ operations
Acquisitions are an ongoing part of the Company’s growth strategy. Acquisitions involve numerous risks, including potential difficulties in the assimilation of acquired operations, not meeting financial objectives, additional need for capital investment, undisclosed liabilities not covered by insurance or indemnification provisions in the acquisition agreement, diversion of management’s attention in connection with an acquisition and potential loss of key employees of the acquired operation. No assurance can be given as to the success of the Company in identifying, executing and integrating acquisitions in the future or the ability to identify satisfactory acquisition targets and successfully complete any acquisition.
11
Table of Contents
The Company’s inability to defend successfully against or counter negative publicity associated with claims involving alleged incidents at its schools
Because of the nature of its business, the Company is and expects that in the future it will be subject to claims and litigation alleging negligence, inadequate supervision and other grounds for liability arising from injuries or other harm to the children it serves, primarily children. In addition, claimants may seek damages from the Company for child abuse, sexual abuse and other acts allegedly committed by Company employees. There can be no assurance that additional lawsuits will not be filed, that the Company’s insurance will be adequate to cover liabilities resulting from any claim or that any such claim or that the publicity resulting from it will not have a material adverse effect on the Company’s business, results of operations and financial condition including, without limitation, adverse effects caused by increased cost or decreased availability of insurance and decreased demand for the Company’s services.
We currently maintain comprehensive general liability, workers’ compensation, automobile liability, property, excess umbrella liability, terrorism, student accident insurance and directors’ and officers’ liability insurance. The policies provide a variety of coverages and limits. Companies involved in the education and care of children, however, may not be able to obtain insurance for the total risks inherent in their operations. In particular, general liability coverage can have sublimits per claim for child abuse. Although we believe we have adequate insurance coverage at this time, claims in excess of, or not included within, our coverage may be asserted. In addition, there can be no assurance that in future years we will not become subject to lower limits or substantial increase in insurance premiums.
Increased employer costs of employee healthcare benefits and further employer subsidies
Rising healthcare costs and interest in universal healthcare coverage in the United States have resulted in government and private sector initiatives proposing healthcare reforms. On March 10, 2010, The Health Care and Education Reconciliation Act of 2010 was signed into law. Various healthcare reform proposals have also emerged at the state level. We cannot predict what, if any, further healthcare initiatives will be implemented at the federal or state level, or the effect this or any future legislation or regulation will have on us. However, we may be required in the future to provide healthcare benefits to a greater percentage of our employees and to subsidize a greater percentage of the costs of healthcare benefits of our employees. The resulting increased costs could adversely affect our financial condition and results of operations.
Control of a majority of the outstanding common stock of the Company by a small number of stockholders
A limited number of our stockholders can exert significant influence over us. As of September 16, 2010, four stockholders and their affiliates controlled approximately 70% of the Company’s outstanding Common Stock. This share ownership would permit these and other stockholders, if they chose to act together, to exert significant influence over the outcome of stockholder votes, including votes concerning the election of directors, by-law amendments, possible mergers, corporate control contests and other significant corporate transactions.
The effect of anti-takeover provisions in the Company’s Certificate of Incorporation, bylaws and Delaware law and Shareholders’ Rights Plan
The Company’s certificate of incorporation and bylaws contain certain provisions that could make more difficult the acquisition of the Company by means of a tender offer, a proxy contest or otherwise. These provisions establish staggered terms for members of the Company’s Board of Directors and include advance notice procedures for stockholders to nominate candidates for election as directors of the Company and for stockholders to submit proposals for consideration at stockholders’ meetings. In addition, the Company is subject to Section 203 of the Delaware General Corporation Law (“DGCL”) which limits transactions between a publicly held company and “interested stockholders” (generally, those stockholders who, together with their affiliates and associates, own 15% or more of a company’s outstanding capital stock). This provision of the DGCL may have the effect of deterring certain potential acquisitions of Nobel Learning Communities. The Company’s certificate
12
Table of Contents
of incorporation provides for 8,936,170 authorized but unissued shares of preferred stock. The rights, preferences, qualifications, limitations and restrictions of these unissued authorized shares preferred stock may be fixed by the Company’s Board of Directors without any further action by stockholders.
On July 20, 2008, the Company’s Board of Directors adopted a limited duration Shareholder Rights Plan designed to protect the Company’s shareholders in the event of an attempt to acquire control of the Company on terms which do not secure fair value for all of the Company’s shareholders. The Board has adopted a limited duration Plan that expires in four years, rather than the more common ten-year term. The four-year term was selected to provide the Company with an opportunity to maximize long-term shareholder value by enabling management of the Company to execute on its growth strategy, while protecting shareholders from a creeping acquisition or other tactics to gain control of the Company without offering all shareholders an adequate price. In addition, the Plan is not intended to prevent a takeover. Instead, it is intended to encourage anyone seeking to acquire the Company to negotiate with the Company’s Board of Directors prior to attempting a takeover in order to ensure that any takeover reflects an adequate price and is consistent with interests of the Company’s shareholders and other constituencies.
The Company’s ability to find affordable real estate and renew existing locations on terms acceptable to the Company
We may be unable to identify and successfully negotiate or renew existing leases at attractive rents; which may impact the Company’s profitability. In addition, if the Company cannot renew school leases for an appropriate term length, it may impact enrollment should parents become concerned with the length of time a school will remain open in a particular location.
The Company’s ability to obtain the capital required to implement fully its business and strategic plan
Our ability to execute our business and strategic plan is dependent upon the availability of adequate financing sources on acceptable terms. Our efforts to execute our business plan and open or acquire new schools are subject to our ability to finance such growth. Based on current economic events and the related restraint in the capital markets, financing resources may be inadequate to support new school openings or acquisitions, and we may be required to seek additional capital to support such expansion efforts. Such additional capital may take the form of the issuance of debt or equity securities, among other forms. Beyond our existing revolving senior credit facility, we presently have no commitments to provide the Company with any additional capital should we determine that additional capital is required. In the event that management determines that additional capital is required to support the Company’s business and strategic plan, there is no assurance that we will be able to secure such financing on acceptable terms under the current condition of the capital markets. If we are unable to secure needed additional capital, our growth efforts would be curtailed.
Competitive conditions in the preschool and elementary school education and services industry, such as the growth of competitors as possible alternatives to the public school system, including virtual charter schools, charter schools and magnet schools
We compete for individual enrollment in a highly fragmented market. For enrollment, the Company competes with residential based child care (operated out of the caregiver’s home) and center-based child care which may include work-site child care centers, full and part-time child care centers and preschools, private and public elementary schools, and church-affiliated, government subsidized and other not-for-profit providers and schools. In addition, substitutes for organized preschool, child care, and educational services, such as relatives and others caring for a child or home schooling, can represent lower cost alternatives to the Company’s services. Management believes our ability to compete successfully depends on a number of factors, including qualifications of Principals and teachers, quality of care, quality of curriculum, site convenience and cost. We are often at a price disadvantage with respect to these alternative providers, who operate with little or no rental expense, little or no curriculum expense, and generally may not comply or are not required to comply with the
13
Table of Contents
same health, safety, insurance and operational regulations as the Company. Competitors in the private pay education service segment also may offer similar or competing services at a lower price than the Company and some may have access to greater financial resources than the Company. The Company also competes with many not-for-profit providers of child care and preschools, some of which receive government subsidies, as well as elementary schools, some of which are able to offer lower pricing than the Company. In addition, the Company is currently studying the impact, if any, of the rapid expansion of virtual, or on-line, schools on demand for the Company’s elementary and middle school products. There can be no assurance that the Company will be able to compete successfully against current and future competitors.
Government regulations affecting school operations
Our schools or other school and child-care based centers and programs are subject to numerous national, state and local regulations and licensing requirements. Although these regulations vary greatly from jurisdiction to jurisdiction, government agencies generally review, among other things, the adequacy of buildings and equipment, licensed capacity, the ratio of staff to children, educational qualifications of teachers and staff training, record keeping, the dietary program, the daily curriculum, hiring practices and compliance with health and safety standards. Failure of any location to comply with applicable regulations and requirements could subject it to governmental sanctions, which might include fines, corrective orders, probation, or, in more serious cases, suspension or revocation of the location’s license to operate or an award of damages to private litigants and could require significant expenditures by the Company to bring its location into compliance. Many government agencies may publish or publicly report major and/or minor regulatory violations and the Company may suffer adverse publicity, which could result in a loss of enrollment in a school or market. We believe that our operations are in substantial compliance with all material regulations applicable to our business. However, there is no assurance that a licensing authority will not determine a particular school to be in violation of applicable regulations and take action against that school and possibly other schools in the same jurisdiction. In addition, there may be unforeseen changes in regulations and licensing requirements, such as changes in the required ratio of child center staff personnel to enrolled children that could have a material adverse effect on our operations. States in which we operate routinely review the adequacy of regulatory and licensing requirements and implement changes, which may significantly increase our costs to operate in those states.
We have several special purpose high schools that provide our graduates with state-approved high school diplomas. There have been instances in the past when the local school district has determined our education materials or curriculum did not meet requirements for credit in their district thereby limiting our ability to successfully attract students. There is a risk that such determinations may be made in the future with respect to the same or different schools, and that as a result, our enrollment and financial performance in such schools will suffer.
We may not be able to adequately protect our intellectual property, which could adversely affect our business
We rely on a combination of trademarks, copyrights, service marks, trade secrets, and similar intellectual property rights to protect our brands and other intellectual property. Our ability to successfully execute our business strategy depends, in part, on our ability to use our existing intellectual property to enhance brand awareness in current and future markets. There can be no assurance that the actions we have taken to establish and protect our intellectual property will be adequate to prevent infringement, dilution, or other violation of our trademarks by others or to prevent others from claiming that our services infringe, dilute or otherwise violate third party trademarks or other proprietary rights. In some cases, litigation, which can result in substantial costs and diversion of our resources, may be necessary to protect our trademarks and other intellectual property rights or to defend against claims by third parties alleging that we infringe, dilute, misappropriate or otherwise violate third party trademark or other intellectual property rights.
The laws of foreign countries may not protect our intellectual property to the same extent as the laws of the United States. If our efforts to protect our intellectual property are not adequate, or if any third party
14
Table of Contents
misappropriates or infringes on our intellectual property, the value of our brands could be harmed which could adversely affect our business and operating results.
If additional jurisdictions pass “living wage” laws, our operations in those jurisdictions could be negatively impacted
“Living wage” laws set minimum wage rates above the federal minimum wage, adjusted to local cost of living conditions. Currently such laws exist or have recently passed at the state, county or local level in New York, California, Oregon, Washington and North Carolina. In many cases, the laws only cover certain job classifications (e.g., home health care workers in New York City) and are only applicable to companies doing business with or receiving benefits from state or local governments and agencies. Recently, there has been an effort in a number of jurisdictions to extend these benefits to child care workers, primarily in New York and California. Living wage laws, if enacted in jurisdictions where we do business, could increase our costs of operations and have a material, negative impact on our business and financial condition in those areas.
Breaches in data security could adversely affect the Company’s financial condition and operating results
For various operational needs, we receive certain personal information from enrolled and potential students, families and employees, such as names, addresses, credit and debit card numbers, and other information of a sensitive nature. While we have policies and practices that protect our data, a compromise of our systems, whether caused by a third party or by employee error or malfeasance, that results in personal information being obtained by unauthorized persons could adversely affect our reputation and brand, as well as our operations and financial condition, and could result in litigation against us or the imposition of fines and penalties. In addition, any security breach or inadvertent disclosure of personal or confidential information could require us to expend significant additional resources related to the security of information systems, could result in a disruption of our operations, and cause significant harm to our reputation and brand, all of which could reduce demand for our services.
The establishment of government mandated Universal Pre-K or similar programs or benefits that do not allow for participation by for-profit operators or allows for participation at low reimbursement rates
National, state or local child care and early age education benefit programs relying primarily on subsidies in the form of tax credits or other direct financial aid could provide the Company opportunities for expansion in additional markets, especially where these benefits are universal based on residency and age, as opposed to those based on socio-economic need or measures. However, a universal benefit with governmentally mandated or publicly provided child care could reduce the demand for educational services at the Company’s existing locations. Even in situations where the Company was allowed to provide publicly funded early age education programs, the amount of public funding, the rates at which the subsidies are granted, our subsidy participation requirements or restrictions could have a material adverse effect on the Company’s business and financial condition if the Company were to undertake these programs.
The Company’s ability to maintain compliance with operational covenants as defined among the Company and its lenders
The Company is required to meet or exceed certain financial covenants as defined by the 2008 Amended Credit Agreement. As the Company’s revenue and net income are subject to general economic conditions as described above, there may be risks in meeting or exceeding these covenants. The potential risks of not meeting these covenants could include the inability to borrow under the 2008 Amended Credit Agreement, the requirement to repay outstanding borrowings under the 2008 Credit Agreement, a charge from the lenders to amend the 2008 Amended Credit Agreement or to waive the non-compliance, and increased interest costs, certain of which would have a material adverse effect on the Company.
15
Table of Contents
The impact of the recently enacted Dodd-Frank Wall Street Reform and Consumer Protection Act
On July 21, 2010, The Dodd-Frank Wall Street Reform and Consumer Protection Act (the “Financial Reform Act”) was signed into law. The Financial Reform Act includes regulations intended to enhance SEC enforcement authority and provides for additional corporate governance requirements. New regulations associated with the Financial Reform Act may have impacts upon legal entity structures and business lines, corporate governance and organization, operations and IT systems, risk management and internal control frameworks, tax planning, regulatory and public disclosures and legal and compliance demands. We cannot predict what, if any, further initiatives may be required in future periods that impact the scope of this Financial Reform Act. The Company’s efforts to maintain compliance within the scope of the requirements provided by the Financial Reform Act may impact the Company’s business and financial condition.
The impact of the litigation with the U.S. Department of Justice concerning alleged violations of the Americans with Disabilities Act of 1990 on our results of operations or cash flows in future periods
The United States Department of Justice (Disability Rights Section of the Civil Rights Division) (“DOJ”) filed a lawsuit on April 29, 2009 in the U.S. District Court for the Eastern District of Pennsylvania against the Company alleging that the Company violated Title III of the Americans with Disabilities Act of 1990 (“ADA”) by excluding children with disabilities from its schools and programs. The complaint seeks an unspecified amount in compensatory damages and civil penalties, as well as declaratory and injunctive relief.
The Company is committed to complying with and believes it has complied with the ADA in providing access to children with disabilities. The Company believes that the DOJ’s allegations are without merit, and intends to defend against these allegations vigorously.
The Company is not able at this time to estimate the range of loss, if any, arising out this matter since its outcome is uncertain. Although it does not expect that the resolution of the matter will have a material adverse effect on its financial condition, results of operations or cash flows, there can be no assurances in this regard.
Environmental or health related events that could affect schools in areas impacted by such events
We are not aware of any existing environmental conditions that currently or in the future could reasonably be expected to have a material adverse effect on our financial position, operating results or cash flows and we have not incurred material expenditures to address environmental conditions at any school. Although we have periodically conducted limited environmental investigations and remedial activities at some of our schools, we have not undertaken an in-depth environmental review of all of our schools and accordingly, there may be material environmental liabilities of which we are unaware. In addition, no assurances can be given that future laws or regulations will not impose any material environmental liability.
A regional or global health pandemic could severely disrupt our business. A health pandemic is a disease that spreads rapidly and widely by infection and affects many individuals in an area or population at the same time. If a regional or global health pandemic were to occur, depending upon its severity and duration, the Company’s business could be severely affected. Enrollment in our schools could experience sharp declines as parents might avoid taking their children out in public in the event of a health pandemic, and local, regional or national governments might limit or ban public interactions to halt or delay the spread of disease causing business disruptions and the temporary closure of our schools. A health pandemic could impair our ability to hire and retain an adequate level of staff. The impact of a health pandemic on the Company might be disproportionately greater than on other companies that depend less on the interaction of people for the sale of their products and services.
Our financial and operating performance may be adversely affected by acts of God, such as natural disasters, in locations where we own and/or lease school properties. Some types of losses, such as those from earthquakes, hurricanes, terrorism and environmental hazards may be either uninsurable or too expensive to
16
Table of Contents
justify insuring against. Should an uninsured loss or a loss in excess of insured limits occur, we could lose all or a portion of the capital we have invested in a property, as well as the anticipated future revenue from the school. In that event, we might nevertheless remain obligated for any lease obligations, mortgage debt or other financial obligations related to the property. In addition, the degree of preparedness, contingency planning or recovery capability in relation to a major incident or crisis may hinder operational continuity and consequently impact the value and reputation of our business.
| ITEM 1B. | UNRESOLVED STAFF COMMENTS. |
None.
| ITEM 2. | PROPERTIES. |
At September 15, 2010, we operated 184 schools on 5 owned and 179 leased properties in 15 states and the District of Columbia. Our schools are geographically distributed as follows:
Location | Number of Schools | |
Arizona | 1 | |
California | 38 | |
District of Columbia | 1 | |
Florida | 8 | |
Illinois | 20 | |
Maryland | 1 | |
Nevada | 9 | |
New Jersey | 10 | |
North Carolina | 17 | |
Oregon | 3 | |
Ohio | 9 | |
Pennsylvania | 23 | |
South Carolina | 2 | |
Texas | 17 | |
Virginia | 19 | |
Washington | 6 | |
Total | 184 | |
In addition to the school locations listed above, Laurel Springs School, our online K-12 School, leases one property in California and one property in Oregon. We lease 22,500 square feet of space for our corporate offices in West Chester, Pennsylvania. This space is adequate for our current needs.
The land and buildings that we own are subject to security interests on the real property. Our leased properties are leased under long-term leases which are typically triple-net leases requiring us to pay all applicable real estate taxes, utility expenses, insurance and operating costs. These leases usually contain inflation indexed rent escalators.
| ITEM 3. | LEGAL PROCEEDINGS. |
The DOJ filed a lawsuit on April 29, 2009 in the U.S. District Court for the Eastern District of Pennsylvania against the Company alleging that the Company violated Title III of the ADA by excluding children with disabilities from its schools and programs. The complaint seeks an unspecified amount in compensatory damages and civil penalties, as well as declaratory and injunctive relief.
17
Table of Contents
The Company is committed to complying with and believes it has complied with the ADA in providing access to children with disabilities. The Company believes that the DOJ’s allegations are without merit, and intends to defend against these allegations vigorously.
The Company is not able at this time to estimate the range of loss, if any, arising out of this matter since its outcome is uncertain. Although it does not expect that the resolution of the matter will have a material adverse effect on its financial condition, results of operations or cash flows, there can be no assurances in this regard.
| ITEM 4. | REMOVEDAND RESERVED. |
None.
18
Table of Contents
| ITEM 5. | MARKETFOR REGISTRANT’S COMMON EQUITY, RELATED STOCKHOLDER MATTERSAND ISSUER PURCHASESOF EQUITY |
Market Information
Our common stock trades on The Nasdaq Global Market under the symbol NLCI.
The table below sets forth the quarterly high and low closing sales prices for our common stock as reported by Nasdaq for each quarter during the period from June 28, 2008 through July 3, 2010.
| High | Low | |||||
Fiscal 2009 (June 29, 2008 to June 27, 2009) | ||||||
First Quarter | $ | 16.00 | $ | 12.17 | ||
Second Quarter | 15.76 | 12.55 | ||||
Third Quarter | 13.86 | 11.37 | ||||
Fourth Quarter | 12.50 | 10.73 | ||||
Fiscal 2010 (June 28, 2009 to July 3, 2010) | ||||||
First Quarter | $ | 12.11 | $ | 9.51 | ||
Second Quarter | 9.66 | 7.41 | ||||
Third Quarter | 8.56 | 5.75 | ||||
Fourth Quarter | 8.10 | 5.90 | ||||
Holders
At September 9, 2010, there were approximately 250 holders of record of shares of our common stock.
Dividend Policy
We have never paid a dividend on our common stock and do not expect to do so in the foreseeable future. Although the payment of dividends is at the discretion of the Board of Directors, we intend to retain our earnings in order to finance our ongoing operations and to develop and expand our business. Our credit facility with our senior lender prohibits us from paying dividends on our common stock or making other cash distributions on our common stock without the lender’s consent.
19
Table of Contents
STOCK PERFORMANCE
The peer group includes other public entities that provide education services; the group includes K12 Inc., Leapfrog Enterprises, Inc., Plato Learning Inc., Princeton Review, Inc., Renaissance Learning Inc. and Voyager Learning, Inc.
The following line graph compares the cumulative total stockholder return on the Common Stock with the total return of the Nasdaq (U.S. Companies) and the industry peer group described above for the period July 2, 2005 through July 3, 2010 as calculated by Morningstar, Inc. The graph assumes that the value of the investment in the common stock and each index was $100 at July 2, 2005 and that all dividends paid by the companies included in the indexes were reinvested.
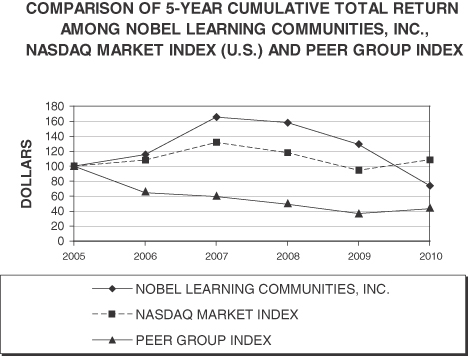
ASSUMES $100 INVESTED ON JULY 2, 2005
ASSUMES DIVIDEND REINVESTED
FISCAL YEAR ENDING JULY 3, 2010
Total Return Index for: | July 2, 2005 | July 1, 2006 | June 30, 2007 | June 28, 2008 | June 27, 2009 | July 3, 2010 | ||||||||||||
Nobel Learning Communities, Inc. | $ | 100.00 | $ | 115.45 | $ | 165.68 | $ | 158.18 | $ | 129.43 | $ | 74.20 | ||||||
NASDAQ Market Index | $ | 100.00 | $ | 108.25 | $ | 131.82 | $ | 118.11 | $ | 94.71 | $ | 108.76 | ||||||
Peer Group Index | $ | 100.00 | $ | 64.61 | $ | 59.60 | $ | 49.46 | $ | 37.06 | $ | 43.45 | ||||||
20
Table of Contents
| ITEM 6. | SELECTED FINANCIAL DATA. |
The following table sets forth selected historical consolidated financial and other data, with dollars in thousands, except per share amounts. See “Item 7. Management’s Discussion and Analysis of Financial Condition and Results of Operations” and “Item 8. Financial Statements and Supplementary Data” included elsewhere in this report. The historical operating results below have been recast to reflect the reclassification of discontinued operations from continuing operations to income (loss) from discontinued operations, net of income taxes.
| For the Fiscal Year Ended | ||||||||||||||||||||
| July 3, 2010 | June 27, 2009 | June 28, 2008 | June 30, 2007 | July 1, 2006 | ||||||||||||||||
Operating Data: | ||||||||||||||||||||
Revenue | $ | 232,035 | $ | 220,103 | $ | 204,201 | $ | 180,823 | $ | 159,898 | ||||||||||
Cost of services | 203,139 | 191,119 | 173,550 | 153,459 | 136,893 | |||||||||||||||
Gross profit | 28,896 | 28,984 | 30,651 | 27,364 | 23,005 | |||||||||||||||
General and administrative expenses (a) | 22,938 | 18,726 | 18,516 | 16,993 | 13,523 | |||||||||||||||
Operating income | 5,958 | 10,258 | 12,135 | 10,371 | 9,482 | |||||||||||||||
Interest expense (b) | 1,571 | 981 | 475 | 1,385 | 1,469 | |||||||||||||||
Other income, net (c) | (30 | ) | (78 | ) | (326 | ) | (3,871 | ) | (350 | ) | ||||||||||
Income from continuing operations before income taxes | 4,417 | 9,355 | 11,986 | 12,857 | 8,363 | |||||||||||||||
Income tax expense | 1,711 | 3,622 | 4,621 | 5,021 | 3,269 | |||||||||||||||
Income from continuing operations | 2,706 | 5,733 | 7,365 | 7,836 | 5,094 | |||||||||||||||
Income (loss) from discontinued operations, net of income tax (d) | (834 | ) | (1,169 | ) | 313 | (471 | ) | (615 | ) | |||||||||||
Net income | 1,872 | 4,564 | 7,678 | 7,365 | 4,479 | |||||||||||||||
Preferred stock dividends | — | — | — | 325 | 487 | |||||||||||||||
Net income available to common stockholders | $ | 1,872 | $ | 4,564 | $ | 7,678 | $ | 7,040 | $ | 3,992 | ||||||||||
Basic income per share: | ||||||||||||||||||||
Income from continuing operations | $ | 0.26 | $ | 0.55 | $ | 0.71 | $ | 0.85 | $ | 0.62 | ||||||||||
Discontinued operations | (0.08 | ) | (0.11 | ) | 0.03 | (0.06 | ) | (0.08 | ) | |||||||||||
Income per share (may not sum due to rounding) | $ | 0.18 | $ | 0.44 | $ | 0.74 | $ | 0.79 | $ | 0.54 | ||||||||||
Diluted income per share: | ||||||||||||||||||||
Income from continuing operations | $ | 0.25 | $ | 0.54 | $ | 0.69 | $ | 0.75 | $ | 0.51 | ||||||||||
Discontinued operations | (0.08 | ) | (0.11 | ) | 0.03 | (0.05 | ) | (0.06 | ) | |||||||||||
Net income per share (may not sum due to rounding) | $ | 0.18 | $ | 0.43 | $ | 0.72 | $ | 0.70 | $ | 0.44 | ||||||||||
Weighted average common shares outstanding (in thousands): | ||||||||||||||||||||
Basic | 10,532 | 10,456 | 10,382 | 8,957 | 7,473 | |||||||||||||||
Diluted | 10,619 | 10,701 | 10,630 | 10,580 | 10,080 | |||||||||||||||
Number of weeks included in fiscal year | 53 | 52 | 52 | 52 | 52 | |||||||||||||||
Balance Sheet Data: | ||||||||||||||||||||
Cash and cash equivalents | $ | 1,606 | $ | 786 | $ | 1,064 | $ | 3,814 | $ | 9,837 | ||||||||||
Goodwill and intangible assets, net | 91,337 | 78,198 | 72,303 | 51,681 | 39,902 | |||||||||||||||
Total assets | 134,396 | 119,575 | 113,148 | 88,244 | 86,419 | |||||||||||||||
Deferred revenue | 15,756 | 14,526 | 15,003 | 12,835 | 11,885 | |||||||||||||||
Short term debt and current portion of long term debt | — | — | — | — | 2,180 | |||||||||||||||
Long term debt | 21,500 | 13,525 | 12,500 | — | 11,000 | |||||||||||||||
Stockholders’ equity | 71,980 | 68,886 | 62,914 | 54,218 | 46,280 | |||||||||||||||
21
Table of Contents
| (a) | During Fiscal 2007, general and administrative expense included a charge of $341,000 for accelerated depreciation as a result of a change in the accounting estimate regarding the remaining life of the Company’s existing payroll system. |
| (b) | During Fiscal 2007, the Company recorded a charge of $562,000 to write off unamortized loan origination fees as the Company’s prior senior term loan credit agreement was extinguished and replaced with a new $50,000,000 revolving credit facility. |
| (c) | During Fiscal 2007, the Company received a payment on an outstanding receivable from a single entity in the amount of $3,510,000. This payment settled all outstanding receivables from this entity. Upon receipt of this payment, the entity was released from all obligations to the Company. Payment of this receivable resulted in the recognition of $3,300,000 of other income in continuing operations. Also, during Fiscal 2007, the Company received payments for a second outstanding receivable from a separate single entity in the amount of $1,028,000. The payments to the Company released this entity from its obligations to the Company and transferred ownership of leasehold improvements and other assets. This resulted in the recognition of $310,000 of other income in continuing operations. |
| (d) | Discontinued operations contain the following (dollars in thousands): |
| For the Fiscal Year Ended | ||||||||||||||||||||
| July 3, 2010 | June 27, 2009 | June 28, 2008 | June 30, 2007 | July 1, 2006 | ||||||||||||||||
Revenues | $ | — | $ | 1,761 | $ | 2,057 | $ | 6,149 | $ | 8,431 | ||||||||||
Cost of services | (176 | ) | (2,242 | ) | (1,730 | ) | (5,141 | ) | (9,232 | ) | ||||||||||
Rent and other | (720 | ) | (1,112 | ) | (611 | ) | (1,665 | ) | (436 | ) | ||||||||||
Closed school lease reserves | (454 | ) | (340 | ) | (245 | ) | (2,027 | ) | 228 | |||||||||||
Gain from sale of schools | — | — | — | 1,900 | — | |||||||||||||||
Gain from settlement of sublease | — | — | 1,028 | — | — | |||||||||||||||
Income (loss) from discontinued operations before income tax benefit | (1,350 | ) | (1,933 | ) | 499 | (784 | ) | (1,009 | ) | |||||||||||
Income tax (expense) benefit | 516 | 764 | (186 | ) | 313 | 394 | ||||||||||||||
Income (loss) from discontinued operations | $ | (834 | ) | $ | (1,169 | ) | $ | 313 | $ | (471 | ) | $ | (615 | ) | ||||||
Fiscal 2009 discontinued operations include, among other items, the results of a school which was closed during the fourth quarter of Fiscal 2009. As of June 27, 2009, based upon the provisions of the lease to this property, the Company had notified the landlord of the property of issues regarding the physical condition of the property and terminated rent payments to the landlord. At that time, the resolution of the lease was not known and the Company had not deemed future payment of its lease obligations to the landlord as probable and subsequently did not accrue for such future payments. During the second quarter of Fiscal 2010, the Company resolved this issue with the landlord and paid the landlord $350,000 to terminate this lease and release the Company from any future obligations associated with the property.
During Fiscal 2008, the Company settled a contract dispute relating to the sublease of a school on which the Company had discontinued operations. The settlement is in the amount of $1,250,000 to be paid to the Company over five years. The net gain resulting from this settlement is $1,028,000 after costs and discount for the five year collection period.
During Fiscal 2007, the Company completed the sale of seven schools resulting in a before tax gain of $1,900,000. Also, during Fiscal 2007, the Company recorded before tax charges of $2,027,000 which included an estimate for rent payments as well as estimated legal and broker fees to be incurred with respect to two closed schools for which a new tenant has not been identified and one closed school for which the Company is obligated to subsidize rent and property taxes on behalf of a sub-tenant through May 2008.
22
Table of Contents
| ITEM 7. | MANAGEMENT’S DISCUSSIONAND ANALYSISOF FINANCIAL CONDITIONAND RESULTSOF OPERATIONS. |
The following discussion should be read in conjunction with the financial statements and notes thereto appearing elsewhere in this Annual Report on Form 10-K.
The Company has made statements in this report that constitute forward-looking statements as that term is defined in the federal securities laws. These forward-looking statements concern the Company’s operations, economic performance and financial condition and may include statements regarding: opportunities for growth; the number of preschool and elementary schools expected to be added in future years; the profitability of newly opened schools; capital expenditure levels; the ability to incur additional indebtedness; strategic acquisitions, investments and other transactions; and changes in operating systems and policies. The forward-looking statements are subject to various known and unknown risks, uncertainties and other factors. When words such as “believes,” “expects,” “anticipates,” “plans,” “estimates,” “projects” or similar expressions are used in this Annual Report on Form 10-K, the Company is making forward-looking statements.
Although the Company believes that any forward-looking statements are based on reasonable assumptions, expected results may not be achieved. Actual results may differ materially from the Company’s expectations. Risk factors that could have a material adverse affect on the Company’s business, results of operations, financial condition or cash flow are outlined in Item 1A. Risk Factors of this Form 10-K.
Readers are cautioned that risks outlined in Item 1A. Risk Factors of this Form 10-K may not be exhaustive. The Company operates in a continually changing business and regulatory environment and new risks and requirements emerge from time to time. Readers should not rely upon forward-looking statements except as statements of management’s present intentions and expectations that may or may not occur. Readers should read these cautionary statements as being applicable to all forward-looking statements wherever they appear. The Company assumes no obligation to update or revise the forward-looking statements or to update the reasons why actual results could differ from those projected in the forward-looking statements.
Introduction
The following discussion should be read in conjunction with “Item 6. Selected Historical Consolidated Financial and Other Data”, the consolidated financial statements and the related notes presented in “Item 8. Financial Statements and Supplementary Data” included elsewhere in this report.
Fiscal Year End
Our fiscal year is either 52 or 53 weeks ending on the Saturday closest to June 30. The fiscal year ended July 3, 2010 (“Fiscal 2010”) includes 53 weeks. The fiscal years ended June 27, 2009 (“Fiscal 2009”) and June 28, 2008 (“Fiscal 2008”) each included 52 weeks.
Reclassifications
Certain Fiscal 2008 amounts have been reclassified in regard to the classification of operating and discontinued operations to conform to the current period’s presentation. All significant intercompany balances and transactions have been eliminated.
The consolidated financial statements include the accounts of the Company and its wholly owned subsidiaries and majority owned subsidiaries.
23
Table of Contents
Results of Operations
The Company operates a national network of over 180 nonsectarian private Preschool and K+ schools and a global K-12 distance learning and online school. The Company offers an array of ancillary educational services, including before-and after-school programs, the Camp Zone® summer program and learning support programs. The Company is dedicated to providing a high quality private education through small class sizes, caring and skilled teachers, and attention to individual learning styles. The Company’s school facilities are located in fifteen different states and the District of Columbia.
During the first quarter of Fiscal 2010, we acquired Laurel Springs School, an online distance learning provider of K-12 education programs. The Laurel Springs School acquisition is intended to broaden the Company’s educational platform by addressing the K-12 distance learning market, including international opportunities.
During the current economic cycle, the Company has strategically reduced the number of new school openings to coincide with lower demand and the slowdown in housing starts.
The number of students enrolled in our schools and our tuition rates are two factors, among several, that impact the Company’s revenue and gross profits. Unemployment rates have and, we believe, will continue to impact enrollments. If unemployment rates improve within the key age groups that represent the majority of our families, the Company believes this will result in increases in future enrollments, revenue and gross profit. Additionally, the Company has historically implemented tuition increases when appropriate and intends to continue this practice while considering trends in the costs to provide services and competitive factors.
Results from operations are measured each fiscal period by reporting and analyzing results at the Company level. Additionally, we seek to measure revenue and profit growth in the following categories: (i) Comparable Schools, (ii) Core Schools, (iii) New Schools and (iv) Acquired Schools or businesses. Management seeks to balance growth in these categories in order to improve revenue and gross profit while adding to overall system capacity and total company performance. These four categories are measured individually and through several different metrics to help management better understand where growth is derived and manage the balance between growth, investment and profitability the Company seeks to achieve. It is important to note that the set of schools in each category may differ from reporting period to reporting period as schools may be opened, acquired, closed or become comparable at different times during the fiscal year. The four categories are more fully described below.
| i. | Comparable Schools—consists of an identical set of schools open for each of the entire periods being reported, sometimes referred to as “same schools.” By definition, Comparable Schools are always the same number of identical schools in each comparable period. Comparing results of the performance of these schools provides an “apples-to-apples” comparison of results between periods. Results are measured by revenue, operating expense and gross profit performance for this identical group of schools for the current period versus the prior period. Management seeks to grow revenue and increase gross margin in this category through annual tuition rate increases, enrollment growth and expense management. |
| ii. | Core Schools—consists of schools reported as Comparable Schools for each specific period presented. By definition, the population of Core Schools is schools open and comparable versus the prior period at a fixed point in time. We measure Core Schools’ performance as a percentage of revenue to develop period-over-period trends to understand the contribution provided by our efforts to grow the Core School base. When presenting Core School results there may be schools included within Core School results that were subsequently classified as discontinued operations. In each case, the results of activities from these schools are presented as discontinued operations in this Form 10-K for all periods presented herein. |
24
Table of Contents
| iii. | New Schools—consists of newly developed schools. By definition, the population of schools in each period should be different for each period as the Company continues to add schools. |
New Schools are an integral part of the Company’s business development strategy and are defined as newly developed schools as compared to “Acquired Schools” which are discussed below. In planning New School development activity, management typically seeks to balance the pre-opening costs and start-up losses associated with the ramp up of new schools and achieving an appropriate growth and profitability balance for the Company as a whole.
New School revenue is expressed as a percentage of total operating revenue for each comparative period. This information is included in the revenue section below. We also measure New School gross profit, gross margin and expense items as a percentage of revenue to develop period-over-period trends to understand the contribution provided by our efforts from this activity when compared to the prior period. We seek to improve New School period-over-period performance by minimizing the impact of pre-opening and ramp up costs, as well as shortening the time it takes a new school to ramp up.
| iv. | Acquired Schools—consists of purchased schools previously operated by independent third parties. |
Acquired Schools are an integral part of the Company’s business development strategy. Management seeks to acquire schools that expand or complement existing markets as well as schools that provide platforms for additional growth in new markets within our demographic parameters. Management seeks to add schools at a rate and in a manner that promotes the appropriate growth and profitability balance described above. While the Company has typically acquired schools that are already profitable, in some cases the Company acquires schools that are just beginning their ramp up periods, and as such may not yet be profitable. Acquired Schools’ revenue is expressed as a percentage of total operating revenue for each comparative period. This information is included in the revenue section below. We measure Acquired Schools’ gross profit, gross margin and expense items as a percentage of revenue to develop period-over-period trends to understand the contribution provided by our efforts from this activity when compared to the prior period.
Results for Comparable Schools for Fiscal 2010 as compared to Fiscal 2009 and Fiscal 2009 as compared to Fiscal 2008, respectively, are included in Revenue, Personnel Costs, School Operating Costs and Rent and Other section of the Results of Operations section below and results for Core Schools, Acquired Schools and New Schools are summarized in tables presented in the Gross Profit section of the Results of Operations section below.
Results of Operations—Fiscal 2010 compared to Fiscal 2009
At July 3, 2010 the Company operated 184 schools. During Fiscal 2010, the Company opened four new preschools, acquired one elementary school and closed one preschool. The Laurel Springs School which was acquired during the first quarter of Fiscal 2010 delivers its curriculum on-line and a physical school location does not exist for its students, it is therefore not included in the school counts below. During Fiscal 2009, the Company opened four new preschools, acquired three elementary schools and six preschools.
School counts for Fiscal 2010 and Fiscal 2009 are as follows:
| Fiscal | ||||||
| 2010 | 2009 | |||||
Number of schools at the beginning of period | 180 | 173 | ||||
Acquisitions | 1 | 9 | ||||
Openings | 4 | 4 | ||||
Closings | (1 | ) | (6 | ) | ||
Number of schools at the end of the period | 184 | 180 | ||||
25
Table of Contents
As a result of certain school closures during Fiscal 2010 the Company has conformed amounts reported for Fiscal 2009 to the period ended July 3, 2010. Operating results include one preschool closed during the second quarter of Fiscal 2010.
The table below identifies schools and the periods they were acquired, opened or closed during Fiscal 2010 and Fiscal 2009 (the acquisition of the Laurel Springs School is not included in these counts).
| Fiscal 2010 | ||||||||||||||
| 1st Quarter | 2nd Quarter | 3rd Quarter | 4th Quarter | Total | ||||||||||
Acquired | 1 | — | — | — | 1 | |||||||||
Opened | 3 | — | 1 | — | 4 | |||||||||
Closed | — | (1 | ) | — | — | (1 | ) | |||||||
| 4 | (1 | ) | 1 | — | 4 | |||||||||
| Fiscal 2009 | ||||||||||||||
| 1st Quarter | 2nd Quarter | 3rd Quarter | 4th Quarter | Total | ||||||||||
Acquired | 3 | — | 1 | 5 | 9 | |||||||||
Opened | 2 | — | 2 | — | 4 | |||||||||
Closed | — | — | (1 | ) | (5 | ) | (6 | ) | ||||||
| 5 | — | 2 | — | 7 | ||||||||||
The following table sets forth certain statement of operations data as a percentage of revenue for Fiscal 2010 and Fiscal 2009 (dollars in thousands):
| Fiscal 2010 | Percent of Revenues | Fiscal 2009 | Percent of Revenues | Increase (decrease) | |||||||||||||||
| Dollar | Percent | ||||||||||||||||||
Revenues | $ | 232,035 | 100.0 | % | $ | 220,103 | 100.0 | % | $ | 11,932 | 5.4 | % | |||||||
Personnel costs | 111,716 | 48.1 | 105,562 | 48.0 | 6,154 | 5.8 | |||||||||||||
School operating costs | 32,223 | 13.9 | 29,405 | 13.4 | 2,818 | 9.6 | |||||||||||||
Rent and other | 59,200 | 25.5 | 56,152 | 25.5 | 3,048 | 5.4 | |||||||||||||
Cost of services | 203,139 | 87.5 | 191,119 | 86.8 | 12,020 | 6.3 | |||||||||||||
Gross profit | 28,896 | 12.5 | 28,984 | 13.2 | (88 | ) | (0.3 | ) | |||||||||||
General and administrative expenses | 22,938 | 9.9 | 18,726 | 8.5 | 4,212 | 22.5 | |||||||||||||
Operating income | $ | 5,958 | 2.6 | % | $ | 10,258 | 4.7 | % | $ | (4,300 | ) | (41.9 | )% | ||||||
As a result of certain school closures subsequent to the end of Fiscal 2009, the Company has conformed amounts reported for Fiscal 2009 to the period ended July 3, 2010. Operating results include one preschool closed during the second quarter of Fiscal 2010.
The table below shows the number of schools included in each of the four growth categories. Each category is discussed below for Fiscal 2010 and Fiscal 2009, respectively:
| Fiscal | ||||
School Category | 2010 | 2009 | ||
Comparable | 166 | 166 | ||
Core | 166 | 144 | ||
Acquired | 10 | 27 | ||
New | 8 | 9 | ||
Total | 184 | 180 | ||
26
Table of Contents
Comparable School revenues and personnel costs presented in the following analysis reflect 52 weeks of activity for both Fiscal 2010 and Fiscal 2009. All other comparisons reflect the full 53 weeks of activity for Fiscal 2010 compared to 52 weeks for Fiscal 2009.
Revenue
Revenue for Fiscal 2010 increased $11,932,000, or 5.4%, to $232,035,000 from $220,103,000 for Fiscal 2009. The revenue increase was comprised of the following (dollars in thousands):
| Fiscal | Increase (decrease) | ||||||||||||
| 2010 | 2009 | Dollar | Percent | ||||||||||
Total Company revenue | $ | 232,035 | $ | 220,103 | $ | 11,932 | 5.4 | % | |||||
Comparable Schools | $ | 201,802 | $ | 210,908 | $ | (9,106 | ) | (4.3 | )% | ||||
Schools acquired, opened or closed after June 28, 2008: | |||||||||||||
Acquired | 14,949 | 4,987 | 9,962 | 199.8 | |||||||||
New | 5,502 | 1,146 | 4,356 | 380.1 | |||||||||
Closed | 176 | 2,879 | (2,703 | ) | (93.9 | ) | |||||||
Laurel Springs School | 6,756 | — | 6,756 | n.m. | |||||||||
53rd week, Comparable Schools | 2,667 | — | 2,667 | n.m. | |||||||||
Other | 183 | 183 | — | — | |||||||||
| $ | 232,035 | $ | 220,103 | $ | 11,932 | 5.4 | % | ||||||
Total Company revenue growth for Fiscal 2010 as compared to Fiscal 2009 was primarily driven by the acquisition of four elementary schools and six preschools, the opening of eight new preschools and the acquisition of the Laurel Springs School, an on-line and distance learning school for grades K-12, which was partially offset by the closing of four preschools and one elementary school, all of which occurred subsequent to June 28, 2008.
On a fifty-two week basis, Comparable School revenue decreases for Fiscal 2010 as compared to Fiscal 2009 were primarily driven by an overall decrease in enrollments. As a percentage, Comparable School revenue growth fell below that of tuition rate increases, due in large part to the current economic downturn and increased unemployment rates which we believe have contributed to an overall reduction in enrollment in many of the geographic areas in which the Company operates. The decrease in Comparable School revenues was partially offset by a tuition rate increase that the Company had implemented during January 2009 of approximately 1.4% and an additional increase of 2.5% to 2.8% during July 2009.
Revenue Trends
The revenue results of each of the four school categories for Fiscal 2010 (schools acquired, opened or closed subsequent to June 28, 2008) and Fiscal 2009 (schools acquired, opened or closed subsequent to June 30, 2007) are as follows:
| Fiscal 2010 | Number of Schools | Percent of Revenue excluding Laurel Springs & Other | Fiscal 2009 | Number of Schools | Percent of Revenue excluding Laurel Springs & Other | |||||||||||
Core Schools | $ | 204,469 | 166 | 88.1 | % | $ | 185,103 | 144 | 84.1 | % | ||||||
Acquired Schools | 14,949 | 10 | 6.4 | 26,894 | 27 | 12.2 | ||||||||||
New Schools | 5,502 | 8 | 2.4 | 5,959 | 9 | 2.7 | ||||||||||
Closed schools | 176 | 4 | 0.1 | 1,963 | 5 | 0.9 | ||||||||||
Laurel Springs School | 6,756 | n.a. | 2.9 | — | n.a. | — | ||||||||||
Other | 183 | n.a. | 0.1 | 184 | n.a. | 0.1 | ||||||||||
| $ | 232,035 | 100 | % | $ | 220,103 | 100 | % | |||||||||
27
Table of Contents
Acquired Schools’ revenue decreased as a percentage of total revenue to 6.4% for Fiscal 2010, as compared to 12.2% for Fiscal 2009. Acquired Schools for Fiscal 2010 included ten schools. Acquired Schools for Fiscal 2009 included twenty-seven schools, nine of which have included significant before-and-after school programs that are not counted as separate schools. These nine schools were not included in Acquired Schools for Fiscal 2010.
New Schools’ revenue decreased as a percentage of total revenue to 2.4% for Fiscal 2010, as compared to 2.7% for Fiscal 2009. This was reflective of the typical adjustment period common to New Schools. New Schools included in Fiscal 2010 have been operating an average of 447 days with four of the eight New Schools included in this period’s results operating for more than 400 days. New Schools included in Fiscal 2009 were operating an average of 437 days with four of the nine New Schools included in this period’s results operating for more than 400 days.
Closed schools decreased as a percentage of total revenue to 0.1% for the Fiscal 2010, as compared to 0.9% for Fiscal 2009. This decrease was the result of four schools which were closed for substantially the entire periods reported during Fiscal 2010 but which operated during all of Fiscal 2009.
Enrollment trends
The Company estimates Comparable School enrollment trends based on the relationship of tuition increases to Comparable School revenue performance. As an example, a 4% decrease in Comparable School revenue combined with a 3% tuition increase would imply a 7% Comparable School enrollment decline. Tuition rate and implied enrollment decreases for each thirteen week period during Fiscal 2010 as compared to the same thirteen week periods during Fiscal 2009 were as follows:
| Comparable School increase (decrease) | |||||||||
Thirteen Weeks Ended | Revenue | Tuition Rate | Enrollment | ||||||
September 26, 2009 compared to September 27, 2008 | (5.8 | )% | 4.5 | % | (10.3 | )% | |||
December 26, 2009 compared to December 27, 2008 | (4.8 | )% | 4.5 | % | (9.3 | )% | |||
March 27, 2010 compared to March 28, 2009 | (3.9 | )% | 3.0 | % | (6.9 | )% | |||
June 26, 2010 compared to June 27, 2009 (1) | (1.8 | )% | 3.0 | % | (4.8 | )% | |||
| (1) | The fourth quarter of Fiscal 2010 included fourteen weeks whereas the fourth quarter of Fiscal 2009 included thirteen weeks. The above accounts for revenues during the first thirteen weeks of the fourth quarter of Fiscal 2010. |
Personnel costs
Personnel costs primarily include teacher salaries, wages, payroll taxes, employee benefits and vacation costs. This category of costs is partially variable and primarily affected by wage rate changes, incentive compensation, health care benefit and participant rate increases, staffing ratio requirements and changes in enrollment. The category tends to be variable on a step function basis when staffing ratios indicate additional teachers are required without full enrollment in a class. In the case of New Schools, personnel costs tend to be higher as a percentage of revenue as a base level of personnel and associated costs are established in the early years of a school’s life. However, we expect to leverage these front-end investments as enrollments increase. Preschool staffing ratios are mandated by state requirements which can result in very low student to teacher ratios when class sizes are not optimal, especially in periods of declining enrollment.
28
Table of Contents
Personnel costs for Fiscal 2010 increased $6,154,000, or 5.8%, to $111,716,000 as compared to $105,562,000 for Fiscal 2009. The increase in personnel costs was comprised of the following (dollars in thousands):
| Fiscal | Increase (decrease) | ||||||||||||
| 2010 | 2009 | Dollar | Percent | ||||||||||
Total Company personnel costs | $ | 111,716 | $ | 105,562 | $ | 6,154 | 5.8 | % | |||||
Comparable Schools | $ | 97,308 | $ | 100,130 | $ | (2,822 | ) | (2.8 | )% | ||||
Schools acquired, opened or closed after June 28, 2008: | |||||||||||||
Acquired | 8,013 | 2,380 | 5,633 | 236.7 | |||||||||
New | 3,084 | 832 | 2,252 | 270.7 | |||||||||
Closed | 155 | 2,220 | (2,065 | ) | (93.0 | ) | |||||||
53rd week, Comparable Schools | 1,604 | — | 1,604 | n.m. | |||||||||
Laurel Springs School | 1,552 | — | 1,552 | n.m. | |||||||||
| $ | 111,716 | $ | 105,562 | $ | 6,154 | 5.8 | % | ||||||
The Company’s overall increase in personnel costs for Fiscal 2010 as compared to Fiscal 2009 was primarily driven by the acquisition of four elementary schools and six preschools, the opening of eight new preschools and the acquisition of the Laurel Springs School, which was partially offset by the closing of four preschools and one elementary school, all of which occurred subsequent to June 28, 2008. Personnel costs in the Company’s Comparable Schools declined by 2.8%.
Personnel costs slightly increased to 48.1% of revenue for Fiscal 2010 as compared to 48.0% for Fiscal 2009. This was comprised of the following:
| Personnel costs as a percentage of revenue | ||||||
| Fiscal | ||||||
| 2010 | 2009 | |||||
Total Company | 48.1 | % | 48.0 | % | ||
Comparable Schools | 48.2 | % | 47.5 | % | ||
Core Schools | 48.4 | % | 47.2 | % | ||
Schools acquired or opened subsequent to June 28, 2008 for Fiscal 2010 and June 30, 2007 for Fiscal 2009 | ||||||
Acquired Schools | 53.6 | % | 49.2 | % | ||
New Schools | 56.1 | % | 55.7 | % | ||
Laurel Springs School | 23.0 | % | — | |||
Increases in personnel costs as a percentage of revenue at Comparable Schools and Core Schools for Fiscal 2010 are reflective of declining enrollments. Wages were generally frozen during the second quarter of Fiscal 2009 and there were no Company-wide wage rate increases during Fiscal 2010. However, the Company has increased wages in connection with promotions, for competitive reasons and with respect to new hires whose salaries may be higher than those of the employees they have replaced. In addition, preschool staffing ratios are mandated by state regulations and as such, some classes and schools are not able to reduce wage costs in line with lower enrollments and lower revenue.
Acquired Schools’ personnel costs increased as a percentage of total revenue for Fiscal 2010 as compared to Fiscal 2009. Acquired Schools for Fiscal 2010 included four elementary schools which were owned during almost the entire school year, whereas Acquired Schools for Fiscal 2009 included two elementary schools which were owned during almost the entire school year and two additional elementary schools that were acquired
29
Table of Contents
during the fourth quarter of Fiscal 2009. Additionally, Acquired Schools included for Fiscal 2009 included nine schools with significant before-and-after programs that are not counted as separate schools and required a lower ratio of staff to student as compared to other schools without separate before-and-after school programs; these schools were not included as Acquired Schools for Fiscal 2010.
New Schools’ personnel costs increased as a percentage of revenue to 56.1% for Fiscal 2010, as compared to 55.7% for Fiscal 2009. New Schools included in Fiscal 2010 have been operating an average of 447 days with four of the eight New Schools included in this period’s results operating for more than 400 days. New Schools included in Fiscal 2009 have been operating an average of 437 days with four of the nine New Schools included in this period’s results operating for more than 400 days.
School operating costs
School operating costs primarily include food, utilities, transportation, maintenance, janitorial, supplies, school level marketing spending and ancillary programs. This category is partially variable with increases driven by additional enrollment. In the case of New Schools, school operating costs tend to be higher as a percentage of revenue because a base level of costs are incurred in the early period of a school’s life and are expected to be leveraged as enrollments increase.
School operating costs for Fiscal 2010 increased $2,818,000, or 9.6%, to $32,223,000 as compared to $29,405,000 for Fiscal 2009. The increase in school operating costs was comprised of the following (dollars in thousands):
| Fiscal | Increase (decrease) | ||||||||||||
| 2010 | 2009 | Dollar | Percent | ||||||||||
Total Company school operating costs | $ | 32,223 | $ | 29,405 | $ | 2,818 | 9.6 | % | |||||
Comparable Schools | $ | 28,331 | $ | 27,659 | $ | 672 | 2.4 | % | |||||
Schools acquired, opened or closed after June 28, 2008: | |||||||||||||
Acquired | 1,907 | 661 | 1,246 | 188.5 | |||||||||
New | 976 | 285 | 691 | 242.5 | |||||||||
Closed | 223 | 788 | (565 | ) | (71.7 | ) | |||||||
Laurel Springs School | 768 | — | 768 | n.m. | |||||||||
Other | 18 | 12 | 6 | 50.0 | |||||||||
| $ | 32,223 | $ | 29,405 | $ | 2,818 | 9.6 | % | ||||||
The Company’s overall increase in school operating costs for Fiscal 2010 as compared to Fiscal 2009 was primarily driven by the acquisition of four elementary schools and six preschools, the opening of eight new preschools and the acquisition of the Laurel Springs School, which was partially offset by the closing of four preschools and one elementary school, all of which occurred subsequent to June 28, 2008.
School operating costs for comparable schools for Fiscal 2010 increased $672,000 as compared to Fiscal 2009. $586,000 of this increase was due to facility maintenance and repair costs attributable in large part to increased snow removal costs and facility repairs during Fiscal 2010.
30
Table of Contents
School operating costs increased to 13.9% of revenue for Fiscal 2010 as compared to 13.4% for Fiscal 2009. This was comprised of the following:
| School operating costs as a percentage of revenue | ||||||
| Fiscal | ||||||
| 2010 | 2009 | |||||
Total Company | 13.9 | % | 13.4 | % | ||
Comparable Schools | 14.0 | % | 13.1 | % | ||
Core Schools | 13.9 | % | 13.1 | % | ||
Schools acquired or opened subsequent to June 28, 2008 for Fiscal 2010 and June 30, 2007 for Fiscal 2009 | ||||||
Acquired Schools | 12.8 | % | 13.2 | % | ||
New Schools | 17.7 | % | 16.8 | % | ||
Laurel Springs School | 11.4 | % | — | |||
Comparable Schools’ operating costs as a percentage of revenue increased to 14.0% from 11.7% for Fiscal 2010 as compared to Fiscal 2009. This increase was primarily driven by increased facility maintenance costs due in part to increased snow removal expense and other costs as noted above.
Acquired Schools’ school operating costs decreased as a percentage of total revenue for Fiscal 2010 as compared to Fiscal 2009. This decrease was consistent with an increased number of acquired elementary schools between periods, which generally leverage operating costs better than preschools. Acquired Schools for Fiscal 2010 included four elementary schools which were owned during almost the entire school year, whereas Acquired Schools for Fiscal 2009 included two elementary schools which were owned during almost the entire school year and two additional elementary schools that were acquired during the fourth quarter of Fiscal 2009.
New Schools’ operating costs increased as a percentage of total revenue to 17.7% for Fiscal 2010, as compared to 16.8% for Fiscal 2009. New Schools included in Fiscal 2010 have been operating an average of 447 days with four of the eight New Schools included in this period’s results operating for more than 400 days. New Schools included in Fiscal 2009 have been operating an average of 437 days with four of the nine New Schools included in this period’s results operating for more than 400 days.
Rent and other
Rent and other costs primarily include property rent and property taxes, the portion of claims retained by the Company for workers’ compensation and property insurance, depreciation and amortization, regional and school marketing, vehicle and equipment rent, and pre-opening costs. Much of this category of costs is relatively fixed in nature with increases related to contractual obligations, changes in marketing initiatives and the addition of new or acquired schools. In the case of New Schools, rent and other costs tend to be higher as a percentage of revenue because these costs are incurred in the early period of a school’s life and are expected to be leveraged as enrollments increase.
31
Table of Contents
Rent and other costs for Fiscal 2010 increased $3,048,000, or 5.4%, to $59,200,000 as compared to $56,152,000 for Fiscal 2009. The increase in rent and other costs was comprised of the following (dollars in thousands):
| Fiscal | Increase (decrease) | ||||||||||||
| 2010 | 2009 | Dollar | Percent | ||||||||||
Total Company rent and other costs | $ | 59,200 | $ | 56,152 | $ | 3,048 | 5.4 | % | |||||
Comparable Schools | $ | 50,994 | $ | 50,942 | $ | 52 | 0.1 | % | |||||
Schools acquired, opened or closed after June 28, 2008: | |||||||||||||
Acquired | 3,733 | 1,477 | 2,256 | 152.7 | |||||||||
New | 3,271 | 1,412 | 1,859 | 131.7 | |||||||||
Closed | 932 | 2,321 | (1,389 | ) | (59.8 | ) | |||||||
Laurel Springs School | 270 | — | 270 | n.m. | |||||||||
| $ | 59,200 | $ | 56,152 | $ | 3,048 | 5.4 | % | ||||||
The Company’s overall increase in rent and other costs for Fiscal 2010 as compared to Fiscal 2009 was primarily driven by the acquisition of four elementary schools and six preschools, the opening of eight new preschools and the acquisition of the Laurel Springs School, partially offset by the closing of four preschools and one elementary school, all of which occurred subsequent to June 28, 2008.
The $52,000 increase in rent and other costs for comparable schools for Fiscal 2010 as compared to Fiscal 2009 was primarily the result of $848,000 of increased rent and property taxes due to contractual rent and property tax escalations offset by decreases of $614,000 of lower marketing costs and $182,000 of lower insurance premiums and lower workers’ compensation claims retained by the Company.
Rent and other costs were 25.5% of revenue for Fiscal 2010 and Fiscal 2009. This was comprised of the following:
| Rent and Other Costs as a Percentage of Revenue | ||||||
| Fiscal | ||||||
| 2010 | 2009 | |||||
Total Company | 25.5 | % | 25.5 | % | ||
Comparable Schools | 25.3 | % | 24.2 | % | ||
Core Schools | 24.9 | % | 23.6 | % | ||
Schools acquired or opened subsequent to June 28, 2008 for Fiscal 2010 and June 30, 2007 for Fiscal 2009 | ||||||
Acquired Schools | 25.0 | % | 26.6 | % | ||
New Schools | 59.5 | % | 54.3 | % | ||
Laurel Springs School | 4.0 | % | — | |||
Increases in rent and other costs as a percentage of revenue at Comparable Schools and Core Schools are reflective of overall contractual rent and property tax escalations at these schools in addition to overall enrollment declines due in large part to current economic activity including increased unemployment rates.
New Schools’ rent and other costs increased as a percentage of total revenue to 59.5% for Fiscal 2010, as compared to 54.3% for Fiscal 2009. New Schools included in Fiscal 2010 have been operating an average of 447 days with four of the eight New Schools included in this period’s results operating for more than 400 days. New Schools included in Fiscal 2009 have been operating an average of 437 days with four of the nine New Schools included in this period’s results operating for more than 400 days.
32
Table of Contents
Gross profit
As a result of the factors described above, gross profit for Fiscal 2010 decreased $88,000, or 0.3%, to $28,896,000 as compared to $28,984,000 for Fiscal 2009. Gross profit was 12.5% of revenue for Fiscal 2010 and 13.2% of revenue for Fiscal 2009.
The change in gross profit for Fiscal 2010 as compared to Fiscal 2009 was as follows (dollars in thousands):
| Fiscal 2010 | Percent of Revenues | Fiscal 2009 | Percent of Revenues | Increase (decrease) | |||||||||||||||
| Dollar | Percent | ||||||||||||||||||
Revenues | $ | 232,035 | 100.0 | % | $ | 220,103 | 100.0 | % | $ | 11,932 | 5.4 | % | |||||||
Personnel costs | 111,716 | 48.1 | 105,562 | 48.0 | 6,154 | 5.8 | |||||||||||||
School operating costs | 32,223 | 13.9 | 29,405 | 13.4 | 2,818 | 9.6 | |||||||||||||
Rent and other | 59,200 | 25.5 | 56,152 | 25.5 | 3,048 | 5.4 | |||||||||||||
Cost of services | 203,139 | 87.5 | 191,119 | 86.8 | 12,020 | 6.3 | |||||||||||||
Gross profit | $ | 28,896 | 12.5 | % | $ | 28,984 | 13.2 | % | $ | (88 | ) | (0.3 | )% | ||||||
Gross profit for Comparable Schools on a fifty-two week basis for Fiscal 2010 as compared to Fiscal 2009 was as follows (dollars in thousands):
| Fiscal 2010 | Percent of Revenues | Fiscal 2009 | Percent of Revenues | Increase (decrease) | |||||||||||||||
| Dollar | Percent | ||||||||||||||||||
Revenues | $ | 201,802 | 100.0 | % | $ | 210,908 | 100.0 | % | $ | (9,106 | ) | (4.3 | )% | ||||||
Personnel costs | 97,308 | 48.2 | 100,130 | 47.5 | (2,822 | ) | (2.8 | ) | |||||||||||
School operating costs | 28,331 | 14.0 | 27,659 | 13.1 | 672 | 2.4 | |||||||||||||
Rent and other | 50,994 | 25.3 | 50,942 | 24.2 | 52 | 0.1 | |||||||||||||
Cost of services | 176,633 | 87.5 | 178,731 | 84.7 | (2,098 | ) | (1.2 | ) | |||||||||||
Gross profit | $ | 25,169 | 12.5 | % | $ | 32,177 | 15.3 | % | $ | (7,008 | ) | (21.8 | )% | ||||||
33
Table of Contents
The table below shows comparative information as a percentage of revenue for Fiscal 2010 and Fiscal 2009 for Core Schools, New Schools, Acquired Schools and Closed Schools (dollars in thousands):
| Increase (Decease) | |||||||||||||||||||||
| Fiscal 2010 | Percentage of Revenue | Fiscal 2009 | Percentage of Revenue | Dollar | Percent | ||||||||||||||||
Core Schools | |||||||||||||||||||||
Number of schools | 166 | 144 | |||||||||||||||||||
Revenue | $ | 204,469 | 100.0 | % | $ | 185,103 | 100.0 | % | $ | 19,366 | 10.5 | % | |||||||||
Personnel Cost | 98,912 | 48.4 | 87,382 | 47.2 | 11,530 | 13.2 | |||||||||||||||
School Operating Cost | 28,331 | 13.9 | 24,228 | 13.1 | 4,103 | 16.9 | |||||||||||||||
Rent and Other | 50,994 | 24.9 | 43,676 | 23.6 | 7,318 | 16.8 | |||||||||||||||
Gross Profit | $ | 26,232 | 12.8 | % | $ | 29,817 | 16.1 | % | $ | (3,585 | ) | (12.0 | )% | ||||||||
Acquired Schools | |||||||||||||||||||||
Number of schools | 10 | 27 | |||||||||||||||||||
Revenue | $ | 14,949 | 100.0 | % | $ | 26,894 | 100.0 | % | $ | (11,945 | ) | (44.4 | )% | ||||||||
Personnel Costs | 8,013 | 53.6 | 13,220 | 49.2 | (5,207 | ) | (39.4 | ) | |||||||||||||
School Operating Costs | 1,907 | 12.8 | 3,556 | 13.2 | (1,649 | ) | (46.4 | ) | |||||||||||||
Rent and Other | 3,733 | 25.0 | 7,150 | 26.6 | (3,417 | ) | (47.8 | ) | |||||||||||||
Gross Profit | $ | 1,296 | 8.7 | % | $ | 2,968 | 11.0 | % | $ | (1,672 | ) | (56.3 | )% | ||||||||
New Schools | |||||||||||||||||||||
Number of schools | 8 | 9 | |||||||||||||||||||
Revenue | $ | 5,502 | 100.0 | % | $ | 5,959 | 100.0 | % | $ | (457 | ) | (7.7 | )% | ||||||||
Personnel Costs | 3,084 | 56.1 | 3,319 | 55.7 | (235 | ) | (7.1 | ) | |||||||||||||
School Operating Costs | 976 | 17.7 | 1,000 | 16.8 | (24 | ) | (2.4 | ) | |||||||||||||
Rent and Other | 3,271 | 59.5 | 3,237 | 54.3 | 34 | 1.1 | |||||||||||||||
Gross Loss | $ | (1,829 | ) | (33.2 | )% | $ | (1,597 | ) | (26.8 | )% | $ | (232 | ) | 14.5 | % | ||||||
Closed Schools | |||||||||||||||||||||
Number of schools | 4 | 5 | |||||||||||||||||||
Revenue | $ | 176 | 100.0 | % | $ | 1,963 | 100.0 | % | $ | (1,787 | ) | (91.0 | )% | ||||||||
Personnel Costs | 155 | 88.1 | 1,641 | 83.6 | (1,486 | ) | (90.6 | ) | |||||||||||||
School Operating Costs | 223 | 126.7 | 608 | 31.0 | (385 | ) | (63.3 | ) | |||||||||||||
Rent and Other | 932 | 529.5 | 2,089 | 106.4 | (1,157 | ) | (55.4 | ) | |||||||||||||
Gross Profit | $ | (1,134 | ) | (644.3 | )% | $ | (2,375 | ) | (121.0 | )% | $ | 1,241 | (52.3 | )% | |||||||
Laurel Springs School | |||||||||||||||||||||
Revenue | $ | 6,756 | 100.0 | % | $ | — | — | $ | 6,756 | n.m. | |||||||||||
Personnel Costs | 1,552 | 23.0 | — | — | 1,552 | n.m. | |||||||||||||||
School Operating Costs | 768 | 11.4 | — | — | 768 | n.m. | |||||||||||||||
Rent and Other | 270 | 4.0 | — | — | 270 | n.m. | |||||||||||||||
Gross Profit | $ | 4,166 | 61.7 | % | $ | — | — | $ | 4,166 | n.m. | |||||||||||
Other | |||||||||||||||||||||
Revenue | $ | 183 | 100.0 | % | $ | 184 | 100.0 | % | $ | (1 | ) | (0.5 | )% | ||||||||
Personnel Costs | — | — | — | — | — | n.m | |||||||||||||||
School Operating Costs | 18 | 9.8 | 13 | 7.1 | 5 | n.m | |||||||||||||||
Rent and Other | — | — | — | — | — | n.m | |||||||||||||||
Gross Profit | $ | 165 | 90.2 | % | $ | 171 | 92.9 | % | $ | (6 | ) | (3.5 | )% | ||||||||
Total | |||||||||||||||||||||
Revenue | $ | 232,035 | 100.0 | % | $ | 220,103 | 100.0 | % | $ | 11,932 | 5.4 | % | |||||||||
Personnel Costs | 111,716 | 48.1 | 105,562 | 48.0 | 6,154 | 5.8 | |||||||||||||||
School Operating Costs | 32,223 | 13.9 | 29,405 | 13.4 | 2,818 | 9.6 | |||||||||||||||
Rent and Other | 59,200 | 25.5 | 56,152 | 25.5 | 3,048 | 5.4 | |||||||||||||||
Gross Profit | $ | 28,896 | 12.5 | % | $ | 28,984 | 13.2 | % | $ | (88 | ) | (0.3 | )% | ||||||||
Percentage of Revenue amounts may not sum to 100% due to rounding.
34
Table of Contents
General and administrative expenses
General and administrative expenses increased $4,212,000, or 22.3%, to $22,938,000 for Fiscal 2010 from $18,726,000 for Fiscal 2009. This increase was primarily the result of $3,582,000 of expenses, excluding amortization expense, associated with the Laurel Springs School which was acquired during the first quarter of Fiscal 2010. General and administrative expenses for Fiscal 2010 as compared to Fiscal 2009 also included increased amortization expense from acquisitions of $925,000, legal fees of $961,000 during Fiscal 2010 as compared to $277,000 during Fiscal 2009 which were incurred in connection with the Company’s defense in regard to a lawsuit filed by the United States Department of Justice alleging the Company violated Title III of the Americans with Disabilities Act of 1990 and transaction costs related to acquisitions of $207,000. These increases were partially offset by overall decreases in other professional fees of $624,000, a decrease in corporate depreciation expense of $526,000, as a number of technology investments have been fully depreciated and other decreased costs including travel, recruiting and site acquisition costs.
Operating income
As a result of the factors mentioned above, the Company’s operating income decreased $4,300,000 to $5,958,000 for Fiscal 2010 from $10,258,000 of operating income for Fiscal 2009.
Interest expense
As a result of increased debt outstanding, interest expense increased $590,000 to $1,571,000 for Fiscal 2010 as compared to $981,000 for Fiscal 2009. During Fiscal 2010, the Company had average daily debt outstanding of $28,653,000 as compared to average daily debt outstanding of $14,700,000 during Fiscal 2009.
Other Income
Other income decreased $48,000 to $30,000 for Fiscal 2010 as compared to $78,000 for Fiscal 2009.
Income taxes
Income tax expense from continuing operations for Fiscal 2010 was $1,711,000 as compared to $3,622,000 for Fiscal 2009. The Company’s effective tax rate for Fiscal 2010 was 38.8% and the effective tax rate for Fiscal 2009 was 38.5%.
At July 3, 2010 the Company had a net deferred tax liability of $1,311,000. At June 27, 2009 the Company had net deferred tax assets totaling $301,000. Deferred tax assets, net of valuation allowances, have been recognized to the extent that their realization is more likely than not. However, the amount of the deferred tax assets considered realizable could be adjusted in the future as estimates of taxable income or the timing thereof are revised. If the Company is unable to generate sufficient taxable income in the future through operating results, increases in the valuation allowance may be required through an increase to tax expense in future periods. Conversely, if the Company recognizes taxable income of a suitable nature and in the appropriate periods, the deferred tax assets will more likely than not be realized.
35
Table of Contents
Discontinued operations
The results of operations for schools that are no longer operating under the Company’s management have been reflected in the consolidated financial statements and notes as discontinued operations for all periods presented. The operating results for discontinued operations in the consolidated statements of income for all periods presented, net of tax, and are as follows (dollars in thousands):
| Fiscal | ||||||||
| 2010 | 2009 | |||||||
Revenues | $ | — | $ | 1,761 | ||||
Cost of services | (176 | ) | (2,242 | ) | ||||
Rent and other | (720 | ) | (1,112 | ) | ||||
Closed school lease reserves | (454 | ) | (340 | ) | ||||
Loss from discontinued operations before income tax benefit | (1,350 | ) | (1,933 | ) | ||||
Income tax benefit | 516 | 764 | ||||||
Loss from discontinued operations | $ | (834 | ) | $ | (1,169 | ) | ||
Net Income
As a result of the above factors, the Company’s net income was $1,872,000 for Fiscal 2010 as compared to $4,564,000 for Fiscal 2009.
Results of Operations—Fiscal 2009 compared to Fiscal 2008
At June 27, 2009, the Company operated 180 schools. Between June 29, 2008 and June 27, 2009, the Company opened four new preschools, acquired six preschools and acquired three elementary schools. Additionally, three preschools and three elementary schools were closed during Fiscal 2009.
School counts for Fiscal 2009 and Fiscal 2008 are as follows:
| Fiscal | ||||||
| 2009 | 2008 | |||||
Number of schools at the beginning of period | 173 | 151 | ||||
New | 4 | 5 | ||||
Acquired | 9 | 20 | ||||
Closed | (6 | ) | (3 | ) | ||
Number of schools at the end of the period | 180 | 173 | ||||
As a result of certain school closures during Fiscal 2009 the Company has conformed amounts reported for Fiscal year 2008 to the period ended June 27, 2009. Operating results include one preschool closed during the third quarter of Fiscal 2009, two preschools and one elementary school closed during the fourth quarter of Fiscal 2009, and two preschools closed during the fourth quarter of Fiscal 2008. In addition, the Company closed two elementary schools during the fourth quarter of Fiscal 2009; these two schools are included in the Company’s income (loss) from discontinued operations.
36
Table of Contents
The table below identifies schools and the periods they were acquired or opened for Fiscal 2009 and Fiscal 2008. During Fiscal 2009 the results of one elementary school that was acquired during Fiscal 2008 and subsequently closed during Fiscal 2009 are not included in the Company’s operating income, rather these results are included in the Company’s income (loss) from discontinued operations. Additionally, during Fiscal 2008 the results of one preschool acquired and closed in the same fiscal quarter are not included in the Company’s operating income; rather these results are included in the Company’s income (loss) from discontinued operations. Both schools are included in the count of Acquired Schools in the table below and in count of Acquired Schools and Closed Schools in the roll-forward above.
| Fiscal 2009 | ||||||||||
| 1st Quarter | 2nd Quarter | 3rd Quarter | 4th Quarter | Total | ||||||
New | 2 | — | 2 | — | 4 | |||||
Acquired | 3 | — | 1 | 5 | 9 | |||||
| 5 | — | 3 | 5 | 13 | ||||||
| Fiscal 2008 | ||||||||||
| 1st Quarter | 2nd Quarter | 3rd Quarter | 4th Quarter | Total | ||||||
New | 4 | — | — | 1 | 5 | |||||
Acquired | 6 | — | 12 | 2 | 20 | |||||
| 10 | — | 12 | 3 | 25 | ||||||
The following table sets forth certain statement of operations data as a percent of revenue for Fiscal 2009 and Fiscal 2008 (dollars in thousands):
| Fiscal 2009 | Percent of Revenues | Fiscal 2008 | Percent of Revenues | Increase (decrease) | |||||||||||||||
| Dollar | Percent | ||||||||||||||||||
Revenues | $ | 220,103 | 100.0 | % | $ | 204,201 | 100.0 | % | $ | 15,902 | 7.8 | % | |||||||
Personnel costs | 105,562 | 48.0 | 97,762 | 47.9 | 7,800 | 8.0 | |||||||||||||
School operating costs | 29,405 | 13.4 | 26,769 | 13.1 | 2,636 | 9.8 | |||||||||||||
Rent and other | 56,152 | 25.5 | 49,019 | 24.0 | 7,133 | 14.6 | |||||||||||||
Cost of services | 191,119 | 86.8 | 173,550 | 85.0 | 17,569 | 10.1 | |||||||||||||
Gross profit | 28,984 | 13.2 | 30,651 | 15.0 | (1,667 | ) | (5.4 | ) | |||||||||||
General and administrative expenses | 18,726 | 8.5 | 18,516 | 9.1 | 210 | 1.1 | |||||||||||||
Operating income | $ | 10,258 | 4.7 | % | $ | 12,135 | 5.9 | % | $ | (1,877 | ) | (15.5 | )% | ||||||
The table below shows the number of schools included in each of the four growth initiative categories for each section where they are respectively discussed below:
| Fiscal | ||||
School Category | 2009 | 2008 | ||
Comparable | 144 | 144 | ||
Core | 144 | 135 | ||
New | 9 | 8 | ||
Acquired | 27 | 24 | ||
Total | 180 | 167 | ||
Schools closed subsequent to reported fiscal year | — | 6 | ||
Schools operated during reported fiscal year | 180 | 173 | ||
37
Table of Contents
Revenue
Revenue for Fiscal 2009 increased $15,902,000 or 7.8% to $220,103,000 from $204,201,000 for Fiscal 2008. This increase was primarily driven by revenues from schools opened or acquired subsequent to the end of Fiscal 2007 of $20,658,000 partially offset by a $2,403,000 decrease in revenues from Comparable Schools from schools closed subsequent to the end of Fiscal 2007.
| Fiscal | Increase (decrease) | ||||||||||||
| 2009 | 2008 | Dollar | Percent | ||||||||||
Total Company revenue | $ | 220,103 | $ | 204,201 | $ | 15,902 | 7.8 | % | |||||
Comparable Schools | $ | 185,103 | $ | 187,445 | $ | (2,342 | ) | (1.2 | )% | ||||
Schools acquired, opened or closed after June 30, 2007: | |||||||||||||
Acquired | 26,894 | 9,670 | 17,224 | 178.1 | |||||||||
New | 5,959 | 2,525 | 3,434 | 136.0 | |||||||||
Closed | 1,963 | 4,366 | (2,403 | ) | (55.0 | ) | |||||||
Other | 184 | 195 | (11 | ) | (5.6 | ) | |||||||
| $ | 220,103 | $ | 204,201 | $ | 15,902 | 7.8 | % | ||||||
Comparable school revenue decreases were primarily driven by overall decreases in enrollment partially offset by average tuition increases between 3.0% and 4.0%. As a percentage, Comparable School revenue growth fell below that of tuition rate increases, due in large part to current economic activity affecting unemployment rates which has contributed towards an overall reduction in enrollment in certain geographic areas in which the Company operates.
Revenue trends
In comparing Fiscal 2009 to Fiscal 2008, revenue continues to be generated by each of the four growth categories. The revenue results of each of the four revenue growth categories for Fiscal 2009 (schools acquired, opened or closed subsequent to June 30, 2007) and Fiscal 2008 (schools acquired, opened or closed subsequent to July 1, 2006) are as follows:
| Fiscal 2009 | Percent of Revenue (1) | Fiscal 2008 | Percent of Revenue (1) | |||||||||
Core Schools | $ | 185,103 | 84.1 | % | $ | 172,356 | 84.4 | % | ||||
New Schools | 5,959 | 2.7 | % | 7,035 | 3.4 | % | ||||||
Acquired Schools | 26,894 | 12.2 | % | 20,249 | 9.9 | % | ||||||
Closed schools and other | 2,147 | 1.0 | % | 4,561 | 2.2 | % | ||||||
| $ | 220,103 | 100.0 | % | $ | 204,201 | 100.0 | % | |||||
| (1) | Percent of revenue may not total due to rounding. |
New Schools’ revenue decreased as a percentage of total revenue to 2.7% in Fiscal 2009 as compared to 3.4% in Fiscal 2008. New schools for Fiscal 2009 include nine schools as compared to eight schools for Fiscal 2008. One of the new schools included in the Fiscal 2008 period was a “land banked” school where the Company held the rights to the land for a period of time prior to development so that the market for that school would be more fully developed by the time it opened. As a result, the school ramped up quickly due to the more mature market. Another of the schools included in the Fiscal 2008 period was an already operating corporate contract school taken over by the Company from a previous operator and had an existing enrollment and revenue stream. The remaining schools included in both fiscal periods were opened in newer “path-of-progress” markets in which management expects to continue to develop incremental enrollments.
38
Table of Contents
Acquired Schools’ revenue increased as a percentage of total revenue to 12.2% for Fiscal 2009 as compared to 9.9% for Fiscal 2008. Acquired Schools for Fiscal 2009 include twenty-seven schools, nine of which include significant before-and-after school programs that are not counted as separate schools.
Personnel costs
For Fiscal 2009, personnel costs increased $7,800,000 or 8.0% to $105,562,000 from $97,762,000 for Fiscal 2008. This increase was primarily driven by an increase in personnel costs from acquired schools offset by decreased costs in Comparable, New and Closed Schools.
| Fiscal | Increase (decrease) | ||||||||||||
| 2009 | 2008 | Dollar | Percent | ||||||||||
Total Company | $ | 105,562 | $ | 97,762 | $ | 7,800 | 8.0 | % | |||||
Comparable Schools | $ | 87,382 | $ | 88,363 | $ | (981 | ) | (1.1 | )% | ||||
Schools acquired, opened or closed after June 30, 2007: | |||||||||||||
Acquired | 13,220 | 1,546 | 11,674 | 755.1 | |||||||||
New | 3,319 | 4,890 | (1,571 | ) | (32.1 | ) | |||||||
Closed | 1,641 | 2,963 | (1,322 | ) | (44.6 | ) | |||||||
| $ | 105,562 | $ | 97,762 | $ | 7,800 | 8.0 | % | ||||||
Personnel costs increased to 48.0% of revenue for Fiscal 2009 as compared to 47.9% for Fiscal 2008. This increase of 10 basis points consisted of the following:
| Percentage of Revenue | ||||||
| Fiscal | Fiscal | |||||
| 2009 | 2008 | |||||
Total Company | 48.0 | % | 47.9 | % | ||
Comparable Schools | 47.2 | % | 47.1 | % | ||
Schools acquired or opened subsequent to June 30, 2007 for Fiscal 2009 and July 1, 2006 for Fiscal 2008: | ||||||
Core Schools | 47.2 | % | 47.1 | % | ||
Acquired Schools | 49.2 | % | 48.0 | % | ||
New Schools | 55.7 | % | 55.4 | % | ||
Increases in personnel costs as a percentage of revenue at Comparable Schools are reflective of wage rate and staffing increases coinciding with overall enrollment declines at these schools due in large part to current economic activity affecting unemployment rates which has contributed towards an overall reduction in enrollment in certain geographic areas in which the Company operates.
Personnel costs as a percentage of revenue at New Schools increased thirty basis points because one of the New Schools which operated during Fiscal 2008 was a “land banked” school where the Company held the rights to the land for a period of time prior to development so that the market for that school would be more fully developed by the time it opened. As a result, the school was able to ramp up quickly due to the more mature market resulting in a more optimal student to teacher ratio and another of the schools included in the Fiscal 2008 period was an already operating corporate contract school taken over by the Company from a previous operator with an existing student base and a more optimal student to teacher ratio than most new schools. The remaining schools included in both fiscal periods were opened in newer “path-of-progress” markets which management expects to continue to develop incremental enrollments.
39
Table of Contents
Personnel costs as a percentage of revenue for Acquired Schools were negatively impacted by the results of a Camelback Desert School (CDS) that was acquired during the fourth quarter of Fiscal 2008. For Fiscal 2009, this one school had a 140 basis point impact to personnel costs as a percentage of revenue for Acquired Schools; the school had no impact on this percentage for Fiscal 2008 as it was opened late in the fourth quarter of that fiscal year.
School operating costs
For Fiscal 2009, school operating costs increased $2,636,000 or 9.8% to $29,405,000 from $26,769,000 for Fiscal 2008. This increase was primarily driven by an increase in school operating costs from new and acquired schools offset by decreased costs in Comparable and Closed Schools.
| Fiscal | Increase (decrease) | ||||||||||||
| 2009 | 2008 | Dollar | Percent | ||||||||||
Total Company | $ | 29,405 | $ | 26,769 | $ | 2,636 | 9.8 | % | |||||
Comparable Schools | $ | 24,228 | $ | 24,260 | $ | (32 | ) | (0.1 | )% | ||||
Schools acquired, opened or closed after June 30, 2007: | |||||||||||||
Acquired | 3,556 | 1,113 | 2,443 | 219.5 | |||||||||
New | 1,000 | 451 | 549 | 121.7 | |||||||||
Closed | 608 | 915 | (307 | ) | (33.6 | ) | |||||||
Other | 13 | 30 | (17 | ) | (56.7 | ) | |||||||
| $ | 29,405 | $ | 26,769 | $ | 2,636 | 9.8 | % | ||||||
School operating costs increased to 13.4% of revenue for Fiscal 2009 as compared to 13.1% for Fiscal 2008. This increase of 30 basis points consisted of the following:
| Percentage of Revenue | ||||||
| Fiscal | Fiscal | |||||
| 2009 | 2008 | |||||
Total Company | 13.4 | % | 13.1 | % | ||
Comparable Schools | 13.1 | % | 12.9 | % | ||
Schools acquired or opened subsequent to June 30, 2007 for Fiscal 2009 and July 1, 2006 for Fiscal 2008: | ||||||
Core Schools | 13.1 | % | 13.2 | % | ||
Acquired Schools | 13.2 | % | 11.2 | % | ||
New Schools | 16.8 | % | 12.5 | % | ||
Increases in school operating costs as a percentage of revenue at Comparable Schools for Fiscal 2009 as compared to Fiscal 2008 are reflective of overall flat costs at these schools coinciding with overall enrollment declines due in large part to economic conditions and high unemployment rates, which have contributed towards an overall reduction in enrollment in certain geographic areas in which the Company operates. Costs for facility repairs and maintenance as well as food costs increased approximately 50 basis points during Fiscal 2009 as compared to Fiscal 2008 due vendor price increases for these products and services. These increases were partially offset by decreased spending during Fiscal 2009 as compared to Fiscal 2008 in recruiting, marketing and other controllable expenses.
School operating costs as a percentage of revenue at New Schools increased 430 basis points because one of the New Schools which operated during Fiscal 2008 was a “land banked” school where the Company held the rights to the land for a period of time prior to development so that the market for that school would be more fully developed by the time it opened. As a result, the school was able to ramp up quickly due to the more mature
40
Table of Contents
market, and another of the schools included in the Fiscal 2008 period was an already operating corporate contract school taken over by the Company from a previous operator and already had an existing revenue stream. The remaining schools included in both fiscal periods were opened in newer “path-of-progress” markets which management expects to continue to develop incremental enrollments and are more typical of New Schools.
School operating costs as a percentage of revenue for Acquired Schools were negatively impacted by the results of a Camelback Desert School (CDS) that was acquired during the fourth quarter of Fiscal 2008. For Fiscal 2009, this one school had a 50 basis point impact to school operating costs as a percentage of revenue for Acquired Schools, the school had a 20 basis point impact on this percentage for Fiscal 2008 as it was opened late in the fourth quarter of that fiscal year.
Rent and other
For Fiscal 2009, rent and other costs increased $7,133,000 or 14.6% to $56,152,000 from $49,019,000 for Fiscal 2008. This increase was primarily driven by an increase in rent and other costs from acquired, new and closed schools. During Fiscal 2009 closed school costs included $777,000 of depreciation expense due to a change in estimate for the remaining usable life of fixed assets that resided in six schools that were closed during the fiscal year.
| Fiscal | Increase | |||||||||||
| 2009 | 2008 | Dollar | Percent | |||||||||
Total Company | $ | 56,152 | $ | 49,019 | $ | 7,133 | 14.6 | % | ||||
Comparable Schools | $ | 43,676 | $ | 43,638 | $ | 38 | 0.1 | % | ||||
Schools acquired, opened or closed after June 30, 2007: | ||||||||||||
Acquired | 7,150 | 2,028 | 5,122 | 252.6 | ||||||||
New | 3,237 | 1,673 | 1,564 | 93.5 | ||||||||
Closed | 2,089 | 1,680 | 409 | 24.3 | ||||||||
| $ | 56,152 | $ | 49,019 | $ | 7,133 | 14.6 | % | |||||
Rent and other costs increased to 25.5% of revenue for Fiscal 2009 as compared to 24.0% for Fiscal 2008. This increase of 150 basis points consisted of the following:
| Percentage of Revenue | ||||||
| Fiscal | Fiscal | |||||
| 2009 | 2008 | |||||
Total Company | 25.5 | % | 24.0 | % | ||
Comparable Schools | 23.6 | % | 23.3 | % | ||
Schools acquired or opened subsequent to June 30, 2007 for Fiscal 2009 and July 1, 2006 for Fiscal 2008: | ||||||
Core Schools | 23.6 | % | 22.9 | % | ||
Acquired Schools | 26.6 | % | 25.6 | % | ||
New Schools | 54.3 | % | 37.8 | % | ||
Closed Schools | 106.4 | % | 38.5 | % | ||
Increases in rent and other costs as a percentage of revenue at Comparable Schools for Fiscal 2009 as compared to Fiscal 2008 are reflective of overall flat costs at these schools coinciding with overall enrollment declines due in large part to economic conditions and high unemployment rates. Rents and property taxes increased $822,000 or approximately 270 basis points during Fiscal 2009 as compared to Fiscal 2008 which was consistent with contractual rent and property tax escalations from prior years. Depreciation expense increased $560,000 or 70 basis points as a percentage of revenue due to continued capital investments to maintain and
41
Table of Contents
improve school facilities and ongoing investments in curriculum and technology. These increases were partially offset by reduced spending in marketing and school vehicles and reductions in insurance premiums and workers compensation and property damage claims retained by the Company.
School operating costs as a percentage of revenue at New Schools increased 1,650 basis points because the one of New Schools which operated during Fiscal 2008 was a “land banked” school where the Company held the rights to the land for a period of time prior to development so that the market would be more fully developed, hence the school was able to ramp up quickly due to a more mature market, and another of the schools included in the Fiscal 2008 period was an already operating corporate contract school taken over by the Company from a previous operator with no rent cost. The remaining schools included in both fiscal periods were opened in newer “path-of-progress” markets which management expects to continue to develop incremental enrollments and are more typical of New Schools.
During Fiscal 2009, the Company recorded charges for accelerated depreciation of $789,000 as a result of changes in accounting estimates regarding the remaining useful lives of assets residing at schools that were closed and that were classified as continuing operations for the periods presented. These changes in estimates had a 470 basis point impact as a percentage of revenue for Closed Schools rent and other costs.
Gross profit
As a result of the items noted above, gross profit for Fiscal 2009 decreased $1,667,000 or 5.4% to $28,984,000 from $30,651,000 for Fiscal 2008. Gross profit was 13.2% of revenue for Fiscal 2009 and 15.0% of revenue for Fiscal 2008. The change in gross profit for Fiscal 2009 as compared to the same period in the prior year is as follows (dollars in thousands):
| Fiscal 2009 | Percent of Revenues | Fiscal 2008 | Percent of Revenues | Increase (decrease) | |||||||||||||||
| Dollar | Percent | ||||||||||||||||||
Revenues | $ | 220,103 | 100.0 | % | $ | 204,201 | 100.0 | % | $ | 15,902 | 7.8 | % | |||||||
Personnel costs | 105,562 | 48.0 | 97,762 | 47.9 | 7,800 | 8.0 | |||||||||||||
School operating costs | 29,405 | 13.4 | 26,769 | 13.1 | 2,636 | 9.8 | |||||||||||||
Rent and other | 56,152 | 25.5 | 49,019 | 24.0 | 7,133 | 14.6 | |||||||||||||
Cost of services | 191,119 | 86.8 | 173,550 | 85.0 | 17,569 | 10.1 | |||||||||||||
Gross profit | $ | 28,984 | 13.2 | % | $ | 30,651 | 15.0 | % | $ | (1,667 | ) | (5.4 | )% | ||||||
The table below shows the change in gross profit for Fiscal 2009 as compared to the same period in the prior year for Comparable Schools:
| Fiscal 2009 | Percent of Revenues | Fiscal 2008 | Percent of Revenues | Increase (decrease) | |||||||||||||||
| Dollar | Percent | ||||||||||||||||||
Revenues | $ | 185,103 | 100.0 | % | $ | 187,445 | 100.0 | % | $ | (2,342 | ) | (1.2 | )% | ||||||
Personnel costs | 87,382 | 47.2 | 88,363 | 47.1 | (981 | ) | (1.1 | ) | |||||||||||
School operating costs | 24,228 | 13.1 | 24,260 | 12.9 | (32 | ) | (0.1 | ) | |||||||||||
Rent and other | 43,676 | 23.6 | 43,638 | 23.3 | 38 | 0.1 | |||||||||||||
Cost of services | 155,286 | 83.9 | 156,261 | 83.4 | (975 | ) | (0.6 | ) | |||||||||||
Gross profit | 29,817 | 16.1 | % | 31,184 | 16.6 | % | (1,367 | ) | (4.4 | )% | |||||||||
42
Table of Contents
The table below shows comparative information as a percent of revenue for Core Schools, New Schools and Acquired Schools:
| Fiscal 2009 | Percent of Revenues | Fiscal 2008 | Percent of Revenues | Increase (decrease) | |||||||||||||||||
| Dollar | Percent | ||||||||||||||||||||
Core Schools | |||||||||||||||||||||
Number of schools | 144 | 135 | |||||||||||||||||||
Revenue | $ | 185,103 | 100.0 | % | $ | 172,356 | 100.0 | % | $ | 12,747 | 7.4 | % | |||||||||
Personnel Cost | 87,382 | 47.2 | 81,191 | 47.1 | 6,191 | 7.6 | |||||||||||||||
School Operating Cost | 24,228 | 13.1 | 22,687 | 13.2 | 1,541 | 6.8 | |||||||||||||||
Rent and Other | 43,676 | 23.6 | 39,506 | 22.9 | 4,170 | 10.6 | |||||||||||||||
Gross Profit | $ | 29,817 | 16.1 | % | $ | 28,972 | 16.8 | % | $ | 845 | 2.9 | % | |||||||||
New Schools | |||||||||||||||||||||
Number of schools | 9 | 8 | |||||||||||||||||||
Revenue | $ | 5,959 | 100.0 | % | $ | 7,035 | 100.0 | % | $ | (1,076 | ) | (15.3 | )% | ||||||||
Personnel Costs | 3,319 | 55.7 | 3,899 | 55.4 | (580 | ) | (14.9 | ) | |||||||||||||
School Operating Costs | 1,000 | 16.8 | 876 | 12.5 | 124 | 14.2 | |||||||||||||||
Rent and Other | 3,237 | 54.3 | 2,658 | 37.8 | 579 | 21.8 | |||||||||||||||
Gross Loss | $ | (1,597 | ) | (26.8 | )% | $ | (398 | ) | (5.7 | )% | $ | (1,199 | ) | 301.3 | % | ||||||
Acquired Schools | |||||||||||||||||||||
Number of schools | 27 | 24 | |||||||||||||||||||
Revenue | $ | 26,894 | 100.0 | % | $ | 20,249 | 100.0 | % | $ | 6,645 | 32.8 | % | |||||||||
Personnel Costs | 13,220 | 49.2 | 9,710 | 48.0 | 3,510 | 36.1 | |||||||||||||||
School Operating Costs | 3,556 | 13.2 | 2,262 | 11.2 | 1,294 | 57.2 | |||||||||||||||
Rent and Other | 7,150 | 26.6 | 5,175 | 25.6 | 1,975 | 38.2 | |||||||||||||||
Gross Profit | $ | 2,968 | 11.0 | % | $ | 3,102 | 15.3 | % | $ | (134 | ) | (4.3 | )% | ||||||||
Closed Schools | |||||||||||||||||||||
Number of schools | 5 | 7 | |||||||||||||||||||
Revenue | $ | 1,963 | 100.0 | % | $ | 4,366 | 100.0 | % | $ | (2,403 | ) | -55.0 | % | ||||||||
Personnel Costs | 1,641 | 83.6 | 2,962 | 67.8 | (1,321 | ) | (44.6 | ) | |||||||||||||
School Operating Costs | 608 | 31.0 | 913 | 20.9 | (305 | ) | (33.4 | ) | |||||||||||||
Rent and Other | 2,089 | 106.4 | 1,680 | 38.5 | 409 | 24.3 | |||||||||||||||
Gross Loss | $ | (2,375 | ) | (121.0 | )% | $ | (1,189 | ) | (27.2 | )% | $ | (1,186 | ) | 99.7 | % | ||||||
Other | |||||||||||||||||||||
Revenue | $ | 184 | 100.0 | % | $ | 195 | 100.0 | % | $ | (11 | ) | (5.6 | )% | ||||||||
Personnel Costs | — | — | — | — | — | — | |||||||||||||||
School Operating Costs | 13 | 7.1 | 31 | 15.9 | (18 | ) | (58.1 | ) | |||||||||||||
Rent and Other | — | — | — | — | — | — | |||||||||||||||
Gross Profit | $ | 171 | 92.9 | % | $ | 164 | 84.1 | % | $ | 7 | 4.3 | % | |||||||||
Total | |||||||||||||||||||||
Revenue | $ | 220,103 | 100.0 | % | $ | 204,201 | 100.0 | % | $ | 15,902 | 7.8 | % | |||||||||
Personnel Costs | 105,562 | 48.0 | 97,762 | 47.9 | 7,800 | 8.0 | |||||||||||||||
School Operating Costs | 29,405 | 13.4 | 26,769 | 13.1 | 2,636 | 9.8 | |||||||||||||||
Rent and Other | 56,152 | 25.5 | 49,019 | 24.0 | 7,133 | 14.6 | |||||||||||||||
Gross Profit | $ | 28,984 | 13.2 | % | $ | 30,651 | 15.0 | % | $ | (1,667 | ) | (5.4 | )% | ||||||||
43
Table of Contents
Gross profit for Core Schools decreased as a percentage of revenue, to 16.1% during Fiscal 2009 as compared to 16.8% for Core Schools reported in the prior fiscal year.
Gross loss as a percentage of revenue from New Schools worsened to (26.8%) during Fiscal 2009 as compared to (5.7%) during Fiscal 2008. New Schools for the Fiscal 2009 period include nine schools as compared to eight schools for the Fiscal 2008 period. One of the new schools included in the Fiscal 2008 period was a “land banked” school where the Company held the rights to the land for a period of time prior to development so that the market for that school would be more fully developed by the time it opened (As a result, the school was able to ramp up quickly due to a more mature market). Another of the schools included in the Fiscal 2008 period was an already operating corporate contract school taken over by the Company from a previous operator with no rent costs and which was immediately accretive. The remaining schools included in both fiscal periods were opened in newer “path-of-progress” markets which management expects to continue to develop incremental enrollments and are more typical of New Schools.
Gross profit from Acquired Schools during Fiscal 2009 was negatively impacted primarily by the results of one Camelback Desert School (CDS) with gross losses of $259,000. This loss had a negative 125 basis point impact on gross profit percentages for continuing operations for Fiscal 2009. CDS was acquired for the strong demographic characteristics of the Phoenix, Arizona market. The Company believes that under its management the school may perform more in line with current, well-operated schools’ financial performance as best practices are adopted at this school and the requisite time passes for local market acceptance which may be extended due to local market conditions. The Company has an early lease termination option to protect itself without continuing liability in the case that it is not able to obtain the desired financial performance after a certain period of time.
General and administrative expenses
During Fiscal 2009, general and administrative expenses increased $210,000, or 1.1%, to $18,726,000 from $18,516,000 for Fiscal 2008. Fiscal 2009 general and administrative expenses decreased to 8.5% of revenue as compared to 9.1% for Fiscal 2008.
The overall increase in general and administrative expenses included consulting and professional fees of $368,000 related to the evaluation of whether a sale of the Company was in the best interest of its shareholders, increased legal fees of $286,000 incurred as a result of a lawsuit filed against the Company by the United States Department of Justice and increased amortization expense from acquisitions of $688,000. These increases were offset by a decrease of approximately $945,000 due to lower performance-based incentive compensation (based on targets as determined by the Compensation Committee and approved by the Board of Directors) and the effects of an adjustment of $266,000 that corrected the Company’s accounting for its deferred compensation plan.
Operating Income
As a result of the factors mentioned above, operating income decreased $1,877,000 or 15.5% to $10,258,000 for Fiscal 2009 from $12,135,000 for Fiscal 2008. Operating income decreased in Fiscal 2009 to 4.7% of revenue from 5.9% in Fiscal 2008.
Interest expense
Interest expense increased $506,000 or 106.5% to $981,000 for Fiscal 2009 from $475,000 for Fiscal 2008. This increase corresponded to an increase of average debt outstanding of $14,700,000 during Fiscal 2009 as compared to $5,400,000 during Fiscal 2008. During Fiscal 2009, average debt outstanding increased primarily due to the Company’s use of debt to finance acquisitions, most substantially, the Enchanted Care acquisition with a purchase price and acquisition costs of over $14 million and which closed during the third quarter of Fiscal 2008.
44
Table of Contents
Income tax expense
Income tax expense from continuing operations for Fiscal 2009 was $3,622,000 as compared to $4,621,000 for Fiscal 2008. The Company’s effective tax rate for Fiscal 2009 and Fiscal 2008 was 38.5%. Income tax expense was computed by applying estimated effective income tax rates to the income or loss before income taxes. Income tax expense varies from the statutory federal income tax rate due primarily to state income taxes.
At June 27, 2009 and June 28, 2008, the Company had net deferred tax assets totaling $301,000 and $47,000, respectively. Deferred tax assets, net of valuation allowances, have been recognized to the extent that their realization is more likely than not. However, the amount of the deferred tax assets considered realizable could be adjusted in the future as estimates of taxable income or the timing thereof are revised. If the Company is unable to generate sufficient taxable income in the future through operating results, increases in the valuation allowance may be required through an increase to tax expense in future periods. Conversely, if the Company recognizes taxable income of a suitable nature and in the appropriate periods, the deferred tax assets will more likely than not be realized.
Other Income
Other income for Fiscal 2009 decreased $248,000 to $78,000 from $326,000 for Fiscal 2009.
During the second quarter of Fiscal 2008, the Company received a payment of $300,000 for the settlement and release of a contract for which the Company no longer has performance obligations. The settlement of this contract resulted in an increase to Fiscal 2008 basic and diluted earnings per share of $0.02.
Discontinued operations
In accordance with SFAS No. 144, “Accounting for the Impairment or Disposal of Long-Lived Assets,” the results of operations for schools that are no longer operating under the Company’s management have been reflected in the consolidated financial statements and notes as discontinued operations for all periods presented. The operating results for discontinued operations in the statements of operations for all periods presented, net of tax, are as follows (dollars in thousands):
| Fiscal | ||||||||
| 2009 | 2008 | |||||||
Revenues | $ | 1,761 | $ | 2,057 | ||||
Cost of services | (2,242 | ) | (1,730 | ) | ||||
Rent and other | (1,112 | ) | (611 | ) | ||||
Closed school lease reserves | (340 | ) | (245 | ) | ||||
Gain from sale of schools | — | — | ||||||
Gain from settlement of sublease | — | 1,028 | ||||||
Income (loss) from discontinued operations before income tax benefit | (1,933 | ) | 499 | |||||
Income tax (expense) benefit | 764 | (186 | ) | |||||
Income (loss) from discontinued operations, net of income taxes | $ | (1,169 | ) | $ | 313 | |||
During the fourth quarter of Fiscal 2008, the Company settled a contract dispute in the amount of $1,250,000 to be paid to the Company over five years. The net gain resulting from this settlement is $1,028,000 after costs and discount for the five year collection period. This gain resulted in an increase to Fiscal 2008 basic and diluted earnings per share of $0.06 included in discontinued operations.
45
Table of Contents
Net Income
As a result of the above factors, the Company’s net income was $4,564,000 for Fiscal 2009 as compared to $7,678,000 for Fiscal 2008.
Liquidity and Capital Resources
Cash Flow
The Company’s principal sources of liquidity are cash flow from operations and amounts available under its revolving credit commitment under the 2008 Amended Credit Agreement. Principal uses of liquidity are to meet working capital needs, debt service, capital expenditures related to the renovation and maintenance of its existing schools and capital expenditures related to new school development, furniture, fixtures, technology and curriculum.
During Fiscal 2010, the Company used $11,983,000 for the acquisition of one elementary school and an on-line distance learning school. During Fiscal 2009, the Company used $7,196,000 for the acquisition of nine school businesses.
Under the 2008 Amended Credit Agreement, at July 3, 2010, there was $21,500,000 outstanding and at September 9, 2010, there was $21,875,000 outstanding. In addition, there was $2,615,000 outstanding for letters of credit as of July 3, 2010 and September 15, 2010. The total unused and available portion of the 2008 Amended Credit Agreement, after allowance for the letters of credit, at June 27, 2009 was $50,885,000 and at September 9, 2010 was $50,510,000. The Company uses derivative financial instruments to manage its exposure to fluctuations in interest rates, at July 3, 2010 and September 15, 2010, the Company had interest rate swap contracts with notional amounts totaling $13,000,000.
Cash provided by operating activities for Fiscal 2010, Fiscal 2009 and 2008 was $10,135,000, $12,787,000 and $14,333,000, respectively. The $2,652,000 decrease in Fiscal 2010 as compared to Fiscal 2009 was primarily due to a decrease in net income of $2,692,000.
Cash used in investing activities for Fiscal 2010, 2009 and 2008 was $17,008,000, $14,646,000 and $29,353,000, respectively. The $2,362,000 increase in Fiscal 2010 as compared to Fiscal 2009 was primarily due to an increase of cash used for acquisitions of $4,787,000. Cash used to purchase capital assets decreased $1,925,000 to $5,525,000 during Fiscal 2010 as compared to $7,450,000 during Fiscal 2009 as the Company opened four New Schools during both years.
Cash provided by financing activities for Fiscal 2010, Fiscal 2009 and Fiscal 2008 was $7,693,000, $1,581,000 and $12,270,000, respectively. Cash provided in Fiscal 2010 was primarily due to the net proceeds from borrowing activities of $7,975,000 during Fiscal 2010 compared to net proceeds of borrowings of $1,025,000 during Fiscal 2009.
As a result of the above cash flow activity, total cash and cash equivalents increased by $820,000 from $786,000 at June 27, 2009 to $1,606,000 at July 3, 2010.
Revolving Credit Agreement
At the beginning of Fiscal 2008, the Company had a credit agreement in the amount of $50,000,000, which provided for a $50,000,000 Revolving Credit Commitment and up to $3,500,000 in letters of credit as a sub-limit of the Revolving Credit Commitment (as amended, the “Prior Credit Agreement”). The Prior Credit Agreement was scheduled to terminate on October 29, 2011. During Fiscal 2008, the Company amended the loan facility under its Prior Credit Agreement (the “2008 Credit Agreement”). The 2008 Credit Agreement provides for a $75,000,000 Revolving Credit Commitment with a $25,000,000 accordion feature permitting the Company to increase the size of the facility under its current terms and conditions by obtaining additional credit from either
46
Table of Contents
participating or new banks. Under the terms of the 2008 Credit Agreement, proceeds may be used to fund permitted acquisitions, capital expenditures and ongoing business operations. The borrowing rates on the 2008 Credit Agreement were determined pursuant to matrix based on our debt to defined EBITDA leverage ratio, with either LIBOR or bank base rate indexed borrowings. The 2008 Credit Agreement has a five-year term that ends on June 6, 2013.
On January 15, 2010, the Company and its lenders amended the 2008 Credit Agreement (the “2008 Amended Credit Agreement”). The 2008 Amended Credit Agreement continues to provide for a $75,000,000 Revolving Credit Commitment with a $25,000,000 accordion feature permitting the Company to increase the size of the facility and a term that ends on June 6, 2013. The 2008 Amended Credit Agreement amends certain operational covenants that the Company was required to meet under the 2008 Credit Agreement. As of July 3, 2010 and June 27, 2009, outstanding borrowings equaled $21,500,000 and $13,525,000, respectively and outstanding letters of credit were $2,615,000.
The Company’s obligation under its 2008 Credit Agreement and the 2008 Amended Credit Agreement bears interest, at the Company’s option, at either:
| (1) | a selected LIBOR rate plus a margin based on our debt to defined EBITDA leverage ratio |
or;
| (2) | a defined base rate plus a margin based on our debt to defined EBITDA leverage ratio. |
The applicable margins may be adjusted quarterly based on the leverage ratio, and adjusted periodically based on adjustments to the indexed LIBOR rate or defined base rate. The Company also pays a letter of credit fee based on the face amount of each letter of credit calculated at the margin applicable to loans under the 2008 Amended Credit Agreement bearing interest based on selected LIBOR rate. The ranges of margins applicable during Fiscal 2010 and Fiscal 2009 were as follows:
| Spreads added to LIBOR or Base Rates | ||||
| June 6, 2008 - January 14, 2010 | January 15, 2010 - July 3, 2010 | |||
LIBOR rate plus debt to defined EBITDA-indexed rate | 1.15% - 2.40% | 2.50% - 3.75% | ||
Base rate plus debt to defined EBITDA-indexed rate | 0.15% - 0.90% | 1.50% - 2.75% | ||
Letter of Credit fees LIBOR plus defined EBITDA-indexed rate | 1.15% - 2.40% | 2.50% - 3.75% | ||
The Company’s obligations under the 2008 Amended Credit Agreement are guaranteed by subsidiaries and collateralized in part by a pledge of the stock of the Company’s subsidiaries and liens on all real and personal property owned by the Company.
The 2008 Amended Credit Agreement contains customary covenants and provisions that restrict the Company’s ability to change its business, acquire businesses, declare or pay dividends, grant liens, incur additional indebtedness, make capital expenditures, govern the use of proceeds from disposition of assets or equity related transactions and requires repayment in certain change of control events. In addition, the 2008 Amended Credit Agreement provides that the Company must meet or exceed amounts for defined EBITDA and fixed charge coverage ratios and must not exceed certain leverage ratios. The Company’s loan covenants under its 2008 Amended Credit Agreement limit the amount of senior debt borrowings and acquisitions that are permitted.
Long-Term Obligations and Commitments
The Company has certain contractual obligations and commercial commitments. Contractual obligations are those that will require cash payments in accordance with the terms of a contract, such as a loan agreement or
47
Table of Contents
lease agreement. Commercial commitments represent potential obligations for performance in the event of demands by third parties. At July 3, 2010, letter of credit commitments totaled $2,615,000.
The Company’s most significant contractual obligations are real estate leases for its schools. Additionally, the Company has closed locations for which it continues to have cash obligations under lease agreements with third party landlords. The Company attempts to mitigate these cash payment obligations by subleasing the locations to third parties. The Company has cash risk for the future real estate leases for closed schools for which it does not have third party sublease coverage or where third party sublease coverage on any specific sublease may not equal the total cash obligation under the lease agreement for that property.
Future minimum lease obligations, by year and in the aggregate, for all real properties, vehicle and other leases that the Company and its subsidiaries have entered into, consisted of the following at July 3, 2010 (dollars in thousands):
| Total | Fiscal | ||||||||||||||||||||
| 2011 | 2012 | 2013 | 2014 | 2015 | Thereafter | ||||||||||||||||
Long term debt obligations including contractual interest | $ | 24,508 | $ | 988 | $ | 988 | $ | 22,532 | $ | — | $ | — | $ | — | |||||||
Letters of credit | 2,615 | 2,615 | — | — | — | — | |||||||||||||||
Operating leases | 347,241 | 41,388 | 39,478 | 36,292 | 33,309 | 30,938 | 165,836 | ||||||||||||||
Total | $ | 374,364 | $ | 44,991 | $ | 40,466 | $ | 58,824 | $ | 33,309 | $ | 30,938 | $ | 165,836 | |||||||
Most of the above real estate leases are triple-net leases requiring the Company to pay all applicable real estate taxes, utility expenses, maintenance and insurance costs, that are not included in the amounts presented above. Most of the above operating leases are real estate leases that contain annual rent increase provisions based on changes in consumer price indexes or other formulas, which are not reflected in the above schedule. Rent expense for all leases included in continuing operations was $40,523,000, $37,376,000 and $32,254,000 for Fiscal 2010, Fiscal 2009 and Fiscal 2008, respectively.
At July 3, 2010, there were eight leased properties included in discontinued operations. Six of these properties were sub-leased and two remained vacant. The obligations of the leases that are subject to a sublease are substantially covered by the subtenant. If the parties under these sublease agreements default, the Company has the obligation to pay rent under the terms of these leases. The operating lease commitments reflected are net of sublease amounts due to the Company of $6,606,000. Some of the closed location real estate lease obligations extend beyond the term of the current subleases on those properties. The leases on the closed schools expire between 2010 and 2017. The Company’s liability with respect to closed school lease commitments could change if sublessees default under their sublease with the Company or if the Company is unsuccessful in subleasing additional closed schools or extending existing sublease agreements. Some of the closed school lease commitments extend beyond the term of the current subleases on the respective property.
In addition to the lease obligations noted above, the Company has made guarantees for fourteen leases that were assigned to third parties. All of these leases will expire no later than April of 2013. The Company has assessed its exposure regarding the assignment of the Guaranteed Properties and has determined that the fair value of this exposure is de minimis and therefore has not recorded a liability for this contingency. The maximum potential undiscounted amount of future payments the Company could be required to pay under these guarantees as of July 3, 2010 is $1,659,000.
Capital Expenditures
Company funded capital expenditures for New School development includes school equipment, furniture, fixtures and curricula purchased by the Company for the operations of the New Schools. The funds used to open
48
Table of Contents
or acquire these schools were provided by cash flow from operations, the Company’s Revolving Credit Agreement or asset sales. Renovations and equipment purchases are capital expenditures incurred for existing schools in order to maintain the operations and, where necessary, upgrade the school facility and/or extend the service life of the school. The Company’s current senior bank credit facility has annual limitations on the amount of capital expenditures. For Fiscal 2010, this limitation was $15,000,000.
Capital expenditures were as follows (dollars in thousands):
| Fiscal | |||||||||
| 2010 | 2009 | 2008 | |||||||
New school development | $ | 1,389 | $ | 2,789 | $ | 1,716 | |||
Facility Renovations | 2,435 | 2,583 | 3,540 | ||||||
Curriculum | 964 | 1,232 | 1,392 | ||||||
Corporate and information systems | 737 | 846 | 1,474 | ||||||
| $ | 5,525 | $ | 7,450 | $ | 8,122 | ||||
During Fiscal 2010, the Company opened four new preschools and acquired one preschool and acquired an online K-12 distance learning school, which is not site based, but which does require capital expenditures for technology and curriculum. During Fiscal 2009, the Company opened four new preschools, acquired six preschools and three elementary schools, and added three new preschools which opened during the first quarter of Fiscal 2010. During Fiscal 2008, the Company opened five new preschools and acquired eighteen preschools and two elementary schools.
Insurance
Companies involved in the education and care of children may not be able to obtain insurance for the totality of risks inherent in their operations. In particular, general liability coverage can have insurance sub-limits per claim for child abuse. The Company believes it has adequate insurance coverage at this time. There can be no assurance that in future years the Company will not become subject to lower limits or substantial increases in insurance premiums.
Recently Issued Accounting Standards
In February 2010, the FASB amended ASC Topic 855 “Subsequent Events”. The amendment does not change the definition of a subsequent event (i.e. an event or transaction that occurs after the balance sheet date but before the financial statements are issued) but requires SEC filers to evaluate subsequent events through the date that its financial statements are issued. FASB ASC Topic 855 has been effective during Fiscal 2010. The adoption of FASB ASC Topic 855 did not have a material effect on the Company’s consolidated financial statements.
In January 2010, the FASB issued ASU 2010-06, “Fair Value Measurements and Disclosures (ASC Topic 820) — Improving Disclosures about Fair Value Measurements”. This ASU requires new disclosures and clarifies certain existing disclosure requirements about fair value measurements. ASU 2010-06 requires a reporting entity to disclose significant transfers in and out of Level 1 and Level 2 fair value measurements, to describe the reasons for the transfers and to present separately information about purchases, sales, issuances and settlements for fair value measurements using significant unobservable inputs. ASU 2010-06 is effective for interim and annual reporting periods beginning after December 15, 2009, except for the disclosures about purchases, sales, issuances and settlements in the roll forward of activity in Level 3 fair value measurements, which is effective for interim and annual reporting periods beginning after December 15, 2010; early adoption is permitted. The adoption of ASU 2010-06 has not had a material impact on our financial position, results of operations or cash flows.
49
Table of Contents
In October 2009, the FASB issued ASU 2009-13, “Revenue Recognition (Topic 605) — Multiple-Deliverable Revenue Arrangements”. ASU 2009-13 revises certain accounting for revenue arrangements with multiple deliverables. In particular when vendor specific objective evidence or third party evidence for deliverables in an arrangement cannot be determined, ASU 2009-13 allows use of a best estimate of the selling price to allocate the arrangement consideration among them. ASU 2009-13 is effective for the first quarter of Fiscal 2011, with early adoption permitted. We do not expect that the adoption of ASU 2009-13 will have a material impact on our financial position, results of operations or cash flows.
In June 2009, the Financial Accounting Standards Board (“FASB”) issued the codification of Generally Accepted Accounting Principles (the “Codification”). “The Codification is intended to become the source of the authoritative U.S. GAAP recognized by the FASB to be applied by nongovernmental entities. On the effective date of this statement, the Codification superseded all then-existing non-SEC accounting and reporting standards. All other non-grandfathered non-SEC accounting literature not included in the Codification has become non-authoritative. The Codification became effective for financial statements issued for interim and annual periods ending after September 15, 2009 and is reflected in this Form 10-Q. The adoption of the Codification has not had a material effect on the Company’s consolidated financial statements.
On June 28, 2009, the Company adopted an update to ASC 260 “Earnings per Share” which addressed “whether instruments granted in share-based payment transactions are participating securities prior to vesting and, therefore, need to be included in the earnings allocation in computing earnings per share under the two-class method as described in ASC 260. Under the guidance in this topic, unvested share-based payment awards that contain non-forfeitable rights to dividends or dividend equivalents (whether paid or unpaid) are participating securities and shall be included in the computation of earnings per share pursuant to the two-class method. The adoption of this topic did not have an impact on the Company’s financial statements.
In December 2007 the FASB expanded the requirements of ASC Topic 805, “Business Combinations”. Among other things, this topic broadened the scope Topic 805 to include all transactions where an acquirer obtains control of one or more other businesses; retains the guidance to recognize intangible assets separately from goodwill; requires, with limited exceptions, that all assets acquired and liabilities assumed, including certain of those that arise from contractual contingencies, be measured at their acquisition date fair values; requires most acquisition and restructuring-related costs to be expensed as incurred; requires that step acquisitions, once control is acquired, be recorded at the full amounts of the fair values of the identifiable assets, liabilities and the non-controlling interest in the acquiree; and replaces the reduction of asset values and recognition of negative goodwill with a requirement to recognize a gain in earnings. The adoption of this topic did not have any effect on the Company’s historical financial statements. See Note 3 for the application of this standard to transactions that occurred during Fiscal 2010.
Critical Accounting Policies
The preparation of financial statements in conformity with accounting principles generally accepted in the United States of America requires management to make estimates and assumptions that affect the reported amounts of assets and liabilities and disclosure of contingent assets and liabilities as of the date of the financial statements and the reported amounts of revenues and expenses during the reporting period. Actual results could differ from those estimates under different conditions or if assumptions change. The most significant estimates underlying the accompanying consolidated financial statements include long-lived assets and goodwill valuations and any potential impairment, the allowance for doubtful accounts, the valuation of stock compensation expense, estimates of future obligations related to closed facilities, valuations of liabilities for workers’ compensation claim liabilities retained by the Company and realization of our deferred tax assets.
Principles of Consolidation and Basis of Presentation:
Fiscal Period. The fiscal year ended July 3, 2010 (“Fiscal 2010”) includes 53 weeks. The fiscal years ended June 27, 2009 (“Fiscal 2009”) and June 28, 2008 (“Fiscal 2008”) each includes 52 weeks.
50
Table of Contents
Consolidation. All significant intercompany balances and transactions have been eliminated.
Reclassifications. As a result of certain school closures during Fiscal 2009 the Company has conformed amounts reported for Fiscal 2008 in its Annual Report on Form 10-K to the period ended July 3, 2010.
Recognition of Revenues:
We recognize revenue when the following criteria are met: an arrangement exists by way of a registration, an enrollment agreement or a contract, pursuant to which educational services are rendered over time, and a specific tuition rate and/or fee will probably be collected.
Net revenues include tuition, fees and other revenues, reduced by discounts. Fees are received for registration, other educational services and management fees. Ancillary income is primarily comprised of supplemental fees from certain after school programs, summer programs, camps and field trips. Tuition revenues, net of discounts and other revenues, are recognized as services are performed.
Net revenues with respect to Laurel Springs, in some cases include the delivery of learning materials, which are included with tuition revenue and accounted for as a single unit of accounting. Tuition payments received in advance of the time period for which service is to be performed are recorded as deferred revenue. Registration fees are recognized over the applicable school period. Certain fees may be received in advance of services being rendered, in which case the fee revenue is deferred and recognized over the appropriate period of service.
Cash and Cash Equivalents:
The Company considers cash on hand, cash in bank accounts and cash investments with maturities of three months or less when purchased as cash and cash equivalents. The Company maintains funds in accounts in excess of FDIC insurance limits; however, the Company minimizes the risk of losing its deposits by maintaining such deposits in high quality financial institutions. Amounts receivable from credit card companies are also considered cash equivalents because they are both short-term and highly liquid in nature and are typically converted to cash within three days of the sales transaction.
Accounts Receivable and Credit Risk:
The Company provides education services to the children attending its schools. In certain circumstances, the Company grants small amounts of credit to its customers for a limited period of time. Exposure to losses on receivables is principally dependent on each person’s financial condition. The Company monitors its exposure for credit losses and maintains allowances for anticipated losses. The Company’s sources of revenues are geographically diverse and, consequently, the Company is not dependent on economic conditions in any one geographic area or market.
The Company’s accounts receivable are comprised primarily of tuition due from parents and governmental agencies. Accounts receivable are presented at estimated net realizable value. The Company uses estimates in determining the collectability of its accounts receivable and must rely on its evaluation of historical trends, governmental funding processes, specific customer issues and current economic trends to determine appropriate reserves. Material differences between management’s estimates and actual realized accounts receivables may result in adjustments to the timing of bad debt expense. Customer accounts are considered due when services are rendered and are considered for write-off when open for sixty days subsequent to the service date. Accounts due from governmental agencies are due within the terms as outlined within each agency agreement.
Long-Lived and Intangible Assets:
Long-lived assets and certain identifiable intangibles to be held and used are reviewed for impairment whenever events or changes in circumstances indicate that the carrying value of such assets may not be
51
Table of Contents
recoverable. An asset’s value is impaired if management’s estimate of the aggregate future cash flows, undiscounted and without interest charges, to be generated by the asset are less than the carrying value of the asset. Such cash flows consider factors such as expected future operating income and historical trends, as well as the effects of demand and competition. To the extent impairment has occurred, the loss will be measured as the excess of the carrying amount of the asset over the fair value of the asset. Such estimates require the use of judgment and numerous subjective assumptions, which, if actual experience varies, could result in material differences in the requirements for impairment charges.
No impairment charges were recorded during Fiscal 2010, Fiscal 2009 or Fiscal 2008.
Discontinued Operations:
The results of operations for schools that are no longer operating under the Company’s management and were not part of the operations of a cluster of schools that continue to operate have been reflected in the consolidated financial statements and notes as discontinued operations for the periods presented.
Goodwill:
Goodwill is tested annually for impairment as of the end of the respective fiscal year as well as whenever events or changes in circumstances indicate that the carrying value may not be recoverable. Circumstances that could trigger an interim impairment test include but are not limited to: a significant adverse change in the business climate or legal factors; an adverse action or assessment by a regulator; unanticipated competition; loss of key personnel; the likelihood that a reporting unit or significant portion of a reporting unit will be sold or otherwise disposed; or results of testing for recoverability of a significant asset group within a reporting unit.
Goodwill impairment testing consists of a two-step process. Step 1 of the impairment test involves comparing the fair values of the applicable reporting units with their carrying values, including goodwill. If the carrying amount of a reporting unit exceeds the reporting unit’s fair value, we perform Step 2 of the goodwill impairment test to determine the amount of impairment loss. Step 2 of the goodwill impairment test involves comparing the implied fair value of the affected reporting unit’s goodwill against the carrying value of that goodwill. In performing the first step of the impairment test, we reconcile the aggregate estimated fair value of our reporting units to our enterprise value (which includes a control premium).
The testing of goodwill for impairment is performed at a level referred to as a reporting unit. The Company currently has six reporting units based primarily on our geographical regions and gross margin history. Goodwill is allocated to each reporting unit based on actual goodwill valued in connection with each business combination consummated within each reporting unit. To estimate the fair value of our reporting units, we use the income approach. The income approach is based on a discounted cash flow analysis (“DCF”) and calculates the fair value by estimating the after-tax cash flows attributable to a reporting unit and then discounting the after-tax cash flows to a present value using a risk-adjusted discount rate. Assumptions used in the DCF require the exercise of significant judgment, including judgment about appropriate discount rates and terminal values, growth rates, and the amount and timing of expected future cash flows. The forecasted cash flows are based on current plans and for years beyond that plan, the estimates are based on assumed growth rates. We believe the assumptions are consistent with the plans and estimates used to manage the underlying businesses. The discount rates, which are intended to reflect the risks inherent in future cash flow projections, used in the DCF are based on estimates of the weighted-average cost of capital (“WACC”) of a market participant. Such estimates are derived from our analysis of peer companies and considered the industry weighted average return on debt and equity from a market participant perspective. Specific assumptions used were as follows:
| July 3, 2010 | June 27, 2009 | |||||
Weighted average cost of capital | 14.5 | % | 14.0 | % | ||
Compounded annual revenue growth rate for five years | 4.9 | % | 3.9 | % | ||
Terminal year stable growth rate | 3.0 | % | 3.0 | % |
52
Table of Contents
The Company believes the assumptions used to determine the fair value of our respective reporting units are reasonable. If different assumptions were used, particularly with respect to forecasted cash flows or WACCs, different estimates of fair value may result and there could be the potential that an impairment charge could result. Actual operating results and the related cash flows of the reporting units could differ from the estimated operating results and related cash flows.
As of July 3, 2010, the following six reporting units with goodwill totaling $83,275,000 had fair values exceeding their carrying values as follows:
| Goodwill ($000’s) | |||
5% - 20% estimated fair value in excess of carrying value: | |||
Reporting Unit 1 | $ | 35,324 | |
Reporting Unit 2 | 4,328 | ||
Reporting Unit 3 | 1,948 | ||
21% - 50% estimated fair value in excess of carrying value: | |||
Reporting Unit 4 | 14,578 | ||
> 50% estimated fair value in excess of carrying value: | |||
Reporting Unit 5 | 13,257 | ||
Reporting Unit 6 | 4,752 | ||
Goodwill from FY 2010 acquisitions | 9,088 | ||
Total goodwill at July 3, 2010 | $ | 83,275 | |
With the exception of potential regional economic differences, the fair value of all of the Company’s reporting units are primarily affected by the forecasted demand and spending on its educational services. The number of student enrollments and tuition rates charged are two factors, amongst several, that may impact the Company’s revenue and gross profits. Recent unemployment rate increases and decreases have and, we believe, will continue to have potentially negative or positive impacts on enrollment. If unemployment rates improve within the key age groups that represent the majority of our families, the Company believes this will result in increases in revenue and gross profit. Additionally, the Company has historically implemented tuition increases when appropriate and intends to continue this practice while considering trends in the costs to provide services and competitive factors. Some of the inherent assumptions and estimates used in determining the estimated fair value of these reporting units are outside the control of management, including interest rates, cost of capital, unemployment rates and tax rates. It is possible that changes in circumstances, existing at the measurement date or at other times in the future, or in the numerous estimates associated with management’s judgments, assumptions and estimates made in assessing the fair value of our goodwill, may result in an impairment charge of a portion or all of the goodwill amounts previously noted. If we record an impairment charge, our financial position and results of operations could be adversely affected.
Deferred Financing Costs:
Included in deposits and other assets are deferred financing costs that are incurred by the Company in connection with the issuance of debt. These costs are deferred and amortized to interest expense over the life of the underlying indebtedness. As of July 3, 2010 and June 27, 2009, $791,000 and $686,000 in unamortized financing costs were carried on the Company’s balance sheet, respectively.
Stock Compensation:
The Company records estimated compensation costs for all share-based payments based on estimated fair value at the grant date. For purposes of calculating grant date fair value for stock options, the value of the options
53
Table of Contents
is estimated using a Black Scholes option pricing formula. The calculated expense is amortized over the options’ requisite service period, generally, the vesting period. Stock compensation is estimated only for grants expected to vest, which is total estimated value less estimated forfeitures. Restricted stock awards are valued based at their fair value on the grant date and amortized over their vesting period.
Income Taxes:
The Company is subject to income taxes in the U.S. federal jurisdiction, and various U.S. states’ jurisdictions. Tax regulations within each jurisdiction are subject to the interpretation of the related tax laws and regulations and require significant judgment to apply. With few exceptions, the Company is no longer subject to U.S. federal, state and local income tax examinations by tax authorities for the years before Fiscal 2005.
The Company recognizes deferred income taxes in regard to the tax consequences of “temporary differences” by applying enacted statutory tax rates applicable to future years to differences between the financial statement carrying amounts and the tax basis of existing assets and liabilities. The effect on deferred taxes of a change in tax rate is recognized in income in the period of enactment. An estimated valuation allowance is recorded based on the uncertainty regarding the ultimate realizability of deferred tax assets.
The Company recognizes the financial statement benefit of a tax position only after determining that the relevant tax authority would more likely than not sustain the position following an audit. For tax positions meeting the more-likely-than-not threshold, the amount recognized in the financial statements is the largest benefit that has a greater than 50 percent likelihood of being realized upon ultimate settlement with the relevant tax authority.
| ITEM 7A. | QUANTITATIVEAND QUALITATIVE DISCLOSURESABOUT MARKET RISK. |
Market risk represents the risk of loss that may impact the consolidated financial position, results of operations or cash flows of the Company. The Company is exposed to market risk in the areas of interest rates and interest rate swap agreements.
Interest Rates
The Company’s exposure to market risk for changes in interest rates relates primarily to debt obligations. The Company has interest rate exposure as a result of the 2008 Amended Credit Agreement. Borrowings under the 2008 Amended Credit Agreement are subject to variable prime base rate pricing. Accordingly, a 1.0% change in the LIBOR rate and the prime rate would result in interest expense changing by approximately $157,000 and $48,000 during Fiscal 2010 and Fiscal 2009, respectively. As of July 3, 2010, under the 2008 Amended Credit Agreement the Company had outstanding $21,500,000 in borrowings and $2,615,000 in letter of credit commitments.
Interest Rate Swap Agreements
The Company uses derivative financial instruments to manage its exposure to fluctuations in interest rates. The instruments are subject to varying degrees of market risk, as they are subject to rate and price fluctuations and are also subject to elements of credit risk in the event the counterparty should default. At July 3, 2010 and June 27, 2009, the Company had the following interest rate swap contracts outstanding that were designated as cash flow hedges and were determined to be highly effective:
Swap # | Notional Amount | Fixed Rate Payment Obligation | Counterparty payments index | Termination Date | ||||||
Swap Contracts at July 3, 2010: | ||||||||||
1 | $ | 3,000,000 | 1.15 | % | LIBOR | February 27, 2012 | ||||
2 | 5,000,000 | 1.48 | % | LIBOR | March 26, 2012 | |||||
Swap Contracts at June 27, 2009: | ||||||||||
3 | 5,000,000 | 3.68 | % | LIBOR | June 6, 2010 | |||||
4 | 5,000,000 | 2.74 | % | LIBOR | April 28, 2010 | |||||
54
Table of Contents
In addition to the above interest rate swaps, during Fiscal 2010, the Company entered into a “blend and extend” transaction with its bank, whereby the original interest rate swap (Swap #3 above) was terminated and replaced with a new interest rate swap with a termination date of May 28, 2012 and a rate of 1.86%. This transaction resulted in the termination of hedge accounting for the original interest rate swap. During Fiscal 2010, $53,000 of previously recognized other comprehensive income derived from Swap #3 was reclassified as expense. As of July 3, 2010, the fair value of the new interest rate swap was a liability of $103,000.
| ITEM 8. | FINANCIAL STATEMENTSAND SUPPLEMENTARY DATA. |
Financial statements and supplementary financial information specified by this Item, together with the Reports of the Company’s independent registered public accounting firm thereon, are included in this Annual Report on Form 10-K on pages F-1 through F-30 below.
| ITEM 9. | CHANGESINAND DISAGREEMENTSWITH ACCOUNTANTSON ACCOUNTINGAND FINANCIAL DISCLOSURE. |
None.
| ITEM 9A. | CONTROLSAND PROCEDURES. |
Disclosure Controls and Procedures
We maintain disclosure controls and procedures that are designed to ensure that information required to be disclosed in our Securities Exchange Act of 1934 reports is recorded, processed, summarized and reported within the time periods specified in the Securities and Exchange Commission’s rules and forms, and that such information is accumulated and communicated to our management, including our Chief Executive Officer and our Chief Financial Officer, as appropriate, to allow timely decisions regarding required disclosure. In designing and evaluating the disclosure controls and procedures, our management recognized that any controls and procedures, no matter how well designed and operated, can provide only reasonable assurance of achieving the desired control objectives, and our management necessarily was required to apply its judgment in evaluating the cost-benefit relationship of possible controls and procedures.
Under the supervision of our Chief Executive Officer and Chief Financial Officer, we have carried out an evaluation of the effectiveness of our disclosure controls and procedures as of the end of the period covered by this report. Based upon that evaluation, our Chief Executive Officer and Chief Financial Officer concluded that our disclosure controls and procedures are effective.
There have been no significant changes in our internal controls over financial reporting that have materially affected, or are reasonably likely to materially affect, our internal control over financial reporting during our most recent fiscal quarter.
Management’s Annual Report on Internal Control Over Financial Reporting
Our management is responsible for establishing and maintaining adequate internal control over financial reporting as defined in Rules 13a-15(f) and 15d-15(f) under the Exchange Act. Because of its inherent limitations, internal control over financial reporting may not prevent or detect misstatements. Projections of any evaluation of effectiveness to future periods are subject to the risks that controls may become inadequate because of changes in conditions, or that the degree of compliance with the policies or procedures may deteriorate.
Management assessed the effectiveness of our internal control over financial reporting as of July 3, 2010. In making this assessment, management used the criteria set forth by the Committee of Sponsoring Organizations of the Treadway Commission (COSO) in Internal Control-Integrated Framework.
55
Table of Contents
Based on this assessment management believes that, as of July 3, 2010, our internal control over financial reporting is effective.
Our independent registered public accounting firm, Grant Thornton LLP, audited the Company’s internal control over financial reporting as of July 3, 2010 and their report dated September 16, 2010 expressed an unqualified opinion on our internal control over financial reporting and is included in this Item 9A.
Changes in Internal Control Over Financial Reporting
There have been no changes in internal controls over financial reporting identified in connection with the foregoing evaluation that occurred during our last fiscal quarter that have materially affected, or are reasonably likely to materially affect our internal control over financial reporting.
56
Table of Contents
REPORT OF INDEPENDENT REGISTERED PUBLIC ACCOUNTING FIRM
Board of Directors and Shareholders
Nobel Learning Communities, Inc.
We have audited Nobel Learning Communities, Inc. (a Delaware Corporation) and subsidiaries’ (the “Company”) internal control over financial reporting as of July 3, 2010, based on criteria established inInternal Control—Integrated Framework issued by the Committee of Sponsoring Organizations of the Treadway Commission (COSO). The Company’s management is responsible for maintaining effective internal control over financial reporting and for its assessment of the effectiveness of internal control over financial reporting, included in the accompanying Management’s Report on Internal Control over Financial Reporting. Our responsibility is to express an opinion on the Company’s internal control over financial reporting based on our audit.
We conducted our audit in accordance with the standards of the Public Company Accounting Oversight Board (United States). Those standards require that we plan and perform the audit to obtain reasonable assurance about whether effective internal control over financial reporting was maintained in all material respects. Our audit included obtaining an understanding of internal control over financial reporting, assessing the risk that a material weakness exists, testing and evaluating the design and operating effectiveness of internal control based on the assessed risk, and performing such other procedures as we considered necessary in the circumstances. We believe that our audit provides a reasonable basis for our opinion.
A company’s internal control over financial reporting is a process designed to provide reasonable assurance regarding the reliability of financial reporting and the preparation of financial statements for external purposes in accordance with generally accepted accounting principles. A company’s internal control over financial reporting includes those policies and procedures that (1) pertain to the maintenance of records that, in reasonable detail, accurately and fairly reflect the transactions and dispositions of the assets of the company; (2) provide reasonable assurance that transactions are recorded as necessary to permit preparation of financial statements in accordance with generally accepted accounting principles, and that receipts and expenditures of the company are being made only in accordance with authorizations of management and directors of the company; and (3) provide reasonable assurance regarding prevention or timely detection of unauthorized acquisition, use, or disposition of the company’s assets that could have a material effect on the financial statements.
Because of its inherent limitations, internal control over financial reporting may not prevent or detect misstatements. Also, projections of any evaluation of effectiveness to future periods are subject to the risk that controls may become inadequate because of changes in conditions, or that the degree of compliance with the policies or procedures may deteriorate.
In our opinion, Nobel Learning Communities, Inc. and subsidiaries maintained, in all material respects, effective internal control over financial reporting as of July 3, 2010, based on criteria established inInternal Control—Integrated Framework issued by COSO.
We also have audited, in accordance with the standards of the Public Company Accounting Oversight Board (United States), the consolidated balance sheets of Nobel Learning Communities, Inc. and subsidiaries as of July 3, 2010 and June 27, 2009 and the related consolidated statements of income, stockholders’ equity and comprehensive income and cash flows for the fiscal years ended July 3, 2010 (53 weeks), June 27, 2009 (52 weeks), and June 28, 2008 (52 weeks), and our report dated September 16, 2010, expressed an unqualified opinion.
/s/ Grant Thornton LLP
Philadelphia, Pennsylvania
September 16, 2010
57
Table of Contents
| ITEM 9B. | OTHER INFORMATION. |
None.
58
Table of Contents
| ITEM 10. | DIRECTORS, EXECUTIVE OFFICERSAND CORPORATE GOVERNANCE. |
The information required by this Item is incorporated herein by reference to the information set forth in the Proxy Statement.
| ITEM 11. | EXECUTIVE COMPENSATION. |
The information required by this Item is incorporated herein by reference to the information set forth in the Proxy Statement.
| ITEM 12. | SECURITY OWNERSHIPOF CERTAIN BENEFICIAL OWNERSAND MANAGEMENTAND RELATED STOCKHOLDER MATTERS. |
The information required by this Item is incorporated herein by reference to the information set forth in the Proxy Statement.
| ITEM 13. | CERTAIN RELATIONSHIPSAND RELATED TRANSACTIONSAND DIRECTOR INDEPENDENCE. |
The information required by this Item is incorporated herein by reference to the information set forth in the Proxy Statement.
| ITEM 14. | PRINCIPAL ACCOUNTANT FEESAND SERVICES. |
The information required by this Item is incorporated herein by reference to the information set forth in the Proxy Statement.
59
Table of Contents
| ITEM 15. | EXHIBITSAND FINANCIAL STATEMENT SCHEDULES. |
| (a) | Documents filed as a part of this Report: |
| Page | ||
(1) Financial Statements. | ||
Report of Independent Registered Public Accounting Firm | F-2 | |
Consolidated Balance Sheets | F-3 | |
Consolidated Statements of Income | F-4 | |
Consolidated Statements of Stockholders’ Equity and Comprehensive Income (Loss) | F-5 | |
Consolidated Statements of Cash Flows | F-6 | |
Notes to Consolidated Financial Statements | F-7 | |
(2) Financial Statement Schedules. | ||
Report of Independent Registered Public Accounting Firm | 57 | |
Schedule II – Valuation and Qualifying Accounts | F-1 | |
All other schedules have been omitted as not applicable or not required under the instructions contained in Regulation S-X or the information is included elsewhere in the financial statements or notes thereto.
| (b) | Exhibits required to be filed by Item 601 of Regulation S-K. |
The exhibits to this Annual Report on Form 10-K are listed on the accompanying index to exhibits and are incorporated herein by reference or are filed or furnished as part of the Annual Report on Form 10-K.
Exhibit Number | Description of Exhibit | |
| 3.1 | The Registrant’s Certificate of Incorporation, as amended and restated. (Filed as Exhibit 3 to the Registrant’s Quarterly Report on Form 10-Q for the quarter ended December 31, 1998 and incorporated herein by reference.) | |
| 3.2 | The Registrant’s Certificate of Designation, Preferences and Rights of Series D Convertible Preferred Stock. (Filed as Exhibit 3.4 to the Registrant’s Current Report on Form 8-K, filed on September 11, 1995 and incorporated herein by reference.) | |
| 3.3 | The Registrant’s Amended and Restated By-laws as modified August 27, 2008. (Filed as Exhibit 3.1 to the Registrant’s Quarterly Report on Form 10-Q for the quarter ended March 28, 2009 and incorporated herein by reference.) | |
| 3.4 | The Registrant’s Certificate of Designation of the Series A Junior Preferred Stock (Filed as Exhibit 3.1 to the Registrant’s Current Report on Form 8-K, filed on July 21, 2008, and incorporated herein by reference.) | |
| 4.1 | Executive Nonqualified Excess Plan of Registrant Plan Document (Filed as Exhibit 4.1 to the Registrant’s Registration Statement on Form S-8, filed on February 7, 2007, and incorporated herein by reference.) | |
| 4.2 | Executive Nonqualified Excess Plan of Registrant Adoption Agreement (Filed as Exhibit 4.2 to the Registrant’s Registration Statement on Form S-8, filed on February 7, 2007, and incorporated herein by reference.) | |
| 4.3 | Rights Agreement, dated as of July 20, 2008, between the Registrant and StockTrans, Inc. (Filed as Exhibit 4.1 to the Registrant’s Current Report on Form 8-K, filed on July 21, 2008 and incorporated herein by reference.) | |
60
Table of Contents
Exhibit Number | Description of Exhibit | |
| 10.1 | 1995 Stock Incentive Plan of the Registrant, as amended. (Filed as Exhibit 10.3 to the Registrant’s Annual Report on Form 10-K for the transitional fiscal year ended June 30, 1998 and incorporated herein by reference.) | |
| 10.2 | Form of Non-Qualified Stock Option Agreement, for stock option grants under 1995 Stock Incentive Plan. (Filed as Exhibit 10.4 to the Registrant’s Annual Report on Form 10-K for the transitional fiscal year ended June 30, 1998 and incorporated herein by reference.) | |
| 10.3 | Form of Incentive Stock Option Agreement, for stock option grants under 1995 Stock Incentive Plan. (Filed as Exhibit 10.4 to the Registrant’s Annual Report on Form 10-K for the transitional fiscal year ended June 30, 1998 and incorporated herein by reference.) | |
| 10.4* | The Registrant’s Senior Executive Severance Pay Plan Statement and Summary Plan Description as modified February 3, 2000 and December 21, 2001. (Filed as Exhibit 10.2 to the Registrant’s Quarterly Report on Form 10-Q for the quarter ended December 31, 2001 and incorporated herein by reference.) | |
| 10.5* | The Registrant’s Executive Severance Pay Plan Statement and Summary Plan Description as modified February 3, 2000 and December 21, 2001. (Filed as Exhibit 10.3 to the Registrant’s Quarterly Report on Form 10-Q for the quarter ended December 31, 2001 and incorporated herein by reference.) | |
| 10.6 | Registration Rights Agreement dated as of June 17, 2003 among the Registrant, Camden Partners Strategic Fund II-A, L.P. and Camden Partners Strategic Fund II-B, L.P. (Filed as Exhibit 10.46 to the Registrant’s Annual Report on Form 10-K for the fiscal year ended June 30, 2003 and incorporated herein by reference.) | |
| 10.7 | First Amendment dated as of September 9, 2003 to Registration Rights Agreement among the Registrant, Camden Partners Strategic Fund II-A, L.P. and Camden Partners Strategic Fund II-B, L.P. (Filed as Exhibit 10.47 to the Registrant’s Annual Report on Form 10-K for the fiscal year ended June 30, 2003 and incorporated herein by reference.) | |
| 10.8 | Registration Rights Agreement dated as of September 9, 2003 among the Registrant, Camden Partners Strategic Fund II-A, L.P., Camden Partners Strategic Fund II-B, L.P., Allied Capital Corporation, Mollusk Holdings, L.L.C. and Blesbok, LLC. (Filed as Exhibit 10.50 to the Registrant’s Annual Report on Form 10-K for the fiscal year ended June 30, 2003 and incorporated herein by reference.) | |
| 10.9* | Omnibus Incentive Equity Compensation Plan of the Registrant(Filed as Exhibit 99.1 to the Registrant’s Registration Statement on Form S-8 (Registration Statement No. 333-124247) filed on April 22, 2005 and incorporated herein by reference.) | |
| 10.9.1* | Amendment No. 1 to Omnibus Incentive Equity Compensation Plan of Registrant, dated November 8, 2007 (Filed herewith.) | |
| 10.10* | Employment Agreement dated as of May 10, 2006 between the Registrant and Lee Bohs. (Filed as Exhibit 10.1 to the Registrant’s Current Report on Form 8-K, filed May 17, 2006 and incorporated herein by reference.) | |
| 10.11 | Form of Incentive Stock Option Certificate, for stock option grants under the Omnibus Incentive Equity Compensation Plan. (Filed as Exhibit 10.1 to the Registrant’s Quarterly Report on Form 10-Q for the quarter ended October 1, 2005, and incorporated herein by reference.) | |
| 10.12 | Form of Non-Qualified Stock Option Agreement (Non-Employee Director), for stock option grants under the Omnibus Incentive Equity Compensation Plan. (Filed as Exhibit 10.2 to the Registrant’s Quarterly Report on Form 10-Q for the quarter ended October 1, 2005, and incorporated herein by reference.) | |
| 10.13 | Form of Non-Qualified Stock Option Agreement (Employee), for stock option grants under the Omnibus Incentive Equity Compensation Plan. (Filed as Exhibit 10.3 to the Registrant’s Quarterly Report on Form 10-Q for the quarter ended October 1, 2005, and incorporated herein by reference.) | |
61
Table of Contents
Exhibit Number | Description of Exhibit | |
| 10.14 | Form of Stock Award certificate, for stock option grants under the Omnibus Incentive Equity Compensation Plan. (Filed as Exhibit 10.4 to the Registrant’s Quarterly Report on Form 10-Q for the quarter ended October 1, 2005, and incorporated herein by reference.) | |
| 10.15* | Amendment and Restated Employment Agreement between the Registrant and George Bernstein, dated as of April 6, 2007 (Filed as Exhibit 10.2 to the Registrant’s Current Report on Form 8-K, filed on April 18, 2007 and incorporated herein by reference.) | |
| 10.16* | Amendment to the Amended and Restated Employment Agreement between the Registrant and George Bernstein, dated as of May 8, 2008 (Filed as Exhibit 10.1 to the Registrant’s Current Report on Form 8-K, filed on May 14, 2008 and incorporated herein by reference.) | |
| 10.17* | Second Amended and Restated Employment Agreement between the Registrant and George Bernstein, dated as of October 22, 2008 (Filed as Exhibit 10.1 to the Registrant’s Current Report on Form 8-K, filed on October 23, 2008 and incorporated herein by reference.) | |
| 10.18* | Severance Agreement dated as of April 6, 2007 between the Registrant and George Bernstein. (Filed as Exhibit 10.2 to the Registrant’s Current Report on Form 8-K, filed on April 18, 2007, and incorporated herein by reference.) | |
| 10.19* | Severance Agreement dated as of April 6, 2007 between the Registrant and Thomas Frank. (Filed as Exhibit 10.3 to the Registrant’s Current Report on Form 8-K, filed on April 18, 2007, and incorporated herein by reference.) | |
| 10.20* | Severance Agreement dated as of April 6, 2007 between the Registrant and Patricia B. Miller. (Filed as Exhibit 10.4 to the Registrant’s Current Report on Form 8-K, filed on April 18, 2007, and incorporated herein by reference.) | |
| 10.21* | Severance Agreement dated as of April 6, 2007 between the Registrant and Jeanne Marie Welsko. (Filed as Exhibit 10.5 to the Registrant’s Current Report on Form 8-K, filed on April 18, 2007, and incorporated herein by reference.) | |
| 10.22* | Severance Agreement dated as of April 6, 2007 between the Registrant and Osborne F. Abbey. (Filed as Exhibit 10.6 to the Registrant’s Current Report on Form 8-K, filed on April 18, 2007, and incorporated herein by reference.) | |
| 10.23* | Severance Agreement dated as of April 6, 2007 between the Registrant and G. Lee Bohs. (Filed as Exhibit 10.7 to the Registrant’s Current Report on Form 8-K, filed on April 18, 2007, and incorporated herein by reference.) | |
| 10.24 | Amended and Restated Credit Agreement with Harris N.A., as agent for the lenders, dated as of June 6, 2008 (Filed as Exhibit 10.1 to the Registrant’s Current Report on Form 8-K filed on June 11, 2008, and incorporated herein by reference.) | |
| 10.25 | Amended and Restated Security Agreement, dated as of June 6, 2005 (Filed as Exhibit 10.2 to the Registrant’s Current Report on Form 8-K, filed on June 11, 2008 and incorporated herein by reference.) | |
| 10.26 | Employment Agreement dated August 19, 2008 between the Registrant and Dr. Susan W. Race. (Filed as Exhibit 10.1 to the Registrant’s Current Report on Form 8-K, filed September 17, 2008, and incorporated herein by reference). | |
| 10.27* | Severance Agreement dated September 15, 2008 between the Registrant and Dr. Susan W. Race. (Filed as Exhibit 10.1 to the Registrant’s Current Report on Form 8-K, filed September 24, 2008, and incorporated herein by reference). | |
| 10.28* | First Amendment to Severance Agreement dated as of September 19, 2008 between the Registrant and Thomas Frank. (Filed as Exhibit 10.2 to the Registrant’s Current Report on Form 8-K, filed October 23, 2008, and incorporated herein by reference). | |
62
Table of Contents
Exhibit Number | Description of Exhibit | |
| 10.29* | First Amendment to Severance Agreement dated as of September 19, 2008 between the Registrant and Patricia B. Miller. (Filed as Exhibit 10.3 to the Registrant’s Current Report on Form 8-K, filed October 23, 2008, and incorporated herein by reference). | |
| 10.30* | First Amendment to Severance Agreement dated as of September 19, 2008 between the Registrant and Jeanne Marie Welsko. (Filed as Exhibit 10.4 to the Registrant’s Current Report on Form 8-K, filed October 23, 2008, and incorporated herein by reference). | |
| 10.31* | First Amendment to Severance Agreement dated as of September 19, 2008 between the Registrant and G. Lee Bohs. (Filed as Exhibit 10.5 to the Registrant’s Current Report on Form 8-K, filed October 23, 2008, and incorporated herein by reference). | |
| 10.32* | First Amendment to Second Amended and Restated Employment Agreement dated as of May 1, 2009 between the Registrant and Patricia B. Miller. (Filed as Exhibit 10.1 to the Registrant’s Quarterly Report on Form 10-W, filed May 1, 2009, and incorporated herein by reference). | |
| 10.33 | First Amendment to Amended and Restated Credit Agreement with Bank of Montreal as agent for the lenders, dated as of January 15, 2010. (Filed as Exhibit 10.1 to the Registrant’s Current Report on Form 8-K, filed January 15, 2010, and incorporated herein by reference). | |
| 10.34* | Third Amended and Restated Employment Agreement, dated May 17, 2010, by and among Nobel Learning Communities, Inc. and George Bernstein. (Filed as Exhibit 10.1 to the Registrant’s Current Report on Form 8-K, filed May 18, 2010, and incorporated herein by reference). | |
| 10.35* | Retention Agreement, dated May 18, 2010, by and among Nobel Learning Communities, Inc. and Thomas Frank. (Filed as Exhibit 10.2 to the Registrant’s Current Report on Form 8-K, filed May 17, 2010, and incorporated herein by reference). | |
| 10.36* | Retention Agreement, dated May 18, 2010, by and among Nobel Learning Communities, Inc. and Patricia B. Miller. (Filed as Exhibit 10.3 to the Registrant’s Current Report on Form 8-K, filed May 17, 2010, and incorporated herein by reference). | |
| 10.37* | Retention Agreement, dated May 18, 2010, by and among Nobel Learning Communities, Inc. and Jeanne Marie Welsko. (Filed as Exhibit 10.4 to the Registrant’s Current Report on Form 8-K, filed May 17, 2010, and incorporated herein by reference). | |
| 10.38* | Retention Agreement, dated May 18, 2010, by and among Nobel Learning Communities, Inc. and G. Lee Bohs. (Filed as Exhibit 10.5 to the Registrant’s Current Report on Form 8-K, filed May 17, 2010, and incorporated herein by reference). | |
| 10.39* | Retention Agreement, dated May 18, 2010, by and among Nobel Learning Communities, Inc. and Dr. Susan Race. (Filed as Exhibit 10.6 to the Registrant’s Current Report on Form 8-K, filed May 18, 2010, and incorporated herein by reference). | |
| 14.1 | Code of Business Conduct and Ethics of the Registrant, as adopted June 3, 2004. (Filed as Exhibit 99.1 to the Registrant’s Current Report on Form 8-K, filed on October 5, 2004, and incorporated herein by reference.) | |
| 16.1 | Letter from BDO Seidman, LLP to the SEC, dated June 6, 2007 regarding change in certifying accountant. (Filed as Exhibit 16.1 to the Registrant’s Current Report on Form 8-K, filed on June 8, 2007, and incorporated herein by reference.) | |
| 21.1 | List of subsidiaries of the Registrant. (Filed herewith.) | |
| 23.1 | Consent of Grant Thornton, LLP (Filed herewith.) | |
| 31.1 | Certifications of the Chief Executive Officer of the Registrant required by Rule 13a-14(a) under the Securities Exchange Act of 1934, as amended. (Filed herewith.) | |
| 31.2 | Certifications of the Chief Financial Officer of the Registrant required by Rule 13a-14(a) under the Securities Exchange Act of 1934, as amended. (Filed herewith.) | |
63
Table of Contents
Exhibit Number | Description of Exhibit | |
| 32.1 | Certifications of the Chief Executive Officer of the Registrant required by Rule 13a-14(b) under the Securities Exchange Act of 1934, as amended. (This exhibit shall not be deemed “filed” for purposes of Section 18 of the Securities Exchange Act of 1934, as amended, or otherwise subject to the liability of that section. Further, this exhibit shall not be deemed to be incorporated by reference into any filing under the Securities Act of 1933, as amended or the Securities Exchange Act of 1934, as amended.) (Filed herewith.) | |
| 32.2 | Certifications of the Chief Financial Officer of the Registrant required by Rule 13a-14(b) under the Securities Exchange Act of 1934, as amended. (This exhibit shall not be deemed “filed” for purposes of Section 18 of the Securities Exchange Act of 1934, as amended, or otherwise subject to the liability of that section. Further, this exhibit shall not be deemed to be incorporated by reference into any filing under the Securities Act of 1933, as amended or the Securities Exchange Act of 1934, as amended.) (Filed herewith.) | |
| * | Each management contract or compensation plan required to be filed as an exhibit is identified by an asterisk (*) |
| (c) | Financial Statement Schedules. |
Exhibits Required by Item 601 of Regulation S-K: The exhibits to this report are listed under Item 15(a)(2) above.
64
Table of Contents
SIGNATURES
Pursuant to the requirements of Section 13 or 15(d) of the Securities Exchange Act of 1934, the Registrant has duly caused this report to be signed on its behalf by the undersigned, thereunto duly authorized.
| Date: September 16, 2010 | NOBEL LEARNING COMMUNITIES, INC | |||||||
| By: | /S/ GEORGE H. BERNSTEIN | |||||||
George H. Bernstein Chief Executive Officer | ||||||||
Pursuant to the requirements of the Securities Exchange Act of 1934, this report has been signed below by the following persons on behalf of the Registrant and in the capacities and on the date indicated.
Signature | Position | Date | ||
/S/ GEORGE H. BERNSTEIN George H. Bernstein | Chief Executive Officer and Director (Principal Executive Officer) | September 16, 2010 | ||
/S/ THOMAS FRANK Thomas Frank | Chief Financial Officer (Principal Financial and Accounting Officer) | September 16, 2010 | ||
/S/ THERESE KREIG CRANE Therese Kreig Crane | Director | September 16, 2010 | ||
/S/ DAVID BEALE David Beale | Director | September 16, 2010 | ||
/S/ STEVEN B. FINK Steven B. Fink | Director | September 16, 2010 | ||
/S/ PETER H. HAVENS Peter H. Havens | Director | September 16, 2010 | ||
/S/ RICHARD J. PINOLA Richard J. Pinola | Director | September 16, 2010 | ||
/S/ MICHAEL J. ROSENTHAL Michael J. Rosenthal | Director | September 16, 2010 | ||
/S/ RALPH SMITH Ralph Smith | Director | September 16, 2010 | ||
/S/ DAVID L. WARNOCK David L. Warnock | Director | September 16, 2010 | ||
65
Table of Contents
SCHEDULE II
Nobel Learning Communities, Inc.
Valuation and Qualifying Accounts.
(dollars in thousands)
| Balance at beginning of period | Charge to expense | Write-offs | Balance at end of period | ||||||||
Year ended July 3, 2010 | |||||||||||
Allowance for doubtful accounts | $ | 301 | 631 | (468 | ) | $ | 464 | ||||
Year ended June 27, 2009 | |||||||||||
Allowance for doubtful accounts | $ | 227 | 482 | (408 | ) | $ | 301 | ||||
Year ended June 28, 2008 | |||||||||||
Allowance for doubtful accounts | $ | 187 | 312 | (272 | ) | $ | 227 | ||||
F-1
Table of Contents
REPORT OF INDEPENDENT REGISTERED PUBLIC ACCOUNTING FIRM
Board of Directors and Shareholders
Nobel Learning Communities, Inc.
We have audited the accompanying consolidated balance sheets of Nobel Learning Communities, Inc. (a Delaware corporation) and subsidiaries (the “Company”) as of July 3, 2010 and June 27, 2009, and the related consolidated statements of income, stockholders’ equity and comprehensive income, and cash flows for the fiscal years ended July 3, 2010 (53 weeks), June 27, 2009 (52 weeks) and June 28, 2008 (52 weeks). Our audits of the basic financial statements included the financial statement schedule listed in the index appearing under item 15(a)(2). These consolidated financial statements and financial statement schedule are the responsibility of the Company’s management. Our responsibility is to express an opinion on these consolidated financial statements and financial statement schedule based on our audits.
We conducted our audits in accordance with the standards of the Public Company Accounting Oversight Board (United States). Those standards require that we plan and perform the audit to obtain reasonable assurance about whether the financial statements are free of material misstatement. An audit includes examining, on a test basis, evidence supporting the amounts and disclosures in the financial statements. An audit also includes assessing the accounting principles used and significant estimates made by management, as well as evaluating the overall financial statement presentation. We believe that our audits provide a reasonable basis for our opinion.
In our opinion, the consolidated financial statements referred to above present fairly, in all material respects, the consolidated financial position of Nobel Learning Communities, Inc. and subsidiaries as of July 3, 2010 and June 27, 2009, and the consolidated results of its operations and its cash flows for the fiscal years ended July 3, 2010 (53 weeks), June 27, 2009 (52 weeks) and June 28, 2008 (52 weeks), in conformity with accounting principles generally accepted in the United States of America. Also, in our opinion, the related financial statement schedule, when considered in relation to the basic consolidated financial statements taken as a whole, presents fairly, in all material respects, the information set forth therein.
We also have audited, in accordance with the standards of the Public Company Accounting Oversight Board (United States), Nobel Learning Communities, Inc. and subsidiaries’ internal control over financial reporting as of July 3, 2010, based on criteria established inInternal Control—Integrated Framework issued by the Committee of Sponsoring Organizations of the Treadway Commission (COSO) and our report dated September 16, 2010, expressed an unqualified opinion.
/s/ Grant Thornton LLP
Philadelphia, PA
September 16, 2010
F-2
Table of Contents
Nobel Learning Communities, Inc. and Subsidiaries
Consolidated Balance Sheets
(Dollars in thousands, except share amounts)
| July 3, 2010 | June 27, 2009 | |||||||
ASSETS | ||||||||
Cash and cash equivalents | $ | 1,606 | $ | 786 | ||||
Customer accounts receivable, less allowance for doubtful accounts of $464 at July 3, 2010 and $301 at June 27, 2009 | 957 | 802 | ||||||
Note receivable, current portion | 250 | 500 | ||||||
Deferred tax asset | 749 | 443 | ||||||
Prepaid rent | 3,425 | 3,336 | ||||||
Prepaid expenses and other current assets | 2,746 | 2,912 | ||||||
Total Current Assets | 9,733 | 8,779 | ||||||
Property and equipment, at cost | 86,907 | 79,935 | ||||||
Accumulated depreciation and amortization | (57,863 | ) | (51,185 | ) | ||||
Property and equipment, net | 29,044 | 28,750 | ||||||
Goodwill | 83,275 | 71,489 | ||||||
Intangible assets, net | 8,062 | 6,725 | ||||||
Note receivable | 473 | 693 | ||||||
Deposits and other assets | 3,809 | 3,139 | ||||||
Total Assets | $ | 134,396 | $ | 119,575 | ||||
LIABILITIES AND STOCKHOLDERS’ EQUITY | ||||||||
Accounts payable and other current liabilities | $ | 19,534 | $ | 19,386 | ||||
Income taxes payable | 752 | 438 | ||||||
Current portion of lease obligations | 226 | 274 | ||||||
Deferred revenue | 15,756 | 14,526 | ||||||
Total Current Liabilities | 36,268 | 34,624 | ||||||
Long-term obligations | 21,500 | 13,525 | ||||||
Long-term portion of lease obligations | 533 | 686 | ||||||
Deferred tax liability | 2,060 | 142 | ||||||
Other long term liabilities | 2,055 | 1,712 | ||||||
Total Liabilities | 62,416 | 50,689 | ||||||
Commitments and Contingencies | ||||||||
Stockholders’ Equity: | ||||||||
Preferred stock, $0.001 par value per share; 10,000,000 shares authorized; 1,063,830 shares issued and outstanding | 1 | 1 | ||||||
Common stock, $0.001 par value; 20,000,000 shares authorized; 10,550,701 and 10,497,409 shares issued and outstanding at July 3, 2010 and June 27, 2009, respectively | 10 | 10 | ||||||
Additional paid-in capital | 60,427 | 59,297 | ||||||
Retained earnings | 11,601 | 9,729 | ||||||
Accumulated other comprehensive loss | (59 | ) | (151 | ) | ||||
Total Stockholders’ Equity | 71,980 | 68,886 | ||||||
Total Liabilities and Stockholders’ Equity | $ | 134,396 | $ | 119,575 | ||||
The accompanying notes are an integral part of these consolidated financial statements.
F-3
Table of Contents
Nobel Learning Communities, Inc. and Subsidiaries
Consolidated Statements of Income
(Dollars in thousands, except per share data)
| For the Fiscal Year Ended | ||||||||||||
| July 3, 2010 (53 weeks) | June 27, 2009 (52 weeks) | June 28, 2008 (52 weeks) | ||||||||||
Revenues, net | $ | 232,035 | $ | 220,103 | $ | 204,201 | ||||||
Cost of services: | ||||||||||||
Personnel costs | 111,716 | 105,562 | 97,762 | |||||||||
School operating costs | 32,223 | 29,405 | 26,769 | |||||||||
Rent and other | 59,200 | 56,152 | 49,019 | |||||||||
Total Cost of Services | 203,139 | 191,119 | 173,550 | |||||||||
Gross profit | 28,896 | 28,984 | 30,651 | |||||||||
General and administrative expenses | 22,938 | 18,726 | 18,516 | |||||||||
Operating income | 5,958 | 10,258 | 12,135 | |||||||||
Interest expense | 1,571 | 981 | 475 | |||||||||
Other income, net | (30 | ) | (78 | ) | (326 | ) | ||||||
Income from continuing operations before income taxes | 4,417 | 9,355 | 11,986 | |||||||||
Income tax expense | 1,711 | 3,622 | 4,621 | |||||||||
Income from continuing operations | 2,706 | 5,733 | 7,365 | |||||||||
(Loss) income from discontinued operations, net of income tax benefit (expense) of $516, $764 and ($186) respectively | (834 | ) | (1,169 | ) | 313 | |||||||
Net income | $ | 1,872 | $ | 4,564 | $ | 7,678 | ||||||
Basic income per share: | ||||||||||||
Income from continuing operations | $ | 0.26 | $ | 0.55 | $ | 0.71 | ||||||
(Loss) income from discontinued operations | (0.08 | ) | (0.11 | ) | 0.03 | |||||||
Net income per common share | $ | 0.18 | $ | 0.44 | $ | 0.74 | ||||||
Diluted income per share: | ||||||||||||
Income from continuing operations | $ | 0.25 | $ | 0.54 | $ | 0.69 | ||||||
(Loss) income from discontinued operations | (0.08 | ) | (0.11 | ) | 0.03 | |||||||
Net income per common share * | $ | 0.18 | $ | 0.43 | $ | 0.72 | ||||||
Weighted average common shares outstanding (in thousands): | ||||||||||||
Basic | 10,532 | 10,456 | 10,382 | |||||||||
Diluted | 10,619 | 10,701 | 10,630 | |||||||||
| * | Net income per share totals may not sum due to rounding. |
The accompanying notes are an integral part of these consolidated financial statements.
F-4
Table of Contents
Nobel Learning Communities, Inc. and Subsidiaries
Consolidated Statements of Stockholders’ Equity and Comprehensive Income
For the Fiscal Years Ended July 3, 2010, June 27, 2009 and June 28, 2008
(Dollars in thousands except share data)
| Preferred Stock | Common Stock | Additional Paid-In Capital | Retained Earnings/ (Accumulated Deficit) | Accumulated Other Comprehensive Income (loss) | Total | ||||||||||||||||||||
| Shares | Amount | Shares | Amount | ||||||||||||||||||||||
June 30, 2007 | 1,063,830 | $ | 1 | 10,365,610 | $ | 10 | $ | 56,676 | $ | (2,469 | ) | — | $ | 54,218 | |||||||||||
Comprehensive income: | |||||||||||||||||||||||||
Net income | — | — | — | — | — | 7,678 | — | 7,678 | |||||||||||||||||
Change in fair value of swap contract, net of tax | — | — | — | — | — | — | 9 | 9 | |||||||||||||||||
Total comprehensive income | 7,687 | ||||||||||||||||||||||||
Cumulative impact from adoption of FASB Interpretation No. 48 | — | — | — | — | — | (44 | ) | — | (44 | ) | |||||||||||||||
Stock based compensation | — | — | — | — | 717 | — | — | 717 | |||||||||||||||||
Stock options exercised and related tax benefits | — | — | 28,567 | — | 336 | — | — | 336 | |||||||||||||||||
June 28, 2008 | 1,063,830 | $ | 1 | 10,394,177 | $ | 10 | $ | 57,729 | $ | 5,165 | $ | 9 | $ | 62,914 | |||||||||||
Comprehensive income: | |||||||||||||||||||||||||
Net income | — | — | — | — | — | 4,564 | — | 4,564 | |||||||||||||||||
Change in fair value of swap contract, net of tax | — | — | — | — | — | — | (160 | ) | (160 | ) | |||||||||||||||
Total comprehensive income | 4,404 | ||||||||||||||||||||||||
Stock based compensation | — | — | — | — | 1,012 | — | — | 1,012 | |||||||||||||||||
Stock options and restricted award stares issued and related tax benefits | — | — | 103,232 | — | 556 | — | — | 556 | |||||||||||||||||
June 27, 2009 | 1,063,830 | $ | 1 | 10,497,409 | $ | 10 | $ | 59,297 | $ | 9,729 | $ | (151 | ) | $ | 68,886 | ||||||||||
Comprehensive income: | |||||||||||||||||||||||||
Net income | — | — | — | — | — | 1,872 | — | 1,872 | |||||||||||||||||
Change in fair value of swap contract, net of tax | — | — | — | — | — | — | 92 | 92 | |||||||||||||||||
Total comprehensive income | 1,964 | ||||||||||||||||||||||||
Stock based compensation | — | — | — | — | 1,107 | — | — | 1,107 | |||||||||||||||||
Stock options and restricted award shares issued and related tax benefits | — | — | 53,292 | — | 23 | — | — | 23 | |||||||||||||||||
July 3, 2010 | 1,063,830 | $ | 1 | 10,550,701 | $ | 10 | $ | 60,427 | $ | 11,601 | $ | (59 | ) | $ | 71,980 | ||||||||||
| �� | |||||||||||||||||||||||||
The accompanying notes are an integral part of these consolidated financial statements.
F-5
Table of Contents
Nobel Learning Communities, Inc. and Subsidiaries
Consolidated Statements of Cash Flows
(Dollars in thousands)
| For the Fiscal Year Ended | ||||||||||||
| July 3, 2010 (53 weeks) | June 27, 2009 (52 weeks) | June 28, 2008 (52 weeks) | ||||||||||
Cash Flows from Operating Activities: | ||||||||||||
Net income | $ | 1,872 | $ | 4,564 | $ | 7,678 | ||||||
Adjustments to reconcile net income to net cash provided by operating activities: | ||||||||||||
Depreciation and amortization | 9,994 | 10,087 | 7,320 | |||||||||
Reserve for lease costs for closed schools | 454 | 382 | (245 | ) | ||||||||
Provision for losses on accounts receivable | 631 | 482 | 312 | |||||||||
Stock based compensation | 1,107 | 1,012 | 717 | |||||||||
Provision (benefit) for deferred taxes | 336 | (254 | ) | 306 | ||||||||
Gain from sublease settlement | — | — | (1,028 | ) | ||||||||
Other | (151 | ) | (55 | ) | — | |||||||
Changes in assets and liabilities, net of acquired amounts | ||||||||||||
Customer accounts receivable | (718 | ) | (331 | ) | (243 | ) | ||||||
Prepaid expenses and other current assets | 333 | 498 | (557 | ) | ||||||||
Other assets and liabilities | 183 | (464 | ) | (1,603 | ) | |||||||
Deferred revenue | (2,476 | ) | (1,723 | ) | 1,163 | |||||||
Accounts payable and current liabilities | (1,430 | ) | (1,411 | ) | 513 | |||||||
Net Cash Provided by Operating Activities | 10,135 | 12,787 | 14,333 | |||||||||
Cash Flows Used in Investing Activities: | ||||||||||||
Purchase of fixed assets, net of acquired amounts | (5,525 | ) | (7,450 | ) | (8,122 | ) | ||||||
Proceeds from repayment of notes receivable | 500 | — | — | |||||||||
Acquisitions, net of cash acquired | (11,983 | ) | (7,196 | ) | (21,061 | ) | ||||||
Investment in product rights and trade names | — | — | (170 | ) | ||||||||
Net Cash Used in Investing Activities | (17,008 | ) | (14,646 | ) | (29,353 | ) | ||||||
Cash Flows from Financing Activities: | ||||||||||||
Borrowings of long term debt | 74,175 | 78,400 | 76,200 | |||||||||
Repayment of long term debt | (66,200 | ) | (77,375 | ) | (63,700 | ) | ||||||
Proceeds from exercise of stock options and warrants | 56 | 363 | 213 | |||||||||
Tax benefits from exercise of stock options | — | 193 | 123 | |||||||||
Payment of debt issuance costs | (338 | ) | — | (566 | ) | |||||||
Net Cash Provided by Financing Activities | 7,693 | 1,581 | 12,270 | |||||||||
Net increase (decrease) in cash and cash equivalents | 820 | (278 | ) | (2,750 | ) | |||||||
Cash and cash equivalents at beginning of year | 786 | 1,064 | 3,814 | |||||||||
Cash and cash equivalents at end of year | $ | 1,606 | $ | 786 | $ | 1,064 | ||||||
Supplemental disclosure of cash flow information: | ||||||||||||
Interest paid | $ | 1,273 | $ | 786 | $ | 317 | ||||||
Income taxes paid | 625 | 3,691 | 5,577 | |||||||||
The accompanying notes are an integral part of these consolidated financial statements.
F-6
Table of Contents
Nobel Learning Communities, Inc. and Subsidiaries
Notes to Consolidated Financial Statements
1. Summary of Significant Accounting Policies and Company Background:
Nobel Learning Communities, Inc. (collectively with its subsidiaries, the “Company” or “Nobel Learning Communities”) is a national network of nonsectarian private schools, including preschools, elementary schools, middle schools and specialty high schools in 15 states and the District of Columbia. The Company also owns and operates the Laurel Springs School, a global K-12 online distance learning school. Nobel Learning Communities provides high-quality private education, with small schools and class sizes and attention to individual learning styles. Nobel Learning Communities also offers an array of supplemental educational services, including before and after-school programs, the Camp Zone® summer program, learning support programs and technology camps. These schools operate under various brand names and are located in the District of Columbia, Arizona, California, Florida, Illinois, Maryland, Nevada, New Jersey, North Carolina, Ohio, Oregon, Pennsylvania, South Carolina, Texas, Virginia, and Washington.
Use of Estimates:
The preparation of financial statements in conformity with accounting principles generally accepted in the United States of America requires management to make estimates and assumptions that affect the reported amounts of assets and liabilities and disclosure of contingent assets and liabilities as of the date of the financial statements and the reported amounts of revenues and expenses during the reporting period. Actual results could differ from those estimates under different conditions or if assumptions change. The most significant estimates underlying the accompanying consolidated financial statements include long-lived assets and goodwill valuations and any potential impairment, the allowance for doubtful accounts, the valuation of stock compensation expense and estimates of future obligations related to closed facilities, valuations of liabilities for workers’ compensation claim liabilities retained by the Company and realization of our deferred tax assets.
Principles of Consolidation and Basis of Presentation:
Fiscal Period. The fiscal year ended July 3, 2010 (“Fiscal 2010”) includes 53 weeks. The fiscal years ended June 27, 2009 (“Fiscal 2009”) and June 28, 2008 (“Fiscal 2008”) each includes 52 weeks.
Consolidation. All significant intercompany balances and transactions have been eliminated.
Reclassifications. As a result of certain school closures during Fiscal 2009, the Company has conformed amounts reported for Fiscal 2008 in its Annual Report on Form 10-K to the period ended June 27, 2009.
Recognition of Revenues:
Net revenue is recognized when the following criteria are met: an arrangement exists, through a registration, an enrollment agreement or contract, pursuant to which educational services are rendered over time, and a specific tuition rate and/or fee will probably be collected. Net revenues include tuition, fees and other revenues, reduced by discounts. Fees are received for registration, other educational services and management fees. Ancillary income is primarily comprised of supplemental fees from certain after school programs, summer programs, camps and field trips. Tuition revenues, net of discounts and other revenues, are recognized as service is performed. Net revenues include tuition, fees and other revenues, reduced by discounts. Fees are received for registration, other educational services and management fees. Ancillary income is primarily comprised of supplemental fees from certain after school programs, summer programs, camps and field trips. Tuition revenues, net of discounts and other revenues, are recognized as services are performed.
Net revenues with respect to Laurel Springs, in some cases include the delivery of learning materials, which are included with tuition revenue and accounted for as a single unit of accounting. Tuition payments received in
F-7
Table of Contents
Nobel Learning Communities, Inc. and Subsidiaries
Notes to Consolidated Financial Statements—(Continued)
advance of the time period for which service is to be performed are recorded as deferred revenue. Registration fees are recognized over the applicable school period. Certain fees may be received in advance of services being rendered, in which case the fee revenue is deferred and recognized over the appropriate period of service.
Cash and Cash Equivalents:
The Company considers cash on hand, cash in bank accounts and cash investments with maturities of three months or less when purchased as cash and cash equivalents. The Company maintains funds in accounts in excess of FDIC insurance limits; however, the Company minimizes this risk by maintaining deposits in high quality financial institutions. Amounts receivable from credit card companies are also considered cash equivalents because they are both short-term and highly liquid in nature and are typically converted to cash within three days of the sales transaction.
Accounts Receivable and Credit Risk:
The Company provides education services to the children attending its schools. In certain circumstances, the Company grants small amounts of credit to its customers for a limited period of time. Exposure to losses on receivables is principally dependent on each person’s financial condition. The Company monitors its exposure for credit losses and maintains allowances for anticipated losses. The Company’s sources of revenues are geographically diverse and, consequently, the Company is not dependent on economic conditions in any one geographic area or market.
The Company’s accounts receivable are comprised primarily of tuition due from parents and governmental agencies. Accounts receivable are presented at estimated net realizable value. The Company uses estimates in determining the collectability of its accounts receivable and must rely on its evaluation of historical trends, governmental funding processes, specific customer issues and current economic trends to determine appropriate reserves. Material differences between management estimates and actual realized accounts receivable may result in adjustments to the amount and timing of bad debt expense. Customer accounts are considered due when services are rendered and are considered for write-off when open for sixty days subsequent to the service date. Accounts due from governmental agencies are due within the terms as outlined within each agency agreement.
Property and Equipment:
Property and equipment are stated at cost less accumulated depreciation and amortization. Depreciation and amortization are computed on a straight-line basis over the estimated useful lives of the related assets as follows:
Buildings | 40 years | |
Leasehold improvements | The shorter of the leasehold period or the estimated useful life | |
Furniture and equipment | 3 to 10 years | |
Computer software and equipment | 3 to 10 years |
Maintenance, repairs and minor refurbishments are expensed as incurred. Upon retirement, lease terminations or other disposition of buildings, the cost of property and equipment associated with the facility and the related accumulated depreciation are derecognized and any gain or loss is included in operations.
F-8
Table of Contents
Nobel Learning Communities, Inc. and Subsidiaries
Notes to Consolidated Financial Statements—(Continued)
Long-Lived and Intangible Assets:
Long-lived assets and certain identifiable intangibles to be held and used are reviewed for impairment whenever events or changes in circumstances indicate that the carrying value of such assets may not be recoverable. An asset’s value is impaired if management’s estimate of the aggregate future cash flows, undiscounted and without interest charges, to be generated by the asset are less than the carrying value of the asset. Such cash flows consider factors such as expected future operating income and historical trends, as well as the effects of demand and competition. To the extent impairment has occurred, the loss will be measured as the excess of the carrying amount of the asset over the fair value of the asset. Such estimates require the use of judgment and numerous subjective assumptions, which, if actual experience varies, could result in material differences in the requirements for impairment charges.
No impairment charges were recorded during Fiscal 2010, Fiscal 2009 or Fiscal 2008.
Discontinued Operations:
The results of operations for schools that are no longer operating under the Company’s management and were not part of the operations of a cluster of schools that continue to operate have been reflected in the consolidated financial statements and notes as discontinued operations for the periods presented.
Goodwill:
Goodwill is tested annually for impairment as of the end of the respective fiscal year as well as whenever events or changes in circumstances indicate that the carrying value may not be recoverable. Circumstances that could trigger an interim impairment test include but are not limited to: a significant adverse change in the business climate or legal factors; an adverse action or assessment by a regulator; unanticipated competition; loss of key personnel; the likelihood that a reporting unit or significant portion of a reporting unit will be sold or otherwise disposed; or results of testing for recoverability of a significant asset group within a reporting unit.
Goodwill impairment testing consists of a two-step process. Step 1 of the impairment test involves comparing the fair values of the applicable reporting units with their carrying values, including goodwill. If the carrying amount of a reporting unit exceeds the reporting unit’s fair value, we perform Step 2 of the goodwill impairment test to determine the amount of impairment loss. Step 2 of the goodwill impairment test involves comparing the implied fair value of the affected reporting unit’s goodwill against the carrying value of that goodwill. In performing the first step of the impairment test, we reconcile the aggregate estimated fair value of our reporting units to our enterprise value (which includes a control premium).
F-9
Table of Contents
Nobel Learning Communities, Inc. and Subsidiaries
Notes to Consolidated Financial Statements—(Continued)
The testing of goodwill for impairment is performed at a level referred to as a reporting unit. The Company currently has six reporting units based primarily on our geographical regions and gross margin history. Goodwill is allocated to each reporting unit based on actual goodwill valued in connection with each business combination consummated within each reporting unit. To estimate the fair value of our reporting units, we use the income approach. The income approach is based on a discounted cash flow analysis (“DCF”) and calculates the fair value by estimating the after-tax cash flows attributable to a reporting unit and then discounting the after-tax cash flows to a present value using a risk-adjusted discount rate. Assumptions used in the DCF require the exercise of significant judgment, including judgment about appropriate discount rates and terminal values, growth rates, and the amount and timing of expected future cash flows. The forecasted cash flows are based on current plans and for years beyond that plan, the estimates are based on assumed growth rates. We believe the assumptions are consistent with the plans and estimates used to manage the underlying businesses. The discount rates, which are intended to reflect the risks inherent in future cash flow projections, used in the DCF are based on estimates of the weighted-average cost of capital (“WACC”) of a market participant. Such estimates are derived from our analysis of peer companies and considered the industry weighted average return on debt and equity from a market participant perspective. Specific assumptions used were as follows:
| July 3, 2010 | June 27, 2009 | |||||
Weighted average cost of capital | 14.5 | % | 14.0 | % | ||
Compounded annual revenue growth rate for five years | 4.9 | % | 3.9 | % | ||
Terminal year stable growth rate | 3.0 | % | 3.0 | % |
The Company believes the assumptions used to determine the fair value of our respective reporting units are reasonable. If different assumptions were used, particularly with respect to forecasted cash flows or WACCs, different estimates of fair value may result and there could be the potential that an impairment charge could result. Actual operating results and the related cash flows of the reporting units could differ from the estimated operating results and related cash flows.
As of July 3, 2010, the following six reporting units with goodwill totaling $83,275,000 had fair values exceeding their carrying values as follows:
| Goodwill ($000’s) | |||
| 5% - 20% estimated fair value in excess of carrying value: | |||
Reporting Unit 1 | $ | 35,324 | |
Reporting Unit 2 | 4,328 | ||
Reporting Unit 3 | 1,948 | ||
21% - 50% estimated fair value in excess of carrying value: | |||
Reporting Unit 4 | 14,578 | ||
> 50% estimated fair value in excess of carrying value: | |||
Reporting Unit 5 | 13,257 | ||
Reporting Unit 6 | 4,752 | ||
Goodwill from FY 2010 acquisitions | 9,088 | ||
Total goodwill at July 3, 2010 | $ | 83,275 | |
With the exception of potential regional economic differences, the fair value of all of the Company’s reporting units are primarily affected by the forecasted demand and spending on its educational services. The number of student enrollments and tuition rates charged are two factors, amongst several, that may impact the Company’s revenue and gross profits. Recent unemployment rate increases and decreases have and, we believe, will continue to have potentially negative or positive impacts on enrollment. If unemployment rates improve
F-10
Table of Contents
Nobel Learning Communities, Inc. and Subsidiaries
Notes to Consolidated Financial Statements—(Continued)
within the key age groups that represent the majority of our families, the Company believes this will result in increases in revenue and gross profit. Additionally, the Company has historically implemented tuition increases when appropriate and intends to continue this practice while considering trends in the costs to provide services and competitive factors. Some of the inherent assumptions and estimates used in determining the estimated fair value of these reporting units are outside the control of management, including interest rates, cost of capital, unemployment rates and tax rates. It is possible that changes in circumstances, existing at the measurement date or at other times in the future, or in the numerous estimates associated with management’s judgments, assumptions and estimates made in assessing the fair value of our goodwill, may result in an impairment charge of a portion or all of the goodwill amounts previously noted. If we record an impairment charge, our financial position and results of operations could be adversely affected.
Advertising Costs:
General advertising costs, which include search engine fees, internet hosting fees, yellow pages and mass media advertising, consulting fees towards the development and delivery of advertising and marketing strategies, are expensed as incurred. Media production costs, targeted mailings and other marketing collateral are expensed when distributed to schools or when specific marketing events take place. Advertising and marketing costs during Fiscal 2010, Fiscal 2009 and Fiscal 2008 were $3,787,000 $4,018,000 and $4,138,000, respectively. As of July 3, 2010 and June 27, 2009, prepaid advertising expense totaled $324,000 and $508,000, respectively.
Deferred Financing Costs:
Included in deposits and other assets are deferred financing costs that are incurred by the Company in connection with the issuance of debt. These costs are deferred and amortized to interest expense using the straight-line method over the life of the underlying indebtedness. As of July 3, 2010 and June 27, 2009, $791,000 and $686,000 in unamortized financing costs were carried on the Company’s balance sheet, respectively.
Stock Compensation:
The Company records estimated compensation costs for all share-based payments based on estimated fair value at the grant date. For purposes of calculating grant date fair value for stock options, the value of the options is estimated using a Black Scholes option pricing formula. The calculated expense is amortized over the options’ requisite service period, generally, the vesting period. Stock compensation is estimated only for grants expected to vest, which is total estimated value less estimated forfeitures. Restricted stock awards are valued based at their fair value on the grant date and amortized over their vesting period.
Lease Reserves and Exit Costs:
The Company records estimated costs for school closures when the lease is terminated or at the “cease use” date rather than at the date of a commitment to an exit or disposal plan.
Income Taxes:
The Company is subject to income taxes in the U.S. federal jurisdiction, and various U.S. states’ jurisdictions. Tax regulations within each jurisdiction are subject to the interpretation of the related tax laws and regulations and require significant judgment to apply. With few exceptions, the Company is no longer subject to U.S. federal, state and local income tax examinations by tax authorities for the years before Fiscal 2005.
F-11
Table of Contents
Nobel Learning Communities, Inc. and Subsidiaries
Notes to Consolidated Financial Statements—(Continued)
The Company recognizes deferred income taxes in regard to the tax consequences of “temporary differences” by applying enacted statutory tax rates applicable to future years to differences between the financial statement carrying amounts and the tax basis of existing assets and liabilities. The effect on deferred taxes of a change in tax rate is recognized in income in the period of enactment. An estimated valuation allowance is recorded based on the uncertainty regarding the ultimate realizability of deferred tax assets.
The Company recognizes the financial statement benefit of a tax position only after determining that the relevant tax authority would more likely than not sustain the position following an audit. For tax positions meeting the more-likely-than-not threshold, the amount recognized in the financial statements is the largest benefit that has a greater than 50 percent likelihood of being realized upon ultimate settlement with the relevant tax authority.
New Accounting Pronouncements:
In July 2010, the Financial Accounting Standards Board (“FASB”) issued guidance that will require companies to provide more information about the credit quality of their financing receivables in the disclosures to financial statements including, but not limited to, significant purchases and sales of financing receivables, aging information and credit quality indicators. The guidance is effective for the Company as of December 15, 2010. The Company does not anticipate that adoption will have a significant effect on its consolidated financial statements.
In February 2010, the FASB amended ASC Topic 855 “Subsequent Events”. The amendment does not change the definition of a subsequent event (i.e. an event or transaction that occurs after the balance sheet date but before the financial statements are issued) but requires SEC filers to evaluate subsequent events through the date that its financial statements are issued. FASB ASC Topic 855 has been effective for Fiscal 2010. The adoption of FASB ASC Topic 855 did not have a material effect on the Company’s consolidated financial statements.
In January 2010, the FASB issued guidance that requires new disclosures and clarifies some existing disclosure requirements about fair value measurements. The new pronouncement requires a reporting entity: (1) to disclose separately the amounts of significant transfers in and out of Level 1 and Level 2 fair value measurements and describe the reasons for the transfers; and (2) to present separately information about purchases, sales, issuances, and settlements in the reconciliation for fair value measurements using significant unobservable inputs. In addition, it clarifies the requirements of the following existing disclosures: (1) for purposes of reporting fair value measurement for each class of assets and liabilities, a reporting entity needs to use judgment in determining the appropriate classes of assets and liabilities, and (2) a reporting entity should provide disclosures about the valuation techniques and inputs used to measure fair value for both recurring and nonrecurring fair value measurements. The new guidance is effective for interim and annual reporting periods beginning after December 15, 2009, except for the disclosures about purchases, sales, issuances, and settlements in the roll-forward of activity in Level 3 fair value measurements, which will be effective for the Company in fiscal 2011. Adoption requires additional disclosure to delineate such categories in the notes to the Company’s consolidated financial statements (see Note 12).
In October 2009, the FASB issued ASU 2009-13, “Revenue Recognition (Topic 605) — Multiple-Deliverable Revenue Arrangements”. ASU 2009-13 revises certain accounting for revenue arrangements with multiple deliverables. In particular when vendor specific objective evidence or third party evidence for deliverables in an arrangement cannot be determined, ASU 2009-13 allows use of a best estimate of the selling price to allocate the arrangement consideration among them. ASU 2009-13 is effective for the first quarter of Fiscal 2011, with early adoption permitted. We do not expect that the adoption of ASU 2009-13 will have a material impact on our financial position, results of operations or cash flows.
F-12
Table of Contents
Nobel Learning Communities, Inc. and Subsidiaries
Notes to Consolidated Financial Statements—(Continued)
In June 2009, the Financial Accounting Standards Board (“FASB”) issued the codification of Generally Accepted Accounting Principles (the “Codification”). “The Codification is intended to become the source of the authoritative U.S. GAAP recognized by the FASB to be applied by nongovernmental entities. On the effective date of this statement, the Codification superseded all then-existing non-SEC accounting and reporting standards. All other non-grandfathered non-SEC accounting literature not included in the Codification has become non-authoritative. The Codification became effective for financial statements issued for interim and annual periods ending after September 15, 2009 and is reflected in this Form 10-K. The adoption of the Codification has not had a material effect on the Company’s consolidated financial statements.
On June 28, 2009, the Company adopted an update to ASC 260 “Earnings per Share” which addressed “whether instruments granted in share-based payment transactions are participating securities prior to vesting and, therefore, need to be included in the earnings allocation in computing earnings per share under the two-class method as described in ASC 260. Under the guidance in this topic, unvested share-based payment awards that contain non-forfeitable rights to dividends or dividend equivalents (whether paid or unpaid) are participating securities and shall be included in the computation of earnings per share pursuant to the two-class method. The adoption of this topic did not have an impact on the Company’s financial statements.
In December 2007 the FASB expanded the requirements of ASC Topic 805, “Business Combinations.” Among other things, this topic broadened the scope of Topic 805 to include all transactions where an acquirer obtains control of one or more other businesses; retains the guidance to recognize intangible assets separately from goodwill; requires, with limited exceptions, that all assets acquired and liabilities assumed, including certain of those that arise from contractual contingencies, be measured at their acquisition date fair values; requires most acquisition and restructuring-related costs to be expensed as incurred; requires that step acquisitions, once control is acquired, be recorded at the full amounts of the fair values of the identifiable assets, liabilities and the non-controlling interest in the acquiree; and replaces the reduction of asset values and recognition of negative goodwill with a requirement to recognize a gain in earnings. The adoption of this topic did not have any effect on the Company’s historical financial statements. See Note 3 for the application of this standard to transactions that occurred during Fiscal 2010.
F-13
Table of Contents
Nobel Learning Communities, Inc. and Subsidiaries
Notes to Consolidated Financial Statements—(Continued)
2. Earnings Per Share:
Earnings per share is based on the weighted average number of shares and common stock equivalents outstanding during the period. In the calculation of basic earnings per share, weighted average number of shares outstanding is used as the denominator. In the calculation of diluted earnings per share, shares outstanding are adjusted to assume the exercise of options if such shares are dilutive. Earnings per share is computed as follows (dollars and average common stock outstanding in thousands):
| For the Fiscal Year Ended | |||||||||
| July 3, 2010 | June 27, 2009 | June 28, 2008 | |||||||
Basic income per share: | |||||||||
Net income | $ | 1,872 | $ | 4,564 | $ | 7,678 | |||
Weighted average common shares outstanding | 10,532 | 10,456 | 10,382 | ||||||
Basic income per share | $ | 0.18 | $ | 0.44 | $ | 0.74 | |||
Diluted income per share: | |||||||||
Net income | $ | 1,872 | $ | 4,564 | $ | 7,678 | |||
Weighted average common shares outstanding | 10,532 | 10,456 | 10,382 | ||||||
Dilutive effect of stock options | 87 | 245 | 248 | ||||||
Weighted average common stock and dilutive securities outstanding | 10,619 | 10,701 | 10,630 | ||||||
Diluted income per share | $ | 0.18 | $ | 0.43 | $ | 0.72 | |||
Anti-dilutive Stock options issued and outstanding with exercise prices in excess of average market price. | 947 | 372 | 156 | ||||||
F-14
Table of Contents
Nobel Learning Communities, Inc. and Subsidiaries
Notes to Consolidated Financial Statements—(Continued)
3. Acquisitions:
During Fiscal 2010, Fiscal 2009 and Fiscal 2008, the Company completed two, five and five acquisitions, respectively. Each of these acquisitions is consistent with the Company’s growth strategy in the private pay education market and includes both expansion in existing markets and entrance into new markets. During Fiscal 2010, the Company also expanded its learning platform with the acquisition of Laurel Springs School, an on-line and distance learning K-12 school. The twelve acquisitions completed during the last three fiscal years are summarized as follows:
| Fiscal Year Acquired | Number of facilities acquired | Market | ||||||||||
Name of Acquisition | Preschool | PreK & K -8 | Before-and-After (2) | Description | (N)ew or (E)xisting | |||||||
Laurel Springs School | 2010 | — | — | — | Distance Learning | N | ||||||
Gifted Child Studies, Inc. | 2010 | — | 1 | — | San Diego, CA | E | ||||||
Montessori Corner | 2009 | 2 | 1 | — | Princeton, NJ | N | ||||||
HighPointe Childrens Academy | 2009 | — | 1 | — | Dallas, TX | E | ||||||
Country Tyme | 2009 | 1 | — | — | Limerick, PA | E | ||||||
Southern Highlands Preparatory Schools | 2009 | 1 | 1 | — | Las Vegas, NV | E | ||||||
Ivy Kids Early Learning Center | 2009 | 1 | — | — | Missouri City, TX | E | ||||||
Camelback Desert Schools (1) | 2008 | — | 2 | — | Phoenix, AZ | N | ||||||
Enchanted Care Learning Centers (2) | 2008 | 9 | — | 6 | Columbus, OH | N | ||||||
Ivy Glen Schools | 2008 | 3 | — | 1 | Dallas, TX | E | ||||||
Teddy Bear Treehouse | 2008 | 2 | — | — | San Diego, CA | E | ||||||
Learning Ladder (3) | 2008 | 4 | — | — | Lancaster, PA | E | ||||||
| (1) | During the fourth quarter of Fiscal 2009, the Company closed one Camelback Desert School. The results of this school are included in income (loss) from discontinued operations in the periods presented in this Form 10-K. |
| (2) | Before-and-After facilities are intergral to adjacent school facilities and as such are not incremental to total school count. |
| (3) | In conjunction with the acquisition of Learning Ladder schools the Company determined one location would be closed. This school was closed during the first quarter of Fiscal 2008 and its results are included in income from discontinued operations during Fiscal 2008. |
During the first quarter of 2010, the Company acquired the Laurel Springs School (“Laurel Springs”), an online and distance learning school (www.laurelsprings.com). Laurel Springs’ educational program spans the entire K-12 market and has a fully accredited curriculum that includes Honors AP Courses, a Gifted and Talented program, a chapter of the National Honors Society and a strong college preparatory program. Laurel Springs’ student body and alumni includes elite athletes, entertainers, and home schooled students and concurrent students from all 50 states and from numerous foreign countries. Laurel Springs extends the Company’s educational programs through high school and provides a fully integrated K-12 platform.
F-15
Table of Contents
Nobel Learning Communities, Inc. and Subsidiaries
Notes to Consolidated Financial Statements—(Continued)
A summary of the purchase price and the allocation of estimated fair value of the net assets and liabilities acquired or assumed, is presented below (dollars in thousands):
Acquired Entity | Net cash paid at acquisition | Net non-cash working capital assets/ (liabilities) included in purchase price | Goodwill | Acquired Intangible Assets at Fair Value | Restrictive Covenants | Amortizable Asset Life (years) | Other Long- Term Assets (Liabilities) at Fair Value | Total purchase price of acquisition | ||||||||||||||||||||||||
| Trade Name | Amortizable Asset Life (years) | Student Roster | Amortizable Asset Life (years) | |||||||||||||||||||||||||||||
Fiscal 2010 Acquisitions | ||||||||||||||||||||||||||||||||
Laurel Springs School | $ | 10,444 | $ | (2,539 | ) | $ | 9,088 | $ | 1,126 | 5 | $ | 2,035 | 10 | $ | 150 | 5 | $ | 585 | $ | 12,984 | ||||||||||||
Gifted Child Studies, Inc. | 1,539 | (1,611 | ) | 2,698 | 264 | 20 | 302 | 7 | — | n/a | (115 | ) | 3,149 | |||||||||||||||||||
Total Fiscal 2010 acquisitions | $ | 11,983 | $ | (4,150 | ) | $ | 11,786 | $ | 1,390 | $ | 2,337 | $ | 150 | $ | 470 | $ | 16,133 | |||||||||||||||
Fiscal 2009 Acquisitions: | ||||||||||||||||||||||||||||||||
Montessori Corners | $ | 2,658 | $ | (676 | ) | $ | 2,883 | $ | 88 | 20 | $ | 238 | 7 | — | n/a | $ | 125 | $ | 3,334 | |||||||||||||
Highpointe | 1,093 | (5 | ) | 703 | — | n/a | 249 | 7 | — | n/a | 146 | 1,098 | ||||||||||||||||||||
Country Tyme | 1,354 | 47 | 1,041 | — | n/a | 216 | 4 | — | n/a | 50 | 1,307 | |||||||||||||||||||||
Southern Highlands | 1,256 | (502 | ) | 1,106 | 94 | 20 | 255 | 7 | — | n/a | 303 | 1,758 | ||||||||||||||||||||
Ivy Kids | 745 | 35 | 400 | — | n/a | 120 | 4 | — | n/a | 190 | 710 | |||||||||||||||||||||
Purchase accounting adjustments to prior year acquisitions: | 90 | (43 | ) | 133 | — | — | — | n/a | — | — | ||||||||||||||||||||||
Total Fiscal 2009 acquisitions | $ | 7,196 | $ | (1,144 | ) | $ | 6,266 | $ | 182 | $ | 1,078 | $ | — | $ | 814 | $ | 8,207 | |||||||||||||||
Fiscal 2008 Acquisitions: | ||||||||||||||||||||||||||||||||
Camelback Desert Schools | $ | 194 | $ | (294 | ) | $ | 127 | $ | 43 | 20 | $ | 115 | 4 | $ | — | n/a | $ | 203 | $ | 488 | ||||||||||||
Enchanted Care | 14,303 | (1,097 | ) | 12,074 | 608 | 20 | 1,936 | 7 | — | n/a | 782 | 15,400 | ||||||||||||||||||||
Ivy Glen | 2,132 | 3 | 1,583 | — | n/a | 423 | 6 | — | n/a | 123 | 2,129 | |||||||||||||||||||||
Teddy Bear Treehouse | 2,279 | 4 | 1,925 | — | n/a | 281 | 3 | — | n/a | 69 | 2,275 | |||||||||||||||||||||
Learning Ladder | 2,153 | (183 | ) | 1,972 | — | n/a | 252 | 4 | — | n/a | 112 | 2,336 | ||||||||||||||||||||
Total Fiscal 2008 acquisitions | $ | 21,061 | $ | (1,567 | ) | $ | 17,681 | $ | 651 | $ | 3,007 | $ | — | $ | 1,289 | $ | 22,628 | |||||||||||||||
F-16
Table of Contents
Nobel Learning Communities, Inc. and Subsidiaries
Notes to Consolidated Financial Statements—(Continued)
The following unaudited pro forma results of operations assume that acquisitions completed during Fiscal 2008, Fiscal 2009 and Fiscal 2010 were completed at the beginning of each of the respective periods presented (dollars in thousands, except per share data):
| Fiscal | ||||||
| 2010 | 2009 | |||||
Revenues | $ | 233,298 | $ | 238,572 | ||
Net Income | 1,469 | 4,716 | ||||
Earnings per share—basic | $ | 0.14 | $ | 0.45 | ||
Earnings per share—assuming dilution | $ | 0.14 | $ | 0.44 | ||
SEC Regulation S-X does not require any additional pro-forma financial information to be furnished as a result of any of the above acquisitions.
To date, the Company has not identified any material unrecorded pre-acquisition contingencies where the related asset or liability is probable and the amount can be reasonably estimated. Prior to the end of the one-year purchase price allocation period, if information becomes available that would indicate it is probable that such events existed at the acquisition date and the amounts can be reasonably estimated, such items will be included in the final purchase price allocation and may result in an adjustment to goodwill. Beginning in Fiscal 2010, the Company no longer capitalized direct costs incurred to complete the acquisition of acquired entities, rather these costs have been recognized as expense in the period in which they have been incurred. Total acquisition costs recognized as general and administrative expense during Fiscal 2010 were $207,000. With the exceptions of LSS and GCS, each of the above acquisitions includes tax deductible goodwill at a basis equal to its respective book value. Goodwill is not deductible for income tax purposes for neither LSS nor GCS.
4. Goodwill and Other Intangible Assets:
Intangible assets include trade names, student rosters, a franchise agreement and other identifiable intangibles from acquisitions. At July 3, 2010 and June 27, 2009, the Company’s goodwill and intangible assets were as follows (dollars in thousands):
| Weighted Average Amortization Period (in months) | July 3, 2010 | June 27, 2009 | ||||||||||||||||||
| Gross Carrying Amount | Accumulated Amortization | Net Balance | Gross Carrying Amount | Accumulated Amortization | Net Balance | |||||||||||||||
Goodwill | n.a. | $ | 83,275 | $ | — | $ | 83,275 | $ | 71,489 | $ | — | $ | 71,489 | |||||||
Amortized intangible assets: | ||||||||||||||||||||
Franchise agreement | 130 | $ | 580 | $ | 260 | $ | 320 | $ | 580 | $ | 192 | $ | 388 | |||||||
Trade Names | 194 | 4,317 | 743 | 3,574 | 2,928 | 362 | 2,566 | |||||||||||||
Student Rosters | 80 | �� | 8,485 | 4,436 | 4,049 | 6,149 | 2,378 | 3,771 | ||||||||||||
Restrictive convenants | 150 | 31 | 119 | — | — | — | ||||||||||||||
Total Intangible Assets | $ | 13,532 | $ | 5,470 | $ | 8,062 | $ | 9,657 | $ | 2,932 | $ | 6,725 | ||||||||
At July 3, 2010, goodwill totaled $83,275,000, an increase of $11,786,000 from June 27, 2009. This increase was primarily the result of the acquisition of Laurel Springs School and Gifted Child Studies, both completed during the first quarter of Fiscal 2010.
F-17
Table of Contents
Nobel Learning Communities, Inc. and Subsidiaries
Notes to Consolidated Financial Statements—(Continued)
Amortization expense related to intangible assets was $2,538,000, $1,617,000 and $930,000 for Fiscal 2010, 2009 and Fiscal 2008, respectively. Projected amortization expense for the intangible assets above for Fiscal 2011, Fiscal 2012, Fiscal 2013, Fiscal 2014 and Fiscal 2015 is $1,892,000, $1,385,000, $1,168,000, $725,000 and $687,000, respectively.
5. Cash Equivalents:
The Company has an agreement with its primary bank that allows the bank to act as the Company’s agent in making daily investments with available funds in excess of a selected minimum account balance. This investment amounted to approximately $450,000 and $20,000 at July 3, 2010 and June 27, 2009, respectively. The Company’s funds were invested in money market accounts which are not federally insured. The Company believes it is not exposed to any significant credit risk on cash and cash equivalents as such deposits are maintained in high quality financial institutions.
6. Note Receivable:
During the fourth quarter of Fiscal 2008, the Company settled a contract dispute with a former sub-lessee with a note to the Company with a face amount of $1,250,000 to be paid over five years. The Company has imputed an interest rate of 4.25% in determining the present value of this receivable, this rate is consistent with other published discounts for liabilities the payee has with other creditors. The unaccreted discount related to this note totaled $112,000 at issue and will be recognized as income from discontinued operations during the collection period of the note. At July 3, 2010, the unaccreted discount related to the note was $27,000. During Fiscal 2010, Fiscal 2009 and Fiscal 2008, interest income of $29,000, $52,000 and $5,000 was recognized as income from discontinued operations, respectively.
7. Property and Equipment:
The balances of major property and equipment classes were as follows (dollars in thousands):
| July 3, 2010 | June 27, 2009 | |||||||||||||||||
| Cost | Accumulated Depreciation | Net Book Value | Cost | Accumulated Depreciation | Net Book Value | |||||||||||||
Land | $ | 1,518 | $ | — | $ | 1,518 | $ | 1,518 | $ | — | $ | 1,518 | ||||||
Buildings | 6,049 | 3,154 | 2,895 | 5,856 | 2,890 | 2,966 | ||||||||||||
Leasehold improvements | 36,712 | 21,627 | 15,085 | 32,492 | 19,321 | 13,171 | ||||||||||||
Furniture and equipment | 42,489 | 33,082 | 9,407 | 37,945 | 28,974 | 8,971 | ||||||||||||
Construction in progress | 139 | — | 139 | 2,124 | — | 2,124 | ||||||||||||
| $ | 86,907 | $ | 57,863 | $ | 29,044 | $ | 79,935 | $ | 51,185 | $ | 28,750 | |||||||
Depreciation expense from continuing operations was $7,426,000, $8,050,000 and $6,381,000 for Fiscal 2010, Fiscal 2009 and Fiscal 2008, respectively.
F-18
Table of Contents
Nobel Learning Communities, Inc. and Subsidiaries
Notes to Consolidated Financial Statements—(Continued)
8. Change in Accounting Estimate:
During Fiscal 2009, the Company recorded charges for accelerated depreciation and amortization of $1,145,000 as a result of changes in accounting estimates regarding the remaining useful lives of assets residing at schools that were closed during the fiscal year and the retirement and replacement of the Company’s website. These changes in estimates resulted in an after-tax charge to basic and diluted income per share of $0.07 for Fiscal 2009. These charges are further detailed as follows:
| Fiscal 2009 | |||
Accelerated depreciation and amortization included in Operating Income: | |||
Accelerated Depreciation—Rent and other | $ | 789 | |
Accelerated amortization of intangibles—general and administrative expenses | 70 | ||
Company website—general and administrative expenses | 51 | ||
Total accelerated depreciation and amortization included in Operating Income | 910 | ||
Accelerated depreciation and amortization included in loss from discontinued operations: | |||
Accelerated Depreciation | 235 | ||
Total accelerated depreciation and amortization expense for changes in accounting estimates | $ | 1,145 | |
9. Accounts Payable and Other Current Liabilities:
Accounts payable and other current liabilities were as follows, (dollars in thousands):
| July 3, 2010 | June 27, 2009 | |||||
Accounts payable | $ | 8,016 | $ | 6,459 | ||
Accrued payroll and related items | 4,560 | 5,862 | ||||
Accrued property taxes | 1,401 | 1,321 | ||||
Accrued rent | 1,844 | 1,462 | ||||
Other accrued expenses | 3,713 | 4,282 | ||||
| $ | 19,534 | $ | 19,386 | |||
10. Debt:
At the beginning of Fiscal 2008, the Company had a credit agreement in the amount of $50,000,000, which provided for a $50,000,000 Revolving Credit Commitment and up to $3,500,000 in letters of credit as a sub-limit of the Revolving Credit Commitment (as amended, the “Prior Credit Agreement”). The Prior Credit Agreement was scheduled to terminate on October 29, 2011. During Fiscal 2008, the Company amended the loan facility under its Prior Credit Agreement (the “2008 Credit Agreement”). The 2008 Credit Agreement provides for a $75,000,000 Revolving Credit Commitment with a $25,000,000 accordion feature permitting the Company to increase the size of the facility under its current terms and conditions by obtaining additional credit from either participating or new banks. Under the terms of the 2008 Credit Agreement, proceeds may be used to fund permitted acquisitions, capital expenditures and ongoing business operations. The borrowing rates on the 2008 Credit Agreement were determined pursuant to matrix based on our debt to defined EBITDA leverage ratio, with either LIBOR or bank base rate indexed borrowings. The 2008 Credit Agreement has a five-year term that ends on June 6, 2013.
F-19
Table of Contents
Nobel Learning Communities, Inc. and Subsidiaries
Notes to Consolidated Financial Statements—(Continued)
On January 15, 2010, the Company and its lenders amended the 2008 Credit Agreement (the “2008 Amended Credit Agreement”). The 2008 Amended Credit Agreement continues to provide for a $75,000,000 revolving credit commitment with a $25,000,000 accordion feature permitting the Company to increase the size of the facility and a term that ends on June 6, 2013. The 2008 Amended Credit Agreement amends certain operational covenants that the Company was required to meet under the 2008 Credit Agreement. As of July 3, 2010 and June 27, 2009, outstanding borrowings equaled $21,500,000 and $13,525,000, respectively and outstanding letters of credit as of July 3, 2010 and June 27, 2009 were $2,615,000.
The Company’s obligations under the 2008 Amended Credit Agreement are guaranteed by subsidiaries and collateralized in part by a pledge of the stock of the Company’s subsidiaries and liens on all real and personal property owned by the Company.
The Company’s obligation under its 2008 Credit Agreement and the 2008 Amended Credit Agreement bears interest, at the Company’s option, at either:
(1) a selected LIBOR rate plus a margin based on our debt to defined EBITDA leverage ratio
or;
(2) a defined base rate plus a margin based on our debt to defined EBITDA leverage ratio.
The applicable margins may be adjusted quarterly based on the leverage ratio, and adjusted periodically based on adjustments to the indexed LIBOR rate or defined base rate. The Company also pays a letter of credit fee based on the face amount of each letter of credit calculated at the margin applicable to loans under the 2008 Amended Credit Agreement bearing interest based on selected LIBOR rate. The ranges of margins applicable during Fiscal 2010 and Fiscal 2009 were as follows:
The 2008 Amended Credit Agreement contains customary covenants and provisions that restrict the Company’s ability to change its business, acquire businesses, declare or pay dividends, grant liens, incur additional indebtedness, make capital expenditures, govern the use of proceeds from disposition of assets or equity related transactions and requires repayment in certain change of control events. In addition, the 2008 Amended Credit Agreement provides that the Company must meet or exceed amounts for defined EBITDA and fixed charge coverage ratios and must not exceed certain leverage ratios. The Company’s loan covenants under its 2008 Amended Credit Agreement limit the amount of senior debt borrowings and acquisitions that are permitted.
| Spreads added to LIBOR or Base Rates | ||||
| June 6, 2008 - January 14, 2010 | January 15, 2010 - July 3, 2010 | |||
LIBOR rate plus debt to defined EBITDA-indexed rate | 1.15% – 2.40% | 2.50% – 3.75% | ||
Base rate plus debt to defined EBITDA-indexed rate | 0.15% – 0.90% | 1.50% – 2.75% | ||
Letter of Credit fees LIBOR plus defined EBITDA-indexed rate | 1.15% – 2.40% | 2.50% – 3.75% | ||
As of July 3, 2010 and June 27, 2009, included in deposits and other assets on the Company’s balance sheet are deferred financing costs of $791,000 and $686,000, respectively. These costs are amortized to interest expense on a straight-line basis over the life of the underlying indebtedness. During Fiscal 2010, Fiscal 2009 and Fiscal 2008, the Company recognized interest expense related to the amortization of financing costs of $217,000, $167,000 and $15,000, respectively.
F-20
Table of Contents
Nobel Learning Communities, Inc. and Subsidiaries
Notes to Consolidated Financial Statements—(Continued)
11. Derivative Financial Instruments and Comprehensive Income:
Interest Rate Swap Agreements
The Company uses derivative financial instruments to manage its exposure to fluctuations in interest rates. The instruments are subject to varying degrees of market risk, as they are subject to rate and price fluctuations and are also subject to elements of credit risk in the event the counterparty should default. Amounts received or paid with regard to derivative instruments as a part of designated transactions result in the reclassification amounts previously recognized as other comprehensive income related to the forecasted transaction, which when realized, are netted in interest expense. Amounts reclassified into earnings related to designated derivative instruments for Fiscal 2010 and Fiscal 2009 were $290,000 and $177,000, respectively. The amount reclassified into earnings related to a terminated derivative instrument during Fiscal 2010 was $54,000. There were no derivative instruments in place during Fiscal 2008 and no terminated derivative instruments during Fiscal 2009 or Fiscal 2008.
At July 3, 2010 and June 27, 2009, the Company had the following interest rate swap contracts outstanding that were designated as cash flow hedges and were determined to be highly-effective:
Swap # | Notional Amount | Fixed Rate Payment Obligation | Counterparty payments index | Termination Date | ||||||
Swap Contracts at July 3, 2010: | ||||||||||
1 | $ | 3,000,000 | 1.15 | % | LIBOR | February 27, 2012 | ||||
2 | 5,000,000 | 1.48 | % | LIBOR | March 26, 2012 | |||||
Swap Contracts at June 27, 2009: | ||||||||||
3 | 5,000,000 | 3.68 | % | LIBOR | June 6, 2010 | |||||
4 | 5,000,000 | 2.74 | % | LIBOR | April 28, 2010 | |||||
In addition to the above interest rate swaps, during Fiscal 2010, the Company entered into a “blend and extend” transaction with its bank, whereby the original interest rate swap (Swap #3 above) was terminated and replaced with a new interest rate swap with a termination date of May 28, 2012 and a rate of 1.86%. This transaction resulted in the termination of hedge accounting for the original interest rate swap. During Fiscal 2010, $53,000 of previously unrealized losses accounted for in accumulated other comprehensive income derived from Swap #3 was reclassified into earnings as expense. As of July 3, 2010, the fair value of the new interest rate swap was a liability of $103,000.
The following tables present the fair value of the Company’s interest rate swaps as well as their classification on the balance sheet as of July 3, 2010 and on the consolidated statement of income of the year ended July 3, 2010 (dollars in thousands):
Fair Value of Interest Rate Swaps as of July 3, 2010 | |||||||||
| Notional Amount | Balance Sheet Location | Fair Value | |||||||
Interest rate swap contracts designated as hedging instruments | $ | 8,000 | Other long term liabilities | $ | (86 | ) | |||
| Accumulated other comprehensive loss | 59 | ||||||||
Interest rate swap contract not designated as hedging instruments | 5,000 | Other long term liabilities | (103 | ) | |||||
The Effect of Interest Rate Swaps on the Statement of Income Fiscal Year Ended July 3, 2010 | ||||||||
| Notional Amount | Statement of Income Location | Unrealized Loss | ||||||
Interest rate swap not designated as a hedging instrument | $ | 5,000 | Interest expense | $ | 49 | |||
F-21
Table of Contents
Nobel Learning Communities, Inc. and Subsidiaries
Notes to Consolidated Financial Statements—(Continued)
If the Company were to settle the underlying LIBOR based debt instruments, any unrealized gains or losses reported in accumulated Other Comprehensive Income for cash flow hedges would be reclassified into earnings during the period in which the underlying instruments were settled. The Company does not anticipate any of these instruments to settle during the twelve months subsequent to July 3, 2010.
12. Fair Value of Financial Instruments
The Company determines fair value based upon a hierarchy that defines three levels of inputs that may be used to measure fair value:
Level 1—Quoted prices in active markets for identical assets and liabilities that the reporting entity has the ability to access at the measurement date.
Level 2—Inputs other than quoted prices included within Level 1 that are observable for the asset and liability or can be corroborated with observable market data for substantially the entire contractual term of the asset or liability.
Level 3—Unobservable inputs that reflect the entity’s own assumptions about the assumptions that market participants would use in the pricing of the asset or liability and are consequently not based on market activity, but rather through particular valuation techniques.
The determination of where an asset or liability falls in the hierarchy requires significant judgment and considers factors specific to the asset or liability. In instances where the determination of the fair value measurement is based on inputs from different levels of the fair value hierarchy, the level in the fair value hierarchy within which the entire fair value measurement falls is based on the lowest level input that is significant to the fair value measurement in its entirety. The Company evaluates its hierarchy disclosures each quarter; and depending on various factors, it is possible that an asset or liability may be classified differently from quarter to quarter. However, the Company expects that changes in classifications between levels will be rare.
The fair value of short-term financial instruments such as cash, accounts receivable and accounts payable and accrued expenses approximates their carrying value on the consolidated balance sheet.
The carrying values for the Company’s long-term debt and note receivable approximate fair value based on current rates that management believes could be obtained for similar debt instrument and note.
The Company receives third-party valuations from financial institutions to assign values to derivative instruments. The Company assessed the institutions’ valuation technique, noting that the specialists use an industry recognized discounted cash flow model that utilizes inputs which substantially fall within Level 2 of the fair value hierarchy. Although the Company has determined that the majority of the inputs used to value its derivatives fall within Level 2 of the fair value hierarchy, the credit valuation adjustments associated with those derivatives utilize Level 3 inputs, such as estimates of current credit spreads to evaluate the likelihood of default by the Company and its counterparties. However, as of July 3, 2010 and June 27, 2009, the Company has assessed the significance of the impact of the credit valuation adjustments on the overall valuation of its derivative positions and has determined that the credit valuation adjustments are not significant to the overall valuation of the Company’s derivatives. As a result, the Company has determined that its derivative valuations in their entirety are classified in Level 2 of the fair value hierarchy.
F-22
Table of Contents
Nobel Learning Communities, Inc. and Subsidiaries
Notes to Consolidated Financial Statements—(Continued)
The following table presents information about the Company’s assets and liabilities (including derivatives that are presented net, see Note 11) measured at fair value on a recurring basis as of July 3, 2010 and June 27, 2009, aggregated by the level in the fair value hierarchy within which those instruments fall:
| Quoted Prices in Active Markets Level 1 | Significant Other Observable Inputs Level 2 | Significant Unobservable Inputs Level 3 | ||||||||
Total derivatives, net liability at July 3, 2010 | $ | — | $ | (189 | ) | $ | — | |||
Total derivatives, net liability at June 27, 2009 | $ | — | $ | (246 | ) | $ | — | |||
13. Other Income, net:
Other income included the following items (dollars in thousands):
| Fiscal | ||||||||||||
| 2010 | 2009 | 2008 | ||||||||||
Interest income | $ | (30 | ) | $ | (69 | ) | $ | (38 | ) | |||
Settlement of outstanding contract | — | — | (300 | ) | ||||||||
Other | — | (9 | ) | 12 | ||||||||
| $ | (30 | ) | $ | (78 | ) | $ | (326 | ) | ||||
During the second quarter of Fiscal 2008, the Company received a payment of $300,000 for the settlement and release of a contract for which the Company no longer had performance obligations. The settlement of this contract resulted in an increase to Fiscal 2008 basic and diluted earnings per share of $0.02.
14. Lease Obligations:
Future minimum lease obligations, by year and in the aggregate, for all real properties, vehicle and other leases that the Company and its subsidiaries have entered into, consisted of the following at July 3, 2010 (dollars in thousands):
| Operating Lease Commitments | Total Operating Lease Commitments | Closed Location Cash Sublease Amounts Due to the Company | Operating Lease Commitments, net of Sublease Amounts due to the Company | |||||||||||||||
| Continuing Operations | Discontinued Operations | |||||||||||||||||
Fiscal Year | Vehicle and Other Leases | School Real Estate Leases | Closed Location Real Estate Leases | |||||||||||||||
2011 | 1,006 | 39,900 | 2,271 | 43,177 | 1,789 | 41,388 | ||||||||||||
2012 | 806 | 38,315 | 1,964 | 41,085 | 1,607 | 39,478 | ||||||||||||
2013 | 445 | 35,495 | 1,773 | 37,713 | 1,421 | 36,292 | ||||||||||||
2014 | 337 | 32,620 | 1,290 | 34,247 | 938 | 33,309 | ||||||||||||
2015 | 220 | 30,420 | 1,149 | 31,789 | 851 | 30,938 | ||||||||||||
2016 & thereafter | 51 | 165,323 | 462 | 165,836 | — | 165,836 | ||||||||||||
Total | $ | 2,865 | $ | 342,073 | $ | 8,909 | $ | 353,847 | $ | 6,606 | $ | 347,241 | ||||||
Net operating lease commitments are the net cash amounts due from the Company to third-party landlords not covered by underlying sub-leases from a third party sub-tenant or assignee. The amount is net of closed location real estate leases less closed location cash sublease amounts due to the Company. The Company’s liability with respect to closed location real estate leases could change if a sublessee defaults under their sublease with the Company or if the Company is successful in subleasing additional closed schools, extending existing sublease agreements or
F-23
Table of Contents
Nobel Learning Communities, Inc. and Subsidiaries
Notes to Consolidated Financial Statements—(Continued)
mitigating the commitment in some other form. Some of the closed location real estate lease obligations extend beyond the term of the current subleases on those properties. The leases on the closed schools expire between 2011 and 2017.
In addition to the lease obligations noted above, the Company has made guarantees for fourteen leases that were assigned to third parties. All of these leases will expire no later than April of 2013. The Company has assessed its exposure regarding the assignment of the Guaranteed Properties and has determined that the fair value of this exposure is de minimis and therefore has not recorded a liability for this contingency. The maximum potential undiscounted amount of future payments the Company could be required to pay under these guarantees as of July 3, 2010 is $1,659,000. Rent expense for all leases included in continuing operations was $40,523,000, $37,376,000 and $32,254,000 for Fiscal 2010, Fiscal 2009 and Fiscal 2008, respectively.
15. Lease Reserves:
The Company records estimated costs for school closures at the cease-use date. The reserves for closed schools are recorded at their estimated fair value by discounting to present value the net of all future rent payments and known or estimated sublease rentals over the respective lease term for the closed schools. The leases on the closed schools expire through 2017. At July 3, 2010 and June 27, 2009 the lease reserve for closed schools was $759,000 and $960,000, respectively. The following table summarizes activity recorded to the lease reserves (dollars in thousands):
| For the Fiscal Year Ended | ||||||||
| July 3, 2010 | June 27, 2009 | |||||||
Lease reserve at the beginning of period | $ | 960 | $ | 1,065 | ||||
Payments against reserve | (655 | ) | (487 | ) | ||||
Adjustments to reserve: | ||||||||
Discontinued Operations | 454 | 340 | ||||||
Continuing Operations | — | 42 | ||||||
Lease reserve at end of period | $ | 759 | $ | 960 | ||||
16. Costs Associated with Exit Activities:
The results of operations for schools that are no longer operating under the Company’s management have been reflected in the consolidated financial statements and notes as discontinued operations for all periods presented. The operating results for discontinued operations in the consolidated statements of income for all periods presented, net of tax were as follows (dollars in thousands):
| Fiscal | ||||||||||||
| 2010 | 2009 | 2008 | ||||||||||
Revenues | $ | — | $ | 1,761 | $ | 2,057 | ||||||
Cost of services | (176 | ) | (2,242 | ) | (2,341 | ) | ||||||
Rent and other | (720 | ) | (1,112 | ) | (245 | ) | ||||||
Closed school lease reserves | (454 | ) | (340 | ) | 1,028 | |||||||
Loss from discontinued operations before income tax benefit | (1,350 | ) | (1,933 | ) | 499 | |||||||
Income tax benefit | 516 | 764 | (186 | ) | ||||||||
Loss from discontinued operations | $ | (834 | ) | $ | (1,169 | ) | $ | 313 | ||||
F-24
Table of Contents
Nobel Learning Communities, Inc. and Subsidiaries
Notes to Consolidated Financial Statements—(Continued)
Fiscal 2009 discontinued operations include, among other items, the results of a school that was closed during the fourth quarter of Fiscal 2009. As of June 27, 2009, based upon the provisions of the lease to this property, the Company had notified the landlord of the property of issues regarding the physical condition of the property and terminated rent payments to the landlord. At that time, the resolution of the lease was not known and the Company had not deemed future payment of its lease obligations to the landlord as probable and subsequently did not accrue for such future payments, however the Company did continue to accrue for monthly rent as payments were subsequently withheld. During the second quarter of Fiscal 2010, the Company resolved this issue with the landlord and paid the landlord $350,000 to terminate this lease and release the Company from any future obligations associated with the property at which time, the Company recognized a pre-tax charge of $286,000.
During the fourth quarter of Fiscal 2008, the Company settled a contract dispute in the amount of $1,250,000 to be paid to the Company over five years. The net gain resulting from this settlement is $1,028,000 after costs and discount for the five year collection period. This gain resulted in an increase to Fiscal 2008 basic and diluted earnings per share of $0.06 included in discontinued operations (see Note 2).
17. Stockholders’ Equity:
Preferred Stock:
In 1995, the Company issued 1,063,830 shares of the Company’s non-voting Series D Convertible Preferred Stock for a purchase price of $2,000,000. The Series D Convertible Preferred Stock was convertible, until August 31, 2003, to common stock. The Series D Convertible Preferred Stock is no longer convertible. Holders of Series D Convertible Preferred Stock are not entitled to dividends, unless dividends are declared on the Company’s common stock. Upon liquidation, the holders of shares of Series D Convertible Preferred Stock are entitled to receive, before any distribution or payment is made upon any common stock, $1.88 per share plus any unpaid dividends. At July 3, 2010 and June 27, 2009, 1,063,830 shares of Series D Convertible Preferred Stock were outstanding.
18. Stock Based Compensation.
As of July 3, 2010, approximately 1,302,000 stock options were issued and outstanding and 71,000 shares of restricted stock had been granted and are classified as equity awards. As of July 3, 2010, the total number of shares of common stock still available for issuance under the Company’s stock compensation plans was 404,000.
2004 Omnibus Incentive Equity Compensation Plan:
On October 6, 2004, the stockholders approved the 2004 Omnibus Incentive Equity Compensation Plan (the “Plan”). Under the Plan, new shares of common stock may be issued in connection with stock grants, incentive stock options and non-qualified stock options for key employees and outside directors. The purpose of the Plan is to attract and retain quality employees. All stock option grants to date under the Plan have been non-qualified stock options which vest over three years (except that stock options issued to directors vest at the end of the fiscal year in which the options were granted and options granted to new directors upon joining the Board of Directors vest immediately). Stock option grants under the Plan have contractual terms between seven and ten years.
Beginning in Fiscal 2008, stock-based compensation awarded to the Company’s non-employee Board of Directors was granted in the form of restricted stock awards (“RSA”) that vest the earlier of the first anniversary of the date of the grant or the day prior to the next annual meeting of the Company’s stockholders at which directors are elected. As of July 3, 2010, 61,000 RSAs have been granted to the Company’s non-employee Board of Directors. During the third quarter of Fiscal 2010, the Company granted an RSA of 10,000 shares to a Senior Vice President of the Company. This RSA is subject to a service period of three years prior to vesting.
F-25
Table of Contents
Nobel Learning Communities, Inc. and Subsidiaries
Notes to Consolidated Financial Statements—(Continued)
Through July 3, 2010, approximately 1,074,000 non-qualified stock options and 71,000 RSAs had been issued and are outstanding under the Plan.
2000 Stock Option Plan for Consultants:
In February 2000, the Company established the 2000 Stock Option Plan for Consultants. This plan reserved up to an aggregate of 200,000 shares of common stock of the Company for issuance in connection with non-qualified stock options for non-employee consultants. Through July 3, 2010, 11,000 non-qualified stock options have been issued and are outstanding under the 2000 Stock Option Plan for Consultants. Stock option grants under the 2000 Stock Option Plan for Consultants have a contractual term between seven and ten years.
1995 Stock Incentive Plan:
With the approval of the 2004 Omnibus Incentive Equity Compensation Plan, the 1995 Stock Incentive Plan was terminated and the remaining shares reserved for issuance there-under of 719,000 were cancelled. At July 3, 2010, 218,000 non-qualified stock options have been issued and are outstanding under the 1995 Stock Incentive Plan. Stock option grants under the 1995 Stock Incentive Plan have a contractual term of ten years.
The fair value of each option grant is estimated on the date of grant using the Black-Scholes option-pricing model with the following assumptions:
| Fiscal | |||||||||
| 2010 | 2009 | 2008 | |||||||
Expected dividend yield | 0.0 | % | 0.0 | % | 0.0 | % | |||
Expected stock price volatility | 28.2 | % | 26.3 | % | 21.7 | % | |||
Risk-free interest rate | 2.9 | % | 3.6 | % | 4.2 | % | |||
Weighted average expected life of options | 6 years | 6 years | 6 years | ||||||
Expected rate of forfeiture | 2.6 | % | 5.1 | % | 7.3 | % | |||
Stock option awards are amortized on a straight-line basis over the requisite service periods of the awards, which are generally the vesting periods. Stock-based compensation expense is included in general and administrative expense in the statements of income for Fiscal 2010, Fiscal 2009 and Fiscal 2008 and was $1,107,000, $1,012,000 and $717,000, respectively. As of July 3, 2010, there was $1,113,000 of total unrecognized stock-based compensation cost related to options granted under our plans that will be recognized over a weighted average period of 1.2 years. The Company expects to continue its historical practice of issuing stock options and RSAs, which will result in additional stock-based compensation in the future, although amounts may vary.
F-26
Table of Contents
Nobel Learning Communities, Inc. and Subsidiaries
Notes to Consolidated Financial Statements—(Continued)
A summary of option activity under the Company’s employee stock option plans for the fiscal years ended July 3, 2010, June 30, 2009 and June 28, 2008 and changes during the years then ended is as follows:
| Shares Available for Grant | Outstanding | Exercisable | ||||||||||||
| Shares | Weighted Average Grant & Exercise Price | Shares | Weighted Average Grant & Exercise Price | |||||||||||
Balance at June 30, 2007 | 1,016,000 | 861,000 | $ | 7.71 | 608,000 | $ | 6.91 | |||||||
Granted at market | (167,000 | ) | 167,000 | 14.70 | — | — | ||||||||
Cancelled | 21,000 | (21,000 | ) | 11.79 | — | — | ||||||||
Exercised | — | (29,000 | ) | 7.61 | — | — | ||||||||
Balance at June 28, 2008, not including RSAs | 870,000 | 978,000 | $ | 8.82 | 687,000 | $ | 7.26 | |||||||
RSAs Granted at market | (17,000 | ) | n.a. | n.a. | n.a. | n.a. | ||||||||
Balance at June 28, 2008, net of RSA grants | 853,000 | 978,000 | $ | 8.82 | 687,000 | $ | 7.26 | |||||||
Stock options: | ||||||||||||||
Granted at market | (239,000 | ) | 239,000 | 15.26 | — | — | ||||||||
Cancelled | 1,000 | (1,000 | ) | 14.73 | — | — | ||||||||
Exercised | — | (62,000 | ) | 5.89 | — | — | ||||||||
Balance at June 27, 2009, not including RSAs | 615,000 | 1,154,000 | $ | 10.28 | 775,000 | $ | 8.17 | |||||||
RSAs Granted at market | (17,000 | ) | n.a. | n.a. | n.a. | n.a. | ||||||||
Balance at June 27, 2009, net of RSAs | 598,000 | 1,154,000 | $ | 10.28 | 775,000 | $ | 8.17 | |||||||
Stock options: | ||||||||||||||
Granted at market | (182,000 | ) | 182,000 | 9.87 | — | — | ||||||||
Cancelled | 25,000 | (25,000 | ) | 9.27 | — | — | ||||||||
Exercised | — | (9,000 | ) | 6.43 | — | — | ||||||||
Balance at July 3, 2010, not including RSAs | 441,000 | 1,302,000 | $ | 10.27 | 915,000 | $ | 9.25 | |||||||
RSAs Granted at market | (37,000 | ) | n.a. | n.a. | n.a. | n.a. | ||||||||
Balance at July 3, 2010, net of RSAs | 404,000 | 1,302,000 | $ | 10.27 | 915,000 | $ | 9.25 | |||||||
The aggregate intrinsic value for options outstanding and options exercisable at July 3, 2010, was approximately $283,000. The aggregate intrinsic value for options exercised during Fiscal 2010, Fiscal 2009 and Fiscal 2008 was $23,000, $429,000 and $209,000, respectively. The weighted average remaining contractual terms for options outstanding and options exercisable at July 3, 2010 were approximately 4.9 years and 4.7 years, respectively. The total fair value of options vested during Fiscal 2010, Fiscal 2009 and Fiscal 2008 was $768,000, $573,000 and $416,000, respectively. The weighted average fair value of stock options granted during Fiscal 2010, Fiscal 2009 and Fiscal 2008 was $3.17, $4.88 and $4.47, respectively. The total number of options not yet vested as of July 3, 2010 and June 27, 2009, was 387,000 shares and 380,000 shares, respectively with a weighted average exercise price of $12.67 and $14.59, respectively.
19. Income Taxes:
The Company is subject to income taxes in the U.S. federal jurisdiction, and various U.S. states’ jurisdictions. Tax regulations within each jurisdiction are subject to the interpretation of the related tax laws and
F-27
Table of Contents
Nobel Learning Communities, Inc. and Subsidiaries
Notes to Consolidated Financial Statements—(Continued)
regulations and require significant judgment to apply. With few exceptions, the Company is no longer subject to U.S. federal, state and local income tax examinations by tax authorities for the years before Fiscal 2005.
The Company recognizes the financial statement benefit of a tax position only after determining that the relevant tax authority would more likely than not sustain the position following an audit. For tax positions meeting the more-likely-than-not threshold, the amount recognized in the financial statements is the largest benefit that has a greater than 50 percent likelihood of being realized upon ultimate settlement with the relevant tax authority. During Fiscal 2008, the Company recognized approximately a $44,000 increase in the liability for unrecognized tax benefits, which was accounted for as an increase to the July 1, 2007 accumulated deficit balance. Also during Fiscal 2008, the Company recognized $21,000 of expense related to accrued interest and penalties in regard to unrecognized tax benefits. Additionally, during Fiscal 2008, the Company reduced its state net operating loss carry-forwards and the corresponding valuation allowance by $1,392,000. At July 3, 2010 and June 27, 2009, there were no remaining unrecognized tax benefits included on the Company’s balance sheet as the statutes of limitations related to the items previously recorded have expired.
The provision for income taxes attributable to income before income taxes consisted of the following (dollars in thousands):
| For the Fiscal Years | |||||||||||
| 2010 | 2009 | 2008 | |||||||||
Current tax provision | |||||||||||
Federal | $ | 1,608 | $ | 3,249 | $ | 4,002 | |||||
State | 227 | 449 | 542 | ||||||||
Total | 1,835 | 3,698 | 4,544 | ||||||||
Deferred tax provision | |||||||||||
Federal | (109 | ) | (67 | ) | 68 | ||||||
State | (15 | ) | (9 | ) | 9 | ||||||
Total | (124 | ) | (76 | ) | 77 | ||||||
Income tax expense | $ | 1,711 | $ | 3,622 | $ | 4,621 | |||||
Reconciliation between the statutory federal income tax rate and the effective income tax rates on income before income taxes is as follows (dollars in thousands):
| For the Fiscal Years | |||||||||
| 2010 | 2009 | 2008 | |||||||
U.S. federal statutory rate | $ | 1,499 | $ | 3,182 | $ | 4,070 | |||
State taxes, net of federal tax benefit | 212 | 440 | 551 | ||||||
Goodwill and other non deductible expenses | — | — | — | ||||||
| $ | 1,711 | $ | 3,622 | $ | 4,621 | ||||
F-28
Table of Contents
Nobel Learning Communities, Inc. and Subsidiaries
Notes to Consolidated Financial Statements—(Continued)
Deferred income taxes reflect the impact of temporary differences between amounts of assets and liabilities for financial reporting purposes and such amounts as measured by tax laws. Temporary differences and carry- forwards that give rise to a significant portion of deferred tax assets and (liabilities) are as follows (dollars in thousands):
| As of | ||||||||||||||
| July 3, 2010 | June 28, 2008 | |||||||||||||
| Deferred tax assets (liabilities) | ||||||||||||||
| Current | Long Term | Current | Long Term | |||||||||||
Goodwill amortization and impairments | $ | — | $ | (9,036 | ) | $ | — | $ | (6,521 | ) | ||||
Fixed asset depreciation and impairments | — | 4,246 | — | 3,939 | ||||||||||
Closed school lease reserves | — | 211 | — | 264 | ||||||||||
Stock option and deferred compensation | — | 1,832 | — | 1,430 | ||||||||||
Deferred rent expense | — | 305 | — | 563 | ||||||||||
Gain on settlement of contract | — | 11 | — | 22 | ||||||||||
Mark-to-Market on Swap contracts | — | 39 | — | 99 | ||||||||||
Prepayments, accruals and reserves | 749 | 59 | 443 | 62 | ||||||||||
| $ | 749 | $ | (2,333 | ) | $ | 443 | $ | (142 | ) | |||||
As of July 3, 2010, the Company has utilized all previously generated state and federal net operating loss carry-forwards.
20. Employee Benefit Plans:
The Company has a 401(k) Plan in which eligible employees may elect to enroll after six months of service on scheduled enrollment dates. The Company matches 25% of an employee’s contribution to the Plan, up to 6% of the employee’s salary. The Company’s matching contributions under the Plan were $416,000, $411,000 and $389,000 for Fiscal 2010, Fiscal 2009 and Fiscal 2008, respectively.
The Company has a deferred compensation plan that permits certain members of management and highly compensated employees to defer up to 100% of their compensation and for identified individuals to receive a contribution from the Company. The Company’s contributions are made at the discretion of the Compensation Committee of the Company’s Board of Directors and are subject to a five-year vesting period subsequent to the employee’s initial plan participation date. At July 3, 2010 and June 27, 2009, the Company has included $1,281,000 and $850,000 in “Other long term liabilities” to reflect its liability under the plan, respectively. As of July 3, 2010 and June 27, 2009, there was $174,000 and $161,000 of unvested Company contributions to the deferred compensation plan, respectively. During Fiscal 2010, Fiscal 2009 and Fiscal 2008, the Company has recognized $293,000, $201,000 and $302,000 of general and administrative expense reflecting the prorated vesting of employer contributions into the plan, respectively.
In accordance with the SEC’s Staff Accounting Bulletin No. 108, “Considering the Effects of Prior Year Misstatements when Quantifying Misstatements in Current Year Financial Statements” (“SAB 108”), during Fiscal 2009, the Company recorded an adjustment of $266,000 reducing the deferred compensation liability and reducing general and administrative expense for Fiscal 2009. This adjustment to the Company’s financial statements was immaterial both as it related to Fiscal 2009 as well as each of the periods from the inception of the deferred compensation plan. In evaluating materiality and determining the appropriateness of applying SAB 108 to this error, the Company considered materiality both qualitatively and quantitatively as prescribed by the SEC’s Staff Accounting Bulletin No. 99.
F-29
Table of Contents
Nobel Learning Communities, Inc. and Subsidiaries
Notes to Consolidated Financial Statements—(Continued)
The Company has established a rabbi trust fund to finance the obligations under the plan with corporate owned whole life insurance contracts on certain individuals who are participants in the plan. At July 3, 2010 and June 27, 2009, there were two individuals, both employees of the Company. At July 3, 2010 and June 27, 2009, the total carrying value of the two policies was $13,400,000. The Company has included $1,238,000 and $1,021,000 in “Deposits and other assets” as of July 3, 2010 and June 27, 2009, respectively, which represents the cash surrender value of these policies. Premiums for Fiscal 2011 through Fiscal 2016 are expected to be approximately $50,000 per year, but will fluctuate based upon funding levels of the plan.
21. Commitments and Contingencies:
The United States Department of Justice (Disability Rights Section of the Civil Rights Division) filed a lawsuit on April 29, 2009 in the U.S. District Court for the Eastern District of Pennsylvania against the Company alleging that the Company violated Title III of the Americans with Disabilities Act of 1990 by excluding children with disabilities from its schools and programs. The complaint seeks an unspecified amount in compensatory damages and civil penalties, as well as declaratory and injunctive relief.
The Company is not able at this time to estimate the range of loss, if any, arising out of this matter since its outcome is uncertain. Although it does not expect that the resolution of the matter will have a material adverse effect on its financial condition, results of operations or cash flows, there can be no assurances in this regard.
The Company is engaged in other legal actions arising in the ordinary course of its business. The Company currently believes that the ultimate outcome of all such pending matters will not have a material adverse effect on the Company’s consolidated financial statements, although the significance of these pending matters on the Company’s future operating results and cash flows depends on the level of future results of operations and cash flows, as well as on the timing and amounts, if any, of the ultimate outcome.
The Company carries property, fire and other casualty insurance on its schools and general liability insurance in amounts which management believes are adequate. As is the case with other entities in the education and preschool industry, the Company cannot effectively insure itself against certain risks inherent in its operations. Some forms of child abuse coverage have insurance sublimits per claim in the general liability coverage.
22. Related Party Transactions:
There were no related party transactions for the periods included in this Form 10-K.
F-30
Table of Contents
Nobel Learning Communities, Inc. and Subsidiaries
Notes to Consolidated Financial Statements—(Continued)
23. Segment Information:
The Company’s operations are organized into the following operating segments:
| (1) | Private Pay Schools includes a national network of nonsectarian private schools, including preschools, elementary schools, middle schools and specialty high schools in 15 states and the District of Columbia. Other includes corporate overhead expenses which primarily support the Private Pay Schools operations. |
| (2) | The Laurel Springs School is a global K-12 online distance learning school headquartered in Ojai, California which includes students in all fifty United States and a number of other countries. The Laurel Springs School was acquired during September of Fiscal 2010. |
| Fiscal 2010 | Fiscal 2009 | Fiscal 2008 | ||||||||||||||
| Private Schools & Other | Laurel Springs School | Total | Private Schools & Other | Private Schools & Other | ||||||||||||
Total revenue | $ | 225,279 | $ | 6,756 | $ | 232,035 | $ | 220,103 | $ | 204,201 | ||||||
Depreciation and amortization: | ||||||||||||||||
Continuing operations | $ | 9,063 | $ | 906 | $ | 9,969 | $ | 9,668 | $ | 7,200 | ||||||
Discontinued operations | 25 | — | 25 | 419 | 120 | |||||||||||
Total depreciation and amortization | $ | 9,088 | $ | 906 | $ | 9,994 | $ | 10,087 | $ | 7,320 | ||||||
Gross profit | $ | 24,730 | $ | 4,166 | $ | 28,896 | $ | 28,984 | $ | 30,651 | ||||||
Interest expense | 1,571 | — | 1,571 | 981 | 475 | |||||||||||
Income tax expense (benefit) | 1,732 | (21 | ) | 1,711 | 3,622 | 4,621 | ||||||||||
Net income | 1,905 | (33 | ) | 1,872 | 4,564 | 7,678 | ||||||||||
Total additions to property, plant and equipment | 5,233 | 292 | 5,525 | 7,450 | 8,122 | |||||||||||
Intangible assets excluding goodwill | 4,751 | 3,311 | 8,062 | 6,725 | 7,080 | |||||||||||
Goodwill | 73,996 | 9,279 | 83,275 | 71,489 | 65,223 | |||||||||||
Segment assets | ||||||||||||||||
Continuing operations | $ | 118,676 | $ | 13,998 | $ | 132,674 | $ | 117,681 | $ | 111,052 | ||||||
Discontinued operations | 1,722 | — | 1,722 | 1,894 | 2,096 | |||||||||||
Total Assets | $ | 120,398 | $ | 13,998 | $ | 134,396 | $ | 119,575 | $ | 113,148 | ||||||
F-31
Table of Contents
Nobel Learning Communities, Inc. and Subsidiaries
Notes to Consolidated Financial Statements—(Continued)
24. Quarterly Results of Operations (unaudited):
The following table shows certain unaudited financial information for the Company for the interim periods indicated. The unaudited financial information has been prepared by the Company pursuant to the rules and regulations of the Securities and Exchange Commission and, in the opinion of management, includes all adjustments, consisting of normal recurring adjustments, necessary to present fairly the Company’s financial position. Quarterly results may vary from year to year depending on the timing and amount of revenues and costs associated with new school development and acquisitions. (dollars in thousands, except per share data):
Quarterly Results Adjusted for Discontinued Operations | ||||||||||||||||||||||||||||||||
| First Quarter | Second Quarter | Third Quarter | Fourth Quarter | |||||||||||||||||||||||||||||
| 2010 | 2009 | 2010 | 2009 | 2010 | 2009 | 2010 | 2009 | |||||||||||||||||||||||||
Revenues | $ | 50,623 | $ | 50,903 | $ | 58,593 | $ | 55,872 | $ | 60,188 | $ | 56,918 | $ | 62,631 | $ | 56,410 | ||||||||||||||||
Gross profit | 3,144 | 4,972 | 8,417 | 8,803 | 8,366 | 8,708 | 8,969 | 6,501 | ||||||||||||||||||||||||
Income (loss) from continuing operations, net of tax | (1,232 | ) | (128 | ) | 1,395 | 2,358 | 1,231 | 2,544 | 1,312 | 959 | ||||||||||||||||||||||
Income (loss) from discontinued operations, net of tax | (200 | ) | (230 | ) | (377 | ) | (239 | ) | (73 | ) | (207 | ) | (184 | ) | (493 | ) | ||||||||||||||||
Net income (loss) | $ | (1,432 | ) | $ | (358 | ) | $ | 1,018 | $ | 2,119 | $ | 1,158 | $ | 2,337 | $ | 1,128 | $ | 466 | ||||||||||||||
Basic loss per share | ||||||||||||||||||||||||||||||||
Continuing operations | $ | (0.12 | ) | $ | (0.01 | ) | $ | 0.13 | $ | 0.23 | $ | 0.12 | $ | 0.24 | $ | 0.12 | $ | 0.09 | ||||||||||||||
Discontinued operations, net of tax | (0.02 | ) | (0.02 | ) | (0.04 | ) | (0.02 | ) | (0.01 | ) | (0.02 | ) | (0.02 | ) | (0.05 | ) | ||||||||||||||||
Net income (loss) per common share | $ | (0.14 | ) | $ | (0.03 | ) | $ | 0.10 | $ | 0.21 | $ | 0.11 | $ | 0.22 | $ | 0.11 | $ | 0.04 | ||||||||||||||
Diluted income (loss) per share: | ||||||||||||||||||||||||||||||||
Continuing operations | $ | (0.12 | ) | $ | (0.01 | ) | $ | 0.13 | $ | 0.22 | $ | 0.12 | $ | 0.24 | $ | 0.12 | $ | 0.09 | ||||||||||||||
Discontinued operations | (0.02 | ) | (0.02 | ) | (0.04 | ) | (0.02 | ) | (0.01 | ) | (0.02 | ) | (0.02 | ) | (0.05 | ) | ||||||||||||||||
Net income (loss) per common share | $ | (0.14 | ) | $ | (0.03 | ) | $ | 0.10 | $ | 0.20 | $ | 0.11 | $ | 0.22 | $ | 0.11 | $ | 0.04 | ||||||||||||||
Net income per share totals may not sum due to rounding |
| |||||||||||||||||||||||||||||||
25. Subsequent Events:
The Company has evaluated subsequent events through the filing of this Annual Report on Form 10-K and has determined that there have not been any events that have occurred that would require adjustments to or additional disclosures in the audited consolidated financial statements.
F-32