Exhibit (c)(ii)
American Bancorp, Inc.
Opelousas, LA
Fairness Opinion
February 11, 2004

P.O. Box 14720
Baton Rouge, Louisiana 70898
(225) 757-1200
fax (225) 765-7200
| 1 | Introduction | 1 | ||||||
| 1.1 | Description of the Engagement | 1 | ||||||
| 1.2 | Standard of Value | 1 | ||||||
| 1.3 | Summary of the Company | 1 | ||||||
| 1.4 | Sources of Information | 1 | ||||||
| 1.5 | Assumptions and Limiting Conditions | 2 | ||||||
| 2 | Economic Conditions and Industry Data | 2 | ||||||
| 2.1 | National Economic Profile | 2 | ||||||
| 2.2 | Regional and Local Economic and Demographic Profile | 3 | ||||||
| 2.3 | Industry Conditions | 3 | ||||||
| 3 | Analysis of the Subject Company | 4 | ||||||
| 3.1 | General Description | 4 | ||||||
| 3.2 | Management | 4 | ||||||
| 3.3 | Competition | 4 | ||||||
| 3.4 | Facilities | 5 | ||||||
| 4 | Financial Statement Analysis | 5 | ||||||
| 4.1 | Historical Financial Statements | 5 | ||||||
| 4.2 | Comparative Statistics | 5 | ||||||
| 4.2.1 | Uniform Bank Performance Report | 5 | ||||||
| 4.3 | Normalizing Adjustments | 6 | ||||||
| 4.3.1 | Holding Company Adjustments | 6 | ||||||
| 4.3.2 | Income Tax Adjustment | 6 | ||||||
| 5 | Valuation of the Subject Company | 7 | ||||||
| 5.1 | Factors to be Considered | 7 | ||||||
| 5.2 | Valuation Approaches | 7 | ||||||
| 5.3 | Asset Based Approaches | 8 | ||||||
| 5.4 | Market Based Approach—Comparable Transactions | 8 | ||||||
| 5.4.1 | Comparable Sales—Whole Bank Transactions | 8 | ||||||
| 5.4.2 | Publicly Traded Comparable Companies | 9 | ||||||
| 5.4.3 | Publicly Traded Comparable Companies—Share Exchange | 9 | ||||||
| 5.4.4 | Historical Transactions in Company Stock | 10 | ||||||
| 5.5 | Income Based Approaches | 10 | ||||||
| 5.5.1 | Discounted Future Returns | 10 | ||||||
| 5.5.2 | Capitalization of Historical Earnings | 11 | ||||||
| 6 | Valuation Adjustments | 11 | ||||||
| 6.1 | Common Adjustments | 11 | ||||||
| 6.2 | Control Premium/Minority Discount | 12 | ||||||
| 6.2.1 | The Minority Stockholder's Situation | 12 | ||||||
| 6.2.2 | Control Premium | 13 | ||||||
| 6.3 | Marketability Adjustment | 14 | ||||||
| 6.4 | Application of Adjustments | 14 | ||||||
| 7 | Valuation Conclusion | 15 | ||||||
| 8 | Valuator's Certification | 15 | ||||||
| 9 | Valuator's Qualifications | 16 | ||||||
i
1.1 Description of the Engagement
National Capital, L.L.C. ("National Capital") has been engaged to provide a Fairness Opinion to American Bancorp, Inc. (the "Company") in connection with the Company's proposed merger with American Interim Company, a wholly-owned subsidiary of the Company. The transaction is intended to reduce the number of shareholders of common stock of the Company to fewer than 75, thereby allowing the Company to elect to be taxed as a Subchapter S corporation for federal income tax purposes and to terminate the registration of its common stock under the Securities Exchange Act of 1934. Under this plan, certain shareholders of the Company will receive cash for their shares in an involuntary exchange. Our Fairness Opinion addresses the fairness of the cash consideration to be paid to these shareholders, from the perspective of all shareholders of the Company.
1.2 Standard of Value
Revenue Ruling 59-60 defines fair market value as:
…the price at which the property would change hands between a willing buyer and a willing seller when the former is not under any compulsion to buy and the latter is not under any compulsion to sell, both parties having reasonable knowledge of relevant facts. Court decisions frequently state in addition that the hypothetical buyer and seller are assumed to be able, as well as willing, to trade and to be well informed about the property and concerning the market for such property.
For the purpose of this engagement, Fair Market Value is not appropriate due to the involuntary surrender of certain shareholders' interests in exchange for cash that will occur as part of the reverse stock split. Fair Market Value is, however, an appropriate starting point from which to define a standard of value that acknowledges the premium due to an involuntary participant in a transaction. The concept of Fair Value, while not well defined in Louisiana case law, can be described as Fair Market Value without the phrase "not under any compulsion to sell". As the seller is being forced to transact, some incremental value is generally recognized to be appropriate as compensation for the involuntary nature of the transaction. This incremental value is often recognized in the valuation process through the exclusion of all or part of the minority discount usually applied to minority shareholder interests under the Fair Market Value standard.
Fair Value will be used as the standard of value when considering the fairness of the proposed transaction.
1.3 Summary of the Company
The Company is the holding company for American Bank & Trust Company (the "Bank"), a community bank servicing the banking needs of consumers and businesses in the Opelousas, Louisiana area. Detailed corporate information can be found in Section 3: Analysis of the Subject Company.
1.4 Sources of Information
In preparing this valuation report, we obtained various financial documents and other information pertaining to the Company and Bank from its management. We have considered, among other items, the following:
- 1.
- The Bank's Call Reports for the years ended December 31, 1997 through 2003;
- 2.
- The Bank's Uniform Bank Performance Report ("UBPR") dated September 30, 2003;
- 3.
- The Company's Annual Report to Shareholders for the years ended December 31, 2001 and 2002, including the Company's audited financial statements;
1
- 4.
- The Company's SEC form 10-K for the year ended December 31, 2002; and
- 5.
- The Company's Business Plan and current financial projections.
In addition to the information provided by the Company, we reviewed and analyzed a number of public documents and databases, including the following:
- 1.
- Federal Reserve Board Beige Book dated January 14, 2004; (www.federalreserve.gov/fomc/BeigeBook);
- 2.
- Stocks, Bonds, Bills and Inflation: Valuation Edition 2002 Yearbook; Ibbotson Associates, 2003; and
- 3.
- Numerous internet resources, including the sites maintained by the following:
Federal Reserve Bank of Atlanta (www.frbatlanta.org), Federal Deposit Insurance Corporation (www.fdic.gov), and SNL Financial (www.snl.com andwww.ymerge.com).
1.5 Assumptions and Limiting Conditions
This valuation report is subject to the following assumptions and limiting conditions:
- 1.
- All financial information was supplied by the Company or its agents. This information has been accepted by National Capital as having been prepared in accordance with generally accepted accounting principles and has not been subject to further verification, except as otherwise described in this report.
- 2.
- National Capital has relied on the accuracy and completeness of all information provided by the Company and its agents. Any material misstatements or omissions could significantly alter our conclusion of value.
- 3.
- Except as noted herein, no attempts were made to verify the validity of the information provided by or obtained from any external source. All thirdparty sources are considered reputable providers of accurate data.
- 4.
- No verification of legal title has been conducted in relation to the real and personal property of the Company. All rights and claims to these assets are assumed to be valid and no consideration has been given to any liens or encumbrances other than those specifically identified in this report.
- 5.
- All liabilities of the Company are assumed valid and legally enforceable. No consideration has been given to contingent liabilities except as specifically identified in this report.
- 6.
- This report and conclusion of value are for the specific use identified in Section 1.1, and may not be quoted in whole or in part or otherwise referred to in any document, or furnished or otherwise communicated to any person for any other purpose without our prior written consent.
- 7.
- This fairness opinion and report are limited only by the above factors and reflect the unbiased, professional opinion of National Capital.
2 Economic Conditions and Industry Data
2.1 National Economic Profile
The Federal Reserve Board Beige Book discussing the current U.S. economic outlook is included as Exhibit A.
2
2.2 Regional and Local Economic and Demographic Profile
Additional information on the regional and local economy is included as Exhibit B.
2.3 Industry Conditions
Sales of banks and bank holding companies have slowed in recent years, dropping to levels not seen since the early 1990s. Much of this decrease is attributable to the lack of attractive acquisition candidates and the shift in focus of many mid-size acquirors toward selling or merging with other institutions.
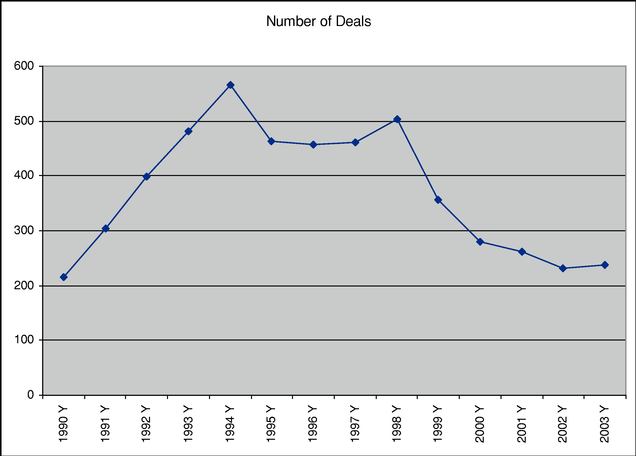
Over the last fourteen years, bank pricing has seen several peaks and valleys, as shown in the following graph. In 2003, we saw a return to relatively high pricing multiples, along with an increase in earning multiples as compared to book multiples.
3
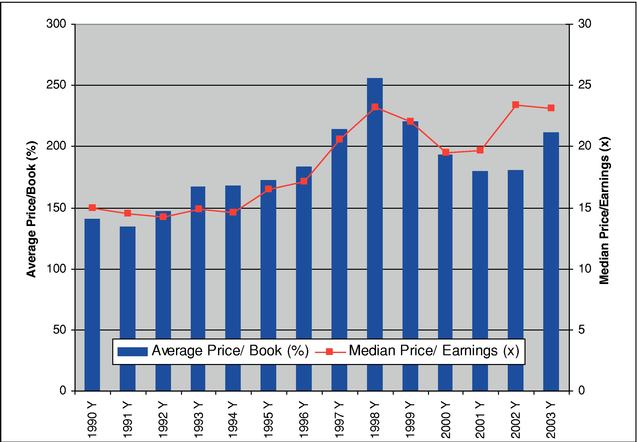
Please refer to Exhibit C for additional information on industry conditions.
3 Analysis of the Subject Company
3.1 General Description
American Bank & Trust Company is a full service provider of financial services for consumers and businesses with five offices in St. Landry Parish and one location in Lafayette Parish. The Bank, founded in 1958, currently has over $100 million in total assets.
The Company had 10,000,000 shares of common stock authorized as of the valuation date, with 120,000 shares issued and 115,987 shares outstanding. There are a total of 503 shareholders.
3.2 Management
Mr. Salvador L. Diesi, Sr., age 73, is the President, and has been with the Bank for 20 years. Mr. Ronald J. Lashute, age 53, serves as the Bank's Executive Vice President and Chief Executive Officer. Mr. Lashute has worked for the Bank for 31 years. Executive Management is considered sufficient for the current and future needs of the Bank.
3.3 Competition
Competition within the industry comes from many different sources: national and state chartered banks, credit unions, savings banks, investment companies and non-traditional lenders. Over the past twenty years, the share of the average consumer's wealth held in commercial banks has steadily declined.
4
Statistical information on the Bank's market and competitors is included as Exhibit D.
3.4 Facilities
The Bank operates from a main office located at Union and Landry Streets, Opelousas, Louisiana. It has one other full-service office in Opelousas, and offices in Krotz Springs, Port Barre and Lawtell in St. Landry Parish, as well as the Lafayette office. There is also an operations center located next to the main office. All facilities are considered adequate for current and future operations of the Bank.
4 Financial Statement Analysis
4.1 Historical Financial Statements
The table below summarizes pertinent financial information of the Bank.
American Bank & Trust Company
Financial Summary
| | 2003 | 2002 | 2001 | 1999 | CAGR | ||||||
|---|---|---|---|---|---|---|---|---|---|---|---|
| Total Loans | 39,972 | 40,558 | 38,241 | 32,660 | 5.18 | % | |||||
| Total Assets | 100,781 | 99,653 | 92,041 | 82,749 | 5.05 | % | |||||
| Total Deposits | 85,638 | 84,842 | 78,711 | 71,345 | 4.67 | % | |||||
| Loan Loss Reserve | 667 | 627 | 605 | 580 | 3.56 | % | |||||
Loans to Deposits | 46.68 | % | 47.80 | % | 48.58 | % | 45.78 | % | |||
| Reserve to Loans | 1.67 | % | 1.55 | % | 1.58 | % | 1.78 | % | |||
| Return on Assets | 1.00 | % | 1.29 | % | 1.25 | % | 1.47 | % | |||
Total Capital | 14,055 | 13,577 | 12,236 | 11,044 | 6.21 | % | |||||
Net Income | 1,006 | 1,290 | 1,149 | 1,217 | - -4.65 | % |
The Company's historical balance sheets and income statements for the years ended December 31, 1999 through 2003 are included as Exhibit E.
4.2 Comparative Statistics
4.2.1 Uniform Bank Performance Report
The Uniform Bank Performance Report (UBPR) is an analytical tool created for bank supervisory, examination, and management purposes. In a concise format, it shows the impact of management decisions and economic conditions on a company's performance and balance sheet composition. The performance and composition data contained in the report can be used as an aid in evaluating the adequacy of earnings, liquidity, capital, asset and liability management, and growth management. Bankers and examiners alike can use this report to further their understanding of a company's financial condition, and through such understanding, perform their duties more effectively.1 Some of the key ratios are presented below.
5
- 1
- Federal Financial Institutions Examination Council website (http://www.ffiec.gov/UBPR.htm)
UBPR
| | 9/30/2003 | |||||||
|---|---|---|---|---|---|---|---|---|
| | AMBO | Peer | Percentile | |||||
| Capital Adequacy | ||||||||
| Tier One Risk-Based Capital/Risk-Weighted Assets | 28.90 | 13.34 | 96 | |||||
| Total Risk-Based Capital/Risk-Weighted Assets | 30.16 | 14.50 | 96 | |||||
| Tier One Leverage Capital | 14.09 | 8.98 | 94 | |||||
Asset Quality | ||||||||
| Past Due Loans/Total Loans: | 0.99 | 0.97 | 58 | |||||
| Nonaccrual/Total Loans | 0.01 | 0.66 | 19 | |||||
| 90+ Days Past Due/Total Loans | 0.99 | 0.21 | 89 | |||||
| 30-89 Days Past Due/Total Loans | 1.18 | 1.12 | 59 | |||||
| Net Loan Losses/Average Total Loans & Leases | 0.00 | 0.19 | 22 | |||||
Management | ||||||||
| Average Earning Assets/Average Assets | 92.62 | 91.43 | 61 | |||||
| Personnel Expense/Average Assets | 1.63 | 2.00 | 20 | |||||
| Total Overhead Expense/Average Assets | 3.34 | 3.75 | 35 | |||||
| Asset Growth Rate | 5.60 | 9.17 | 48 | |||||
Earnings | ||||||||
| Return on Assets (Net Income/Average Assets) | 1.11 | 0.87 | 67 | |||||
Liquidity | ||||||||
| Net Short Term Non-Core Funding Dependence | (0.14 | ) | 1.02 | 38 | ||||
| Net Noncore Funding Dependence | 0.13 | 7.84 | 25 | |||||
| Net Loans/Total Deposits | 47.73 | 75.36 | 6 | |||||
| Net Loans/Core Deposits | 53.47 | 88.01 | 6 | |||||
| Net Loans/Assets | 40.22 | 64.49 | 6 | |||||
| Core Deposits/Assets | 75.87 | 73.94 | 56 | |||||
4.3 Normalizing Adjustments
Given the highly regulated nature of the banking industry, there are few normalizing adjustments to be considered when valuing a financial institution. For purposes of this valuation, the following normalizing adjustments were made.
4.3.1 Holding Company Adjustments
For the purposes of this valuation, we considered the financial information of the Bank, as there are no operations and limited expenses at the holding company level. We reduced the Bank's pretax income by $13,000 to consider ongoing holding company expenses, resulting in pretax income of $1,246,000. We also considered the holding company's equity of $14,069,647 and cash dividend of $231,974 for valuation purposes.
4.3.2 Income Tax Adjustment
The Bank's income tax liability in 2003 was reduced by $79,703 due to overpayments in previous years. We increased income tax by this amount, thereby reducing the Company's net income. Total net income for valuation purposes, after these adjustments, was $913,297.
6
5 Valuation of the Subject Company
5.1 Factors to be Considered
Discussing the valuation process, Revenue Ruling 59-60 states:
In valuing the stock of closely held corporations or the stock of corporations where market quotations are not available, all other available financial data, as well as all relevant factors affecting the fair market value must be considered for estate tax and gift tax purposes. No general formula may be given that is applicable to the many different valuation situations arising in the valuation of such stock.
Revenue Ruling 59-60 also outlines the following factors that "require careful analysis" in business valuations:
- 1.
- The nature of the business and the history of the enterprise from its inception.
- 2.
- The economic outlook in general and the condition and outlook of the specific industry in particular.
- 3.
- The book value of the stock and the financial condition of the business.
- 4.
- The earning capacity of the company.
- 5.
- The dividend-paying capacity of the company.
- 6.
- Whether or not the enterprise had goodwill or other intangible value.
- 7.
- Sales of the stock and the size of the block of stock to be valued.
- 8.
- The market price of stocks of corporations engaged in the same or a similar line of business having their stocks actively traded in a free and open market, either on an exchange or over-the-counter.
Each of these factors is addressed in this valuation report.
5.2 Valuation Approaches
There are three main categories of valuation methods: Asset Based Approaches, Market Based Approaches and Income Based Approaches. Each method examines the value of a subject entity from a slightly different perspective, and each method has its own strengths and weaknesses in general and in specific application. In most cases, the values determined by each method will differ as a result of the varying inputs and assumptions required under each approach. It is up to the analyst to determine which method provides the most accurate value of the subject.
Methods within the Asset Based Approaches presume that the value of the subject entity is represented by the market values of the assets owned by the entity, less the market value of any liabilities. Thenet asset value method assumes that the values of all assets are realized through the course of normal business operations, while theliquidation method assumes that all assets are liquidated in an orderly fashion.
Thecomparative transaction method represents the common application of the Market Based Approach. By using one or more sets of statistics drawn from comparable completed whole-entity sales (public company mergers and acquisitions, private transactions) and/or partial interest transactions (publicly-traded stocks, mutual funds, partnership interests, REITs, etc.), the value of the subject can be estimated using multiples of the subject's revenues, earnings, dividends, cash flow, capital or other relevant financial attributes. In addition, historical information on actual transactions in the subject's stock can provide highly valuable information as to the true value of the subject, provided that the transactions were conducted at arm's length and occurred in the relatively recent past.
7
Within the Income Based Approaches, methods are differentiated based on the use of historical or projected income streams. Under thecapitalized returns method, an estimation of value is based on historical data. This method is most suitable for use when the subject's recent historical normalized returns can be reasonably expected to continue into the future and can be expected to grow at a predictable rate. By contrast, thediscounted future returns method is based on the present value of expected future earnings. This method is more applicable if the subject's earnings fluctuate greatly, if the subject has no history of earnings, or if the subject has recently undergone major changes in operating characteristics. Both of these methods require a reasonable and supportable estimation of future earnings prospects.
5.3 Asset Based Approaches
The Company's tangible equity totaled $14.1 million as of December 31, 2003. Assuming that all of the Company's assets and liabilities are carried at or near their reasonable market values, this amount should be the minimum at which the whole Company should be sold. At any lower value, the current owners could liquidate the Company and walk away with over $14 million, less the cost of liquidation.
In reality, FDIC-insured financial institutions are rarely liquidated except in cases of near failure. These failure situations are usually a result of long-term mismanagement, highrisk lending practices and/or illegal activity (fraud, embezzlement, etc.). Further, this liquidation method is not an appropriate method to consider in the valuation of an ongoing entity.
5.4 Market Based Approach—Comparable Transactions
The comparable transactions method is based on the financial theory of substitution or economic indifference. By obtaining data related to actual sales transactions of similar entities or interests and making appropriate adjustments to recognize the differences between the subject and its comparables, an estimate of the market value of the subject can be obtained.
The selection of financial attributes to be valued and the selection of appropriate comparables are critical in developing a market-based valuation estimate. While this method can be extremely useful due to its use of actual transaction data as a source of value determination, it is often difficult (or even impossible) to find truly comparable companies that have sold or that are traded in a public market. It should be noted that comparables do not have to be identical to the subject company, but should be similar enough to withstand scrutiny. Courts have criticized valuators for excluding reasonably comparable entities from consideration and have also objected to the use of transaction data that was drawn from too wide a set of comparables, which were, in fact, incomparable.
The following methods were used to develop comparable-based valuations:
5.4.1 Comparable Sales—Whole Bank Transactions
The SNL DataSource database provides detailed information on whole bank transactions and allows for searches based on multiple criteria. The criteria used in this valuation were:
| | From | To | |||||
|---|---|---|---|---|---|---|---|
| Seller Total Assets | $ | 50MM | $ | 250MM | |||
Return On Assets | 0.50 | % | 1.50 | % | |||
Tangible Equity/Assets | 9.0 | % | 20.0 | % | |||
Transaction Announced | 2/10/2003 | 2/9/2004 | |||||
8
Terminated transactions and transactions where material data was unavailable were excluded from the analysis. A complete listing of the transaction dataset is included in Exhibit F.
| Number of Transactions | 24 |
| | Multiple | ||
|---|---|---|---|
| Price/Earnings | 21.73 | ||
| Price/Tangible Book* | 169.60 | % | |
| Price/Assets | 20.20 | % | |
| Price/Deposits | 23.16 | % | |
| Premium/Core Deposits | 13.99 | % |
*—We adjusted the Company's tangible equity to the level of that of the peer group, multiplied the price/tangible book multiple to this adjusted level, and added the excess equity dollar for dollar.
By applying the median of key valuation factors to the relevant factors from the Company's financials, we determined an entity value, before appropriate adjustments, of $21,679,854. Exhibit F includes details of this valuation process.
5.4.2 Publicly Traded Comparable Companies
Exhibit G shows a comparison of certain financial data of 13 publicly traded bank holding companies located in Louisiana or Mississippi. These publicly traded companies were selected based on their asset size and location. We have carefully considered each guideline company and its similarity or difference to the Company in terms of business, size, and financial and operating characteristics. All of these companies have a market presence in one or more metropolitan area in the two states, and some of them may be direct competitors of the Company. When viewed together, they serve as a guideline for expected returns, capital market pricing and financial data of related segments of the banking industry. We have, therefore, determined that the guideline companies are sufficiently similar to the Company to permit their utilization in a valuation pricing model. The median pricing multiples of the group are shown below.
| | Multiple | ||
|---|---|---|---|
| Price/Earnings | 15.65 | ||
| Price/Tangible Book* | 181.69 | % | |
| Price/Assets | 19.30 | % | |
| Price/Deposits | 25.54 | % | |
| Dividend Yield | 2.58 | % |
*—We adjusted the Company's tangible equity to the level of that of the peer group, multiplied the price/tangible book multiple to this adjusted level, and added the excess equity dollar for dollar.
By applying the median of key valuation factors to the relevant factors from the Company's financials, we determined an entity value, before appropriate adjustments, of $19,094,478.
5.4.3 Publicly Traded Comparable Companies—Share Exchange
The Publicly Traded Comparable Companies—Share Exchange Method is founded on the premise that a rational, publicly-traded potential buyer of a bank or bank holding company would be willing to execute a share exchange only if such an exchange would be non-dilutive (or minimally dilutive) to the acquirer's pro forma per share earnings.
9
We analyzed the earnings performance of the Company in light of the earnings performance and market values of the peer group of publicly traded bank holding companies discussed above. Based on size, financial strength, operating history and geographic proximity, it is reasonable to assume that each institution would be able to consummate a transaction with the Company.
Before analyzing the earnings performance of the Company in light of the share exchange analysis, we made an earnings adjustment of 25% to take into account an estimate of cost savings and other synergies that would be expected to result from the acquisition. After adjustment, we determined that the pro forma earnings estimate of the Company for the year ended December 31, 2004, would be approximately $1,500,000. To determine the implied share exchange market value of the Company, we calculated the average of the projected values that the regional peer group acquirors would pay for the Company in a non-dilutive transaction. To determine the individual projected values, we divided the Company's adjusted pro forma earnings by each acquiring company's estimated earnings per share for 2004 to determine the number of shares to be issued to the Company, and multiplied the number of shares to be issued by the acquiring company's price-earnings ratio. Using the share exchange analysis, we determined an implied share exchange market value of $22,125,704, prior to the application of appropriate valuation adjustments. Exhibit H illustrates the application of the share exchange analysis.
5.4.4 Historical Transactions in Company Stock
There have been several transactions involving Company stock in the last 18 months. The Company repurchases shares routinely, with the price set by the Board at 75% of book value. There were eight such transactions between June 2002 and December 2003, totaling 301 shares at prices between $79 and $89 per share. None of these transactions are considered "arm's length."
Additionally, some shares recently have been traded through market makers, who then publish the price on the OTC Bulletin Board. Information regarding these trades is not readily available to the Company; however, information on the OTC website and Yahoo Finance indicate that 1,600 shares were traded since June 1, 2002, at prices ranging from $90 to $150 per share. There have been no transactions since October 2003.
5.5 Income Based Approaches
5.5.1 Discounted Future Returns
As discussed in Section 5.2: Valuation Approaches, this method has as its basic premise the theory that a business is worth the present value of all the expected future benefits of ownership. Proper application of this theory requires the analyst to select the appropriate measure of return to the owner (cash flow vs. net earnings) and select the appropriate discount rate and/or capitalization rate to be applied to the selected measure of returns. The method also requires the analyst to make certain assumptions regarding prospective earnings and anticipated earnings growth rates.
The two primary components of the value estimate developed using the discounted future returns method are:
- •
- The present value of operations from the valuation date until a stable and sustainable level of growth and profit is established, and
- •
- The present value of the company's value in theterminal year, defined as the year after stable and sustainable growth and profit are established.
After projecting the future values of the Company, it is necessary to determine the present value of those future returns using a discount rate. The Ibbotson Buildup Method was used to determine this discount rate. Exhibit I includes a detailed description of the components of this rate.
10
Balance sheet and income statement projections were prepared by National Capital and reviewed by Company management. Dividends and cash flows from the sale of the Company at the terminal period were used as the appropriate measure of return. Future period dividends were projected at 70% of earnings. The selected payout ratio is based on the Company's earnings and growth projections and its ability to distribute this level of earnings without impairing capital adequacy. Based on this information, the value of the Company using the Discounted Future Returns Value, prior to the application of appropriate valuation adjustments, is $19,098,861. Exhibit I provides detailed calculations of this result.
5.5.2 Capitalization of Historical Earnings
Following much of the same logic as the Discounted Future Returns Method, the Capitalization of Historical Earnings relies on historical data rather than estimates of future performance as the basis for valuation. In many cases, courts have indicated a preference for the use of historical financial information due to the actual, verifiable nature of the data. While it has often been said that past performance is not always an indication of future results, the Historical Earnings Method can provide a reasonable indication of value, especially in cases where the subject company has a history of stable earnings or growth and such stability or growth can be reasonably expected to continue in a similar manner.
The Company has experienced a declining return on average assets over the last five years. As indicated in Exhibit J, a weighted trend line of earnings from 1999 through 2003 was used to establish the earnings level to be capitalized. The median Price/Earnings multiple of comparable public companies was used to calculate the appropriate capitalization rate.
After consideration of all appropriate factors, the value of the Company using the Capitalization of Historical Earnings method, prior to the application of appropriate valuation adjustments, is $19,325,602.
6 Valuation Adjustments
6.1 Common Adjustments
The purpose of a valuation adjustment is to reflect differences between the characteristics of the subject and those of the comparable dataset(s) from which the indications of value are derived. As valuations are based on the financial principle of substitution, these adjustments are an attempt to account for the varying degrees of risk associated with the subject interest vis a vis "comparable" investments.
The following adjustments were considered during the valuation process. Not all are applicable for the given situation, but all were reviewed for applicability. Those discounts considered appropriate are discussed in detail below.
- •
- Discount for trapped-in capital gains
- •
- Key person discount
- •
- Discount for known or potential environmental liability
- •
- Discount for pending litigation
- •
- Portfolio discount (for unattractive assemblage of assets)
- •
- Concentration of customer or supplier base
- •
- Voting vs. non-voting stock adjustment
11
- •
- Block discount
- •
- Control premium/minority discount
- •
- Marketability discount
- •
- Expectations premium
6.2 Control Premium/Minority Discount
6.2.1 The Minority Stockholder's Situation
Minority stock interests in a "closed" corporation are usually worth much less than the proportionate share of the assets to which they attach…2
- 2
- Cravens v.Welch, 10 Fed. Supp. 94 (1935)
The above statement, from a 1935 stock valuation case that is still widely quoted, captures the essence of the minority stockholder's situation. This revelation comes as a shock to many people, who may have always assumed that a partial interest is worth a pro rata portion of the value of the total enterprise.
H. Calvin Coolidge, a former bank trust officer with extensive experience in dealing with and selling (or attempting to sell) minority interests in closely held companies, presents a cogent summary of the minority stockholder's position.
The holder of a minority interest can at best elect only a minority of the directors, and for corporations chartered in states which do not permit cumulative voting, he may not be able to elect even one director. Lacking control of the board of directors, he cannot compel payment of dividends which must be declared equally and which would give him his pro rata share of earnings. Lacking control of the board of directors, he cannot compel his election as an officer or his employment by the corporation, which the holders of the controlling interest can do, often with resultant handsome compensation. In short, the holder of a minority interest has no voice in corporate affairs and is at the mercy of the holders of the controlling interest who have no reason to pay anything but a token dividend, if any, and no reason to buy out the minority holder except at a nominal price.
A willing buyer contemplating purchase from a willing seller of a minority interest, being under no compulsion to buy (which would exclude a buyer already owning some shares whose new purchase would cover control), would suffer the same disadvantage of lack of control. The buyer is asked to make an investment with no assurance as to the certainty of current yield or as to when, or the amount at which, he may be able to liquidate his investment. Regardless, therefore, of the value of 100% of the corporation, the buyer will not purchase a minority interest except at a discount from its proportionate share of the value of 100% of the corporation.3
- 3
- H. Calvin Coolidge, "Discount for Minority Interest: Rev. Rul. 79-7's Denial of Discount Is Erroneous,"Illinois Bar Journal 68 (July 1980), p. 744
The lack of concurrence between the value of stock and the corporation's underlying assets was clearly established by the U.S. Supreme Court back in 1925:
The capital stock of a corporation, its net assets, and its shares of stock are entirely different things…the value of one bears no fixed or necessary relation to the value of the other.4
12
- 4
- Ray Consol. Copper Co. v.United States, 45 S. Ct. 526 (1925)
An oft-cited U.S. Tax Court case quoted the above, adding:
This is particularly true as to minority interests in a closed corporation…5
- 5
- Drayton Cochran et al., 7 T.C.M. 325 (1948)
That minority shareholders often find themselves disadvantaged compared to controlling shareholders is attested to by the fact that the oft-quoted, lengthy, and scholarly two volume treatiseO'Neal's Oppression of Minority Shareholders is doing well in its second edition, published in 1985. In the preface to that edition, the authors comment on the growing amount of minority shareholder litigation:
Most American lawyers do not realize the tremendous amount of litigation in this country arising out of shareholder disputes. Since the publication of the first edition of this treatise, the volume of litigation grounded on minority shareholder oppression—actual, fancied, or fabricated—has grown enormously, and the flood of litigation shows no sign of abating. The increase in litigation has been pronounced in both federal and state courts, with an especially large number of suits challenging the validity of "cash-out" mergers. Also worthy of note is that in the last four or five years there has been a substantial increase in the number of suits minority shareholders have brought for involuntary dissolution of their corporation or to force majority shareholders to purchase their shares.6
- 6
- F. Hodge O'Neal and Robert B. Thompson,O'Neal's Oppression of Minority Shareholders,2nd ed., vol. 1 (Wilmette, Ill.: Callaghan & Company, 1985), p. iii. The termcash-out merger is sometimes used to mean asqueeze-out orfreeze-out merger, in which minority shareholders receive cash for their shares. They cannot block the merger or demand consideration other than cash. If they are not satisfied with the amount of cash offered, their remedy is to demand an appraisal of the stock under dissenter's appraisal rights statutes. See, for example,Roland International Corp. v.Najjar, 407 A.2d 1032, 1033 (Del. S. Ca. 1979)
6.2.2 Control Premium
Due to the involuntary nature of the subject transaction, no minority discount will be applied to valuation methods that initially yield a whole company value. For methods that initially yield a marketable minority value, we will attempt to remove the minority discount through the application of a control premium.
The precise determination of an appropriate minority discount (or inversely, control premium can be extremely difficult, if not impossible. Two major bodies of empirical evidence are often used to estimate minority discounts:7
- 7
- Pratt,Discounts and Premiums, p. 62
- 1.
- Prices at which controlling interests are acquired in the public market compared with the preannouncement minority stock trading prices, and
- 2.
- Prices at which holding company interests sell compared with their underlying net asset values.
- a.
- REITs
- b.
- SEC-registered limited partnership interests
- c.
- Closed-end mutual funds
We used the SNL DataSource to build a control premium / minority discount database based on all whole bank transactions announced in the past twelve months. This data yielded a median control premium of 24.82%.
13
Given the nature of the Company and the block of stock being valued and after consideration of the various discount studies and bodies of empirical evidence appropriate to this valuation, it is our determination that a control premium of 24.82% is appropriate in this situation. Please refer to Exhibit K for additional information.
6.3 Marketability Adjustment
Generally, minority interests in privately held corporations command significant marketability discounts due to the difficulty associated with liquidating such interests. Several of the key factors in determining the appropriate marketability discount include:
- •
- The size and stability of dividends
- •
- Prospects for liquidity (probably length of holding period)
- •
- The pool of potential buyers
- •
- Growth prospects
Based on this analysis, and with the support of a number of discount studies (see Exhibit L for details), we determined that a marketability discount of 30% was appropriate for this valuation.
6.4 Application of Adjustments
The following table shows the application of valuation adjustments to the various values determined using the methods discussed above.
AMERICAN BANK & TRUST COMPANY
Valuation Methods Summary
| Valuation Method | Method Results Before Adjustments | Result Type Discount (Premium) | Indicated Whole Bank Value Before Adjustments | Entity Level Marketability Discount (Premium) | Indicated Whole Bank Value After Adjustments | Fair Value per Share | Book Multiple | Earnings Multiple | ||||||||
|---|---|---|---|---|---|---|---|---|---|---|---|---|---|---|---|---|
| Book Value | 14,069,647 | 14,069,647 | 14,069,647 | 1.00 | 15.41 | |||||||||||
| Comparable Sales—Whole Bank | 21,679,854 | 21,679,854 | 30.00 | % | 15,175,898 | 130.84 | 1.08 | 16.62 | ||||||||
| Share Exchange | 22,125,704 | 22,125,704 | 30.00 | % | 15,487,993 | 133.53 | 1.10 | 16.96 | ||||||||
| Public Company Multiples | 19,094,478 | -24.82 | % | 23,833,727 | 30.00 | % | 16,683,609 | 143.84 | 1.19 | 18.27 | ||||||
| Discounted Future Returns | 19,098,881 | -24.82 | % | 23,839,223 | 30.00 | % | 16,687,456 | 143.87 | 1.19 | 18.27 | ||||||
| Earnings Capitalization | 19,325,602 | -24.82 | % | 24,122,216 | 30.00 | % | 16,885,551 | 145.58 | 1.20 | 18.49 |
| | | | | | Fair Market Value per Share | Book Multiple | Earnings Multiple | Dividend Yield | |||||||||
|---|---|---|---|---|---|---|---|---|---|---|---|---|---|---|---|---|---|
| Total Shares Outstanding (fully diluted) | 115,987 | Average | 139.53 | 1.15 | 17.72 | 1.43 | % | ||||||||||
| Trailing 12 Month Earnings | 913,297 | Maximum | 145.58 | 1.20 | 18.49 | 1.37 | % | ||||||||||
| Trailing 12 Month Dividend | 231,974 | Minimum | 130.84 | 1.08 | 16.62 | 1.53 | % | ||||||||||
| EPS | 7.87 |
14
7 Valuation Conclusion
After considering all relevant information and the results of various valuation methods, it falls to the valuator to use judgment and experience to analyze the results and determine the ultimate fairness of the proposed transaction.
Based on all factors that we deem relevant and assuming the accuracy and completeness of the information and data provided to us, we conclude that the cash consideration of $140.24 per share to be paid by the Company is fair, from a fýnancial point of view, to all shareholders of the Company, including those shareholders receiving the cash consideration.
8 Valuator's Certification
I certify that, to the best of my knowledge and belief
- 1.
- The statements of fact in this report are true and correct.
- 2.
- Neither the valuator, nor any officer, agent or employee of National Capital, L.L.C. has any present or contemplated interest in the subject company, nor any personal bias with respect to the parties involved.
- 3.
- National Capital, L.L.C. has received a fee for the preparation of this valuation report. The fee paid to National Capital, L.L.C. was not contingent on any action or event resulting from the analysis, opinions or conclusions in the report.
- 4.
- This valuation report is valid only for the valuation period indicated in the report and only for the express purpose stated herein.
- 5.
- The report analyses, opinions and conclusions are limited only by the reported assumptions and limiting conditions, and are my personal, unbiased professional analyses, opinions and conclusions.
- 6.
- The valuator's analyses, opinions and conclusion were developed, and this report was prepared, in conformity with the National Association of Certified Valuation Analysts' standards for conducting and reporting on business valuations.
Jonathan W. Briggs, CFA February 11, 2004 |
15
9 Valuator's Qualifications
Jonathan W. Briggs
| Experience | 2003-Present National Capital, L.L.C. Baton Rouge, LA | |||
| Principal | ||||
| • | Perform business valuations for purposes including ESOP Formation, Contribution and Dissolution; Family Limited Partnership Formation and Gifting, Estate Valuation; Merger/Acquisition; Subchapter-S Conversion; Private Placements; etc. | |||
| • | Provide investment banking and financial advisory services to publicly traded and privately held companies across a wide range of industries. | |||
| • | Act as Buyer's, Seller's or Third-Party Representative in merger transactions. | |||
| 2003-Present American Planning Corporation Baton Rouge, LA | ||||
| Principal | ||||
| • | Act as a Financial Consultant to Financial Institutions and Financial Holding Companies. | |||
| • | Provide short- and long-range financial planning services based on valueenhancement strategies. | |||
| • | Develop and value long-range strategic business plans. | |||
| 1997-2003 Chaffe & Associates, Inc. New Orleans, LA | ||||
| Assistant Vice President | ||||
| • | Perform business valuations for purposes including ESOP Formation, Contribution and Dissolution; Family Limited Partnership Formation and Gifting, Estate Valuation; Merger/Acquisition; Subchapter-S Conversion; Private Placements; etc. | |||
| • | Provide investment banking and financial advisory services to publicly traded and privately held companies across a wide range of industries. | |||
| • | Act as Buyer's, Seller's or Third-Party Representative in merger transactions. | |||
| Education | University of New Orleans New Orleans, LA | |||
| • | B.S.—Finance | |||
Memberships and Designations | Association for Investment Management & Research (Chartered Financial Analyst Designation) | |||
16
Exhibit A
National Economic Data and Analyses
The Federal Reserve Board
January 14, 2004
Summary
Prepared at the Federal Reserve Bank of Kansas City and based on information collected before January 6, 2004. This document summarizes comments received from businesses and other contacts outside the Federal Reserve and is not a commentary on the views of Federal Reserve officials.
Reports from Federal Reserve Districts suggest that the nation's economy has continued to improve since the last survey. The strongest report came from the San Francisco district, which said its economy expanded soundly. Most other districts also gave quite favorable reports, saying their economies improved, strengthened further, or grew at a moderate pace. However, Cleveland, Chicago, and Dallas reported only slow or modest growth, and St. Louis said conditions were mixed. Retailers and manufacturers reported that prices were generally steady despite increases for raw materials.
Holiday retail sales were generally positive across the country, and auto sales either improved or held steady in most districts. Manufacturing activity increased in nearly all districts, and New York, Philadelphia, and Kansas City noted some growth in factory employment. Housing remained strong, particularly in the Boston and San Francisco districts. Commercial real estate was still weak, although a few districts reported signs of firming. Travel and tourism activity increased considerably, and gains were reported in most other service industries as well. Bank loan demand was flat or slightly lower, with credit quality generally unchanged. Energy and agricultural activity was steady in most districts, although the appearance of mad cow disease created considerable uncertainty in the cattle industry.
Along with the increase in overall economic activity, many districts reported modest improvements in labor markets. These improvements took the form of reduced layoffs or modestly increased hiring, although new hiring was still quite minimal in several districts and most types of workers remained easy to recruit. Health care and other employee benefit costs continued to rise. However, with labor markets still slack, wage pressures remained generally subdued. Retail prices were generally flat, with some districts reporting less discounting of holiday retail prices than in previous years. Manufacturers in most districts also held their selling prices steady, despite substantial increases in the prices of some raw materials such as steel and natural gas.
Consumer Spending
Reports on holiday retail sales were generally upbeat across the country, particularly for sales during the last two weeks of 2003. San Francisco gave the strongest report, saying robust sales led to considerable year-over-year gains. Holiday sales were also quite solid in the Boston, Philadelphia, St. Louis, and Kansas City districts. Most other districts reported more modest year-over-year sales growth, although some of these districts noted an improvement in sales at the end of December. Cleveland, on the other hand, said retailers were generally disappointed by sluggish sales during the holidays. All districts reporting on store inventories said stock levels were generally in good shape for 2004, and all districts reporting on expectations for future retail sales anticipate continued improvement in the months ahead.
Looking across product categories, sales of high-end items were characterized as especially strong in several districts, including New York, Philadelphia, Atlanta, and San Francisco. Likewise, electronics and home furnishings sold well in many districts. On the other hand, sales of apparel were reported to be soft in the Philadelphia and Cleveland districts, and San Francisco noted heavy discounting at lower-
A-1
priced apparel stores. Indeed, sales at discount stores in general were reported to have been below plan in several districts, including New York, Cleveland, and Kansas City.
Reports on auto sales were also generally positive, with most districts reporting either steady or improving sales at the end of the year. Cleveland, St. Louis, and Minneapolis characterized new vehicle sales as "strong" or "solid" in December, although St. Louis reported that sales of used cars were not as robust as sales of new cars. Richmond, Chicago, and San Francisco all noted some improvement in vehicle sales from previous months, while Atlanta, Kansas City, and Dallas said sales were mixed or flat. Philadelphia noted that a seasonal slowing in auto sales resulted in a buildup of inventories, and dealers in the Cleveland district were worried about their ability to sell all of their 2003 models. Otherwise, though, districts reporting expectations for auto sales were generally optimistic about 2004.
Manufacturing
Nearly all districts reported increases in manufacturing activity in December, and several districts noted that factory employment had begun to edge up as well. Chicago reported broad-based improvement across manufacturing industries, and Dallas and San Francisco said factory activity increased in a variety of sectors. Philadelphia, Richmond, and Kansas City noted strong orders in December, and Boston said several firms had been "pleasantly surprised" by recent increases in orders. Factory employment was reported to have posted modest overall gains in the New York, Philadelphia, and Kansas City districts, and factory jobs also reportedly picked up in select industries or for select occupations in the Boston, Richmond, and San Francisco districts.
Looking across industries, primary metal manufacturing was said to be improving in the Philadelphia, Cleveland, and Richmond districts, and production of various high-tech goods continued to rebound in the Boston, Dallas, and San Francisco districts due to increased capital spending by customers. Several districts also noted increases in the production of industrial machinery, building materials, and transportation equipment. On the negative side, St. Louis reported layoffs in the biotechnology, food, and tobacco industries. Petrochemical producers suffered from overcapacity in the Dallas district and continued to lay off workers in the Atlanta district. In addition, producers of paper goods in the Boston and Philadelphia districts reported some weakness.
Manufacturers across the country generally expect factory conditions to continue to improve in the months ahead, and several districts noted that capital spending in 2004 will be somewhat higher than in 2003. Much of the increased spending will go towards replacement of outdated IT and other capital equipment, but both Chicago and Kansas City reported a few firms plan plant expansions as well. Exceptions to the optimistic outlook included textile producers in the Boston and Richmond districts, who continue to suffer from excess capacity.
Real Estate and Construction
Residential real estate activity remained robust, with home sales and new construction reported to be strong in most districts. In the Boston district, home sales in Massachusetts continued to rise at double-digit rates, while housing activity in other parts of the district returned to more normal levels following boom conditions during the last two years. In the San Francisco district, home sales increased and home price appreciation remained solid. In most other districts, home sales and single-family homebuilding were reported to be holding steady at high levels. The only districts reporting some slowdown in overall housing activity were Chicago and Dallas. Contacts in the Chicago district said some easing was inevitable given the previous boom, but Dallas reported that high inventories of existing homes were becoming a concern. Both Boston and Kansas City reported that the high-end market was weaker than the entry-level market, although tentative signs of a turnaround in high-end construction were noted in Kansas City. The multifamily market remained weak in the few districts reporting on this sector, the only bright spot being a modest recovery in apartment rents in New York.
A-2
Commercial real estate activity remained weak, although there were signs of improvement in a few districts. In most districts, commercial real estate markets and nonresidential construction were described as soft with little improvement expected in the near term. Commercial builders in the Cleveland district viewed 2003 as a weak year and did not expect conditions to improve for at least the next six months. In the Chicago district, vacancy rates remained elevated in most segments of the market, and contacts saw no indication of a firming in demand at the end of the year. On a more positive note, however, a few districts reported either a pickup in activity or improvement in expectations for the future. For example, Atlanta reported that commercial construction activity was still generally weak but that leasing activity continued to improve. In the Dallas district, the office market remained soft, but contacts were increasingly optimistic that the worst was behind them. The strongest report came from the Richmond district, where contacts were highly encouraged by a pickup in leasing activity late in the year.
Tourism and Services
Travel and tourism activity improved substantially. Boston, Richmond, Minneapolis, Kansas City and San Francisco all reported a surge in visitors to ski resorts due to very good snow conditions, while Atlanta noted increased optimism about winter tourism in Florida and New Orleans. Boston also reported a positive outlook for international bookings due to the lower dollar and promotional airfares. Demand for hotel rooms in New York remained strong, as brisk leisure travel activity more than compensated for a continued slump in business travel. In other reports on business travel, Atlanta observed a modest increase in convention bookings, while Boston noted increased spending on corporate entertaining and higher bookings for corporate meetings in 2004.
Activity in other service industries generally expanded as well. Several districts reported increased demand for freight transport services. For example, Cleveland observed busy trucking activity serving retailers, Dallas reported increased rail shipments of lumber due to strength in construction, and San Francisco noted that exports and holiday imports kept several seaports operating at capacity. Looking at other sectors, Dallas reported robust growth in legal services, Philadelphia noted improved demand at marketing firms, and New York cited unusually brisk hiring for office jobs. Boston reported little change in overall demand for insurance, with slightly higher sales of long-term care products but lower revenue from large-property insurance. On a negative note, Richmond indicated lackluster activity at several business support and technical firms.
Banking
Overall demand for bank loans either remained unchanged or declined somewhat in most districts. Home mortgage lending continued to fall due mainly to lower refinancing activity. Banks in the Chicago district reported that new mortgage originations were also slowing somewhat, although such lending remained fairly strong. Demand for consumer loans fell somewhat in the New York and St. Louis districts and rose in the Philadelphia and Kansas City districts. Business loan demand increased in the Philadelphia, Richmond, and St. Louis districts but held steady or weakened in other districts. Banks in the Richmond district attributed the increased demand for business loans to the stronger economy and were optimistic about lending prospects for 2004. In the Chicago and San Francisco districts, banks reported more inquiries about lending terms from small businesses, even though overall business lending remained flat.
Credit quality and lending standards were little changed in most districts. Credit quality was described as stable in the Philadelphia district, although some banks reported higher defaults on consumer loans. Banks in the New York district reported fewer delinquencies in all loan categories except business loans. In the Chicago district, business loan quality improved, but home mortgage loan quality eroded slightly. The only changes in credit standards were in the New York district, where they were tightened
A-3
slightly for non-mortgage loans, and in the Chicago district, where some large banks were said to be loosening standards on business loans in an effort to boost lending.
Natural Resources and Agriculture
Activity in natural resource industries generally held steady. Ore mining in the Minneapolis district continued at a strong pace, as some mines produced near capacity while other, previously shut, mines reopened. Energy activity in the Dallas district was little changed, but contacts noted continuing excess capacity in the oil services and machinery industry. Oil and gas drilling in the Kansas City district remained unchanged at levels considerably higher than a year ago, while Minneapolis reported a decrease in both oil and natural gas exploration. Looking ahead, natural gas producers in the Kansas City district plan increased capital spending in anticipation of continued strong production, but contacts in both the Kansas City and Dallas districts expect some decline in oil production in coming months.
While most districts reported steady conditions in the farm economy, the appearance of mad cow disease created substantial uncertainty in the cattle industry. Farm incomes were supported in the Chicago district by strong hog production and by rising corn and soybean prices, while incomes in the Kansas City district were maintained by high soybean prices and still-elevated cattle prices. In the San Francisco district, farmers benefited from strong holiday sales of cut flowers and Christmas trees. Crop conditions in the Atlanta and Dallas districts were reported as stable. However, farmers in some parts of the Minneapolis and Kansas City districts continued to suffer from drought, and Richmond reported harvest and planting delays due to excessive precipitation. The emergence of a case of mad cow disease in Washington state resulted in a great deal of uncertainty for cattle ranchers. Contacts in several districts noted substantial declines in cattle prices due to foreign bans on U.S. beef exports. The uncertainty was causing ranchers in the Kansas City and Dallas districts to take a wait-and-see approach toward herd adjustments. San Francisco, on the other hand, reported that the appearance of mad cow disease was boosting sales of range-raised beef.
Labor Markets, Wages, and Prices
Most districts reported modest improvements in labor markets in December. San Francisco noted a pickup in hiring, Minneapolis reported more hiring announcements than layoff announcements, and Kansas City said layoffs dropped considerably. Likewise, demand for temp workers increased in the Philadelphia and Richmond districts, and Chicago said the seasonal decrease in temp employment this year was less than in the previous two years. On the other hand, hiring was said to be quite minimal in several districts. Cleveland, for example, noted that most firms still do not plan to increase payrolls in the near future. In addition, while hiring improved somewhat in the Atlanta district, firms generally remained reluctant to add full-time staff. Both Kansas City and Dallas noted some pickup in demand for high-tech workers, although such workers were still easily recruited in the Kansas City district and some types of high-tech and telecom work in the Dallas district continued to be outsourced overseas. Acute labor shortages were generally reported only for select health care fields, with some hospitals in the Atlanta district recruiting overseas to fill open nursing positions.
Wage pressures generally remained subdued throughout the nation, but most districts continued to report greater upward pressure on health care and other employee benefit costs. Chicago, Kansas City and San Francisco described wage increases as "weak" or "modest" and Boston stated that wages were mostly stable. Exceptions were reported in the Dallas district, with wages subject to downward pressure in the airline industry but upward pressure in certain occupations such as skilled mechanics. Meanwhile, districts consistently reported that employee benefit costs continued to increase. San Francisco said that the improving job market was making it harder to shift increases in health care premiums to workers, resulting in slightly higher growth of total compensation.
A-4
Most districts reported little change in final goods prices, but costs of some raw materials rose noticeably. Retail prices were generally stable. Atlanta, Kansas City, Dallas, and San Francisco all reported less discounting of holiday retail prices than in previous years, although a few other districts said holiday discounts were similar to last year. In manufacturing, the most widely cited increase in raw materials costs was for steel. Contacts in the Cleveland district said steel producers were raising prices to cover the increased cost of their own inputs, such as scrap and iron ore, and that steel prices were likely to continue rising through the first quarter. Price increases were also reported in some districts for copper and aluminum. In the Boston district, prices of lumber and plywood were reported to have fallen back somewhat from the highs reached in the third quarter, but contacts in other districts said these prices were still well above year-ago levels. In most districts, manufacturing firms were reported to still be having difficulty passing input costs on to their customers. In the Dallas district, petrochemical producers held their selling prices steady in the face of sharply rising natural gas prices, and trucking firms kept their rates unchanged despite higher fuel costs. The only signs of a change in pricing power were in the New York and Kansas City districts, where some firming in selling prices was reported.
A-5
Exhibit B
Regional Economic Data and Analyses
WINTER 2003
Louisiana
Employment in Louisiana remained weak during third quarter 2003.
- •
- Employment levels declined in Louisiana during the past two years, although the rate of loss has diminished in the last 18 months (see Chart 1).
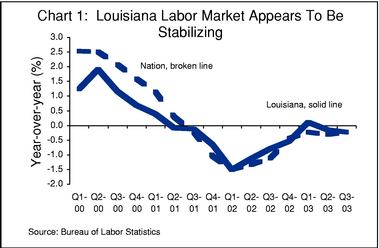
- •
- During the third quarter, the most significant job losses occurred in services and manufacturing (see Chart 2).
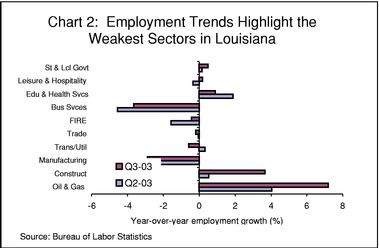
- •
- In contrast, employment in the energy and construction industries expanded strongly on a year-over-year basis as of third quarter 2003.
B-1
- •
- Employment was flat in the leisure and hospitality sector, increasing only 0.2 percent on a year-over-year basis as of third quarter 2003. This sector accounts for more than one in ten jobs in Louisiana, and is an important economic driver in the metro areas of the state.
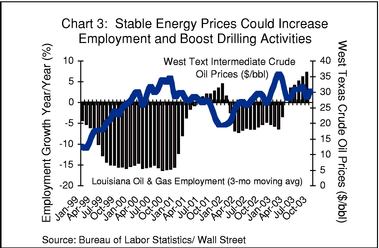
Employment in the Louisiana oil and gas sector may benefit from stable energy prices.
- •
- The still dominant energy sector accounts for 19 percent of gross state product as of year-end 2001 (most recent data available), down from over 30 percent at year-end 1981.
- •
- Energy sector employees are well compensated; as a result, even modest changes in the industry have a significant effect on personal income in natural resource dependent areas. Employment levels in the sector typically rise when oil prices exceed a mid-twenty dollar per barrel price point and contract below that level. The Organization of the Petroleum Exporting Countries (OPEC) has sought to maintain prices at or above $25 per barrel, a goal achieved since early 2002 (see Chart 3).
- •
- Favorable commodity prices for key crops coupled with generally robust production figures indicate that 2003 net farm incomes will exceed results from recent years.
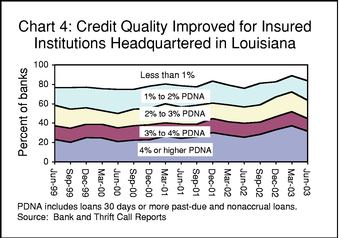
Asset quality improved in the second half of 2003.
- •
- Past-due and nonaccrual loan levels reported by insured institutions headquartered in Louisiana reached a cyclical peak at year-end 2001 and remained elevated during 2002.1
- 1
- The median past-due ratio peaked at 2.67 percent at year-end 2001 and remained relatively unchanged at year-end 2002.
- •
- The median consumer past-due and nonaccrual loan ratio was 2.54 percent in second quarter 2003, down from 2.72 percent the prior quarter, but 10 basis points above the 2.44 percent ratio one year earlier, indicating on-going pressure in overall credit quality for insured institutions in Louisiana (see Chart 4).
B-2
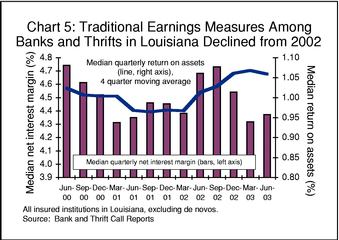
Future earnings among insured institutions in Louisiana may be pressured.
- •
- The median quarterly net interest margin (NIM) was 4.37 percent in second quarter 2003 for insured institutions in Louisiana, virtually unchanged from one quarter ago, but down significantly from 4.68 percent at second quarter 2002 (see Chart 5).
- •
- As the national economy gains momentum, interest rates are expected to rise. Traditionally, net interest margins for Louisiana community banks have been adversely affected by rising interest rates, as most insured institutions are liability sensitive, with liabilities repricing more quickly than assets.
B-3
State Profile
Louisana at a Glance
| General Information | Jun-03 | Jun-02 | Jun-01 | Jun-00 | Jun-99 | |||||||
|---|---|---|---|---|---|---|---|---|---|---|---|---|
| Institutions (#) | 171 | 174 | 177 | 186 | 188 | |||||||
| Total Assets (in thousands) | 51,657,794 | 47,476,679 | 45,609,598 | 54,861,163 | 53,515,538 | |||||||
| New Institutions (# < 3 years) | 0 | 4 | 12 | 15 | 15 | |||||||
| New Institutions (# < 9 years) | 17 | 17 | 17 | 19 | 21 | |||||||
Capital | Jun-03 | Jun-02 | Jun-01 | Jun-00 | Jun-99 | |||||||
| Tier 1 Leverage (median) | 9.98 | 10.31 | 10.07 | 10.40 | 10.29 | |||||||
Asset Quality | Jun-03 | Jun-02 | Jun-01 | Jun-00 | Jun-99 | |||||||
| Past-Due and Nonaccrual (median %) | 2.54 | % | 2.32 | % | 2.32 | % | 2.02 | % | 2.35 | % | ||
| Past-Due and Nonaccrual > = 5% | 32 | 28 | 26 | 23 | 25 | |||||||
| ALLL/Total Loans (median %) | 1.29 | % | 1.29 | % | 1.25 | % | 1.27 | % | 1.31 | % | ||
| ALLL/Noncurrent Loans (median multiple) | 1.28 | 1.89 | 1.44 | 1.70 | 1.67 | |||||||
| Net Loan Losses/Loans (aggregate) | 0.31 | % | 0.35 | % | 0.38 | % | 0.34 | % | 0.44 | % | ||
Earnings | Jun-03 | Jun-02 | Jun-01 | Jun-00 | Jun-99 | |||||||
| Unprofitable Institutions (#) | 4 | 1 | 7 | 12 | 14 | |||||||
| Percent Unprofitable | 2.34 | % | 0.57 | % | 3.95 | % | 6.45 | % | 7.45 | % | ||
| Return on Assets (median %) | 1.12 | 1.10 | 0.98 | 1.10 | 1.01 | |||||||
| 25th Percentile | 0.77 | 0.78 | 0.67 | 0.74 | 0.69 | |||||||
| Net Interest Margin (median %) | 4.33 | % | 4.55 | % | 4.34 | % | 4.67 | % | 4.48 | % | ||
| Yield on Earning Assets (median) | 6.06 | % | 6.82 | % | 8.08 | % | 8.09 | % | 7.71 | % | ||
| Cost of Funding Earning Assets (median) | 1.78 | % | 2.43 | % | 3.82 | % | 3.62 | % | 3.31 | % | ||
| Provisions to Avg. Assets (median) | 0.11 | % | 0.13 | % | 0.11 | % | 0.11 | % | 0.10 | % | ||
| Noninterest Income to Avg. Assets (median) | 0.92 | % | 0.84 | % | 0.83 | % | 0.80 | % | 0.77 | % | ||
| Overhead to Avg. Assets (median) | 3.42 | % | 3.32 | % | 3.38 | % | 3.45 | % | 3.31 | % | ||
Liquidity/Sensitivity | Jun-03 | Jun-02 | Jun-01 | Jun-00 | Jun-99 | |||||||
| Loans to Deposits (median %) | 70.87 | % | 72.93 | % | 71.12 | % | 71.62 | % | 67.75 | % | ||
| Loans to Assets (median %) | 60.23 | % | 60.83 | % | 61.39 | % | 60.85 | % | 57.22 | % | ||
| Brokered Deposits (# of Institutions) | 13 | 13 | 10 | 10 | 6 | |||||||
| Bro. Deps./Assets (median for above inst.) | 0.79 | % | 1.35 | % | 1.35 | % | 2.13 | % | 4.52 | % | ||
| Noncore Funding to Assets (median) | 18.71 | % | 18.36 | % | 18.20 | % | 17.66 | % | 16.71 | % | ||
| Core Funding to Assets (median) | 68.69 | % | 68.85 | % | 69.55 | % | 69.68 | % | 71.01 | % | ||
Bank Class | Jun-03 | Jun-02 | Jun-01 | Jun-00 | Jun-99 | |||||||
| State Nonmember | 122 | 124 | 126 | 132 | 132 | |||||||
| National | 15 | 16 | 16 | 19 | 20 | |||||||
| State Member | 3 | 2 | 2 | 2 | 3 | |||||||
| S&L | 20 | 21 | 21 | 21 | 21 | |||||||
| Savings Bank | 9 | 8 | 9 | 9 | 9 | |||||||
| Mutually Insured | 2 | 3 | 3 | 3 | 3 | |||||||
| MSA Distribution | | # of Inst. | Assets | % Inst. | % Assets | ||||||
|---|---|---|---|---|---|---|---|---|---|---|---|
| No MSA | 90 | 10,296,361 | 52.63 | % | 19.93 | % | |||||
| New Orleans LA | 29 | 30,813,743 | 16.96 | % | 59.65 | % | |||||
| Lafayette LA | 22 | 4,774,063 | 12.87 | % | 9.24 | % | |||||
| Baton Rouge LA | 10 | 2,634,371 | 5.85 | % | 5.10 | % | |||||
| Shreveport-Bossier City LA | 8 | 751,601 | 4.68 | % | 1.45 | % | |||||
| Houma LA | 6 | 708,720 | 3.51 | % | 1.37 | % | |||||
| Monroe LA | 2 | 458,659 | 1.17 | % | 0.89 | % | |||||
| Lake Charles LA | 2 | 878,973 | 1.17 | % | 1.70 | % | |||||
| Alexandria LA | 2 | 341,303 | 1.17 | % | 0.66 | % |
B-4
January 14, 2004
Federal Reserve Districts
Sixth District—Atlanta
Summary
Reports from the Sixth District indicated that the pace of economic growth remained favorable during November and December. District retailers gave encouraging early reports on holiday sales and most contacts noted that activity met or exceeded year-ago levels. Auto sales were mixed, with foreign models outperforming domestic brands. Strength in the District's residential housing markets continued, whereas commercial construction remained generally weak. Reports noted modest improvement in the industrial sector, and some contacts reported an increase in capital spending during November and December. The District's tourism and hospitality sector continued to improve late in the year. Responses from the financial sector were also mostly positive. Labor market reports firmed a bit in November and December, although employers remained cautious. Prices were described as stable overall.
Consumer Spending
Initial reports from District retailers indicated that holiday sales met or exceeded year-ago levels. Contacts noted that the combination of lean inventories and strong sales resulted in fewer discounts than in recent years. In particular, less discounting was noted after Christmas. Several contacts reported that high-end merchandise did well over the holiday season. Electronics and home-related products were also strong sellers. Generally, retailers were upbeat about their prospects for first-quarter sales.
Vehicle sales in November and December were mixed, according to reports from auto dealers. Some contacts noted that December is traditionally a low-volume month, although foreign model sales were quite strong late in the year. Most contacts reported that a reduction in the level of incentives had not significantly reduced sales or floor traffic at dealerships.
Real Estate
District single-family housing markets ended the year strongly, with both construction and sales continuing at a steady pace. Commercial markets were mixed. Commercial construction remained generally weak in November and December, while leasing activity continued to improve. Local industry analysts reported that improvements in the commercial real estate market were expected in 2004.
Manufacturing and Transportation
District contacts reported that manufacturing production continued to recover in November and December, and industrial energy sales had stabilized in some parts the District. Some contacts noted that previously delayed capital spending plans have been revived, especially IT equipment and infrastructure. Reports cited increased confidence in the sustainability of economic growth, tax law changes, and the need to replace outdated and worn equipment as reasons for the pickup in capital spending. Auto parts producers continued to announce plans for new plants, and tractor and trailer producers reported increasing orders over last year. New military contracts boosted activity for
B-5
shipyards and military equipment suppliers. Less positively, Louisiana's petrochemical industry continued to pare employment rolls.
District trucking contacts continued to report gains in seasonal freight demand late in the year. Airfreight tonnage improved from yearearlier levels for both domestic and international cargo in Atlanta and Miami.
Tourism and Business Travel
The District's tourism and hospitality industry continued to improve at year-end. In Miami, restaurants were said to be hiring aggressively, and south and central Florida tourism officials were upbeat about the current tourist season. Tennessee hotel occupancy rates were picking up in November and December from a year earlier as well. New Orleans tourism industry officials were upbeat about the first half of 2004, and Atlanta contacts reported a modest increase in convention bookings for 2004.
Banking and Finance
Responses from the financial sector were mostly positive. Deposit growth held steady or improved in much of the region from a year ago. Commercial loan demand, however, remained weak. Credit quality continued to strengthen and past due loans at banks were below year-ago levels. Most banks were reported to be moving ahead with capital expenditures to improve operating efficiency.
Employment and Prices
Reports on hiring were more positive in November and December than in previous reports, but employers continued to be cautious regarding adding full-time staff. Several businesses reported that they were keeping a lid on current payrolls but were increasing the amount of outsourcing. In south Florida, seasonal hiring was reportedly stronger than it has been for several years. Hospitals throughout the District continued to recruit internationally to help meet the nursing shortage.
Most reports indicated that businesses were not raising prices. But one report did note that increases in raw material costs were being passed on to customers, whereas wage and benefit increases were not being passed on. Prices for timber products remained high because of relatively low supplies and strong housing construction activity in the District.
Agriculture
Conditions remained mostly favorable for the District's crops. The harvest of sugar cane, citrus crops and vegetables was underway in some areas. The discovery of mad cow disease in Washington was expected to have an effect on the region's economy through lower cattle prices.
B-6
January 14, 2004
Federal Reserve Districts
Eleventh District—Dallas
Eleventh District economic activity expanded modestly from midNovember to early January. Contacts expressed optimism about the outlook for 2004 and are increasingly taking steps to increase capital spending and hiring as a result. Manufacturing activity continued to recover, while the demand for business services strengthened modestly. Retailers reported that holiday sales were good but not great. Conditions were mostly unchanged for the energy industry and for real estate and construction firms. The beef industry has been disrupted by fears of "mad cow" disease, but there was little change in other agricultural conditions.
Prices
Energy prices are higher. Natural gas prices jumped over 40 percent in December. U.S. crude oil prices were up in response to OPEC production restraint, terror uncertainties, cold weather, higher tanker rates and very low crude inventories in the U.S. In December, crude inventories twice set records for the lowest levels ever seen during the month. OPEC has not responded to prices above their announced target range for a variety of reasons including a weaker dollar and expectations that supply will be stronger in the spring. Heating oil prices have been volatile but ended the period up slightly-responding to cold weather, a spike in natural gas prices, and higher crude prices. The price of regular gasoline was stable at $1.48 to $1.50 per gallon throughout the period, although December pump prices were the highest ever for a December. Gasoline demand has been running at rates above the five-year maximum all year, including November and December.
The spike in natural gas prices was a shock to large users like petrochemical producers. Domestic producers absorbed the additional costs, hurting profit margins. Prices for plastic resins remained stable in December. High natural gas prices have led to a moderate rise in the price of cement, sand, gravel and aluminum, and one respondent expressed concerns about being driven out of business by natural gas cost pressures.
Transportation firms reported concerns over rising fuel prices, although their ability to pass these cost pressures onto selling prices is mixed. Intense competition is keeping trucking prices unchanged, but strong demand is allowing some price increases for rail shipments. Airlines say selling prices continue to be soft.
Producers of primary and fabricated metals say input prices have skyrocketed. Shortages of steel, scrap and rebar were reported. Apparel prices continue to face downward pressure from tough global competition. Prices for most telecommunications and electronics products continue to decline. Retailers say that prices are declining at a slower rate. Auto dealers report that input prices and manufacturer incentives are unchanged, but selling prices continue to decline.
Labor Market
The labor market appears to be strengthening slowly with scattered reports of increased hiring. Still contacts report concerns about rising costs for health care and other employee benefits, including an increase in the Texas unemployment tax. Rising wage pressures are reported for some types of workers,
B-7
such as skilled mechanics and clerical workers. Temporary service firms say wages and salaries have increased 3 percent to 4 percent in the past quarter, but individuals that were making about $15 an hour in 2001 are currently making about $13.50 an hour. Financial stress continues to exert downward pressure on wages and employment levels in the airline industry.
Manufacturing
Manufacturing activity was improved for most products, including food, metals, lumber and paper products. Apparel producers reported no change is sales growth over the past month and say tough global competition continues to put pressure on the industry. An exporter of manufactured equipment noted an increase in projects in the Middle East following the capture of Saddam Hussein.
Demand for construction-related products, such as concrete, brick and glass, has been better than expected, which contacts attribute to favorable weather conditions. The outlook is "cautiously optimistic." Producers are cautious because of high natural gas prices and uncertainty about interest rates, but are optimistic because of productivity improvements achieved by modifying the mix of fuel content and the start of new public and commercial construction projects.
Respondents in high-tech manufacturing reported a continued moderate growth in orders with a slight acceleration in orders for latest-technology products and research. One respondent noted that the recent improvement in the economic outlook has motivated companies to increase their investment in cutting-edge technology so that they can stay ahead of the competition. Inventories were reported to be close to desired levels with retailers keeping lean inventories, and one manufacturer reporting that they were trying to build inventories. Contacts said they continue to outsource functions such as logistics and information technology to companies in the U.S. and overseas. Most contacts expect sales to grow at a 5 percent to 10 percent annual rate over the next three-to-six months.
Telecommunication manufacturing firms reported continued slow recovery, with demand up slightly and inventories declining slowly. The decrease in inventories and the growth of broadband use has helped to boost future prospects for the industry, although a robust recovery is not on the horizon. Domestic employment levels are not expected to increase, but plans to hire or outsource in the Asian Pacific region, particularly China, could boost worldwide employment.
Refiners raised production levels in response to cold weather and higher heating oil prices. Imports of refined products have been running at high rates, above the five-year maximum. Petrochemical markets continued to be plagued by overcapacity, despite rising demand from an improving U.S. economy. High natural gas prices have resulted in the loss of most export markets, further worsening the overcapacity situation. Producers are also facing growing competition from foreign producers for domestic markets.
Services
Legal firms reported robust growth in the fourth quarter. Litigation activity was still strong, and transactional/venture capital activity continued to strengthen. One contact noted a slowdown in bankruptcy work. Accounting activity was flat.
Temporary service firms reported only a slight increase in activity. Demand is strongest to supply health care workers, but orders grew considerably for IT and light industrial. Demand for workers to supply call centers and administrative/clerical positions have been weaker than expected.
Transportation firms, including trucking, airline and rail, reported increased demand. Rail shipments of grain have been boosted by good crop yields in the U.S. and higher demand from abroad. There has also been an increase in rail shipments of lumber and wood as a result of sustained growth in the housing construction market. The airline industry continues to improve modestly. Holiday demand was stronger in 2003 than in 2002, but demand was weaker than expected, which contacts attribute to the increased homeland security alert status.
B-8
Retail Sales
Retail sales started the holiday season slowly but ended it with a flourish. Overall contacts said that sales were good but not great. The industry remains very competitive, but contacts say there are fewer massive promotional efforts because consumers expect low prices and aren't attracted to the "loud noise of discount." Inventories are in good shape. Auto sales remain flat.
Construction and Real Estate
On the commercial side, office market fundamentals remained weak, but respondents are increasingly optimistic that the worst is behind them. Still, most contacts don't expect a major improvement in office markets until late 2004 or early 2005. Industrial real estate continues to perform relatively well, and most contacts in that industry are cautiously optimistic that demand will remain steady in the first quarter.
On the residential side, multifamily markets remain soft, with little change in demand. Apartment construction has subsided some, according to contacts, but there are still significant projects in the pipeline. While vacancy rates have flattened, there continues to be downward pressure on rents. Single-family builders say demand is flat to down, and fierce competition is keeping a lid on price increases. Contacts in the existing home market remain concerned about the amount of inventory available to buyers. Most single-family respondents were guarded in their outlooks, hoping for a pickup in job growth in 2004.
Energy
Crude oil demand has been at levels well above the five-year average since October, but there has been little change in energy activity. The domestic rig count remained near 1100 and drilling in the Gulf of Mexico is at a depressed 100 rigs. International drilling continues to improve. There continues to be excess capacity in the oil services and machinery industry, leading to sluggish pricing and moderate profits. In 2004, producers expect U.S. oil drilling to decline roughly 7 percent from current levels. International activity is expected to increase 6 percent.
Agriculture
Crop conditions were mostly unchanged, but the first U.S. case of "mad cow" disease led to a significant drop in cattle prices. Thirtyfive international markets closed their borders to U.S. beef. Contacts consider U.S. beef safe but say cattlemen may delay liquidating herds, reducing beef production in 2004. Some contacts were hopeful that Mexico and Canada would soon re-open their borders to U.S. beef. However, most contacts were uncertain about how the American consumer would respond while the extent of the disease in the U.S. is being determined.
B-9
Exhibit C
Industry Economic Data and Analysis
THIRD QUARTER 2003
- •
- Industry Ekes Out Another Quarterly Earnings Record
- •
- Lower Loss Provisions, Higher Noninterest Income Offset Sharp Drop in Gains on Sales of Securities and Other Assets
- •
- Net Interest Margin Falls to 12-Year Low
- •
- Domestic Deposits Register First Decline in Over Four Years
Net Income Sets a Record for Third Consecutive Quarter
Commercial banks and savings institutions insured by the FDIC reported record-high earnings in the third quarter of 2003, the third consecutive quarter that industry earnings have set a record. Net income totaled $30.4 billion, an increase of $147 million (0.5 percent) from the second quarter, and $3.1 billion (11.3 percent) more than the industry earned in the third quarter of 2002. The average return on assets was 1.36 percent, compared to 1.38 percent in the second quarter, and 1.34 percent a year earlier. More than half of all institutions (55.3 percent) reported an ROA of 1 percent or higher for the quarter. Slightly more than half reported increased net income compared to the second quarter (50.8 percent), and a similar proportion (50.7 percent) reported higher net income than in the third quarter of 2002.
Nonrecurring Gains are Sharply Lower Than in Second Quarter
Noninterest income growth was a major source of earnings strength, and lower expenses for loan-loss provisions also helped lift profits. The improvement in earnings was held down by reduced gains on sales of securities and other assets, and by lower net interest income. Net operating income, which does not include gains from securities sales and other nonrecurring items, was $2.0 billion (7.4 percent) higher than in the second quarter, and was $4.5 billion (18.3 percent) more than in the third quarter of 2002.
Consumer Business Lines Continue to Exhibit Strength
As has been the case in recent quarters, earnings strength was most evident at institutions with concentrations of consumer-related assets. The average ROA at credit-card lenders rose to 4.18 percent, from 4.04 percent in the second quarter. At other consumer lenders, the average ROA rose from 1.49 percent to 1.68 percent. An exception was mortgage lenders, whose average ROA fell from 1.50 percent to 1.34 percent, mainly because of sharply lower gains on sales of securities and other assets.
Servicing Income Rebounds With Rise in Interest Rates
Rising interest rates caused a decline in the market values of fixed-rate securities in the third quarter, and reduced the gains realized on securities sales, which were $2.7 billion (55.8 percent) lower than in the second quarter. The increase in rates also had a dampening effect on loan demand, especially for mortgage refinancings, and the reduced volume of lending activity contributed to a $390 million (0.6 percent) decline in net interest income. However, the prospect of reduced refinancing activity had a positive effect on the value of mortgage servicing rights, and servicing income rose by $3.2 billion (281 percent) compared to the second quarter. The industry also registered a $1.0-billion (20.2-percent) rise in securitization income, and a $2.2-billion (57.0-percent) increase in gains on loan sales. These improvements helped lift total noninterest income by $2.1 billion (4.3 percent). The
C-1
industry's bottom line was also helped by lower expenses. Provisions for loan losses were $1.7 billion (17.1 percent) lower than in the second quarter, and noninterest expenses were only $355 million (0.5 percent) higher.
Chart 1
Small Institutions Register Slight Improvement in Margins
The increase in medium- and long-term interest rates affected the net interest margins of large and small institutions differently. More than half of all banks and thrifts with less than $100 million in assets—52.5 percent—reported improved net interest margins in the third quarter, whereas only about a third of institutions with more than $1 billion in assets—35.2 percent—reported margin improvement. Average asset yields declined more sharply at large institutions than at smaller ones. The reductions in net interest margins at larger institutions caused the industry's margin to fall by 9 basis points, from 3.74 percent to 3.65 percent. This is the lowest level reported by the industry since the first quarter of 1991.
Chart 2
C-2
C&I Loans Remain at Forefront of Asset Quality Improvement
The improving trend in asset quality that began late last year continued through the third quarter, as both noncurrent loans and net charge-offs declined. Net charge-offs were $684 million (6.7 percent) lower than in the second quarter, and were $2.4 billion (20.3 percent) below the level of a year ago. Charge-offs of commercial and industrial (C&I) loans fell by $423 million (13.4 percent) from the second quarter, accounting for 62 percent of the improvement in total net charge-offs. Compared to the third quarter of 2002, C&I charge-offs were down by $2.2 billion (44.2 percent), representing 88.6 percent of the improvement in all net charge-offs. Net charge-offs on credit-card loans declined by $363 million (9.0 percent) from the second quarter, and were $306 million (7.7 percent) lower than a year earlier. The only loan category that had a significant increase in charge-offs was loans to foreign governments, where net charge-offs rose by $133 million.
Chart 3
Noncurrent Rate Falls to Two-Year Low
Noncurrent loans declined for the fourth quarter in a row, falling by $2.6 billion (4.0 percent). Compared to the level of a year ago, noncurrent loans are down by $6.7 billion (9.7 percent). Noncurrent C&I loans fell by $1.4 billion (5.7 percent) during the quarter, and have fallen by $5.3 billion (18.5 percent) in the past 12 months. As with net charge-offs, improvements in C&I loans have accounted for the majority of the improvement in total noncurrent loans. At the end of September, the percent of total loans that were noncurrent stood at 1.17 percent, the lowest level since midyear 2001.
Coverage Ratio Improves Despite Decline in Loss Reserves
Total loan-loss provisions fell short of total net charge-offs for the third quarter in a row, contributing to a $991-million (1.2-percent) decline in the industry's loss reserves. The ratio of reserves to total loans declined from 1.64 percent to 1.59 percent during the quarter. This is the lowest level for this ratio in more than 2 years (it was 1.55 percent at the end of the second quarter of 2001). In
C-3
contrast, the industry's "coverage ratio" increased to $1.36 in reserves for every $1.00 of noncurrent loans, from $1.33 at midyear, thanks to the decline in noncurrent loans.
Chart 4
Regulatory Capital Ratios Hit New Highs
Total equity capital increased by only $5.0 billion (0.6 percent) during the quarter, the smallest quarterly increase since the third quarter of 1999. The main reason that equity growth slowed was depreciation in the market values of institutions' available-for-sale securities, caused by rising interest rates. Under Generally Accepted Accounting Principles (GAAP), changes in the values of these securities are reflected in equity capital. At midyear, commercial banks' available-for-sale securities contained about $26 billion in unrealized gains; at the end of the third quarter, this figure had declined to $14 billion. Even with the small increase in equity capital, the industry's equity-toassets ratio registered a modest improvement, from 9.10 percent to 9.13 percent. Because regulatory capital definitions do not include adjustments for unrealized gains in securities portfolios, two of the industry's three regulatory capital ratios—tier 1 risk-based capital and total risk-based capital—rose to record-high levels during the quarter.
Shrinkage in Mortgage-Backed Securities Limits Asset Growth
Assets of insured banks and thrifts increased by only $22.2 billion (0.2 percent) in the third quarter, the smallest increase in the last 6 quarters. The industry's portfolio of loans grew by $87 billion (1.7 percent), but securities holdings fell by $59.6 billion (3.4 percent). Residential mortgage loans increased by $40.6 billion (2.5 percent), and home equity loans grew by $19.5 billion (6.6 percent), but both increases were below the levels of the previous quarter. Mortgage-backed securities declined by
C-4
$86.2 billion (8.3 percent). C&I loans declined for an eleventh consecutive quarter, but the $2.7-billion decline was the smallest quarterly drop during this period of shrinkage.
Chart 5
Savings Deposits Continue to Grow
Domestic deposits declined for the first time since the first quarter of 1999, falling by $7.7 billion (0.1 percent). Most of the decrease occurred in demand deposits, which declined by $46.2 billion (7.5 percent). At banks filing Call Reports, savings deposits increased by $52.8 billion (2.3 percent). Deposits in foreign offices increased by $14.1 billion (2.1 percent), and nondeposit liabilities rose by $10.8 billion (0.5 percent). Most of the growth in nondeposit liabilities consisted of short-term borrowings.
Chart 6

Industry Contraction is Smallest in 17 Years
The number of insured banks and thrifts filing quarterly financial reports declined by 31 in the third quarter. This is the smallest quarterly reduction in reporting institutions since 1986. There were no failures during the third quarter. Mergers absorbed 57 institutions, and 31 new institutions were chartered during the quarter. Two mutual savings banks, with total assets of $494 million, converted to
C-5
stock ownership. The number of institutions on the FDIC's "Problem List" declined from 129 to 116 during the quarter, and total assets of "problem" institutions fell from $32.2 billion to $30.3 billion.
Chart 7
TABLE I-A. Selected Indicators, All FDIC-Insured Institutions*
| | 2003** | 2002** | 2002 | 2001 | 2000 | 1999 | 1998 | |||||||||||||||
|---|---|---|---|---|---|---|---|---|---|---|---|---|---|---|---|---|---|---|---|---|---|---|
| Return on assets (%) | 1.37 | 1.34 | 1.30 | 1.14 | 1.14 | 1.25 | 1.16 | |||||||||||||||
| Return on equity (%) | 15.00 | 14.60 | 14.14 | 12.97 | 13.53 | 14.71 | 13.50 | |||||||||||||||
| Core capital (leverage) ratio (%) | 7.87 | 8.01 | 7.87 | 7.78 | 7.71 | 7.80 | 7.59 | |||||||||||||||
| Noncurrent assets plus other real estate owned to assets (%) | 0.77 | 0.92 | 0.90 | 0.88 | 0.71 | 0.63 | 0.66 | |||||||||||||||
| Net charge-offs to loans (%) | 0.77 | 0.97 | 0.97 | 0.83 | 0.59 | 0.53 | 0.59 | |||||||||||||||
| Asset growth rate (%) | 8.13 | 5.44 | 7.20 | 5.44 | 8.41 | 5.40 | 8.05 | |||||||||||||||
| Net interest margin (%) | 3.72 | 4.00 | 3.96 | 3.78 | 3.77 | 3.89 | 3.91 | |||||||||||||||
| Net operating income growth (%) | 10.37 | 21.37 | 18.52 | -0.84 | 1.72 | 19.75 | 3.02 | |||||||||||||||
| Number of institutions reporting | 9,237 | 9,415 | 9,354 | 9,614 | 9,905 | 10,222 | 10,464 | |||||||||||||||
| Commercial banks | 7,812 | 7,931 | 7,887 | 8,079 | 8,316 | 8,580 | 8,774 | |||||||||||||||
| Savings institutions | 1,425 | 1,484 | 1,467 | 1,535 | 1,589 | 1,642 | 1,690 | |||||||||||||||
| Percentage of unprofitable institutions | 5.42 | 6.45 | 6.65 | 8.22 | 7.54 | 7.64 | 5.97 | |||||||||||||||
| Number of problem institutions | 116 | 146 | 136 | 114 | 94 | 79 | 84 | |||||||||||||||
| Assets of problem institutions (in billions) | $ | 30 | $ | 42 | $ | 39 | $ | 40 | $ | 24 | $ | 10 | $ | 11 | ||||||||
| Number of failed/assisted institutions | 2 | 9 | 11 | 4 | 7 | 8 | 3 | |||||||||||||||
- *
- Excludes insured branches of foreign banks (IBAs)
- **
- Through September 30, ratios annualized where appropriate. Asset growth rates are for 12 months ending September 30.
C-6
TABLE II-A. Aggregate Condition and Income Data, All FDIC-Insured Institutions
| (dollar figures in millions) | 3rd Quarter 2003 | 2nd Quarter 2003 | 3rd Quarter 2002 | %Change 02:3-03:3 | ||||||||||
|---|---|---|---|---|---|---|---|---|---|---|---|---|---|---|
| Number of institutions reporting | 9,237 | 9,268 | 9,415 | -1.9 | ||||||||||
| Total employees (full-time equivalent) | 2,041,607 | 2,088,817 | 2,003,419 | 1.9 | ||||||||||
| CONDITION DATA | ||||||||||||||
| Total assets | $ | 8,945,735 | $ | 8,923,525 | $ | 8,272,909 | 8.1 | |||||||
| Loans secured by real estate | 3,124,930 | 3,038,924 | 2,744,470 | 13.9 | ||||||||||
| 1-4 Family residential mortgages | 1,653,989 | 1,613,371 | 1,445,421 | 14.4 | ||||||||||
| Commercial real estate | 665,661 | 652,598 | 611,419 | 8.9 | ||||||||||
| Construction and development | 263,687 | 257,067 | 243,651 | 8.2 | ||||||||||
| Home equity lines | 314,880 | 295,363 | 240,180 | 31.1 | ||||||||||
| Commercial & industrial loans | 931,532 | 934,187 | 962,022 | -3.2 | ||||||||||
| Loans to individuals | 772,344 | 764,088 | 753,567 | 2.5 | ||||||||||
| Credit cards | 266,643 | 269,883 | 281,829 | -5.4 | ||||||||||
| Farm loans | 46,672 | 46,257 | 48,181 | -3.1 | ||||||||||
| Other loans & leases | 461,393 | 467,054 | 448,139 | 3.0 | ||||||||||
| Less: Unearned income | 2,980 | 3,589 | 3,789 | -21.4 | ||||||||||
| Total loans & leases | 5,333,891 | 5,246,919 | 4,952,589 | 7.7 | ||||||||||
| Less: Reserve for losses | 84,931 | 85,922 | 83,858 | 1.3 | ||||||||||
| Net loans and leases | 5,248,960 | 5,160,997 | 4,868,731 | 7.8 | ||||||||||
| Securities | 1,702,171 | 1,761,751 | 1,589,424 | 7.1 | ||||||||||
| Other real estate owned | 5,514 | 5,519 | 5,040 | 9.4 | ||||||||||
| Goodwill and other intangibles | 170,393 | 158,822 | 145,739 | 16.9 | ||||||||||
| All other assets | 1,818,697 | 1,836,435 | 1,663,976 | 9.3 | ||||||||||
| Total liabilities and capital | 8,945,735 | 8,923,525 | 8,272,909 | 8.1 | ||||||||||
| Deposits | 5,851,069 | 5,844,704 | 5,391,969 | 8.5 | ||||||||||
| Domestic office deposits | 5,158,888 | 5,166,616 | 4,778,981 | 7.9 | ||||||||||
| Foreign office deposits | 692,181 | 678,088 | 612,988 | 12.9 | ||||||||||
| Other borrowed funds | 1,690,761 | 1,671,935 | 1,576,969 | 7.2 | ||||||||||
| Subordinated debt | 103,666 | 102,826 | 95,992 | 8.0 | ||||||||||
| All other liabilities | 483,630 | 492,456 | 444,819 | 8.7 | ||||||||||
| Equity capital | 816,608 | 811,604 | 763,160 | 7.0 | ||||||||||
| Loans and leases 30-89 days past due | 50,106 | 52,098 | 55,055 | (9.0 | ) | |||||||||
| Noncurrent loans and leases | 62,227 | 64,811 | 68,900 | (9.7 | ) | |||||||||
| Restructured loans and leases | 3,333 | 3,286 | 3,364 | (0.9 | ) | |||||||||
| Direct and indirect investments in real estate | 727 | 694 | 696 | 4.5 | ||||||||||
| Mortgage-backed securities | 948,242 | 1,034,398 | 901,709 | 5.2 | ||||||||||
| Earning assets | 7,700,560 | 7,682,627 | 7,152,756 | 7.7 | ||||||||||
| FHLB Advances | 464,511 | 454,136 | 452,528 | 2.6 | ||||||||||
| Unused loan commitments | 5,891,861 | 5,903,541 | 5,582,066 | 5.5 | ||||||||||
| Trust assets | 11,792,873 | 11,891,679 | 10,534,152 | 11.9 | ||||||||||
| Assets securitized and sold*** | 896,072 | 878,692 | 904,270 | (0.9 | ) | |||||||||
| Notional amount of derivatives*** | 67,789,253 | 66,477,267 | 53,714,908 | 26.2 | ||||||||||
- ***
- Commercial banks only.
C-7
| INCOME DATA | First Three Qtrs 2003 | First Three Qtrs 2002 | %Change | 3rd Quarter 2003 | 3rd Quarter 2002 | %Change 02:3-03:3 | ||||||||||||
|---|---|---|---|---|---|---|---|---|---|---|---|---|---|---|---|---|---|---|
| Total interest income | $ | 304,424 | $ | 325,970 | -6.6 | $ | 99,758 | $ | 109,174 | -8.6 | ||||||||
| Total interest expense | 94,303 | 118,352 | -20.3 | 29,572 | 39,299 | -24.8 | ||||||||||||
| Net interest income | 210,121 | 207,618 | 1.2 | 70,187 | 69,874 | 0.5 | ||||||||||||
| Provision for loan and lease losses | 28,474 | 37,777 | -24.6 | 8,268 | 13,527 | -38.9 | ||||||||||||
| Total noninterest income | 149,291 | 136,511 | 9.4 | 51,869 | 46,204 | 12.3 | ||||||||||||
| Total noninterest expense | 207,388 | 194,116 | 6.8 | 70,516 | 65,904 | 7.0 | ||||||||||||
| Securities gains (losses) | 10,690 | 8,003 | 33.6 | 2,153 | 4,342 | -50.4 | ||||||||||||
| Applicable income taxes | 44,464 | 40,056 | 11.0 | 15,065 | 13,644 | 10.4 | ||||||||||||
| Extraordinary gains, net | 19 | -2 | N/M | 17 | -41 | N/M | ||||||||||||
| Net income | 89,794 | 80,180 | 12.0 | 30,376 | 27,305 | 11.3 | ||||||||||||
| From international operations | 6,263 | 4,500 | 39.2 | 1,737 | 842 | 106.3 | ||||||||||||
| Net charge-offs | 30,101 | 34,865 | -13.7 | 9,565 | 12,004 | -20.3 | ||||||||||||
| Cash dividends | 62,499 | 55,363 | 12.9 | 20,447 | 18,034 | 13.4 | ||||||||||||
| Retained earnings | 27,295 | 24,817 | 10.0 | 9,929 | 9,270 | 7.1 | ||||||||||||
| Net operating income | 82,556 | 74,800 | 10.4 | 28,905 | 24,432 | 18.3 | ||||||||||||
N/M - - Not Meaningful
C-8
TABLE III-A. Third Quarter 2003, All FDIC-Insured Institutions
| | | Asset Concentration Groups* | ||||||||||||||||||||||||||||||
|---|---|---|---|---|---|---|---|---|---|---|---|---|---|---|---|---|---|---|---|---|---|---|---|---|---|---|---|---|---|---|---|---|
| | All Insured Institutions | International Banks | Agricultural Banks | Credit Card Banks | Commercial Lenders | Mortgage Lenders | Consumer Lenders | Other Specialized <$1 Billion | All Other <$1 Billion | All Other >$1 Billion | ||||||||||||||||||||||
| THIRD QUARTER (The way it is...) | ||||||||||||||||||||||||||||||||
| Number of institutions reporting | 9,237 | 7 | 1,821 | 35 | 4,166 | 1,024 | 166 | 523 | 1,392 | 103 | ||||||||||||||||||||||
| Commercial banks | 7,812 | 7 | 1,816 | 33 | 3,812 | 239 | 127 | 445 | 1,249 | 84 | ||||||||||||||||||||||
| Savings institutions | 1,425 | 0 | 5 | 2 | 354 | 785 | 39 | 78 | 143 | 19 | ||||||||||||||||||||||
| Total assets (in billions) | $ | 8,945.7 | $ | 1,483.9 | $ | 129.5 | $ | 252.8 | $ | 3,095.7 | $ | 1,588.7 | $ | 191.9 | $ | 62.2 | $ | 192.2 | $ | 1,948.9 | ||||||||||||
| Commercial banks | 7,474.3 | 1,483.9 | 128.9 | 248.7 | 2,811.4 | 568.0 | 144.0 | 46.3 | 160.7 | 1,882.3 | ||||||||||||||||||||||
| Savings institutions | 1,471.4 | 0.0 | 0.6 | 4.1 | 284.3 | 1,020.7 | 47.9 | 15.9 | 31.5 | 66.5 | ||||||||||||||||||||||
| Total deposits (in billions) | 5,851.1 | 853.0 | 106.6 | 79.2 | 2,242.5 | 965.9 | 106.1 | 46.5 | 157.3 | 1,293.9 | ||||||||||||||||||||||
| Commercial banks | 4,916.6 | 853.0 | 106.1 | 76.9 | 2,051.8 | 338.5 | 75.8 | 34.3 | 132.1 | 1,248.0 | ||||||||||||||||||||||
| Savings institutions | 934.5 | 0.0 | 0.4 | 2.3 | 190.7 | 627.4 | 30.3 | 12.2 | 25.2 | 46.0 | ||||||||||||||||||||||
| Net income (in millions) | 30,376 | 4,163 | 405 | 2,566 | 9,965 | 5,216 | 816 | 232 | 499 | 6,514 | ||||||||||||||||||||||
| Commercial banks | 25,813 | 4,163 | 404 | 2,538 | 9,062 | 2,058 | 579 | 174 | 443 | 6,393 | ||||||||||||||||||||||
| Savings institutions | 4,563 | 0 | 1 | 28 | 903 | 3,158 | 237 | 58 | 56 | 121 | ||||||||||||||||||||||
Performance Ratios (annualized, %) | ||||||||||||||||||||||||||||||||
| Yield on earning assets | 5.19 | 4.45 | 5.91 | 10.64 | 5.41 | 5.11 | 6.22 | 4.50 | 5.56 | 4.50 | ||||||||||||||||||||||
| Cost of funding earning assets | 1.54 | 1.57 | 1.83 | 1.97 | 1.49 | 1.78 | 1.50 | 1.49 | 1.73 | 1.29 | ||||||||||||||||||||||
| Net interest margin | 3.65 | 2.87 | 4.08 | 8.68 | 3.92 | 3.32 | 4.71 | 3.01 | 3.83 | 3.21 | ||||||||||||||||||||||
| Noninterest income to assets | 2.32 | 3.00 | 0.71 | 12.06 | 1.67 | 1.52 | 2.49 | 8.20 | 1.01 | 2.28 | ||||||||||||||||||||||
| Noninterest expense to assets | 3.16 | 3.22 | 2.70 | 9.34 | 2.98 | 2.66 | 3.36 | 8.55 | 3.01 | 2.86 | ||||||||||||||||||||||
| Loan and lease loss provision to assets | 0.37 | 0.39 | 0.24 | 3.80 | 0.35 | 0.12 | 0.93 | 0.24 | 0.23 | 0.13 | ||||||||||||||||||||||
| Net operating income to assets | 1.29 | 1.06 | 1.24 | 4.18 | 1.27 | 1.09 | 1.61 | 1.43 | 0.98 | 1.31 | ||||||||||||||||||||||
| Pretax return on assets | 2.03 | 1.69 | 1.55 | 6.55 | 1.87 | 2.08 | 2.64 | 2.19 | 1.36 | 1.98 | ||||||||||||||||||||||
| Return on assets | 1.36 | 1.11 | 1.26 | 4.18 | 1.29 | 1.34 | 1.68 | 1.49 | 1.04 | 1.33 | ||||||||||||||||||||||
| Return on equity | 14.92 | 14.75 | 11.59 | 24.66 | 13.69 | 14.91 | 22.86 | 9.32 | 9.87 | 15.31 | ||||||||||||||||||||||
| Net charge-offs to loans and leases | 0.72 | 1.52 | 0.29 | 4.83 | 0.47 | 0.19 | 1.34 | 2.47 | 0.37 | 0.48 | ||||||||||||||||||||||
| Loan and lease loss provision to net charge-offs | 86.44 | 63.14 | 129.93 | 98.50 | 110.60 | 95.05 | 87.34 | 34.88 | 112.90 | 55.11 | ||||||||||||||||||||||
| Efficiency ratio | 56.77 | 60.45 | 60.19 | 45.57 | 56.63 | 58.81 | 49.05 | 77.61 | 66.10 | 56.68 | ||||||||||||||||||||||
| % of unprofitable institutions | 6.55 | 0.00 | 4.12 | 2.86 | 6.91 | 6.74 | 6.02 | 14.91 | 5.46 | 7.77 | ||||||||||||||||||||||
| % of institutions with earnings gains | 50.67 | 85.71 | 44.26 | 60.00 | 60.83 | 40.63 | 54.22 | 33.08 | 42.10 | 46.60 | ||||||||||||||||||||||
Structural Changes | ||||||||||||||||||||||||||||||||
| New Charters | 31 | 0 | 0 | 0 | 6 | 1 | 0 | 23 | 1 | 0 | ||||||||||||||||||||||
| Institutions absorbed by mergers | 57 | 1 | 5 | 0 | 36 | 6 | 2 | 0 | 4 | 6 | ||||||||||||||||||||||
| Failed Institutions | 0 | 0 | 0 | 0 | 0 | 0 | 0 | 0 | 0 | 0 | ||||||||||||||||||||||
PRIOR THIRD QUARTERS (The way it was...) | ||||||||||||||||||||||||||||||||
| Return on assets (%) | ||||||||||||||||||||||||||||||||
| 2002 | 1.34 | 0.65 | 1.38 | 3.76 | 1.31 | 1.37 | 1.18 | 1.60 | 1.22 | 1.51 | ||||||||||||||||||||||
| 2000 | 1.21 | 1.03 | 1.29 | 3.59 | 1.17 | 0.87 | 1.16 | 1.03 | 1.16 | 1.32 | ||||||||||||||||||||||
| 1998 | 1.15 | 0.24 | 1.26 | 3.20 | 1.37 | 1.20 | 1.44 | 1.94 | 1.17 | 1.44 | ||||||||||||||||||||||
Net charge-offs to loans & leases (%) | ||||||||||||||||||||||||||||||||
| 2002 | 0.98 | 2.17 | 0.30 | 5.35 | 0.68 | 0.15 | 1.29 | 0.42 | 0.34 | 0.86 | ||||||||||||||||||||||
| 2000 | 0.53 | 0.37 | 0.21 | 3.69 | 0.43 | 0.11 | 0.26 | 1.50 | 0.25 | 0.65 | ||||||||||||||||||||||
| 1998 | 0.63 | 0.87 | 0.24 | 4.50 | 0.33 | 0.21 | 0.64 | 0.23 | 0.36 | 0.49 | ||||||||||||||||||||||
- *
- See page 8 for explanations.
C-9
TABLE III-A. Third Quarter 2003, All FDIC-Insured Institutions
| | | Asset Size Distribution | Geographic Regions* | ||||||||||||||||||||||||||||||||
|---|---|---|---|---|---|---|---|---|---|---|---|---|---|---|---|---|---|---|---|---|---|---|---|---|---|---|---|---|---|---|---|---|---|---|---|
| | All Insured Institutions | Less than $100 Million | $100 Million to $1 Billion | $1 Billion to $10 Billion | Greater than $10 Billion | New York | Atlanta | Chicago | Kansas City | Dallas | San Francisco | ||||||||||||||||||||||||
| THIRD QUARTER (The way it is...) | |||||||||||||||||||||||||||||||||||
| Number of institutions reporting | 9,237 | 4,465 | 4,190 | 470 | 112 | 1,188 | 1,231 | 2,028 | 2,141 | 1,878 | 771 | ||||||||||||||||||||||||
| Commercial banks | 7,812 | 3,985 | 3,404 | 339 | 84 | 621 | 1,075 | 1,663 | 2,029 | 1,741 | 683 | ||||||||||||||||||||||||
| Savings institutions | 1,425 | 480 | 786 | 131 | 28 | 567 | 156 | 365 | 112 | 137 | 88 | ||||||||||||||||||||||||
| Total assets (in billions) | $ | 8,945.7 | $ | 229.1 | $ | 1,159.9 | $ | 1,299.7 | $ | 6,257.2 | $ | 3,041.5 | $ | 1,858.6 | $ | 1,653.7 | $ | 445.3 | $ | 592.6 | $ | 1,353.9 | |||||||||||||
| Commercial banks | 7,474.3 | 204.1 | 907.8 | 946.5 | 5,415.9 | 2,521.5 | 1,730.4 | 1,515.1 | 400.4 | 501.0 | 806.1 | ||||||||||||||||||||||||
| Savings institutions | 1,471.4 | 24.9 | 252.0 | 353.2 | 841.3 | 520.0 | 128.3 | 138.7 | 45.0 | 91.7 | 547.9 | ||||||||||||||||||||||||
| Total deposits (in billions) | 5,851.1 | 191.4 | 930.9 | 867.7 | 3,861.0 | 1,912.0 | 1,241.9 | 1,092.7 | 300.6 | 451.2 | 852.7 | ||||||||||||||||||||||||
| Commercial banks | 4,916.6 | 171.7 | 737.8 | 636.5 | 3,370.6 | 1,563.9 | 1,151.1 | 990.8 | 272.1 | 397.1 | 541.5 | ||||||||||||||||||||||||
| Savings institutions | 934.5 | 19.8 | 193.1 | 231.2 | 490.4 | 348.1 | 90.8 | 101.9 | 28.5 | 54.1 | 311.2 | ||||||||||||||||||||||||
| Net income (in millions) | 30,376 | 582 | 3,374 | 4,417 | 22,003 | 9,289 | 6,497 | 5,153 | 1,960 | 1,986 | 5,492 | ||||||||||||||||||||||||
| Commercial banks | 25,813 | 518 | 2,835 | 3,338 | 19,121 | 7,846 | 6,179 | 4,806 | 1,867 | 1,579 | 3,536 | ||||||||||||||||||||||||
| Savings institutions | 4,563 | 64 | 538 | 1,079 | 2,882 | 1,443 | 318 | 348 | 92 | 407 | 1,956 | ||||||||||||||||||||||||
Performance Ratios (annualized, %) | |||||||||||||||||||||||||||||||||||
| Yield on earning assets | 5.19 | 5.85 | 5.72 | 5.29 | 5.03 | 4.89 | 5.11 | 5.16 | 6.10 | 5.45 | 5.56 | ||||||||||||||||||||||||
| Cost of funding earning assets | 1.54 | 1.74 | 1.75 | 1.60 | 1.48 | 1.62 | 1.50 | 1.60 | 1.58 | 1.45 | 1.36 | ||||||||||||||||||||||||
| Net interest margin | 3.65 | 4.11 | 3.97 | 3.70 | 3.56 | 3.26 | 3.61 | 3.57 | 4.52 | 4.00 | 4.20 | ||||||||||||||||||||||||
| Noninterest income to assets | 2.32 | 1.33 | 1.50 | 1.93 | 2.59 | 2.57 | 2.30 | 1.93 | 2.78 | 2.10 | 2.22 | ||||||||||||||||||||||||
| Noninterest expense to assets | 3.16 | 3.56 | 3.31 | 3.08 | 3.13 | 3.14 | 3.18 | 2.88 | 3.85 | 3.68 | 3.06 | ||||||||||||||||||||||||
| Loan and lease loss provision to assets | 0.37 | 0.26 | 0.28 | 0.32 | 0.40 | 0.40 | 0.22 | 0.43 | 0.50 | 0.26 | 0.44 | ||||||||||||||||||||||||
| Net operating income to assets | 1.29 | 0.97 | 1.11 | 1.25 | 1.35 | 1.16 | 1.32 | 1.21 | 1.73 | 1.27 | 1.54 | ||||||||||||||||||||||||
| Pretax return on assets | 2.03 | 1.33 | 1.63 | 2.04 | 2.13 | 1.84 | 2.08 | 1.79 | 2.56 | 1.83 | 2.63 | ||||||||||||||||||||||||
| Return on assets | 1.36 | 1.02 | 1.17 | 1.37 | 1.41 | 1.22 | 1.40 | 1.24 | 1.77 | 1.34 | 1.66 | ||||||||||||||||||||||||
| Return on equity | 14.92 | 8.90 | 11.68 | 13.13 | 16.36 | 13.74 | 15.85 | 14.36 | 16.45 | 13.93 | 16.69 | ||||||||||||||||||||||||
| Net charge-offs to loans and leases | 0.72 | 0.30 | 0.37 | 0.48 | 0.86 | 1.09 | 0.50 | 0.64 | 0.85 | 0.38 | 0.60 | ||||||||||||||||||||||||
| Loan and lease loss provision to net charge-offs | 86.44 | 140.96 | 117.64 | 110.11 | 80.10 | 75.88 | 72.40 | 104.21 | 85.96 | 113.13 | 102.83 | ||||||||||||||||||||||||
| Efficiency ratio | 56.77 | 69.63 | 63.97 | 56.87 | 55.10 | 58.05 | 58.36 | 56.30 | 54.75 | 63.05 | 50.69 | ||||||||||||||||||||||||
| % of unprofitable institutions | 6.55 | 10.08 | 3.27 | 3.40 | 1.79 | 7.66 | 9.34 | 5.87 | 4.20 | 6.39 | 9.08 | ||||||||||||||||||||||||
| % of institutions with earnings gains | 50.67 | 46.36 | 54.15 | 58.09 | 60.71 | 50.93 | 55.89 | 49.75 | 47.13 | 47.50 | 61.87 | ||||||||||||||||||||||||
Structural Changes | |||||||||||||||||||||||||||||||||||
| New Charters | 31 | 30 | 0 | 1 | 0 | 3 | 9 | 2 | 5 | 5 | 7 | ||||||||||||||||||||||||
| Institutions absorbed by mergers | 57 | 25 | 29 | 2 | 1 | 11 | 6 | 8 | 11 | 11 | 10 | ||||||||||||||||||||||||
| Failed Institutions | 0 | 0 | 0 | 0 | 0 | 0 | 0 | 0 | 0 | 0 | 0 | ||||||||||||||||||||||||
PRIOR THIRD QUARTERS (The way it was...) | |||||||||||||||||||||||||||||||||||
| Return on assets (%) | |||||||||||||||||||||||||||||||||||
| 2002 | 1.34 | 1.11 | 1.23 | 1.54 | 1.33 | 1.10 | 1.38 | 1.30 | 1.64 | 1.44 | 1.75 | ||||||||||||||||||||||||
| 2000 | 1.21 | 1.00 | 1.15 | 1.35 | 1.20 | 1.28 | 1.28 | 1.00 | 1.31 | 1.08 | 1.21 | ||||||||||||||||||||||||
| 1998 | 1.15 | 1.21 | 1.22 | 1.52 | 1.00 | 0.93 | 1.48 | 1.33 | 1.44 | 1.28 | 0.95 | ||||||||||||||||||||||||
Net charge-offs to loans & leases (%) | |||||||||||||||||||||||||||||||||||
| 2002 | 0.98 | 0.31 | 0.36 | 0.76 | 1.21 | 1.51 | 0.73 | 0.80 | 1.15 | 0.42 | 0.77 | ||||||||||||||||||||||||
| 2000 | 0.53 | 0.21 | 0.29 | 0.54 | 0.60 | 0.63 | 0.46 | 0.38 | 0.67 | 0.34 | 0.67 | ||||||||||||||||||||||||
| 1998 | 0.63 | 0.23 | 0.30 | 0.91 | 0.64 | 0.85 | 0.45 | 0.35 | 0.69 | 0.37 | 0.79 | ||||||||||||||||||||||||
- *
- See page 9 for explanations.
C-10
TABLE IV-A. First Three Quarters 2003, All FDIC-Insured Institutions
| | | Asset Concentration Groups* | ||||||||||||||||||||||||||||||
|---|---|---|---|---|---|---|---|---|---|---|---|---|---|---|---|---|---|---|---|---|---|---|---|---|---|---|---|---|---|---|---|---|
| | All Insured Institutions | International Banks | Agricultural Banks | Credit Card Banks | Commercial Lenders | Mortgage Lenders | Consumer Lenders | Other Specialized <$1 Billion | All Other <$1 Billion | All Other >$1 Billion | ||||||||||||||||||||||
| FIRST THREE QUARTERS (The way it is...) | ||||||||||||||||||||||||||||||||
| Number of institutions reporting | 9,237 | 7 | 1,821 | 35 | 4,166 | 1,024 | 166 | 523 | 1,392 | 103 | ||||||||||||||||||||||
| Commercial banks | 7,812 | 7 | 1,816 | 33 | 3,812 | 239 | 127 | 445 | 1,249 | 84 | ||||||||||||||||||||||
| Savings institutions | 1,425 | 0 | 5 | 2 | 354 | 785 | 39 | 78 | 143 | 19 | ||||||||||||||||||||||
| Total assets (in billions) | $ | 8,945.7 | $ | 1,483.9 | $ | 129.5 | $ | 252.8 | $ | 3,095.7 | $ | 1,588.7 | $ | 191.9 | $ | 62.2 | $ | 192.2 | $ | 1,948.9 | ||||||||||||
| Commercial banks | 7,474.3 | 1,483.9 | 128.9 | 248.7 | 2,811.4 | 568.0 | 144.0 | 46.3 | 160.7 | 1,882.3 | ||||||||||||||||||||||
| Savings institutions | 1,471.4 | 0.0 | 0.6 | 4.1 | 284.3 | 1,020.7 | 47.9 | 15.9 | 31.5 | 66.5 | ||||||||||||||||||||||
| Total deposits (in billions) | 5,851.1 | 853.0 | 106.6 | 79.2 | 2,242.5 | 965.9 | 106.1 | 46.5 | 157.3 | 1,293.9 | ||||||||||||||||||||||
| Commercial banks | 4,916.6 | 853.0 | 106.1 | 76.9 | 2,051.8 | 338.5 | 75.8 | 34.3 | 132.1 | 1,248.0 | ||||||||||||||||||||||
| Savings institutions | 934.5 | 0.0 | 0.4 | 2.3 | 190.7 | 627.4 | 30.3 | 12.2 | 25.2 | 46.0 | ||||||||||||||||||||||
| Net income (in millions) | 89,794 | 12,522 | 1,201 | 7,112 | 29,713 | 16,148 | 2,166 | 631 | 1,539 | 18,761 | ||||||||||||||||||||||
| Commercial banks | 76,113 | 12,522 | 1,198 | 7,048 | 26,951 | 6,695 | 1,617 | 474 | 1,354 | 18,255 | ||||||||||||||||||||||
| Savings institutions | 13,681 | 0 | 4 | 65 | 2,763 | 9,452 | 549 | 157 | 185 | 505 | ||||||||||||||||||||||
Performance Ratios (annualized, %) | ||||||||||||||||||||||||||||||||
| Yield on earning assets | 5.39 | 4.81 | 6.01 | 10.71 | 5.59 | 5.30 | 6.42 | 4.67 | 5.72 | 4.69 | ||||||||||||||||||||||
| Cost of funding earning assets | 1.67 | 1.75 | 1.96 | 2.16 | 1.63 | 1.90 | 1.66 | 1.60 | 1.87 | 1.39 | ||||||||||||||||||||||
| Net interest margin | 3.72 | 3.06 | 4.04 | 8.55 | 3.97 | 3.40 | 4.76 | 3.07 | 3.85 | 3.30 | ||||||||||||||||||||||
| Noninterest income to assets | 2.28 | 3.14 | 0.70 | 11.84 | 1.62 | 1.46 | 2.26 | 7.99 | 1.00 | 2.19 | ||||||||||||||||||||||
| Noninterest expense to assets | 3.17 | 3.44 | 2.68 | 9.27 | 2.98 | 2.55 | 3.33 | 8.41 | 2.97 | 2.87 | ||||||||||||||||||||||
| Loan and lease loss provision to assets | 0.44 | 0.55 | 0.22 | 3.87 | 0.38 | 0.15 | 0.96 | 0.32 | 0.23 | 0.22 | ||||||||||||||||||||||
| Net operating income to assets | 1.26 | 1.03 | 1.22 | 3.93 | 1.24 | 1.13 | 1.50 | 1.29 | 1.01 | 1.24 | ||||||||||||||||||||||
| Pretax return on assets | 2.05 | 1.73 | 1.55 | 6.16 | 1.91 | 2.23 | 2.39 | 2.11 | 1.44 | 1.94 | ||||||||||||||||||||||
| Return on assets | 1.37 | 1.14 | 1.25 | 3.93 | 1.31 | 1.43 | 1.54 | 1.36 | 1.09 | 1.31 | ||||||||||||||||||||||
| Return on equity | 15.00 | 15.12 | 11.60 | 23.98 | 13.91 | 15.73 | 20.71 | 8.47 | 10.32 | 14.77 | ||||||||||||||||||||||
| Net charge-offs to loans and leases | 0.77 | 1.53 | 0.24 | 5.17 | 0.52 | 0.19 | 1.42 | 1.44 | 0.31 | 0.56 | ||||||||||||||||||||||
| Loan and lease loss provision to net charge-offs | 94.60 | 87.31 | 152.12 | 94.00 | 107.12 | 113.47 | 85.98 | 79.11 | 128.50 | 77.19 | ||||||||||||||||||||||
| Efficiency ratio | 56.59 | 60.82 | 60.50 | 46.16 | 56.37 | 56.31 | 50.13 | 77.34 | 65.24 | 57.01 | ||||||||||||||||||||||
| % of unprofitable institutions | 5.42 | 0.00 | 2.75 | 2.86 | 6.27 | 5.27 | 3.61 | 13.58 | 3.88 | 3.88 | ||||||||||||||||||||||
| % of institutions with earnings gains | 57.63 | 57.14 | 46.84 | 60.00 | 68.92 | 52.34 | 61.45 | 36.14 | 49.93 | 50.49 | ||||||||||||||||||||||
Condition Ratios (%) | ||||||||||||||||||||||||||||||||
| Earning assets to total assets | 86.08 | 77.85 | 91.76 | 88.26 | 89.63 | 88.91 | 91.90 | 89.82 | 91.76 | 82.49 | ||||||||||||||||||||||
| Loss Allowance to: | ||||||||||||||||||||||||||||||||
| Loans and leases | 1.59 | 2.30 | 1.54 | 4.51 | 1.55 | 0.73 | 1.62 | 1.81 | 1.37 | 1.62 | ||||||||||||||||||||||
| Noncurrent loans and leases | 136.49 | 99.37 | 115.98 | 272.04 | 152.57 | 88.68 | 163.93 | 171.68 | 124.55 | 148.34 | ||||||||||||||||||||||
| Noncurrent assets plus other real estate owned to assets | 0.77 | 0.99 | 0.95 | 1.41 | 0.79 | 0.64 | 0.88 | 0.36 | 0.74 | 0.61 | ||||||||||||||||||||||
| Equity capital ratio | 9.13 | 7.67 | 10.81 | 16.84 | 9.42 | 8.80 | 7.49 | 15.93 | 10.56 | 8.73 | ||||||||||||||||||||||
| Core capital (leverage) ratio | 7.87 | 6.79 | 10.22 | 16.85 | 8.18 | 7.15 | 7.21 | 14.24 | 9.94 | 7.15 | ||||||||||||||||||||||
| Tier 1 risk-based capital ratio | 10.66 | 9.50 | 14.75 | 14.84 | 10.10 | 11.82 | 10.18 | 32.37 | 16.61 | 9.79 | ||||||||||||||||||||||
| Total risk-based capital ratio | 13.22 | 12.84 | 15.90 | 17.42 | 12.33 | 14.05 | 12.98 | 33.56 | 17.84 | 12.76 | ||||||||||||||||||||||
| Net loans and leases to deposits | 89.71 | 68.98 | 74.92 | 246.08 | 91.57 | 111.13 | 142.04 | 35.48 | 67.75 | 76.14 | ||||||||||||||||||||||
| Net loans to total assets | 58.68 | 39.66 | 61.67 | 77.08 | 66.33 | 67.57 | 78.54 | 26.53 | 55.45 | 50.55 | ||||||||||||||||||||||
| Domestic deposits to total assets | 57.67 | 27.00 | 82.31 | 26.30 | 70.14 | 58.66 | 52.45 | 73.98 | 81.67 | 60.45 | ||||||||||||||||||||||
Structural Changes | ||||||||||||||||||||||||||||||||
| New Charters | 81 | 0 | 1 | 0 | 18 | 3 | 0 | 58 | 1 | 0 | ||||||||||||||||||||||
| Institutions absorbed by mergers | 187 | 1 | 18 | 0 | 116 | 22 | 4 | 2 | 10 | 14 | ||||||||||||||||||||||
| Failed Institutions | 2 | 0 | 1 | 0 | 1 | 0 | 0 | 0 | 0 | 0 | ||||||||||||||||||||||
PRIOR FIRST THREE QUARTERS (The way it was...) | ||||||||||||||||||||||||||||||||
| Number of institutions | ||||||||||||||||||||||||||||||||
| 2002 | 9,415 | 5 | 1,877 | 41 | 4,081 | 1,159 | 206 | 453 | 1,495 | 98 | ||||||||||||||||||||||
| 2000 | 9,989 | 7 | 2,045 | 58 | 3,947 | 1,309 | 304 | 507 | 1,731 | 81 | ||||||||||||||||||||||
| 1998 | 10,624 | 11 | 2,371 | 68 | 3,416 | 1,502 | 312 | 608 | 2,246 | 90 | ||||||||||||||||||||||
Total assets (in billions) | ||||||||||||||||||||||||||||||||
| 2002 | $ | 8,272.9 | $ | 1,232.2 | $ | 124.7 | $ | 291.0 | $ | 3,394.2 | $ | 1,279.6 | $ | 168.3 | $ | 49.0 | $ | 192.5 | $ | 1,541.3 | ||||||||||||
| 2000 | 7,269.5 | 1,165.0 | 120.9 | 277.5 | 3,781.1 | 1,000.0 | 78.3 | 50.6 | 208.1 | 587.9 | ||||||||||||||||||||||
| 1998 | 6,327.5 | 1,450.8 | 125.2 | 242.1 | 2,602.8 | 1,004.8 | 94.5 | 60.4 | 274.9 | 471.9 | ||||||||||||||||||||||
Return on assets (%) | ||||||||||||||||||||||||||||||||
| 2002 | 1.34 | 0.85 | 1.31 | 3.55 | 1.30 | 1.34 | 1.40 | 1.39 | 1.19 | 1.40 | ||||||||||||||||||||||
| 2000 | 1.16 | 1.10 | 1.31 | 2.92 | 1.12 | 0.99 | 1.19 | 1.56 | 1.17 | 0.92 | ||||||||||||||||||||||
| 1998 | 1.20 | 0.66 | 1.28 | 2.74 | 1.30 | 1.14 | 1.38 | 1.73 | 1.21 | 1.47 | ||||||||||||||||||||||
Net charge-offs to loans & leases (%) | ||||||||||||||||||||||||||||||||
| 2002 | 0.97 | 1.78 | 0.26 | 6.07 | 0.67 | 0.16 | 1.12 | 0.47 | 0.30 | 0.86 | ||||||||||||||||||||||
| 2000 | 0.51 | 0.44 | 0.18 | 3.68 | 0.40 | 0.12 | 0.20 | 1.98 | 0.23 | 0.55 | ||||||||||||||||||||||
| 1998 | 0.58 | 0.60 | 0.20 | 4.41 | 0.33 | 0.18 | 0.65 | 0.50 | 0.33 | 0.55 | ||||||||||||||||||||||
Noncurrent assets plus OREO to assets (%) | ||||||||||||||||||||||||||||||||
| 2002 | 0.92 | 1.28 | 0.93 | 1.61 | 0.88 | 0.68 | 1.34 | 0.36 | 0.70 | 0.80 | ||||||||||||||||||||||
| 2000 | 0.67 | 0.66 | 0.76 | 1.51 | 0.70 | 0.48 | 0.95 | 0.30 | 0.56 | 0.45 | ||||||||||||||||||||||
| 1998 | 0.67 | 0.61 | 0.81 | 1.62 | 0.62 | 0.65 | 0.99 | 0.35 | 0.63 | 0.59 | ||||||||||||||||||||||
| Equity capital ratio (%) | ||||||||||||||||||||||||||||||||
| 2002 | 9.22 | 7.26 | 11.04 | 15.39 | 9.53 | 8.82 | 7.78 | 16.73 | 10.90 | 8.87 | ||||||||||||||||||||||
| 2000 | 8.55 | 6.92 | 10.48 | 12.60 | 8.62 | 8.12 | 7.99 | 15.78 | 10.14 | 8.61 | ||||||||||||||||||||||
| 1998 | 8.73 | 6.49 | 11.02 | 14.14 | 9.13 | 8.72 | 8.98 | 14.06 | 10.42 | 8.39 | ||||||||||||||||||||||
- *
- Asset Concentration Group Definitions (Groups are hierarchical and mutually exclusive)
International Banks—Banks with assets greater than $10 billion and more than 25 percent of total assets in foreign offices.
Agricultural Banks—Banks whose agricultural production loans plus real estate loans secured by farmland exceed 25 percent of their total loans and leases.
Credit-card Lenders—Institutions whose credit-card loans plus securitized receivables exceed 50 percent of total assets plus securitized receivables.
Commercial Lenders—Institutions whose commercial and industrial loans, plus real estate construction and development loans, plus loans secured by commercial real estate properties exceed 25 percent of total assets.
Mortgage Lenders—Institutions whose residential mortgage loans, plus mortgage-backed securities, exceed 50 percent of total assets.
Consumer Lenders—Institutions whose residential mortgage loans, plus credit-card loans, plus other loans to individuals, exceed 50 percent of total assets.
Other Specialized <$1 Billion—Institutions with assets less than $1 billion, whose loans and leases are less than 40 percent of total assets.
All Other <$1 billion—Institutions with assets less than $1 billion that do not meet any of the definitions above, they have significant lending activity with no identified asset concentrations.
All Other >$1 billion—Institutions with assets greater than $1 billion that do not meet any of the definitions above, they have significant lending activity with no identified asset concentrations.
C-11
TABLE IV-A. First Three Quarters 2003, All FDIC-Insured Institutions
| | | Asset Size Distribution | Geographic Regions* | ||||||||||||||||||||||||||||||||
|---|---|---|---|---|---|---|---|---|---|---|---|---|---|---|---|---|---|---|---|---|---|---|---|---|---|---|---|---|---|---|---|---|---|---|---|
| | All Insured Institutions | Less than $100 Million | $100 Million to $1 Billion | $1 Billion to $10 Billion | Greater than $10 Billion | New York | Atlanta | Chicago | Kansas City | Dallas | San Francisco | ||||||||||||||||||||||||
| THIRD QUARTER (The way it is...) | |||||||||||||||||||||||||||||||||||
| Number of institutions reporting | 9,237 | 4,465 | 4,190 | 470 | 112 | 1,188 | 1,231 | 2,028 | 2,141 | 1,878 | 771 | ||||||||||||||||||||||||
| Commercial banks | 7,812 | 3,985 | 3,404 | 339 | 84 | 621 | 1,075 | 1,663 | 2,029 | 1,741 | 683 | ||||||||||||||||||||||||
| Savings institutions | 1,425 | 480 | 786 | 131 | 28 | 567 | 156 | 365 | 112 | 137 | 88 | ||||||||||||||||||||||||
| Total assets (in billions) | $ | 8,945.7 | $ | 229.1 | $ | 1,159.9 | $ | 1,299.7 | $ | 6,257.2 | $ | 3,041.5 | $ | 1,858.6 | $ | 1,653.7 | $ | 445.3 | $ | 592.6 | $ | 1,353.9 | |||||||||||||
| Commercial banks | 7,474.3 | 204.1 | 907.8 | 946.5 | 5,415.9 | 2,521.5 | 1,730.4 | 1,515.1 | 400.4 | 501.0 | 806.1 | ||||||||||||||||||||||||
| Savings institutions | 1,471.4 | 24.9 | 252.0 | 353.2 | 841.3 | 520.0 | 128.3 | 138.7 | 45.0 | 91.7 | 547.9 | ||||||||||||||||||||||||
| Total deposits (in billions) | 5,851.1 | 191.4 | 930.9 | 867.7 | 3,861.0 | 1,912.0 | 1,241.9 | 1,092.7 | 300.6 | 451.2 | 852.7 | ||||||||||||||||||||||||
| Commercial banks | 4,916.6 | 171.7 | 737.8 | 636.5 | 3,370.6 | 1,563.9 | 1,151.1 | 990.8 | 272.1 | 397.1 | 541.5 | ||||||||||||||||||||||||
| Savings institutions | 934.5 | 19.8 | 193.1 | 231.2 | 490.4 | 348.1 | 90.8 | 101.9 | 28.5 | 54.1 | 311.2 | ||||||||||||||||||||||||
| Net income (in millions) | 89,794 | 1,641 | 10,125 | 12,896 | 65,132 | 27,742 | 18,601 | 16,141 | 5,362 | 6,084 | 15,864 | ||||||||||||||||||||||||
| Commercial banks | 76,113 | 1,444 | 8,487 | 9,589 | 56,593 | 23,321 | 17,604 | 15,003 | 5,076 | 4,880 | 10,229 | ||||||||||||||||||||||||
| Savings institutions | 13,681 | 196 | 1,638 | 3,307 | 8,539 | 4,420 | 997 | 1,138 | 286 | 1,205 | 5,635 | ||||||||||||||||||||||||
Performance Ratios (annualized, %) | |||||||||||||||||||||||||||||||||||
| Yield on earning assets | 5.39 | 5.95 | 5.87 | 5.46 | 5.26 | 5.18 | 5.34 | 5.29 | 6.26 | 5.61 | 5.68 | ||||||||||||||||||||||||
| Cost of funding earning assets | 1.67 | 1.87 | 1.88 | 1.72 | 1.61 | 1.79 | 1.63 | 1.71 | 1.71 | 1.56 | 1.46 | ||||||||||||||||||||||||
| Net interest margin | 3.72 | 4.09 | 3.99 | 3.74 | 3.65 | 3.39 | 3.71 | 3.58 | 4.56 | 4.05 | 4.21 | ||||||||||||||||||||||||
| Noninterest income to assets | 2.28 | 1.34 | 1.46 | 1.84 | 2.56 | 2.63 | 2.17 | 1.92 | 2.66 | 1.99 | 2.11 | ||||||||||||||||||||||||
| Noninterest expense to assets | 3.17 | 3.62 | 3.29 | 3.07 | 3.16 | 3.25 | 3.15 | 2.86 | 3.86 | 3.62 | 3.00 | ||||||||||||||||||||||||
| Loan and lease loss provision to assets | 0.44 | 0.24 | 0.27 | 0.34 | 0.49 | 0.50 | 0.28 | 0.46 | 0.68 | 0.27 | 0.47 | ||||||||||||||||||||||||
| Net operating income to assets | 1.26 | 0.91 | 1.12 | 1.22 | 1.31 | 1.15 | 1.28 | 1.19 | 1.56 | 1.28 | 1.50 | ||||||||||||||||||||||||
| Pretax return on assets | 2.05 | 1.30 | 1.67 | 2.02 | 2.16 | 1.89 | 2.04 | 1.92 | 2.33 | 1.88 | 2.61 | ||||||||||||||||||||||||
| Return on assets | 1.37 | 0.98 | 1.20 | 1.36 | 1.42 | 1.24 | 1.38 | 1.31 | 1.62 | 1.39 | 1.65 | ||||||||||||||||||||||||
| Return on equity | 15.00 | 8.45 | 11.95 | 13.20 | 16.41 | 14.03 | 15.30 | 15.25 | 15.25 | 14.45 | 16.45 | ||||||||||||||||||||||||
| Net charge-offs to loans and leases | 0.77 | 0.26 | 0.32 | 0.52 | 0.94 | 1.16 | 0.56 | 0.65 | 0.97 | 0.38 | 0.64 | ||||||||||||||||||||||||
| Loan and lease loss provision to net charge-offs | 94.60 | 153.55 | 131.38 | 107.85 | 89.80 | 87.37 | 80.67 | 109.54 | 102.18 | 115.46 | 103.96 | ||||||||||||||||||||||||
| Efficiency ratio | 56.59 | 70.97 | 63.59 | 57.46 | 54.76 | 58.03 | 58.23 | 54.96 | 55.49 | 63.33 | 50.62 | ||||||||||||||||||||||||
| % of unprofitable institutions | 5.42 | 9.09 | 2.00 | 2.13 | 0.89 | 5.98 | 8.61 | 4.59 | 3.22 | 5.17 | 8.43 | ||||||||||||||||||||||||
| % of institutions with earnings gains | 57.63 | 52.00 | 62.65 | 64.68 | 64.29 | 60.10 | 64.01 | 59.42 | 52.45 | 50.75 | 70.04 | ||||||||||||||||||||||||
Condition Ratios (%) | |||||||||||||||||||||||||||||||||||
| Earning assets to total assets | 86.08 | 91.59 | 91.86 | 90.69 | 83.85 | 83.64 | 84.37 | 88.31 | 90.51 | 89.82 | 88.10 | ||||||||||||||||||||||||
| Loss Allowance to: | |||||||||||||||||||||||||||||||||||
| Loans and leases | 1.59 | 1.42 | 1.37 | 1.47 | 1.67 | 1.94 | 1.42 | 1.64 | 1.77 | 1.38 | 1.23 | ||||||||||||||||||||||||
| Noncurrent loans and leases | 136.49 | 116.76 | 147.13 | 159.01 | 132.02 | 122.18 | 160.25 | 125.16 | 189.77 | 133.42 | 152.15 | ||||||||||||||||||||||||
| Noncurrent assets plus other real estate owned to assets | 0.77 | 0.91 | 0.73 | 0.65 | 0.80 | 0.84 | 0.60 | 0.96 | 0.74 | 0.78 | 0.64 | ||||||||||||||||||||||||
| Equity capital ratio | 9.13 | 11.44 | 10.03 | 10.49 | 8.59 | 8.96 | 8.83 | 8.65 | 10.79 | 9.64 | 9.74 | ||||||||||||||||||||||||
| Core capital (leverage) ratio | 7.87 | 11.09 | 9.47 | 9.19 | 7.17 | 7.71 | 7.47 | 7.73 | 9.94 | 8.53 | 7.95 | ||||||||||||||||||||||||
| Tier 1 risk-based capital ratio | 10.66 | 17.02 | 13.80 | 13.48 | 9.40 | 10.74 | 9.53 | 9.80 | 14.04 | 12.80 | 11.36 | ||||||||||||||||||||||||
| Total risk-based capital ratio | 13.22 | 18.13 | 15.03 | 15.16 | 12.40 | 13.47 | 12.15 | 12.72 | 15.44 | 14.34 | 13.76 | ||||||||||||||||||||||||
| Net loans and leases to deposits | 89.71 | 72.12 | 79.11 | 90.34 | 93.00 | 76.75 | 90.00 | 97.22 | 100.66 | 78.20 | 110.95 | ||||||||||||||||||||||||
| Net loans to total assets | 58.68 | 60.28 | 63.49 | 60.31 | 57.38 | 48.25 | 60.13 | 64.23 | 67.94 | 59.54 | 69.88 | ||||||||||||||||||||||||
| Domestic deposits to total assets | 57.67 | 83.57 | 80.14 | 66.06 | 50.81 | 46.43 | 62.54 | 61.20 | 66.27 | 75.86 | 61.13 | ||||||||||||||||||||||||
Structural Changes | |||||||||||||||||||||||||||||||||||
| New Charters | 81 | 77 | 3 | 1 | 0 | 7 | 26 | 5 | 9 | 12 | 22 | ||||||||||||||||||||||||
| Institutions absorbed by mergers | 187 | 86 | 89 | 9 | 3 | 32 | 26 | 38 | 35 | 29 | 27 | ||||||||||||||||||||||||
| Failed Institutions | 2 | 1 | 1 | 0 | 0 | 0 | 0 | 1 | 0 | 0 | 1 | ||||||||||||||||||||||||
PRIOR FIRST THREE QUARTERS (The way it was...) | |||||||||||||||||||||||||||||||||||
| Number of institutions | |||||||||||||||||||||||||||||||||||
| 2002 | 9,415 | 4,809 | 4,059 | 441 | 106 | 1,222 | 1,249 | 2,067 | 2,180 | 1,910 | 787 | ||||||||||||||||||||||||
| 2000 | 9,989 | 5,558 | 3,902 | 428 | 101 | 1,304 | 1,320 | 2,221 | 2,277 | 2,035 | 832 | ||||||||||||||||||||||||
| 1998 | 10,624 | 6,305 | 3,791 | 447 | 81 | 1,363 | 1,358 | 2,389 | 2,422 | 2,226 | 866 | ||||||||||||||||||||||||
Total assets (in billions) | |||||||||||||||||||||||||||||||||||
| 2002 | $ | 8,272.9 | $ | 243.9 | $ | 1,113.3 | $ | 1,256.3 | $ | 5,659.5 | $ | 2,826.3 | $ | 1,667.5 | $ | 1,561.4 | $ | 429.8 | $ | 569.2 | $ | 1,218.7 | |||||||||||||
| 2000 | 7,269.5 | 264.6 | 1,019.3 | 1,215.6 | 4,770.1 | 2,489.3 | 1,565.9 | 1,227.6 | 450.5 | 549.2 | 986.9 | ||||||||||||||||||||||||
| 1998 | 6,327.5 | 295.2 | 978.9 | 1,295.6 | 3,757.8 | 2,274.0 | 1,083.7 | 1,007.1 | 397.9 | 535.5 | 1,029.4 | ||||||||||||||||||||||||
Return on assets (%) | |||||||||||||||||||||||||||||||||||
| 2002 | 1.34 | 1.05 | 1.18 | 1.45 | 1.36 | 1.17 | 1.36 | 1.33 | 1.59 | 1.43 | 1.60 | ||||||||||||||||||||||||
| 2000 | 1.16 | 1.06 | 1.18 | 1.26 | 1.14 | 1.24 | 1.01 | 1.04 | 1.36 | 1.10 | 1.28 | ||||||||||||||||||||||||
| 1998 | 1.20 | 1.19 | 1.25 | 1.47 | 1.09 | 1.07 | 1.27 | 1.27 | 1.44 | 1.26 | 1.21 | ||||||||||||||||||||||||
Net charge-offs to loans & leases (%) | |||||||||||||||||||||||||||||||||||
| 2002 | 0.97 | 0.28 | 0.33 | 0.74 | 1.19 | 1.48 | 0.69 | 0.77 | 1.19 | 0.40 | 0.79 | ||||||||||||||||||||||||
| 2000 | 0.51 | 0.22 | 0.27 | 0.53 | 0.58 | 0.63 | 0.42 | 0.34 | 0.73 | 0.32 | 0.64 | ||||||||||||||||||||||||
| 1998 | 0.58 | 0.22 | 0.28 | 0.87 | 0.58 | 0.79 | 0.42 | 0.36 | 0.66 | 0.37 | 0.65 | ||||||||||||||||||||||||
Noncurrent assets plus OREO to assets (%) | |||||||||||||||||||||||||||||||||||
| 2002 | 0.92 | 0.87 | 0.75 | 0.73 | 1.00 | 1.05 | 0.79 | 1.04 | 0.87 | 0.84 | 0.72 | ||||||||||||||||||||||||
| 2000 | 0.67 | 0.69 | 0.59 | 0.64 | 0.70 | 0.70 | 0.69 | 0.67 | 0.60 | 0.66 | 0.59 | ||||||||||||||||||||||||
| 1998 | 0.67 | 0.77 | 0.67 | 0.77 | 0.62 | 0.76 | 0.55 | 0.60 | 0.64 | 0.63 | 0.68 | ||||||||||||||||||||||||
Equity capital ratio (%) | |||||||||||||||||||||||||||||||||||
| 2002 | 9.22 | 11.42 | 10.05 | 10.08 | 8.78 | 8.92 | 9.42 | 8.62 | 10.32 | 9.76 | 9.79 | ||||||||||||||||||||||||
| 2000 | 8.55 | 11.34 | 9.70 | 8.90 | 8.06 | 8.46 | 8.44 | 8.18 | 9.46 | 8.78 | 8.84 | ||||||||||||||||||||||||
| 1998 | 8.73 | 11.32 | 10.04 | 9.70 | 7.86 | 8.03 | 9.42 | 8.93 | 9.19 | 9.17 | 8.98 | ||||||||||||||||||||||||
- *
- Regions:
New York—Connecticut, Delaware, District of Columbia, Maine, Maryland, Massachusetts, New Hampshire, New Jersey, New York, Pennsylvania, Puerto Rico Rhode Island, Vermont, U.S. Virgin Islands
Altanta—Alabama, Florida, Georgia, North Carolina, South Carolina, Virginia, West Virginia
Chicago—Illinois, Indiana, Kentucky, Michigan, Ohio, Wisconsin
Kansas City—Iowa, Kansas, Minnesota, Missouri, Nebraska, North Dakota, South Dakota
Dallas—Arkansas, Colorado, Louisiana, Mississippi, New Mexico, Oklahoma, Tennessee, Texas
San Francisco—Alaska, Arizona, California, Hawaii, Idaho, Montana, Nevada, Oregon, Pacific Islands, Utah, Washington, Wyoming
C-12
TABLE V-A. Loan Performance, All FDIC-Insured Institutions
| | | Asset Concentration Groups* | |||||||||||||||||||||||||||||
|---|---|---|---|---|---|---|---|---|---|---|---|---|---|---|---|---|---|---|---|---|---|---|---|---|---|---|---|---|---|---|---|
| September 30, 2003 | All Insured Institutions | International Banks | Agricultural Banks | Credit Card Banks | Commercial Lenders | Mortgage Lenders | Consumer Lenders | Other Specialized <$1 Billion | All Other <$1 Billion | All Other >$1 Billion | |||||||||||||||||||||
| Percent of Loans 30-89 Days Past Due | |||||||||||||||||||||||||||||||
| All loans secured by real estate | 0.85 | 1.23 | 1.11 | 0.81 | 0.72 | 0.91 | 0.86 | 1.20 | 1.30 | 0.87 | |||||||||||||||||||||
| Construction and development | 0.79 | 2.00 | 1.22 | 0.69 | 0.74 | 1.13 | 1.09 | 1.36 | 1.48 | 0.60 | |||||||||||||||||||||
| Commercial real estate | 0.57 | 0.75 | 1.16 | 0.10 | 0.57 | 0.47 | 0.65 | 0.86 | 1.05 | 0.44 | |||||||||||||||||||||
| Multifamily residential real estate | 0.32 | 0.15 | 0.70 | 0.29 | 0.34 | 0.22 | 2.52 | 0.39 | 0.90 | 0.36 | |||||||||||||||||||||
| Home equity loans | 0.41 | 0.51 | 0.54 | 0.52 | 0.40 | 0.25 | 0.21 | 0.27 | 0.65 | 0.67 | |||||||||||||||||||||
| Other 1-4 family residential | 1.09 | 1.36 | 1.66 | 2.43 | 1.03 | 1.06 | 1.02 | 1.48 | 1.48 | 1.08 | |||||||||||||||||||||
| Commercial and industrial loans | 0.75 | 0.51 | 1.71 | 1.52 | 0.90 | 0.58 | 1.12 | 1.68 | 1.53 | 0.51 | |||||||||||||||||||||
| Loans to individuals | 1.85 | 2.02 | 2.26 | 2.38 | 1.54 | 1.09 | 1.99 | 2.29 | 2.16 | 1.55 | |||||||||||||||||||||
| Credit card loans | 2.33 | 2.26 | 2.27 | 2.44 | 2.20 | 1.39 | 2.08 | 3.20 | 2.51 | 1.98 | |||||||||||||||||||||
| Other loans to individuals | 1.60 | 1.89 | 2.25 | 1.16 | 1.46 | 1.07 | 1.97 | 2.13 | 2.15 | 1.49 | |||||||||||||||||||||
| All other loans and leases (including farm) | 0.46 | 0.41 | 0.63 | 0.00 | 0.73 | 0.81 | 0.52 | 0.37 | 1.13 | 0.23 | |||||||||||||||||||||
| Total loans and leases | 0.94 | 1.06 | 1.17 | 2.03 | 0.84 | 0.90 | 1.28 | 1.37 | 1.44 | 0.77 | |||||||||||||||||||||
Percent of Loans Noncurrent** | |||||||||||||||||||||||||||||||
| All real estate loans | 0.81 | 1.23 | 1.17 | 0.46 | 0.78 | 0.81 | 0.89 | 0.92 | 1.03 | 0.72 | |||||||||||||||||||||
| Construction and development | 0.87 | 2.59 | 1.35 | 0.02 | 0.75 | 1.09 | 1.60 | 1.56 | 1.77 | 1.09 | |||||||||||||||||||||
| Commercial real estate | 0.96 | 2.27 | 1.38 | 0.15 | 0.86 | 1.00 | 1.83 | 0.93 | 1.32 | 1.17 | |||||||||||||||||||||
| Multifamily residential real estate | 0.31 | 0.73 | 1.21 | 0.00 | 0.32 | 0.22 | 0.17 | 0.41 | 0.79 | 0.39 | |||||||||||||||||||||
| Home equity loans | 0.23 | 0.14 | 0.25 | 0.19 | 0.24 | 0.14 | 0.21 | 0.10 | 0.25 | 0.38 | |||||||||||||||||||||
| Other 1-4 family residential | 0.83 | 0.95 | 0.99 | 1.96 | 0.87 | 0.89 | 0.92 | 0.94 | 0.87 | 0.58 | |||||||||||||||||||||
| Commercial and industrial loans | 2.51 | 4.79 | 2.19 | 1.30 | 1.86 | 1.48 | 2.25 | 1.77 | 1.86 | 2.62 | |||||||||||||||||||||
| Loans to individuals | 1.29 | 2.34 | 0.88 | 1.96 | 0.62 | 0.34 | 0.78 | 1.18 | 0.84 | 0.68 | |||||||||||||||||||||
| Credit card loans | 1.93 | 1.95 | 1.76 | 2.02 | 1.57 | 1.04 | 1.75 | 3.22 | 2.06 | 1.67 | |||||||||||||||||||||
| Other loans to individuals | 0.95 | 2.56 | 0.86 | 0.51 | 0.51 | 0.28 | 0.59 | 0.82 | 0.78 | 0.53 | |||||||||||||||||||||
| All other loans and leases (including farm) | 0.71 | 0.60 | 1.33 | 0.00 | 1.08 | 0.67 | 1.33 | 0.88 | 1.09 | 0.46 | |||||||||||||||||||||
| Total loans and leases | 1.17 | 2.31 | 1.33 | 1.66 | 1.01 | 0.82 | 0.99 | 1.05 | 1.10 | 1.09 | |||||||||||||||||||||
Percent of Loans Charged-off (net, YTD) | |||||||||||||||||||||||||||||||
| All real estate loans | 0.11 | 0.14 | 0.07 | 0.17 | 0.12 | 0.06 | 0.29 | 0.05 | 0.08 | 0.14 | |||||||||||||||||||||
| Construction and development | 0.12 | 0.55 | 0.19 | -0.25 | 0.09 | 0.15 | 0.07 | 0.15 | 0.26 | 0.22 | |||||||||||||||||||||
| Commercial real estate | 0.12 | -0.03 | 0.11 | -0.02 | 0.13 | 0.21 | 0.03 | 0.00 | 0.10 | 0.08 | |||||||||||||||||||||
| Multifamily residential real estate | 0.02 | 0.19 | 0.11 | 0.11 | 0.02 | 0.01 | 0.91 | 0.00 | 0.03 | 0.00 | |||||||||||||||||||||
| Home equity loans | 0.16 | 0.04 | 0.08 | 0.13 | 0.14 | 0.07 | 0.48 | -0.04 | 0.05 | 0.27 | |||||||||||||||||||||
| Other 1-4 family residential | 0.09 | 0.04 | 0.07 | 0.45 | 0.14 | 0.04 | 0.29 | 0.07 | 0.06 | 0.13 | |||||||||||||||||||||
| Commercial and industrial loans | 1.30 | 1.68 | 0.62 | 5.49 | 1.24 | 0.96 | 2.51 | 0.64 | 0.68 | 1.08 | |||||||||||||||||||||
| Loans to individuals | 2.94 | 3.34 | 0.72 | 5.76 | 1.45 | 1.46 | 2.79 | 8.08 | 1.02 | 1.69 | |||||||||||||||||||||
| Credit card loans | 5.71 | 4.67 | 3.77 | 5.91 | 5.02 | 2.92 | 8.44 | 25.31 | 5.10 | 7.37 | |||||||||||||||||||||
| Other loans to individuals | 1.41 | 2.50 | 0.63 | 2.43 | 1.01 | 1.34 | 1.59 | 0.82 | 0.82 | 0.93 | |||||||||||||||||||||
| All other loans and leases (including farm) | 0.44 | 0.43 | 0.00 | 0.00 | 0.60 | 0.65 | 0.49 | 0.29 | 0.58 | 0.34 | |||||||||||||||||||||
| Total loans and leases | 0.80 | 1.50 | 0.20 | 5.20 | 0.50 | 0.20 | 1.40 | 1.40 | 0.30 | 0.60 | |||||||||||||||||||||
Loans Outstanding (in billions) | |||||||||||||||||||||||||||||||
| All real estate loans | $ | 3,124.9 | $ | 127.4 | $ | 41.6 | $ | 11.9 | $ | 1,317.5 | $ | 946.7 | $ | 74.5 | $ | 11.5 | $ | 74.9 | $ | 518.8 | |||||||||||
| Construction and development | 263.7 | 1.6 | 2.1 | 0.2 | 191.6 | 26.8 | 1.9 | 0.8 | 4.2 | 34.5 | |||||||||||||||||||||
| Commercial real estate | 665.7 | 7.3 | 9.9 | 0.3 | 463.3 | 63.3 | 6.9 | 3.1 | 17.4 | 94.1 | |||||||||||||||||||||
| Multifamily residential real estate | 147.6 | 1.4 | 0.7 | 0.1 | 84.3 | 43.9 | 0.6 | 0.5 | 1.6 | 14.6 | |||||||||||||||||||||
| Home equity loans | 314.9 | 11.1 | 0.7 | 9.6 | 133.5 | 84.6 | 13.4 | 0.5 | 3.2 | 58.3 | |||||||||||||||||||||
| Other 1-4 family residential | 1,654.0 | 79.8 | 13.6 | 1.8 | 423.5 | 726.6 | 51.5 | 6.3 | 44.4 | 306.5 | |||||||||||||||||||||
| Commercial and industrial loans | 931.5 | 156.6 | 11.5 | 9.4 | 447.6 | 61.1 | 13.2 | 2.1 | 11.5 | 218.6 | |||||||||||||||||||||
| Loans to individuals | 772.3 | 169.2 | 6.9 | 164.0 | 191.5 | 56.2 | 57.0 | 2.3 | 15.3 | 109.8 | |||||||||||||||||||||
| Credit card loans | 266.6 | 60.7 | 0.2 | 156.6 | 20.3 | 4.6 | 9.3 | 0.4 | 0.7 | 13.9 | |||||||||||||||||||||
| Other loans to individuals | 505.7 | 108.6 | 6.7 | 7.4 | 171.2 | 51.7 | 47.7 | 2.0 | 14.6 | 95.9 | |||||||||||||||||||||
| All other loans and leases (including farm) | 508.1 | 150.4 | 21.0 | 18.7 | 130.3 | 17.4 | 8.5 | 0.9 | 6.5 | 154.5 | |||||||||||||||||||||
| Total loans and leases | 5,336.9 | 603.6 | 81.1 | 204.1 | 2,086.8 | 1,081.4 | 153.3 | 16.8 | 108.2 | 1,001.6 | |||||||||||||||||||||
Memo: Other Real Estate Owned (in millions) | |||||||||||||||||||||||||||||||
| All other real estate owned | 5,513.8 | 286.6 | 151.6 | 7.2 | 2,668.5 | 1,196.7 | 162.4 | 34.9 | 225.1 | 780.7 | |||||||||||||||||||||
| Construction and development | 691.8 | 0.0 | 11.3 | 0.0 | 432.4 | 147.3 | 2.1 | 2.1 | 25.2 | 71.5 | |||||||||||||||||||||
| Commercial real estate | 1,967.6 | 92.4 | 61.3 | 0.2 | 1,226.4 | 127.1 | 13.3 | 15.5 | 89.7 | 341.6 | |||||||||||||||||||||
| Multifamily residential real estate | 128.3 | 6.0 | 2.6 | 0.0 | 76.7 | 5.4 | 0.2 | 0.5 | 4.4 | 32.5 | |||||||||||||||||||||
| 1-4 family residential | 2,516.2 | 108.2 | 41.3 | 7.0 | 876.2 | 912.6 | 145.5 | 16.6 | 95.4 | 313.5 | |||||||||||||||||||||
| Farmland | 108.2 | 0.0 | 35.2 | 0.0 | 50.0 | 6.5 | 1.4 | 0.3 | 10.5 | 4.3 | |||||||||||||||||||||
- *
- See page 8 for explanations.
- **
- Noncurrent loan rates represent the percentage of loans in each category that are past due 90 days or more or that are in nonaccrual status.
C-13
TABLE V-A. Loan Performance, All FDIC-Insured Institutions
| | | Asset Size Distribution | Geographic Regions* | |||||||||||||||||||||||||||||||
|---|---|---|---|---|---|---|---|---|---|---|---|---|---|---|---|---|---|---|---|---|---|---|---|---|---|---|---|---|---|---|---|---|---|---|
| September 30, 2003 | All Insured Institutions | Less than $100 Million | $100 Million to $1 Billion | $1 Billion to $10 Billion | Greater than $10 Billion | New York | Atlanta | Chicago | Kansas City | Dallas | San Francisco | |||||||||||||||||||||||
| Percent of Loans 30-89 Days Past Due | ||||||||||||||||||||||||||||||||||
| All loans secured by real estate | 0.85 | 1.29 | 0.85 | 0.68 | 0.87 | 0.80 | 0.73 | 1.09 | 0.76 | 1.02 | 0.77 | |||||||||||||||||||||||
| Construction and development | 0.79 | 1.10 | 0.86 | 0.74 | 0.76 | 0.68 | 0.53 | 1.01 | 0.69 | 0.91 | 0.98 | |||||||||||||||||||||||
| Commercial real estate | 0.57 | 0.97 | 0.64 | 0.58 | 0.48 | 0.52 | 0.45 | 0.77 | 0.62 | 0.74 | 0.38 | |||||||||||||||||||||||
| Multifamily residential real estate | 0.32 | 0.70 | 0.44 | 0.34 | 0.27 | 0.16 | 0.23 | 0.68 | 0.52 | 0.87 | 0.18 | |||||||||||||||||||||||
| Home equity loans | 0.41 | 0.57 | 0.42 | 0.35 | 0.42 | 0.38 | 0.43 | 0.49 | 0.49 | 0.49 | 0.27 | |||||||||||||||||||||||
| Other 1-4 family residential | 1.09 | 1.75 | 1.16 | 0.83 | 1.10 | 0.96 | 1.00 | 1.50 | 0.92 | 1.32 | 0.99 | |||||||||||||||||||||||
| Commercial and industrial loans | 0.75 | 1.65 | 1.23 | 1.01 | 0.61 | 0.64 | 0.60 | 0.87 | �� | 1.21 | 1.05 | 0.77 | ||||||||||||||||||||||
| Loans to individuals | 1.85 | 2.50 | 1.97 | 1.89 | 1.81 | 1.94 | 1.78 | 1.73 | 2.31 | 1.64 | 1.67 | |||||||||||||||||||||||
| Credit card loans | 2.33 | 2.38 | 4.17 | 3.01 | 2.21 | 2.34 | 3.08 | 2.51 | 2.81 | 1.01 | 1.84 | |||||||||||||||||||||||
| Other loans to individuals | 1.60 | 2.51 | 1.70 | 1.52 | 1.56 | 1.67 | 1.50 | 1.58 | 1.65 | 1.76 | 1.47 | |||||||||||||||||||||||
| All other loans and leases (including farm) | 0.46 | 0.97 | 0.55 | 0.47 | 0.43 | 0.43 | 0.24 | 0.62 | 0.49 | 0.65 | 0.52 | |||||||||||||||||||||||
| Total loans and leases | 0.94 | 1.44 | 0.98 | 0.87 | 0.93 | 0.95 | 0.79 | 1.07 | 1.06 | 1.08 | 0.87 | |||||||||||||||||||||||
Percent of Loans Noncurrent** | ||||||||||||||||||||||||||||||||||
| All real estate loans | 0.81 | 1.07 | 0.82 | 0.80 | 0.80 | 0.81 | 0.58 | 1.21 | 0.65 | 0.98 | 0.66 | |||||||||||||||||||||||
| Construction and development | 0.87 | 1.00 | 0.96 | 0.86 | 0.82 | 0.90 | 0.67 | 1.22 | 0.79 | 0.69 | 0.92 | |||||||||||||||||||||||
| Commercial real estate | 0.96 | 1.17 | 0.88 | 0.97 | 0.99 | 0.88 | 0.81 | 1.32 | 0.79 | 1.08 | 0.76 | |||||||||||||||||||||||
| Multifamily residential real estate | 0.31 | 0.74 | 0.42 | 0.37 | 0.24 | 0.21 | 0.24 | 0.64 | 0.44 | 0.85 | 0.14 | |||||||||||||||||||||||
| Home equity loans | 0.23 | 0.27 | 0.22 | 0.23 | 0.23 | 0.19 | 0.18 | 0.35 | 0.34 | 0.31 | 0.13 | |||||||||||||||||||||||
| Other 1-4 family residential | 0.83 | 1.06 | 0.81 | 0.80 | 0.84 | 0.79 | 0.55 | 1.46 | 0.52 | 0.96 | 0.73 | |||||||||||||||||||||||
| Commercial and industrial loans | 2.51 | 1.92 | 1.44 | 1.63 | 2.84 | 3.65 | 2.18 | 2.26 | 1.32 | 1.40 | 1.57 | |||||||||||||||||||||||
| Loans to individuals | 1.29 | 1.01 | 0.88 | 0.84 | 1.41 | 1.90 | 0.84 | 0.69 | 1.56 | 0.68 | 0.98 | |||||||||||||||||||||||
| Credit card loans | 1.93 | 1.51 | 2.97 | 1.84 | 1.91 | 2.13 | 2.17 | 1.64 | 2.16 | 0.80 | 1.54 | |||||||||||||||||||||||
| Other loans to individuals | 0.95 | 1.00 | 0.62 | 0.52 | 1.08 | 1.74 | 0.55 | 0.51 | 0.78 | 0.66 | 0.34 | |||||||||||||||||||||||
| All other loans and leases (including farm) | 0.71 | 1.27 | 1.25 | 0.74 | 0.65 | 0.76 | 0.46 | 0.71 | 0.77 | 1.43 | 0.75 | |||||||||||||||||||||||
| Total loans and leases | 1.17 | 1.21 | 0.93 | 0.93 | 1.26 | 1.59 | 0.88 | 1.31 | 0.93 | 1.04 | 0.81 | |||||||||||||||||||||||
Percent of Loans Charged-off (net, YTD) | ||||||||||||||||||||||||||||||||||
| All real estate loans | 0.11 | 0.07 | 0.07 | 0.10 | 0.12 | 0.07 | 0.09 | 0.25 | 0.07 | 0.13 | 0.05 | |||||||||||||||||||||||
| Construction and development | 0.12 | 0.11 | 0.09 | 0.12 | 0.14 | 0.05 | 0.09 | 0.18 | 0.12 | 0.17 | 0.08 | |||||||||||||||||||||||
| Commercial real estate | 0.12 | 0.07 | 0.08 | 0.15 | 0.15 | 0.07 | 0.07 | 0.27 | 0.07 | 0.10 | 0.11 | |||||||||||||||||||||||
| Multifamily residential real estate | 0.02 | 0.11 | 0.03 | 0.00 | 0.02 | 0.01 | 0.02 | 0.03 | 0.02 | 0.09 | 0.01 | |||||||||||||||||||||||
| Home equity loans | 0.16 | 0.06 | 0.04 | 0.11 | 0.18 | 0.04 | 0.14 | 0.30 | 0.15 | 0.20 | 0.06 | |||||||||||||||||||||||
| Other 1-4 family residential | 0.09 | 0.07 | 0.07 | 0.08 | 0.10 | 0.04 | 0.08 | 0.26 | 0.06 | 0.14 | 0.03 | |||||||||||||||||||||||
| Commercial and industrial loans | 1.30 | 0.63 | 0.68 | 0.94 | 1.47 | 1.61 | 1.17 | 1.23 | 0.71 | 0.77 | 1.36 | |||||||||||||||||||||||
| Loans to individuals | 2.94 | 0.85 | 1.87 | 2.37 | 3.19 | 3.55 | 2.18 | 1.77 | 3.82 | 1.11 | 3.70 | |||||||||||||||||||||||
| Credit card loans | 5.71 | 4.34 | 9.89 | 6.69 | 5.49 | 5.71 | 7.68 | 5.04 | 5.79 | 2.50 | 5.45 | |||||||||||||||||||||||
| Other loans to individuals | 1.41 | 0.76 | 0.81 | 0.93 | 1.62 | 1.90 | 1.04 | 1.16 | 0.58 | 0.86 | 1.84 | |||||||||||||||||||||||
| All other loans and leases (including farm) | 0.44 | 0.32 | 0.40 | 0.39 | 0.45 | 0.49 | 0.32 | 0.50 | 0.30 | 0.51 | 0.38 | |||||||||||||||||||||||
| Total loans and leases | 0.80 | 0.30 | 0.30 | 0.50 | 0.90 | 1.20 | 0.60 | 0.70 | 1.00 | 0.40 | 0.60 | |||||||||||||||||||||||
Loans Outstanding (in billions) | ||||||||||||||||||||||||||||||||||
All real estate loans | $ | 3,124.9 | $ | 89.7 | $ | 551.4 | $ | 542.4 | $ | 1,941.4 | $ | 705.1 | $ | 704.0 | $ | 616.0 | $ | 163.8 | $ | 237.6 | $ | 698.5 | ||||||||||||
| Construction and development | 263.7 | 8.6 | 68.2 | 60.5 | 126.4 | 31.1 | 78.6 | 61.3 | 15.9 | 37.3 | 39.5 | |||||||||||||||||||||||
| Commercial real estate | 665.7 | 24.9 | 193.0 | 157.0 | 290.8 | 132.6 | 161.2 | 147.5 | 43.9 | 72.9 | 107.6 | |||||||||||||||||||||||
| Multifamily residential real estate | 147.6 | 2.2 | 24.8 | 35.4 | 85.2 | 37.4 | 18.9 | 27.7 | 5.2 | 6.5 | 51.9 | |||||||||||||||||||||||
| Home equity loans | 314.9 | 2.9 | 30.7 | 37.4 | 243.9 | 67.5 | 76.5 | 87.0 | 8.9 | 15.9 | 59.0 | |||||||||||||||||||||||
| Other 1-4 family residential | 1,654.0 | 40.8 | 216.2 | 246.4 | 1,150.5 | 403.9 | 359.5 | 282.2 | 77.2 | 95.1 | 436.1 | |||||||||||||||||||||||
| Commercial and industrial loans | 931.5 | 20.9 | 104.8 | 117.8 | 687.9 | 299.9 | 197.7 | 218.8 | 45.9 | 59.8 | 109.4 | |||||||||||||||||||||||
| Loans to individuals | 772.3 | 14.6 | 60.3 | 96.4 | 601.0 | 298.7 | 133.9 | 125.2 | 55.2 | 43.3 | 116.1 | |||||||||||||||||||||||
| Credit card loans | 266.6 | 0.3 | 6.6 | 23.8 | 235.9 | 122.6 | 24.2 | 20.6 | 31.3 | 6.6 | 61.3 | |||||||||||||||||||||||
| Other loans to individuals | 505.7 | 14.3 | 53.7 | 72.6 | 365.1 | 176.1 | 109.6 | 104.6 | 23.9 | 36.6 | 54.8 | |||||||||||||||||||||||
| All other loans and leases (including farm) | 508.1 | 14.9 | 30.7 | 39.4 | 423.0 | 194.6 | 98.5 | 120.1 | 43.2 | 17.4 | 34.3 | |||||||||||||||||||||||
| Total loans and leases | 5,336.9 | 140.2 | 747.3 | 796.1 | 3,653.4 | 1,498.3 | 1,134.1 | 1,080.1 | 308.1 | 358.0 | 958.3 | |||||||||||||||||||||||
Memo: Other Real Estate Owned (in millions) | ||||||||||||||||||||||||||||||||||
| All other real estate owned | 5,513.8 | 374.2 | 1,475.4 | 981.6 | 2,682.6 | 750.3 | 1,210.3 | 1,376.5 | 437.4 | 889.6 | 849.6 | |||||||||||||||||||||||
| Construction and development | 691.8 | 53.5 | 250.0 | 167.6 | 220.8 | 36.6 | 131.7 | 151.2 | 91.1 | 184.1 | 97.1 | |||||||||||||||||||||||
| Commercial real estate | 1,967.6 | 150.2 | 664.3 | 486.5 | 666.6 | 276.6 | 496.4 | 354.7 | 181.1 | 345.2 | 313.6 | |||||||||||||||||||||||
| Multifamily residential real estate | 128.3 | 11.5 | 39.1 | 29.6 | 48.2 | 9.5 | 40.6 | 20.9 | 8.7 | 39.9 | 8.7 | |||||||||||||||||||||||
| 1-4 family residential | 2,516.2 | 134.8 | 463.9 | 301.6 | 1,615.8 | 320.5 | 529.6 | 837.2 | 135.0 | 291.4 | 402.5 | |||||||||||||||||||||||
| Farmland | 108.2 | 24.5 | 59.1 | 7.3 | 17.3 | 1.9 | 13.7 | 12.8 | 22.9 | 29.9 | 27.0 | |||||||||||||||||||||||
- *
- See page 9 for explanations.
- **
- Noncurrent loan rates represent the percentage of loans in each category that are past due 90 days or more or that are in nonaccrual status.
C-14
- •
- Third Quarter Deposit Growth Is Flat
- •
- BIF Reserve Ratio Rises 2 Basis Points to 1.31 Percent
- •
- SAIF Reserve Ratio Increases 1 Basis Point to 1.40 Percent
Total deposits held by insured institutions increased by only 0.1 percent ($6.4 billion) during the third quarter, as domestic deposits decreased by 0.15 percent ($7.7 billion), and foreign office deposits increased by 2.1 percent ($14.1 billion). The domestic deposit decline was driven by decreased demand deposits (-$46.2 billion) and time deposits under $100 thousand (-$18.0 billion). These decreases were partially offset by increases in money market deposit accounts (+$41.9 billion) and other savings deposits (+$8.9 billion). During the first nine months of 2003, deposits held by insured institutions rose by 5.1 percent ($282.6 billion), as domestic deposits increased by 5.1 percent ($248.4 billion), and foreign office deposits grew by 5.2 percent ($34.1 billion).
Deposits insured by the FDIC decreased by 0.1 percent ($3.1 billion) during the third quarter of 2003. This was the first decrease since the first quarter of 1999 when insured deposits dropped by 0.7 percent ($19.4 billion). Deposits insured by the Bank Insurance Fund (BIF) totaled $2.5 trillion on September 30, 2003, unchanged from the previous quarter. During the third quarter, the BIF increased by 2.0 percent ($662 million) to $33.46 billion (unaudited). More than four fifths of the increase to the BIF ($543 million) came from reducing reserves previously set aside for future estimated failure costs. The BIF was reduced $45 million by unrealized losses on available-for-sale securities, and was increased by $164 million (net of expenses) from interest on securities, insurance assessments, and other revenue. The increase to the BIF and the flat deposit growth pushed the reserve ratio of the Bank Insurance Fund to 1.31 percent, two basis points higher than the previous quarter, 6 basis points higher than the previous year, and the largest year-to year increase in 24 quarters.
Deposits insured by the Savings Association Insurance Fund (SAIF) decreased by 0.45 percent in the third quarter to $867.6 billion. This was the first quarterly decrease in SAIF-insured deposits since the second quarter of 1999. The balance of the SAIF was $12.19 billion (unaudited) on September 30, 2003, up $103 million during the quarter. The reserve ratio of the SAIF was 1.40 percent at the end of the third quarter, one basis point higher than three months earlier.
There were no failures of FDIC insured institutions during the third quarter of 2003. During the first nine months of 2003, two institutions failed; both were BIF-members. At the time of failure these institutions had $1.1 billion in assets with estimated loss to the insurance fund of $100 million.
Changes in Insurance Fund Balances
| | Bank Insurance Fund | Savings Association Insurance Fund | ||||||||||||||||||||||||||||||||||||||||
|---|---|---|---|---|---|---|---|---|---|---|---|---|---|---|---|---|---|---|---|---|---|---|---|---|---|---|---|---|---|---|---|---|---|---|---|---|---|---|---|---|---|---|
| (dollar figures in millions) | 3rd Qtr. 2003 | 2nd Qtr. 2003 | 1st Qtr. 2003 | 4th Qtr. 2002 | 3rd Qtr. 2002 | 2nd Qtr. 2002 | 1st Qtr. 2002 | 3rd Qtr. 2003 | 2nd Qtr. 2003 | 1st Qtr. 2003 | 4th Qtr. 2002 | 3rd Qtr. 2002 | 2nd Qtr. 2002 | 1st Qtr. 2002 | ||||||||||||||||||||||||||||
| Beginning Fund Balance | $ | 32,800 | $ | 32,382 | $ | 32,050 | $ | 31,383 | $ | 31,187 | $ | 30,697 | $ | 30,439 | $ | 12,083 | $ | 11,906 | $ | 11,747 | $ | 11,586 | $ | 11,323 | $ | 11,049 | $ | 10,935 | ||||||||||||||
| Unrealized Gain (Loss) on Available-For-Sale Securities | -45 | 38 | 103 | -72 | 433 | 183 | 22 | -16 | 13 | 33 | -26 | 147 | 61 | 10 | ||||||||||||||||||||||||||||
| Provision for Insurance Losses | -543 | -133 | -6 | -497 | 447 | -19 | -18 | -26 | -45 | -21 | -70 | -4 | -79 | -3 | ||||||||||||||||||||||||||||
| All Other Income, Net of Expenses | 164 | 247 | 223 | 242 | 210 | 288 | 218 | 93 | 119 | 105 | 117 | 112 | 134 | 101 | ||||||||||||||||||||||||||||
| Total Fund Balance Change | 662 | 418 | 332 | 667 | 196 | 490 | 258 | 103 | 177 | 159 | 161 | 263 | 274 | 114 | ||||||||||||||||||||||||||||
Ending Fund Balance | $ | 33,462 | $ | 32,800 | $ | 32,382 | $ | 32,050 | $ | 31,383 | $ | 31,187 | $ | 30,697 | $ | 12,186 | $ | 12,083 | $ | 11,906 | $ | 11,747 | $ | 11,586 | $ | 11,323 | $ | 11,049 | ||||||||||||||
C-15
TABLE I-B. Selected Insurance Fund Indicators*
| (dollar figures in millions) | 3rd Quarter 2003 | 2nd Quarter 2003 | 3rd Quarter 2002 | %Change 02:3-03:3 | |||||||
|---|---|---|---|---|---|---|---|---|---|---|---|
| Bank Insurance Fund | |||||||||||
| Reserve ratio (%) | 1.31 | 1.29 | 1.25 | 5.2 | |||||||
| Fund Balance | $ | 33,462 | 32,800 | 31,383 | 6.6 | ||||||
| Estimated insured deposits | 2,547,889 | 2,547,109 | 2,513,160 | 1.4 | |||||||
| SAIF-member Oakars | 102,116 | 100,398 | 90,087 | 13.4 | |||||||
| BIF-members | 2,445,773 | 2,446,711 | 2,423,073 | 0.9 | |||||||
| Assessment base | 4,090,423 | 4,085,149 | 3,769,397 | 8.5 | |||||||
| SAIF-member Oakars | 105,840 | 103,674 | 91,770 | 15.3 | |||||||
| BIF-members | 3,984,583 | 3,981,475 | 3,677,627 | 8.3 | |||||||
Savings Association Insurance Fund | |||||||||||
| Reserve ratio (%) | 1.40 | 1.39 | 1.39 | 1.0 | |||||||
| Fund Balance | $ | 12,186 | 12,083 | 11,586 | 5.2 | ||||||
| Estimated insured deposits | 867,562 | 871,477 | 833,029 | 4.1 | |||||||
| BIF-member Oakars | 391,866 | 393,601 | 354,919 | 10.4 | |||||||
| SAIF-member Sassers | 94,310 | 92,550 | 93,067 | 1.3 | |||||||
| Other SAIF members | 381,386 | 385,326 | 385,042 | -0.9 | |||||||
| Assessment base | 1,054,730 | 1,037,914 | 954,539 | 10.5 | |||||||
| BIF-member Oakars | 395,959 | 399,185 | 359,793 | 10.1 | |||||||
| SAIF-member Sassers | 118,850 | 115,187 | 113,860 | 4.4 | |||||||
| Other SAIF members | 539,922 | 523,542 | 480,887 | 12.3 | |||||||
Insurance Fund Reserve Ratios*
Percent of Insured Deposits
C-16
Fund Balances and Insured Deposits*
($Millions)
| | BIF Balance | BIF-Insured Deposits | SAIF Balance | SAIF-Insured Deposits | ||||
|---|---|---|---|---|---|---|---|---|
| 12/98 | 29,612 | 2,134,425 | 9,840 | 716,029 | ||||
| 12/99 | 29,414 | 2,151,454 | 10,281 | 717,591 | ||||
| 12/00 | 30,975 | 2,299,932 | 10,759 | 755,156 | ||||
| 12/01 | 30,439 | 2,409,566 | 10,935 | 801,171 | ||||
| 3/02 | 30,697 | 2,495,498 | 11,049 | 810,902 | ||||
| 6/02 | 31,187 | 2,490,954 | 11,323 | 818,806 | ||||
| 9/02 | 31,383 | 2,513,160 | 11,586 | 833,029 | ||||
| 12/02 | 32,050 | 2,527,927 | 11,747 | 859,694 | ||||
| 3/03 | 32,282 | 2,531,307 | 11,906 | 867,908 | ||||
| 6/03 | 32,800 | 2,547,109 | 12,083 | 871,477 | ||||
| 9/03 | 33,462 | 2,547,889 | 12,186 | 867,562 |
- *
- A reserve ratio is the fund balance as a percentage of estimated insured deposits. As with other Call Report items, prior periods may reflect adjustments. As a result, prior period reserve ratios may differ from previously reported values. Only year end fund balances are audited by GAO. Fund balances for the most recent period are unaudited. BIF-insured deposit totals include U.S. branches of foreign banks.
TABLE II-B. Closed/Assisted Institutions
| (dollar figures in millions) | 2003** | 2002** | 2002 | 2001 | 2000 | 1999 | 1998 | |||||||||||||||
|---|---|---|---|---|---|---|---|---|---|---|---|---|---|---|---|---|---|---|---|---|---|---|
| BIF Members | ||||||||||||||||||||||
| Number of institutions | 2 | 7 | 10 | 3 | 6 | 7 | 3 | |||||||||||||||
| Total assets | $ | 1088 | $ | 2403 | $ | 2508 | $ | 54 | $ | 378 | $ | 1490 | $ | 371 | ||||||||
| SAIF Members | ||||||||||||||||||||||
| Number of institutions | 0 | 1 | 1 | 1 | 1 | 1 | 0 | |||||||||||||||
| Total assets | $ | 0 | $ | 50 | $ | 50 | $ | 2200 | $ | 30 | $ | 71 | $ | 0 | ||||||||
- **
- Through September 30.
C-17
TABLE III-B. Selected Indicators, By Fund Membership*
| (dollar figures in millions) | 2003** | 2002** | 2002 | 2001 | 2000 | 1999 | 1998 | |||||||||||||||
|---|---|---|---|---|---|---|---|---|---|---|---|---|---|---|---|---|---|---|---|---|---|---|
| BIF Members | ||||||||||||||||||||||
| Number of institutions reporting | 8,043 | 8,171 | 8,125 | 8,326 | 8,571 | 8,834 | 9,031 | |||||||||||||||
| BIF-member Oakars | 806 | 790 | 801 | 766 | 743 | 744 | 745 | |||||||||||||||
| Other BIF-members | 7,237 | 7,381 | 7,324 | 7,560 | 7,828 | 8,090 | 8286 | |||||||||||||||
| Total assets | $ | 7,758,900 | $ | 7,186,677 | $ | 7,335,938 | $ | 6,857,284 | $ | 6,510,744 | $ | 5,980,128 | $ | 5,702,872 | ||||||||
| Total deposits | 5,095,393 | 4,700,106 | 4,854,895 | 4,567,608 | 4,337,665 | 3,987,340 | 3,843,779 | |||||||||||||||
| Net income | 78,809 | 70,484 | 92,655 | 76,500 | 73,430 | 73,948 | 64,451 | |||||||||||||||
| Return on assets (%) | 1.39 | 1.36 | 1.32 | 1.14 | 1.18 | 1.29 | 1.18 | |||||||||||||||
| Return on equity (%) | 15.12 | 14.70 | 14.34 | 12.91 | 13.86 | 15.11 | 13.82 | |||||||||||||||
| Noncurrent assets plus OREO to assets (%) | 0.78 | 0.95 | 0.91 | 0.90 | 0.72 | 0.62 | 0.64 | |||||||||||||||
| Number of problem institutions | 103 | 123 | 116 | 90 | 74 | 66 | 68 | |||||||||||||||
| Assets of problem institutions | $ | 29,371 | $ | 34,500 | $ | 32,176 | $ | 31,881 | $ | 10,787 | $ | 4,450 | $ | 5,326 | ||||||||
| Number of failed/assisted institutions | 2 | 8 | 10 | 3 | 6 | 7 | 3 | |||||||||||||||
| Assets of failed/assisted institutions | $ | 1,088 | $ | 2,413 | $ | 2,508 | $ | 54 | $ | 378 | $ | 1,490 | $ | 371 | ||||||||
SAIF Members | ||||||||||||||||||||||
| Number of institutions reporting | 1,194 | 1,244 | 1,229 | 1,287 | 1,333 | 1,387 | 1,432 | |||||||||||||||
| SAIF-member Oakars | 138 | 133 | 133 | 130 | 123 | 123 | 116 | |||||||||||||||
| Other SAIF-members | 1,056 | 1,111 | 1,096 | 1,157 | 1,210 | 1,264 | 1316 | |||||||||||||||
| Total assets | $ | 1,186,834 | $ | 1,086,232 | $ | 1,099,966 | $ | 1,011,737 | $ | 952,161 | $ | 903,532 | $ | 828,177 | ||||||||
| Total deposits | 755,677 | 691,863 | 713,599 | 621,825 | 577,100 | 550,703 | 542,481 | |||||||||||||||
| Net income | 10,985 | 9,696 | 12,463 | 10,623 | 8,070 | 8,450 | 7,568 | |||||||||||||||
| Return on assets (%) | 1.28 | 1.22 | 1.17 | 1.11 | 0.89 | 0.99 | 0.98 | |||||||||||||||
| Return on equity (%) | 14.18 | 13.93 | 12.79 | 13.46 | 11.12 | 11.97 | 11.29 | |||||||||||||||
| Noncurrent assets plus OREO to assets (%) | 0.71 | 0.74 | 0.79 | 0.75 | 0.65 | 0.64 | 0.80 | |||||||||||||||
| Number of problem institutions | 13 | 23 | 20 | 24 | 20 | 13 | 16 | |||||||||||||||
| Assets of problem institutions | $ | 933 | $ | 7,551 | $ | 6,751 | $ | 7,923 | $ | 13,053 | $ | 5,524 | $ | 5,992 | ||||||||
| Number of failed/assisted institutions | 0 | 1 | 1 | 1 | 1 | 1 | 0 | |||||||||||||||
| Assets of failed/assisted institutions | $ | 0 | $ | 50 | $ | 50 | $ | 2,200 | $ | 30 | $ | 71 | $ | 0 | ||||||||
- *
- Excludes insured branches of foreign banks (IBAs).
- **
- Through September 30, ratios annualized where appropriate
C-18
TABLE IV-B. Estimated FDIC-Insured Deposits by Fund Membership and Type of Institution
| | | | | Estimated Insured Deposits | ||||||||||
|---|---|---|---|---|---|---|---|---|---|---|---|---|---|---|
| (dollar figures in millions) September 30, 2003 | Number of Institutions | Total Assets | Domestic Depostis* | |||||||||||
| BIF | SAIF | Total | ||||||||||||
| Commercial Banks and Savings Institutions | ||||||||||||||
| FDIC-Insured Commercial Banks | 7,812 | 7,474,311 | 4,224,399 | 2,281,571 | 409,569 | 2,691,141 | ||||||||
| BIF-member | 7,700 | 7,300,861 | 4,109,980 | 2,247,158 | 354,501 | 2,601,660 | ||||||||
| SAIF-member | 112 | 173,450 | 114,419 | 34,413 | 55,068 | 89,481 | ||||||||
FDIC-Supervised | 4,832 | 1,346,239 | 995,177 | 626,537 | 86,484 | 713,021 | ||||||||
| OCC-Supervised | 2,031 | 4,202,114 | 2,295,687 | 1,218,563 | 234,787 | 1,453,350 | ||||||||
| Federal Reserve-Supervised | 949 | 1,925,959 | 933,535 | 436,471 | 88,298 | 524,769 | ||||||||
FDIC-Insured Savings Institutions | 1,425 | 1,471,423 | 934,489 | 265,062 | 457,993 | 723,055 | ||||||||
| OTS-Supervised Savings Institutions | 936 | 1,101,886 | 673,376 | 125,012 | 388,983 | 513,995 | ||||||||
| BIF-member | 42 | 156,082 | 80,274 | 60,323 | 7,597 | 67,920 | ||||||||
| SAIF-member | 894 | 945,804 | 593,102 | 64,689 | 381,386 | 446,075 | ||||||||
| FDIC-Supervised State Savings Banks | 489 | 369,537 | 261,112 | 140,050 | 69,010 | 209,060 | ||||||||
| BIF-member | 301 | 301,958 | 213,369 | 137,036 | 29,768 | 166,804 | ||||||||
| SAIF-member | 188 | 67,579 | 47,743 | 3,014 | 39,242 | 42,256 | ||||||||
Total Commercial Banks and Savings Institutions | 9,237 | 8,945,735 | 5,158,888 | 2,546,633 | 867,562 | 3,414,196 | ||||||||
| BIF-member | 8,043 | 7,758,900 | 4,403,623 | 2,444,517 | 391,866 | 2,836,383 | ||||||||
| SAIF-member | 1,194 | 1,186,834 | 755,265 | 102,116 | 475,696 | 577,812 | ||||||||
Other FDIC-Insured Institutions | ||||||||||||||
| U.S. Branches of Foreign Banks | 15 | 9,925 | 5,205 | 1,256 | 0 | 1,256 | ||||||||
Total FDIC-Insured Institutions | 9,252 | 8,955,659 | 5,164,093 | 2,547,889 | 867,562 | 3,415,452 | ||||||||
- *
- Excludes $692 billion in foreign office deposits, which are uninsured.
C-19
TABLE V-B. Assessment Base Distribution and Rate Schedule
BIF Assessment Base Distribution
Assessable Deposits in Billions as of September 30, 2003
Supervisory and Capital Ratings for First Semiannual Assessment Period, 2004
| | Supervisory Risk Subgroup | |||||||||||||||
|---|---|---|---|---|---|---|---|---|---|---|---|---|---|---|---|---|
| Capital Group | ||||||||||||||||
| A | B | C | ||||||||||||||
| 1. Well-capitalized | ||||||||||||||||
| Number of institutions | 7,400 | 91.8 | 470 | 5.8 | 82 | 1.0 | ||||||||||
| Assessable deposit base | $ | 3,939 | 96.3 | $ | 119 | 2.9 | $ | 18 | 0.4 | |||||||
| 2. Adequately capitalized | ||||||||||||||||
| Number of institutions | 82 | 1.0 | 8 | 0.1 | 13 | 0.2 | ||||||||||
| Assessable deposit base | $ | 11 | 0.3 | $ | 1 | 0.0 | $ | 2 | 0.1 | |||||||
| 3. Undercapitalized | ||||||||||||||||
| Number of institutions | 0 | 0.0 | 2 | 0.0 | 1 | 0.0 | ||||||||||
| Assessable deposit base | $ | 0 | 0.0 | $ | 0 | 0.0 | $ | 0 | 0.0 | |||||||
NOTE: "Number" reflects the number of SAIF members; "Base" reflects the SAIF-assessable deposits held by both BIF and SAIF members. Institutions are categorized based on capitalization and a supervisory subgroup rating, which is generally determined by on-site examinations.
SAIF Assessment Base Distribution
Assessable Deposits in Billions as of September 30, 2003
Supervisory and Capital Ratings for First Semiannual Assessment Period, 2004
| | Supervisory Risk Subgroup | |||||||||||||||
|---|---|---|---|---|---|---|---|---|---|---|---|---|---|---|---|---|
| Capital Group | ||||||||||||||||
| A | B | C | ||||||||||||||
| 1. Well-capitalized | ||||||||||||||||
| Number of institutions | 1,092 | 91.5 | 81 | 6.8 | 13 | 1.1 | ||||||||||
| Assessable deposit base | $ | 1,019 | 96.6 | $ | 34 | 3.2 | $ | 1 | 0.1 | |||||||
| 2. Adequately capitalized | ||||||||||||||||
| Number of institutions | 4 | 0.3 | 1 | 0.1 | 3 | 0.3 | ||||||||||
| Assessable deposit base | $ | 1 | 0.1 | $ | 0 | 0.0 | $ | 0 | 0.0 | |||||||
| 3. Undercapitalized | ||||||||||||||||
| Number of institutions | 0 | 0.0 | 0 | 0.0 | 0 | 0.0 | ||||||||||
| Assessable deposit base | $ | 0 | 0.0 | $ | 0 | 0.0 | $ | 0 | 0.0 | |||||||
NOTE: "Number" reflects the number of SAIF members; "Base" reflects the SAIF-assessable deposits held by both BIF and SAIF members. Institutions are categorized based on capitalization and a supervisory subgroup rating, which is generally determined by on-site examinations.
C-20
Assessment Rate Schedule
First Semiannual 2004 Assessment Period
Cents per $100 of Assessable Deposits
| | Supervisory Risk Subgroup | |||||
|---|---|---|---|---|---|---|
| Capital Group | ||||||
| A | B | C | ||||
| 1. Well-capitalized | 0 | 3 | 17 | |||
| 2. Adequately capitalized | 3 | 10 | 24 | |||
| 3. Undercapitalized | 10 | 24 | 27 | |||
NOTE: Rates for the BIF and the SAIF are set separately by the FDIC.
Currently, the rate schedules are identical.
C-21
C-22
This publication contains financial data and other information for depository institutions insured by the Federal Deposit Insurance Corporation (FDIC). These notes are an integral part of this publication and provide information regarding the comparability of source data and reporting differences over time.
Tables I-A through V-A.
The information presented in Tables I-A through V-A of theFDIC Quarterly Banking Profile is aggregated for all FDICinsured Institutions, both commercial banks and savings institutions. Some tables are arrayed by groups of FDIC-insured institutions based on predominant types of asset concentration, while other tables aggregate institutions by asset size and geographic region. Quarterly and full-year data are provided for selected indicators, including aggregate condition and income data, performance ratios, condition ratios and structural changes, as well as past due, noncurrent and charge-off information for loans outstanding and other assets.
Tables I-B through V-B.
A separate set of tables(Tables I-B through V-B) provides quarterly and annual data related to the bank (BIF) and savings association (SAIF) insurance funds, closed/assisted institutions, and assessments.
Summary balance-sheet and earnings data are provided for commercial banks and savings institutions according to insurance fund membership. BIF-member institutions may acquire SAIF-insured deposits, resulting in institutions with some deposits covered by both insurance funds. Also, SAIF members may acquire BIF-insured deposits. The insurance fund membership does not necessarily reflect which fund insures the largest percentage of an institution's deposits. Therefore, the BIFmember and the SAIF-member tables each include deposits from both insurance funds. Depository institutions that are not insured by the FDIC through either the BIF or SAIF are not included in the FDICQuarterly Banking Profile. U.S. branches of institutions headquartered in foreign countries and nondeposit trust companies are not included unless otherwise indicated. Efforts are made to obtain financial reports for all active institutions. However, in some cases, final financial reports are not available for institutions that have closed or converted their charter.
DATA SOURCES
The financial information appearing in this publication is obtained primarily from the Federal Financial Institutions Examination Council (FFIEC)Call Reports and the OTSThrift Financial Reports submitted by all FDIC-insured depository institutions. This information is stored on and retrieved from the FDIC's Research Information System (RIS) data base.
COMPUTATION METHODOLOGY
Certain adjustments are made to the OTSThrift Financial Reports to provide closer conformance with the reporting and accounting requirements of the FFIECCall Reports. Parent institutions are required to file consolidated reports, while their subsidiary financial institutions are still required to file separate reports. Data from subsidiary institution reports are included in theQuarterly Banking Profile tables, which can lead to doublecounting. No adjustments are made for any double-counting of subsidiary data.
All asset and liability figures used in calculating performance ratios represent average amounts for the period (beginning-of-period amount plus end-of-period amount plus any interim periods, divided by the total number of periods). For "pooling-of-interest" mergers, the assets of the acquired institution(s)
C-23
are included in average assets since the year-to-date income includes the results of all merged institutions. No adjustments are made for "purchase accounting" mergers. Growth rates represent the percentage change over a 12-month period in totals for institutions in the base period to totals for institutions in the current period.
All data are collected and presented based on the location of each reporting institution's main office. Reported data may include assets and liabilities located outside of the reporting institution's home state.
ACCOUNTING CHANGES
FASB Interpretation No. 45—In November 2002, the FASB issued Interpretation No. 45,Guarantor's Accounting and Disclosure Requirements for Guarantees, Including Indirect Guarantees of Indebtedness of Others. This interpretation clarifies that a guarantor is required to recognize, at the inception of a guarantee (financial standby letters of credit, performance standby letters of credit), a liability for the fair value of the obligation undertaken in issuing the guarantee. Banks apply the initial recognition and measurement provisions of Interpretation No. 45 on a prospective basis to guarantees issued or modified after December 31, 2002, irrespective of the bank's fiscal year end. A bank's previous accounting for guarantees issued prior to January 1, 2003, is not revised.
FASB Interpretation No. 46—The FASB issued Interpretation No. 46,Consolidation of Variable Interest Entities, in January 2003. Most small banks are unlikely to have any "variable interests" in variable interest entities. Banks with variable interests in variable interest entities created after January 31, 2003, must apply the provisions of Interpretation No. 46 to those entities immediately. A bank that is a public company, or a subsidiary of a public company, and has a variable interest in a variable interest entity created before February 1, 2003, must apply the provisions of Interpretation No. 46 to that entity no later than the beginning of the first interim or annual reporting period beginning after September 15, 2003. A bank that is neither a public company nor a subsidiary of a public company, but has a variable interest in a variable interest entity created before February 15, 2003, must apply the provisions of Interpretation No. 46 to that entity no later than the end of the first annual reporting period beginning after June 15, 2003.
Goodwill and intangible assets—FAS 141 terminates the use of pooling-of-interest accounting for business combinations after 2001 and requires purchase accounting. Under FAS 142 amortization of goodwill is eliminated. Only intangible assets other than goodwill are amortized each quarter. In addition companies are required to test for impairment of both goodwill and other intangibles once each fiscal year. The year 2002, the first fiscal year affected by this accounting change, has been designated a transitional year and the amount of initial impairments are to be recorded as extraordinary losses on a "net of tax" basis (and not as noninterest expense). Subsequent annual review of intangibles and goodwill impairment may require additional noninterest expense recognition. FASB Statement No. 147 clarifies that acquisitions of financial institutions (except transactions between two or more mutual enterprises), including branch acquisitions that meet the definition of a business combination, should be accounted for by the purchase method under FASB Statement No. 141. This accounting standard includes transition provisions that apply to unidentifiable intangible assets previously accounted for in accordance with FASB Statement No. 72. If the transaction (such as a branch acquisition) in which an unidentifiable intangible asset arose does not meet the definition of a business combination, this intangible asset is not be reported as "Goodwill" on the Call Report balance sheet. Rather, this unidentifiable intangible asset is reported as "Other intangible assets," and must continue to be amortized and the amortization expense should be reported in the Call Report income statement.
FASB Statement No. 133Accounting for Derivative Instruments and Hedging Activities—establishes new accounting and reporting standards. Derivatives were previously off-balance sheet items, but
C-24
beginning in 2001 all banks must recognize derivatives as either assets or liabilities on the balance sheet, measured at fair value. A derivative may be specifically designated as a "fair value hedge," a "cash flow hedge," or a hedge of a foreign currency exposure. The accounting for changes in the value of a derivative (gains and losses) depends on the intended use of the derivative, its resulting designation, and the effectiveness of the hedge. Derivatives held for purposes other than trading are reported as "other assets" (positive fair values) or "other liabilities" (negative fair values). For a fair value hedge, the gain or loss is recognized in earnings and "effectively" offsets loss or gain on the hedged item attributable to the risk being hedged. Any ineffectiveness of the hedge could result in a net gain or loss on the income statement. Accumulated net gains (losses) on cash flow hedges are recorded on the balance sheet as "accumulated other comprehensive income" and the periodic change in the accumulated net gains (losses) for cash flow hedges is reflected directly in equity as the value of the derivative changes.
Initial transition adjustments upon adoption of FAS 133 are reported as adjustments to net income in the income statement as extraordinary items. Upon implementing FAS 133, a bank may transfer any debt security categorized as held-to-maturity into the available-for-sale category or the trading category. Unrealized gains (losses) on transferred held-to-maturity debt securities on the date of initial application must be reflected as an adjustment to net income if transferred to the trading category or an adjustment to equity if transferred to the available-for-sale category.
Subchapter S Corporations—The Small Business Job Protection Act of 1996 changed the Internal Revenue Code to allow financial institutions to elect Subchapter S corporation status, beginning in 1997. A Subchapter S corporation is treated as a pass-through entity, similar to a partnership, for federal income tax purposes. It is generally not subject to any federal income taxes at the corporate level. Its taxable income flows through to its shareholders in proportion to their stock ownership, and the shareholders generally pay federal income taxes on their share of this taxable income. This can have the effect of reducing institutions' reported taxes and increasing their after-tax earnings. The election of Subchapter S status may result in an increase in shareholders' personal tax liability. Therefore, some S corporations may increase the amount of earnings distributed as dividends to compensate for higher personal taxes.
DEFINITIONS (in alphabetical order)
All other assets—total cash, balances due from depository institutions, premises, fixed assets, direct investments in real estate, investment in unconsolidated subsidiaries, customers' liability on acceptances outstanding, assets held in trading accounts, federal funds sold, securities purchased with agreements to resell, fair market value of derivatives, and other assets.
All other liabilities—bank's liability on acceptances, limited-life preferred stock, allowance for estimated off-balance sheet credit losses, fair market value of derivatives, and other liabilities.
C-25
Assessment base distribution—assessable deposits consist of BIF and SAIF deposits in banks' domestic offices with certain adjustments. Each institution's assessment depends on its assigned riskbased capital category and supervisory risk subgroup:
| (Percent) | Total Risk-Based Capital* | | Tier 1 Risk-Based Capital* | | Tier 1 Leverage | | Tangible Equity | |||||||
|---|---|---|---|---|---|---|---|---|---|---|---|---|---|---|
| Well-capitalized | ³10 | and | ³6 | and | ³5 | — | ||||||||
| Adequately capitalized | ³8 | and | ³4 | and | ³4 | — | ||||||||
| Undercapitalized | ³6 | and | ³3 | and | ³3 | — | ||||||||
| Significantly undercapitalized | <6 | or | <3 | or | <3 | and | >2 | |||||||
| Critically undercapitalized | — | — | — | £2 |
- *
- As a percentage of risk-weighted assets.
For purpose of BIF and SAIF assessments, risk-based assessment rules combine the three lowest capital rating categories into a single "undercapitalized" group. Supervisory risk subgroup assignments are based on supervisory ratings. Generally, the strongest institutions (those rated 1 or 2) are in subgroup A, those rated 3 are in subgroup B, and those rated 4 or 5 are in subgroup C.
Assets securitized and sold—total outstanding principal balance of assets sold and securitized with servicing retained or other seller-provided credit enhancements.
BIF-insured deposits (estimated)—the portion of estimated insured deposits that is insured by the BIF. For SAIF-member "Oakar" institutions, it represents the adjusted attributable amount acquired from BIF members.
Construction and development loans—includes loans for all property types under construction, as well as loans for land acquisition and development.
Core capital—common equity capital plus noncumulative perpetual preferred stock plus minority interest in consolidated subsidiaries, less goodwill and other ineligible intangible assets. The amount of eligible intangibles (including servicing rights) included in core capital is limited in accordance with supervisory capital regulations.
Cost of funding earning assets—total interest expense paid on deposits and other borrowed money as a percentage of average earning assets.
Derivatives (notional amount)—represents the sum of the following: interest-rate contracts (defined as the "notional" value of interest-rate swap, futures, forward and option contracts), foreign-exchange-rate contracts, commodity contracts and equity contracts (defined similarly to interest-rate contracts).
Futures and forward contracts—a contract in which the buyer agrees to purchase and the seller agrees to sell, at a specified future date, a specific quantity of an underlying variable or index at a specified price or yield. These con tracts exist for a variety of variables or indices, (traditional agricultural or physical commodities, as well as currencies and interest rates). Futures contracts are standardized and are traded on organized exchanges which set limits on counterparty credit exposure. Forward contracts do not have standardized terms and are traded over the counter.
Option contracts—a contract in which the buyer acquires the right to buy from or sell to another party some specified amount of an underlying variable or index at a stated price (strike price) during a period or on a specified future date, in return for compensation (such as a fee or premium). The seller is obligated to purchase or sell the variable or index at the discretion of the buyer of the contract.
C-26
Swaps—an obligation between two parties to exchange a series of cash flows at periodic intervals (settlement dates), for a specified period. The cash flows of a swap are either fixed, or determined for each settlement date by multiplying the quantity (notional principal) of the underlying variable or index by specified reference rates or prices. Except for currency swaps, the notional principal is used to calculate each payment but is not exchanged.
Domestic deposits to total assets—total domestic office deposits as a percent of total assets on a consolidated basis.
Earning assets—all loans and other investments that earn interest or dividend income.
Efficiency Ratio—Noninterest expense less amortization of intangible assets as a percent of net interest income plus noninterest income. This ratio measures the proportion of net operating revenues that are absorbed by overhead expenses, so that a lower value indicates greater efficiency.
Estimated insured deposits—in general, insured deposits are total domestic deposits minus estimated uninsured deposits. While the uninsured estimate is calculated as the sum of the excess amounts in accounts over $100,000, beginning June 30, 2000 the amount of estimated uninsured deposits was adjusted to consider a financial institution's better estimate. Since March 31, 2002, all institutions provide a reasonable estimate of uninsured deposits from their systems and records.
Failed/assisted institutions—an institution fails when regulators take control of the institution, placing the assets and liabilities into a bridge bank, conservatorship, receivership, or another healthy institution. This action may require the FDIC to provide funds to cover losses. An institution is defined as "assisted" when the institution remains open and receives some insurance funds in order to continue operating.
FHLB advances—all borrowings by FDIC insured institutions from the Federal Home Loan Bank System (FHLB), as reported by Call Report filers and by TFR filers.
Goodwill and other intangibles—intangible assets include servicing rights, purchased credit card relationships and other identifiable intangible assets.
Loans secured by real estate—includes home equity loans, junior liens secured by 1-4 family residential properties and all other loans secured by real estate.
Loans to individuals—includes outstanding credit card balances and other secured and unsecured consumer loans.
Long-term assets (5+ years)—loans and debt securities with remaining maturities or repricing intervals of over five years.
Mortgage-backed securities—certificates of participation in pools of residential mortgages and collateralized mortgage obligations issued or guaranteed by government-sponsored or private enterprises. Also, see "Securities", below.
Net charge-offs—total loans and leases charged off (removed from balance sheet because of uncollectibility), less amounts recovered on loans and leases previously charged off.
Net interest margin—the difference between interest and dividends earned on interest-bearing assets and interest paid to depositors and other creditors, expressed as a percentage of average earning assets. No adjustments are made for interest income that is tax exempt.
Net loans to total assets—loans and lease financing receivables, net of unearned income, allowance and reserves, as a percent of total assets on a consolidated basis.
C-27
Net operating income—income excluding discretionary transactions such as gains (or losses) on the sale of investment securities and extraordinary items. Income taxes subtracted from operating income have been adjusted to exclude the portion applicable to securities gains (or losses).
Noncurrent assets—the sum of loans, leases, debt securities and other assets that are 90 days or more past due, or in nonaccrual status.
Noncurrent loans & leases—the sum of loans and leases 90 days or more past due, and loans and leases in nonaccrual status.
Number of institutions reporting—the number of institutions that actually filed a financial report.
Other borrowed funds—federal funds purchased, securities sold with agreements to repurchase, demand notes issued to the U.S. Treasury, FHLB advances, other borrowed money, mortgage indebtedness, obligations under capitalized leases and trading liabilities, less revaluation losses on assets held in trading accounts.
Other real estate owned—primarily foreclosed property. Direct and indirect investments in real estate ventures are excluded. The amount is reflected net of valuation allowances. For institutions that file a Thrift Financial Report (TFR), the valuation allowance subtracted also includes allowances for other repossessed assets. Also, for TFR filers the components of other real estate owned are reported gross of valuation allowances.
Percent of institutions with earnings gains—the percent of institutions that increased their net income (or decreased their losses) compared to the same period a year earlier.
"Problem" institutions—federal regulators assign a composite rating to each financial institution, based upon an evaluation of financial and operational criteria. The rating is based on a scale of 1 to 5 in ascending order of supervisory concern. "Problem" institutions are those institutions with financial, operational, or managerial weaknesses that threaten their continued financial viability. Depending upon the degree of risk and supervisory concern, they are rated either a "4" or "5". For all BIF-member institutions, and for all SAIF-member institutions for which the FDIC is the primary federal regulator, FDIC composite ratings are used. For all SAIF-member institutions whose primary federal regulator is the OTS, the OTS composite rating is used.
Reserves for losses—the allowance for loan and lease losses on a consolidated basis. Between March 31, 2001 and March 31, 2003 reserves for losses did not include the allocated transfer risk reserve, which was netted from loans and leases.
Restructured loans and leases—loan and lease financing receivables with terms restructured from the original contract. Excludes restructured loans and leases that are not in compliance with the modified terms.
Retained earnings—net income less cash dividends on common and preferred stock for the reporting period.
Return on assets—net income (including gains or losses on securities and extraordinary items) as a percentage of average total assets. The basic yardstick of bank profitability.
Return on equity—net income (including gains or losses on securities and extraordinary items) as a percentage of average total equity capital.
Risk-weighted assets—assets adjusted for risk-based capital definitions which include on-balance-sheet as well as off-balance-sheet items multiplied by risk-weights that range from zero to 100 percent. A conversion factor is used to assign a balance sheet equivalent amount for selected off-balance-sheet accounts.
C-28
SAIF-insured deposits(estimated)—the portion of estimated insured deposits that is insured by the SAIF. For BIF-member "Oakar" institutions, it represents the adjusted attributable amount acquired from SAIF members.
Securities—excludes securities held in trading accounts. Banks' securities portfolios consist of securities designated as "held-to-maturity", which are reported at amortized cost (book value), and securities designated as "available-for-sale", reported at fair (market) value.
Securities gains (losses)—realized gains (losses) on held-to-maturity and available-for-sale securities, before adjustments for income taxes. Thrift Financial Report (TFR) filers also include gains (losses) on the sales of assets held for sale.
Troubled real estate asset rate—noncurrent real estate loans plus other real estate owned as a percent of total real estate loans and other real estate owned.
Trust assets—market value, or other reasonably available value of fiduciary and related assets, to include marketable securities, and other financial and physical assets. Common physical assets held in fiduciary accounts include real estate, equipment, collectibles, and household goods. Such fiduciary assets are not included in the assets of the financial institution.
Unearned income & contra accounts—unearned income for Call Report filers only.
Unused loan commitments—includes credit card lines, home equity lines, commitments to make loans for construction, loans secured by commercial real estate, and unused commitments to originate or purchase loans.
Volatile liabilities—the sum of large-denomination time deposits, foreign-office deposits, federal funds purchased, securities sold under agreements to repurchase, and other borrowings.
Yield on earning assets—total interest, dividend and fee income earned on loans and investments as a percentage of average earning assets.
C-29
TheFDIC Quarterly Banking Profile is published quarterly by the Division of Insurance and Research of the Federal Deposit Insurance Corporation. Single copy subscriptions of theFDIC Quarterly Banking Profile can be obtained through the FDIC Public Information Center, 801 17th Street, NW, Washington, DC 20434; Telephone (202) 416-6940 or (877) 275-3342; or Email: publicinfo@fdic.gov.
TheFDIC Quarterly Banking Profile is available on-line by visiting the FDIC's website at www.fdic.gov. Comparable financial data for individual institutions can now be obtained from the FDIC's Institution Directory (I.D.) System on this web site.
| Chairman | Donald E. Powell | |
Director, Division of Insurance and Research | Arthur J. Murton | |
Media Inquiries | (202) 898-6993 | |
Authors | Don Inscoe Associate Director, Statistics Branch (202) 898-3940 | |
Kevin Brown (202) 898-6817 | ||
Ross Waldrop (202) 898-3951 |
C-30
Exhibit D
Market and Competitor Information
Briefing Book
American Bank & Trust Company
Opelousas, LA
| Contents | Page | |
|---|---|---|
| Deposit Market Share Analysis | 2 | |
| Market Demographic Profile | 4 |
D-1
Deposit Market Share Analysis
American Bank & Trust Company Bank
Pending Ownership, including Bank, Savings Bank, Thrift Branches
Ownership as of: 02/06/2004
Holding Company Level
Markets grouped by County, Top 10 institutions included
COUNTY: Saint Landry, LA
| Rank Institution | Type | Branch Count | Total Deposits in Market ($000) | Total Market Share (%) | Weighted Deposits in Market ($000) | Weighted Market Share (%) | Deposit HHI | Percent of Parent Deposits (%) | ||||||||||
|---|---|---|---|---|---|---|---|---|---|---|---|---|---|---|---|---|---|---|
| 1 | Saint Landry Bancshares Inc. (LA) | Bank | 2 | 180,642 | 20.90 | 180,642 | 23.58 | 556 | 89.97 | |||||||||
| 2 | St. Landry Homestead FSB (LA) | Thrift | 3 | 145,592 | 16.84 | 72,796 | 9.50 | 90 | 100.00 | |||||||||
| 3 | J.P. Morgan Chase & Co. (NY) | Bank | 4 | 86,076 | 9.96 | 86,076 | 11.24 | 126 | 0.02 | |||||||||
| 4 | Tri-Parish Bancshares Ltd. (LA) | Bank | 1 | 85,349 | 9.87 | 85,349 | 11.14 | 124 | 100.00 | |||||||||
| 5 | American Bancorp Inc. (LA) | Bank | 5 | 75,796 | 8.77 | 75,796 | 9.89 | 98 | 94.35 | |||||||||
| 6 | Washington State Bkshrs Inc. (LA) | Bank | 5 | 72,430 | 8.38 | 72,430 | 9.45 | 89 | 100.00 | |||||||||
| 7 | St. Landry Financial Corp. (LA) | Thrift | 2 | 51,258 | 5.93 | 25,629 | 3.35 | 11 | 100.00 | |||||||||
| 8 | Sunset Bancorp Inc. (LA) | Bank | 1 | 35,712 | 4.13 | 35,712 | 4.66 | 22 | 68.51 | |||||||||
| 9 | Hancock Holding Co. (MS) | Bank | 3 | 34,038 | 3.94 | 34,038 | 4.44 | 20 | 1.00 | |||||||||
| 10 | First Bancshares of Baton (LA) | Bank | 1 | 27,026 | 3.13 | 27,026 | 3.53 | 12 | 39.73 | |||||||||
| Totals | 15 | 40 | 864,479 | 766,054 | 1,170 | |||||||||||||
COUNTY: Lafayette, LA
| Rank Institution | Type | Branch Count | Total Deposits in Market ($000) | Total Market Share (%) | Weighted Deposits in Market ($000) | Weighted Market Share (%) | Deposit HHI | Percent of Parent Deposits (%) | ||||||||||
|---|---|---|---|---|---|---|---|---|---|---|---|---|---|---|---|---|---|---|
| 1 | IBERIABANK Corp. (LA) | Bank | 12 | 647,473 | 24.08 | 647,473 | 25.64 | 657 | 40.60 | |||||||||
| 2 | J.P. Morgan Chase & Co. (NY) | Bank | 15 | 638,889 | 23.76 | 638,889 | 25.30 | 640 | 0.18 | |||||||||
| 3 | Hibernia Corp. (LA) | Bank | 7 | 297,828 | 11.08 | 297,828 | 11.79 | 139 | 2.02 | |||||||||
| 4 | Whitney Holding Corp. (LA) | Bank | 6 | 280,714 | 10.44 | 280,714 | 11.12 | 124 | 4.80 | |||||||||
| 5 | Home Bank (LA) | Thrift | 7 | 235,408 | 8.75 | 117,704 | 4.66 | 22 | 100.00 | |||||||||
| 6 | MidSouth Bancorp Inc. (LA) | Bank | 7 | 205,534 | 7.64 | 205,534 | 8.14 | 66 | 56.95 | |||||||||
| 7 | Teche Holding Co. (LA) | Thrift | 3 | 92,284 | 3.43 | 46,142 | 1.83 | 3 | 25.59 | |||||||||
| 8 | Financial Corp. of Louisiana (LA) | Bank | 5 | 84,872 | 3.16 | 84,872 | 3.36 | 11 | 33.76 | |||||||||
| 9 | Regions Financial Corp. (AL) | Bank | 4 | 75,973 | 2.83 | 75,973 | 3.01 | 9 | 0.14 | |||||||||
| 10 | Saint Martin Bancshares Inc. (LA) | Bank | 2 | 47,210 | 1.76 | 47,210 | 1.87 | 3 | 40.60 | |||||||||
| Totals | 16 | 83 | 2,688,938 | 2,525,092 | 1,678 | |||||||||||||
Deposit Market Share Summary
American Bank & Trust Company Bank
By County
| County | Market Share Rank | Branch Count | Total Deposits in Market ($000) | Total Market Share (%) | Percent of Parent Deposits (%) | Market Deposit HHI | ||||||
|---|---|---|---|---|---|---|---|---|---|---|---|---|
| Saint Landry, LA | 5 | 5 | 75,796 | 8.77 | 94.35 | 1,170 | ||||||
| Lafayette, LA | 15 | 1 | 4,538 | 0.17 | 5.65 | 1,678 |
Herfindahl-Hirschman Index Weightings
Bank Deposits are weighted at 100%
Savings Bank Deposits are weighted at 50%
Thrift Deposits are weighted at 50%
D-2
Market Share and Demographic Profile
American Bank & Trust Company Bank
By County
| | Number of Branches | Company Deposits in Market ($000) | Deposit Market Share (%) | Percent of State Franchise (%) | Percent of National Franchise (%) | Total Population 2003 (Actual) | Population Change 2000-2003 (%) | Projected Population Change 2003-2008 (%) | Median Projected HH Income 2003 ($) | HH Income Change 2000-2003 (%) | HH Income Change 2003-2008 (%) | ||||||||||||
|---|---|---|---|---|---|---|---|---|---|---|---|---|---|---|---|---|---|---|---|---|---|---|---|
| Louisiana (LA) | |||||||||||||||||||||||
| Saint Landry | 5 | 75,796 | 8.77 | 94.35 | 94.35 | 88,894 | 1.36 | 2.33 | 24,369 | 5.19 | 6.58 | ||||||||||||
| Lafayette | 1 | 4,538 | 0.17 | 5.65 | 5.65 | 192,591 | 1.10 | 2.46 | 40,486 | 9.62 | 10.83 | ||||||||||||
| LA totals: | 6 | 80,334 | 100.00 | 100.00 | 281,485 | ||||||||||||||||||
Weighted Average: Louisiana Franchise | 1.35 | 2.34 | 25,279 | 5.44 | 6.82 | ||||||||||||||||||
| Aggregate: Entire State of Louisiana | 4,486,970 | 0.40 | 0.79 | 36,225 | 9.58 | 12.41 | |||||||||||||||||
| Aggregate: National | 290,647,163 | 3.28 | 5.25 | 46,868 | 9.69 | 13.57 | |||||||||||||||||
Weighted Average is calculated as the sum of (Percent of State/National Franchise * demographic item) within each market.
D-3
Exhibit E
Historical Financial Statements
December 31, 1999
through
December 31, 2003
AMERICAN BANK & TRUST COMPANY
Balance Sheet
| | Last 4 Quarters | Last 4 Years | ||||||||||||||||
|---|---|---|---|---|---|---|---|---|---|---|---|---|---|---|---|---|---|---|
| ($000) | ||||||||||||||||||
| 12/03 Q | 09/03 Q | 06/03 Q | 03/03 Q | 2002 Y | 2001 Y | 2000 Y | 1999 Y | |||||||||||
| Cash & Nonint-bearing Deps | 5,199 | 4,620 | 6,266 | 5,505 | 6,974 | 5,321 | 6,900 | 6,049 | ||||||||||
| Total Int-bearing Balances | — | — | — | — | — | 99 | 298 | 1,090 | ||||||||||
| Total Cash & Bals Due Dep Inst | 5,199 | 4,620 | 6,266 | 5,505 | 6,974 | 5,420 | 7,198 | 7,139 | ||||||||||
Secs Held-to-maturity (Cost) | 1,601 | 1,601 | 1,601 | 2,103 | 2,105 | 2,306 | 4,896 | 2,800 | ||||||||||
| Secs Available-for-sale (FV) | 42,422 | 43,302 | 37,029 | 33,371 | 37,536 | 34,899 | 31,068 | 31,422 | ||||||||||
| Total Securities | 44,023 | 44,903 | 38,630 | 35,474 | 39,641 | 37,205 | 35,964 | 34,222 | ||||||||||
Tot Fed Funds&Reverse Repos | 9,125 | 5,600 | 9,250 | 13,250 | 10,300 | 8,925 | 4,775 | 8,105 | ||||||||||
Tot Lns & Lses (Incl Lns HFS) | 39,972 | 39,845 | 39,009 | 39,902 | 40,558 | 38,241 | 32,660 | 28,834 | ||||||||||
| Total Reserves | (667 | ) | (659 | ) | (648 | ) | (639 | ) | (627 | ) | (605 | ) | (580 | ) | (579 | ) | ||
| Net Lns & Lses (Incl Lns HFS) | 39,305 | 39,186 | 38,361 | 39,263 | 39,931 | 37,636 | 32,080 | 28,255 | ||||||||||
Trading Account Assets | — | — | — | — | — | — | — | — | ||||||||||
| Premises & Fixed Assets | 1,755 | 1,755 | 1,695 | 1,607 | 1,643 | 1,771 | 1,550 | 1,108 | ||||||||||
| Total Other Real Estate Owned | — | — | — | — | — | — | — | — | ||||||||||
| Invest in Unconsol Subs | — | — | — | — | — | — | — | — | ||||||||||
| Customer Accept Liab | — | — | — | — | — | — | — | — | ||||||||||
| Total Intangible Assets | — | — | — | — | — | — | — | — | ||||||||||
| Other Assets | 1,374 | 1,372 | 1,093 | 1,159 | 1,164 | 1,084 | 1,182 | 1,403 | ||||||||||
| TOTAL ASSETS | 100,781 | 97,436 | 95,295 | 96,258 | 99,653 | 92,041 | 82,749 | 80,232 | ||||||||||
Nonint-bear Deps | 29,756 | 32,511 | 31,208 | 31,324 | 29,544 | 27,914 | 25,952 | 23,533 | ||||||||||
| Int-bear Deposits | 55,882 | 49,596 | 49,126 | 50,361 | 55,298 | 50,797 | 45,393 | 46,934 | ||||||||||
| Total Deposits | 85,638 | 82,107 | 80,334 | 81,685 | 84,842 | 78,711 | 71,345 | 70,467 | ||||||||||
Tot Fed Funds & Repos | — | — | — | — | — | — | — | — | ||||||||||
| Other Borrowed Money | 477 | 478 | 86 | 87 | 481 | 485 | — | — | ||||||||||
| Other Liabilities | 611 | 713 | 793 | 736 | 753 | 609 | 360 | 297 | ||||||||||
| Tot Liabilities (Excl Min Int) | 86,726 | 83,298 | 81,213 | 82,508 | 86,076 | 79,805 | 71,705 | 70,764 | ||||||||||
Minority Interest | — | — | — | — | — | — | — | — | ||||||||||
Preferred Stock & Surplus | — | — | — | — | — | — | — | — | ||||||||||
| Common Stock Par Value | 600 | 600 | 600 | 600 | 600 | 600 | 600 | 600 | ||||||||||
| Common Stock Surplus | 2,150 | 2,150 | 2,150 | 2,150 | 2,150 | 2,150 | 2,150 | 2,150 | ||||||||||
| Retained Earnings | 10,810 | 10,838 | 10,574 | 10,323 | 10,043 | 9,103 | 8,275 | 7,272 | ||||||||||
| Other Comprehensive Income | 495 | 550 | 758 | 677 | 784 | 383 | 19 | (554 | ) | |||||||||
| Oth Equity Capital Components | — | — | — | — | — | — | NA | NA | ||||||||||
| Total Equity | 14,055 | 14,138 | 14,082 | 13,750 | 13,577 | 12,236 | 11,044 | 9,468 | ||||||||||
TOTAL LIAB, MIN INT & EQUITY | 100,781 | 97,436 | 95,295 | 96,258 | 99,653 | 92,041 | 82,749 | 80,232 | ||||||||||
Avg Earning Assets | 90,962 | 89,209 | 87,975 | 87,194 | 85,301 | 76,119 | 71,703 | 69,603 | ||||||||||
Avg Total Assets | 98,457 | 96,433 | 94,257 | 94,740 | 92,413 | 83,836 | 78,168 | 76,441 | ||||||||||
| Avg Common Equity | 14,097 | 14,110 | 13,916 | 13,663 | 13,034 | 11,887 | 10,165 | 9,536 | ||||||||||
Core Deposits | 76,353 | 73,287 | 71,920 | 72,950 | 76,720 | 71,501 | 66,166 | 65,849 | ||||||||||
NPAs/ Assets (%) | 0.03 | 0.41 | 0.05 | 0.04 | 0.01 | 0.03 | 0.02 | 0.12 | ||||||||||
| Total Noncurrent Lns/ Loans (%) | 0.08 | 0.99 | 0.12 | 0.10 | 0.03 | 0.06 | 0.03 | 0.31 | ||||||||||
| Total Noncurrent Loans/ Assets (%) | 0.03 | 0.41 | 0.05 | 0.04 | 0.01 | 0.02 | 0.01 | 0.11 | ||||||||||
| Reserves/ NPAs (%) | 2,223.33 | 166.84 | 1,440.00 | 1,638.46 | 4,478.57 | 2,520.83 | 4,142.86 | 609.47 | ||||||||||
| Reserves/ Loans (%) | 1.67 | 1.65 | 1.66 | 1.60 | 1.55 | 1.58 | 1.78 | 2.01 | ||||||||||
Tang Equity/ Tang Assets (%) | 13.95 | 14.51 | 14.78 | 14.28 | 13.62 | 13.29 | 13.35 | 11.80 | ||||||||||
| Tier 1 Risk Based Ratio (%) | 28.10 | 28.90 | 29.10 | 28.20 | 26.82 | 26.62 | 29.08 | 28.69 | ||||||||||
| Risk Based Capital Ratio (%) | 29.35 | 30.16 | 30.36 | 29.46 | 28.07 | 27.86 | 30.33 | 29.94 | ||||||||||
E-1
AMERICAN BANK & TRUST COMPANY
Income Statement
| | Last 4 Quarters | | Last 4 Years | ||||||||||||||||
|---|---|---|---|---|---|---|---|---|---|---|---|---|---|---|---|---|---|---|---|
| ($000) | 12/03 Q | 09/03 Q | 06/03 Q | 03/03 Q | LTM 12/03 | 2002 Y | 2001 Y | 2000 Y | 1999 Y | ||||||||||
| Real Estate Loans | 444 | 448 | 463 | 469 | 1,824 | 1,964 | 1,974 | 1,669 | 1,394 | ||||||||||
| Comm & Ind Loans | 118 | 136 | 136 | 143 | 533 | 513 | 554 | 620 | 584 | ||||||||||
| Consumer Loans | 132 | 120 | 118 | 120 | 490 | 513 | 545 | 488 | 470 | ||||||||||
| Other Loans | — | 7 | 4 | 10 | 21 | 26 | 43 | NA | NA | ||||||||||
| Total Interest Income on Lns | 694 | 711 | 721 | 742 | 2,868 | 3,016 | 3,116 | 2,777 | 2,448 | ||||||||||
Tot Bal Due from Dep Inst | — | — | — | — | — | — | 10 | 38 | 80 | ||||||||||
US Treas Secs & Govt Oblig | 163 | 145 | 127 | 180 | 615 | 949 | 989 | NA | NA | ||||||||||
| Mortgage-backed Securities | 96 | 66 | 94 | 107 | 363 | 494 | 555 | NA | NA | ||||||||||
| All Other Securities | 143 | 132 | 118 | 122 | 515 | 502 | 445 | NA | NA | ||||||||||
| Tot Int/Div Income on Secs | 402 | 343 | 339 | 409 | 1,493 | 1,945 | 1,989 | 2,170 | 1,897 | ||||||||||
Trading Accounts | — | — | — | — | — | — | — | — | — | ||||||||||
| Fed Funds Sold | 15 | 18 | 38 | 29 | 100 | 119 | 211 | 230 | 412 | ||||||||||
| Other Interest Inc | — | 3 | 1 | 1 | 5 | 5 | 5 | NA | NA | ||||||||||
| Total Interest Income | 1,111 | 1,075 | 1,099 | 1,181 | 4,466 | 5,085 | 5,331 | 5,215 | 4,837 | ||||||||||
Transaction Accounts | 26 | 23 | 28 | 26 | 103 | 114 | 141 | 171 | 155 | ||||||||||
| Savings Accounts | 33 | 33 | 36 | 41 | 143 | 205 | 312 | 314 | 319 | ||||||||||
| Time Deps >$100K | 39 | 43 | 47 | 49 | 178 | 212 | 311 | 268 | 245 | ||||||||||
| Other TimeDeposits | 55 | 65 | 71 | 83 | 274 | 455 | 760 | 783 | 787 | ||||||||||
| Tot Int Expense-Deps | 153 | 164 | 182 | 199 | 698 | 986 | 1,524 | 1,536 | 1,506 | ||||||||||
Fed Funds Purchased | — | — | — | — | — | — | — | 1 | — | ||||||||||
| Demand Notes & Other | 8 | 7 | 2 | 20 | 37 | 20 | — | — | — | ||||||||||
| Subordinated Debt | — | — | — | — | — | — | — | — | — | ||||||||||
| Total Interest Expense | 161 | 171 | 184 | 219 | 735 | 1,006 | 1,524 | 1,537 | 1,506 | ||||||||||
Net Interest Income | 950 | 904 | 915 | 962 | 3,731 | 4,079 | 3,807 | 3,678 | 3,331 | ||||||||||
Total Provision Expense | 10 | 11 | 10 | 11 | 42 | 42 | 42 | 11 | — | ||||||||||
Fiduciary Activities | — | — | — | — | — | — | — | NA | NA | ||||||||||
Services Charges on Deps | 136 | 144 | 132 | 133 | 545 | 546 | 548 | 539 | 554 | ||||||||||
| Total Oth Svc Chgs & NII | 62 | 82 | 83 | 68 | 295 | 272 | 162 | 174 | 184 | ||||||||||
| Total Noninterest Income | 198 | 226 | 215 | 201 | 840 | 818 | 710 | 713 | 738 | ||||||||||
Total Realzd Gns(Ls)-Secs | — | — | — | — | — | — | — | — | — | ||||||||||
Salary and Benefits | 487 | 389 | 384 | 389 | 1,649 | 1,639 | 1,486 | 1,395 | 1,301 | ||||||||||
| Occupancy & Fixed Asset | 147 | 158 | 137 | 138 | 580 | 531 | 571 | 466 | 409 | ||||||||||
| Amort of Intangibles | — | — | — | — | — | — | — | — | — | ||||||||||
| Oth Nonint Exp | 255 | 239 | 285 | 262 | 1,041 | 980 | 890 | 876 | 857 | ||||||||||
| Total Noninterest Expense | 889 | 786 | 806 | 789 | 3,270 | 3,150 | 2,947 | 2,737 | 2,567 | ||||||||||
Inc bef Inc Tax & Extra Items | 249 | 333 | 314 | 363 | 1,259 | 1,705 | 1,528 | 1,643 | 1,502 | ||||||||||
Income Taxes | 38 | 69 | 63 | 83 | 253 | 415 | 379 | 426 | 403 | ||||||||||
| Income before Extraord Items | 211 | 264 | 251 | 280 | 1,006 | 1,290 | 1,149 | 1,217 | 1,099 | ||||||||||
Extraord Items, Net Tax | — | — | — | — | — | — | — | — | — | ||||||||||
| NET INCOME (LOSS) | 211 | 264 | 251 | 280 | 1,006 | 1,290 | 1,149 | 1,217 | 1,099 | ||||||||||
Preferred Stock Dividend | — | — | — | — | — | — | — | — | — | ||||||||||
| Earnings Available to Common | 211 | 264 | 251 | 280 | 1,006 | 1,290 | 1,149 | 1,217 | 1,099 | ||||||||||
| Common Stock Dividend | 240 | — | — | — | 240 | 350 | 321 | 214 | 230 | ||||||||||
Shares Outstanding (000) | 116 | 116 | 116 | 116 | 116 | 116 | 116 | 116 | 116 | ||||||||||
| Earnings Per Share ($) | 1.82 | 2.28 | 2.16 | 2.41 | 8.67 | 11.12 | 9.91 | 10.49 | 9.48 | ||||||||||
| Dividends Per Share ($) | 2.07 | — | — | — | 2.07 | 3.02 | 2.77 | 1.85 | 1.98 | ||||||||||
ROAA (%) | 0.93 | 1.10 | 1.07 | 1.18 | 1.05 | 1.40 | 1.37 | 1.56 | 1.44 | ||||||||||
| ROAE (%) | 5.99 | 7.48 | 7.21 | 8.20 | 7.21 | 9.90 | 9.67 | 11.97 | 11.52 | ||||||||||
| Net Interest Margin (%) | 4.18 | 4.05 | 4.16 | 4.41 | 4.20 | 4.78 | 5.00 | 5.13 | 4.79 | ||||||||||
| Efficiency Ratio (%) | 77.44 | 66.44 | 68.60 | 65.21 | 71.54 | 61.86 | 62.84 | 60.13 | 61.09 | ||||||||||
| - | |||||||||||||||||||
| Interest Income/ AA (%) | 4.51 | 4.46 | 4.66 | 4.99 | 4.65 | 5.50 | 6.36 | 6.67 | 6.33 | ||||||||||
| Interest Expense/ AA (%) | 0.65 | 0.71 | 0.78 | 0.92 | 0.77 | 1.09 | 1.82 | 1.97 | 1.97 | ||||||||||
| Net Interest Income/ AA (%) | 3.86 | 3.75 | 3.88 | 4.06 | 3.89 | 4.41 | 4.54 | 4.71 | 4.36 | ||||||||||
| Noninterest Income/ AA (%) | 0.80 | 0.94 | 0.91 | 0.85 | 0.88 | 0.89 | 0.85 | 0.91 | 0.97 | ||||||||||
| Noninterest Expense/ AA (%) | 3.61 | 3.26 | 3.42 | 3.33 | 3.41 | 3.41 | 3.52 | 3.50 | 3.36 | ||||||||||
E-2
Exhibit F
Valuation Calculations
Comparable Transactions Method
AMERICAN BANK & TRUST COMPANY
Merger Pricing Comparison
| Bank & BHC Mergers Announced | between 2/10/03 & 2/9/04 | |
| With Assets | between $50 million & $250 million | |
| Tangible Equity / Assets | between 9% & 20% | |
| ROAA | between 0.5% & 1.5% |
| | ST | Assets ($000) | Tang Eq/ Assets (%) | ROAA (%) | ROAE (%) | NPAs/ Assets (%) | Efficiency Ratio (%) | Announce Date | Comp/ Term Date | Price/ Book (%) | Price/ Tang Book (%) | Price/ LTM Earnings (x) | Price/ Assets (%) | Price/ Deposits (%) | Premium/ Core Deposits (%) | ||||||||||||||||
|---|---|---|---|---|---|---|---|---|---|---|---|---|---|---|---|---|---|---|---|---|---|---|---|---|---|---|---|---|---|---|---|
| America Bancshares Inc./ Sun Country Bank | CA | 162,491 | 9.11 | 1.13 | 13.36 | 0.55 | 63.14 | 4/30/03 | 8/21/03 | 180.23 | 182.90 | 14.92 | 16.64 | 18.44 | 9.24 | ||||||||||||||||
| American Community Bancshares/ FNB Bancshares Inc. | SC | 71,729 | 10.53 | 0.84 | 8.56 | NA | 69.37 | 11/5/03 | NA | 188.46 | 188.46 | 23.26 | 22.06 | 26.19 | 13.70 | ||||||||||||||||
| Boston Private Financial/ First State Bancorp | CA | 168,519 | 9.74 | 1.31 | 14.38 | 0.33 | 56.92 | 7/10/03 | NA | 231.98 | 252.08 | 15.03 | 15.81 | 17.88 | 18.52 | ||||||||||||||||
| Bourbon Bancshares Inc./ Kentucky First Bancorp Inc. | KY | 75,796 | 17.23 | 1.22 | 7.29 | — | 55.48 | 7/8/03 | 11/7/03 | 164.19 | 164.19 | 21.73 | 29.35 | 41.34 | 19.07 | ||||||||||||||||
| Capitol Bancorp Ltd./ AEA Bancshares Inc. | WA | 143,521 | 10.37 | 0.85 | 8.40 | 5.81 | 54.66 | 1/14/04 | NA | 176.91 | 176.91 | 27.38 | 16.03 | 18.35 | 13.08 | ||||||||||||||||
| Citizens First Bancorp Inc./ Metro Bancorp, Inc. | MI | 146,842 | 10.90 | 1.04 | 9.59 | 0.93 | 68.95 | 5/22/03 | 1/9/04 | 181.40 | 181.40 | 20.15 | 20.43 | 23.09 | 11.40 | ||||||||||||||||
| Community Bancshares of MS/ Security Bancshares Inc. | MS | 146,650 | 12.71 | 0.77 | 5.99 | 1.82 | 63.05 | 11/25/03 | NA | 78.93 | 80.70 | 14.27 | 10.23 | 11.84 | NM | ||||||||||||||||
| Community Capital Corp./ Abbeville Capital Corporation | SC | 69,109 | 10.19 | 1.28 | 12.71 | 0.06 | 56.55 | 8/19/03 | NA | 200.59 | 200.59 | 16.36 | 21.70 | 28.03 | 17.09 | ||||||||||||||||
| Harrodsburg First Fin Bancorp/ Independence Bancorp | IN | 102,749 | 10.52 | 1.05 | 9.72 | 0.48 | 73.32 | 1/22/04 | NA | 189.35 | 206.38 | 23.70 | 21.50 | 26.83 | 17.51 | ||||||||||||||||
| IBERIABANK Corp./ Alliance Bank of Baton Rouge | LA | 77,514 | 11.67 | 0.68 | 5.18 | — | 72.78 | 11/17/03 | NA | 170.99 | 170.99 | 34.46 | 19.96 | 22.88 | 10.51 | ||||||||||||||||
| Investor group/ Snyder National Bank | TX | 109,178 | 10.13 | 0.67 | 6.34 | 0.18 | 69.38 | 9/30/03 | 10/23/03 | 123.98 | 123.98 | 20.59 | 12.56 | 14.19 | 3.91 | ||||||||||||||||
| Inwood Bancshares Inc./ WB&T Bancshares Inc. | TX | 154,271 | 10.37 | 1.35 | 14.00 | 1.12 | 65.39 | 4/11/03 | 8/15/03 | 237.13 | 237.56 | 18.33 | 24.63 | 27.59 | 17.70 | ||||||||||||||||
| Lakeland Bancorp Inc./ CSB Financial Corp. | NJ | 122,229 | 9.46 | 0.95 | 9.97 | — | 73.65 | 3/31/03 | 8/25/03 | 293.94 | 293.94 | 31.25 | 27.82 | 32.20 | 23.82 | ||||||||||||||||
| Marquette Financial Companies/ Valley Bancorp, Inc. | AZ | 74,383 | 10.66 | 0.84 | 7.70 | 0.34 | 70.84 | 5/22/03 | 7/31/03 | 174.62 | 174.62 | 22.55 | 18.61 | 22.30 | 10.84 | ||||||||||||||||
| Mid-State Bancshares/ Ojai Valley Bank | CA | 86,185 | 9.09 | 1.21 | 13.18 | 0.47 | 62.66 | 6/30/03 | 10/31/03 | 258.39 | 258.39 | 18.56 | 23.49 | 25.93 | 17.53 | ||||||||||||||||
| National Penn Bancshares Inc./ HomeTowne Heritage Bank | PA | 123,943 | 11.29 | 0.55 | 4.32 | — | 69.54 | 4/30/03 | 12/12/03 | 268.75 | 268.75 | NM | 30.34 | 35.09 | 24.00 | ||||||||||||||||
| Northern States Financial Corp/ Round Lake Bankcorp Inc. | IL | 104,233 | 9.06 | 1.34 | 14.72 | 1.75 | 68.84 | 9/11/03 | 1/5/04 | 216.46 | 216.46 | 20.31 | 19.00 | 20.99 | 13.99 | ||||||||||||||||
| Northwest Financial Corp./ First Heartland Bancorp | IA | 87,037 | 9.02 | 1.05 | 11.64 | 0.56 | 64.25 | 8/29/03 | 11/10/03 | 167.59 | 167.59 | NA | 11.28 | 13.95 | 6.08 | ||||||||||||||||
| Prosperity Bancshares Inc./ MainBancorp Inc. | TX | 206,708 | 9.46 | 0.76 | 6.86 | 1.73 | 75.23 | 7/21/03 | 11/3/03 | 176.26 | 211.84 | 24.74 | 19.66 | 22.29 | 12.72 | ||||||||||||||||
| Sky Financial Group Inc./ GLB Bancorp Inc. | OH | 207,407 | 14.26 | 0.72 | 4.89 | 0.46 | 74.58 | 7/16/03 | 10/20/03 | 132.56 | 133.19 | 33.54 | 19.21 | 23.27 | 6.47 | ||||||||||||||||
| South Shore Savings Bank/ Horizon Bank & Trust Co. | MA | 126,898 | 9.49 | 0.84 | 8.44 | 0.65 | 59.48 | 7/21/03 | NA | 152.83 | 152.83 | 20.94 | 15.87 | 20.10 | 9.78 | ||||||||||||||||
| Union Bankshares Corp./ Guaranty Financial Corp. | VA | 197,075 | 10.05 | 1.01 | 9.88 | — | 75.47 | 12/19/03 | NA | 267.79 | 267.79 | 28.02 | 27.44 | 30.80 | 20.57 | ||||||||||||||||
| Univest Corp. of Pennsylvania/ Suburban Community Bank | PA | 85,534 | 11.20 | 1.02 | 9.42 | — | 70.56 | 5/16/03 | 10/4/03 | 251.90 | 251.90 | 28.14 | 28.22 | 37.46 | 24.62 | ||||||||||||||||
| Wintrust Financial Corp./ Advantage National Bancorp | IL | 104,333 | 9.00 | 0.54 | 6.07 | — | 89.98 | 7/2/03 | 10/1/03 | 229.09 | 229.09 | NM | 20.62 | 23.23 | 15.75 | ||||||||||||||||
| Median | 115,704 | 10.28 | 0.98 | 8.99 | 0.46 | 69.16 | 184.93 | 194.53 | 21.73 | 20.20 | 23.16 | 13.99 | |||||||||||||||||||
| American Bank & Trust Company | 100,781 | 13.95 | 1.05 | 7.21 | 0.03 | 71.54 | |||||||||||||||||||||||||
F-1
AMERICAN BANK & TRUST COMPANY
Value Indication by Comparison to Merger Peer Group
Number of Transactions 24
| | Multiple | Relevant Factor | Value Indication | Weight | ||||||
|---|---|---|---|---|---|---|---|---|---|---|
| Price / Earnings | 21.73 | 913,297 | 19,845,944 | 40% | ||||||
| Price / Tangible Book * | 169.60 | % | 14,069,647 | 23,862,708 | 20% | |||||
| Price / Assets | 20.20 | % | 100,781,000 | 20,352,723 | 10% | |||||
| Price / Deposits | 23.16 | % | 85,638,000 | 19,833,761 | 10% | |||||
| Premium / Core Deposits | 13.99 | % | 76,353,000 | 24,751,432 | 20% | |||||
| 100% | ||||||||||
Value Indication | $ | 21,679,854 | ||||||||
| Shares Outstanding | 115,987 | |||||||||
| Value Indication Per Share | $ | 186.92 | ||||||||
F-2
Exhibit G
Valuation Calculations
Publicly Traded Comparable Bank Method
AMERICAN BANK & TRUST COMPANY
Publicly-Traded Peer Financial Comparison
| | Ticker | State | Fin. Date | Assets ($000) | Loans ($000) | Deposits ($000) | Leverage Ratio (%) | NPA/ Assets (%) | ROAA (%) | ROAE (%) | NIM (%) | Efficiency Ratio (%) | ||||||||||||
|---|---|---|---|---|---|---|---|---|---|---|---|---|---|---|---|---|---|---|---|---|---|---|---|---|
| BancorpSouth, Inc. | BXS | MS | 12/31/03 | 10,303,478 | 6,215,624 | 8,599,128 | NA | 0.64 | 1.28 | 15.50 | 3.80 | 59.58 | ||||||||||||
| Hancock Holding Company | HBHC | MS | 12/31/03 | 4,150,358 | 2,411,894 | 3,447,847 | 9.29 | 0.52 | 1.34 | 12.69 | 4.45 | 57.12 | ||||||||||||
| Hibernia Corporation | HIB | LA | 12/31/03 | 18,560,400 | 12,864,925 | 14,159,500 | NA | 0.41 | 1.45 | 15.08 | 4.16 | 51.91 | ||||||||||||
| IBERIABANK Corporation | IBKC | LA | 12/31/03 | 2,116,624 | 1,399,900 | 1,589,106 | 6.45 | 0.34 | 1.20 | 13.05 | 3.91 | 53.58 | ||||||||||||
| Trustmark Corporation | TRMK | MS | 12/31/03 | 7,914,321 | 4,958,336 | 5,089,459 | 7.33 | 0.41 | 1.60 | 17.56 | 4.11 | 53.58 | ||||||||||||
| Whitney Holding Corporation | WTNY | LA | 12/31/03 | 7,754,982 | 4,838,444 | 6,158,582 | 9.76 | 0.44 | 1.36 | 11.96 | 4.47 | 60.99 | ||||||||||||
| Britton & Koontz Capital Corporation | BKBK | MS | 12/31/03 | 373,084 | 207,623 | 232,934 | 7.82 | NA | 0.80 | 9.13 | 4.19 | 72.95 | ||||||||||||
| Citizens Holding Company | CIZ | MS | 9/30/03 | 571,897 | 340,758 | 460,762 | 8.59 | 0.86 | 1.22 | 11.90 | 4.41 | 53.84 | ||||||||||||
| First M & F Corporation | FMFC | MS | 12/31/03 | 1,078,298 | 770,430 | 820,226 | 8.84 | NA | 1.03 | 9.82 | 4.11 | 64.34 | ||||||||||||
| MidSouth Bancorp, Inc. | MSL | LA | 12/31/03 | 432,697 | 259,083 | 374,389 | 7.24 | 0.36 | 1.55 | 21.34 | 5.19 | 66.19 | ||||||||||||
| NBC Capital Corporation | NBY | MS | 12/31/03 | 1,093,224 | 582,933 | 815,839 | 9.93 | NA | 1.30 | 12.20 | 3.42 | 63.35 | ||||||||||||
| Peoples Financial Corporation | PFBX | MS | 12/31/03 | 575,434 | 291,524 | 372,557 | 14.51 | 2.37 | 0.87 | 6.08 | 3.83 | 72.05 | ||||||||||||
| Peoples Holding Company | PHC | MS | 12/31/03 | 1,416,078 | 851,063 | 1,133,931 | NA | 0.64 | 1.33 | 13.41 | 4.23 | 62.77 | ||||||||||||
| Median | 1,416,078 | 851,063 | 1,133,931 | 8.72 | 0.48 | 1.30 | 12.69 | 4.16 | 60.99 | |||||||||||||||
| American Bank & Trust Company | 100,781 | 39,305 | 85,638 | 13.95 | 0.03 | 1.05 | 7.21 | 4.20 | 71.54 |
G-1
AMERICAN BANK & TRUST COMPANY
Publicly-Traded Peer Pricing Comparison
| | Ticker | State | Shares Outstanding | Book Value/ Share ($) | Tangible BVPS ($) | EPS ($) | Dividend/ Share ($) | 2/9/2004 Price ($) | Price/ BVPS (%) | P / Tang. BVPS (%) | Price/ EPS | Price/ Assets (%) | Price/ Deposits (%) | Dividend Yield (%) | ||||||||||||||||||
|---|---|---|---|---|---|---|---|---|---|---|---|---|---|---|---|---|---|---|---|---|---|---|---|---|---|---|---|---|---|---|---|---|
| BancorpSouth, Inc. | BXS | MS | 77,956,000 | 11.15 | NA | 1.69 | 0.72 | 21.93 | 196.68 | NA | 12.98 | 16.59 | 19.88 | 3.28 | ||||||||||||||||||
| Hancock Holding Company | HBHC | MS | 15,255,468 | 26.13 | 22.55 | 3.41 | 0.92 | 57.73 | 220.93 | 256.01 | 16.93 | 21.22 | 25.54 | 1.59 | ||||||||||||||||||
| Hibernia Corporation | HIB | LA | 155,261,000 | 11.55 | NA | 1.67 | 0.72 | 22.81 | 197.49 | NA | 13.66 | 19.08 | 25.01 | 3.16 | ||||||||||||||||||
| IBERIABANK Corporation | IBKC | LA | 6,718,458 | 29.41 | 19.87 | 3.71 | 0.96 | 61.90 | 210.47 | 311.52 | 16.68 | 19.65 | 26.17 | 1.55 | ||||||||||||||||||
| Trustmark Corporation | TRMK | MS | 58,246,733 | 11.84 | 9.82 | 2.01 | 0.76 | 30.04 | 253.71 | 305.90 | 14.94 | 22.11 | 34.38 | 2.53 | ||||||||||||||||||
| Whitney Holding Corporation | WTNY | LA | 40,447,992 | 20.78 | 18.49 | 2.47 | 1.32 | 41.37 | 199.09 | 223.74 | 16.75 | 21.58 | 27.17 | 3.19 | ||||||||||||||||||
| Britton & Koontz Capital Corporation | BKBK | MS | 2,113,087 | 14.29 | 13.77 | 1.29 | 0.64 | 18.40 | 128.75 | 133.62 | 14.26 | 10.42 | 16.69 | 3.48 | ||||||||||||||||||
| Citizens Holding Company | CIZ | MS | 4,974,578 | 11.08 | 9.77 | 1.33 | 0.60 | 23.25 | 209.84 | 237.97 | 17.48 | 20.22 | 25.10 | 2.58 | ||||||||||||||||||
| First M & F Corporation | FMFC | MS | 4,565,038 | 24.24 | 20.55 | 2.36 | 1.00 | 35.36 | 145.87 | 172.07 | 14.98 | 14.97 | 19.68 | 2.83 | ||||||||||||||||||
| MidSouth Bancorp, Inc. | MSL | LA | 3,194,000 | 10.09 | 9.78 | 1.99 | 0.24 | 35.65 | 353.32 | 364.52 | 17.91 | 26.32 | 30.41 | 0.67 | ||||||||||||||||||
| NBC Capital Corporation | NBY | MS | 8,171,811 | 13.60 | 13.25 | 1.65 | 0.96 | 25.82 | 189.85 | 194.87 | 15.65 | 19.30 | 25.86 | 3.72 | ||||||||||||||||||
| Peoples Financial Corporation | PFBX | MS | 5,557,000 | 15.03 | 15.03 | 0.90 | 0.30 | 18.50 | 123.09 | 123.09 | 20.56 | 17.87 | 27.59 | 1.62 | ||||||||||||||||||
| Peoples Holding Company | PHC | MS | 8,194,526 | 16.79 | NA | 2.19 | 0.80 | 31.73 | 188.98 | NA | 14.49 | 18.36 | 22.93 | 2.52 | ||||||||||||||||||
| Median | 197.49 | 230.86 | 15.65 | 19.30 | 25.54 | 2.58 | ||||||||||||||||||||||||||
| American Bank & Trust Company | 115,987 | $ | 121.89 | $ | 121.89 | $ | 8.67 | $ | 2.07 | |||||||||||||||||||||||
G-2
AMERICAN BANK & TRUST COMPANY
Value Indication by Comparison to Public Peer Group
| | Multiple | Relevant Factor | Value Indication | Weight | |||||
|---|---|---|---|---|---|---|---|---|---|
| Price / Earnings | 15.65 | 913,297 | 14,291,714 | 40 | % | ||||
| Price / Tangible Book * | 181.69 | % | 14,069,647 | 25,562,987 | 20 | % | |||
| Price / Assets | 19.30 | % | 100,781,000 | 19,451,095 | 20 | % | |||
| Price / Deposits | 25.54 | % | 85,638,000 | 21,874,877 | 20 | % | |||
| Dividend Yield | 2.58 | % | 231,974 | 8,988,993 | 0 | % | |||
| 100 | % |
| Value Indication | $ | 19,094,478 | |
| Shares Outstanding | 115,987 | ||
| Value Indication Per Share | $ | 164.63 |
G-3
Exhibit H
Valuation Calculations
Publicly Traded Share Exchange Method
AMERICAN BANK & TRUST COMPANY
Exchange Valuation
| Last 12 months Net Income | $ | 1,200,000 | |||||||||||
| Plus: Est. Enhancement by Acquirer | @ | 25% | 300,000 | ||||||||||
| Equals: Target Annual Earnings: | $ | 1,500,000 |
| Company | | Stock Price | Est. EPS | Price/ Est. EPS | Shares | Projected Value | |||||||
|---|---|---|---|---|---|---|---|---|---|---|---|---|---|
| BancorpSouth, Inc. | 21.93 | 1.65 | 13.29 | 909,091 | 19,936,364 | ||||||||
| Hancock Holding Company | 57.73 | 3.65 | 15.82 | 410,959 | 23,724,658 | ||||||||
| Hibernia Corporation | 22.81 | 1.80 | 12.67 | 833,333 | 19,008,333 | ||||||||
| IBERIABANK Corporation | 61.90 | 3.82 | 16.20 | 392,670 | 24,306,283 | ||||||||
| Trustmark Corporation | 30.04 | 2.19 | 13.72 | 684,932 | 20,574,658 | ||||||||
| Whitney Holding Corporation | 41.37 | 2.55 | 16.22 | 588,235 | 24,335,294 | ||||||||
| Britton & Koontz Capital Corporation | 18.40 | 1.34 | 13.73 | 1,119,403 | 20,595,896 | ||||||||
| Citizens Holding Company | 23.25 | 1.60 | 14.53 | 937,500 | 21,796,875 | ||||||||
| First M & F Corporation | 35.36 | NA | NA | NA | NA | ||||||||
| MidSouth Bancorp, Inc. | 35.65 | 2.10 | 16.98 | 714,286 | 25,464,286 | ||||||||
| NBC Capital Corporation | 25.82 | 1.65 | 15.65 | 909,091 | 23,472,727 | ||||||||
| Peoples Financial Corporation | 18.50 | NA | NA | NA | NA | ||||||||
| Peoples Holding Company | 31.73 | 2.36 | 13.44 | 635,593 | 20,167,373 | ||||||||
Average | $ | 22,125,704 | |||||||||||
Shares Outstanding | 115,987 | ||||||||||||
Value Indication Per Share | $ | 190.76 | |||||||||||
H-1
Exhibit I
Valuation Calculations
Discounted Future Returns Method
| | 1998Y | 1999Y | 2000Y | 2001Y | 2002Y | 2003Y | 2004Y | 2005Y | 2006Y | 2007Y | 2008Y | ||||||||||||
|---|---|---|---|---|---|---|---|---|---|---|---|---|---|---|---|---|---|---|---|---|---|---|---|
| Total Assets ($000) | 73,632 | 80,232 | 82,749 | 92,041 | 99,653 | 100,781 | 101,741 | 105,911 | 110,082 | 114,253 | 118,423 | ||||||||||||
| Avg Assets ($000) | 69,115 | 76,932 | 81,491 | 87,395 | 95,847 | 98,457 | 101,261 | 103,826 | 107,997 | 112,167 | 116,338 | ||||||||||||
| Total Deposits ($000) | 63,850 | 70,467 | 71,345 | 78,711 | 84,842 | 85,638 | 86,112 | 89,337 | 92,562 | 95,787 | 99,012 | ||||||||||||
| Total Equity ($000) | 9,409 | 9,468 | 11,044 | 12,236 | 13,577 | 14,070 | 14,430 | 14,850 | 15,288 | 15,742 | 16,213 | ||||||||||||
| Intangible Assets ($000) | — | — | — | — | — | ||||||||||||||||||
| Total Tangible Equity ($000) | 9,409 | 9,468 | 11,044 | 12,236 | 13,577 | 14,070 | 14,430 | 14,850 | 15,288 | 15,742 | 16,213 | ||||||||||||
| Net Income (Loss) ($000) | 1,017 | 1,099 | 1,217 | 1,149 | 1,290 | 913 | 1,200 | 1,402 | 1,458 | 1,514 | 1,571 | ||||||||||||
| Cash Dividends ($000) | 216 | 230 | 214 | 321 | 350 | 232 | 840 | 981 | 1,021 | 1,060 | 1,099 | ||||||||||||
| Time Deposits >$100K ($000) | 4,007 | 4,618 | 5,179 | 7,210 | 8,122 | 9,285 | 8,611 | 8,934 | 9,256 | 9,579 | 9,901 | ||||||||||||
Payout ratio | 21.2 | % | 20.9 | % | 17.6 | % | 27.9 | % | 27.1 | % | 25.4 | % | 70.0 | % | 70.0 | % | 70.0 | % | 70.0 | % | 70.0 | % | |
| Core Deposits | 93.7 | % | 93.4 | % | 92.7 | % | 90.8 | % | 90.4 | % | 89.2 | % | 90.0 | % | 90.0 | % | 90.0 | % | 90.0 | % | 90.0 | % | |
| ROAA | 1.47 | % | 1.43 | % | 1.49 | % | 1.31 | % | 1.35 | % | 0.93 | % | 1.19 | % | 1.35 | % | 1.35 | % | 1.35 | % | 1.35 | % | |
| Equity/Assets | 12.78 | % | 11.80 | % | 13.35 | % | 13.29 | % | 13.62 | % | 13.96 | % | 14.18 | % | 14.02 | % | 13.89 | % | 13.78 | % | 13.69 | % |
I-1
AMERICAN BANK & TRUST COMPANY
Value Indication by Comparison to Merger Peer Group—5 Years Out
Number of Transactions 24
| | Multiple | Relevant Factor | Value Indication | Weight | |||||
|---|---|---|---|---|---|---|---|---|---|
| Price / Earnings | 21.73 | 1,570,564 | 34,128,349 | 40 | % | ||||
| Price / Tangible Book * | 170.98 | % | 16,212,976 | 27,720,378 | 20 | % | |||
| Price / Assets | 20.20 | % | 118,423,387 | 23,915,603 | 10 | % | |||
| Price / Deposits | 23.16 | % | 99,012,434 | 22,931,280 | 10 | % | |||
| Premium / Core Deposits | 13.99 | % | 89,111,190 | 28,679,632 | 20 | % | |||
| 100 | % |
| Value Indication | $ | 29,616,030 | |
| Shares Outstanding | 115,987 | ||
| Value Indication Per Share | $ | 255.34 |
I-2
| Yr | Discount Rate 13.56% | Dividends FV | Dividends PV | Sale FV | Sale PV | ||||||
|---|---|---|---|---|---|---|---|---|---|---|---|
| 1 | 88.06% | 840 | 740 | ||||||||
| 2 | 77.54% | 981 | 761 | ||||||||
| 3 | 68.28% | 1,021 | 697 | ||||||||
| 4 | 60.13% | 1,060 | 637 | ||||||||
| 5 | 52.95% | 1,099 | 582 | 29,616 | |||||||
| Present Value | 3,417 | 15,682 | |||||||||
| Sum of Present Values | 19,099 | ||||||||||
| Shares Outstanding | 115,987 | Per Share | $ | 164.66 | |||||||
Ibbotson Build Up Method
| Riskless Rate | 4.16% | 1/30/04 10Yr CMT | ||
| Equity Risk Premium | 7.40% | Ibbotson | ||
| Industry Risk Premium | -1.30% | Ibbotson | ||
| Size Premium | 3.30% | Ibbotson | ||
| Specific Company Premium | 0.00% | location, economic concentration | ||
| Cost of Equity Estimate | 13.56% | |||
I-3
Exhibit J
Valuation Calculations
Capitalization of Historical Earnings Method
| | 1999Y | 2000Y | 2001Y | 2002Y | 2003Y | ||||||
|---|---|---|---|---|---|---|---|---|---|---|---|
| Total Assets ($000) | 80,232 | 82,749 | 92,041 | 99,653 | 100,781 | ||||||
| Avg Assets ($000) | 76,932 | 81,491 | 87,395 | 95,847 | 98,457 | ||||||
| Total Deposits ($000) | 70,467 | 71,345 | 78,711 | 84,842 | 85,638 | ||||||
| Total Equity ($000) | 9,468 | 11,044 | 12,236 | 13,577 | 14,070 | ||||||
| Intangible Assets ($000) | — | — | — | — | |||||||
| Total Tangible Equity ($000) | 9,468 | 11,044 | 12,236 | 13,577 | 14,070 | ||||||
| Net Income (Loss) ($000) | 1,099 | 1,217 | 1,149 | 1,290 | 913 | ||||||
| Cash Dividends ($000) | 230 | 214 | 321 | 350 | 232 | ||||||
| Time Deposits >$100K ($000) | 4,618 | 5,179 | 7,210 | 8,122 | 9,285 | ||||||
Payout ratio | 20.9 | % | 17.6 | % | 27.9 | % | 27.1 | % | 25.4 | % | |
| Core Deposits | 93.4 | % | 92.7 | % | 90.8 | % | 90.4 | % | 89.2 | % | |
| ROAA | 1.43 | % | 1.49 | % | 1.31 | % | 1.35 | % | 0.93 | % | |
| Equity/Assets | 11.80 | % | 13.35 | % | 13.29 | % | 13.62 | % | 13.96 | % | |
Weighting | 1 | 2 | 3 | 4 | 5 | ||||||
Weighted Average Historical Normalized ROA | 1.23 | % | |||||||||
| Resulting Earnings on Current Asset Base | 1,235 | ||||||||||
| Capitalization Rate | 6.39 | % | |||||||||
| Indicated Value | 19,325,602 | ||||||||||
| Shares Outstanding | 115,987 | ||||||||||
| Indicated Value per Share | 166.62 |
J-1
Exhibit K
Minority Discount Studies and Evidence
Control Premiums and Minority Interest Discounts1
1 The information contained in this document is based heavily on Shannon P. Pratt's bookValuating a Business, 2d ed. (Homewood, Ill.: Business One-Irwin, 1989) and Z. Christopher Mercer's bookValuing Financial Institutions, (Homewood, Ill.: Business One-Irwin, 1992).
The existence of control premiums has been documented in numerous studies of publicly traded stocks.2 For example, in theMergerstat Review 1990, published by Merrill Lynch, the average control premium derived from the acquisition of 185 public companies in 1990 was 42 percent.3 TheMergerstat Review was based on the differences between market prices of each of the publicly traded acquired companies five days before buyout announcements and the actual buyout prices.
2 For further references on these concepts, see Appendix D ofValuating a Business, p. 705. Dr. Pratt's staff periodically updates this bibliography as a courtesy to the appraisal profession. These updates are published by the Business Valuation Committee of the American Society of Appraisers in regular issues ofBusiness Valuation Review, which is a current source of theoretical and practical articles on topics related to business appraisal.
3Mergerstat Review 1990, 1991, pp. 100-101.(Mergerstat Review was published by W.T. Grimm & Co. until 1987, when it was acquired by Merrill Lynch.) The publication, prepared each year, is a common reference source related to control premiums and other aspects of market transactions.
Based upon the Mergerstat Review reports and other studies, control premiums are generally in the range of 20 to 50 percent or morefrom the freely tradable pricing of the public markets. In other words, control premiums are applied to freely tradable minority interest (or as-if-freely-tradable) valuation bases.
As noted above, a minority interest discount is applied to the value of the enterprise to reflect the absence of control. In other words, the purpose of a minority interest discount is to eliminate the control premiumfrom a controlling interest valuation base. An example using a hypothetical company will explain the relationships.
| I. | Application of Control Premium | |||||||
| Market Price (freely tradable, minority interest) | $ | 100.00 | per share | |||||
| + | Control Premium (assume 40%) | 40.00 | per share | |||||
| = | Controlling Interest Price | 140.00 | per share | |||||
II. | Application of Minority Interest Discount | |||||||
| Controlling Interest Price | $ | 140.00 | per share | |||||
| - | Minority Interest Discount [1-(1/ 1.40)% = 28.6%] | (40.00 | ) | per share | ||||
| = | Minority Interest Price (freely tradable, minority interest) | 100.00 | per share | |||||
In the first example, we began with the freely tradable minority interest price (for example, the publicly traded price) and added a control premium of 40 percent. The minority interest discount, which in this case is 28.6 percent, is defined as the elimination of the control premium, so it is calculated as shown in the second example. While the relationship between the controlling interest price and the freely tradable minority interest price—and the corollary relationship between the control premium and the minority interest discount—are fairly straightforward, they are the subject of much confusion by appraisers, courts, and other users of business appraisals.
Marketability Discounts
Readers should not confuse the minority interest discount with the marketability discount. They are separate discounts and are applied to different valuation bases. We have just seen that the minority
K-1
interest discount is applied to a controlling interest valuation base to eliminate the value attributable to elements of control. The marketability discount is applied to a freely tradable valuation base to penalize a subject valuation interest for its comparative lack of marketability or liquidity.
Theoretically, the marketability discount is the discount necessary to generate a sufficient increment in return to the holder of a minority interest of an entity's closely-held shares to induce the purchaser to make this particular investment, rather than an alternative investment identical in all respects save marketability.4 Stated alternatively, if predictable and observable returns can be obtained from the two similar investments—one in a marketable stock and the other in a nonmarketable stock—other things being equal, a rational investor will pay somewhat less for the nonmarketable shares than for the freely tradable shares.
4 The marketability discount provides the incremental return (reward) necessary to offset the risks associated with a long or indeterminable holding period until liquidity can be achieved. The concept of developing values based upon comparisons with alternate investments is inherent in the definition of fair market value. The hypothetical willing buyer makes comparisons with alternative investment opportunities before engaging in a transaction. At the same time, the hypothetical willing seller must also make similar comparisons in order to evaluate the reasonableness of an offer for his or her closely-held business interest. Revenue Ruling 59-60, which defines fair market value, outlines several ways that hypothetical investors (and real-life appraisers) can look at alternative investments.
Marketability discounts can range from very small (in the range of 5-10 percent) to quite large (60-70 percent or more). The basic logic for the marketability discount lies in illiquidity and the inherent riskiness this implies; therefore, all else equal, a marketable interest is worth more than a nonmarketable but otherwise identical interest.
Risks associated with illiquidity include the inability to dispose of an interest in the face of deteriorating company or industry conditions, as well as the inability to sell the interest if the investor's personal situation requires liquidity. Illiquidity, then, can pose substantial risks to investors. In addition, most closely-held companies do not pay regular dividends to shareholders. Consequently, the expectation of achieving a reasonable rate of return from an investment in a minority interest of a closely-held company is often extended until ultimate disposition, over which the shareholder has no control. It is no small wonder, then, that marketability discounts can be quite large.
Minority Interest Discounts versus Marketability Discounts
Minority discounts and marketability discounts are separate and distinct valuation discounts. They are applied to different valuation bases and are designed to account for different valuation factors. Nevertheless, one of the more common mistakes that appraisers (and, unfortunately, courts) make is to confuse, mix or combine the two discounts.
There is no such measurable adjustment factor as a "discount for marketability and minority interest." Unfortunately, this mysterious discount has been applied in numerous valuations prepared by business appraisers (or would-be business appraisers) and in all too many court decisions.
The use of the minority interest and marketability discounts in combination in the same valuation presumes that the base valuation reference point is a controlling interest value, that a minority interest discount is applied to eliminate the control element in the valuation, and that therefore a marketability discount is applied to derive the value on a nonmarketable minority interest basis.
It is important to note that minority interest and marketability discounts aresuccessive andmultiplicative rather than additive. Following through from the example of discount applications above,
K-2
the sequential application of the two discounts is shown below, beginning from a controlling interest value base.
| III. | Application of Successive Minority Interest and Marketability Discounts | |||||||
| Controlling Interest Price (per Example II) | $ | 140.00 | per share | |||||
| - | Minority Interest Discount (28.6% discount to eliminate a 40% control premium) | (40.00 | ) | per share | ||||
| = | As-if-freely-tradable price (minority interest basis) | 100.00 | per share | |||||
| - | Marketability discount (assume 35% is appropriate) | $ | (35.00 | ) | per share | |||
| = | Nonmarketable minority interest value | 65.00 | per share | |||||
The combined discounts total 53.6 percent from the controlling interest base value in the example. The total discount can be calculated in two ways. First, dividing the nonmarketable minority interest discount by the controlling interest price and subtracting from 1 (or 100%) yields a total discount of 53.6 percent:
1- | ( | $65 $140 | ) | %=53.6% |
Second, the successive and multiplicative nature of the discounts can be seen by the following calculation, which yields the same result. Using the discounts shown above for the minority interest discount (28.6 percent) and the marketability discount (35 percent), the total effective discount is calculated:
1-[(1-28.6%)×(1-35%)]%=53.6%
In the present example, a total discount from the controlling interest base value of well over 50 percent is established after applying successive minority interest discounts (to eliminate control) and marketability discounts (to account for illiquidity). This example is not at all unrealistic and is in the (wide) range of typical discounts for nonmarketable minority interests in relationship to controlling interest vales for closely-held business interests.
The Minority Stockholder's Situation
Minority stock interests in a "closed" corporation are usually worth much less than the proportionate share of the assets to which they attach5
5Cravens v.Welch, 10 Fed. Supp. 94 (1935)
The above statement, from a 1935 stock valuation case that is still widely quoted, captures the essence of the minority stockholder's situation. This revelation comes as a shock to many people, who may have always assumed that a partial interest is worth a pro rata portion of the value of the total enterprise.
H. Calvin Coolidge, a former bank trust officer with extensive experience in dealing with and selling (or attempting to sell) minority interests in closely held companies, presents a cogent summary of the minority stockholder's position.
The holder of a minority interest can at best elect only a minority of the directors, and for corporations chartered in states which do not permit cumulative voting, he may not be able to
K-3
elect even one director. Lacking control of the board of directors, he cannot compel payment of dividends which must be declared equally and which would give him his pro rata share of earnings. Lacking control of the board of directors, he cannot compel his election as an officer or his employment by the corporation, which the holders of the controlling interest can do, often with resultant handsome compensation. In short, the holder of a minority interest has no voice in corporate affairs and is at the mercy of the holders of the controlling interest who have no reason to pay anything but a token dividend, if any, and no reason to buy out the minority holder except at a nominal price.
A willing buyer contemplating purchase from a willing seller of a minority interest, being under no compulsion to buy (which would exclude a buyer already owning some shares whose new purchase would cover control), would suffer the same disadvantage of lack of control. The buyer is asked to make an investment with no assurance as to the certainty of current yield or as to when, or the amount at which, he may be able to liquidate his investment. Regardless, therefore, of the value of 100% of the corporation, the buyer will not purchase a minority interest except at a discount from its proportionate share of the value of 100% of the corporation.6
6 H. Calvin Coolidge, "Discount for Minority Interest: Rev. Rul. 79-7's Denial of Discount Is Erroneous,"Illinois Bar Journal 68 (July 1980), p. 744
The lack of concurrence between the value of stock and the corporation's underlying assets was clearly established by the U.S. Supreme Court back in 1925:
The capital stock of a corporation, its net assets, and its shares of stock are entirely different things... the value of one bears no fixed or necessary relation to the value of the other.7
7Ray Consol. Copper Co. v.United States, 45 S. Ct. 526 (1925)
An oft-cited U.S. Tax Court case quoted the above, adding:
This is particularly true as to minority interests in a closed corporation...8
8Drayton Cochran et al., 7 T.C.M. 325 (1948)
That minority shareholders often find themselves disadvantaged compared to controlling shareholders is attested to by the fact that the oft-quoted, lengthy, and scholarly two volume treatiseO'Neal's Oppression of Minority Shareholders is doing well in its second edition, published in 1985. In the preface to that edition, the authors comment on the growing amount of minority shareholder litigation:
Most American lawyers do not realize the tremendous amount of litigation in this country arising out of shareholder disputes. Since the publication of the first edition of this treatise, the volume of litigation grounded on minority shareholder oppression—actual, fancied, or fabricated—has grown enormously, and the flood of litigation shows no sign of abating. The increase in litigation has been pronounced in both federal and state courts, with an especially large number of suits challenging the validity of "cash-out" mergers. Also worthy of note is that in the last four or five years there has been a substantial increase in the number of suits minority shareholders have brought for involuntary dissolution of their corporation or to force majority shareholders to purchase their shares.9
9 F. Hodge O'Neal and Robert B. Thompson,O'Neal's Oppression of Minority Shareholders,2nd ed., vol. 1 (Wilmette, Ill.: Callaghan & Company, 1985), p. iii. The termcash-out merger is sometimes used to mean asqueeze-out orfreeze-out merger, in which minority shareholders receive cash for their shares. They cannot block the merger or demand consideration other than cash. If they are not satisfied with the amount of cash offered, their remedy is to demand an appraisal of the stock under dissenter's appraisal rights statutes. See, for example,Roland International Corp. v.Najjar, 407 A.2d 1032, 1033 (Del. S. Ca. 1979)
K-4
Pratt, inValuing a Business, suggests three broad approaches to the valuation of minority interests:
- 1.
- Determine the value of the total enterprise on a control basis, and deduct any discounts appropriate for minority interest and/or lack of marketability.
- 2.
- Value the interest by direct comparison with other minority interest transactions. (Since most available data on minority interest transactions deal with publicly traded stocks, this approach usually requires the further step of deducting a discount for the lack of marketability but no further deduction for minority interest.)
- 3.
- Value the interest with a "bottom-up" approach based on the discounted future returns the shareholder may expect to realize through dividends and/or liquidation of the interest at some future date.
Problems in Liquidating Minority Shares of Closely Held Companies
A corollary to the disadvantages associated with lack of control is lack of marketability. Although the minority interest status and degree of liquidity (marketability) of the investment are two different concepts, they are interrelated. The disadvantages associated with the minority status make it very difficult to find buyers for minority shares of nonpublic companies, further reducing the value of such shares. In fact, unless there is some provision for sale of the shares through either the articles of incorporation or a contract, the minority shareholder may be unable to find anyone willing to buy the shares at any price.
Restrictive Agreements
Many minority shares are subject to restrictions on transfer. The typical restriction gives the company and/or each of the company's stockholders a right to first refusal, thus putting any potential sale on hold for two or three months or longer. As a practical matter, few potential buyers would make a firm offer to buy and leave their offers open for that length of time. Thus, such restrictive agreements further reduce the marketability, and, hence, the value of the shares. Some restrictions on sale are far more onerous than a simple right of first refusal, thus limiting the shares' marketability even further.
Lack of Right to Partition
Discounts for minority interests in direct investment in real estate, when taken at all, usually are only about 15 to 20 percent below a pro rata proportion of the value of the total parcel. Sometimes people more familiar with direct investments in real estate than with investments in business accord similarly low minority interest discounts to investments in business interests.
As discussed earlier, the controlling owner of a business enterprise has an extremely wide diversity of options available, some of which may benefit control owners without benefiting minority owners. Of particular importance in protecting the interest of minority owners of real estate is the legal right topartition, the right to demand that the property be divided up and the majority owner given title to his or her share (or to demand sale of property if partitioning is impractical.) With a few exceptions (noted subsequently in the Rights to Dissolution or Sale of Stock section), no such rights are available to minority stockholders.
K-5
Lack of Right to Participate in a Sale
Many minority stockholders assume that if a controlling interest is sold, they have the right to receive the same price for their shares as the controlling shareholders. Generally speaking, however, unless there are special state laws or protective provisions in the articles of incorporation, this is not true. There have been many situations on which controlling stockholders sold out and minority shareholders subsequently accepted offers for their shares at a fraction of the price per share the controlling shareholders received.
O'Neal and Thompson make the following statement regarding the traditional doctrine on sale of control:
The traditional view is that a shareholder, irrespective of whether he is also a director, officer, or both, may sell his shares, just as other kinds if personal property, for whatever price he can obtain, even if his shares constitute a controlling block and the price per share is enhanced by that fact. Further, he is under no obligation to obtain for other shareholders an opportunity to sell their shares on the same favorable terms he is receiving or even to inform them of that price or the terms of the sale.10
10 O'Neal and Thompson,O 1Veal's Oppression. p. 4
There has been much bitter litigation over this point, and the authors footnote many court case citations. The flavor of the decisions is captured in their paraphrasing of the fýndings in two cases:
Majority shareholder has no duty to see that minority shareholders are allowed to join in a sale of stock at the same price per share and on the same terms offered for shares constituting the controlling interest[Claget v. Hutchinson, 583 F.2d 1259 (CA4, 1978)].
Majority shareholders did not breach their fiduciary duty by selling control at a premium, by inviting some (but not all) minority shareholders to sell also and share in the premium, or by failing to disclose these facts to the other minority shareholders[Richie v. McGrath, 1 Kan App.2d 481, 571 P2d 17 (1977)].11
11Ibid., p.10.
State Statutes Affecting Minority Stockholder Rights
Statutes affecting minority stockholders' rights vary greatly from state to state. These statutes, and the case law developed pursuant to each, can have an extremely important bearing on the values of certain minority interests in many situatiorn.
Requirements for Supermajority Votes
In some states, a simple majority can approve major actions such as a merger or a sale of a company. Other states require a two-thirds or even greater majority to approve such actions, which means that a minority of just over one third has the power to block them thus giving large majority interests a form of "blocking power."
Both types of actions that require a supermajority vote and the size of the supermajority required for each action vary considerably from state to state, and many states are undergoing processes of review and change. The tendency is toward requiring only a simple majority (anything above 50 percent) rather than a supermajority to authorize most or all corporate actions.
K-6
Right to Dissolution or Sale of Stock
An increasing number of states are enacting statutes enabling minority shares aggregating some specified percentage of the total outstanding to petition the courts to force dissolution of the corporation under certain circumstances. Such statutes generally provide that controlling stockholders can prevent dissolution in such cases by paying the petitioners for dissolution the fair value of their shares. By far the largest amount of litigation regarding the value of shares under such statutes has been pursuant to California Corporation Code Section 2000.
Dissenting-Stockholder Appraisal Rights
Most states have statutes allowing minority stockholders to dissent if a company merges, sells all or nearly all of its assets, or undergoes some other fundamental change. In most cases, the dissenters' remedy is to have their shares appraised and be paid that value in cash. In most states, the standard of value for dissenting-stockholder actions is "fair value." A few states (including Louisiana) still specify "fair market value," but recently several have changed their dissenting-stockholder statutory standard of value to "fair value."
Most states require that if a minority stockholder wishes to dissent to a corporate action, the decision to dissent must be registered in writing at or within a few days following the stockholder meeting at which the action is approved by the majority of stockholders. This registration of dissent often is referred to asperfecting dissenters' appraisal rights. The courts are virtually unanimous in prohibiting dissenters' appraisal rights unless they have been perfected within the amount of time specified in the statute.
Effect of Distribution of Ownership
If one person owns 49 percent of a company's stock and another owns 51 percent, the 49 percent holder has little or no control of any kind. However, if two stockholders own 49 percent and a third owns 2 percent, the 49 percent stockholders may be on a par with each other depending on who owns the other 2 percent. The 2 percent stockholder may be able to command a premium over the normal minority interest value for that particular block of stock because of its swing vote power.
If each of the three stockholders or partners owns a one-third interest, no one has complete control. However, no one is in a relatively inferior position, unless two of the three have close ties with each other that the third does not share. Each of equal individual interests normally are worth less than a pro rata portion of the total enterprise's worth; thus, the sum of the values of the individual interests usually is less than what the total enterprise could be sold for to a single buyer. However, the percentage discount from pro rata value for each such equal interest normally would be smaller than that for a minority interest with no control whatsoever.
Each situation must be analyzed individually with respect to the degree of control, or lack of it, and the implications for the minority interest's value.
Voting versus Nonvoting Shares
The difference in value, if any, between voting and nonvoting minority shares depends largely on the size of the block and the distribution of ownership. In general, the greater the extent to which the issue of control is involved, the greater the impact of voting rights on the stock's value. As noted earlier, when swing votes are involved, the value impact can be considerable.
There have been several empirical studies on the price differentials between voting and nonvoting publicly traded stocks. The market data indicate that for small minority interests, the market generally accords very little or no value to voting rights. Where differentials in favor of voting stock exist, they generally have been under 5 percent, and no study has indicated a differential of over 10 percent.
K-7
Again, the distribution of stock can have a bearing. If one stockholder has total control anyway and there is no cumulative voting, the question of whether the minority shares are voting or nonvoting is academic unless a split-up of the control block is foreseeable.
Restrictive agreements also can have a bearing. Some voting stocks are subject to an agreement that causes them to be converted to nonvoting stock in the event of a transfer. Such a provision can render voting rights virtually impotent for valuation purposes.
How the Applicable Standard of Value Affects Minority Interests
The applicable standard of value for the vast majority of valuation situations falls into one of four categories: (1) fair market value, (2) investment value, (3) intrinsic value, or (4) fair value. The applicable standard of value is determined primarily by the purpose and circumstances of the valuation. In some situations, the applicable standard of value is mandated by law. In others, the choice of standard of value lies within the discretion of the parties involved.
Fair Market Value
Thefair market value standard implies a price at which an arm's-length transaction would be expected to take place between normally motivated investors under open market conditions, without considering any special benefits for any particular buyer or seller. Considering the unattractiveness of minority interests in closely held companies to investors at large, the discount from a proportionate share of enterprise value under the fair market value standard normally is quite large.
Investment Value
Theinvestment value standard is the value to a particular investor considering that investor's cost of capital, perception of risk and other unique characteristics. Because of the particular attributes of ownership that may have unique appeal to any specific investor, the investment value of a minority interest in a certain enterprise may be equal to, greater than, or less than fair market value and also equal to, greater than, or less than a pro rata portion of the total enterprise value.
Intrinsic Value
Intrinsic value (sometimes calledfundamental value) is the value inherent in the characteristics of the investment itself. It is rarely used as a standard of value in and of itself. More commonly, the term is referred to, and some of the notions it implies used, in the context of one of the other three standards of value.
Fair Value
Thefair value standard suffers from lack of consistent definition from one context to another. It most often crops up as the statutory standard of value applicable to appraisals under dissenting-stockholders' rights or rights to dissolution. Such valuations by their nature are valuations of minority interests. The need to interpret the meaning of this standard of value from a study of the legal precedents in minority stockholder actions in each of the 50 states and Canada poses a continuing challenge to the appraisal profession. Certain precedents—including, for example, those pursuant to California Corporations Code Section 2000—have suggested that fair value be interpreted to mean fair market value without a minority interest discount (a proportionate share of enterprise value). However, research of the specifically applicable legal precedents is very important in each context to which the fair value standard is determined to apply.
Even when a proportionate share of enterprise value is an indicated interpretation of "fair value," precedents as to which factors to consider and the relative weights to accord to each vary considerably. Generally, but not always, unless liquidation is in prospect, emphasis will be on factors that bear on the enterprise's going-concern value rather than on its liquidation value.
K-8
Exhibit L
Marketability Discount Studies and Evidence
Discount for Lack of Marketability1
- 1
- Much of the following information was excerpted from Shannon P. Pratt, Robert F. Reilly, Robert P. Schweihs "Discount for Lack of Marketability,"Valuing Small Businesses & Professional Practices, Third Edition, McGraw-Hill
An adjustment is warranted for lack of marketability to reflect the lack of a recognized market for closely held business interests. Investors prefer investments that have access to a liquid secondary market and may be readily sold. Interests without such marketability characteristics would normally sell at a discount from prices of comparable publicly traded interests. It is important to recognize that there aredegrees of marketability. These degrees of marketability depend on the circumstances in each case.
In selecting a discount for lack of marketability, we considered several subjective factors, some of which include:
- •
- Stocks with no or lowdividends suffer more from lack of marketability than stocks with high dividends.
- •
- Generally, the most powerful factor that could reduce or eliminate a discount for lack of marketability would be the existence of a"put" right.
- •
- The existence of a reasonable number ofpotential buyers or even one strong potential buyer (often demonstrated by past activity in the company's stock) could dampen the discount for lack of marketability. For example, if an ESOP regularly purchases shares, the possibility of sometime selling shares to the ESOP may cause the discount to be less than if the ESOP did not exist.
- •
- The morerestrictions attached to the interests, the higher the discount.
Marketability Studies
There are two general types of empirical studies designed to quantify the valuation adjustments associated with the lack of marketability of minority ownership interests in closely held businesses:
- 1.
- Discounts on the sale of restricted shares of publicly traded companies, and
- 2.
- Discounts on the sale of closely held company shares—compared to prices of subsequent initial public offerings of the same company's shares.
Marketability Discounts Extracted from Prices of Restricted Stocks
One body of empirical specifically isolates the pricing implications of marketability from all other valuation-related factors: the body of data on transactions in letter stocks. Aletter stock is identical in all respects buy one to the freely traded stock of a public company. It is restricted from trading on the open stock market for a certain period of time. The duration of the restrictions varies from one situation to another. Since marketability is the only difference between the letter stock and its freely traded counterpart, the analyst may quantify differences in the price at which letter stock transactions take place compared with open market transactions in the same stock on the same date. This difference will provide some evidence of the price spread between (1) a readily marketable security and (2) one that is otherwise identical but subject to certain restrictions on its marketability.
SEC Institutional Investor Study
In a major SEC study of institutional investor actions, one topic was the amount of discount at which transactions in restricted stock (or letter stock) occurred compared to the prices of identical but unrestricted stock on the open market.2 The letter stock transactions were segregated into the markets in which their unrestricted counterparts traded. The four markets used in the study were the New York Stock Exchange, American Stock Exchange, over-the-counter (OTC) reporting companies, and
L-1
over-the-counter non-reporting companies. Because most small businesses are much smaller than the typical well-known public companies, the smaller non-reporting public companies may have characteristics that are more comparable to the subject small business. However, since these non-reporting public need not report to the SEC, one may have difficulty in obtaining information about them.
- 2
- "Discounts Involved in Purchases of Common Stock," in U.S. 92nd Congress,1st Session, House,Institutional Investor Study Report of the Securities and Exchange Commission.
Compared to their free-trading counterparts, the price discounts on the letter stocks were the least for NYSE companies and increased, in order, for AMEX-listed stocks, OTC reporting companies, and OTC non-reporting companies. For OTC non-reporting companies, the largest number of observations fell in the 30 to 40 percent price discount range, with the average being 32.6 percent. Slightly over 56 percent of the OTC non-reporting companies had price discounts greater than 30 percent on the sale of their restricted stock, compared with the stock market price of their free-trading stock. Slightly over 30 percent of the OTC reporting companies were discounted over 30 percent, and over 52 percent had price discounts over 20 percent.
Considering all transactions across all four exchanges, the overall average price discount was 25.8 percent and the median price discount was about the same.
Gelman Study
In 1972, Milton Gelman published the results of his study of prices paid for restricted securities by four closed-end investment companies specializing in restricted securities investments.3 From 89 transactions between 1968 and 1970, Gelman found that (1) both the arithmetic average and median price discounts were 33 percent and that (2) almost 60 percent of the purchases were at price discounts of 30 percent and higher. The distribution of price discounts found in the Gelman study is presented on the following page.
- 3
- Milton Gelman, "An Economist-Financial Analyst's Approach to Valuing Stock of a Closely Held Company,"Journal of Taxation, June 1972
| Size of Discount | Number of Common Stocks | Percent of Total | |||
|---|---|---|---|---|---|
| Less than 15.0% | 5 | 6 | |||
| 15.0%-19.9% | 9 | 10 | |||
| 20.0%-24.9% | 13 | 15 | |||
| 25.0%-29.9% | 9 | 10 | |||
| 30.0%-34.9% | 12 | 13 | |||
| 35.0%-39.9% | 9 | 10 | |||
| 40.0% and Over | 32 | 36 | |||
| Total | 89 | 100 | |||
Trout Study
In a study of letter stocks purchased by mutual funds from 1968 to 1972, Robert Trout attempted to construct a financial model that would provide an estimate of the price discount appropriate for a private company's stock.4 His multiple regression model involved 60 purchases and found an average price discount of 33.45 percent for restricted stock from freely traded stock. As the SEC study previously showed, Trout also found that companies with stock listed on national exchanges had lower discounts on their restricted stock transactions than did companies with stock traded over-the-counter.
L-2
- 4
- Robert R. Trout, "Estimation of the Discount Associated with the Transfer of Restricted Securities,"Taxes, June 1977.
Moroney Study
In an article published in the March 1973 issue ofTaxes, Robert E. Moroney presented the results of a study of the prices paid for restricted securities by 10 registered investment companies. The study reflected 146 purchases. The average price discount for the 146 transactions was 35.6 percent and the median discount was 33.0 percent.
Maher Study
Another well-documented study on lack of marketability discounts for closely held business ownership interests was performed by J. Michael Maher and published in the September 1976 issue ofTaxes. Maher's analytical method was similar to Moroney's in that it compared prices paid for restricted stocks with the market prices of their unrestricted counterparts. Maher found that mutual funds were not purchasing restricted securities during 1974 and 1975, which were very depressed years for the stock market. Therefore, the data actually used covered the five-year period from 1969 through 1973. The study showed, "The mean discount for lack of marketability for the years 1969-73 amounted to 35.43 percent." Maher further eliminated the top and bottom 10 percent of purchases in an effort to remove especially high and low risk situations. The result was almost identical with the outliers removed, with the average price discount of 34.73 percent.
Standard Research Consultants Study
In 1983, Standard Research Consultants analyzed recent private placement of common stock to test the current applicability of the SEC study.5 Standard Research Consultants studied 28 private placements of restricted common stock from October 1978 through June 1982. Price discounts ranged from 7 percent to 91 percent, with a median of 45 percent.
- 5
- William F. Pittock and Charles H. Stryker, "Revenue Ruling 77-287 Revisited,"SRC Quarterly Reports, Spring 1983
Willamette Management Associates Study
Willamette Management Associates analyzed private placements of restricted stocks for the period January 1, 1981 through May 31, 1984. The early part of this study overlapped the last part of the SRC study, buy few transactions took place during the period of overlap. Most of the transactions in the Willamette Management Associates study occurred in 1983.
Willamette Management Associates identified 33 transactions during that period (1) that could reasonably be classified as arm's length and (2) for which the price of the restricted shares could be compared directly with the price of trades in identical buy unrestricted shares of the same company at the same time. The median price discount for the 33 restricted stock transactions compared to the prices of their freely tradable counterparts was 31.2 percent.
The slightly lower percentage price discounts for private placements during this time may be attributable to the somewhat depressed pricing in the public stock market. This, in turn, reflected the recessionary economic conditions prevalent during most of the period of the study. This study supports the long-term average price discount of 35 percent for transactions in restricted stock compared with the prices of their freely tradable counterparts.
L-3
Silber Study
In a 1991 article in the Financial Analysts Journal, William L. Silber presented the results of analysis of 69 private placements of common stock of publicly traded companies between 1981 and 1988.6 He found that the average price discount was 33.75 percent, very consistent with earlier studies.
- 6
- William L. Silber, "Discounts on Restricted Stock: The Impact of Illiquidity on Stock Prices,"Financial Analysts Journal, July-August 1991.
Silber also found that the size of the price discount tended to be higher for private placements that were larger as a percentage of the shares outstanding.
FMV Opinions, Inc. Study
An article in the January/February 1994 issue ofEstate Planning referenced a study by FMV Opinions, Inc., that "examined over 100 restricted stock transactions from 1979 through April 1992."7 The FMV study found a mean price discount of only 23 percent.
- 7
- Lance S. Hall and Timothy C. Polacek, "Strategies for Obtaining the Largest Valuation Discounts,"Estate Planning, January/February 1994.
Management Planning, Inc. Study
Management Planning performed a study titled "Analysis of Restricted Stocks of Public Companies: 1980-1995," which covered a total of 49 transactions after eliminations for various factors.8 The elimination factors included the following:
- 8
- See Chapter 12 in Z. Christopher Mercer,Quantifying Marketability Discounts (Memphis: Peabody Publishing, 1997).
- 1.
- Any company that suffered a loss in the fiscal year preceding the private transaction.
- 2.
- Any company defined as a "start-up" company (defined as having revenues of less than $3 million).
- 3.
- Any transactions that were known to have registration rights.
There was clear size effect, with smaller companies tending to have larger discounts, as shown in the following table.
Analysis of Restricted Stock Discounts by Revenue Size
| | | | | Range of Discounts | |||||||
|---|---|---|---|---|---|---|---|---|---|---|---|
| Revenues | % of Sample | Average Revenues ($ millions) | Average Discounts | ||||||||
| Low | High | ||||||||||
| Under $10 million | 28.6 | % | 6.6 | 32.9 | % | 2.8 | % | 57.6 | % | ||
| $10-$30 million | 22.4 | % | 22.5 | 30.8 | % | 15.3 | % | 49.8 | % | ||
| $30-$50 million | 20.4 | % | 35.5 | 25.2 | % | 5.2 | % | 46.3 | % | ||
| $50-$100 million | 16.3 | % | 63.5 | 19.4 | % | 11.6 | % | 29.3 | % | ||
| Over $100 million (adjusted)a. | 8.2 | % | 224.9 | 14.9 | % | 0.0 | % | 24.1 | % | ||
Overall Sample Averages | 95.9 | % | 47.5 | 27.7 | % | 0.0 | % | 57.6 | % | ||
Note:
- a.
- Excludes Sudbury Holdings, Inc. whose private placement consisted of 125% of the pre-transaction shares outstanding. Also excludes Starrett Housing Corp. which is one of the five most thinly traded companies in the sample.
L-4
Summary of Empirical Studies on Restricted Stock Transactions
The ten empirical studies of restricted stock transactions reported above cover several hundred transactions spanning the late 1960s through 1995. Considering the number of independent researchers and the very long time span encompassing a wide variety of market conditions, the results are remarkably consistent, as set forth in the table below.
| Study | Years Covered in Study | Average Discount(%) | |||
|---|---|---|---|---|---|
| SEC Overall Average | 1966-1969 | 25.8 | % | ||
| SEC Non-reporting OTC companies | 1966-1969 | 32.6 | % | ||
| Gelman | 1968-1970 | 33.0 | % | ||
| Trout | 1968-1972 | 33.5 | % | ||
| Moroney | (a) | 35.6 | % | ||
| Maher | 1969-1973 | 35.4 | % | ||
| Standard Research Consultants | 1978-1982 | 45.0 | %(b) | ||
| Willamette Management Associates | 1981-1984 | 31.2 | %(b) | ||
| Silber | 1981-1988 | 33.8 | % | ||
| FMV Opinions, Inc. | 1979-April 1992 | 23.0 | % | ||
| Management Planning, Inc. | 1980-1995 | 27.7 | % | ||
Average | 32.4 | % |
Notes:
- (a)
- Although the years covered in this study are likely to be 1969-1972, no specific years were given in the published account.
- (b)
- Median discount
Studies of Private Transactions Before Initial Public Offerings
Before the 1980s, virtually all the empirical research directed at quantifying the value impact of marketability (or the discount for lack of marketability) focused on comparisons between the prices (1) of freely tradable shares of stock and (2) of restricted buy otherwise identical shares of stock. Observers agreed that price discounts for lack of marketability for ownership interests of closely held companies were greater than those for restricted shares of publicly held companies. This is because the closely held ownership interests had no established market in which they could eventually sell following the removal of certain trading restrictions. However, data for quantifying how much greater this price discount should be had not yet been developed and analyzed.
During the 1980s, an investment banking firm and a valuation firm independently undertook development of data with which to address this question. Both firms used data from registration statements.
Emory Studies
Eight separate studies were undertaken by John D. Emory of Robert W. Baird & Company, an investment banking firm headquartered in Milwaukee, Wisconsin. The studies reviewed the securities of companies undertaking an IPO and covered various time periods from 1981 through 1997. The IPO prices of the securities were compared with the price of the last private transaction of the security. This transaction occurred as long as five months before the IPO.
After eliminating companies with no transactions within the five months before their IPO and those companies that had a history of operating losses, 310 qualifying transactions remained in the eight studies.
L-5
The mean and median price discounts for the 310 transactions were 45 and 44 percent. A summary of each study appears in the table below.
| | | Discount | |||||
|---|---|---|---|---|---|---|---|
| Number of Qualifying Transactions | | ||||||
| Date | Average | Median | |||||
| 13 | 1980 - 1981 | 60 | % | 66 | % | ||
| 21 | 1985 - 1986 | 43 | % | 43 | % | ||
| 27 | 1987 - 1989 | 45 | % | 45 | % | ||
| 23 | 1989 - 1990 | 45 | % | 40 | % | ||
| 35 | 1990 - 1992 | 42 | % | 40 | % | ||
| 54 | 1992 - 1993 | 45 | % | 44 | % | ||
| 46 | 1994 - 1995 | 45 | % | 45 | % | ||
| 91 | 1995 - 1997 | 43 | % | 42 | % | ||
| 310 | 45 | % | 44 | % | |||
Willamette Management Associates Studies
Willamette Management Associates, Inc. has conducted a series of studies on the prices of private stock transactions relative to those of subsequent public offerings of stock of the same companies. The studies covered the years 1975 through 1993.
The Willamette studies differed from the Emory studies in several respects. One important difference was that the source documents for the Willamette studies were complete SEC registration statements primarily on Form S-1 and Form S-18. By contrast, the source documents for the Emory studies were prospectuses. Although the prospectus constitutes a portion of the registration statement, it is required to disclose only transactions with affiliated parties. Form S-1 and Form S-18 registration statements require disclosure ofall private transactions in the stock within the three years before the public offering, in a section of the registration statement separate from the prospectus portion. The Willamette Management Associates studies attempted to include only transactions that were on an arm's length basis. The data analyzed included sales of stock in private placements and repurchases of treasury stock by the companies. All stock option transactions and sales of stock to corporate insiders were eliminated unless there was sufficient evidence showing the transaction occurred at fair market value.
L-6
A summary of the Willamette Management Associates studies is shown below.
| Time Period | Number of Companies Analyzed | Number of Transactions Analyzed | Average Discount | Trimmed Average Discount | Median Discount | ||||||
|---|---|---|---|---|---|---|---|---|---|---|---|
| 1975-77 | 19 | 31 | 34.0 | % | 43.4 | % | 52.5 | % | |||
| 1970s | 9 | 17 | 55.6 | % | 56.8 | % | 62.7 | % | |||
| 1980-88 | 58 | 113 | 48.0 | % | 51.9 | % | 56.5 | % | |||
| 1983 | 85 | 214 | 50.1 | % | 55.2 | % | 60.7 | % | |||
| 1984 | 20 | 33 | 43.2 | % | 52.9 | % | 73.1 | % | |||
| 1985 | 18 | 25 | 41.3 | % | 47.3 | % | 42.6 | % | |||
| 1986 | 47 | 74 | 38.5 | % | 44.7 | % | 47.4 | % | |||
| 1987 | 25 | 40 | 36.9 | % | 44.9 | % | 43.8 | % | |||
| 1988 | 13 | 19 | 41.5 | % | 42.5 | % | 51.8 | % | |||
| 1989 | 9 | 19 | 47.3 | % | 46.9 | % | 50.3 | % | |||
| 1990 | 17 | 23 | 30.5 | % | 33.0 | % | 48.5 | % | |||
| 1991 | 27 | 34 | 24.2 | % | 28.9 | % | 31.8 | % | |||
| 1992 | 36 | 75 | 41.9 | % | 47.0 | % | 51.7 | % | |||
| 1993 | 51 | 110 | 46.9 | % | 49.9 | % | 53.3 | % | |||
Average | 41.4 | % | 46.1 | % | 51.9 | % |
L-7