 2012 First Quarter Results April 24, 2012 © 2012 Total System Services, Inc. ® All rights reserved worldwide. Exhibit 99.2 |
 Forward-Looking Statements This presentation and comments made by management contain forward-looking statements including, among others, statements regarding the expected future operating results of TSYS. These statements are based on management’s current expectations and assumptions and are subject to risks, uncertainties and changes in circumstances. Forward-looking statements include all statements that are not historical facts and can be identified by the use of forward- looking terminology such as the words “believe,” “expect,” “anticipate,” “intend,” “plan,” “estimate” or similar expressions. Actual results may differ materially from those set forth in the forward-looking statements due to a variety of factors. More information about these risks, uncertainties and factors may be found in TSYS’ 2011 Annual Report on Form 10-K, Quarterly Reports on Form 10-Q and Current Reports on Form 8-K. TSYS does not assume any obligation to update any forward-looking statements as a result of new information, future developments or otherwise. 2 ©2012 Total System Services, Inc.® Proprietary. All rights reserved worldwide. |
 Use of Non-GAAP Financial Measures This slide presentation contains certain non-GAAP financial measures determined by methods other than in accordance with generally accepted accounting principles. Such non-GAAP financial measures include the following: revenues before reimbursable items; operating margin excluding reimbursable items; revenues measured on a constant currency basis; free cash flow; and EBITDA. The most comparable GAAP measures to these measures are revenues; operating margin; revenues; cash flows from operating activities; and net income, respectively. Management uses these non-GAAP financial measures to assess the performance of TSYS’ core business. TSYS believes that these non-GAAP financial measures provide meaningful additional information about TSYS to assist investors in evaluating TSYS’ operating results. These non-GAAP financial measures should not be considered as a substitute for operating results determined in accordance with GAAP and may not be comparable to other similarly titled measures of other companies. The computations of the non- GAAP financial measures used in this slide presentation are set forth in the Appendix to this slide presentation. 3 ©2012 Total System Services, Inc.® Proprietary. All rights reserved worldwide. |
 Phil Tomlinson Chairman and Chief Executive Officer |
 Jim Lipham Chief Financial Officer |
 Consolidated Selected Financial Highlights 6 (in thousands, except per share data) Total Revenues $461,162 $ 429,430 7.4% Revenues Before Reimbursable Items 395,179 362,643 9.0 Operating Income 84,831 73,028 16.2 Net Income Attributable to TSYS Common Shareholders $56,395 $48,790 15.6 Total Cardholder Transactions (in millions) 2,276.1 1,952.8 16.6 Earnings Per Share Attributable to TSYS Common Shareholders $0.30 $0.25 18.6 1 Qtr 2012 1 Qtr 2011 Percent Change st st ©2012 Total System Services, Inc.® Proprietary. All rights reserved worldwide. |
 2012 YTD Revenue Change Revenues Before Reimbursable Items 7 Internal Growth New Clients Acquisitions Lost Business, Non-recurring Items and Price Compression (3.4%) Reported Currency (0.3%) 9.0% 7.0% 10% 15% 5% 0% 4.2% 1.5% ©2012 Total System Services, Inc.® Proprietary. All rights reserved worldwide. |
 Consolidated Accounts on File Portfolio Summary (in millions) 8 Mar 2012 Mar 2011 % Change Mar 2012 Dec 2011 % Change Consumer Credit 197.2 183.4 7.5 197.2 195.0 1.1 Government Services 30.5 29.0 5.4 30.5 29.7 2.8 Retail 25.3 24.6 2.7 25.3 24.6 3.0 Total Consumer 253.0 237.0 6.8 253.0 249.3 1.5 Commercial 65.0 51.1 27.2 65.0 61.9 5.1 Other 9.4 6.3 48.4 9.4 7.9 18.7 Subtotal 327.4 294.4 11.2 327.4 319.1 2.6 Prepaid / Stored Value 88.5 62.3 42.0 88.5 85.1 3.9 Total AOF 415.9 356.7 16.6 415.9 404.2 2.9 ©2012 Total System Services, Inc.® Proprietary. All rights reserved worldwide. |
 Key Drivers 1Q 2012 Year Over Year Segment Financial Highlights • Strong organic growth • Increased volumes • Volumes – Accounts on file were 361.8 million – Total cardholder transactions were 1,893.0 million, an increase of 16.4% 9 ©2012 Total System Services, Inc.® Proprietary. All rights reserved worldwide. Revenues $240.6 million Excluding Reimbursables $204.0 million Operating Income $68.2 million Operating Margin 28.3% Excluding Reimbursables 33.4% Same Client Transactions 1,879.5 million Increase of 15.6% North America Services |
 Key Drivers 1Q 2012 Year Over Year Segment Financial Highlights • Strong organic growth • Conversion of new clients • Dedication of more internal resources, previously shared between our North America and International segments • Volumes – Accounts on file were 54.1 million – Total cardholder transactions were 383.0 million, an increase of 17.5% 10 ©2012 Total System Services, Inc.® Proprietary. All rights reserved worldwide. Revenues $100.4 million Excluding Reimbursables $96.5 million Constant currency basis $101.5 million Operating Income $4.1 million Operating Margin 4.1% Excluding Reimbursables 4.3% Same Client Transactions 352.7 million Increase of 8.4% International Services |
 Key Drivers 1Q 2012 Year Over Year Segment Financial Highlights • Acquisition of TermNet • Upward trends in transaction volumes • Strong dollar volume growth in direct acquiring • Volumes – Point-of-Sale Transactions were 1,219.7 million, an increase of 1.1% – Excluding deconverted clients, Point-of-Sale Transactions increased 11.0% 11 Revenues $125.5 million Excluding Reimbursables $98.4 million Operating Income $34.2 million Operating Margin 27.3% Excluding Reimbursables 34.8% Merchant Services ©2012 Total System Services, Inc.® Proprietary. All rights reserved worldwide. |
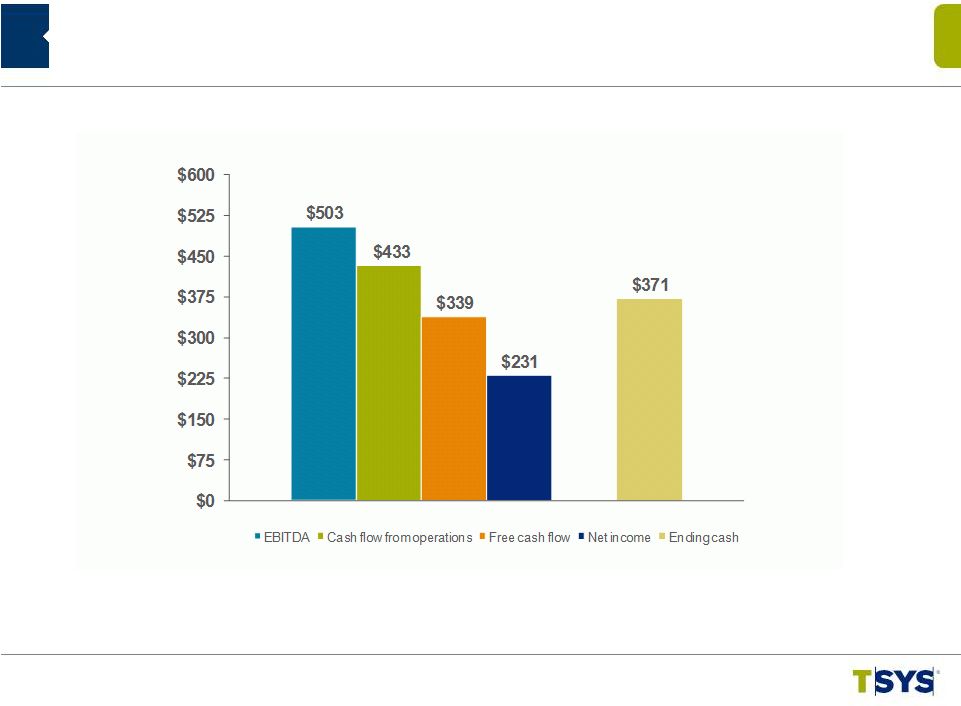 Cash Flow Strength: 2012 TTM Consolidated Financial Highlights (in millions) 12 TTM = Trailing Twelve Months ©2012 Total System Services, Inc.® Proprietary. All rights reserved worldwide. |
 Appendix |
 Appendix Non-GAAP Reconciliation – Revenues Before Reimbursable Items Total Revenues $ 461,162 $ 429,430 Reimbursable Items 65,983 66,787 Revenues Before Reimbursable Items $ 395,179 $ 362,643 (in thousands) 14 Three Months Ended 3/31/12 3/31/11 ©2012 Total System Services, Inc.® Proprietary. All rights reserved worldwide. |
 Appendix Non-GAAP Reconciliation – Segment Operating Margin Excluding Reimbursable Items North America International Merchant (in thousands) 15 ©2012 Total System Services, Inc.® Proprietary. All rights reserved worldwide. Three Months Ended 3/31/12 3/31/11 Three Months Ended 3/31/12 3/31/11 Three Months Ended 3/31/12 3/31/11 Operating Income (a) $ 68,173 $ 55,200 $ 4,113 $ 11,025 $ 34,219 $ 26,923 Total Revenues (b) 240,599 230,558 100,360 90,710 125,518 115,756 Reimbursable Items 36,549 35,968 3,869 3,291 27,162 29,237 Revenues Before Reimbursable Items(c) 204,050 194,590 96,491 87,419 98,356 86,519 Operating Margin (a)/(b) 28.33% 23.94% 4.10% 12.15% 27.26% 23.26% Operating Margin Excluding Reimbursables (a)/(c) 33.41% 28.37% 4.26% 12.61% 34.79% 31.12% |
 Three Months Ended 3/31/12 3/31/11 Percentage Change Appendix Non-GAAP Reconciliation – Constant Currency (1) Reflects current period results on a non-GAAP basis as if foreign currency rates did not change from the comparable prior year period. (2) Reflects the impact of calculated changes in foreign currency rates from the comparable period. (in thousands) 16 Consolidated: Constant Currency (1) $ 462,251 $ 429,430 7.6% Foreign Currency (2) (1,089) --- Total Revenues 461,162 429,430 7.4% International Services: Constant Currency (1) $ 101,531 $ 90,710 11.9% Foreign Currency (2) (1,171) --- Total Revenues $100,360 $90,710 10.6% ©2012 Total System Services, Inc.® Proprietary. All rights reserved worldwide. |
 Appendix Non-GAAP Reconciliation – EBITDA (in thousands) 17 Trailing Twelve Months Ended 3/31/2012 Net Income $ 230,894 Adjusted for: Deduct: Equity in Income of Equity Investments (9,212) Add: Income Taxes 106,995 Add: Nonoperating expense 5,582 Add: Depreciation and Amortization 168,970 EBITDA $ 503,229 ©2012 Total System Services, Inc.® Proprietary. All rights reserved worldwide. |
 Appendix Non-GAAP Reconciliation – Free Cash Flow Trailing Twelve Months Ended 3/31/2012 Cash Flows from Operating Activities $ 432,745 Less: Purchase of Property and Equipment (25,626) Additions to Licensed Computer Software from Vendors (20,815) Additions to Internally Developed Computer Software (17,839) Additions to Contract Acquisition Costs (29,520) Free Cash Flow $ 338,945 (in thousands) 18 ©2012 Total System Services, Inc.® Proprietary. All rights reserved worldwide. |