 2013 First Quarter Results April 23, 2013 © 2013 Total System Services, Inc.® All rights reserved worldwide. Exhibit 99.2 |
 Forward-Looking Statements This presentation and comments made by management contain forward-looking statements including, among others, statements regarding the expected future operating results of TSYS. These statements are based on management’s current expectations and assumptions and are subject to risks, uncertainties and changes in circumstances. Forward-looking statements include all statements that are not historical facts and can be identified by the use of forward- looking terminology such as the words “believe,” “expect,” “anticipate,” “intend,” “plan,” “estimate” or similar expressions. Actual results may differ materially from those set forth in the forward-looking statements due to a variety of factors. More information about these risks, uncertainties and factors may be found in TSYS’ 2012 Annual Report on Form 10-K, Quarterly Reports on Form 10-Q and Current Reports on Form 8-K. TSYS does not assume any obligation to update any forward-looking statements as a result of new information, future developments or otherwise. 2 ©2013 Total System Services, Inc.® Proprietary. All rights reserved worldwide. |
 Use of Non-GAAP Financial Measures This slide presentation contains certain non-GAAP financial measures determined by methods other than in accordance with generally accepted accounting principles. Such non-GAAP financial measures include the following: revenues before reimbursable items; operating margin excluding reimbursable items; revenues measured on a constant currency basis; free cash flow; and EBITDA. The most comparable GAAP measures to these measures are revenues; operating margin; revenues; cash flows from operating activities; and net income, respectively. Management uses these non-GAAP financial measures to assess the performance of TSYS’ core business. TSYS believes that these non-GAAP financial measures provide meaningful additional information about TSYS to assist investors in evaluating TSYS’ operating results. These non-GAAP financial measures should not be considered as a substitute for operating results determined in accordance with GAAP and may not be comparable to other similarly titled measures of other companies. The computations of the non- GAAP financial measures used in this slide presentation are set forth in the Appendix to this slide presentation. 3 ©2013 Total System Services, Inc.® Proprietary. All rights reserved worldwide. |
 Phil Tomlinson Chairman and Chief Executive Officer ©2013 Total System Services, Inc.® Proprietary. All rights reserved worldwide. |
 Jim Lipham Chief Financial Officer ©2013 Total System Services, Inc.® Proprietary. All rights reserved worldwide. |
 Consolidated Selected Financial Highlights 6 ©2013 Total System Services, Inc.® Proprietary. All rights reserved worldwide. Total Revenues $ 464,996 $ 461,162 0.8% Revenues Before Reimbursable Items 404,237 395,180 2.3 Operating Income 74,903 84,831 (11.7) Net Income Attributable to TSYS Common Shareholders 57,028 56,395 1.1 Total Cardholder Transactions (in millions) 2,447.6 2,250.2 8.8 Basic Earnings Per Share Attributable to TSYS Common Shareholders $0.31 $0.30 2.2 1st Qtr 2013 1st Qtr 2012 Percent Change (in thousands, except per share data) |
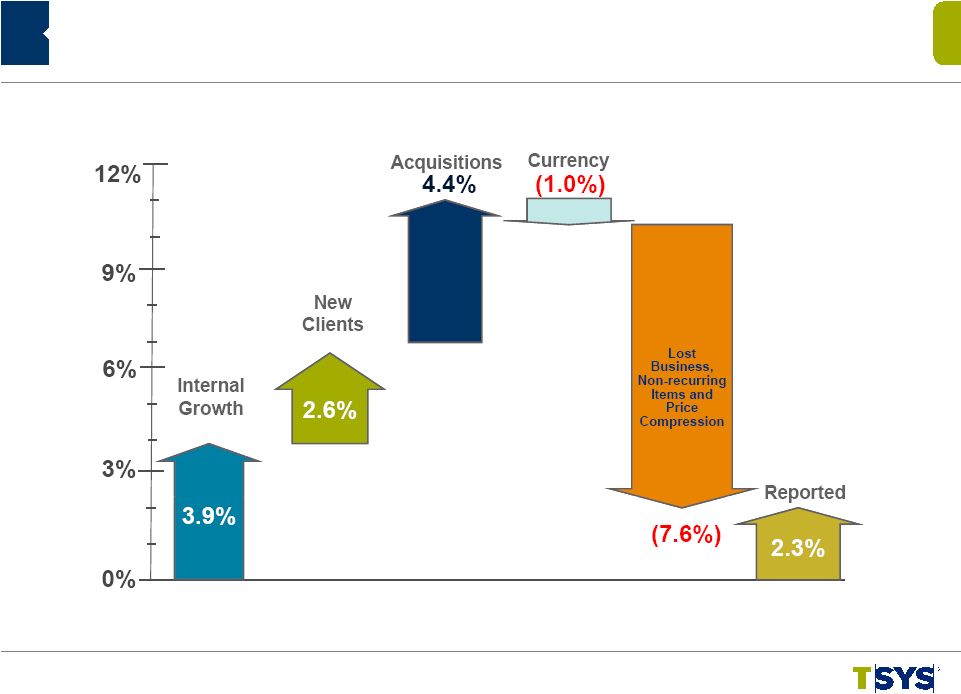 2013 YTD Revenue Change Revenues Before Reimbursable Items 7 ©2013 Total System Services, Inc.® Proprietary. All rights reserved worldwide. |
 Consumer Credit 203.8 197.2 3.3 203.8 200.5 1.6 Retail 25.2 25.3 (0.3 ) 25.2 25.0 0.7 Total Consumer 229.0 222.5 2.9 229.0 225.5 1.5 Commercial 37.9 35.5 6.6 37.9 37.1 2.1 Other 13.4 9.4 42.9 13.4 12.8 5.1 Subtotal 280.3 267.4 4.8 280.3 275.4 1.8 Prepaid / Stored Value 107.3 88.5 21.3 107.3 115.9 (7.4 ) Government Services 59.4 30.5 94.4 59.4 57.0 4.1 Commercial Card Single Use 31.6 29.5 7.3 31.6 31.1 1.5 Total AOF 478.6 415.9 15.1 478.6 479.4 (0.2 ) Consolidated Accounts on File Portfolio Summary (in millions) Mar 2013 Mar 2012 % Change Mar 2013 Dec 2012 % Change 8 ©2013 Total System Services, Inc.® Proprietary. All rights reserved worldwide. |
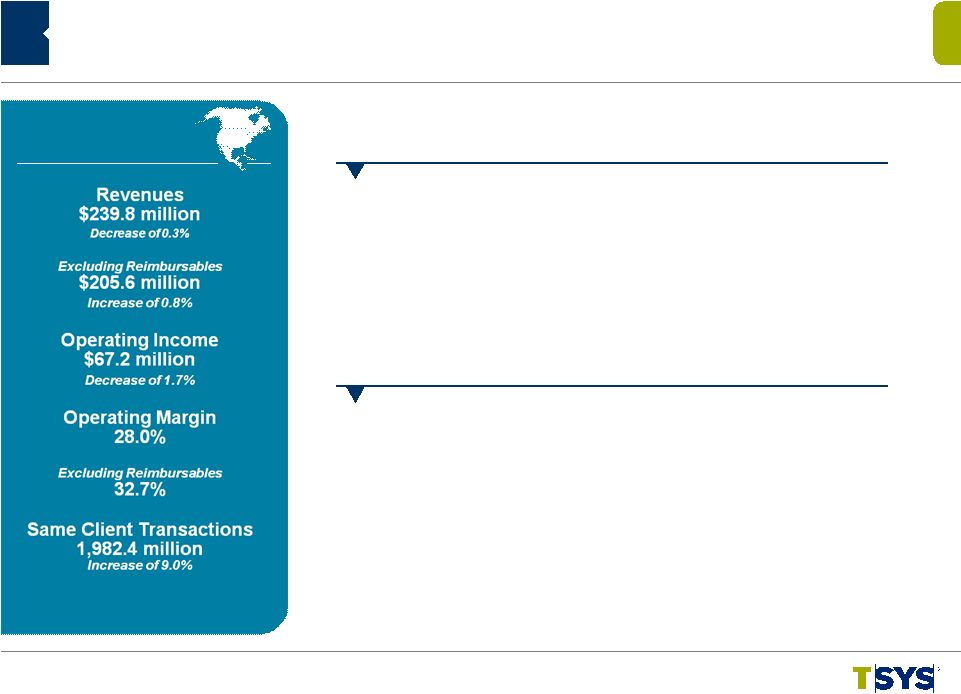 Key Drivers 1Q 2013 Year Over Year Segment Financial Highlights • Strong internal growth • Increased volumes • Pricing concessions • Lost business North America Services 9 ©2013 Total System Services, Inc.® Proprietary. All rights reserved worldwide. • Total accounts on file were 422.8 million, an increase of 16.9% • Excluding prepaid, govt. services and single use, accounts on file were 226.5 million, an increase of 5.2% • Total cardholder transactions were 2,013.4 million, an increase of 7.8% Volumes |
 1Q 2013 Year Over Year Segment Financial Highlights • Strong internal growth • Deconversion fee • Lost business 10 ©2013 Total System Services, Inc.® Proprietary. All rights reserved worldwide. Key Drivers Volumes • Accounts on file were 55.8 million, an increase of 3.2% • Total cardholder transactions were 434.2 million, an increase of 13.3% International Services |
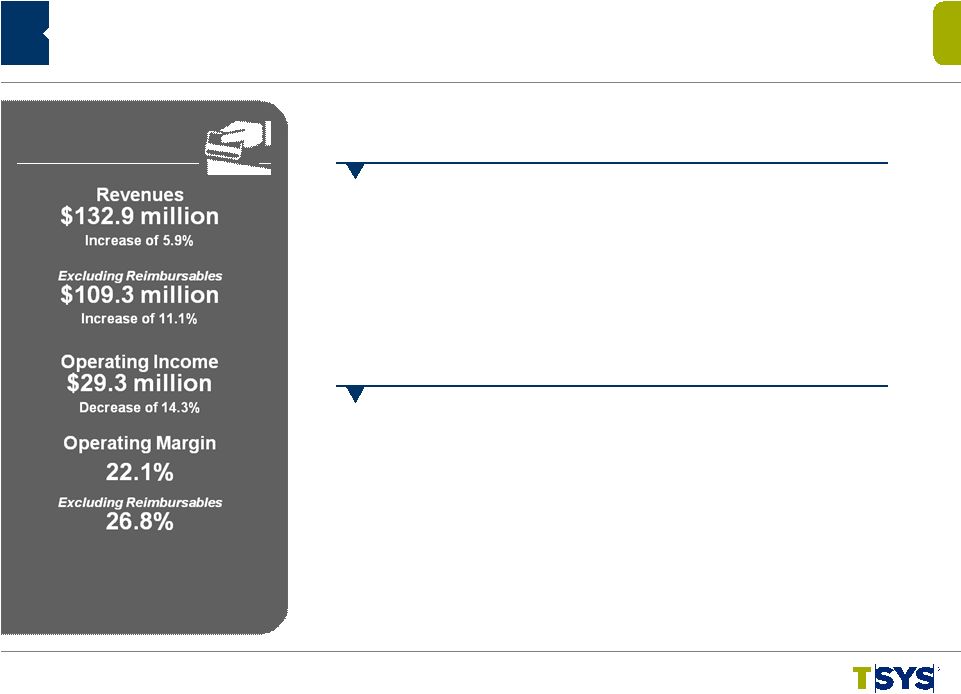 Merchant Services • Upward trends in transaction volumes excluding deconversions • Strong dollar volume growth in direct acquiring • Acquisitions of Central Payment & ProPay • Lost business 11 ©2013 Total System Services, Inc.® Proprietary. All rights reserved worldwide. Key Drivers Volumes • Point-of-Sale transactions were 1,099.1 million, a decrease of 9.9% • Excluding deconverted clients, Point-of-Sale transactions increased 6.6% • Dollar sales volume was $10.1 billion, an increase of 15.5% 1Q 2013 Year Over Year Segment Financial Highlights |
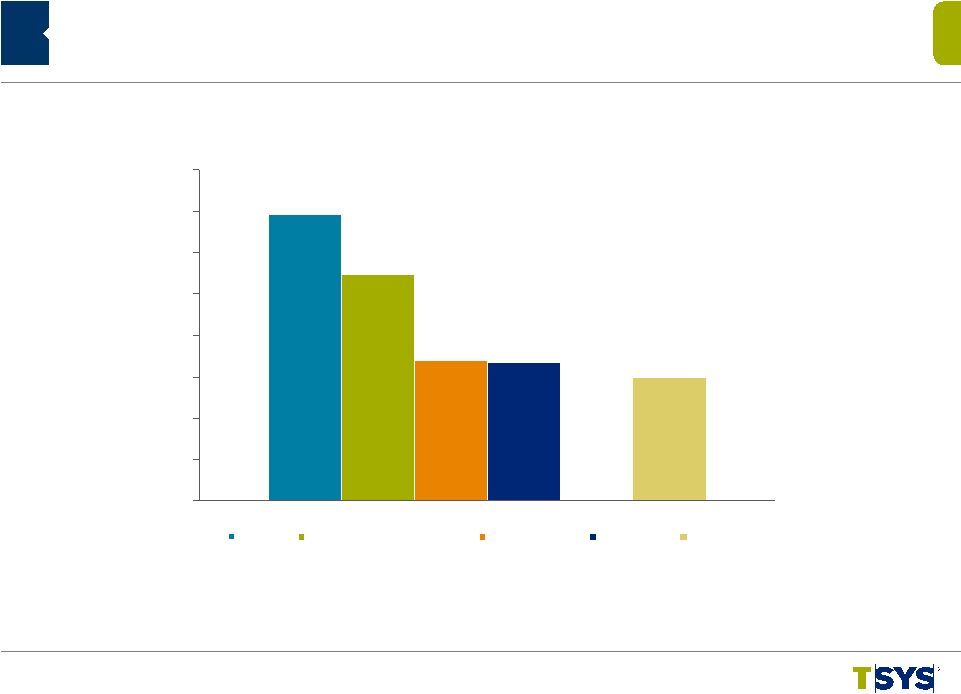 Cash Flow Strength: 2013 TTM Consolidated Financial Highlights $520 $410 $254 $251 $223 $0 $75 $150 $225 $300 $375 $450 $525 $600 EBITDA Cash flow from operations Free cash flow Net income Ending cash (in millions) 12 ©2013 Total System Services, Inc.® Proprietary. All rights reserved worldwide. TTM = Trailing Twelve Months |
 Appendix ©2013 Total System Services, Inc.® Proprietary. All rights reserved worldwide. |
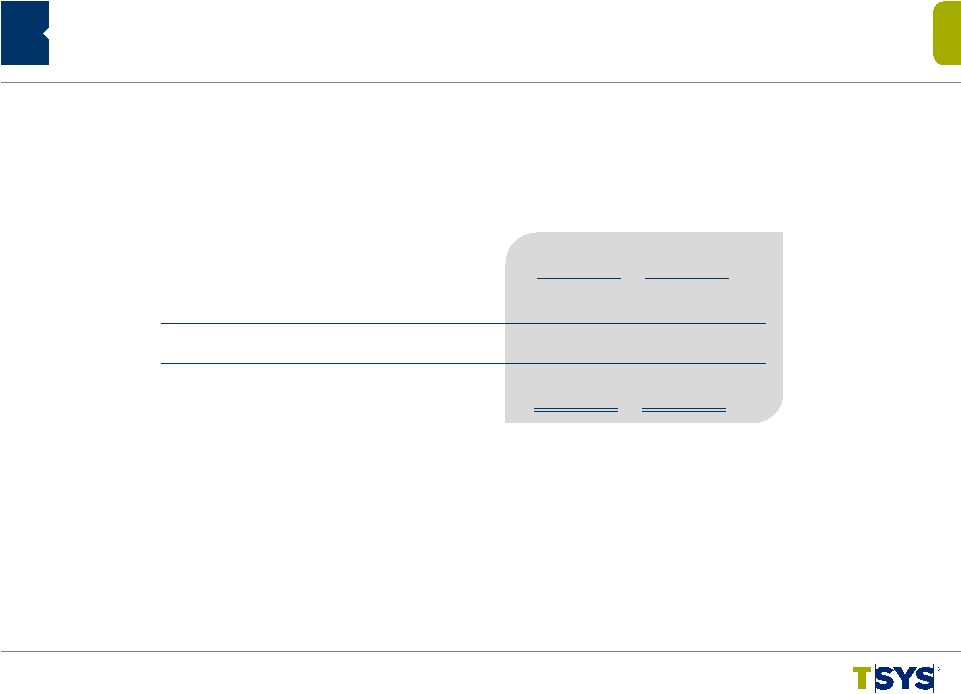 Appendix Non-GAAP Reconciliation – Revenues Before Reimbursable Items Three Months Ended 3/31/13 3/31/12 Total Revenues $ 464,996 $ 461,162 Reimbursable Items 60,759 65,982 Revenues Before Reimbursable Items $ 404,237 $ 395,180 (in thousands) 14 ©2013 Total System Services, Inc.® Proprietary. All rights reserved worldwide. |
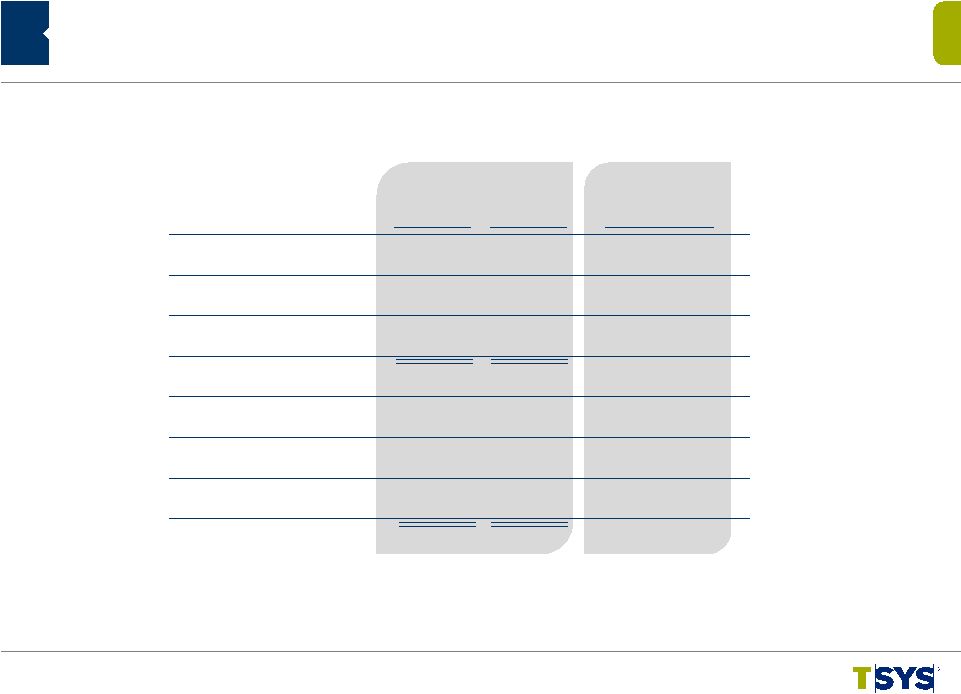
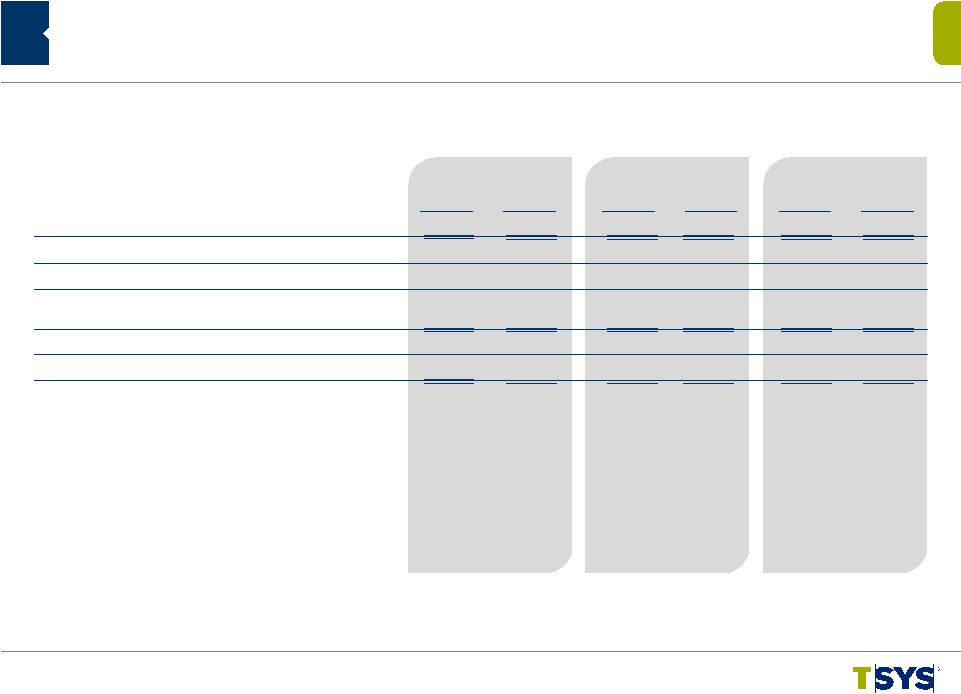 Three Months Ended 3/31/13 3/31/12 Three Months Ended 3/31/13 3/31/12 Three Months Ended 3/31/13 3/31/12 Operating Income (a) $ 67,202 $ 68,347 $ 6,626 $ 4,113 $ 29,327 $ 34,219 Total Revenues (b) 239,789 240,599 97,096 100,360 132,901 125,518 Reimbursable Items 34,193 36,549 4,503 3,869 23,600 27,162 Revenues Before Reimbursable Items(c) 205,596 204,050 92,593 96,491 109,301 98,356 Operating Margin (a)/(b) 28.03% 28.41% 6.82% 4.10% 22.07% 27.26% Operating Margin Excluding Reimbursables (a)/(c) 32.69% 33.50% 7.16% 4.26% 26.83% 34.79% Appendix Non-GAAP Reconciliation – Segment Operating Margin Excluding Reimbursable Items North America International Merchant (in thousands) 15 ©2013 Total System Services, Inc.® Proprietary. All rights reserved worldwide. |
 Three Months Ended 3/31/13 3/31/12 Percentage Change Appendix Non-GAAP Reconciliation – Constant Currency (1) Reflects current period results on a non-GAAP basis as if foreign currency rates did not change from the comparable prior year period. (2) Reflects the impact of calculated changes in foreign currency rates from the comparable period. (in thousands) Consolidated: Constant Currency (1) $ 469,016 $ 461,162 1.7% Foreign Currency (2) (4,020) --- Total Revenues $464,996 $461,162 0.8% International Services: Constant Currency (1) $ 101,185 $100,360 0.8% Foreign Currency (2) (4,089) --- Total Revenues $97,096 $100,360 (3.3%) 16 ©2013 Total System Services, Inc.® Proprietary. All rights reserved worldwide. |
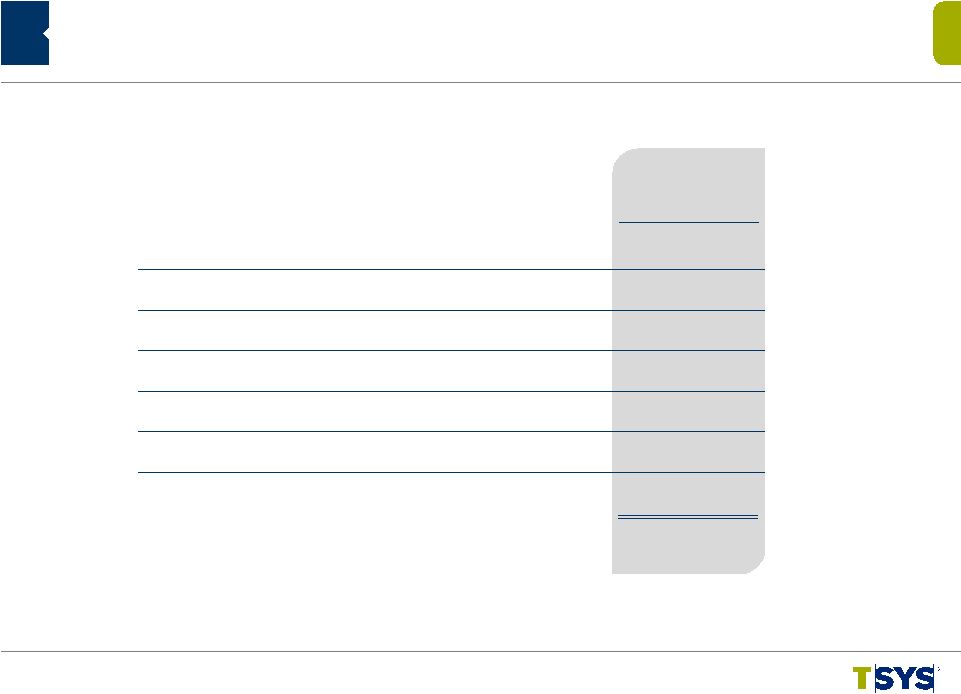 Appendix Non-GAAP Reconciliation – EBITDA Trailing Twelve Months Ended 3/31/2013 Net Income $ 251,428 Adjusted for: Deduct: Equity in Income of Equity Investments (11,214) Add: Income Taxes 103,392 Add: Nonoperating expense 4,118 Add: Depreciation and Amortization 172,235 EBITDA $ 519,959 (in thousands) 17 ©2013 Total System Services, Inc.® Proprietary. All rights reserved worldwide. |
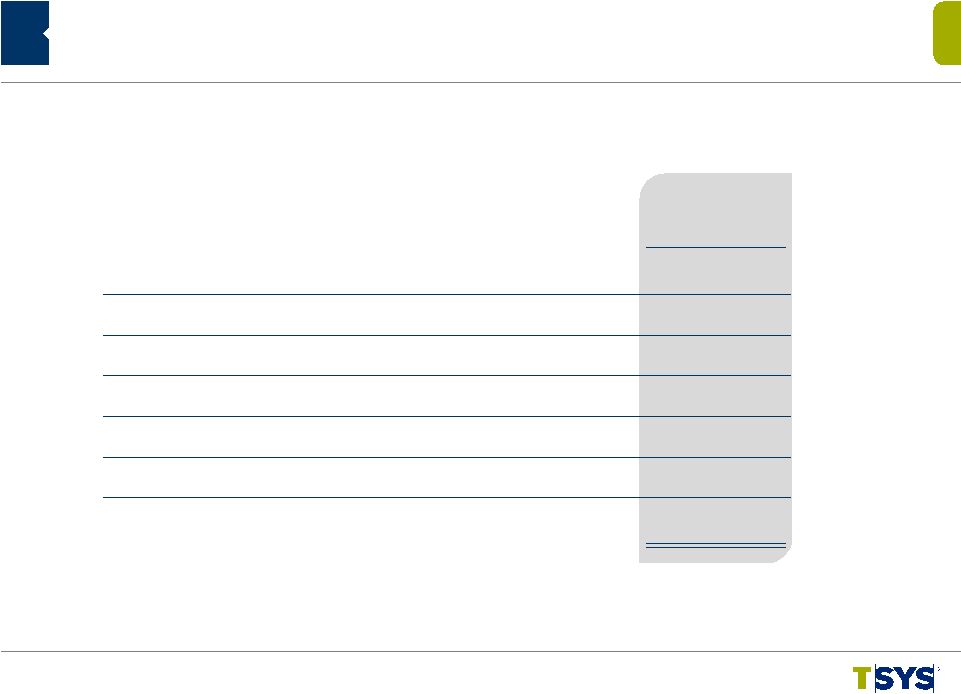 Appendix Non-GAAP Reconciliation – Free Cash Flow Trailing Twelve Months Ended 3/31/2013 Cash Flows from Operating Activities $ 410,277 Less: Purchase of Property and Equipment (32,893) Additions to Licensed Computer Software from Vendors (60,312) Additions to Internally Developed Computer Software (20,146) Additions to Contract Acquisition Costs (42,951) Free Cash Flow $ 253,975 (in thousands) 18 ©2013 Total System Services, Inc.® Proprietary. All rights reserved worldwide. |