 2014 First Quarter Results April 22, 2014 ©2014 Total System Services, Inc.® Proprietary. All rights reserved worldwide. Exhibit 99.2 |
 Forward-Looking Statements 2 This presentation and comments made by management contain forward- looking statements including, among others, statements regarding the expected future operating results of TSYS. These statements are based on management’s current expectations and assumptions and are subject to risks, uncertainties and changes in circumstances. Forward-looking statements include all statements that are not historical facts and can be identified by the use of forward-looking terminology such as the words “believe,” “expect,” “anticipate,” “intend,” “plan,” “potential”, “estimate” or similar expressions. Actual results may differ materially from those set forth in the forward-looking statements due to a variety of factors. More information about these risks, uncertainties and factors may be found in TSYS’ filings with the Securities and Exchange Commission, including its 2013 Annual Report on Form 10-K. TSYS does not assume any obligation to update any forward-looking statements as a result of new information, future developments or otherwise. ©2014 Total System Services, Inc.® Proprietary. All rights reserved worldwide. |
 Use of Non-GAAP Financial Measures 3 ©2014 Total System Services, Inc.® Proprietary. All rights reserved worldwide. This slide presentation contains certain non-GAAP financial measures determined by methods other than in accordance with generally accepted accounting principles. Such non-GAAP financial measures include the following: revenues before reimbursable items; operating margin excluding reimbursable items; revenues measured on a constant currency basis; free cash flow; EBITDA, adjusted EBITDA , adjusted cash earnings per share, adjusted segment operating income and adjusted segment operating margin. The most comparable GAAP measures to these measures are revenues; operating margin; revenues; cash flows from operating activities; net income; net income; earnings per share, operating income and operating margin, respectively. Management uses these non-GAAP financial measures to assess the performance of TSYS’ core business. TSYS believes that these non-GAAP financial measures provide meaningful additional information about TSYS to assist investors in evaluating TSYS’ operating results. These non-GAAP financial measures should not be considered as a substitute for operating results determined in accordance with GAAP and may not be comparable to other similarly titled measures of other companies. The computations of the non-GAAP financial measures used in this slide presentation are set forth in the Appendix to this slide presentation. |
 Phil Tomlinson Chairman and Chief Executive Officer ©2014 Total System Services, Inc.® Proprietary. All rights reserved worldwide. |
 Troy Woods President & Chief Operating Officer ©2014 Total System Services, Inc.® Proprietary. All rights reserved worldwide. |
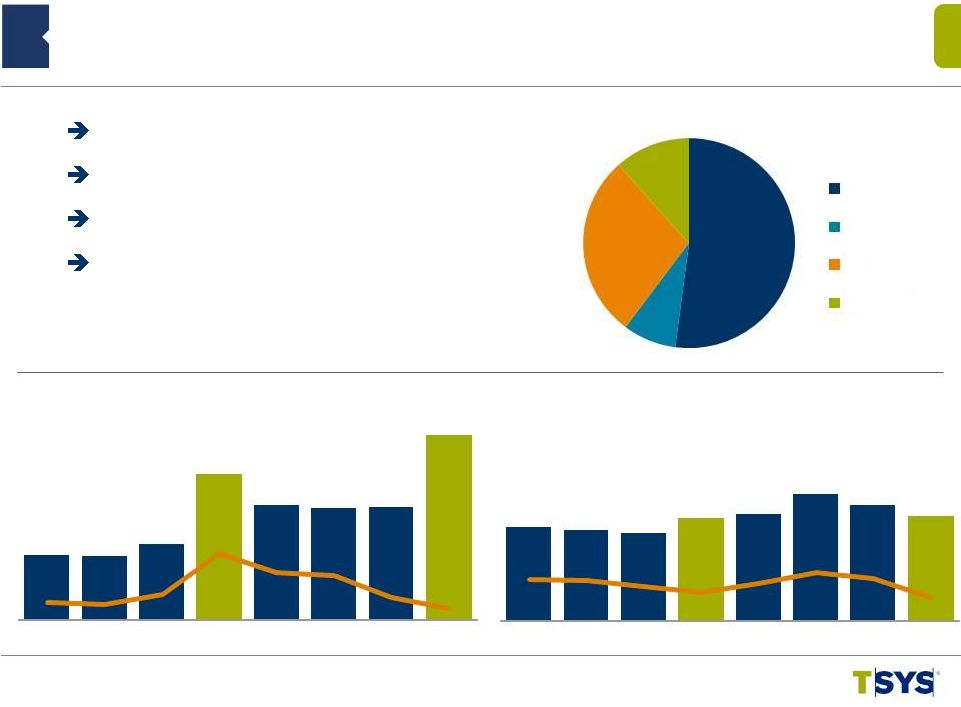
 1Q 2014 North America Segment Highlights 6 ©2014 Total System Services, Inc.® Proprietary. All rights reserved worldwide. ($ in millions) (*) Revenues Before Reimbursable Items ($ in millions) 3.4% (1.3%) 1.9% 0.8% 4.4% 4.5% 6.8% Adjusted Segment Operating Income Operating Margin* 73% 23% 4% (1) Includes Credit, Debit, Retail, Prepaid & Loyalty (2) Includes Healthcare 9.1% Improving Revenue Growth 6th Straight Positive Growth Quarter Adjusted Segment Operating Income Up 8.5% Adjusted Operating Margin: 33.2% Chase License Payments Expired Increased Incentive Pay Market Salary Adjustments $205.6 $203.5 $213.6 $205.6 $214.5 $217.3 $223.3 $224.4 2Q12 3Q12 4Q12 1Q13 2Q13 3Q13 4Q13 1Q14 Segment Revenue* YOY Growth % $73.4 $71.5 $81.2 $68.7 $81.3 $84.4 $87.1 $74.6 35.7% 35.2% 38.0% 33.4% 37.9% 38.9% 39.0% 33.2% 2Q12 3Q12 4Q12 1Q13 2Q13 3Q13 4Q13 1Q14 Consumer (1) Commercial (2) Other Segment Revenue by Line of Business* |
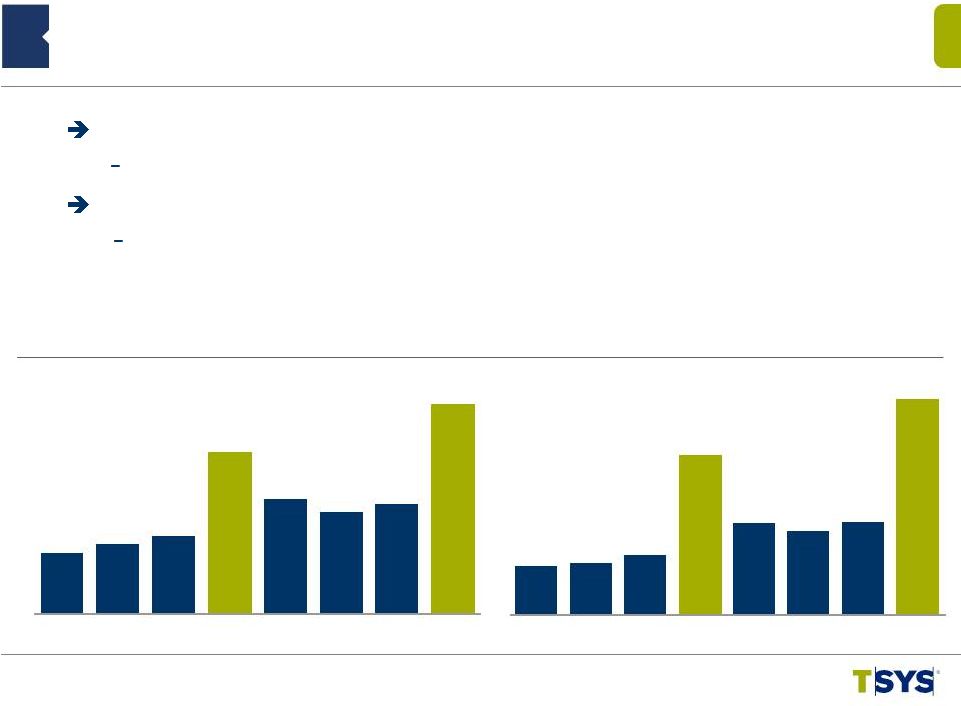
 1Q 2014 North America Segment Highlights 7 ©2014 Total System Services, Inc.® Proprietary. All rights reserved worldwide. * (in millions) (in millions) 7.2% 3.4% 5.5% 5.2% 6.3% 16.2% 16.5% 18.0% 20.9% 20.9% 16.9% 11.2% 11.6% 13.4% 12.1% 9.5% 12.7% 7.8% 11.5% 17.6% 13.4% 15.6% 17.2% 17.1% Thirteenth Straight Quarter of Account On File YOY Growth Large Account Conversion Pipeline Sixteenth Straight Quarter of Transaction YOY Growth Same Client Transactions Up 12.9%: Eighteenth Straight Quarter of YOY Growth 387.3 413.4 424.8 422.8 430.7 461.4 481.9 495.5 2Q12 3Q12 4Q12 1Q13 2Q13 3Q13 4Q13 1Q14 Accounts on File YOY Growth% 2,003.8 2,036.6 2,194.7 2,013.4 2,235.0 2,395.8 2,488.2 2,327.6 2Q12 3Q12 4Q12 1Q13 2Q13 3Q13 4Q13 1Q14 Transaction Volume YOY Growth% (*) Growth Excluding Prepaid, Government Services and Single Use Accounts |
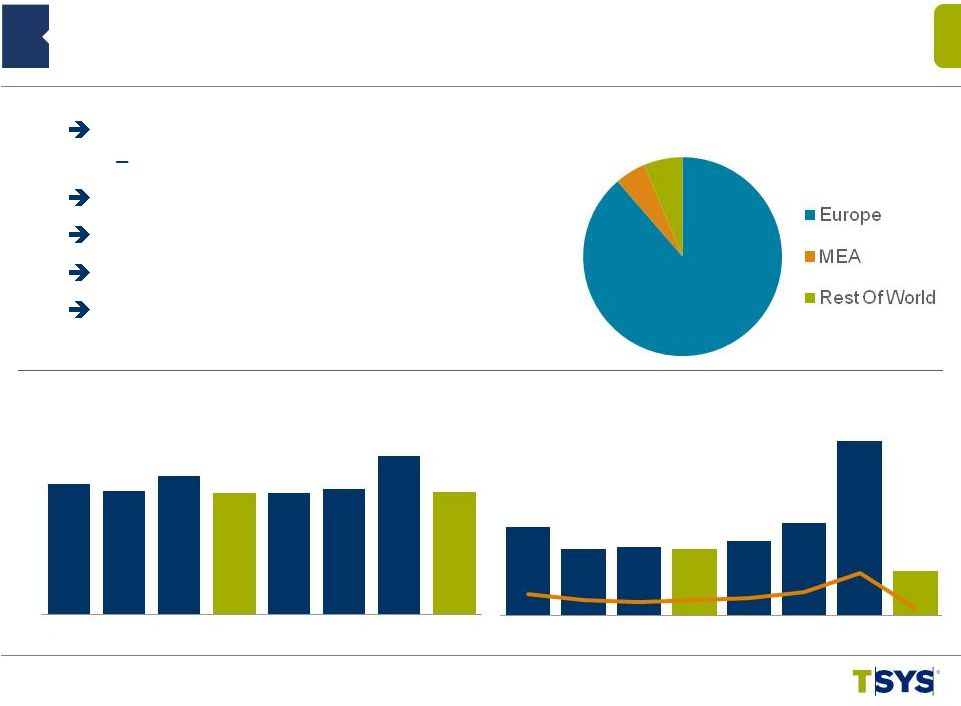 5% 6% 1Q 2014 International Segment Highlights 8 ©2014 Total System Services, Inc.® Proprietary. All rights reserved worldwide. ($ in millions) Reported Constant Currency (*) Revenues Before Reimbursable Items ($ in millions) Adjusted Segment Operating Income Operating Margin* 5.6% 1.4% 1.1% (2.6%) (4.0%) 0.7% 9.6% 4.4% 0.1% (0.9%) 3.1% 9.0% 8.6% 89% 0.5% (4.6%) Revenue $76.8M* – Up 0.5% Down 4.6% on Constant Currency Currency Tailwinds Continued Margin Improvement Focus Reemphasis on Accelerating Growth Japan Market Divestitures (NOTE: International numbers restated for Japan discontinued operations (1.0%) $79.8 $77.3 $83.1 $76.4 $76.6 $77.9 $90.6 $76.8 2Q12 3Q12 4Q12 1Q13 2Q13 3Q13 4Q13 1Q14 Segment Revenue* YOY Growth % $9.2 $6.8 $7.0 $6.9 $7.7 $9.5 $18.0 $4.6 11.5% 8.9% 8.4% 9.0% 10.0% 12.2% 19.9% 5.9% 2Q12 3Q12 4Q12 1Q13 2Q13 3Q13 4Q13 1Q14 Segment Revenue by Region QTD |
 1Q 2014 International Segment Highlights 9 ©2014 Total System Services, Inc.® Proprietary. All rights reserved worldwide. (in millions) (in millions) 11.6% 5.7% 4.1% 3.7% 9.9% 12.1% 8.5% 18.1% 15.9% 19.5% 14.2% 23.3% 26.7% 17.3% 8.9% 19.3% Strong AOF Growth, Despite Some Client Purging Irish Debit AOF Grew By 71.2% Double-digit Transaction Growth of 19.3% Same Client Transaction Growth of 17.3% 52.8 52.9 54.5 55.7 58.0 59.2 59.1 60.7 2Q12 3Q12 4Q12 1Q13 2Q13 3Q13 4Q13 1Q14 Accounts on File YOY Growth% 399.2 414.6 473.6 434.0 492.4 525.5 555.6 517.9 2Q12 3Q12 4Q12 1Q13 2Q13 3Q13 4Q13 1Q14 Transaction Volume YOY Growth% |
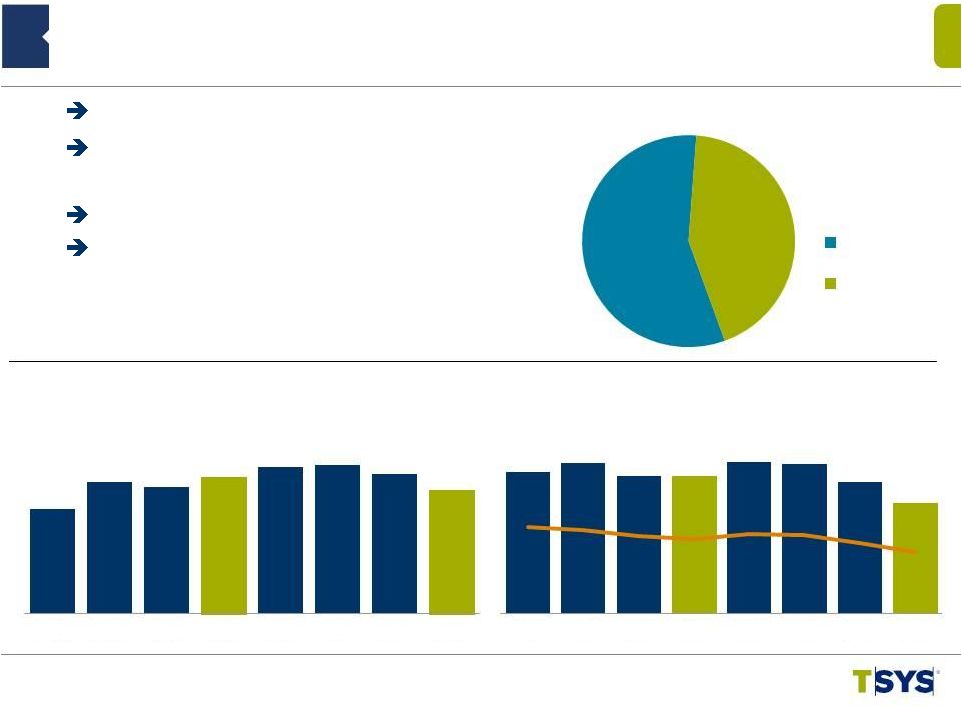 Anniversary of Acquisitions Completed Clearing and Settlement Conversion Direct Revenue Mix Holds at 57% Expanded CPAY Ownership to 75% 1Q 2014 Merchant Segment Highlights 10 ©2014 Total System Services, Inc.® Proprietary. All rights reserved worldwide. (*) Revenues Before Reimbursable Items ($ in millions) 5.0% 15.6% 5.5% 11.1% 15.6% 5.4% 4.3% Adjusted Segment Operating Income Operating Margin* ($ in millions) (4.3%) Segment Revenue* YOY Growth % $39.6% 38.2% 35.6% 34.4% 36.6% 35.9% 32.6% 28.8% Segment Revenue by Mix* QTD 57% 43% $97.7 $107.8 $105.9 $109.3 $113.0 $113.6 $110.4 $104.6 2Q12 3Q12 4Q12 1Q13 2Q13 3Q13 4Q13 1Q14 $38.7 $41.1 $37.7 $37.6 $41.3 $40.8 $36.0 $30.2 2Q12 3Q12 4Q12 1Q13 2Q13 3Q13 4Q13 1Q14 Direct Indirect |
 ©2014 Total System Services, Inc.® Proprietary. All rights reserved worldwide. 11 1Q 2014 Merchant Segment Highlights (*) Excludes Managed Accounts Segment Revenue by LOB ($ in billions) 12.3% 23.0% 32.2% 35.3% 40.6% 22.0% 11.1% (12%) 45% 55% 26% 22% (11%) (12%) (12%) ($ in millions) 4% (14%) 9.3% Direct Revenues Up 4.2% Indirect Revenues Down 13.5% POS Transactions Increased 2.7%, Excluding Deconverted Accounts High Single-digit Direct Small Business Sales Volume Growth 2Q12 3Q12 4Q12 1Q13 2Q13 3Q13 4Q13 1Q14 $3.8 $4.4 $4.7 $4.8 $5.3 $5.3 $5.2 $5.3 SBS Sales Volume* YOY Growth % YOY Growth % Indirect Direct $58 $58 $55 $52 $51 $51 $48 $45 $40 $50 $51 $57 $62 $63 $62 $59 2Q12 3Q12 4Q12 1Q13 2Q13 3Q13 4Q13 1Q14 |
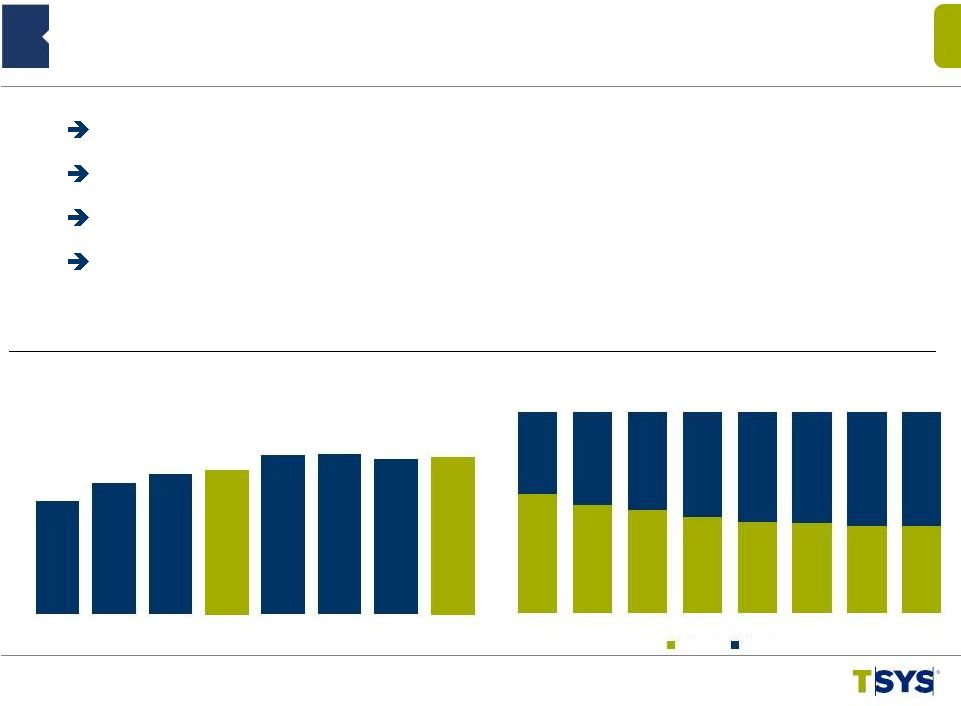
 Segment Revenue YOY Growth % 1Q 2014 NetSpend Segment Highlights 12 ©2014 Total System Services, Inc.® Proprietary. All rights reserved worldwide. ($ in millions) Revenue $132.6M – up 13.1% Added 2k Retail Locations Added 70+ New PayCard Clients Announced PayChex and Western Union Partnerships ($ in millions) (*NOTE: Periods prior to the acquisition by TSYS have been restated ) $25.7 $24.9 $23.9 $28.0 $29.3 $34.6 $31.7 $28.7 30.1% 29.4% 26.7% 23.9% 27.9% 33.4% 30.5% 21.7% 2Q12 3Q12 4Q12 1Q13 2Q13 3Q13 4Q13 1Q14 $85.3 $84.9 $89.7 $117.3 $104.9 $103.7 $104.1 $132.6 14.7% 14.2% 16.9% 28.3% 22.9% 22.2% 16.1% 13.1% 2Q12 3Q12 4Q12 1Q13 2Q13 3Q13 4Q13 1Q14 Partner Retail Direct Paycard Segment Revenue by Channel QTD 8% 52% 28% 12% Adjusted Segment Operating Income* Operating Margin* |
 1Q 2014 NetSpend Segment Highlights 13 ©2014 Total System Services, Inc.® Proprietary. All rights reserved worldwide. Gross Dollar Volume YOY Growth % Direct Deposit Active Cards YOY Growth % Direct Deposit Active Cards up 21.2% Exceeded 2M for the first time in history Gross Dollar Volume (GDV) up 22.1% Record Tax Season (in thousands) ($ in millions) 24.2% 24.8% 25.1% 66.7% 42.3% 23.8% 22.1% 17.1% 17.9% 18.2% 42.8% 30.1% 22.4% 21.2% 21.5% 22.1% 957.0 1,018.5 1,081.6 1,707.9 1,361.4 1,261.1 1,321.1 2,070.3 2Q12 3Q12 4Q12 1Q13 2Q13 3Q13 4Q13 1Q14 $3,034.7 $3,089.8 $3,265.4 $5,378.7 $3,947.9 $3,780.9 $3,967.6 $6,567.2 2Q12 3Q12 4Q12 1Q13 2Q13 3Q13 4Q13 1Q14 |
 Jim Lipham Chief Financial Officer ©2014 Total System Services, Inc.® Proprietary. All rights reserved worldwide. |
 Consolidated Selected Financial Highlights 15 ©2014 Total System Services, Inc.® Proprietary. All rights reserved worldwide. Total Revenues $592,848 $448,791 32.1% Revenues Before Reimbursable Items 532,750 388,032 37.3 Adjusted EBITDA* 149,596 123,446 21.2 Adjusted Cash EPS* from Continuing Operations $0.38 $0.38 (1.1) 1 st Qtr 2014 1 st Qtr 2013 Percent Change (in thousands, except per share data) (*) Adjusted Cash EPS and Adjusted EBITDA definitions are contained in Appendix |
 Revenues before Reimbursable Items Adjusted Operating Margin Adjusted Segment Operating Income North America $74,578 $224,368 33.24% International 4,555 76,773 5.93% Merchant 30,168 104,625 28.83% NetSpend 28,717 132,640 21.65% Eliminations -- (5,656) Corporate administration excluding stock comp (24,144) -- Adjusted operating margin $113,874 $532,750 21.37% Amortization of acquisition intangibles (24,313) NetSpend M&A expenses (1,253) Stock-based compensation (7,611) Operating income (US GAAP) $80,697 Segment Operating Margin and Consolidated Adjusted Operating Margin (in thousands) 16 ©2014 Total System Services, Inc.® Proprietary. All rights reserved worldwide. Three Months Ended March 31, 2014 |
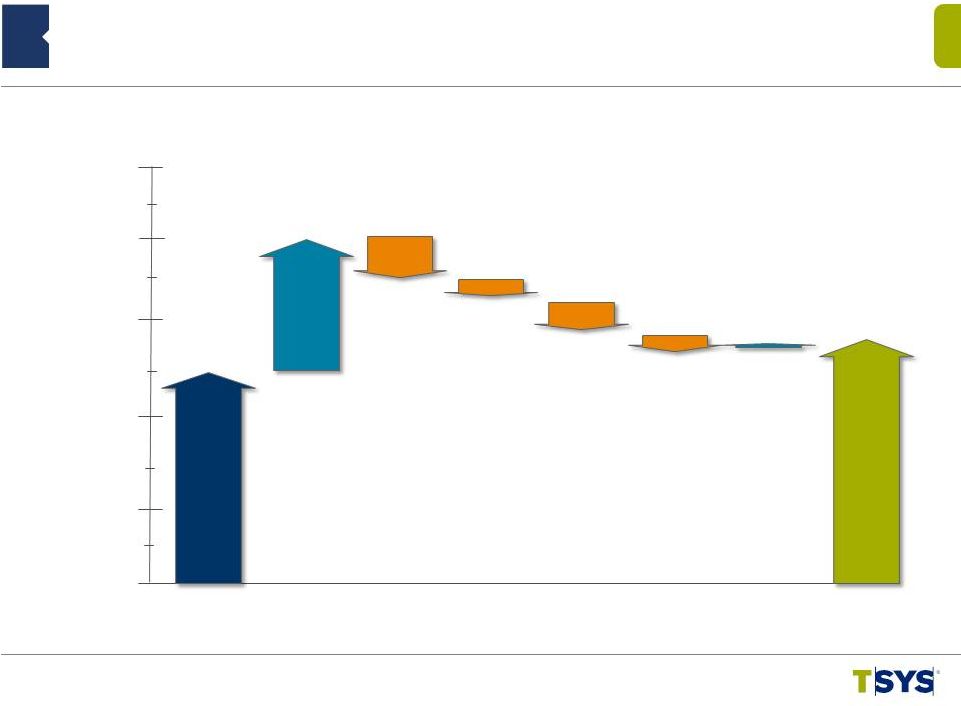 ©2014 Total System Services, Inc.® Proprietary. All rights reserved worldwide. Rollforward of Quarterly Cash Balance $200 $500 $100 $0 $300 Beginning Balance $248 Operating Activities $149 Cap Ex ($47) Debt Pmts ($22) Dividends ($19) Acquisition ($38) Other $3 Ending Balance $274 (in millions) 12/31/2013 3/31/2014 17 $400 |
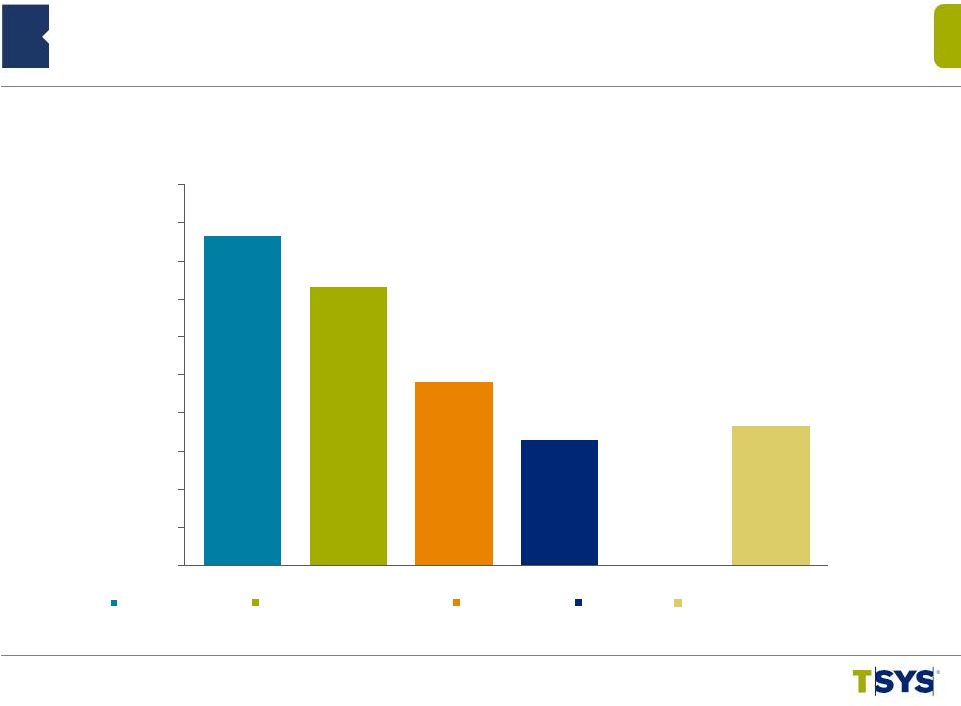 Cash Flow Strength: 2014 TTM Consolidated Financial Highlights 18 ©2014 Total System Services, Inc.® Proprietary. All rights reserved worldwide. TTM = Trailing Twelve Months (in millions) $650 $549 $363 $249 $274 $0 $75 $150 $225 $300 $375 $450 $525 $600 $675 $750 Adjusted EBITDA Cash flow from operations Free cash flow Net income Ending cash |
 2014 Revised Guidance* Range Range Percent Change Total Revenues $2,422 to $2,471 17% to 20% Revenues Before Reimbursable Items $2,182 to $2,226 20% to 22% Adjusted EBITDA $732 to $746 17% to 20% Adjusted Cash EPS from continuing operations $1.90 to $1.93 10% to 12% Average Basic Weighted Shares 188.4 (in millions, except per share data) 19 (*) See Appendix for guidance assumptions ©2014 Total System Services, Inc.® Proprietary. All rights reserved worldwide. |
 Q&A ©2014 Total System Services, Inc.® Proprietary. All rights reserved worldwide. |
 Appendix ©2014 Total System Services, Inc.® Proprietary. All rights reserved worldwide. |
 Appendix: Non-GAAP Items – Adjusted EBITDA and Adjusted Cash EPS • Adjusted EBITDA is net income excluding equity in income of equity investments, nonoperating income/(expense), taxes, depreciation, amortization and stock-based compensation expenses and other non-recurring items. • Adjusted cash EPS is adjusted cash earnings divided by weighted average shares outstanding used for basic EPS calculations. Adjusted cash earnings is net income excluding the after-tax impact of stock-based compensation expenses, amortization of acquisition intangibles, and other non-recurring items. • Adjusted segment operating income is operating income at the segment level adjusted for acquisition intangible amortization. • Adjusted segment operating margin is adjusted segment operating income divided by segment revenues before reimbursable items. • The Company believes that these non-GAAP financial measures it presents are useful to investors in evaluating the Company’s operating performance for the following reasons: – adjusted EBITDA and adjusted cash EPS are widely used by investors to measure a company’s operating performance without regard to items, such as interest expense, income tax expense, depreciation and amortization, merger and acquisition expenses and employee stock-based compensation expense that can vary substantially from company to company depending upon their respective financing structures and accounting policies, the book values of their assets, their capital structures and the methods by which their assets were acquired; and – securities analysts use adjusted EBITDA and adjusted cash EPS as supplemental measures to evaluate the overall operating performance of companies. • By comparing the Company’s adjusted EBITDA and adjusted cash EPS in different historical periods, investors can evaluate the Company’s operating results without the additional variations caused by employee stock-based compensation expense, which may not be comparable from period to period due to changes in the fair market value of the Company’s common stock (which is influenced by external factors like the volatility of public markets and the financial performance of the Company’s peers) and is not a key measure of the Company’s operations. • The Company’s management uses the non-GAAP financial measures: – as measures of operating performance, because they exclude the impact of items not directly resulting from the Company’s core operations; – for planning purposes, including the preparation of the Company’s annual operating budget; – to allocate resources to enhance the financial performance of the Company’s business; – to evaluate the effectiveness of the Company’s business strategies; and – in communications with the Company’s board of directors concerning the Company’s financial performance. ©2014 Total System Services, Inc.® Proprietary. All rights reserved worldwide. 22 |
 Consumer Credit 234.8 203.7 15.3 234.8 228.9 2.6 Retail 27.5 25.2 9.3 27.5 27.8 (0.9 ) Total Consumer 262.3 228.9 14.6 262.3 256.7 2.2 Commercial 40.4 37.9 6.7 40.4 39.9 1.2 Other 19.7 13.4 46.5 19.7 18.9 4.4 Subtotal 322.4 280.2 15.1 322.4 315.5 2.2 Prepaid */ Stored Value 120.0 107.3 11.8 120.0 118.0 1.7 Government Services 63.0 59.4 6.1 63.0 62.2 1.1 Commercial Card Single Use 50.8 31.6 60.8 50.8 45.3 12.2 Total AOF 556.2 478.5 16.2 556.2 541.0 2.8 Appendix: Accounts on File Portfolio Summary (in millions) Mar 2014 Mar 2013 % Change Mar 2014 Dec 2013 % Change 23 ©2014 Total System Services, Inc.® Proprietary. All rights reserved worldwide. (* - Prepaid does not include NetSpend accounts) |
 Appendix: Non-GAAP Reconciliation – Revenues Before Reimbursable Items Three Months Ended 03/31/14 03/31/13 Total Revenues $592,848 $448,791 Reimbursable Items 60,098 60,759 $532,750 $388,032 (in thousands) 24 ©2014 Total System Services, Inc.® Proprietary. All rights reserved worldwide. Revenues before Reimbursable Items |
 Appendix: Non-GAAP Reconciliation – Adjusted Segment Operating Income and Operating Margin Three Months Ended Operating income $80,697 $74,520 Add: Acquisition intangible amort 24,313 8,532 Add: Corporate admin and other 33,008 30,193 Total segment adjusted operating income $138,018 $113,245 By segment: North America services (a) $74,578 $68,748 International services (b) $4,555 $6,861 Merchant services (c) $30,168 $37,636 NetSpend (d) $28,717 $-- Total revenues $592,848 $448,791 Reimbursable items (60,098) (60,759) Total segment revenues before reimbursable items $532,750 $388,032 Intersegment revenues 5,656 3,252 By segment: North America services (e) $224,368 $205,596 International services (f) $76,773 $76,387 Merchant services (g) $104,625 $109,301 NetSpend (h) $132,640 $-- Adjusted segment operating margin: North America services (a) / (e) 33.24% 33.44% International services (b) / (f) 5.93% 8.98% Merchant services (c) / (g) 28.83% 34.43% NetSpend (d) / (h) 21.65% na (in thousands) 25 ©2014 Total System Services, Inc.® Proprietary. All rights reserved worldwide. 3/31/14 3/31/13 |
 Three Months Ended 3/31/14 3/31/13 Percentage Change Appendix: Non-GAAP Reconciliation – Constant Currency (1) Reflects current period results on a non-GAAP basis as if foreign currency rates did not change from the comparable prior year period. (2) Reflects the impact of calculated changes in foreign currency rates from the comparable period. (in thousands) Consolidated: Constant Currency (1) $588,485 $448,791 31.1% Foreign Currency (2) 4,363 --- Total Revenues $592,848 $448,791 32.1% International Services: Constant Currency (1) $78,134 $80,891 (3.4%) Foreign Currency (2) 4,244 --- Total Revenues $82,378 $80,891 1.8% 26 ©2014 Total System Services, Inc.® Proprietary. All rights reserved worldwide. |
 Three Months Ended 3/31/14 3/31/13 Percentage Change Appendix: Non-GAAP Reconciliation – Constant Currency (1) Reflects current period results on a non-GAAP basis as if foreign currency rates did not change from the comparable prior year period. (2) Reflects the impact of calculated changes in foreign currency rates from the comparable period. (in thousands) 27 ©2014 Total System Services, Inc.® Proprietary. All rights reserved worldwide. Consolidated: Constant Currency (1) $528,701 $388,032 36.3% Foreign Currency (2) 4,049 --- Revenues before reimbursable items $532,750 $388,032 37.3% International Services: Constant Currency (1) $72,843 $76,387 (4.6%) Foreign Currency (2) 3,930 --- Revenues before reimbursable items $76,773 $76,387 0.5% |
 Appendix: Non-GAAP Reconciliation – EBITDA and Adjusted EBITDA (in thousands) 28 ©2014 Total System Services, Inc.® Proprietary. All rights reserved worldwide. Three Months Ended Mar 2014 Mar 2013 Net income : As reported (GAAP) (a) $51,625 $59,149 Adjusted for: Deduct: Income from discontinued operations (980) (15) Deduct: Equity in Income of Equity Investments (4,096) (3,817) Add: Income Taxes 24,335 17,463 Add: Nonoperating expenses 9,813 1,740 Add: Depreciation and amortization 60,035 40,852 EBITDA $140,732 $115,372 Adjust for: Add: Share-based compensation 7,611 4,593 Add: NetSpend M&A expenses 1,253 3,481 Adjusted EBITDA $149,596 $123,446 |
 Appendix: Non-GAAP Reconciliation – Adjusted Cash EPS (in thousands) 29 ©2014 Total System Services, Inc.® Proprietary. All rights reserved worldwide. Three Months Ended Mar 2014 Mar 2013 Income from continuing operations available to TSYS common shareholders: As reported (GAAP) (a) $49,321 $57,905 Adjusted for amounts attributable to TSYS common shareholders (net of taxes): Acquisition intangible amortization 15,813 5,492 Share-based compensation 5,017 3,148 Cash earnings $70,151 $66,545 NetSpend M&A expenses (nonrecurring) 1,204 5,222 Adjusted cash earnings (b) $71,355 $71,767 Average common shares outstanding and participating securities (c) 187,752 186,807 Basic EPS from continuing operations available to TSYS common shareholders (a) / (c) $0.26 $0.31 Adjusted cash EPS Available to TSYS common shareholders (b) / (c) $0.38 $0.38 |
 Appendix: Non-GAAP Reconciliation – EBITDA and Adjusted EBITDA Trailing Twelve Months Ended 3/31/2014 Net Income $249,074 Adjusted for: Deduct: Discontinued operations (3,021) Deduct: Equity in Income of Equity Investments (13,327) Add: Income Taxes 218,210 Add: Nonoperating expense 38,097 Add: Depreciation and Amortization 117,854 EBITDA $606,886 Adjust for: Share-based compensation 31,950 NetSpend M&A Operating Expenses* 11,406 Adjusted EBITDA $650,243 (in thousands) 30 ©2014 Total System Services, Inc.® Proprietary. All rights reserved worldwide. * Excludes share-based compensation |
 Appendix: Non-GAAP Reconciliation – Free Cash Flow Trailing Twelve Months Ended 3/31/2014 Cash Flows from Operating Activities $548,668 Less: Purchase of Property and Equipment (47,757) Additions to Licensed Computer Software from Vendors (40,788) Additions to Internally Developed Computer Software (36,944) Additions to Contract Acquisition Costs (60,202) Free Cash Flow $362,977 (in thousands) 31 ©2014 Total System Services, Inc.® Proprietary. All rights reserved worldwide. |
 Appendix: 2014 Guidance Assumptions The guidance assumes: 32 ©2014 Total System Services, Inc.® Proprietary. All rights reserved worldwide. • There will be no significant movements in the London Interbank Offered rate and TSYS will not make any significant draws on the remaining balance of its credit facility; • There will be no significant movement in foreign currency exchange rates related to TSYS’ business; • TSYS will not incur significant expenses associated with the conversion of new large clients other than included in the 2014 estimate, additional acquisitions, or any significant impairment of goodwill or other intangibles; • There will be no deconversions of large clients during the year; • There will be minimal synergies from the NetSpend acquisition for 2014; and • The economy will not worsen. |