 2014 Second Quarter Results July 22, 2014 ©2014 Total System Services, Inc.® Proprietary. All rights reserved worldwide. Exhibit 99.2 |
 Forward-Looking Statements 2 This presentation and comments made by management contain forward- looking statements including, among others, statements regarding the expected future operating results of TSYS. These statements are based on management’s current expectations and assumptions and are subject to risks, uncertainties and changes in circumstances. Forward-looking statements include all statements that are not historical facts and can be identified by the use of forward-looking terminology such as the words “believe,” “expect,” “anticipate,” “intend,” “plan,” “potential”, “estimate” or similar expressions. Actual results may differ materially from those set forth in the forward-looking statements due to a variety of factors. More information about these risks, uncertainties and factors may be found in TSYS’ filings with the Securities and Exchange Commission, including its 2013 Annual Report on Form 10-K. TSYS does not assume any obligation to update any forward-looking statements as a result of new information, future developments or otherwise. ©2014 Total System Services, Inc.® Proprietary. All rights reserved worldwide. |
 Use of Non-GAAP Financial Measures 3 ©2014 Total System Services, Inc.® Proprietary. All rights reserved worldwide. This slide presentation contains certain non-GAAP financial measures determined by methods other than in accordance with generally accepted accounting principles. Such non-GAAP financial measures include the following: revenues before reimbursable items; operating margin excluding reimbursable items; revenues measured on a constant currency basis; free cash flow; EBITDA, adjusted EBITDA , adjusted earnings per share, adjusted segment operating income and adjusted segment operating margin. The most comparable GAAP measures to these measures are revenues; operating margin; revenues; cash flows from operating activities; net income; net income; earnings per share, operating income and operating margin, respectively. Management uses these non-GAAP financial measures to assess the performance of TSYS’ core business. TSYS believes that these non-GAAP financial measures provide meaningful additional information about TSYS to assist investors in evaluating TSYS’ operating results. These non-GAAP financial measures should not be considered as a substitute for operating results determined in accordance with GAAP and may not be comparable to other similarly titled measures of other companies. The computations of the non-GAAP financial measures used in this slide presentation are set forth in the Appendix to this slide presentation. |
 Phil Tomlinson Chairman and Chief Executive Officer ©2014 Total System Services, Inc.® Proprietary. All rights reserved worldwide. |
 Troy Woods President & Chief Operating Officer ©2014 Total System Services, Inc.® Proprietary. All rights reserved worldwide. |
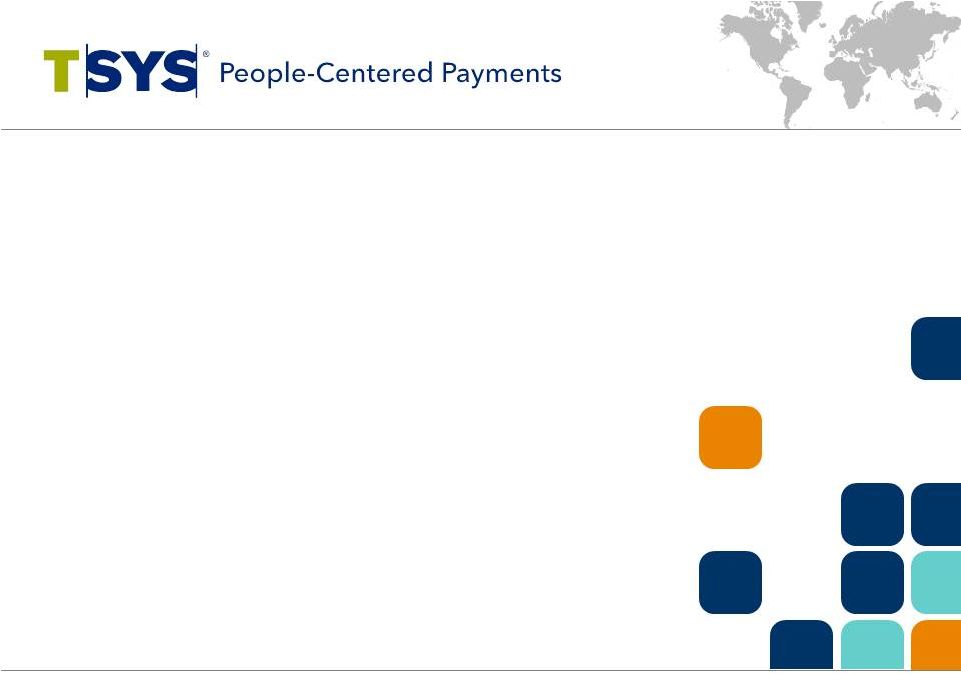
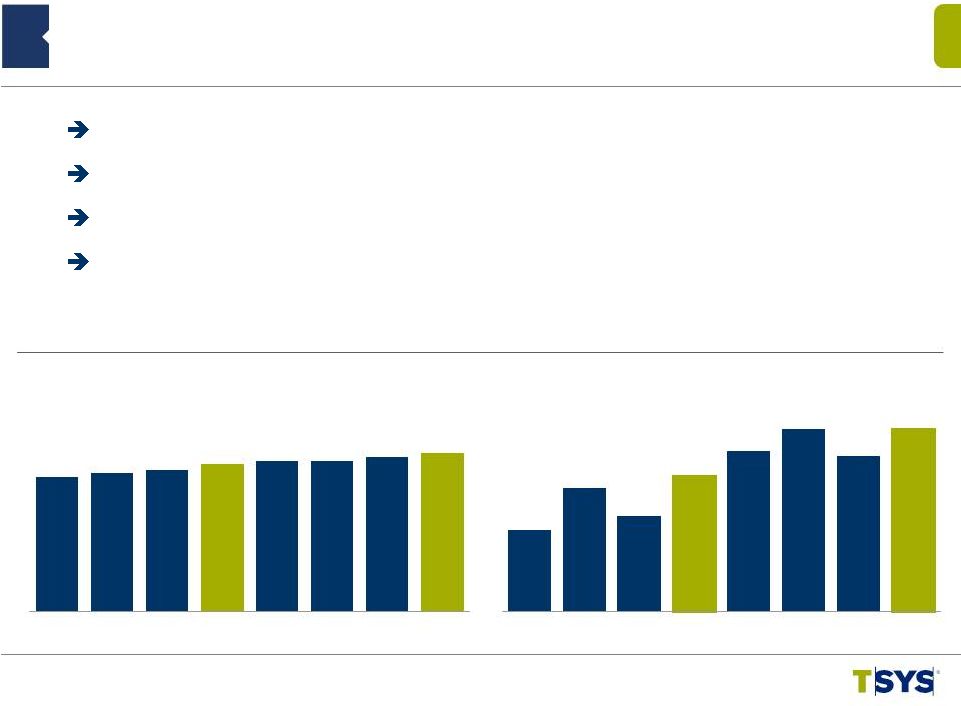
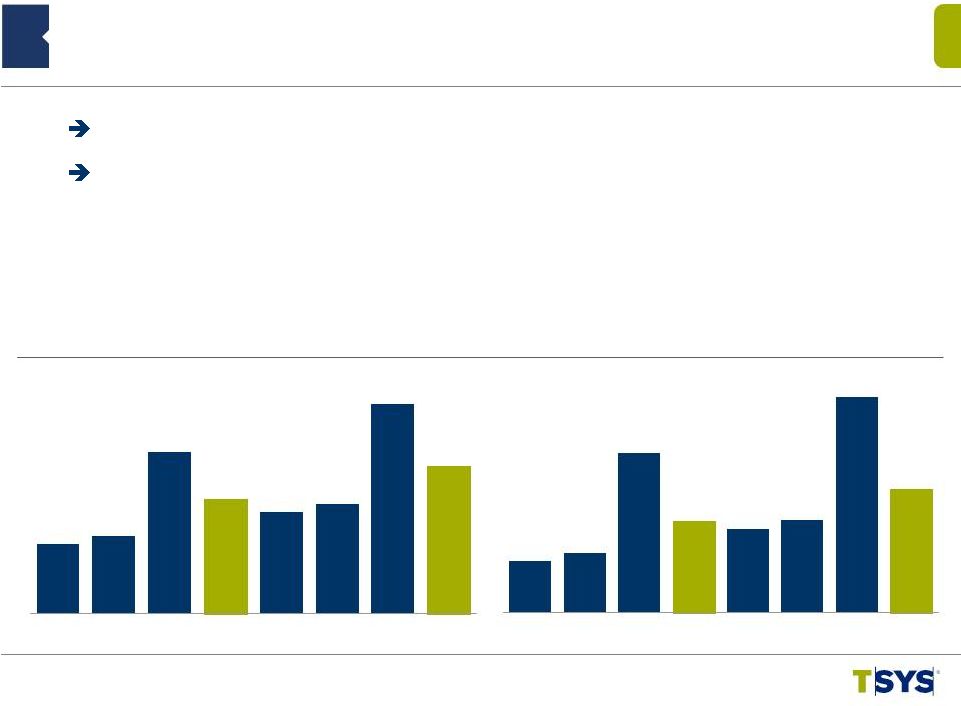
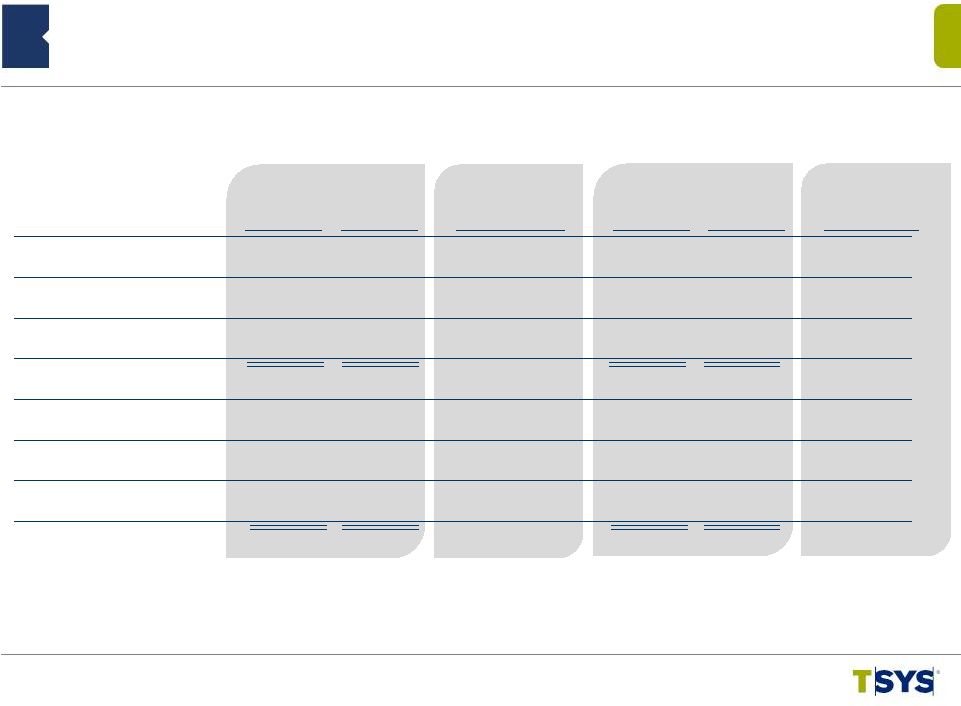
 2Q 2014 North America Segment Highlights 6 ©2014 Total System Services, Inc.® Proprietary. All rights reserved worldwide. ($ in millions) (*) Revenues Before Reimbursable Items ($ in millions) (1.3%) 1.9% 0.8% 4.4% 4.5% 6.8% Adjusted Segment Operating Income Operating Margin * (1) Includes Credit, Debit, Retail, Prepaid & Loyalty (2) Includes Healthcare 9.1% Revenue up 8.7% YOY; 7th Straight Quarter of Positive Growth Benefiting from Conversion of 16.9M Accounts since 2Q13 8.7% $203.5 $213.6 $205.6 $214.5 $217.3 $223.3 $224.4 $233.2 3Q12 4Q12 1Q13 2Q13 3Q13 4Q13 1Q14 2Q14 Segment Revenue* YOY Growth % $71.5 $81.2 $68.7 $81.3 $84.4 $87.1 $74.6 $84.6 35.2% 38.0% 33.4% 37.9% 38.9% 39.0% 33.2% 3Q12 4Q12 1Q13 2Q13 3Q13 4Q13 1Q14 2Q14 Segment Revenue by Line of Business* Consumer (1) Commercial (2) Other 73% 23% 36.3% 4% |
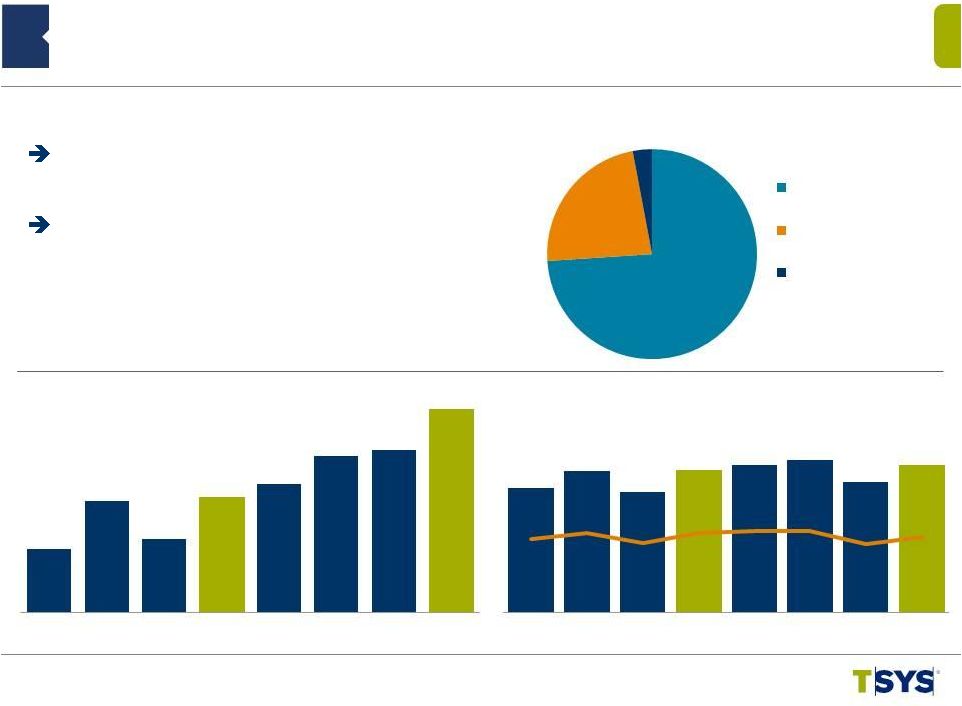
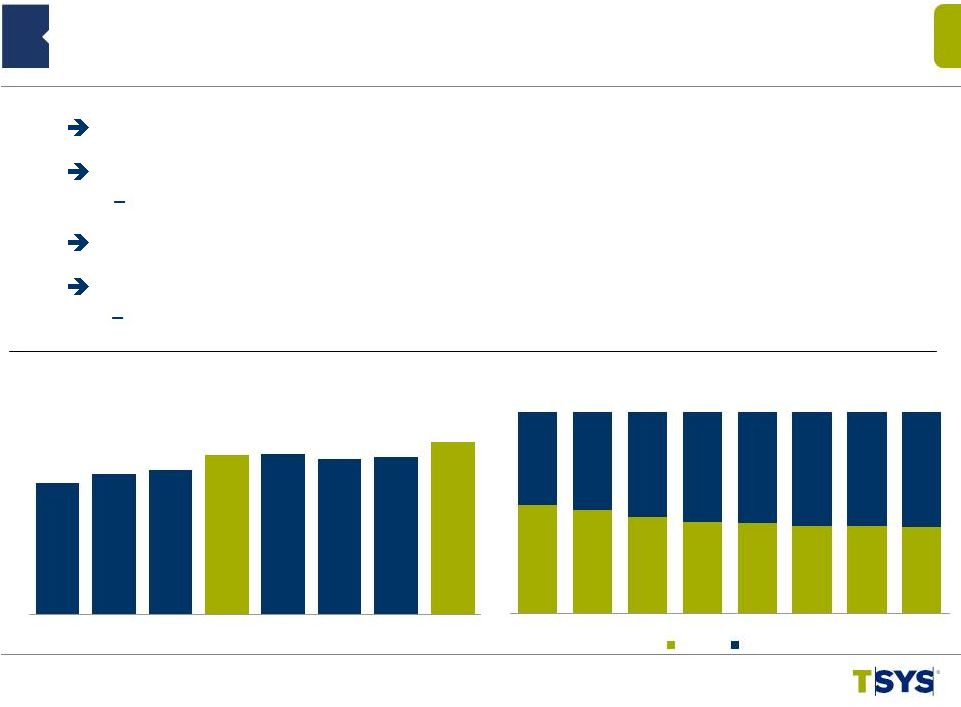
 2Q 2014 North America Segment Highlights 7 ©2014 Total System Services, Inc.® Proprietary. All rights reserved worldwide. (*) Growth Excluding Prepaid, Government Services and Single Use Accounts * (in millions) (in millions) 3.4% 5.5% 5.2% 6.3% 16.2% 16.5% 20.9% 20.9% 16.9% 11.2% 11.6% 13.4% 9.5% 12.7% 7.8% 11.5% 17.6% 13.4% 15.6% 17.2% 17.1% AOF at Highest Level in History; Exceeded 500M Mark Strong YOY Growth in Traditional Accounts on File Largest Quarter of Transaction Volume in History at 2.7B Same Client Transactions up 13.9% 18.5% 19.1% 20.7% 413.4 424.8 422.8 430.7 461.4 481.9 495.5 510.3 3Q12 4Q12 1Q13 2Q13 3Q13 4Q13 1Q14 2Q14 Accounts on File YOY Growth% 2,036.6 2,194.7 2,013.4 2,235.0 2,395.8 2,488.2 2,327.6 2,696.7 3Q12 4Q12 1Q13 2Q13 3Q13 4Q13 1Q14 2Q14 Transaction Volume YOY Growth% |
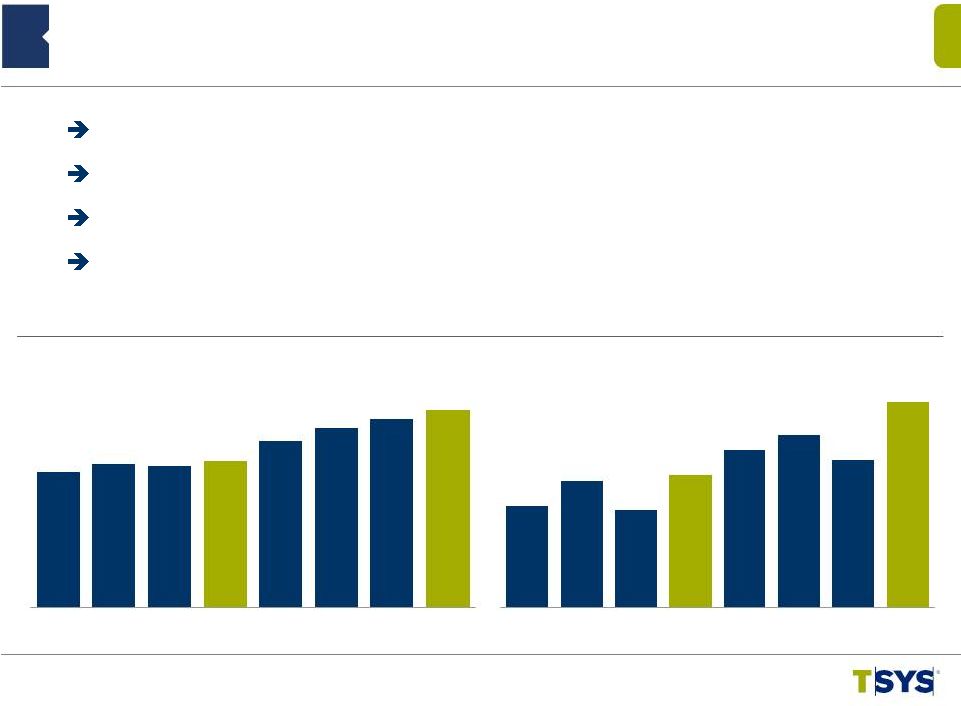
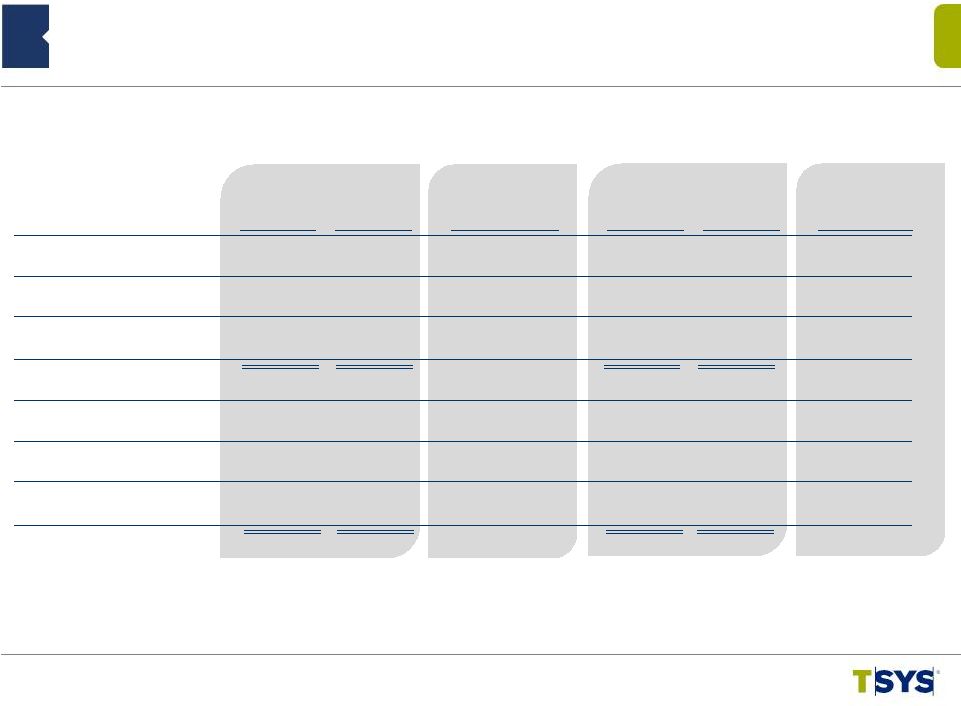
 2Q 2014 International Segment Highlights 8 ©2014 Total System Services, Inc.® Proprietary. All rights reserved worldwide. ($ in millions) Reported Constant Currency (*) Revenues Before Reimbursable Items ($ in millions) 1.4% 1.1% (2.6%) (4.0%) 0.7% 4.4% 0.1% (0.9%) 3.1% 9.0% 8.6% 88% 0.5% (4.6%) Revenue $84.7M* – Up 10.6% Up 1.8% on Constant Currency $6.7M of Currency Benefit Margin Improvement Plans Show Tangible Results Accelerate Growth Program Strengthens Pipeline (1.0%) 10.6% 1.8% $77.3 $83.1 $76.4 $76.6 $77.9 $90.6 $76.8 $84.7 3Q12 4Q12 1Q13 2Q13 3Q13 4Q13 1Q14 2Q14 Segment Revenue* YOY Growth % $6.8 $7.0 $6.9 $7.7 $9.5 $18.0 $4.6 $11.7 8.9% 8.4% 9.0% 10.0% 12.2% 19.9% 5.9% 13.9% 3Q12 4Q12 1Q13 2Q13 3Q13 4Q13 1Q14 2Q14 Segment Revenue by Region QTD Europe MEA Rest Of World 6% 6% Adjusted Segment Operating Income Operating Margin * |
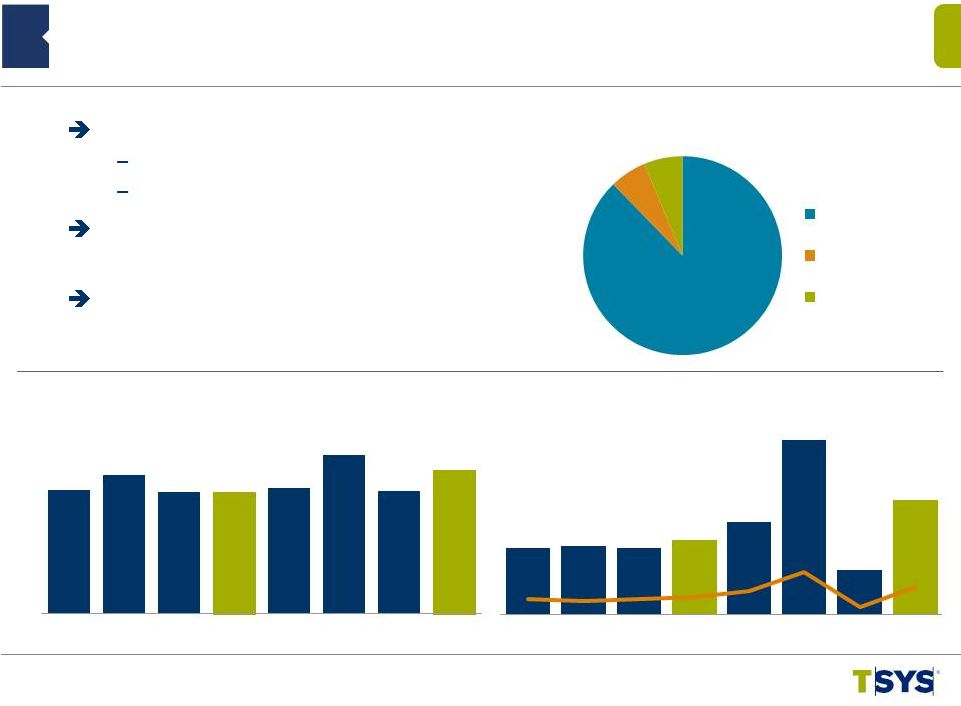
 2Q 2014 International Segment Highlights 9 ©2014 Total System Services, Inc.® Proprietary. All rights reserved worldwide. (in millions) (in millions) 5.7% 4.1% 3.7% 9.9% 12.1% 8.5% 15.9% 19.5% 14.2% 23.3% 26.7% 17.3% 8.9% 19.3% AOF Grew 4.3M YOY, Mainly Through Existing Clients Irish Debit Continues to be Strong Growth Driver at 42.9% 15 th Straight Quarter of Double digit Transaction Growth Same Client Transactions Grew 14.6% 7.5% 13.4% 3Q12 4Q12 1Q13 2Q13 3Q13 4Q13 1Q14 2Q14 Accounts on File YOY Growth % 414.6 473.6 434.0 492.4 525.5 555.6 517.9 558.1 3Q12 4Q12 1Q13 2Q13 3Q13 4Q13 1Q14 2Q14 Transaction Volume YOY Growth% 52.9 54.5 55.7 58.0 59.2 59.1 60.7 62.3 |
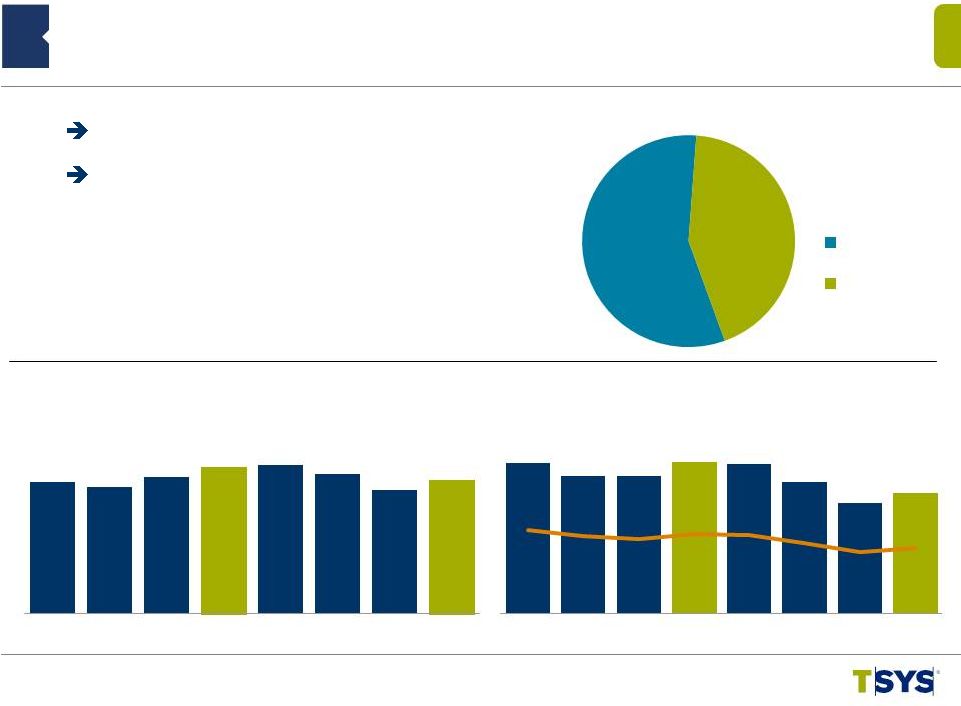 Improved Margin Following Conversion Strong Pipeline of Indirect Clients 2Q 2014 Merchant Segment Highlights 10 ©2014 Total System Services, Inc.® Proprietary. All rights reserved worldwide. (*) Revenues Before Reimbursable Items ($ in millions) Adjusted Segment Operating Income Operating Margin * ($ in millions) 15.6% 5.5% 11.1% 15.6% 5.4% 4.3% (4.3%) (4.1%) $107.8 $105.9 $109.3 $113.0 $113.6 $110.4 $104.6 $108.3 3Q12 4Q12 1Q13 2Q13 3Q13 4Q13 1Q14 2Q14 Segment Revenue* YOY Growth % $41.1 $37.7 $37.6 $41.3 $40.8 $36.0 $30.2 $32.9 38.2% 35.6% 34.4% 36.6% 35.9% 32.6% 28.8% 30.4% 3Q12 4Q12 1Q13 2Q13 3Q13 4Q13 1Q14 2Q14 Segment Revenue by Mix* QTD Direct Indirect 43% 57% |
 ©2014 Total System Services, Inc.® Proprietary. All rights reserved worldwide. 11 2Q 2014 Merchant Segment Highlights (*) Excludes Managed Accounts Segment Revenue by LOB ($ in billions) (12%) 45% 55% 26% 22% (11%) (12%) (12%) ($ in millions) 4% (14%) Direct Revenues Up 1% Indirect Revenues Down 10% Positive Turn Compared to Prior Quarters POS Transactions Increased 3.5%, Excluding Deconverted Accounts Record Quarter Direct Small Business Sales Volume Continued Growth in High Single Digits 1% (10%) 23.0% 32.2% 35.3% 40.6% 22.0% 11.1% 9.3% 8.2% $4.4 $4.7 $4.8 $5.3 $5.3 $5.2 $5.3 $5.8 3Q12 4Q12 1Q13 2Q13 3Q13 4Q13 1Q14 2Q14 SBS Sales Volume * YOY Growth % $58 $55 $52 $51 $51 $48 $45 $46 $50 $51 $57 $62 $63 $62 $59 $62 3Q12 4Q12 1Q13 2Q13 3Q13 4Q13 1Q14 2Q14 Indirect Direct YOY Growth% |
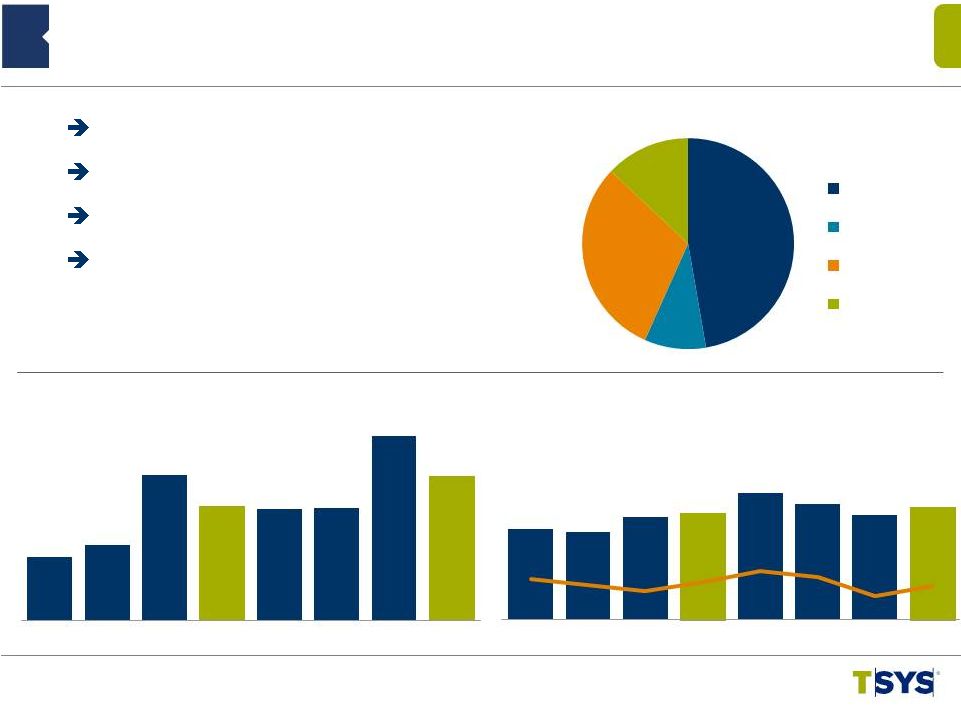 Adjusted Segment Operating Income* Segment Revenue YOY Growth % 12 ©2014 Total System Services, Inc.® Proprietary. All rights reserved worldwide. ($ in millions) Revenue $116.8M – up 11.4% Added 2k Retail Locations Added 80+ New PayCard Clients Preparing for PayChex and Western Union Launches ($ in millions) (*NOTE: Periods prior to the acquisition by TSYS have been restated ) $84.9 $89.7 $117.3 $104.9 $103.7 $104.1 $132.6 $116.8 14.2% 16.9% 28.3% 22.9% 22.2% 16.1% 13.1% 11.4% 3Q12 4Q12 1Q13 2Q13 3Q13 4Q13 1Q14 2Q14 $24.9 $23.9 $28.0 $29.3 $34.6 $31.7 $28.7 $30.7 29.4% 26.7% 23.9% 27.9% 33.4% 30.5% 21.7% 26.3% 3Q12 4Q12 1Q13 2Q13 3Q13 4Q13 1Q14 2Q14 10% 47% 30% 13% Segment Revenue by Channel QTD Partner Retail Direct Paycard 2Q 2014 NetSpend Segment Highlights Operating Margin * |
 2Q 2014 NetSpend Segment Highlights 13 ©2014 Total System Services, Inc.® Proprietary. All rights reserved worldwide. Gross Dollar Volume Direct Deposit Active Cards YOY Growth % Direct Deposit Active Cards up 17.6% Gross Dollar Volume (GDV) up 17.2% (in thousands) ($ in millions) 24.8% 25.1% 66.7% 42.3% 23.8% 22.1% 17.9% 18.2% 42.8% 30.1% 22.4% 21.2% 17.6% 1,018.5 1,081.6 1,707.9 1,361.4 1,261.1 1,321.1 2,070.3 1,600.7 3Q12 4Q12 1Q13 2Q13 3Q13 4Q13 1Q14 2Q14 $3,089.8 $3,265.4 $5,378.7 $3,947.9 $3,780.9 $3,967.6 $6,567.2 $4,628.0 3Q12 4Q12 1Q13 2Q13 3Q13 4Q13 1Q14 2Q14 21.5% 22.1% 17.2% YOY Growth % |
 Paul Todd Chief Financial Officer ©2014 Total System Services, Inc.® Proprietary. All rights reserved worldwide. |
 Consolidated Selected Financial Highlights 15 ©2014 Total System Services, Inc.® Proprietary. All rights reserved worldwide. $602,036 $461,860 30.4% Total Revenues $1,194,883 $910,651 31.2% 538,067 400,929 34.2 Revenues Before Reimbursable Items 1,070,818 788,960 35.7 170,894 140,105 22.0 Adjusted EBITDA* 320,489 263,551 21.6 $0.45 $0.37 19.8 Adjusted EPS* from Continuing Operations $0.83 $0.76 9.2 (in thousands, except per share data) 2 nd Qtr 2014 2 nd Qtr 2013 Percent Change YTD 2014 YTD 2013 Percent Change (*) Adjusted EBITDA and Adjusted EPS definitions are contained in Appendix |
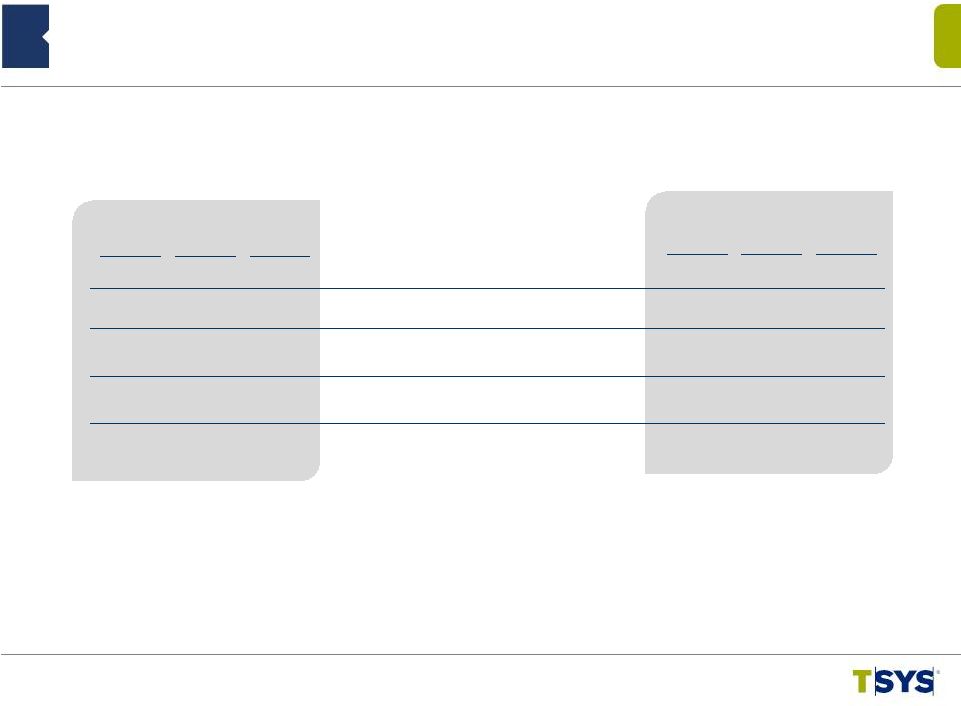
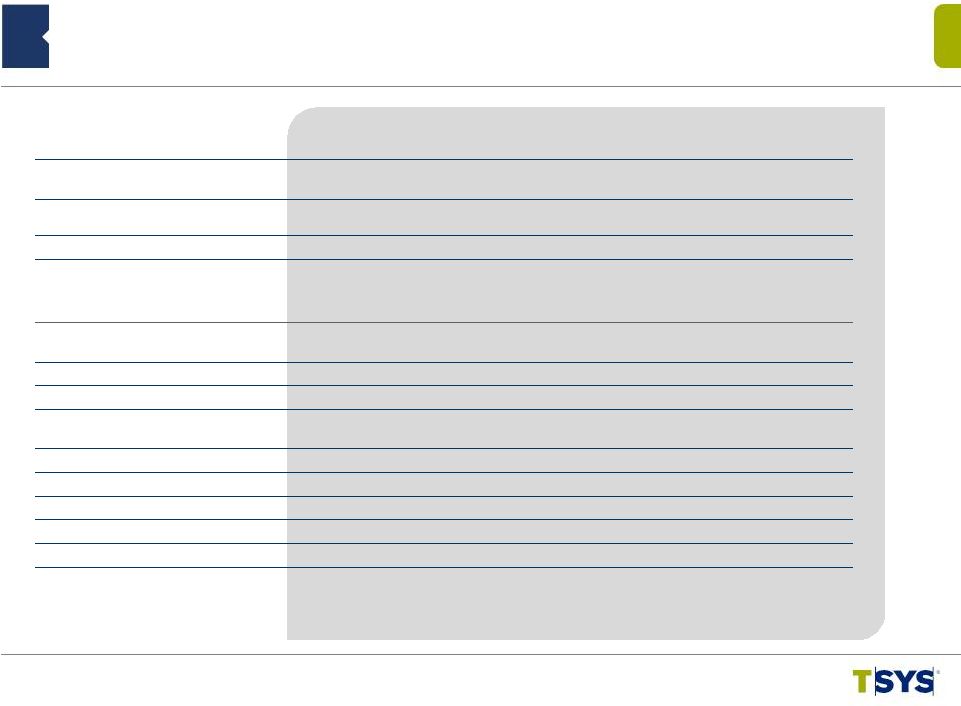
 Revenues before Reimbursable Items Adjusted Operating Margin Adjusted Segment Operating Income North America $84,578 $233,217 36.27% International 11,743 84,732 13.86% Merchant 32,896 108,335 30.37% NetSpend 30,703 116,833 26.28% Eliminations -- (5,050) Corporate administration excluding stock comp (25,705) -- Adjusted operating margin $134,215 $538,067 24.94% Amortization of acquisition intangibles (24,282) NetSpend M&A expenses (1,182) Stock-based compensation (9,988) Operating income (US GAAP) $98,763 Segment Operating Margin and Consolidated Adjusted Operating Margin (in thousands) 16 ©2014 Total System Services, Inc.® Proprietary. All rights reserved worldwide. Three Months Ended June 30, 2014 |
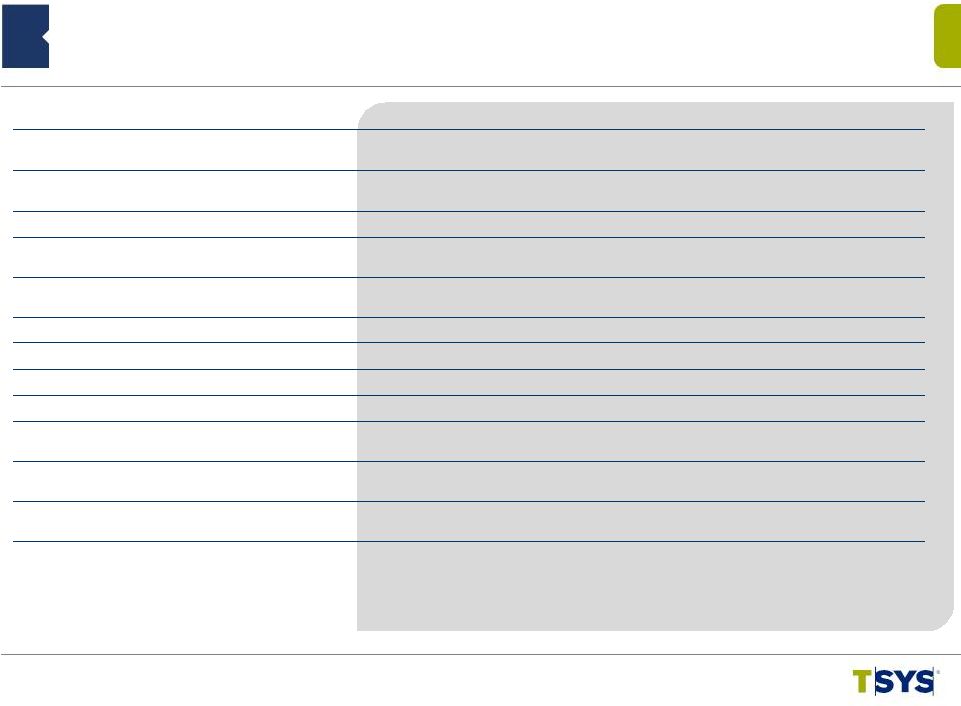
 Revenues before Reimbursable Items Adjusted Operating Margin Adjusted Segment Operating Income North America $159,155 $457,585 34.78% International 16,298 161,505 10.09% Merchant 63,064 212,960 29.61% NetSpend 59,421 249,473 23.82% Eliminations -- (10,706) Corporate administration excluding stock comp (49,849) -- Adjusted operating margin $248,089 $1,070,818 23.17% Amortization of acquisition intangibles (48,595) NetSpend M&A expenses (2,435) Stock-based compensation (17,599) Operating income (US GAAP) $179,460 Segment Operating Margin and Consolidated Adjusted Operating Margin (in thousands) 17 ©2014 Total System Services, Inc.® Proprietary. All rights reserved worldwide. Six Months Ended June 30, 2014 |
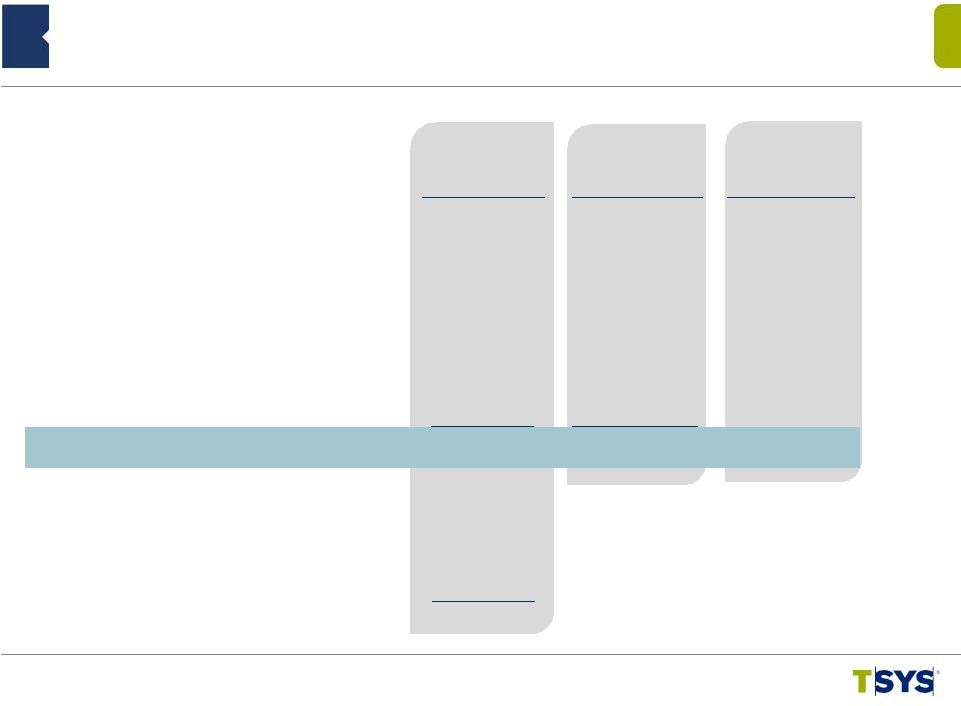
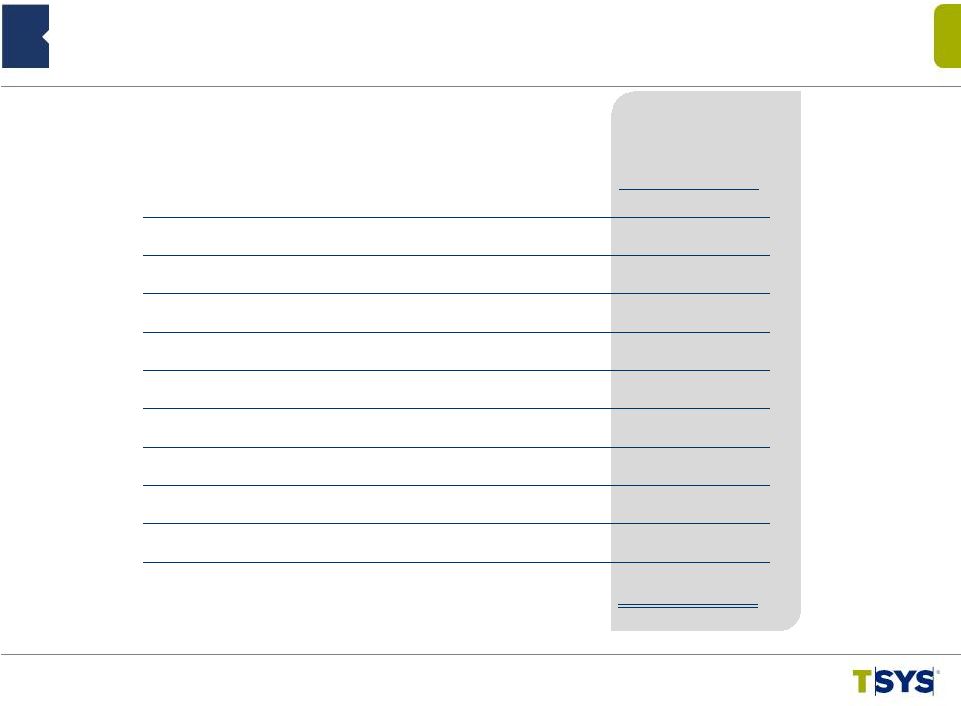
 ©2014 Total System Services, Inc.® Proprietary. All rights reserved worldwide. Rollforward of Quarterly Cash Balance $200 $500 $100 $0 $300 $274* Operating Activities $91 Cap Ex ($59) Debt Pmts ($12) Dividends ($19) Share Repurchase ($116) Other $14 Ending Balance $251 (in millions) 3/31/2014 6/30/2014 18 $400 Sale Proceeds,net $45 Beginning Balance $307 * Cash Balance from Continuing Operations |
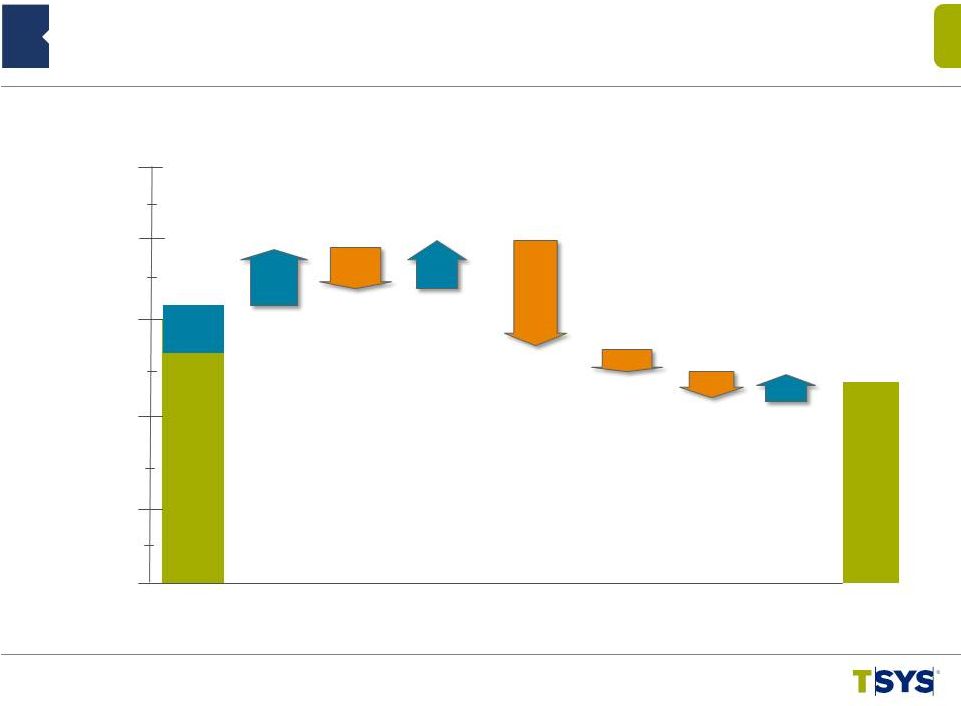
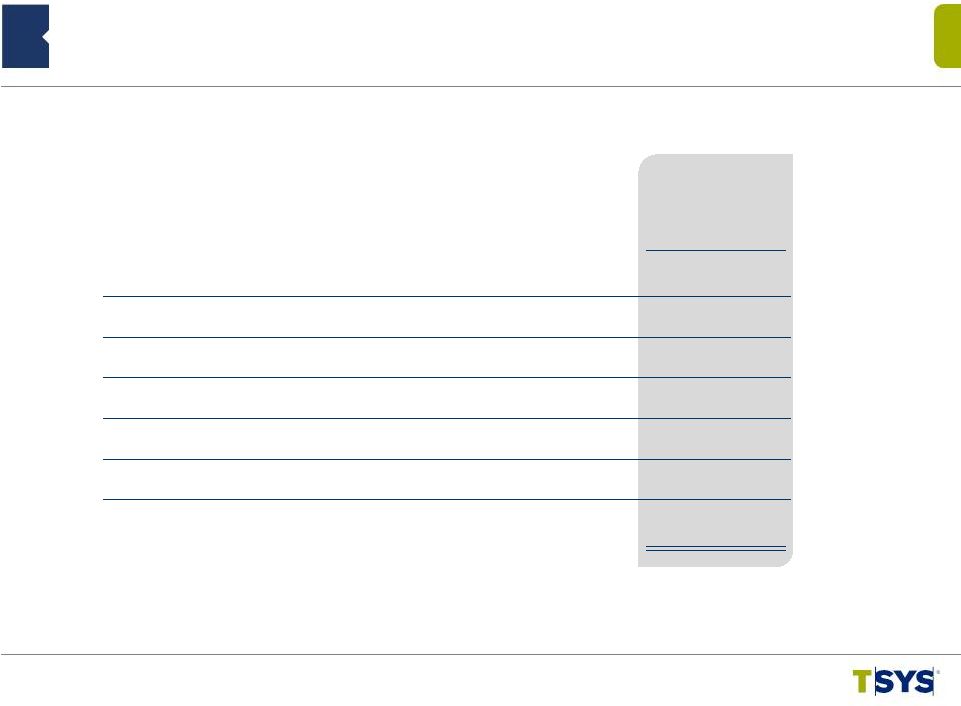
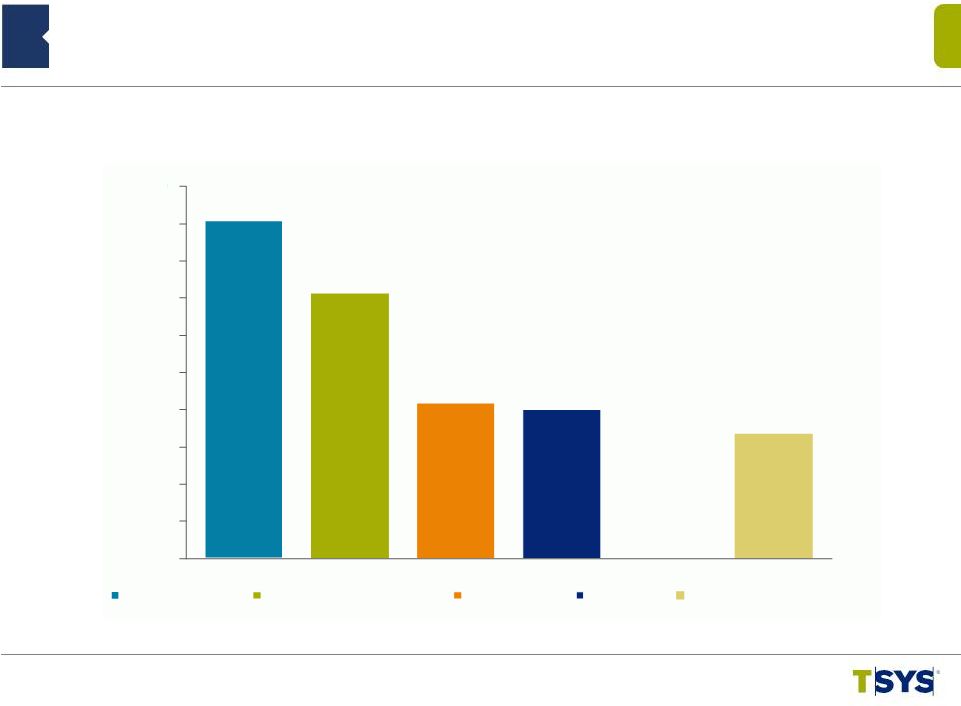 Cash Flow Strength: 2014 TTM Consolidated Financial Highlights 19 ©2014 Total System Services, Inc.® Proprietary. All rights reserved worldwide. TTM = Trailing Twelve Months (in millions) $681 $535 $313 $300 $251 $0 $75 $150 $225 $300 $375 $450 $525 $600 $675 $750 Adjusted EBITDA Cash flow from operations Free cash flow Net income Ending cash |
 Q&A ©2014 Total System Services, Inc.® Proprietary. All rights reserved worldwide. |
 Appendix ©2014 Total System Services, Inc.® Proprietary. All rights reserved worldwide. |
 Appendix: Non-GAAP Items – Adjusted EBITDA and Adjusted EPS • Adjusted EBITDA is net income excluding equity in income of equity investments, nonoperating income/(expense), taxes, depreciation, amortization and stock-based compensation expenses and NetSpend merger & acquisition expenses. • Adjusted EPS is adjusted earnings divided by weighted average shares outstanding used for basic EPS calculations. Adjusted earnings is net income excluding the after-tax impact of stock-based compensation expenses, amortization of acquisition intangibles, and NetSpend merger & acquisition expenses. • Adjusted segment operating income is operating income at the segment level adjusted for acquisition intangible amortization. • Adjusted segment operating margin is adjusted segment operating income divided by segment revenues before reimbursable items. • The Company believes that these non-GAAP financial measures it presents are useful to investors in evaluating the Company’s operating performance for the following reasons: – adjusted EBITDA and adjusted EPS are widely used by investors to measure a company’s operating performance without regard to items, such as interest expense, income tax expense, depreciation and amortization, merger and acquisition expenses and employee stock-based compensation expense that can vary substantially from company to company depending upon their respective financing structures and accounting policies, the book values of their assets, their capital structures and the methods by which their assets were acquired; and – securities analysts use adjusted EBITDA and adjusted EPS as supplemental measures to evaluate the overall operating performance of companies. • By comparing the Company’s adjusted EBITDA and adjusted EPS in different historical periods, investors can evaluate the Company’s operating results without the additional variations caused by employee stock-based compensation expense, which may not be comparable from period to period due to changes in the fair market value of the Company’s common stock (which is influenced by external factors like the volatility of public markets and the financial performance of the Company’s peers) and is not a key measure of the Company’s operations. • The Company’s management uses the non-GAAP financial measures: – as measures of operating performance, because they exclude the impact of items not directly resulting from the Company’s core operations; – for planning purposes, including the preparation of the Company’s annual operating budget; – to allocate resources to enhance the financial performance of the Company’s business; – to evaluate the effectiveness of the Company’s business strategies; and – in communications with the Company’s board of directors concerning the Company’s financial performance. ©2014 Total System Services, Inc.® Proprietary. All rights reserved worldwide. 22 |
 Consumer Credit 246.5 208.5 18.2 246.5 234.8 5.0 Retail 27.9 25.9 8.0 27.9 27.5 1.4 Total Consumer 274.4 234.4 17.1 274.4 262.3 4.6 Commercial 40.4 38.6 4.9 40.4 40.4 0.1 Other 20.4 15.3 32.7 20.4 19.7 3.4 Subtotal 335.2 288.3 16.3 335.2 322.4 4.0 Prepaid */ Stored Value 54.2 37.0 46.4 54.2 50.8 6.6 Government Services 65.6 60.6 8.4 65.6 63.0 4.3 Commercial Card Single Use 117.7 102.8 14.4 117.7 120.0 (2.0 ) Total AOF 572.7 488.7 17.2 572.7 556.2 3.0 Appendix: Accounts on File Portfolio Summary (in millions) Jun 2014 Jun 2013 % Change Jun 2014 Mar 2014 % Change 23 ©2014 Total System Services, Inc.® Proprietary. All rights reserved worldwide. (* - Prepaid does not include NetSpend accounts) |
 Appendix: Non-GAAP Reconciliation – Revenues Before Reimbursable Items Three Months Ended Six Months Ended Total Revenues $602,036 $461,860 $1,194,883 Reimbursable Items 63,969 60,931 124,065 Revenues Before Reimbursable Items $538,067 $400,929 $1,070,818 (in thousands) 24 ©2014 Total System Services, Inc.® Proprietary. All rights reserved worldwide. 6/30/13 6/30/14 6/30/13 6/30/14 $910,651 121,691 $788,960 |
 Appendix: Non-GAAP Reconciliation – Adjusted Segment Operating Income and Operating Margin Three Months Ended Six Months Ended Operating income $98,763 $94,642 $179,460 $169,163 Add: Acquisition intangible amort 24,282 7,879 48,595 16,411 Add: Corporate admin and other 36,875 27,792 69,883 57,984 Total segment adjusted operating income $159,920 $130,313 $297,938 $243,558 By segment: North America services (a) $84,578 $81,318 $159,155 $150,066 International services (b) $11,743 $7,693 $16,298 $14,554 Merchant services (c) $32,896 $41,302 $63,064 $78,938 NetSpend (d) $30,703 $ -- $59,421 $ -- Total revenues $602,036 $461,860 $1,194,883 $910,651 Reimbursable items (63,969) (60,931) (124,065) (121,691) Total segment revenues before reimbursable items $538,067 $400,929 $1,070,818 $788,960 Intersegment revenues 5,050 3,175 10,706 6,428 By segment: North America services (e) $233,217 $214,526 $457,585 $420,122 International services (f) $84,732 $76,626 $161,505 $153,013 Merchant services (g) $108,335 $112,952 $212,960 $222,253 NetSpend (h) $116,833 $ -- $249,473 $ -- Adjusted segment operating margin: North America services (a) / (e) 36.27% 37.91% 34.78% 35.72% International services (b) / (f) 13.86% 10.04% 10.09% 9.51% Merchant services (c) / (g) 30.37% 36.57% 29.61% 35.52% NetSpend (d) / (h) 26.28% na 23.82% na (in thousands) 25 ©2014 Total System Services, Inc.® Proprietary. All rights reserved worldwide. 6/30/14 6/30/13 6/30/14 6/30/13 |
 Six Months Ended 6/30/14 6/30/13 Percentage Change Three Months Ended 6/30/14 6/30/13 Percentage Change Appendix: Non-GAAP Reconciliation – Constant Currency (1) Reflects current period results on a non-GAAP basis as if foreign currency rates did not change from the comparable prior year period. (2) Reflects the impact of calculated changes in foreign currency rates from the comparable period. (in thousands) Consolidated: Constant Currency (1) $594,799 $461,860 28.8% $1,183,283 $910,651 29.9% Foreign Currency (2) 7,237 --- 11,600 --- Total Revenues $602,036 $461,860 30.4% $1,194,883 $910,651 31.2% International Services: Constant Currency (1) $83,300 $81,504 2.2% $161,434 $162,395 (0.6%) Foreign Currency (2) 7,166 --- 11,410 --- Total Revenues $90,466 $81,504 11.0% $172,844 $162,395 6.4% 26 ©2014 Total System Services, Inc.® Proprietary. All rights reserved worldwide. |
 Six Months Ended 6/30/14 6/30/13 Percentage Change Three Months Ended 6/30/14 6/30/13 Percentage Change Appendix: Non-GAAP Reconciliation – Constant Currency (1) Reflects current period results on a non-GAAP basis as if foreign currency rates did not change from the comparable prior year period. (2) Reflects the impact of calculated changes in foreign currency rates from the comparable period. (in thousands) 27 ©2014 Total System Services, Inc.® Proprietary. All rights reserved worldwide. Consolidated: Constant Currency (1) $531,303 $400,929 32.5% $1,060,004 $788,960 34.4% Foreign Currency (2) 6,764 --- 10,813 --- Revenues before reimbursable items $538,067 $400,929 34.2% $1,070,818 $788,960 35.7% International Services: Constant Currency (1) $78,039 $76,626 1.8% $150,882 $153,013 (1.4%) Foreign Currency (2) 6,693 --- 10,624 --- Revenues before reimbursable items $84,732 $76,626 10.6% $161,505 $153,013 5.6% |
 Appendix: Non-GAAP Reconciliation – EBITDA and Adjusted EBITDA (in thousands) 28 ©2014 Total System Services, Inc.® Proprietary. All rights reserved worldwide. Three Months Ended Six Months Ended Jun 2014 Jun 2013 Jun 2014 Jun 2013 Net income : As reported (GAAP) (a) $111,340 $60,561 $162,965 $119,710 Adjusted for: Deduct: Income from discontinued operations (50,133) (678) (51,113) (693) Deduct: Equity in Income of Equity Investments (3,600) (2,749) (7,696) (6,565) Add: Income Taxes 30,771 29,984 55,106 47,447 Add: Nonoperating expenses 10,386 7,524 20,198 9,264 Add: Depreciation and amortization 60,961 39,006 120,995 79,857 EBITDA $159,725 $133,648 $300,455 $249,020 Adjust for: Add: Share-based compensation 9,988 5,211 17,599 9,804 Add: NetSpend M&A expenses 1,181 1,246 2,435 4,727 Adjusted EBITDA $170,894 $140,105 $320,489 $263,551 |
 Appendix: Non-GAAP Reconciliation – Adjusted EPS (in thousands) 29 ©2014 Total System Services, Inc.® Proprietary. All rights reserved worldwide. Three Months Ended Six Months Ended Jun 2014 Jun 2013 Jun 2014 Jun 2013 Income from continuing operations available to TSYS Common Shareholders: As reported (GAAP) (a) $59,771 $58,096 $109,092 $116,000 Adjusted for amounts attributable to TSYS common shareholders (net of taxes): Acquisition intangible amortization 15,799 5,048 31,612 10,538 Share-based compensation 6,584 3,573 11,601 6,719 NetSpend M&A expenses 1,122 3,288 2,325 8,510 Adjusted earnings (b) $83,276 $70,005 $154,631 $141,767 Average common shares outstanding and participating securities (c) 186,373 187,738 187,058 187,277 Basic EPS Available to TSYS Common Shareholders (a) / (c) $0.32 $0.31 $0.58 $0.62 Adjusted EPS Available to TSYS Common Shareholders (b) / (c) $0.45 $0.37 $0.83 $0.76 |
 Appendix: Non-GAAP Reconciliation – EBITDA and Adjusted EBITDA Trailing Twelve Months Ended 6/30/2014 Net Income $299,853 Adjusted for: Deduct: Discontinued operations (52,476) Deduct: Equity in Income of Equity Investments (14,179) Add: Income Taxes 240,165 Add: Nonoperating expense 40,958 Add: Depreciation and Amortization 118,641 EBITDA $632,962 Adjust for: Share-based compensation 36,728 NetSpend M&A Operating Expenses* 11,341 Adjusted EBITDA $681,031 (in thousands) 30 ©2014 Total System Services, Inc.® Proprietary. All rights reserved worldwide. * Excludes share-based compensation |
 Appendix: Non-GAAP Reconciliation – Free Cash Flow Cash Flows from Operating Activities $534,593 Less: Purchase of Property and Equipment (64,048) Additions to Licensed Computer Software from Vendors (44,748) Additions to Internally Developed Computer Software (41,254) Additions to Contract Acquisition Costs (71,083) Free Cash Flow $313,460 (in thousands) 31 ©2014 Total System Services, Inc.® Proprietary. All rights reserved worldwide. Trailing Twelve Months Ended 6/30/2014 |