 2014 Third Quarter and YTD Results October 28, 2014 ©2014 Total System Services, Inc.® Proprietary. All rights reserved worldwide. Exhibit 99.2 |
 Forward-Looking Statements 2 This presentation and comments made by management contain forward- looking statements including, among others, statements regarding the expected future operating results of TSYS. These statements are based on management’s current expectations and assumptions and are subject to risks, uncertainties and changes in circumstances. Forward-looking statements include all statements that are not historical facts and can be identified by the use of forward-looking terminology such as the words “believe,” “expect,” “anticipate,” “intend,” “plan,” “potential”, “estimate” or similar expressions. Actual results may differ materially from those set forth in the forward-looking statements due to a variety of factors. More information about these risks, uncertainties and factors may be found in TSYS’ filings with the Securities and Exchange Commission, including its 2013 Annual Report on Form 10-K. TSYS does not assume any obligation to update any forward-looking statements as a result of new information, future developments or otherwise. ©2014 Total System Services, Inc.® Proprietary. All rights reserved worldwide. |
 ©2014 Total System Services, Inc.® Proprietary. All rights reserved worldwide. Use of Non-GAAP Financial Measures 3 This slide presentation contains certain non-GAAP financial measures determined by methods other than in accordance with generally accepted accounting principles. Such non-GAAP financial measures include the following: revenues before reimbursable items; operating margin excluding reimbursable items; revenues measured on a constant currency basis; free cash flow; EBITDA, adjusted EBITDA, adjusted earnings per share, adjusted segment operating income and adjusted segment operating margin. The most comparable GAAP measures to these measures are revenues; operating margin; revenues; cash flows from operating activities; net income; net income; earnings per share, operating income and operating margin, respectively. Management uses these non-GAAP financial measures to assess the performance of TSYS’ core business. TSYS believes that these non-GAAP financial measures provide meaningful additional information about TSYS to assist investors in evaluating TSYS’ operating results. These non-GAAP financial measures should not be considered as a substitute for operating results determined in accordance with GAAP and may not be comparable to other similarly titled measures of other companies. The computations of the non-GAAP financial measures used in this slide presentation are set forth in the Appendix to this slide presentation. |
 Troy Woods President & Chief Executive Officer ©2014 Total System Services, Inc.® Proprietary. All rights reserved worldwide. |
 Paul Todd Chief Financial Officer ©2014 Total System Services, Inc.® Proprietary. All rights reserved worldwide. |
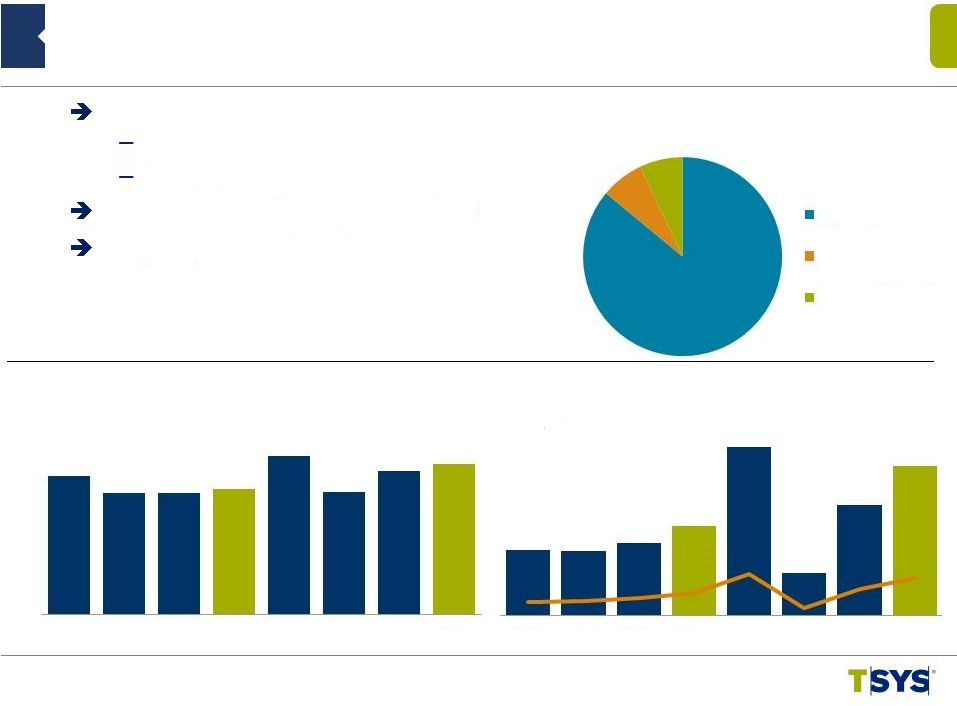
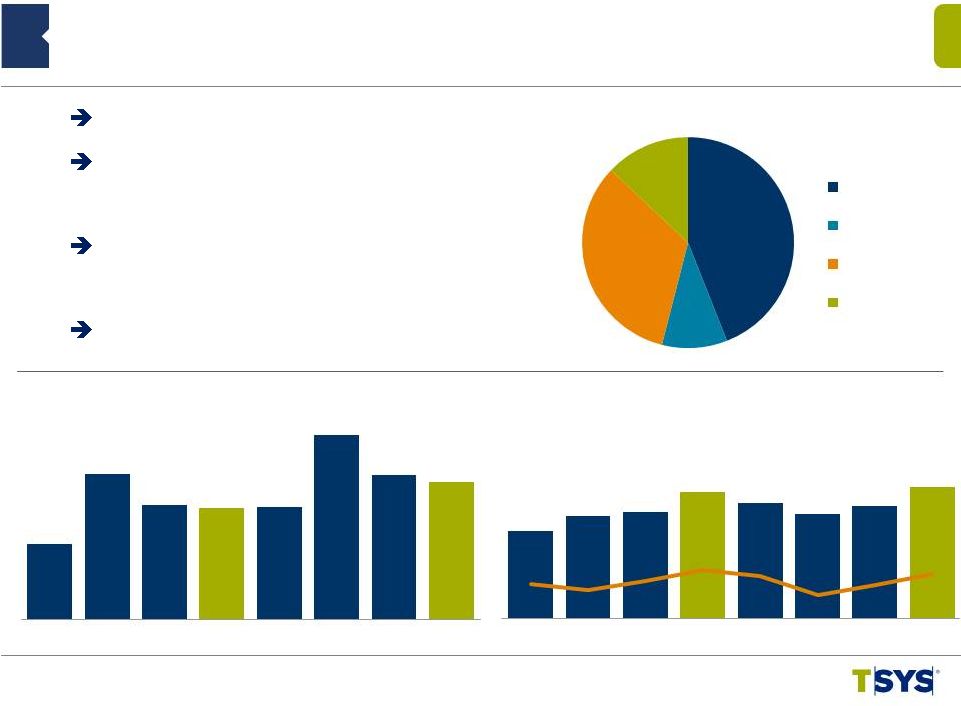
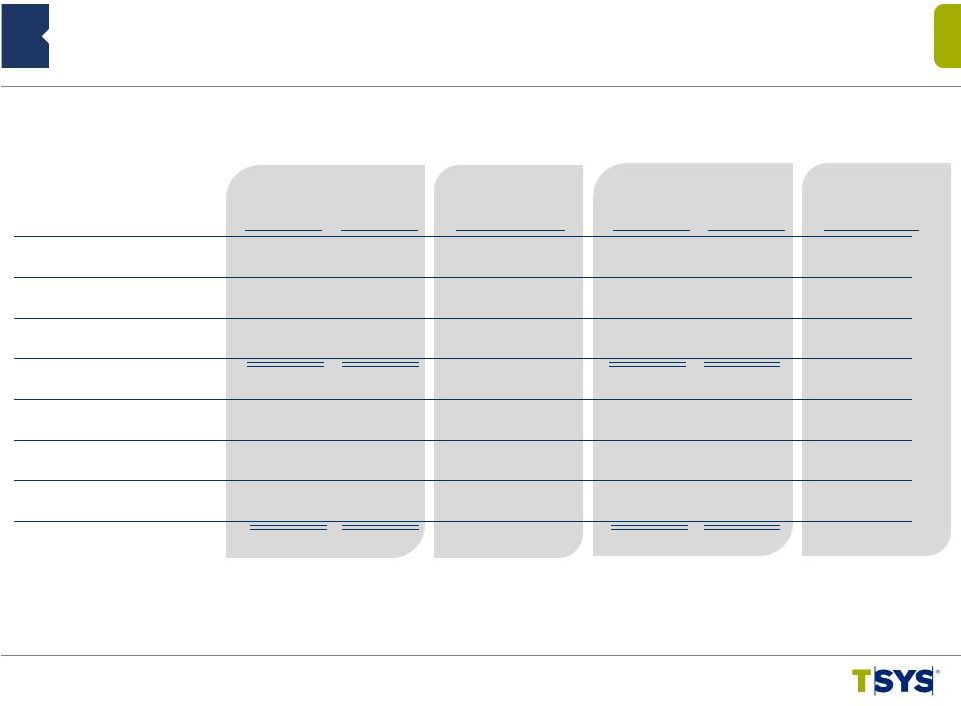
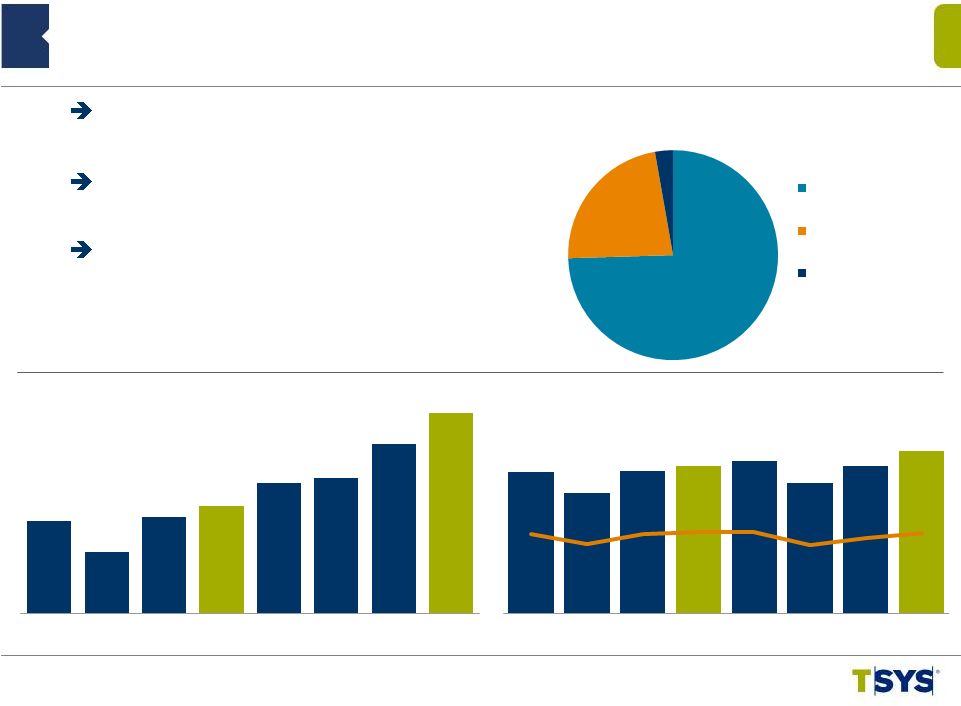 ©2014 Total System Services, Inc.® Proprietary. All rights reserved worldwide. 3Q 2014 North America Segment Highlights 6 ($ in millions) (*) Revenues Before Reimbursable Items ($ in millions) 1.9% 0.8% 4.4% 4.5% 6.8% Adjusted Segment Operating Income Operating Margin* (1) Includes Credit, Debit, Retail, Prepaid & Loyalty (2) Includes Healthcare 9.1% Largest Quarter of Segment Revenue in History, Excluding Termination Fees Double Digit YOY Revenue Growth – First Time Since 2006 Revenue Growth Benefiting from Conversions 8.7% 10.9% 4Q12 1Q13 2Q13 3Q13 4Q13 1Q14 2Q14 3Q14 4Q12 1Q13 2Q13 3Q13 4Q13 1Q14 2Q14 3Q14 4% Consumer (1) Commercial (2) Other 73% 23% $81.2 $68.7 $81.3 $84.4 $87.1 $74.6 $84.6 $92.7 38.0% 33.4% 37.9% 38.9% 39.0% 33.2% 36.3% 38.5% $213.6 $205.6 $214.5 $217.3 $223.3 $224.4 $233.2 $241.0 Segment Revenue* YOY Growth % Segment Revenue by Line of Business* |
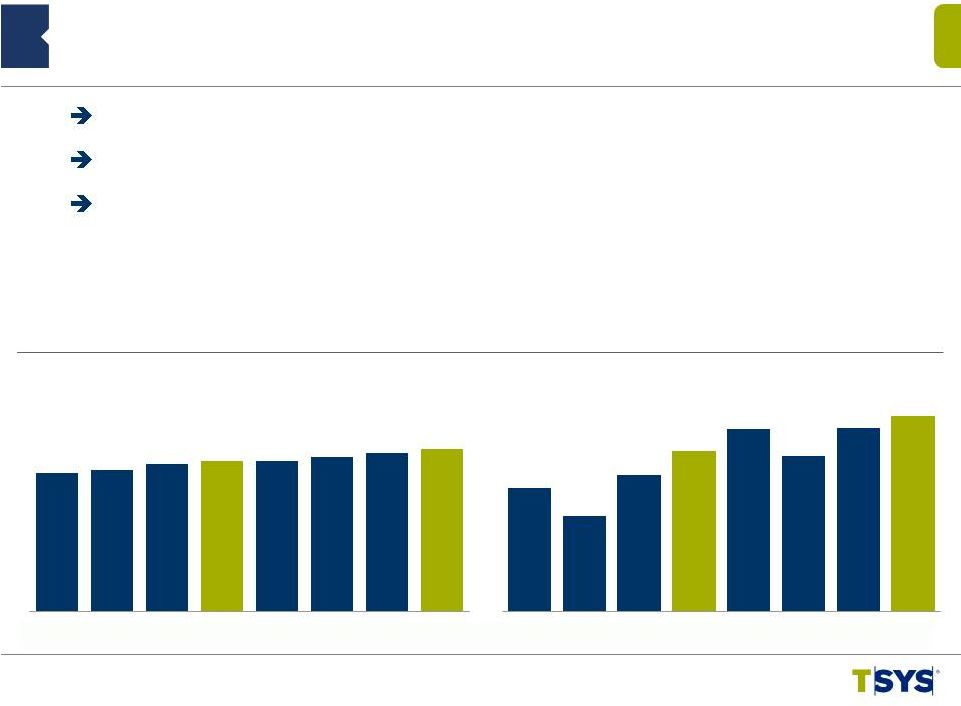
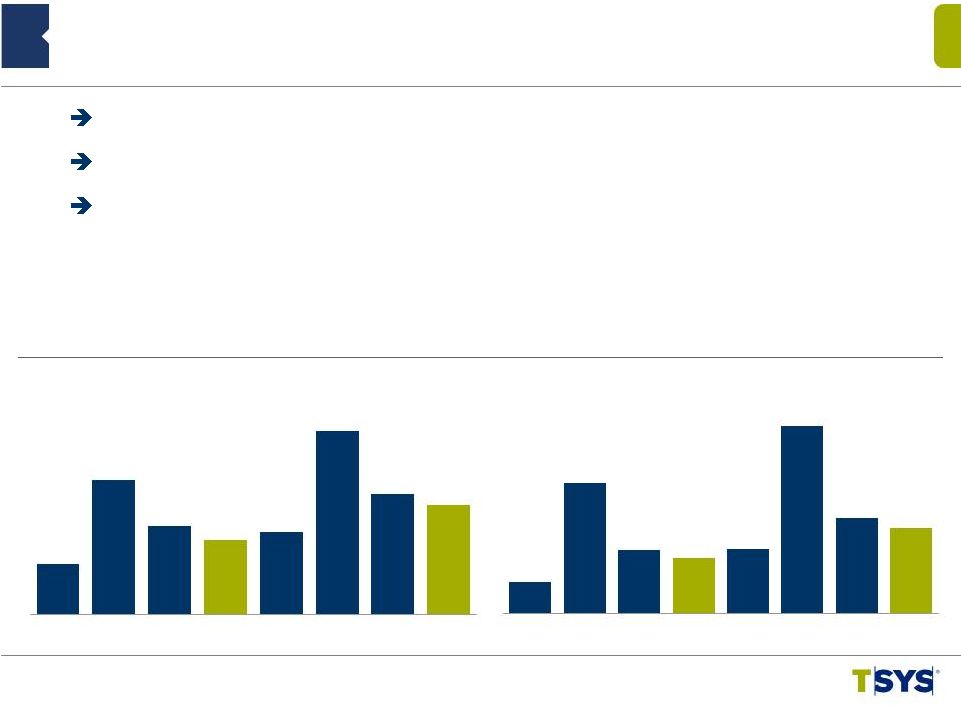
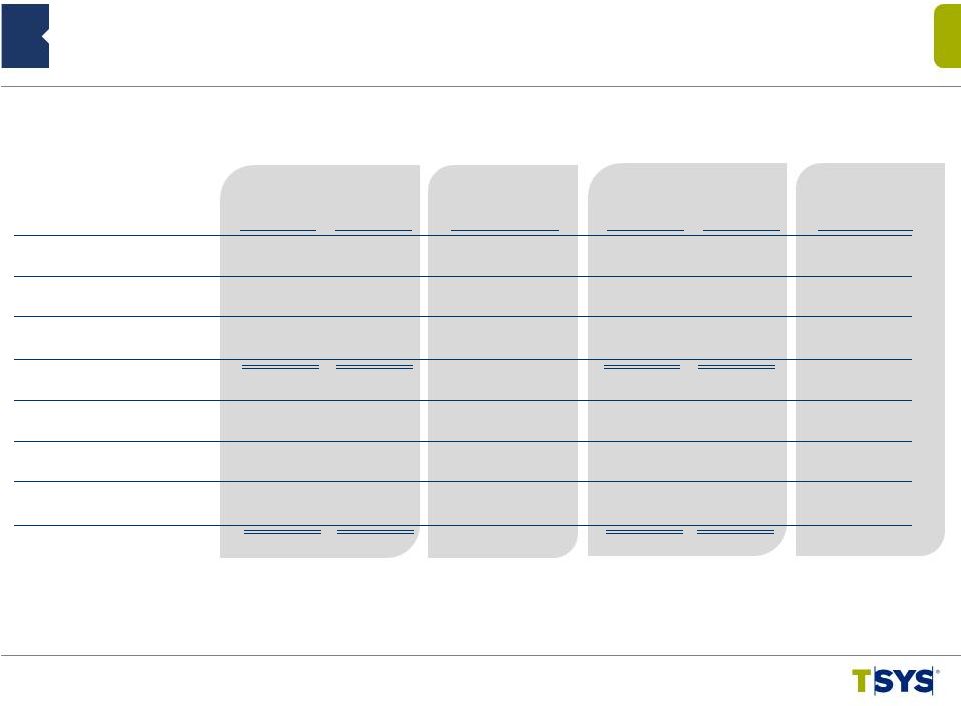
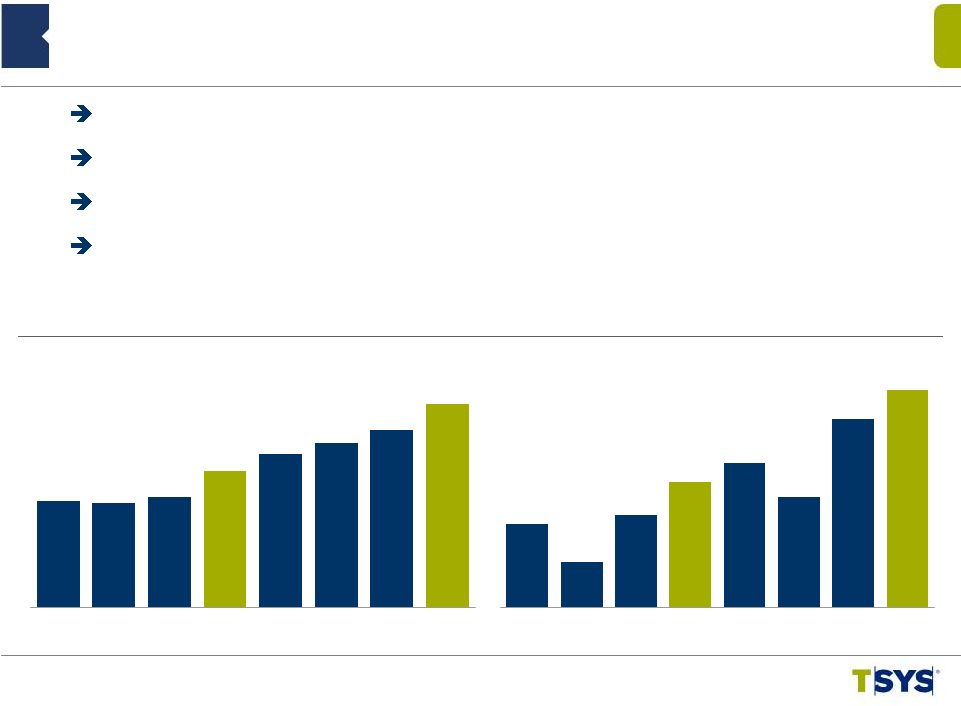 ©2014 Total System Services, Inc.® Proprietary. All rights reserved worldwide. 3Q 2014 North America Segment Highlights 7 (*) Growth Excluding Prepaid, Government Services and Single Use Accounts * (in millions) (in millions) 5.5% 5.2% 6.3% 16.2% 16.5% 20.9% 16.9% 11.2% 11.6% 13.4% 12.7% 7.8% 11.5% 17.6% 13.4% 15.6% 17.2% 17.1% Five Straight Quarters of Double Digit Growth in Traditional Accounts on File* Over 10M Accounts Converted in 3Q14 Largest Quarter of Transaction Volume in History at 2.8B Same Client Transactions up 12.6% 18.5% 19.1% 20.7% 17.4% 18.1% 18.3% 424.8 422.8 430.7 461.4 481.9 495.5 510.3 541.4 Accounts on File YOY Growth % 4Q12 1Q13 2Q13 3Q13 4Q13 1Q14 2Q14 3Q14 2,194.7 2,013.4 2,235.0 2,395.8 2,488.2 2,327.6 2,696.7 2,833.6 4Q12 1Q13 2Q13 3Q13 4Q13 1Q14 2Q14 3Q14 Transaction Volume YOY Growth % |
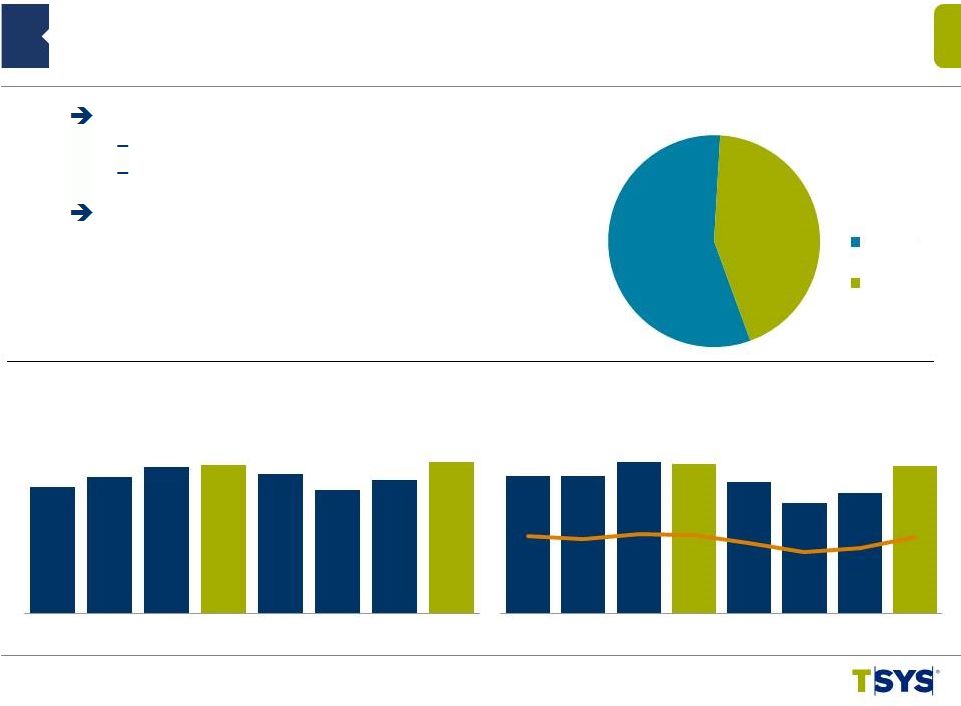
 Adjusted Segment Operating Income Operating Margin* 3Q 2014 International Segment Highlights 8 ($ in millions) Reported Constant Currency (*) Revenues Before Reimbursable Items ($ in millions) 1.1% (2.6%) (4.0%)` 0.7% 0.1% (0.9%) 3.1% 9.0% 8.6% 86% 0.5% (4.6%) Revenue $87.4M* – Up 12.2% Up 4.4% on Constant Currency $6.1M of Currency Benefit Positive Revenue Growth in All Regions Margin Improvement Continues (1.0%) 10.6% 1.8% 12.2% 4.4% ©2014 Total System Services, Inc.® Proprietary. All rights reserved worldwide. 8.4% 9.0% 10.0% 12.2% 19.9% 5.9% 13.9% 18.3% Segment Revenue by Region QTD Europe MEA Rest Of World 7% 7% $7.0 $6.9 $7.7 $9.5 $18.0 $4.6 $11.7 $16.0 4Q12 1Q13 2Q13 3Q13 4Q13 1Q14 2Q14 3Q14 $83.1 $76.4 $76.6 $77.9 $90.6 $76.8 $84.7 $87.4 4Q12 1Q13 2Q13 3Q13 4Q13 1Q14 2Q14 3Q14 Segment Revenue* YOY Growth % |
 ©2014 Total System Services, Inc.® Proprietary. All rights reserved worldwide. 3Q 2014 International Segment Highlights 9 (in millions) (in millions) 19.5% 14.2% 23.3% 26.7% 17.3% 19.3% AOF Grew 4.9M YOY Predominately Organic Transactions Grew 48.9M, or 9.3% YOY Same Client Transactions Grew 9.7% 13.4% 4.1% 3.7% 9.9% 12.1% 8.5% 8.9% 7.5% 8.1% 9.3% Accounts on File YOY Growth % Transaction Volume YOY Growth % 54.5 55.7 58.0 59.2 4Q12 1Q13 2Q13 3Q13 4Q13 1Q14 2Q14 3Q14 59.1 60.7 62.3 64.1 4Q12 1Q13 2Q13 3Q13 4Q13 1Q14 2Q14 3Q14 473.6 434.0 492.4 525.5 555.6 517.9 558.1 574.3 |
 ©2014 Total System Services, Inc.® Proprietary. All rights reserved worldwide. Revenues Before Reimbursables Increased 1.2% Direct Up 4% with Continued Focus on Growth Initiatives Indirect Down (2)% But Exceeding Expectations Second Quarter of Improved Operating Margin 3Q 2014 Merchant Segment Highlights 10 (*) Revenues Before Reimbursable Items ($ in millions) 5.5% 11.1% 15.6% 5.4% 4.3% ($ in millions) (4.3%) (4.1%) 1.2% Segment Revenue by Mix* QTD Direct Indirect 43% 57% Segment Revenue* YOY Growth % $105.9 $109.3 $113.0 $113.6 $110.4 $104.6 $108.3 $115.0 4Q12 1Q13 2Q13 3Q13 4Q13 1Q14 2Q14 3Q14 $37.7 $37.6 $41.3 $40.8 $36.0 $30.2 $32.9 $40.4 35.6% 34.4% 36.6% 35.9% 32.6% 28.8% 30.4% 35.1% 4Q12 1Q13 2Q13 3Q13 4Q13 1Q14 2Q14 3Q14 Adjusted Segment Operating Income Operating Margin* |
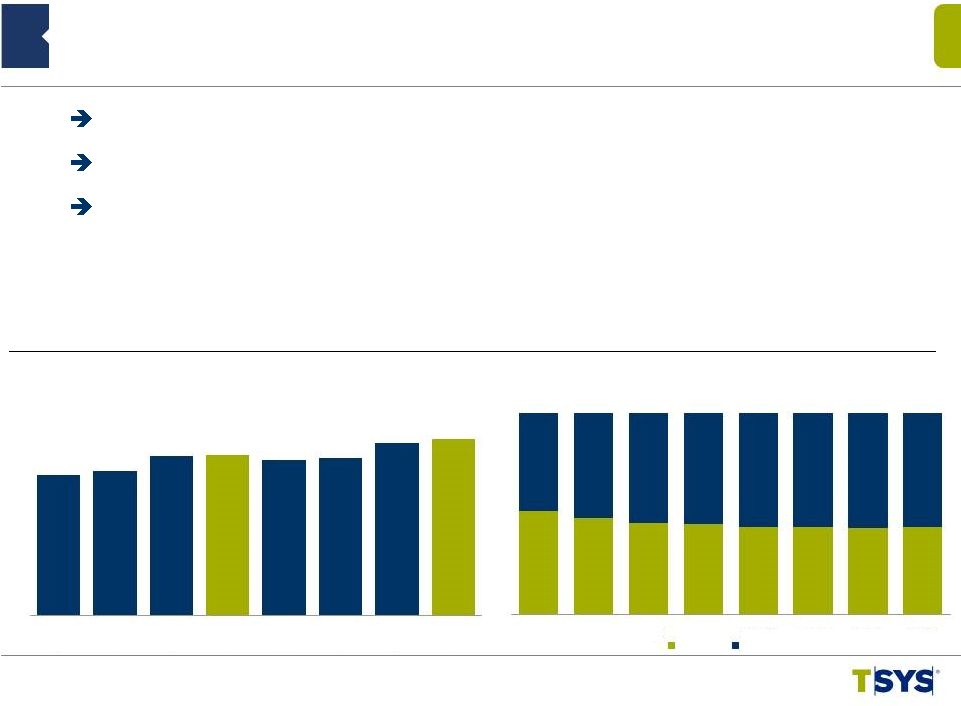 ©2014 Total System Services, Inc.® Proprietary. All rights reserved worldwide. 11 3Q 2014 Merchant Segment Highlights (*) Excludes Managed Accounts Segment Revenue by LOB YOY Growth % ($ in billions) 32.2% 35.3% 40.6% 22.0% 11.1% (12%) 45% 55% 26% 22% (11%) (12%) (12%) ($ in millions) 4% (14%) 9.3% POS Transactions Increased 4.3%, Excluding Deconverted Accounts SBS Sales Volume Up 10.0% Value Added Products Key Component Driving Revenue Growth 8.2% 1% (10%) 4% (2%) 10.0% $4.7 $4.8 $5.3 $5.3 $5.2 $5.3 $5.8 $5.9 4Q12 1Q13 2Q13 3Q13 4Q13 1Q14 2Q14 3Q14 SBS Sales Volume YOY Growth % $55 $51 $52 $51 $51 $48 $45 $46 $50 $57 $62 $63 $62 $59 $62 $65 4Q12 1Q13 2Q13 3Q13 4Q13 1Q14 2Q14 3Q14 Indirect Direct |
 ©2014 Total System Services, Inc.® Proprietary. All rights reserved worldwide. Adjusted Segment Operating Income* Segment Revenue YOY Growth % 3Q 2014 NetSpend Segment Highlights 12 ($ in millions) 10% 44% 33% 13% Revenue $114.0M – Up 10.0% Added 4k Distributing Locations and Employers Bringing the Total to Over 80k Launched Western Union Both in Retail and Direct Channels Rolled Out Paychex to Entire Salesforce ($ in millions) (*NOTE: Periods prior to the acquisition by TSYS have been restated ) $89.7 $117.3 $104.9 $103.7 $104.1 $132.6 $116.8 $114.0 16.9% 28.3% 22.9% 22.2% 16.1% 13.1% 11.4% 10.0% 4Q12 1Q13 2Q13 3Q13 4Q13 1Q14 2Q14 3Q14 Segment Revenue by Channel QTD Partner Retail Direct Paycard $23.9 $28.0 $29.3 $34.6 $31.7 $28.7 $30.7 $36.1 26.7% 23.9% 27.9% 33.4% 30.5% 21.7% 26.3% 31.7% 4Q12 1Q13 2Q13 3Q13 4Q13 1Q14 2Q14 3Q14 Operating Margin* |
 ©2014 Total System Services, Inc.® Proprietary. All rights reserved worldwide. 3Q 2014 NetSpend Segment Highlights 13 Gross Dollar Volume YOY Growth % Direct Deposit Active Cards YOY Growth % Direct Deposit Active Cards up 20.6% Gross Dollar Volume (GDV) up 16.6% Double Digit Growth in Direct Deposit Active Cards Across All Channels (in thousands) ($ in millions) 25.1% 66.7% 42.3% 23.8% 22.1% 18.2% 42.8% 30.1% 22.4% 21.2% 17.6% 20.6% 1,081.6 1,707.9 1,361.4 1,261.1 1,321.1 2,070.3 1,600.7 1,520.7 4Q12 1Q13 2Q13 3Q13 4Q13 1Q14 2Q14 3Q14 $3,265.4 $5,378.7 $3,947.9 $3,780.9 $3,967.6 $6,567.2 $4,628.0 $4,409.3 4Q12 1Q13 2Q13 3Q13 4Q13 1Q14 2Q14 3Q14 21.5% 22.1% 17.2% 16.6% |
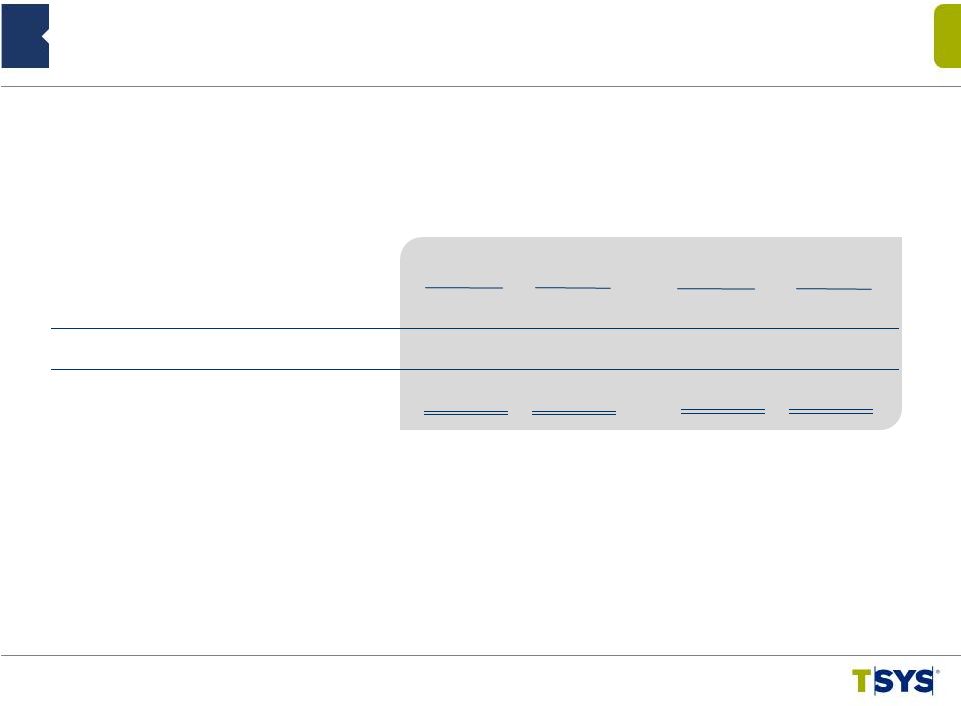
 ©2014 Total System Services, Inc.® Proprietary. All rights reserved worldwide. Consolidated Selected Financial Highlights 14 $616,891 $570,551 8.1% Total Revenues $1,811,774 $1,481,202 22.3% 552,860 509,488 8.5 Revenues Before Reimbursable Items 1,623,678 1,298,449 25.0 198,040 179,446 10.4 Adjusted EBITDA* 518,529 442,996 17.1 $0.56 $0.49 12.5 Adjusted EPS* from Continuing Operations $1.38 $1.25 10.4 (in thousands, except per share data) 3 rd Qtr 2014 3 rd Qtr 2013 Percent Change YTD 2014 YTD 2013 Percent Change (*) Adjusted EBITDA and Adjusted EPS definitions are contained in Appendix |
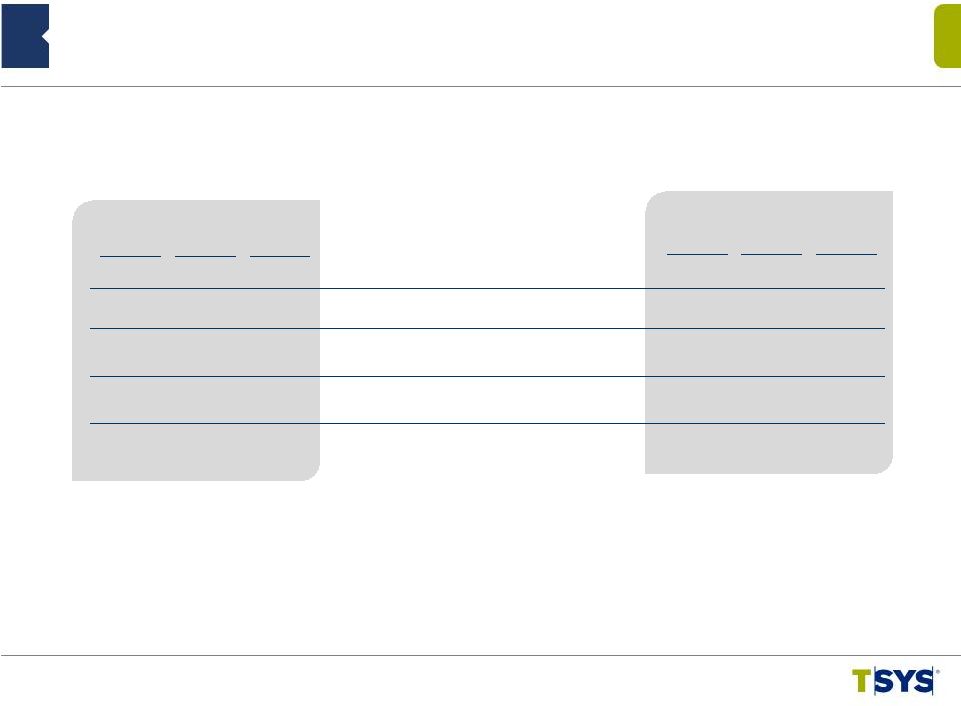
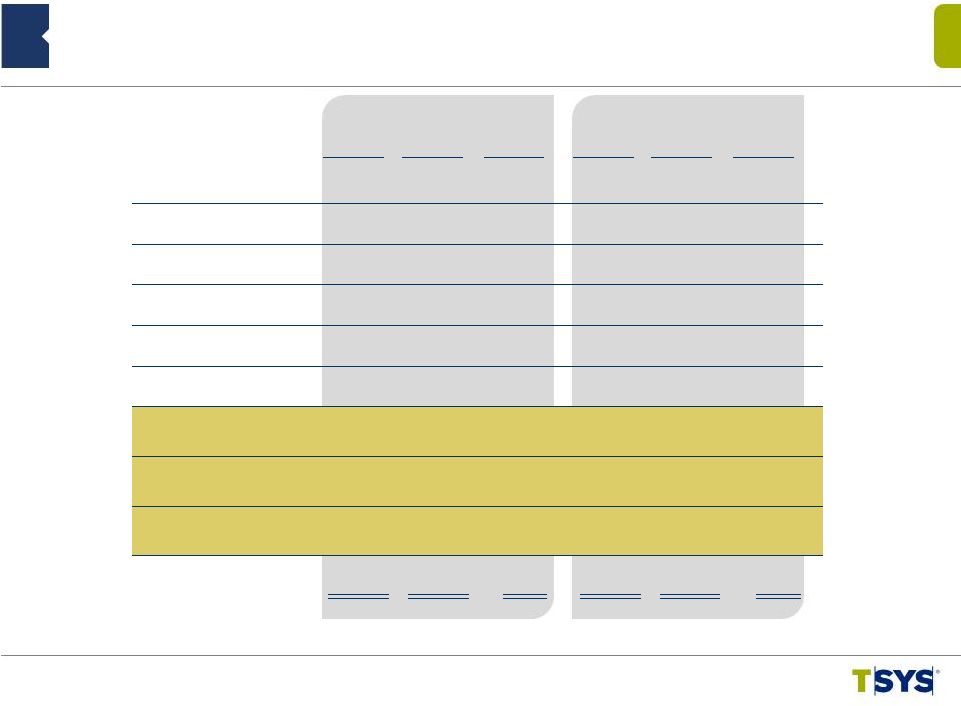
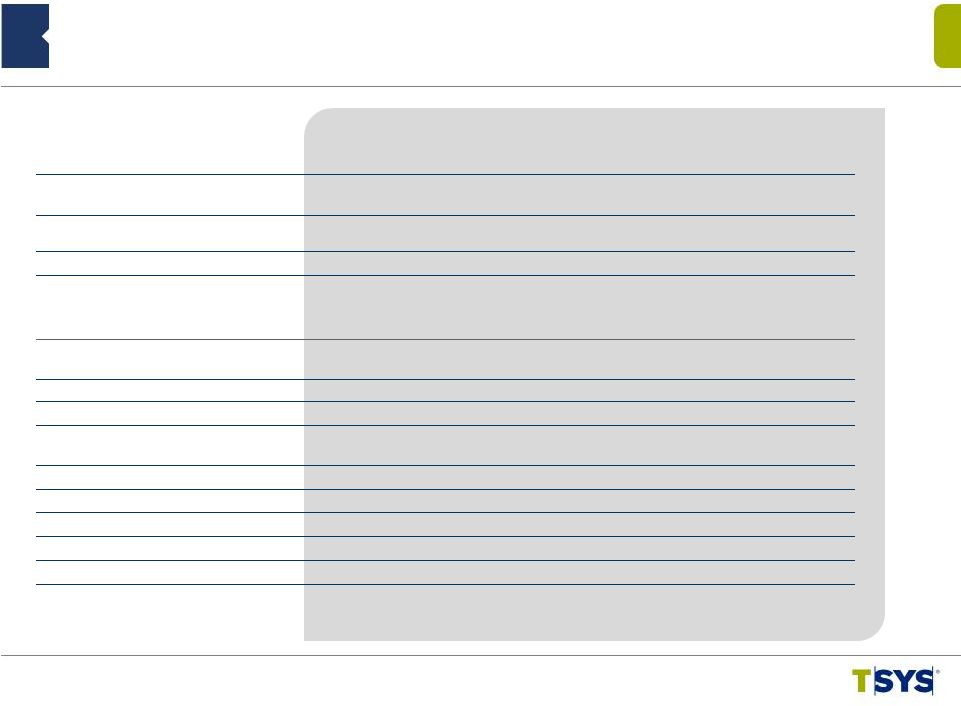
 ©2014 Total System Services, Inc.® Proprietary. All rights reserved worldwide. Revenues before Reimbursable Items Adjusted Operating Margin Adjusted Segment Operating Income North America $92,736 $240,957 38.49% International 15,976 87,385 18.28% Merchant 40,409 115,012 35.13% NetSpend 36,123 114,048 31.67% Eliminations -- (4,542) Corporate administration excluding stock comp (25,428) -- Adjusted operating margin $159,816 $552,860 28.91% Amortization of acquisition intangibles (24,210) NetSpend M&A expenses (779) Stock-based compensation (5,420) Operating income (US GAAP) $129,407 Segment Operating Margin and Consolidated Adjusted Operating Margin (in thousands) 15 Three Months Ended September 30, 2014 |
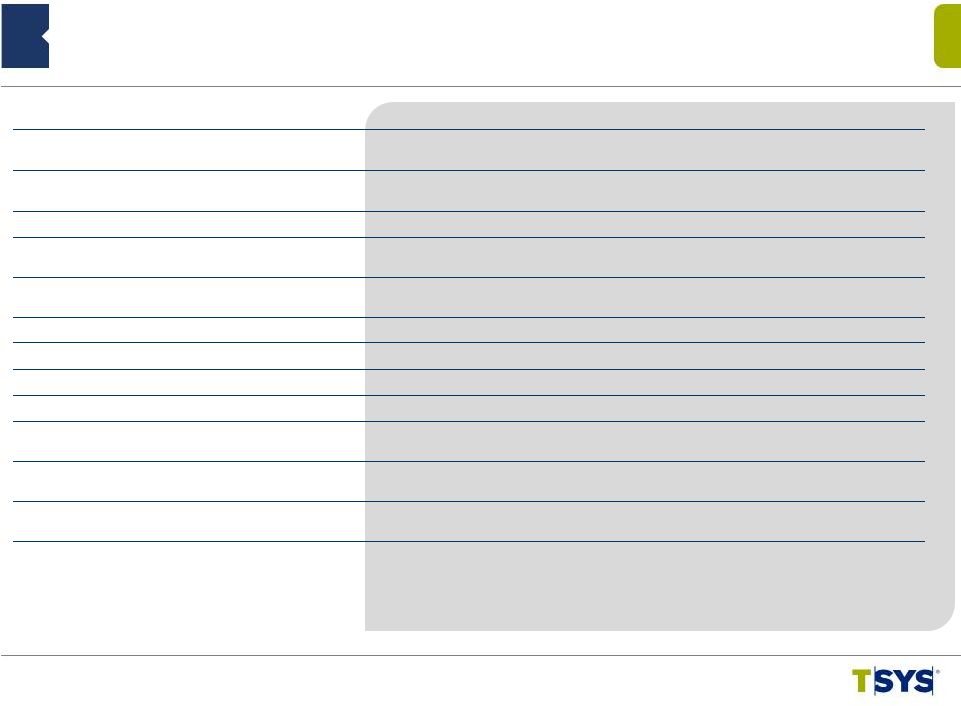
 ©2014 Total System Services, Inc.® Proprietary. All rights reserved worldwide. Revenues before Reimbursable Items Adjusted Operating Margin Adjusted Segment Operating Income North America $251,892 $698,543 36.06% International 32,274 248,890 12.97% Merchant 103,473 327,972 31.55% NetSpend 95,543 363,521 26.28% Eliminations -- (15,248) Corporate administration excluding stock comp (75,278) -- Adjusted operating margin $407,904 $1,623,678 25.12% Amortization of acquisition intangibles (72,805) NetSpend M&A expenses (3,213) Stock-based compensation (23,019) Operating income (US GAAP) $308,867 Segment Operating Margin and Consolidated Adjusted Operating Margin (in thousands) 16 Nine Months Ended September 30, 2014 |
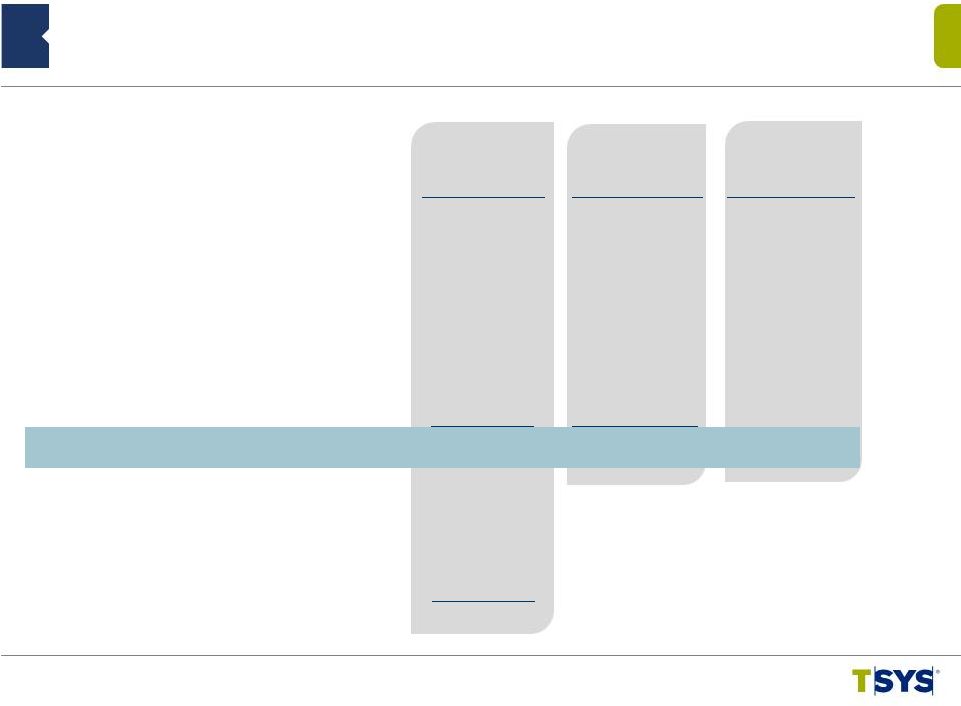
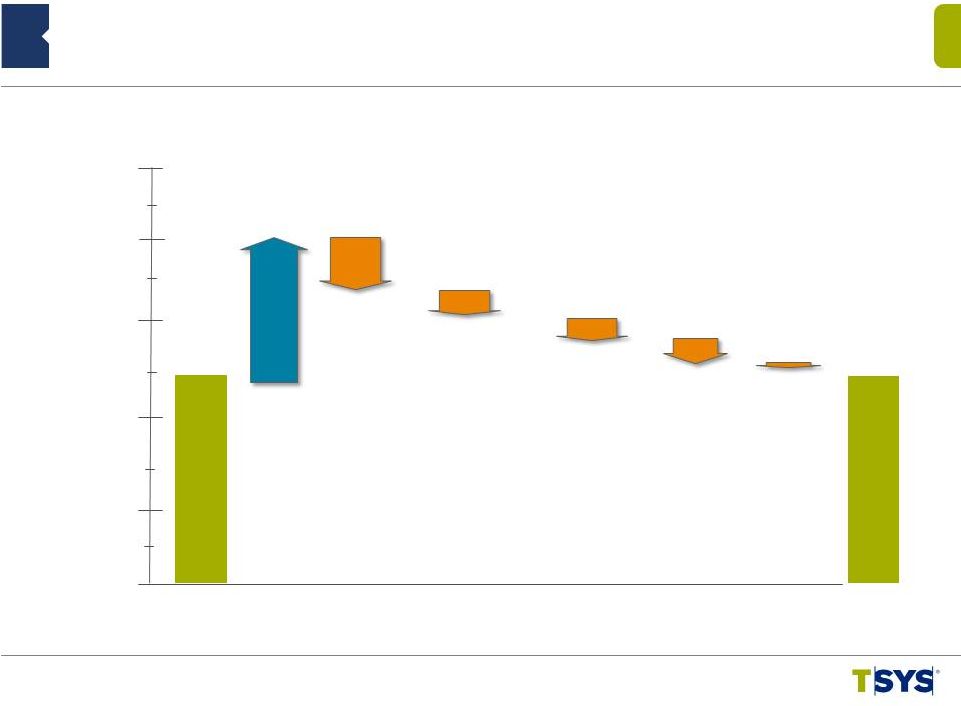 ©2014 Total System Services, Inc.® Proprietary. All rights reserved worldwide. Rollforward of Quarterly Cash Balance $200 $500 $100 $0 $300 Operating Activities $151 Cap Ex ($62) Debt Pmts ($14) Dividends ($19) Other ($2) Ending Balance $266 (in millions) 6/30/2014 9/30/2014 17 $400 Acquisition ($39) Beginning Balance $251 |
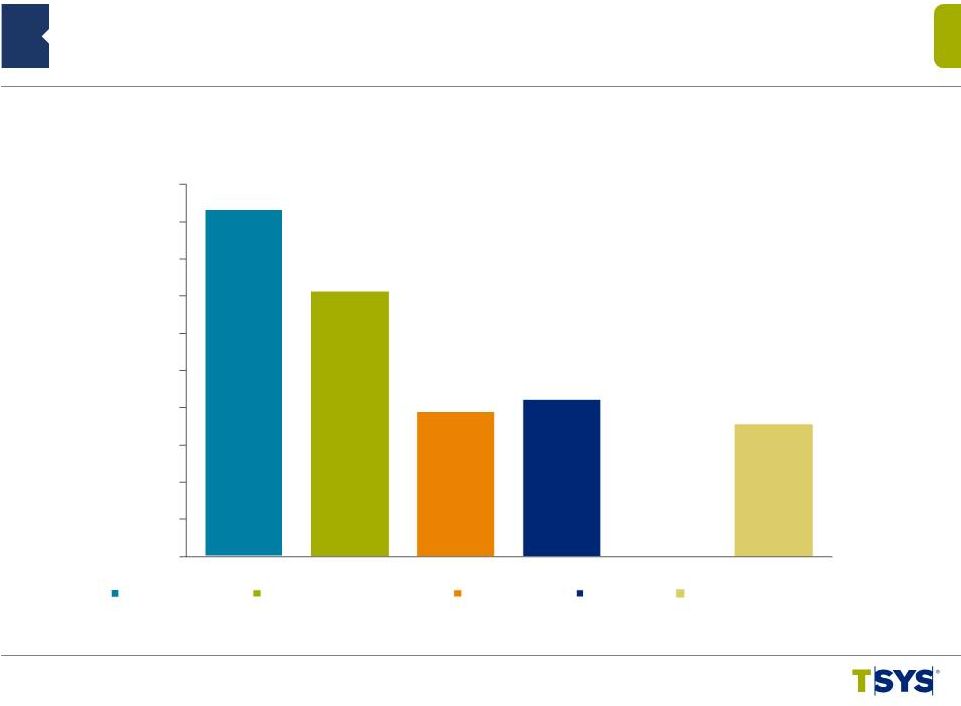 ©2014 Total System Services, Inc.® Proprietary. All rights reserved worldwide. Cash Flow Strength: 2014 TTM Consolidated Financial Highlights 18 TTM = Trailing Twelve Months (in millions) $700 $535 $292 $318 $266 $0 $75 $150 $225 $300 $375 $450 $525 $600 $675 $750 Adjusted EBITDA Cash flow from operations Free cash flow Net income Ending cash |
 Q&A ©2014 Total System Services, Inc.® Proprietary. All rights reserved worldwide. |
 Appendix ©2014 Total System Services, Inc.® Proprietary. All rights reserved worldwide. |
 ©2014 Total System Services, Inc.® Proprietary. All rights reserved worldwide. Appendix: Non-GAAP Items – Adjusted EBITDA and Adjusted EPS • Adjusted EBITDA is net income excluding equity in income of equity investments, nonoperating income/(expense), taxes, depreciation, amortization and stock-based compensation expenses and NetSpend merger & acquisition expenses. • Adjusted EPS is adjusted earnings divided by weighted average shares outstanding used for basic EPS calculations. Adjusted earnings is net income excluding the after-tax impact of stock-based compensation expenses, amortization of acquisition intangibles, and NetSpend merger & acquisition expenses. • Adjusted segment operating income is operating income at the segment level adjusted for amortization of acquisition intangibles. • Adjusted segment operating margin is adjusted segment operating income divided by segment revenues before reimbursable items. • The Company believes that these non-GAAP financial measures it presents are useful to investors in evaluating the Company’s operating performance for the following reasons: – adjusted EBITDA and adjusted EPS are widely used by investors to measure a company’s operating performance without regard to items, such as interest expense, income tax expense, depreciation and amortization, merger and acquisition expenses and employee stock-based compensation expense that can vary substantially from company to company depending upon their respective financing structures and accounting policies, the book values of their assets, their capital structures and the methods by which their assets were acquired; and – securities analysts use adjusted EBITDA and adjusted EPS as supplemental measures to evaluate the overall operating performance of companies. • By comparing the Company’s adjusted EBITDA and adjusted EPS in different historical periods, investors can evaluate the Company’s operating results without the additional variations caused by employee stock-based compensation expense, which may not be comparable from period to period due to changes in the fair market value of the Company’s common stock (which is influenced by external factors like the volatility of public markets and the financial performance of the Company’s peers) and is not a key measure of the Company’s operations. • The Company’s management uses the non-GAAP financial measures: – as measures of operating performance, because they exclude the impact of items not directly resulting from the Company’s core operations; – for planning purposes, including the preparation of the Company’s annual operating budget; – to allocate resources to enhance the financial performance of the Company’s business; – to evaluate the effectiveness of the Company’s business strategies; and – in communications with the Company’s board of directors concerning the Company’s financial performance. 21 |
 ©2014 Total System Services, Inc.® Proprietary. All rights reserved worldwide. Consumer Credit 263.9 224.1 17.8 263.9 246.5 7.1 Retail 28.4 26.8 5.8 28.4 27.9 1.5 Total Consumer 292.3 250.9 16.5 292.3 274.4 6.5 Commercial 41.5 38.8 6.9 41.5 40.4 2.8 Other 21.2 16.9 25.3 21.2 20.4 4.0 Subtotal 355.0 306.6 15.8 355.0 335.2 5.9 Prepaid*/ Stored Value 125.1 110.7 13.0 125.1 117.7 6.4 Government Services 66.7 61.6 8.1 66.7 65.6 1.5 Commercial Card Single Use 58.7 41.7 41.0 58.7 54.2 8.4 Total AOF 605.5 520.6 16.3 605.5 572.7 5.7 Appendix: Accounts on File Portfolio Summary (in millions) 22 (* - Prepaid does not include NetSpend accounts) Sep 2014 Sep 2013 % Change Sep 2014 Jun 2014 % Change |
 ©2014 Total System Services, Inc.® Proprietary. All rights reserved worldwide. Appendix: Non-GAAP Reconciliation – Revenues Before Reimbursable Items (in thousands) 23 Three Months Ended 9/30/14 9/30/14 Nine Months Ended 9/30/13 9/30/13 Total Revenues $616,891 $570,551 $1,811,774 $1,481,202 Reimbursable Items 64,031 61,063 188,096 182,753 Revenues Before Reimbursable Items $552,860 $509,488 $1,623,678 $1,298,449 |
 ©2014 Total System Services, Inc.® Proprietary. All rights reserved worldwide. Appendix: Non-GAAP Reconciliation – Adjusted Segment Operating Income and Operating Margin Three Months Ended Nine Months Ended Operating income $129,407 $104,479 $308,867 $273,642 Add: Acquisition intangible amort 24,210 24,731 72,805 41,142 Add: Corporate admin and other 31,627 40,130 101,510 98,114 Total segment adjusted operating income $185,244 $169,340 $483,182 $412,898 By segment: North America services (a) $92,736 $84,443 $251,892 $234,509 International services (b) $15,976 $9,528 $32,274 $24,082 Merchant services (c) $40,409 $40,753 $103,473 $119,691 NetSpend (d) $36,123 $34,616 $95,543 $34,616 Total revenues $616,891 $570,551 $1,811,774 $1,481,202 Reimbursable items (64,031) (61,063) (188,096) (182,753) Total segment revenues before reimbursable items $552,860 $509,488 $1,623,678 $1,298,449 Intersegment revenues 4,542 3,001 15,248 9,428 By segment: North America services (e) $240,957 $217,257 $698,543 $637,379 International services (f) $87,385 $77,876 $248,890 $230,889 Merchant services (g) $115,012 $113,650 $327,972 $335,903 NetSpend (h) $114,048 $103,706 $363,521 $103,706 Adjusted segment operating margin: North America services (a) / (e) 38.49% 38.87% 36.06% 36.79% International services (b) / (f) 18.28% 12.23% 12.97% 10.43% Merchant services (c) / (g) 35.13% 35.86% 31.55% 35.63% NetSpend (d) / (h) 31.67% 33.38% 26.28% 33.38% (in thousands) 24 9/30/13 9/30/14 9/30/13 9/30/14 |
 ©2014 Total System Services, Inc.® Proprietary. All rights reserved worldwide. Nine Months Ended 9/30/14 9/30/13 Percentage Change Three Months Ended 9/30/14 9/30/13 Percentage Change Appendix: Non-GAAP Reconciliation – Constant Currency (1) Reflects current period results on a non-GAAP basis as if foreign currency rates did not change from the comparable prior year period. (2) Reflects the impact of calculated changes in foreign currency rates from the comparable period. (in thousands) Consolidated: Constant Currency (1) $610,554 $570,551 7.0% $1,793,838 $1,481,202 21.1% Foreign Currency (2) 6,337 --- 17,936 --- Total Revenues $616,891 $570,551 8.1% $1,811,774 $1,481,202 22.3% International Services: Constant Currency (1) $85,506 $83,025 3.0% $246,940 $245,420 0.6% Foreign Currency (2) 6,359 --- 17,770 --- Total Revenues $91,865 $83,025 10.6% $264,710 $245,420 7.9% 25 |
 ©2014 Total System Services, Inc.® Proprietary. All rights reserved worldwide. Nine Months Ended 9/30/14 9/30/13 Percentage Change Three Months Ended 9/30/14 9/30/13 Percentage Change Appendix: Non-GAAP Reconciliation – Constant Currency (1) Reflects current period results on a non-GAAP basis as if foreign currency rates did not change from the comparable prior year period. (2) Reflects the impact of calculated changes in foreign currency rates from the comparable period. (in thousands) 26 Consolidated: Constant Currency (1) $546,782 $509,488 7.3% $1,606,786 $1,298,449 23.7% Foreign Currency (2) 6,078 --- 16,892 --- Revenues before reimbursable items $552,860 $509,488 8.5% $1,623,678 $1,298,449 25.0% International Services: Constant Currency (1) $81,284 $77,876 4.4% $232,166 $230,889 0.6% Foreign Currency (2) 6,101 --- 16,725 --- Revenues before reimbursable items $87,385 $77,876 12.2% $248,890 $230,889 7.8% |
 ©2014 Total System Services, Inc.® Proprietary. All rights reserved worldwide. Appendix: Non-GAAP Reconciliation – EBITDA and Adjusted EBITDA (in thousands) 27 Three Months Ended Nine Months Ended Sep 2014 Sep 2013 Sep 2014 Sep 2013 Net income : As reported (GAAP) (a) $85,198 $67,494 $248,163 $187,205 Adjusted for: Deduct: Income from discontinued operations (880) (611) (51,993) (1,305) Deduct: Equity in Income of Equity Investments (4,135) (2,792) (11,831) (9,357) Add: Income Taxes 39,227 30,100 94,333 77,547 Add: Nonoperating expenses 9,997 10,288 30,195 19,552 Add: Depreciation and amortization 62,434 57,901 183,430 137,758 EBITDA $191,841 $162,380 $492,297 $411,400 Adjust for: Add: Share-based compensation 5,420 9,784 23,019 19,587 Add: NetSpend M&A expenses 779 7,282 3,213 12,009 Adjusted EBITDA $198,040 $179,446 $518,529 $442,996 |
 ©2014 Total System Services, Inc.® Proprietary. All rights reserved worldwide. Appendix: Non-GAAP Reconciliation – Adjusted EPS (in thousands) 28 Three Months Ended Nine Months Ended Sep 2014 Sep 2013 Sep 2014 Sep 2013 Income from continuing operations available to TSYS Common Shareholders: As reported (GAAP) (a) $82,925 $64,834 $192,018 $180,835 Adjusted for amounts attributable to TSYS common shareholders (net of taxes): Acquisition intangible amortization 15,762 16,595 47,374 27,134 Share-based compensation 3,573 6,706 15,174 13,425 NetSpend M&A expenses 786 5,424 3,111 13,934 Adjusted earnings (b) $103,046 $93,559 $257,677 $235,328 Average common shares outstanding and participating securities (c) 185,577 189,525 186,559 188,035 Basic EPS Available to TSYS Common Shareholders (a) / (c) $0.45 $0.34 $1.03 $0.96 Adjusted EPS Available to TSYS Common Shareholders (b) / (c) $0.56 $0.49 $1.38 $1.25 |
 ©2014 Total System Services, Inc.® Proprietary. All rights reserved worldwide. Appendix: Non-GAAP Reconciliation – EBITDA and Adjusted EBITDA Trailing Twelve Months Ended 9/30/2014 Net Income $317,556 Adjusted for: Deduct: Discontinued operations (52,744) Deduct: Equity in Income of Equity Investments (15,522) Add: Income Taxes 127,767 Add: Nonoperating expense 40,668 Add: Depreciation and Amortization 244,698 EBITDA $662,423 Adjust for: Share-based compensation 32,364 NetSpend M&A Operating Expenses* 4,838 Adjusted EBITDA $699,625 (in thousands) 29 * Excludes share-based compensation |
 ©2014 Total System Services, Inc.® Proprietary. All rights reserved worldwide. Appendix: Non-GAAP Reconciliation – Free Cash Flow Trailing Twelve Months Ended 9/30/2014 (in thousands) 30 Cash Flows from Operating Activities $535,028 Less: Purchase of Property and Equipment (71,057) Additions to Licensed Computer Software from Vendors (44,814) Additions to Internally Developed Computer Software (41,250) Additions to Contract Acquisition Costs (85,682) Free Cash Flow $292,225 |