Free signup for more
- Track your favorite companies
- Receive email alerts for new filings
- Personalized dashboard of news and more
- Access all data and search results
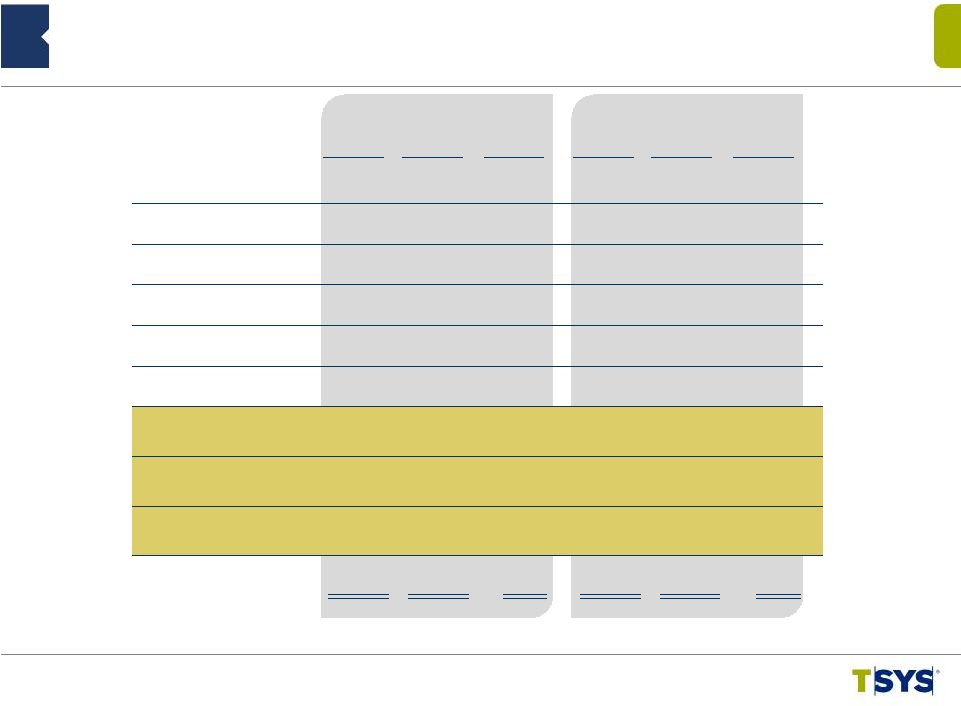
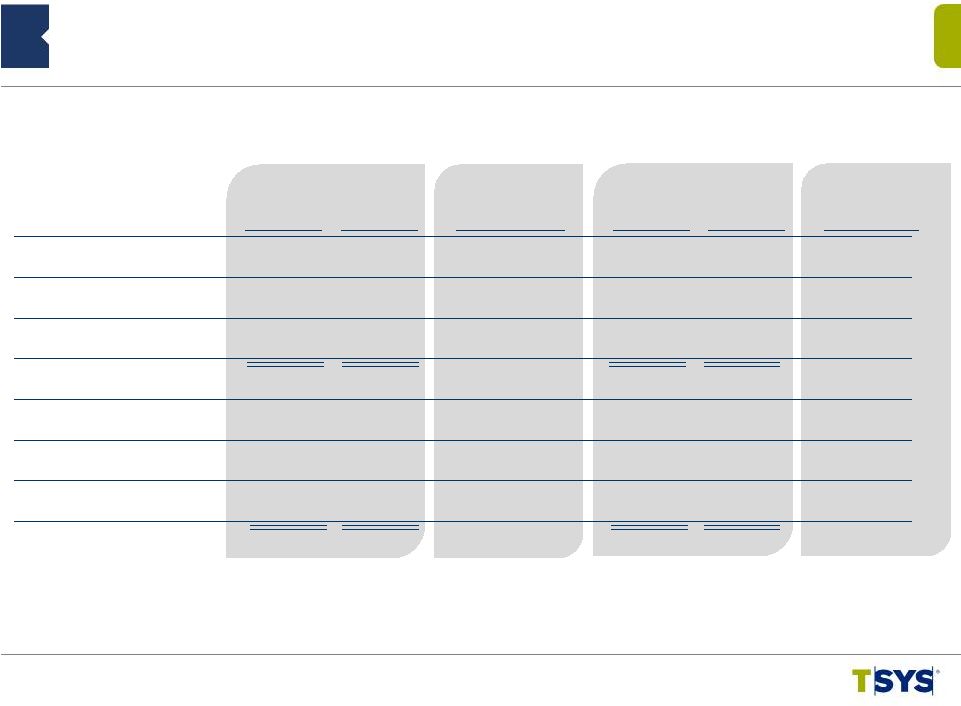
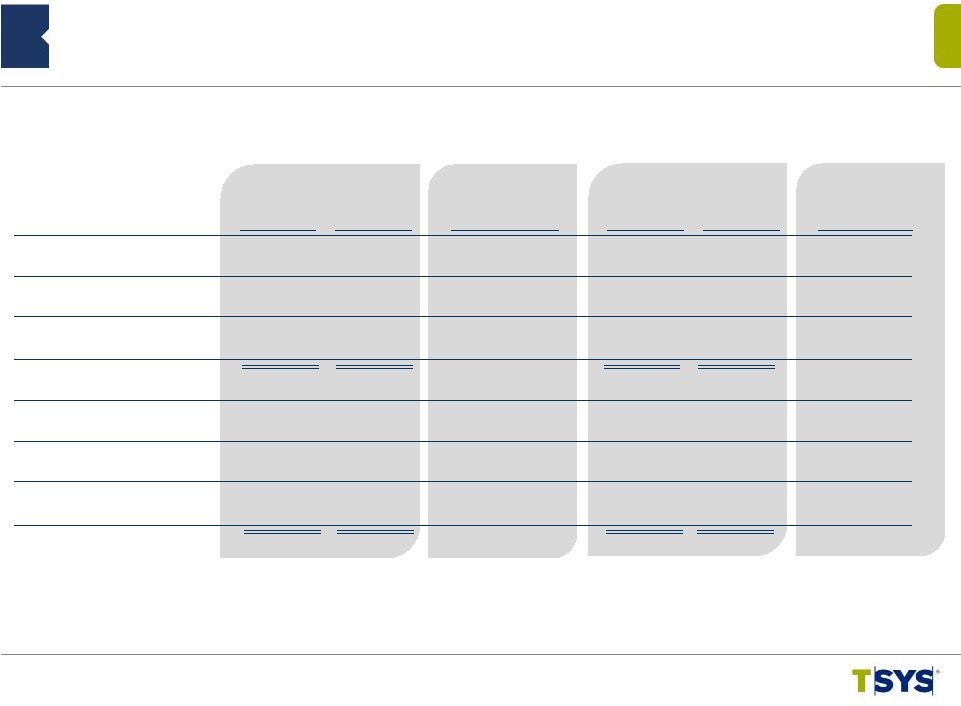
Filing tables
Filing exhibits
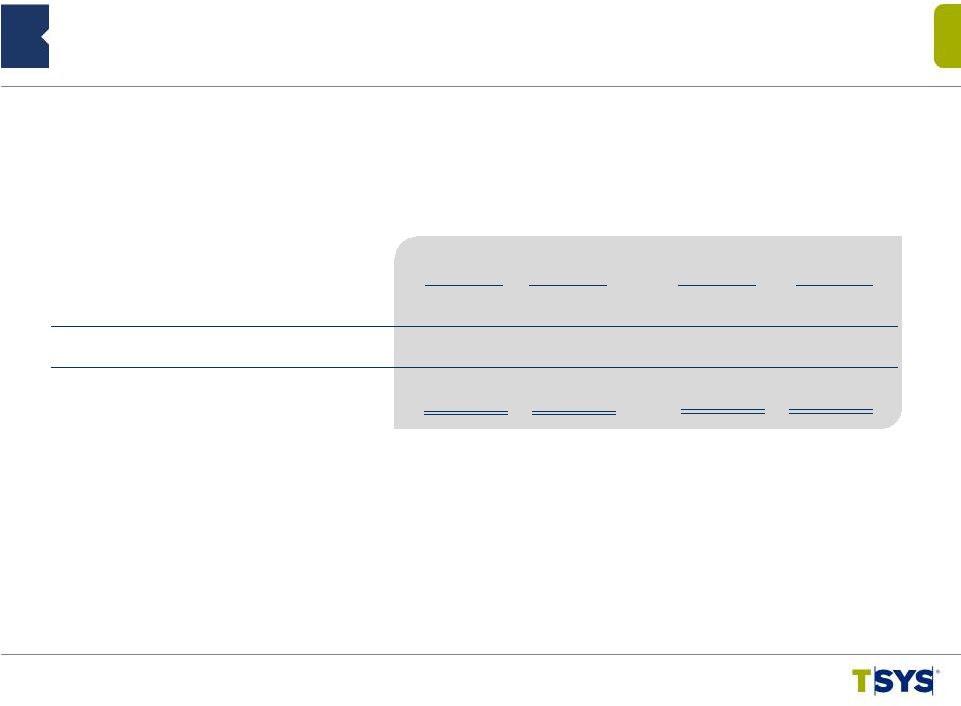
Related financial report
TSS similar filings
- 29 Apr 15 Submission of Matters to a Vote of Security Holders
- 28 Apr 15 Results of Operations and Financial Condition
- 26 Mar 15 Departure of Directors or Certain Officers
- 27 Jan 15 Results of Operations and Financial Condition
- 28 Oct 14 Results of Operations and Financial Condition
- 22 Jul 14 Results of Operations and Financial Condition
- 23 Jun 14 Departure of Directors or Certain Officers
Filing view
External links