 2015 First Quarter and YTD Results April 28, 2015 Exhibit 99.2 © 2015 Total System Services, Inc.® All rights reserved worldwide. |
 2015 First Quarter and YTD Results This presentation and comments made by management contain forward-looking statements including, among others, statements regarding the expected future operating results of TSYS. These statements are based on management’s current expectations and assumptions and are subject to risks, uncertainties and changes in circumstances. Forward-looking statements include all statements that are not historical facts and can be identified by the use of forward-looking terminology such as the words “believe,” “expect,” “anticipate,” “intend,” “plan,” “potential,” “estimate” or similar expressions. Actual results may differ materially from those set forth in the forward-looking statements due to a variety of factors. More information about these risks, uncertainties and factors may be found in TSYS’ filings with the Securities and Exchange Commission, including its 2014 Annual Report on Form 10-K. TSYS does not assume any obligation to update any forward-looking statements as a result of new information, future developments or otherwise. 2 > FORWARD-LOOKING STATEMENTS © 2015 Total System Services, Inc.® All rights reserved worldwide. |
 © 2015 Total System Services, Inc.® All rights reserved worldwide. 2015 First Quarter and YTD Results This slide presentation contains certain non-GAAP financial measures determined by methods other than in accordance with generally accepted accounting principles. Such non-GAAP financial measures include the following: revenues before reimbursable items; operating margin excluding reimbursable items; revenues measured on a constant currency basis; free cash flow; EBITDA, adjusted EBITDA, adjusted earnings per share, adjusted segment operating income and adjusted segment operating margin. The most comparable GAAP measures to these measures are revenues; operating margin; revenues; cash flows from operating activities; net income; net income; earnings per share, operating income and operating margin, respectively. Management uses these non-GAAP financial measures to assess the performance of TSYS’ core business. TSYS believes that these non-GAAP financial measures provide meaningful additional information about TSYS to assist investors in evaluating TSYS’ operating results. These non-GAAP financial measures should not be considered as a substitute for operating results determined in accordance with GAAP and may not be comparable to other similarly titled measures of other companies. The computations of the non-GAAP financial measures used in this slide presentation are set forth in the Appendix to this slide presentation. 3 > USE OF NON-GAAP FINANCIAL MEASURES |
 4 Troy Woods Chairman, President & Chief Executive Officer © 2015 Total System Services, Inc.® All rights reserved worldwide. |
 5 Paul Todd Chief Financial Officer © 2015 Total System Services, Inc.® All rights reserved worldwide. |
 © 2015 Total System Services, Inc.® All rights reserved worldwide. 2015 First Quarter and YTD Results 6 Total Revenues $662,156 $592,848 11.7% Revenues Before Reimbursable Items 595,784 532,750 11.8 Adjusted EBITDA* 193,454 149,596 29.3 Adjusted EBITDA Margin* 32.47% 28.08% 439 bps Adjusted EPS* from Continuing Operations $0.54 $0.38 41.2% YTD 2015 YTD 2014 Percent Change (*) Adjusted EBITDA , Adjusted EBITDA margin and Adjusted EPS definitions are contained in Appendix (in thousands, except per share data) > CONSOLIDATED SELECTED FINANCIAL HIGHLIGHTS |
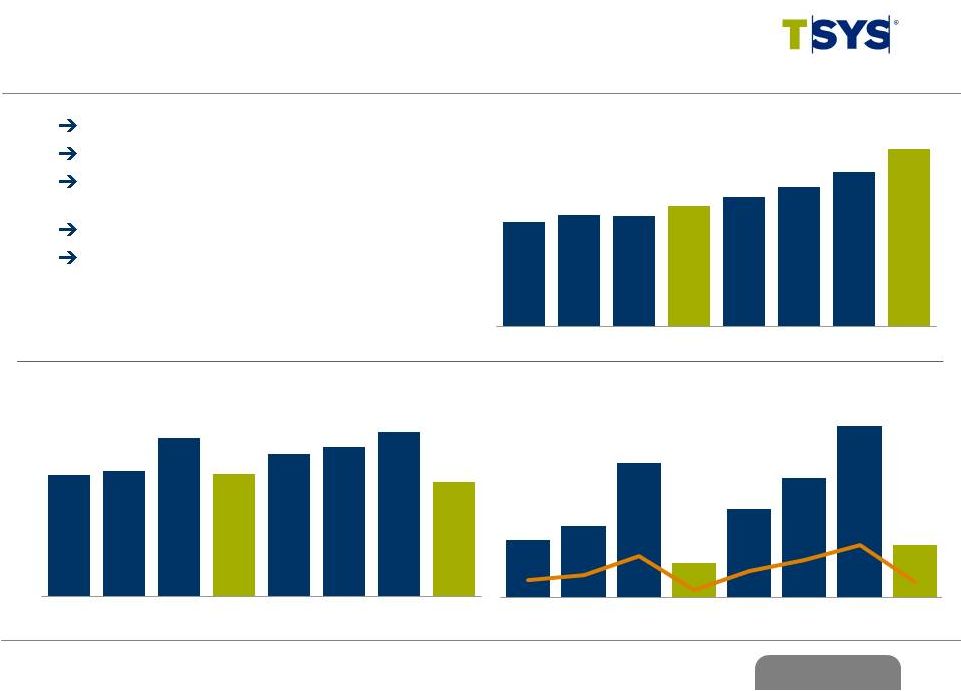
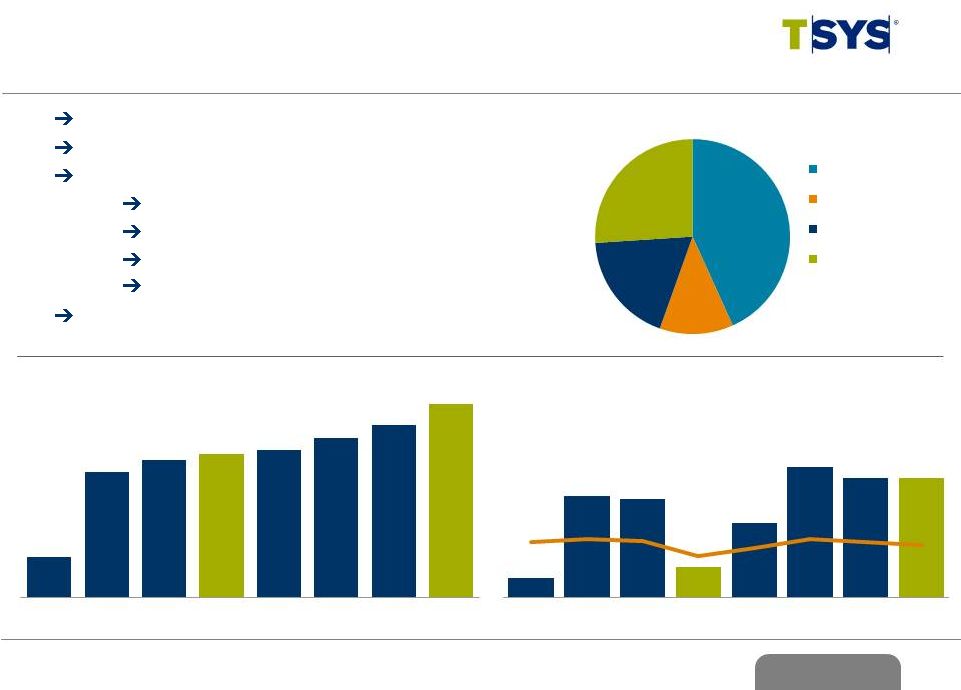 © 2015 Total System Services, Inc.® All rights reserved worldwide. 2015 First Quarter and YTD Results 7 Double digit organic revenue growth Strong cross segment delivery of performance Volume gains: AOF increased 30.1% All-time AOF high of 724M Transactions increased 36.5% GDV up 16.7% Expanding consolidated margins ($ in millions) (*) Revenues Before Reimbursable Items ($ in millions) 5.7% 32.3% 37.3% 31.6% Adjusted Operating Income Operating Margin* 34.2% 8.5% 8.4% 11.8% > 1Q 2015 CONSOLIDATED HIGHLIGHTS 43% 12% 19% 26% Revenue by Segment* North America International Merchant NetSpend $109.0 $146.3 $145.2 $113.9 $134.2 $159.8 $154.7 $154.5 27.2% 28.7% 27.6% 21.4% 24.9% 28.9% 27.2% 25.9% 2Q13 3Q13 4Q13 1Q14 2Q14 3Q14 4Q14 1Q15 $400.9 $509.5 $525.3 $532.8 $538.1 $552.9 $569.3 $595.8 2Q13 3Q13 4Q13 1Q14 2Q14 3Q14 4Q14 1Q15 Consolidated Revenue* YOY Growth % |
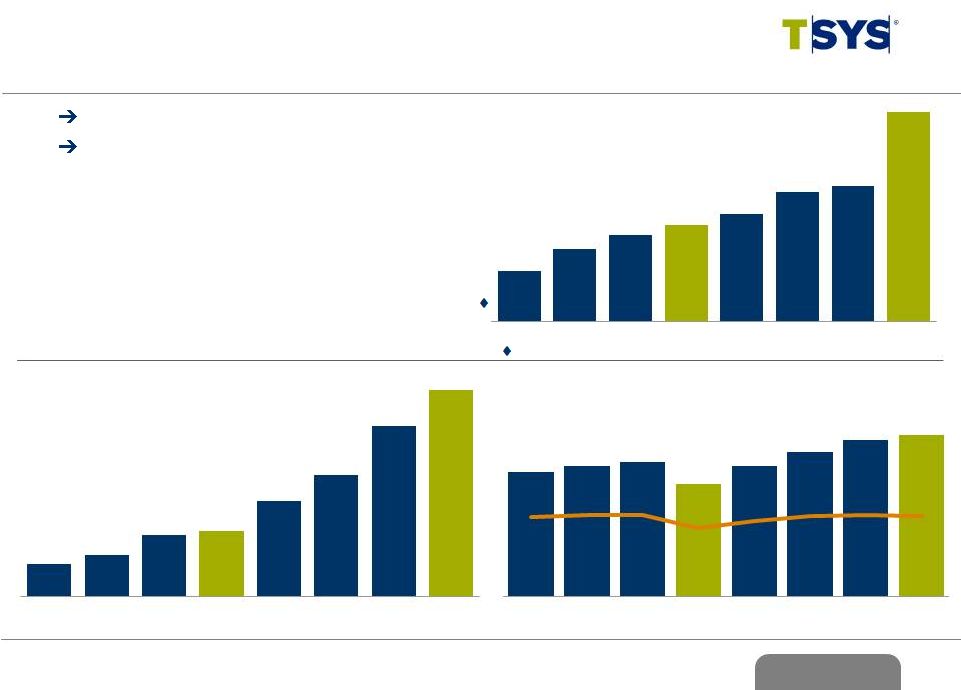 © 2015 Total System Services, Inc.® All rights reserved worldwide. 2015 First Quarter and YTD Results 8 Bank of America conversion completed All-time quarterly highs - Revenue and operating income - Accounts on file up 31.8% to 653.2M - Transactions increased 42.2% to 3.3B ($ in millions) (*) Revenues Before Reimbursable Items ($ in millions) 4.4% 4.5% 6.8% Adjusted Segment Operating Income Operating Margin* 9.1% 8.7% 10.9% 14.5% 18.7% > 1Q 2015 NORTH AMERICA SEGMENT HIGHLIGHTS Growth Excluding Prepaid, Government Services and Single Use Accounts 430.7 461.4 481.9 495.5 510.3 541.4 550.0 653.2 2Q13 3Q13 4Q13 1Q14 2Q14 3Q14 4Q14 1Q15 Accounts on File YOY Growth % 6.3% 16.2% 16.5% 11.2% 11.6% 13.4% 17.2% 17.1% 18.5% 19.1% 17.4% 18.1% 14.1% 16.6% 31.8% 49.4% $81.3 $84.4 $87.1 $74.6 $84.6 $92.7 $99.6 $102.6 37.9% 38.9% 39.0% 33.2% 36.3% 38.5% 39.0% 38.5% 2Q13 3Q13 4Q13 1Q14 2Q14 3Q14 4Q14 1Q15 $214.5 $217.3 $223.3 $224.4 $233.2 $241.0 $255.5 $266.2 2Q13 3Q13 4Q13 1Q14 2Q14 3Q14 4Q14 1Q15 Segment Revenue* YOY Growth % ( ) (in millions) |
 © 2015 Total System Services, Inc.® All rights reserved worldwide. 2015 First Quarter and YTD Results 9 Virgin Money migration completed Revenue up across all lines of business Accounts on file increased 16.1% to 70.5M Transactions increased 10.5% to 572.0M Margin improvement plan on track Adjusted Segment Operating Income Operating Margin* ($ in millions) Reported Constant Currency (*) Revenues Before Reimbursable Items ($ in millions) (4.0%) 0.7% 3.1% 9.0% 8.6% 0.5% (4.6%) (1.0%) 10.6% 1.8% 12.2% 4.4% 2.5% 5.7% (4.0%) 5.1% > 1Q 2015 INTERNATIONAL SEGMENT HIGHLIGHTS 58.0 59.2 59.1 60.7 62.3 64.1 66.6 70.5 2Q13 3Q13 4Q13 1Q14 2Q14 3Q14 4Q14 1Q15 Accounts on File YOY Growth% $76.6 $77.9 $90.6 $76.8 $84.7 $87.4 $92.9 $73.7 2Q13 3Q13 4Q13 1Q14 2Q14 3Q14 4Q14 1Q15 Segment Revenue* YOY Growth % $7.7 $9.5 $18.0 $4.6 $11.7 $16.0 $22.8 $7.0 2Q13 3Q13 4Q13 1Q14 2Q14 3Q14 4Q14 1Q15 10.0% 12.2% 19.9% 5.9% 13.9% 18.3% 24.6% 9.5% 9.9% 12.1% 8.5% 8.9% 7.5% 8.1% 12.7% 16.1% (in millions) |
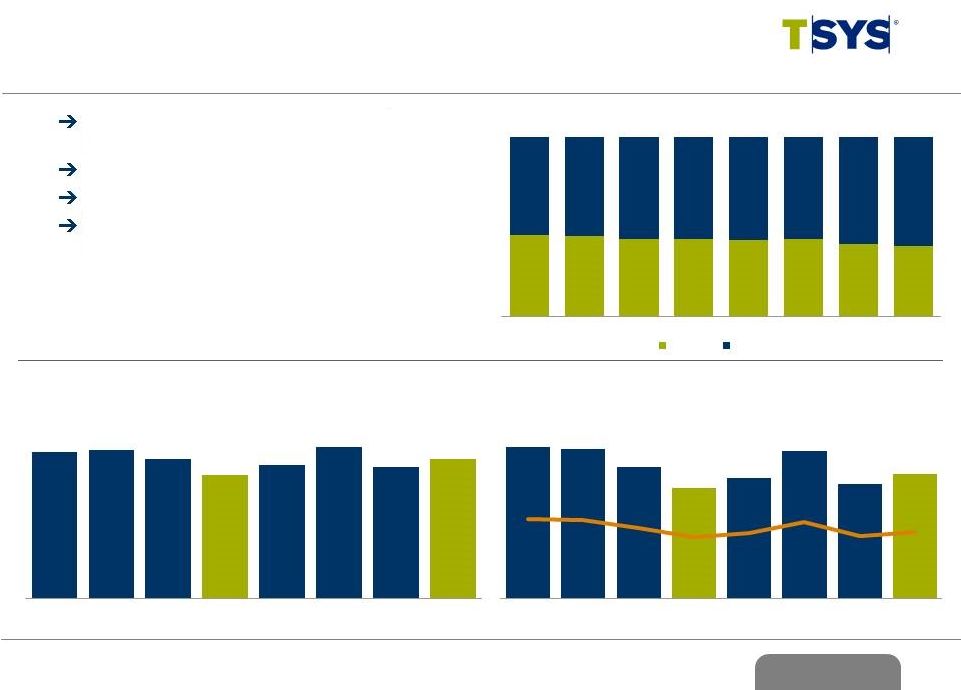 © 2015 Total System Services, Inc.® All rights reserved worldwide. 2015 First Quarter and YTD Results 10 Revenue up 5.5% and operating margin up 207 bps YoY Revenue mix: 61% Direct; 39% Indirect SBS Sales Volume at $5.8B, up 9.9% YoY POS transactions increased 5.6%, excluding deconverted accounts (*) Revenues Before Reimbursable Items ($ in millions) 15.6% 5.4% 4.3% Adjusted Segment Operating Income Operating Margin* ($ in millions) (4.3%) (4.1%) 1.2% (2.4%) 5.5% > 1Q 2015 MERCHANT SEGMENT HIGHLIGHTS Segment Revenue by LOB YOY Growth % 55% 26% 22% (11%) (12%) (12%) ($ in millions) 4% (14%) 1% (10%) 4% (2%) (9%) 3% (4%) 13% Segment Revenue* YOY Growth % $113.0 $113.6 $110.4 $104.6 $108.3 $115.0 $107.7 $110.4 2Q13 3Q13 4Q13 1Q14 2Q14 3Q14 4Q14 1Q15 $41.3 $40.8 $36.0 $30.2 $32.9 $40.4 $31.4 $34.1 36.6% 35.9% 32.6% 28.8% 30.4% 35.1% 29.2% 30.9% 2Q13 3Q13 4Q13 1Q14 2Q14 3Q14 4Q14 1Q15 $51 $51 $48 $45 $46 $50 $44 $43 $62 $63 $62 $59 $62 $65 $64 $67 2Q13 3Q13 4Q13 1Q14 2Q14 3Q14 4Q14 1Q15 Indirect Direct |
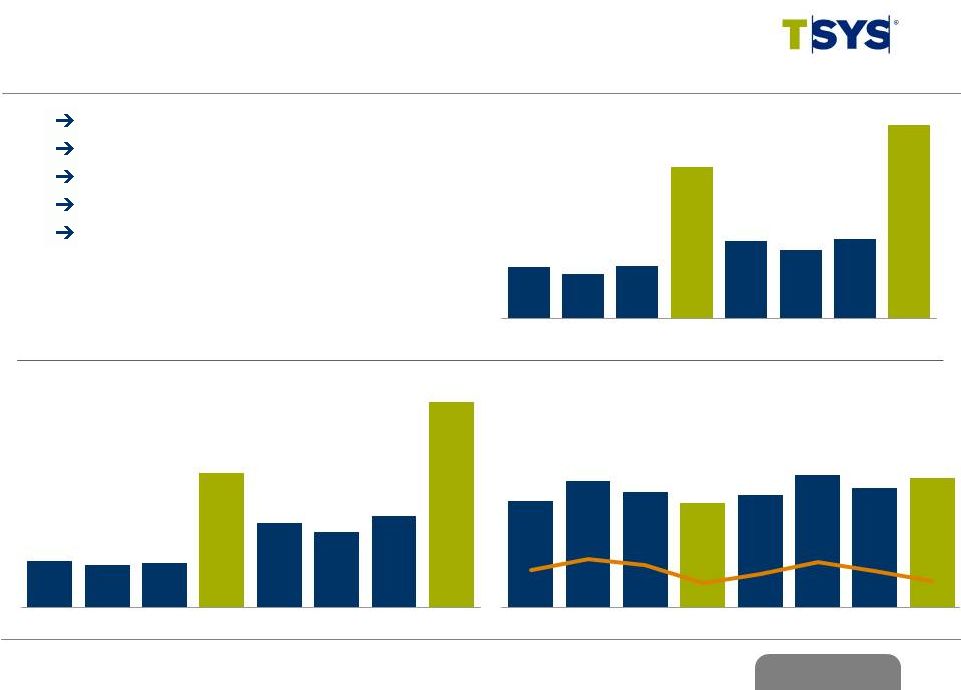 © 2015 Total System Services, Inc.® All rights reserved worldwide. 2015 First Quarter and YTD Results 11 Completed launch of Brinks Prepaid MasterCard All-time quarterly revenue high Gross Dollar Volume (GDV) up 16.7% Total Active Cards at 4.2M, up 14.7% Direct Deposit Active Cards at 2.4M, up 16.1% Adjusted Segment Operating Income* Operating Margin* Segment Revenue YOY Growth % ($ in millions) ($ in millions) > 1Q 2015 NETSPEND SEGMENT HIGHLIGHTS (*NOTE: Periods prior to the acquisition by TSYS have been restated ) $3.9 $3.8 $4.0 $6.6 $4.6 $4.4 $4.7 $7.7 2Q13 3Q13 4Q13 1Q14 2Q14 3Q14 4Q14 1Q15 $104.9 $103.7 $104.1 $132.6 $116.8 $114.0 $119.2 22.9% 22.2% 16.1% 13.1% 11.4% 10.0% 14.4% 16.9% 2Q13 3Q13 4Q13 1Q14 2Q14 3Q14 4Q14 1Q15 $29.3 $34.6 $31.7 $28.7 $30.7 $36.1 $32.7 $35.5 27.9% 33.4% 30.5% 21.7% 26.3% 31.7% 27.5% 22.9% 2Q13 3Q13 4Q13 1Q14 2Q14 3Q14 4Q14 1Q15 30.1% 22.4% 21.5% 22.1% 17.2% 16.6% 18.2% 16.7% $155.1 Gross Dollar Volume YOY Growth % ($ in billions) |
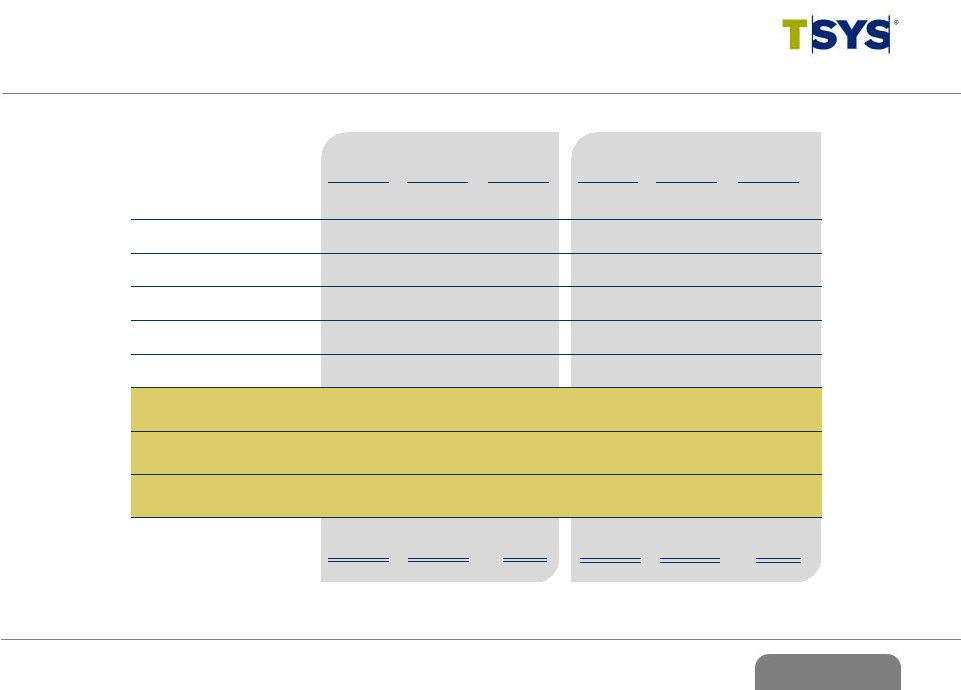
 © 2015 Total System Services, Inc.® All rights reserved worldwide. 2015 First Quarter and YTD Results 12 > SEGMENT OPERATING MARGIN AND CONSOLIDATED ADJUSTED OPERATING MARGIN Revenues before Reimbursable Items Adjusted Operating Margin Adjusted Segment Operating Income (in thousands) Three Months Ended March 31, 2015 North America $102,570 $266,219 38.53% International 6,983 73,730 9.47% Merchant 34,115 110,398 30.90% NetSpend 35,467 155,074 22.87% Eliminations -- (9,637) Corporate administration excluding stock comp (24,629) -- Adjusted operating margin $154,506 $595,784 25.93% Amortization of acquisition intangibles (23,867) Stock-based compensation (8,143) Operating income (US GAAP) $122,496 |
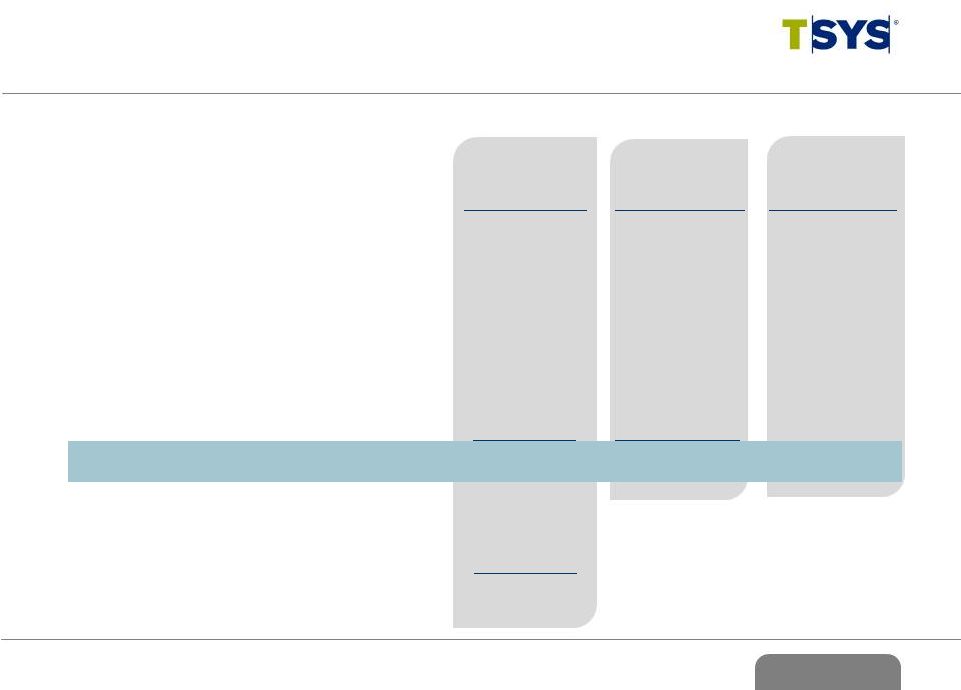
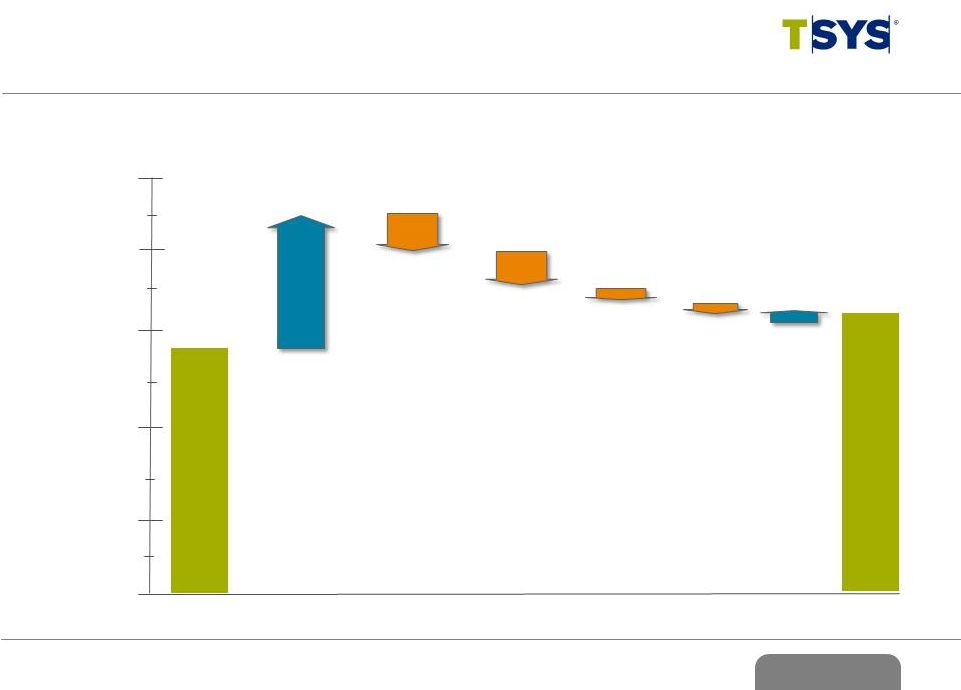 © 2015 Total System Services, Inc.® All rights reserved worldwide. 2015 First Quarter and YTD Results 13 > ROLLFORWARD OF QUARTERLY CASH BALANCE $200 $500 $100 $0 $300 Operating Activities $158 Cap Ex ($44) Debt Pmts ($15) Dividends ($18) Ending Balance $328 (in millions) 12/31/2014 3/31/2015 $400 Share Repurchase ($54) Beginning Balance $289 Other $12 |
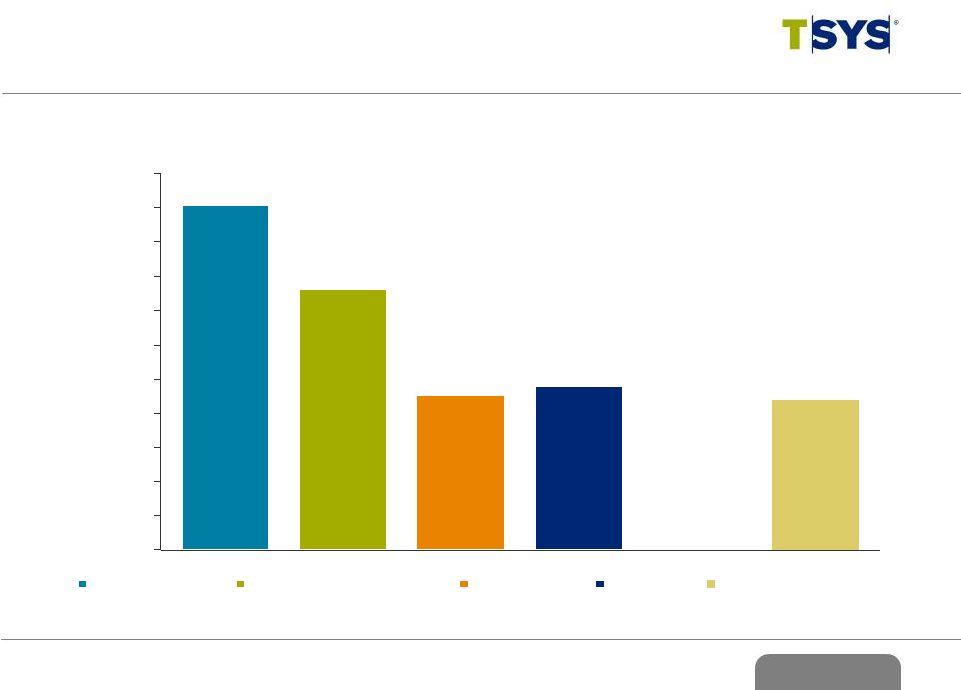 © 2015 Total System Services, Inc.® All rights reserved worldwide. 2015 First Quarter and YTD Results 14 > CASH FLOW STRENGTH: 2015 TTM Consolidated Financial Highlights (in millions) $756 $570 $338 $357 $328 $0 $75 $150 $225 $300 $375 $450 $525 $600 $675 $750 $825 Adjusted EBITDA Cash flow from operations Free cash flow Net income Ending cash (TTM = Trailing Twelve Months) |
 2015 Revised Guidance* Range Range Percent Change Total Revenues $2,620 to $2,660 7% to 9% Revenues Before Reimbursable Items $2,370 to $2,410 8% to 10% Adjusted EPS attributable to TSYS common shareholders from continuing operations $2.19 to $2.23 12% to 14% Average Basic Weighted Shares 185 (in millions, except per share data) 15 (*) See Appendix for guidance assumptions ©2015 Total System Services, Inc.® Proprietary. All rights reserved worldwide. 15 |
 16 Q&A © 2015 Total System Services, Inc.® All rights reserved worldwide. |
 17 Appendix © 2015 Total System Services, Inc.® All rights reserved worldwide. |
 © 2015 Total System Services, Inc.® All rights reserved worldwide. 2015 First Quarter and YTD Results Adjusted EBITDA is net income excluding equity in income of equity investments, nonoperating income/(expense), taxes, depreciation, amortization and stock-based compensation expenses and NetSpend merger & acquisition expenses. Adjusted EPS is adjusted earnings divided by weighted average shares outstanding used for basic EPS calculations. Adjusted earnings is net income excluding the after-tax impact of stock-based compensation expenses, amortization of acquisition intangibles, and NetSpend merger & acquisition expenses. Adjusted segment operating income is operating income at the segment level adjusted for amortization of acquisition intangibles. Adjusted segment operating margin is adjusted segment operating income divided by segment revenues before reimbursable items. The Company believes that these non-GAAP financial measures it presents are useful to investors in evaluating the Company’s operating performance for the following reasons: – adjusted EBITDA and adjusted EPS are widely used by investors to measure a company’s operating performance without regard to items, such as interest expense, income tax expense, depreciation and amortization, merger and acquisition expenses and employee stock-based compensation expense that can vary substantially from company to company depending upon their respective financing structures and accounting policies, the book values of their assets, their capital structures and the methods by which their assets were acquired; and – securities analysts use adjusted EBITDA and adjusted EPS as supplemental measures to evaluate the overall operating performance of companies. By comparing the Company’s adjusted EBITDA and adjusted EPS in different historical periods, investors can evaluate the Company’s operating results without the additional variations caused by employee stock-based compensation expense, which may not be comparable from period to period due to changes in the fair market value of the Company’s common stock (which is influenced by external factors like the volatility of public markets and the financial performance of the Company’s peers) and is not a key measure of the Company’s operations. The Company’s management uses the non-GAAP financial measures: – as measures of operating performance, because they exclude the impact of items not directly resulting from the Company’s core operations; – for planning purposes, including the preparation of the Company’s annual operating budget; – to allocate resources to enhance the financial performance of the Company’s business; – to evaluate the effectiveness of the Company’s business strategies; and – in communications with the Company’s board of directors concerning the Company’s financial performance. 18 > APPENDIX: Non-GAAP Items – Adjusted EBITDA and Adjusted EPS |
 © 2015 Total System Services, Inc.® All rights reserved worldwide. 2015 First Quarter and YTD Results 19 Consumer Credit 364.5 234.8 55.3 364.5 270.0 35.0 Retail 28.3 27.5 2.6 28.3 28.4 (0.5) Total Consumer 392.8 262.3 49.8 392.8 298.4 31.6 Commercial 42.3 40.4 4.8 42.3 41.6 1.8 Other 22.7 19.7 15.2 22.7 22.4 1.3 Subtotal 457.8 322.4 42.0 457.8 362.4 26.3 Prepaid*/ Stored Value 126.6 120.0 5.5 126.6 127.3 (0.6) Government Services 74.5 63.0 18.3 74.5 67.4 10.6 Commercial Card Single Use 64.8 50.8 27.5 64.8 59.6 8.8 Total AOF 723.7 556.2 30.1 723.7 616.7 17.4 (in millions) Mar 2015 Mar 2014 % Change Mar 2015 Dec 2014 % Change (* - Prepaid does not include NetSpend accounts) > APPENDIX: Accounts on File Portfolio Summary |
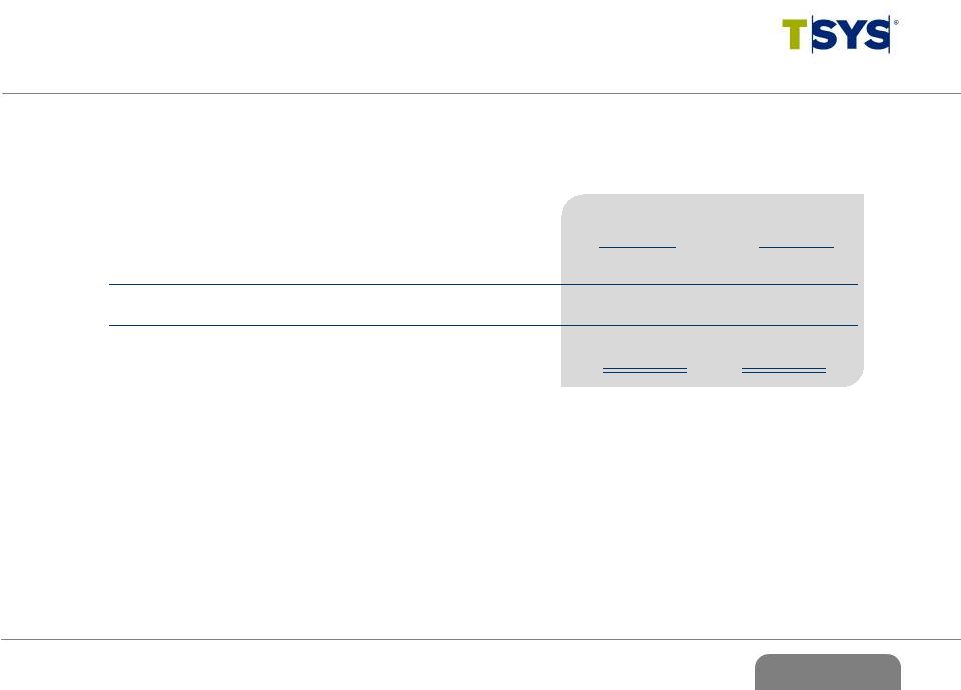 © 2015 Total System Services, Inc.® All rights reserved worldwide. 2015 First Quarter and YTD Results 20 > APPENDIX: Non-GAAP Reconciliation – Revenues Before Reimbursable Items Three Months Ended 3/31/15 3/31/14 Total revenues $662,156 $592,848 Reimbursable items 66,372 60,098 Revenues before reimbursable items $595,784 $532,750 (in thousands) |
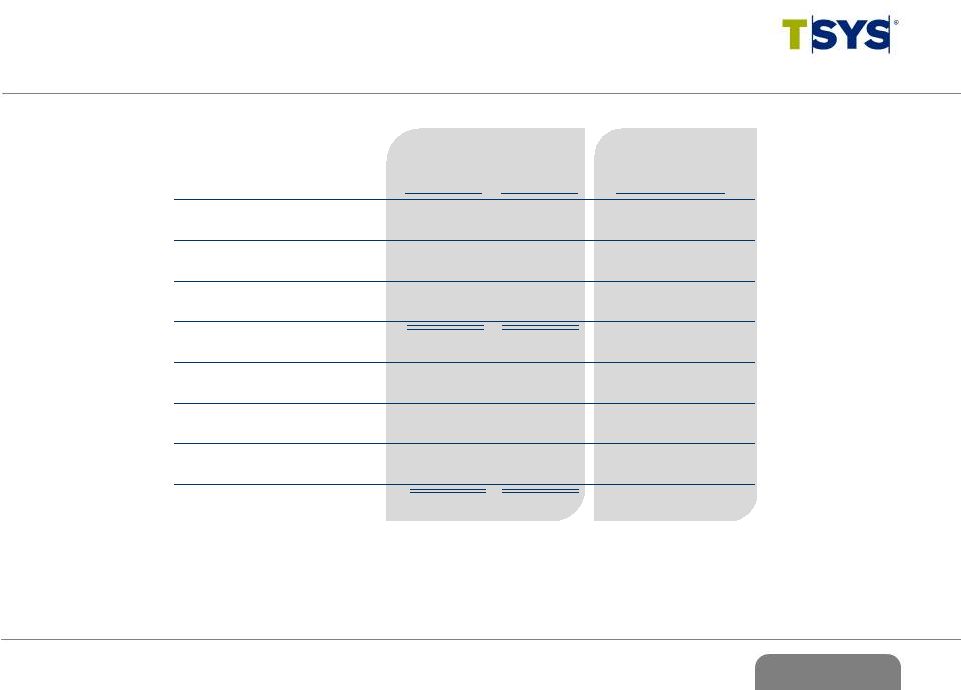
 © 2015 Total System Services, Inc.® All rights reserved worldwide. 2015 First Quarter and YTD Results 21 Three Months Ended Operating income $122,496 $80,697 Add: Acquisition intangible amort 23,867 24,313 Add: Corporate admin and other 32,772 33,008 Total segment adjusted operating income $179,135 $138,018 By segment: North America services (a) $102,570 $74,578 International services (b) $6,983 $4,555 Merchant services (c) $34,115 $30,168 NetSpend (d) $35,467 $28,717 Total revenues $662,156 $592,848 Reimbursable items (66,372) (60,098) Total segment revenues before reimbursable items $595,784 $532,750 Intersegment revenues 9,637 5,656 By segment: North America services (e) $266,219 $224,368 International services (f) $73,730 $76,773 Merchant services (g) $110,398 $104,625 NetSpend (h) $155,074 $132,640 Adjusted segment operating margin: North America services (a) / (e) 38.53% 33.24% International services (b) / (f) 9.47% 5.93% Merchant services (c) / (g) 30.90% 28.83% NetSpend (d) / (h) 22.87% 21.65% (in thousands) > APPENDIX: Non-GAAP Reconciliation – Adjusted Segment Operating Income and Operating Margin 3/31/15 3/31/14 |
 © 2015 Total System Services, Inc.® All rights reserved worldwide. 2015 First Quarter and YTD Results 22 Three Months Ended 3/31/15 3/31/14 Percentage Change (1) Reflects current period results on a non-GAAP basis as if foreign currency rates did not change from the comparable prior year period. (2) Reflects the impact of calculated changes in foreign currency rates from the comparable period. (in thousands) Consolidated: Constant currency (1) $669,863 $592,848 13.0% Foreign currency (2) (7,707) --- Total revenues $662,156 $592,848 11.7% International services: Constant currency (1) $87,381 $82,378 6.1% Foreign currency (2) (7,579) --- Total revenues $79,802 $82,378 (3.1%) > APPENDIX: Non-GAAP Reconciliation – Constant Currency |
 © 2015 Total System Services, Inc.® All rights reserved worldwide. 2015 First Quarter and YTD Results 23 (1) Reflects current period results on a non-GAAP basis as if foreign currency rates did not change from the comparable prior year period. (2) Reflects the impact of calculated changes in foreign currency rates from the comparable period. Three Months Ended 3/31/15 3/31/14 Percentage Change (in thousands) Consolidated: Constant currency (1) $602,902 $532,750 13.2% Foreign currency (2) (7,118) --- Revenues before reimbursable items $595,784 $532,750 11.8% International Services: Constant currency (1) $80,719 $76,773 5.1% Foreign currency (2) (6,989) --- Revenues before reimbursable items $73,730 $76,773 (4.0%) > APPENDIX: Non-GAAP Reconciliation – Constant Currency |
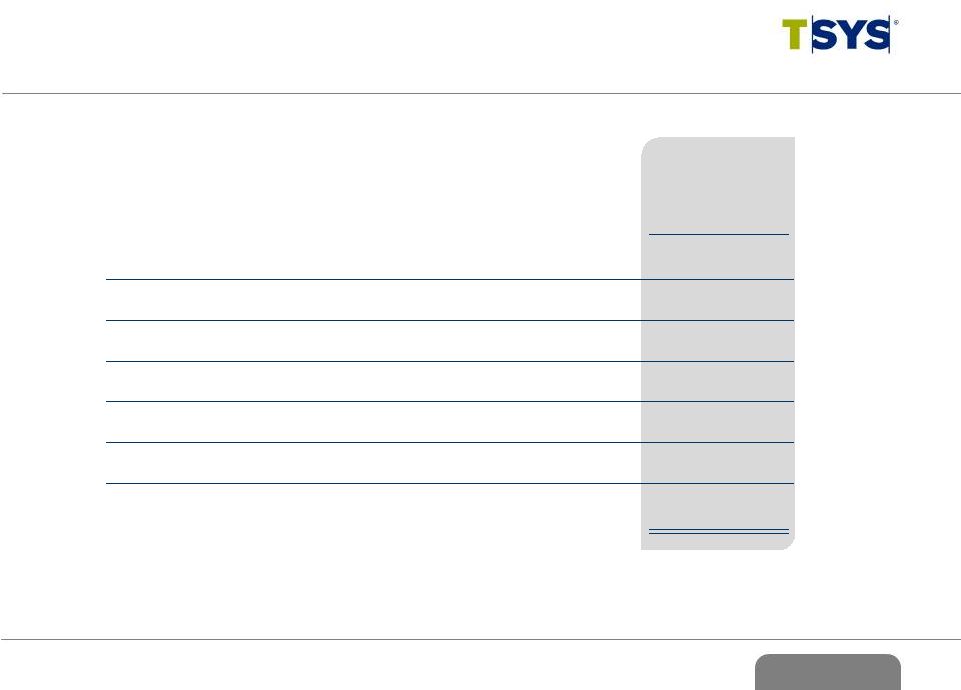
 © 2015 Total System Services, Inc.® All rights reserved worldwide. > APPENDIX: Non-GAAP Reconciliation – EBITDA and Adjusted EBITDA 2015 First Quarter and YTD Results 24 (in thousands) Three Months Ended Mar 2015 Mar 2014 Net income : As reported (GAAP) (a) $78,899 $51,625 Adjusted for: Add/(Deduct): Loss/(Income) from discontinued operations -- (980) Deduct: Equity in income of equity investments (5,394) (4,096) Add: Income taxes 39,782 24,335 Add: Nonoperating expenses 9,209 9,813 Add: Depreciation and amortization 62,815 60,035 EBITDA $185,311 $140,732 Adjust for: Add: Share-based compensation 8,143 7,611 Add: NetSpend M&A expenses -- 1,253 Adjusted EBITDA $193,454 $149,596 |
 © 2015 Total System Services, Inc.® All rights reserved worldwide. 2015 First Quarter and YTD Results 25 (in thousands) Three Months Ended Mar 2015 Mar 2014 Income from continuing operations available to TSYS common shareholders: As reported (GAAP) (a) $77,755 $49,321 Adjusted for amounts attributable to TSYS common shareholders (net of taxes): Acquisition intangible amortization 15,761 15,813 Share-based compensation 5,441 5,017 NetSpend M&A expenses -- 1,204 Adjusted earnings (b) $98,957 $71,355 Average common shares outstanding and participating securities (c) 184,481 187,752 Basic EPS Available to TSYS common shareholders (a) / (c) $0.42 $0.26 Adjusted EPS Available to TSYS common shareholders (b) / (c) $0.54 $0.38 > APPENDIX: Non-GAAP Reconciliation – Adjusted EPS |
 © 2015 Total System Services, Inc.® All rights reserved worldwide. 2015 First Quarter and YTD Results 26 Trailing Twelve Months Ended 3/31/2015 Cash flows from operating activities $569,987 Less: Purchases of property and equipment (72,320) Additions to licensed computer software from vendors (35,256) Additions to internally developed computer software (41,327) Additions to contract acquisition costs (83,332) Free cash flow $337,752 (in thousands) > APPENDIX: Non-GAAP Reconciliation – Free Cash Flow |
 © 2015 Total System Services, Inc.® All rights reserved worldwide. > APPENDIX: Non-GAAP Reconciliation – EBITDA and Adjusted EBITDA 2015 First Quarter and YTD Results 27 Trailing Twelve Months Ended 3/31/2015 Net Income $356,679 Adjusted for: Deduct: Discontinued operations (47,674) Deduct: Equity in Income of Equity Investments (18,881) Add: Income Taxes 145,207 Add: Nonoperating expense 38,108 Add: Depreciation and Amortization 249,401 EBITDA $722,840 Adjust for: Share-based compensation 31,322 NetSpend M&A Operating Expenses* 1,963 Adjusted EBITDA $756,125 (in thousands) * Excludes share-based compensation |
 ©2015 Total System Services, Inc.® Proprietary. All rights reserved worldwide. Appendix: 2015 Revised Guidance Assumptions • There will be no significant movements in the London Interbank Offered rate and TSYS will not make any significant draws on the remaining balance of its credit facility; • There will be no significant movement in foreign currency exchange rates related to TSYS’ business; • TSYS will not incur significant expenses associated with the conversion of new large clients other than included in the 2015 estimate, additional acquisitions, or any significant impairment of goodwill or other intangibles; • There will be no deconversions of large clients during the year; • No future share repurchases are included; and • The economy will not worsen. 28 The guidance assumes: |