
Long-term Outlook and U.S. Onshore Update November 16, 2016

NBL Long-term Outlook Dave Stover 2 Chairman, President and CEO

NBL 3 Key Takeaways From Today Robust Growth in Oil, Total Production, and Cash Flow 2016 – 2020E: U.S. onshore oil grows at a 23 – 29% CAGR* DJ and Delaware increase to between 240 MBoe/d (base plan) and 300 MBoe/d (upside) Total company volume CAGR of 8 – 12%** Total company operating cash flow outpaces total volume growth by 3 - 4X Near-Term Sanction at Leviathan: Extending Growth Trajectory More than doubling EMED gross capacity by 2020 EMED cash margins competitive with U.S. unconventional oil basins Fully Funded Capital Program with Improving Balance Sheet and Corporate Returns Leviathan initial investment funded with EMED portfolio management Remaining capital and dividend funded by operating cash flows Return on average capital employed*** increases to 8 – 14% in 2020E 3 It’s all about value-added growth * Ranges used throughout the presentation represent base to upside plan outcomes. See base and upside plan pricing in appendix. ** Adjusted for divestitures *** See appendix for definition of this non-GAAP measure.
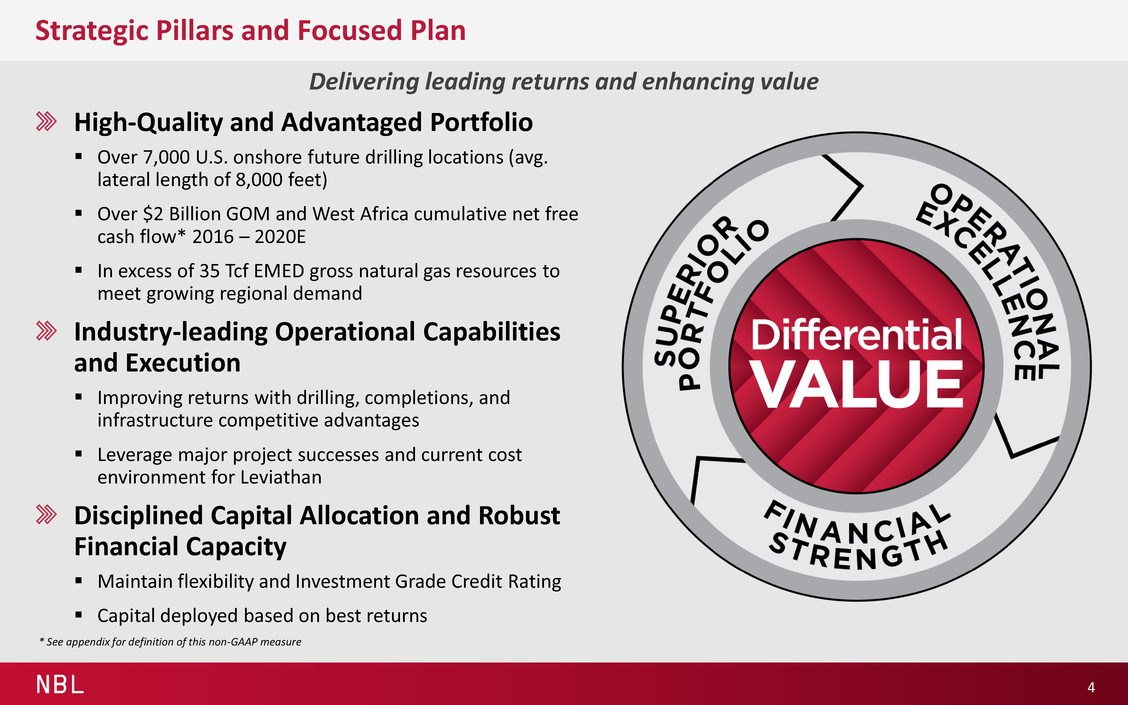
NBL Strategic Pillars and Focused Plan 4 Delivering leading returns and enhancing value * See appendix for definition of this non-GAAP measure High-Quality and Advantaged Portfolio Over 7,000 U.S. onshore future drilling locations (avg. lateral length of 8,000 feet) Over $2 Billion GOM and West Africa cumulative net free cash flow* 2016 – 2020E In excess of 35 Tcf EMED gross natural gas resources to meet growing regional demand Industry-leading Operational Capabilities and Execution Improving returns with drilling, completions, and infrastructure competitive advantages Leverage major project successes and current cost environment for Leviathan Disciplined Capital Allocation and Robust Financial Capacity Maintain flexibility and Investment Grade Credit Rating Capital deployed based on best returns
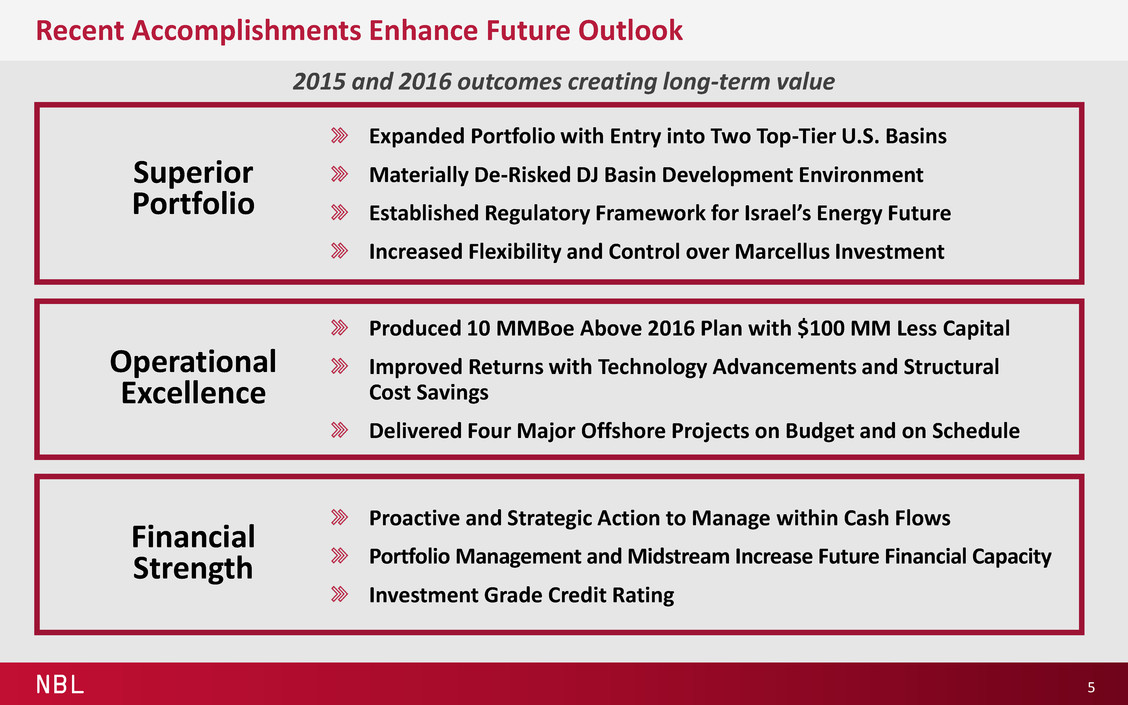
NBL Expanded Portfolio with Entry into Two Top-Tier U.S. Basins Materially De-Risked DJ Basin Development Environment Established Regulatory Framework for Israel’s Energy Future Increased Flexibility and Control over Marcellus Investment Produced 10 MMBoe Above 2016 Plan with $100 MM Less Capital Improved Returns with Technology Advancements and Structural Cost Savings Delivered Four Major Offshore Projects on Budget and on Schedule Proactive and Strategic Action to Manage within Cash Flows Portfolio Management and Midstream Increase Future Financial Capacity Investment Grade Credit Rating Recent Accomplishments Enhance Future Outlook 5 2015 and 2016 outcomes creating long-term value Operational Excellence Financial Strength Superior Portfolio
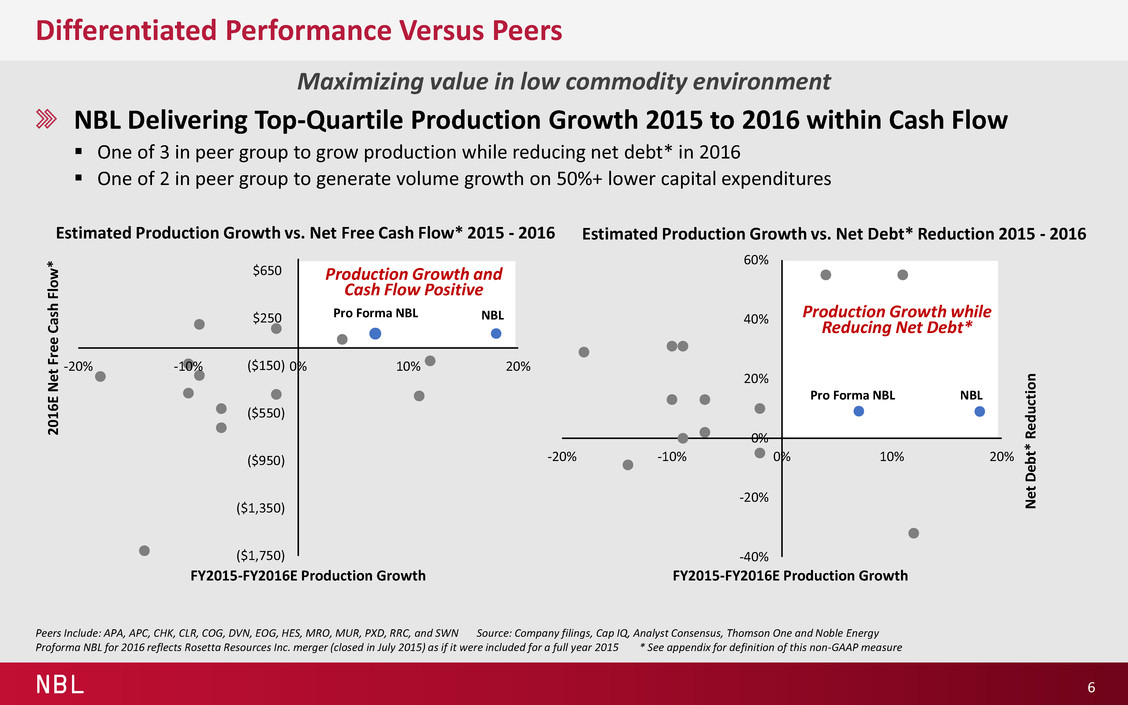
NBL ($1,750) ($1,350) ($950) ($550) ($150) $250 $650 -20% -10% 0% 10% 20% NBL Differentiated Performance Versus Peers NBL Delivering Top-Quartile Production Growth 2015 to 2016 within Cash Flow One of 3 in peer group to grow production while reducing net debt* in 2016 One of 2 in peer group to generate volume growth on 50%+ lower capital expenditures 6 Maximizing value in low commodity environment Peers Include: APA, APC, CHK, CLR, COG, DVN, EOG, HES, MRO, MUR, PXD, RRC, and SWN Source: Company filings, Cap IQ, Analyst Consensus, Thomson One and Noble Energy Proforma NBL for 2016 reflects Rosetta Resources Inc. merger (closed in July 2015) as if it were included for a full year 2015 * See appendix for definition of this non-GAAP measure -40% -20% 0% 20% 40% 60% -20% -10% 0% 10% 20% Pro Forma NBL NBL Estimated Production Growth vs. Net Debt* Reduction 2015 - 2016 Production Growth while Reducing Net Debt* FY2015-FY2016E Production Growth N et D eb t* R ed u ct io n Production Growth and Cash Flow Positive Pro Forma NBL Estimated Production Growth vs. Net Free Cash Flow* 2015 - 2016 FY2015-FY2016E Production Growth 2 0 1 6 E N et F re e C as h F lo w *
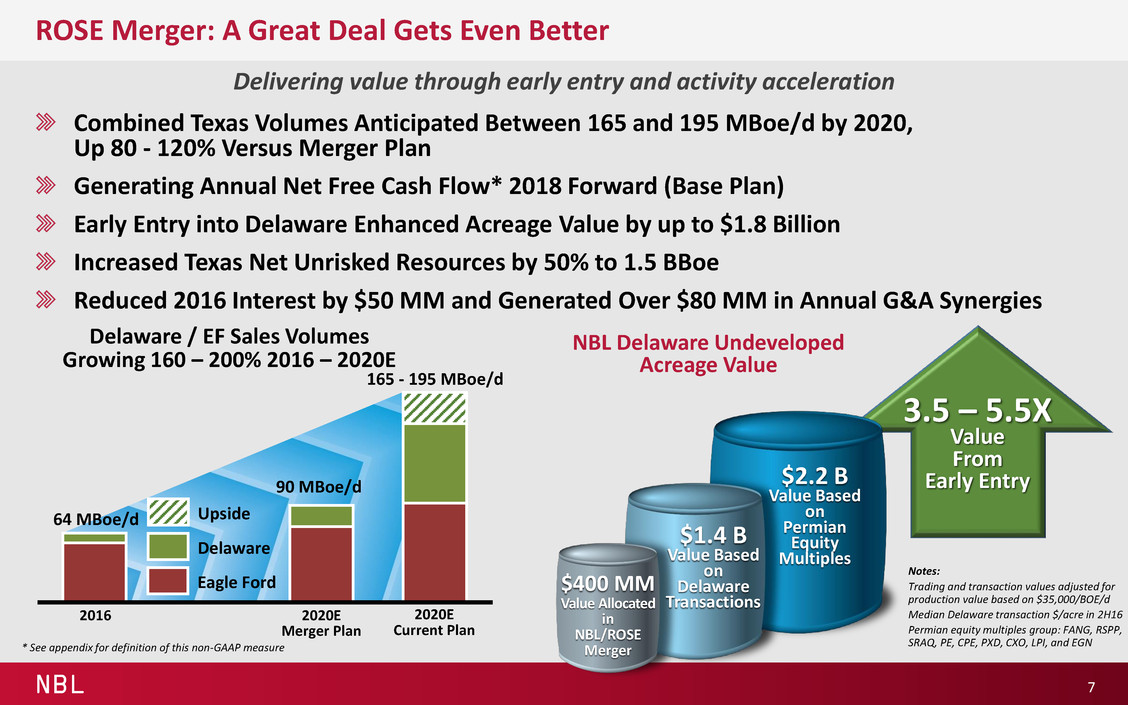
NBL ROSE Merger: A Great Deal Gets Even Better Combined Texas Volumes Anticipated Between 165 and 195 MBoe/d by 2020, Up 80 - 120% Versus Merger Plan Generating Annual Net Free Cash Flow* 2018 Forward (Base Plan) Early Entry into Delaware Enhanced Acreage Value by up to $1.8 Billion Increased Texas Net Unrisked Resources by 50% to 1.5 BBoe Reduced 2016 Interest by $50 MM and Generated Over $80 MM in Annual G&A Synergies 7 Delivering value through early entry and activity acceleration Notes: Trading and transaction values adjusted for production value based on $35,000/BOE/d Median Delaware transaction $/acre in 2H16 Permian equity multiples group: FANG, RSPP, SRAQ, PE, CPE, PXD, CXO, LPI, and EGN NBL Delaware Undeveloped Acreage Value $2.2 B Value Based on Permian Equity Multiples $1.4 B Value Based on Delaware Transactions $400 MM Value Allocated in NBL/ROSE Merger 3.5 – 5.5X Value From Early Entry 64 MBoe/d Delaware / EF Sales Volumes Growing 160 – 200% 2016 – 2020E 165 - 195 MBoe/d 90 MBoe/d * See appendix for definition of this non-GAAP measure 2016 2020E Merger Plan 2020E Current Plan Eagle Ford Delaware Upside

NBL Focused Outcomes Through 2020 DJ and Delaware Increase to 240 MBoe/d in Base Plan and 300 MBoe/d in Upside Combined CAGR of 19–26% Approximately 75% of Total Company Capital to DJ, Delaware, and EMED Accelerate USO Activity to 13 Rigs (Base Plan) and Up to 16 Rigs (Upside) by 2020 2020E Includes Full Year of Volumes from Leviathan 8 Accelerating high-margin growth 155 MBoe/d ** DJ, Delaware, and EMED Volume Growth 300 MBoe/d 390 MBoe/d ** 2016 Tamar production volumes adjusted to reflect a reduction in working interest to 25%, anticipated to be accomplished during plan period. Base plan for 2020 assumes Leviathan volumes at startup of a minimum 600 MMcf/d, gross. Upside plan assumes 1 Bcf/d at startup. NBL Leviathan working interest at startup assumed at 35%. DJ Delaware EMED 2016 – 2020E Total Company Capital* Other Offshore Other USO EMED Delaware DJ Base Plan ~$12 B Upside Plan ~$13.5 B * Excludes NBLX estimated capital expenditures 2016 Divestment Adjusted 2020E Base Plan 2020E Upside Plan

NBL High-Margin Growth Accelerates Cash Flow Even Faster 9 ROACE* increases to 8 – 14% by 2020 Total NBL Base Upside 23% 35% Total Company Operating Cash Flow Grows Even Stronger (2016 – 2020E CAGR) Total NBL U.S. Onshore Total NBL Oil U.S. Onshore Oil Base Upside Strong Total and Oil Volume Growth (2016 – 2020E CAGR)** 8% 12% 13% 16% 11% 16% 23% 29% * See appendix for definition of this non-GAAP measure ** Adjusted for divestitures

NBL Fully Funded Business Plan Operating Cash Flows Exceed Total Capital (Excluding EMED) and Dividend EMED Portfolio Management Self-Funds Leviathan Initial Phase Maintains Robust Financial Liquidity and Improves Balance Sheet Nearly $5 B Incremental Operating Cash Flow Upside with $10/Bbl WTI Increase Accelerates growth outlook Midstream Provides Additional Future Proceeds / Acceleration 10 Significant growth while improving the balance sheet Sources Uses Cumulative Sources & Uses (2016 – 2020E) Upside Operating Cash Flow Operating Cash Flow USO & Other Global Offshore Capital EMED Capital Strengthen Balance Sheet Dividends Future EMED Proceeds 2016 EMED Proceeds 2016 Domestic Proceeds Base Plan Upside Plan Note: Sources do not include potential additional future proceeds from NBLX / CNNX. Additional Opportunities Upside Capital
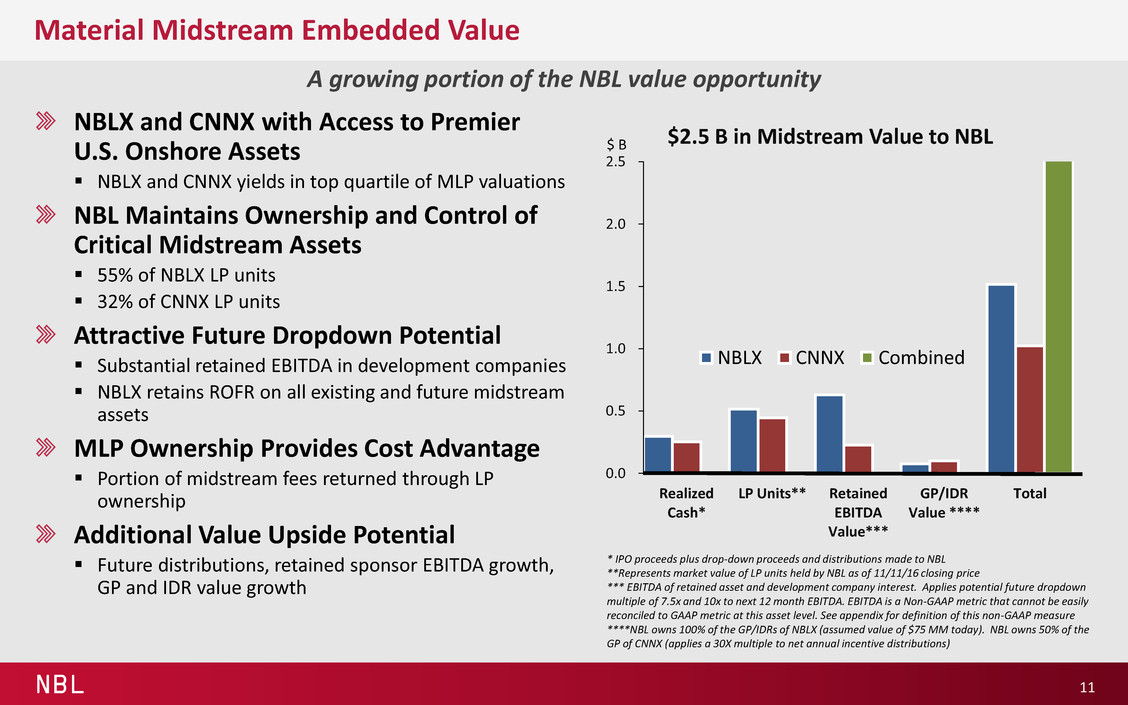
NBL Material Midstream Embedded Value 11 A growing portion of the NBL value opportunity NBLX and CNNX with Access to Premier U.S. Onshore Assets NBLX and CNNX yields in top quartile of MLP valuations NBL Maintains Ownership and Control of Critical Midstream Assets 55% of NBLX LP units 32% of CNNX LP units Attractive Future Dropdown Potential Substantial retained EBITDA in development companies NBLX retains ROFR on all existing and future midstream assets MLP Ownership Provides Cost Advantage Portion of midstream fees returned through LP ownership Additional Value Upside Potential Future distributions, retained sponsor EBITDA growth, GP and IDR value growth 0.0 0.5 1.0 1.5 2.0 2.5 Realized Cash* LP Units** Retained EBITDA Value*** GP/IDR Value **** Total $2.5 B in Midstream Value to NBL NBLX CNNX Combined $ B * IPO proceeds plus drop-down proceeds and distributions made to NBL **Represents market value of LP units held by NBL as of 11/11/16 closing price *** EBITDA of retained asset and development company interest. Applies potential future dropdown multiple of 7.5x and 10x to next 12 month EBITDA. EBITDA is a Non-GAAP metric that cannot be easily reconciled to GAAP metric at this asset level. See appendix for definition of this non-GAAP measure ****NBL owns 100% of the GP/IDRs of NBLX (assumed value of $75 MM today). NBL owns 50% of the GP of CNNX (applies a 30X multiple to net annual incentive distributions)

NBL Improved 2017 Outlook and Capital Plans 12 Delivering much more than original expectations * Excludes NBLX estimated capital expenditures 300 325 350 375 400 425 Original 2017 Outlook 2016 Divestments Impact Raised Expectations 2017 Outlook MBoe/d 2017 Volumes Raised Nearly 10% From Original Expectations 400 - 410 390 2017 Preliminary Capital $2.0 - $2.4 B* 65% DJ / Texas 25% EMED Other EMED Delaware DJ Eagle Ford Original Plans Assumed 2017E Volumes Could be Held at 390 MBoe/d for $1.5 B Capital, Excluding EMED 2017E Plan Estimates 405 MBoe/d on $1.65 B Capital, Excluding EMED Over 70% of Total Capital Allocation to U.S. Onshore 2017E USO Average Rigs Increased to 7, More Than 2X 2016 Rigs DJ (2-3), Delaware (3), Eagle Ford (1) Commencing Leviathan Development ‘17 capital primarily funded by ‘16 Tamar sell-down 372
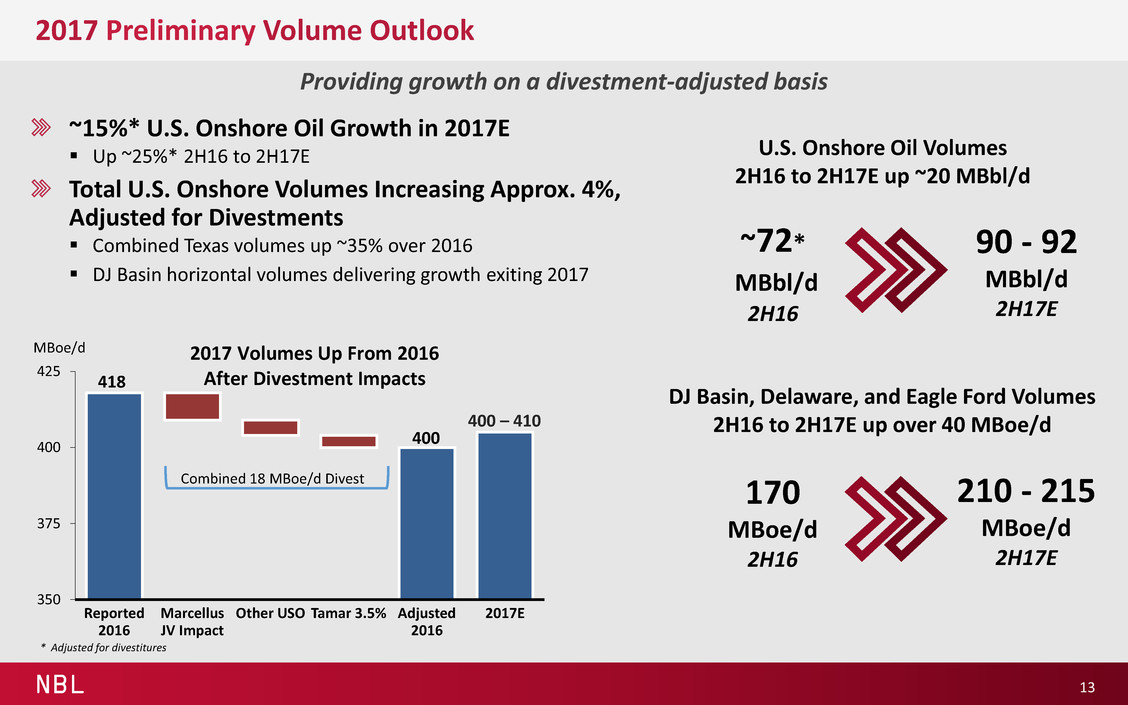
NBL 2017 Preliminary Volume Outlook ~15%* U.S. Onshore Oil Growth in 2017E Up ~25%* 2H16 to 2H17E Total U.S. Onshore Volumes Increasing Approx. 4%, Adjusted for Divestments Combined Texas volumes up ~35% over 2016 DJ Basin horizontal volumes delivering growth exiting 2017 13 Providing growth on a divestment-adjusted basis 400 – 410 350 375 400 425 Reported 2016 Marcellus JV Impact Other USO Tamar 3.5% Adjusted 2016 2017E MBoe/d Combined 18 MBoe/d Divest 400 2017 Volumes Up From 2016 After Divestment Impacts 418 90 - 92 MBbl/d 2H17E U.S. Onshore Oil Volumes 2H16 to 2H17E up ~20 MBbl/d ~72* MBbl/d 2H16 210 - 215 MBoe/d 2H17E DJ Basin, Delaware, and Eagle Ford Volumes 2H16 to 2H17E up over 40 MBoe/d 170 MBoe/d 2H16 * Adjusted for divestitures

NBL Combination Provides Competitive Advantages U.S. Onshore Deep inventory of locations in high-return, low-cost basins Contiguous acreage in multiple stacked pay resource plays Significant capital efficiency gains with sustainable cost reductions Eastern Mediterranean Long-life assets with strong realizations and low maintenance capital World-class projects in substantially undersupplied regional market Other Global Offshore Oil-levered assets Substantial annual cash flow contributor 14 Premier, high-quality unconventional and offshore assets
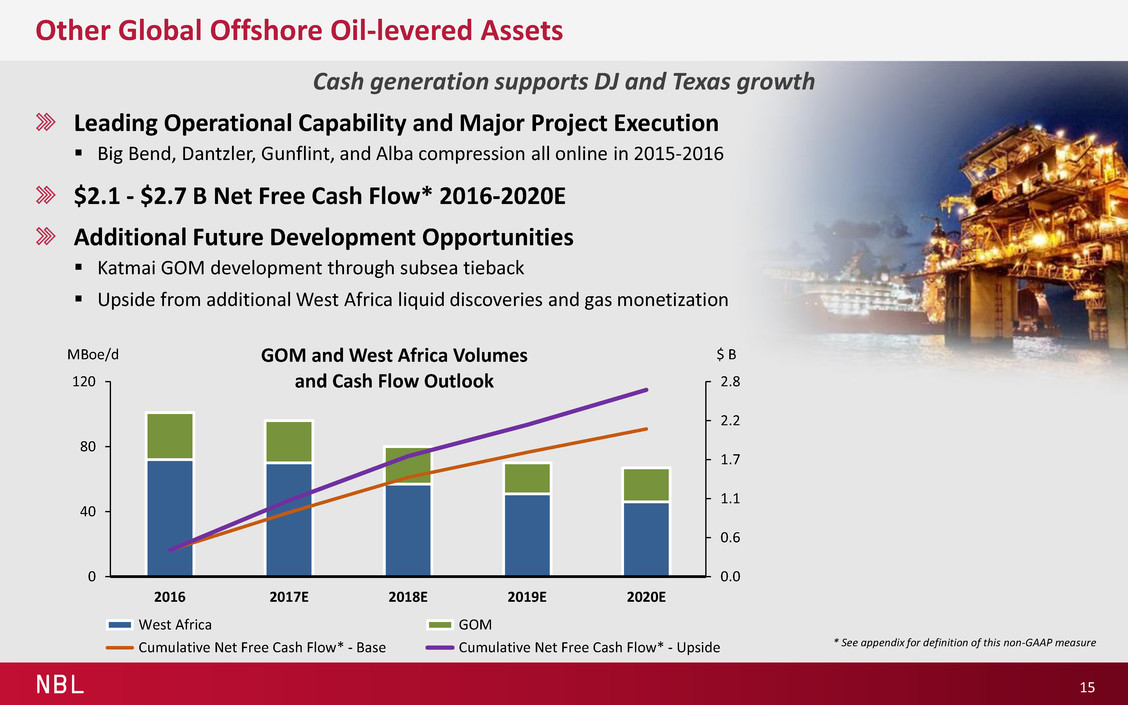
NBL Other Global Offshore Oil-levered Assets Leading Operational Capability and Major Project Execution Big Bend, Dantzler, Gunflint, and Alba compression all online in 2015-2016 $2.1 - $2.7 B Net Free Cash Flow* 2016-2020E Additional Future Development Opportunities Katmai GOM development through subsea tieback Upside from additional West Africa liquid discoveries and gas monetization 15 Cash generation supports DJ and Texas growth 0.0 0.6 1.1 1.7 2.2 2.8 0 40 80 120 2016 2017E 2018E 2019E 2020E GOM and West Africa Volumes and Cash Flow Outlook West Africa GOM Cumulative Net Free Cash Flow* - Base Cumulative Net Free Cash Flow* - Upside MBoe/d $ B * See appendix for definition of this non-GAAP measure

NBL EMED: World-class Resources in a High-Demand Region Tamar 10 Tcf (Producing) and Leviathan 22 Tcf Gross Recoverable Resources Tamar supplying up to 60% of Israel power generation Leviathan Sanction On Track for YE 2016 / Early 2017 Up to 450 MMcf/d sales under contract totaling ~$12 B gross revenues Expected sales volumes in 2020 of a minimum of 600 MMcf/d and up to 1 Bcf/d, gross Expanding Ultimate Gross Capacity to Over 4 Bcf/d Tamar current capacity 1.2 Bcf/d, upside expansion to 2 Bcf/d Leviathan ultimate capacity of 2.1 Bcf/d Regional deficit 4 Bcf/d currently, growing to 9 Bcf/d EMED Portfolio Management Planned to Support Upcoming Development Tamar 3.5% sell-down closing 4Q16, additional 7.5% planned Leviathan 10% farm-down assumed over plan 16 Exceptional assets, margins, and growth
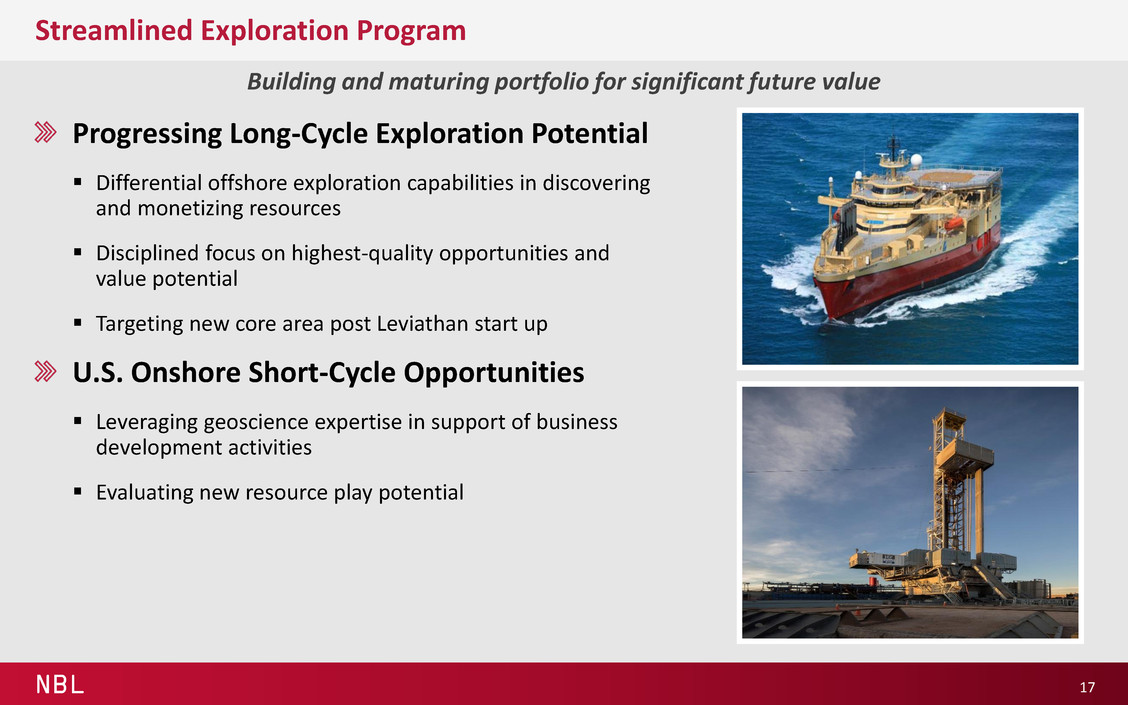
NBL Streamlined Exploration Program Progressing Long-Cycle Exploration Potential Differential offshore exploration capabilities in discovering and monetizing resources Disciplined focus on highest-quality opportunities and value potential Targeting new core area post Leviathan start up U.S. Onshore Short-Cycle Opportunities Leveraging geoscience expertise in support of business development activities Evaluating new resource play potential 17 Building and maturing portfolio for significant future value

NBL U.S. Onshore Update Gary Willingham 18 Executive Vice President, Operations

NBL U.S. Onshore Top Tier Acreage in Premier Basins 19 Complementary assets driving growth and value Delaware 352,000 net acres 3,220 gross locations 8,400’ average lateral length 2 BBoe net unrisked resources Eagle Ford Marcellus 363,000* net acres 1,900 gross locations 8,000’ average lateral length 20 Tcfe net unrisked resources DJ Basin 40,000 net acres 1,675 gross locations 7,500’ average lateral length 1 BBoe net unrisked resources 35,000 net acres 360 gross locations 7,600’ average lateral length 460 MMBoe net unrisked resources * Reflects Marcellus acreage post JV separation One of the Largest Independent U.S. Onshore Producers Combined ~7 BBoe net unrisked resources Industry Leading Operating Capabilities and Execution Drilled over 1,600 horizontal wells Differentiated Ability in Sharing Learnings Across Basins Leveraging Midstream Infrastructure Advantage Excellent Safety and Stewardship Performance

NBL Recent U.S. Onshore Accomplishments 20 2015 and 2016 actions enhance long-term value Added Positions in Two Top-Tier U.S. Basins Enhanced Wells Ranch IDP in the DJ Basin through Acreage Exchange Focused Activity within Liquids Plays Enhanced Completions Delivering Increase in Per Well Recovery Across USO and Adding to Economic Inventory Increased Drilling Efficiency within the DJ Basin by Over 75% since 2014 Reduced USO Unit Lease Operating Expenses by 33% since 2014, Creating Sustainable Advantage Accelerated Value of Long-dated Inventory in DJ Basin Operational Excellence Financial Strength Superior Portfolio
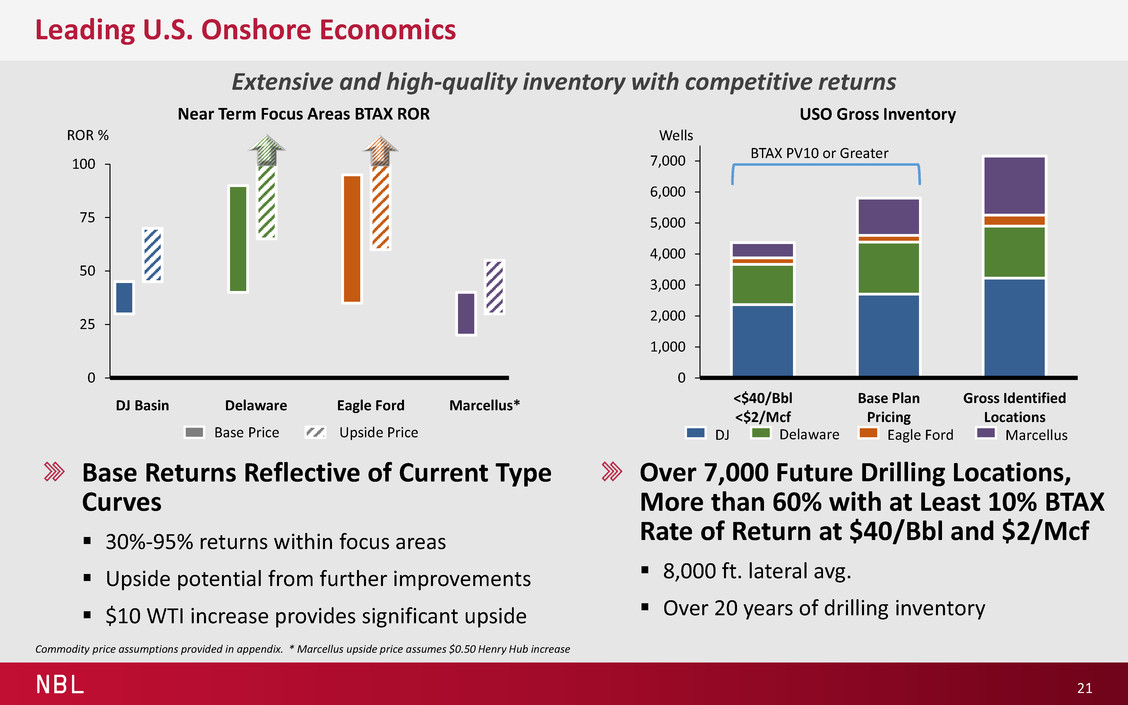
NBL 0 25 50 75 100 Near Term Focus Areas BTAX ROR 0 1,000 2,000 3,000 4,000 5,000 6,000 7,000 <$40/Bbl <$2/Mcf Base Plan Pricing Gross Identified Locations USO Gross Inventory Leading U.S. Onshore Economics 21 Extensive and high-quality inventory with competitive returns Over 7,000 Future Drilling Locations, More than 60% with at Least 10% BTAX Rate of Return at $40/Bbl and $2/Mcf 8,000 ft. lateral avg. Over 20 years of drilling inventory Eagle Ford Delaware DJ Marcellus BTAX PV10 or Greater Base Returns Reflective of Current Type Curves 30%-95% returns within focus areas Upside potential from further improvements $10 WTI increase provides significant upside Upside Price Base Price DJ Basin Delaware Eagle Ford Marcellus* Commodity price assumptions provided in appendix. * Marcellus upside price assumes $0.50 Henry Hub increase Wells ROR %
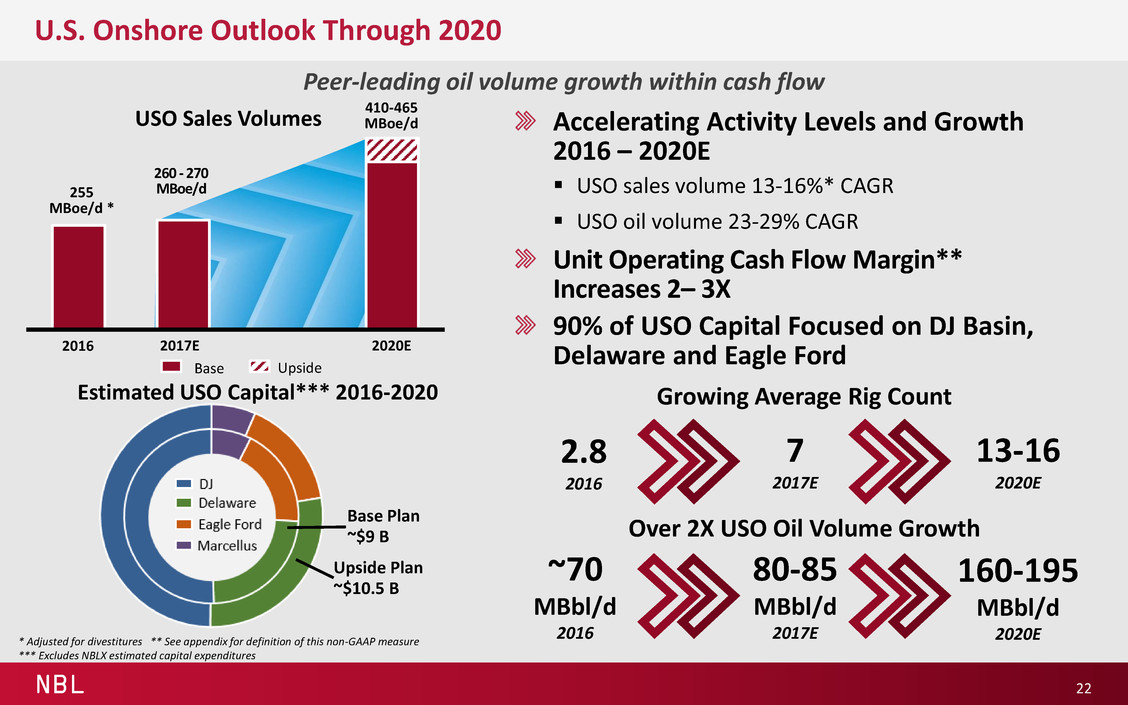
NBL U.S. Onshore Outlook Through 2020 Peer-leading oil volume growth within cash flow Accelerating Activity Levels and Growth 2016 – 2020E USO sales volume 13-16%* CAGR USO oil volume 23-29% CAGR Unit Operating Cash Flow Margin** Increases 2– 3X 90% of USO Capital Focused on DJ Basin, Delaware and Eagle Ford 22 * Adjusted for divestitures ** See appendix for definition of this non-GAAP measure *** Excludes NBLX estimated capital expenditures Upside Base Base Plan ~$9 B Upside Plan ~$10.5 B Estimated USO Capital*** 2016-2020 2.8 2016 Growing Average Rig Count 7 2017E 13-16 2020E ~70 MBbl/d 2016 Over 2X USO Oil Volume Growth 80-85 MBbl/d 2017E 160-195 MBbl/d 2020E 2016 2017E 2020E USO Sales Volumes 255 MBoe/d * 260 - 270 MBoe/d 410-465 MBoe/d
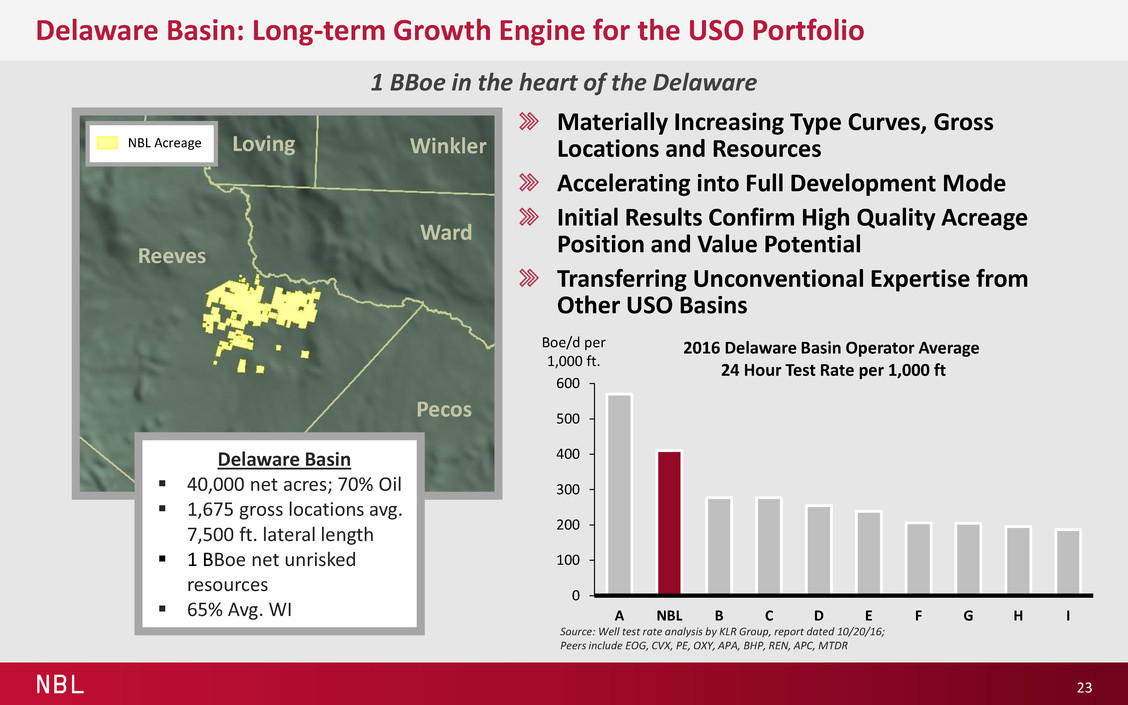
NBL Delaware Basin: Long-term Growth Engine for the USO Portfolio 23 1 BBoe in the heart of the Delaware 0 100 200 300 400 500 600 A NBL B C D E F G H I 2016 Delaware Basin Operator Average 24 Hour Test Rate per 1,000 ft Boe/d per 1,000 ft. Source: Well test rate analysis by KLR Group, report dated 10/20/16; Peers include EOG, CVX, PE, OXY, APA, BHP, REN, APC, MTDR Materially Increasing Type Curves, Gross Locations and Resources Accelerating into Full Development Mode Initial Results Confirm High Quality Acreage Position and Value Potential Transferring Unconventional Expertise from Other USO Basins Reeves Ward Pecos Loving Winkler NBL Acreage Delaware Basin 40,000 net acres; 70% Oil 1,675 gross locations avg. 7,500 ft. lateral length 1 BBoe net unrisked resources 65% Avg. WI
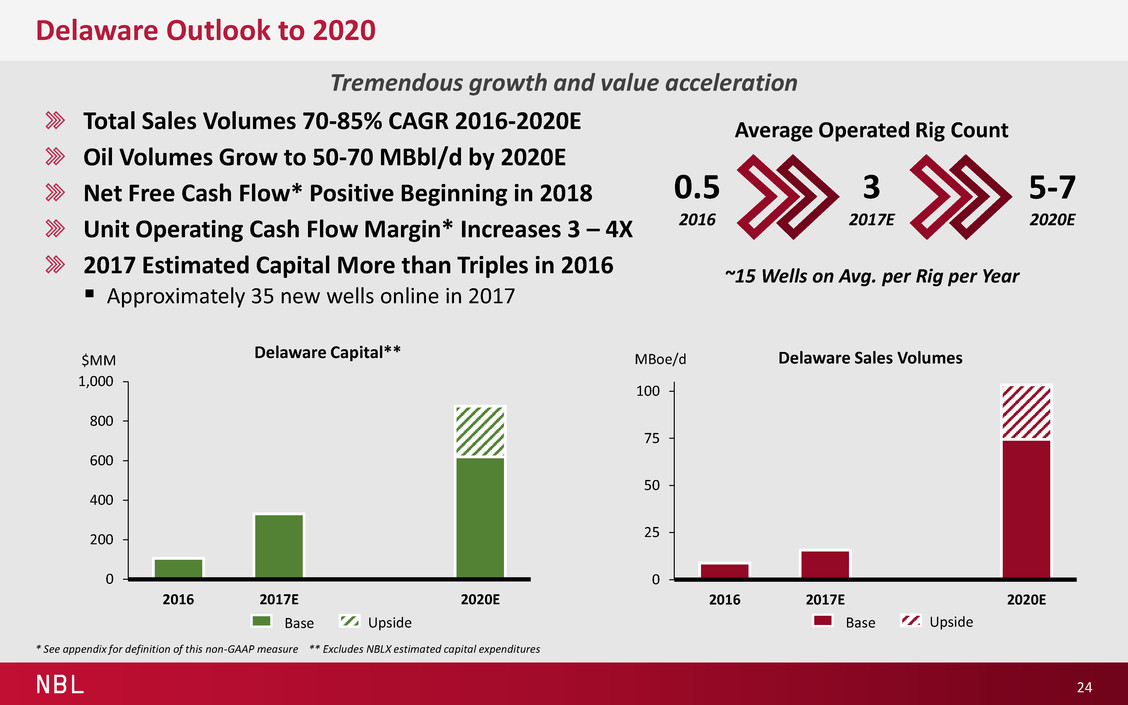
NBL 0 25 50 75 100 2016 2017E 2020E Delaware Sales Volumes 0 200 400 600 800 1,000 2016 2017E 2020E Delaware Capital** $MM Delaware Outlook to 2020 24 Total Sales Volumes 70-85% CAGR 2016-2020E Oil Volumes Grow to 50-70 MBbl/d by 2020E Net Free Cash Flow* Positive Beginning in 2018 Unit Operating Cash Flow Margin* Increases 3 – 4X 2017 Estimated Capital More than Triples in 2016 Approximately 35 new wells online in 2017 Tremendous growth and value acceleration MBoe/d Upside Base Upside Base 0.5 2016 Average Operated Rig Count ~15 Wells on Avg. per Rig per Year 3 2017E 5-7 2020E * See appendix for definition of this non-GAAP measure ** Excludes NBLX estimated capital expenditures

NBL 0 100 200 300 400 500 0 100 200 300 400 Cum. MBoe Days on Production Well Results Improving with Enhanced Completions Gen 1 Gen 2 Gen 3 WCA Current Type Curve Gen 4 NBL New Completion Techniques Delivering Enhanced Results in the Delaware 25 Faster learning curve accelerates value creation Note: Gross 3 stream normalized to 7,500’ lateral Generation 1 700 lbs/ft X-Link Fluid Generation 2 1200 lbs/ft Hybrid Fluid Generation 3 1500+ lbs/ft Hybrid Fluid Generation 4 2000+ lbs/ft Slickwater ROSE Leveraging Learnings from Across USO to Optimize Completions Quickly transitioned to slickwater, high intensity completions Optimizing well placement to maximize total resource development Significant Improvements from Initial NBL Wells Stronger well performance with higher proppant loading and shorter stages Testing Higher Proppant Concentration Upside Up to 5,000 lbs/ft proppant results expected early 2017
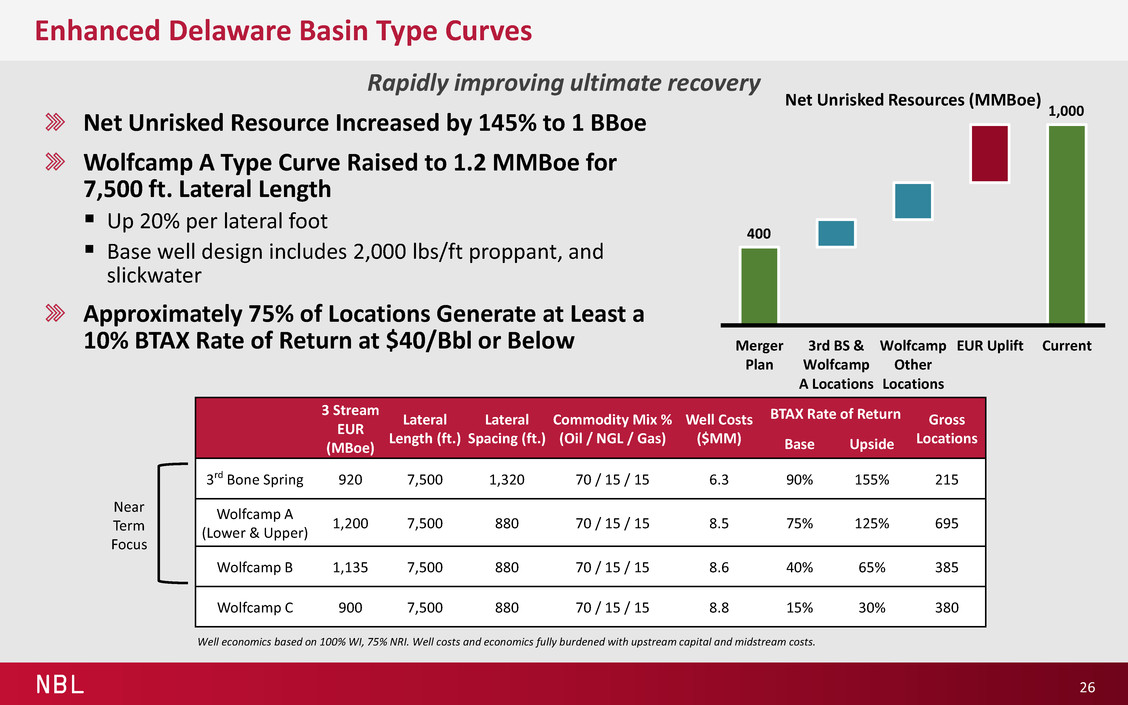
NBL Merger Plan 3rd BS & Wolfcamp A Locations Wolfcamp Other Locations EUR Uplift Current Net Unrisked Resources (MMBoe) Enhanced Delaware Basin Type Curves 26 Rapidly improving ultimate recovery Net Unrisked Resource Increased by 145% to 1 BBoe Wolfcamp A Type Curve Raised to 1.2 MMBoe for 7,500 ft. Lateral Length Up 20% per lateral foot Base well design includes 2,000 lbs/ft proppant, and slickwater Approximately 75% of Locations Generate at Least a 10% BTAX Rate of Return at $40/Bbl or Below 3 Stream EUR (MBoe) Lateral Length (ft.) Lateral Spacing (ft.) Commodity Mix % (Oil / NGL / Gas) Well Costs ($MM) BTAX Rate of Return Gross Locations Base Upside 3rd Bone Spring 920 7,500 1,320 70 / 15 / 15 6.3 90% 155% 215 Wolfcamp A (Lower & Upper) 1,200 7,500 880 70 / 15 / 15 8.5 75% 125% 695 Wolfcamp B 1,135 7,500 880 70 / 15 / 15 8.6 40% 65% 385 Wolfcamp C 900 7,500 880 70 / 15 / 15 8.8 15% 30% 380 400 1,000 Near Term Focus Well economics based on 100% WI, 75% NRI. Well costs and economics fully burdened with upstream capital and midstream costs.

NBL Delaware Stacked Pay Running Room 27 High-quality Stacked Targets Across Position Pay interval more than 3,400 ft thick Increased Locations by 40% to 1,675 from Merger Plan Drillable footage up more than 100% including longer lateral lengths Increased confidence in Wolfcamp A downspacing Added Wolfcamp B and C locations to development plan Additional 485 Potential Locations in Other Prospective Zones Additional opportunities to be unlocked Targeted Wells per Section NBL Peer Range Development Plan 3rd Bone Spring 4 4-7 Wolfcamp A Upper & Lower 12 7-15 Wolfcamp B 6 6 Wolfcamp C 6 4-6 Gross Inventory 1,675 Potential Upside 1st Bone Spring & Avalon 4 6-16 2nd Bone Spring 4 4-6 Total Inventory 2,160 Top TVD 7,950’ 8,800’ 9,000’ 9,600’ 10,400’ 10,700’ 10,950’
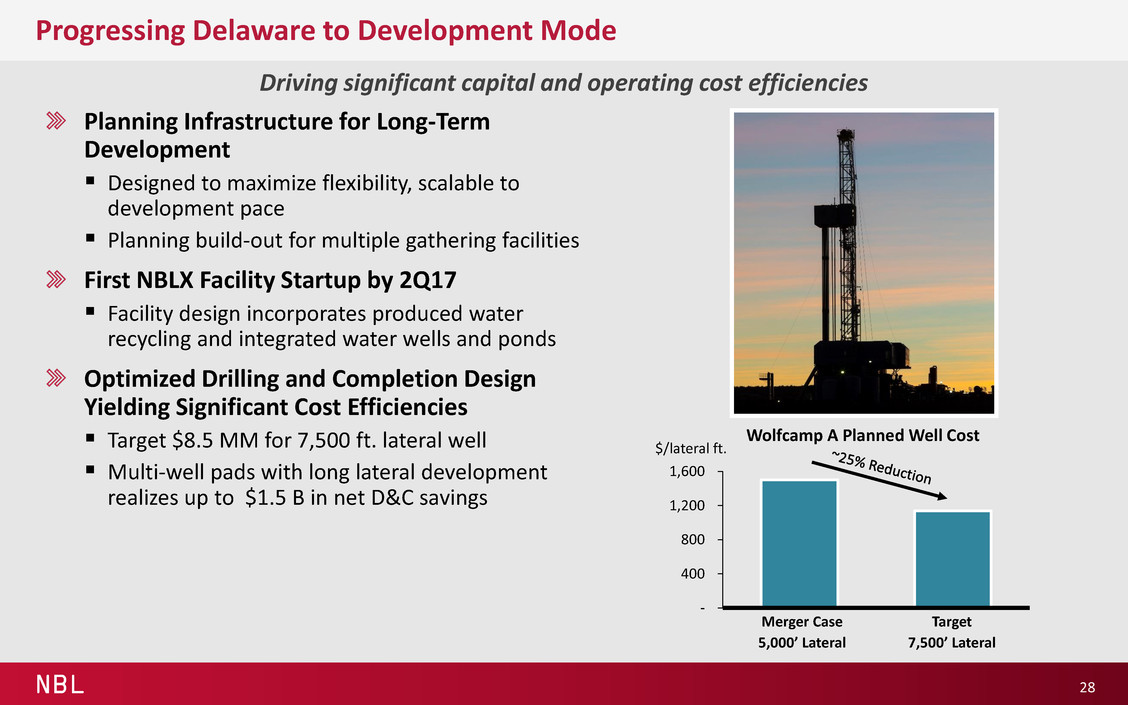
NBL - 400 800 1,200 1,600 Wolfcamp A Planned Well Cost Progressing Delaware to Development Mode 28 Planning Infrastructure for Long-Term Development Designed to maximize flexibility, scalable to development pace Planning build-out for multiple gathering facilities First NBLX Facility Startup by 2Q17 Facility design incorporates produced water recycling and integrated water wells and ponds Optimized Drilling and Completion Design Yielding Significant Cost Efficiencies Target $8.5 MM for 7,500 ft. lateral well Multi-well pads with long lateral development realizes up to $1.5 B in net D&C savings Driving significant capital and operating cost efficiencies $/lateral ft. Merger Case 5,000’ Lateral Target 7,500’ Lateral

NBL Delaware Basin Impactful Near-Term Catalysts 29 Focused on long laterals, pad drilling and multi-zone testing Reeves Ward NBL Acreage NBLX Gathering Facilities First Online by 2Q17 Second Online by Year-End Wolfcamp B 7,300 ft lateral 3,000 lbs/ft completion Online 4Q16 Multi-Zone Development 7-well pad with 7,500 ft laterals - 3rd Bone Spring: 2 - Wolfcamp A Upper: 3 - Wolfcamp A Lower: 2 Online 4Q17 High Intensity Completions Testing 3,000 lbs/ft to 5,000 lbs/ft Online 4Q16 Multi-Zone Development 3-well pad with 10,000 ft laterals 3rd Bone Spring, Wolfcamp A Upper and Wolfcamp A Lower Online 2Q17

NBL 0 10 20 30 40 50 60 70 80 90 0% 20% 40% 60% 80% 100% Wellhead Liquids % NBL High EUR and High Liquids Mix DJ Basin: Foundational Asset of the USO Portfolio 30 Source: RS Energy; 2015 2 Stream data; Peers include: PDCE, APC, XOG, ECA, SYRG, BCEI, WLL, and BBG Large, high-quality, contiguous acreage position DJ Basin Average Operator EUR vs. Liquids % Creating Differential Value with Long Laterals, Midstream Advantage and High Liquids Content Increasing Type Curves in Focus Development Areas Enhancing Capital Efficiency through Technology and Sub-surface Expertise DJ Basin 352,000 net acres, 70% Liquids 3,220 gross locations, avg. 8,400 ft. lateral length 2 BBoe net unrisked resources 79% Avg. WI NBL Acreage IDP Areas Low GOR Mid GOR High GOR East Pony Wells Ranch Mustang Greeley Crescent Bronco Weld W el lh ea d Bo e /f t

NBL 0 50 100 150 200 2016* 2017E 2020E DJ Basin Sales Volumes 0 250 500 750 1,000 1,250 1,500 2016 2017E 2020E DJ Basin Capital** $MM DJ Basin Outlook to 2020 31 Total Sales Volume 11-16%* CAGR 2016-2020E Near-Term Focus on Wells Ranch, East Pony and Mustang Areas Continued Expansion of Necessary NBLX and Third-party Infrastructure to Support Growth 2017E Capital Includes 2-3 Drilling Rigs with ~130 Wells Commencing Production 2017 program delivers same lateral footage as 9 rigs in 2014 Solid growth from advantaged position MBoe/d * Adjusted for divestitures ** Excludes NBLX estimated capital expenditures Upside Horizontal Upside Base Vertical 2 2016 Average Rig Count 2-3 2017E 5-6 2020E ~50 Wells on Avg. per Rig per Year

NBL 0 50 100 150 200 0 50 100 150 200 250 300 Days on Production Wells Ranch, East Pony and Mustang Per Well Production 2014 2015 2016 Technical Expertise Driving Evolution of DJ Basin Completion Designs 32 Enhanced completions increasing ultimate recovery 2016 Plug-&-Perf Completion, Monobore Slickwater Fracs: 1,000+ lbs/ft 2015 Openhole Completion Slickwater Fracs: 650-750 lbs/ft 2014 Openhole Completion Gel Fracs: 750-1000 lbs/ft Reflects Gross 3 Stream, Normalized to 9,500 Enhanced Completion Designs Driving Improved Well Productivity 2016 well performance 15% above 2015 Achieving Higher Ultimate Recoveries and Value through Controlled Flow- back Current Well Design Benefits Enhanced near wellbore rock stimulation Increased entry points through cluster spacing Monobore and slickwater cost savings Testing Higher Proppant Upside Up to 2,500+ lbs/ft proppant Cum. MBoe
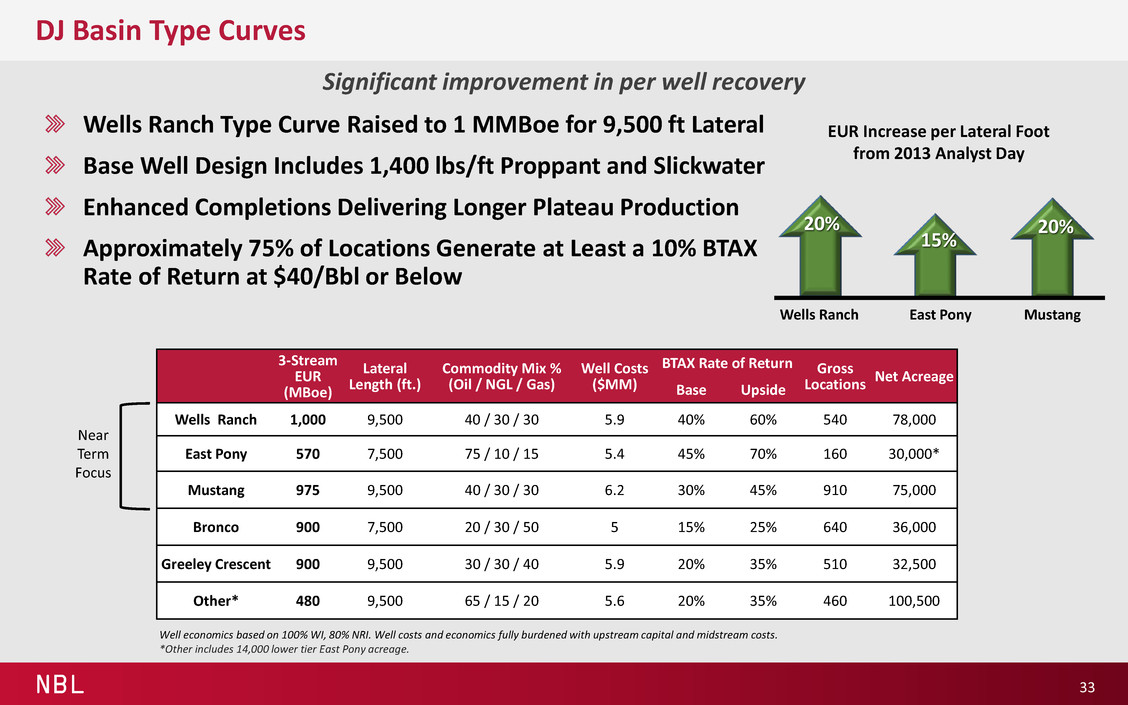
NBL DJ Basin Type Curves 33 Significant improvement in per well recovery Well economics based on 100% WI, 80% NRI. Well costs and economics fully burdened with upstream capital and midstream costs. *Other includes 14,000 lower tier East Pony acreage. 3-Stream EUR (MBoe) Lateral Length (ft.) Commodity Mix % (Oil / NGL / Gas) Well Costs ($MM) BTAX Rate of Return Gross Locations Net Acreage Base Upside Wells Ranch 1,000 9,500 40 / 30 / 30 5.9 40% 60% 540 78,000 East Pony 570 7,500 75 / 10 / 15 5.4 45% 70% 160 30,000* Mustang 975 9,500 40 / 30 / 30 6.2 30% 45% 910 75,000 Bronco 900 7,500 20 / 30 / 50 5 15% 25% 640 36,000 Greeley Crescent 900 9,500 30 / 30 / 40 5.9 20% 35% 510 32,500 Other* 480 9,500 65 / 15 / 20 5.6 20% 35% 460 100,500 Wells Ranch Type Curve Raised to 1 MMBoe for 9,500 ft Lateral Base Well Design Includes 1,400 lbs/ft Proppant and Slickwater Enhanced Completions Delivering Longer Plateau Production Approximately 75% of Locations Generate at Least a 10% BTAX Rate of Return at $40/Bbl or Below 20% Wells Ranch East Pony Mustang EUR Increase per Lateral Foot from 2013 Analyst Day Near Term Focus 15% 20%

NBL 0 25 50 75 100 125 150 0 25 50 75 100 125 150 175 200 Days on Production Wells Ranch Type Curve 2,500 lbs/ft Completions Current Type Curve (1,400 lbs/ft) 2013 Type Curve (700 lbs/ft) DJ Basin: Wells Ranch Development Area 34 Cum. MBoe Creating more value in core IDP Increased Acreage Position to 78,000 Net Acres through Acreage Exchange 540 remaining locations Drilling Long Laterals in Less than 6 Days and Short Laterals in Less than 4 Days Advantaged Midstream Position with Noble Midstream Central Gathering Facility and Proximity to Grand Parkway Testing Higher Proppant Concentration Upside Early performance of recent wells testing up to 2,500 lbs/ft are experiencing higher initial rates Gross 3 Stream, Normalized to 9,500 ft NBL Acreage 2,500 lbs/ft Wells
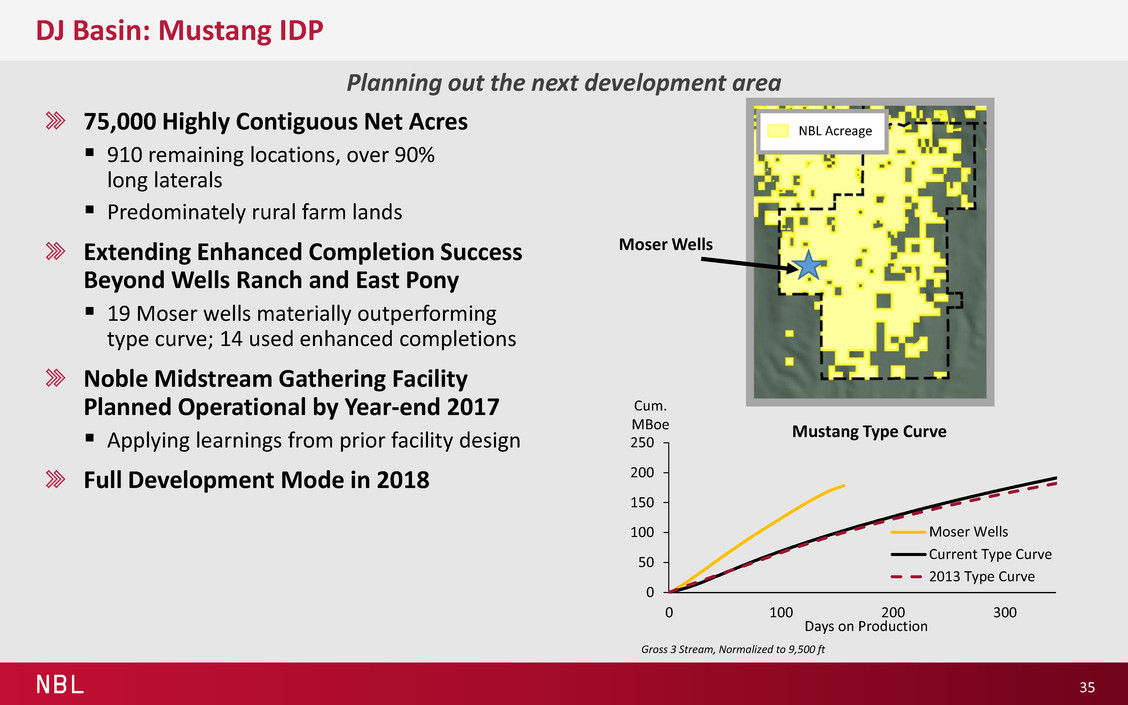
NBL 0 50 100 150 200 250 0 100 200 300 Days on Production Mustang Type Curve Moser Wells Current Type Curve 2013 Type Curve DJ Basin: Mustang IDP 35 75,000 Highly Contiguous Net Acres 910 remaining locations, over 90% long laterals Predominately rural farm lands Extending Enhanced Completion Success Beyond Wells Ranch and East Pony 19 Moser wells materially outperforming type curve; 14 used enhanced completions Noble Midstream Gathering Facility Planned Operational by Year-end 2017 Applying learnings from prior facility design Full Development Mode in 2018 Planning out the next development area Gross 3 Stream, Normalized to 9,500 ft Cum. MBoe Moser Wells NBL Acreage
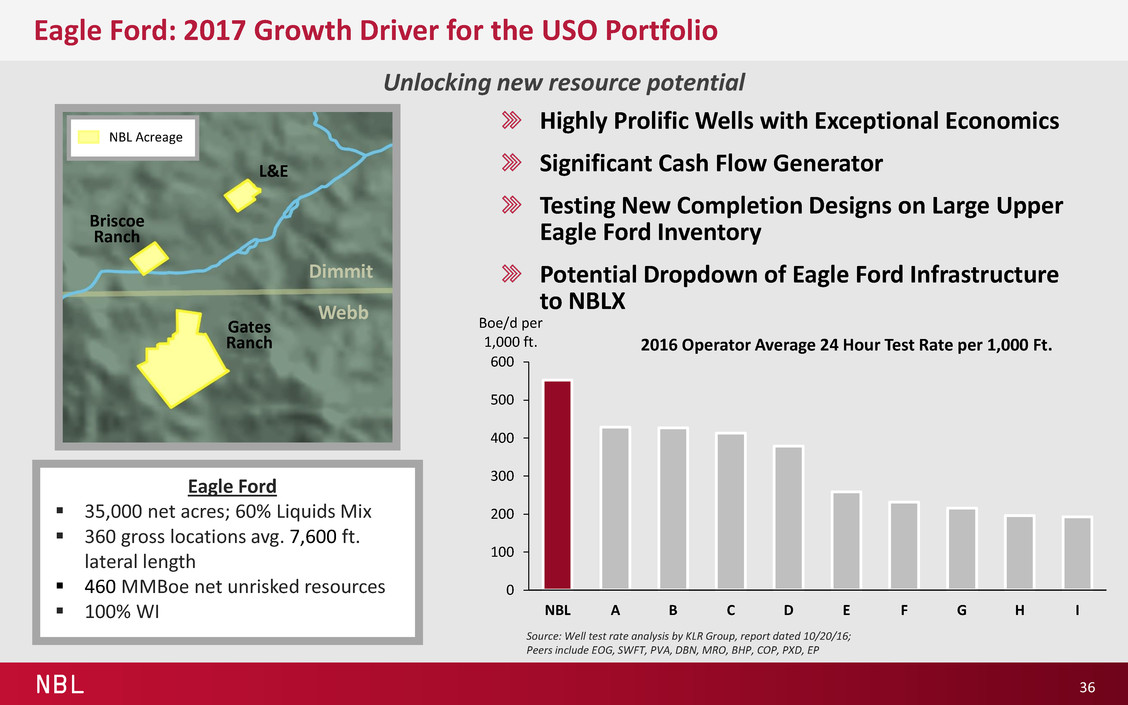
NBL 0 100 200 300 400 500 600 NBL A B C D E F G H I 2016 Operator Average 24 Hour Test Rate per 1,000 Ft. Eagle Ford: 2017 Growth Driver for the USO Portfolio Highly Prolific Wells with Exceptional Economics Significant Cash Flow Generator Testing New Completion Designs on Large Upper Eagle Ford Inventory Potential Dropdown of Eagle Ford Infrastructure to NBLX 36 Unlocking new resource potential Boe/d per 1,000 ft. Source: Well test rate analysis by KLR Group, report dated 10/20/16; Peers include EOG, SWFT, PVA, DBN, MRO, BHP, COP, PXD, EP Eagle Ford 35,000 net acres; 60% Liquids Mix 360 gross locations avg. 7,600 ft. lateral length 460 MMBoe net unrisked resources 100% WI L&E Gates Ranch Briscoe Ranch Dimmit Webb NBL Acreage

NBL 0 25 50 75 100 2016** 2017E 2020E Eagle Ford Sales Volumes 0 100 200 300 400 500 2016 2017E 2020E Eagle Ford Capital $MM Eagle Ford Outlook to 2020 37 Total Sales Volume 15% CAGR 2016-2020E Net Free Cash Flow* Positive Every Year in Base Plan Commencing Production on ~40 Wells in 2017 2017E Capital Focused on Gates Ranch Solid production and cash flow contributions MBoe/d * See appendix for definition of this non-GAAP measure ** Adjusted for divestitures 0.3 2016E Average Rig Count 1 2017E 2 2020E ~30 Wells on Avg. per Rig per Year
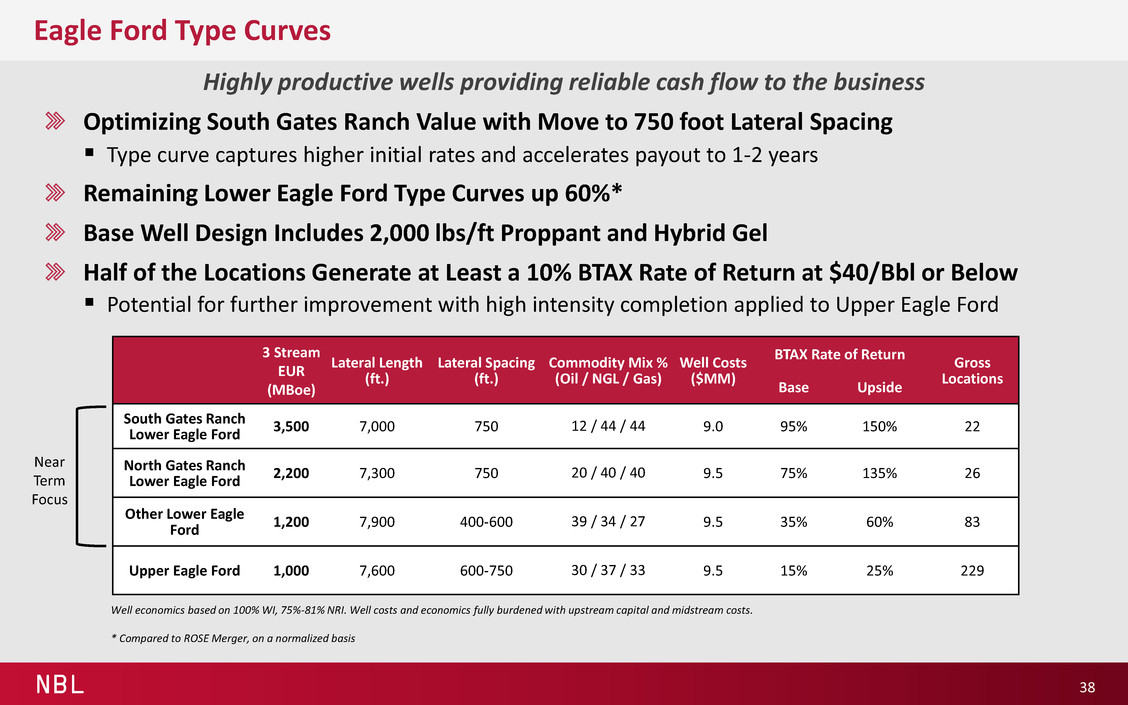
NBL Eagle Ford Type Curves 38 Highly productive wells providing reliable cash flow to the business Optimizing South Gates Ranch Value with Move to 750 foot Lateral Spacing Type curve captures higher initial rates and accelerates payout to 1-2 years Remaining Lower Eagle Ford Type Curves up 60%* Base Well Design Includes 2,000 lbs/ft Proppant and Hybrid Gel Half of the Locations Generate at Least a 10% BTAX Rate of Return at $40/Bbl or Below Potential for further improvement with high intensity completion applied to Upper Eagle Ford 3 Stream EUR (MBoe) Lateral Length (ft.) Lateral Spacing (ft.) Commodity Mix % (Oil / NGL / Gas) Well Costs ($MM) BTAX Rate of Return Gross Locations Base Upside South Gates Ranch Lower Eagle Ford 3,500 7,000 750 12 / 44 / 44 9.0 95% 150% 22 North Gates Ranch Lower Eagle Ford 2,200 7,300 750 20 / 40 / 40 9.5 75% 135% 26 Other Lower Eagle Ford 1,200 7,900 400-600 39 / 34 / 27 9.5 35% 60% 83 Upper Eagle Ford 1,000 7,600 600-750 30 / 37 / 33 9.5 15% 25% 229 Well economics based on 100% WI, 75%-81% NRI. Well costs and economics fully burdened with upstream capital and midstream costs. * Compared to ROSE Merger, on a normalized basis Near Term Focus
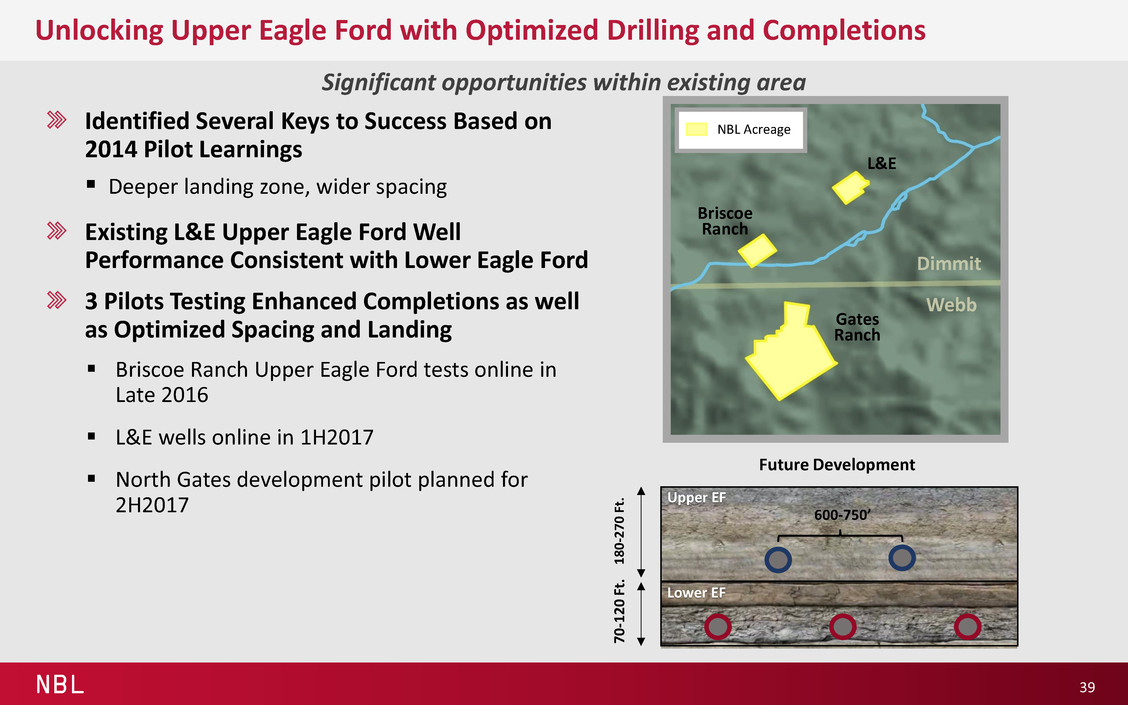
NBL Unlocking Upper Eagle Ford with Optimized Drilling and Completions 39 Significant opportunities within existing area Identified Several Keys to Success Based on 2014 Pilot Learnings Deeper landing zone, wider spacing Existing L&E Upper Eagle Ford Well Performance Consistent with Lower Eagle Ford 3 Pilots Testing Enhanced Completions as well as Optimized Spacing and Landing Briscoe Ranch Upper Eagle Ford tests online in Late 2016 L&E wells online in 1H2017 North Gates development pilot planned for 2H2017 Future Development 600-750’ Upper EF Lower EF 1 8 0 -2 7 0 Ft . 7 0 -1 2 0 F t. L&E Gates Ranch Briscoe Ranch Dimmit Webb NBL Acreage
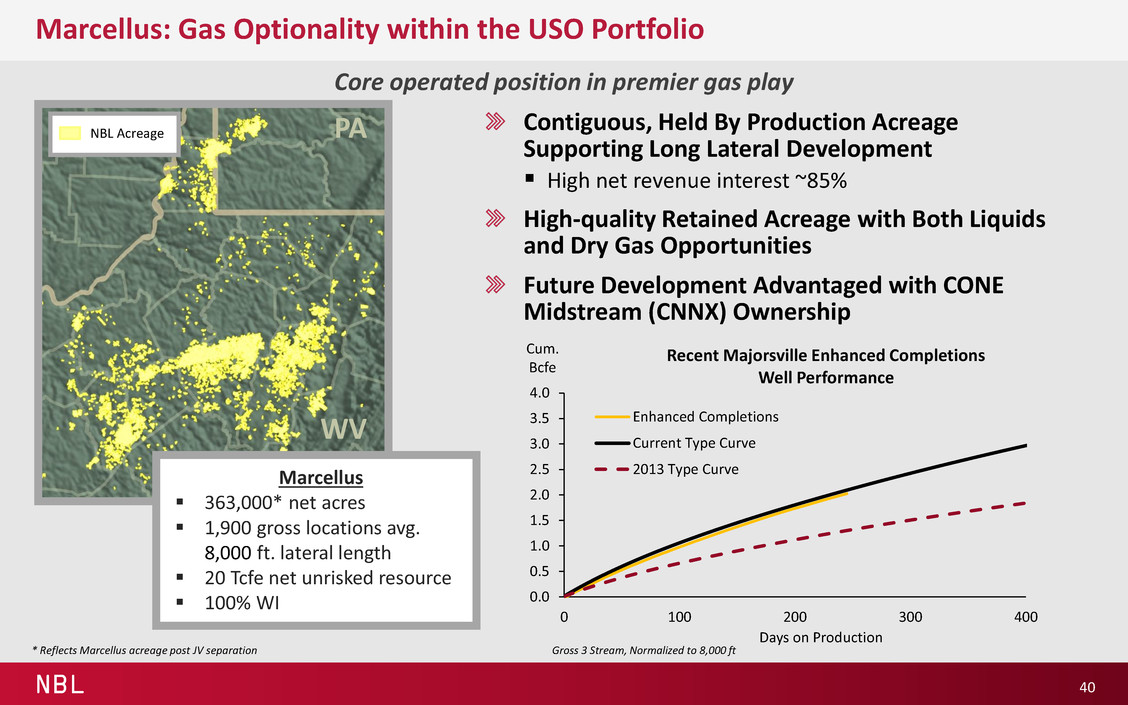
NBL 0.0 0.5 1.0 1.5 2.0 2.5 3.0 3.5 4.0 0 100 200 300 400 Days on Production Recent Majorsville Enhanced Completions Well Performance Enhanced Completions Current Type Curve 2013 Type Curve Marcellus: Gas Optionality within the USO Portfolio 40 Core operated position in premier gas play Contiguous, Held By Production Acreage Supporting Long Lateral Development High net revenue interest ~85% High-quality Retained Acreage with Both Liquids and Dry Gas Opportunities Future Development Advantaged with CONE Midstream (CNNX) Ownership Marcellus 363,000* net acres 1,900 gross locations avg. 8,000 ft. lateral length 20 Tcfe net unrisked resource 100% WI * Reflects Marcellus acreage post JV separation NBL Acreage Cum. Bcfe PA WV Gross 3 Stream, Normalized to 8,000 ft

NBL 0 100 200 300 400 500 600 Marcellus Sales Volumes 0 100 200 300 400 500 2016 2017E 2020E Marcellus Capital $MM Marcellus Outlook to 2020 41 Total Sales Volumes Average between 420 – 450 MMcfe/d 2016-2020E Net Free Cash Flow* Positive throughout Forecast Period Unit Operating Cash Flow Margin* Increases 2 – 3X 2017 Estimated Capital Allocated to Bring Online Drilled Uncompleted Wells Substantial volume on minimal capital MMcfe/d 0 2016 Average Operated Rig Count ~20 Wells on Avg. per Rig per Year 0 2017E 1 2020E * See appendix for definition of this non-GAAP measure 2016 Reported 2016 Adjusted for JV Separation 2017E 2020E

NBL Marcellus Type Curves 42 Prolific wells contributing steady cash flow to the USO business Well economics based on 100% WI, 85% NRI. Well costs and economics fully burdened with upstream capital and midstream costs. * Marcellus upside price assumes $0.50 Henry Hub increase **Utica stacked acreage not reflected in total acreage Enhanced Completions Significantly Improving EURs Base well design includes 2,000 lbs/ft proppant and slickwater Testing 3,000 lbs/ft proppant in 2017 Long laterals improving well economics Near Term Focus on DUCs and High Value Inventory within Majorsville, Moundsville and North Nineveh 3 Stream EUR (Bcfe) Lateral Length (ft.) Commodity Mix % (Oil / NGL / Gas) Well Costs ($MM) BTAX Rate of Return Gross Locations Net Acreage Base Upside* Majorsville 17.5 8,000 5 / 20 / 75 8.0 40% 50% 80 33,000 Moundsville Marcellus 14 8,000 17 / 39 / 44 8.0 30% 40% 60 10,000 North Nineveh 16 8,000 0 / 0 / 100 8.0 40% 55% 40 11,000 West Virginia Wet 13 8,000 0 / 15 / 85 8.0 20% 30% 250 35,000 Moundsville Utica 21 8,000 0 / 0 / 100 12.8 55% 75% 60 15,000** Other Marcellus 11-14 8,000 0 / 10 / 90 8.0 15% 25% 1400 274,000 67% Majorsville EUR Increase per Lateral Foot from 2013 Analyst Day Near Term Focus
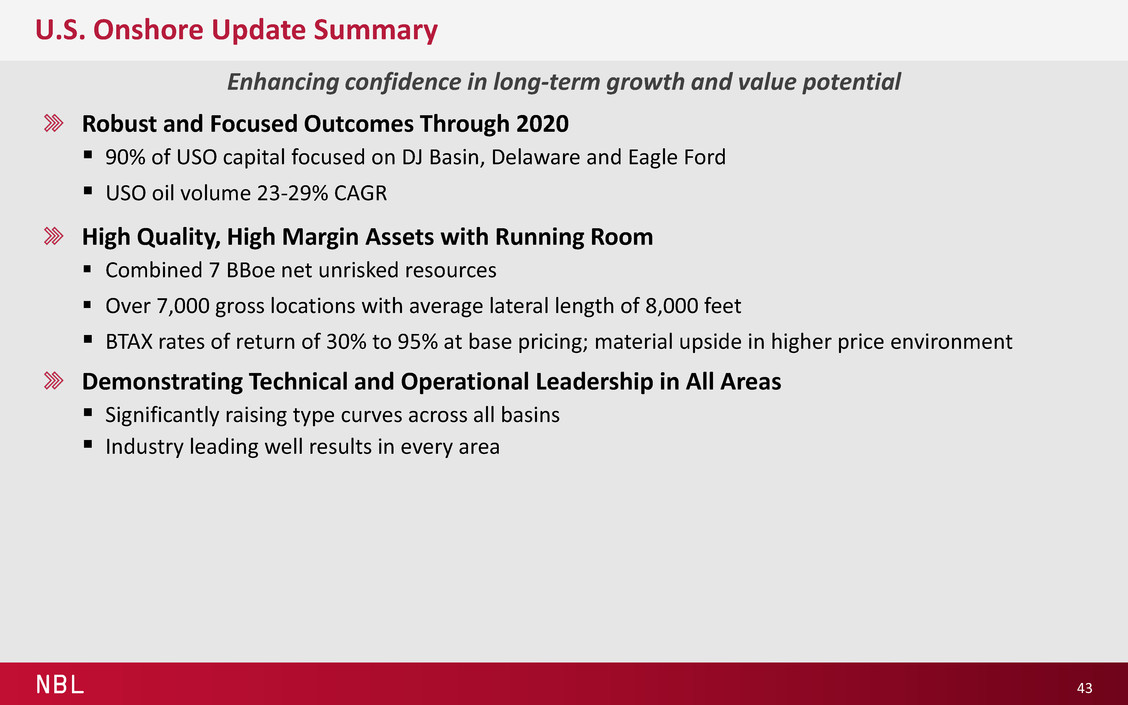
NBL U.S. Onshore Update Summary 43 Enhancing confidence in long-term growth and value potential Robust and Focused Outcomes Through 2020 90% of USO capital focused on DJ Basin, Delaware and Eagle Ford USO oil volume 23-29% CAGR High Quality, High Margin Assets with Running Room Combined 7 BBoe net unrisked resources Over 7,000 gross locations with average lateral length of 8,000 feet BTAX rates of return of 30% to 95% at base pricing; material upside in higher price environment Demonstrating Technical and Operational Leadership in All Areas Significantly raising type curves across all basins Industry leading well results in every area
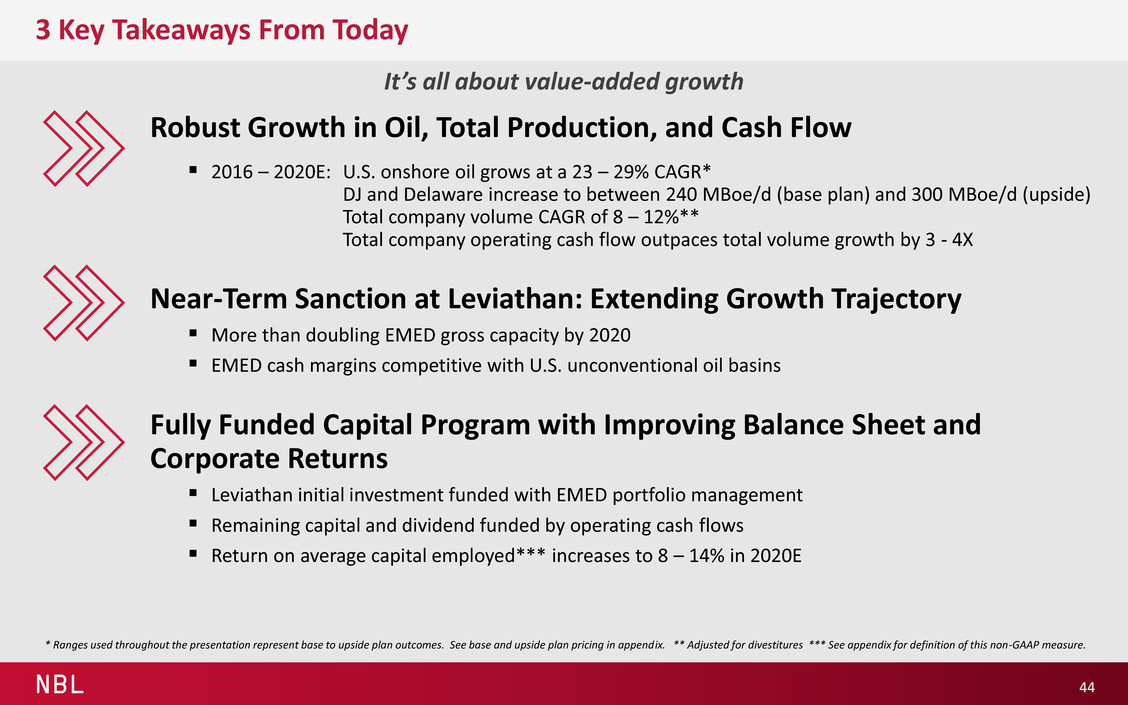
NBL 3 Key Takeaways From Today Robust Growth in Oil, Total Production, and Cash Flow 2016 – 2020E: U.S. onshore oil grows at a 23 – 29% CAGR* DJ and Delaware increase to between 240 MBoe/d (base plan) and 300 MBoe/d (upside) Total company volume CAGR of 8 – 12%** Total company operating cash flow outpaces total volume growth by 3 - 4X Near-Term Sanction at Leviathan: Extending Growth Trajectory More than doubling EMED gross capacity by 2020 EMED cash margins competitive with U.S. unconventional oil basins Fully Funded Capital Program with Improving Balance Sheet and Corporate Returns Leviathan initial investment funded with EMED portfolio management Remaining capital and dividend funded by operating cash flows Return on average capital employed*** increases to 8 – 14% in 2020E 44 It’s all about value-added growth * Ranges used throughout the presentation represent base to upside plan outcomes. See base and upside plan pricing in appendix. ** Adjusted for divestitures *** See appendix for definition of this non-GAAP measure.

NBL Appendix 45

NBL 46 Period Base Plan Upside Plan WTI, Brent ($/Bbl) Henry Hub ($/Mcf) WTI, Brent ($/Bbl) Henry Hub ($/Mcf) 2017 $50 $3 $60 $3 2018 $55 $3 $65 $3 2019 $55 $3 $65 $3 2020 $56 $3 $66 $3 ’17-’20 Avg $54 $3 $64 $3 Price Deck Assumptions Note: Ranges of production and cash flow throughout the presentation represent base to upside plan outcomes
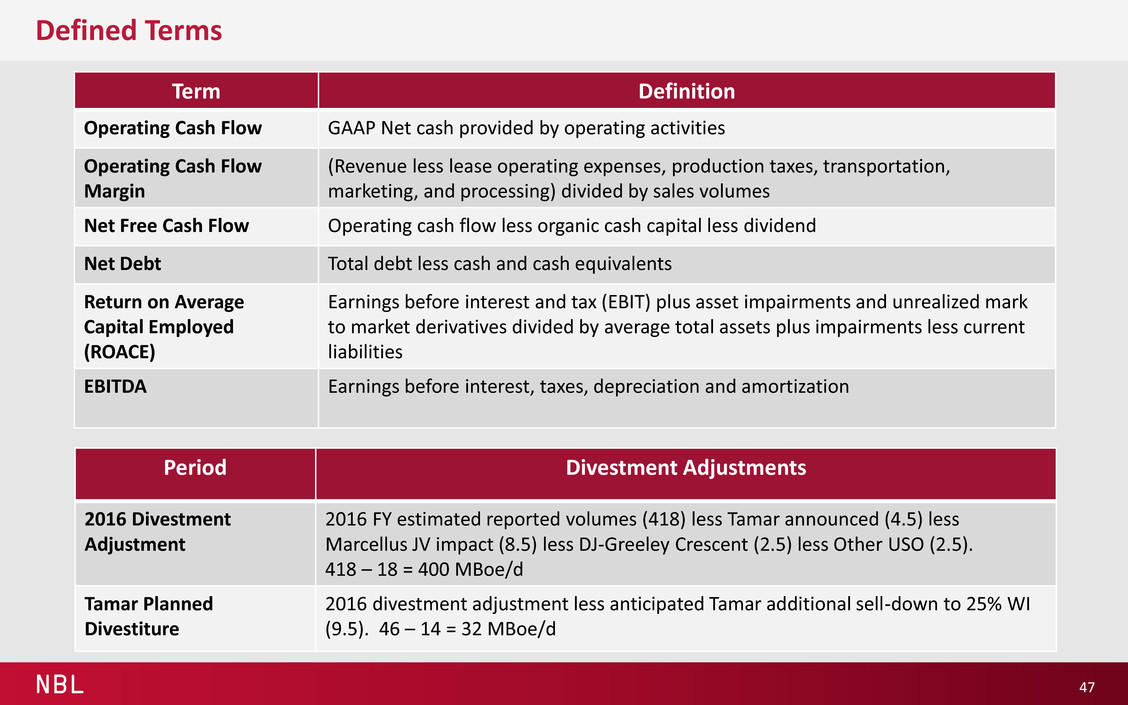
NBL Defined Terms 47 Defined Terms and Divestment Adjustments Term Definition Operating Cash Flow GAAP Net cash provided by operating activities Operating Cash Flow Margin (Revenue less lease operating expenses, production taxes, transportation, marketing, and processing) divided by sales volumes Net Free Cash Flow Operating cash flow less organic cash capital less dividend Net Debt Total debt less cash and cash equivalents Return on Average Capital Employed (ROACE) Earnings before interest and tax (EBIT) plus asset impairments and unrealized mark to market derivatives divided by average total assets plus impairments less current liabilities EBITDA Earnings before interest, taxes, depreciation and amortization Period Divestment Adjustments 2016 Divestment Adjustment 2016 FY estimated reported volumes (418) less Tamar announced (4.5) less Marcellus JV impact (8.5) less DJ-Greeley Crescent (2.5) less Other USO (2.5). 418 – 18 = 400 MBoe/d Tamar Planned Divestiture 2016 divestment adjustment less anticipated Tamar additional sell-down to 25% WI (9.5). 46 – 14 = 32 MBoe/d
NBL Forward-Looking Statements and Other Matters 48 This presentation contains certain “forward-looking statements” within the meaning of the federal securities law. Words such as “anticipates,” “believes,” “expects,” “intends,” “will,” “should,” “may,” “estimate,” and similar expressions may be used to identify forward-looking statements. Forward-looking statements are not statements of historical fact and reflect Noble Energy’s current views about future events. They include estimates of oil and natural gas reserves and resources, estimates of future production, assumptions regarding future oil and natural gas pricing, planned drilling activity, future results of operations, projected cash flow and liquidity, business strategy and other plans and objectives for future operations. No assurances can be given that the forward-looking statements contained in this presentation will occur as projected, and actual results may differ materially from those projected. Forward-looking statements are based on current expectations, estimates and assumptions that involve a number of risks and uncertainties that could cause actual results to differ materially from those projected. These risks include, without limitation, the volatility in commodity prices for crude oil and natural gas, the presence or recoverability of estimated reserves, the ability to replace reserves, environmental risks, drilling and operating risks, exploration and development risks, competition, government regulation or other actions, the ability of management to execute its plans to meet its goals and other risks inherent in Noble Energy’s business that are discussed in its most recent Form 10-K and in other reports on file with the Securities and Exchange Commission (“SEC”). These reports are also available from Noble Energy’s offices or website, http://www.nobleenergyinc.com. Forward-looking statements are based on the estimates and opinions of management at the time the statements are made. Noble Energy does not assume any obligation to update forward-looking statements should circumstances or management's estimates or opinions change. The SEC requires oil and gas companies, in their filings with the SEC, to disclose proved reserves that a company has demonstrated by actual production or conclusive formation tests to be economically and legally producible under existing economic and operating conditions. The SEC permits the optional disclosure of probable and possible reserves, however, we have not disclosed our probable and possible reserves in our filings with the SEC. We use certain terms in this presentation, such as “net unrisked resources”, “gross natural gas resources”, and “EUR” or “estimated ultimate recovery”. These estimates are by their nature more speculative than estimates of proved, probable and possible reserves and accordingly are subject to substantially greater risk of being actually realized. The SEC guidelines strictly prohibit us from including these estimates in filings with the SEC. Investors are urged to consider closely the disclosures and risk factors in our most recent Form 10-K and in other reports on file with the SEC, available from Noble Energy’s offices or website, http://www.nobleenergyinc.com. This presentation also contains certain forward-looking non-GAAP financial measures, including return on average capital employed, net free cash flow, operating cash flow margin, EBITDA and net debt. Due to the forward-looking nature of the aforementioned non-GAAP financial measures, management cannot reliably or reasonably predict certain of the necessary components of the most directly comparable forward-looking GAAP measures, such as future impairments and future changes in working capital. Accordingly, we are unable to present a quantitative reconciliation of such forward-looking non-GAAP financial measures to their most directly comparable forward-looking GAAP financial measures. Amounts excluded from these non-GAAP measures in future periods could be significant. Management believes the aforementioned non-GAAP financial measures are good tools for internal use and the investment community in evaluating Noble Energy’s overall financial performance. These non-GAAP measures are broadly used to value and compare companies in the crude oil and natural gas industry.


