1Q19 Financial and Operational Results May 2019
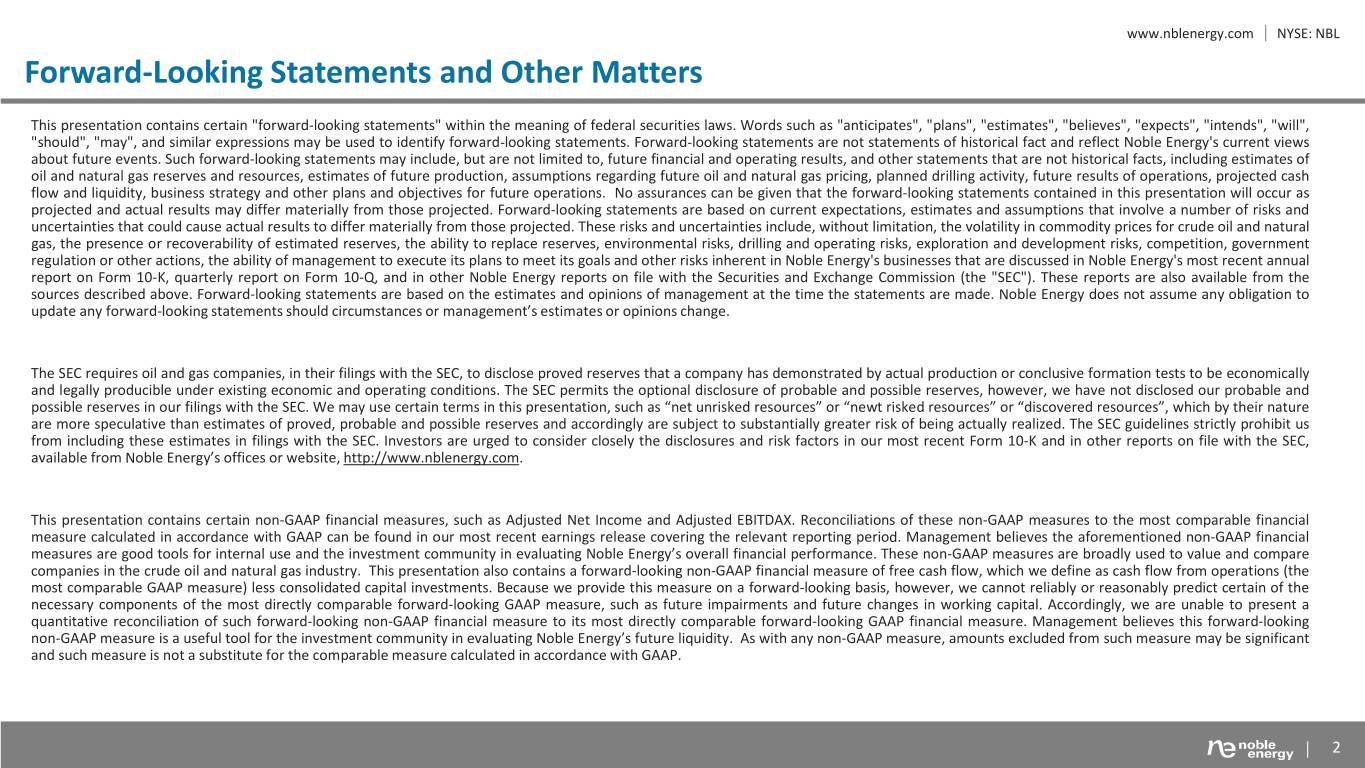
www.nblenergy.com NYSE: NBL Forward-Looking Statements and Other Matters This presentation contains certain "forward-looking statements" within the meaning of federal securities laws. Words such as "anticipates", "plans", "estimates", "believes", "expects", "intends", "will", "should", "may", and similar expressions may be used to identify forward-looking statements. Forward-looking statements are not statements of historical fact and reflect Noble Energy's current views about future events. Such forward-looking statements may include, but are not limited to, future financial and operating results, and other statements that are not historical facts, including estimates of oil and natural gas reserves and resources, estimates of future production, assumptions regarding future oil and natural gas pricing, planned drilling activity, future results of operations, projected cash flow and liquidity, business strategy and other plans and objectives for future operations. No assurances can be given that the forward-looking statements contained in this presentation will occur as projected and actual results may differ materially from those projected. Forward-looking statements are based on current expectations, estimates and assumptions that involve a number of risks and uncertainties that could cause actual results to differ materially from those projected. These risks and uncertainties include, without limitation, the volatility in commodity prices for crude oil and natural gas, the presence or recoverability of estimated reserves, the ability to replace reserves, environmental risks, drilling and operating risks, exploration and development risks, competition, government regulation or other actions, the ability of management to execute its plans to meet its goals and other risks inherent in Noble Energy's businesses that are discussed in Noble Energy's most recent annual report on Form 10-K, quarterly report on Form 10-Q, and in other Noble Energy reports on file with the Securities and Exchange Commission (the "SEC"). These reports are also available from the sources described above. Forward-looking statements are based on the estimates and opinions of management at the time the statements are made. Noble Energy does not assume any obligation to update any forward-looking statements should circumstances or management’s estimates or opinions change. The SEC requires oil and gas companies, in their filings with the SEC, to disclose proved reserves that a company has demonstrated by actual production or conclusive formation tests to be economically and legally producible under existing economic and operating conditions. The SEC permits the optional disclosure of probable and possible reserves, however, we have not disclosed our probable and possible reserves in our filings with the SEC. We may use certain terms in this presentation, such as “net unrisked resources” or “newt risked resources” or “discovered resources”, which by their nature are more speculative than estimates of proved, probable and possible reserves and accordingly are subject to substantially greater risk of being actually realized. The SEC guidelines strictly prohibit us from including these estimates in filings with the SEC. Investors are urged to consider closely the disclosures and risk factors in our most recent Form 10-K and in other reports on file with the SEC, available from Noble Energy’s offices or website, http://www.nblenergy.com. This presentation contains certain non-GAAP financial measures, such as Adjusted Net Income and Adjusted EBITDAX. Reconciliations of these non-GAAP measures to the most comparable financial measure calculated in accordance with GAAP can be found in our most recent earnings release covering the relevant reporting period. Management believes the aforementioned non-GAAP financial measures are good tools for internal use and the investment community in evaluating Noble Energy’s overall financial performance. These non-GAAP measures are broadly used to value and compare companies in the crude oil and natural gas industry. This presentation also contains a forward-looking non-GAAP financial measure of free cash flow, which we define as cash flow from operations (the most comparable GAAP measure) less consolidated capital investments. Because we provide this measure on a forward-looking basis, however, we cannot reliably or reasonably predict certain of the necessary components of the most directly comparable forward-looking GAAP measure, such as future impairments and future changes in working capital. Accordingly, we are unable to present a quantitative reconciliation of such forward-looking non-GAAP financial measure to its most directly comparable forward-looking GAAP financial measure. Management believes this forward-looking non-GAAP measure is a useful tool for the investment community in evaluating Noble Energy’s future liquidity. As with any non-GAAP measure, amounts excluded from such measure may be significant and such measure is not a substitute for the comparable measure calculated in accordance with GAAP. 2
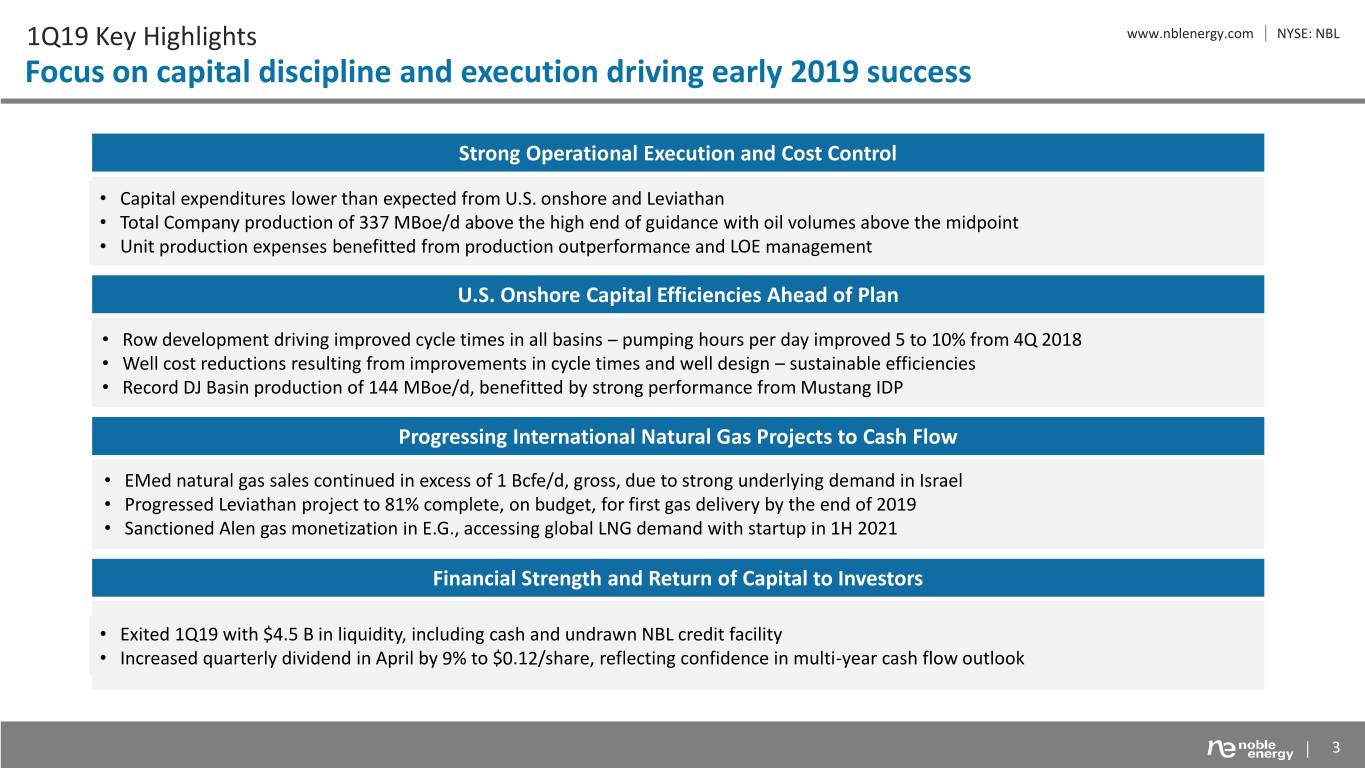
1Q19 Key Highlights www.nblenergy.com NYSE: NBL Focus on capital discipline and execution driving early 2019 success Strong Operational Execution and Cost Control • Capital expenditures lower than expected from U.S. onshore and Leviathan • Total Company production of 337 MBoe/d above the high end of guidance with oil volumes above the midpoint • Unit production expenses benefitted from production outperformance and LOE management U.S. Onshore Capital Efficiencies Ahead of Plan • Row development driving improved cycle times in all basins – pumping hours per day improved 5 to 10% from 4Q 2018 • Well cost reductions resulting from improvements in cycle times and well design – sustainable efficiencies • Record DJ Basin production of 144 MBoe/d, benefitted by strong performance from Mustang IDP Progressing International Natural Gas Projects to Cash Flow • EMed natural gas sales continued in excess of 1 Bcfe/d, gross, due to strong underlying demand in Israel • Progressed Leviathan project to 81% complete, on budget, for first gas delivery by the end of 2019 • Sanctioned Alen gas monetization in E.G., accessing global LNG demand with startup in 1H 2021 Financial Strength and Return of Capital to Investors • Exited 1Q19 with $4.5 B in liquidity, including cash and undrawn NBL credit facility • Increased quarterly dividend in April by 9% to $0.12/share, reflecting confidence in multi-year cash flow outlook 3
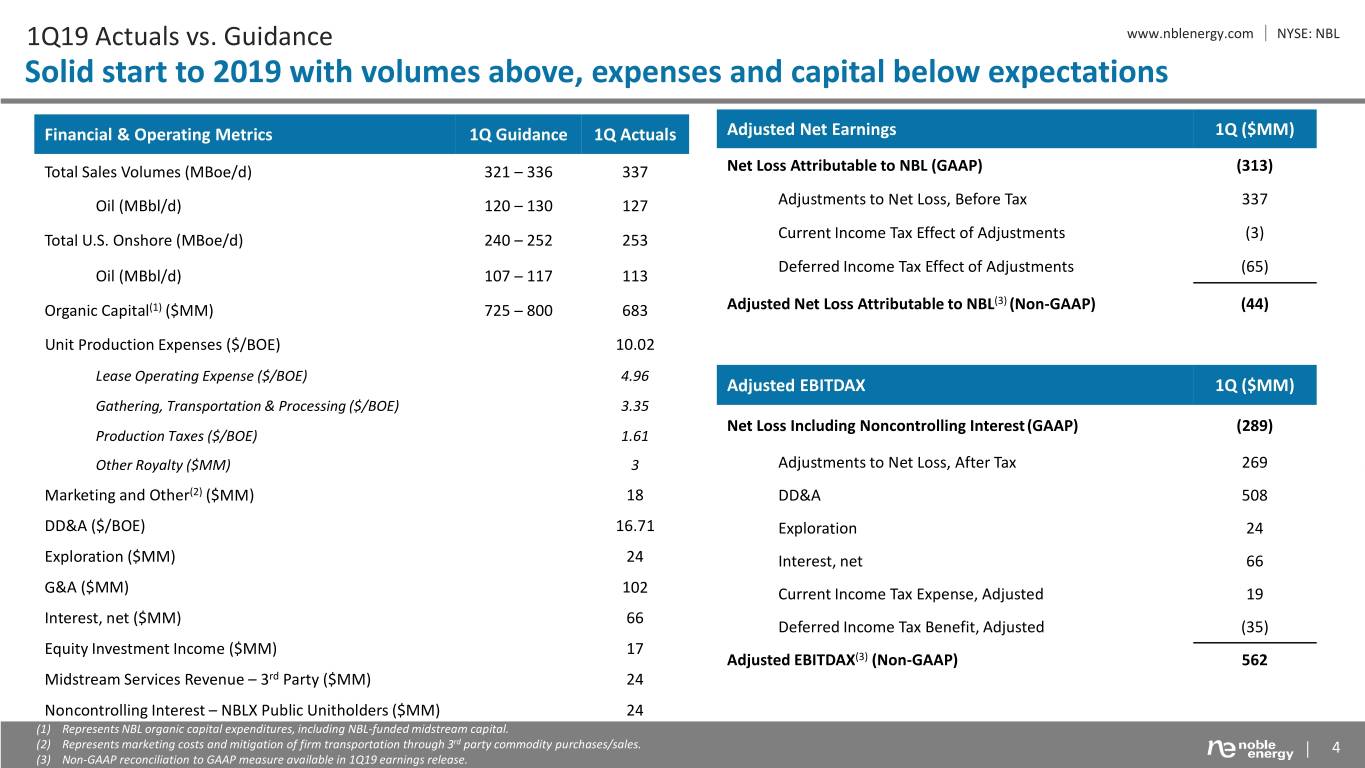
1Q19 Actuals vs. Guidance www.nblenergy.com NYSE: NBL Solid start to 2019 with volumes above, expenses and capital below expectations Financial & Operating Metrics 1Q Guidance 1Q Actuals Adjusted Net Earnings 1Q ($MM) Total Sales Volumes (MBoe/d) 321 – 336 337 Net Loss Attributable to NBL (GAAP) (313) Oil (MBbl/d) 120 – 130 127 Adjustments to Net Loss, Before Tax 337 Total U.S. Onshore (MBoe/d) 240 – 252 253 Current Income Tax Effect of Adjustments (3) Deferred Income Tax Effect of Adjustments (65) Oil (MBbl/d) 107 – 117 113 (3) Organic Capital(1) ($MM) 725 – 800 683 Adjusted Net Loss Attributable to NBL (Non-GAAP) (44) Unit Production Expenses ($/BOE) 10.02 Lease Operating Expense ($/BOE) 4.96 Adjusted EBITDAX 1Q ($MM) Gathering, Transportation & Processing ($/BOE) 3.35 Net Loss Including Noncontrolling Interest(GAAP) (289) Production Taxes ($/BOE) 1.61 Other Royalty ($MM) 3 Adjustments to Net Loss, After Tax 269 Marketing and Other(2) ($MM) 18 DD&A 508 DD&A ($/BOE) 16.71 Exploration 24 Exploration ($MM) 24 Interest, net 66 G&A ($MM) 102 Current Income Tax Expense, Adjusted 19 Interest, net ($MM) 66 Deferred Income Tax Benefit, Adjusted (35) Equity Investment Income ($MM) 17 Adjusted EBITDAX(3) (Non-GAAP) 562 Midstream Services Revenue – 3rd Party ($MM) 24 Noncontrolling Interest – NBLX Public Unitholders ($MM) 24 (1) Represents NBL organic capital expenditures, including NBL-funded midstream capital. (2) Represents marketing costs and mitigation of firm transportation through 3rd party commodity purchases/sales. 4 (3) Non-GAAP reconciliation to GAAP measure available in 1Q19 earnings release.
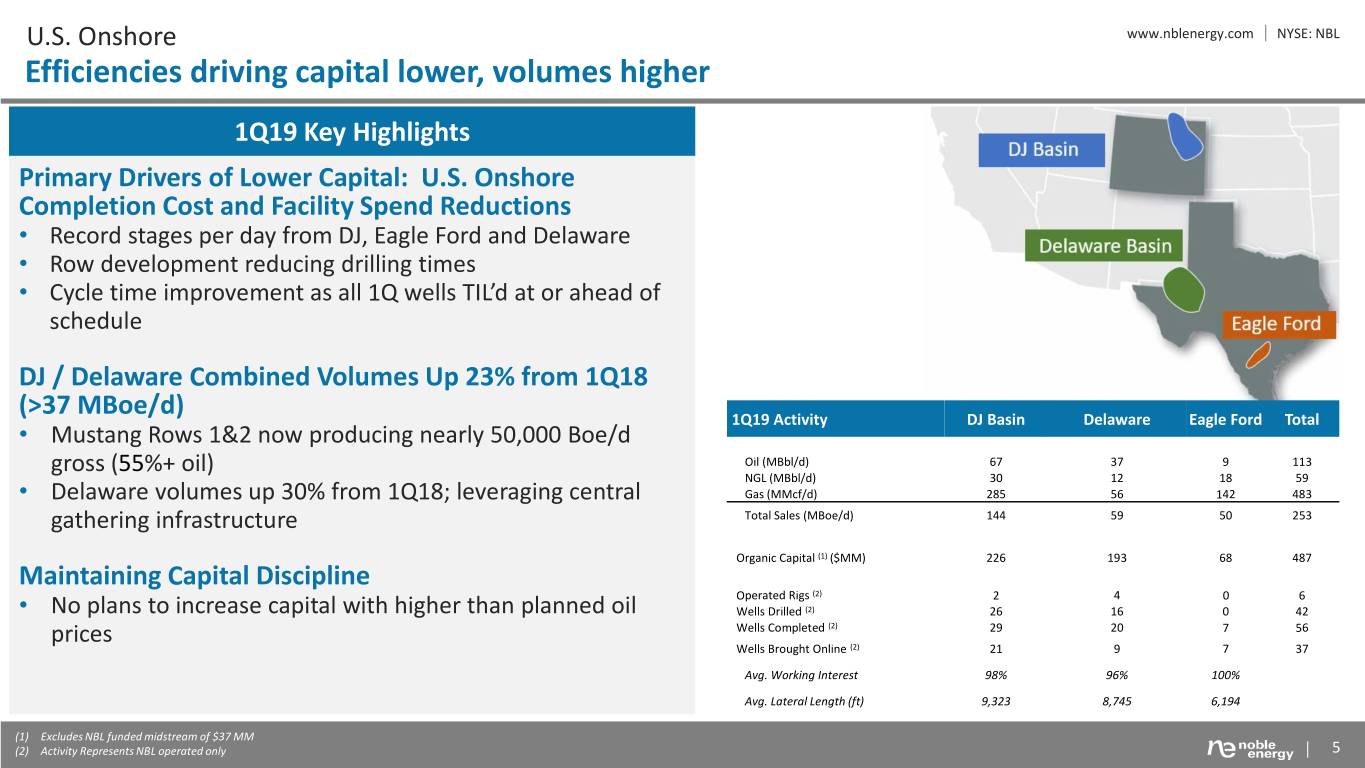
U.S. Onshore www.nblenergy.com NYSE: NBL Efficiencies driving capital lower, volumes higher 1Q19 Key Highlights Primary Drivers of Lower Capital: U.S. Onshore Completion Cost and Facility Spend Reductions • Record stages per day from DJ, Eagle Ford and Delaware • Row development reducing drilling times • Cycle time improvement as all 1Q wells TIL’d at or ahead of schedule DJ / Delaware Combined Volumes Up 23% from 1Q18 (>37 MBoe/d) 1Q19 Activity DJ Basin Delaware Eagle Ford Total • Mustang Rows 1&2 now producing nearly 50,000 Boe/d gross (55%+ oil) Oil (MBbl/d) 67 37 9 113 NGL (MBbl/d) 30 12 18 59 • Delaware volumes up 30% from 1Q18; leveraging central Gas (MMcf/d) 285 56 142 483 gathering infrastructure Total Sales (MBoe/d) 144 59 50 253 Organic Capital (1) ($MM) 226 193 68 487 Maintaining Capital Discipline Operated Rigs (2) 2 4 0 6 • No plans to increase capital with higher than planned oil Wells Drilled (2) 26 16 0 42 prices Wells Completed (2) 29 20 7 56 Wells Brought Online (2) 21 9 7 37 Avg. Working Interest 98% 96% 100% Avg. Lateral Length (ft) 9,323 8,745 6,194 (1) Excludes NBL funded midstream of $37 MM (2) Activity Represents NBL operated only 5

DJ Basin www.nblenergy.com NYSE: NBL Differentiated position and execution driving record production NBL Acreage Municipalities Continued Delivery from DJ Basin GOR: Low Mid High East Pony Weld • Generating operating cash flow above capital expenditures • Record net production of 144 MBoe/d in 1Q19, up 21% from 1Q18 . . . . . . . . . . . . . . . . . . . . . . . . . . . . . . . . . . . . . . . . . . Mustang/Wells Ranch Driving Outperformance Wells Ranch • Mustang / Wells Ranch total 106 MBoe/d in 1Q19, up 44% from 1Q18 • Additional Wells Ranch offloads providing gas and NGL uplift • Mustang Row 2 wells producing as expected (western portion of row 2 Mustang higher GOR area of field). . . . . . . . . . . . . . . . . . . . . . . . . . . . . . . . . . . . . . . . . . . . . . . 342,000 net acres 78% avg. WI Large-Scale Planning Provides Long-Term Visibility MBoe/d Net Production TILs • Currently permitted for ~600 locations – over 5 years activity at current 150 50 drilling pace 125 100 • Mustang CDP permits with 6-year timeframe 75 25 50 • Evaluating additional comprehensive drilling plans for future development 25 0 0 1Q18 2Q18 3Q18 4Q18 1Q19 Oil NGL Gas TILs 6
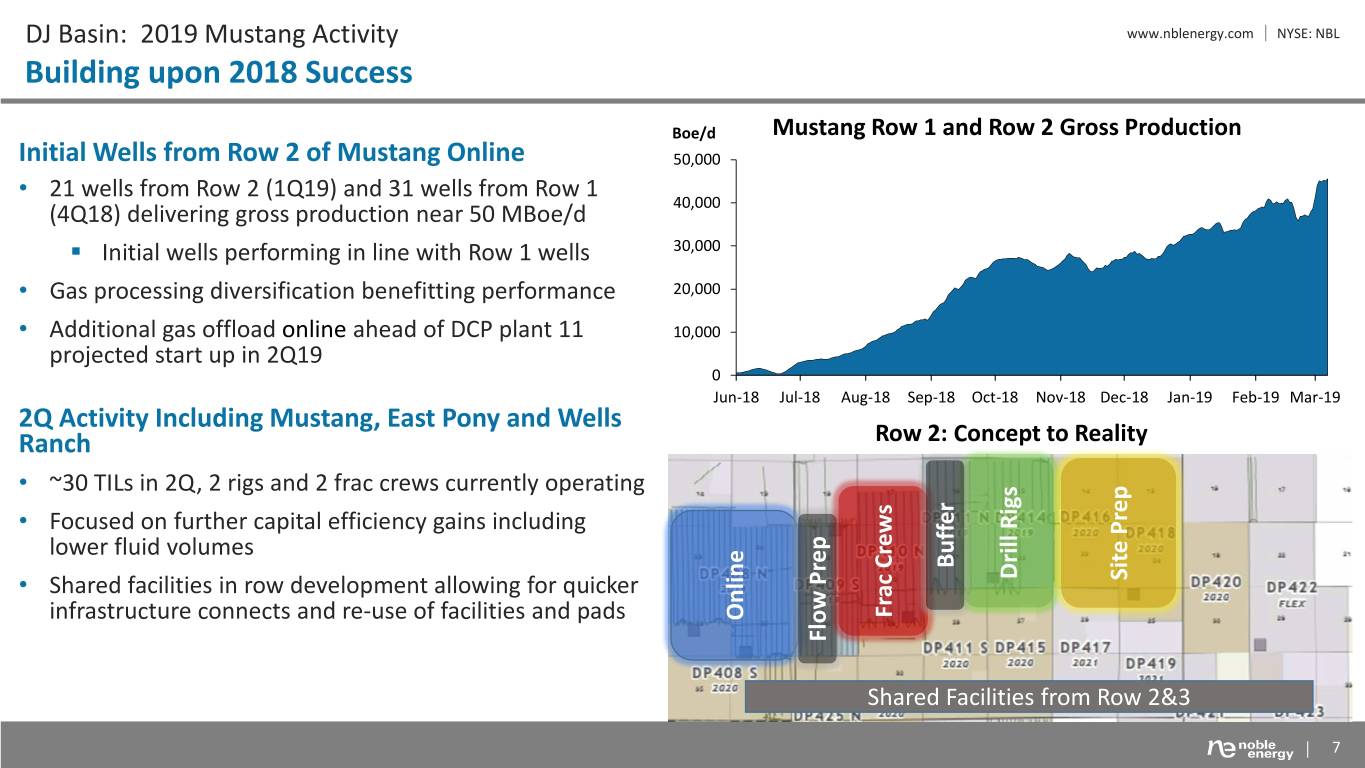
DJ Basin: 2019 Mustang Activity www.nblenergy.com NYSE: NBL Building upon 2018 Success Boe/d Mustang Row 1 and Row 2 Gross Production Initial Wells from Row 2 of Mustang Online 50,000 • 21 wells from Row 2 (1Q19) and 31 wells from Row 1 (4Q18) delivering gross production near 50 MBoe/d 40,000 . Initial wells performing in line with Row 1 wells 30,000 • Gas processing diversification benefitting performance 20,000 • Additional gas offload online ahead of DCP plant 11 10,000 projected start up in 2Q19 0 . . . . . . . . . . . . . . . . . . . . . . . . . . . . . . . . . . . . . . . . . . . . . . . Jun-18 Jul-18 Aug-18 Sep-18 Oct-18 Nov-18 Dec-18 Jan-19 Feb-19 Mar-19 2Q Activity Including Mustang, East Pony and Wells Ranch Row 2: Concept to Reality • ~30 TILs in 2Q, 2 rigs and 2 frac crews currently operating • Focused on further capital efficiency gains including lower fluid volumes. Buffer Drill Rigs Drill • Shared facilities in row development allowing for quicker Prep Site Frac Crews Frac infrastructure connects and re-use of facilities and pads . . Online . . . Flow Prep Shared Facilities from Row 2&3 7

Delaware Basin www.nblenergy.com NYSE: NBL Building momentum for 2H19 growth Reeves Strong 1Q Well Performance • Production flat from 4Q18 despite low TILs and acreage divestiture . • Wells TIL’d ahead of schedule from improved frac times • 1Q19 avg. IP-30 of 1,560 Boe/d from nine wells (2 3rd Bone Spring, 7 Wolfcamp) • Two wells drilled for leasehold retention at expected rates in SW Reeves • Remaining wells IP-30 rates avg. 211 Boe/d (68% oil) per 1,000’ Row Development Catalysts Upcoming • ~15-20 wells TIL in 2Q19, including row development completions NBL Acreage Currently running 4 rigs and 2 completion crews 94,000 net acres 1Q19 TILs • 72% avg. WI 2Q19 TILs • Significant production growth expected in 3Q/4Q . . . . . . . . . . . . . . .. . . . . . . MBoe/d Net Production TILs 60 30 EPIC Progressing, Gas and NGL Takeaway Secured 50 25 • EPIC early crude service on target for 3Q19 start-up 40 20 30 15 • Firm processing / takeaway for natural gas and NGLs 20 10 • Hedged basis for ~75% of WAHA-exposed gas volumes through 2020 10 5 0 0 1Q18 2Q18 3Q18 4Q18 1Q19 Oil NGL Gas Divested TILs 8
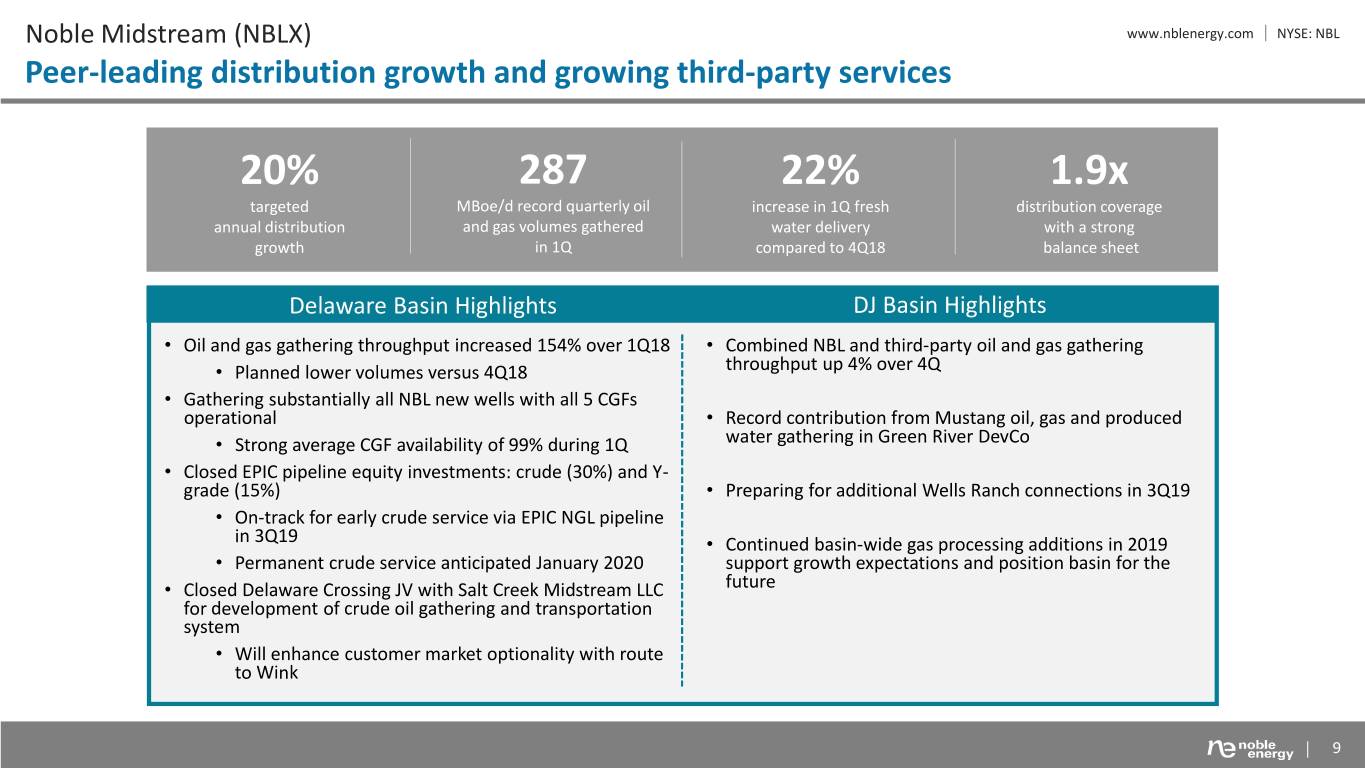
Noble Midstream (NBLX) www.nblenergy.com NYSE: NBL Peer-leading distribution growth and growing third-party services 20% 287 22% 1.9x targeted MBoe/d record quarterly oil increase in 1Q fresh distribution coverage annual distribution and gas volumes gathered water delivery with a strong growth in 1Q compared to 4Q18 balance sheet Delaware Basin Highlights DJ Basin Highlights • Oil and gas gathering throughput increased 154% over 1Q18 • Combined NBL and third-party oil and gas gathering • Planned lower volumes versus 4Q18 throughput up 4% over 4Q • Gathering substantially all NBL new wells with all 5 CGFs operational • Record contribution from Mustang oil, gas and produced • Strong average CGF availability of 99% during 1Q water gathering in Green River DevCo • Closed EPIC pipeline equity investments: crude (30%) and Y- grade (15%) • Preparing for additional Wells Ranch connections in 3Q19 • On-track for early crude service via EPIC NGL pipeline in 3Q19 • Continued basin-wide gas processing additions in 2019 • Permanent crude service anticipated January 2020 support growth expectations and position basin for the • Closed Delaware Crossing JV with Salt Creek Midstream LLC future for development of crude oil gathering and transportation system • Will enhance customer market optionality with route to Wink 9
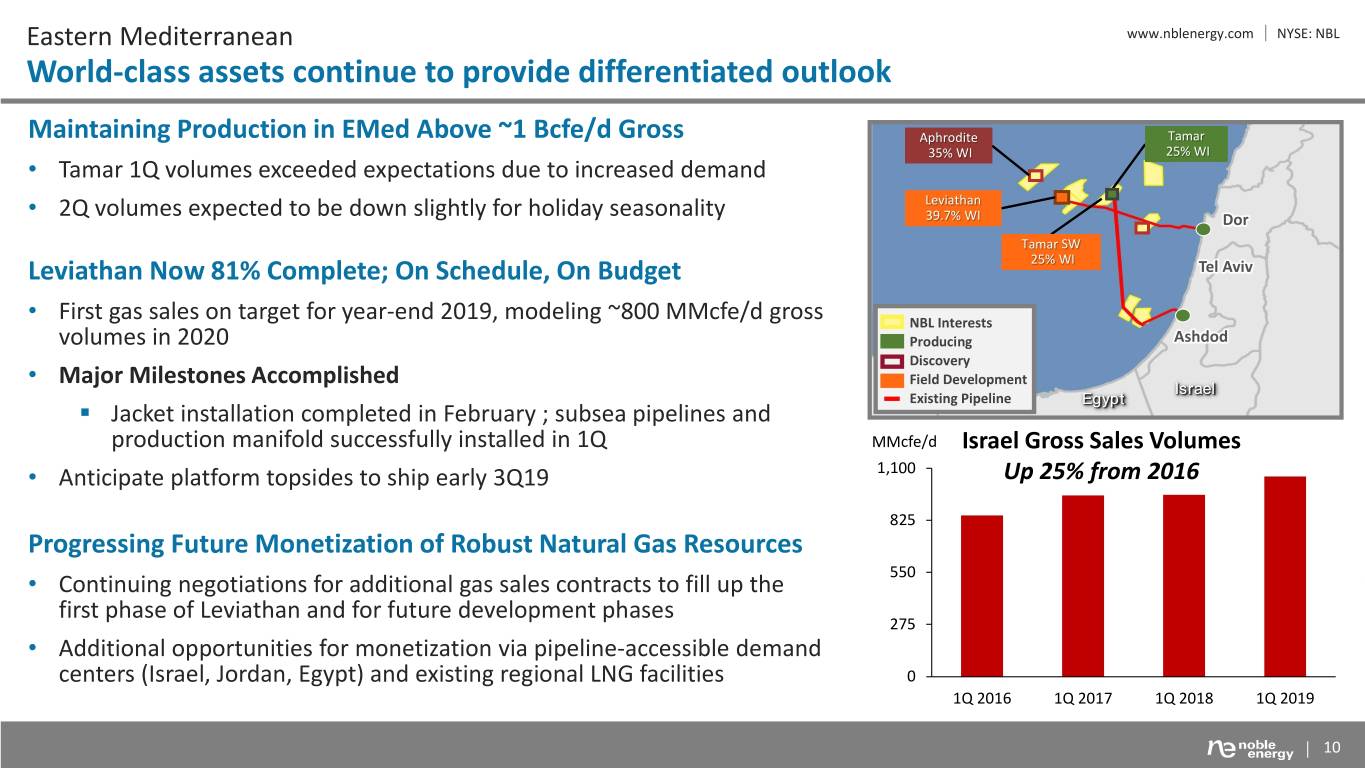
Eastern Mediterranean www.nblenergy.com NYSE: NBL World-class assets continue to provide differentiated outlook Maintaining Production in EMed Above ~1 Bcfe/d Gross Aphrodite Tamar 35% WI 25% WI • Tamar 1Q volumes exceeded expectations due to increased demand Leviathan . . . . . . . . . . . . . • 2Q volumes expected to be down slightly for holiday seasonality 39.7% WI Dor . . . . . . . . . . . . . . . . . . . . . . . . . . . . . . . . . . . . . . . . . . . . . . . . . . . . . . . . . . . . . . . . . . . . . . . . . . . . . . . . . . Tamar SW Leviathan Now 81% Complete; On Schedule, On Budget 25% WI Tel Aviv • First gas sales on target for year-end 2019, modeling ~800 MMcfe/d gross NBL Interests volumes in 2020. . Producing Ashdod Discovery • Major Milestones Accomplished Field Development Israel Existing Pipeline Egypt . Jacket installation completed in February ; subsea pipelines and production manifold successfully installed in 1Q MMcfe/d Israel Gross Sales Volumes 1,100 • Anticipate platform topsides to ship early 3Q19. . . . . . . . . . . . . . . . . . . . . . . . . . . . . . . . . . Up 25% from 2016 . . . . . . . . . . . . . . . . . . . . . . . . . . . . . . . . . 825 Progressing Future Monetization of Robust Natural Gas Resources 550 • Continuing negotiations for additional gas sales contracts to fill up the first phase of Leviathan and for future development phases 275 • Additional opportunities for monetization via pipeline-accessible demand centers (Israel, Jordan, Egypt) and existing regional LNG facilities 0 1Q 2016 1Q 2017 1Q 2018 1Q 2019 10
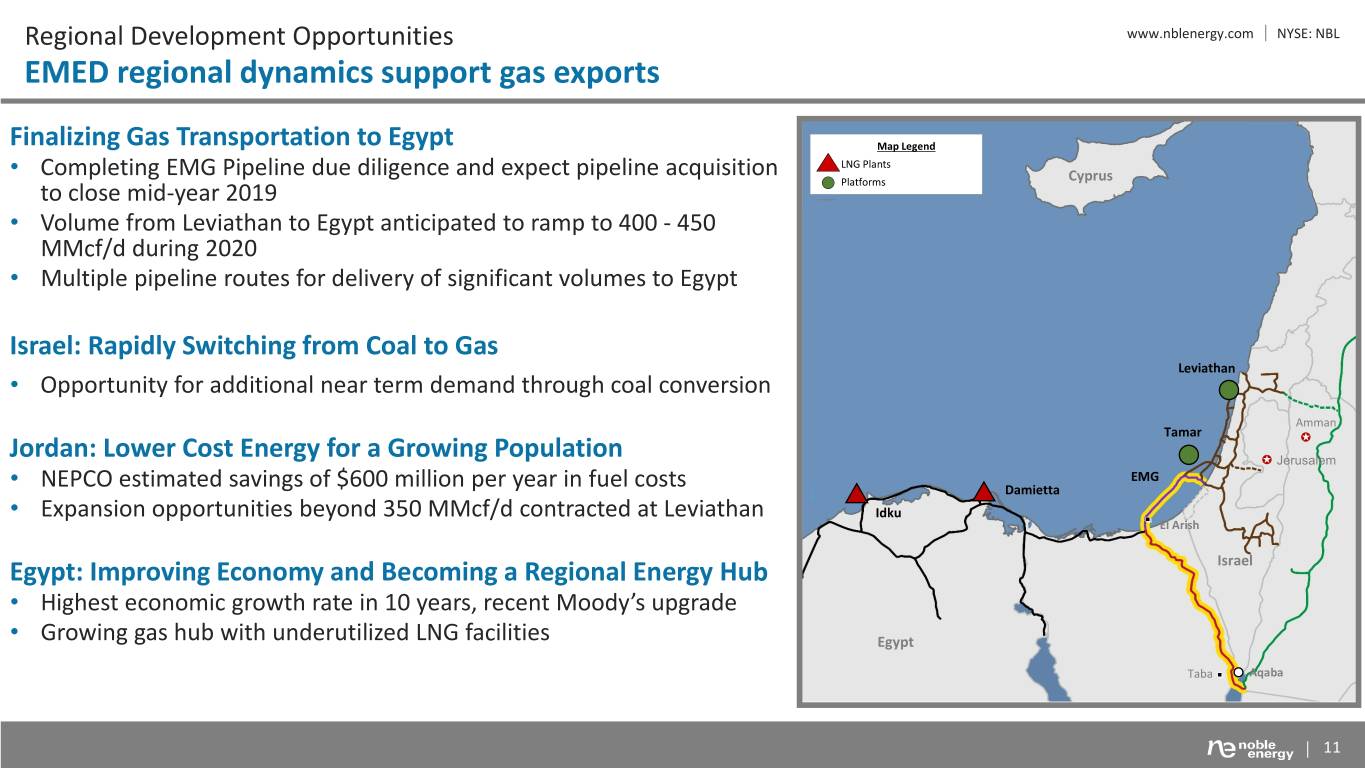
Regional Development Opportunities www.nblenergy.com NYSE: NBL EMED regional dynamics support gas exports Finalizing Gas Transportation to Egypt Map Legend LNG Plants • Completing EMG Pipeline due diligence and expect pipeline acquisition Cyprus to close mid-year 2019 Platforms • Volume from Leviathan to Egypt anticipated to ramp to 400 - 450 MMcf/d during 2020 • Multiple pipeline routes for delivery of significant volumes to Egypt Israel: Rapidly Switching from Coal to Gas Leviathan • Opportunity for additional near term demand through coal conversion Amman Tamar Jordan: Lower Cost Energy for a Growing Population Jerusalem EMG • NEPCO estimated savings of $600 million per year in fuel costs Damietta • Expansion opportunities beyond 350 MMcf/d contracted at Leviathan Idku El Arish Egypt: Improving Economy and Becoming a Regional Energy Hub Israel • Highest economic growth rate in 10 years, recent Moody’s upgrade • Growing gas hub with underutilized LNG facilities Egypt Taba Aqaba 11
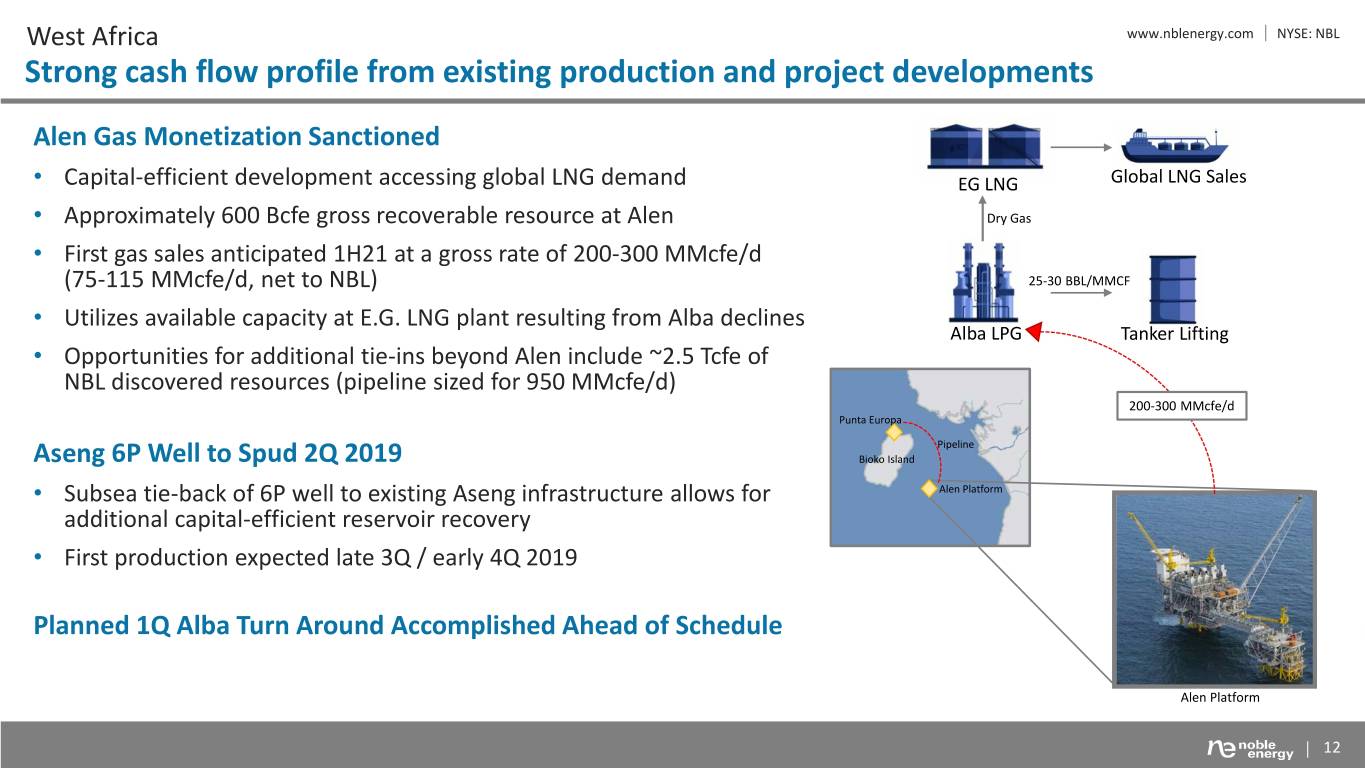
West Africa www.nblenergy.com NYSE: NBL Strong cash flow profile from existing production and project developments Alen Gas Monetization Sanctioned • Capital-efficient development accessing global LNG demand EG LNG Global LNG Sales • Approximately 600 Bcfe gross recoverable resource at Alen Dry Gas • First gas sales anticipated 1H21 at a gross rate of 200-300 MMcfe/d (75-115 MMcfe/d, net to NBL) 25-30 BBL/MMCF • Utilizes available capacity at E.G. LNG plant resulting from Alba declines Alba LPG Tanker Lifting • Opportunities for additional tie-ins beyond Alen include ~2.5 Tcfe of NBL discovered resources (pipeline sized for 950 MMcfe/d) 200-300 MMcfe/d Punta Europa Pipeline Aseng 6P Well to Spud 2Q 2019 Bioko Island • Subsea tie-back of 6P well to existing Aseng infrastructure allows for Alen Platform additional capital-efficient reservoir recovery • First production expected late 3Q / early 4Q 2019 ~10% Decline Planned 1Q Alba Turn Around Accomplished Ahead of Schedule Alen Platform 12
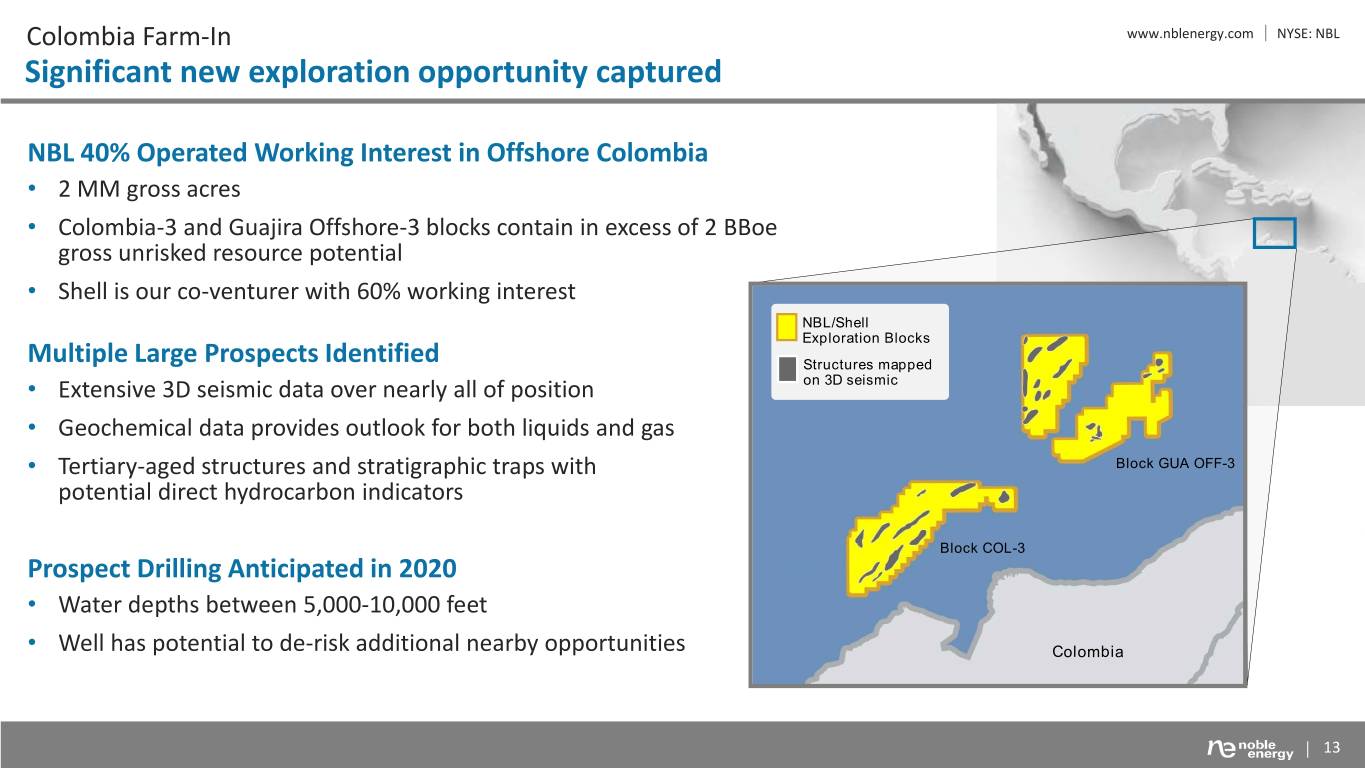
Colombia Farm-In www.nblenergy.com NYSE: NBL Significant new exploration opportunity captured NBL 40% Operated Working Interest in Offshore Colombia • 2 MM gross acres • Colombia-3 and Guajira Offshore-3 blocks contain in excess of 2 BBoe gross unrisked resource potential • Shell is our co-venturer with 60% working interest. . . . . . . . . . . . . . . . . . . . . . . . . . . . . . . . . . . . . . . . . . . . . . . . . . . . . . . . . . . . . . . . . . . . . . . . . . . . . . . . . . . . . NBL/Shell Exploration Blocks Multiple Large Prospects Identified Structures mapped • Extensive 3D seismic data over nearly all of position on 3D seismic • Geochemical data provides outlook for both liquids and gas Block GUA-3 • Tertiary-aged structures and stratigraphic traps with Block GUA OFF-3 potential direct hydrocarbon indicators . . . . . . . . . . . . . . . . . . . . . . . . . . . . . . . . . . . . . . . . . . . . . . . . . . . . . . . . . . . . . . . . . . . . . . . . . . . . . . . . . . . . . . . Block COL-3 Block COL-3 Prospect Drilling Anticipated in 2020 • Water depths between 5,000-10,000 feet Colombia • Well has potential to de-risk additional nearby opportunities Colombia 13
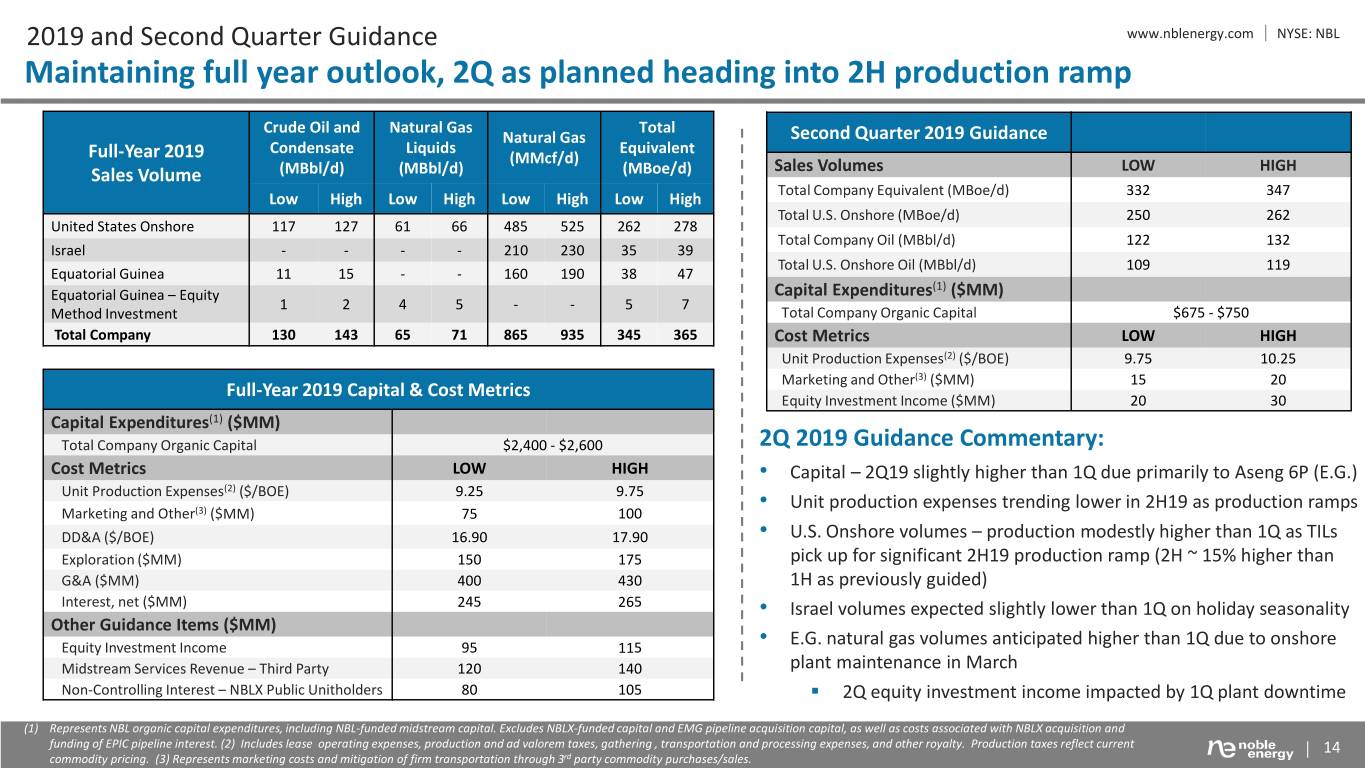
2019 and Second Quarter Guidance www.nblenergy.com NYSE: NBL Maintaining full year outlook, 2Q as planned heading into 2H production ramp Crude Oil and Natural Gas Total Natural Gas Second Quarter 2019 Guidance Full-Year 2019 Condensate Liquids Equivalent (MMcf/d) Sales Volumes LOW HIGH Sales Volume (MBbl/d) (MBbl/d) (MBoe/d) Total Company Equivalent (MBoe/d) 332 347 Low High Low High Low High Low High Total U.S. Onshore (MBoe/d) 250 262 United States Onshore 117 127 61 66 485 525 262 278 Total Company Oil (MBbl/d) 122 132 Israel - - - - 210 230 35 39 Total U.S. Onshore Oil (MBbl/d) 109 119 Equatorial Guinea 11 15 - - 160 190 38 47 (1) Equatorial Guinea – Equity Capital Expenditures ($MM) 1 2 4 5 - - 5 7 Method Investment Total Company Organic Capital $675 - $750 Total Company 130 143 65 71 865 935 345 365 Cost Metrics LOW HIGH Unit Production Expenses(2) ($/BOE) 9.75 10.25 Marketing and Other(3) ($MM) 15 20 Full-Year 2019 Capital & Cost Metrics Equity Investment Income ($MM) 20 30 Capital Expenditures(1) ($MM) Total Company Organic Capital $2,400 - $2,600 2Q 2019 Guidance Commentary: Cost Metrics LOW HIGH • Capital – 2Q19 slightly higher than 1Q due primarily to Aseng 6P (E.G.) Unit Production Expenses(2) ($/BOE) 9.25 9.75 Unit production expenses trending lower in 2H19 as production ramps Marketing and Other(3) ($MM) 75 100 • DD&A ($/BOE) 16.90 17.90 • U.S. Onshore volumes – production modestly higher than 1Q as TILs Exploration ($MM) 150 175 pick up for significant 2H19 production ramp (2H ~ 15% higher than G&A ($MM) 400 430 1H as previously guided) Interest, net ($MM) 245 265 • Israel volumes expected slightly lower than 1Q on holiday seasonality Other Guidance Items ($MM) Equity Investment Income 95 115 • E.G. natural gas volumes anticipated higher than 1Q due to onshore Midstream Services Revenue – Third Party 120 140 plant maintenance in March Non-Controlling Interest – NBLX Public Unitholders 80 105 . 2Q equity investment income impacted by 1Q plant downtime (1) Represents NBL organic capital expenditures, including NBL-funded midstream capital. Excludes NBLX-funded capital and EMG pipeline acquisition capital, as well as costs associated with NBLX acquisition and funding of EPIC pipeline interest. (2) Includes lease operating expenses, production and ad valorem taxes, gathering , transportation and processing expenses, and other royalty. Production taxes reflect current 14 commodity pricing. (3) Represents marketing costs and mitigation of firm transportation through 3rd party commodity purchases/sales.
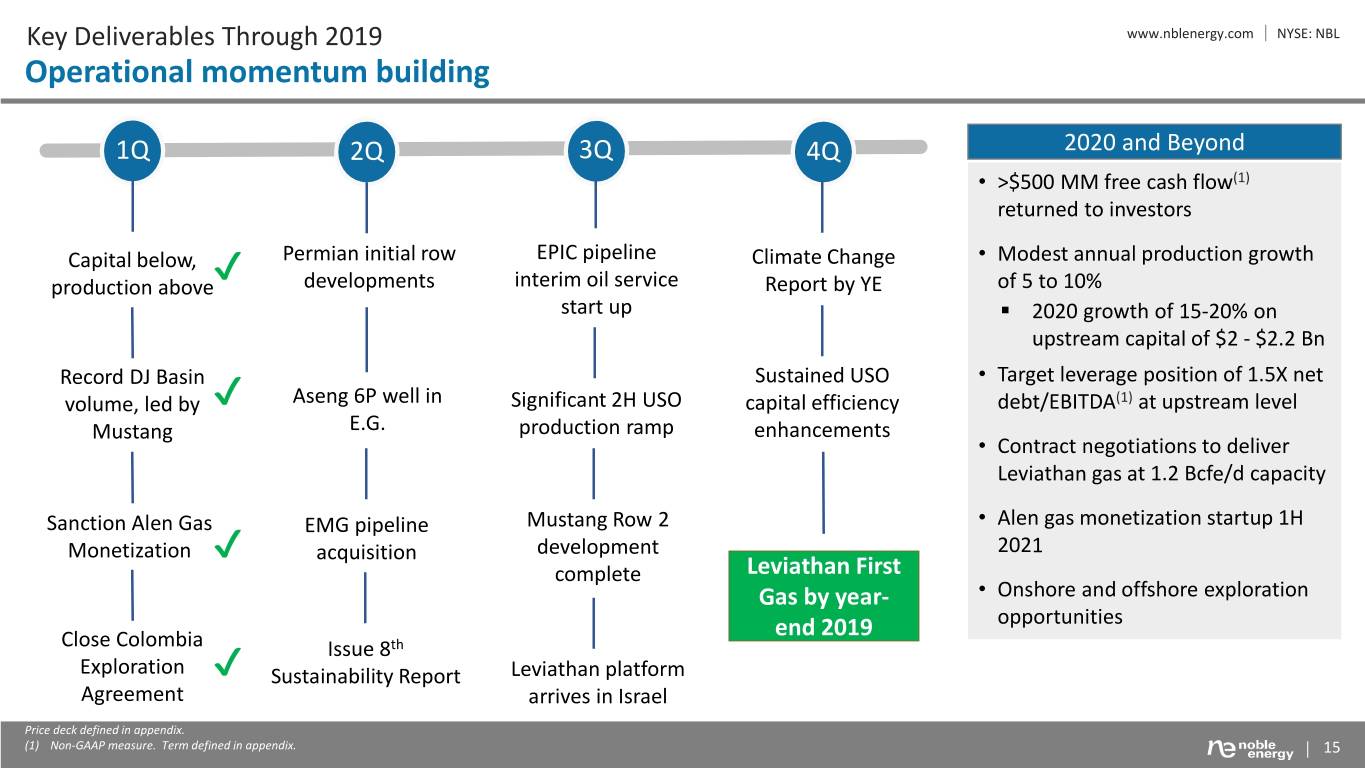
Key Deliverables Through 2019 www.nblenergy.com NYSE: NBL Operational momentum building 1Q 2Q 3Q 4Q 2020 and Beyond • >$500 MM free cash flow(1) returned to investors Capital below, Permian initial row EPIC pipeline Climate Change • Modest annual production growth production above✔ developments interim oil service Report by YE of 5 to 10% start up . 2020 growth of 15-20% on upstream capital of $2 - $2.2 Bn Record DJ Basin Sustained USO • Target leverage position of 1.5X net volume, led by ✔ Aseng 6P well in Significant 2H USO capital efficiency debt/EBITDA(1) at upstream level Mustang E.G. production ramp enhancements • Contract negotiations to deliver Leviathan gas at 1.2 Bcfe/d capacity Sanction Alen Gas EMG pipeline Mustang Row 2 • Alen gas monetization startup 1H Monetization acquisition development 2021 ✔ complete Leviathan First Gas by year- • Onshore and offshore exploration end 2019 opportunities Close Colombia Issue 8th Exploration Sustainability Report Leviathan platform Agreement ✔ arrives in Israel Price deck defined in appendix. (1) Non-GAAP measure. Term defined in appendix. 15
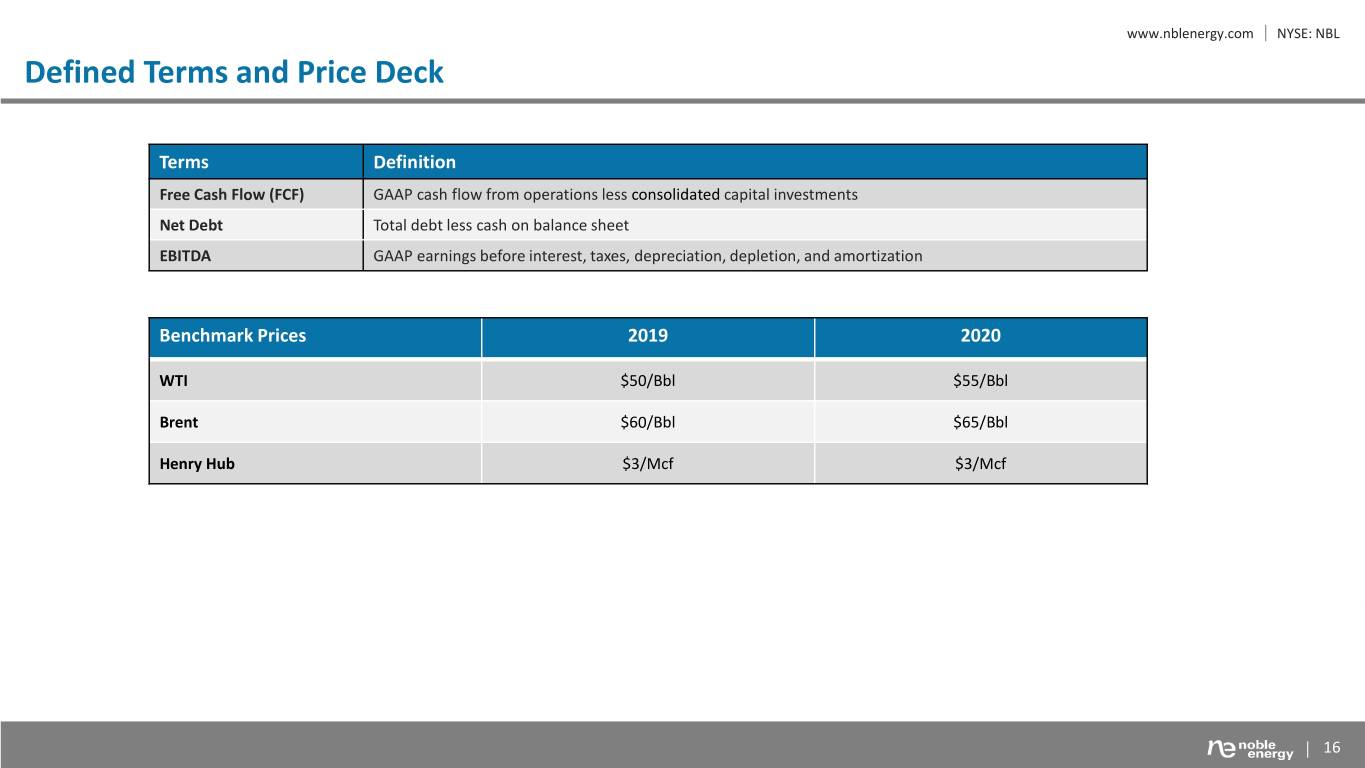
www.nblenergy.com NYSE: NBL Defined Terms and Price Deck Terms Definition Free Cash Flow (FCF) GAAP cash flow from operations less consolidated capital investments Net Debt Total debt less cash on balance sheet EBITDA GAAP earnings before interest, taxes, depreciation, depletion, and amortization Benchmark Prices 2019 2020 WTI $50/Bbl $55/Bbl Brent $60/Bbl $65/Bbl Henry Hub $3/Mcf $3/Mcf 16


