High-Graded Assets
Focused Exploration
Expanding Production
Monetizing Stranded Natural Gas
Transitioning to a Cash Generator
Noble Energy, Inc.
Acquisition of
Patina Oil & Gas Corporation
December 16, 2004

Forward-looking Statement
This communication contains statements that constitute forward-looking statements within the
meaning of the Private Securities Litigation Reform Act of 1995. These statements are based on
Noble Energy’s and Patina Oil & Gas’ current expectations and beliefs and are subject to a number
of risks, uncertainties and assumptions that could cause actual results to differ materially from
those described in the forward-looking statements. Risks, uncertainties and assumptions include
1) the possibility that the companies may be unable to obtain stockholder or regulatory approvals
required for the acquisition; 2) the possibility that problems may arise in successfully integrating
the businesses of the two companies; 3) the possibility that the acquisition may involve
unexpected costs; 4) the possibility that the combined company may be unable to achieve cost-
cutting synergies; 5) the possibility that the businesses may suffer as a result of uncertainty
surrounding the acquisition; 6) the possibility that the industry may be subject to future regulatory
or legislative actions; 7) the volatility in commodity prices for oil and gas; 8) the presence or
recoverability of estimated reserves; 9) the ability to replace reserves; 10) environmental risks; 11)
drilling and operating risks; 12) exploration and development risks; 13) competition; 14) the ability
of management to execute its plans to meet its goals and other risks that are described in SEC
reports filed by Noble Energy and Patina Oil & Gas. Because forward-looking statements involve
risks and uncertainties, actual results and events may differ materially from results and events
currently expected by Noble Energy and Patina Oil & Gas. Noble Energy and Patina Oil & Gas
assume no obligation and expressly disclaim any duty to update the information contained herein
except as required by law.

Additional Information About The Merger
And Where To Find It
In connection with the proposed acquisition by Noble Energy of Patina Oil & Gas, Noble Energy and Patina Oil &
Gas will file relevant materials with the SEC, including one or more registration statement(s) that contain a
prospectus and a joint proxy statement. Investors and security holders of Noble Energy and Patina Oil & Gas are
urged to read these documents (if and when they become available) and any other relevant documents filed with
the SEC, as well as any amendments or supplements to those documents, because they will contain important
information about Noble Energy, Patina Oil & Gas and the acquisition. Investors and security holders may obtain
these documents (and any other documents filed by Noble Energy or Patina Oil & Gas with the SEC) free of charge
at the SEC’s website at www.sec.gov. In addition, the documents filed with the SEC by Noble Energy may be
obtained free of charge from Noble Energy’s website at www.nobleenergyinc.com. The documents filed with the
SEC by Patina Oil & Gas may be obtained free of charge from Patina Oil & Gas’ website at www.patinaoil.com.
Investors and security holders are urged to read the joint proxy statement/prospectus and the other relevant
materials when they become available before making any voting or investment decision with respect to the
proposed acquisition.
Noble Energy, Patina Oil & Gas and their respective executive officers and directors may be deemed to be
participants in the solicitation of proxies from the stockholders of Noble Energy and Patina Oil & Gas in favor of
the acquisition. Information about the executive officers and directors of Noble Energy and their ownership of
Noble Energy common stock is set forth in the proxy statement for Noble Energy’s 2004 Annual Meeting of
Stockholders, which was filed with the SEC on March 24, 2004. Information about the executive officers and
directors of Patina Oil & Gas and their ownership of Patina Oil & Gas common stock is set forth in the proxy
statement for Patina Oil & Gas’ 2004 Annual Meeting of Stockholders, which was filed with the SEC on April 16,
2004. Investors and security holders may obtain more detailed information regarding the direct and indirect
interests of Noble Energy, Patina Oil & Gas and their respective executive officers and directors in the acquisition
by reading the joint proxy statement/prospectus regarding the acquisition when it becomes available.
These materials do not constitute an offer to sell or solicitation of an offer to buy any security and shall not
constitute an offer, solicitation or sale in any jurisdiction in which such offering would be unlawful.

Transaction Summary
An Accretive Acquisition Benefiting All Parties
Transaction Value – $3.4 Billion
$1.8 Billion Equity
$1.1 Billion Debt
$0.5 Billion Assumed Debt
60 Percent Stock / 40 Percent Cash
New NBL Shares Issued – 27 Million
Immediately Accretive to EPS and DCFPS
Pro Forma Ownership
68 Percent NBL
32 Percent POG
Board of Directors
Five Current NBL Directors
Two POG Directors

Transaction Summary
Key Terms and Conditions
March/April 2005
Estimated Closing:
NBL Shareholder Approval
POG Shareholder Approval
Hart Scott Rodino Approval
Conditions:
$100MM
Termination Fee:
POG Shareholders Can, Subject to Proration, Elect:
Cash or NBL Common Stock, in Either Case
Having a Value Equal to $14.80, plus
Value of 0.3751 NBL Shared During Specified
Period Prior to Closing
In Total, POG Shareholders Will Receive
Consideration Comprised of 60 Percent of NBL
Common Stock and 40 Percent Cash
Consideration:

Transaction Summary
Substantial Financial and Operating Benefits
Reserves and Production Increase Over 50 Percent
Lengthen Domestic Reserve Life
Reserves Per Share Increase 12 Percent
Establishes New Core Areas in Long-lived Basins
Domestic Onshore Reserves Increase to 45 Percent of Total
Onshore Tight Gas Expertise Enhanced
Reduces Domestic Risk and Costs
Less Reliance on Exploration
More Exploitation/Development
Multi-year Project Inventory
Immediately Accretive to EPS and DCFPS*
Increased Free Cash Flow Generation Capacity
Hedging Program Protects Cash Flows from Operations
* See Appendix

Benefits to POG’s Shareholders
Immediate Exposure to High Impact Projects Overseas
and in the Deep Water Gulf of Mexico
Combined Companies Have Outstanding Portfolio
Diversification
55% Domestic Reserves, 45% International Reserves
Transaction Structure Allows POG’s Shareholders to
Continue to Participate in the Growth of POG’s Assets
While Gaining Exposure to Exploration Projects with
Significant Potential
Additional Financial Flexibility with Investment Grade
Rating
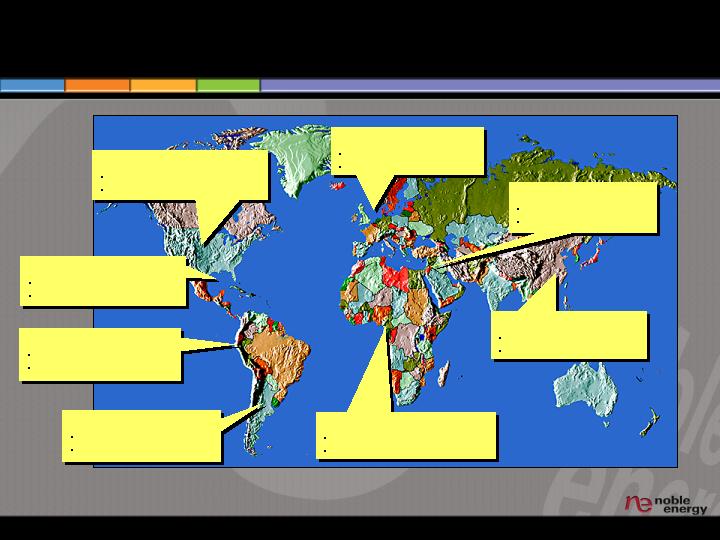
An Outstanding Combination of Assets
Equatorial Guinea*
Reserves 203 MMBoe
Production 17 MBoepd
Argentina*
Reserves 10 MMBoe
Production 3 MBoepd
Ecuador*
Reserves 13 MMBoe
Production 3 MBoepd
Israel*
Reserves 75 MMBoe
Production 7 MBoepd
North Sea*
Reserves 11 MMBoe
Production 9 MBoepd
China*
Reserves 10 MMBoe
Production 4 MBoepd
Onshore US Pro Forma*
Reserves 320 MMBoe
Production 78 MBoepd
Gulf of Mexico*
Reserves 68 MMBoe
Production 39 MBoepd
* Reserves As Of 12/31/03
Production As Of YTD 9/04
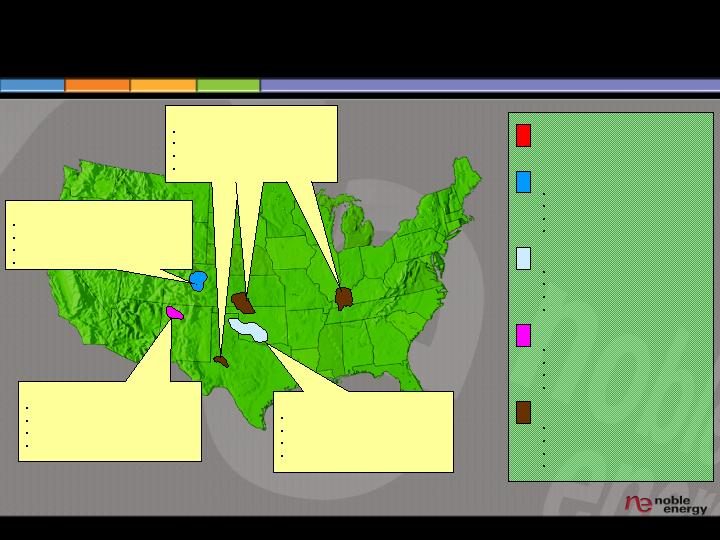
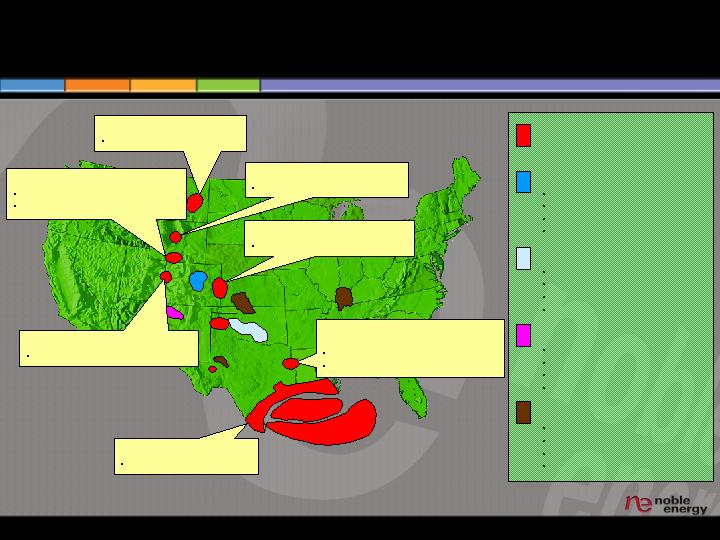
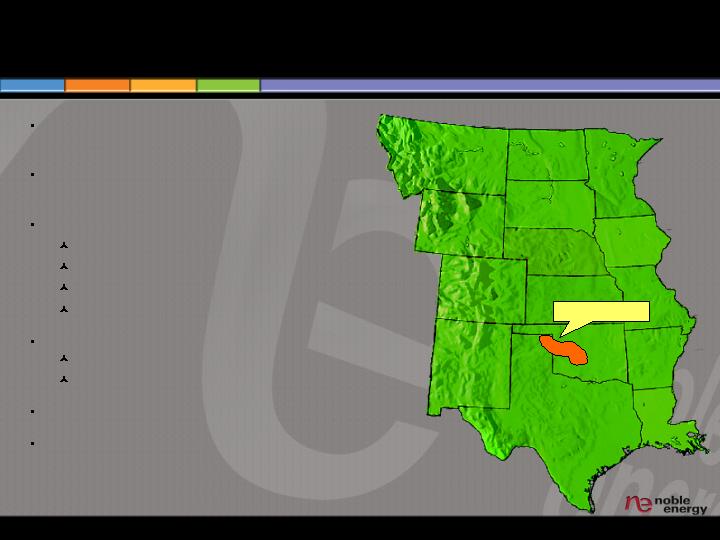
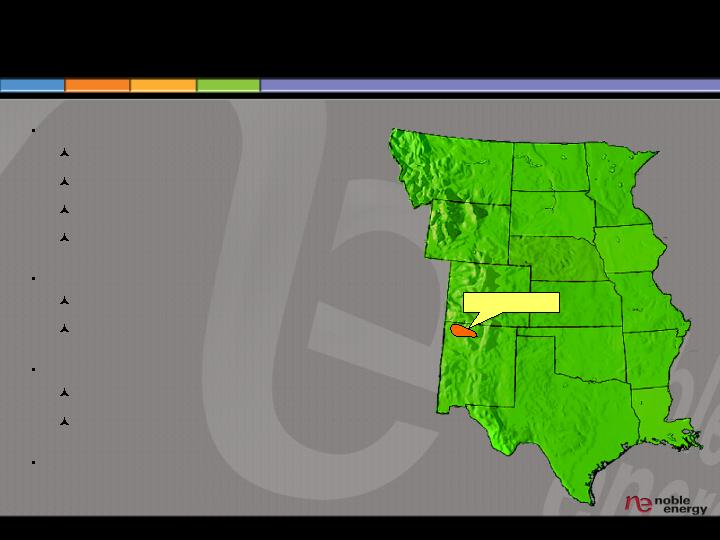
POG Adds Significant Assets in Key Growth Basins
San Juan
16 MMBoe Proved (2004E)
97% Gas
22 MMBoe Probable & Possible
500+ Projects
Wattenberg
152 MMBoe Proved (2004E)
68% Gas
120 MMBoe Probable & Possible
8,700+ Projects
Mid-Continent
80 MMBoe Proved (2004E)
70% Gas
35 MMBoe Probable & Possible
800+ Projects
Central
15 MMBoe Proved (2004E)
11% Gas
4 MMBoe Probable & Possible
300 Projects
NBL
POG – Wattenberg
152 MMBoe Proved (2004E)
68% Gas
120 MMBoe Probable & Possible
8,700+ Projects
POG – Mid-Continent
80 MMBoe Proved (2004E)
70% Gas
35 MMBoe Probable & Possible
800+ Projects
POG – San Juan
16 MMBoe Proved (2004E)
97% Gas
22 MMBoe Probable & Possible
500+ Projects
POG – Central
15 MMBoe Proved (2004E)
11% Gas
4 MMBoe Probable & Possible
300 Projects
POG Adds Significant Assets in Key Growth Basins
Siberia Ridge Field
8 – 10 Well Drilling Program
Additional Infill Drilling Potential
Bowdoin Field
25 Well Drilling Program
Niobrara Trend
235 Well Infill Drilling Program
Caspiana Field
(Hosston / Cotton Valley)
5 – 7 Well Drilling Program
Additional Infill Drilling Potential
Gulf Coast Region
38 Drilling Well Program
Wind River
Testing 27,000 Acre Position
Piceance
Drilling 32 Wells on 6,500 Acres

International
70%
Domestic
30%
Rebalance Reserve Mix
Domestic Weighting Increases Significantly
International
45%
Domestic
55%
Total Reserves:
710 MMBoe
Pro Forma
NBL YE 2003
Total Reserves:
457 MMBoe

Increased Domestic Onshore Contribution
More Stable, Longer-lived Production
GOM
37%
North Sea
7%
Domestic
Onshore
20%
Other Int’l
9%
Israel
12%
EG
15%
GOM
24%
North Sea
5%
Domestic
Onshore
47%
Other Int’l
6%
Israel
8%
EG
10%
107 MBoepd
160 MBoepd
NBL Production
3Q04
Pro Forma
3Q04

Why Patina Oil & Gas?
Grow Domestic Position in Key Basins
Long-lived Onshore
Deepwater
Complement International Production
Growth
Balance Risk From Exploration
Generate Competitive Risk-weighted
Returns
Reduce Dependence on Gulf of Mexico
Shelf
High-quality, Multi-year, Low-risk Inventory
Balances Risk Profile of Reserve Base
Increases Domestic Onshore Reserves to
45 Percent of Total Reserves From 15
Percent
Increases Domestic Exploitation
Extends Domestic Reserve Life
Taps into One of the Stronger Near-term
Organic Growth Profiles in the Sector
Establishes New Core Areas with Platform
for Further Regional Consolidation
Allows Application of POG’s Technological
Expertise to NBL’s Existing Onshore Tight
Gas Operations
Provides NBL with an Opportunity to
Further High Grade Asset Base
NBL’s Articulated
Strategic Objectives
A Combination with POG Would
Address Many of These Objectives
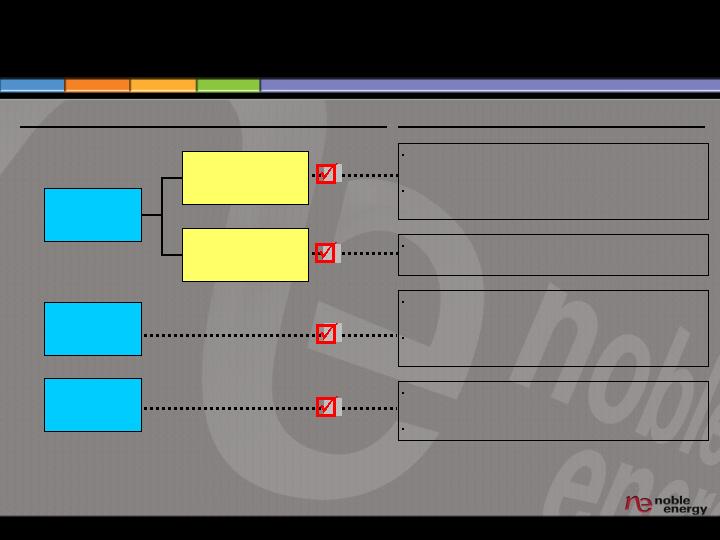
Establish
Organic Growth
Platform
Strategic
Acquisitions
Major International Developments Online, Driving
Visible Production Growth Through 2008
Recent Deepwater Discoveries and Associated
Development Opportunities Anchor U.S. Growth
Reduced Run-rate Unit Cash Costs by 5 Percent
From 1H03 to 1H04
Five Non-core/Higher Operating Cost Asset
Packages Identified and Sold
Total Debt/Book Capitalization Declined to
38 Percent
Net Debt/Book Capitalization at 35 Percent
Announced Acquisition of Patina Oil & Gas
Adding Long-lived Domestic Natural Gas
NBL’s Long-term Corporate Objectives
Achievements
Growth
Cost
Reductions
Reduce
Financial
Leverage
Significant Progress Towards Long-term Goals

POG Has A Strong Record Of Growth
Production (MBoepd)
Proven Reserves (MMBoe)

Large POG Resource Base
Provides Stability and Upside
Over 250 MMBoe of Proved Reserves Provides Stable Production Base
Low-cost, High Operating Margins
High Free Cash Flow Generation
Significant Inventory of High Rate of Return Projects
Over 200 MMBoe of Probable and Possible Resources
Seven-plus Year Project Inventory
Low-risk Exploitation and Development
More Than 10,000 Total Identified Projects
Operating Control of Reserves, Production and Upside
95 Percent of Value
Focused Asset Base
Over 85 Percent of Value and Upside Concentrated in Two Core Areas
Technical, Operating and Acquisition Expertise Highly Transferable
3Q04 Average Daily Production – 54 MBoepd
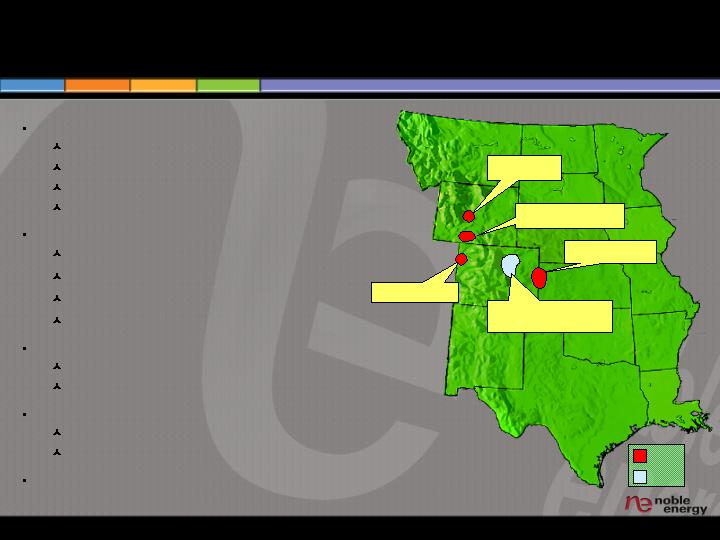
D-J Basin – The Wattenberg Field
A New Core Area with Running Room
Wattenberg Field
One of Ten Largest Gas Fields in US
Over 500 MMBoe of Cumulative Production
POG Currently Largest Operator in Field
Stable, Predictable, Long-lived Production
Resources – 2004E
152 MMBoe of Proven Reserves
73 Percent Developed
120 MMBoe Probable/Possible
68 Percent Natural Gas
Production – 3Q04
33 MBoepd
13 Year Reserve Life
Control
Average WI of 94 Percent
99 Percent Operated
Leasehold – 220,000 Net Acres
D-J Basin
Wattenberg Field
Siberia Ridge Field
Wind River
Piceance
Niobrara Trend
NBL
POG
Wattenberg Field
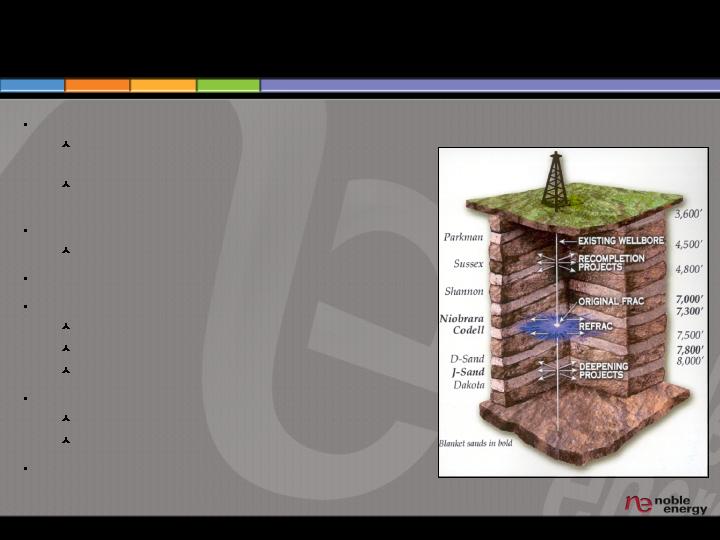
A Large Inventory of Exploitation and Growth Opportunities
Multiple Zones
Up to Eight Productive Formations in
4500’-Thick Section
All Zones Can Be Drilled, Commingled and
Produced From Single Wellbore
Low Risk Development Opportunities
Over 98 Percent Historical Success Rate
Over 8,700 Identified High-return Projects
Major Proven Development Programs
Codell Drilling, Refracs and Trifracs
Niobrara Recompletions / Refracs
J-Sand Drilling and Deepenings
Further Exploitation Potential
Dakota
Shallow Sands (Sussex, Shannon, Parkman)
Potential for Field Consolidation
Mid-Continent Area
A Platform for Substantial Growth
Growing Natural Gas Position in
Anadarko Basin
Stable Oil Production in Ardmore-Marietta
Basin
Resources – 2004E
80 MMBoe of Proven Reserves
71 Percent Developed
35 MMBoe Probable/Possible
70 Percent Natural Gas
Production – 3Q04
15 MBoepd
15 Year Reserve Life
87 Percent Operated
Leasehold – 180,000 Net Acres
Mid-Continent

Mid-Continent
A Large Number of Low-risk Growth Opportunities
Buffalo Wallow – 20 Acre
Down-spacing Approved
Granite Wash – 200
Potential Locations
Billy Rose – Developing
10,000 Net Acres
Western Oklahoma –
Developing Red Fork Play
Southern Oklahoma
Expand Waterfloods
Test Deeper Horizons
Over 800 Identified Projects
Hemphill
St. Claire
Buffalo Wallow
Billy Rose
South Thomas
Elm Grove
Eakley Weatherford
Wildcat Jim
SW Davis
East Cumberland
Franklin Unit
Santa Fe
Milroy Deese
Loco
Cottonwood Creek
Texas
Oklahoma
San Juan Basin
Establishing A Platform for Growth
Resources – 2004E
16 MMBoe of Proven Reserves
70 Percent Developed
22 MMBoe Probable/Possible
97 Percent Natural Gas
Production – 3Q04
2 MBoepd
26 Year Reserve Life
Control
Average WI of 78 Percent
98 Percent Operated
Leasehold – 20,700 Net Acres
San Juan Basin

Central Region
Stable Oil Production
Primarily Illinois and Kansas Basins
Resources – 2004E
15 MMBoe of Proven Reserves
89 Percent Developed
4 MMBoe Probable/Possible
11 Percent Natural Gas
Production – 3Q04
4 MBoepd
10 Year Reserve Life
93 Percent Operated
Leasehold – 70,000 Net Acres

New Ventures
Leasing Acreage in Three Areas Targeting Shale
Formations
Utilize POG’s Tight Reservoir Completion Expertise
More Than 70,000 Net Acres Acquired To Date
Drilling Expected to Begin in 1Q05

Mid
Continent
26%
San Juan
9%
Wattenberg
61%
Central
4%
Mid Continent
8%
San Juan
5%
Central
3%
Wattenberg
84%
PDNP
9%
Possible
23%
PUD
15%
PDP
32%
Probable
21%
POG’s Deep Project Inventory Provides Future Growth
Resources by Category
Total: 477 MMBoe
Resources by Area
Total: 477 MMBoe
Projects by Category
Total: 10,400
Projects by Area
Total: 10,400
PDNP
20%
PUD
13%
Possible
29%
Probable
38%

A Significantly Enhanced Domestic Business
Combination Drives Further Cost Improvements
Year-to-Date 9/30/04, $/Boe
Domestic
Pro Forma
Domestic
NBL
POG
Percent
Change
LOE
4.36
3.51
3.97
Production Tax
0.78
2.36
1.50
SG&A [1]
1.42
1.20
1.16 [2]
Exploration
3.92
0.09
2.18
Interest [1]
1.35
0.64
1.64 [3]
Subtotal
11.83
7.80
10.45
(12%)
DD&A
10.59
6.25
10.72 [4]
Total
22.42
14.05
21.17
(6%)
Production (MMBoe)
17.4
14.5
31.9
[1]
Average Total NBL Rates
[2]
Includes Acquisition Synergies
[3]
Includes Additional Borrowings
[4]
Includes Purchase Price Allocation

2005 Guidance
Pro Forma
NBL
Production Growth (%)
10
10 – 11
(175 – 180 MBoepd)
LOE ($/Boe)
3.70 – 3.90
3.50 – 3.75
SG&A ($/Boe)
1.45 – 1.65
1.15 – 1.35
DD&A ($/Boe)
7.00 – 7.50
8.25 – 8.75
Exploration ($MM)
140 – 160
140 – 165
Capital Spending ($MM)
735
995
Effective Tax Rate (%)
42
40
% Deferred
20 – 30
25 – 35
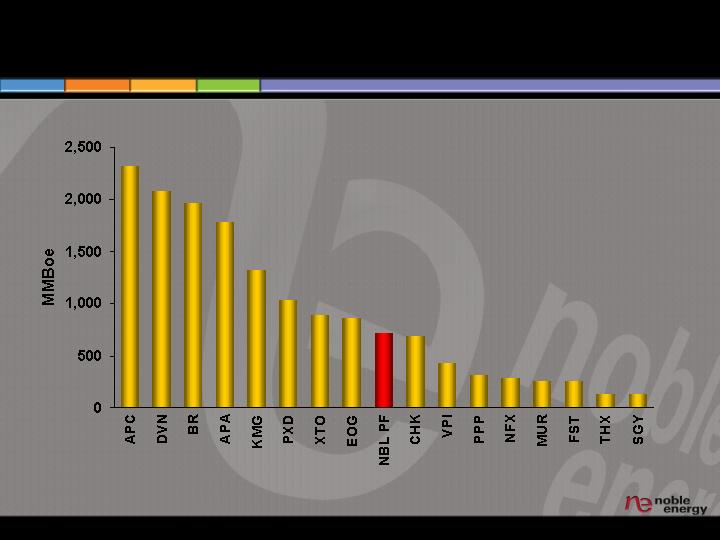
2003 Proved Reserves
Note: 2003 Reserve Figures Adjusted for Announced Asset Acquisitions and Divestitures
710
Source: J.P. Morgan Chase
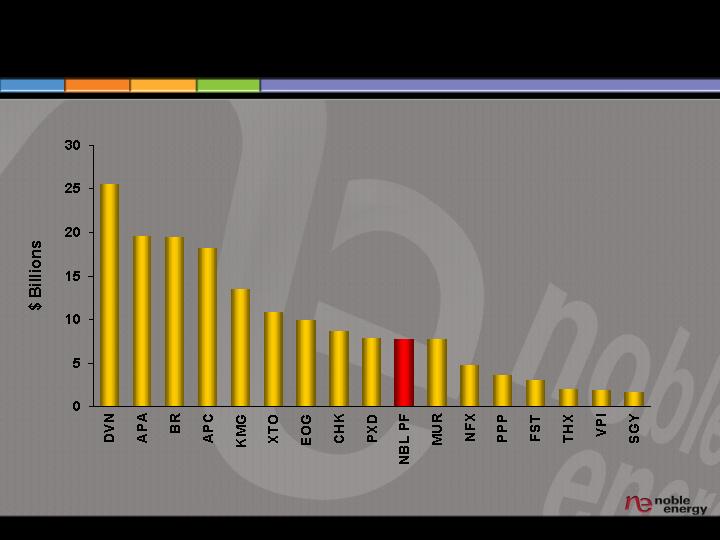
Enterprise Value
$7.7
Source: J.P. Morgan Chase

Capitalization
Current NBL
12/31/04E
(Millions)
Pro Forma
12/31/04
(Millions)
Amount
Percent
Amount
Percent
Credit Facility
$85
4%
$447
8%
Current Term Loan
150
6%
150
3%
Acquisition Loan
-
-
1,300
23%
Sr. Unsecured Notes
644
28%
644
11%
Total Debt
$879
38%
$2,541
45%
Total Equity
1,443
62%
3,146
55%
Total Capitalization
$2,322
100%
$5,687
100%

Financial Flexibility
Five-year Financing Provides Repayment Flexibility
Combined Company Generates Substantial Free
Cash Flow
Available for Expanded Capital Projects
Debt Reduced to Pre-acquisition Levels Within
Three Years
Hedges Ensure Free Cash Flow to Meet Goals

Hedging Strategy
Protects Cash Flow from Operations for Capital Needs
and Debt Reduction
New Production Hedges Through 2008
Natural Gas: 80 MMcfpd
Crude Oil: 7,000 Boepd
Layered into NBL’s Existing Production
Treated as Hedges
Fixed Rate Swaps

NBL and POG
Accelerating Progress Towards Strategic Objectives
Stronger and More Balanced Company
Reserves and Production Increase Over 50 Percent
Domestic Onshore Significantly Enhanced
Domestic Growth Less Dependent on Exploration
A Larger Base to Support Major Projects
Increased Inventory of Exploitation Projects
NBL’s Current Portfolio to Benefit with Added Expertise
from POG
Domestic Cost Structure Improves Further
Accretive to Earnings and Discretionary Cash Flow* Immediately
Significant Combined Free Cash Flow to Accommodate New
Opportunities and Debt Reduction
* See Appendix

Appendix

Disclosure & Reconciliation of Non-GAAP Measures
Discretionary Cash Flow
A – 1
YTD
09/04 2003
($MM) ($MM)
Net Income
$241.3
78.0
DD&A
234.4
288.7
Power Project DD&A
15.4
27.1
Crude Oil and Natural Gas Exploration
82.1
148.8
Interest Capitalized
(9.7)
(14.1)
Undistributed (Earnings)/Loss From Unconsol. Subs.
(44.0)
(40.6)
Distribution from Unconsol. Subs.
50.0
46.1
DD&A – Discontinued Operations
-
28.8
Impairment of Operating Assets
-
31.9
Change in Accounting Principle, Net of Tax
-
5.8
Deferred Income Tax Provision (Benefit)
43.9
(34.9)
Accretion of Asset Retirement Obligation
7.1
9.3
Other
(4.5)
63.9
Discretionary Cash Flow (1)
$615.9
$638.9
Adjustments to Reconcile:
Working Capital
(34.1)
(26.1)
Israel – Take or Pay Payment
(51.8)
Cash Exploration Costs
(29.1)
14.1
Capitalized Interest
9.7
2.9
Deferred Tax, Misc. Credits and Other
(38.3)
-
Net Cash Provided By Operating Activities
$524.0
$578.0

(1) Discretionary cash flow is a forward-looking non-GAAP financial measure. The GAAP
measure most comparable to discretionary cash flow is net cash provided by operating activities
(net operating cash). Net operating cash is not accessible on a forward-looking basis and
reconciling information is not available without unreasonable effort. The reconciling information
that is unavailable would include a forward-looking balance sheet prepared in accordance with
GAAP. The probable significance of having a forward-looking GAAP balance sheet is estimated
to be a variance of plus or minus 10 percent of the forward-looking discretionary cash flow in
this presentation.
The table above reconciles cash flow to net cash flow provided by operating activities. While
discretionary cash flow is not a GAAP measure of financial performance, management believes it
is a good tool for internal use and the investment community in evaluating the company’s overall
financial performance. Among management, professional research analysts, portfolio managers
and investors following the crude oil and natural gas industry, discretionary cash flow is broadly
used as an indicator of a company’s ability to fund exploration and production activities and
meet financial obligations. Discretionary cash flow is also commonly used as a basis to value
and compare companies in the crude oil and natural gas industry.
Disclosure & Reconciliation of Non-GAAP Measures
Discretionary Cash Flow
A - 2