Use these links to rapidly review the document
TABLE OF CONTENTS
ITEM 8—FINANCIAL STATEMENTS AND SUPPLEMENTARY DATA
PART IV ITEM 14—EXHIBITS, FINANCIAL STATEMENT SCHEDULES, AND REPORTS ON FORM 8-K
UNITED STATES
SECURITIES AND EXCHANGE COMMISSION
Washington, D.C. 20549
FORM 10-K/A
| /x/ | ANNUAL REPORT UNDER SECTION 13 OR 15(d) OF THE SECURITIES EXCHANGE ACT OF 1934 | |
For the fiscal year ended December 31, 2000 | ||
OR | ||
/ / | TRANSITION REPORT PURSUANT TO SECTION 13 OR 15(d) OF THE SECURITIES EXCHANGE ACT OF 1934 | |
For the transition period from to | ||
Commission File Number1-8542 | ||
ECHO BAY MINES LTD.
(Exact name of registrant as specified in its charter)
| Incorporated under the laws of Canada | None | |
| (State or other jurisdiction of incorporation or organization) | (I.R.S. Employer Identification No.) | |
Suite 1210, 10180-101 Street Edmonton, Alberta | T5J 3S4 | |
| (Address of principal executive offices) | (Postal Code) |
Registrant's telephone number, including area code:(780) 496-9002
Securities registered pursuant to Section 12(b) of the Act:
Title of each class | Name of each exchange on which registered | |
| Common shares, no par value | American Stock Exchange |
Securities registered pursuant to Section 12(g) of the Act:None
Indicate by check mark whether the registrant (1) has filed all reports required to be filed by Section 13 or 15(d) of the Securities Exchange Act of 1934 during the preceding 12 months (or for such shorter period that the registrant was required to file such reports), and (2) has been subject to such filing requirements for the past 90 days.
Yes /x/ No / /
Indicate by check mark if disclosure of delinquent filers pursuant to Item 405 of Regulation S-K is not contained herein, and will not be contained, to the best of registrant's knowledge, in definitive proxy or information statements incorporated by reference in Part III of this Form 10-K or any amendment to this Form 10-K. /x/
| Aggregate market value of the voting securities held by non-affiliates of the registrant at March 28, 2001 | U.S.$210,910,718 | |
| Number of common shares outstanding as of March 28, 2001 | 140,607,145 |
After issuing the Company's 2000 financial statements and filing the Form 10-K with the Securities and Exchange Commission ("SEC") and following discussion with the Staff of the SEC and the Company's independent accountants, management determined that it was necessary to revise its reconciliation of Canadian and U.S. generally accepted accounting principles ("GAAP"). Previously capitalized expenditures relating to the extendion of the K-2 deposit at the Kettle River mine are classified as exploration expense for U.S. GAAP purposes. Deferred mining costs previously included in property, plant and equipment, on the balance sheets and statements of cash flows are classified separately as long-term assets and are included in cash from operations on the statements of cash flows (see note 14 to the consolidated financial statements).
PART I
ITEMS 1 AND 2—BUSINESS AND PROPERTIES
In this report, the "Company" refers to Echo Bay Mines Ltd. and its subsidiaries unless the context specifies otherwise. The Company's financial statements are presented in accordance with generally accepted accounting principles in Canada. In this report, all dollar amounts are expressed in U.S. dollars unless specified otherwise.
The Company mines, processes and explores for gold. The Company also produces a significant amount of silver at its McCoy/Cove mine in Nevada. In 2000, the Company had three operating mines in the United States: Round Mountain in Nevada; McCoy/Cove in Nevada; and Kettle River in Washington. The Company also reopened the Lupin mine, located in the Nunavut Territory of Canada. The Lupin mine had been placed on care and maintenance in early 1998 due to depressed gold prices and a high cost structure. A reengineering study identified savings that helped lower costs and allowed the Company to recommence operations and gold production in April 2000. All of the Company's mines are 100% owned except for Round Mountain, which is 50% owned.
The Company's operations in 2000 were, and will continue to be, materially affected by the price of gold, which averaged $332 per ounce in 1997, $294 per ounce in 1998, and $279 per ounce in 1999 and 2000. At December 31, 2000 the gold price was $274 per ounce.
In 1997, in view of the drop in the gold price, the Company deferred a final construction decision on its planned Aquarius gold mine in Canada. See "Development Program—Aquarius."
The Company's exploration efforts focus principally on projects located in North America, where the Company already has an extensive gold mining infrastructure.
In 2000, the Company produced a total of 694,663 ounces of gold and 12,328,297 ounces of silver at an average cash operating cost of $193 per ounce. The Company reported net earnings of $18.6 million on revenues of $281 million. At December 31, 2000, the Company had 4.5 million ounces of gold reserves and 10.9 million ounces of silver reserves.
The Company expects to produce 570,000 ounces of gold and five million ounces of silver at an average cash operating cost of $225 per ounce of gold in 2001. The expected decline in production will result from the completion of mining at McCoy/Cove. For a general identification of risk factors involved in the Company's business, see "Cautionary 'Safe Harbor' Statement under the United States Private Litigation Reform Act of 1995" and "Risk Factors."
A glossary of terms used in the mining industry and in the report is included on pages 42 - 45.
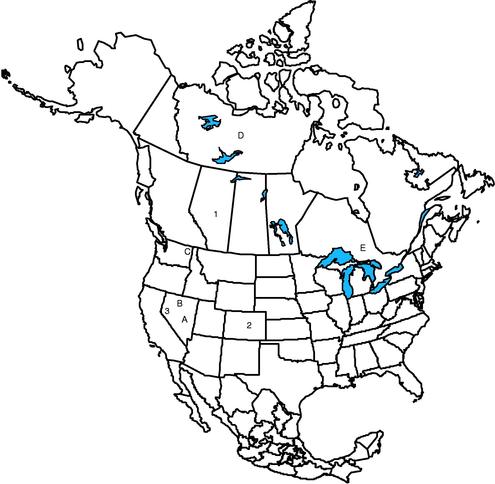
| Properties: | Offices: | |
| A. Round Mountain (Nevada) | 1. Edmonton (Alberta) | |
| B. McCoy/Cove (Nevada) | 2. Englewood (Colorado) | |
| C. Kettle River (Washington) | 3. Reno (Nevada) | |
| D. Lupin (Nunavut) | ||
| E. Aquarius (Ontario) |
(all 100% owned):
Echo Bay Inc. (Delaware)
Echo Bay Finance Corporation (Delaware)
Echo Bay Exploration Inc. (Delaware)
Round Mountain Gold Corporation (Delaware)
Echo Bay Minerals Company (Delaware)
Sunnyside Gold Corporation (Delaware)
Echo Bay Management Corporation (Delaware)
White Pine Gold Corporation (Delaware)
Echo Bay Alaska Inc. (Delaware)
Echo Bay Resources Inc. (Delaware)
Echo Bay Sales Ltd. (Alberta)
Corp. Air Inc. (Alberta)
A total of 21 subsidiaries were omitted because they are not considered significant individually or in the aggregate.
| Gold Production (ounces) | 2000 | 1999 | 1998 | |||
|---|---|---|---|---|---|---|
| Round Mountain (50%) | 320,064 | 270,904 | 255,252 | |||
| McCoy/Cove | 162,784 | 124,536 | 167,494 | |||
| Lupin | 117,729 | — | — | |||
| Kettle River | 94,086 | 104,396 | 113,692 | |||
| Total gold | 694,663 | 499,836 | 536,438 | |||
| Percentage increase (decrease) from prior year | 39.0% | (6.8%) | (25.6%) | |||
Silver Production (ounces) | 2000 | 1999 | 1998 | |||
|---|---|---|---|---|---|---|
| Total silver-all from McCoy/Cove | 12,328,297 | 8,430,072 | 9,412,823 | |||
| Percentage increase (decrease) from prior year | 46.2% | (10.4%) | (14.6%) | |||
| Year ended December 31 | 2000 | 1999 | 1998 | ||||||
|---|---|---|---|---|---|---|---|---|---|
| Gold | |||||||||
| Ounces sold | 676,439 | 486,592 | 553,130 | ||||||
| Average price realized per ounce — revenue basis | $ | 319 | $ | 325 | $ | 333 | |||
| Average price realized per ounce — cash basis(1) | $ | 294 | $ | 335 | $ | 340 | |||
| Average market price per ounce | $ | 279 | $ | 279 | $ | 294 | |||
| Revenue (millions of U.S. dollars) | $ | 215.8 | $ | 158.2 | $ | 183.9 | |||
| Percentage of total revenue | 77% | 75% | 79% | ||||||
Silver | |||||||||
| Ounces sold | 12,347,779 | 9,173,012 | 8,198,867 | ||||||
| Average price realized per ounce — revenue basis | $ | 5.28 | $ | 5.69 | $ | 5.88 | |||
| Average price realized per ounce — cash basis(1) | $ | 5.21 | $ | 5.22 | $ | 5.36 | |||
| Average market price per ounce | $ | 5.00 | $ | 5.25 | $ | 5.54 | |||
| Revenue (millions of U.S. dollars) | $ | 65.2 | $ | 52.2 | $ | 48.3 | |||
| Percentage of total revenue | 23% | 25% | 21% | ||||||
| Total revenue (millions of U.S. dollars) | $ | 281.0 | $ | 210.4 | $ | 232.2 | |||
The effects of changes in sales volume and prices were:
| Thousands of U.S. dollars Year ended December 31 | 2000 | 1999 | 1998 | |||||||
|---|---|---|---|---|---|---|---|---|---|---|
| Increase in volume | $ | 79,770 | $ | (16,438 | ) | $ | (62,291 | ) | ||
| Lower gold prices | (4,084 | ) | (3,649 | ) | (16,040 | ) | ||||
| Higher (lower) silver prices | (5,061 | ) | (1,743 | ) | 5,083 | |||||
| Increase/(decrease) in total revenue from the previous year | $ | 70,625 | $ | (21,830 | ) | $ | (73,248 | ) | ||
The increase in gold revenue from 1999 to 2000 was primarily due to the re-commissioning of Lupin operations, increased mill grades and recoveries at McCoy/Cove and higher leach pad tons at Round Mountain. The increase in silver revenues from 1999 to 2000 was due to higher grades and increased production at McCoy/Cove. The decrease in gold revenue from 1998 to 1999 was due to lower gold sales volume resulting primarily from lower grades at McCoy/Cove, and decreased gold prices realized. The increase in silver revenue from 1998 to 1999 was due to silver inventories carried over from 1998 more than offsetting lower silver prices realized.
- (1)
- Excludes non-cash items affecting gold and silver revenues, such as the recognition of deferred income or deferral of revenue to future periods for hedge accounting purposes.
| Production Costs per Ounce of Gold Produced(1) | 2000 | 1999 | 1998 | |||||||
|---|---|---|---|---|---|---|---|---|---|---|
| Direct mining expense | $ | 192 | $ | 237 | $ | 209 | ||||
| Deferred stripping and mine development costs | 3 | (23) | (1) | |||||||
| Inventory movements and other | (2) | 1 | — | |||||||
| Cash operating costs | 193 | 215 | 208 | |||||||
| Royalties | 9 | 11 | 11 | |||||||
| Production taxes | 2 | — | 2 | |||||||
| Total cash costs | 204 | 226 | 221 | |||||||
| Depreciation | 35 | 58 | 62 | |||||||
| Amortization | 20 | 20 | 25 | |||||||
| Reclamation and mine closure | 12 | 11 | 9 | |||||||
| Total production costs | $ | 271 | $ | 315 | $ | 317 | ||||
| Percentage decrease from prior year | (14.0%) | (0.6%) | (11.7%) | |||||||
Cash Operating Costs per Ounce of Gold Produced(1) | 2000 | 1999 | 1998 | ||||||
|---|---|---|---|---|---|---|---|---|---|
| Round Mountain | $ | 195 | $ | 200 | $ | 198 | |||
| McCoy/Cove | 179 | 221 | 203 | ||||||
| Lupin | 213 | — | — | ||||||
| Kettle River | 218 | 238 | 244 | ||||||
| Company consolidated weighted average | $ | 193 | $ | 215 | $ | 208 | |||
| Percentage increase (decrease) from prior year | (10.2%) | 3.4% | (16.5%) | ||||||
In 2000, the average cash operating cost per ounce was $193 compared with $215 in 1999 and $208 in 1998. Cash operating costs per ounce were lower in 2000 compared to 1999, reflecting increased grades and higher production at McCoy/Cove. Cash operating costs per ounce were higher in 1999 compared to 1998, reflecting lower production at McCoy/Cove partially offset by savings in mining and milling costs at McCoy/Cove and Kettle River. The Company's consolidated cash operating cost target is $225 per ounce of gold produced in 2001.
Operating costs include mining and processing costs for gold and silver sold during the year. The most significant of these costs are labor, consumable materials, repairs of machinery and equipment, fuel, utilities and environmental compliance. The cost of transporting personnel and freight to the Lupin mine is also a significant cost for that operation.
The reconciliation of cash operating costs per ounce to the financial statements for the last three years is provided below.
Reconciliation of Cash Operating
Costs per Ounce to Financial Statements
| Thousands of U.S. dollars, except per ounce amounts | 2000 | 1999 | 1998 | |||||||
|---|---|---|---|---|---|---|---|---|---|---|
| Operating costs per financial statements | $ | 173,435 | $ | 139,816 | $ | 148,769 | ||||
| Change in finished goods inventory and other | 208 | 2,381 | (1,704 | ) | ||||||
| Co-product cost of silver produced | (39,574 | ) | (34,732 | ) | (35,486 | ) | ||||
| Cash operating costs | $ | 134,069 | $ | 107,465 | $ | 111,579 | ||||
| Gold ounces produced | 694,663 | 499,836 | 536,438 | |||||||
| Cash operating costs per ounce(1) | $ | 193 | $ | 215 | $ | 208 | ||||
- (1)
- The Company reports per ounce production cost data in accordance with The Gold Institute Production Cost Standard (the "Standard"). The Gold Institute is an association of suppliers of gold and gold products and includes leading North American gold producers. Adoption of the Standard is voluntary, and the data presented may not be comparable to data presented by other gold producers. Production costs per ounce are derived from amounts included in the audited Statements of Operations and include mine site operating costs such as mining, processing, administration, transportation, royalties, production taxes, depreciation, amortization and reclamation costs, but exclude financing, capital, development and exploration costs. These costs are then divided by gold ounces produced to arrive at the total production costs per ounce. The measures are furnished to provide additional information and should not be considered in isolation or as a substitute for measures of performance prepared in accordance with generally accepted accounting principles.
The data referred to herein, in respect of ore reserves and other mineralization, has been verified by Ralph Bullis, Director of Exploration. Mr. Bullis, a full-time employee of the Company, is a "qualified person" within the meaning of applicable Canadian securities regulatory standards. He has verified the data disclosed herein, including any relevant sampling, analytical and test data. Reserves reported for development properties are reviewed by independent third parties in conjunction with feasibility studies. The following table presents ore reserves by property. A description of each mine follows the "Reserves" and "Other Mineralization" sections. See "Risk Factors" for a discussion of items that could affect the Company's reserve estimates.
| | 2000 | 1999 | 1998 | ||||||||||
|---|---|---|---|---|---|---|---|---|---|---|---|---|---|
| Ore Reserves(1)(2) (thousands, except average grades) (proven and probable at December 31) | Tons | Average grade (ounces per ton) | Contained ounces (100%) | Contained ounces (the Company's share) | Contained ounces (the Company's share) | Contained ounces (the Company's Share) | |||||||
| Gold | |||||||||||||
| Mines: | |||||||||||||
| Round Mountain | 273,206 | 0.019 | 5,218 | 2,609 | 2,938 | 3,188 | |||||||
| McCoy/Cove | 4,720 | 0.034 | 161 | 161 | 514 | 699 | |||||||
| Lupin | 1,678 | 0.259 | 434 | 434 | 518 | 543 | |||||||
| Kettle River | 363 | 0.193 | 70 | 70 | 162 | 237 | |||||||
Total mines | 5,883 | 3,274 | 4,132 | 4,667 | |||||||||
| Development properties: | |||||||||||||
| Aquarius | 17,527 | 0.068 | 1,189 | 1,189 | 1,164 | 1,263 | |||||||
| Paredones Amarillos(3) | — | — | — | — | — | 869 | |||||||
Total development properties | 1,189 | 1,189 | 1,164 | 2,132 | |||||||||
Total gold | 7,072 | 4,463 | 5,296 | 6,799 | |||||||||
Silver | |||||||||||||
| McCoy/Cove | 4,720 | 2.309 | 10,899 | 10,899 | 28,243 | 38,809 | |||||||
| Total silver | 10,899 | 10,899 | 28,243 | 38,809 | |||||||||
- (1)
- The definitions of proven and probable ore are those used in Canada by certain provincial securities regulatory authorities and are set forth in National Instrument 43-101. The definitions are substantially the same as those applied in the United States by the Securities and Exchange Commission, which are based on definitions used by the United States Bureau of Mines and the United States Geological Survey. See "Glossary—Reserves."
- (2)
- Drill spacing used to determine reserves varies by ore type and are as follows by property: Round Mountain—50 to 100 feet for proven reserves, 100 to 200 feet for probable reserves; McCoy/Cove—40 to 100 feet for proven reserves, 110 to 230 feet for probable reserves; Lupin—15 feet laterally and 65 feet vertically for proven reserves, 75 feet for probable reserves; Kettle River—75 feet for proven and probable reserves; Aquarius—82 feet for proven and probable reserves.
- (3)
- In the third quarter of 1999, the Company sold its interest in the Paredones Amarillos project. The Company's share of Paredones Amarillos' reserves of 869,000 ounces of gold was removed from the Company's estimates of reserves as of December 31, 1999.
The Company reports extractable (minable) ore reserves. Reserves do not reflect recovery losses in the milling or heap leaching processes, but do include allowance for dilution of ore in the mining process.
Ore reserves were estimated based on a gold price of $300 per ounce at December 31, 2000 ($325 per ounce at December 31, 1999 and 1998) and a silver price of $5.00 per ounce at December 31, 2000 ($5.50 per ounce at December 31, 1999 and $5.75 per ounce at December 31, 1998.) The market price for gold has for more than three years traded, on average, below the level used in estimating reserves at December 31, 2000. If the market price for gold were to continue at such levels and the Company determined that its reserves should be estimated at a significantly lower gold price than that used at December 31, 2000, there would be a reduction in the amount of gold reserves. The Company estimates that if reserves at December 31, 2000 were based on $275 per ounce of gold, reserves would decrease by approximately 10% at Round Mountain, 3% at Kettle River and 2% at the Aquarius development property. There would be no impact on reserves at Lupin and McCoy/Cove. The estimates are based on extrapolation of information developed in the reserve calculation, but without the same degree of analysis required for reserve estimation. Should any significant reductions in reserves occur, material write-downs of the Company's investment in mining properties and/or increased amortization, reclamation and closure charges may be required.
Change in Proven and Probable Reserves
The reconciliation of the change in proven and probable reserves from December 31, 1999 to December 31, 2000 is as follows.
| | | (millions of ounces) | |||||||
|---|---|---|---|---|---|---|---|---|---|
| | | Gold | Silver | ||||||
| Proven and probable reserves at December 31, 1999 | 5.3 | 28.2 | |||||||
| Production(1) | (1.0 | ) | (19.6 | ) | |||||
| Extensions, discoveries and adjustments | |||||||||
| — | Round Mountain | 0.1 | — | ||||||
| — | McCoy/Cove | — | 2.3 | ||||||
| — | Lupin | 0.1 | — | ||||||
| — | Aquarius | — | — | ||||||
| Change in gold and silver price assumptions | — | — | |||||||
| Proven and probable reserves at December 31, 2000 | 4.5 | 10.9 | |||||||
- (1)
- Production represents previously modeled, in-situ ounces mined during 2000; this amount does not reflect recovery losses from heap leaching and milling.
For further information on ore reserves for specific mines, see the mines' descriptions in "Business and Properties."
MEASURED AND INDICATED RESOURCES
The following table presents measured and indicated resources by property. Measured and indicated resources for producing mines and development properties are generally estimated by the Company.
Cautionary Note to U.S. Investors concerning estimates of Measured and Indicated Resources
This section uses the terms "measured" and "indicated resources." We advise U.S. investors that while those terms are recognized and required by Canadian regulations, the U.S. Securities and Exchange Commission does not recognize them.U.S. investors are cautioned not to assume that any part or all of mineral deposits in these categories will ever be converted into reserves.
Measured and Indicated Resources(1)(2)
(thousands, except average grades) (at December 31)
| | 2000 | 1999 | 1998 | |||||||||||
|---|---|---|---|---|---|---|---|---|---|---|---|---|---|---|
| | Tons (100% basis) | Tons (the Company's share) | Average Grade (ounces per ton) | Tons (the Company's share) | Average grade (ounces per ton) | Tons (the Company's Share) | Average grade (ounces per ton) | |||||||
| Gold | ||||||||||||||
| Round Mountain | 18,706 | 9,353 | 0.022 | 15,682 | 0.020 | 14,254 | 0.020 | |||||||
| McCoy/Cove | — | — | — | 100 | 0.350 | 125 | 0.120 | |||||||
| Lupin | 76 | 76 | 0.263 | 69 | 0.275 | 485 | 0.345 | |||||||
| Kettle River | 418 | 418 | 0.189 | 17 | 0.235 | 188 | 0.223 | |||||||
Silver | ||||||||||||||
| McCoy/Cove | — | — | — | 100 | 2.000 | 125 | 12.352 | |||||||
- (1)
- Measured and indicated resources have not been included in the proven and probable ore reserve estimates because even though enough drilling, trenching, and/or underground work indicate a sufficient amount and grade to warrant further exploration or development expenditures, these resources do not qualify under the U.S. Securities and Exchange Commission standards as commercially minable ore bodies until further drilling, metallurgical work, and other economic and technical feasibility factors based upon such work are resolved.
- (2)
- Quantities of measured and indicated resources are roughly equivalent to the commonly used term "mineralized materials."
The following table presents inferred resources by property. Inferred resources for producing mines and development properties are generally estimated by the Company.
Cautionary Note to U.S. Investors concerning estimates of Inferred Resources
This section uses the term "inferred resources." We advise U.S. investors that while this term is recognized and required by Canadian regulations, the U.S. Securities and Exchange Commission does not recognize it. "Inferred Resources" have a great amount of uncertainty as to their existence, and great uncertainty as to their economic and legal feasibility. It cannot be assumed that all or any part of an Inferred Mineral Resource will ever be upgraded to a higher category. Under Canadian rules estimates of Inferred Mineral Resources may not form the basis of feasibility or other economic studies.U.S. investors are cautioned not to assume that any part or all of an inferred resource exists, or is economically or legally minable.
Inferred Resources(1)
(thousands, except average grades) (at December 31)
| | 2000 | 1999 | 1998 | |||||||||||
|---|---|---|---|---|---|---|---|---|---|---|---|---|---|---|
| | Tons (100% basis) | Tons (the Company's share) | Average Grade (ounces per ton) | Tons (the Company's share) | Average grade (ounces per ton) | Tons (the Company's Share) | Average grade (ounces per ton) | |||||||
| Gold | ||||||||||||||
| Mines: | ||||||||||||||
| Round Mountain | 90,534 | 45,267 | 0.014 | 47,440 | 0.015 | 39,890 | 0.013 | |||||||
| McCoy/Cove | — | — | — | — | — | 300 | 0.157 | |||||||
| Lupin | 611 | 611 | 0.326 | 739 | 0.337 | 200 | 0.269 | |||||||
| Kettle River | 96 | 96 | 0.177 | — | — | — | — | |||||||
Development properties(2): | ||||||||||||||
| Aquarius | 724 | 724 | 0.066 | 575 | 0.078 | 785 | 0.064 | |||||||
| Ulu | 1,279 | 1,279 | 0.326 | 1,509 | 0.374 | 1,509 | 0.374 | |||||||
| Paredones Amarillos(3) | — | — | — | — | — | 205 | 0.020 | |||||||
Silver | ||||||||||||||
| McCoy/Cove | — | — | — | — | — | 300 | 3.567 | |||||||
- (1)
- Inferred resources have not been included in the proven and probable ore reserve estimates because even though enough drilling, trenching, and/or underground work indicate a sufficient amount and grade to warrant further exploration or development expenditures, these resources do not qualify under the U.S. Securities and Exchange Commission standards as commercially minable ore bodies until further drilling, metallurgical work, and other economic and technical feasibility factors based upon such work are resolved.
- (2)
- The Company's construction and production decisions at its development properties depend on the issuance of appropriate permits and the ability of the Company to obtain required financing. See "Development Program."
- (3)
- In the third quarter of 1999, the Company sold its interest in the Paredones Amarillos project. The Company's share of Paredones Amarillos' inferred resources of 205,000 tons at an average grade of 0.020 ounces of gold per ton was removed from the Company's estimates of inferred resources as of December 31, 1999.
CAUTIONARY "SAFE HARBOR" STATEMENT UNDER THE UNITED STATES PRIVATE SECURITIES LITIGATION REFORM ACT OF 1995
With the exception of historical matters, the matters discussed in this report are forward-looking statements that involve risks and uncertainties that could cause actual results to differ materially from targeted or projected results. Such forward-looking statements include statements regarding targets for gold and silver production, cash operating costs and certain significant expenses, percentage increases and decreases in production from the Company's principal mines, schedules for completion of detailed feasibility studies and initial feasibility studies, potential changes in reserves and production, the timing and scope of future drilling and other exploration activities, expectations regarding receipt of permits and commencement of mining or production, anticipated grades and recovery rates, the ability to secure financing, and potential acquisitions or increases, divestitures or decreases in property interests. Factors that could cause actual results to differ materially include, among others: changes in gold and silver prices; fluctuations in grades and recovery rates; geological, metallurgical, processing, access, transportation or other problems; results of exploration activities, pending and future feasibility studies; changes in project parameters as plans continue to be refined; political, economic and operational risks; availability of materials and equipment; regulatory risks, including but not limited to reclamation security requirements and the timing for the receipt of governmental permits; force majeure events; the failure of plant, equipment or processes to operate in accordance with specifications or expectations; accidents, labor relations; delays in start-up dates for projects; environmental costs and risks; and other factors described herein or in the Company's filings with the U.S. Securities and Exchange Commission. Many of these factors are beyond the Company's ability to predict or control. Readers are cautioned not to put undue reliance on forward-looking statements. See "Risk Factors" for items which could affect forward-looking statements.
The Company owns an undivided 50% interest in and operates the Round Mountain gold mine, acquired in 1985. Homestake Mining Company owns the remaining undivided 50% interest in the joint venture common operation. Homestake increased its interest in the Round Mountain mine from 25% to 50% by acquiring Case Pomeroy's 25% interest as of July 1, 2000. Mining equipment, crushing facilities, heap leaching facilities, milling facilities, gold extraction and recovery facilities, administration and maintenance buildings and other equipment, are included in the joint venture. The Round Mountain gold mine is an open-pit mining operation located 60 miles north of Tonopah in Nye County, Nevada. The property position consists of contiguous patented and unpatented mining claims covering approximately 27,500 acres. The Company has received patents to convert minable land to patented status. Patented claims now cover all the current reserves in the ultimate pit.
The following table sets forth operating data for the Round Mountain operation from 1996 through 2000. The Company's share of production is 50% of the ounces shown and the Company is obligated to pay 50% of all operating, capital and other related costs.
| | 2000 | 1999 | 1998 | 1997 | 1996 | |||||||||||||
|---|---|---|---|---|---|---|---|---|---|---|---|---|---|---|---|---|---|---|
| Gold produced (ounces) | 640,128 | 541,808 | 510,504 | 477,680 | 410,974 | |||||||||||||
| Mining cost/ton of ore and waste | $ | 0.83 | $ | 0.73 | $ | 0.66 | $ | 0.65 | $ | 0.69 | ||||||||
| Heap leaching cost/ton of ore | $ | 0.68 | $ | 0.68 | $ | 0.74 | $ | 0.61 | $ | 0.80 | ||||||||
| Milling cost/ton of ore | $ | 2.80 | $ | 2.92 | $ | 3.36 | $ | 4.38 | — | |||||||||
| Production cost/ounce of gold produced: | ||||||||||||||||||
| Direct mining expense | $ | 200 | $ | 221 | $ | 209 | $ | 208 | $ | 228 | ||||||||
| Deferred stripping cost | (1 | ) | (19 | ) | (7 | ) | 2 | (2 | ) | |||||||||
| Inventory movements and other | (4 | ) | (2 | ) | (4 | ) | (3 | ) | (5 | ) | ||||||||
| Cash operating cost | 195 | 200 | 198 | 207 | 221 | |||||||||||||
| Royalties paid | 17 | 19 | 20 | 22 | 32 | |||||||||||||
| Production taxes | 1 | — | 3 | 4 | 4 | |||||||||||||
| Total cash cost | 213 | 219 | 221 | 233 | 257 | |||||||||||||
| Depreciation | 43 | 48 | 46 | 39 | 51 | |||||||||||||
| Amortization | 18 | 18 | 18 | 18 | 18 | |||||||||||||
| Reclamation and mine closure | 9 | 9 | 7 | 7 | 5 | |||||||||||||
| Total production costs | $ | 283 | $ | 294 | $ | 292 | $ | 297 | $ | 331 | ||||||||
| Capital expenditures (millions)(1) | $ | 4.6 | $ | 7.7 | $ | 12.6 | $ | 30.7 | $ | 17.5 | ||||||||
| Deferred (applied) mining expenditures (millions)(1) | $ | 0.4 | $ | 5.1 | $ | 1.7 | $ | (0.4 | ) | $ | 0.4 | |||||||
| Heap leached-reusable pad: | ||||||||||||||||||
| Ore processed (tons/day) | 24,335 | 15,602 | 18,953 | 26,608 | 27,737 | |||||||||||||
| Total ore processed (000 tons) | 8,785 | 5,741 | 6,842 | 9,552 | 9,819 | |||||||||||||
| Grade (ounce/ton) | 0.028 | 0.034 | 0.036 | 0.036 | 0.036 | |||||||||||||
| Recovery rate (%) | 61.6 | 73.4 | 70.6 | 74.9 | 66.1 | |||||||||||||
| Gold recovered (ounces) | 141,176 | 140,988 | 182,378 | 268,518 | 231,420 | |||||||||||||
| Heap leached-dedicated pad: | ||||||||||||||||||
| Ore processed (tons/day) | 141,047 | 120,020 | 101,892 | 107,716 | 87,706 | |||||||||||||
| Total ore processed (000 tons) | 50,918 | 44,167 | 36,783 | 38,670 | 31,048 | |||||||||||||
| Grade (ounce/ton) | 0.011 | 0.011 | 0.010 | 0.010 | 0.011 | |||||||||||||
| Recovery rate (%) | (2) | (2) | (2) | (2) | (2) | |||||||||||||
| Gold recovered (ounces) | 352,132 | 215,825 | 221,396 | 195,558 | 167,004 | |||||||||||||
| Milled:(3) | ||||||||||||||||||
| Ore processed (tons/day) | 9,304 | 8,083 | 7,993 | n.m. | — | |||||||||||||
| Total ore processed (000 tons) | 3,387 | 2,999 | 2,885 | 274 | — | |||||||||||||
| Gold grade (ounce/ton) | 0.045 | 0.067 | 0.045 | 0.041 | — | |||||||||||||
| Gold recovery rate (%) | 83.1 | 87.0 | 77.9 | 60.0 | — | |||||||||||||
| Gold recovered (ounces) | 139,870 | 157,901 | 97,686 | 6,410 | — | |||||||||||||
| High grade ore processed:(4) | ||||||||||||||||||
| Gold recovered (ounces) | 6,950 | 27,094 | 9,044 | 7,194 | 12,550 | |||||||||||||
- (1)
- The Company's 50% share.
- (2)
- For dedicated leach pads, a gold recovery rate cannot be calculated until leaching is complete. The eventual recovery rate is estimated to be approximately 50%.
- (3)
- Construction of a mill to treat higher-grade non-oxidized ore was completed in the fourth quarter of 1997.
- (4)
- A high-grade occurrence was discovered in April 1992. A small gravity plant was constructed to recover these ounces.
n.m.. Not meaningful.
The Round Mountain orebody straddles the margin of a volcanic caldera complex. Gold-bearing hydrothermal fluids were transported along major structural conduits created by the volcano's collapse and associated faulting. These ascending fluids deposited gold in permeable zones along a broad northwest trend. Primarily gold mineralization at Round Mountain occurs as electrum, a natural gold/silver alloy, in association with quartz, adularia and pyrite. Narrow fractures in shear zones host a higher-grade mineralization while porous sites within the volcanic rock host the disseminated mineralization. Economic gold mineralization is found in both the volcanic and surrounding sedimentary rocks as well as overlaying alluvial placers. The oblong open-pit mine is over a mile at its longest dimension and currently more than 1,200 feet from the highest working level to the bottom of the pit.
Round Mountain Mine
Ore Reserves(1)(2)
December 31, 2000
| | Tonnage (000's short tons) | Average grade of gold (ounces per ton) | Gold content(3) (000's ounces) | |||
|---|---|---|---|---|---|---|
| Round Mountain pit | 177,300 | 0.022 | 3,847 | |||
| Offloads and heap leach stockpiles(4) | 89,760 | 0.011 | 974 | |||
| Mill stockpiles | 6,146 | 0.065 | 397 | |||
| Total Proven and Probable—2000 | 273,206 | 0.019 | 5,218 | |||
Proven | 192,517 | 0.018 | 3,549 | |||
| Probable | 80,689 | 0.021 | 1,669 | |||
| Total Proven and Probable—2000 | 273,206 | 0.019 | 5,218 | |||
Total Proven and Probable—1999 | 320,062 | 0.018 | 5,875 | |||
- (1)
- The Company's share is 50% of the reserves presented.
- (2)
- See "Reserves" for a discussion of the estimation of proven and probable ore reserves.
- (3)
- Reserves include allowances for dilution in mining but do not reflect losses in the leaching process. The average leach recovery rate for the reusable pad in 2000 was 61.6%. The eventual average recovery rate for the dedicated pad is estimated to be approximately 50%. The mill recovery rate was 83.1% in 2000.
- (4)
- The offloads consist of approximately 68 million tons of previously crushed, leached and rinsed ore. The heap leach stockpiles consist of approximately 42 million tons of previously unprocessed ore. Sampling and metallurgical testing conducted in 1994 and 1995 confirmed that this material can be profitably processed on the dedicated leach pads.
The cut-off grades are 0.006 ounce of gold per ton for oxides and 0.010 ounce per ton for non-oxides. The prospective waste to ore ratio of pit ore is 0.76:1.
The Round Mountain operation uses conventional open-pit mining methods and recovers gold using four independent processing operations. These include crushed ore leaching (reusable pad), run-of-mine ore leaching (dedicated pad), milling of higher grade non-oxidized ore, and the gravity concentration circuit. Most of the ore is heap leached, with higher grade oxidized ores placed on the reusable pad and lower grade ores placed on the dedicated pad.
Heap leaching on a reusable pad is used to recover gold from oxide ores above a cut-off grade of 0.018 ounce per ton. Ore is crushed to less than3/4 inches at a rate of up to 30,000 tons per day and conveyed to two parallel 1.5 million square foot asphalt reusable leach pads. This ore is leached for approximately 100 days, rinsed, removed and placed on the dedicated leach pad and re-leached. The remaining gold values are sufficient to justify additional leaching of the ore on the dedicated pad over a period of years. In 2000, 24,335 tons of ore per day were processed on the reusable heap leach pad, compared to 15,602 tons per day in 1999. Reusable pad volume varies with ore release, which is determined by the phases of the pit being mined.
Lower grade ore (down to a cut-off grade of 0.006 ounces per ton for oxidized ores) and ore removed from the reusable leach pad, in addition to the stockpiled ore that was previously removed from the reusable pads, is transported to a dedicated run-of-mine leach pad. Ore is placed in 50-foot thick layers for leaching. After completion of an initial leaching cycle of approximately 100 days, additional layers of ore are placed until the heap reaches an ultimate height of 400 feet. The dedicated leach pad is constructed in phases, as capacity is needed. The existing dedicated leach pad covers approximately 30.7 million square feet and has a capacity of approximately 320 million tons. In 2000, the operation processed 141,047 tons of ore per day on the dedicated pad, compared to 120,020 tons per day in 1999. Production in 2000 from the dedicated pad was 352,132 ounces, compared to 215,825 ounces in 1999, due to increased tons and higher grades.
Construction of an 8,000 ton-per-day mill to treat higher grade non-oxide ore was completed in the fourth quarter of 1997, at a total cost of $62 million (the Company's share, $31 million). The mill processed 9,304 tons per day in 2000 producing 139,870 ounces, compared to 8,083 tons per day in 1999 producing 157,901 ounces. The reduction in mill ounces resulted from lower grades. The mill facility achieved a recovery rate of 83.1% from both higher-grade oxide and non-oxidized ores during 2000 by employing gravity concentration, fine grinding and cyanide leaching. Optimization efforts were undertaken during 2000 and by late in the year the facility was regularly attaining daily tonnage in excess of 10,000 tons per day. Efforts to continue to increase the mill throughput rate are continuing and tonnage processed is expected to again increase in 2001. In addition, some success has been achieved in processing certain high-grade oxide ores through the mill.
Gravity concentration is only applied to the highest grade ore containing coarse gold. A 500 ton-per-day gravity recovery circuit processes ore from several small flat-lying narrow, but very high-grade veins within the Round Mountain ore body. The mine produced 6,950 ounces of gold from the gravity circuit in 2000, compared to 27,094 ounces in 1999 due to lower coarse gold availability. Gravity circuit tails are sent to the mill for further cleaning and disposal.
Ore and waste rock was mined at a rate of approximately 193,837 tons per day in 2000 compared to 214,516 tons per day in 1999. The decrease in total mining tons was attributable to a reduction in the waste to ore stripping ratio to 0.82:1 in 2000 compared to 1.40:1 in 1999.
The joint venture partners approved the purchase of a new fleet of eight 240-ton haul trucks at a total cost of $18 million (the Company's share, $9 million). The trucks are scheduled to be delivered in 2001 and will replace older higher cost units.
Mining at Round Mountain is expected to be complete during 2006 (assuming no additions to reserves), with completion of stockpile processing in 2008. The joint venture partners continue to support an aggressive exploration program in the vicinity of the mine in order to add reserves and extend the mine life. In 2000, the operation completed a $1 million exploration program (the Company's share, $0.5 million) to test four target areas. A similar program has been budgeted for 2001 to explore geologic environments similar to the Round Mountain deposit.
In 2001, Round Mountain is expected to produce up to 5% less gold than 2000's production of 640,128 ounces (the Company's share, 320,064 ounces) reflecting anticipated increased waste and lower dedicated pad mine ore, partially offset by increased reusable pad grade and increased tons milled and grade. See "Cautionary 'Safe Harbor' Statement under the United States Private Securities Litigation Reform Act of 1995" and "Risk Factors".
The McCoy/Cove property commenced production in April 1986 as an open pit heap leaching operation. The McCoy mine and surrounding property, which was purchased by the Company in September 1986, is located in Lander County, Nevada, about 30 miles southwest of the town of Battle Mountain. The Cove deposit, located one mile northeast of the McCoy deposit, was discovered in early 1987. Open pit mining of the Cove deposit began in early 1988 and was completed in October 2000. Mining in the McCoy open pit was completed in April 2000. Mining is still being conducted at the Cove South Deep underground.
The McCoy/Cove property consists of approximately 1,482 unpatented claims covering approximately 30,000 acres of United States federal land administered by the Bureau of Land Management of the Department of the Interior. The Company has completed all steps currently required under U.S. law to convert certain unpatented claims to patented status and has filed the appropriate applications for patents. The patents have not been issued to date and are currently in the process of government review. See "Other—Government Regulation and Environmental Issues."
During 1996, the Company recorded a $30.0 million provision related to the estimated costs to remove waste rock from a portion of the Cove pit wall that had collapsed. The remediation was completed in the second quarter of 1999, at a total cost of $24.2 million. The unused portion of the remediation accrual was applied against deferred mining costs and reduced the balance by $5.8 million.
In 1997, as a result of the lower gold prices, the Company recorded a $47.0 million provision for impaired assets related to McCoy/Cove. The need for and the amount of the provision were determined by comparing asset carrying values to estimated future net cash flows from existing reserves.
The following table sets forth operating data for the McCoy/Cove operation from 1996 through 2000.
| | 2000 | 1999 | 1998 | 1997 | 1996 | |||||||||||||
|---|---|---|---|---|---|---|---|---|---|---|---|---|---|---|---|---|---|---|
| Gold produced (ounces) | 162,784 | 124,536 | 167,494 | 187,034 | 271,731 | |||||||||||||
| Silver produced (ounces) | 12,328,297 | 8,430,072 | 9,412,823 | 11,021,708 | 7,102,348 | |||||||||||||
| Mining cost/ton of ore and waste | $ | 0.78 | $ | 0.66 | $ | 0.71 | $ | 0.74 | $ | 0.72 | ||||||||
| Heap leaching cost/ton of ore | $ | 2.44 | $ | 1.82 | $ | 1.74 | $ | 1.70 | $ | 1.68 | ||||||||
| Milling cost/ton of ore | $ | 6.38 | $ | 6.32 | $ | 6.09 | $ | 8.82 | $ | 9.50 | ||||||||
| Production cost/ounce of gold produced: | ||||||||||||||||||
| Direct mining expense | $ | 166 | $ | 252 | $ | 200 | $ | 276 | $ | 286 | ||||||||
| Deferred stripping cost | 12 | (35 | ) | (1 | ) | (10 | ) | (16 | ) | |||||||||
| Inventory movements and other | 1 | 4 | 4 | 5 | 1 | |||||||||||||
| Cash operating cost | 179 | 221 | 203 | 271 | 271 | |||||||||||||
| Royalties | 3 | 2 | 3 | 3 | 5 | |||||||||||||
| Production taxes | 5 | — | 2 | (1 | ) | 4 | ||||||||||||
| Total cash cost | 187 | 223 | 208 | 273 | 280 | |||||||||||||
| Depreciation | 26 | 48 | 52 | 66 | 71 | |||||||||||||
| Amortization | 28 | 27 | 37 | 44 | 46 | |||||||||||||
| Reclamation and mine closure | 11 | 11 | 9 | 10 | 8 | |||||||||||||
| Total production cost | $ | 252 | $ | 309 | $ | 306 | $ | 393 | $ | 405 | ||||||||
| Average gold-to-silver price ratio(1) | 56:1 | 54:1 | 54:1 | 67:1 | 75:1 | |||||||||||||
| Capital expenditures (millions) | $ | 0.6 | $ | 1.1 | $ | 1.3 | $ | 2.2 | $ | 7.3 | ||||||||
| Deferred (applied) mining expenditures (millions) | $ | (5.0 | ) | $ | 9.5 | $ | 0.5 | $ | 3.7 | $ | 6.0 | |||||||
| Heap leached: | ||||||||||||||||||
| Ore processed (tons/day) | 4,971 | 11,262 | 11,296 | 17,840 | 16,671 | |||||||||||||
| Total ore processed (000 tons) | 1,809 | 4,178 | 4,112 | 6,494 | 6,068 | |||||||||||||
| Gold grade (ounce/ton) | 0.024 | 0.022 | 0.021 | 0.018 | 0.018 | |||||||||||||
| Silver grade (ounce/ton) | 0.96 | 0.37 | 0.26 | 0.29 | 0.27 | |||||||||||||
| Gold and silver recovery rates | (2) | (2) | (2) | (2) | (2) | |||||||||||||
| Gold recovered (ounces) | 46,892 | 45,200 | 53,096 | 55,129 | 66,834 | |||||||||||||
| Silver recovered (ounces) | 910,858 | 396,428 | 398,006 | 396,928 | 513,227 | |||||||||||||
| | 2000 | 1999 | 1998 | 1997 | 1996 | ||||||
|---|---|---|---|---|---|---|---|---|---|---|---|
| Milled: | |||||||||||
| Ore processed (tons/day) | 11,461 | 12,000 | 11,829 | 9,315 | 9,031 | ||||||
| Total ore processed (000 tons) | 4,172 | 4,452 | 4,306 | 3,391 | 3,287 | ||||||
| Gold grade (ounce/ton) | 0.053 | 0.038 | 0.046 | 0.061 | 0.086 | ||||||
| Silver grade (ounce/ton) | 3.71 | 3.02 | 2.95 | 4.54 | 3.14 | ||||||
| Gold recovery rate (%) | 50.7 | 45.8 | 57.8 | 64.3 | 79.5 | ||||||
| Silver recovery rate (%) | 69.8 | 61.3 | 69.8 | 69.7 | 73.5 | ||||||
| Gold recovered (ounces) | 115,892 | 79,336 | 114,398 | 131,905 | 204,897 | ||||||
| Silver recovered (ounces) | 11,417,439 | 8,033,644 | 9,014,817 | 10,624,780 | 6,589,121 | ||||||
- (1)
- To convert costs per ounce of gold into comparable costs per ounce of co-product silver, divide the production cost per ounce of gold by the period's average gold-to-silver price ratio.
- (2)
- As dedicated leach pads are used at McCoy/Cove, a gold recovery rate cannot be calculated until leaching is complete. The ultimate recovery rate for crushed ore is estimated to be about 68% for gold and 35% for silver and for run-of-mine ore, 48% for gold and 10% for silver.
Gold deposition in the McCoy pit is associated with the intrusion of a Tertiary-age quartz diorite stock into Mesozoic sedimentary formations including quartzites, conglomerates, and limestones. Gold occurs in the Skarn Formation proximal to the intrusion and as a stockwork-type deposit in the highly fractured sediments.
The Cove deposit is a sediment hosted gold-silver deposit that is spatially associated with a sequence of argillically-altered felsite dikes. Gold and silver mineralization occurs both as a rind around the altered intrusion and away from the intrusions along favorable horizons such as permeable beds and fractured zones. Cove ore is hosted by limestone of the Augusta Mountain Formation, by conglomerate/sandstone of the Panther Canyon Formation and by dolomite in the Home Station Formation.
McCoy/Cove Mine
Ore Reserves(1)
December 31, 2000
| | Tonnage (000's short tons) | Average grade (ounces per ton) | Content(2) (000's ounces) | |||||||
|---|---|---|---|---|---|---|---|---|---|---|
| | | Gold | Silver | Gold | Silver | |||||
| Cove Underground | 53 | 0.405 | 0.725 | 21 | 38 | |||||
| Stockpiles | 4,667 | 0.030 | 2.327 | 140 | 10,861 | |||||
| Proven and Probable—2000 | 4,720 | 0.034 | 2.309 | 161 | 10,899 | |||||
Proven | 4,667 | 0.030 | 2.327 | 140 | 10,861 | |||||
| Probable | 53 | 0.405 | 0.725 | 21 | 38 | |||||
| Total Proven and Probable—2000 | 4,720 | 0.034 | 2.309 | 161 | 10,899 | |||||
Total Proven and Probable—1999 | 11,832 | 0.043 | 2.387 | 514 | 28,243 | |||||
- (1)
- See "Reserves" for a discussion of the estimation of proven and probable ore reserves.
- (2)
- Reserves include allowances for dilution in mining but do not reflect losses in the recovery process. Recovery rates for the life-of-mine are estimated to be 55% for gold and 68% for silver.
The gold-equivalent cut-off grades for the underground is 0.275 ounce per ton. All other reserves are in stockpiles.
Ore and waste rock was mined from the open pits at a rate of 55,938 tons per day in 2000, compared to 117,641 tons per day in 1999. The lower rate is an average for the full year despite the completion of mining prior to year's end. Longer hauls and smaller working areas also affected mining rates. All material required drilling and blasting prior to excavation. The open pit mining operation employed one 35-cubic yard hydraulic mining shovel, two 23-cubic yard hydraulic mining shovels, one 23-cubic yard wheel loader, eight 150-ton and ten 190-ton mechanical haul trucks. A portion of the fleet is being used for reclamation activities.
Ore mined from underground amounted to 63,000 tons in 2000, compared to 133,000 tons mined in 1999. The lower mining rate is attributable to both higher development requirements and mining less productive drift and fill cuts as opposed to mining open stopes in 1999.
The Company mined the Cove pit at a high rate to minimize dewatering time and costs. Water pumped out of the Cove pit averaged 14,000 gallons per minute at the end of 2000. The Company uses infiltration ponds for water pumped from the mine. Dewatering activities must be maintained while underground operations are still active.
The ore mined from the Cove pit was all oxide in the early years of production. Oxide ore was replaced by sulfide ore at depth. In the second half of 1997, McCoy/Cove began processing carbonaceous ore that had in past years been mined from the Cove pit and stockpiled.
Stockpiled ore increased from 2.7 million tons in 1999 to 4.7 million tons in 2000. Stockpiled ore fluctuated as a function of the mine plan. Because open pit mining has been completed, the stockpiled ore will now be consumed through mid-2002.
The mill uses flotation and agitation leach circuits to recover gold and silver from high-grade oxide ore and sulfide ores not amenable to heap leaching. The majority of the ore processed through the mill in 2000 was from sulfide ores mined during the year. Mill throughput averaged 11,461 tons per day in 2000 compared to 12,000 in 1999. Gold and silver mill production increased in 2000 compared to 1999 due to higher grades and increased recoveries as a result of the higher grades. The higher grades also brought harder ores, which decreased the throughput.
The Cove South Deep underground contributed 60,130 tons to the mill and produced approximately 10,700 ounces of gold and 43,000 ounces of silver. Mining will continue at Cove South Deep into the first half of 2001.
Heap leach crushing was completed in the first half of 2000 as the remainder of the oxide ore was mined from the McCoy and Cove pits. Residual leaching will continue in 2001. Rinsing and restoration of the first of three heap leach pads commenced in 1999 and contouring and seeding was completed in 2000.
Heap leach gold production was slightly higher in 2000 compared to 1999 due to higher grade ore placed on pad 3 and re-leaching of pad 2. Heap leach processing averaged 4,971 tons per day in 2000, down from 11,262 tons per day in 1999.
In 2001, McCoy/Cove will be processing ore from stockpiles and the Cove South Deep underground. Residual heap leaching will continue in 2001. As a result, McCoy/Cove is expected to produce about 60% less gold and silver in 2001 compared to the 162,784 ounces of gold and 12.3 million ounces of silver produced in 2000. See "Cautionary 'Safe Harbor' Statement under the United States Private Securities Litigation Reform Act of 1995" and "Risk Factors."
The Kettle River properties are located in Ferry County in the State of Washington and cover approximately 7,535 acres through patented and unpatented mining claims and fee lands.
Development of the Lamefoot project began during 1992 when the portal was collared. By December 1994, 17,500 feet of drifting was complete. Lamefoot commenced production in December 1994, and achieved full production in June 1995. Mining at Lamefoot was completed in December 2000.
In December 1994, construction commenced at the K-2 project. The portal was collared in March 1995 and a total of 10,629 feet of development was completed by the end of 1996. K-2 stope development began in the fourth quarter of 1996 and production commenced in January 1997.
In 1997, as a result of the lower gold prices, the Company recorded a $15.0 million provision for impaired assets related to Kettle River. The need for and the amount of the provision were determined by comparing asset carrying values to estimated future net cash flows from existing reserves.
During the year, exploration efforts identified an extension to the northeast of the K-2 deposit. A $3.4 million development program is planned for 2001. The resource of approximately 500,000 tons is scheduled for mining in 2002.
In 2000, the Company acquired a 75 percent interest in the Golden Eagle advanced gold exploration project. Golden Eagle is located in the Republic district of Washington State approximately 15 miles from the Kettle River millsite. The Company plans to spend $0.8 million for exploration activity in the Republic district in 2001 including work at Golden Eagle.
The following table sets forth operating data for the Kettle River operation from 1996 through 2000.
| | 2000 | 1999 | 1998 | 1997 | 1996 | ||||||||||||
|---|---|---|---|---|---|---|---|---|---|---|---|---|---|---|---|---|---|
| Gold produced (ounces) | 94,086 | 104,396 | 113,692 | 129,866 | 124,910 | ||||||||||||
| Mining cost/ton of ore | $ | 20.52 | $ | 23.57 | $ | 21.65 | $ | 21.53 | $ | 21.12 | |||||||
| Milling cost/ton of ore | $ | 11.58 | $ | 11.22 | $ | 10.71 | $ | 10.58 | $ | 11.96 | |||||||
| Production cost/ounce of gold produced: | |||||||||||||||||
| Direct mining expense | $ | 224 | $ | 239 | $ | 238 | $ | 231 | $ | 190 | |||||||
| Deferred mine development | — | — | — | — | — | ||||||||||||
| Inventory movements and other | (6 | ) | (1 | ) | 6 | (4 | ) | 11 | |||||||||
| Cash operating cost | 218 | 238 | 244 | 227 | 201 | ||||||||||||
| Royalties | 13 | 15 | 12 | 14 | 10 | ||||||||||||
| Production taxes | 1 | 2 | 1 | 2 | 2 | ||||||||||||
| Total cash cost | 232 | 255 | 257 | 243 | 213 | ||||||||||||
| Depreciation | 11 | 55 | 77 | 54 | 59 | ||||||||||||
| Amortization | 8 | 8 | 5 | 36 | 45 | ||||||||||||
| Reclamation and mine closure | 15 | 15 | 12 | 12 | 8 | ||||||||||||
| Total production cost | $ | 266 | $ | 333 | $ | 351 | $ | 345 | $ | 325 | |||||||
| Capital expenditures (millions) | $ | 1.4 | $ | 0.4 | $ | 1.5 | $ | 3.8 | $ | 8.8 | |||||||
| Milled: | |||||||||||||||||
| Ore processed (tons/day) | 1,470 | 1,698 | 2,017 | 2,118 | 1,652 | ||||||||||||
| Total ore processed (000 tons) | 535 | 630 | 734 | 771 | 601 | ||||||||||||
| Grade (ounce/ton) | 0.209 | 0.198 | 0.187 | 0.197 | 0.240 | ||||||||||||
| Recovery rate (%) | 84.1 | 83.7 | 82.8 | 85.4 | 86.5 | ||||||||||||
Ore reserves at Kettle River exist at the Lamefoot and K-2 deposits. At Lamefoot, gold occurs near the contact between Permian age siliciclastic and carbonate rocks and is associated with silicification, magnetite, hematite, pyrrhotite and pyrite. At K-2, gold is contained in steeply dipping quartz carbonate veins hosted by Eocene age volcanic rocks.
Kettle River
Ore Reserves(1)
December 31, 2000
| | Tonnage (000's short tons) | Average grade of gold (ounces per ton) | Gold content(2) (000's ounces) | |||
|---|---|---|---|---|---|---|
| Lamefoot stockpile | 107 | 0.196 | 21 | |||
| K-2 | 256 | 0.191 | 49 | |||
| Total Proven and Probable—2000 | 363 | 0.193 | 70 | |||
Proven | 363 | 0.193 | 70 | |||
| Probable | — | — | — | |||
| Total Proven and Probable—2000 | 363 | 0.193 | 70 | |||
Total Proven and Probable—1999 | 779 | 0.208 | 162 | |||
- (1)
- See "Reserves" for a discussion of the estimation of proven and probable ore reserves.
- (2)
- Reserves do not reflect losses in the milling process but do include allowance for dilution in the mining process. The average mill recovery rate of gold in 2000 was 83.7%.
The cut-off grade is 0.135 ounces of gold per ton at K-2.
At Kettle River, a series of deposits are mined and trucked to feed a central mill. In 2000, approximately 62% of ore milled came from Lamefoot and approximately 38% of ore milled came from K-2.
At the Lamefoot property, the mining method used was longhole open stoping, with delayed backfill. Zones with ore widths of 50 feet used cemented backfill in primary stopes and unconsolidated fill in secondary stopes. Zones under 50 feet in width were filled with unconsolidated fill. Ore was removed from the stopes using remote control muckers and hauled to the surface using 26-ton haul trucks. Total Lamefoot ore production in 2000 was 379,447 tons compared to 381,603 in 1999. Mining was completed in December 2000.
The mining method used at K-2 is longhole open stoping, similar to Lamefoot, but due to the narrow widths, cemented fill is required in the South zone. Total K-2 ore production in 2000 was 227,671 tons compared to 257,258 in 1999.
The mill processed approximately 1,470 tons of ore per day in 2000, compared to 1,698 tons per day in 1999. Total Kettle River production decreased in 2000 compared to 1999 due to fewer tons mined.
In 2001, Kettle River is expected to produce about 30% to 35% less than the 94,086 ounces of gold produced in 2000, reflecting anticipated lower mill tonnage, somewhat offset by higher grade and recovery. See "Cautionary 'Safe Harbor' Statement under the United States Private Securities Litigation Reform Act of 1995" and "Risk Factors."
The Lupin mine is an underground operation located 250 miles northeast of Yellowknife in the Nunavut Territory of Canada, 56 miles south of the Arctic Circle. Production began in October 1982.
The Lupin mining lease covers 6,998 acres. The principal lease was renewed for 21 years in 1992 and, provided the Company has complied with its terms, is renewable for further 21 year periods subject to any applicable regulations then in effect. The lease was granted by the Department of Indian Affairs and Northern Development on behalf of the Crown and is subject to the provisions of the Territorial Lands Act and the Canada Mining Regulations. The lease is in good standing. See "Other—Government Regulation and Environmental Issues" for discussion regarding Inuit ownership interests.
The Company purchased the Ulu property, located approximately 100 miles north of Lupin, in 1995. The property is subject to a 5% net smelter royalty after the recovery of 675,000 ounces of gold. Ulu has approximately 1.5 million tons of other mineralization at an average grade of 0.374 ounces of gold per ton. The deposit is open on strike and down dip. In the third quarter of 1997, the Company deferred further development of Ulu in light of the downturn in gold prices.
In 1997, as a result of the lower gold prices, the Company recorded a $65.0 million provision for impaired assets related to the Lupin and Ulu properties. The need for and the amount of the provision were determined by comparing asset-carrying values to estimated future net cash flows from existing reserves.
The Lupin mine was placed on care and maintenance in early 1998 due to depressed gold prices and a high cost structure. Annual care and maintenance costs were $3.4 million in 1999 and $4.6 million in 1998.
In 2000 the Company reopened the Lupin mine. A reengineering study, completed late in 1998, identified savings that helped lower costs. Gold production from Lupin recommenced in April 2000. The Company incurred and expensed start-up costs of $4.8 million in 2000. Based on current reserves of 434,000 ounces and other mineralization of 0.7 million tons at an average grade of 0.320 ounces of gold per ton, the mine plan projects production through 2004. Drilling indicates additional mineralization at depth, which if confirmed by additional drilling, could extend the mine life for several more years. The Ulu satellite deposit represents the potential for additional mill feed for the site.
The following table below sets forth operating data for the Lupin mine from 1996 through 2000.
| | 2000 | 1999 | 1998 | 1997 | 1996 | ||||||||||
|---|---|---|---|---|---|---|---|---|---|---|---|---|---|---|---|
| Gold produced (ounces) | 117,729 | — | — | 165,335 | 166,791 | ||||||||||
| Mining cost/ton of ore | C$ | 42.36 | — | — | C$ 46.09 | C$ 44.08 | |||||||||
| Milling cost/ton of ore | C$ | 13.98 | — | — | C$ 11.77 | C$ 12.39 | |||||||||
| Production cost/ounce of gold produced: | |||||||||||||||
| Canadian dollars: | |||||||||||||||
| Direct mining expense | C$ | 344 | — | — | C$ 381 | C$ 411 | |||||||||
| Deferred mine development | (6 | ) | — | — | 13 | (4 | ) | ||||||||
| Inventory movements and other | — | — | — | (1 | ) | 1 | |||||||||
| Cash operating cost | C$ | 338 | — | — | C$ 393 | C$ 408 | |||||||||
| U.S. dollars: | |||||||||||||||
| Cash operating cost | US$ | 213 | — | — | US$ 284 | US$ 299 | |||||||||
| Royalties | — | — | — | — | — | ||||||||||
| Production taxes | — | — | — | — | — | ||||||||||
| Total cash cost | 213 | — | — | 284 | 299 | ||||||||||
| Depreciation | 27 | — | — | 71 | 71 | ||||||||||
| Amortization | 8 | — | — | 24 | 21 | ||||||||||
| Reclamation and mine closure | 17 | — | — | 14 | 8 | ||||||||||
| Total production cost | US$ | 265 | — | — | US$ 393 | US$ 399 | |||||||||
| Capital expenditures (millions US$) | $ | 4.7 | — | — | $12.3 | $15.7 | |||||||||
| Deferred (applied) mining expenditures (millions US$) | $ | 0.4 | — | — | $(1.8 | ) | $0.2 | ||||||||
| Milled: | |||||||||||||||
| Ore processed (tons/day) | 1,861 | — | — | 2,167 | 2,111 | ||||||||||
| Total ore processed (000 tons) | 508 | — | — | 789 | 768 | ||||||||||
| Grade (ounce/ton) | 0.248 | — | — | 0.226 | 0.235 | ||||||||||
| Recovery rate (%) | 93.3 | — | — | 92.6 | 92.5 | ||||||||||
Gold at the Lupin deposit occurs in a Z-shaped isoclinally folded iron formation of Archean age. Gold is associated with pyrrhotite, arsenopyrite and quartz.
Lupin Mine
Ore Reserves(1)
December 31, 2000
| | Tonnage (000's short tons) | Average grade of gold (ounces per ton) | Gold content(2) (000's ounces) | |||
|---|---|---|---|---|---|---|
| Center Zone | 610 | 0.275 | 168 | |||
| East Zone | 177 | 0.226 | 40 | |||
| West Zone | 673 | 0.251 | 169 | |||
| McPherson Zone | 218 | 0.263 | 57 | |||
| Total Proven and Probable—2000 | 1,678 | 0.259 | 434 | |||
Proven | 1,141 | 0.256 | 292 | |||
| Probable | 537 | 0.264 | 142 | |||
| Total Proven and Probable—2000 | 1,678 | 0.259 | 434 | |||
Total Proven and Probable—1999 | 1,931 | 0.268 | 518 | |||
- (1)
- See "Reserves" for a discussion of the estimation of proven and probable ore reserves.
- (2)
- Reserves do not reflect losses in the milling process but do include allowance for dilution of ore in the mining process. The mining recovery factor was estimated at 85%. The average mill recovery rate in 2000 was 93%.
The cut-off grade used in the reserve calculation is 0.150 ounce of gold per ton at the upper levels of the mine and 0.204 ounce of gold per ton at the lower levels of the mine.
Access to the Lupin underground mine, removal of ore and waste, and movement of personnel within the mine is by a shaft developed to a depth of 3,970 feet and by a ramp driven to a depth of 4,510 feet.
The ore in the Center, West, East and McPherson Zones has been mined by the sub-level, long-hole open stoping method. In 1995, Lupin incorporated "pastefill," which is composed of mine tailings and cement, into the stoping sequence.
After the ore is mined, it is hoisted to the surface for processing and recovery of gold in a 2,300 ton per day mill, where the recovered gold is cast in doré bars prior to being shipped off site. The mill processed 1,861 tons per day in 2000.
Additional ground support is required and longer truck haulage distances are a factor as the depth increases. All of this causes slower and more costly mining in the deeper levels of the mine. The Company has changed its mining techniques and backfill process to address the challenges of mining at greater depths. Mechanized cut and fill mining techniques may afford an opportunity to reduce dilution and to improve profitability at depth.
During 1997, a study determined that a required exhaust air raise, doubling as an internal winze, was feasible to access ore below the current depth of the ramp. The winze will allow the hoisting of ore from the deeper areas of the mine, thereby reducing haulage costs. The project was started in 1997, prior to the mine's temporary shut down. Further work was re-started upon re-commissioning of the mine in early 2000. Final commissioning of the winze is expected to take place in April 2001.
In 2001, Lupin is expected to produce about 25% to 30% more than the 117,729 ounces of gold produced in 2000, reflecting a full year of production. See "Cautionary 'Safe Harbor' Statement under the United States Private Securities Litigation Reform Act of 1995" and "Risk Factors."
Supplies, Utilities and Transportation
The Lupin mill facilities and mine are in a remote location in the sub-Arctic region of Canada. The Company must therefore prepare for and respond to difficult weather and other conditions. At the mine, the Company maintains supplies of spare parts and other materials, including fuel, in excess of what would be required at less remote locations.
The principal supplies needed for the operation of the Lupin mine are diesel fuel, chemical reagents (including lime, cyanide and zinc), cement, grinding media, drill steel, equipment parts, lubricants, food and explosives. The largest single item is diesel fuel, which is used principally to generate power. A diesel-powered generating plant provides power for all the Lupin facilities. The powerhouse has a primary installed capacity of approximately 18,000 kilowatts, which is supplemented by additional standby generators having a combined capacity of 1,500 kilowatts. Heating for the Lupin facilities is obtained by using waste heat from these generators augmented by oil-fired boilers.
All equipment, materials and supplies must be transported to the mine from Edmonton or Yellowknife. Personnel are transported from these locations and from Kugluktuk (formerly Coppermine) and Cambridge Bay in the Nunavut Territory. In 2000, the cost of transporting personnel, equipment, material and supplies to Lupin was approximately $3.7 million. Each year since 1983, the Company has completed a 360-mile ice road commencing 40 miles northeast of Yellowknife and ending at the Lupin mine as the most economical way of transporting bulk items, including fuel, to the mine. Winter road operating costs are shared with other third party users.
In order to operate the winter road, the Company is required to obtain certain licenses from the Federal and Territorial Governments. To date, the Company has experienced no significant difficulties in obtaining these licenses. The current license of occupation expires in 2003. The process to file a new application for a jointly held license of occupation among major road users is underway. The winter road is usable for approximately 12 weeks each year beginning in mid-January, during which time tractor-trailers can transport all of the Company's annual requirements for diesel fuel, chemical reagents and other supplies. There are on-site facilities for the storage of approximately 5.4 million U.S. gallons of diesel fuel, which is in excess of the mine's annual requirements.
Surface facilities at the Lupin mine include a 6,300-foot compacted gravel airstrip with an instrument landing and navigation system and runway lighting. Supplies and personnel that must be brought in by air are transported principally on the Company's Boeing 727 aircraft, which carries up to 114 passengers, or up to 35,000 pounds of freight, or a combination of both passengers and freight.
Voice and data communications with the Lupin mine are maintained via satellite, which provides for uninterrupted communications regardless of weather conditions.
Water Supply and Waste Disposal
Water for mining, milling and domestic use is obtained on site by pumping from Contwoyto Lake. Tailings from the mill are pumped into a tailings pond or pumped underground as part of the paste-backfill. Since 1995, approximately 31% of tailings were placed underground as paste-backfill. Water from the tailings pond is processed through a water treatment plant and monitored for compliance with all regulatory standards prior to discharge. In July of 2000, the Lupin water license was extended for a period of 8 years through 2008, to coincide with the anticipated mine life.
In 1997, the Company deferred a final construction decision on its 100%-owned Aquarius project, located in Macklem Township, 40 kilometers east of Timmins, Ontario, Canada. The City of Timmins is centrally located in northeastern Ontario on Highway 101 approximately 700 kilometers, by road, northwest of Toronto. All-weather primary highways connect with Thunder Bay to the west and North Bay, Sudbury and Toronto to the south. The project site is located two kilometers south of Highway 101.
The project site is on a group of 12 patented claims that grant the Company fee simple title. The patents are part of a larger land package of leased and staked claims that cover most of the northern portion of Macklem Township. Federal environmental permitting started in May 1995. On June 30, 2000 the Minister of the Environment concluded that the project was not likely to cause significant adverse environmental effects and public concerns did not warrant a referral to a review panel. The project was referred back to the Minister of Fisheries and Oceans for action under Section 37 of the Canadian Environmental Assessment Act. In August 2000, Oceans and Fisheries Canada (O&FC) issued the Letter of Intent and Memorandum of Understanding for the Aquarius Project. A draft version of the federal permit "Authorization For Works Or Undertakings Affecting Fish Habitat" was released for comment by O&FC in December 2000. The Company anticipates full federal permitting during the first quarter 2001. This will allow the company to proceed with obtaining all necessary provincial and municipal permits to build and operate the project.
Based on the revised bankable feasibility study completed during the second quarter 2000, Aquarius has proven and probable reserves of 1,189,000 ounces of gold at December 31, 2000 (17.5 million tons of ore at an average grade of 0.068 ounces per ton). The reserves are based on a cutoff grade of 0.015 ounce per ton. The cutoff grade was based on a price of $300 per ounce of gold. The gold recovery is expected to be 95%.
Aquarius is an Archean lode gold deposit with mineralization in carbonate altered ultramafic rocks, associated felsic intrusives, and quartz veins in talc-chlorite schists. Clay overburden 10 to 40 meters thick overlays 30 to 80 meters of glacial till. The "nuggety" style of gold mineralization at Aquarius is characteristic of this deposit type and leads to difficulty in the prediction of ore grades. This difficulty is addressed by extensive drilling advanced geostatistical analysis with multiple techniques, cross validation with production data and independent estimates, and review of the results by an expert consultant.
In 1998, the Company completed the infrastructure required for the frozen earth system (ice-wall) around the pit perimeter to prevent groundwater from flowing into the pit from the surrounding water table. Similar systems have been used successfully in construction and underground mining for over 100 years. The circumference of the freeze system is 12,000 ft (2.25 miles, equivalent to 3.66 km), and includes over 600,000 linear feet of drilling and the placement of more than 2,200 freeze-wells spaced 6.3 feet apart. This will allow an adequate distance between the freeze-wells to provide a solid ice barrier. The freeze-wells penetrate the bedrock, which has little water flow. A calcium-chloride solution (refrigerant) will be cooled to minus 20o F by electrically powered refrigeration units and circulated through the freeze-wells. As the circulation of the refrigerant progresses, cylindrical columns of frozen soil will form around each freeze-well. The size of the columns increases over time, forming a virtually watertight, impermeable barrier. The Company expects that it will take approximately four months for this process to entirely form the ice-wall to prevent water from leaking through the glacial overburden. The Company does not plan to operate the frozen earth system during the period of project deferral. All facilities and equipment are on a scheduled care and maintenance program designed to fully preserve all assets.
The revised bankable feasibility study evaluated a number of processing options for treating the Aquarius ore. Based on test results, economic evaluation and a "least risk" approach a simplified gravity/flotation process was selected. This process is based on semi-autogenous grinding (SAG) utilizing milling equipment previously belonging to the Paredones Amarillos project. The mill has been designed to process 7,500 tonnes (8,250 tons) per day.
The first planned stage of mining will be removal of the clay and sand overburden. The rock mining stage will produce all of the ore to be milled. Due to the shape of the deposit, the pit will have two separate bottoms with a ridge of waste rock separating them. Mining will be phased to exploit the more northerly of the two segments first.
Electrical power will be supplied to the project from Ontario Hydro, the main utility provider in the province of Ontario. The on-site primary sub-station and power-line to the Ontario grid were installed in 1997.
There will be two sources for water supply. Fresh water will come from one or more wells located near the minesite development. Water will also be reclaimed from the tailings area.
Based on the proposed mine plan and revised processing concept, the average annual production rate is expected to be approximately 189,000 ounces. Average cash operating costs are expected to be approximately $150 per ounce. Total production costs are anticipated to be $240 per ounce. The capital cost to construct Aquarius is estimated at $90 million, excluding the value of owner equipment contributions. See "Cautionary 'Safe Harbor' Statement under the United States Private Securities Litigation Reform Act of 1995" and "Risk Factors."
During the operating phase of the mine, the total site workforce is expected to consist of approximately 215 people.
Site clearing and pit-perimeter road construction were completed in 1997. The remainder of the engineering, procurement, and construction activities are currently deferred until the spot price for gold increases and the Company obtains financing under acceptable terms.
Development holding costs are expensed as incurred. The Company expensed Aquarius holding costs of $0.7 million in 2000 and $0.5 million in 1999. At December 31, 2000, the Company has a net book value of approximately $48 million in acquisition and construction costs related to Aquarius. Further delays in development and construction from continued low gold prices could result in a write-down of all or a portion of these costs. The Company expects to expense approximately $1.4 million in development holding costs and $1.6 million in depreciation for Aquarius in 2001.
Under an agreement with Newmont Gold Company, completed in July 2000, the Company exchanged its 50% interest in the Kuranakh gold project located in eastern Russia for Newmont's 75% operating interest in the Golden Eagle project located in the Republic district of Washington State. The Company may also receive up to an additional $7 million from Newmont depending on whether certain permitting, financing and project completion conditions are achieved in respect of Kuranakh. Further, each party will be required to pay a production royalty to the other, starting at 0.5% of its share in production at a $350 per ounce gold price and increasing to 1% at a $400 gold price. No gain or loss was recorded pursuant to this agreement.
Kuranakh is situated next to an existing mine and milling operation in the Sakha Republic. Over the past four years the Company conducted exploration and other work, and concluded that Kuranakh was a good development opportunity. Significant exploration activity however remained to be carried out. Even if the Company were to fund this category of expenditure and incur the expense of pursuing a project in a remote foreign location, it does not have the capacity to procure capital to develop and build Kuranakh. The Company concluded that the Kuranakh gold project would be a better opportunity for a financially stronger enterprise. This led to discussions, and ultimately the agreement with Newmont.
Golden Eagle is an advanced gold exploration project located approximately 15 miles from the Company's Kettle River operation. Covering approximately 204 acres of fee land and patented mining claims in a prospective area for mineral exploration, Golden Eagle represents a good opportunity to extend operations at Kettle River. The Company commenced a drilling program during the third quarter of 2000. The agreement with Newmont also includes other holdings in the Republic District representing 3,500 acres where mineral rights and/or surface rights are held.
In addition to conducting exploration for new gold deposits, the Company explores for extensions of known reserves at its mines and development properties. The Company's exploration program concentrates on those projects believed to represent the most promising near-term prospects. In particular, exploration efforts are focused on projects located where the Company already has, or plans an extensive gold mining infrastructure, principally those prospects in North America.
In 2000, efforts at Round Mountain focused on identification and exploration in the areas surrounding the minesite. Four areas were drilled with further drilling recommended at one of those targets. At McCoy/Cove, detailed drilling from underground further defined the Cove South Deep deposit in coordination with mining and extraction of the deposit. Five additional targets were drill tested at McCoy/Cove during the year. At Kettle River the East Veins deposit, a satellite located to the north east of the K-2 deposit, was successfully drilled off from underground development headings with additions to other mineralization. Drill tests of continuations of the East Veins were encouraging and further drilling is planned in 2001. The Company continues to evaluate opportunities within the region for extending the life of the project.
In 2000, the Company carried out extensive reviews of projects in Nevada and selected areas of the western U.S. as well as in the Timmins area in Ontario, Canada. Four U.S. properties acquired in 1999 were drill tested with results warranting further work on one of the properties. Two new properties were acquired during 2000 in Nevada. Drilling planned for 2001 will follow up on the results of fieldwork done on these properties during the year. In Canada, activities in the Timmins area included drill tests of two properties with field examinations of several others. Further drilling is planned on two Timmins properties in 2001. The Youga/Bitou project is a joint venture project in Burkina Faso, West Africa and the only project in which the Company is involved outside of North America. Further drilling and fieldwork were done during 2000 in support of the feasibility study managed by the operating partner.
By judgement entered on July 6, 2000 the Superior Court for the State of Alaska found that Echo Bay Alaska Inc., an indirect subsidiary of the Company, had completed the requirements of a closeout plan relating to final reclamation of the Alaska-Juneau mine. Among other findings, the Court concluded, as to those areas within the mine where Echo Bay Alaska Inc. activities took place, there exists no risk of a release or threatened release of a hazardous substance in sufficient concentrations to present a danger to human or ecological receptors.
According to the findings of the Court, a full compromise and settlement of all claims and courses of action raised by the State of Alaska or which could have been asserted against Echo Bay Alaska Inc. constitutes the completion of the closeout plan requirements and related work plans. This finding is based upon all information made available to the State by Echo Bay Alaska Inc. and its contractors. The Company believes that all obligations in respect of the Alaska-Juneau project have been satisfied and there is no further liability to the Company or its subsidiaries relating to the reclamation and closure of the project. The remaining $2.0 million reclamation accrual was credited to Other Income in 2000. In addition, the Company believes that no third party liability exists in respect of the activities of Echo Bay Alaska Inc. relating to the Alaska-Juneau project and the reclamation of the Alaska-Juneau mine.
In 1996, Sunnyside Gold Corporation ("SGC"), an indirect wholly owned subsidiary of the Company, finalized a consent decree with the State of Colorado that set standards for the release of all reclamation and water treatment permits and resolved future enforcement issues regarding groundwater seeps and springs. SGC estimates that it will take a minimum of an additional three years for all of the conditions of the consent decree agreement to be fulfilled by both parties. SGC has $4.7 million accrued at December 31, 2000 for future reclamation costs at the Sunnyside mine. SGC's provision for future reclamation costs is reviewed periodically and adjusted as additional information becomes available.
Precious Metal Sales and Hedging Activities
The Company's doré bars are further refined by third parties before they are sold as gold or silver bullion. The refined gold and silver is sold to banks or precious metal dealers.
The Company's profitability is subject to changes in gold and silver prices, exchange rates, interest rates and certain commodity prices. To reduce the impact of such changes, the Company attempts to lock in the future value of certain of these items through hedging transactions. These transactions are accomplished through the use of derivative financial instruments, the value of which is derived from movements in the underlying prices or rates.
The Company continually monitors its hedging policy in light of forecasted production, operating and capital expenditures, exploration and development requirements and factors affecting volatility of gold prices such as actual and prospective interest rate and gold lease rate performance. The gold- and silver-related instruments used in these transactions include fixed and floating forward sales contracts and options. These forward sales contracts obligate the Company to sell gold or silver at a specific price on a future date. Call options give the holder the right, but not the obligation to buy gold or silver on a specific future date at a specific price. These tools reduce the risk associated with gold and silver price declines, but also could limit the Company's participation in increases of gold and silver prices. The Company engages in forward currency-exchange contracts to reduce the impact on the Lupin mine's operating costs caused by fluctuations in the exchange rate of U.S. dollars to Canadian dollars.
The Company assesses the exposure that may result from a hedging transaction prior to entering into the commitment, and only enters into transactions which it believes accurately hedge the underlying risk and could be safely held to maturity. The Company does not actively engage in the practice of trading derivative securities for profit. The Company regularly reviews its unrealized gains and losses on hedging transactions.
The credit risk exposure related to all hedging activities is limited to the unrealized gains on outstanding contracts based on current market prices. To reduce counterparty credit exposure, the Company deals only with large, credit-worthy financial institutions and limits credit exposure to each. In addition, the Company deals only in markets it considers highly liquid to allow for situations where positions may need to be reversed.
Certain of the Company's counterparties require margin deposits if the fair value of the hedge position is less than the predetermined margin threshold. The Company also utilizes counterparties that do not require margin deposits. At December 31, 2000, the estimated fair value of the Company's hedge portfolio was $8.4 million, which is within the predetermined margin limits of $17 million. Sensitivity to various market factors underlying these contracts are shown in Note 17 to the consolidated financial statements. The Company regularly reviews its margin risk and attempts to mitigate this risk by modifying its hedge position whenever market conditions allow.
In 2000, the Company delivered approximately 37% of gold production against forward sales and put options at an average commitment price of $313 per ounce. This compares with 77% of gold production at $346 per ounce in 1999 and 96% of gold production at $341 per ounce in 1998. Approximately 35% of silver production was delivered against forward sales and put options at an average cash price of $5.71 per ounce in 2000. This compares to 43% at $5.66 per ounce in 1999 and 50% at $5.44 per ounce in 1998.
The Company's hedge position as of December 31, 2000 is shown in note 17 to the consolidated financial statements. For the year 2001, this position includes forward sales of approximately 125,000 ounces at a forward price of $312 per ounce. For 2002 through 2005, the Company has forward sales totaling 195,000 ounces of gold at a forward price of $310 per ounce. Call options purchased by the Company match these forward ounces and give the Company the ability to participate in gold price increases above the strike price of $351 and $360 per ounce. In addition, in 2005, the Company has sold call options for 105,000 ounces of gold at a strike price of $340 per ounce and purchased a corresponding amount of call options with a strike price of $395 per ounce. These forward sales contracts and call options represent approximately 10% of current reserves. The Company has hedged 2.5 million silver ounces at a minimum average cash price of $5.91 per ounce in 2001. The reduced hedging position results from continued weakness in spot gold prices and low forward premiums resulting in lower hedge prices that can be achieved.
The Company's hedging commitments are described in note 17 to the Company's consolidated financial statements. See also "Qualitative and Quantitative Disclosures about Market Risk."
The Company's existing term and revolving credit facilities expire in August 2001. The Report of Independent Chartered Accountants dated January 31, 2001 includes Comments by Auditors for U.S. Readers on Canada-U.S. Reporting Difference. This comment identifies conditions and events that cast doubt on the Company's ability to continue as a going concern. The basis of the going concern comment was the Company's ability to refinance the credit facilities referred to above.
Governmental and Environmental Regulation
The mining industry in the Nunavut Territory, where the Company's Lupin mine is situated, operates under Canadian federal and territorial legislation governing prospecting, development, production, environmental protection, exports, income taxes, labor standards, mine safety and other matters. The Company believes its Canadian operations are operating in substantial compliance with applicable law. The operation of the Lupin mine is subject to substantial regulation by government authorities, which is in many instances discretionary.
The Company's Lupin operation is subject to environmental regulation primarily by the Federal Department of Indian Affairs and Northern Development and the Nunavut Water Board. The Company is subject to the jurisdiction of the Nunavut Water Board and any further approvals or licenses will have to be obtained from that Board. In addition, any changes or additions to existing operations at Lupin may be subject to environmental assessment by the federal government under the Canadian Environmental Assessment Act (Canada). The federal Departments of Fisheries & Oceans and Environment have an enforcement role in the event of environmental incidents, but presently have no direct regulatory role in relation to the Lupin operation. Lupin is also subject to enforcement by the Nunavut Department of Sustainable Development pursuant to the Nunavut Environmental Protection Act. This Act contains requirements to obtain licenses and permits that may affect the Lupin operation in the future. The Company believes it is in substantial compliance with all relevant territorial environmental law.
On April 1, 1999, the Nunavut Agreement, dated May 25, 1993, between the Inuit of Canada's eastern arctic region and Her Majesty the Queen in right of Canada, came into force. Under this agreement, the Inuit were granted ownership of approximately 360,000 square kilometers of land in an area referred to as the Nunavut Settlement Area, including ownership of subsurface rights in approximately 37,500 square kilometers of those lands. Third party interests in lands in the Nunavut Settlement Area created prior to April 1, 1999 are protected under the Nunavut Agreement. Where a third party was granted a mining lease under the Canada Mining Regulations in lands comprising the Nunavut Settlement Area, that interest continues in accordance with the terms and conditions on which it was granted, including any rights granted under the legislation that gave rise to the interest. However, where any successor legislation has the effect of diminishing the rights afforded to the federal government, it will not bind the Inuit without its consent. The Inuit are entitled to receive whatever compensation is payable by the interest holder for the use or exploitation of mineral rights. The federal government continues to administer the third party interest on behalf of the Inuit, unless the third party and the Inuit enter into an agreement under which the third party agrees to the administration of their interest by the Inuit. In the event such an agreement is reached, the applicable legislation will cease to apply to the third party interest. Subsurface interests in such lands continue to be administered in accordance with applicable legislation relating to those interests and are not affected by the Nunavut Agreement.
Third party interests in lands in the Nunavut Settlement Area created on or after April 1, 1999 are granted, in the case of surface rights, by the appropriate regional Inuit association and, in the case of subsurface rights, by Nunavut Tungavik Incorporated, which will hold subsurface title to Inuit owned lands and will be additionally responsible, in consultation with the appropriate regional Inuit associations, for the administration and management of those subsurface rights.
On January 1, 1994, the North American Free Trade Agreement ("NAFTA") between Canada, the United States and Mexico came into force. NAFTA amends the Investment Canada Act and its regulations and guidelines in that the investors who are residents of the United States and Mexico are treated more favorably than all other "non-Canadian" investors with respect to reviews by Investment Canada. Direct acquisitions of Canadian businesses by investors from the United States or Mexico are only subject to review if the acquisitions exceed a certain threshold which is adjusted annually in accordance with a formula set out in Annex I to NAFTA. However, indirect acquisitions of Canadian businesses by investors from the United States or Mexico are not subject to review.
The Competition Act (Canada) ("the Act") obliges parties to proposed transactions in the nature of mergers and acquisitions that exceed prescribed party size and transaction size thresholds to notify the Commissioner of Competition (the "Commissioner"), provide prescribed information about the parties and the transaction, and prohibits the parties from completing the transaction until the prescribed waiting period (either 14 or 42 days, depending on the form of the notification used) has expired. The party size threshold is exceeded when the transacting parties, together with their affiliates, have assets in Canada or have gross annual revenues from sales in, from or into Canada that exceed Cdn.$400 million. The transaction size threshold depends on the type of transaction. For asset acquisitions, pre-notification is required where the assets in Canada or gross annual revenues from sales in or from Canada generated by those assets exceeds C$35 million. For share acquisitions, pre-notification is required if the corporation, the shares of which are being acquired, has assets in Canada or gross revenues from sales in or from Canada generated from those assets that exceed Cdn.$35 million, and where the person or persons acquiring the shares acquire voting rights that exceed 20% for public companies and 35% for private companies. The purpose of the pre-notification provisions is to provide the Commissioner with information to assess whether he should challenge the transaction under the merger provisions of the Act on the grounds that they are likely to prevent or lessen competition substantially.
The Company's U.S. operations are subject to comprehensive regulation with respect to operational, environmental, safety and similar matters by federal agencies including the U.S. Department of the Interior (Bureau of Land Management), the U.S. Department of Agriculture (U.S. Forest Service), the U.S. Environmental Protection Agency ("EPA"), the U.S. Mine Safety and Health Administration ("MSHA") and similar state and local agencies. Failure to comply with applicable laws, regulations and permits can result in injunctive actions, damages and civil and criminal penalties. If the Company expands or changes its existing operations or proposes any new operations, it may be required to obtain additional or amended permits or authorizations in accordance with the National Environmental Policy Act (NEPA) or state law counterparts. The Company spends substantial time, effort and funds in planning, constructing and operating its facilities to ensure compliance with U.S. environmental and other regulatory requirements. Such efforts and expenditures are common throughout the U.S. mining industry and generally should not have a material adverse effect on the Company's competitive position.
The Company believes its U.S. operations are in substantial compliance with applicable air and water quality laws and regulations, including reporting requirements under the Emergency Planning Community Right to Know Act, and that it has acquired or applied for all permits required under such laws or requested by the states in which it is operating.
Certain wastes from mining and mineral processing operations are currently exempt from regulation under the Bevill amendment to the federal Resource Conservation and Recovery Act ("RCRA"). However, Congress may consider revision and reauthorization of RCRA, as well as the federal Clean Water Act and Endangered Species Act, each of which substantially affects mine development and operations. The effect of any revised or additional regulation on the Company's U.S. operations cannot be determined until the legislative process is completed and new administrative rules are issued, but they can have a significant impact upon operations of all mining companies and increase the costs of those operations.
New laws and regulations, amendments to existing laws and regulations, administrative interpretation of existing laws and regulations, or more stringent enforcement of existing laws and regulations, could have a material adverse impact on the Company's results of operations and financial condition, although the results of such actions are speculative. For example, during recent legislative sessions, legislation was considered in the United States Congress which proposed a number of modifications to the General Mining Law of 1872, which has traditionally governed the location and maintenance of unpatented mining claims and related activities on federal land. Among these modifications were proposals that would have (i) imposed a royalty on production from unpatented mining claims, (ii) increased the cost of holding and maintaining such claims, and (iii) imposed more specific reclamation requirements and standards for operations on such claims. Although none of these proposed modifications was enacted into law, Congress may consider the same or similar proposals in 2001 as well.
The one area in which specific action has been taken relates to the regulation of surface activities on federally owned lands administered by the Bureau of Land Management ("BLM"). New surface management regulations (the"3809 Regulations") were enacted and became effective on January 20, 2001. The effect of the new 3809 Regulations is to create an environment significantly more stringent and restrictive for activities and operations on federal lands involving unpatented mining claims and millsites. For example, the new 3809 Regulations provide that all activities on unpatented mining claims or millsites for which approval of a Plan of Operations is required (which includes all activities other than exploration activities that disturb less than five acres of surface) are subject to a new standard of review by the BLM, which must make a determination that the proposed activities would not cause substantial irreparable harm to significant scientific, cultural or environmental resource values that cannot be effectively mitigated. That new standard would apply to any new significant activities undertaken by the Company or its subsidiaries on federal public lands. While imposition of that new standard should not have an effect on the Company's existing approved Plans of Operation (to which it does not apply) at its Round Mountain, McCoy/Cove and Kettle River properties, if the Company needs to make any substantive modifications to those existing Plans of Operation (such as widening a road or expanding a leach pad or tailings facility), that standard (as well as all other provisions of the new 3809 Regulations) would apply unless the Company could demonstrate to the BLM's satisfaction that it was not practical for economic, environmental, safety or technical reasons. In addition, under previous regulations, up to 75% of financial security for the performance of reclamation obligations could be provided by corporate guarantees. While the new 3809 Regulations do provide for existing financial guarantees to continue to be in effect, no new corporate guarantees will be accepted after July 19, 2001. To the extent applied to modifications of the Company's current operations, and to the extent the Company engages in activities or operations on public lands outside of its current permit boundaries (including any new projects), the new 3809 Regulations will make the process for the preparation and obtaining of approval of a Plan of Operations more time-consuming and expensive, and any such proposed activities or operations will be subject to more detailed and expensive regulatory requirements. Moreover, the Company's ultimate ability to have any such proposed activities or operations approved will be subject to a much greater level of uncertainty. The new regulations may not significantly affect existing operations, so long as such operations do not require, for their continuing viability, new discretionary permits for land outside the boundaries of land currently permitted or significant changes within current permit boundaries. New, including expanded, exploration or mining operations will need to quantify the cost burden imposed by the new regulations when assessing the economic viability of any project. Litigation is currently pending in Washington, D.C. and Nevada federal courts to stay the enforcement of the new regulations.
In addition, the BLM has called upon two of the Company's subsidiaries to provide other security to replace corporate guarantees that had been given in respect of the Round Mountain and McCoy/Cove operations totaling approximately $33 million. The subsidiaries consider the BLM's action, taken by administrative decision, to be arbitrary, capricious and an abuse of discretion and will vigorously oppose and contest the decision. The BLM has not asked for additional security amounts, rather the agency had requested a different form of security. If the BLM position were to prevail, which the Company considers unlikely, there is a risk the BLM would initiate action designed to have operations suspended at the applicable location. The potential impact on the Company as a result of such administrative action is difficult to predict. See "Risk Factors—Governmental Regulation."
A material direct economic impact of potential mining law revision could come from the imposition of royalties on production from the McCoy/Cove mine in Nevada, as the reserves are from unpatented lode mining claims on federal land. However, the Company has completed all of the steps currently required under U.S. law to convert critical McCoy/Cove claims to patented status. The Company's applications for patents are being processed, and the Company expects the government to complete its administrative review in accordance with applicable law and regulations, although the Company cannot predict with certainty whether those patents will be issued or the time frame for such issuance. Patents for the Round Mountain mine were received in September 2000. See "Risk Factors—Government Regulations."
The federal Comprehensive Environmental Response, Compensation and Liability Act of 1980 ("CERCLA"), commonly called the "Superfund Act," contains stringent reporting requirements for the release or disposal of hazardous substances, with substantial fines for noncompliance. In addition, under CERCLA, any party responsible for the release or threatened release of a hazardous substance into the environment is liable for all clean-up costs. Responsible parties under CERCLA include the owner or operator of the site where the release occurs or anyone who owned or operated the site when a disposal was made, regardless of culpability. Mining wastes are subject to CERCLA regulation if they contain hazardous substances, and EPA has included several mining sites on its list of high-priority sites for clean-up under CERCLA.
Various types of dust control, revegetation and similar reclamation-related measures are generally required for the Company's U.S. operations under specific state or federal air, water quality and mine reclamation rules and permits. The BLM and Forest Service permits and Plans of Operations for the Company's operations also contain reclamation-related requirements. The Company believes its operations are in substantial compliance with these reclamation requirements. "The reclamation spending in 2000 amounted to approximately $4.5 million."
The Company believes that all of its U.S. operations are currently being conducted in substantial compliance with applicable MSHA and similar state labor, health and safety rules.
At December 31, 2000, the Company employed 1,240 persons excluding temporary employees directly involved in short-term programs, broken down as follows.
| Round Mountain, including ancillary services | 678 | |
| McCoy/Cove | 149 | |
| Kettle River | 101 | |
| Lupin | 276 | |
| Technical and corporate staff and other | 36 | |
| 1,240 | ||
A sufficient supply of qualified workers is available for both Canadian and U.S. operations, although the continuation of such supply depends upon a number of factors, including, principally, the demand occasioned by other projects. None of the Company's employees are represented by labor unions. The Company believes it generally has good relations with its employees. The Company provides its employees with a competitive compensation package and comprehensive benefits program.
Executive Officers of the Registrant
The executive officers of the Company are listed below.
| Name | Age | Position experience within the last five years with the Company and business | ||
|---|---|---|---|---|
| LOIS-ANN L. BRODRICK | 57 | Vice President and Corporate Secretary of the Company since March 1998; Corporate Secretary of the Company from May 1996 to March 1998; prior thereto Assistant Corporate Secretary of the Company | ||
| ROBERT L. LECLERC | 56 | Chairman and Chief Executive Officer of the Company since April 1997; Chairman of the Company from May 1996 to April 1997; prior thereto Chairman and Chief Executive Officer and partner, Milner Fenerty (barristers and solicitors) | ||
| JERRY L.J. MCCRANK | 50 | Vice President, Operations of the Company since March 1998; General Manager at Lupin from July 1997 to March 1998; General Manager, Operations from November 1996 to July 1997; prior thereto General Manager at Lupin | ||
| TOM S.Q. YIP | 43 | Vice President, Finance and Chief Financial Officer of the Company since August 1999; Vice President, Controller and Principal Accounting Officer of the Company from March 1998 to August 1999; Controller and Principal Accounting Officer of the Company from September 1997 to March 1998; prior thereto Director, Internal Audit |
The Company carries insurance against property damage, including boiler and machinery insurance, and also comprehensive general liability insurance of $50 million per occurrence, which is available to all operations. The Company carries special liability policies applicable to aircraft and motor vehicles. It is also insured against dishonesty and gold and silver bullion thefts, as well as losses of goods in transit. The property damage and boiler and machinery insurance policies include coverage for business interruption resulting from an insured physical loss, subject to a five-day waiting period and a maximum indemnification period of one year.
Risks not insured against include mine cave-ins, mine flooding and other uninsurable underground hazards, ground failure in open-pit mines and most types of environmental pollution against which the Company cannot insure or against which it has elected not to insure.
The Company believes that it has taken adequate precautions to minimize the risk of environmental pollution. However, with respect to certain mines, there is some risk that cyanide may escape from leach pads or tailings dams in sufficient quantities to cause water or surface pollution and there is some risk of environmental impairment liability under environmental laws. See "Government Regulation and Environmental Issues."
Underground mining is generally subject to certain types of risks and hazards, including unusual or unexpected formations, pressures, cave-ins, flooding and other conditions. The Company has not experienced any significant cave-ins at its underground mines. In addition, because mining can be conducted on a number of different levels at the same time, a cave-in in one area would not necessarily affect mining in other areas.
Open-pit mining, such as that conducted at certain of the Company's mines, is generally subject to certain types of risks and hazards, primarily unpredictable pit wall failure. Open pit mining is conducted in phases and a pit wall failure in one area would not necessarily affect overall pit design or mining in unaffected areas. See "McCoy/Cove" regarding the Company's 1996 $30.0 million provision related to the estimated costs to remove waste rock from a portion of the Cove pit wall that had collapsed.
Supplies, Utilities and Transportation
The principal supplies needed for the operation of the Company's mines are explosives, diesel fuel, chemical reagents (including cyanide, lime, sulfur dioxide, sodium hydroxide and zinc dust), cement, equipment parts and lubricants.
Power is supplied to the Company's mines by power companies or by diesel generators. Each mine has access to adequate water.
Each of the U.S. mines has good road access by either paved or gravel roads from state highways.
The Lupin mill facilities and mine are in a remote location in the sub-Arctic region of Canada. The Company must therefore prepare for and respond to difficult weather and other conditions. All equipment, materials and supplies must be transported to the mine from Edmonton or Yellowknife. Personnel are transported from these locations and from Kugluktuk (formerly Coppermine) and Cambridge Bay in the Nunavut Territory. Each year since 1983, the Company has completed a 360-mile ice road commencing 40 miles northeast of Yellowknife and ending at the Lupin mine as the most economical way of transporting bulk items, including fuel, to the mine. As well the Company operates a Boeing 727 to transport personnel and some supplies to the mine.
Heap leaching is done with a weak cyanide solution held within a closed circuit, which includes the leach pads and surface holding ponds. Leached ore from the reusable pad at Round Mountain is washed and deposited adjacent to the mine site. Where dedicated pads are used, the leached ore remains on the pads. Mill processing may use a cyanide leaching solution, which is contained within the mills' processing circuits. See "Government Regulation and Environmental Issues."
See also "Lupin—Water Supply and Waste Disposal."
Production from the Company's mines is subject to certain royalties. These are described in note 18 to the Company's consolidated financial statements.
The Company leases office premises for its head office functions, and enters into lease commitments for office equipment. The Company incurred $1.4 million in rental expense in 2000, net of $1.6 million in rental income related to office subleases. The Company's commitments under the remaining terms of the leases are approximately $9.6 million, payable as follows: $2.0 million in 2001, $2.0 million in 2002, $1.6 million in 2003, $1.5 million in 2004, $1.0 million in 2005 and $1.5 million thereafter.
The Company was incorporated in Canada in 1964. Between 1964 and 1982, the Company developed and operated several silver mines near Port Radium in the Northwest Territories of Canada and produced 35.5 million ounces of silver. These silver reserves were mined out in 1982.
In 1979, the Company optioned the Lupin gold property, located 190 miles east of Port Radium. Construction of the Lupin mine began in August 1980, and commercial production commenced in October 1982. During 1982 through 1984, the Company concentrated efforts on developing the Lupin mine.
With earnings generated from Lupin, the Company initiated an aggressive acquisition, exploration and development program.
During 1985 and 1986, the Company acquired a 50% interest in the Round Mountain mine and 100% interests in the McCoy, Borealis, Manhattan, Sunnyside and Illipah mines. The Cove deposit was discovered adjacent to the McCoy mine in early 1987 and major expansions at McCoy/Cove and Round Mountain were started in 1988. The mine expansions were substantially funded by borrowing gold and silver. Gold and silver financing allowed the Company to hedge future production and to obtain the low interest rates associated with bullion financings. The Borealis, Manhattan, Sunnyside and Illipah mines have subsequently been mined out and closed.
In 1985, the Company acquired a 100% interest in the Alaska-Juneau project near Juneau, Alaska. In 1987, the Company entered into a joint venture related to the Kensington project near Juneau, Alaska, in which the Company held a 50% interest.
In 1990, the Company brought the Kettle River mine in Washington state into commercial production. In 1992, the Company increased its ownership interest to 100% from 70% when the Company's 30% partner withdrew from the Kettle River joint venture.
Beginning in 1993, the Company significantly increased exploration activities. Exploration programs were funded at all operating properties and also at many other locations along the major gold belts of North America, Central America, South America and West Africa. Most of the Company's exploration expenditures were made outside of the United States and Canada.
In 1995, the Company added five development properties: Paredones Amarillos in Mexico; Chapada in Brazil; Kingking in the Philippines; and Aquarius and Ulu in Canada. The Company sold its interest in the Kensington project to its joint venture partner in 1995.
In 1996, underground development began at Ulu and the Company wrote off its entire remaining investment in the Alaska-Juneau project.
During 1996 and 1997, the Company increased its ownership from 7% to 58% of the outstanding common shares of Santa Elina Mines Corporation ("Santa Elina"), which held interests in mining properties, principally in Brazil, and also in Bolivia. The Company sold its investment in Santa Elina in 1998.
In 1997, in response to declining gold prices, the Company deferred final construction decisions on the Aquarius and Paredones Amarillos development properties and deferred further development of the Ulu deposit. The Company also narrowed the focus of its exploration program principally to projects in North America where the Company already has extensive gold mining infrastructure.
During 1997, the Company recorded $346.0 million in provisions for impaired assets and recorded $16.7 million for related severance costs to the Company's consolidated financial statements.
In January 1998, the Company temporarily suspended operations at the Lupin mine. In November 1999, the Company announced its decision to reopen the Lupin mine. Production recommenced in April 2000.
The Company agreed in 1999 to sell its 60% interest in the Paredones Amarillos project in Mexico to its joint venture partner, and recognized a loss of $13.8 million.
The Company reported net earnings of $18.6 million in 2000 and net losses of $37.3 million in 1999, and $20.1 million in 1998. The 2000 results compared to 1999 reflect higher gold and silver sales volume, the 1999 loss on the sale of the Company's interest in Paradones Amarillos, and lower depreciation and amortization. These factors were partially offset by increased operating costs and lower gold and silver prices realized. The loss in 1999 compared to 1998 reflects lower gold sales volumes, the 1999 loss on the sale of the Company's interest in Paredones Amarillos, the 1998 gain on the sale of Santa Elina and other mining properties and decreased average gold and silver prices realized. These factors were partially offset by decreased operating costs, lower depreciation and amortization, increased silver sales volumes and decreased exploration and development spending. The loss in 1998 resulted from lower gold and silver volumes and prices realized. The Company incurred exploration and development expenses of $10.3 million in 2000, $8.8 million in 1999, and $12.0 million in 1998. The Company's profitability depends on, among other things, the price of gold and silver, the profitability of production at existing and new mines, and the ability to bring into commercial production the projects that have been the subject of the Company's exploration and development programs. See "Liquidity," "Gold and Silver Prices," "Uncertainty of Reserve and Other Mineralization Estimates" and "Estimation of Asset Carrying Values" for additional disclosure with respect to factors which may affect the carrying values of the Company's assets, and the Company's results of operations and financial condition generally.
The Company's ability to maintain, or increase, its annual production of gold and silver will be dependent in significant part on its ability to bring new mines into production, such as the Aquarius project in Canada, and to expand existing mines. In 1997, the Company deferred a final construction decision on Aquarius and deferred further development of the Ulu satellite deposit in Canada. Although the Company utilizes the operating history of its existing mines to derive estimates of future operating costs and capital requirements, such estimates may differ materially from actual operating results at new mines or at expansions of existing mines. The economic feasibility analysis with respect to any individual project is based upon, among other things, the interpretation of geological data obtained from drill holes and other sampling techniques, feasibility studies (which derive estimates of cash operating costs based upon anticipated tonnage and grades of ore to be mined and processed), precious metals price assumptions, the configuration of the ore body, expected recovery rates of metals from the ore, comparable facility and equipment costs, anticipated climatic conditions, estimates of labor productivity, royalty or other ownership burdens and other factors. In addition, many of the risks identified below under "Exploration Risks" are also applicable to the Company's development projects. Such development projects are also subject to the successful completion of final feasibility studies, issuance of necessary permits and receipt of adequate financing. Although the Company's feasibility studies are completed with the Company's knowledge of the operating history of similar ore bodies in the region, the actual operating results of its development projects may differ materially from those anticipated, and uncertainties related to operations are even greater in the case of development projects.
Because mines have limited lives based on proven and probable reserves, the Company continually seeks to replace and expand its reserves. Moreover, two of the Company's mines, McCoy/Cove and Kettle River have less than two years of mine life remaining if no additional reserves are developed, which has led to significant emphasis on the Company's exploration program. Mineral exploration, at both newly acquired properties and existing mining operations, is highly speculative in nature, involves many risks and frequently does not result in the discovery of minable reserves. There can be no assurance that the Company's exploration efforts will result in the discovery of significant gold or silver mineralization or that any mineralization discovered will result in an increase of the Company's proven or probable reserves. If proven or probable reserves are developed, it may take a number of years and substantial expenditures from the initial phases of drilling until production is possible, during which time the economic feasibility of production may change. No assurance can be given that the Company's exploration programs will result in the replacement of current production with new reserves or that the Company's development program will be able to extend the life of the Company's existing mines. In the event that new reserves are not developed, the Company will not be able to sustain any mine's current level of gold or silver production beyond the life of its existing reserve estimates.
The Company encounters strong competition from other mining companies in connection with the acquisition of properties producing or capable of producing precious metals. As a result of this competition, some of which is with companies with greater financial resources than the Company, the Company may be unable to acquire attractive mining properties on terms it considers acceptable. In addition, there are a number of uncertainties inherent in any program relating to the location of economic ore reserves, the development of appropriate metallurgical processes, the receipt of necessary governmental permits and the construction of mining and processing facilities. Accordingly, there can be no assurance that the Company's acquisition and exploration programs will yield new reserves to replace and expand current reserves.
Liquidity and Capital Resources
The cash operating costs at the Company's four operating mines averaged $193 per ounce in 2000, and are expected to increase to approximately $225 per ounce in 2001. Total production costs were $271 per ounce in 2000. In the current gold price environment, the Company's cost structure has significant implications for the Company's liquidity and ability to invest funds in exploration and development. While the Company continues to generate cash flow from operations at current gold prices, the amount of cash flow available for acquisitions, investments, exploration and development is very limited. As a result, the Company is carefully monitoring its discretionary spending, though it intends to continue to conduct exploration and development activities consistent with a more focused program.
The Company's existing term and revolving credit facilities expire in August 2001. The Company currently has $19.0 million outstanding under its revolving credit facility. Based on the current trailing 90-day average spot price of gold, the Company is restricted to an additional borrowing capacity of approximately $4 million available under this credit facility. At current gold prices, the Company does not anticipate drawing on the revolving line. The Company believes it is currently in compliance with the credit facility covenants. The Company is in the process of refinancing this facility and believes it will be successful in this effort prior to August 2001.
The Report of Independent Chartered Accountants dated January 31, 2001 includes Comments by Auditors for U.S. Readers on Canada-U.S. Reporting Difference. This comment identifies conditions and events that cast doubt on the Company's ability to continue as a going concern. The basis of the going concern comment was the Company's ability to refinance the credit facilities referred to above.
Certain regulatory agencies may require security to be provided for some or all of the cost to restore land disturbed during operations. The Company has provided letters of credit, surety bonds and corporate guarantees as security for these future reclamation costs. Future reclamation costs are determined using management's best estimates of the scope of work to be performed and the related costs to meet current regulatory requirements. The estimated future reclamation and mine closure cost is $73.2 million: see note 8 to the consolidated financial statements. These estimates may change based on future changes in operations, costs, reclamation activities and regulatory requirements. Future reclamation obligations are expected to be funded from operating cash flows. Early in 2001, regulators in Nevada called upon two of the Company's subsidiaries to provide other security to replace corporate guarantees that had been given in respect of the Round Mountain and McCoy/Cove operations. The subsidiaries disagree with the regulators' position and believe that they qualify under the criteria set out for corporate guarantees and will oppose the regulatory position. The potential impact on the Company as a result of such administrative action is difficult to predict. See "Governmental and Environmental Regulation". In the event that the Company is unable to secure the necessary letters of credit or surety bonds or to provide the necessary corporate guarantees to secure reclamation obligations, the Company could be in violation of its operating permits which could have a significant impact on the Company's ability to continue operating at the specific location.
In 1997, the Company issued $100.0 million of 11% capital securities due in 2027 (note 7 to the consolidated financial statements). The Company has the right to defer interest payments on the capital securities for up to 10 consecutive semi-annual periods. During a period of interest deferral, interest accrues at a rate of 12% per annum, compounded semi-annually, on the full principal amount and deferred interest. The Company, at its option, may satisfy its deferred interest obligation by delivering common shares to the indenture trustee for the capital securities. The trustee would sell the Company's shares and remit the proceeds to the holders of the securities in payment of the deferred interest obligation. Deferred interest obligations not settled with proceeds from the sale of shares remain an unsecured liability of the Company. Since April 1998, the Company has exercised its right to defer its interest payments to holders of the capital securities. Interest deferred to date amounts to $43.1 million at December 31, 2000 and is payable no later than April 1, 2003 together with any additional compounded or deferred interest up to that date. The interest amount payable on April 1, 2003 assuming the continuation of interest deferral will be $83.8 million. Although the Company has the contractual right to issue shares in settlement of this obligation, market conditions in 2003 will determine the Company's ability to settle through the delivery and sale of common shares.
Early in 2000, The American Stock Exchange advised the Company that its listing eligibility was under review. The review was undertaken because the Company had fallen below two of the Exchange's continued listing guidelines. The Company had sustained net losses in its five most recent fiscal years (1995 to 1999) and in the Exchange's view, the Company's shareholders' equity under generally accepted accounting principles in the United States is inadequate. The Company is addressing the Exchange's concerns through periodic progress reviews and currently the matter is in abeyance pending a review of the Company's December 31, 2000 financial statements. If the Company were to be de-listed, the ability of U.S. shareholders to buy or sell securities of the Company may be limited. The Company's common shares are listed on a number of exchanges as described in Part II Item 5.
The profitability of the Company's current operations is directly related and sensitive to the market price of gold and silver. Gold prices are currently, and have been since the beginning of 1997, at depressed levels. Gold and silver prices fluctuate widely and are affected by numerous factors beyond the Company's control, including global supply and demand, expectations with respect to the rate of inflation, the exchange rates of the dollar to other currencies, interest rates, forward selling by producers, central bank sales and purchases, production and cost levels in major gold-producing regions such as South Africa and Australia, global or regional political, economic or financial situations and a number of other factors.
The current demand for, and supply of, gold and silver affect the prices of such metals, but not necessarily in the same manner as current demand and supply affect the prices of other commodities. The potential supply of gold consists of new mine production plus existing stocks of bullion and fabricated gold held by governments, financial institutions, industrial organizations and individuals. As mine production in any single year constitutes a very small portion of the total potential supply of gold, normal variations in current production do not necessarily have a significant effect on the supply of gold or on its price. If gold or silver prices should decline below the Company's cash costs of production and remain at such levels for any sustained period of time, the Company could determine that it is not economically feasible to continue commercial production at any or all of its mines. For example, in January 1998, the Company temporarily suspended operations at the Lupin mine. Although the Company has a hedging program in place to reduce the risk associated with gold and silver price volatility, there is no assurance that the Company's hedging strategies will be successful. See "Other—Precious Metal Sales and Hedging Activities" and "Management's Discussion and Analysis—Commitments and Contingencies." Furthermore, should the Company experience a prolonged period of depressed gold prices and prepare its reserve calculations and/or life-of-mine plans at significantly lower prices than those used at year-end 2000, the Company could experience material write-downs of its investment in mining properties. See "Uncertainty of Reserve and Other Mineralization Estimates" and "Estimation of Asset Carrying Value."
Estimation of Asset Carrying Values
The Company periodically undertakes a detailed review of the life-of-mine plans for its operating properties and an evaluation of the Company's portfolio of development projects, exploration projects and other assets. The recoverability of the Company's carrying values of its operating and development properties are assessed by comparing carrying values to estimated future net cash flows from each property. The 2000 analysis used price assumptions of $300 per ounce of gold and $5.00 per ounce of silver for purposes of estimating future cash flows except for 2001, for which prices of $280 per ounce of gold and $5.00 per ounce of silver were used. No asset impairments were evident in 2000, 1999 or 1998 based on the Company's analyses in those years.
The Company assesses the carrying values of its assets on an ongoing basis as required by generally accepted accounting principles. Factors that may affect carrying values include, but are not limited to, gold and silver prices, capital cost estimates, mining, processing and other operating costs, grade and metallurgical characteristics of ore, mine design and timing of production. In the event of a prolonged period of depressed gold prices, the Company may be required to take additional material write-downs of its operating and development properties.
Uncertainty of Reserve and Other Mineralization Estimates
There are numerous uncertainties inherent in estimating proven and probable reserves and other mineralization, including many factors beyond the control of the Company. The estimation of reserves and other mineralization involves subjective judgments about many relevant factors, and the accuracy of any such estimate is a function of the quality of available data and of engineering and geological interpretation and judgment. Results of drilling, testing and production subsequent to the date of an estimate may justify revision of such estimate. Assumptions about prices are subject to great uncertainty and gold and silver prices have fluctuated widely in recent years and are currently at depressed levels. See "Gold and Silver Prices." Assurance cannot be given that the volume and grade of reserves mined and processed and recovery rates will be as anticipated. Declines in the market price of gold and related precious metals also may render reserves or other mineralization containing relatively lower grades of mineralization uneconomic to exploit. The prices used in estimating the Company's ore reserves at December 31, 2000 were $300 per ounce of gold and $5.00 per ounce of silver. The market prices were $274 per ounce of gold and $4.60 per ounce of silver at December 31, 2000. The market price of gold has for more than three years traded, on average, below the price at which the Company estimates its reserves. If the Company were to determine that its reserves and future cash flows should be estimated at a significantly lower gold price than that used at December 31, 2000, there would likely be a reduction in the amount of gold reserves. The Company estimates that if reserves at December 31, 2000 were based on $275 per ounce of gold, reserves would decrease by approximately 10% at Round Mountain, 3% at Kettle River and 2% at the Aquarius development property. There would not be an impact on Lupin and McCoy/Cove reserves. The estimates are based on extrapolation of information developed in the reserve calculation, but without the same degree of analysis as required for reserve estimation. Should any significant reductions in reserves occur, material write-downs of the Company's investment in mining properties and/or increased amortization, reclamation and closure charges may be required. Under certain such circumstances, the Company may discontinue the development of a project or mining at one or more of its properties. Changes in operating and capital costs and other factors, including but not limited to short-term operating factors such as the need for sequential development of ore bodies and the processing of new or different ore grades and ore types, may materially and adversely affect reserves.
The Company's business operations are subject to risks and hazards inherent in the mining industry, including, but not limited to, unanticipated variations in grade and other geological problems, water conditions, surface or underground conditions, metallurgical and other processing problems, mechanical equipment performance problems, the unavailability of materials and equipment, accidents, labor force disruptions, force majeure factors, unanticipated transportation costs and weather conditions, any of which may materially and adversely affect, among other things, the development of properties, production quantities and rates, costs and expenditures and production commencement dates.
The Company's processing facilities are dependent on continuous mine feed to remain in operation. Insofar as the Company's mines may not maintain material stockpiles of ore or material in process, any significant disruption in either mine feed or processing throughput, whether due to equipment failures, adverse weather conditions, supply interruptions, labor force disruptions or other issues, may have an immediate adverse effect on the results of operations of the Company. A significant reduction in mine feed or processing throughput at a particular mine could cause the unit cost of production to increase to the point where the Company could determine that some or all of the Company's reserves were uneconomic to exploit.
The Company periodically reviews mining schedules, production levels and asset lives in its life-of-mine planning for all of its operating and development properties. Significant changes in the life-of-mine plans may occur as a result of mining experience, new ore discoveries, changes in mining methods and rates, process changes, investments in new equipment and technology, precious metals price assumptions, and other factors. Based on this analysis, the Company reviews its accounting estimates and in the event of an impairment, may be required to write-down the carrying value of a mine or mines. This complex process continues for the life of every mine. See "Estimation of Asset Carrying Values."
As a result of the foregoing risks, among other things, expenditures on any and all projects, actual production quantities and rates, and cash costs may be materially and adversely affected and may differ materially from anticipated expenditures, production quantities and rates, and costs, just as estimated production dates may be delayed materially, in each case especially to the extent development projects are involved. Any such events can materially and adversely affect the Company's business, financial condition, results of operations and cash flows.
The business of gold and silver mining is generally subject to a number of risks and hazards, including environmental conditions, industrial accidents, labor disputes, unusual or unexpected geological conditions, ground or slope failures, cave-ins, changes in the regulatory environment and natural phenomena such as inclement weather conditions, floods, blizzards and earthquakes. Such occurrences could result in damage to, or destruction of, mineral properties or production facilities, personal injury or death, environmental damage to the Company's properties or the properties of others, delays in mining, monetary losses and possible legal liability. The Company maintains insurance against certain risks that are typical in the gold mining industry and in amounts that the Company believes to be reasonable, but which may not provide adequate coverage in certain circumstances. However, insurance against certain risks (including certain liabilities for environmental pollution or other hazards as a result of exploration and production) is not generally available to the Company or to other companies within the industry on acceptable terms. See "Other—Insurance and Mining Risks."
The Company's mining operations and exploration and development activities are subject to extensive Canadian, U.S. and other foreign federal, state, provincial, territorial and local laws and regulations governing exploration, development, production, exports, taxes, labor standards, waste disposal, protection and remediation of the environment, reclamation, historic and cultural resources preservation, mine safety and occupational health, toxic substances, reporting and other matters. See "Other—Governmental and Environmental Regulation." The costs of discovering, evaluating, planning, designing, developing, constructing, operating and closing the Company's mines and other facilities in compliance with such laws and regulations are significant. It is possible that the costs and delays associated with compliance with such laws and regulations could become such that the Company would not proceed with the development or operation of a mine.
As part of its normal course of operating and development activities, the Company has dedicated the appropriate financial and human resources to comply with governmental regulations and permitting requirements, and anticipates that it will continue to do so in the future. Moreover, it is possible that future regulatory developments, such as increasingly strict environmental protection laws, regulations and enforcement policies thereunder, and claims for damages to property and persons resulting from the Company's operations, could result in substantial costs and liabilities in the future. The Company has not incurred any material capital expenditures for purposes of complying with applicable environmental obligations.
The Company is required to obtain governmental permits to develop its reserves and for expansion or advanced exploration activities at its operating properties and its exploration properties. Obtaining the necessary governmental permits is a complex and time-consuming process involving numerous Canadian, U.S. or foreign federal, state, provincial, territorial and local agencies. See "Other—Governmental and Environmental Regulation." The Company believes it has all permits required to allow it to conduct current operations and to mine and process its ore reserves. The Company will be required to obtain additional permits to allow it to construct and operate properties currently under development. The Company will be required to obtain additional permits to allow it to construct and operate properties currently under development. The duration and success of each permitting effort are contingent upon many variables not within the Company's control.
In the case of foreign operations, governmental approvals, licenses and permits are, as a practical matter, subject to the discretion of the applicable governments or governmental officials. In the context of environmental protection permitting, including the approval of reclamation plans, the Company must comply with known standards, existing laws and regulations that may entail greater or lesser costs and delays depending on the nature of the activity to be permitted and the interpretation of the laws and regulations implemented by the permitting authority. The failure to obtain certain permits and associated financial assurance, or the imposition of extensive conditions upon certain permits, could have a material adverse effect on the Company's business, operations and prospects.
In addition, there is a risk that private individuals or entities may assert that the Company's activities have caused damage to their interests. Such a case was brought against the Company in 2000: see "Legal Proceedings—Colorado School of Mines."
Risk of International Operations
Many of the mineral rights and interests of the Company are subject to governmental approvals, licenses, agreements and permits. Such approvals, licenses, agreements and permits are, as a practical matter, subject to the discretion of the applicable governments or governmental officials. No assurance can be given that the Company will be successful in obtaining any or all of the various approvals, licenses, agreements, and permits it seeks, that it will obtain them in a timely fashion, or on terms favorable to it, or that it will be able to maintain them in full force and effect without modification or revocation.
In certain countries, Company assets are subject to various political, economic and other uncertainties, including, among other things, the risks of war or civil unrest, expropriation, nationalization, renegotiation or nullification of existing concessions, licenses, permits, approvals and contracts, taxation policies, foreign exchange and repatriation restrictions, changing political conditions, international monetary fluctuations, currency controls and foreign governmental regulations that favor or require the awarding of contracts to local contractors or require foreign contractors to employ citizens of, or purchase supplies from, a particular jurisdiction. In addition, in the event of a dispute arising from foreign operations, the Company may be subject to the exclusive jurisdiction of foreign courts or may not be successful in subjecting foreign persons to the jurisdiction of courts in the United States or Canada. The Company also may be hindered or prevented from enforcing its rights with respect to a governmental instrumentality because of the doctrine of sovereign immunity. It is not possible for the Company to accurately predict such developments or changes in law or policy or to what extent any such developments or changes may have a material adverse effect on the Company's operations.
Certain of the Company's United States property rights, including the McCoy/Cove property, consist of unpatented lode mining claims. Unpatented mining claims may be located on U.S. federal public lands open to appropriation, and may be either lode claims or placer claims depending upon the nature of the deposit within the claim. In addition, unpatented millsite claims, which may be used for processing operations or other activities ancillary to mining operations, may be located on U.S. federal public lands that are non-mineral in character. The validity of unpatented mining claims and millsites, from which a material portion of the reserves at the Company's McCoy/Cove mine are derived, and upon which some of the Company's surface facilities and facilities ancillary to its mining operations are located, is often uncertain and may be contested and subject to title defects. Unpatented mining claims and millsites are generally considered to be subject to greater title risk than other real property interests. The validity of an unpatented mining claim or millsite, in terms of its location and maintenance, and the uses thereof, is dependent on strict compliance with a complex body of federal and state statutory and decisional law, administrative interpretation of that law and, for unpatented mining claims, the existence of a discovery of valuable minerals. In addition, there are few public records that definitively control the issues of validity and ownership of unpatented mining claims or millsites. While the Company has obtained various reports, opinions and certificates of title with respect to certain of the unpatented mining claims and millsites it owns or to which it has rights in accordance with what the Company believes is industry practice, and the uses being made by the Company of the mining claims and millsites it owns or controls are in accordance with what the Company believes is industry practice, there can be no assurance that title to any of its unpatented mining claims or millsites may not be defective.
The following terms are described to aid in understanding the Company's Form 10-K and other periodic filings. Geological terms are generally not included.
Adit—A tunnel driven horizontally into the side of the mountain or hill to gain access to mineralization for exploration or mining.
Assay—A chemical test performed on a sample of ore, mineral or rock to determine the mineralized content.
Call option—An option contract that gives the holder the right, but not the obligation, to buy a specific commodity on a specific future date at a fixed price.
Concentrate—A metal-rich product from a mineral separation process such as flotation. The metals are "concentrated" from ore and the remainder is discarded as neutralized tailings. The contained metals are recovered from the concentrates either by leaching or by smelting.
Contango—The premium paid over spot prices on a forward contract. The contango is based on the difference between the cost of leasing gold and current money interest rates.
Dilution—The unwanted but unavoidable inclusion of some barren or low-grade rock along with the ore being mined. This lowers the grade of the mined material.
Doré—An unrefined bar of bullion containing an alloy of gold, silver and impurities. The Company ships doré bars to refiners for further processing, then sells the refined gold and silver to precious metal dealers, mainly banks and their affiliates.
Drift—An underground horizontal passage providing access to a mineralized area.
Drilling
Blasthole Drilling—The drilling of holes in rock to insert with an explosive charge. The drill holes are usually about 10-25 feet apart. The ensuing synchronized blast will break up the rock so it can be dug out.
Diamond (or Core) Drilling—Drilling with a hollow diamond-studded bit to cut out a solid rock core. A column of rock is extracted from inside the drill rod for geological examination and assay.
In-Fill Drilling—Drilling between widely spaced holes (typically up to 200 feet apart) to establish or upgrade the ore reserve classification.
Rotary Drilling—Drilling with a bit that breaks the rock into chips. The chips are continually flushed from the hole (outside the drill pipe) and are collected in sequence for geological examination and assay.
Reverse-Circulation Drilling—A type of Rotary Drilling that uses a double-walled drill pipe. Compressed air, water or other drilling medium is forced down the space between the two pipes to the drill bit, and the drilled chips are flushed back up to the surface through the center tube of the drill pipe.
Step-Out Drilling—Drilling at widely spaced intervals (typically in increments of 300 feet) outward from known deposits to test for extensions of mineralization.
Exercise (or strike) price—The price at which the underlying commodity or security can be bought, sold, or settled on exercise of the option contract. In the case of a call option, the exercise price is the price at which the buyer of the option has the right to purchase the underlying commodity or security. In the case of a put option, the exercise price is the price at which the buyer of the option has the right to sell the underlying commodity or security.
Exploration—Exploration can be divided into three basic categories:
Grassroots Exploration—Exploration for ore in an area that has the correct geologic setting, although no ore may have been found yet in that precise location.
Headframe Exploration—Exploration for a separate ore body "within sight of the headframe" of an existing mine.
Definition Exploration—Exploration that defines an ore body, or searches for extensions to it, once it has been discovered.
Feasibility Studies—Determinations of the economic feasibility of mining a deposit, based on progressively greater levels of information.
Initial Feasibility (Level 1)—A preliminary estimate of what the economic parameters of mining a deposit are likely to be, based on a particular mining plan, process flow sheet, facility design, infrastructure, and estimated capital and operating costs. A Level 1 estimate usually describes an installation that might be built. The deposit is classified as other mineralization.
Detailed/Optimized Feasibility (Level 2)—A refinement and reassessment of the initial study, based on extensive additional information, detailed engineering, and optimization work. This provides a level of confidence such that a decision to build the project can be made. A Level 2 estimate generally describes an installation that probably will be built, rather than an installation which is conceptual only. The deposit is now classified as ore reserves.
Definitive Feasibility (Level 3)—Yet a further increase in the level of engineering and other detailed work. The designs and estimates provided in the Level 3 estimate are for the installation that will be built with minimal modifications. The Company would not normally proceed to this level of detail before making a construction decision unless it were to be required for stand-alone project financing.
Flotation—A process for concentrating minerals based on the selective adhesion of certain minerals to air bubbles in a mixture of water and ground-up ore. When the right chemicals are added to a frothy water bath of ore that has been ground to the consistency of talcum powder, the minerals will float to the surface. The metal-rich flotation concentrate is then skimmed off the surface.
Forward contract—A legal agreement to buy or sell a commodity at a specific price on a future date.
Gold loan—A low interest rate method of debt financing that also acts to hedge future selling prices. A gold producer borrows gold bullion from a bank or dealer and sells it on the spot market, thereby establishing the sales price for the quantity of gold borrowed. The producer replaces the borrowed gold from its future production according to an agreed upon schedule. A gold loan allows the producer to receive the proceeds from the sale of the borrowed gold immediately, rather than as the metal is produced.
Grade—The metal content of ore. With precious metals, grade is expressed as troy ounces per ton of ore. Cut-off Grade—The minimum grade of ore that can be mined and processed economically.
Heap Leaching—A low-cost leaching process in which ore is placed in a large heap on an impermeable pad. The solvent, a weak cyanide solution, is dripped or sprinkled over the heap and collected at the bottom after percolating through the ore and dissolving the metals. See the illustration in "Mine Processing."
Leaching—The extraction of a soluble metallic compound from ore by dissolving the metals in a solvent. See also Heap Leaching.
Leach Cycle—The average amount of time that ore is leached.
Leach Pad—A large, impermeable foundation or pad used as a base for ore during heap leaching. The pad prevents the leach solution from escaping out of the circuit.
Dedicated Pad—A Leach Pad which is constructed to permanently accommodate one ore heap. The pad forms the tailings pile when economic recovery has been reached and the pad neutralized.
Reusable Pad—A pad where ore is loaded and then unloaded at the end of each Leach Cycle. The pad, made of durable materials, can be reused continually.
Mill—A plant where ore is ground, usually to fine powder, and the metals are extracted by physical and/or chemical processes. See the illustration in "Mine Processing."
Mineral Reserve—An "Ore Reserve" or "Mineral Reserve" is the economically mineable part of a Measured or Indicated Resource demonstrated by at least a preliminary feasibility study. This study must include adequate information on mining, processing, metallurgical, economic and other relevant factors that demonstrate, at the time of reporting, that economic extraction can be justified. An Ore Reserve or Mineral Reserve gives effect to diluting materials and allowances for losses that may occur when the material is mined but does not reflect any subsequent losses in leaching or milling.
Proven Mineral Reserve: This category of Mineral Reserve is the economically mineable part of a Measured Mineral Resource where there is the highest degree of confidence in the estimate. It is restricted to that part of the deposit where production planning is taking place and for which any variation in the estimate would not significantly affect potential economic viability.
Probable Mineral Reserve: This is the economically mineable part of an Indicated, and in some cases a Measured, Mineral Resource where there is a lesser degree of confidence in the estimate. The underlying preliminary feasibility study must address whether economic extraction can be justified.
Mineral Resource—The term "Mineral Resource" covers mineralization and natural material of intrinsic economic interest which has been identified and estimated through exploration and sampling. Within this mineralization Mineral Reserves may subsequently be defined by the consideration and application of technical, economic, legal, environmental, socio-economic and governmental factors. To qualify as a Mineral Resource the material must have reasonable prospects for economic extraction, having regard to relevant technical and economic factors. Mineral Resources are sub-divided, in decreasing order of geological confidence, into Measured, Indicated and Inferred categories.
Measured Mineral Resource: This part of a Mineral Resource is one for which quantity, grade or quality, densities, shape and physical characteristics are so well established that they can be estimated with confidence sufficient to allow the appropriate application of technical and economic parameters, to support production planning and evaluation of the economic viability of the deposit. The estimate is based on detailed and reliable exploration, sampling and testing information gathered through appropriate techniques from locations such as outcrops, trenches, pits, workings and drill holes that are spaced closely enough to confirm both geological and grade continuity.
Indicated Mineral Resource: The "Indicated" category is used where the nature, quality, quantity and distribution of data are such as to allow confident interpretation of the geological framework and reasonably to assume continuity of mineralization. The Indicated Mineral Resource estimate is intended to be of sufficient quality to support a preliminary feasibility study which can serve as the basis for development and production planning decisions.
Inferred Mineral Resource: This is the part of a Mineral Resource for which quantity and grade or quality can be estimated on the basis of geological evidence and limited sampling and reasonably assumed, but not verified, geological and grade continuity. The information is based on limited information and sampling gathered through appropriate techniques from locations such as outcrops, trenches, pits, workings and drill holes. Due to the uncertainty which may attach to Inferred Mineral Resources, it cannot be assumed that all or any part of an Inferred Mineral Resource will be upgraded to an Indicated or Measured Mineral Resource as a result of continued exploration.
Ore Body—A mineral deposit that can be mined at a profit under existing economic conditions.
Ore Pass—A vertical or steeply inclined raise used to move ore by gravity to the mine level where it will be crushed and hoisted to surface.
Ore Reserve—See Mineral Reserve.
Other Mineralization—See Mineral Resource.
Ounce—Throughout this report, the terms "ounce" and "milliounce" are used as abbreviations for the troy ounce measure of weight. The troy ounce has been used exclusively as a precious metals measurement, probably since the 16th century.
| One troy ounce | = | 1.097 avoirdupois ounces | ||||||
| = | 31.103 grams | |||||||
| One milliounce | = | 0.001 ounce |
Put option—An option contract that gives the holder the right, but not the obligation, to sell a specific commodity on a specific future date at a fixed price.
Ramp—An underground tunnel providing access for exploration or the movement of materials and equipment between mine levels.
Recovery Rate—The percentage of metals recovered in a mineral separation process. Recovery rates vary considerably depending on physical, metallurgical and economic circumstances.
Run-of-Mine Ore—Uncrushed ore in its natural state just as it is when blasted.
Shaft—A vertical accessway to a mine. Shafts are used for the movement of personnel and materials, including ore and nonmineralized rock.
Spot deferred sale—Similar to a forward sale except the date of sale may be deferred many times before the gold is ultimately delivered. The contango will increase at each deferral or roll forward.
Stope—An underground working area where ore is mined.
Swap—Transactions that generally involve the contractual exchange of interest payment obligations, currency positions, or commodities (or any combination thereof), on a specified amount of notional principal for a specified period of time.
Tailings—The neutralized material discarded after the economically recoverable metals have been extracted from the ore by Milling or Heap Leaching.
Ton—The short ton is used throughout this report. It is a unit of weight equal to 2,000 pounds or 907.2 kilograms.
Waste-to-Ore Ratio—In an open pit mine, large quantities of nonmineralized rock often cover up the ore and must be removed. The stripping ratio is the number of tons of nonmineralized material removed per ton of ore mined.
The following table sets forth annual high, low, average and end of period afternoon fixing gold prices in U.S. dollars per troy ounce on the London Bullion Market.
| | | Year ended December 31, | ||||||||||||||||
|---|---|---|---|---|---|---|---|---|---|---|---|---|---|---|---|---|---|---|
| | 2001* | 2000 | 1999 | 1998 | 1997 | 1996 | ||||||||||||
| High | $ | 273 | $ | 313 | $ | 326 | $ | 313 | $ | 367 | $ | 415 | ||||||
| Low | 256 | 264 | 253 | 273 | 283 | 367 | ||||||||||||
| Average | 264 | 279 | 279 | 294 | 332 | 388 | ||||||||||||
| End of Period | 260 | 274 | 290 | 286 | 293 | 369 | ||||||||||||
- *
- Through March 28, 2001
The following table sets forth annual high, low, average and end of period noon prices in U.S. dollars per troy ounce as quoted by Handy & Harman.
| | | Year ended December 31, | ||||||||||||||||
|---|---|---|---|---|---|---|---|---|---|---|---|---|---|---|---|---|---|---|
| | 2001* | 2000 | 1999 | 1998 | 1996 | 1997 | ||||||||||||
| High | $ | 4.87 | $ | 5.53 | $ | 5.77 | $ | 7.31 | $ | 6.13 | $ | 5.79 | ||||||
| Low | 4.30 | 4.60 | 4.91 | 4.72 | 4.18 | 4.67 | ||||||||||||
| Average | 4.56 | 5.00 | 5.25 | 5.54 | 4.87 | 5.18 | ||||||||||||
| End of Period | 4.39 | 4.60 | 5.40 | 4.87 | 6.13 | 4.87 | ||||||||||||
- *
- Through March 28, 2001
The exchange rates of the Canadian dollar to the U.S. dollar at the end of each period and the high, the low and the average exchange rates for each period, were as follows (such rates, which are expressed in Canadian dollars, being the noon buying rates in New York City for cable transfers in U.S. dollars as certified for customs purposes by the Federal Reserve Bank of New York).
| | | Year ended December 31, | ||||||||||
|---|---|---|---|---|---|---|---|---|---|---|---|---|
| | 2001* | 2000 | 1999 | 1998 | 1997 | 1996 | ||||||
| High | C$1.4936 | C$1.4341 | C$1.4433 | C$1.4075 | C$1.3353 | C$1.3310 | ||||||
| Low | 1.5732 | 1.5593 | 1.5514 | 1.5765 | 1.4358 | 1.3822 | ||||||
| Average | 1.5265 | 1.4852 | 1.4864 | 1.4823 | 1.3838 | 1.3638 | ||||||
| End of Period | 1.5670 | 1.5002 | 1.4433 | 1.5512 | 1.4352 | 1.3697 | ||||||
- *
- Through March 28, 2001
For ease of reference, the following conversion factors are provided. The term "ounce" as used in this report means "troy ounce."
| 1 mile | = | 1.6093 kilometers | ||
| 1 foot | = | 0.305 meter | ||
| 1 acre | = | 0.4047 hectare | ||
| 1 U.S. gallon | = | 3.785 liters | ||
| 1 short ton | = | 2,000 pounds | ||
| = | 907.2 kilograms | |||
| 1 troy ounce | = | 1.097 avoirdupois ounces | ||
| = | 31.103 grams |
In September 1992, the Summa Corporation commenced a lawsuit against Echo Bay Exploration Inc. and Echo Bay Management Corporation, indirect subsidiaries of the Company, alleging improper deductions in the calculation of royalties payable over several years of production at the McCoy/Cove and Manhattan mines. The matter was tried in the Nevada State Court in April 1997, with Summa claiming more than $13 million in damages, and, in September 1997, judgement was rendered for the Echo Bay companies. The decision was appealed by Summa to the Supreme Court of Nevada, which heard the matter on November 9, 1999.
On April 26, 2000, the Supreme Court of Nevada reversed the decision of the trial court and remanded the case back to the trial court for "a calculation of the appropriate [royalties] in a manner not inconsistent with this order". The case was decided by a panel comprised of three of the seven Justices of the Supreme Court of Nevada and the Echo Bay defendants petitioned that panel for a rehearing. The petition was denied by the three member panel on May 15, 2000 and remanded to the lower court for consideration of other defenses and arguments put forth by the Echo Bay defendants. The Echo Bay defendants filed a petition for a hearing before the full Court and on December 22, 2000, the Court recalled its previous decision. Both the Echo Bay defendants and their counsel believe that grounds exist to modify or reverse the decision. The Company has $1.5 million accrued related to the Summa litigation. If the appellate reversal of the trial decision is maintained and the trial court, on remand, were to dismiss all the Echo Bay defenses, the royalty calculation at McCoy/Cove would change and additional royalties would be payable.
On January 24, 2000, a subsidiary of the Company was served with a complaint in the case of Colorado School of Mines vs. AK Steel, et al., Civil Action 99-N-1863 (USDC Colorado). This lawsuit seeks contribution from numerous parties for environmental cleanup costs at a federal Comprehensive Environmental Response, Compensation and Liability Act site. In October 2000, the Company's subsidiary and plaintiff agreed to a settlement. This settlement has been filed with the Court for approval and in January 2001 the Colorado School of Mines requested the Court to expedite approval of the settlement agreement. The settlement was approximately $179,000 (the Company's share, $89,500).
The Company is also engaged in routine litigation incidental to its business.
ITEM 4—SUBMISSION OF MATTERS TO A VOTE OF SECURITY HOLDERS
There were no matters submitted to a vote of security holders during the fourth quarter of 2000.
ITEM 5—MARKET FOR THE REGISTRANT'S COMMON SHARES AND
RELATED SHAREHOLDER MATTERS
The Company's common shares were first sold to the public at $2.36 per share in April 1983 after giving effect to the six-for-five share split in 1983 and the two-for-one share split in 1987. The Company's current stock exchange listings, together with the date of listing, are set out below.
Canada-Toronto (April 1983)
United States-American (October 1983)
France-Paris (March 1985)
Belgium-Brussels (October 1985)
Switzerland-Zurich (April 1987)
Germany-Frankfurt (November 1988)
The following table sets forth for the period from January 1, 1999 through January 31, 2001 the high and low reported prices and trading volume of the common shares on The Toronto Stock Exchange and the American Stock Exchange.
| | The Toronto Stock Exchange | American Stock Exchange | ||||||||||
|---|---|---|---|---|---|---|---|---|---|---|---|---|
| | High | Low | Volume | High | Low | Volume | ||||||
| | (Canadian Dollars) | (shares in thousands) | (U.S. Dollars) | (shares in thousands) | ||||||||
| 1999 | ||||||||||||
| First Quarter | 3.18 | 2.46 | 2,116 | 2.19 | 1.63 | 7,239 | ||||||
| Second Quarter | 2.80 | 2.05 | 2,054 | 1.94 | 1.38 | 6,701 | ||||||
| Third Quarter | 4.00 | 1.78 | 3,675 | 2.63 | 1.19 | 12,232 | ||||||
| Fourth Quarter | 3.69 | 1.75 | 2,721 | 2.50 | 1.13 | 9,747 | ||||||
2000 | ||||||||||||
| First Quarter | 2.85 | 1.76 | 2,445 | 1.94 | 1.25 | 7,052 | ||||||
| Second Quarter | 2.09 | 1.30 | 2,824 | 1.38 | 0.88 | 6,776 | ||||||
| Third Quarter | 1.61 | 1.05 | 2,075 | 1.06 | 0.69 | 4,763 | ||||||
| October | 1.15 | 0.92 | 481 | 0.75 | 0.63 | 2,146 | ||||||
| November | 1.12 | 0.77 | 669 | 0.69 | 0.50 | 1,905 | ||||||
| December | 0.90 | 0.52 | 1,599 | 0.63 | 0.32 | 4,629 | ||||||
2001 | ||||||||||||
| January | 0.92 | 0.59 | 513 | 0.63 | 0.38 | 1,292 | ||||||
| February | 1.43 | 0.85 | 2,844 | 0.94 | 0.58 | 2,865 | ||||||
On March 28, 2001, the closing price of the common shares on The Toronto Stock Exchange and on the American Stock Exchange was C$1.01 and U.S.$0.68, respectively.
On March 28, 2001 the Company had 140,607,145 common shares outstanding held by approximately 66,000 registered and nominee shareholders.
Early in 2000, The American Stock Exchange advised the Company that its listing eligibility was under review. The review was undertaken because the Company had fallen below two of the Exchange's continued listing guidelines. The Company had sustained net losses in its five most recent fiscal years (1995 to 1999) and in the Exchange's view, the Company's shareholders' equity under generally accepted accounting principles in the United States is inadequate. The Company is addressing the Exchange's concerns through periodic progress reviews and currently the matter is in abeyance pending a review of the Company's December 31, 2000 financial statements.
The Company suspended payment of dividends beginning in 1997. The declaration and payment of future dividends is dependent upon the Company's capital requirements, earnings and economic outlook. Additionally, since April 1998, the Company has exercised its right to defer its interest payment to holders of the capital securities. During the deferral period, the Company is prohibited from paying dividends.
Historically, dividends payable to Canadian residents have been converted to and paid in Canadian dollars.
See "Certain Tax Matters—Canadian Federal Income Tax Considerations" for information with respect to Canadian withholding tax applicable to non-Canadian shareholders.
The following paragraphs summarize certain United States and Canadian federal income tax considerations in connection with the receipt of dividends paid on common shares of the Company and certain United States and Canadian federal income tax considerations in connection with a disposition of common shares. These tax considerations are stated in brief and general terms and are based on United States and Canadian law currently in effect. There are other potentially significant United States and Canadian federal income tax considerations and state, provincial or local income tax considerations with respect to ownership and disposition of the common shares which are not discussed herein. The tax considerations relative to ownership and disposition of the common shares may vary from taxpayer to taxpayer depending on the taxpayer's particular status. Accordingly, prospective purchasers should consult with their tax advisors regarding tax considerations which may apply to their particular situation.
United States Federal Income Tax Considerations
Dividends on common shares paid to U.S. citizens or corporations (including any Canadian federal income tax withheld) will be generally subject to U.S. federal ordinary income taxation to the extent that a shareholder received a distribution out of the shareholder's ratable share of the Company's current or accumulated earnings and profits (e.g., a taxable dividend distribution). To the extent that the amount of the dividend distribution exceeds the shareholder's ratable share, such excess would not be taxable but would reduce the shareholder's basis in the Company's common stock. To the extent that the distribution exceeds the shareholder's adjusted basis in the shares (i.e. cost less all non-taxable dividend distributions), the excess would be taxable as a gain as if the shareholder had sold or exchanged the shares. In this case, holding periods for capital gain purposes would be the same as the holding period for such stock from which that dividend would be attributed. Such dividends will not be eligible for the deduction for dividends received by corporations (unless such corporation owns by vote and value at least 10% of the stock of the Company, in which case a portion of such dividend may be eligible for such deduction).
U.S. corporations, U.S. citizens and U.S. residents will generally be entitled, subject to certain limitations, to a credit against their U.S. federal income tax for Canadian federal income taxes withheld from such dividends. Taxpayers may claim a deduction for such taxes if they do not elect to claim such tax credit. No deduction for foreign taxes may be claimed by an individual taxpayer who does not itemize deductions. Because the application of the foreign tax credit depends upon the particular circumstances of each shareholder, shareholders are urged to consult their own tax advisors in this regard.
The Company believes that it is not a "passive foreign investment company" (a "PFIC"), a "foreign personal holding company" (a "FPHC"), or a "controlled foreign corporation" (a "CFC"), for United States Federal income tax purposes, and the Company does not expect to become a PFIC, a FPHC or a CFC. If the Company were, or were to become, a PFIC, a FPHC, or a CFC, some or all United States shareholders would be required to include in their taxable income certain undistributed amounts of the Company's income, or, in certain circumstances, to pay an interest charge together with tax calculated at maximum rates on certain "excess distributions," including gains on the sale of stock.
Any United States person who owns 5% or more in value of the stock of the Company may be required to file IRS Form 5471 with respect to the Company and its non-United States subsidiaries to report certain acquisitions or dispositions of stock of the Company. Annual filings of Form 5471 would be required from any United States person owning 50% or more of the stock of the Company or, if the Company were a FPHC or a CFC, from certain United States persons owning 10% or more of the stock of the Company.
Canadian Federal Income Tax Considerations
Dividends paid on common shares held by non-residents of Canada will generally be subject to Canadian withholding tax. This withholding tax is levied at the basic rate of 25%, although this rate may be reduced by the terms of any applicable tax treaty. The Canada-U.S. tax treaty provides that the withholding rate on dividends paid to U.S. residents on common shares is 5%, if such dividends were paid to a shareholder which is a company and which owns at least 10% of the voting stock of the Company, or 15% in all other cases. Generally, a non-resident of Canada who holds common shares as capital property will not be subject to Canadian federal income tax on capital gains realized on the disposition of his or her common shares provided that during the five years preceding the disposition the non-resident, together with non-arm's-length persons, has not at any time owned 25% or more of the issued shares of any class of the Company.
ITEM 6—SELECTED FINANCIAL DATA
The following table is derived in part from the audited consolidated financial statements of the Company. The consolidated financial statements have been prepared in accordance with accounting principles generally accepted in Canada. In all material respects, they conform with principles generally accepted in the United States (except as described in footnote 1 to this table and note 14 to the Company's consolidated financial statements). This information should be read in conjunction with the audited consolidated financial statements and the notes thereto.
| Year ended December 31 millions of U.S. dollars except for gold price and per share data | 2000 | 1999 | 1998 | 1997 | 1996 | ||||||||||
|---|---|---|---|---|---|---|---|---|---|---|---|---|---|---|---|
| Statement of Operations Data | |||||||||||||||
| Revenue | $ | 281.0 | $ | 210.4 | $ | 232.2 | $ | 305.4 | $ | 337.3 | |||||
| Average gold price realized per ounce | $ | 319 | $ | 325 | $ | 333 | $ | 362 | $ | 384 | |||||
| Earnings (loss) before taxes(2) | $ | 16.8 | $ | (37.1) | $ | (19.8) | $ | (418.7) | $ | (176.1) | |||||
| Effective tax rate | (10.4%) | (0.6%) | (1.8%) | (0.4%) | (0.4%) | ||||||||||
| Net earnings (loss)(2) | $ | 18.6 | $ | (37.3) | $ | (20.1) | $ | (420.5) | $ | (176.7) | |||||
| Net earnings (loss) attributable to common shareholders(2)(3) | $ | 3.2 | $ | (51.0) | $ | (32.6) | $ | (426.2) | $ | (176.7) | |||||
| Net earnings (loss) per common share(2)(3) | $ | 0.02 | $ | (0.36) | $ | (0.23) | $ | (3.06) | $ | (1.31) | |||||
| Weighted average common shares outstanding (millions) | 140.6 | 140.6 | 140.1 | 139.4 | 134.4 | ||||||||||
Balance Sheet Data | |||||||||||||||
| Working capital (deficiency) | $ | 5.0 | $ | 4.0 | $ | (0.5) | $ | (28.7) | $ | (52.9) | |||||
| Current ratio | 1.07 | 1.07 | 0.99 | 0.73 | 0.74 | ||||||||||
| Total assets | $ | 295.8 | $ | 340.2 | $ | 368.1 | $ | 432.8 | $ | 832.1 | |||||
| Gold, silver and currency financings | $ | 32.5 | $ | 56.7 | $ | 52.8 | $ | 66.5 | $ | 182.9 | |||||
| Deferred income taxes | $ | 4.7 | $ | 7.4 | $ | 7.5 | $ | 7.9 | $ | 8.4 | |||||
| Shareholders' equity | $ | 116.8 | $ | 101.1 | $ | 133.8 | $ | 153.7 | $ | 492.3 | |||||
| Common shares outstanding (millions) | 140.6 | 140.6 | 140.6 | 139.4 | 139.4 | ||||||||||
Other Data | |||||||||||||||
| Dividends paid on common shares – total | $ | — | $ | — | $ | — | $ | — | $ | 10.1 | |||||
| – per share | $ | — | $ | — | $ | — | $ | — | $ | 0.075 | |||||
| Net cash flows provided from (used in) operating activities Activities | $ | 42.3 | $ | 37.7 | $ | 14.1 | $ | (9.2) | $ | 29.9 | |||||
| Capital and exploration spending | $ | 16.5 | $ | 14.7 | $ | 24.1 | $ | 151.1 | $ | 161.7 | |||||
- (1)
- This information should be read in conjunction with the Company's audited consolidated financial statements and accompanying notes. Commitments and contingencies are described in note 18 to the Company's consolidated financial statements. The Company's consolidated financial statements are prepared in accordance with Canadian generally accepted accounting principles. Had the consolidated financial statements been prepared in accordance with accounting principles generally accepted in the United States, certain selected financial data would be disclosed as follows. See also note 14 to the Company's consolidated financial statements.
| | | 2000 | 1999 | 1998 | 1997 | 1996 | ||||||||||||
|---|---|---|---|---|---|---|---|---|---|---|---|---|---|---|---|---|---|---|
| Earnings (loss) before income taxes | $ | 1.6 | $ | (48.0 | ) | $ | (40.4 | ) | $ | (499.9 | ) | $ | (173.1 | ) | ||||
| Net earnings (loss) | $ | 3.3 | $ | (48.2 | ) | $ | (40.8 | ) | $ | (454.7 | ) | $ | (173.7 | ) | ||||
| Net earnings (loss) per common share | $ | 0.02 | $ | (0.34 | ) | $ | (0.29 | ) | $ | (3.26 | ) | $ | (1.29 | ) | ||||
| Total assets | $ | 297.4 | $ | 341.3 | $ | 370.1 | $ | 435.5 | $ | 919.6 | ||||||||
| Gold and other financings | $ | 129.5 | $ | 154.3 | $ | 147.9 | $ | 162.3 | $ | 182.9 | ||||||||
| Deferred income taxes | $ | 4.7 | $ | 7.4 | $ | 7.5 | $ | 7.9 | $ | 55.0 | ||||||||
| Shareholders' equity | $ | (18.4 | ) | $ | (19.5 | ) | $ | 24.2 | $ | 67.4 | $ | 533.1 | ||||||
- (2)
- In 1997, the Company recorded a $362.7 million provision for impaired assets and other charges ($2.60 per share). In 1996, the Company recorded provisions of $30.0 million ($0.22 per share) for the Cove pit wall at the McCoy/Cove mine in Nevada and $77.1 million ($0.57 per share) to write off the $57.1 million book value of its Alaska-Juneau development property in Alaska and to accrue $20.0 million for estimated reclamation and closure costs.
- (3)
- After interest expense on the equity portion of the capital securities, issued in 1997. See note 7 to the consolidated financial statements.
ITEM 7—MANAGEMENT'S DISCUSSION AND ANALYSIS OF
FINANCIAL CONDITION AND RESULTS OF OPERATIONS
The following discussion of the financial results of the Company's operations for the years 1998 through 2000 should be read in conjunction with the financial data and the Company's consolidated financial statements included elsewhere in this report. The Company's consolidated financial statements are prepared in accordance with accounting principles generally accepted in Canada. Except as described in note 14 to the Company's consolidated financial statements, they conform in all material respects to those principles generally accepted in the United States.
Material changes in the Company's reserves may significantly impact results of operations and asset carrying values. See the discussion of reserves in "Business and Properties—Reserves."
The following contains statements that are, by their nature, forward-looking and uncertain. See "Cautionary 'Safe Harbor' Statement under the United States Private Litigation Reform Act of 1995," "Business and Properties—Risk Factors" and "Commitments and Contingencies" for a discussion of certain factors that should be considered in evaluating these statements.
The Company had net earnings of $18.6 million ($0.02 per share) in 2000, compared with net losses of $37.3 million ($0.36 per share) in 1999 and $20.1 million ($0.23 per share) in 1998. The 2000 results compared to 1999 reflect 39% higher gold and 35% higher silver sales volume, the 1999 loss on the sale of the Company's interest in Paradones Amarillos, and lower depreciation and amortization. These factors were partially offset by increased operating costs and lower gold and silver prices realized in 2000. The 1999 results compared to 1998 reflect lower gold sales volumes, the loss on the sale of the Company's interest in Paradones Amarillos, the 1998 gain on the sale of Santa Elina and other mining properties, and decreased average gold and silver prices realized. These factors were partially offset by decreased operating costs, lower depreciation and amortization, increased silver sales volumes and decreased exploration and development spending in 1999.
The Company produced 694,663 ounces of gold during the year, an increase of 39% over 1999 and 12.3 million ounces of silver during the year, an increase of 46% over 1999. Production targets for 2001 are 570,000 ounces of gold and five million ounces of silver. The expected decline in production will result from the completion of mining at McCoy/Cove.
The average gold price realized by the Company in 2000 was $319 per ounce. This was above the average market price of $279 per ounce in 2000, but lower than the $325 per ounce average price realized in 1999. To help protect against gold price declines, the Company has forward sales contracts on 125,000 ounces of its estimated 2001 gold production at an average price of $312 per ounce.
In 2000, operating activities provided net cash flows of $42.3 million.
Revenue increased to $281.0 million in 2000 from $210.4 million in 1999, reflecting 39% higher gold and 35% higher silver sales volume ($79.8 million), resulting primarily from the recommencement of Lupin operations and increased production at McCoy/Cove. These factors were partially offset by lower gold and silver prices realized. The decrease in revenue in 1999 from 1998 reflected lower gold sales volume, primarily from McCoy/Cove, and decreased gold and silver prices realized.
Consolidated cash operating costs per ounce of gold produced(1) were $193 in 2000, $215 in 1999 and $208 in 1998. Cash operating costs generally reflect mining and processing costs, most significantly labor, consumable materials, repairs of machinery and equipment, fuel, utilities and environmental compliance. Cash operating costs per ounce were lower in 2000 compared to 1999, reflecting increased grades and higher production at McCoy/Cove. Cash operating costs per ounce were higher in 1999 compared to 1998, reflecting lower production at McCoy/Cove partially offset by savings in mining and milling costs at McCoy/Cove and Kettle River.
The Company's cash operating cost target for 2001 is $225 per ounce of gold produced, reflecting an anticipated 15% to 20% decrease in production in 2001, largely due to the completion of mining at McCoy/Cove.
Royalties increased to $8.0 million in 2000 from $7.2 million in 1999 and $7.5 million in 1998, primarily due to increased production. The Company's royalty expense target for 2001 is $7 million. See note 18 to the consolidated financial statements.
Depreciation expense was $32.5 million in 2000, $40.9 million in 1999, and $45.8 million in 1998. Depreciation expense decreased in 2000 and 1999 from 1998 due to McCoy/Cove and Kettle River assets approaching the end of their useful lives and being fully depreciated and not replaced. Depreciation per ounce(1) was $35 in 2000, $58 in 1999 and $62 in 1998.
Amortization varies with the quantity of gold and silver sold and the mix of production from the various mines. The quantities of the Company's proven and probable reserves also affect amortization expense, as the Company's investment is amortized over these ounces. Amortization expense of $18.2 million in 2000 and $14.0 million in 1999 compared to $17.5 million in 1998 reflect changes in production levels. Amortization per ounce(1) was $20 in 2000, $20 in 1999 and $25 in 1998.
For 2001, the Company expects depreciation and amortization expense to be $45 million, compared to $50.7 million in 2000.
Reclamation and mine closure expense varies with the quantity of gold and silver produced and the mix of production from the various mines. The quantities of the Company's proven and probable reserves also affect reclamation and mine closure expense, as the total estimated costs are accrued over these ounces. Reclamation and mine closure expense increased by $3.5 million in 2000 compared to 1999, as a result of increased production. The increase in 1999 compared to 1998 reflects increases in reclamation and mine closure rates. For 2001, the Company expects this expense to be $8 million.
Decreases in general and administrative costs over the past three years reflect downsizing and cost reduction initiatives. For 2001, the Company expects general and administrative costs to be $6 million.
Exploration and development expense was $10.3 million in 2000 and $8.8 million in 1999, down from $12.0 million in 1998. Exploration and development expense includes Lupin costs relating to the recommencement of operations of $4.8 million in 2000 and annual care and maintenance costs of $3.4 million in 1999 and $4.6 million in 1998. The Company has reduced exploration and development programs in response to market conditions, which may limit the discovery and development of new reserves. This could have adverse implications on the Company as McCoy/Cove and Kettle River near the end of their mine lives. For 2001, the Company expects exploration and development expenditures to total $5 million.
Loss (Gain) on Sale of Interests in Mining and Other Properties
In 1999, the Company recognized a $13.8 million loss on the sale of its 60% interest in the Paredones Amarillos project in Mexico to its joint venture partner. In 1998, the Company recognized a total gain of $7.4 million on the sale of its investment in Santa Elina and interests in other mining properties.
- (1)
- The Company reports per ounce production cost data in accordance with The Gold Institute Production Cost Standard (the "Standard"). The Gold Institute is an association of suppliers of gold and gold products and includes leading North American gold producers. Adoption of the Standard is voluntary, and the data presented may not be comparable to data presented by other gold producers. Production costs per ounce are derived from amounts included in the audited Statements of Operations and include mine site operating costs such as mining, processing, administration, transportation, royalties, production taxes, depreciation, amortization and reclamation costs, but exclude financing, capital, development and exploration costs. These costs are then divided by gold ounces produced to arrive at the total production costs per ounce. The measures are furnished to provide additional information and should not be considered in isolation or as a substitute for measures of performance prepared in accordance with generally accepted accounting principles.
LIQUIDITY AND CAPITAL RESOURCES
In 2000, the market price of gold averaged $279 per ounce. A depressed gold price significantly affects the Company's ability to proceed with construction of the Aquarius mine, to expand its exploration activities, to refinance its indebtedness on favorable terms, to make interest payments on the capital securities or to pursue new acquisitions or investments.
Net cash flows provided from operating activities were $42.3 million in 2000, compared with net cash flows provided from operating activities of $37.7 million in 1999 and net cash flows used in operating activities of $14.1 million in 1998. The 2000 results reflect the recommencement of Lupin operations and increased sales volume.
Net cash used in investing activities in 2000 totaled $6.7 million, largely related to investments in mining properties, plant and equipment.
Net cash used in financing activities was $24.8 million in 2000, reflecting debt repayments of $36.8 million and currency borrowings of $12.0 million.
At December 31, 2000, the Company had $14.3 million in cash and cash equivalents and $2.2 million in short-term investments.
At December 31, 2000, the Company's current debt was $26.5 million and its long-term debt was $6.0 million.
The Company's existing term and revolving credit facilities are scheduled to expire in August 2001. The Company currently has $19.0 million outstanding under its revolving credit facility. Based on the current trailing 90-day average spot price of gold, the Company is restricted to an additional borrowing capacity of $4 million under this credit facility. At current gold prices, the Company does not anticipate drawing on the revolving line. The Company believes it is currently in compliance with the credit facility covenants. The Company is in discussions with lenders to arrange a new borrowing facility but has not yet entered into a final agreement. The Company's ability to borrow is constrained by conditions in the gold mining industry and its recent and currently expected future operating results. Should the Company be unable to arrange a new borrowing facility to replace its maturing facility, it is unlikely that the Company would be able to settle its existing loan with cash from operations or other sources. As a result of these conditions, there is substantial doubt about the Company's ability to continue its operations in the normal course of business. Therefore, the "Report of the Independent Chartered Accountants" dated January 31, 2001 includes Comments by Auditors for U.S. Readers on Canada-U.S. Reporting Difference. This comment identifies the going concern issue. The basis of the going concern comment was the Company's ability to refinance the credit facilities referred to above.
At December 31, 2000, the estimated fair value of the Company's hedge portfolio was $8.4 million, which is within the predetermined margin limits of $17 million. Certain counterparties could require margin deposits if the fair value of the hedge portfolio were less than the predetermined margin threshold. At December 30, 2001, a change in the gold price of $10 per ounce would result in a change in fair value of the hedge position by $3.2 million assuming no changes in dollar interest rates, gold lease rates or other volatility factors underlying the Company's hedge position.
In 1997, the Company issued $100.0 million of 11% capital securities due in 2027 (note 7 to the consolidated financial statements). The Company has the right to defer interest payments on the capital securities for a period not to exceed 10 consecutive semi-annual periods. During a period of interest deferral, interest accrues at a rate of 12% per annum, compounded semi-annually, on the full principal amount and deferred interest. The Company, at its option, may satisfy its deferred interest obligation by delivering common shares to the indenture trustee for the capital securities. The trustee would sell the Company's shares and remit the proceeds to the holders of the securities in payment of the deferred interest obligation. Deferred interest obligations not settled with proceeds from the sale of shares remain an unsecured liability of the Company. Since April 1998, the Company has exercised its right to defer its interest payments to holders of the capital securities. Interest deferred to date amounts to $43.1 million at December 31, 2000 and is payable no later than April 1, 2003 together with any additional compounded or deferred interest up to that date. Although the Company has the contractual right to issue shares in settlement of this obligation, market conditions in 2003 will determine the Company's ability to settle through the delivery and sale of common shares.
The Company expects to spend $22 million for capital expenditures in 2001, funded by its operating cash flow and credit facilities. The Company will continue to monitor its discretionary spending in view of the current gold market, the cost structure of its operating mines and the availability of additional credit; and will modify or reduce its discretionary spending where necessary.
Early in 2000, The American Stock Exchange advised the Company that its listing eligibility was under review. The review was undertaken because the Company had fallen below two of the Exchange's continued listing guidelines. The Company had sustained net losses in its five most recent fiscal years (1995 to 1999) and in the Exchange's view, the Company's shareholders' equity under generally accepted accounting principles in the United States is inadequate. The Company is addressing the Exchange's concerns through periodic progress reviews and currently the matter is in abeyance pending a review of the Company's December 31, 2000 financial statements.
The Company's profitability is subject to changes in gold and silver prices, exchange rates, interest rates and certain commodity prices. To reduce the impact of such changes, the Company attempts to lock in the future value of certain of these items through hedging transactions. These transactions are accomplished through the use of derivative financial instruments, the values of which are derived from movements in the underlying prices or rates.
The Company continually monitors its hedging policy in light of forecasted production, operating and capital expenditures, exploration and development requirements and factors affecting volatility of gold prices such as actual and prospective interest rate and gold lease rate performance. The gold- and silver-related instruments used in hedging transactions include fixed and floating forward contracts and options. These forward sales contracts obligate the Company to sell gold or silver at a specific price on a future date. Call options give the holder the right, but not the obligation to buy gold or silver at a specific future date at a specific price. These tools reduce the risk associated with gold and silver price declines, but also could limit the Company's participation in increases of gold and silver prices. The Company engages in forward currency-exchange contracts to reduce the impact on the Lupin mine's operating costs caused by fluctuations in the exchange rate of U.S. dollars to Canadian dollars.
Gains and losses resulting from hedging activities are recognized in earnings on a basis consistent with the hedged item. When hedged production is sold, revenue is recognized in amounts implicit in the commodity loan, delivery commitment or option agreement. Gains or losses on foreign currency and crude oil hedging activities are recorded in operating costs, or capitalized in the cost of assets, when the hedged Canadian dollars are purchased and when crude oil supplies are used in operations. Gains and losses on early termination of hedging contracts are deferred until the hedged items are recognized in earnings. Premiums paid or received on gold and silver option contracts purchased or sold are deferred and recognized in earnings on the option expiration dates.
The Company assesses the exposure that may result from a hedging transaction prior to entering into the commitment, and only enters into transactions that it believes accurately hedge the underlying risk and could be safely held to maturity. The Company does not engage in the practice of trading derivative securities for profit. The Company regularly reviews its unrealized gains and losses on hedging transactions.
The credit risk exposure related to all hedging activities is limited to the unrealized gains on outstanding contracts based on current market prices. To reduce counterparty credit exposure, the Company deals only with large, credit-worthy financial institutions and limits credit exposure to each. In addition, the Company deals only in markets it considers highly liquid to allow for situations where positions may need to be reversed.
Certain of the Company's counterparties require margin deposits if the fair value of the hedge position is less than the predetermined margin threshold. The Company also utilizes counterparties that do not require margin deposits. At December 31, 2000, the estimated fair value of the Company's hedge portfolio was $8.4 million, which is within the predetermined margin limits of $17 million. Sensitivity to various market factors underlying these contracts are shown in Note 17 to the consolidated financial statements. The Company regularly reviews its margin risk and attempts to mitigate this risk by modifying its hedge position whenever market conditions allow.
In 2000, the Company delivered approximately 37% of gold production against forward sales and put options at an average commitment price of $313 per ounce. This compares with 77% of gold production at $346 per ounce in 1999 and 96% of gold production at $341 per ounce in 1998. Approximately 35% of silver production was delivered against forward sales and put options at an average cash price of $5.71 per ounce in 2000. This compares to 43% at $5.66 per ounce in 1999 and 50% at $5.44 per ounce in 1998.
The Company's hedge position as of December 31, 2000 is shown in Note 17 to the consolidated financial statements. For the year 2001, this position includes forward sales of approximately 125,000 ounces at a forward price of $312 per ounce. For the years 2002 through 2005, the Company has forward sales totaling 195,000 ounces of gold at a forward price of $310 per ounce. Call options purchased by the Company match these forward ounces and give the Company the ability to participate in gold price increases above the strike price of $351 and $360 per ounce. In addition, in 2005, the Company has sold call options for 105,000 ounces of gold at a strike price of $340 per ounce and purchased a corresponding amount of call options with a strike price of $395 per ounce. These forward sales contracts and call options represent approximately 10% of current reserves. The Company has hedged 2.5 million silver ounces at a minimum average cash price of $5.91 per ounce in 2001. The reduced hedging position results from continued weakness in spot gold prices and low forward premiums resulting in lower hedge prices that can be achieved.
The Company's hedging commitments are described in note 17 to the Company's consolidated financial statements. See also "Qualitative and Quantitative Disclosures about Market Risk."
The Company's operations are subject to laws and regulations concerning protection of the environment. These laws and regulations change periodically and are generally becoming more restrictive, which may have the effect of increasing its future costs. Certain of the Company's subsidiaries have provided corporate guarantees and other forms of security to regulatory authorities in connection with future reclamation activities. Early in 2001, regulators in Nevada formally called upon two of the Company's subsidiaries to provide other security to replace corporate guarantees that had been given in respect of the Round Mountain and McCoy/Cove operations. The subsidiaries disagree with the regulators' position and believe that they qualify under the criteria set out for corporate guarantees and will oppose the regulatory decision. Although the outcome cannot be predicted, the Company and their counsel believe that the Company will prevail. See "Business and Properties—Other—Government Regulation and Environmental Issues."
The Company's operations are subject to certain royalty obligations as described in note 18 to the Company's consolidated financial statements.
Lease commitments are described in note 18 to the Company's consolidated financial statements.
The Company's provision for future reclamation and closure costs at the former Sunnyside mine in Colorado is reviewed periodically and may be adjusted, as additional information becomes available.
Other commitments and contingencies are discussed in notes 17 and 18 to the consolidated financial statements.
ITEM 7A—QUALITATIVE AND QUANTITATIVE DISCLOSURES
ABOUT MARKET RISK
See "Management's Discussion and Analysis—Results of Operations" for a discussion of market risks related to the Company's hedging activities.
The following table provides information as of December 31, 2000 about the Company's derivative financial instruments and other financial instruments that are sensitive to changes in commodity prices, interest rates and exchange rates.
| | Expected Year of Maturity | | ||||||||||||||||||||||
|---|---|---|---|---|---|---|---|---|---|---|---|---|---|---|---|---|---|---|---|---|---|---|---|---|
| (Amounts in millions of U.S. dollars, except amounts per ounce or unless otherwise noted) | | |||||||||||||||||||||||
| 2001 | 2002 | 2003 | 2004 | 2005 | There- After | Fair Value of Financial Instruments | ||||||||||||||||||
| Assets: | ||||||||||||||||||||||||
| Short-term investments | — | — | — | — | — | — | $ | 2.9 | ||||||||||||||||
| Liabilities: | ||||||||||||||||||||||||
| Currency loans | $ | 26.5 | — | — | — | — | — | $ | 26.5 | |||||||||||||||
| Capital securities(1) | $ | 6.0 | ||||||||||||||||||||||
| Principal | $ | 100.0 | ||||||||||||||||||||||
| Fixed interest rate(2) | 11% | 11% | 11% | 11% | 11% | 11% | ||||||||||||||||||
| Derivative financial instruments: | ||||||||||||||||||||||||
| Gold forward sales | $ | 5.7 | ||||||||||||||||||||||
| Ounces | 125,000 | 60,000 | 60,000 | 60,000 | 15,000 | — | ||||||||||||||||||
| Price per ounce | $ | 312 | $ | 310 | $ | 310 | $ | 310 | $ | 310 | — | |||||||||||||
| Silver forward sales | $ | 1.8 | ||||||||||||||||||||||
| Ounces (000's) | 1,500 | — | — | — | — | — | ||||||||||||||||||
| Price per ounce | $ | 5.85 | — | — | — | — | — | |||||||||||||||||
| Gold call options sold | $ | (2.2 | ) | |||||||||||||||||||||
| Ounces | — | — | — | — | 105,000 | — | ||||||||||||||||||
| Price per ounce | — | — | — | — | $ | 340 | — | |||||||||||||||||
| Gold call options purchased | $ | 2.4 | ||||||||||||||||||||||
| Ounces | 105,000 | 60,000 | 60,000 | 60,000 | 120,000 | — | ||||||||||||||||||
| Price per ounce | $ | 351 | $ | 360 | $ | 360 | $ | 360 | $ | 395 | — | |||||||||||||
| Silver put options purchased | $ | 1.4 | ||||||||||||||||||||||
| Ounces (000's) | 1,000 | — | — | — | — | — | ||||||||||||||||||
| Price per ounce | $ | 6.00 | — | — | — | — | — | |||||||||||||||||
| Silver call options purchased | $ | — | ||||||||||||||||||||||
| Ounces (000's) | 1,500 | — | — | — | — | — | ||||||||||||||||||
| Price per ounce | $ | 6.60 | — | — | — | — | — | |||||||||||||||||
| Silver put options sold | $ | (0.4 | ) | |||||||||||||||||||||
| Ounces (000's) | 2,500 | — | — | — | — | — | ||||||||||||||||||
| Price per ounce | $ | 4.75 | — | — | — | — | — | |||||||||||||||||
| Foreign currency contracts | $ | (0.3 | ) | |||||||||||||||||||||
| Canadian dollars (000's) | 20,000 | — | — | — | — | — | ||||||||||||||||||
| Exchange rate (C$ to US$1.00) | 1.47 | — | — | — | — | — | ||||||||||||||||||
- (1)
- At December 31, 2000, the present value of the $100.0 million principal payment in 2027 was $5.8 million. At December 31, 2000, the fair value of the entire capital securities obligation, including the interest component, was $56.1 million.
- (2)
- During a period of interest deferral, the interest rate on the capital securities is 12%, compounded semi-annually.
ITEM 8—FINANCIAL STATEMENTS AND SUPPLEMENTARY DATA
Management's Responsibility for Financial Reporting
The accompanying financial statements and related data are the responsibility of management. Management has prepared the statements in accordance with accounting principles generally accepted in Canada.
The integrity of the financial reporting process is also the responsibility of management. Management maintains systems of internal controls designed to provide reasonable assurance that transactions are authorized, assets are safeguarded, and reliable financial information is produced. Management selects accounting principles and methods that are appropriate to the Company's circumstances, and makes decisions affecting the measurement of transactions in which estimates or judgments are required to determine the amounts reported.
The Board of Directors is responsible for ensuring that management fulfills its responsibilities for financial reporting. The Board carries out this responsibility principally through its Audit Committee.
The Audit Committee consists entirely of outside directors. The Committee meets periodically with management and the external auditors to discuss internal financial controls, auditing matters and financial reporting issues. The Committee satisfies itself that each party is properly discharging its responsibilities; reviews the quarterly and annual financial statements and the external auditors' report; and recommends the appointment of the external auditors for review by the Board and approval by the shareholders.
The external auditors audit the financial statements annually on behalf of the shareholders. They also perform certain procedures related to the Company's unaudited interim financial statements and report their findings to the Audit Committee. The external auditors have free access to management and the Audit Committee.
/s/ ROBERT L. LECLERC Robert L. Leclerc Chairman and Chief Executive Officer and Director | |||
/s/ TOM S.Q. YIP Tom S.Q. Yip Vice President, Finance and Chief Financial Officer | |||
January 31, 2001 | |||
Report of Independent Chartered Accountants
The Board of Directors
Echo Bay Mines Ltd.
We have audited the consolidated balance sheets of Echo Bay Mines Ltd. as at December 31, 2000 and 1999 and the consolidated statements of operations, deficit and cash flow for each of the years in the three-year period ended December 31, 2000. These financial statements are the responsibility of the Company's management. Our responsibility is to express an opinion on these financial statements based on our audits.
We conducted our audits in accordance with auditing standards generally accepted in Canada and the United States. Those standards require that we plan and perform an audit to obtain reasonable assurance whether the financial statements are free of material misstatement. An audit includes examining, on a test basis, evidence supporting the amounts and disclosures in the financial statements. An audit also includes assessing the accounting principles used and significant estimates made by management, as well as evaluating the overall financial statement presentation.
In our opinion, the consolidated financial statements referred to above present fairly, in all material respects, the financial position of the Company as at December 31, 2000 and 1999 and the results of its operations and its cash flows for each of the years in the three-year period ended December 31, 2000 in accordance with accounting principles generally accepted in Canada.
| Edmonton, Canada January 31, 2001 | /s/ Ernst & Young LLP Chartered Accountants |
Comments by Auditors for U.S. Readers on Canada-U.S. Reporting Difference
In the United States, reporting standards for auditors require the addition of an explanatory paragraph (following the opinion paragraph) when the financial statements are affected by conditions and events that cast substantial doubt on the company's ability to continue as a going concern, such as those described in Note 1 to the financial statements. Our report to the shareholders dated January 31, 2001 is expressed in accordance with Canadian reporting standards, which do not permit a reference to such events and conditions in the auditors' report when these are adequately disclosed in the financial statements.
| Edmonton, Canada January 31, 2001 | /s/ Ernst & Young LLP Chartered Accountants |
ECHO BAY MINES LTD.
CONSOLIDATED BALANCE SHEETS
December 31
| thousands of U.S. dollars | 2000 | 1999 | ||||||
|---|---|---|---|---|---|---|---|---|
| ASSETS | ||||||||
| Current assets: | ||||||||
| Cash and cash equivalents | $ | 14,269 | $ | 3,401 | ||||
| Short-term investments | 2,186 | 2,042 | ||||||
| Interest and accounts receivable | 3,022 | 2,942 | ||||||
| Inventories (note 2) | 39,443 | 37,204 | ||||||
| Prepaid expenses and other assets | 14,031 | 15,621 | ||||||
| 72,951 | 61,210 | |||||||
| Plant and equipment (note 3) | 138,527 | 167,438 | ||||||
| Mining properties (note 3) | 63,499 | 81,959 | ||||||
| Long-term investments and other assets (note 4) | 20,868 | 29,565 | ||||||
| $ | 295,845 | $ | 340,172 | |||||
| LIABILITIES AND SHAREHOLDERS' EQUITY | ||||||||
| Current liabilities: | ||||||||
| Accounts payable and accrued liabilities | $ | 26,073 | $ | 29,961 | ||||
| Income and mining taxes payable | 5,780 | 3,004 | ||||||
| Debt and other financings (note 5) | 26,500 | 13,750 | ||||||
| Deferred income (note 6) | 9,651 | 10,525 | ||||||
| 68,004 | 57,240 | |||||||
| Debt and other financings (note 5) | 6,032 | 42,919 | ||||||
| Deferred income (note 6) | 50,698 | 83,684 | ||||||
| Other long-term obligations (note 8) | 49,632 | 47,847 | ||||||
| Deferred income taxes | 4,694 | 7,381 | ||||||
Commitments and contingencies (notes 8, 17 and 18) | ||||||||
Shareholders' equity: | ||||||||
| Common shares (note 13), no par value, unlimited number authorized; issued and outstanding — 140,607,145 shares | 713,343 | 713,343 | ||||||
| Capital securities (note 7) | 140,076 | 124,616 | ||||||
| Deficit | (711,680 | ) | (714,844 | ) | ||||
| Foreign currency translation | (24,954 | ) | (22,014 | ) | ||||
| 116,785 | 101,101 | |||||||
| $ | 295,845 | $ | 340,172 | |||||
See accompanying notes.
ECHO BAY MINES LTD.
CONSOLIDATED STATEMENTS OF OPERATIONS
Year ended December 31
| thousands of U.S. dollars, Except for per share data | 2000 | 1999 | 1998 | ||||||||
|---|---|---|---|---|---|---|---|---|---|---|---|
| Revenue | $ | 280,976 | $ | 210,351 | $ | 232,181 | |||||
| Expenses: | |||||||||||
| Operating costs | 173,435 | �� | 139,816 | 148,769 | |||||||
| Royalties (note 18) | 8,034 | 7,197 | 7,547 | ||||||||
| Production taxes | 2,460 | 256 | 1,618 | ||||||||
| Depreciation and amortization | 50,664 | 54,941 | 63,286 | ||||||||
| Reclamation and mine closure | 10,572 | 7,025 | 6,295 | ||||||||
| General and administrative | 5,650 | 7,429 | 8,027 | ||||||||
| Exploration and development | 10,336 | 8,754 | 12,010 | ||||||||
| Interest and other (note 9) | 3,012 | 8,194 | 11,845 | ||||||||
| Loss (gain) on sale of interests in mining and other properties (note 10) | — | 13,795 | (7,447 | ) | |||||||
| 264,163 | 247,407 | 251,950 | |||||||||
| Earnings (loss) before income taxes | 16,813 | (37,056 | ) | (19,769 | ) | ||||||
| Income tax expense (recovery) (note 11) | (1,748 | ) | 216 | 354 | |||||||
| Net earnings (loss) | $ | 18,561 | $ | (37,272 | ) | $ | (20,123 | ) | |||
| Net earnings (loss) attributable to common shareholders (note 7) | $ | 3,164 | $ | (50,969 | ) | $ | (32,555 | ) | |||
| Earnings (loss) per share | $ | 0.02 | $ | (0.36 | ) | $ | (0.23 | ) | |||
| Weighted average number of shares outstanding (thousands) | 140,607 | 140,607 | 140,084 | ||||||||
CONSOLIDATED STATEMENTS OF DEFICIT
Year ended December 31
| thousands of U.S. dollars | 2000 | 1999 | 1998 | |||||||
|---|---|---|---|---|---|---|---|---|---|---|
| Balance, beginning of year | $ | (714,844 | ) | $ | (663,875 | ) | $ | (631,320 | ) | |
| Net earnings (loss) | 18,561 | (37,272 | ) | (20,123 | ) | |||||
| Interest on capital securities, net of nil tax effect (note 7) | (15,397 | ) | (13,697 | ) | (12,432 | ) | ||||
| Balance, end of year | $ | (711,680 | ) | $ | (714,844 | ) | $ | (663,875 | ) | |
See accompanying notes.
ECHO BAY MINES LTD.
CONSOLIDATED STATEMENTS OF CASH FLOW
Year ended December 31
| thousands of U.S. dollars | 2000 | 1999 | 1998 | ||||||||
|---|---|---|---|---|---|---|---|---|---|---|---|
| CASH PROVIDED FROM (USED IN): | |||||||||||
| OPERATING ACTIVITIES | |||||||||||
| Net earnings (loss) | $ | 18,561 | $ | (37,272 | ) | $ | (20,123 | ) | |||
| Add (deduct): | |||||||||||
| Depreciation | 32,457 | 40,957 | 45,792 | ||||||||
| Amortization | 18,207 | 13,984 | 17,494 | ||||||||
| Deferred income included in revenue (note 6) | (24,473 | ) | (11,129 | ) | (5,381 | ) | |||||
| Deferred income included in operating costs (note 6) | (3,149 | ) | — | — | |||||||
| Deferral of gains on restructuring of hedge commitments (note 6) | 2,434 | 14,014 | 5,236 | ||||||||
| Deferred income taxes | (2,400 | ) | — | — | |||||||
| Net gain on sale of other assets (note 9) | (432 | ) | (736 | ) | (495 | ) | |||||
| Unrealized losses on share investments | 28 | 1,508 | 3,013 | ||||||||
| Loss (gain) on sale of interests in mining properties and other (note 10) | — | 13,795 | (7,447 | ) | |||||||
| Other | 769 | 961 | (90 | ) | |||||||
| Change in cash invested in operating assets and liabilities: | |||||||||||
| Interest and accounts receivable | (85 | ) | 864 | 1,898 | |||||||
| Inventories | (2,869 | ) | 882 | 3,743 | |||||||
| Prepaid expenses and other assets | (31 | ) | 290 | (2,309 | ) | ||||||
| Accounts payable and accrued liabilities | 496 | (459 | ) | (26,748 | ) | ||||||
| Income and mining taxes payable | 2,790 | 13 | (512 | ) | |||||||
| 42,303 | 37,672 | 14,071 | |||||||||
| INVESTING ACTIVITIES | |||||||||||
| Mining properties, plant and equipment | (7,387 | ) | (33,265 | ) | (26,971 | ) | |||||
| Long-term investments and other assets | (524 | ) | (5,135 | ) | (534 | ) | |||||
| Proceeds on sale of plant and equipment | 332 | 972 | 3,763 | ||||||||
| Proceeds on sale of short-term investments | 182 | 485 | 3,018 | ||||||||
| Net proceeds from (cost of) repurchase of gold and silver hedging contracts | — | (3,334 | ) | 8,673 | |||||||
| Proceeds on sale of investment in Santa Elina (note 10) | — | — | 6,252 | ||||||||
| Proceeds on sale of mining properties | — | — | 1,195 | ||||||||
| Other | 712 | (1,411 | ) | 342 | |||||||
| (6,685 | ) | (41,688 | ) | (4,262 | ) | ||||||
| FINANCING ACTIVITIES | |||||||||||
| Debt borrowings | 12,000 | 17,000 | — | ||||||||
| Debt repayments | (36,750 | ) | (16,181 | ) | (18,327 | ) | |||||
| Other | — | (1,389 | ) | (448 | ) | ||||||
| (24,750 | ) | (570 | ) | (18,775 | ) | ||||||
| Net increase (decrease) in cash and cash equivalents | 10,868 | (4,586 | ) | (8,966 | ) | ||||||
| Cash and cash equivalents, beginning of year | 3,401 | 7,987 | 16,953 | ||||||||
| Cash and cash equivalents, end of year | $ | 14,269 | $ | 3,401 | $ | 7,987 | |||||
See accompanying notes.
ECHO BAY MINES LTD.
NOTES TO CONSOLIDATED FINANCIAL STATEMENTS
December 31, 2000
Tabular dollar amounts in thousands of U.S. dollars, except amounts per
share and per ounce or unless otherwise noted
1. SUMMARY OF SIGNIFICANT ACCOUNTING POLICIES
Echo Bay Mines Ltd. mines, processes and explores for gold and silver. Gold accounted for 77% of 2000 revenue and silver 23%. In 2000 and 1999, the Company had three operating mines in the United States: Round Mountain and McCoy/Cove in Nevada; Kettle River in Washington. In 2000, the Company recommenced operations at its Lupin mine in the Nunavut Territory, Canada. All of the Company's mines are 100% owned except for Round Mountain, which is 50% owned.
The Company's financial position and operating results are directly affected by the market price of gold in relation to the Company's production costs. Silver price fluctuations also affect the Company's financial position and operating results, although to a lesser extent. Gold and silver prices fluctuate in response to numerous factors beyond the Company's control.
The consolidated financial statements are prepared on the historical cost basis in accordance with accounting principles generally accepted in Canada and, in all material respects, conform with accounting principles generally accepted in the United States, except as described in note 14. The statements are expressed in U.S. dollars.
The preparation of financial statements in conformity with generally accepted accounting principles requires management to make estimates and assumptions that affect the amounts reported in the financial statements and accompanying notes. Actual results could differ from those estimates.
Certain of the comparative figures have been reclassified to conform to the current year's presentation.
The Company's term and revolving credit facility described in note 5 matures in August 2001. The Company is in discussions with lenders to arrange a new borrowing facility but has not yet entered into a final agreement. The Company's ability to borrow is constrained by conditions in the gold mining industry and its recent and currently expected future operating results. Should the Company be unable to arrange a new borrowing facility to replace its maturing facility, it is unlikely that the Company would be able to settle its existing loan with cash from operations or other sources. As a result of these conditions, there is substantial doubt about the Company's ability to continue its operations in the normal course of business. These financial statements are prepared on a going concern basis, which assumes that the Company will continue to realize its assets and discharge its liabilities in the normal course of business for the foreseeable future. Consequently, they do not include any adjustments to the carrying amounts and classifications of assets and liabilities, which may be necessary should the Company not be able to continue to operate in the normal course of business. Management is continuing to discuss replacement financing with its lenders and is confident that a satisfactory agreement will be reached prior to the maturity date of the existing credit facility.
The consolidated financial statements include the accounts of the Company and its subsidiaries. Interests in joint ventures, each of which by contractual arrangement is jointly controlled by all parties having an equity interest in the joint venture, are accounted for using the proportionate consolidation method to consolidate the Company's share of the joint venture's assets, liabilities, revenues and expenses.
Short-term investments, comprised of publicly traded common shares, are recorded at the lower of cost or quoted market prices, with unrealized losses included in income. Long-term common share investments are recorded at cost. A provision for loss is recorded in income if there is a decline in the market value of a long-term share investment that is other than temporary. If the Company's share investment represents more than a 20% ownership interest and the Company can exercise significant influence over the investee, the equity method of accounting is used. The equity method reports the investment at cost, adjusted for the Company's pro rata share of the investee's undistributed earnings or losses since acquisition.
The Company's self-sustaining Canadian operations are translated into U.S. dollars using the current-rate method, which translates assets and liabilities at the year-end exchange rate and translates revenue and expenses at average exchange rates. Exchange differences arising on translation are recorded as a separate component of shareholders' equity. The change in the balance is attributable to fluctuations in the exchange rate of U.S. dollars to Canadian dollars.
Revenue is recognized when title to delivered gold or silver and the risks and rewards of ownership pass to the buyer.
Earnings (loss) per share are calculated based on the weighted average number of common shares outstanding during the year. For per share calculations, the amount of capital securities interest that is charged directly to the deficit decreases the earnings, or increases the loss, attributable to common shareholders. Fully diluted earnings (loss) per share is the same as basic earnings (loss) per share because the Company's outstanding options and the settlement of deferred interest on the capital securities through the delivery and sale of common shares are not dilutive.
The Company considers all highly liquid debt instruments purchased with a maturity of three months or less to be cash equivalents.
Precious metals inventories are valued at the lower of cost, using the "first-in, first-out" method, or net realizable value. Materials and supplies are valued at the lower of average cost or replacement cost.
Plant and equipment are recorded at cost. Depreciation is provided using the straight-line method over each asset's estimated economic life to a maximum of 20 years.
Mining properties—producing mines' acquisition and development costs
Mining properties are recorded at cost of acquisition. Mine development costs include expenditures incurred to develop new ore bodies, to define further mineralization in existing ore bodies and to expand the capacity of operating mines. These expenditures are amortized against earnings on the unit-of-production method based on estimated recoverable ounces of gold. Estimated recoverable ounces of gold include proven and probable reserves and non-reserve material when sufficient objective evidence exists to determine that it is probable the non-reserve material will be produced.
For the purpose of preparing financial information in accordance with United States generally accepted accounting principles, only proven and probable reserves are considered when applying the unit-of-production method. Non-reserve material was not used in the periods covered by these financial statements when applying the unit-of-production method under both Canadian and U.S. generally accepted accounting standards.
Mining properties—mining costs
Mining costs incurred to remove waste from an open pit, commonly referred to as "deferred stripping costs" and costs to access new production areas in an underground mine are capitalized as a component of property, plant and equipment. These costs are capitalized as betterments of the mining property infrastructure because they relate to gold that will be produced in future years and they are charged to operating costs in the period in which the related production occurs.
For open pit operations, mining costs are capitalized on an individual mine basis, using the ratio of total tons of waste and ore to be mined to total gold ounces to be recovered over the life of the mine. Costs are capitalized in periods when the ratio of tons mined compared to gold produced exceeds the expected average for the mine. Amortization occurs in periods when the ratio is less than the expected average. This accounting method considers variations in grade and recovery in addition to waste-to-ore ratios and results in the recognition of mining costs evenly over the life of the mine as gold is produced.
For underground mining operations, the costs of accessing and developing new production areas are deferred and expensed as operating costs in the period in which the related production occurs.
At properties identified as having the potential to add to the Company's proven and probable reserves, the direct costs of acquisition and development are capitalized only if there is sufficient objective evidence to indicate that it is probable that the property will become an operating mine. Factors considered in making this assessment include the existence and nature of known mineralization and proven and probable reserves, whether the proximity of the property to existing mines and ore bodies increases the probability of developing an operating mine, the results of recent drilling on the property and the existence of feasibility studies or other analyses demonstrating the existence of commercially recoverable ore. Capitalized costs are evaluated for recoverability when events or circumstances indicate that investment in the property may be impaired and are written off if it is determined that the project is not commercially feasible in the period in which this determination is made. The assessment of cost recoverability is based on proven and probable reserves on the property, if any, as well as other mineralization which does not meet the criteria for classification as a proven or probable reserve. If production commences, capitalized costs are transferred to "producing mines' acquisition and development costs" and amortized as described above.
For the purpose of preparing financial information in accordance with United States generally accepted accounting principles, all costs associated with a property that has the potential to add to the Company's proven and probable reserves are expensed until a final feasibility study demonstrating the existence of proven and probable reserves is completed. No costs have been capitalized in the periods covered by these financial statements that do not meet the criteria for capitalization under both Canadian and U.S. generally accepted accounting standards.
The costs of exploration programs are expensed as incurred.
Reclamation and mine closure costs
Estimated site restoration and closure costs for each producing mine are charged against operating earnings on the unit-of-production method based on estimated recoverable ounces of gold.
In 2000, the Company adopted the provisions of CICA Handbook Section 3465 "Income Taxes" on a prospective basis. The provisions require the use of the liability method of tax allocation and the recognition of deferred income taxes based on the differences between the carrying amounts of assets and liabilities for accounting and tax purposes. The adoption of the new standard had no effect on the Company's financial statements.
The Company annually reviews detailed engineering life-of-mine plans for each mine. Long-lived assets are evaluated for impairment when events or changes in circumstances indicate that the related carrying amounts may not be recoverable. Expected future undiscounted cash flows are calculated using estimated recoverable ounces of gold (considering proven and probable mineral reserves and mineral resources expected to be converted into mineral reserves), future sales prices (considering current and historical prices, price trends and related factors), operating costs, capital expenditures, reclamation and mine closure costs. Reductions in the carrying amount of long-lived assets, with a corresponding charge to earnings, are recorded to the extent that the estimated future cash flows are less than the carrying amount.
The Company's estimates of future cash flows are subject to risks and uncertainties. It is possible that changes may occur which could affect the recoverability of the Company's long-lived assets.
For the purpose of preparing financial information in accordance with United States generally accepted accounting principles, estimated recoverable ounces of gold include proven and probable reserves. Impairment is not indicated in the periods covered by these financial statements under Canadian or U.S. generally accepted accounting standards.
If the Company were to determine that its reserves and future cash flows should be calculated at a significantly lower gold price than the $300 per ounce price used at December 31, 2000, there would likely be a material reduction in the amount of gold reserves. In addition, if the price realized by the Company for its gold or silver bullion were to decline substantially below the price at which ore reserves were calculated for a sustained period of time, the Company potentially could experience material write-downs of its investment in its mining properties. Under certain of such circumstances, the Company might discontinue the development of a project or mining at one or more of its properties or might temporarily suspend operations at a producing property and place that property in a "care and maintenance" mode. Reserves could also be materially and adversely affected by changes in operating and capital costs and other factors, including but not limited to, short-term operating factors such as the need for sequential development of ore bodies and the processing of new or different ore grades and ore types.
Significant changes in the life-of-mine plans can occur as a result of mining experience, new ore discoveries, changes in mining methods and rates, process changes, investments in new equipment and technology, and other factors. Changes in the significant assumptions underlying future cash flow estimates, including assumptions regarding precious metals prices, may have a material effect on future carrying values and operating results.
Interest cost is capitalized on construction programs until the facilities are ready for their intended use.
Stock-based compensation plans
The Company has three stock-based compensation plans, which are described in note 13. No compensation expense is recognized for these plans when the stock or stock options are issued to employees. Any consideration paid by employees on the exercise of stock options is credited to share capital.
The Company's profitability is subject to changes in gold and silver prices, exchange rates, interest rates and certain commodity prices. To reduce the impact of such changes, the Company locks in the future value of certain of these items through hedging transactions. These transactions are accomplished through the use of derivative financial instruments, the value of which is derived from movements in the underlying prices or rates.
The gold- and silver-related instruments used in these transactions include fixed and floating forward sales contracts and options. These forward sales contracts obligate the Company to sell gold or silver at a specific price on a future date. Call options give the holder the right, but not the obligation to buy gold or silver at a specific future date at a specific price. These tools reduce the risk of gold and silver price declines, but also could limit the Company's participation in increases of gold and silver prices. The Company engages in forward currency-exchange contracts to reduce the impact on the Lupin mine's operating costs caused by fluctuations in the exchange rate of U.S. dollars to Canadian dollars.
Gains and losses resulting from hedging activities are recognized in earnings on a basis consistent with the hedged item. When hedged production is sold, revenue is recognized in amounts implicit in the commodity loan, delivery commitment or option agreement. Gains or losses on foreign currency are recorded in operating costs, or capitalized in the cost of assets, when the hedged Canadian dollar transactions occur. Gains and losses on early termination of hedging contracts are deferred until the formerly hedged items are recognized in earnings. Premiums paid or received on gold and silver option contracts purchased or sold are deferred and recognized in earnings on the option expiration dates. Call options written after October 24, 2000 will be carried at fair value in accordance with Emerging Issues Committee Abstract 113, "Accounting by Commodity Producers for Written Call Options."
The carrying values of gold loans are remeasured using the market value of gold at the reporting date. Differences between these values and the loan proceeds that were originally received are recorded as deferred income and will be included in revenue when the production related to the loans is delivered.
2. INVENTORIES
| | 2000 | 1999 | ||||
|---|---|---|---|---|---|---|
| Precious metals bullion | $ | 18,357 | $ | 16,033 | ||
| In-process | 8,293 | 7,538 | ||||
| Materials and supplies | 12,793 | 13,633 | ||||
| $ | 39,443 | $ | 37,204 | |||
3. PROPERTY, PLANT AND EQUIPMENT
| Net book value | | | 2000 | 1999 | ||||||||
|---|---|---|---|---|---|---|---|---|---|---|---|---|
| Property and percentage owned | Plant and Equipment | Mining Properties | Net Book Value | Net Book Value | ||||||||
| Round Mountain (50%) | $ | 57,404 | $ | 43,033 | $ | 100,437 | $ | 115,326 | ||||
| McCoy/Cove (100%) | 19,685 | 3,348 | 23,033 | 48,466 | ||||||||
| Lupin (100%) | 24,111 | 2,412 | 26,523 | 27,539 | ||||||||
| Kettle River (100%) | 774 | 1,174 | 1,948 | 2,298 | ||||||||
| Aquarius (100%) | 34,493 | 13,532 | 48,025 | 51,635 | ||||||||
| Other | 2,060 | — | 2,060 | 4,133 | ||||||||
| $ | 138,527 | $ | 63,499 | $ | 202,026 | $ | 249,397 | |||||
| | 2000 | 1999 | ||||||||||
|---|---|---|---|---|---|---|---|---|---|---|---|---|
| Plant and equipment | ||||||||||||
| | Net Book Value | | Net Book Value | |||||||||
| | Cost | Cost | ||||||||||
| Land improvements and utility systems | $ | 72,853 | $ | 5,165 | $ | 74,018 | $ | 8,245 | ||||
| Buildings | 155,893 | 33,518 | 153,128 | 37,544 | ||||||||
| Equipment | 384,236 | 62,311 | 389,360 | 78,707 | ||||||||
| Construction in progress | 40,671 | 37,533 | 44,542 | 42,942 | ||||||||
| $ | 653,653 | $ | 138,527 | $ | 661,048 | $ | 167,438 | |||||
| Mining properties | 2000 | 1999 | ||||
|---|---|---|---|---|---|---|
| Producing mines' acquisition and development costs | $ | 276,951 | $ | 272,362 | ||
| Less accumulated amortization | 248,792 | 230,470 | ||||
| 28,159 | 41,892 | |||||
| Development properties' acquisition and development costs | 13,532 | 14,065 | ||||
| Deferred mining costs | 21,808 | 26,002 | ||||
| $ | 63,499 | $ | 81,959 | |||
The deferred mining ratio for the Round Mountain mine in 2000 was 127 tons per ounce recovered (1999 - 127 tons, 1998 - 127 tons). The deferred mining ratio for the McCoy/Cove mine in 2000 was 76 tons per ounce recovered (1999 - 60 tons, 1998 - 100 tons).
4. LONG-TERM INVESTMENTS AND OTHER ASSETS
| | 2000 | 1999 | ||||
|---|---|---|---|---|---|---|
| Premiums paid on gold and silver option contracts | $ | 21,647 | $ | 34,103 | ||
| Reclamation deposits | 8,639 | 7,116 | ||||
| Other | 2,056 | 828 | ||||
| 32,342 | 42,047 | |||||
| Less current portion included in prepaid expenses and other assets | 11,474 | 12,482 | ||||
| $ | 20,868 | $ | 29,565 | |||
Premiums paid on gold and silver option contracts
Premiums paid on gold and silver option contracts purchased are deferred and recognized in earnings on the option expiration dates. These deferred premiums are expected to be recognized as follows: $11.4 million in 2001, $1.0 million in 2002, $1.4 million in 2003, $2.1 million in 2004, $3.3 million in 2005 and $2.4 million thereafter. Refer to note 6 for a discussion of the deferral of premiums received on gold and silver option contracts sold.
5. DEBT AND OTHER FINANCINGS
| | 2000 | 1999 | ||||
|---|---|---|---|---|---|---|
| Currency loans | $ | 26,500 | $ | 51,250 | ||
| Capital securities (note 7) | 6,032 | 5,419 | ||||
| 32,532 | 56,669 | |||||
| Less current portion | 26,500 | 13,750 | ||||
| $ | 6,032 | $ | 42,919 | |||
Gold term loan and currency loans
The Company has a term and revolving facility with a syndicate of commercial banks under which the Company can borrow either gold or dollars. The facility is convertible between gold and dollar borrowings. Interest on gold borrowings is calculated at the banks' gold rate plus 1.75%, and interest on dollar borrowings at LIBOR plus 1.75%. At December 31, 2000, a $7.5 million currency term loan was outstanding under the facility, with an effective interest rate of 8.25%. The Company repaid an outstanding gold term loan under the agreement in 1999.
The facility requires that the aggregate gold and currency commitment be repaid quarterly at a specified principal amount in dollars and/or the equivalent number of ounces valued at the original gold loan price of $349 per ounce. The gold loan was restructured at a price of $388 per ounce in 1996. Beginning in the third quarter of 1998, the Company opted to accelerate its repayment of gold ounces and decelerate its repayment of the currency loan from the original repayment schedule, which called for quarterly installments through the second quarter of 2001. The difference between the restructured gold loan price of $388 per ounce and the spot price on the repayment date for these accelerated ounces has been deferred and will be recognized in earnings in accordance with the original repayment schedule.
At December 31, 2000, the Company had $19.0 million outstanding under its revolving credit facility. Based on the trailing 90-day average spot price of gold, the Company is restricted to an additional borrowing capacity of $4 million under this credit facility. The Company is in the process of refinancing this facility and believes it will be successful in this effort prior to the expiration of the current facility in August 2001. At December 31, 2000, the effective interest rate on the revolving loan was 8.32%. Annual commitment fees on the unutilized credit facility are 0.5%.
Certain of the Company's financing arrangements require it to maintain specified ratios of assets to liabilities and cash flow to debt. The Company is in compliance with these ratios and other covenant requirements.
The Company had $25.2 million in outstanding surety bonds and letters of credit at December 31, 2000, primarily related to the bonding of future reclamation obligations. At December 31, 2000, annual fees on the letters of credit range from 0.50% to 1.75%.
Interest payments were $4.3 million in 2000, $5.0 million in 1999 and $7.2 million in 1998.
Future gold and silver delivery commitments are summarized by year in note 17.
6. DEFERRED INCOME
| | 2000 | 1999 | ||||
|---|---|---|---|---|---|---|
| Modification of hedging contracts | $ | 39,336 | $ | 61,382 | ||
| Premiums received on gold and silver option contracts | 20,310 | 30,835 | ||||
| Other | 703 | 1,992 | ||||
| 60,349 | 94,209 | |||||
| Less current portion | 9,651 | 10,525 | ||||
| $ | 50,698 | $ | 83,684 | |||
Modification of hedging contracts
Gains and losses on the early termination or other restructuring of gold, silver and foreign currency hedging contracts are deferred until the formerly hedged items are recognized in earnings. These deferred gains (losses) are expected to be recognized as follows: $20.8 million in 2001, $30.7 million in 2002, $(2.3) million in 2003, $(8.1) million in 2004, $(0.9) million in 2005 and $(0.9) million thereafter.
Premiums received on gold and silver option contracts
Premiums received on gold and silver option contracts sold are deferred and recognized in earnings on the option expiration dates. These deferred premiums are expected to be recognized as follows: $9.7 million in 2001, $1.4 million in 2002, $1.4 million in 2003, $3.3 million in 2004, $3.4 million in 2005 and $1.1 million thereafter. Refer to note 4 for a discussion of the deferral of premiums paid on gold and silver option contracts purchased.
7. CAPITAL SECURITIES
In 1997, the Company issued $100.0 million of 11% capital securities due in April 2027. The effective interest rate on the capital securities is 11%, or 12% compounded semi-annually during a period of interest deferral.
The Company has the right to defer interest payments on the capital securities for a period not to exceed 10 consecutive semi-annual periods. During a period of interest deferral, interest accrues at a rate of 12% per annum, compounded semi-annually, on the full principal amount and deferred interest. The Company, at its option, may satisfy its deferred interest obligation by delivering common shares to the indenture trustee for the capital securities. The trustee would sell the Company's shares and remit the proceeds to the holders of the securities in payment of the deferred interest obligation. Deferred interest obligations not settled with proceeds from the sale of shares remain an unsecured liability of the Company. Since April 1998, the Company has exercised its right to defer its interest payments to holders of the capital securities. Interest deferred to date amounts to $43.1 million at December 31, 2000 and is payable no later than April 1, 2003 together with any additional compounded or deferred interest up to that date. Although the Company has the contractual right to issue shares in settlement of this obligation, market conditions in 2003 will determine the Company's ability to settle through the delivery and sale of common shares. The present value of the capital securities' principal amount, $5.8 million, has been classified as debt within gold and other financings (note 5). The present value of the future interest payments of $94.2 million plus deferred accrued interest has been classified within a separate component of shareholders' equity as the Company has the unrestricted ability to settle the future interest payments by issuing its own common shares to the trustee for sale. Interest on the debt portion of the capital securities has been classified as interest expense on the consolidated statement of earnings, and interest on the equity portion of the capital securities has been charged directly to deficit on the consolidated balance sheet. For purposes of per share calculations, interest on the equity portion decreases the earnings attributable to common shareholders. See note 14 for a discussion of differences in treatment of the capital securities under generally accepted accounting principles in the United States.
8. OTHER LONG-TERM OBLIGATIONS
| | 2000 | 1999 | |||||
|---|---|---|---|---|---|---|---|
| Accrued reclamation and mine closure: | |||||||
| Round Mountain | $ | 10,659 | $ | 8,177 | |||
| McCoy/Cove | 19,284 | 19,469 | |||||
| Lupin | 8,280 | 6,518 | |||||
| Kettle River | 8,620 | 6,808 | |||||
| Sunnyside | 4,702 | 5,763 | |||||
| Other | — | 1,014 | |||||
| 51,546 | 47,749 | ||||||
| Other | — | 4,302 | |||||
| 51,546 | 52,051 | ||||||
| Less current portion included in accounts payable and accrued liabilities | 1,914 | 4,204 | |||||
| $ | 49,632 | $ | 47,847 | ||||
At December 31, 2000, the Company's estimate of future reclamation and mine closure costs is $73.2 million, which it believes will meet current regulatory requirements. The aggregate obligation accrued to December 31, 2000 was $51.5 million, including accruals of $10.6 million in 2000, $7.0 million in 1999, and $6.3 million in 1998. The remaining $21.7 million, including $9.9 million at Round Mountain, $9.8 million at Lupin and $2.0 million at Kettle River, will be accrued on the unit-of-production method over the remaining life of each mine. Assumptions used to estimate reclamation and mine closure costs are based on the work that is required under currently applicable permits, laws and regulations. These estimates may change based on future changes in operations, cost of reclamation activities and regulatory requirements.
9. INTEREST AND OTHER
| | 2000 | 1999 | 1998 | |||||||
|---|---|---|---|---|---|---|---|---|---|---|
| Interest income | $ | (964 | ) | $ | (166 | ) | $ | (328 | ) | |
| Interest expense | 5,194 | 4,723 | 5,559 | |||||||
| Alaska-Juneau reclamation | (2,048 | ) | — | — | ||||||
| Unrealized loss on share investments | 28 | 1,508 | 3,013 | |||||||
| (Gain) loss on sale of share investments | (181 | ) | (485 | ) | 962 | |||||
| Gain on sale of plant and equipment | (251 | ) | (251 | ) | (1,457 | ) | ||||
| Other | 1,234 | 2,865 | 4,096 | |||||||
| $ | 3,012 | $ | 8,194 | $ | 11,845 | |||||
10. LOSS (GAIN) ON SALE OF INTERESTS IN MINING AND OTHER PROPERTIES
| | 2000 | 1999 | 1998 | |||||||
|---|---|---|---|---|---|---|---|---|---|---|
| Loss on sale of interest in Paredones Amarillos | $ | — | $ | 13,795 | $ | — | ||||
| Gain on sale of investment in Santa Elina | — | — | (6,252 | ) | ||||||
| Gain on sale of interests in other mining properties | — | — | (1,195 | ) | ||||||
| $ | — | $ | 13,795 | $ | (7,447 | ) | ||||
Loss on sale of interest in Paredones Amarillos
The Company agreed in 1999 to sell its 60% interest in the Paredones Amarillos project in Mexico to its joint venture partner. In return, the Company received full ownership of a mill owned by the joint venture, valued at $2.5 million, and a 2% net profits royalty related to Paredones Amarillos production, capped at $2.0 million. The joint venture partner assumed all project liabilities. In 1999, the Company recognized a loss on the sale of Paredones Amarillos of $13.8 million.
Gain on sale of investment in Santa Elina
In 1998, the Company sold its investment in Santa Elina, which had no book value, for $6.3 million in cash, net of selling costs, and a 48.1% interest in the Chapada exploration property in Brazil, to which the Company assigned no book value. The Company realized no gain when it sold the Chapada property in the second quarter of 1999.
11. INCOME TAX EXPENSE
The geographic components of earnings before income tax expense and income tax expense were as follows.
| | 2000 | 1999 | 1998 | ||||||||
|---|---|---|---|---|---|---|---|---|---|---|---|
| Earnings (loss) before income taxes: | |||||||||||
| Canada | $ | 637 | $ | (22,386 | ) | $ | (23,471 | ) | |||
| United States and other | 16,176 | (14,670 | ) | 3,702 | |||||||
| $ | 16,813 | $ | (37,056 | ) | $ | (19,769 | ) | ||||
| Current income tax expense: | |||||||||||
| Canada | $ | 201 | $ | 216 | $ | 354 | |||||
| United States and other | 451 | — | — | ||||||||
| 652 | 216 | 354 | |||||||||
| Deferred income tax expense (recovery): | |||||||||||
| Canada | (2,400 | ) | — | — | |||||||
| United States and other | — | — | — | ||||||||
| (2,400 | ) | — | — | ||||||||
| Income tax expense (recovery) | $ | (1,748 | ) | $ | 216 | $ | 354 | ||||
The effective tax rate on the Company's earnings differed from the combined Canadian federal and provincial corporate income tax rates of 43.2% for 2000 and 43.5% for 1999 and 43.2% for 1998 for the following reasons.
| | 2000 | 1999 | 1998 | ||||||||
|---|---|---|---|---|---|---|---|---|---|---|---|
| Earnings (loss) before income taxes | $ | 16,813 | $ | (37,056 | ) | $ | (19,769 | ) | |||
| Income tax effect of: | |||||||||||
| Expected Canadian federal and provincial corporate income taxes | $ | 7,246 | $ | (16,115 | ) | $ | (8,540 | ) | |||
| Utilization of net operating loss | (5,760 | ) | (838 | ) | — | ||||||
| Operating loss from which no tax benefit is derived | — | — | 12,720 | ||||||||
| Canadian resource allowance and earned depletion | 113 | (2,153 | ) | (2,349 | ) | ||||||
| Foreign earnings subject to different income tax rates | (1,326 | ) | 18,182 | (1,687 | ) | ||||||
| Other items | (2,021 | ) | 1,140 | 210 | |||||||
| Income tax expense (recovery) | $ | (1,748 | ) | $ | 216 | $ | 354 | ||||
| Effective tax rate (current and deferred) | (10.4% | ) | (0.6% | ) | (1.8% | ) | |||||
At December 31, 2000, the Company had U.S. net operating loss carryforwards of approximately $409 million to apply against future taxable income and $212 million to apply against future alternative minimum taxable income. These loss carryforwards do not include the provisions for impaired assets, which have not yet been recognized fully for income tax purposes. The net operating loss carryforwards expire at various times from 2001 to 2020. Additionally, the Company has Canadian non-capital loss carryforwards of approximately $64 million and net capital loss carryforwards of approximately $208 million. The non-capital loss carryforwards expire at various times from 2003 to 2007. The net capital loss carryforwards have no expiration date.
Deferred tax liabilities and assets
Significant components of the Company's deferred tax liabilities and assets are as follows.
| | 2000 | 1999 | ||||||||||||||||||
|---|---|---|---|---|---|---|---|---|---|---|---|---|---|---|---|---|---|---|---|---|
| millions of U.S. dollars | Canada | U.S. and other | Total | Canada | U.S. and other | Total | ||||||||||||||
| Deferred tax liabilities: | ||||||||||||||||||||
| Tax over book depreciation and depletion | $ | 6.4 | $ | — | $ | 6.4 | $ | 10.3 | $ | — | $ | 10.3 | ||||||||
| Other tax liabilities | 5.3 | 0.8 | 6.1 | 8.0 | 0.7 | 8.7 | ||||||||||||||
| Total deferred tax liabilities | 11.7 | 0.8 | 12.5 | 18.3 | 0.7 | 19.0 | ||||||||||||||
| Deferred tax assets: | ||||||||||||||||||||
| Net operating loss and other carryforwards | 117.2 | 145.0 | 262.2 | 37.3 | 135.4 | 172.7 | ||||||||||||||
| Book over tax depreciation and depletion | 34.5 | 13.2 | 47.7 | 36.2 | 16.3 | 52.5 | ||||||||||||||
| Accrued liabilities | 4.7 | 19.8 | 24.5 | 4.3 | 25.9 | 30.2 | ||||||||||||||
| Other tax assets | 9.2 | 4.7 | 13.9 | 21.0 | 4.7 | 25.7 | ||||||||||||||
| Total deferred tax assets before allowance | 165.6 | 182.7 | 348.3 | 98.8 | 182.3 | 281.1 | ||||||||||||||
| Valuation allowance for deferred tax assets | (158.6 | ) | (181.9 | ) | (340.5 | ) | (87.9 | ) | (181.6 | ) | (269.5 | ) | ||||||||
| Total deferred tax assets | 7.0 | 0.8 | 7.8 | 10.9 | 0.7 | 11.6 | ||||||||||||||
| Net deferred tax liabilities | $ | 4.7 | $ | — | $ | 4.7 | $ | 7.4 | $ | — | $ | 7.4 | ||||||||
The net increase in the valuation allowance for deferred tax assets was $71.0 million for 2000 and $1.7 million for 1999.
Income tax payments were $0.2 million in 2000, $0.2 million in 1999 and $1.6 million in 1998.
12. PREFERRED SHARES
The Company is authorized to issue an unlimited number of preferred shares, issuable in series. Each series is to consist of such number of shares and to have such designation, rights, privileges, restrictions and conditions as may be determined by the directors. No preferred shares are currently issued.
13. COMMON SHARES
Changes in the number of common shares outstanding during the three years ended December 31, 2000 were as follows.
| | Number of Shares | Amount | |||
|---|---|---|---|---|---|
| Balance, December 31, 1997 | 139,370,031 | $ | 709,593 | ||
| 1998 Issuance of shares | 1,237,114 | 3,750 | |||
| Balance, December 31, 1998, 1999 and 2000 | 140,607,145 | $ | 713,343 | ||
The Company has not paid dividends since 1996 and is prohibited from paying common share dividends during a period of interest deferral related to the capital securities (note 7).
The Company's shareholders rights plan was not renewed by the shareholders of the Company at the annual meeting in May 2000 and the plan expired at that time.
Effective February 1997, the Company adopted a restricted share grant plan to provide incentive to officers of the Company. The Company has reserved an aggregate of 750,000 common shares for issuance under the plan, but no grants are outstanding. The vesting of any shares, which may be granted under this plan, is at the discretion of the Compensation Committee of the Board of Directors.
Employee Share Incentive Plan and Director Equity Plan
These plans provide for the granting of options to purchase common shares to officers and employees (under the employee share incentive plan) and to eligible directors (under the director equity plan). Outstanding share options under the plans are exercisable at prices equal to the market value on the date of grant. The option holder may exercise each share option over a period of 10 years from the date of grant. Options generally vest in 25% increments on the first, second, third and fourth year anniversaries following the grant date. Option prices are denominated in Canadian dollars. No more grants are to be made under the director equity plan.
Changes in the number of options outstanding during the three years ended December 31, 2000 were as follows.
| | Employee Share Incentive Plan | Director Equity Plan | |||||||||
|---|---|---|---|---|---|---|---|---|---|---|---|
| | Number of Shares | Weighted Average Exercise Price | Number of Shares | Weighted Average Exercise Price | |||||||
| Options outstanding, December 31, 1997 | 4,992,119 | C$ | 11.60 | 194,950 | C$ | 12.87 | |||||
| 1998: Options granted | 857,906 | 3.59 | 45,500 | 3.70 | |||||||
| Options expired | (78,700 | ) | 9.75 | — | — | ||||||
| Options forfeited | (794,005 | ) | 10.35 | — | — | ||||||
| Options outstanding, December 31, 1998 | 4,977,320 | C$ | 10.44 | 240,450 | C$ | 11.14 | |||||
| 1999: Options granted | 1,170,000 | 2.55 | — | — | |||||||
| Options expired | (34,937 | ) | 9.75 | — | — | ||||||
| Options forfeited | (618,697 | ) | 9.94 | — | — | ||||||
| Options outstanding, December 31, 1999 | 5,493,686 | C$ | 8.82 | 240,450 | C$ | 11.14 | |||||
| 2000: Options granted | — | — | — | — | |||||||
| Options expired | (100,458 | ) | 12.88 | — | — | ||||||
| Options forfeited | (1,021,417 | ) | 8.92 | (13,000 | ) | 5.85 | |||||
| Options outstanding, December 31, 2000 | 4,371,811 | C$ | 8.71 | 227,450 | C$ | 11.44 | |||||
The number of shares reserved for future grants at December 31, 2000 are 5,240,691 under the Employee Share Incentive Plan. The number and weighted average price of shares exercisable under the Employee Share Incentive Plan are 3,389,484 at C$10.41 at December 31, 2000; 3,521,787 at C$11.66 at December 31, 1999; and 3,352,269 at C$12.29 at December 31, 1998. The number and weighted average price of shares exercisable under the Director Equity Plan are 196,575 at C$12.40 at December 31, 2000; 171,575 at C$12.73 at December 31, 1999; and 123,825 at C$13.69 at December 31, 1998.
Options outstanding at December 31, 2000 had the following characteristics.
| Number of Shares Outstanding | Exercise Price Range | Weighted Average Exercise Price of Shares Outstanding | Weighted Average Years Until Expiration | Number of Shares Exercisable | Weighted Average Exercise Price of Shares Exercisable | |||||||
|---|---|---|---|---|---|---|---|---|---|---|---|---|
| Employee Share Incentive Plan | ||||||||||||
| 1,510,077 | C$2.55 – C$3.59 | C$ | 2.95 | 8 | 527,750 | C$ | 3.13 | |||||
| 1,147,473 | 5.75 – 8.88 | 8.02 | 4 | 1,147,473 | 8.02 | |||||||
| 1,213,605 | 10.70 – 15.75 | 13.13 | 5 | 1,213,605 | 13.13 | |||||||
| 500,656 | 16.25 – 19.63 | 16.95 | 4 | 500,656 | 16.95 | |||||||
| Director Equity Plan | ||||||||||||
| 84,500 | C$3.70 – C$8.00 | C$ | 6.02 | 7 | 53,625 | C$ | 6.44 | |||||
| 142,950 | 12.50 – 18.25 | 14.64 | 4 | 142,950 | 14.64 | |||||||
14. DIFFERENCES BETWEEN CANADIAN AND U.S. GENERALLY ACCEPTED ACCOUNTING PRINCIPLES (GAAP)
U.S. GAAP financial statements
The Company prepares its consolidated financial statements in accordance with accounting principles generally accepted in Canada, which differ in some respects from those in the United States, as described below.
In accordance with Canadian GAAP, the present value of the principal amount of the capital securities issued in 1997 is classified as debt within gold and other financings, while the present value of the future interest payments is classified as a separate component of shareholders' equity (note 7). The deferred accrued interest is classified within this equity component as the Company has the option to satisfy the deferred interest by delivering common shares. The related issuance costs were allocated proportionately to deferred financing charges and retained earnings based on the debt and equity classifications. Interest on the capital securities has been allocated proportionately to interest expense and deficit based on the debt and equity classifications. Under U.S. GAAP, the face value of the securities would be classified entirely as debt within gold and other financings; the related issuance costs would be classified as deferred financing charges within long-term investments and other assets and would be amortized to interest expense over the life of the securities; and the interest on the capital securities would be classified entirely as interest expense.
In accordance with Canadian GAAP, certain long-term foreign exchange contracts are considered to be hedges of the cost of goods to be purchased in foreign currencies in future periods. Gains and losses related to changes in market values of such contracts are recognized as a component of the cost of goods when the related hedged purchases occur. In 2000, the Company recognized $3.1 million in deferred foreign exchange gains. Under U.S. GAAP, foreign exchange contracts would be carried at market value and changes included in current earnings.
In accordance with Canadian GAAP, the Company's short-term share investments are carried at the lower of cost or market based on quoted market prices. Under U.S. GAAP, these investments would have been marked to market, with unrealized gains or losses excluded from earnings and reported as accumulated other comprehensive income in shareholders' equity, net of tax.
At December 31, 2000, the Company had 105,000 ounces of gold call options sold with a strike price of $340 per ounce. The Company sold these call options in 1999 to enhance prices on certain of its gold forward contracts. The Company has limited the potential loss on these call options to $60 per ounce if the spot price of gold rises above $340 per ounce by purchasing 105,000 ounces of gold call options at a strike price of $400 per ounce. In accordance with U.S. GAAP, the 105,000 ounces of gold call options sold would not qualify for hedge accounting and therefore would be marked to market at December 31, 2000. As a result, the Company has recorded an unrealized gain on gold call options sold of $3.0 million in 2000 and an unrealized loss of $2.1 million in 1999 under U.S. GAAP.
In accordance with Canadian GAAP, capitalized mine development costs include expenditures incurred to develop new ore bodies, to define further mineralization in existing ore bodies and to expand the capacity of operating mines. The Company capitalized development costs of $1.1 million in 2000 and $0.1 million in 1999 for the extension to the K-2 deposit at the Kettle River mine. Under U.S. GAAP development costs are capitalized only when converting mineralized material to reserves or for further delineation of existing reserves. The development expenditures resulted in additions to mineralized material but did not add to ore reserves. Therefore under U.S. GAAP the expenditures would be classified as exploration expense.
In accordance with Canadian GAAP, deferred mining costs have been included in mining properties. The recoverability of deferred mining costs are evaluated for impairment with other long-lived assets when events or changes in circumstances indicate that the related carrying amounts may not be recoverable. Under U.S. GAAP deferred mining costs would be classified separately from mining properties as other assets and their recoverability is evaluated when necessary by reference to estimated future net cash flows from mining operations prior to the evaluation of mining properties.
In accordance with Canadian GAAP, the capitalization and amortization of deferred mining costs are reported as investing activities on the statements of cash flow. Under U.S. GAAP, these expenditures would be reported as operating activities. Therefore, "cash provided from operating activities" and cash used in "investing activities" under U.S. GAAP would increase by $4.2 million in 2000 and decrease by $8.1 and $2.0 million in 1999 and 1998, respectively.
In accordance with Canadian GAAP, the severance costs associated with the temporary suspension of operations at Lupin were recognized on the commitment date (generally defined as the date the severance plan is established and approved by management) which occurred in 1997. Conditions for recognizing involuntary termination benefits under U.S. GAAP include similar criteria as Canadian GAAP. Additionally, however, the benefit arrangement must also have been communicated to employees. As the Lupin severance activities were not communicated to employees prior to December 31, 1997, under U.S. GAAP the related costs would be recognized in 1998.
The effects on the consolidated statement of earnings of the above differences would have been as follows.
| | 2000 | 1999 | 1998 | |||||||
|---|---|---|---|---|---|---|---|---|---|---|
| Net earnings (loss) under Canadian GAAP | $ | 18,561 | $ | (37,272 | ) | $ | (20,123 | ) | ||
| Additional interest expense on capital securities | (15,397 | ) | (13,697 | ) | (12,432 | ) | ||||
| Change in market value of foreign exchange contracts | 948 | 5,540 | (2,640 | ) | ||||||
| Amortization of deferred foreign exchange gains | (3,149 | ) | — | — | ||||||
| Unrealized loss on short-term investments | 28 | — | — | |||||||
| Unrealized gain/(loss) on gold call options sold | 2,964 | (2,146 | ) | — | ||||||
| Amortization of deferred financing costs on capital securities | (633 | ) | (633 | ) | (633 | ) | ||||
| Kettle River exploration expense | (1,066 | ) | (108 | ) | — | |||||
| Recognition of severance expense | — | — | (4,980 | ) | ||||||
| Net earnings (loss) under U.S. GAAP | $ | 2,256 | $ | (48,316 | ) | $ | (40,808 | ) | ||
| Earnings (loss) per share under U.S. GAAP | $ | 0.02 | $ | (0.34 | ) | $ | (0.29 | ) | ||
The effects of the GAAP differences on the consolidated balance sheet would have been as follows.
| December 31, 2000 | Canadian GAAP | Capital Securities | Mining Properties | Other | U.S. GAAP | |||||||||||
|---|---|---|---|---|---|---|---|---|---|---|---|---|---|---|---|---|
| Short-term investments | $ | 2,186 | $ | — | $ | — | $ | 760 | $ | 2,946 | ||||||
| Property, plant and equipment | 202,026 | — | (22,982 | ) | — | 179,044 | ||||||||||
| Long-term investments and other assets | 20,868 | 792 | 21,808 | — | 43,468 | |||||||||||
| Gold and other financings | 32,532 | 96,968 | — | — | 129,500 | |||||||||||
| Deferred income | 60,349 | — | — | (2,846 | ) | 57,503 | ||||||||||
| Other long-term obligations | 49,632 | 43,108 | — | (533 | ) | 92,207 | ||||||||||
| Common shares | 713,343 | — | — | 36,428 | 749,771 | |||||||||||
| Capital securities | 140,076 | (140,076 | ) | — | — | — | ||||||||||
| Deficit | 711,680 | (792 | ) | 1,174 | 33,021 | 745,083 | ||||||||||
| Shareholders' equity (deficit) | 116,785 | (139,284 | ) | (1,174 | ) | 4,139 | (19,534 | ) | ||||||||
| December 31, 1999 | Canadian GAAP | Capital Securities | Mining Properties | Other | U.S. GAAP | |||||||||||
|---|---|---|---|---|---|---|---|---|---|---|---|---|---|---|---|---|
| Property, plant and equipment | $ | 249,397 | $ | — | $ | (26,110 | ) | $ | — | $ | 223,287 | |||||
| Long-term investments and other assets | 29,255 | 1,425 | 26,002 | — | 56,682 | |||||||||||
| Gold and other financings | 56,669 | 97,581 | — | — | 154,250 | |||||||||||
| Deferred income | 93,899 | — | — | (5,995 | ) | 87,904 | ||||||||||
| Other long-term obligations | 47,847 | 27,035 | — | 3,379 | 78,261 | |||||||||||
| Common shares | 713,343 | — | — | 36,428 | 749,771 | |||||||||||
| Capital securities | 124,616 | (124,616 | ) | — | — | — | ||||||||||
| Deficit | 714,844 | (1,425 | ) | 108 | 33,812 | 747,339 | ||||||||||
| Shareholders' equity (deficit) | 101,101 | (123,191 | ) | (108 | ) | 2,616 | (19,582 | ) | ||||||||
The continuity of shareholders' equity from December 31, 1999 to December 31, 2000 under U.S. GAAP would have been as follows.
| | 2000 | |||
|---|---|---|---|---|
| Balance, beginning of year | $ | (19,582 | ) | |
| Net earnings | 2,256 | |||
| Unrealized gain on short-term investments | 732 | |||
| Foreign currency translation | (2,940 | ) | ||
| Balance, end of year | $ | (19,534 | ) | |
The following statement of comprehensive income (loss) would be disclosed in accordance with U.S. GAAP.
| | 2000 | 1999 | 1998 | ||||||||
|---|---|---|---|---|---|---|---|---|---|---|---|
| Net earnings (loss) under U.S. GAAP | $ | 2,256 | $ | (48,316 | ) | $ | (40,808 | ) | |||
| Other comprehensive income (loss), after a nil income tax effect: | |||||||||||
| Unrealized gain (loss) arising during period | 732 | — | — | ||||||||
| Foreign currency translation adjustments | (2,940 | ) | 4,562 | (6,211 | ) | ||||||
| Other comprehensive income (loss) | (2,208 | ) | 4,562 | (6,211 | ) | ||||||
| Comprehensive income (loss) | $ | 48 | $ | (43,754 | ) | $ | (47,019 | ) | |||
Additionally, under U.S. GAAP, the equity section of the balance sheet would present a subtotal for accumulated other comprehensive loss, as follows.
| | 2000 | 1999 | |||||
|---|---|---|---|---|---|---|---|
| Unrealized gain/(loss) on share investments | $ | 732 | $ | — | |||
| Foreign currency translation | (24,954 | ) | (22,014 | ) | |||
| Accumulated other comprehensive loss | $ | (24,222 | ) | $ | (22,014 | ) | |
FASB Statement No. 123, "Accounting for Stock-Based Compensation," gives the option to either follow fair value accounting or to follow Accounting Principles Board Opinion No. 25, "Accounting for Stock Issued to Employees" ("APB No. 25") and related Interpretations. The Company has determined that it will elect to continue to follow APB No. 25 and related Interpretations in accounting for its employee and director stock options in financial information prepared in conformity with U.S. GAAP.
In accordance with Canadian GAAP and U.S. GAAP (under APB No. 25), the Company does not recognize compensation expense for stock option grants in the earnings statement, as the market prices of the underlying stock on the grant dates do not exceed the exercise prices of the options granted.
Had the Company adopted Statement No. 123 for its U.S. GAAP disclosure, the following net earnings and losses would have been reported.
| | 2000 | 1999 | 1998 | |||||||
|---|---|---|---|---|---|---|---|---|---|---|
| Net earnings (loss) under U.S. GAAP | $ | 2,256 | $ | (48,316 | ) | $ | (40,808 | ) | ||
| Pro forma stock compensation expense, after a nil income tax effect | (929 | ) | (1,845 | ) | (1,654 | ) | ||||
| Pro forma net earnings (loss) under U.S. GAAP | $ | 1,327 | $ | (50,161 | ) | $ | (42,462 | ) | ||
| Pro forma earnings (loss) per share under U.S. GAAP | $ | 0.01 | $ | (0.36 | ) | $ | (0.30 | ) | ||
The Company has utilized the Black-Scholes option valuation model to estimate the fair value of options granted, assuming a weighted average option life of 6 years, risk-free interest rates ranging from 4.87% to 6.64%, dividend yields ranging from nil to 1% and volatility factors of 50% for 1999 grants and 40% for 1998, 1997 and 1996 grants. The weighted average fair value of options granted is estimated at $1.08 per share in 1999 and $1.27 per share in 1998.
Derivative instruments and hedging activities
In 1998, the FASB issued Statement No. 133, "Accounting for Derivative Instruments and Hedging Activities," and in 2000, Statement No. 138 "Accounting for Certain Derivative Instruments and Certain Hedging Activities" effective for fiscal quarters of fiscal years beginning after June 15, 2000 (January 1, 2001 for the Company). The statement requires all derivative instruments to be recognized at fair value on the balance sheet. The changes in fair value are accounted for through earnings unless the instrument qualifies for special hedge accounting treatment. The Company enters into contracts to reduce the risk of changes in the price of gold and silver. The majority of these contracts are forward sales that qualify for exemption from Statement No. 133 under the normal purchase and sales provision. Upon implementation, all derivative instruments held by the Company that do not qualify for the normal purchase and sale exemption would be recognized at fair value on the balance sheet with changes in fair value recorded in earnings. Gains and losses on the early termination or other restructuring of gold, silver and foreign currency hedging contracts would be deferred in accumulated other comprehensive income until the formerly hedged items are recorded in earnings. The transition adjustment recorded under U.S. GAAP at January 1, 2001 would have decreased assets by $11.5 million and liabilities by $48.6 million, offset by increases to accumulated other comprehensive income of $36.0 million and net earnings of $1.1 million.
The estimated fair values of cash and cash equivalents, short-term investments and currency loans approximate their book values. The fair values were determined from quoted market prices or estimated using discounted cash flow analysis. See note 17 for further disclosure regarding estimated fair values of financial instruments.
15. JOINT VENTURES
Summarized below is the Company's 50% interest in the Round Mountain mine, accounted for by the proportionate consolidation method.
| | 2000 | 1999 | 1998 | |||||||
|---|---|---|---|---|---|---|---|---|---|---|
| Revenues | $ | 90,633 | $ | 87,469 | $ | 87,748 | ||||
| Expenses: | ||||||||||
| Operating costs | 60,231 | 52,880 | 51,359 | |||||||
| Royalties | 5,585 | 5,021 | 5,078 | |||||||
| Production taxes | 470 | 57 | 654 | |||||||
| Depreciation and amortization | 18,978 | 17,704 | 16,274 | |||||||
| Reclamation and mine closure | 2,881 | 2,438 | 1,787 | |||||||
| Exploration | 529 | 431 | 613 | |||||||
| Other | (753 | ) | 753 | 3,281 | ||||||
| Earnings before income taxes | $ | 2,712 | $ | 8,185 | $ | 8,702 | ||||
| | 2000 | 1999 | 1998 | |||||||
|---|---|---|---|---|---|---|---|---|---|---|
| Current assets | $ | 33,424 | $ | 33,105 | $ | 69,461 | ||||
| Non-current assets | 109,212 | 126,611 | 120,956 | |||||||
| Current liabilities | (11,244 | ) | (10,667 | ) | (9,370 | ) | ||||
| Non-current liabilities | (18,395 | ) | (18,845 | ) | (19,965 | ) | ||||
| Equity | $ | 112,997 | $ | 130,204 | $ | 161,082 | ||||
| | 2000 | 1999 | 1998 | ||||||||
|---|---|---|---|---|---|---|---|---|---|---|---|
| Net cash provided from (used in): | |||||||||||
| Operating activities | $ | 11,260 | $ | 9,108 | $ | 16,286 | |||||
| Investing activities | (5,075 | ) | (12,799 | ) | (12,438 | ) | |||||
| Financing activities | — | — | — | ||||||||
| Net increase (decrease) in cash | $ | 6,185 | $ | (3,691 | ) | $ | 3,848 | ||||
16. SEGMENT INFORMATION
The Company's management regularly evaluates the performance of the Company by reviewing operating results on a minesite by minesite basis. As such, the Company considers each producing minesite to be an operating segment. In 2000 and 1999, the Company had three operating mines in the United States: Round Mountain and McCoy/Cove in Nevada; and Kettle River in Washington. In 2000, the Company recommenced operations at its Lupin mine in the Nunavut Territory, Canada. All are 100% owned except for Round Mountain, which is 50% owned.
The Company's management generally monitors revenues on a consolidated basis. Information regarding the Company's consolidated revenues is provided below.
| | 2000 | 1999 | 1998 | ||||||
|---|---|---|---|---|---|---|---|---|---|
| Total gold and silver revenues | $ | 280,976 | $ | 210,351 | $ | 232,181 | |||
| Average gold price realized per ounce | $ | 319 | $ | 325 | $ | 333 | |||
| Average silver price realized per ounce | $ | 5.28 | $ | 5.69 | $ | 5.88 | |||
In making operating decisions and allocating resources, the Company's management specifically focuses on the production levels and cash operating costs generated by each operating segment, as summarized in the following tables.
| Gold production (ounces) | 2000 | 1999 | 1998 | |||
|---|---|---|---|---|---|---|
| Round Mountain (50%) | 320,064 | 270,904 | 255,252 | |||
| McCoy/Cove | 162,784 | 124,536 | 167,494 | |||
| Lupin | 117,729 | — | — | |||
| Kettle River | 94,086 | 104,396 | 113,692 | |||
| Total gold | 694,663 | 499,836 | 536,438 | |||
| Silver Production (ounces) | 2000 | 1999 | 1998 | |||
|---|---|---|---|---|---|---|
| Total silver—all from McCoy/Cove | 12,328,297 | 8,430,072 | 9,412,823 | |||
| Operating costs | 2000 | 1999 | 1998 | ||||||
|---|---|---|---|---|---|---|---|---|---|
| Round Mountain (50%) | $ | 60,501 | $ | 53,055 | $ | 51,502 | |||
| McCoy/Cove | 69,920 | 63,429 | 66,606 | ||||||
| Lupin | 22,883 | — | 1,645 | ||||||
| Kettle River | 20,131 | 23,332 | 29,016 | ||||||
| Total operating costs per financial statements | $ | 173,435 | $ | 139,816 | $ | 148,769 | |||
| Royalties | 2000 | 1999 | 1998 | ||||||
|---|---|---|---|---|---|---|---|---|---|
| Round Mountain (50%) | $ | 5,585 | $ | 5,021 | $ | 5,078 | |||
| McCoy/Cove | 1,228 | 644 | 1,092 | ||||||
| Kettle River | 1,221 | 1,532 | 1,377 | ||||||
| Total operating costs per financial statements | $ | 8,034 | $ | 7,197 | $ | 7,547 | |||
| Depreciation and amortization | 2000 | 1999 | 1998 | ||||||
|---|---|---|---|---|---|---|---|---|---|
| Round Mountain (50%) | $ | 18,978 | $ | 17,704 | $ | 16,274 | |||
| McCoy/Cove | 21,539 | 22,743 | 29,034 | ||||||
| Lupin | 4,874 | 5,381 | 6,233 | ||||||
| Kettle River | 1,637 | 6,141 | 9,315 | ||||||
| Depreciation of non-minesite assets | 3,636 | 2,972 | 2,430 | ||||||
| Total operating costs per financial statements | $ | 50,664 | $ | 54,941 | $ | 63,286 | |||
| Total assets | 2000 | 1999 | ||||
|---|---|---|---|---|---|---|
| Round Mountain (50%) | $ | 121,592 | $ | 127,435 | ||
| McCoy/Cove | 42,354 | 63,521 | ||||
| Lupin | 34,860 | 33,983 | ||||
| Kettle River | 10,101 | 9,398 | ||||
| Aquarius | 48,437 | 51,589 | ||||
| Non-minesite assets | 38,501 | 53,936 | ||||
| Total assets | $ | 295,845 | $ | 339,862 | ||
Capital expenditures by minesite are as follows.
| Millions of U.S. dollars | 2000 | 1999 | 1998 | ||||||
|---|---|---|---|---|---|---|---|---|---|
| Round Mountain (50%) | $ | 4.6 | $ | 7.7 | $ | 12.6 | |||
| McCoy/Cove | 0.6 | 1.1 | 1.3 | ||||||
| Lupin | 4.7 | — | — | ||||||
| Kettle River | 1.4 | 0.4 | 1.5 | ||||||
Financial information regarding geographic areas is set out below.
| | 2000 | 1999 | 1998 | |||||||
|---|---|---|---|---|---|---|---|---|---|---|
| Revenue: | ||||||||||
| Canada | $ | 44,370 | $ | — | $ | 11,360 | ||||
| United States | 236,606 | 210,351 | 220,821 | |||||||
| Total revenue | $ | 280,976 | $ | 210,351 | $ | 232,181 | ||||
| | 2000 | 1999 | 1998 | |||||||
|---|---|---|---|---|---|---|---|---|---|---|
| Assets: | ||||||||||
| Canada | $ | 100,310 | $ | 89,095 | $ | 92,457 | ||||
| United States | 193,431 | 247,653 | 267,843 | |||||||
| Other | 2,104 | 3,114 | 7,776 | |||||||
| Total assets | $ | 295,845 | $ | 339,862 | $ | 368,076 | ||||
17. HEDGING ACTIVITIES AND COMMITMENTS
The Company reduces the risk of future gold and silver price declines by hedging a portion of its production. The principal hedging tools used are gold and silver loans, fixed and floating forward sales contracts, spot-deferred contracts, swaps and options.
The Company assesses the exposure that may result from a hedging transaction prior to entering into the commitment, and only enters into transactions which it believes accurately hedge the underlying risk and could be safely held to maturity. The Company does not engage in the practice of trading derivative securities for profit. The Company regularly reviews its unrealized gains and losses on hedging transactions.
The credit risk exposure related to all hedging activities is limited to the unrealized gains on outstanding contracts based on current market prices. To reduce counterparty credit exposure, the Company deals only with large, credit-worthy financial institutions and limits credit exposure to each. In addition, the Company deals only in markets it considers highly liquid to allow for situations where positions may need to be reversed.
Margin deposits are required by certain of the Company's counterparties if the fair value of the hedge position is less than the predetermined margin threshold. The Company regularly reviews its margin risk and attempts to mitigate this risk by modifying its hedge position whenever market conditions allow. In 1999, the Company repurchased a significant portion of its gold and silver forward sales commitments and restructured its gold and silver option positions to better complement the new forward sales positions. The Company purchased call options with expiration dates that match the Company's forward sales commitments and call options sold and have strike prices ranging from $20 to $60 per ounce above the forward sales prices and call options sold strike prices. The quantity of call options purchased is equal to 70% of the Company's forward sales and call options sold in the years 2001 to 2005 and will allow the Company to participate in price rallies above the call option strike prices while reducing the Company's margin risk related to these commitments. A similar strategy has been implemented for the Company's silver hedge position. The gains and losses on the repurchases have been deferred and will be recognized in revenue as the formerly hedged gold and silver is sold (notes 4 and 6).
The Company's hedge contracts require the Company to pay the three-month gold lease rate on 255,000 of its 320,000 ounces of forward sales and on 105,000 ounces of call options sold. The three-month gold lease rate was approximately 0.81% at the end of 2000. The gold lease payments are made on a quarterly basis. For accounting purposes, the amounts are being deferred and recognized in revenue as the hedged gold is sold. The Company has no floating silver lease rate contracts.
Gains and losses on the early termination or other restructuring of gold, silver and foreign currency hedging contracts are deferred until the formerly hedged items are recognized in earnings (note 6).
Premiums paid or received on gold and silver options contracts purchased or sold are deferred and recognized in earnings on the option expiration dates (notes 4 and 6).
At December 31, 2000, the Company had an obligation under foreign currency exchange contracts to purchase C$20.0 million in 2001 at an exchange rate of C$1.47 to U.S.$1.00.
The Company's gold and silver commitments at December 31, 2000 were as follows.
| | Gold | Silver | ||||||||
|---|---|---|---|---|---|---|---|---|---|---|
| | Forward Sales (ounces) | Price of Forward Sale (per ounce) | Forward Sales (ounces) | Price of Forward Sales (per ounce) | ||||||
| 2001 | 125,000 | $ | 312 | 1,500,000 | $ | 5.85 | ||||
| 2002 | 60,000 | 310 | — | — | ||||||
| 2003 | 60,000 | 310 | — | — | ||||||
| 2004 | 60,000 | 310 | — | — | ||||||
| 2005 | 15,000 | 310 | — | — | ||||||
| 320,000 | $ | 311 | 1,500,000 | $ | 5.85 | |||||
The Company's option position at December 31, 2000 was as follows.
| | Put Options Purchased | Put Options Sold | Call Options Purchased | Call Options Sold | ||||||||||||||||
|---|---|---|---|---|---|---|---|---|---|---|---|---|---|---|---|---|---|---|---|---|
| | Ounces | Strike Price per Ounce | Ounces | Strike Price per Ounce | Ounces | Strike Price per Ounce | Ounces | Strike Price per Ounce | ||||||||||||
| Gold | ||||||||||||||||||||
| 2001 | — | $ | — | — | $ | — | 105,000 | $ | 351 | — | $ | — | ||||||||
| 2002 | — | — | — | — | 60,000 | 360 | — | — | ||||||||||||
| 2003 | — | — | — | — | 60,000 | 360 | — | — | ||||||||||||
| 2004 | — | — | — | — | 60,000 | 360 | — | — | ||||||||||||
| 2005 | — | — | — | — | 120,000 | 395 | 105,000 | 340 | ||||||||||||
| — | $ | — | — | $ | — | 405,000 | $ | 368 | 105,000 | $ | 340 | |||||||||
| Silver | ||||||||||||||||||||
| 2001 | 1,000,000 | $ | 6.00 | 2,500,000 | $ | 4.75 | 1,500,000 | $ | 6.60 | — | $ | — | ||||||||
| 1,000,000 | $ | 6.00 | 2,500,000 | $ | 4.75 | 1,500,000 | $ | 6.60 | — | $ | — | |||||||||
Forward Sales contracts of 320,000 ounces of gold as well as the call options sold of 105,000 ounces of gold represent approximately 10% of the Company's reserves. This amount of future hedging is reduced from 2000. In 2000, 37% of gold production was delivered against forward sales contracts and put options. The reduced hedging position results from continued weakness in spot gold prices and low forward premiums resulting in lower hedge prices that can be achieved. The Company continues to monitor its hedging policy in light of forecasted production, operating and capital expenditures, exploration and development requirements and factors affecting gold price volatility.
Shown below are the carrying amounts and estimated fair values of the Company's other outstanding hedging instruments at December 31, 2000 and 1999.
| | | December 31, 2000 | December 31, 1999 | ||||||||||||
|---|---|---|---|---|---|---|---|---|---|---|---|---|---|---|---|
| | | Carrying Amount | Estimated Fair Value | Carrying Amount | Estimated Fair Value | ||||||||||
| Gold forward sales | $ | — | $ | 5,700 | $ | — | $ | (900 | ) | ||||||
| Silver forward sales | — | 1,800 | — | 1,000 | |||||||||||
| Gold options | — puts purchased | — | — | 1,400 | 1,700 | ||||||||||
| — calls sold | (3,000 | ) | (2,200 | ) | (4,100 | ) | (5,600 | ) | |||||||
| — puts sold | — | — | (1,300 | ) | (600 | ) | |||||||||
| — calls purchased | 6,800 | 2,400 | 9,100 | 8,000 | |||||||||||
| Silver options | — puts purchased | 1,200 | 1,400 | 2,500 | 1,400 | ||||||||||
| — puts sold | (1,300 | ) | (400 | ) | (2,200 | ) | (500 | ) | |||||||
| — calls purchased | 700 | — | 1,000 | 300 | |||||||||||
| Foreign currency contracts | — | (300 | ) | — | (1,200 | ) | |||||||||
| $ | 8,400 | $ | 3,600 | ||||||||||||
Fair values are estimated for the contract settlement dates based on market quotations of various input variables. These variables are used in valuation models that estimate the fair market value.
The fair value of the Company's hedged position can be affected by market conditions beyond the Company's control. The effect of changes in various market factors on the Company's outstanding hedged position at December 31, 2000 would be as follows.
| | Amount of Change | Effect on Market Value of Hedged Position | ||||
|---|---|---|---|---|---|---|
| Change in: | ||||||
| Gold prices | $10.00/ounce | $ | 3,200 | |||
| Silver prices | $0.25/ounce | $ | 300 | |||
| Interest rates (effect on gold and silver forward sales and options) | 1% | $ | 1,400 | |||
Hedging gains and losses represent the difference between spot or market prices and realized amounts. The hedging gains (losses) recognized in earnings are as follows.
| | 2000 | 1999 | 1998 | ||||||||
|---|---|---|---|---|---|---|---|---|---|---|---|
| Revenue: | |||||||||||
| Gold loans and swaps | $ | 1,289 | $ | 1,658 | $ | 3,096 | |||||
| Gold forward sales | 16,540 | 17,710 | 7,179 | ||||||||
| Silver forward sales | 3,297 | 3,439 | 3,118 | ||||||||
| Gold and silver options | 1,517 | 4,077 | 11,122 | ||||||||
| Operating costs: | |||||||||||
| Foreign currency contracts | (1,971 | ) | (3,068 | ) | (2,805 | ) | |||||
| Crude oil contracts | — | — | (636 | ) | |||||||
| $ | 20,672 | $ | 23,816 | $ | 21,074 | ||||||
18. OTHER COMMITMENTS AND CONTINGENCIES
Round Mountain mine production is subject to a net smelter return royalty ranging from 3.53% at gold prices of $320 per ounce or less to 6.35% at gold prices of $440 per ounce or more. Its production is also subject to a gross revenue royalty of 3.0%, reduced to 1.5% after $75.0 million has been paid.
McCoy/Cove production is subject to a 2% net smelter return royalty. This royalty is based on sales less certain deductions.
A portion of production from the Lamefoot area of the Kettle River mine is subject to a 5% net smelter return royalty. K-2 area production at Kettle River is subject to a 5% gross proceeds royalty and a net smelter return royalty ranging from 2% at gold prices of $300 per ounce or less to 3% at gold prices of $400 per ounce or more.
The Company's principal lease commitments are for equipment and office premises. The Company incurred $1.4 million in rental expense in 2000, net of $1.6 million in rental income related to office subleases. The Company's commitments under the remaining terms of the leases are approximately $9.6 million, payable as follows: $2.0 million in 2001, $2.0 million in 2002, $1.6 million in 2003, $1.5 million in 2004, $1.0 million in 2005 and $1.5 million thereafter.
In September 1992, the Summa Corporation commenced a lawsuit against Echo Bay Exploration Inc. and Echo Bay Management Corporation, indirect subsidiaries of the Company, alleging improper deductions in the calculation of royalties payable over several years of production at the McCoy/Cove and Manhattan mines. The matter was tried in the Nevada State Court in April 1997, with Summa claiming more than $13 million in damages, and, in September 1997, judgement was rendered for the Echo Bay companies. The decision was appealed by Summa to the Supreme Court of Nevada, which heard the matter on November 9, 1999.
On April 26, 2000, the Supreme Court of Nevada reversed the decision of the trial court and remanded the case back to the trial court for "a calculation of the appropriate [royalties] in a manner not inconsistent with this order". The case was decided by a panel comprised of three of the seven Justices of the Supreme Court of Nevada and the Echo Bay defendants petitioned that panel for a rehearing. The petition was denied by the three member panel on May 15, 2000 and remanded to the lower court for consideration of other defenses and arguments put forth by the Echo Bay defendants. The Echo Bay defendants filed a petition for a hearing before the full Court and on December 22, 2000, the Court recalled its previous decision. Both the Echo Bay defendants and their counsel believe that grounds exist to modify or reverse the decision. The Company has $1.6 million accrued related to the Summa litigation. If the appellate reversal of the trial decision is maintained and the trial court, on remand, were to dismiss all the Echo Bay defenses, the royalty calculation at McCoy/Cove would change and additional royalties would be payable.
On March 29, 2000 Handy & Harman Refining Group, Inc., which operated a facility used by the Company for the refinement of doré bars, filed for protection under Chapter 11 of the U.S. Bankruptcy Code. The outcome of these proceedings is uncertain at this time. The Company has gold and silver accounts at this refining facility with an estimated market value of approximately $2.4 million.
Certain of the Company's subsidiaries have provided corporate guarantees and other forms of security to regulatory authorities in connection with future reclamation activities. Early in 2001, regulators formally called upon two of the Company's subsidiaries to provide other security to replace corporate guarantees that had been given in respect of the Round Mountain and McCoy/Cove operations. The subsidiaries disagree with the regulators' position and believe that they qualify under the criteria set out for corporate guarantees and will oppose the regulatory decision. Although the outcome cannot be predicted, the Company and their counsel believe that the Company will prevail.
QUARTERLY FINANCIAL HIGHLIGHTS
(Unaudited)
(millions of U.S. dollars except per share data)
| | Revenue | Net Earnings (Loss) | Earnings (Loss) per Share | |||||||
|---|---|---|---|---|---|---|---|---|---|---|
| 2000 | ||||||||||
| First quarter | $ | 51.8 | $ | (2.7 | ) | $ | (0.04 | ) | ||
| Second quarter | 84.3 | 10.2 | 0.04 | |||||||
| Third quarter | 76.4 | 9.0 | 0.04 | |||||||
| Fourth quarter | 68.5 | 2.1 | (0.02 | ) | ||||||
| Total | $ | 281.0 | $ | 18.6 | $ | 0.02 | ||||
| 1999 | ||||||||||
| First quarter | $ | 48.8 | $ | (5.1 | ) | $ | (0.06 | ) | ||
| Second quarter | 50.9 | (7.0 | ) | (0.07 | ) | |||||
| Third quarter | 54.2 | (19.9 | ) | (0.17 | ) | |||||
| Fourth quarter | 56.5 | (5.3 | ) | (0.06 | ) | |||||
| Total | $ | 210.4 | $ | (37.3 | ) | $ | (0.36 | ) | ||
Net earnings (loss) and per share amounts include the loss on the sale of the Company's interest in Paredones Amarillos of $13.8 million in the third quarter of 1999. See note 10 to the consolidated financial statements.
ITEM 9—CHANGES IN AND DISAGREEMENTS WITH ACCOUNTANTS ON
ACCOUNTING AND FINANCIAL DISCLOSURE
None.
PART III
ITEM 10—DIRECTORS OF THE REGISTRANT
The information about the directors of the Company required by this item is located in the Echo Bay Mines Ltd. proxy statement to be filed within 120 days after the end of the fiscal year, and is incorporated herein by reference. Information about the executive officers of the Company required by this item appears in Part I of this Annual Report on Form 10-K.
ITEM 11—EXECUTIVE COMPENSATION
The information required by this item will appear in the Echo Bay Mines Ltd. proxy statement to be filed within 120 days after the end of the fiscal year, and is incorporated herein by reference.
ITEM 12—SECURITY OWNERSHIP OF CERTAIN BENEFICIAL OWNERS AND MANAGEMENT
The information required by this item will appear in the Echo Bay Mines Ltd. proxy statement to be filed within 120 days after the end of the fiscal year, and is incorporated herein by reference.
ITEM 13—CERTAIN RELATIONSHIPS AND RELATED TRANSACTIONS
The information required by this item will appear in the Echo Bay Mines Ltd. proxy statement to be filed within 120 days after the end of the fiscal year, and is incorporated herein by reference.
PART IV
ITEM 14—EXHIBITS, FINANCIAL STATEMENT SCHEDULES, AND REPORTS ON FORM 8-K
- (a)
- The following documents are filed as part of this report:
- 1.
- Financial Statements included in Part II, Item 8 Echo Bay Mines Ltd.
2. | Financial Statement Schedules included in Part IV | |
All schedules are omitted because they are not applicable or the required information is shown in the financial statements or notes thereto. | ||
3. | Exhibits required to be filed by Item 601 of Regulation S-K | |
Exhibits 21, 23.1 and 24 are filed herewith. All other exhibits are incorporated by reference as indicated below. |
Exhibit No. | Exhibit Description | |
|---|---|---|
| 3.1 | Restated Articles of Incorporation of the Registrant (incorporated herein by reference to Exhibit 3(a) of Registration Statement No. 2-84687). | |
3.2 | By-Laws of the Registrant (incorporated herein by reference to Exhibit 3(b) of Registration Statement No. 2-84687). | |
4.1 | Shelf registration statement, as amended, dated February 12, 1998 (incorporated herein by reference to Registration Statement 333-35857 and amendments thereto). | |
4.2 | Indenture and First Supplemental Indenture between Echo Bay Mines Ltd. and Bankers Trust Company and Global Security for 11% Capital Securities dated March 27, 1997 (incorporated herein by reference to the report on Form 8-K of file No. 1-8542 which was made effective on March 31, 1997). | |
10.1 | Employee Share Incentive Plan (incorporated herein by reference to Exhibit 10(n) of Registration Statement No. 2-84687). | |
10.2 | Amendment dated February 18, 1986, to the Employee Share Incentive Plan described in 10.1 above (incorporated herein by reference to Exhibit 10.29 of the report on Form 10-K of file No. 1-8542 for the year ended December 31, 1986). | |
10.3 | Director Equity Plan and amendment to Employee Share Incentive Plan (incorporated herein by reference to Registration Statement on Form S-8, file No. 33-91696). | |
10.4 | Employment Agreement dated May 10, 1996 with Robert L. Leclerc (incorporated herein by reference to exhibit 10.6 of the report on Form 10-K of file No. 1-8542 for the year ended December 31, 1996). |
10.5 | Employee Share Incentive Plan and Restricted Share Grant Plan (incorporated herein by reference to Registration Statement on Form S-8, file No. 333-31835). | |
10.6 | Registration Statement dated May 14, 1998 (incorporated herein by reference to Registration Statement on Form S-3, file No. 333-52613 and amendments thereto). | |
10.7 | Second Amended and Restated Gold Bullion Loan Agreement dated as of February 11, 1999 (incorporated herein by reference to exhibit 10.7 of the report on Form 10-K of file No. 1-8542 for the year ended December 31, 1999). | |
23.1 | Consent of Ernst & Young LLP. | |
24 | Power of Attorney. |
- (b)
- Reports on Form 8-K
None filed in the quarter ended December 31, 2000.
Pursuant to the requirements of Section 13 or 15(d) of the Securities Exchange Act of 1934, the registrant has duly caused this report to be signed on its behalf by the undersigned, thereunto duly authorized.
| ECHO BAY MINES LTD. | |||
By: | /s/ ROBERT L. LECLERC Robert L. Leclerc, Chairman, Chief Executive Officer and Director | ||
Date: February 13, 2002 | |||
Pursuant to the requirements of the Securities Exchange Act of 1934, this report has been signed below by the following persons on behalf of the registrant in the capacity and on the date indicated.
| Signature | Title | Date | ||
|---|---|---|---|---|
| /s/ ROBERT L. LECLERC Robert L. Leclerc | Chairman, Chief Executive Officer and Director | February 13, 2002 | ||
/s/ TOM S.Q. YIP Tom S.Q. Yip | Vice President, Finance and Chief Financial Officer | |||
/s/ DAVID A. OTTEWELL David A. Ottewell | Controller and Principal Accounting Officer | |||
* JOHN N. ABELL | ||||
| * LATHAM C. BURNS | ||||
| * JOHN G. CHRISTY | ||||
| * PETER CLARKE | ||||
| * JOHN F. MCOUAT | ||||
| * R. GEOFFREY P. STYLES | ||||
*A majority of the Board of Directors | ||||
*By | LOIS-ANN L. BRODRICK Lois-Ann L. Brodrick, Attorney-in-fact | February 13, 2002 |