 Metro New York’s Premier Business Bank Seizing Tomorrow’s Opportunities While Maintaining Our Core Fundamentals June 2013 Exhibit 99.1 |
 1 Safe Harbor Statement “Safe Harbor” Statement under the Private Securities Litigation Reform Act of 1995: This presentation contains various forward-looking statements with respect to earnings, credit quality and other financial and business matters within the meaning of the Private Securities Litigation Reform Act of 1995. These forward-statements can be identified by words such as “expects,” “anticipates,” “intends,” “believes,” “estimates,” “predicts” and words of similar import. The Company cautions that these forward-looking statements are subject to numerous assumptions, risks and uncertainties, and that statements relating to future periods are subject to uncertainty because of the increased likelihood of changes in underlying factors and assumptions. Actual results could differ materially from forward-looking statements. Factors that may cause actual results to differ materially from those contemplated by such forward-looking statements, include, but are not limited to, statements regarding: (a) our ability to comply with the formal agreement entered into with the Office of the Comptroller of the Currency (the “OCC”) and any additional restrictions placed on us as a result of future regulatory exams or changes in regulatory policy implemented by the OCC or other bank regulators; (b) the OCC and other bank regulators may require us to further modify or change our mix of assets, including our concentration in certain types of loans, or require us to take further remedial actions; (c) the results of the investigation of A.R. Schmeidler & Co., Inc. by the Securities and Exchange Commission (the “SEC”) and the Department of Labor (the “DOL”) and the possibility that our management’s attention will be diverted to the SEC and DOL investigations and settlement discussions and we will incur further costs and legal expenses; (d) the adverse affects on the business of A.R. Schmeidler & Co., Inc. and our trust department arising from a settlement with the SEC and DOL investigations; (e) our inability to pay quarterly cash dividends to shareholders in light of our earnings, the current and future economic environment, Federal Reserve Board guidance, our Bank’s capital plan and other regulatory requirements applicable to Hudson Valley or Hudson Valley Bank; (f) the possibility that we may need to raise additional capital in the future and our ability to raise such capital on terms that are favorable to us; (g) further increases in our non-performing loans and allowance for loan losses; (h) ineffectiveness in managing our commercial real estate portfolio; (i) lower than expected future performance of our investment portfolio; (j) a lack of opportunities for growth, plans for expansion (including opening new branches) and increased or unexpected competition in attracting and retaining customers; (k) continued poor economic conditions generally and in our market area in particular, which may adversely affect the ability of borrowers to repay their loans and the value of real property or other property held as collateral for such loans; (l) lower than expected demand for our products and services; (m) possible impairment of our goodwill and other intangible assets; (n) our inability to manage interest rate risk; (o) increased expense and burdens resulting from the regulatory environment in which we operate and our inability to comply with existing and future regulatory requirements; (p) our inability to maintain regulatory capital above the minimum levels Hudson Valley Bank has set as its minimum capital levels in its capital plan provided to the OCC, or such higher capital levels as may be required; (q) proposed legislative and regulatory action may adversely affect us and the financial services industry; (r) future increased Federal Deposit Insurance Corporation, or FDIC, special assessments or changes to regular assessments; (s) potential liabilities under federal and state environmental laws. For a more detailed discussion of these factors, see the Risk Factors discussion in the Company’s most recent Annual Report on Form 10-K, and subsequent Quarterly Reports on Form 10-Q. The forward-looking statements included in this presentation are made only as of the date hereof and the Company undertakes no obligation to update or revise any of its forward-looking statements. Unless otherwise noted, information presented is from Company sources. |
 2 NOT A TRADITIONAL RETAIL COMMUNITY BANK • A “Community Business Bank” founded to focus on small and middle market commercial customers and their principals • Focus on targeted niche businesses, entrepreneurs and professional service firms with high deposit transaction volume throughout the Metro New York area • Low-cost, core deposits = foundation of customer relationships • We sell service, with a strong commitment to acting as a “private bank” to our niche commercial customers WE LEND WHERE WE LIVE • Providing prudent, conservatively underwritten loans in our home market • Stable and deep management team has extensive in-market experience and is highly accessible to customers • Unique Metro NYC market allows for competitive positioning with high-touch service and significant opportunities for growth A Differentiated Business Model |
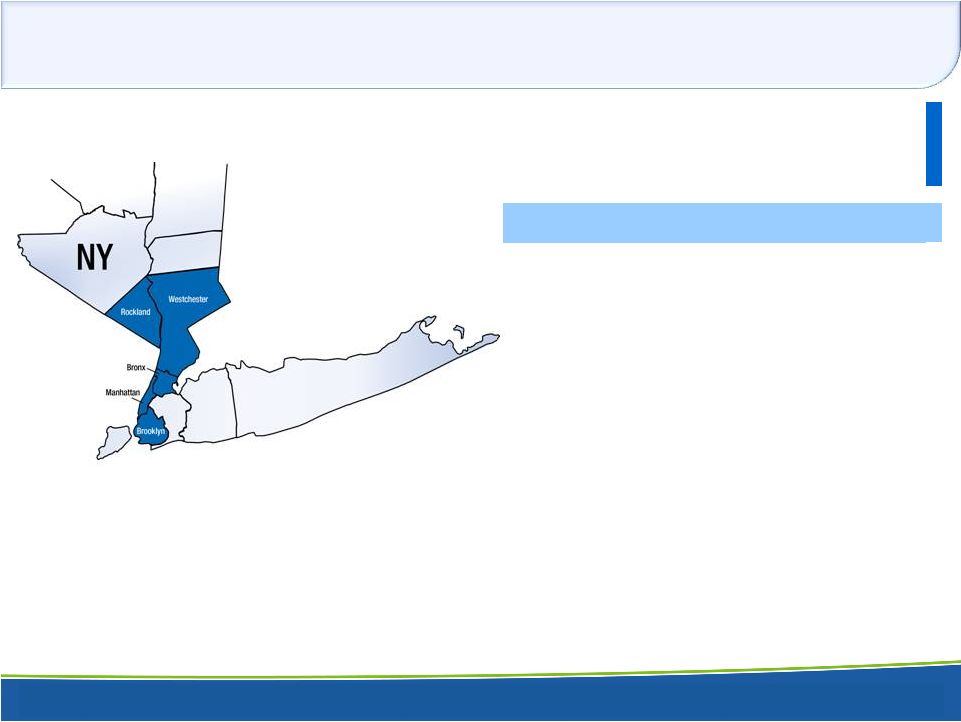   3 Metro New York Franchise • $2.8 billion commercial bank with 28 branches throughout Westchester, Rockland, the Bronx, Manhattan and Brooklyn in New York • Largest bank headquartered in Westchester County • Historic growth achieved by taking share from larger national bank competitors • There are more than 39,000 small and middle market companies with revenues of $1 million or more in this market Branch Network - County Level Deposits Branches (1) US $000s New York State Westchester 17 1,770,169 $ New York (Manhattan) 4 321,111 Bronx 4 194,924 Rockland 2 75,508 Kings (Brooklyn) 1 11,883 (1) 6 Connecticut branches are excluded and will close mid-2013 and 2 New York branches will consolidate into other branch locations in mid- 2013 Source: SNL Financial; deposit data as of 06/30/2012; branch count and map as of 3/31/2013 |
 4 Our Mission is Unchanged OUR METRO NYC SMALL- AND MID-SIZED COMMERCIAL CUSTOMERS REMAIN OUR FOUNDATION AND OUR PRIORITY • What changes is the number and diversity of products offered to serve them OBJECTIVE IS TO GAIN COMPETITIVE ADVANTAGE WHILE MAINTAINING COMPLIANCE • More nimble in adapting to new environments, products, and competitors • More effectively serve our niche markets with an even broader array of customized products that meet their needs |
   5 Summary Financial Highlights 3.66% 66.40% 0.91% 9.18% 8.6% VS. PEERS: (1) Excludes income from loan sales. Peers = Median of US-based, publicly traded commercial banks with assets between $1-$5 billion as of Mar 31, 2013. (Dollars in thousands, except per share amounts) 2012 2012 (1) 2013 Net Interest Income $31,296 $31,296 $21,246 Non Interest Income $20,354 $4,419 $4,517 Non Interest Expense $20,876 $20,876 $19,611 Net Income $18,013 $8,642 $3,651 Diluted Earnings Per Share $0.92 $0.44 $0.18 Dividends Per Share $0.18 $0.18 $0.06 Net Interest Margin 4.75% 4.75% 3.18% Return on Average Equity 25.51% 12.24% 5.02% Return on Average Assets 2.53% 1.21% 0.51% Efficiency Ratio 56.81% 56.81% 74.97% Tangible Common Equity Ratio 9.6% 9.6% 9.6% Average Assets $2,845,223 $2,845,223 $2,859,443 Average Net Loans $1,997,391 $1,997,391 $1,422,132 Average Deposits $2,466,159 $2,466,159 $2,493,021 Average Stockholders' Equity $282,459 $282,459 $290,950 Three Months Ended March 31 |
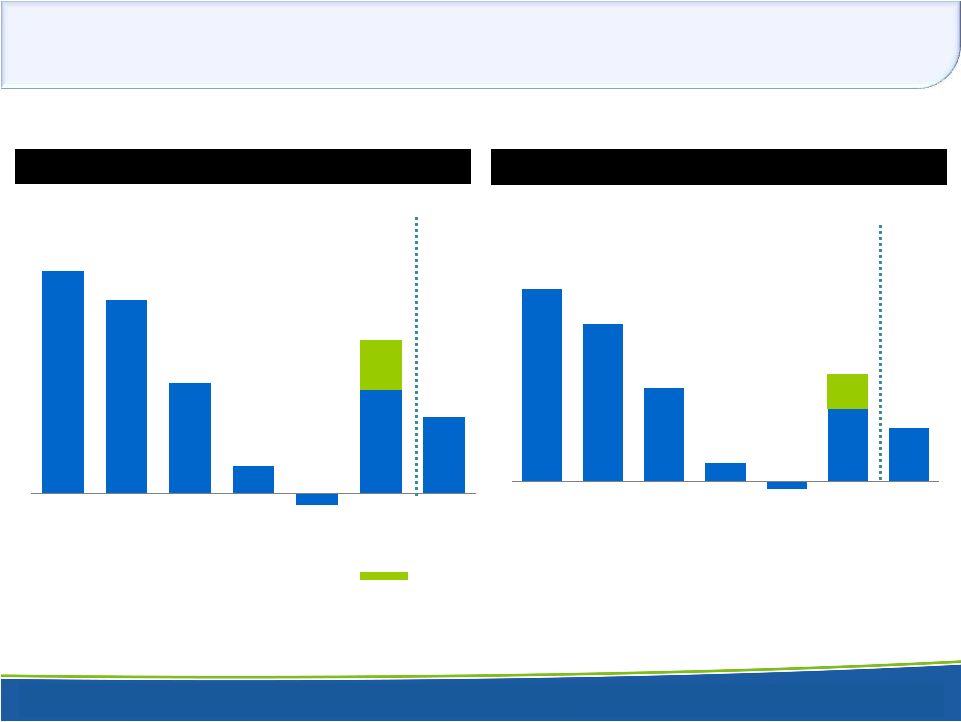 6 Historical Profitability RETURN ON AVERAGE ASSETS % RETURN ON AVERAGE EQUITY % Income from loan sale 1.02 10.05 1.49 1.30 0.74 0.18 0.70 0.51 -0.08 2007 2008 2009 2010 2011 2012 2013Q1 18.00 14.76 8.74 6.82 5.02 1.75 -0.72 2007 2008 2009 2010 2011 2012 2013Q1 |
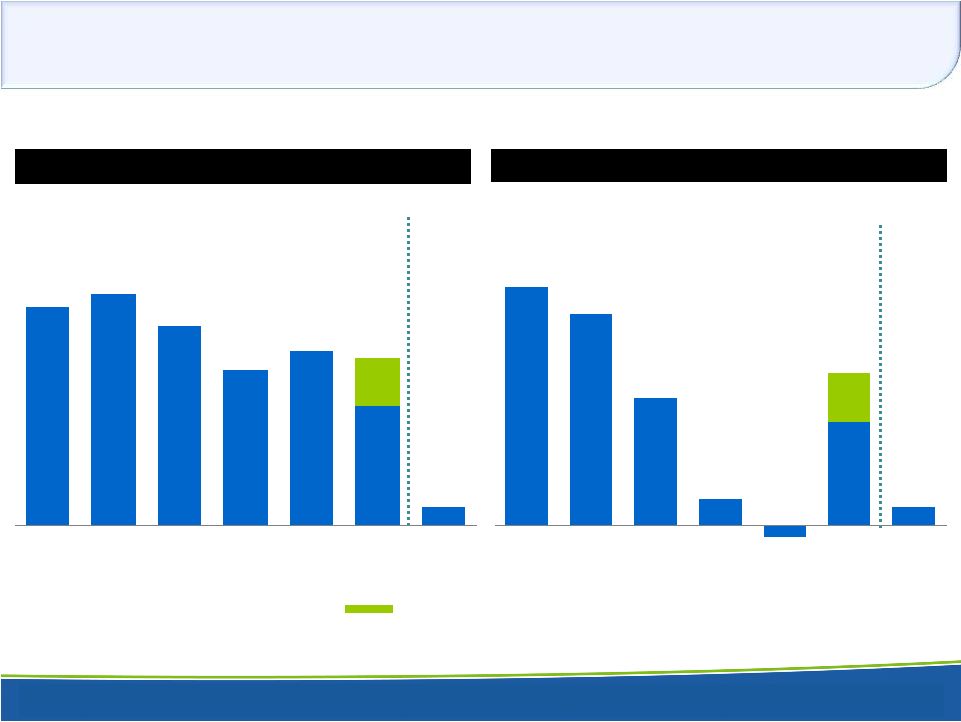 7 Historical Profitability Income from loan sale $2.78 Pre-Tax Pre-Provision Diluted Earnings per Share is a Non-GAAP measure. See Appendix slide 45 for reconciliation $1.49 $3.64 $3.84 $3.31 $2.58 $2.91 $1.97 $0.31 2007 2008 2009 2010 2011 2012 2013Q1 $2.31 $2.06 $1.24 $0.26 $1.01 ($0.11) $0.18 2007 2008 2009 2010 2011 2012 2013Q1 PRE-TAX PRE-PROVISION DILUTED EARNINGS PER SHARE* DILUTED EARNINGS PER SHARE |
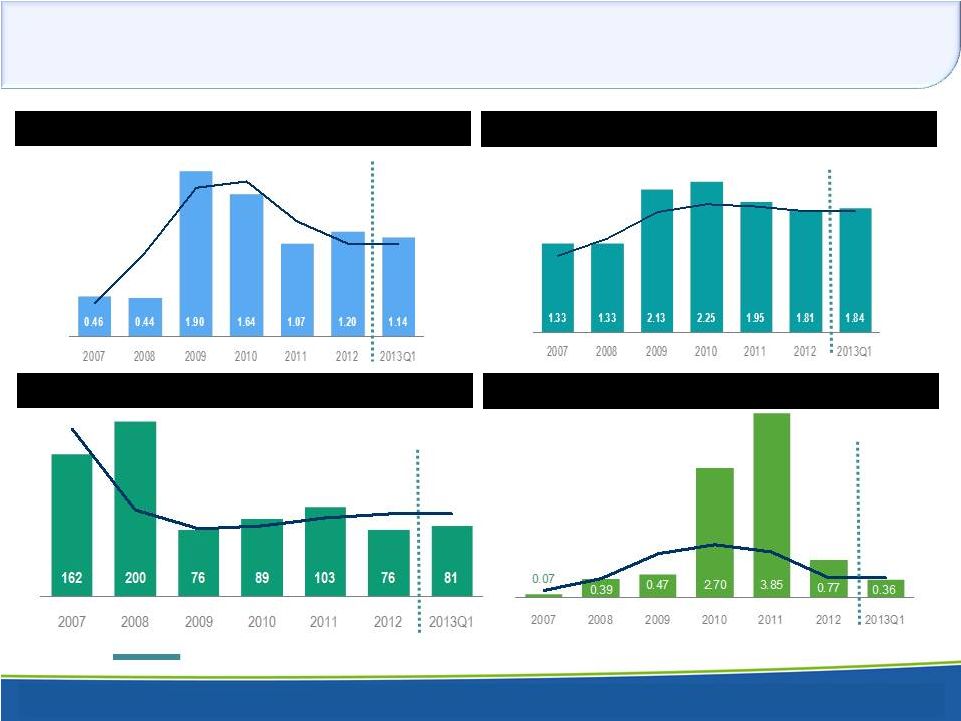 8 Asset Quality Measures Strengthen Balance Sheet NONACCRUAL LOANS / TOTAL ASSETS % LOAN LOSS RESERVE / GROSS LOANS % LOAN LOSS RESERVE / NONACCRUAL LOANS % NET CHARGEOFFS / AVERAGE NET LOANS % Median of US-based, publicly traded commercial banks with assets between $1-$5 billion as of Mar 31, 2013. |
 9 Strong Capital Position TANGIBLE COMMON EQUITY / TANGIBLE ASSETS % LEVERAGE RATIO % TIER 1 RISK BASED CAPITAL RATIO % TOTAL RISK BASED CAPITAL RATIO % Median of US-based, publicly traded commercial banks with assets between $1-$5 billion as of Mar 31, 2013. |
 10 Hudson Valley’s Business Model • Commercial bank focused on small and middle market businesses, professional service firms and their principals – they view us as their “private bankers” • Niche businesses synergistically compliment each other to form the core of HVB’s business model • Relationship Focus -- high quality banking products and exceptional personal service Attorneys Not-For- Profits Property Managers Real Estate Developers Municipal- ities Trusts General Business Focus on Targeted Niche Segments |
 11 Efficiency is Key in High-Touch Business Model “PRIVATE BANK” BUSINESS MODEL SUCCEEDS BECAUSE OF: • Narrowly targeted niche business approach – Institutional focus fully directed to targeted segments – no mass market efforts • High-touch client-RM relationships – Opportunity and incentive structure attracts talent from some of the best operators in the business – RMs are successful at attracting and retaining low-cost, stable deposits and profitable loans MAINTAINING EFFICIENT OPERATIONS IS KEY TO BALANCING COST OF A SERVICE- ORIENTED MODEL • Small branch network • No centralized call center - RMs & Branches are the first and only point of client contact • Non-price sensitive core deposit base limits need for wholesale funding and expensive rate promotions • Referrals and Business Development Board provide low-cost and effective marketing |
 12 Efficiency is Key in High-Touch Business Model OPTIMIZING BRANCH NETWORK AND EFFICIENCY • Consolidation or divestiture of six Connecticut locations, representing less than three percent of $2.5 billion in total deposits, with anticipated annual net savings in excess of $2 million by the middle of 2013 • Consolidation of the East Harlem and Rockledge, South Yonkers locations into nearby branches by the middle of 2013 • Targeted non-interest expense reductions of approximately 5 percent year-over-year |
 13 How is HVB Different? HUDSON VALLEY IS ABLE TO COMPETE IN A DENSE MARKET BECAUSE: • Will start small and work our way into lead bank position • Referral driven – satisfied customers, Business Development Board Members & centers of influence • “Big Fish in Small Pond” treatment – exceptional “above and beyond service” and easy access to decision makers • Decision makers who live and operate in the local market • Will customize products to meet specific customer needs • Provide networking opportunities to help customers grow their businesses • Relationship not transaction driven – longer sales cycle |
 14 How HVB is Different NICHE MARKET SEGMENTATION IS UNIQUE • We go to market in a very focused way • We add value by bringing specialized expertise to targeted customers and segments “PRIVATE BANK” APPROACH • Service orientation and niche expertise is our focus • We are our clients’ private bankers, helping them meet all of their financial needs as a trusted partner EXPERIENCE IN DENSE METRO NYC MARKET PRESENTS GROWTH OPPORTUNITIES • Opportunities are abundant • Small market share gains translate into large profitability gains • Our disciplined growth strategy will prioritize opportunities to deliver significant long-term shareholder value |
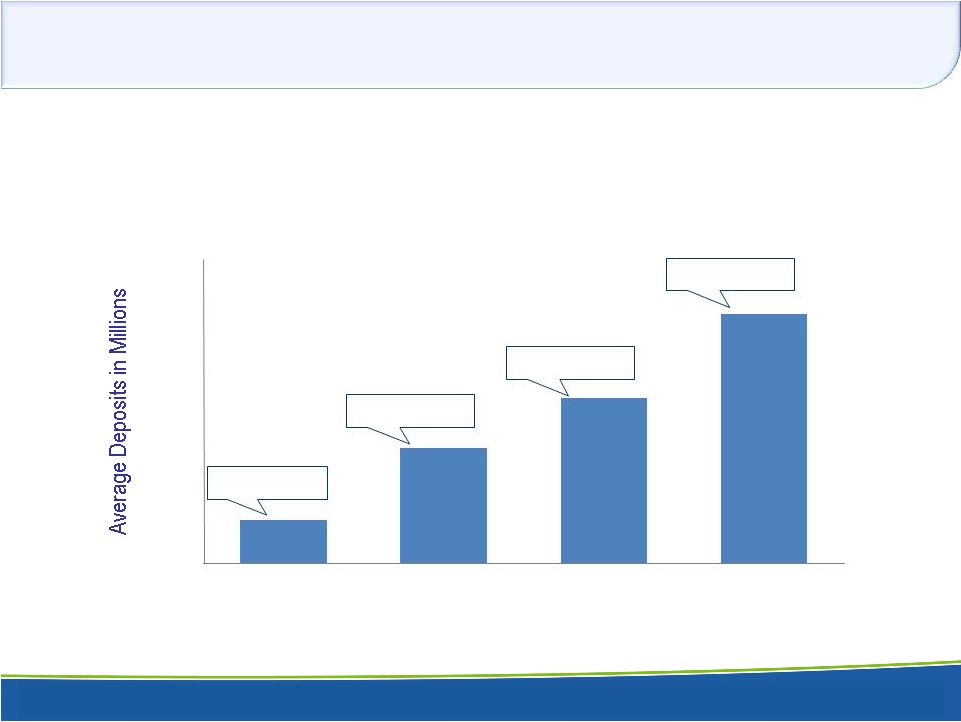 15 Branch Network – Local Service & Execution • Low-cost branch infrastructure supports core deposit franchise • Branch value grows with age – deeper penetration into existing relationships and new referrals increase deposits per branch over time (1) 6 Connecticut branches excluded will close mid-2013 (2) 2 New York branches will consolidate mid-2013 March 2013 YTD Avg Deposit Balances per Branch (1) $0 $20 $40 $60 $80 $100 $120 $140 < 5 Yrs 5-10 Yrs 10-20 Yrs > 20 Yrs Age of Branch $19.3 $52.8 $75.7 $114.2 6 Branches 6 Branches 5 Branches 13 Branches (2) |
 16 HVB Funding Advantage Peers = Median of US-based, publicly traded commercial banks with assets between $1-$5 billion as of Mar. 31, 2013. Cost of Deposits 0.00% 0.50% 1.00% 1.50% 2.00% 2.50% 3.00% 3.50% HVB National Peers |
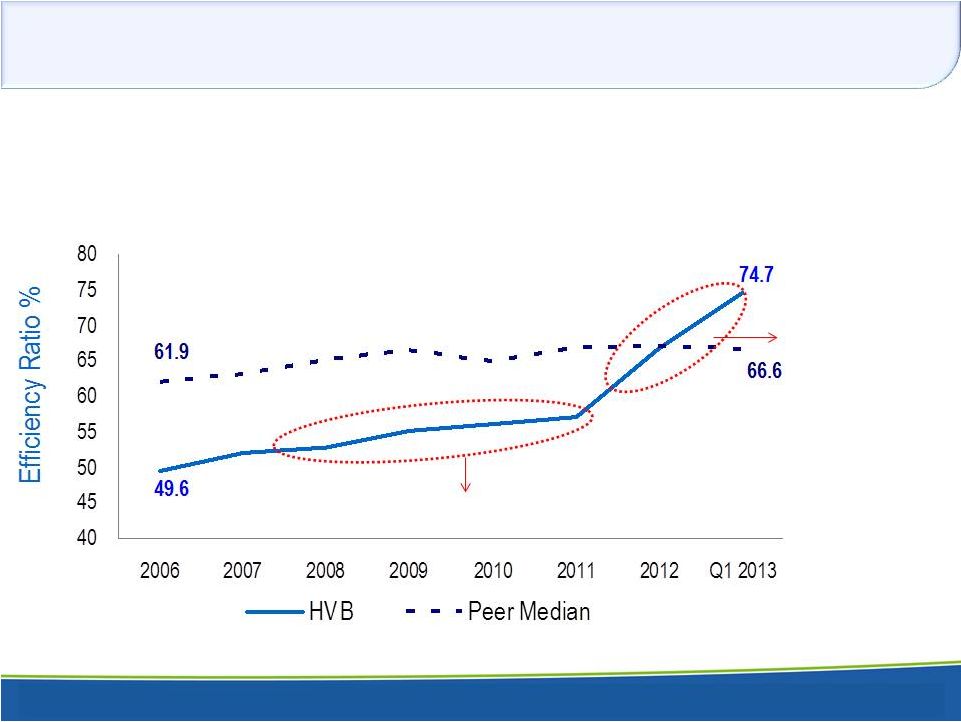 17 Historical Success in Outperforming Peers OPERATING EXPENSE CONTROL HAS SUPPORTED A MID-50% EFFICIENCY RATIO OVER THE PAST FIVE YEARS • Reflects an efficient approach to collecting deposits, with minimal branch network • Stable, non-price-sensitive deposits support highly competitive deposit funding costs • Declining net interest income due to excess cash is primary driver for rising efficiency ratio in 2012 Efficiency Ratio as reported by SNL. Peers = Median of US-based, publicly traded commercial banks with assets between $1-$5 billion as of Mar. 31, 2013. Excess cash on balance sheet Mid-50% efficiency ratio = favorable to peers |
 18 Composition of Client Segments HVB’S CLIENT RELATIONSHIPS ARE DIVERSIFIED ACROSS OUR NICHE SEGMENTS AS OF MARCH 31, 2013 SEGMENT % OF STRATEGIC CLIENT RELATIONSHIPS % OF TOTAL BANK DEPOSITS AVERAGE DEPOSITS PER STRATEGIC CLIENT RELATIONSHIP (IN THOUSANDS) % OF STRATEGIC CLIENT RELATIONSHIPS WITH LOANS Attorney 28% 18% $753 29% Not-for-Profit 18% 15% $929 37% Property Managers/Real Estate Investors 18% 23% $1,526 58% Municipalities 2% 7% $4,233 7% General Business 34% 25% $835 49% TOTAL / AVERAGE 100% 88% $1,017 |
 19 A Core Deposit Driven Franchise Mar 31, 2012 HVB HVB Peers (2) Core Deposits / Total Deposits (1) 96% 96% 88% Non Interest Bearing/Total Deps 39% 40% 20% Deposits / Total Funding 97% 98% 92% Loans / Deposits Ratio 66% 56% 78% Cost of Total Deposits 28 bp 20 bp 58 bp Deposit Metrics Mar 31, 2013 (1) Core Deposits defined as total deposits less time deposits >$100,000. (2) Peers = Median of US-based, publicly traded commercial banks with assets between $1-$5 billion as of Mar 31, 2013. |
 71% 56% 89% 96% 50% 60% 70% 80% 90% 100% 2007 2008 2009 2010 2011 2012 2013 Loan/Dep Ratio Core/Total Deposits (2) (1) 20 A Core Deposit Driven Franchise DEPOSIT COMPOSITION – Mar 31, 2013 CORE FUNDING (1) Net loans excluding loans held-for-sale. (2) Core Deposits defined as total deposits less time deposits >$100,000. TOTAL DEPOSITS – $2,464 MILLION Money Market, 35% Demand, 40% Savings, 5% Time > $100m, 4% Time < $100m, 1% Checking with Interest, 15% |
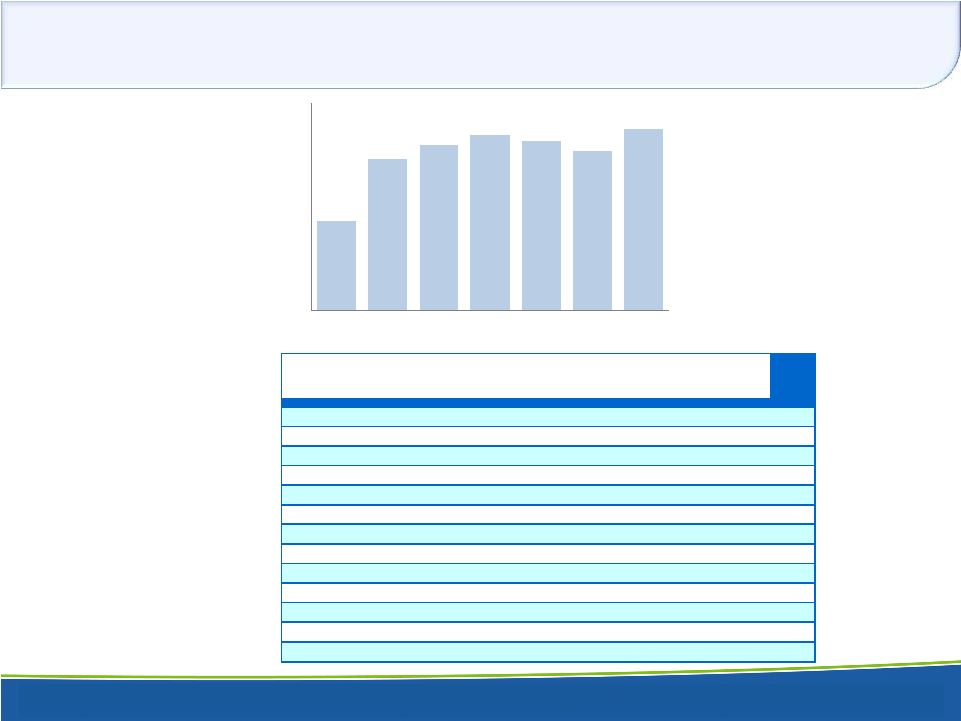
 21 Deposit Growth Drives Long-Term Profitability 67.2% CORE DEPOSITS (1) 96.3% CORE DEPOSITS (1) VS. 87.9% FOR PEERS (2) $0 $500 $1,000 $1,500 $2,000 $2,500 $880 $888 $1,027 $1,125 $1,235 $1,408 $1,626 $1,813 $1,839 $2,173 $2,234 $2,425 $2,520 $2,464 Dec Dec Dec Dec Dec Dec Dec Dec Dec Dec Dec Dec Dec Mar 2000 2001 2002 2003 2004 2005 2006 2007 2008 2009 2010 2011 2012 2013 Demand Deposits Checking with Interest Money Market Accounts Savings Accounts Time Deposits < $100m Time Deposits > $100m Brokered Deposits (1) Core deposits defined as total deposits less time deposits > $100,000 and brokered deposits. December 2006 Includes approximately $127 million of deposits as part of New York National Bank acquisition (2) Peers = Median of US-based, publicly traded commercial banks with assets between $1-$5 billion as of Mar 31, 2013. |
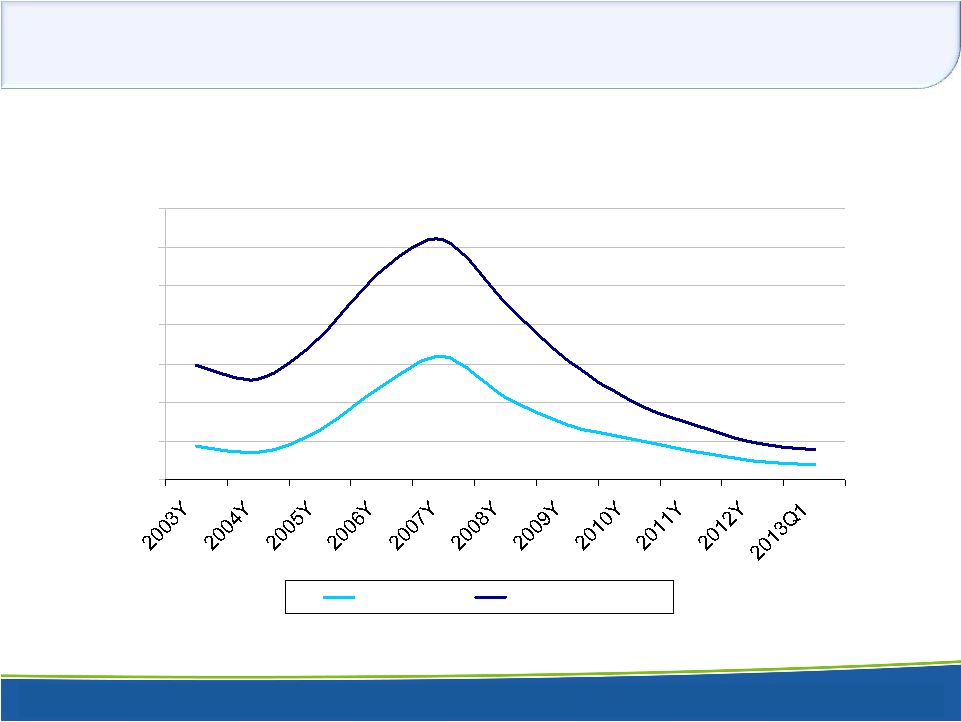
 22 Strong Net Interest Margin (1) Fully tax equivalent basis. (2) Peers = Median of US-based, publicly traded commercial banks with assets between $1-$5 billion as of Mar 31, 2013. VS. 3.66% PEERS (1,2) 3.24% 4.89% 5.42% 8.57% 0.20% 2.08% 0% 1% 2% 3% 4% 5% 6% 7% 8% 9% 2001 2002 2003 2004 2005 2006 2007 2008 2009 2010 2011 2012 2013Q1 Net Interest Margin (FTE) Yield on Loans Cost of Deposits Federal Funds Rate |
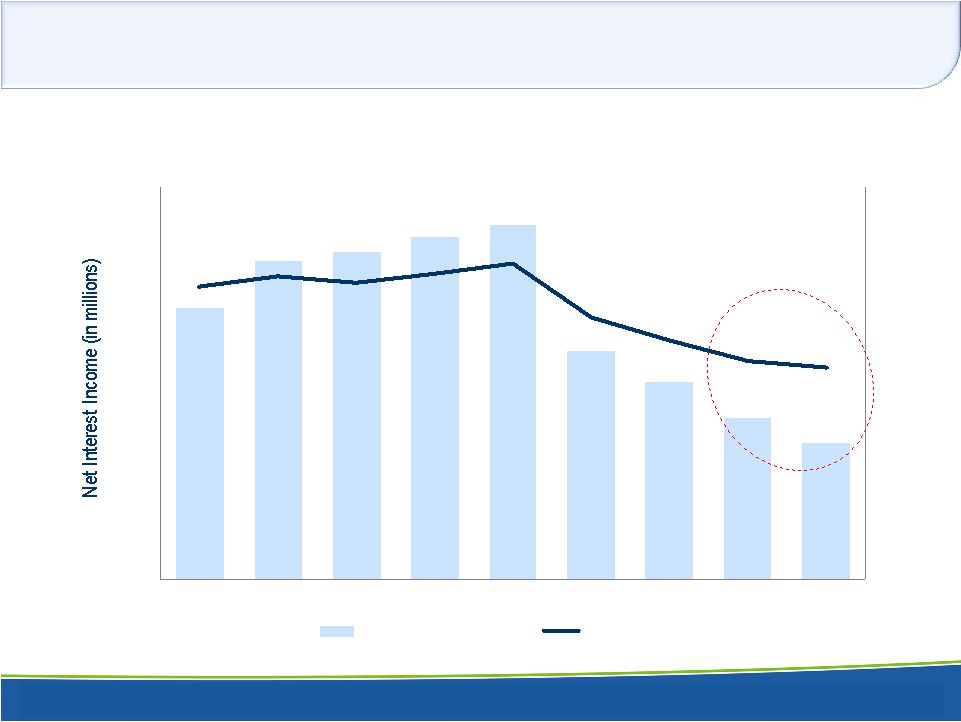 23 Revenue and Margin Compression EXCESS CASH POSITION FROM 1Q12 LOAN SALES COMPRESSING NET INTEREST INCOME • Disciplined redeployment is underway and will take time $22.4 $21.2 3.34% 3.24% $15 $17 $19 $21 $23 $25 $27 $29 $31 $33 Q111 Q211 Q311 Q411 Q112 Q212 Q312 Q412 Q113 0% 1% 2% 3% 4% 5% 6% Net Interest Income NIM (FTE) |
  24 Balance Sheet Positioned for Diversification Mar 31 ($ in Millions) 2010 2011 2012 2013 Cash and Cash Equivalents 356 78 828 792 Securities 460 521 455 484 Real Estate Commercial 796 691 551 576 Construction 174 110 75 70 Residential 467 515 522 490 Commercial & Industrial 245 219 289 250 Other 33 29 22 18 Lease Financing 16 12 11 11 Total Loans (excl.HFS) 1,732 1,576 1,470 1,415 Deferred Loan Fees (4) (4) (2) (2) Allowance for Loan Losses (39) (31) (27) (26) Loans, Net (excl. HFS) 1,689 1,541 1,441 1,387 Total Assets 2,669 2,798 2,891 2,829 Deposits 2,234 2,425 2,520 2,464 Borrowings 124 70 51 46 Stockholders' Equity 290 278 291 293 December 31 |
 25 Redeployment Aimed at Balance Sheet Efficiency Diversifying by simultaneously implementing three approaches 1.Asset purchases – CURRENT • $65 Million in Residential ARMs purchased in 1Q12 • Evaluating others 2.Loan participations with other institutions – NEAR TERM • Building on HVB’s longstanding CRE-participation experience by leveraging other institutions’ expertise and infrastructure for C&I and residential lending 3.Building internal ability to originate, underwrite and service non-CRE credits – NEAR & LONG TERM • Focus is new products for longstanding niche business and industry targets in metro NYC New commercial lending including equipment leases, lines of credit, term loans, ABL, etc. Complementary jumbo mortgage and HELOC products for RMs to offer commercial-account principals All while continuing to leverage historic strength in CRE underwriting to capitalize on solid demand from quality CRE credits |
 26 Growth Strategy ORGANIC GROWTH IS OUR STRENGTH • We have been successful in going to market in a very focused way in the highly competitive Metro NYC commercial banking market – Larger bank M&A in the market provides opportunities to acquire new customers and new talent with intact books of business • Referrals and reputation for service have historically generated profitable, controlled growth in customers • Always seeking to grow sources of fee revenue – A.R. Schmeidler acquisition in 2004 is a good example of investing in a niche business with strong fee generating capabilities • Breadth and depth of niche business markets in Metro NYC provide unusually high growth opportunities compared to other areas of the U.S. • Opportunistic and targeted M&A could supplement organic growth in the future, particularly in fee income |
 27 HVB General Business Average Loan = $541,449 Businesses in Market > 419,000 > $227 BILLION LENDING OPPORTUNITY Market Potential Example AS OF MARCH 31, 2013 SEGMENT % OF STRATEGIC CLIENT RELATIONSHIPS % OF TOTAL BANK DEPOSITS AVERAGE DEPOSITS PER STRATEGIC CLIENT RELATIONSHIP (IN THOUSANDS) % OF STRATEGIC CLIENT RELATIONSHIPS WITH LOANS Attorney 28% 18% $753 29% Not-for-Profit 18% 15% $929 37% Property Managers/Real Estate Investors 18% 23% $1,526 58% Municipalities 2% 7% $4,233 7% General Business 34% 25% $835 49% TOTAL / AVERAGE 100% 88% $1,017 |
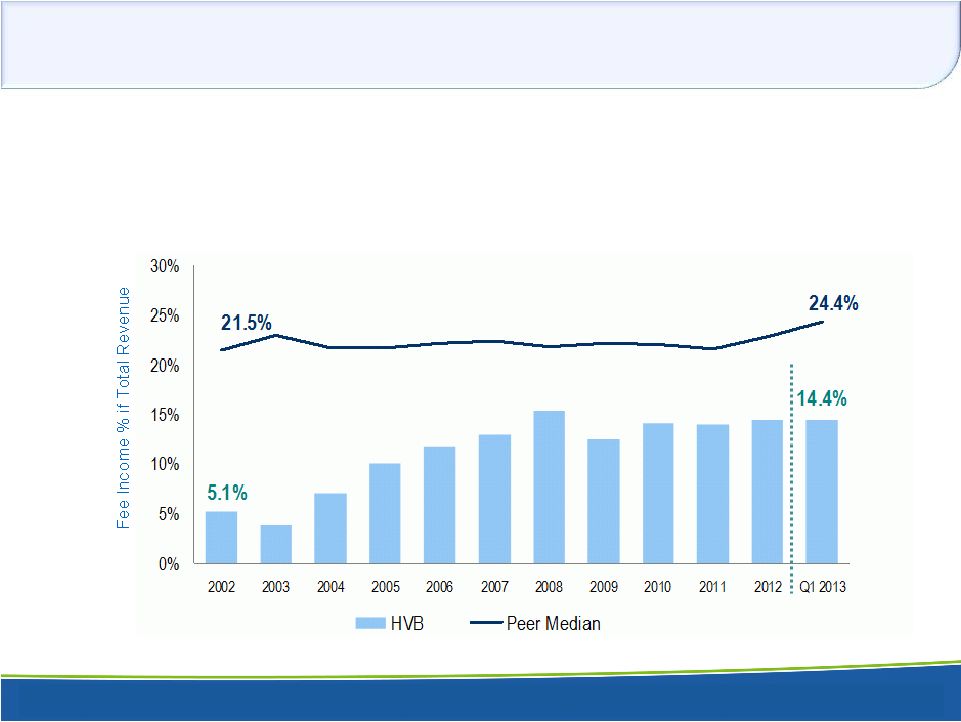 28 Focus on Growing Fee Revenue FEE INCOME A KEY FOCUS • While net interest income is the primary source of Hudson Valley’s revenue, we have been successful in diversifying revenue sources – Over the last 10 years we have grown fee income from 5% of total revenue to more than 14% – We see opportunity to gain more asset management and trust revenue Fee Income excludes realized gains and losses on investment securities and other non-recurring items as defined by SNL. Peers = Median of US-based, publicly traded commercial banks with assets between $1-$5 billion as of Mar 31, 2013. |
 29 HVB Investment Highlights EFFICIENT AND LOW-COST OPERATOR • Longstanding record as an efficient operator BALANCE SHEET STEWARD • Low deposit funding costs support a NIM that exceeds traditional commercial banks • Balance sheet is in transition: – Balancing desire to deploy excess liquidity with long-term risk positioning objectives – Moving away from commercial real estate focus – Diversifying our lending focus to broader in-market C&I opportunities • Underwriting and credit quality a key focus • Capital ratios in excess of “well capitalized” and prescribed minimums FOCUS ON SHAREHOLDER RETURNS • Growing returns to shareholders supports the ability to pay a meaningful dividend • High insider ownership aligns management’s and board’s interests with shareholders’ |
 30 Key Takeaways HISTORIC DIFFERENTIATING QUALITIES REMAIN OUR STRENGTH • Low-cost core deposit base = source of stable funding for future growth • Efficient mindset is in our DNA • “Private Bank” approach wins and retains customers AN INCREASINGLY NIMBLE AND SOPHISTICATED BANK • Ahead of the curve in adopting best practices typically reserved for $10-$25 billion banks • Increased sophistication = heightened competitive edge • Developing diversified lending skills as a strategic and tactical focus USING ENHANCED OPERATIONAL EFFECTIVENESS TO OUR ADVANTAGE • Quicker reaction to customers’ needs • Quicker reaction to regulatory and market changes • Quicker ability to diversify lending sources and maximize capital allocation – Results in: Quicker ability to grow shareholder returns |
 31 HVB Valuation Compared to Peers * May 31, 2013 and May 31, 2012 TODAY* ONE YEAR AGO* Dividend Yield Price / Book Price / Tangible Book Dividend Yield Price / Book Price / Tangible Book HVB 1.3 1.22x 1.33x 4.3 1.13x 1.23x SNL U.S. Bank $1B-$5B Index 1.8% 1.46x 1.66x 2.0% 1.20x 1.38x Median of $1B-$5B NY-NJ-CT Banks 2.9% 1.19x 1.44x 3.4% 1.16x 1.23x |
 32 THANK YOU THANK YOU FOR YOUR INTEREST IN FOR YOUR INTEREST IN HUDSON VALLEY HOLDING HUDSON VALLEY HOLDING CORP. CORP. 32 |
 33 Ticker: HVB Ticker: HVB www.hudsonvalleybank.com www.hudsonvalleybank.com 33 APPENDIX APPENDIX FINANCIAL DETAIL AND NON-GAAP FINANCIAL DETAIL AND NON-GAAP RECONCILIATION RECONCILIATION |
 34 New York Metro Market Profile BANK DEPOSITS & COMPETITIVE ENVIRONMENT • HVB competes against national, regional and local banks • There are 122 banks operating in this New York Metro Market (1) • The five county market is deposit rich – more than three-quarters of a trillion dollars (1) • If this market were a state, it would rank 3rd in deposit size – behind California with $953.5 billion and well ahead of Texas with $599.0 billion (1) – FDIC Summary of Deposits as of June 30, 2012 Summary of Deposits by State (1) Rank State Deposits ($ in 000) 1 New York $ 1,065,665,215 2 California $ 953,488,261 HVB's NY Metro Market $ 789,813,635 3 Texas $ 599,030,737 4 Florida $ 423,907,631 5 Illinois $ 393,026,185 |
 35 New York Metro Market Profile NICHE BUSINESSES • Just as this market is deposit rich, it is also rich with HVB’s targeted niche businesses • We have leading market share among Westchester attorneys and property managers • High growth potential in all other segments and counties, each with HVB market share currently <2% 1 – Dunn & Bradstreet Market Data based on Primary & Secondary NAICS codes DATA DEMONSTRATES TREMENDOUS UNTAPPED ORGANIC GROWTH POTENTIAL IN HVB’S CORE NICHE MARKETS Segment Manhattan / NY Brooklyn Bronx Westchester Rockland Total Attorney 9,577 1,875 567 2,395 602 15,016 Not for Profit 7,815 8,713 3,411 3,430 1,434 24,803 Real Estate Investors 4,314 1,285 605 964 236 7,404 Property Managers 5,519 3,385 1,362 2,023 548 12,837 Municipalities 838 433 280 534 200 2,285 Sub-Total 28,063 15,691 6,225 9,346 3,020 62,345 HVB NICHE BUSINESS BY COUNTY (1) |
 36 New York Metro Market Profile DEMOGRAPHICS • Along with being rich in deposits and HVB’s niche businesses, the market also has very favorable demographics (1) 2010 US Census Quick Facts by State|County Consumer Demographics (1) Manhattan / NY Brooklyn Bronx Westchester Rockland Total Population 1,585,873 2,504,700 1,385,108 949,113 311,687 19,378,102 Housing Units (2) 847,090 1,000,293 511,896 370,821 104,057 8,108,103 Home ownership rate 22.8% 30.3% 20.7% 62.7% 71.0% 55.2% Persons per household, 2006- 2010 2.09 2.68 2.79 2.64 3.02 2.59 Median household income 2006- 2010 $64,971 $43,567 $34,264 $79,619 $82,534 $55,603 Median Income Per Capita $59,149 $23,605 $17,575 $47,814 $34,304 $30,948 Unemployment Rate (3) 8.5% 9.2% 11.6% 6.8% 6.4% 8.1% Business Demographics (4) Revenues: < $1 million 146,423 91,224 31,931 57,425 17,767 344,770 Revenues: $1 million - $5 million 13,926 4,242 1,444 3,276 951 23,839 Revenue: > $5 million 6,833 1,147 482 1,267 276 10,005 Revenue: Not reported 19,101 9,306 4,588 5,730 1,718 40,443 Total Business Entities 186,283 105,919 38,445 67,698 20,712 419,057 (3) County unemployment rates as of March, 2013 Bureau of Labor Statistics (4) Hoovers|D&B (2) A housing unit is defined as a house, an apartment, a mobile home, a group of rooms, or a single room that is occupied |
 37 HVB’s Position in the Market DEPOSIT SHARE • Except for Westchester and the Bronx, HVB’s market share in each county is less than 1% • HVB ranks 25 out of 122 institutions with $2.37 billion in deposits and 0.29% market share (1) • HVB is a small market share play in a very large market HVB Deposits by County County HVB Branches HVB Deposits (1) ($ in 000) HVB Market Share Total Market Deposits (1) ($ in 000) Westchester 18 $ 1,770,169 3.55% $ 49,881,254 Manhattan 5 $ 321,111 0.05% $ 682,797,129 Bronx 4 $ 194,924 1.84% $ 10,582,328 Rockland 2 $ 75,508 0.85% $ 8,906,783 Brooklyn 1 $ 11,883 0.03% $ 37,646,141 Total NY Metro 30 $ 2,373,595 0.30% $ 789,813,635 (1) – FDIC Summary of Deposits as of 6/30/12 |
  38 Quarterly Loan Balances (1) Total is gross of unearned income. Dollars in Millions 2Q 2011 3Q 2011 4Q 2011 1Q 2012 2Q 2012 3Q 2012 4Q 2012 1Q 2013 REAL ESTATE C&D - RESIDENTIAL 63 62 53 51 53 48 34 27 C&D - NON RESIDENTIAL 85 83 57 56 43 43 41 43 OWNER OCCUPIED CRE 324 318 244 256 229 195 181 177 NON-OWNER OCCUPIED CRE 521 500 447 449 405 389 369 399 MULTIFAMILY LOANS 365 507 228 225 213 209 196 195 1-4 FAMILY MORTGAGE 191 187 175 232 237 214 216 189 HOME EQUITY 116 118 113 111 109 109 110 106 COMMERCIAL & INDUSTRIAL 228 222 219 222 231 266 289 250 CONSUMER 27 28 27 27 19 20 19 17 LEASE FINANCING 13 13 12 15 14 14 14 11 OTHER 2 2 0 1 3 3 3 1 TOTAL (1) $1,935 $2,040 $1,575 $1,645 $1,557 $1,510 $1,472 $1,415 Period Ending |
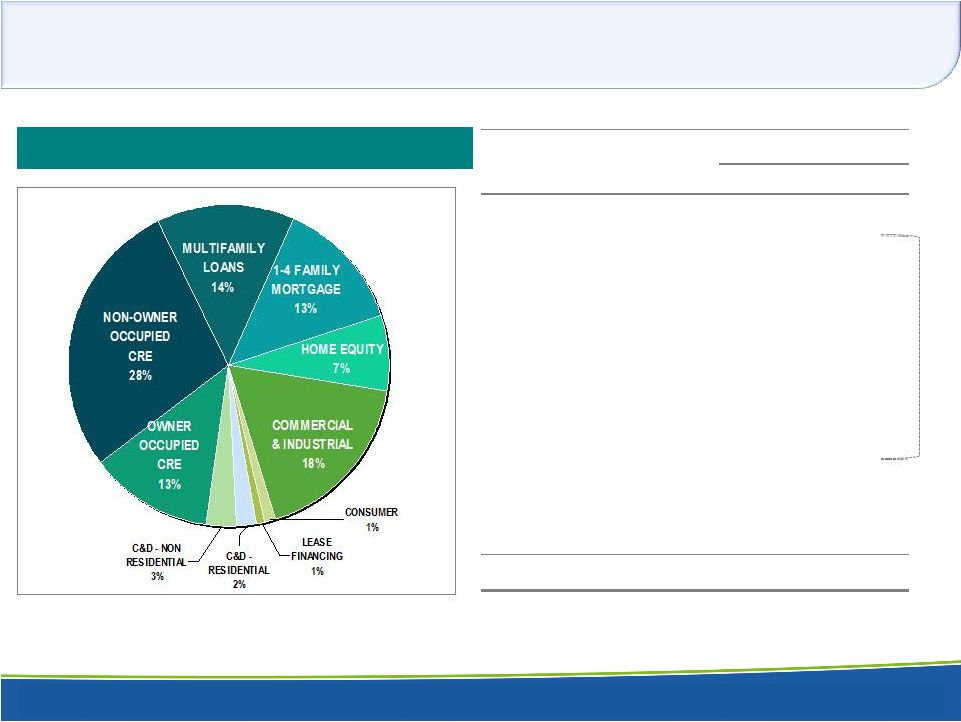   39 Strength in Diversified Commercial Lending 80% LOAN COMPOSITION – Mar 31, 2013 Loan Balances In Millions 2012 2013 REAL ESTATE C&D - RESIDENTIAL $51 $27 C&D - NON RESIDENTIAL 56 43 OWNER OCCUPIED CRE 256 177 NON-OWNER OCCUPIED CRE 449 399 MULTIFAMILY LOANS 225 195 1-4 FAMILY MORTGAGE 232 189 HOME EQUITY 111 106 COMMERCIAL & INDUSTRIAL 222 250 CONSUMER 27 17 LEASE FINANCING 15 11 OTHER 1 1 TOTAL (1) $1,645 $1,415 March 31 (1) Total is gross of unearned income. |
 40 Composition of Commercial Loans BALANCE OUTSTANDING AT MAR 31, 2013 (IN MILLIONS) SEGMENT C&I INVESTOR- OWNED CRE OWNER- OCCUPIED CRE TOTAL C&I + CRE Attorney $12 $3 $4 $19 Municipalities 2 3 0 5 Not For Profit 108 9 72 189 General Business 81 133 80 294 Property Managers & Real Estate Investors 47 251 21 319 TOTAL $250 $399 $177 $826 Table excludes Construction & Development loans. |
 41 Loan Portfolio Granularity LOAN AMOUNT TIER % OF DOLLARS OUTSTANDING BY SIZE OF LOAN % OF LOANS OUTSTANDING BY NUMBER OF LOANS < $250,000 6.36% 63.51% $250,000 to <$1 million 21.14% 21.31% $1 million to < $5 million 53.19% 13.76% $5 million and greater 19.31% 1.43% Total 100.00% 100.00% MARCH 31, 2013 Table excludes Residential loans. |
  42 Portfolio Granularity – Risk Ratings *Total of non-homogeneous loans individually classified as to credit risk as of the most recent analysis performed.. % of “Pass” Rated Loans Portfolio Risk Ratings at Mar 31, 2013 Total (in millions)* Commercial Real Estate: Owner occupied $177 74.2% 3.8% 22.0% Non owner occupied 399 97.2% 0.9% 2.0% Construction: Commercial 43 76.4% 12.4% 11.2% Residential 27 88.7% 3.3% 8.1% Residential: Multifamily 195 97.8% 1.4% 0.8% 1-4 family 78 72.5% 0.6% 26.9% Home equity 0.5 7.2% 0.0% 92.8% Commercial & Industrial 250 93.2% 0.9% 5.9% Lease Financing & Other 26 98.5% 0.0% 1.5% Total Loans $1,196 90.5% 1.8% 7.7% Pass Special Mention Sub- standard 85.1% 88.8% 89.5% 90.1% 89.7% 89.2% 90.5% 80% 82% 84% 86% 88% 90% 92% Q3'11 Q4'11 Q1'12 Q2'12 Q3'12 Q4'12 Q1'13 |
 43 Portfolio Granularity – Delinquencies Note: Balances exclude Loans Held For Sale 3/31/2013 12/31/2012 9/30/2012 3/31/2013 12/31/2012 9/30/2012 31-89 days Past Due incl. NAL 1.40% 0.96% 0.54% 0.70% 0.49% 0.28% 90+ days Past Due incl. NAL 1.81% 1.74% 1.63% 0.91% 0.88% 0.84% Total Past Due incl. NAL 3.21% 2.70% 2.17% 1.61% 1.37% 1.12% Total Nonaccrual Loans (NAL) 2.27% 2.37% 2.81% 1.14% 1.20% 1.44% % OF TOTAL ASSETS % OF TOTAL LOANS |
  44 Quarterly Summary Financial Highlights (a) Excludes income from loan sales. Dollars in thousands, except per share amounts Q2 2011 Q3 2011 Q4 2011 Q1 2012 (a) Q1 2012 Q2 2012 Q3 2012 Q4 2012 Q1 2013 Net Interest Income $29,614 $30,038 $30,739 $31,296 $31,296 $25,508 $24,115 $22,410 $21,246 Non Interest Income $3,831 $5,714 $4,136 $4,419 $20,354 $4,789 $4,353 $4,346 $4,517 Non Interest Expense $20,648 $20,090 $18,967 $20,876 $20,876 $21,034 $20,035 $20,593 $19,611 Net Income (Loss) $7,432 $8,508 ($22,901) $8,656 $18,013 $4,961 $3,134 $3,073 $3,651 Net Interest Margin 4.55% 4.47% 4.60% 4.75% 4.75% 3.93% 3.60% 3.28% 3.18% Diluted Earnings (Loss) Per Share $0.38 $0.43 ($1.17) $0.44 $0.92 $0.25 $0.16 $0.16 $0.18 Dividends Per Share $0.14 $0.18 $0.18 $0.18 $0.18 $0.18 $0.18 $0.18 $0.06 Return on Average Equity 10.13% 11.33% -30.07% 12.20% 25.51% 6.72% 4.32% 4.18% 5.02% Return on Average Assets 1.06% 1.18% -3.19% 1.21% 2.53% 0.71% 0.44% 0.43% 0.51% Efficiency Ratio 58.81% 56.67% 52.79% 56.81% 56.81% 68.06% 69.33% 75.73% 74.97% Tangible Common Equity Ratio 9.7% 9.6% 9.1% 9.6% 9.6% 9.6% 9.2% 9.3% 9.6% Average Assets $2,791,988 $2,872,159 $2,867,304 $2,845,223 $2,845,223 $2,795,090 $2,874,634 $2,883,086 $2,859,443 Average Net Loans $1,840,076 $1,928,888 $2,028,587 $1,997,391 $1,997,391 $1,577,190 $1,505,942 $1,467,153 $1,422,132 Average Deposits $2,383,267 $2,468,359 $2,463,056 $2,466,159 $2,466,159 $2,408,726 $2,489,378 $2,514,818 $2,493,021 Average Stockholders' Equity $293,390 $300,338 $304,624 $282,459 $282,459 $295,378 $290,189 $293,886 $290,950 Earnings |
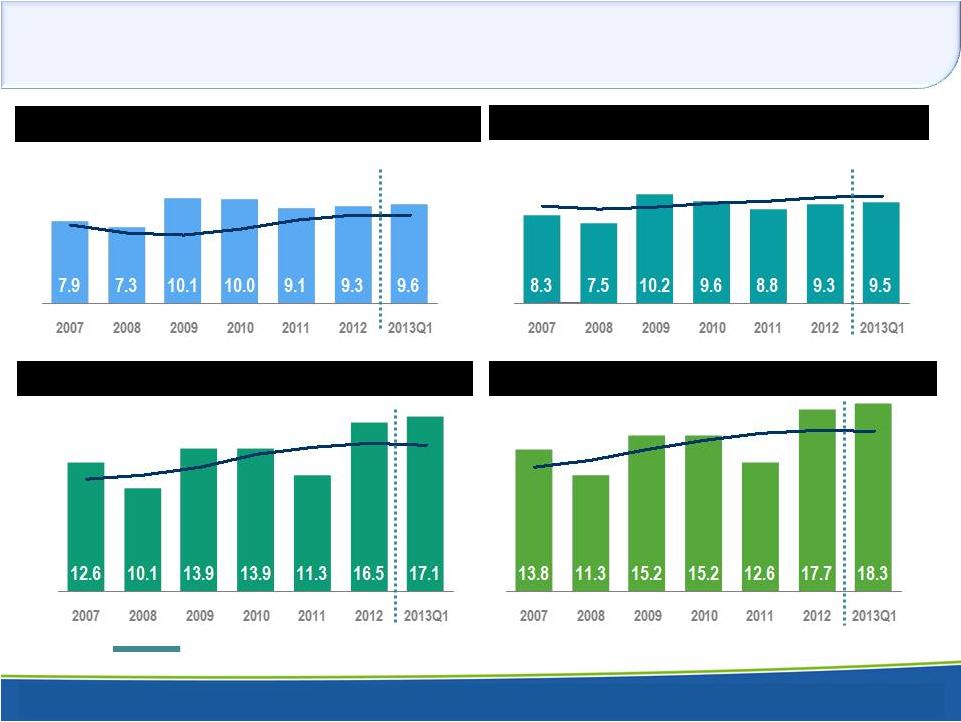
 45 Non-GAAP Reconciliation (a) Year Ended Dec 31,2012 (b) The loan sale in the first quarter of 2012 resulted in a gross gain of $15,935. Related income taxes totaled $6,578. Excluding Loan Sale in thousands except share and per share numbers 2007 2008 2009 2010 2011 2012(a) 2012(a,b) 2013 Net Income as reported 34,483 $ 30,877 $ 19,012 $ 5,113 $ (2,137) $ 29,181 $ 19,824 $ 3,651 $ Income attributable to participating shares as reported - - - - - (125) (85) (43) Net Income attributable to common shares as reported 34,483 $ 30,877 $ 19,012 $ 5,113 $ (2,137) $ 29,055 $ 19,739 $ 3,608 $ Net Income as reported 34,483 $ 30,877 $ 19,012 $ 5,113 $ (2,137) $ 29,181 $ 19,824 $ 3,651 $ Exclude: Income Tax (1) 18,259 15,646 7,310 (1,406) (5,413) 16,945 10,367 1,730 Provision for Loan Loss (2) 1,470 11,025 24,306 46,527 64,154 8,507 8,507 772 Income attributable to participating shares (3) - - - - - (234) (165) (72) Pre-tax, Pre-provision Earnings 54,212 $ 57,548 $ 50,628 $ 50,234 $ 56,605 $ 54,398 $ 38,533 $ 6,081 $ Weighted Average Diluted common shares 14,906,752 14,973,866 15,307,674 19,455,971 19,462,055 19,545,037 19,545,037 19,563,083 Diluted Earnings per Share as reported 2.31 $ 2.06 $ 1.24 $ 0.26 $ (0.11) $ 1.49 $ 1.01 $ 0.18 $ Effects of (1) and (2) above 1.32 $ 1.78 2.07 2.32 3.02 1.30 0.96 0.13 Pre-Tax, Pre-Provision Diluted Earnings per Common Share 3.64 $ 3.84 $ 3.31 $ 2.58 $ 2.91 $ 2.78 $ 1.97 $ 0.31 $ Tangible Equity Ratio: Total Stockholders' Equity: As reported 203,687 $ 207,500 $ 293,678 $ 289,917 $ 277,562 $ 290,971 $ 290,971 $ 292,895 $ Less: Goodwill and other intangible assets 20,296 25,040 27,118 26,296 25,493 24,745 24,745 24,697 Tangible stockholders' equity 183,391 $ 182,460 $ 266,560 $ 263,621 $ 252,069 $ 266,226 $ 266,226 $ 268,198 $ Total Assets: As reported 2,330,748 $ 2,540,890 $ 2,665,556 $ 2,669,033 $ 2,797,670 $ 2,891,246 $ 2,891,246 $ 2,828,809 $ Less: Goodwill and other intangible assets 20,296 25,040 27,118 26,296 25,493 24,745 24,745 24,697 Tangible assets 2,310,452 $ 2,515,850 $ 2,638,438 $ 2,642,737 $ 2,772,177 $ 2,866,501 $ 2,866,501 $ 2,804,112 $ Tangible equity ratio 7.9% 7.3% 10.1% 10.0% 9.1% 9.3% 9.3% 9.6% |
 46 Investment Philosophy and Focus INVESTMENT PHILOSOPHY: • For equity, buy the most assets and cash flow for the fewest dollars in the key beneficiaries of secular growth trends • For fixed income, preservation of principal is primary consideration with income secondary PORTFOLIO FOCUS: • Preservation of principal • Capital appreciation • Protection of purchasing power |
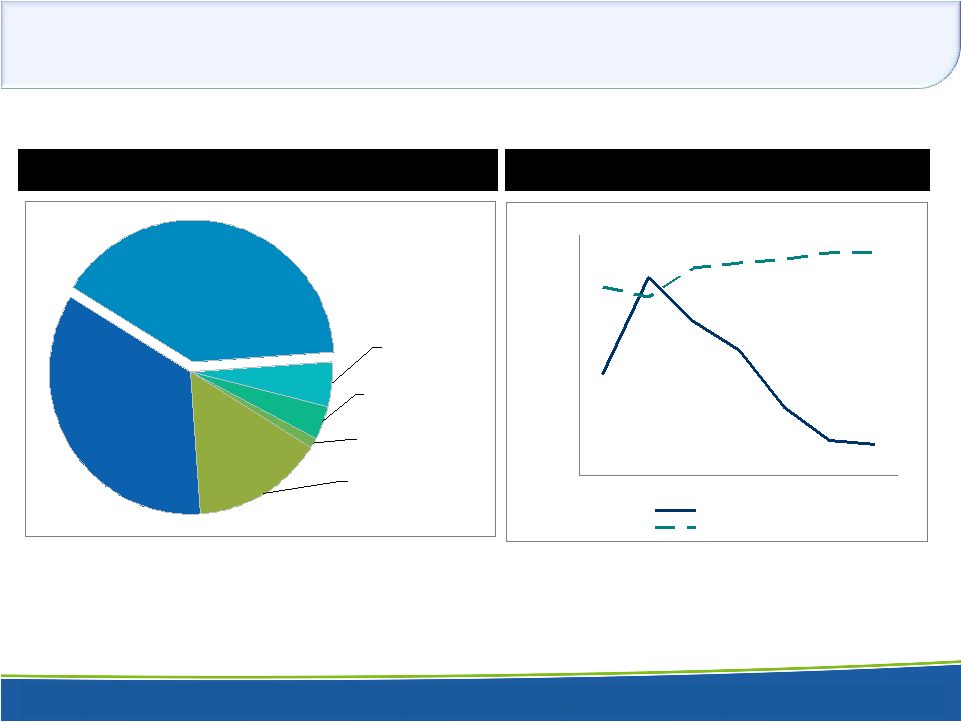
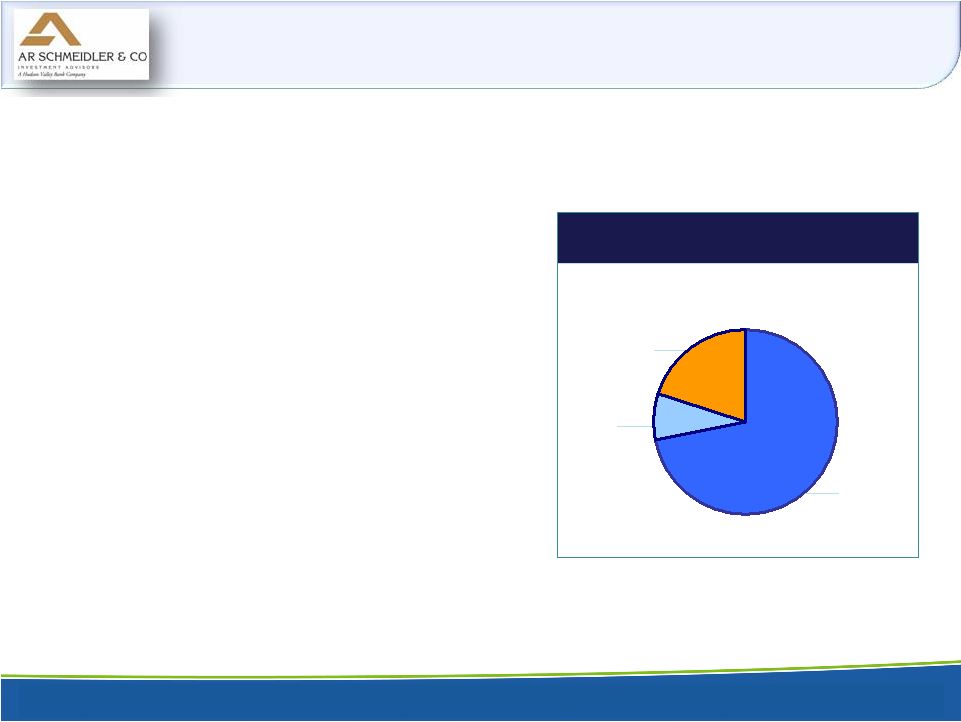 47 Firm Overview • Long-only absolute-return managers using a distinct Graham & Dodd stock selection approach with a macro view that seeks to identify global capital flows • Independent investment management firm established in 1971, acquired by Hudson Valley Bank in 2004 • $1.3 billion in assets under administration* • Team of 21 professionals including investment and client service teams • Client Asset Mix – Institutional 44% – High-Net-Worth 56% OUR PRIMARY OBJECTIVE IS TO INCREASE THE PURCHASING POWER OF OUR CLIENTS’ PORTFOLIOS ASSETS UNDER MANAGEMENT (03/31/2013) $1.3 Billion Cash 8% Equity 73% Fixed 19% *Includes assets under management & advisement |
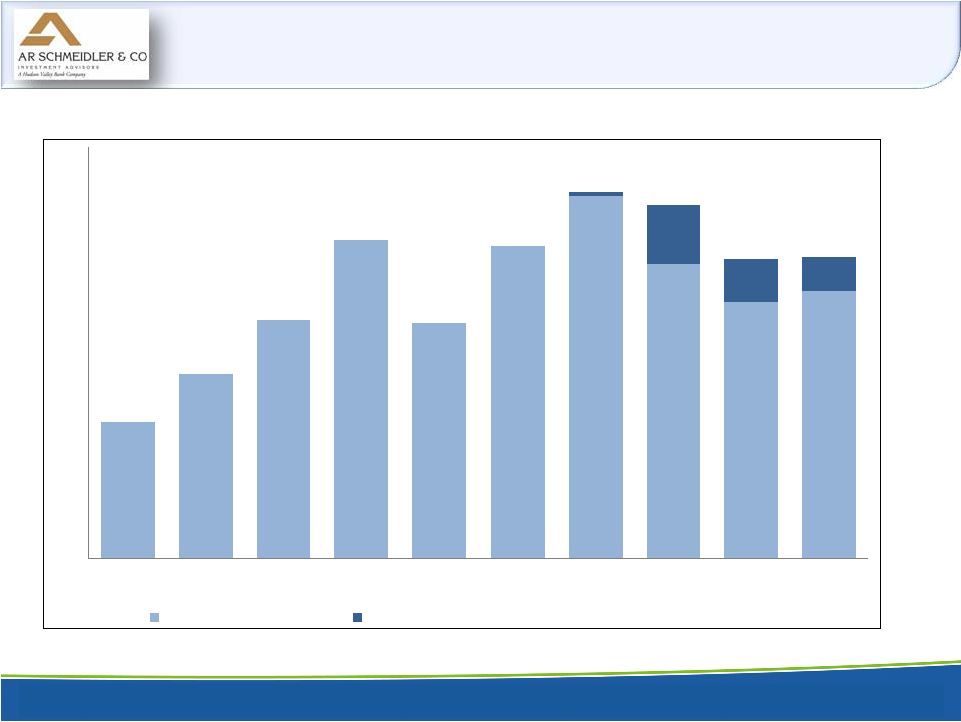 48 Asset Growth 596 809 1,043 1,398 1,031 1,369 1,289 1,123 1,173 261.5 188.7 149.7 1,590 17.9 0 200 400 600 800 1,000 1,200 1,400 1,600 1,800 2004 2005 2006 2007 2008 2009 2010 2011 2012 2013 Assets Under Management Assets Under Advisement |
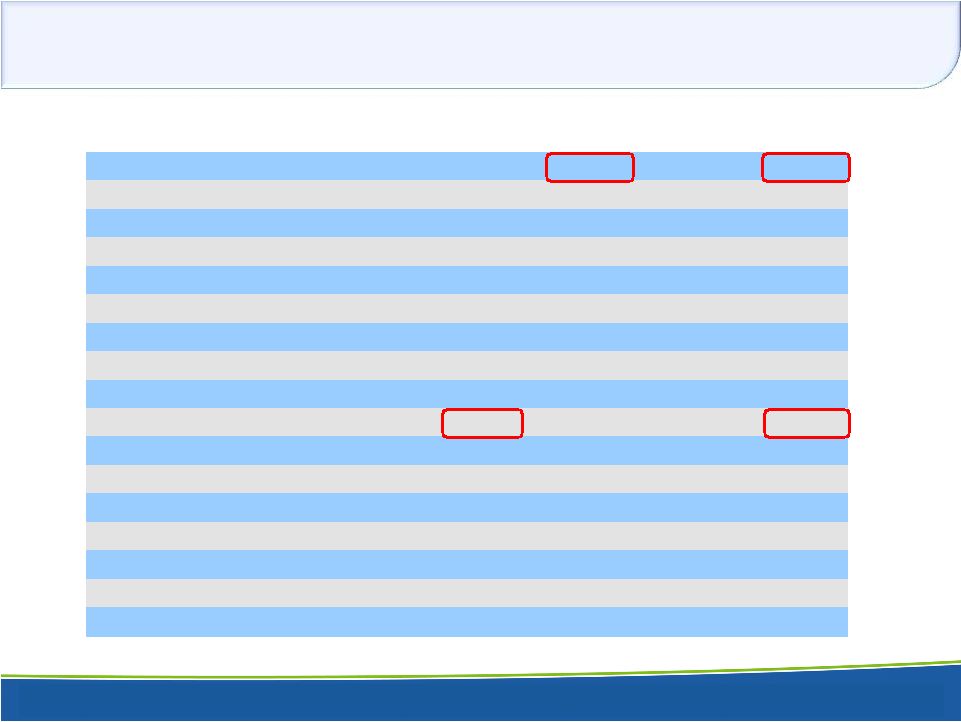
 49 Year 12/31/99 Inception Asset Class To Date To Date To Date Multicap 8.32 134.72 679.17 (1/21/93) Balanced 7.48 126.14 497.54 (12/31/92) Equities 12.02 104.40 562.98 Fixed Income 0.36 110.25 245.68 Index S & P 500 w/div 10.73 36.58 434.31 Russell 3000 w/div 11.07 49.66 448.03 Barclays US Treas Intermediate 0.04 92.05 92.05 Merrill Lynch Corp Bds 1-10 Yrs 0.59 133.05 266.03 Performance data is net of management fees and net of transaction costs. * These performance figures are supplemental information to the GIPS Compliant presentation. MULTICAP & BALANCED PERFORMANCE MARCH 31, 2013 |
 50 EXPAND DISTRIBUTION • HVB – Trust – New York Metro Market • Third Party Programs • Family Offices and Ultra High Net Worth • Foundations and Endowments STRATEGIC AND HIGHLY SELECTIVE ACQUISITIONS • People • Firms Strategy for Growth |
 THANK YOU FOR YOUR INTEREST IN THANK YOU FOR YOUR INTEREST IN HUDSON VALLEY HOLDING CORP. HUDSON VALLEY HOLDING CORP. Ticker: HVB Ticker: HVB www.hudsonvalleybank.com www.hudsonvalleybank.com June 2013 June 2013 |