 Metro New York’s Premier Business Bank Seizing Tomorrow’s Opportunities While Maintaining Our Core Fundamentals August 2013 Exhibit 99.1 |
 1 Safe Harbor Statement “Safe Harbor” Statement under the Private Securities Litigation Reform Act of 1995: This presentation contains various forward-looking statements with respect to earnings, credit quality and other financial and business matters within the meaning of the Private Securities Litigation Reform Act of 1995. These forward-statements can be identified by words such as “expects,” “anticipates,” “intends,” “believes,” “estimates,” “predicts” and words of similar import. The Company cautions that these forward-looking statements are subject to numerous assumptions, risks and uncertainties, and that statements relating to future periods are subject to uncertainty because of the increased likelihood of changes in underlying factors and assumptions. Actual results could differ materially from forward-looking statements. Factors that may cause actual results to differ materially from those contemplated by such forward-looking statements, include, but are not limited to, statements regarding: (a) our ability to comply with the formal agreement entered into with the Office of the Comptroller of the Currency (the “OCC”) and any additional restrictions placed on us as a result of future regulatory exams or changes in regulatory policy implemented by the OCC or other bank regulators; (b) the OCC and other bank regulators may require us to further modify or change our mix of assets, including our concentration in certain types of loans, or require us to take further remedial actions; (c) our ability to deploy our excess cash, reduce our expenses and improve our operating leverage and efficiency; (d) the results of the investigation of A.R. Schmeidler & Co., Inc. by the Securities and Exchange Commission (the “SEC”) and the Department of Labor (the “DOL”) and the possibility that our management’s attention will be diverted to the SEC and DOL investigations and settlement discussions and we will incur further costs and legal expenses; (e) the adverse affects on the business of A.R. Schmeidler & Co., Inc. and our trust department arising from a settlement with the SEC and DOL investigations; (f) our inability to pay quarterly cash dividends to shareholders in light of our earnings, the current and future economic environment, Federal Reserve Board guidance, our Bank’s capital plan and other regulatory requirements applicable to Hudson Valley or Hudson Valley Bank; (g) the possibility that we may need to raise additional capital in the future and our ability to raise such capital on terms that are favorable to us; (h) further increases in our non-performing loans and allowance for loan losses; (i) ineffectiveness in managing our commercial real estate portfolio; (j) lower than expected future performance of our investment portfolio; (k) a lack of opportunities for growth, plans for expansion (including opening new branches) and increased or unexpected competition in attracting and retaining customers; (l) continued poor economic conditions generally and in our market area in particular, which may adversely affect the ability of borrowers to repay their loans and the value of real property or other property held as collateral for such loans; (m) lower than expected demand for our products and services; (n) possible impairment of our goodwill and other intangible assets; (o) our inability to manage interest rate risk; (p) increased expense and burdens resulting from the regulatory environment in which we operate and our inability to comply with existing and future regulatory requirements; (q) our inability to maintain regulatory capital above the minimum levels Hudson Valley Bank has set as its minimum capital levels in its capital plan provided to the OCC, or such higher capital levels as may be required; (r) proposed legislative and regulatory action may adversely affect us and the financial services industry; (s) future increased Federal Deposit Insurance Corporation, or FDIC, special assessments or changes to regular assessments; (t) potential liabilities under federal and state environmental laws. For a more detailed discussion of these factors, see the Risk Factors discussion in the Company’s most recent Annual Report on Form 10-K, and subsequent Quarterly Reports on Form 10-Q. The forward-looking statements included in this presentation are made only as of the date hereof and the Company undertakes no obligation to update or revise any of its forward-looking statements. Unless otherwise noted, information presented is from Company sources. |
 2 Hudson Valley’s Business Model • Commercial bank focused on small and middle market businesses, professional service firms and their principals – they view us as their “private bankers” • Niche businesses synergistically compliment each other to form the core of HVB’s business model • Relationship Focus -- high quality banking products and exceptional personal service Focus on Targeted Niche Segments Attorneys Not-For- Profits Property Managers Real Estate Developers Municipal- ities Trusts General Business |
 3 NOT A TRADITIONAL RETAIL COMMUNITY BANK • A “Community Business Bank” founded to focus on small and middle market commercial customers and their principals • Focus on targeted niche businesses, entrepreneurs and professional service firms with high deposit transaction volume throughout the Metro New York area • Low-cost, core deposits = foundation of customer relationships • We sell service, with a strong commitment to acting as a “private bank” to our niche commercial customers WE LEND WHERE WE LIVE • Providing prudent, conservatively underwritten loans in our home market • Stable and deep management team has extensive in-market experience and is highly accessible to customers • Unique Metro NYC market allows for competitive positioning with high-touch service and significant opportunities for growth A Differentiated Business Model |
 4 Our Mission is Unchanged OUR METRO NYC SMALL- AND MID-SIZED COMMERCIAL CUSTOMERS REMAIN OUR FOUNDATION AND OUR PRIORITY • What changes is the number and diversity of products offered to serve them OBJECTIVE IS TO GAIN COMPETITIVE ADVANTAGE WHILE MAINTAINING COMPLIANCE • More nimble in adapting to new environments, products, and competitors • More effectively serve our niche markets with an even broader array of customized products that meet their needs |
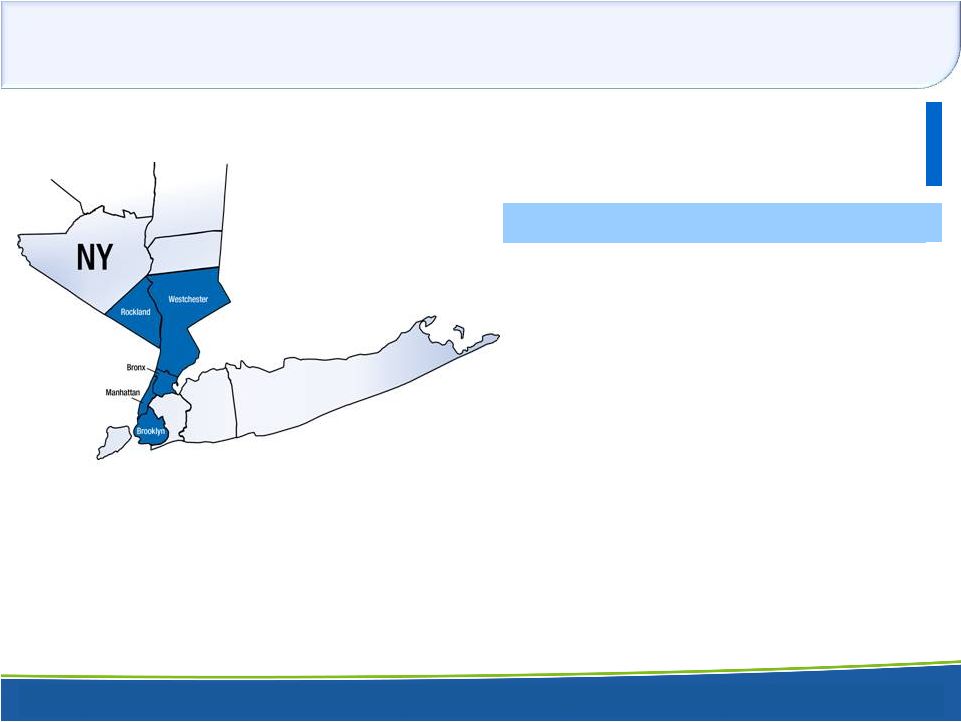   5 Metro New York Franchise • $2.8 billion commercial bank with 28 branches throughout Westchester, Rockland, the Bronx, Manhattan and Brooklyn in New York • Largest bank headquartered in Westchester County • Historic growth achieved by taking share from larger national bank competitors • There are more than 33,000 small and middle market companies with revenues of $1 million or more in this market Source: SNL Financial; deposit data as of 06/30/2012; branch count and map as of 06/30//2013 Branch Network - County Level Deposits Branches (1) US $000s New York State Westchester 17 1,770,169 $ New York (Manhattan) 4 321,111 Bronx 4 194,924 Rockland 2 75,508 Kings (Brooklyn) 1 11,883 (1) 6 Connecticut branches are excluded and closed July-2013 and 2 New York branches consolidated into other branch locations in June-2013 |
  6 Summary Financial Highlights 3.66% 65.00% 0.94% 9.07% 8.6% VS. PEERS: (1) Excludes income from loan sales. Peers = Median of US-based, publicly traded commercial banks with assets between $1-$5 billion as of June 30, 2013. (Dollars in thousands, except per share amounts) 2012 2012 (1) 2013 Net Interest Income $56,804 $56,804 $42,314 Non Interest Income $25,143 $9,208 $8,398 Non Interest Expense $41,910 $41,910 $39,429 Net Income $22,974 $13,603 $7,138 Diluted Earnings Per Share $1.17 $0.69 $0.36 Dividends Per Share $0.36 $0.36 $0.12 Net Interest Margin 4.34% 4.34% 3.12% Return on Average Equity 15.90% 12.24% 4.88% Return on Average Assets 1.63% 1.21% 0.49% Efficiency Ratio 61.97% 61.97% 76.52% Tangible Common Equity Ratio 9.6% 9.6% 9.0% Average Assets $2,820,157 $2,820,157 $2,904,681 Average Net Loans $1,787,290 $1,787,290 $1,415,970 Average Deposits $2,437,442 $2,437,442 $2,540,060 Average Stockholders' Equity $288,918 $288,918 $292,290 Six Months Ended June 30 |
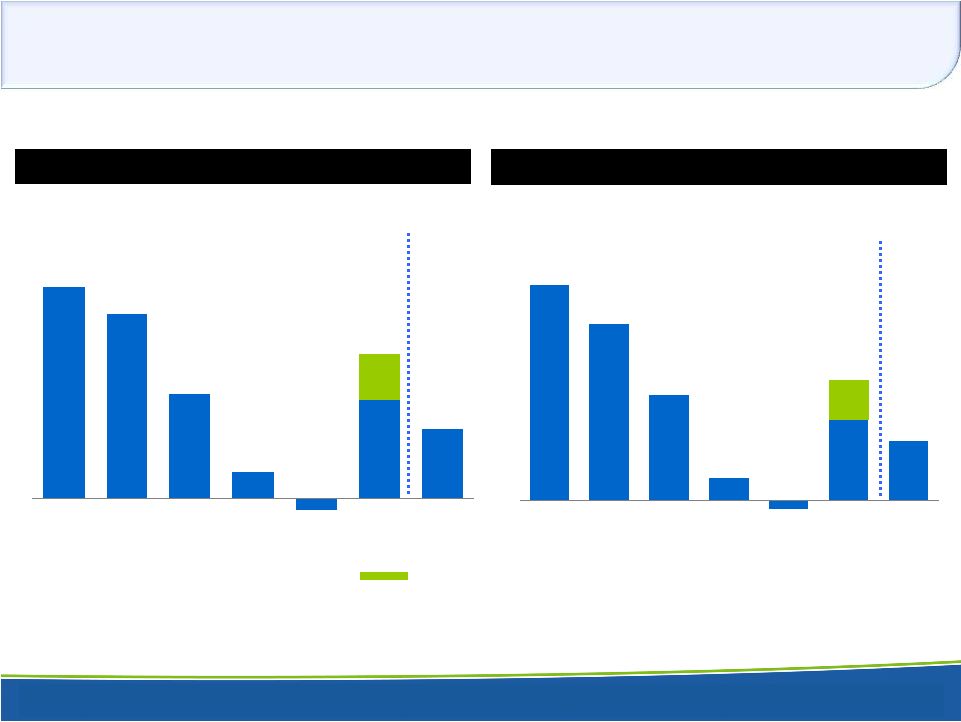 7 Historical Profitability Income from loan sale 1.02 10.05 1.49 1.30 0.74 0.18 0.70 0.49 -0.08 2007 2008 2009 2010 2011 2012 2013Q2 RETURN ON AVERAGE ASSETS % RETURN ON AVERAGE EQUITY % 18.00 14.76 8.74 6.82 4.88 1.75 -0.72 2007 2008 2009 2010 2011 2012 2013Q2 |
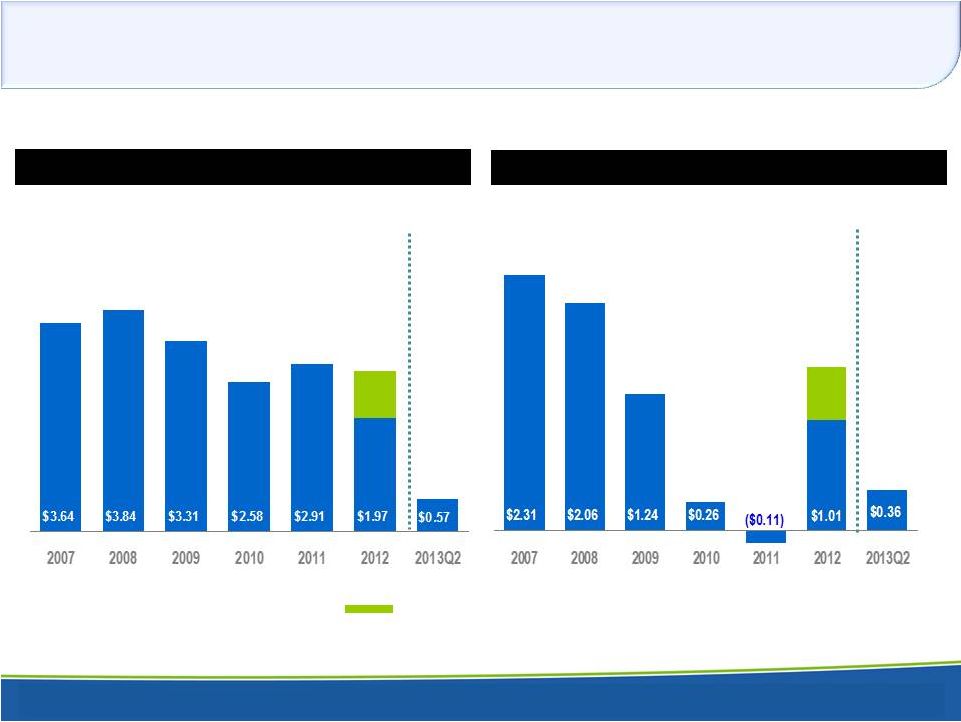 8 Historical Profitability Income from loan sale $2.78 Pre-Tax Pre-Provision Diluted Earnings per Share is a Non-GAAP measure. See Appendix slide 43 for reconciliation $1.49 PRE -TAX PRE -PROVISION DILUTED EARNINGS PER SHARE* DILUTED EARNINGS PER SHARE |
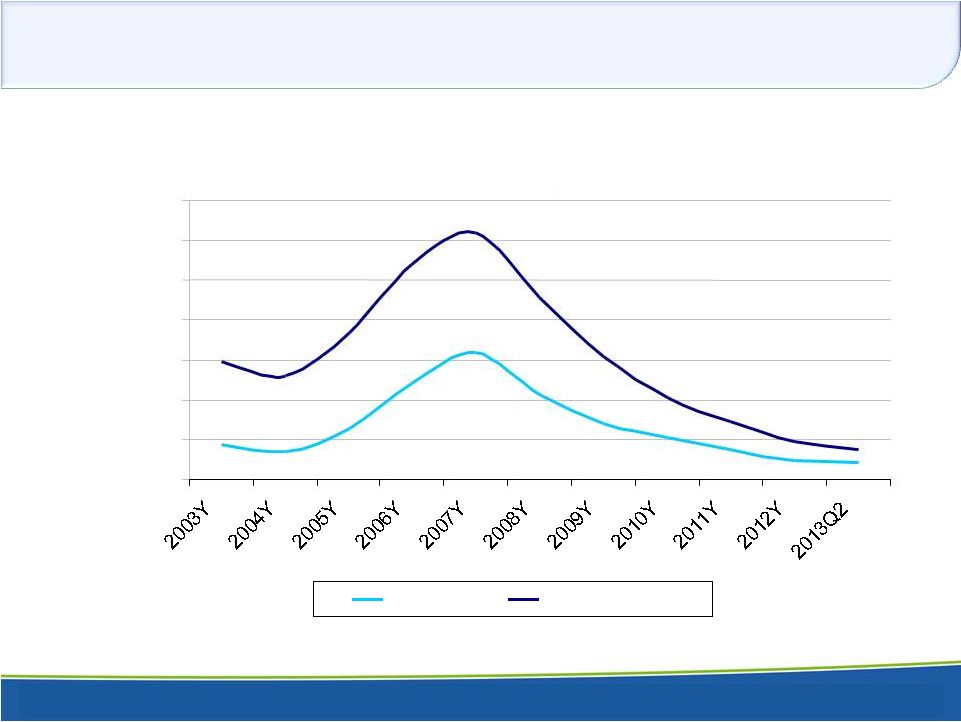
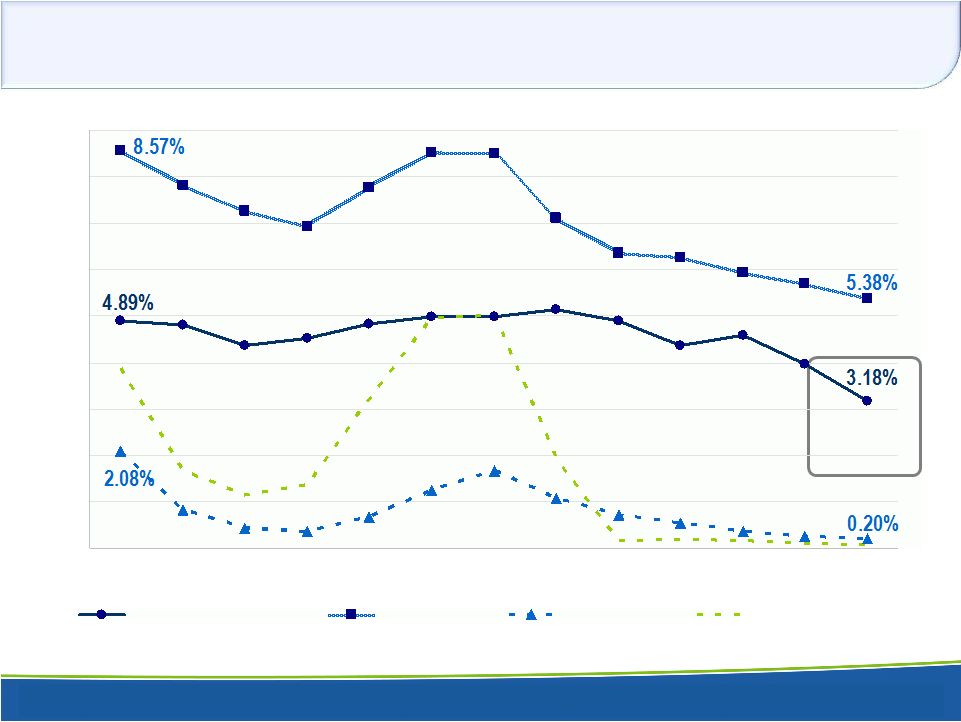 9 Net Interest Margin (1) Fully tax equivalent basis. (2) Peers = Median of US-based, publicly traded commercial banks with assets between $1-$5 billion as of June 30, 2013. 0% 1% 2% 3% 4% 5% 6% 7% 8% 9% 2001 2002 2003 2004 2005 2006 2007 2008 2009 2010 2011 2012 2013Q2 Net Interest Margin (FTE) Yield on Loans Cost of Deposits Federal Funds Rate VS. 3.79% PEERS (1,2) |
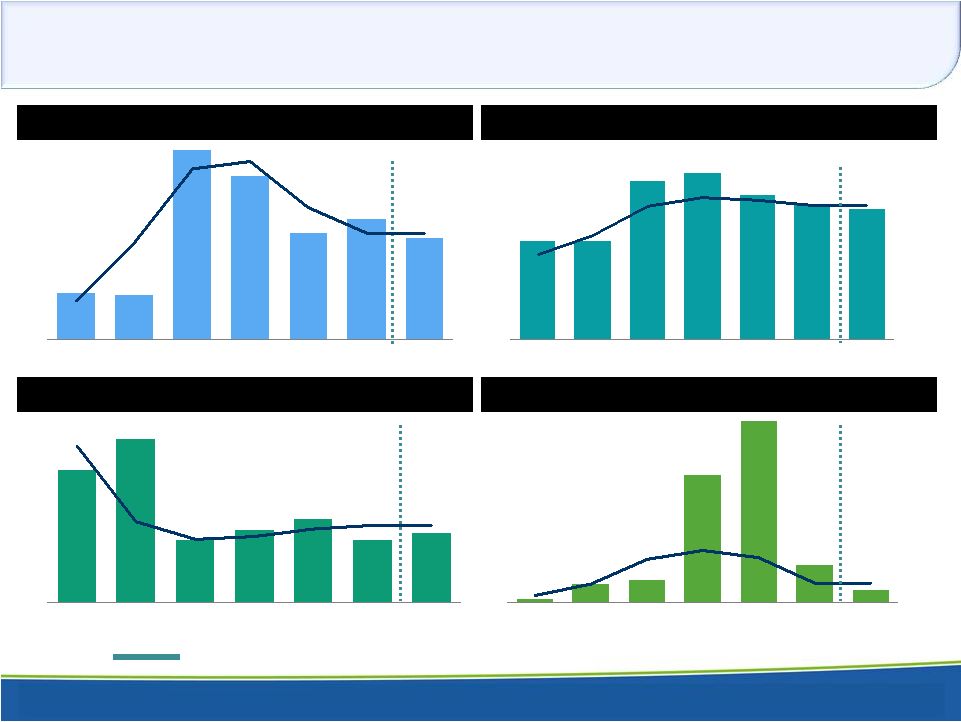
 10 Strong Capital Position Median of US-based, publicly traded commercial banks with assets between $1-$5 billion as of June 30, 2013. 7.9 7.3 10.1 10.0 9.1 9.3 9.0 2007 2008 2009 2010 2011 2012 2013Q2 8.3 7.5 10.2 9.6 8.8 9.3 9.3 2007 2008 2009 2010 2011 2012 2013Q2 12.6 10.1 13.9 13.9 11.3 16.5 16.5 2007 2008 2009 2010 2011 2012 2013Q2 13.8 11.3 15.2 15.2 12.6 17.7 17.7 2007 2008 2009 2010 2011 2012 2013Q2 TANGIBLE COMMON EQUITY / TANGIBLE ASSETS % LEVERAGE RATIO % TIER 1 RISK BASED CAPITAL RATIO % TOTAL RISK BASED CAPITAL RATIO % |
 11 Summary – Why HVB is Different • “Private Bank” model emphasizes selling service over products • Value of service relationship outweighs price sensitivity in HVB’s highly specialized, targeted niche customer segments • Loyal depositors trust HVB with their operating cash management needs, providing a stable source of low-cost deposits – and an opportunity for future business |
 12 Growth Strategy ORGANIC GROWTH IS OUR STRENGTH • We have been successful in going to market in a very focused way in the highly competitive Metro NYC commercial banking market – Larger bank M&A in the market provides opportunities to acquire new customers and new talent with intact books of business • Referrals and reputation for service have historically generated profitable, controlled growth in customers • Always seeking to grow sources of fee revenue – A.R. Schmeidler acquisition in 2004 is a good example of investing in a niche business with strong fee generating capabilities • Breadth and depth of niche business markets in Metro NYC provide unusually high growth opportunities compared to other areas of the U.S. • Opportunistic and targeted M&A could supplement organic growth in the future, particularly in fee income |
 13 HOW DO WE DO IT? • Weekly reporting from branches about significant customer activity – Reporting provides market and customer intelligence – Reported to Chairman, President, EVPs, key managers – Outlines loan/deposit/customer opportunities – Highlights significant accomplishments from the week • Reporting to the Board on Relationships at Risk – Raises executive awareness – NO SURPRISES – Flat corporate structure means highest-level executives know the customers and can personally reach out Institutional Attention to Relationships |
 14 Relationship Management = Differentiation • Hiring the right people to manage and service relationships • All 3,600 Relationships assigned to an Officer – approximately 2/3rds assigned to a Relationship Manager (RM) – Relationships are measured on total balances, not just loan balances – Depositors receive high-touch personalized service just like borrowers • Branch Managers have the other 1/3rd assigned to them and “co-manage” all RM assigned relationships • Branch Managers and Relationship Managers have very good, cooperative relationships • Branches responsible for daily servicing and providing an exceptional customer banking experience • Relationship Managers provide ongoing professional skill, communication and any necessary decision making |
 15 Leveraging Relationships for Additional Business RELATIONSHIP MANAGEMENT DEEP DIVE INITIATIVE • Objective: Ongoing annual Structured, joint (Branch Manager/RM) review and meeting with all relationships to – Review existing business – Seek additional business – Ask for referrals • The Private Banking and Middle Market Model (versus the Retail banking approach) |
 16 Balance Sheet Diversification is Underway OUR BALANCE SHEET IS IN TRANSITION • Redeployment efforts are underway to diversify balance sheet in an efficient and profitable way – We are implementing three approaches simultaneously: 1. Asset purchases – NEAR TERM 2. Loan participations with other institutions – NEAR & LONG TERM 3. Building internal ability to originate, underwrite and service non-CRE credits – LONG TERM |
 17 Liquidity Deployment and Portfolio Diversity • Primarily in our metro New York markets • Enhancing and complementing small- and mid-sized commercial banking customer focus • Additional opportunities outside CRE • Possible initiatives include: – Additional asset purchases – Loan participations – Diversification |
 18 Liquidity Deployment: In-Market Participations • Build on longstanding CRE-participation experience with new opportunities – Continue to underwrite both the borrower and the lead lender • Some examples – New large-regional bank relationship • Participations on upper middle market and large corporate C&I – New peer-bank relationship • Receivables financing • Mortgage warehouse financing • Other non-CRE lending |
 19 Liquidity Deployment: Diversifying Offering • New products for our niche commercial customers and their owners, principals and managers • Focused on metro New York • Some examples – Equipment leasing • Excellent opportunities for deals sized from $250,000 to $5 million • Categories including building equipment (e.g. HVAC), business, office, medical, dental and light industrial equipment – Jumbo residential mortgage and home equity products complementing commercial • For existing commercial customer owners, principals and managers, a broader array of competitive residential options than previously • For prospective customers, a whole new line of products at our bankers’ disposal to develop new commercial relationships • No retail marketing or advertising |
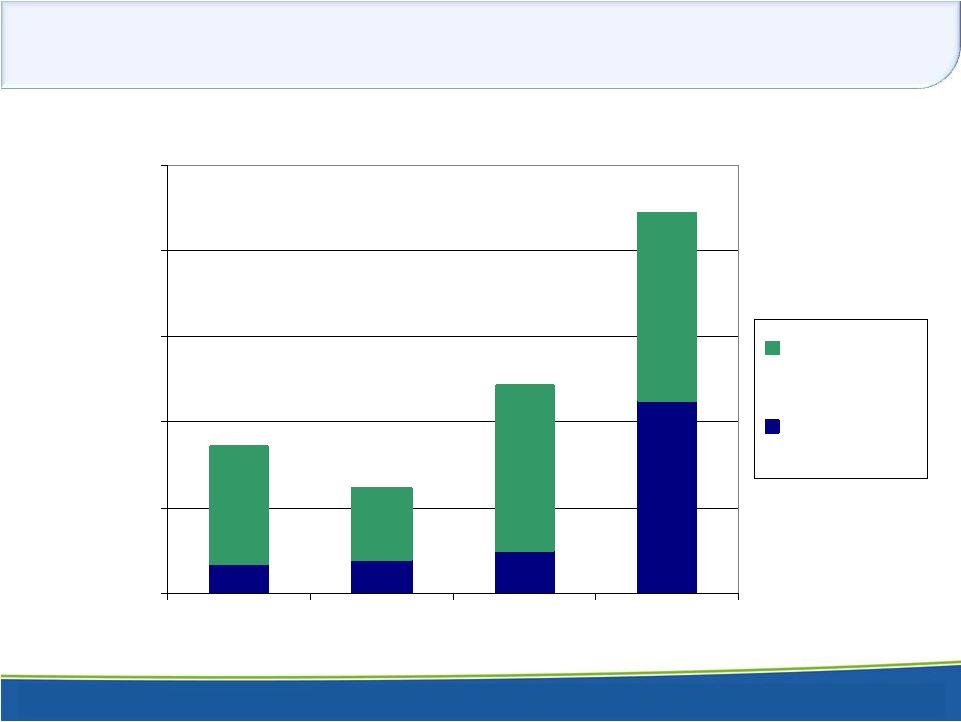 20 Liquidity Deployment $- $50,000,000 $100,000,000 $150,000,000 $200,000,000 $250,000,000 2012 Q3 2012 Q4 2013 Q1 2013 Q2 Investment Purchases Loan Originations & Purchases |
 21 Redeployment Aimed at Balance Sheet Efficiency Diversifying by simultaneously implementing three approaches 1.Asset purchases – CURRENT • $36.3 Million in Residential ARMs purchased in 2Q13 • Evaluating others 2.Loan participations with other institutions – NEAR TERM • Building on HVB’s longstanding CRE-participation experience by leveraging other institutions’ expertise and infrastructure for C&I and residential lending 3.Building internal ability to originate, underwrite and service non-CRE credits – NEAR & LONG TERM • Focus is new products for longstanding niche business and industry targets in metro NYC – New commercial lending including equipment leases, lines of credit, term loans, ABL, etc. – Complementary jumbo mortgage and HELOC products for RMs to offer commercial-account principals All while continuing to leverage historic strength in CRE underwriting to capitalize on solid demand from quality CRE credits |
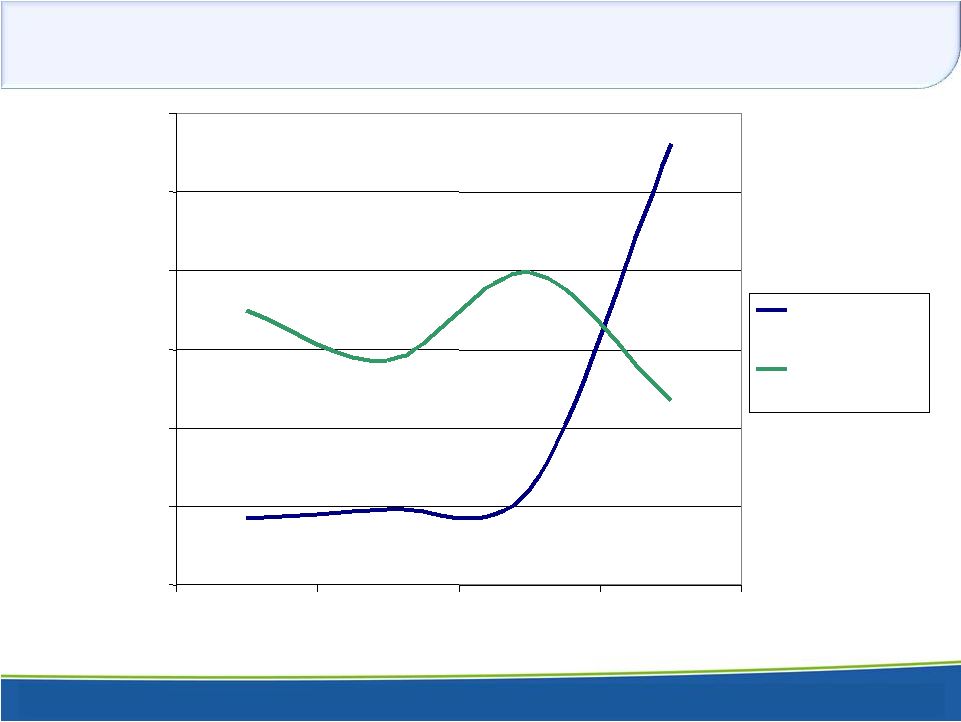 22 Loan Originations and Payoffs $- $20,000,000 $40,000,000 $60,000,000 $80,000,000 $100,000,000 $120,000,000 2012 Q3 2012 Q4 2013 Q1 2013 Q2 Loan Originations & Purchases Loan Payoffs & Paydowns |
 23 Successful Measures to Manage Concentrations MEASURES TO MANAGE CONCENTRATIONS • Effective risk management process • Active pipeline management process • Commitment to developing non-CRE lines of business • Participate with in-market financial institutions to reduce CRE exposure while maintaining strategic relationships CONCENTRATION MEASURES Q1-13 Q2-13 TARGET CRE % of Risk Based Capital 319.7% 333.7% 326.6% < 400% Classified Assets % of Risk Based Capital 36.2% 36.2% 31.0% < 25% Q4-12 In 2Q13 purchased $36.3 million in residential ARMs supported by in-market collateral |
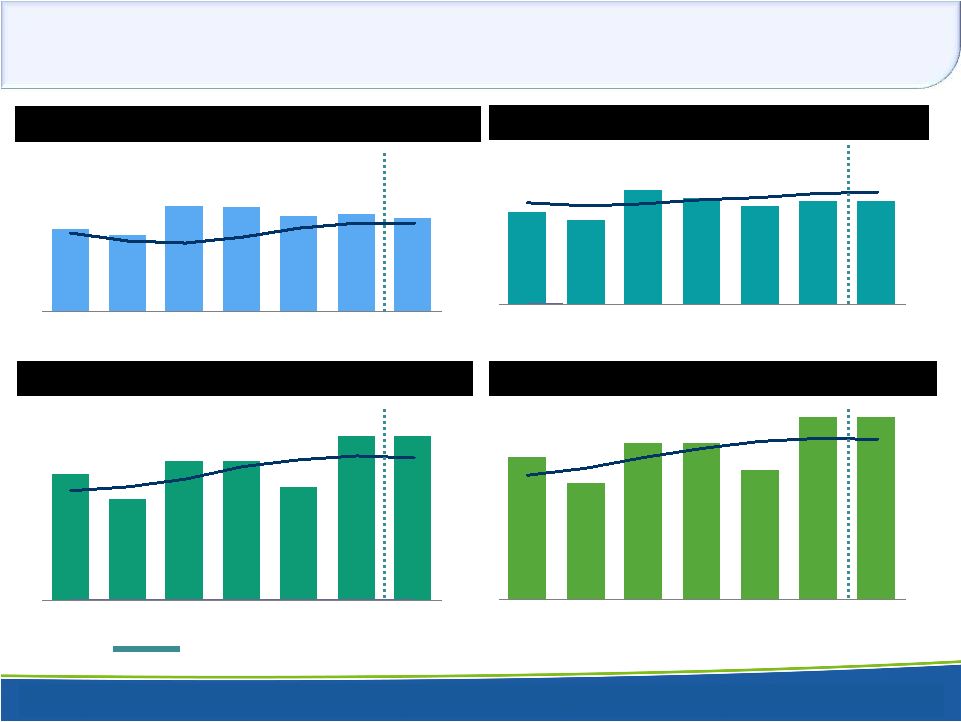
 24 Asset Quality Measures Strengthen Balance Sheet NONACCRUAL LOANS / TOTAL ASSETS % LOAN LOSS RESERVE / GROSS LOANS % LOAN LOSS RESERVE / NONACCRUAL LOANS % NET CHARGEOFFS / AVERAGE NET LOANS % Median of US-based, publicly traded commercial banks with assets between $1-$5 billion as of June 30, 2013. 1.33 1.33 2.13 2.25 1.95 1.81 1.75 2007 2008 2009 2010 2011 2012 2013Q2 0.47 2.70 3.85 0.25 0.07 0.77 0.39 2007 2008 2009 2010 2011 2012 2013Q2 0.46 0.44 1.90 1.64 1.07 1.20 1.01 2007 2008 2009 2010 2011 2012 2013Q2 162 200 76 89 103 76 86 2007 2008 2009 2010 2011 2012 2013Q2 |
 25 Core Deposits – The Jewel of the Franchise Low Cost, Dependable Source of Funding How we Identify, Maintain and Grow Them! |
 26 Institutional Attention to Relationships HOW DO WE DO IT? • Business managed by relationship profitability rather than volume of accounts – Very different from traditional retail banking models • “Relationship Status” reflects achievement of a profitability hurdle • “Resumes” for each actively maintained relationship – i.e. how the business came into the Bank; who their key service providers are (attorney, accountant, insurance broker, etc.); how they like to be entertained – Who really makes the banking decision in each relationship • Recognize that the core deposit is a key source of value for both our clients and for Hudson Valley – value proposition is mutually beneficial for the clients we target |
 27 Marketing for Core Deposits HOW WE IDENTIFY, SECURE AND GROW THEM! • Marketing to the right business segments – large deposits, low activity, not as rate sensitive • Marketing “relationship” and “service” versus interest rate • Utilizing testimonials and recommendations of current customers – Ongoing calling – 10,200 documented calls in 2012 and 5,272 in the 1st half of 2013 – Calls made to prospective individuals/businesses that have recently interacted with a Hudson Valley RM or client |
 June 30, 2012 HVB HVB Peers (2) Core Deposits / Total Deposits (1) 96% 97% 88% Non Interest Bearing/Total Deps 40% 38% 21% Deposits / Total Funding 98% 98% 92% Loans / Deposits Ratio (3) 62% 55% 80% Cost of Total Deposits 26 bp 20 bp 38 bp Deposit Metrics June 30, 2013 Period Ended 28 A Core Deposit Driven Franchise (1) Core Deposits defined as total deposits less time deposits >$100,000. (2) Peers = Median of US-based, publicly traded commercial banks with assets between $1-$5 billion as of June 30, 2013. (3) Represents Net Loans to Deposits |
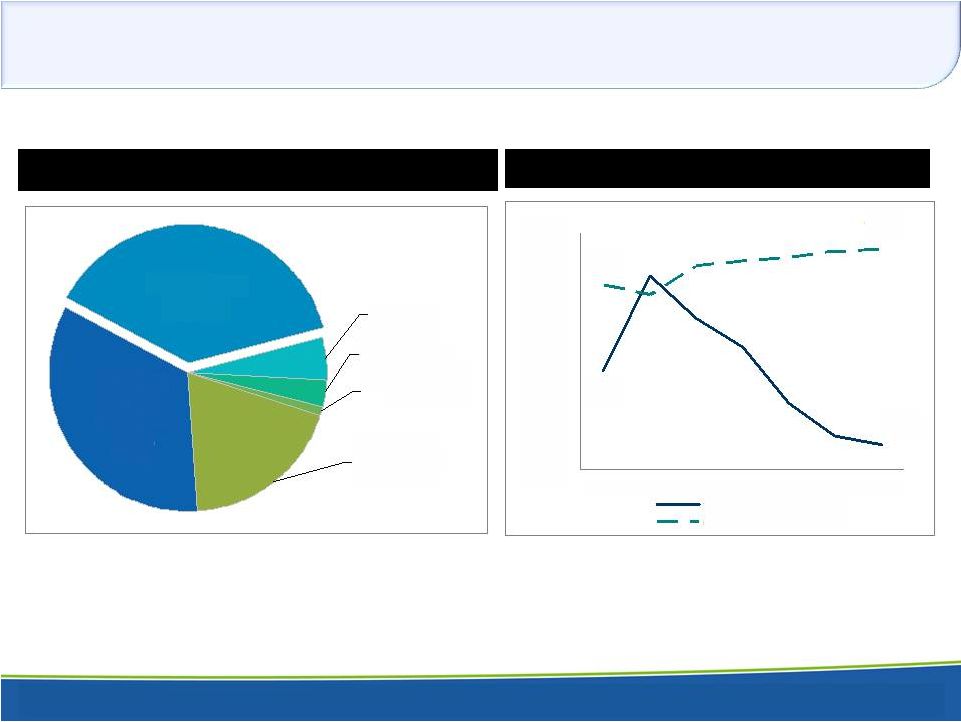 29 A Core Deposit Driven Franchise DEPOSIT COMPOSITION – June 30, 2013 (1) Net loans excluding loans held-for-sale. (2) Core Deposits defined as total deposits less time deposits >$100,000. Money Market, 34% Demand, 38% Savings, 5% Time > $100m, 3% Time < $100m, 1% Checking with Interest, 19% 71% 55% 89% 97% 50% 60% 70% 80% 90% 100% 2007 2008 2009 2010 2011 2012 2013 Loan/Dep Ratio Core/Total Deposits (2) (1) TOTAL DEPOSITS – $2,625 MILLION CORE FUNDING |
 30 HVB Funding Advantage Peers = Median of US-based, publicly traded commercial banks with assets between $1-$5 billion as of June 30, 2013. Cost of Deposits 0.00% 0.50% 1.00% 1.50% 2.00% 2.50% 3.00% 3.50% HVB National Peers |
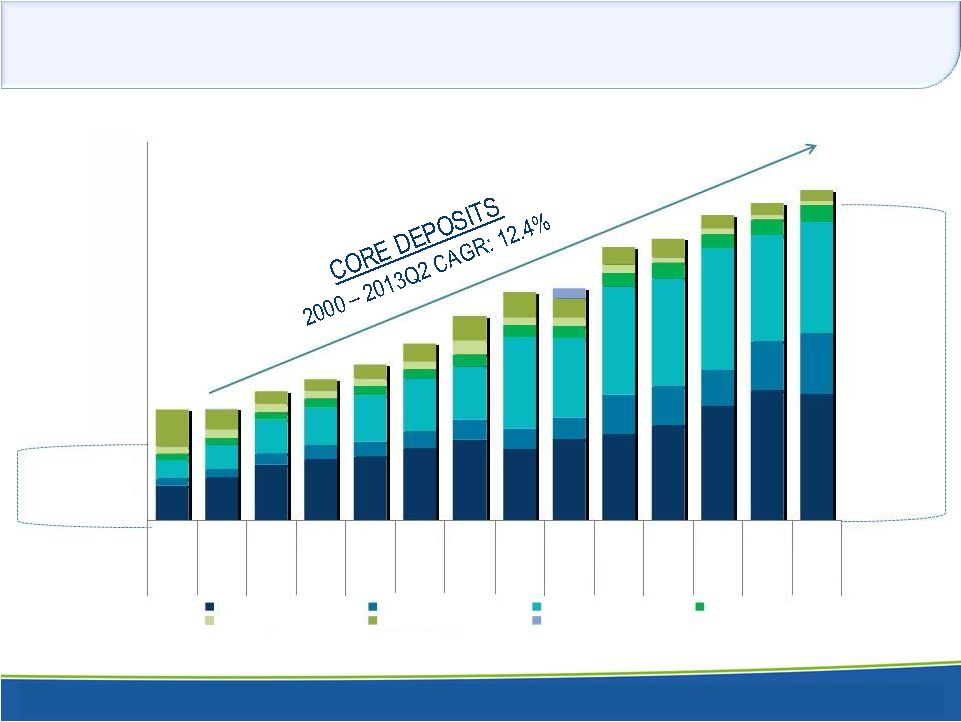 31 Deposit Growth Drives Long-Term Profitability 67.2% CORE DEPOSITS (1) 96.6% CORE DEPOSITS (1) VS. 88.3% FOR PEERS (2) (1) Core deposits defined as total deposits less time deposits > $100,000 and brokered deposits. December 2006 Includes approximately $127 million of deposits as part of New York National Bank acquisition (2) Peers = Median of US-based, publicly traded commercial banks with assets between $1-$5 billion as of June 30, 2013. $0 $250 $500 $750 $1,000 $1,250 $1,500 $1,750 $2,000 $2,250 $2,500 $2,750 $3,000 $880 $888 $1,027 $1,125 $1,235 $1,408 $1,626 $1,813 $1,839 $2,173 $2,234 $2,425 $2,520 $2,625 Dec Dec Dec Dec Dec Dec Dec Dec Dec Dec Dec Dec Dec Jun 2000 2001 2002 2003 2004 2005 2006 2007 2008 2009 2010 2011 2012 2013 Demand Deposits Checking with Interest Money Market Accounts Savings Accounts Time Deposits < $100m Time Deposits > $100m Brokered Deposits |
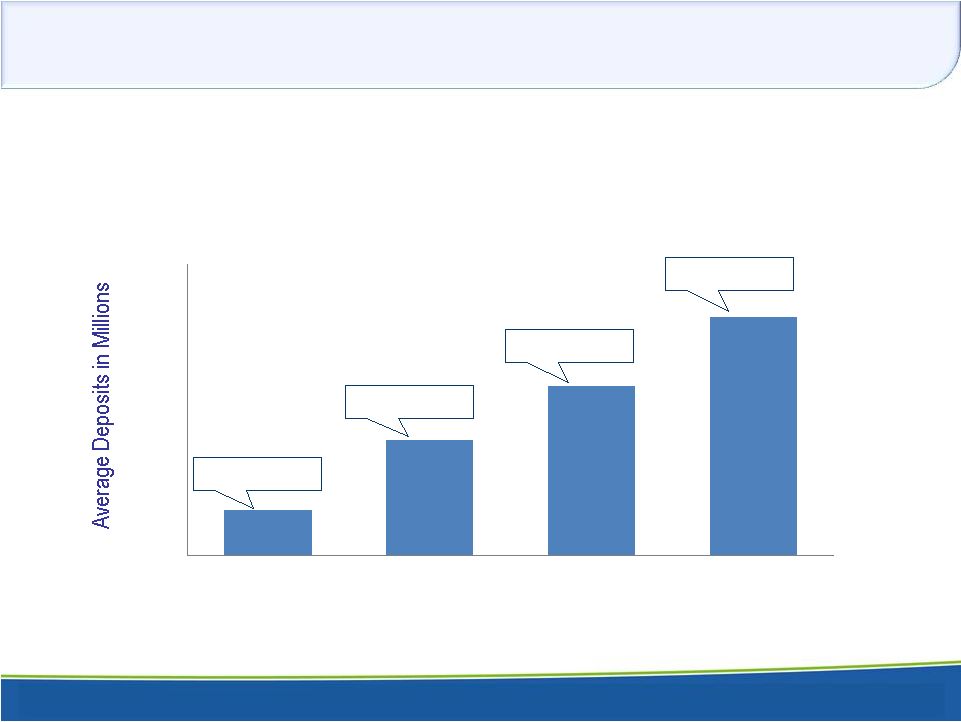 32 Branch Network – Local Service & Execution • Low-cost branch infrastructure supports core deposit franchise • Branch value grows with age – deeper penetration into existing relationships and new referrals increase deposits per branch over time 6 Branches 11 Branches (2) (1) 6 Connecticut branches excluded closed July - 2013 (2) 2 New York branches were consolidated June - 2013 6 Branches 5 Branches June 2013 YTD Avg Deposit Balances per Branch (1) $21.3 $55.1 $81.3 $114.3 $0 $20 $40 $60 $80 $100 $120 $140 < 5 Yrs 5-10 Yrs 10-20 Yrs > 20 Yrs Age of Branch |
 33 Key Takeaways HISTORIC DIFFERENTIATING QUALITIES REMAIN OUR STRENGTH • Low-cost core deposit base = source of stable funding for future growth • Efficient mindset is in our DNA • “Private Bank” approach wins and retains customers AN INCREASINGLY NIMBLE AND SOPHISTICATED BANK • Ahead of the curve in adopting best practices typically reserved for $10-$25 billion banks • Increased sophistication = heightened competitive edge • Developing diversified lending skills as a strategic and tactical focus USING ENHANCED OPERATIONAL EFFECTIVENESS TO OUR ADVANTAGE • Quicker reaction to customers’ needs • Quicker reaction to regulatory and market changes • Quicker ability to diversify lending sources and maximize capital allocation – Results in: Quicker ability to grow shareholder returns |
 34 THANK YOU THANK YOU FOR YOUR INTEREST IN FOR YOUR INTEREST IN HUDSON VALLEY HOLDING HUDSON VALLEY HOLDING CORP. CORP. |
 35 Ticker: HVB Ticker: HVB www.hudsonvalleybank.com www.hudsonvalleybank.com APPENDIX APPENDIX FINANCIAL DETAIL AND NON-GAAP FINANCIAL DETAIL AND NON-GAAP RECONCILIATION RECONCILIATION |
 36 New York Metro Market Profile DEMOGRAPHICS • Along with being rich in deposits and HVB’s niche businesses, the market also has very favorable demographics Consumer Demographics (1) Manhattan / NY Brooklyn Bronx Westchester Rockland Total Population 1,585,873 2,504,700 1,385,108 949,113 311,687 19,378,102 Housing Units (2) 847,090 1,000,293 511,896 370,821 104,057 8,108,103 Home ownership rate 22.8% 30.3% 20.7% 62.7% 71.0% 55.2% Persons per household, 2006- 2010 2.09 2.68 2.79 2.64 3.02 2.59 Median household income 2006- 2010 $64,971 $43,567 $34,264 $79,619 $82,534 $55,603 Median Income Per Capita $59,149 $23,605 $17,575 $47,814 $34,304 $30,948 Unemployment Rate (3) 8.7% 9.4% 11.8% 6.2% 5.9% 7.6% Business Demographics (4) Revenues: < $1 million 137,028 85,670 29,701 54,096 16,678 323,173 Revenues: $1 million - $5 million 13,535 4,113 1,398 3,172 914 23,132 Revenue: > $5 million 6,651 1,129 472 1,238 266 9,756 Revenue: Not reported 18,393 8,897 4,465 5,606 1,669 39,030 Total Business Entities 175,607 99,809 36,036 64,112 19,527 395,091 (3) County unemployment rates as of June, 2013 Bureau of Labor Statistics (4) Hoovers|D&B (2) A housing unit is defined as a house, an apartment, a mobile home, a group of rooms, or a single room that is occupied (1) 2010 US Census Quick Facts by State|County |
 37 New York Metro Market Profile NICHE BUSINESSES • Just as this market is deposit rich, it is also rich with HVB’s targeted niche businesses • We have leading market share among Westchester attorneys and property managers • High growth potential in all other segments and counties, each with HVB market share currently <2% 1 – Dunn & Bradstreet Market Data based on Primary & Secondary NAICS codes DATA DEMONSTRATES TREMENDOUS UNTAPPED ORGANIC GROWTH POTENTIAL IN HVB’S CORE NICHE MARKETS Segment Manhattan / NY Brooklyn Bronx Westchester Rockland Total Attorney 9,251 1,784 546 2,266 563 14,410 Not for Profit 7,512 8,413 3,288 3,322 1,365 23,900 Real Estate Investors 4,169 1,251 578 933 227 7,158 Property Managers 5,253 3,202 1,269 1,907 499 12,130 Municipalities 809 417 283 537 197 2,243 Sub-Total 26,994 15,067 5,964 8,965 2,851 59,841 HVB NICHE BUSINESS BY COUNTY (1) |
 38 Client Retention RELATIONSHIPS ARE NOT BUILT OVERNIGHT – IT TAKES TIME DISTRIBUTION OF STRATEGIC CLIENT RELATIONSHIPS (AS OF JUNE 30, 2013) SEGMENT % <2 YEARS TENURE % 2 TO 5 YEARS TENURE % 5 TO 10 YEARS TENURE % > 10 YEARS TENURE Attorney 4% 29% 30% 36% Not-for-Profit 5% 31% 19% 45% Property Managers / Real Estate Investors 13% 40% 14% 33% Municipalities 4% 27% 13% 56% General Business 5% 26% 21% 48% • The wait is worth it – the value of the relationship generally increases over time |
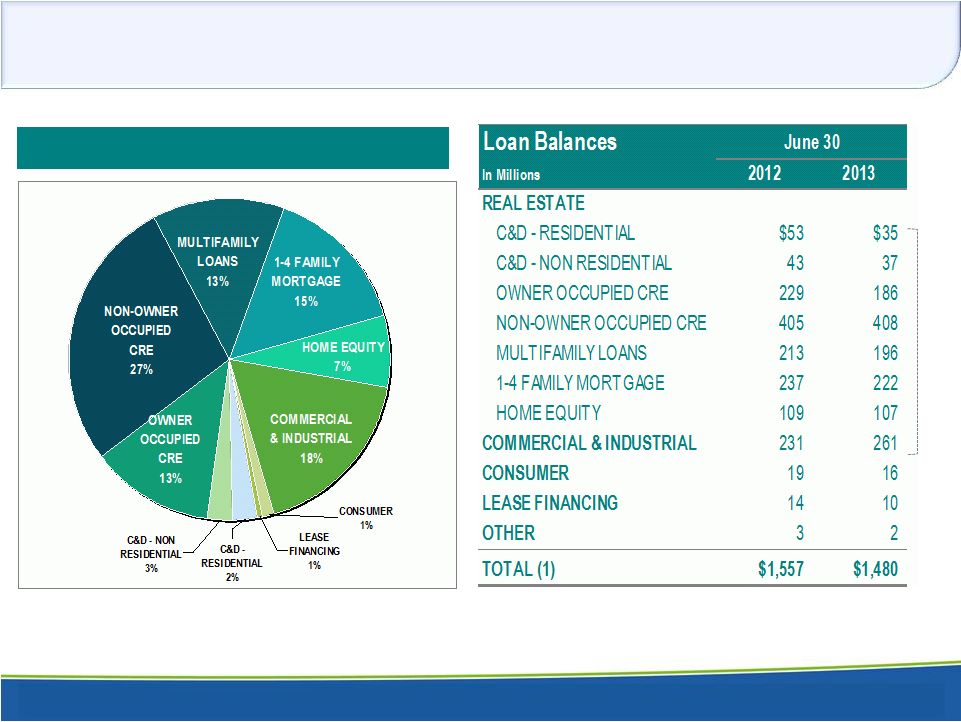 39 Strength in Diversified Commercial Lending 80% LOAN COMPOSITION – June 30, 2013 (1) Total is gross of unearned income. |
 40 HVB General Business Average Loan = $509,713 Businesses in Market > 395,091 > $201 BILLION LENDING OPPORTUNITY Market Potential Example AS OF JUNE 30, 2013 SEGMENT % OF STRATEGIC CLIENT RELATIONSHIPS % OF TOTAL BANK DEPOSITS AVERAGE DEPOSITS PER STRATEGIC CLIENT RELATIONSHIP (IN THOUSANDS) % OF STRATEGIC CLIENT RELATIONSHIPS WITH LOANS Attorney 29% 20% $853 29% Not-for-Profit 18% 14% $919 38% Property Managers/Real Estate Investors 17% 23% $1,618 59% Municipalities 2% 8% $4,970 7% General Business 34% 24% $839 49% TOTAL / AVERAGE 100% 89% $1,070 |
 41 Quarterly Summary Financial Highlights (a) Excludes income from loan sales. Dollars in thousands, except per share amounts Q3 2011 Q4 2011 Q1 2012 (a) Q1 2012 Q2 2012 Q3 2012 Q4 2012 Q1 2013 Q2 2013 Net Interest Income $30,038 $30,739 $31,296 $31,296 $25,508 $24,115 $22,410 $21,246 $21,068 Non Interest Income $5,714 $4,136 $4,419 $20,354 $4,789 $4,353 $4,346 $4,517 $3,881 Non Interest Expense $20,090 $18,967 $20,876 $20,876 $21,034 $20,035 $20,593 $19,611 $19,818 Net Income (Loss) $8,508 ($22,901) $8,656 $18,013 $4,961 $3,134 $3,073 $3,651 $3,487 Net Interest Margin 4.47% 4.60% 4.75% 4.75% 3.93% 3.60% 3.28% 3.18% 3.06% Diluted Earnings (Loss) Per Share $0.43 ($1.17) $0.44 $0.92 $0.25 $0.16 $0.16 $0.18 $0.18 Dividends Per Share $0.18 $0.18 $0.18 $0.18 $0.18 $0.18 $0.18 $0.06 $0.06 Return on Average Equity 11.33% -30.07% 12.20% 25.51% 6.72% 4.32% 4.18% 5.02% 4.75% Return on Average Assets 1.18% -3.19% 1.21% 2.53% 0.71% 0.44% 0.43% 0.51% 0.47% Efficiency Ratio 56.67% 52.79% 56.81% 56.81% 68.06% 69.33% 75.73% 74.97% 78.12% Tangible Common Equity Ratio 9.6% 9.1% 9.6% 9.6% 9.6% 9.2% 9.3% 9.6% 9.0% Average Assets $2,872,159 $2,867,304 $2,845,223 $2,845,223 $2,795,090 $2,874,634 $2,883,086 $2,859,443 $2,949,423 Average Net Loans $1,928,888 $2,028,587 $1,997,391 $1,997,391 $1,577,190 $1,505,942 $1,467,153 $1,422,132 $1,409,875 Average Deposits $2,468,359 $2,463,056 $2,466,159 $2,466,159 $2,408,726 $2,489,378 $2,514,818 $2,493,021 $2,586,583 Average Stockholders' Equity $300,338 $304,624 $282,459 $282,459 $295,378 $290,189 $293,886 $290,950 $293,616 Earnings |
  42 Quarterly Loan Balances (1) Total is gross of unearned income. Dollars in Millions 3Q 2011 4Q 2011 1Q 2012 2Q 2012 3Q 2012 4Q 2012 1Q 2013 2Q 2013 REAL ESTATE C&D - RESIDENTIAL 62 53 51 53 48 34 27 35 C&D - NON RESIDENTIAL 83 57 56 43 43 41 43 37 OWNER OCCUPIED CRE 318 244 256 229 195 181 177 186 NON-OWNER OCCUPIED CRE 500 447 449 405 389 369 399 408 MULTIFAMILY LOANS 507 228 225 213 209 196 195 196 1-4 FAMILY MORTGAGE 187 175 232 237 214 216 189 222 HOME EQUITY 118 113 111 109 109 110 106 107 COMMERCIAL & INDUSTRIAL 222 219 222 231 266 289 250 261 CONSUMER 28 27 27 19 20 19 17 16 LEASE FINANCING 13 12 15 14 14 14 11 10 OTHER 2 0 1 3 3 3 1 2 TOTAL (1) $2,040 $1,575 $1,645 $1,557 $1,510 $1,472 $1,415 $1,480 Period Ending |
 43 Non-GAAP Reconciliation (a) Year Ended Dec 31,2012 (b) The loan sale in the first quarter of 2012 resulted in a gross gain of $15,935. Related income taxes totaled $6,578. Excluding Loan Sale in thousands except share and per share numbers 2007 2008 2009 2010 2011 2012(a) 2012(a,b) 2013 Net Income as reported 34,483 $ 30,877 $ 19,012 $ 5,113 $ (2,137) $ 29,181 $ 19,824 $ 7,138 $ Income attributable to participating shares as reported - - - - - (85) (57) (96) Net Income attributable to common shares as reported 34,483 $ 30,877 $ 19,012 $ 5,113 $ (2,137) $ 29,096 $ 19,766 $ 7,042 $ Net Income as reported 34,483 $ 30,877 $ 19,012 $ 5,113 $ (2,137) $ 29,181 $ 19,824 $ 7,138 $ Exclude: Income Tax (1) 18,259 15,646 7,310 (1,406) (5,413) 16,945 10,367 3,083 Provision for Loan Loss (2) 1,470 11,025 24,306 46,527 64,154 8,507 8,507 1,061 Income attributable to participating shares (3) - - - - - (158) (112) (152) Pre-tax, Pre-provision Earnings 54,212 $ 57,548 $ 50,628 $ 50,234 $ 56,605 $ 54,474 $ 38,586 $ 11,130 $ Weighted Average Diluted common shares 14,906,752 14,973,866 15,307,674 19,455,971 19,462,055 19,545,037 19,545,037 19,572,975 Diluted Earnings per Share as reported 2.31 $ 2.06 $ 1.24 $ 0.26 $ (0.11) $ 1.49 $ 1.01 $ 0.36 $ Effects of (1) and (2) above 1.33 $ 1.78 2.07 2.32 3.02 1.30 0.96 0.21 Pre-Tax, Pre-Provision Diluted Earnings per Common Share 3.64 $ 3.84 $ 3.31 $ 2.58 $ 2.91 $ 2.79 $ 1.97 $ 0.57 $ Tangible Equity Ratio: Total Stockholders' Equity: As reported 203,687 $ 207,500 $ 293,678 $ 289,917 $ 277,562 $ 290,971 $ 290,971 $ 289,466 $ Less: Goodwill and other intangible assets 20,296 25,040 27,118 26,296 25,493 24,745 24,745 24,650 Tangible stockholders' equity 183,391 $ 182,460 $ 266,560 $ 263,621 $ 252,069 $ 266,226 $ 266,226 $ 264,816 $ Total Assets: As reported 2,330,748 $ 2,540,890 $ 2,665,556 $ 2,669,033 $ 2,797,670 $ 2,891,246 $ 2,891,246 $ 2,981,975 $ Less: Goodwill and other intangible assets 20,296 25,040 27,118 26,296 25,493 24,745 24,745 24,650 Tangible assets 2,310,452 $ 2,515,850 $ 2,638,438 $ 2,642,737 $ 2,772,177 $ 2,866,501 $ 2,866,501 $ 2,957,325 $ Tangible equity ratio 7.9% 7.3% 10.1% 10.0% 9.1% 9.3% 9.3% 9.0% |
 44 THANK YOU FOR YOUR INTEREST IN THANK YOU FOR YOUR INTEREST IN HUDSON VALLEY HOLDING CORP. HUDSON VALLEY HOLDING CORP. Ticker: HVB Ticker: HVB www.hudsonvalleybank.com www.hudsonvalleybank.com August 2013 August 2013 |