Exhibit 99.1
|
Metro New York’s Premier Business Bank
July 2014
|

Safe Harbor Statement
“Safe Harbor” Statement under the Private Securities Litigation Reform Act of 1995:
This presentation contains various forward-looking statements with respect to earnings, credit quality and other financial and business matters within the meaning of the Private Securities Litigation Reform Act of 1995. These forward-statements can be identified by words such as “expects,” “anticipates,” “intends,” “believes,” “estimates,” “predicts” and words of similar import. The Company cautions that these forward-looking statements are subject to numerous assumptions, risks and uncertainties, and that statements relating to future periods are subject to uncertainty because of the increased likelihood of changes in underlying factors and assumptions. Actual results could differ materially from forward-looking statements.
Factors that may cause actual results to differ materially from those contemplated by such forward-looking statements, include, but are not limited to, statements regarding: (a) the OCC and other bank regulators may require us to further modify or change our mix of assets, including our concentration in certain types of loans, or require us to take further remedial actions; (b) our inability to deploy our excess cash, reduce our expenses and improve our operating leverage and efficiency; (c) our ability to pay quarterly cash dividends to shareholders in light of our earnings, the current and future economic environment, Federal Reserve Board guidance, our Bank’s capital plan and other regulatory requirements applicable to Hudson Valley or Hudson Valley Bank; (d) the possibility that we may need to raise additional capital in the future and our ability to raise such capital on terms that are favorable to us; (e) further increases in our non-performing loans and allowance for loan losses; (f) ineffectiveness in managing our commercial real estate portfolio; (g) lower than expected future performance of our investment portfolio; (h) inability to effectively integrate and manage the new business and lending teams; (i) a lack of opportunities for growth, plans for expansion (including opening new branches) and increased or unexpected competition in attracting and retaining customers; (j) continued poor economic conditions generally and in our market area in particular, which may adversely affect the ability of borrowers to repay their loans and the value of real property or other property held as collateral for such loans; (k) lower than expected demand for our products and services; (l) possible additional impairment of our goodwill and other intangible assets; (m) our inability to manage interest rate risk; (n) increased expense and burdens resulting from the regulatory environment in which we operate and our ability to comply with existing and future regulatory requirements; (o) our inability to maintain regulatory capital above the minimum levels Hudson Valley Bank has set as its minimum capital levels in its capital plan, or such higher capital levels as may be required; (p) proposed legislative and regulatory action may adversely affect us and the financial services industry; (q) legislative and regulatory actions (including the impact of the Dodd-Frank Wall Street Reform and Consumer Protection Act and related regulations) may subject us to additional regulatory oversight which may result in increased compliance costs and/or require us to change our business model;(r) future increased Federal Deposit Insurance Corporation, or FDIC, special assessments or changes to regular assessments; (s) potential liabilities under federal and state environmental laws; (t) legislative and regulatory changes to laws governing New York State’s taxation of HVB’s REIT subsidiary.
For a more detailed discussion of these factors, see the Risk Factors discussion in the Company’s most recent Annual Report on Form 10-K. The forward-looking statements included in this presentation are made only as of the date hereof and the Company undertakes no obligation to update or revise any of its forward-looking statements.
Unless otherwise noted, information presented is from Company sources.
2
|
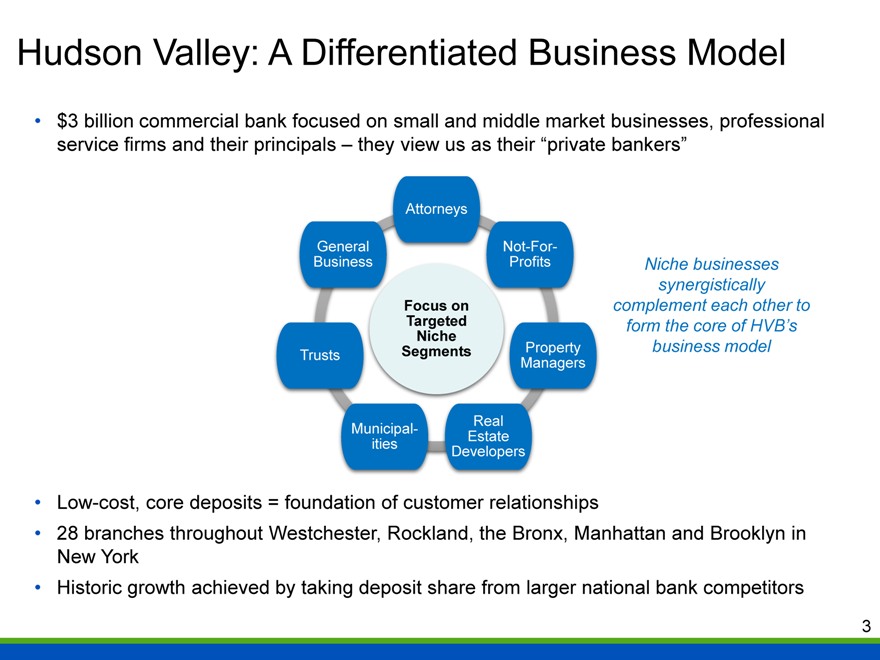
Hudson Valley: A Differentiated Business Model
$3 billion commercial bank focused on small and middle market businesses, professional service firms and their principals – they view us as their “private bankers”
Attorneys
General Not-For-
Business Profits
Focus on
Targeted
Niche
Trusts Segments Property
Managers
Municipal- Real
Estate
ities Developers
Niche businesses synergistically complement each other to form the core of HVB’s business model
Low-cost, core deposits = foundation of customer relationships
28 branches throughout Westchester, Rockland, the Bronx, Manhattan and Brooklyn in New York Historic growth achieved by taking deposit share from larger national bank competitors
3
|
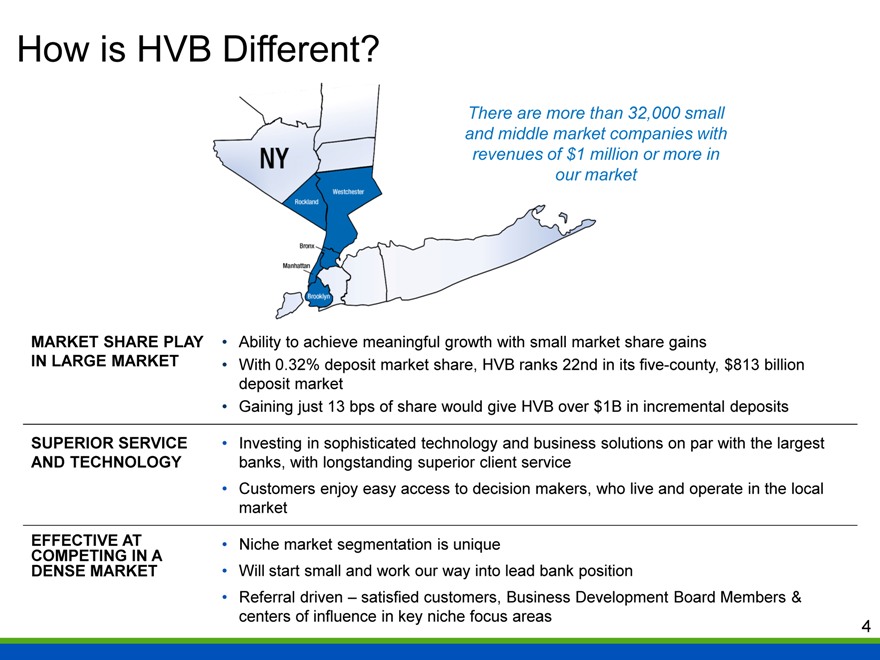
How is HVB Different?
There are more than 32,000 small and middle market companies with revenues of $1 million or more in our market
MARKET SHARE PLAY Ability to achieve meaningful growth with small market share gains
IN LARGE MARKET With 0.32% deposit market share, HVB ranks 22nd in its five-county, $813 billion
deposit market
Gaining just 13 bps of share would give HVB over $1B in incremental deposits
SUPERIOR SERVICE Investing in sophisticated technology and business solutions on par with the largest
AND TECHNOLOGY banks, with longstanding superior client service
Customers enjoy easy access to decision makers, who live and operate in the local
market
EFFECTIVE AT Niche market segmentation is unique
COMPETING IN A
DENSE MARKET Will start small and work our way into lead bank position
Referral driven – satisfied customers, Business Development Board Members &
centers of influence in key niche focus areas 4
|
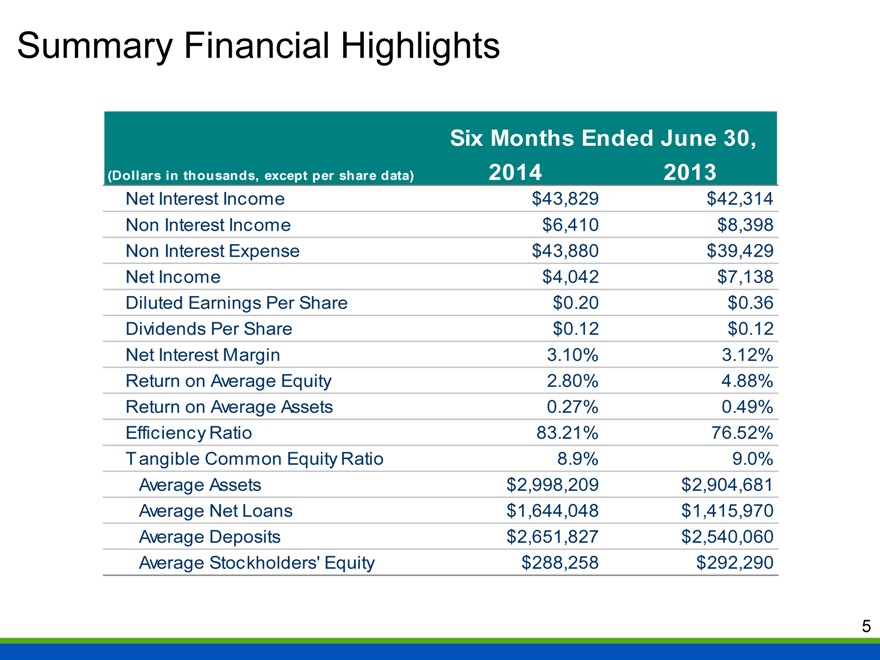
Summary Financial Highlights
Six Months Ended June 30,
(Dollars in thousands, except per share data) 2014 2013
Net Interest Income $43,829 $42,314
Non Interest Income $6,410 $8,398
Non Interest Expense $43,880 $39,429
Net Income $4,042 $7,138
Diluted Earnings Per Share $0.20 $0.36
Dividends Per Share $0.12 $0.12
Net Interest Margin 3.10% 3.12%
Return on Average Equity 2.80% 4.88%
Return on Average Assets 0.27% 0.49%
Efficiency Ratio 83.21% 76.52%
T angible Common Equity Ratio 8.9% 9.0%
Average Assets $2,998,209 $2,904,681
Average Net Loans $1,644,048 $1,415,970
Average Deposits $2,651,827 $2,540,060
Average Stockholders’ Equity $288,258 $292,290
5
|
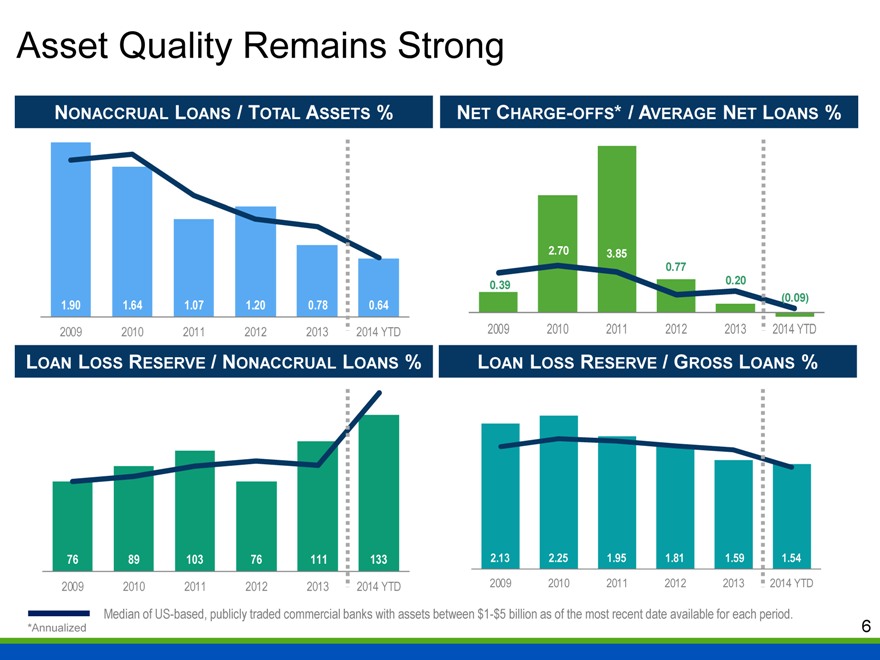
Asset Quality Remains Strong
NONACCRUAL LOANS / TOTAL ASSETS %
1.90 1.64 1.07 1.20 0.78 0.64
2009 2010 2011 2012 2013 2014 YTD
NET CHARGE-OFFS* / AVERAGE NET LOANS %
2.70 3.85
0.77
0.39 0.20
(0.09)
2009 2010 2011 2012 2013 2014 YTD
LOAN LOSS RESERVE / NONACCRUAL LOANS %
76 89 103 76 111 133
2009 2010 2011 2012 2013 2014 YTD
LOAN LOSS RESERVE / GROSS LOANS %
2.13 2.25 1.95 1.81 1.59 1.54
2009 2010 2011 2012 2013 2014 YTD
Median of US-based, publicly traded commercial banks with assets between $1-$5 billion as of the most recent date available for each period.
*Annualized 6
|
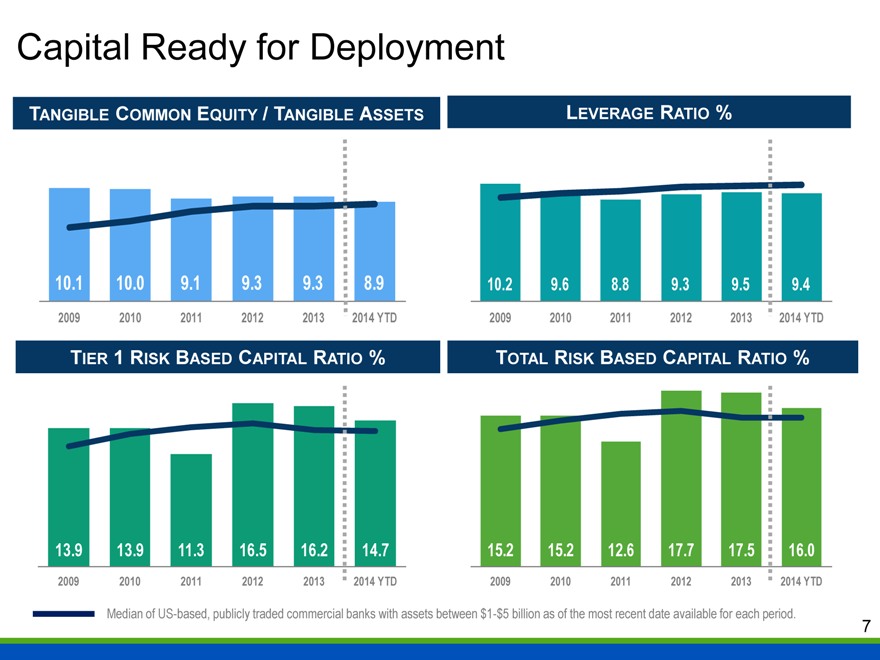
Capital Ready for Deployment
TANGIBLE COMMON EQUITY / TANGIBLE ASSETS
%
10.1 10.0 9.1 9.3 9.3 8.9
2009 2010 2011 2012 2013 2014 YTD
LEVERAGE RATIO %
10.2 9.6 8.8 9.3 9.5 9.4
2009 2010 2011 2012 2013 2014 YTD
TIER 1 RISK BASED CAPITAL RATIO %
13.9 13.9 11.3 16.5 16.2 14.7
2009 2010 2011 2012 2013 2014 YTD
TOTAL RISK BASED CAPITAL RATIO %
15.2 15.2 12.6 17.7 17.5 16.0
2009 2010 2011 2012 2013 2014 YTD
Median of US-based, publicly traded commercial banks with assets between $1-$5 billion as of the most recent date available for each period.
7
|
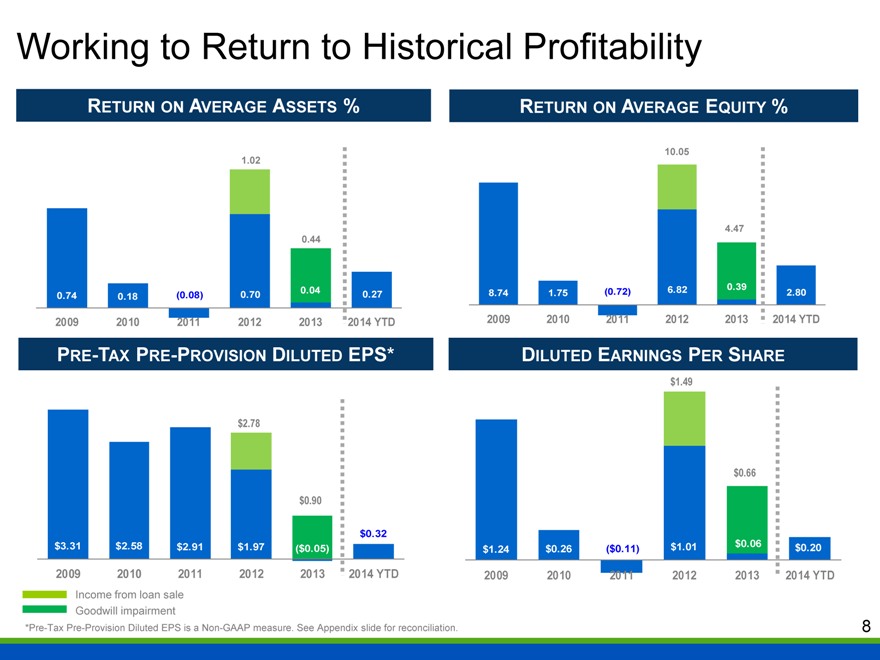
Working to Return to Historical Profitability
RETURN ON AVERAGE ASSETS %
1.02
0.44
0.74 0.18 (0.08) 0.70 0.04 0.27
2009 2010 2011 2012 2013 2014 YTD
RETURN ON AVERAGE EQUITY %
10.05
4.47
8.74 1.75 (0.72) 6.82 0.39 2.80
2009 2010 2011 2012 2013 2014 YTD
PRE-TAX PRE-PROVISION DILUTED EPS*
$ 2.78
$ 0.90
$ 0.32
$ 3.31 $ 2.58 $ 2.91 $1.97 ($0.05)
2009 2010 2011 2012 2013 2014 YTD
DILUTED EARNINGS PER SHARE
$1.49
$0.$661.49
$1.24 $0.26 ($0.11) $1.01 $0.06 $0.20
2009 2010 2011 2012 2013 2014 YTD
Income from loan sale Goodwill impairment
*Pre-Tax Pre-Provision Diluted EPS is a Non-GAAP measure. See Appendix slide for reconciliation.
8
|

HVB: Becoming a Better Bank
LEGACY STRENGTHS Exceptional metro NYC core deposit franchise
Unique niche-lending focus
Highly asset-sensitive balance sheet
RECENT Loan growth of 7% during the quarter ended June 30, 2014
ACCOMPLISHMENTS Redeployed $304 million in liquidity into investment securities
Deposits increased 12% during the second quarter of 2014
Completed the senior management team with the addition of a Chief
Banking Officer
Invested in sophisticated cash management and mobile banking
tools on par with the largest banks
WHERE WE’RE GOING Investing in the Company to be BETTER, not just to be different
Nimbly adapting to new environments, products, and competitors
while capitalizing on legacy strengths
More effectively serving our niche markets and new markets with a
more diverse array of profitable, customized products that meet their
needs
9
|
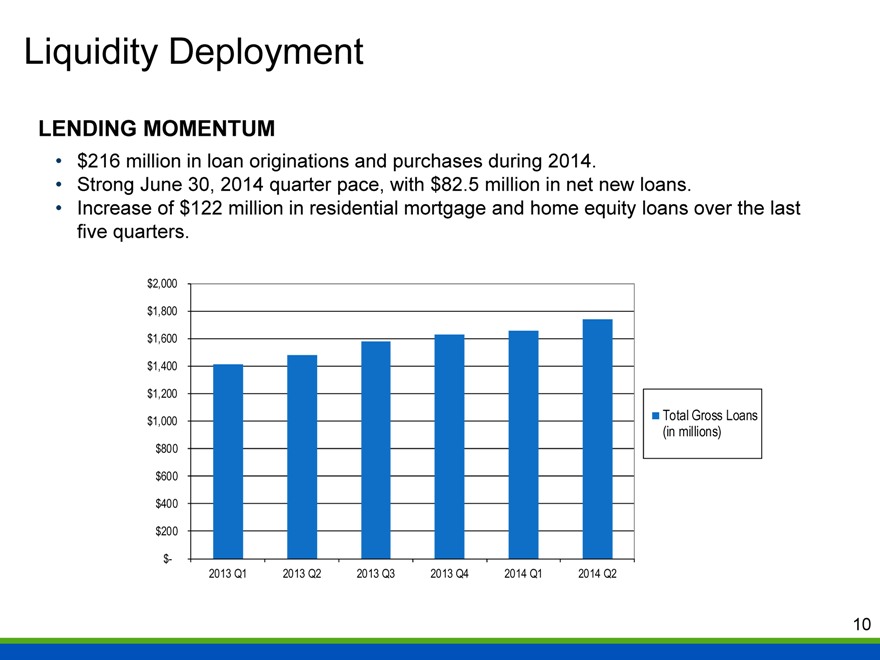
Liquidity Deployment
LENDING MOMENTUM
$216 million in loan originations and purchases during 2014.
Strong June 30, 2014 quarter pace, with $82.5 million in net new loans.
Increase of $122 million in residential mortgage and home equity loans over the last five quarters.
$2,000
$1,800
$1,600
$1,400
$1,200
$1,000
$800
$600
$400
$200
$-
2013 Q1 2013 Q2 2013 Q3 2013 Q4 2014 Q1 2014 Q2
(in Total millions) Gross Loans
10
|

Liquidity Deployment
Balance Sheet Changes by Quarter (in millions)
350
319
304 298
300
250
200
153 161
150
110
100 97
65
50 40 47 40 40 54 54
27
6 12
0
Q2 2013 Q3 2013 Q4 2013 Q1 2014 Q2 2014
-50 -31 -10
-64 -69 -72
-100 -93 -97
-107
-150
Liquidity Invesments Loans Assets Deposits
11
|
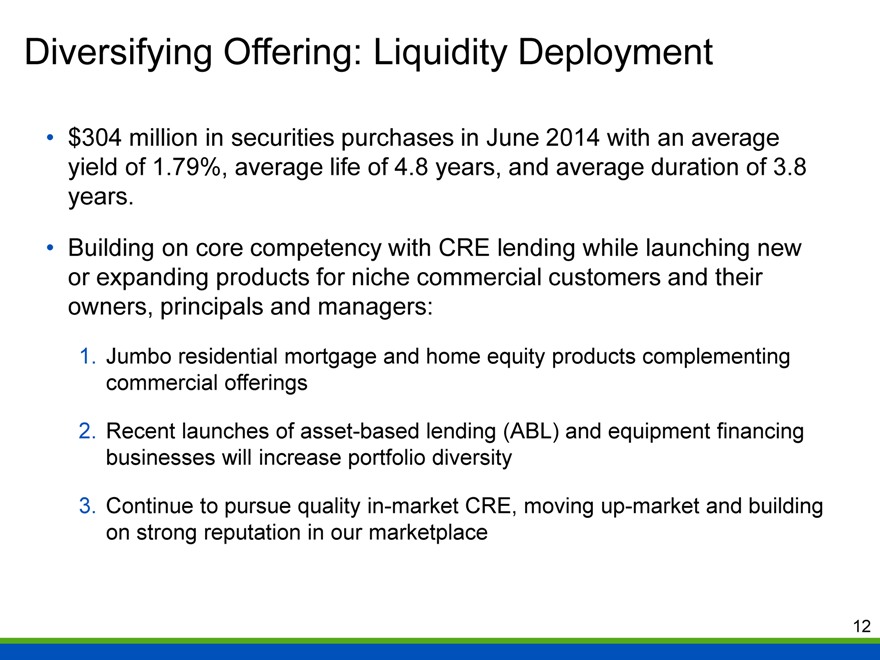
Diversifying Offering: Liquidity Deployment
$304 million in securities purchases in June 2014 with an average yield of 1.79%, average life of 4.8 years, and average duration of 3.8 years.
Building on core competency with CRE lending while launching new or expanding products for niche commercial customers and their owners, principals and managers:
1. Jumbo residential mortgage and home equity products complementing commercial offerings
2. Recent launches of asset-based lending (ABL) and equipment financing businesses will increase portfolio diversity
3. Continue to pursue quality in-market CRE, moving up-market and building on strong reputation in our marketplace
12
|
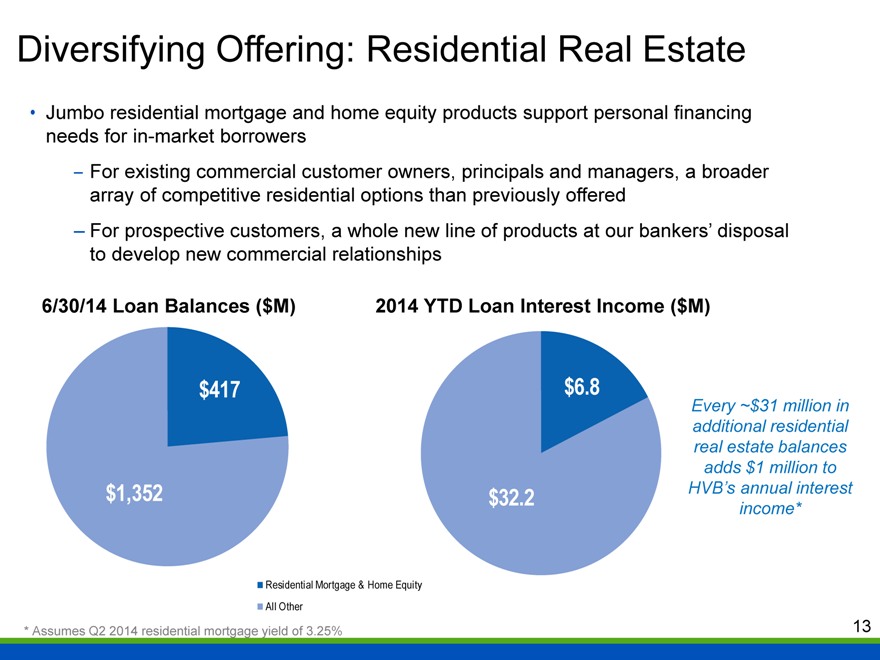
Diversifying Offering: Residential Real Estate
Jumbo residential mortgage and home equity products support personal financing needs for in-market borrowers
– For existing commercial customer owners, principals and managers, a broader array of competitive residential options than previously offered
– For prospective customers, a whole new line of products at our bankers’ disposal to develop new commercial relationships
6/30/14 Loan Balances ($M) 2014 YTD Loan Interest Income ($M)
$417 $6.8
$1,352 $32.2
Every ~$31 million in additional residential real estate balances adds $1 million to HVB’s annual interest income*
Residential Mortgage & Home Equity All Other
* Assumes Q2 2014 residential mortgage yield of 3.25%
13
|
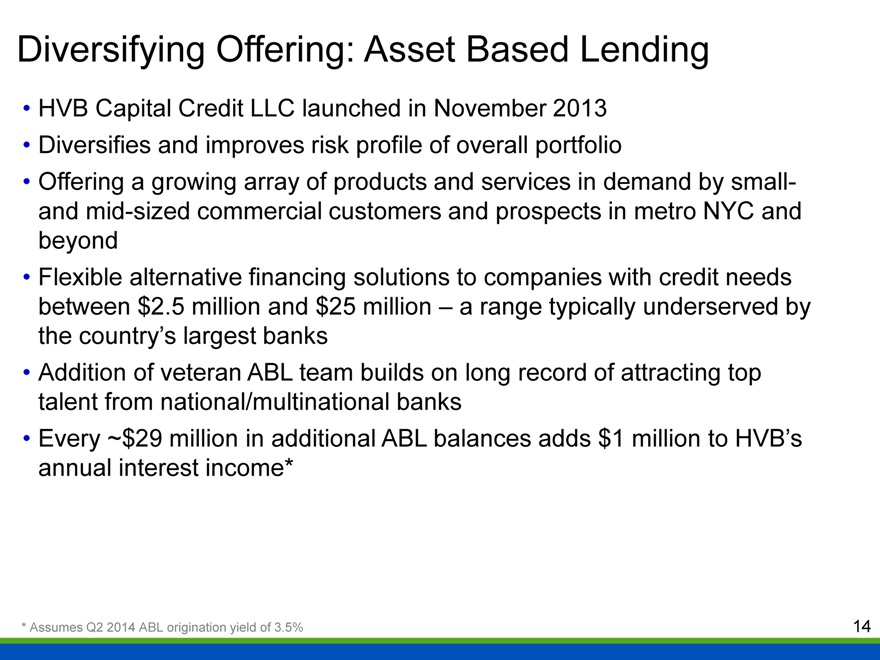
Diversifying Offering: Asset Based Lending
HVB Capital Credit LLC launched in November 2013
Diversifies and improves risk profile of overall portfolio
Offering a growing array of products and services in demand by small- and mid-sized commercial customers and prospects in metro NYC and beyond
Flexible alternative financing solutions to companies with credit needs between $2.5 million and $25 million – a range typically underserved by the country’s largest banks
Addition of veteran ABL team builds on long record of attracting top talent from national/multinational banks
Every ~$29 million in additional ABL balances adds $1 million to HVB’s annual interest income*
* Assumes Q2 2014 ABL origination yield of 3.5%
14
|
Diversifying Offering: Equipment Financing
HVB Equipment Capital LLC launched in March 2014
Nationwide lender to customers, wholesale partners and manufacturers, providing equipment leasing and lending for a wide range of income-producing equipment, including:
– Manufacturing
– Healthcare
– Technology
– Transportation
Focus on seizing opportunities to finance small and middle-market transactions in the $100,000 to $5 million range
Offers new and existing customers a flexible alternative to traditional commercial loans, enhancing cash flow and preserving working capital
15
|
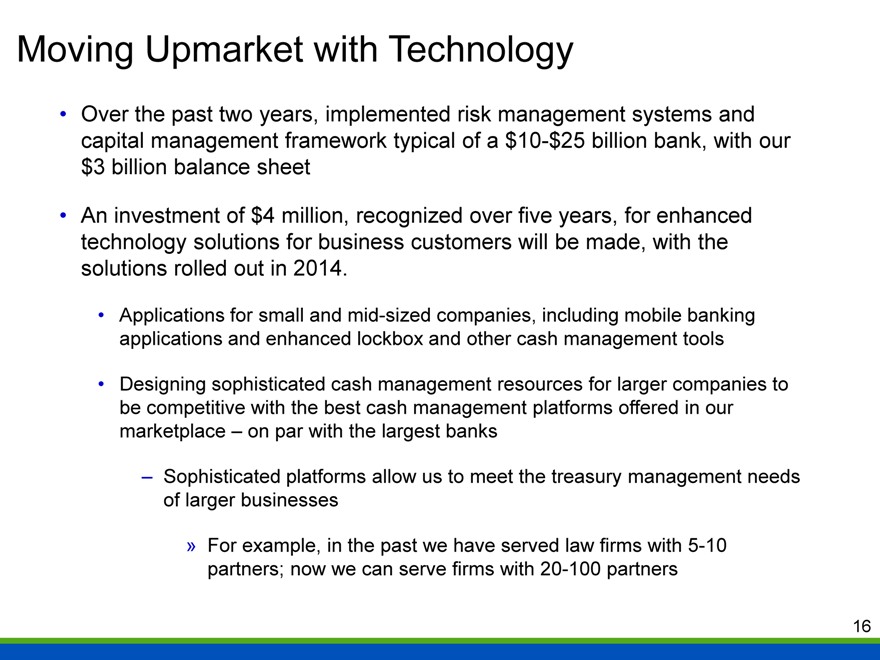
Moving Upmarket with Technology
Over the past two years, implemented risk management systems and capital management framework typical of a $10-$25 billion bank, with our $3 billion balance sheet
An investment of $4 million, recognized over five years, for enhanced technology solutions for business customers will be made, with the solutions rolled out in 2014.
Applications for small and mid-sized companies, including mobile banking applications and enhanced lockbox and other cash management tools
Designing sophisticated cash management resources for larger companies to be competitive with the best cash management platforms offered in our marketplace – on par with the largest banks
– Sophisticated platforms allow us to meet the treasury management needs of larger businesses
» For example, in the past we have served law firms with 5-10 partners; now we can serve firms with 20-100 partners
16
|
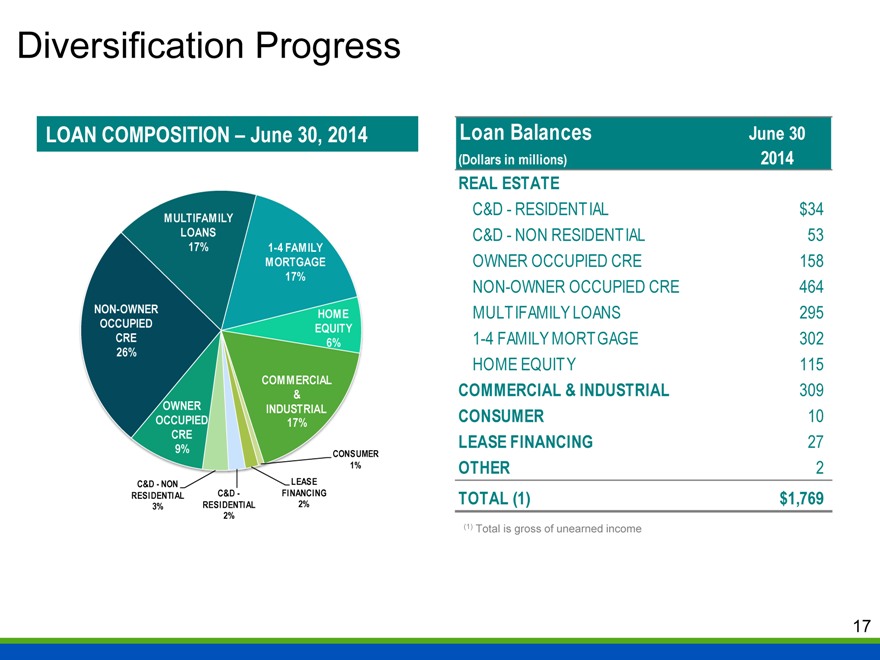
Diversification Progress
LOAN COMPOSITION – June 30, 2014
MULTIFAMILY
LOANS
17% 1-4 FAMILY
MORTGAGE
17%
NON-OWNER HOME
OCCUPIED EQUITY
CRE 6%
26%
COMMERCIAL
&
OWNER INDUSTRIAL
OCCUPIED 17%
CRE
9% CONSUMER
1%
C&D—NON LEASE
RESIDENTIAL C&D— FINANCING
3% RESIDENTIAL 2%
2%
Loan Balances June 30
(Dollars in millions) 2014
REAL ESTATE
C&D—RESIDENTIAL $34
C&D—NON RESIDENTIAL 53
OWNER OCCUPIED CRE 158
NON-OWNER OCCUPIED CRE 464
MULTIFAMILY LOANS 295
1-4 FAMILY MORTGAGE 302
HOME EQUITY 115
COMMERCIAL & INDUSTRIAL 309
CONSUMER 10
LEASE FINANCING 27
OTHER 2
TOTAL (1) $1,769
(1) Total is gross of unearned income
17
|
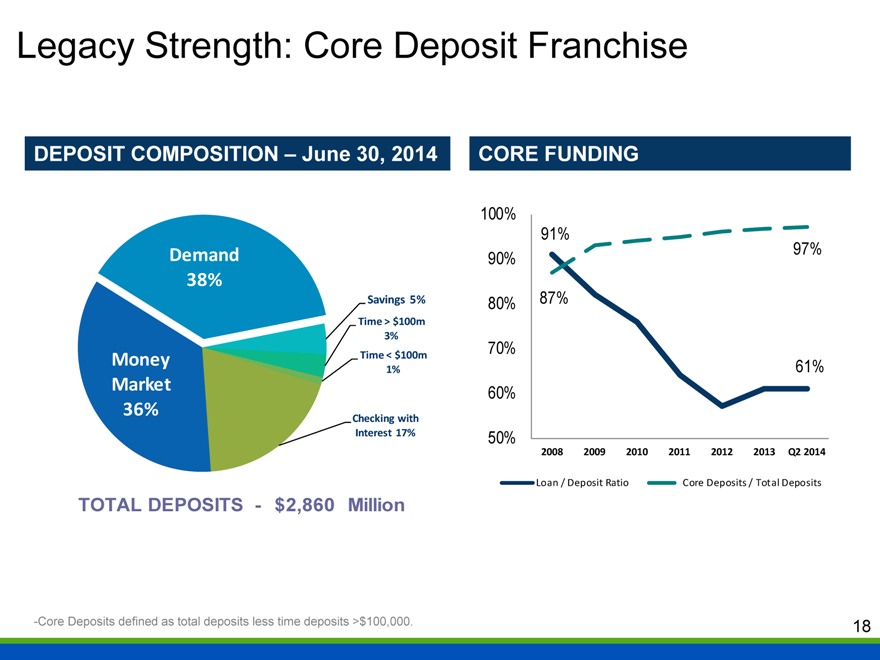
Legacy Strength: Core Deposit Franchise
DEPOSIT COMPOSITION – June 30, 2014
Demand
38%
Savings 5%
Time > $100m
3%
Money Time < $100m
1%
Market
36% Checking with
Interest 17%
TOTAL DEPOSITS— $2,860 Million
CORE FUNDING
100%
91%
90% 97%
80% 87%
70%
61%
60%
50%
2008 2009 2010 2011 2012 2013 Q2 2014
Loan / Deposit Ratio Core Deposits / Total Deposits
-Core Deposits defined as total deposits less time deposits >$100,000.
18
|
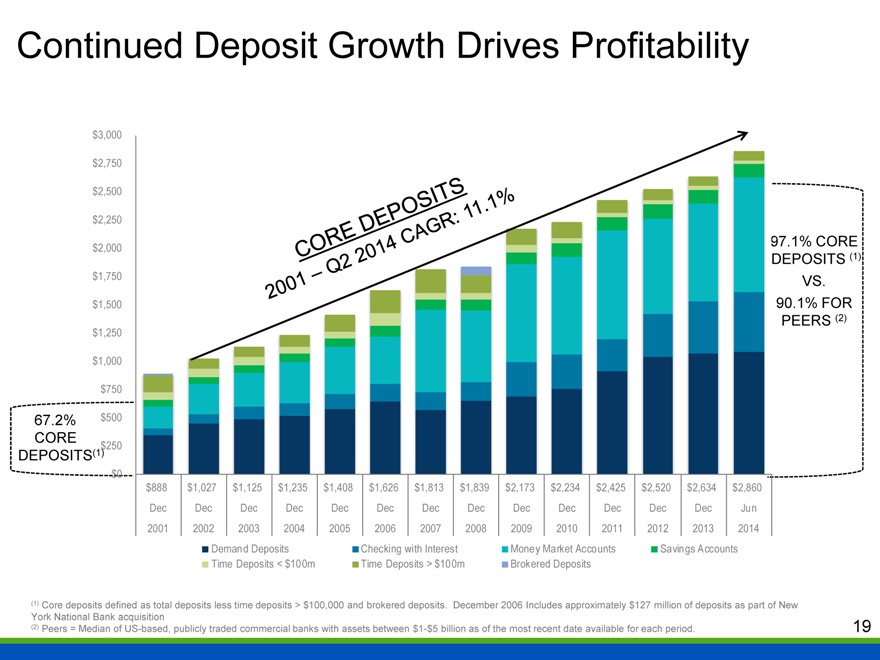
Continued Deposit Growth Drives Profitability
$3,000
$2,750
$2,500
$2,250
$2,000 97.1% CORE
DEPOSITS (1)
$1,750 VS.
$1,500 90.1% FOR
PEERS (2)
$1,250
$1,000
$750
67.2% $500
CORE $250
DEPOSITS(1)
$0
$888 $1,027 $1,125 $1,235 $1,408 $1,626 $1,813 $1,839 $2,173 $2,234 $2,425 $2,520 $2,634 $2,860
Dec Dec Dec Dec Dec Dec Dec Dec Dec Dec Dec Dec Dec Jun
2001 2002 2003 2004 2005 2006 2007 2008 2009 2010 2011 2012 2013 2014
Demand Deposits Checking with Interest Money Market Accounts Savings Accounts
Time Deposits < $100m Time Deposits > $100m Brokered Deposits
(1) Core deposits defined as total deposits less time deposits > $100,000 and brokered deposits. December 2006 Includes approximately $127 million of deposits as part of New York National Bank acquisition (2) Peers = Median of US-based, publicly traded commercial banks with assets between $1-$5 billion as of the most recent date available for each period.
19
|
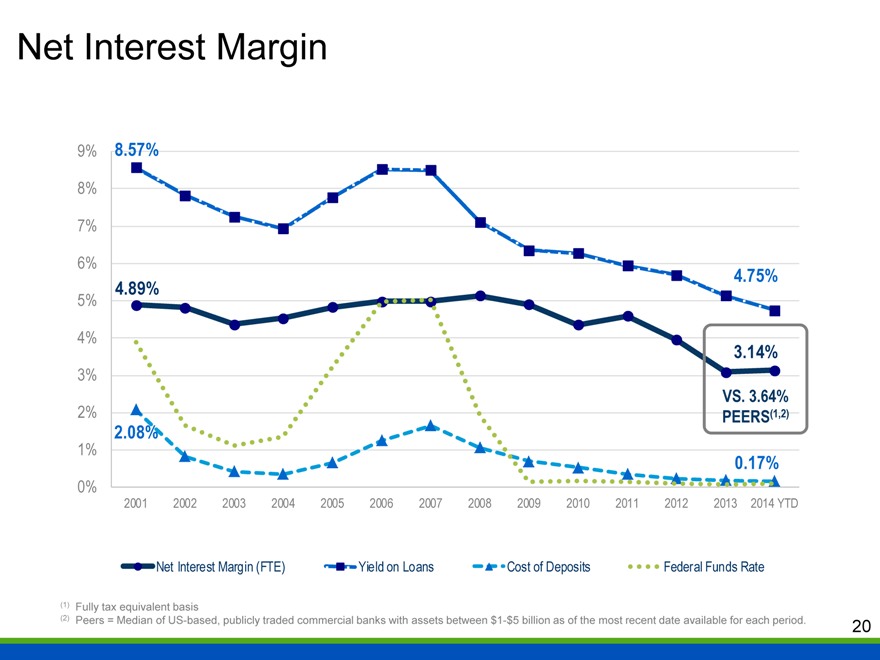
Net Interest Margin
9% 8.57%
8%
7%
6%
5% 4.89% 4.75%
4% 3.14%
3%
VS. 3.64%
2% PEERS(1,2)
1% 2.08%
0.17%
0%
2001 2002 2003 2004 2005 2006 2007 2008 2009 2010 2011 2012 2013 2014 YTD
Net Interest Margin (FTE) Yield on Loans Cost of Deposits Federal Funds Rate
(1) Fully tax equivalent basis
(2) Peers = Median of US-based, publicly traded commercial banks with assets between $1-$5 billion as of the most recent date available for each period.
20
|
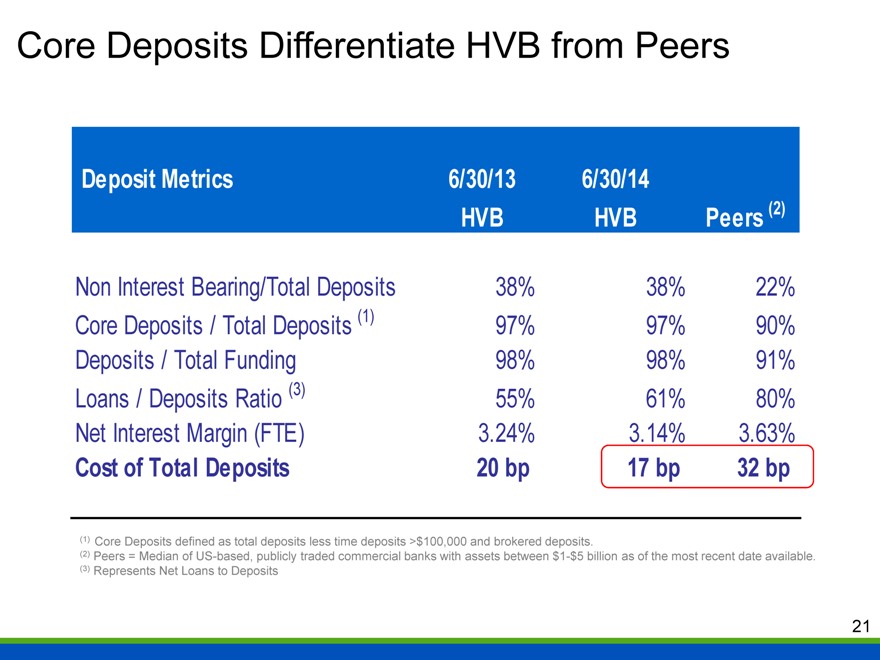
Core Deposits Differentiate HVB from Peers
Deposit Metrics 6/30/13 6/30/14
HVB HVB Peers (2)
Non Interest Bearing/Total Deposits 38% 38% 22%
Core Deposits / Total Deposits (1) 97% 97% 90%
Deposits / Total Funding 98% 98% 91%
Loans / Deposits Ratio (3) 55% 61% 80%
Net Interest Margin (FTE) 3.24% 3.14% 3.63%
Cost of Total Deposits 20 bp 17 bp 32 bp
(1) Core Deposits defined as total deposits less time deposits >$100,000 and brokered deposits.
(2) Peers = Median of US-based, publicly traded commercial banks with assets between $1-$5 billion as of the most recent date available. (3) Represents Net Loans to Deposits
21
|
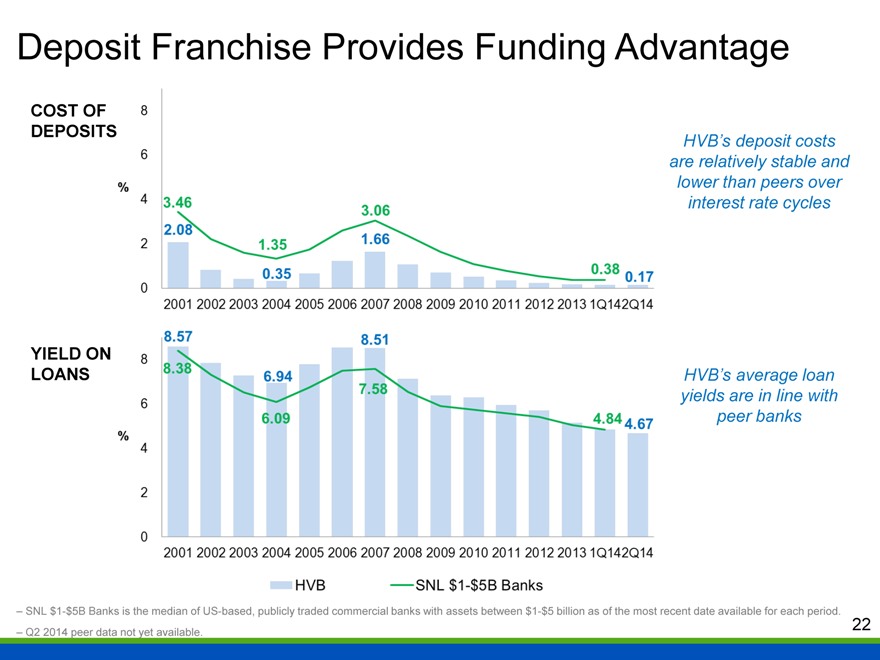
Deposit Franchise Provides Funding Advantage
COST OF DEPOSIT
HVB’s deposit costs re relatively stable and lower than peers over interest rate cycles
YIELD ON LOANS
HVB’s average loan yields are in line with peer banks
– SNL $1-$5B Banks is the median of US-based, publicly traded commercial banks with assets between $1-$5 billion as of the most recent date available for each period.
– Q2 2014 peer data not yet available.
22
|
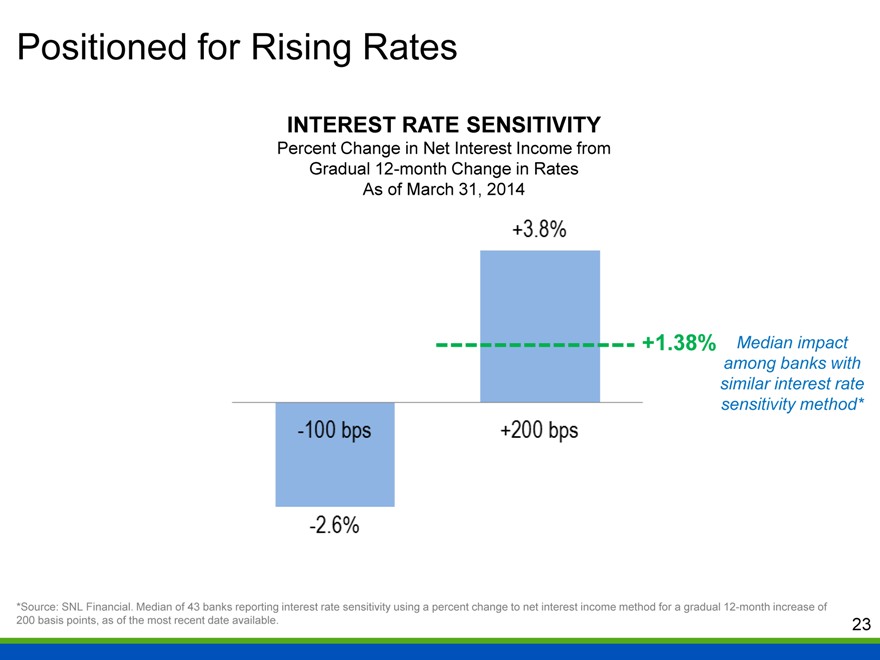
Positioned for Rising Rates
INTEREST RATE SENSITIVITY
Percent Change in Net Interest Income from Gradual 12-month Change in Rates As of March 31, 2014
+3.8%
+1.38%
-100 bps
+200bps
-2.6%
Median impact among banks with similar interest rate sensitivity method*
*Source: SNL Financial. Median of 43 banks reporting interest rate sensitivity using a percent change to net interest income method for a gradual 12-month increase of 200 basis points, as of the most recent date available.
23
|
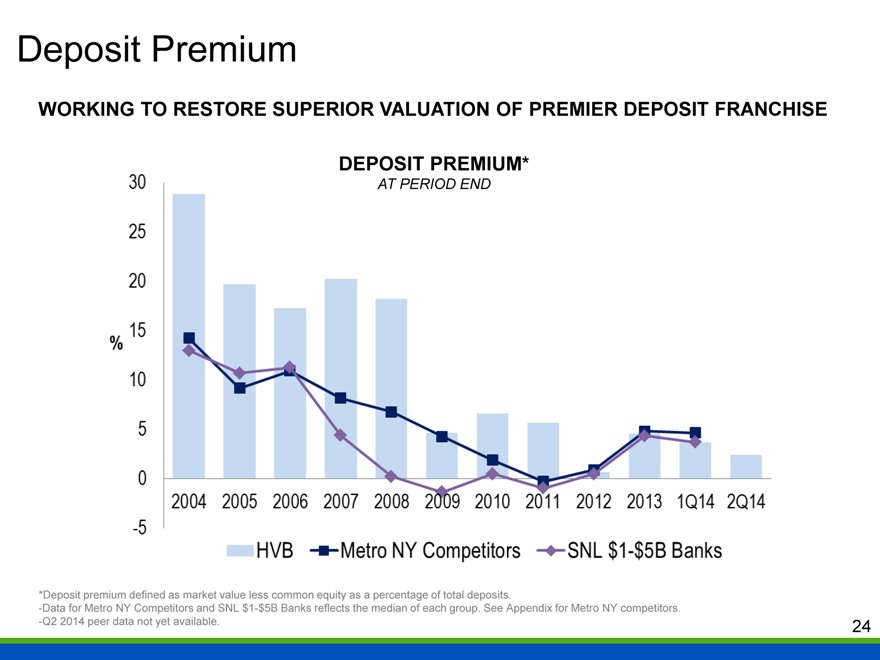
Deposit Premium
WORKING TO RESTORE SUPERIOR VALUATION OF PREMIER DEPOSIT FRANCHISE
DEPOSIT PREMIUM*
AT PERIOD END
30
25
20
15
10
5
0
-5
%
2004
2005
2006
2007
2008
2009
2010
2011
2012
2013
1Q14
2Q14
HVB Metro NY Competitors SNL $1-$5B Banks
*Deposit premium defined as market value less common equity as a percentage of total deposits.
-Data for Metro NY Competitors and SNL $1-$5B Banks reflects the median of each group. See Appendix for Metro NY competitors.
-Q2 2014 peer data not yet available.
24
|
HVB: Becoming a Better Bank
LEGACY STRENGTHS
RECENT
ACCOMPLISHMENTS
WHERE WE’RE GOING
Exceptional metro NYC core deposit franchise
Unique niche-lending focus
Highly asset-sensitive balance sheet
Loan growth of 7% during the quarter ended June 30, 2014
Redeployed $304 million in liquidity into investment securities
Deposits increased 12% during the second quarter of 2014
Completed the senior management team with the addition of a Chief Banking Officer
Invested in sophisticated cash management and mobile banking tools on par with the largest banks
Investing in the Company to be BETTER, not just to be different
Nimbly adapting to new environments, products, and competitors
while capitalizing on legacy strengths
More effectively serving our niche markets and new markets with a more diverse array of profitable, customized products that meet their needs
25
|

THANK YOU
FOR YOUR INTEREST IN HUDSON VALLEY HOLDING CORP.
26
|
APPENDIX
FINANCIAL DETAIL AND NON-GAAP RECONCILIATION
27
|
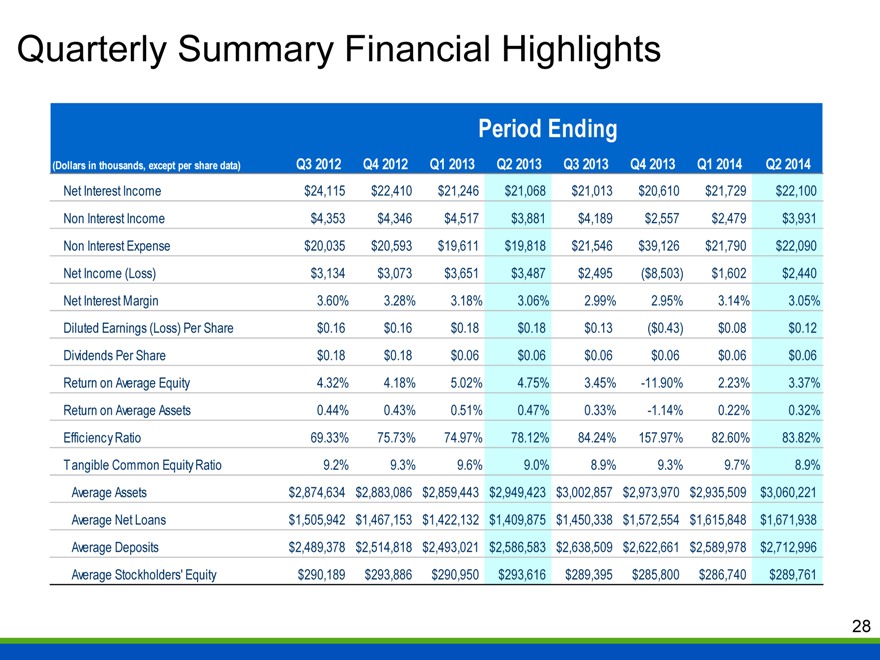
Quarterly Summary Financial Highlights
Period Ending
(Dollars in thousands, except per share data) Q3 2012 Q4 2012 Q1 2013 Q2 2013 Q3 2013 Q4 2013 Q1 2014 Q2 2014
Net Interest Income $24,115 $22,410 $21,246 $21,068 $21,013 $20,610 $21,729 $22,100
Non Interest Income $4,353 $4,346 $4,517 $3,881 $4,189 $2,557 $2,479 $3,931
Non Interest Expense $20,035 $20,593 $19,611 $19,818 $21,546 $39,126 $21,790 $22,090
Net Income (Loss) $3,134 $3,073 $3,651 $3,487 $2,495 ($8,503) $1,602 $2,440
Net Interest Margin 3.60% 3.28% 3.18% 3.06% 2.99% 2.95% 3.14% 3.05%
Diluted Earnings (Loss) Per Share $0.16 $0.16 $0.18 $0.18 $0.13 ($0.43) $0.08 $0.12
Dividends Per Share $0.18 $0.18 $0.06 $0.06 $0.06 $0.06 $0.06 $0.06
Return on Average Equity 4.32% 4.18% 5.02% 4.75% 3.45% -11.90% 2.23% 3.37%
Return on Average Assets 0.44% 0.43% 0.51% 0.47% 0.33% -1.14% 0.22% 0.32%
Efficiency Ratio 69.33% 75.73% 74.97% 78.12% 84.24% 157.97% 82.60% 83.82%
Tangible Common Equity Ratio 9.2% 9.3% 9.6% 9.0% 8.9% 9.3% 9.7% 8.9%
Average Assets $2,874,634 $2,883,086 $2,859,443 $2,949,423 $3,002,857 $2,973,970 $2,935,509 $3,060,221
Average Net Loans $1,505,942 $1,467,153 $1,422,132 $1,409,875 $1,450,338 $1,572,554 $1,615,848 $1,671,938
Average Deposits $2,489,378 $2,514,818 $2,493,021 $2,586,583 $2,638,509 $2,622,661 $2,589,978 $2,712,996
Average Stockholders’ Equity $290,189 $293,886 $290,950 $293,616 $289,395 $285,800 $286,740 $289,761
28
|
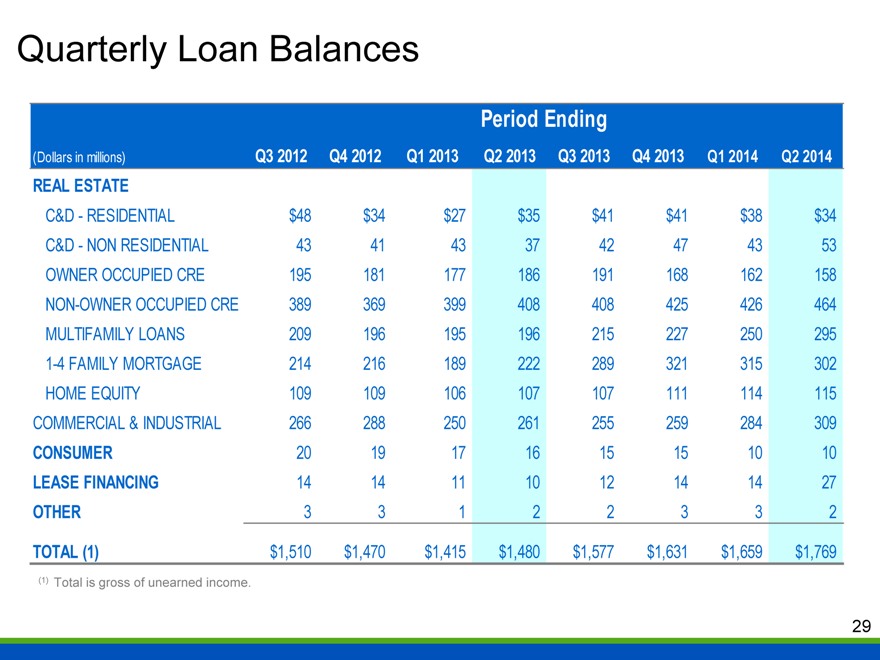
Quarterly Loan Balances
Period Ending
(Dollars in millions) Q3 2012 Q4 2012 Q1 2013 Q2 2013 Q3 2013 Q4 2013 Q1 2014 Q2 2014
REAL ESTATE
C&D - RESIDENTIAL $48 $34 $27 $35 $41 $41 $38 $34
C&D - NON RESIDENTIAL 43 41 43 37 42 47 43 53
OWNER OCCUPIED CRE 195 181 177 186 191 168 162 158
NON-OWNER OCCUPIED CRE 389 369 399 408 408 425 426 464
MULTIFAMILY LOANS 209 196 195 196 215 227 250 295
1-4 FAMILY MORTGAGE 214 216 189 222 289 321 315 302
HOME EQUITY 109 109 106 107 107 111 114 115
COMMERCIAL & INDUSTRIAL 266 288 250 261 255 259 284 309
CONSUMER 20 19 17 16 15 15 10 10
LEASE FINANCING 14 14 11 10 12 14 14 27
OTHER 3 3 1 2 2 3 3 2
TOTAL (1) $1,510 $1,470 $1,415 $1,480 $1,577 $1,631 $1,659 $1,769
(1) Total is gross of unearned income.
29
|
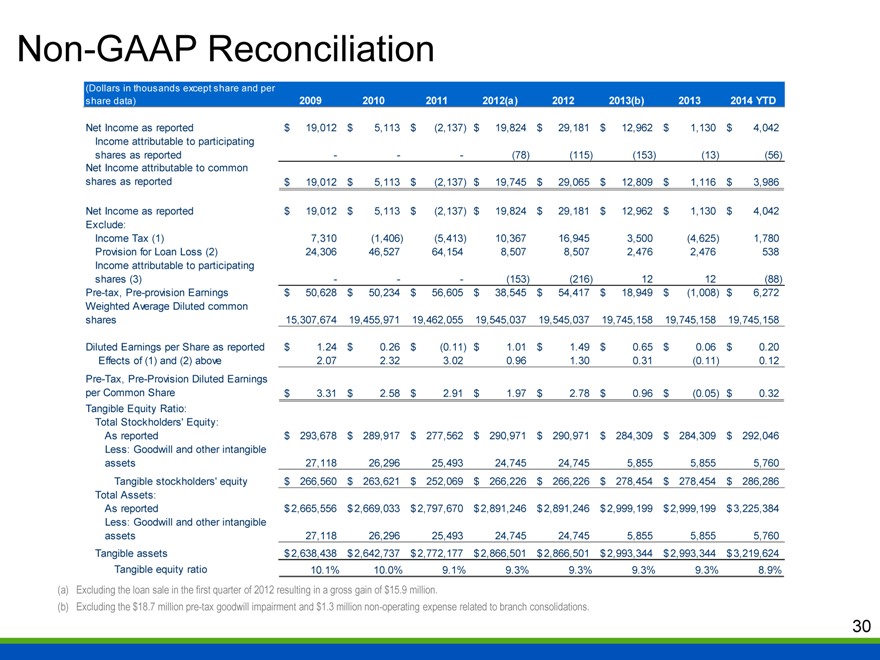
Non-GAAP Reconciliation
(Dollars in thousands except share and per
share data) 2009 2010 2011 2012(a) 2012 2013(b) 2013 2014 YTD
Net Income as reported $19,012 $5,113 $(2,137) $19,824 $29,181 $12,962 $1,130 $4,042
Income attributable to participating shares as reported — — — (78) (115) (153) (13) (56)
Net Income attributable to common shares as reported $19,012 $5,113 $(2,137) $19,745 $29,065 $12,809 $1,116 $3,986
Net Income as reported $19,012 $5,113 $(2,137) $19,824 $29,181 $12,962 $1,130 $4,042
Exclude:
Income Tax (1) 7,310 (1,406) (5,413) 10,367 16,945 3,500 (4,625) 1,780
Provision for Loan Loss (2) 24,306 46,527 64,154 8,507 8,507 2,476 2,476 538
Income attributable to participating shares (3) — — — (153) (216) 12 12 (88)
Pre-tax, Pre-provision Earnings $50,628 $50,234 $56,605 $38,545 $54,417 $18,949 $(1,008) $6,272
Weighted Average Diluted common shares 15,307,674 19,455,971 19,462,055 19,545,037 19,545,037 19,745,158 19,745,158 19,745,158
Diluted Earnings per Share as reported $1.24 $0.26 $(0.11) $1.01 $1.49 $0.65 $0.06 $0.20
Effects of (1) and (2) above 2.07 2.32 3.02 0.96 1.30 0.31 (0.11) 0.12
Pre-Tax, Pre-Provision Diluted Earnings per Common Share $3.31 $2.58 $2.91 $1.97 $2.78 $0.96 $(0.05) $0.32
Tangible Equity Ratio:
Total Stockholders’ Equity:
As reported $293,678 $289,917 $277,562 $290,971 $290,971 $284,309 $284,309 $292,046
Less: Goodwill and other intangible assets 27,118 26,296 25,493 24,745 24,745 5,855 5,855 5,760
Tangible stockholders’ equity $266,560 $263,621 $252,069 $266,226 $266,226 $278,454 $278,454 $286,286
Total Assets:
As reported $2,665,556 $2,669,033 $2,797,670 $2,891,246 $2,891,246 $2,999,199 $2,999,199 $3,225,384
Less: Goodwill and other intangible assets 27,118 26,296 25,493 24,745 24,745 5,855 5,855 5,760
Tangible assets $2,638,438 $2,642,737 $2,772,177 $2,866,501 $2,866,501 $2,993,344 $2,993,344 $3,219,624
Tangible equity ratio 10.1% 10.0% 9.1% 9.3% 9.3% 9.3% 9.3% 8.9%
(a) Excluding the loan sale in the first quarter of 2012 resulting in a gross gain of $15.9 million.
(b) Excluding the $18.7 million pre-tax goodwill impairment and $1.3 million non-operating expense related to branch consolidations.
30
|
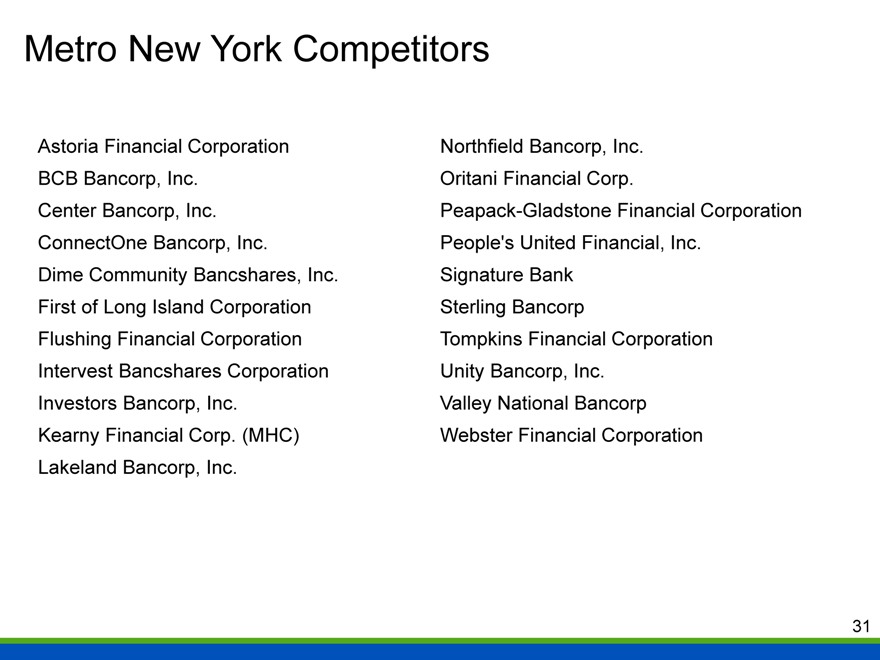
Metro New York Competitors
Astoria Financial Corporation
BCB Bancorp, Inc.
Center Bancorp, Inc.
ConnectOne Bancorp, Inc.
Dime Community Bancshares, Inc.
First of Long Island Corporation
Flushing Financial Corporation
Intervest Bancshares Corporation
Investors Bancorp, Inc.
Kearny Financial Corp. (MHC)
Lakeland Bancorp, Inc.
Northfield Bancorp, Inc.
Oritani Financial Corp.
Peapack-Gladstone Financial Corporation
People’s United Financial, Inc.
Signature Bank
Sterling Bancorp
Tompkins Financial Corporation
Unity Bancorp, Inc.
Valley National Bancorp
Webster Financial Corporation
31
|

THANK YOU FOR YOUR INTEREST IN HUDSON VALLEY HOLDING CORP.
HVB
LISTED
NYSE
www.hudsonvalleybank.com
32