UNITED STATES
SECURITIES AND EXCHANGE COMMISSION
Washington, D.C. 20549
FORM N-CSR
CERTIFIED SHAREHOLDER REPORT OF REGISTERED
MANAGEMENT INVESTMENT COMPANIES
Investment Company Act file number 811-03785
Fidelity Advisor Series I
(Exact name of registrant as specified in charter)
245 Summer St., Boston, MA 02210
(Address of principal executive offices) (Zip code)
Margaret Carey, Secretary
245 Summer St.
Boston, Massachusetts 02210
(Name and address of agent for service)
Registrant's telephone number, including area code:
617-563-7000
| |
Date of fiscal year end: | October 31 |
|
|
Date of reporting period: | April 30, 2023 |
Item 1.
Reports to Stockholders
Fidelity Advisor® Floating Rate High Income Fund
Semi-Annual Report
April 30, 2023
Includes Fidelity and Fidelity Advisor share classes
Contents
To view a fund's proxy voting guidelines and proxy voting record for the 12-month period ended June 30, visit http://www.fidelity.com/proxyvotingresults or visit the Securities and Exchange Commission's (SEC) web site at http://www.sec.gov.
You may also call 1-800-544-8544 if you're an individual investing directly with Fidelity, call 1-800-835-5092 if you're a plan sponsor or participant with Fidelity as your recordkeeper or call 1-877-208-0098 on institutional accounts or if you're an advisor or invest through one to request a free copy of the proxy voting guidelines.
Standard & Poor's, S&P and S&P 500 are registered service marks of The McGraw-Hill Companies, Inc. and have been licensed for use by Fidelity Distributors Corporation.
Other third-party marks appearing herein are the property of their respective owners.
All other marks appearing herein are registered or unregistered trademarks or service marks of FMR LLC or an affiliated company. © 2023 FMR LLC. All rights reserved.
This report and the financial statements contained herein are submitted for the general information of the shareholders of the Fund. This report is not authorized for distribution to prospective investors in the Fund unless preceded or accompanied by an effective prospectus.
A fund files its complete schedule of portfolio holdings with the SEC for the first and third quarters of each fiscal year on Form N-PORT. Forms N-PORT are available on the SEC's web site at http://www.sec.gov. A fund's Forms N-PORT may be reviewed and copied at the SEC's Public Reference Room in Washington, DC. Information regarding the operation of the SEC's Public Reference Room may be obtained by calling 1-800-SEC-0330.
For a complete list of a fund's portfolio holdings, view the most recent holdings listing, semiannual report, or annual report on Fidelity's web site at http://www.fidelity.com, http://www.institutional.fidelity.com, or http://www.401k.com, as applicable.
NOT FDIC INSURED •MAY LOSE VALUE •NO BANK GUARANTEE
Neither the Fund nor Fidelity Distributors Corporation is a bank.
| Top Bond Issuers (% of Fund's net assets) |
(with maturities greater than one year) |
| Bass Pro Group LLC | 2.9 | |
| Asurion LLC | 2.0 | |
| Intelsat Jackson Holdings SA | 1.3 | |
| Fertitta Entertainment LLC NV | 1.2 | |
| Caesars Entertainment, Inc. | 1.1 | |
| Acrisure LLC | 1.0 | |
| ABG Intermediate Holdings 2 LLC | 1.0 | |
| HUB International Ltd. | 0.9 | |
| TransDigm, Inc. | 0.9 | |
| MH Sub I LLC | 0.8 | |
| | 13.1 | |
| |
| Market Sectors (% of Fund's net assets) |
| |
| Technology | 16.0 | |
| Services | 10.4 | |
| Telecommunications | 5.7 | |
| Healthcare | 5.4 | |
| Insurance | 5.1 | |
| |
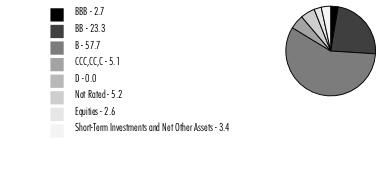
Quality Diversification (% of Fund's net assets) |
|
Percentages shown as 0.0% may reflect amounts less than 0.05%. |
| |
| We have used ratings from Moody's Investors Service, Inc. Where Moody's® ratings are not available, we have used S&P® ratings. All ratings are as of the date indicated and do not reflect subsequent changes. |
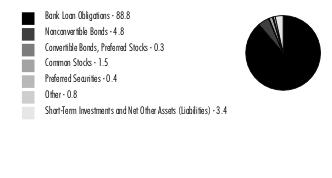
Asset Allocation (% of Fund's net assets) |
|
|
Showing Percentage of Net Assets
| Bank Loan Obligations - 88.8% |
| | | Principal Amount (a) (000s) | Value ($) (000s) |
| Aerospace - 0.9% | | | |
| ADS Tactical, Inc. Tranche B 1LN, term loan 1 month U.S. LIBOR + 5.750% 10.7746% 3/19/26 (b)(c)(d) | | 13,185 | 12,410 |
| Gemini HDPE LLC Tranche B 1LN, term loan 3 month U.S. LIBOR + 3.000% 7.83% 12/31/27 (b)(c)(d) | | 4,110 | 4,101 |
| TransDigm, Inc.: | | | |
| 1LN, term loan CME Term SOFR 1 Month Index + 3.250% 8.1483% 8/24/28 (b)(c)(d) | | 40,890 | 40,825 |
| Tranche H 1LN, term loan CME Term SOFR 1 Month Index + 3.250% 8.1483% 2/22/27 (b)(c)(d) | | 37,616 | 37,637 |
TOTAL AEROSPACE | | | 94,973 |
| Air Transportation - 1.5% | | | |
| AAdvantage Loyalty IP Ltd. Tranche B 1LN, term loan 3 month U.S. LIBOR + 4.750% 10.0004% 4/20/28 (b)(c)(d) | | 26,185 | 26,334 |
| Air Canada Tranche B 1LN, term loan 3 month U.S. LIBOR + 3.500% 8.3694% 8/11/28 (b)(c)(d) | | 17,356 | 17,294 |
| Dynasty Acquisition Co., Inc.: | | | |
| Tranche B 1LN, term loan 1 month U.S. LIBOR + 3.500% 8.5822% 4/8/26 (b)(c)(d) | | 4,892 | 4,798 |
| Tranche B2 1LN, term loan 1 month U.S. LIBOR + 3.500% 8.5822% 4/4/26 (b)(c)(d) | | 2,630 | 2,580 |
| Echo Global Logistics, Inc.: | | | |
| 1LN, term loan 3 month U.S. LIBOR + 4.750% 9.7746% 11/23/28 (b)(c)(d)(e) | | 19,353 | 18,639 |
| 2LN, term loan 3 month U.S. LIBOR + 8.000% 13.0246% 11/23/29 (b)(c)(d)(e) | | 4,100 | 3,948 |
| Mileage Plus Holdings LLC Tranche B 1LN, term loan 3 month U.S. LIBOR + 5.250% 10.2126% 7/2/27 (b)(c)(d) | | 23,146 | 24,062 |
| Rand Parent LLC Tranche B 1LN, term loan CME Term SOFR 1 Month Index + 4.250% 9.1273% 2/9/30 (b)(c)(d) | | 5,340 | 4,986 |
| SkyMiles IP Ltd. Tranche B 1LN, term loan 3 month U.S. LIBOR + 3.750% 8.7985% 10/20/27 (b)(c)(d) | | 20,691 | 21,421 |
| STG Logistics, Inc. 1LN, term loan CME Term SOFR 1 Month Index + 6.000% 11.0822% 3/24/28 (b)(c)(d)(e) | | 12,311 | 11,879 |
| United Airlines, Inc. Tranche B 1LN, term loan 3 month U.S. LIBOR + 3.750% 8.7704% 4/21/28 (b)(c)(d) | | 30,956 | 30,811 |
TOTAL AIR TRANSPORTATION | | | 166,752 |
| Automotive & Auto Parts - 1.7% | | | |
| American Trailer World Corp. Tranche B 1LN, term loan CME Term SOFR 1 Month Index + 3.750% 8.657% 3/5/28 (b)(c)(d) | | 19,862 | 17,075 |
| Belron Finance U.S. LLC Tranche B 1LN, term loan CME Term SOFR 1 Month Index + 2.750% 4/6/29 (c)(d)(f) | | 5,240 | 5,227 |
| Clarios Global LP Tranche B 1LN, term loan: | | | |
| 1 month U.S. LIBOR + 3.250% 8.2746% 4/30/26 (b)(c)(d) | | 10,905 | 10,875 |
| CME Term SOFR 1 Month Index + 3.750% 4/20/30 (c)(d)(f) | | 26,480 | 26,436 |
| CWGS Group LLC Tranche B 1LN, term loan 1 month U.S. LIBOR + 2.500% 7.4533% 6/3/28 (b)(c)(d) | | 40,036 | 37,006 |
| Driven Holdings LLC Tranche B 1LN, term loan 1 month U.S. LIBOR + 3.000% 7.9527% 12/17/28 (b)(c)(d) | | 13,048 | 12,771 |
| Les Schwab Tire Centers Tranche B 1LN, term loan 1 month U.S. LIBOR + 3.250% 8.0636% 11/2/27 (b)(c)(d) | | 15,258 | 15,162 |
| PECF USS Intermediate Holding III Corp. Tranche B 1LN, term loan 1 month U.S. LIBOR + 4.250% 9.52% 12/17/28 (b)(c)(d) | | 26,697 | 21,864 |
| Power Stop LLC 1LN, term loan 3 month U.S. LIBOR + 4.750% 9.5903% 1/26/29 (b)(c)(d) | | 19,939 | 14,223 |
| Rough Country LLC: | | | |
| 2LN, term loan 3 month U.S. LIBOR + 6.500% 11.3403% 7/28/29 (b)(c)(d) | | 6,095 | 5,463 |
| Tranche B 1LN, term loan 3 month U.S. LIBOR + 3.500% 8.3403% 7/28/28 (b)(c)(d) | | 5,131 | 4,775 |
| RVR Dealership Holdings LLC Tranche B 1LN, term loan 1 month U.S. LIBOR + 4.000% 8.9706% 2/8/28 (b)(c)(d) | | 5,285 | 4,606 |
| Truck Hero, Inc. Tranche B 1LN, term loan 1 month U.S. LIBOR + 3.750% 8.7746% 1/29/28 (b)(c)(d) | | 23,749 | 21,472 |
TOTAL AUTOMOTIVE & AUTO PARTS | | | 196,955 |
| Banks & Thrifts - 0.6% | | | |
| Citadel Securities LP Tranche B 1LN, term loan CME Term SOFR 1 Month Index + 2.500% 7.5967% 2/27/28 (b)(c)(d) | | 32,512 | 32,263 |
| Deerfield Dakota Holding LLC Tranche B 1LN, term loan CME Term SOFR 1 Month Index + 3.750% 8.557% 4/9/27 (b)(c)(d) | | 12,628 | 12,180 |
| Novae LLC 1LN, term loan CME Term SOFR 3 Month Index + 5.000% 10.3383% 12/22/28 (b)(c)(d) | | 12,058 | 10,370 |
| Superannuation & Investments U.S. LLC 1LN, term loan 1 month U.S. LIBOR + 3.750% 8.7746% 12/1/28 (b)(c)(d) | | 6,498 | 6,464 |
| Walker & Dunlop, Inc. Tranche B2 1LN, term loan CME Term SOFR 1 Month Index + 3.000% 8.0822% 12/16/28 (b)(c)(d) | | 3,375 | 3,341 |
TOTAL BANKS & THRIFTS | | | 64,618 |
| Broadcasting - 1.6% | | | |
| AppLovin Corp.: | | | |
| Tranche B 1LN, term loan CME Term SOFR 3 Month Index + 3.000% 8.0822% 10/25/28 (b)(c)(d) | | 8,076 | 8,012 |
| Tranche B, term loan CME Term SOFR 1 Month Index + 3.350% 8.3322% 8/15/25 (b)(c)(d) | | 18,344 | 18,230 |
| Diamond Sports Group LLC: | | | |
| 1LN, term loan CME Term SOFR 1 Month Index + 8.000% 12.7755% 5/25/26 (b)(c)(d) | | 8,575 | 7,681 |
| 2LN, term loan CME Term SOFR 1 Month Index + 3.250% 8.0255% 8/24/26 (b)(c)(d) | | 71,092 | 4,532 |
| Dotdash Meredith, Inc. Tranche B 1LN, term loan CME Term SOFR 1 Month Index + 4.000% 8.9034% 12/1/28 (b)(c)(d) | | 42,451 | 38,843 |
| Gray Television, Inc. Tranche D 1LN, term loan CME Term SOFR 1 Month Index + 3.000% 7.9179% 12/1/28 (b)(c)(d) | | 2,569 | 2,510 |
| Nexstar Media, Inc. Tranche B, term loan 1 month U.S. LIBOR + 2.500% 7.5246% 9/19/26 (b)(c)(d) | | 20,849 | 20,784 |
| Sinclair Television Group, Inc.: | | | |
| Tranche B 1LN, term loan: | | | |
1 month U.S. LIBOR + 2.500% 7.53% 9/30/26 (b)(c)(d) | | 5,233 | 4,716 |
1 month U.S. LIBOR + 3.000% 8.03% 4/1/28 (b)(c)(d) | | 2,948 | 2,498 |
| Tranche B4 1LN, term loan CME Term SOFR 1 Month Index + 2.750% 8.8322% 4/21/29 (b)(c)(d) | | 13,796 | 11,520 |
| Springer Nature Deutschland GmbH Tranche B18 1LN, term loan 1 month U.S. LIBOR + 3.000% 8.1591% 8/14/26 (b)(c)(d) | | 11,742 | 11,727 |
| Univision Communications, Inc.: | | | |
| 1LN, term loan CME Term SOFR 3 Month Index + 4.250% 9.1483% 6/24/29 (b)(c)(d) | | 7,841 | 7,755 |
| Tranche B 1LN, term loan: | | | |
1 month U.S. LIBOR + 3.250% 8.2746% 3/24/26 (b)(c)(d) | | 6,046 | 6,000 |
1 month U.S. LIBOR + 3.250% 8.2746% 1/31/29 (b)(c)(d) | | 40,125 | 39,423 |
| Tranche C 5LN, term loan 3 month U.S. LIBOR + 2.750% 7.7746% 3/15/24 (b)(c)(d) | | 862 | 862 |
TOTAL BROADCASTING | | | 185,093 |
| Building Materials - 2.9% | | | |
| Acproducts Holdings, Inc. Tranche B 1LN, term loan 1 month U.S. LIBOR + 4.250% 9.4091% 5/17/28 (b)(c)(d) | | 41,049 | 32,438 |
| APi Group DE, Inc. Tranche B 1LN, term loan: | | | |
| 1 month U.S. LIBOR + 2.500% 7.5903% 10/1/26 (b)(c)(d) | | 13,759 | 13,739 |
| 1 month U.S. LIBOR + 2.750% 7.7746% 12/16/28 (b)(c)(d) | | 11,470 | 11,454 |
| Foley Products Co. LLC 1LN, term loan CME Term SOFR 3 Month Index + 4.750% 9.7983% 12/29/28 (b)(c)(d) | | 11,456 | 11,327 |
| Hunter Douglas, Inc. Tranche B 1LN, term loan CME Term SOFR 3 Month Index + 3.500% 8.3733% 2/25/29 (b)(c)(d) | | 84,970 | 77,111 |
| Ingersoll-Rand Services Co. Tranche B 1LN, term loan CME Term SOFR 1 Month Index + 1.750% 6.657% 2/28/27 (b)(c)(d) | | 17,649 | 17,558 |
| Installed Building Products, Inc. Tranche B 1LN, term loan 1 month U.S. LIBOR + 2.250% 7.3467% 12/14/28 (b)(c)(d) | | 8,019 | 7,981 |
| Oscar AcquisitionCo LLC 1LN, term loan CME Term SOFR 3 Month Index + 4.500% 9.4983% 4/29/29 (b)(c)(d) | | 38,158 | 36,833 |
| Smyrna Ready Mix LLC Tranche B 1lN, term loan CME Term SOFR 1 Month Index + 4.250% 9.3322% 4/1/29 (b)(c)(d) | | 20,062 | 19,862 |
| Specialty Building Products Holdings LLC Tranche B 1LN, term loan 1 month U.S. LIBOR + 3.250% 8.2677% 10/15/28 (b)(c)(d) | | 9,039 | 8,502 |
| SRS Distribution, Inc. Tranche B 1LN, term loan: | | | |
| 1 month U.S. LIBOR + 3.500% 8.5246% 6/4/28 (b)(c)(d) | | 36,908 | 35,149 |
| CME Term SOFR 3 Month Index + 3.500% 8.5822% 6/2/28 (b)(c)(d) | | 11,411 | 10,871 |
| Standard Industries, Inc./New Jersey Tranche B 1LN, term loan CME Term SOFR 1 Month Index + 2.250% 7.3288% 9/22/28 (b)(c)(d) | | 19,895 | 19,834 |
| Traverse Midstream Partners Ll Tranche B, term loan CME TERM SOFR 6 MONTH INDEX + 4.250% 8.7264% 2/16/28 (b)(c)(d) | | 9,572 | 9,431 |
| USIC Holdings, Inc. Tranche B 1LN, term loan 1 month U.S. LIBOR + 3.500% 8.3403% 5/14/28 (b)(c)(d) | | 11,372 | 11,137 |
| White Capital Buyer LLC Tranche B 1LN, term loan 1 month U.S. LIBOR + 4.000% 8.7322% 10/19/27 (b)(c)(d) | | 9,752 | 9,652 |
TOTAL BUILDING MATERIALS | | | 332,879 |
| Cable/Satellite TV - 1.9% | | | |
| Charter Communication Operating LLC Tranche B2 1LN, term loan 1 month U.S. LIBOR + 1.750% 6.557% 2/1/27 (b)(c)(d) | | 70,447 | 69,214 |
| Coral-U.S. Co.-Borrower LLC: | | | |
| Tranche B, term loan 1 month U.S. LIBOR + 2.250% 7.1977% 1/31/28 (b)(c)(d) | | 31,425 | 30,622 |
| Tranche B6 1LN, term loan 1 month U.S. LIBOR + 3.000% 7.9477% 10/15/29 (b)(c)(d) | | 4,745 | 4,661 |
| CSC Holdings LLC: | | | |
| Tranche B 5LN, term loan CME Term SOFR 1 Month Index + 2.500% 7.4477% 4/15/27 (b)(c)(d) | | 22,132 | 19,515 |
| Tranche B6 LN, term loan CME Term SOFR 1 Month Index + 4.500% 9.3895% 1/18/28 (b)(c)(d) | | 48,138 | 44,227 |
| DIRECTV Financing LLC 1LN, term loan 1 month U.S. LIBOR + 5.000% 10.0246% 8/2/27 (b)(c)(d) | | 13,569 | 13,005 |
| Virgin Media Bristol LLC: | | | |
| Tranche N, term loan 1 month U.S. LIBOR + 2.500% 7.4477% 1/31/28 (b)(c)(d) | | 21,915 | 21,538 |
| Tranche Y 1LN, term loan CME Term SOFR 1 Month Index + 3.250% 8.3106% 3/6/31 (b)(c)(d) | | 12,610 | 12,389 |
TOTAL CABLE/SATELLITE TV | | | 215,171 |
| Capital Goods - 0.6% | | | |
| Ali Group North America Corp. Tranche B 1LN, term loan CME Term SOFR 1 Month Index + 2.000% 7.0967% 7/22/29 (b)(c)(d) | | 8,834 | 8,792 |
| Chart Industries, Inc. 1LN, term loan CME Term SOFR 1 Month Index + 3.750% 8.7395% 3/15/30 (b)(c)(d) | | 18,305 | 18,294 |
| CPM Holdings, Inc.: | | | |
| 2LN, term loan 1 month U.S. LIBOR + 8.250% 13.0976% 11/15/26 (b)(c)(d) | | 2,917 | 2,869 |
| Tranche B 1LN, term loan 1 month U.S. LIBOR + 3.500% 8.3476% 11/15/25 (b)(c)(d) | | 7,504 | 7,480 |
| Griffon Corp. Tranche B 1LN, term loan CME Term SOFR 1 Month Index + 2.750% 7.4978% 1/24/29 (b)(c)(d) | | 16,196 | 16,128 |
| TNT Crane & Rigging LLC 2LN, term loan 3 month U.S. LIBOR + 8.750% 13.9266% 4/16/25 (b)(c)(d)(e) | | 4,450 | 4,217 |
| Vertical U.S. Newco, Inc. Tranche B 1LN, term loan 6 month U.S. LIBOR + 3.500% 8.6023% 7/31/27 (b)(c)(d) | | 9,423 | 9,187 |
TOTAL CAPITAL GOODS | | | 66,967 |
| Chemicals - 3.2% | | | |
| ARC Falcon I, Inc.: | | | |
| Tranche B 1LN, term loan 1 month U.S. LIBOR + 3.750% 8.7746% 9/30/28 (b)(c)(d) | | 21,600 | 19,647 |
| Tranche B 2LN, term loan 1 month U.S. LIBOR + 7.000% 12.0246% 9/22/29 (b)(c)(d)(e) | | 3,385 | 2,869 |
| Aruba Investment Holdings LLC: | | | |
| 1LN, term loan CME Term SOFR 1 Month Index + 4.750% 9.7322% 11/24/27 (b)(c)(d) | | 10,484 | 10,326 |
| 2LN, term loan 1 month U.S. LIBOR + 7.750% 12.7746% 11/24/28 (b)(c)(d) | | 12,310 | 10,956 |
| Tranche B 1LN, term loan 1 month U.S. LIBOR + 3.750% 9.0246% 11/24/27 (b)(c)(d) | | 14,505 | 14,359 |
| Avient Corp. Tranche B 1LN, term loan CME Term SOFR 1 Month Index + 3.250% 8.2954% 8/29/29 (b)(c)(d) | | 5,933 | 5,950 |
| Bakelite U.S. Holding Ltd. 1LN, term loan CME Term SOFR 3 Month Index + 4.000% 9.0483% 5/27/29 (b)(c)(d) | | 15,384 | 14,615 |
| Consolidated Energy Finance SA: | | | |
| Tranche B 1LN, term loan 3 month U.S. LIBOR + 3.500% 8.5246% 5/7/25 (b)(c)(d)(e) | | 11,574 | 11,227 |
| Tranche B, term loan 3 month U.S. LIBOR + 2.500% 7.3403% 5/7/25 (b)(c)(d) | | 10,758 | 10,699 |
| Discovery Purchaser Corp. 1LN, term loan CME Term SOFR 3 Month Index + 4.370% 9.2836% 10/4/29 (b)(c)(d) | | 25,915 | 24,792 |
| Groupe Solmax, Inc. Tranche B 1LN, term loan 3 month U.S. LIBOR + 4.750% 9.9091% 5/27/28 (b)(c)(d) | | 18,402 | 16,293 |
| Herens U.S. Holdco Corp. Tranche B 1LN, term loan 3 month U.S. LIBOR + 4.000% 9.1591% 7/3/28 (b)(c)(d) | | 13,482 | 12,389 |
| Hexion Holdings Corp. 1LN, term loan CME Term SOFR 3 Month Index + 4.500% 9.4536% 3/15/29 (b)(c)(d) | | 39,248 | 35,085 |
| Hexion, Inc. 2LN, term loan CME Term SOFR 1 Month Index + 7.430% 12.5018% 3/15/30 (b)(c)(d) | | 8,290 | 6,798 |
| ICP Group Tranche B 1LN, term loan 3 month U.S. LIBOR + 3.750% 8.9099% 12/29/27 (b)(c)(d) | | 7,689 | 5,822 |
| INEOS U.S. Finance LLC Tranche B 1LN, term loan CME Term SOFR 1 Month Index + 3.500% 8.407% 2/10/30 (b)(c)(d) | | 7,590 | 7,568 |
| INEOS U.S. Petrochem LLC: | | | |
| 1LN, term loan CME Term SOFR 1 Month Index + 3.750% 8.8322% 3/1/30 (b)(c)(d) | | 7,839 | 7,819 |
| Tranche B 1LN, term loan 1 month U.S. LIBOR + 2.750% 7.8467% 1/20/26 (b)(c)(d) | | 24,572 | 24,431 |
| Kraton Polymers U.S. LLC Tranche B 1LN, term loan CME Term SOFR 3 Month Index + 3.250% 8.5444% 3/15/29 (b)(c)(d) | | 10,207 | 10,185 |
| Manchester Acquisition Sub LLC Tranche B 1LN, term loan CME Term SOFR 3 Month Index + 5.750% 10.8063% 12/1/26 (b)(c)(d) | | 14,118 | 11,930 |
| Olympus Water U.S. Holding Corp. Tranche B 1LN, term loan: | | | |
| 3 month U.S. LIBOR + 3.750% 8.9375% 11/9/28 (b)(c)(d) | | 21,587 | 20,437 |
| CME Term SOFR 3 Month Index + 4.500% 9.4983% 11/9/28 (b)(c)(d) | | 12,420 | 11,855 |
| Starfruit U.S. Holdco LLC: | | | |
| Tranche B 1LN, term loan CME Term SOFR 1 Month Index + 4.000% 8.9901% 4/3/28 (b)(c)(d) | | 9,940 | 9,903 |
| Tranche B, term loan CME Term SOFR 1 Month Index + 2.750% 7.8954% 10/1/25 (b)(c)(d) | | 20,566 | 20,443 |
| The Chemours Co. LLC Tranche B 1LN, term loan 3 month U.S. LIBOR + 1.750% 6.8322% 4/3/25 (b)(c)(d) | | 16,958 | 16,849 |
| U.S. Coatings Acquisition, Inc. 1LN, term loan CME Term SOFR 1 Month Index + 3.000% 7.8983% 12/20/29 (b)(c)(d) | | 6,541 | 6,553 |
| W.R. Grace Holding LLC Tranche B 1LN, term loan 3 month U.S. LIBOR + 3.750% 8.9375% 9/22/28 (b)(c)(d) | | 17,494 | 17,485 |
TOTAL CHEMICALS | | | 367,285 |
| Consumer Products - 2.4% | | | |
| 19Th Holdings Golf LLC Tranche B 1LN, term loan CME Term SOFR 1 Month Index + 3.250% 7.9104% 2/7/29 (b)(c)(d) | | 21,240 | 19,806 |
| Aip Rd Buyer Corp.: | | | |
| 1LN, term loan CME Term SOFR 1 Month Index + 4.250% 9.2322% 12/22/28 (b)(c)(d) | | 9,212 | 8,820 |
| Tranche B 1LN, term loan CME Term SOFR 1 Month Index + 5.000% 9.807% 12/23/28 (b)(c)(d) | | 17,625 | 17,206 |
| BCPE Empire Holdings, Inc.: | | | |
| 1LN, term loan: | | | |
CME Term SOFR 1 Month Index + 4.000% 9.0246% 6/11/26 (b)(c)(d) | | 11,148 | 11,011 |
CME Term SOFR 1 Month Index + 4.620% 9.7072% 6/11/26 (b)(c)(d) | | 2,968 | 2,953 |
| Tranche B 1LN, term loan 1 month U.S. LIBOR + 4.000% 9.0246% 6/11/26 (b)(c)(d) | | 14,806 | 14,615 |
| Bombardier Recreational Products, Inc. Tranche B 1LN, term loan: | | | |
| 1 month U.S. LIBOR + 2.000% 6.907% 5/23/27 (b)(c)(d) | | 9,561 | 9,310 |
| CME Term SOFR 1 Month Index + 3.500% 8.307% 12/13/29 (b)(c)(d) | | 14,425 | 14,323 |
| CNT Holdings I Corp. Tranche B 1LN, term loan CME Term SOFR 1 Month Index + 3.500% 8.4587% 11/8/27 (b)(c)(d) | | 20,058 | 19,845 |
| Conair Holdings LLC Tranche B 1LN, term loan 3 month U.S. LIBOR + 3.750% 8.9091% 5/17/28 (b)(c)(d) | | 11,482 | 10,683 |
| Diamond BC BV Tranche B 1LN, term loan 3 month U.S. LIBOR + 2.750% 8.0565% 9/29/28 (b)(c)(d) | | 16,669 | 16,641 |
| Gloves Buyer, Inc. Tranche B 1LN, term loan 1 month U.S. LIBOR + 4.000% 8.8403% 1/6/28 (b)(c)(d) | | 1,535 | 1,462 |
| Knowlton Development Corp., Inc. Tranche B 1LN, term loan 1 month U.S. LIBOR + 3.750% 8.7746% 12/21/25 (b)(c)(d) | | 13,658 | 13,204 |
| Kronos Acquisition Holdings, Inc. Tranche B 1LN, term loan 3 month U.S. LIBOR + 3.750% 8.7034% 12/22/26 (b)(c)(d) | | 28,095 | 27,358 |
| Mattress Firm, Inc. Tranche B 1LN, term loan 6 month U.S. LIBOR + 4.250% 9.39% 9/24/28 (b)(c)(d) | | 22,488 | 20,918 |
| Petco Health & Wellness Co., Inc. Tranche B 1LN, term loan CME Term SOFR 3 Month Index + 3.250% 8.4099% 3/4/28 (b)(c)(d) | | 8,247 | 8,121 |
| Runner Buyer, Inc. Tranche B 1LN, term loan 3 month U.S. LIBOR + 5.500% 10.4534% 10/20/28 (b)(c)(d) | | 12,733 | 9,462 |
| Sweetwater Borrower LLC Tranche B 1LN, term loan 1 month U.S. LIBOR + 4.250% 9.3125% 8/5/28 (b)(c)(d) | | 22,884 | 21,339 |
| TGP Holdings III LLC Tranche B 1LN, term loan 1 month U.S. LIBOR + 3.250% 8.2746% 6/29/28 (b)(c)(d) | | 9,857 | 8,003 |
| Woof Holdings LLC: | | | |
| Tranche B 1LN, term loan 3 month U.S. LIBOR + 3.750% 8.76% 12/21/27 (b)(c)(d) | | 15,515 | 14,972 |
| Tranche B 2LN, term loan 3 month U.S. LIBOR + 7.250% 12.4206% 12/21/28 (b)(c)(d) | | 2,135 | 1,708 |
TOTAL CONSUMER PRODUCTS | | | 271,760 |
| Containers - 1.8% | | | |
| AOT Packaging Products AcquisitionCo LLC 1LN, term loan 1 month U.S. LIBOR + 3.250% 8.2746% 3/3/28 (b)(c)(d) | | 24,366 | 23,738 |
| Berlin Packaging, LLC Tranche B 1LN, term loan: | | | |
| 1 month U.S. LIBOR + 3.250% 8.073% 3/11/28 (b)(c)(d) | | 21,070 | 20,407 |
| 1 month U.S. LIBOR + 3.750% 8.4449% 3/11/28 (b)(c)(d) | | 11,872 | 11,624 |
| Berry Global, Inc. Tranche Z 1LN, term loan 1 month U.S. LIBOR + 1.750% 6.6503% 7/1/26 (b)(c)(d) | | 26,931 | 26,857 |
| Canister International Group, Inc. 1LN, term loan 1 month U.S. LIBOR + 4.750% 9.8322% 12/21/26 (b)(c)(d) | | 5,820 | 5,816 |
| Charter NEX U.S., Inc. 1LN, term loan CME Term SOFR 1 Month Index + 3.750% 8.6715% 12/1/27 (b)(c)(d) | | 15,375 | 15,156 |
| Graham Packaging Co., Inc. Tranche B 1LN, term loan 1 month U.S. LIBOR + 3.000% 8.0246% 8/4/27 (b)(c)(d) | | 18,481 | 18,366 |
| Kloeckner Pentaplast of America, Inc. Tranche B 1LN, term loan CME TERM SOFR 6 MONTH INDEX + 4.750% 10.1293% 2/9/26 (b)(c)(d) | | 8,845 | 8,088 |
| Pregis TopCo Corp. 1LN, term loan: | | | |
| 3 month U.S. LIBOR + 3.750% 8.7746% 8/1/26 (b)(c)(d) | | 1,970 | 1,932 |
| 3 month U.S. LIBOR + 4.000% 8.8467% 7/31/26 (b)(c)(d) | | 9,675 | 9,500 |
| Proampac PG Borrower LLC Tranche B 1LN, term loan 1 month U.S. LIBOR + 3.750% 8.9762% 11/18/25 (b)(c)(d) | | 4,932 | 4,848 |
| Reynolds Consumer Products LLC Tranche B 1LN, term loan CME Term SOFR 1 Month Index + 1.750% 6.657% 1/30/27 (b)(c)(d) | | 18,431 | 18,226 |
| Reynolds Group Holdings, Inc. Tranche B 1LN, term loan: | | | |
| 1 month U.S. LIBOR + 3.250% 8.3467% 2/5/26 (b)(c)(d) | | 16,069 | 16,016 |
| 1 month U.S. LIBOR + 3.250% 8.3467% 9/24/28 (b)(c)(d) | | 10,554 | 10,437 |
| Ring Container Technologies Group LLC Tranche B 1LN, term loan 1 month U.S. LIBOR + 3.500% 8.3403% 8/12/28 (b)(c)(d) | | 9,131 | 9,055 |
TOTAL CONTAINERS | | | 200,066 |
| Diversified Financial Services - 2.1% | | | |
| AlixPartners LLP Tranche B 1LN, term loan 1 month U.S. LIBOR + 2.750% 7.7746% 2/4/28 (b)(c)(d) | | 14,592 | 14,558 |
| AVSC Holding Corp.: | | | |
| Tranche B 1LN, term loan 3 month U.S. LIBOR + 3.500% 8.3061% 3/1/25 (b)(c)(d) | | 6,508 | 6,219 |
| Tranche B2 1LN, term loan 3 month U.S. LIBOR + 5.500% 10.3061% 10/15/26 (b)(c)(d) | | 6,152 | 5,933 |
| Broadstreet Partners, Inc.: | | | |
| Tranche B 1LN, term loan 1 month U.S. LIBOR + 3.250% 8.2746% 1/27/27 (b)(c)(d) | | 6,545 | 6,414 |
| Tranche B3 1LN, term loan CME Term SOFR 1 Month Index + 4.000% 1/26/29 (c)(d)(f) | | 12,135 | 12,029 |
| Eagle 4 Ltd. Tranche B 1LN, term loan 1 month U.S. LIBOR + 3.250% 8.4091% 7/12/28 (b)(c)(d) | | 5,779 | 5,772 |
| Finco I LLC Tranche B 1LN, term loan 1 month U.S. LIBOR + 2.500% 7.5246% 6/27/25 (b)(c)(d) | | 1,838 | 1,835 |
| Focus Financial Partners LLC: | | | |
| Tranche B 1LN, term loan CME Term SOFR 1 Month Index + 2.500% 7.4822% 6/24/28 (b)(c)(d) | | 13,983 | 13,789 |
| Tranche B5 1LN, term loan CME Term SOFR 1 Month Index + 3.250% 8.057% 6/30/28 (b)(c)(d) | | 17,334 | 17,214 |
| GT Polaris, Inc. Tranche B 1LN, term loan 1 month U.S. LIBOR + 3.750% 9.0227% 9/24/27 (b)(c)(d) | | 7,100 | 6,577 |
| HarbourVest Partners LLC Tranche B 1LN, term loan: | | | |
| 3 month U.S. LIBOR + 2.250% 7.1977% 3/1/25 (b)(c)(d) | | 17,419 | 17,397 |
| CME Term SOFR 1 Month Index + 3.250% 7.7984% 4/6/30 (b)(c)(d) | | 2,090 | 2,085 |
| Hightower Holding LLC Tranche B 1LN, term loan 3 month U.S. LIBOR + 4.000% 9.01% 4/21/28 (b)(c)(d) | | 13,315 | 12,758 |
| LSF11 Trinity Bidco, Inc. Tranche B 1LN, term loan CME Term SOFR 1 Month Index + 4.500% 4/27/30 (c)(d)(f) | | 4,360 | 4,306 |
| Nexus Buyer LLC: | | | |
| 2LN, term loan 1 month U.S. LIBOR + 6.250% 11.3322% 11/1/29 (b)(c)(d) | | 14,420 | 12,953 |
| Tranche B 1LN, term loan 1 month U.S. LIBOR + 3.750% 8.8322% 11/8/26 (b)(c)(d) | | 14,952 | 14,084 |
| RCS Capital Corp. 1LN, term loan CME Term SOFR 1 Month Index + 4.500% 3/8/30 (c)(d)(f) | | 5,745 | 5,641 |
| TransUnion LLC: | | | |
| Tranche B5 1LN, term loan 1 month U.S. LIBOR + 1.750% 6.7746% 11/16/26 (b)(c)(d) | | 22,107 | 21,999 |
| Tranche B6 1LN, term loan 1 month U.S. LIBOR + 2.250% 7.2746% 12/1/28 (b)(c)(d) | | 15,395 | 15,336 |
| UFC Holdings LLC Tranche B 1LN, term loan 3 month U.S. LIBOR + 2.750% 7.57% 4/29/26 (b)(c)(d) | | 9,777 | 9,747 |
| WH Borrower LLC Tranche B 1LN, term loan: | | | |
| CME Term SOFR 1 Month Index + 5.500% 10.4863% 2/9/27 (b)(c)(d) | | 22,942 | 22,182 |
| CME Term SOFR 1 Month Index + 5.500% 10.4863% 2/15/27 (b)(c)(d) | | 13,320 | 12,893 |
TOTAL DIVERSIFIED FINANCIAL SERVICES | | | 241,721 |
| Diversified Media - 0.8% | | | |
| Advantage Sales & Marketing, Inc. Tranche B 1LN, term loan 1 month U.S. LIBOR + 4.500% 9.7189% 10/28/27 (b)(c)(d) | | 15,351 | 13,056 |
| Allen Media LLC Tranche B 1LN, term loan CME Term SOFR 3 Month Index + 5.500% 10.5483% 2/10/27 (b)(c)(d) | | 39,899 | 35,036 |
| Cmg Media Corp. Tranche B 1LN, term loan 1 month U.S. LIBOR + 3.500% 8.6591% 12/17/26 (b)(c)(d) | | 48,501 | 41,590 |
TOTAL DIVERSIFIED MEDIA | | | 89,682 |
| Energy - 2.6% | | | |
| American Consolidated Natural term loan 21.2681% 9/16/25 (b)(d)(e) | | 1,648 | 1,656 |
| Apro LLC Tranche B 1LN, term loan 3 month U.S. LIBOR + 3.750% 8.758% 11/14/26 (b)(c)(d) | | 17,711 | 17,261 |
| Array Technologies, Inc. Tranche B 1LN, term loan 3 month U.S. LIBOR + 3.250% 8.1721% 10/14/27 (b)(c)(d) | | 24,946 | 24,634 |
| BW Gas & Convenience Holdings LLC Tranche B 1LN, term loan 1 month U.S. LIBOR + 3.500% 8.5246% 3/17/28 (b)(c)(d) | | 7,349 | 7,202 |
| CQP Holdco LP / BIP-V Chinook Holdco LLC Tranche B 1LN, term loan 1 month U.S. LIBOR + 3.500% 8.6591% 6/4/28 (b)(c)(d) | | 62,645 | 62,458 |
| Delek U.S. Holdings, Inc. Tranche B 1LN, term loan CME Term SOFR 1 Month Index + 3.500% 8.5822% 11/19/29 (b)(c)(d) | | 29,245 | 28,575 |
| EG America LLC Tranche B 1LN, term loan: | | | |
| 3 month U.S. LIBOR + 4.000% 8.8403% 2/6/25 (b)(c)(d) | | 24,128 | 23,272 |
| 3 month U.S. LIBOR + 4.250% 9.0903% 3/10/26 (b)(c)(d) | | 10,272 | 9,910 |
| EG Finco Ltd. Tranche B, term loan 3 month U.S. LIBOR + 4.000% 9.1511% 2/6/25 (b)(c)(d) | | 4,749 | 4,580 |
| Esdec Solar Group BV Tranche B 1LN, term loan 6 month U.S. LIBOR + 4.750% 9.9596% 8/27/28 (b)(c)(d) | | 15,231 | 15,003 |
| GIP II Blue Holding LP Tranche B 1LN, term loan 3 month U.S. LIBOR + 4.500% 9.6591% 9/29/28 (b)(c)(d) | | 39,312 | 39,157 |
| GIP III Stetson I LP Tranche B, term loan 1 month U.S. LIBOR + 4.250% 9.0903% 7/18/25 (b)(c)(d) | | 17,905 | 17,845 |
| Natgasoline LLC Tranche B, term loan 1 month U.S. LIBOR + 3.500% 8.5625% 11/14/25 (b)(c)(d) | | 11,603 | 11,472 |
| Par Petroleum LLC Tranche B 1LN, term loan CME Term SOFR 1 Month Index + 4.250% 9.2405% 2/14/30 (b)(c)(d) | | 8,695 | 8,539 |
| Rockwood Service Corp. Tranche B 1LN, term loan 1 month U.S. LIBOR + 4.000% 9.0246% 1/23/27 (b)(c)(d) | | 2,673 | 2,657 |
| WaterBridge Operating LLC Tranche B 1LN, term loan 6 month U.S. LIBOR + 5.750% 11.0051% 6/21/26 (b)(c)(d) | | 6,881 | 6,824 |
| Win Waste Innovations Holdings Tranche B 1LN, term loan 3 month U.S. LIBOR + 2.750% 7.8467% 3/25/28 (b)(c)(d) | | 9,719 | 9,212 |
TOTAL ENERGY | | | 290,257 |
| Entertainment/Film - 0.3% | | | |
| AP Core Holdings II LLC: | | | |
| Tranche B1 1LN, term loan 1 month U.S. LIBOR + 5.500% 10.5246% 9/1/27 (b)(c)(d) | | 15,807 | 15,332 |
| Tranche B2 1LN, term loan 1 month U.S. LIBOR + 5.500% 10.5246% 9/1/27 (b)(c)(d) | | 13,845 | 13,441 |
TOTAL ENTERTAINMENT/FILM | | | 28,773 |
| Environmental - 0.8% | | | |
| Clean Harbors, Inc. Tranche B 1LN, term loan 1 month U.S. LIBOR + 2.000% 6.8403% 10/8/28 (b)(c)(d) | | 8,320 | 8,351 |
| Covanta Holding Corp.: | | | |
| Tranche B 1LN, term loan CME Term SOFR 1 Month Index + 2.500% 7.4822% 11/30/28 (b)(c)(d) | | 13,898 | 13,818 |
| Tranche C 1LN, term loan CME Term SOFR 1 Month Index + 2.500% 7.4965% 11/30/28 (b)(c)(d) | | 1,052 | 1,045 |
| Madison IAQ LLC Tranche B 1LN, term loan 3 month U.S. LIBOR + 3.250% 8.3023% 6/21/28 (b)(c)(d) | | 33,337 | 32,026 |
| The Brickman Group, Ltd. Tranche B 1LN, term loan CME Term SOFR 1 Month Index + 3.250% 8.2853% 4/22/29 (b)(c)(d) | | 13,160 | 12,897 |
| TRC Companies, Inc. Tranche B 1LN, term loan 1 month U.S. LIBOR + 3.750% 8.7746% 11/17/28 (b)(c)(d) | | 13,398 | 13,219 |
| WTG Holdings III Corp. Tranche B 1LN, term loan 1 month U.S. LIBOR + 2.250% 7.125% 4/1/28 (b)(c)(d) | | 4,696 | 4,661 |
TOTAL ENVIRONMENTAL | | | 86,017 |
| Food & Drug Retail - 0.4% | | | |
| 8th Avenue Food & Provisions, Inc. Tranche B 1LN, term loan 1 month U.S. LIBOR + 4.750% 9.5903% 10/1/25 (b)(c)(d) | | 4,565 | 4,033 |
| Cardenas Merger Sub, LLC 1LN, term loan CME TERM SOFR 6 MONTH INDEX + 6.750% 11.7483% 8/1/29 (b)(c)(d) | | 10,204 | 10,140 |
| Froneri U.S., Inc. Tranche B 1LN, term loan 1 month U.S. LIBOR + 2.250% 7.4091% 1/29/27 (b)(c)(d) | | 17,744 | 17,509 |
| JP Intermediate B LLC Tranche B, term loan 3 month U.S. LIBOR + 5.500% 10.7727% 11/20/25 (b)(c)(d) | | 20,297 | 10,724 |
| Primary Products Finance LLC 1LN, term loan CME Term SOFR 3 Month Index + 4.000% 9.0401% 4/1/29 (b)(c)(d) | | 6,240 | 6,157 |
TOTAL FOOD & DRUG RETAIL | | | 48,563 |
| Food/Beverage/Tobacco - 1.3% | | | |
| 8th Avenue Food & Provisions, Inc.: | | | |
| 2LN, term loan 1 month U.S. LIBOR + 7.750% 12.5903% 10/1/26 (b)(c)(d) | | 2,240 | 1,432 |
| Tranche B 1LN, term loan 1 month U.S. LIBOR + 3.750% 8.5903% 10/1/25 (b)(c)(d) | | 4,388 | 3,852 |
| Bengal Debt Merger Sub LLC: | | | |
| 1LN, term loan CME Term SOFR 3 Month Index + 3.250% 8.2483% 1/24/29 (b)(c)(d) | | 33,971 | 30,164 |
| 2LN, term loan CME Term SOFR 3 Month Index + 6.000% 10.9983% 1/24/30 (b)(c)(d) | | 8,175 | 6,131 |
| Chobani LLC Tranche B 1LN, term loan 1 month U.S. LIBOR + 3.500% 8.4215% 10/23/27 (b)(c)(d) | | 16,580 | 16,492 |
| Del Monte Foods, Inc. Tranche B 1LN, term loan CME Term SOFR 1 Month Index + 4.250% 9.3143% 5/16/29 (b)(c)(d) | | 41,550 | 40,693 |
| Shearer's Foods, Inc. Tranche B 1LN, term loan 1 month U.S. LIBOR + 3.500% 8.5967% 9/23/27 (b)(c)(d) | | 9,230 | 9,010 |
| Triton Water Holdings, Inc. Tranche B 1LN, term loan 3 month U.S. LIBOR + 3.500% 8.6591% 3/31/28 (b)(c)(d) | | 43,924 | 41,564 |
TOTAL FOOD/BEVERAGE/TOBACCO | | | 149,338 |
| Gaming - 4.3% | | | |
| Bally's Corp. Tranche B 1LN, term loan 1 month U.S. LIBOR + 3.250% 8.1977% 10/1/28 (b)(c)(d) | | 4,003 | 3,850 |
| Caesars Entertainment, Inc. Tranche B 1LN, term loan CME Term SOFR 1 Month Index + 3.250% 8.3322% 1/26/30 (b)(c)(d) | | 110,250 | 109,699 |
| Churchill Downs, Inc. Tranche B 1LN, term loan CME Term SOFR 1 Month Index + 2.000% 6.85% 3/17/28 (b)(c)(d) | | 8,477 | 8,451 |
| Fertitta Entertainment LLC NV Tranche B 1LN, term loan CME Term SOFR 1 Month Index + 4.000% 8.9822% 1/27/29 (b)(c)(d) | | 133,399 | 129,648 |
| Flutter Financing B.V. Tranche B 1LN, term loan CME Term SOFR 1 Month Index + 3.250% 8.4099% 7/4/28 (b)(c)(d) | | 13,542 | 13,550 |
| Golden Entertainment, Inc. Tranche B, term loan 3 month U.S. LIBOR + 3.000% 8.03% 10/20/24 (b)(c)(d) | | 38,517 | 38,421 |
| GVC Holdings Gibraltar Ltd.: | | | |
| Tranche B2 1LN, term loan CME Term SOFR 1 Month Index + 3.500% 8.4368% 10/31/29 (b)(c)(d) | | 9,327 | 9,355 |
| Tranche B4 1LN, term loan 3 month U.S. LIBOR + 2.250% 7.4368% 3/16/27 (b)(c)(d) | | 12,920 | 12,871 |
| J&J Ventures Gaming LLC 1LN, term loan 3 month U.S. LIBOR + 4.000% 9.1591% 4/26/28 (b)(c)(d) | | 12,253 | 11,924 |
| PCI Gaming Authority 1LN, term loan 1 month U.S. LIBOR + 2.500% 7.5246% 5/29/26 (b)(c)(d) | | 7,534 | 7,520 |
| Penn Entertainment, Inc. Tranche B 1LN, term loan CME Term SOFR 1 Month Index + 2.750% 7.8322% 5/3/29 (b)(c)(d) | | 10,243 | 10,191 |
| Scientific Games Corp. 1LN, term loan CME Term SOFR 1 Month Index + 3.000% 7.9812% 4/14/29 (b)(c)(d) | | 26,744 | 26,629 |
| Scientific Games Holdings LP term loan CME Term SOFR 3 Month Index + 3.500% 8.4206% 4/4/29 (b)(c)(d) | | 31,152 | 30,664 |
| Stars Group Holdings BV Tranche B 1LN, term loan 3 month U.S. LIBOR + 2.250% 7.4091% 7/21/26 (b)(c)(d) | | 35,234 | 35,175 |
| Station Casinos LLC Tranche B 1LN, term loan 1 month U.S. LIBOR + 2.250% 7.28% 2/7/27 (b)(c)(d) | | 37,360 | 36,949 |
TOTAL GAMING | | | 484,897 |
| Healthcare - 5.2% | | | |
| Accelerated Health Systems LLC Tranche B1 LN, term loan CME Term SOFR 3 Month Index + 4.250% 9.2983% 2/15/29 (b)(c)(d) | | 16,674 | 12,480 |
| AHP Health Partners, Inc. Tranche B 1LN, term loan 1 month U.S. LIBOR + 3.500% 8.5246% 8/24/28 (b)(c)(d) | | 14,377 | 14,345 |
| Avantor Funding, Inc. Tranche B5 1LN, term loan 1 month U.S. LIBOR + 2.250% 7.3322% 11/6/27 (b)(c)(d) | | 15,070 | 15,044 |
| Charlotte Buyer, Inc. Tranche B 1LN, term loan CME Term SOFR 3 Month Index + 5.250% 10.0839% 2/12/28 (b)(c)(d) | | 8,978 | 8,612 |
| Da Vinci Purchaser Corp. Tranche B 1LN, term loan 1 month U.S. LIBOR + 4.000% 8.9534% 12/13/26 (b)(c)(d) | | 19,581 | 18,657 |
| Elanco Animal Health, Inc. Tranche B 1LN, term loan 1 month U.S. LIBOR + 1.750% 6.6534% 8/1/27 (b)(c)(d) | | 15,930 | 15,460 |
| Electron BidCo, Inc. Tranche B 1LN, term loan 1 month U.S. LIBOR + 3.000% 8.0967% 11/1/28 (b)(c)(d) | | 12,068 | 11,940 |
| Embecta Corp. Tranche B 1LN, term loan CME Term SOFR 1 Month Index + 3.000% 7.7914% 3/31/29 (b)(c)(d) | | 14,985 | 14,752 |
| Gainwell Acquisition Corp. Tranche B 1LN, term loan 3 month U.S. LIBOR + 4.000% 8.9983% 10/1/27 (b)(c)(d) | | 78,755 | 75,753 |
| HAH Group Holding Co. LLC: | | | |
| 1LN, term loan: | | | |
CME Term SOFR 1 Month Index + 5.000% 10.09% 10/29/27 (b)(c)(d) | | 2,970 | 2,890 |
CME Term SOFR 3 Month Index + 5.000% 10/29/27 (c)(d)(f) | | 6,015 | 5,925 |
| Tranche DD 1LN, term loan CME Term SOFR 3 Month Index + 5.000% 10.09% 10/29/27 (b)(c)(d) | | 376 | 366 |
| Horizon Pharma U.S.A., Inc. Tranche B 1LN, term loan 1 month U.S. LIBOR + 1.750% 6.76% 3/15/28 (b)(c)(d) | | 25,030 | 24,990 |
| ICU Medical, Inc. Tranche B 1LN, term loan CME Term SOFR 1 Month Index + 2.500% 7.5483% 1/6/29 (b)(c)(d) | | 13,325 | 13,173 |
| Insulet Corp. Tranche B 1LN, term loan CME Term SOFR 1 Month Index + 3.250% 8.3467% 5/4/28 (b)(c)(d) | | 36,208 | 36,144 |
| Jazz Financing Lux SARL Tranche B 1LN, term loan 1 month U.S. LIBOR + 3.500% 8.5246% 5/5/28 (b)(c)(d) | | 34,269 | 34,217 |
| Maravai Intermediate Holdings LLC Tranche B 1LN, term loan CME Term SOFR 3 Month Index + 3.000% 8.0279% 10/19/27 (b)(c)(d) | | 14,644 | 14,616 |
| MED ParentCo LP: | | | |
| 1LN, term loan 1 month U.S. LIBOR + 4.250% 9.2746% 8/31/26 (b)(c)(d) | | 12,174 | 11,132 |
| 2LN, term loan 1 month U.S. LIBOR + 8.250% 13.0903% 8/30/27 (b)(c)(d) | | 2,851 | 2,195 |
| Mozart Borrower LP Tranche B 1LN, term loan 1 month U.S. LIBOR + 3.250% 8.2746% 10/23/28 (b)(c)(d) | | 27,240 | 26,419 |
| National Mentor Holdings, Inc.: | | | |
| Tranche B 1LN, term loan 1 month U.S. LIBOR + 3.750% 8.8152% 3/2/28 (b)(c)(d) | | 13,433 | 10,232 |
| Tranche C 1LN, term loan 3 month U.S. LIBOR + 3.750% 8.7483% 3/2/28 (b)(c)(d) | | 225 | 171 |
| Organon & Co. Tranche B 1LN, term loan 3 month U.S. LIBOR + 3.000% 8% 6/2/28 (b)(c)(d) | | 37,823 | 37,744 |
| Packaging Coordinators Midco, Inc. Tranche B 1LN, term loan 3 month U.S. LIBOR + 3.500% 8.6591% 11/30/27 (b)(c)(d) | | 19,887 | 19,281 |
| Pathway Vet Alliance LLC Tranche B 1LN, term loan 3 month U.S. LIBOR + 3.750% 8.7746% 3/31/27 (b)(c)(d) | | 27,917 | 25,823 |
| Perrigo Investments LLC Tranche B 1LN, term loan CME Term SOFR 1 Month Index + 2.500% 7.3322% 4/20/29 (b)(c)(d) | | 16,743 | 16,646 |
| Phoenix Newco, Inc. Tranche B 1LN, term loan 1 month U.S. LIBOR + 3.250% 8.0903% 11/15/28 (b)(c)(d) | | 46,776 | 45,931 |
| PRA Health Sciences, Inc. Tranche B 1LN, term loan CME Term SOFR 3 Month Index + 2.250% 7.4099% 7/3/28 (b)(c)(d) | | 14,894 | 14,884 |
| Surgery Center Holdings, Inc. 1LN, term loan 1 month U.S. LIBOR + 3.750% 8.6977% 8/31/26 (b)(c)(d) | | 17,450 | 17,403 |
| U.S. Anesthesia Partners, Inc.: | | | |
| 2LN, term loan 1 month U.S. LIBOR + 7.500% 12.3476% 10/1/29 (b)(c)(d)(e) | | 2,820 | 2,580 |
| Tranche B 1LN, term loan 1 month U.S. LIBOR + 4.250% 9.0976% 10/1/28 (b)(c)(d) | | 27,076 | 25,654 |
| U.S. Radiology Specialists, Inc. Tranche B 1LN, term loan 3 month U.S. LIBOR + 5.250% 10.3322% 12/15/27 (b)(c)(d) | | 14,844 | 13,675 |
| Upstream Newco, Inc. 1LN, term loan 1 month U.S. LIBOR + 4.250% 9.4099% 11/20/26 (b)(c)(d) | | 4,460 | 3,466 |
TOTAL HEALTHCARE | | | 592,600 |
| Homebuilders/Real Estate - 0.8% | | | |
| Breakwater Energy Tranche B 1LN, term loan 11% 9/1/26 (b)(d)(e) | | 25,849 | 24,557 |
| DTZ U.S. Borrower LLC Tranche B 1LN, term loan: | | | |
| 1 month U.S. LIBOR + 2.750% 7.5903% 8/21/25 (b)(c)(d) | | 15,377 | 15,050 |
| CME Term SOFR 1 Month Index + 3.250% 8.157% 1/24/30 (b)(c)(d) | | 19,396 | 18,717 |
| Fluidra Finco SL Tranche B 1LN, term loan CME Term SOFR 1 Month Index + 2.000% 7.0822% 1/27/29 (b)(c)(d) | | 15,238 | 14,927 |
| Ryan Specialty Group LLC Tranche B 1LN, term loan CME Term SOFR 1 Month Index + 3.000% 8.0822% 9/1/27 (b)(c)(d) | | 18,858 | 18,803 |
TOTAL HOMEBUILDERS/REAL ESTATE | | | 92,054 |
| Hotels - 2.5% | | | |
| ASP LS Acquisition Corp. Tranche B 1LN, term loan 6 month U.S. LIBOR + 4.500% 9.6591% 4/30/28 (b)(c)(d) | | 11,596 | 9,934 |
| BRE/Everbright M6 Borrower LLC Tranche B 1LN, term loan 1 month U.S. LIBOR + 5.000% 9.8711% 9/9/26 (b)(c)(d) | | 9,019 | 8,921 |
| Carnival Finance LLC Tranche B 1LN, term loan: | | | |
| 6 month U.S. LIBOR + 3.000% 8.0246% 6/30/25 (b)(c)(d) | | 20,723 | 20,574 |
| 6 month U.S. LIBOR + 3.250% 8.2746% 10/18/28 (b)(c)(d) | | 25,354 | 24,858 |
| Four Seasons Hotels Ltd. Tranche B 1LN, term loan CME Term SOFR 1 Month Index + 3.250% 8.157% 11/30/29 (b)(c)(d) | | 32,021 | 32,084 |
| Hilton Grand Vacations Borrower LLC Tranche B 1LN, term loan 1 month U.S. LIBOR + 3.000% 8.0246% 8/2/28 (b)(c)(d) | | 69,303 | 68,908 |
| Hilton Worldwide Finance LLC Tranche B 1LN, term loan CME Term SOFR 3 Month Index + 1.750% 6.8205% 6/21/26 (b)(c)(d) | | 21,135 | 21,089 |
| Marriott Ownership Resorts, Inc. Tranche B 1LN, term loan 1 month U.S. LIBOR + 1.750% 6.7746% 8/31/25 (b)(c)(d) | | 27,581 | 27,469 |
| Oravel Stays Singapore Pte Ltd. Tranche B 1LN, term loan 3 month U.S. LIBOR + 8.250% 13.27% 6/23/26 (b)(c)(d) | | 7,816 | 6,696 |
| Playa Resorts Holding BV Tranche B 1LN, term loan CME Term SOFR 1 Month Index + 4.250% 9.1395% 1/5/29 (b)(c)(d) | | 13,451 | 13,421 |
| Travelport Finance Luxembourg SARL 1LN, term loan: | | | |
| 3 month U.S. LIBOR + 6.750% 13.3646% 5/30/26 (b)(c)(d) | | 20,589 | 12,736 |
| 3 month U.S. LIBOR + 8.750% 13.7746% 2/28/25 (b)(c)(d) | | 19,583 | 19,772 |
| Wyndham Hotels & Resorts, Inc. Tranche B, term loan 3 month U.S. LIBOR + 1.750% 6.7746% 5/30/25 (b)(c)(d) | | 20,878 | 20,845 |
TOTAL HOTELS | | | 287,307 |
| Insurance - 5.0% | | | |
| Acrisure LLC: | | | |
| Tranche B 1LN, term loan: | | | |
1 month U.S. LIBOR + 3.500% 8.5246% 2/13/27 (b)(c)(d) | | 49,261 | 46,983 |
1 month U.S. LIBOR + 4.250% 9.2746% 2/15/27 (b)(c)(d) | | 14,034 | 13,554 |
CME Term SOFR 1 Month Index + 5.750% 10.4473% 2/15/27 (b)(c)(d) | | 44,279 | 44,030 |
| Tranche B-2 1LN, term loan 1 month U.S. LIBOR + 3.750% 8.5903% 2/15/27 (b)(c)(d) | | 11,820 | 11,288 |
| Alliant Holdings Intermediate LLC: | | | |
| Tranche B3 1LN, term loan 1 month U.S. LIBOR + 3.500% 8.51% 11/12/27 (b)(c)(d) | | 33,570 | 33,249 |
| Tranche B5 1LN, term loan CME Term SOFR 1 Month Index + 3.500% 8.3762% 11/6/27 (b)(c)(d) | | 14,358 | 14,226 |
| AmWINS Group, Inc. Tranche B 1LN, term loan: | | | |
| 1 month U.S. LIBOR + 2.250% 7.2746% 2/19/28 (b)(c)(d) | | 22,628 | 22,366 |
| CME Term SOFR 1 Month Index + 2.750% 7.8322% 2/19/28 (b)(c)(d) | | 7,975 | 7,935 |
| Amynta Agency Borrower, Inc. Tranche B 1LN, term loan CME Term SOFR 1 Month Index + 5.000% 9.9905% 2/28/28 (b)(c)(d) | | 12,595 | 12,196 |
| AssuredPartners, Inc.: | | | |
| 1 LN, term loan CME Term SOFR 1 Month Index + 3.500% 8.4822% 2/13/27 (b)(c)(d) | | 12,217 | 11,993 |
| Tranche B 1LN, term loan: | | | |
1 month U.S. LIBOR + 3.500% 8.5246% 2/13/27 (b)(c)(d) | | 742 | 730 |
1 month U.S. LIBOR + 3.500% 8.5246% 2/13/27 (b)(c)(d) | | 18,022 | 17,692 |
| Asurion LLC: | | | |
| Tranche B11 1LN, term loan CME Term SOFR 1 Month Index + 4.250% 9.3322% 8/19/28 (b)(c)(d) | | 25,071 | 23,266 |
| Tranche B3 2LN, term loan 1 month U.S. LIBOR + 5.250% 10.2746% 1/31/28 (b)(c)(d) | | 53,143 | 44,463 |
| Tranche B4 2LN, term loan 1 month U.S. LIBOR + 5.250% 10.2746% 1/20/29 (b)(c)(d) | | 66,726 | 55,119 |
| Tranche B8 1LN, term loan 1 month U.S. LIBOR + 3.250% 8.2746% 12/23/26 (b)(c)(d) | | 32,070 | 29,895 |
| Tranche B9 1LN, term loan 1 month U.S. LIBOR + 3.250% 8.2746% 7/31/27 (b)(c)(d) | | 32,872 | 30,297 |
| HUB International Ltd.: | | | |
| Tranche B 1LN, term loan: | | | |
1 month U.S. LIBOR + 3.250% 8.51% 4/25/25 (b)(c)(d) | | 43,424 | 43,323 |
CME Term SOFR 1 Month Index + 4.000% 8.7279% 11/10/29 (b)(c)(d) | | 9,731 | 9,705 |
| Tranche B, term loan 3 month U.S. LIBOR + 3.000% 8.0208% 4/25/25 (b)(c)(d) | | 48,579 | 48,453 |
| USI, Inc. 1LN, term loan: | | | |
| 1 month U.S. LIBOR + 3.250% 8.4091% 12/2/26 (b)(c)(d) | | 6,128 | 6,115 |
| CME Term SOFR 1 Month Index + 3.750% 8.6483% 11/22/29 (b)(c)(d) | | 44,004 | 43,876 |
TOTAL INSURANCE | | | 570,754 |
| Leisure - 2.5% | | | |
| Alterra Mountain Co. Tranche B 1LN, term loan 1 month U.S. LIBOR + 3.500% 8.5246% 8/17/28 (b)(c)(d) | | 18,276 | 18,200 |
| Arcis Golf LLC Tranche B 1LN, term loan 1 month U.S. LIBOR + 4.250% 9.2746% 11/24/28 (b)(c)(d) | | 7,361 | 7,315 |
| City Football Group Ltd. Tranche B 1LN, term loan 1 month U.S. LIBOR + 3.000% 8.2727% 7/21/28 (b)(c)(d) | | 45,880 | 44,619 |
| ClubCorp Holdings, Inc. Tranche B 1LN, term loan 3 month U.S. LIBOR + 2.750% 9/18/24 (c)(d)(f) | | 8,425 | 7,947 |
| Crown Finance U.S., Inc.: | | | |
| 1LN, term loan CME Term SOFR 1 Month Index + 10.000% 14.9848% 9/9/23 (b)(c)(d) | | 15,379 | 15,658 |
| Tranche B 1LN, term loan: | | | |
3 month U.S. LIBOR + 2.500% 3.9997% 2/28/25 (b)(c)(d) | | 26,272 | 4,579 |
3 month U.S. LIBOR + 2.750% 4.2497% 9/30/26 (b)(c)(d) | | 1,462 | 255 |
| Delta 2 SARL Tranche B 1LN, term loan CME Term SOFR 1 Month Index + 3.250% 8.2322% 1/15/30 (b)(c)(d) | | 32,770 | 32,795 |
| Equinox Holdings, Inc.: | | | |
| Tranche 2LN, term loan 3 month U.S. LIBOR + 7.000% 12.1591% 9/8/24 (b)(c)(d) | | 7,325 | 5,203 |
| Tranche B-1, term loan 3 month U.S. LIBOR + 3.000% 8.1591% 3/8/24 (b)(c)(d) | | 29,070 | 26,173 |
| Herschend Entertainment Co. LLC Tranche B 1LN, term loan 1 month U.S. LIBOR + 3.750% 8.8125% 8/27/28 (b)(c)(d) | | 6,604 | 6,599 |
| Lids Holdings, Inc. 1LN, term loan CME Term SOFR 3 Month Index + 5.500% 10.3929% 12/14/26 (b)(c)(d)(e) | | 23,595 | 22,062 |
| SeaWorld Parks & Entertainment, Inc. Tranche B 1LN, term loan 1 month U.S. LIBOR + 3.000% 8.0625% 8/25/28 (b)(c)(d) | | 18,092 | 18,001 |
| SP PF Buyer LLC Tranche B 1LN, term loan 1 month U.S. LIBOR + 4.500% 9.5246% 12/21/25 (b)(c)(d) | | 15,720 | 9,763 |
| Topgolf Callaway Brands Corp. Tranche B 1LN, term loan CME Term SOFR 1 Month Index + 3.500% 8.5822% 3/9/30 (b)(c)(d) | | 30,990 | 30,951 |
| United PF Holdings LLC: | | | |
| 1LN, term loan 3 month U.S. LIBOR + 4.000% 9.1591% 12/30/26 (b)(c)(d) | | 34,719 | 27,471 |
| 2LN, term loan 3 month U.S. LIBOR + 8.500% 13.6591% 12/30/27 (b)(c)(d) | | 3,500 | 2,450 |
| Tranche B 1LN, term loan 1 month U.S. LIBOR + 8.500% 13.6591% 12/30/26 (b)(c)(d)(e) | | 3,549 | 2,946 |
TOTAL LEISURE | | | 282,987 |
| Metals/Mining - 0.1% | | | |
| U.S. Silica Co. Tranche B 1LN, term loan CME Term SOFR 1 Month Index + 4.750% 9.6322% 3/23/30 (b)(c)(d) | | 12,600 | 12,399 |
| Paper - 0.8% | | | |
| Ahlstrom-Munksjo OYJ 1LN, term loan 3 month U.S. LIBOR + 3.750% 8.9091% 2/4/28 (b)(c)(d) | | 10,900 | 10,532 |
| Clydesdale Acquisition Holdings, Inc. 1LN, term loan CME Term SOFR 1 Month Index + 4.170% 9.2572% 4/13/29 (b)(c)(d) | | 75,498 | 73,675 |
TOTAL PAPER | | | 84,207 |
| Publishing/Printing - 0.5% | | | |
| Harland Clarke Holdings Corp.: | | | |
| 1LN, term loan CME Term SOFR 1 Month Index + 7.750% 12.8467% 6/16/26 (b)(c)(d) | | 15,246 | 12,591 |
| Tranche B 7LN, term loan 3 month U.S. LIBOR + 4.750% 9.7746% 11/3/23 (b)(c)(d) | | 1,757 | 1,692 |
| Learning Care Group (U.S.) No 2, Inc. Tranche B 1LN, term loan: | | | |
| 1 month U.S. LIBOR + 8.500% 13.4542% 3/13/25 (b)(c)(d) | | 8,830 | 8,728 |
| 3 month U.S. LIBOR + 3.250% 8.0757% 3/13/25 (b)(c)(d) | | 6,150 | 6,083 |
| MJH Healthcare Holdings LLC Tranche B 1LN, term loan CME Term SOFR 1 Month Index + 3.500% 8.5822% 1/28/29 (b)(c)(d) | | 13,210 | 12,930 |
| RLG Holdings LLC: | | | |
| 2LN, term loan 1 month U.S. LIBOR + 7.500% 12.3403% 7/2/29 (b)(c)(d) | | 2,290 | 2,095 |
| Tranche B 1LN, term loan 1 month U.S. LIBOR + 4.000% 9.0246% 7/8/28 (b)(c)(d) | | 9,046 | 8,533 |
TOTAL PUBLISHING/PRINTING | | | 52,652 |
| Railroad - 0.8% | | | |
| AIT Worldwide Logistics Holdings, Inc. 1LN, term loan 3 month U.S. LIBOR + 4.750% 9.6211% 4/6/28 (b)(c)(d) | | 16,600 | 15,881 |
| Echo Global Logistics, Inc. 1LN, term loan 1 month U.S. LIBOR + 3.500% 8.5246% 11/23/28 (b)(c)(d) | | 13,313 | 12,930 |
| Einstein Merger Sub, Inc. 2LN, term loan 3 month U.S. LIBOR + 7.000% 12.0341% 11/23/28 (b)(c)(d)(e) | | 8,145 | 8,104 |
| First Student Bidco, Inc.: | | | |
| Tranche B 1LN, term loan 3 month U.S. LIBOR + 3.000% 8.1431% 7/21/28 (b)(c)(d) | | 1,626 | 1,547 |
| Tranche C 1LN, term loan 3 month U.S. LIBOR + 3.000% 8.1431% 7/21/28 (b)(c)(d) | | 609 | 579 |
| Genesee & Wyoming, Inc. 1LN, term loan 3 month U.S. LIBOR + 2.000% 6.9983% 12/30/26 (b)(c)(d) | | 20,230 | 20,151 |
| Wwex Unified Topco Holdings LLC: | | | |
| 1LN, term loan CME Term SOFR 1 Month Index + 4.250% 9.1599% 7/26/28 (b)(c)(d) | | 26,356 | 24,831 |
| Tranche B 2LN, term loan 1 month U.S. LIBOR + 7.000% 12.1599% 7/22/29 (b)(c)(d) | | 4,920 | 3,982 |
TOTAL RAILROAD | | | 88,005 |
| Restaurants - 0.9% | | | |
| Burger King Worldwide, Inc. Tranche B 1LN, term loan 1 month U.S. LIBOR + 1.750% 6.7746% 11/19/26 (b)(c)(d) | | 5,383 | 5,319 |
| Dave & Buster's, Inc. Tranche B 1LN, term loan CME Term SOFR 1 Month Index + 5.000% 10.125% 6/29/29 (b)(c)(d) | | 12,247 | 12,234 |
| Flynn Restaurant Group LP Tranche B 1LN, term loan 1 month U.S. LIBOR + 4.250% 9.0903% 11/22/28 (b)(c)(d) | | 5,959 | 5,782 |
| KFC Holding Co. Tranche B 1LN, term loan 1 month U.S. LIBOR + 1.750% 6.7094% 3/15/28 (b)(c)(d) | | 13,721 | 13,620 |
| Pacific Bells LLC Tranche B 1LN, term loan CME Term SOFR 3 Month Index + 4.500% 9.6599% 10/20/28 (b)(c)(d) | | 11,336 | 11,081 |
| PFC Acquisition Corp. Tranche B 1LN, term loan 3 month U.S. LIBOR + 6.500% 11.2746% 3/1/26 (b)(c)(d) | | 12,506 | 11,435 |
| Restaurant Technologies, Inc. Tranche B 1LN, term loan CME Term SOFR 3 Month Index + 4.250% 9.1483% 4/1/29 (b)(c)(d) | | 8,065 | 7,941 |
| Whatabrands LLC Tranche B 1LN, term loan 1 month U.S. LIBOR + 3.250% 8.2746% 8/3/28 (b)(c)(d) | | 38,785 | 38,304 |
TOTAL RESTAURANTS | | | 105,716 |
| Services - 10.2% | | | |
| ABG Intermediate Holdings 2 LLC: | | | |
| Tranche B 2LN, term loan CME Term SOFR 1 Month Index + 6.000% 11.0822% 12/20/29 (b)(c)(d) | | 12,280 | 11,298 |
| Tranche B1 LN, term loan CME Term SOFR 1 Month Index + 3.500% 8.5822% 12/21/28 (b)(c)(d) | | 51,900 | 51,096 |
| Tranche B2 1LN, term loan CME Term SOFR 1 Month Index + 4.000% 9.4067% 12/21/28 (b)(c)(d) | | 34,529 | 34,112 |
| Tranche DD 1LN, term loan CME Term SOFR 1 Month Index + 3.750% 12/21/28 (c)(d)(g) | | 11,321 | 11,184 |
| Adtalem Global Education, Inc. Tranche B 1LN, term loan 1 month U.S. LIBOR + 4.000% 9.0246% 8/12/28 (b)(c)(d) | | 3,407 | 3,409 |
| AEA International Holdings Luxembourg SARL Tranche B 1LN, term loan 3 month U.S. LIBOR + 3.750% 8.9375% 9/7/28 (b)(c)(d) | | 5,461 | 5,433 |
| All-Star Bidco AB: | | | |
| Tranche B 1LN, term loan 3 month U.S. LIBOR + 4.000% 8.9534% 11/16/28 (b)(c)(d) | | 6,493 | 6,477 |
| Tranche B1 1LN, term loan 3 month U.S. LIBOR + 3.500% 8.4534% 11/16/28 (b)(c)(d) | | 16,541 | 16,327 |
| Allied Universal Holdco LLC Tranche B 1LN, term loan CME Term SOFR 1 Month Index + 3.750% 8.8322% 5/14/28 (b)(c)(d) | | 41,921 | 40,386 |
| APX Group, Inc. Tranche B 1LN, term loan 1 month U.S. LIBOR + 3.250% 8.2494% 7/9/28 (b)(c)(d) | | 22,966 | 22,932 |
| Aramark Services, Inc.: | | | |
| Tranche B 1LN, term loan 1 month U.S. LIBOR + 2.500% 7.5246% 4/6/28 (b)(c)(d) | | 26,696 | 26,647 |
| Tranche B 3LN, term loan 1 month U.S. LIBOR + 1.750% 6.7746% 3/11/25 (b)(c)(d) | | 629 | 626 |
| Tranche B-4 1LN, term loan 1 month U.S. LIBOR + 1.750% 6.7746% 1/15/27 (b)(c)(d) | | 4,663 | 4,597 |
| Ascend Learning LLC: | | | |
| 2LN, term loan 1 month U.S. LIBOR + 5.750% 10.8322% 12/10/29 (b)(c)(d) | | 17,350 | 15,029 |
| Tranche B 1LN, term loan 1 month U.S. LIBOR + 3.500% 8.5822% 12/10/28 (b)(c)(d) | | 43,373 | 39,557 |
| Asurion LLC 1LN, term loan CME Term SOFR 3 Month Index + 4.000% 9.0822% 8/19/28 (b)(c)(d) | | 35,635 | 33,045 |
| Avis Budget Group, Inc. 1LN, term loan CME Term SOFR 1 Month Index + 3.500% 8.5822% 3/16/29 (b)(c)(d) | | 17,048 | 17,032 |
| Brand Energy & Infrastructure Services, Inc. Tranche B, term loan 3 month U.S. LIBOR + 4.250% 9.2386% 6/21/24 (b)(c)(d) | | 59,354 | 55,756 |
| Cast & Crew Payroll LLC Tranche B 1LN, term loan: | | | |
| 1 month U.S. LIBOR + 3.500% 8.5246% 2/7/26 (b)(c)(d) | | 30,347 | 30,284 |
| CME Term SOFR 1 Month Index + 3.750% 8.557% 12/30/28 (b)(c)(d) | | 15,993 | 15,950 |
| CHG Healthcare Services, Inc. 1LN, term loan 1 month U.S. LIBOR + 3.250% 8.2746% 9/30/28 (b)(c)(d) | | 5,642 | 5,604 |
| Citadel Securities LP Tranche B 1LN, term loan CME Term SOFR 1 Month Index + 3.000% 7.9215% 2/2/28 (b)(c)(d) | | 6,791 | 6,764 |
| Congruex Group LLC Tranche B 1LN, term loan CME Term SOFR 3 Month Index + 5.750% 10.576% 5/3/29 (b)(c)(d)(e) | | 18,153 | 17,563 |
| CoreLogic, Inc. Tranche B 1LN, term loan 1 month U.S. LIBOR + 3.500% 8.5625% 6/2/28 (b)(c)(d) | | 45,759 | 40,946 |
| EAB Global, Inc. Tranche B 1LN, term loan 3 month U.S. LIBOR + 3.500% 8.8707% 8/16/28 (b)(c)(d) | | 13,840 | 13,506 |
| Element Materials Technology Group: | | | |
| Tranche B 1LN, term loan CME Term SOFR 3 Month Index + 4.250% 9.2483% 6/24/29 (b)(c)(d) | | 7,668 | 7,560 |
| Tranche DD 1LN, term loan CME Term SOFR 3 Month Index + 4.250% 9.2483% 6/24/29 (b)(c)(d) | | 3,539 | 3,489 |
| EmployBridge LLC Tranche B 1LN, term loan 3 month U.S. LIBOR + 4.750% 9.9264% 7/19/28 (b)(c)(d) | | 30,202 | 25,383 |
| Ensemble RCM LLC 1LN, term loan 3 month U.S. LIBOR + 3.750% 8.8954% 8/1/26 (b)(c)(d) | | 11,727 | 11,710 |
| Filtration Group Corp.: | | | |
| Tranche B 1LN, term loan 1 month U.S. LIBOR + 3.500% 8.5246% 10/21/28 (b)(c)(d) | | 13,413 | 13,265 |
| Tranche B, term loan 3 month U.S. LIBOR + 3.000% 8.0246% 3/29/25 (b)(c)(d) | | 9,397 | 9,380 |
| Finastra U.S.A., Inc.: | | | |
| Tranche 2LN, term loan 3 month U.S. LIBOR + 7.250% 12.405% 6/13/25 (b)(c)(d) | | 13,700 | 11,501 |
| Tranche B 1LN, term loan 3 month U.S. LIBOR + 3.500% 8.655% 6/13/24 (b)(c)(d) | | 44,721 | 42,563 |
| Flexera Software LLC Tranche B 1LN, term loan 1 month U.S. LIBOR + 3.750% 8.5903% 3/3/28 (b)(c)(d) | | 18,613 | 18,372 |
| Franchise Group, Inc. Tranche B 1LN, term loan: | | | |
| CME Term SOFR 3 Month Index + 4.750% 9.6971% 3/10/26 (b)(c)(d) | | 9,130 | 8,902 |
| CME Term SOFR 3 Month Index + 4.750% 9.9703% 3/10/26 (b)(c)(d) | | 29,402 | 28,667 |
| Galaxy U.S. Opco, Inc. 1LN, term loan CME Term SOFR 1 Month Index + 4.750% 9.7322% 4/29/29 (b)(c)(d) | | 14,333 | 12,756 |
| Gateway Merger Sub 2021, Inc. Tranche B 1LN, term loan 1 month U.S. LIBOR + 5.250% 10.2746% 6/30/28 (b)(c)(d) | | 7,097 | 6,884 |
| GEMS MENASA Cayman Ltd. Tranche B 1LN, term loan 6 month U.S. LIBOR + 5.000% 9.9534% 7/30/26 (b)(c)(d) | | 15,932 | 15,932 |
| Greeneden U.S. Holdings II LLC Tranche B 1LN, term loan 1 month U.S. LIBOR + 4.000% 9.0246% 12/1/27 (b)(c)(d) | | 10,050 | 9,943 |
| Indy U.S. Bidco LLC Tranche B 1LN, term loan 1 month U.S. LIBOR + 3.750% 8.7746% 3/5/28 (b)(c)(d) | | 8,507 | 7,151 |
| Ion Trading Finance Ltd. Tranche B 1LN, term loan 3 month U.S. LIBOR + 4.750% 9.9091% 3/26/28 (b)(c)(d) | | 33,125 | 31,918 |
| KNS Acquisitions, Inc. Tranche B 1LN, term loan 6 month U.S. LIBOR + 6.250% 11.3467% 4/21/27 (b)(c)(d) | | 11,671 | 10,205 |
| KUEHG Corp. Tranche B, term loan 1 month U.S. LIBOR + 3.750% 8.9091% 2/21/25 (b)(c)(d) | | 23,471 | 23,274 |
| Maverick Purchaser Sub LLC: | | | |
| Tranche B 1LN, term loan: | | | |
1 month U.S. LIBOR + 4.000% 9.0246% 1/23/27 (b)(c)(d) | | 19,042 | 18,375 |
CME Term SOFR 1 Month Index + 4.000% 8.9063% 2/15/29 (b)(c)(d) | | 27,795 | 26,614 |
| Tranche B 2LN, term loan 1 month U.S. LIBOR + 8.750% 13.7746% 1/31/28 (b)(c)(d) | | 10,815 | 9,652 |
| Neptune BidCo U.S., Inc. Tranche B 1LN, term loan CME Term SOFR 1 Month Index + 5.000% 10.0044% 4/11/29 (b)(c)(d) | | 66,260 | 59,038 |
| Optiv Security, Inc. Tranche B 1LN, term loan CME Term SOFR 1 Month Index + 5.250% 8/14/26 (c)(d)(f) | | 10,145 | 9,815 |
| Pilot Travel Centers LLC Tranche B 1LN, term loan CME Term SOFR 1 Month Index + 2.000% 7.0822% 8/4/28 (b)(c)(d) | | 37,940 | 37,819 |
| PowerTeam Services LLC: | | | |
| 1LN, term loan 3 month U.S. LIBOR + 3.250% 8.4091% 3/5/25 (b)(c)(d) | | 1,466 | 1,238 |
| Tranche B 1LN, term loan 3 month U.S. LIBOR + 3.500% 8.6591% 3/6/25 (b)(c)(d) | | 13,262 | 11,405 |
| Sabert Corp. Tranche B 1LN, term loan 1 month U.S. LIBOR + 4.500% 9.5625% 12/10/26 (b)(c)(d) | | 12,104 | 12,073 |
| Sedgwick Claims Management Services, Inc. Tranche B 1LN, term loan CME Term SOFR 1 Month Index + 3.750% 8.7322% 2/24/28 (b)(c)(d) | | 7,650 | 7,555 |
| Sitel Worldwide Corp. Tranche B 1LN, term loan 1 month U.S. LIBOR + 3.750% 8.6% 8/27/28 (b)(c)(d) | | 12,874 | 12,815 |
| Spin Holdco, Inc. Tranche B 1LN, term loan 3 month U.S. LIBOR + 4.000% 8.9857% 3/4/28 (b)(c)(d) | | 75,948 | 62,301 |
| SuperMoose Borrower LLC Tranche B 1LN, term loan 3 month U.S. LIBOR + 3.750% 8.9091% 8/29/25 (b)(c)(d) | | 7,950 | 7,093 |
| The GEO Group, Inc. Tranche 1B 1LN, term loan CME Term SOFR 1 Month Index + 7.120% 12.1072% 3/23/27 (b)(c)(d) | | 5,580 | 5,660 |
| Uber Technologies, Inc. Tranche B 1LN, term loan CME Term SOFR 1 Month Index + 3.000% 7.7202% 3/3/30 (b)(c)(d) | | 32,332 | 32,210 |
| Vaco Holdings LLC 1LN, term loan CME Term SOFR 1 Month Index + 5.000% 10.0483% 1/21/29 (b)(c)(d) | | 12,625 | 12,549 |
| WMB Holdings, Inc. Tranche B 1LN, term loan CME Term SOFR 1 Month Index + 3.250% 8.3322% 11/3/29 (b)(c)(d) | | 11,155 | 11,138 |
TOTAL SERVICES | | | 1,161,765 |
| Specialty Retailing - 0.1% | | | |
| New SK Holdco Sub LLC 1LN, term loan CME Term SOFR 1 Month Index + 8.350% 13.296% 6/30/27 (b)(c)(d) | | 17,484 | 14,774 |
| Steel - 0.2% | | | |
| JMC Steel Group, Inc. 1LN, term loan 1 month U.S. LIBOR + 2.000% 7.0177% 1/24/27 (b)(c)(d) | | 12,595 | 12,445 |
| Tiger Acquisition LLC Tranche B 1LN, term loan 1 month U.S. LIBOR + 3.250% 8.3322% 6/1/28 (b)(c)(d) | | 8,360 | 8,104 |
TOTAL STEEL | | | 20,549 |
| Super Retail - 4.2% | | | |
| Academy Ltd. Tranche B 1LN, term loan 1 month U.S. LIBOR + 3.750% 8.5976% 11/6/27 (b)(c)(d) | | 13,083 | 13,070 |
| At Home Group, Inc. Tranche B 1LN, term loan 3 month U.S. LIBOR + 4.250% 9.4266% 7/24/28 (b)(c)(d) | | 18,295 | 13,556 |
| Bass Pro Group LLC Tranche B 1LN, term loan 1 month U.S. LIBOR + 3.750% 8.7746% 3/5/28 (b)(c)(d) | | 327,616 | 324,547 |
| BJ's Wholesale Club, Inc. Tranche B 1LN, term loan CME Term SOFR 1 Month Index + 2.750% 7.5781% 2/3/27 (b)(c)(d) | | 11,475 | 11,494 |
| Empire Today LLC Tranche B 1LN, term loan 1 month U.S. LIBOR + 5.000% 9.9477% 4/1/28 (b)(c)(d) | | 15,358 | 12,010 |
| Hanesbrands, Inc. Tranche B 1LN, term loan CME Term SOFR 1 Month Index + 3.750% 8.557% 3/8/30 (b)(c)(d) | | 8,935 | 8,885 |
| Harbor Freight Tools U.S.A., Inc. Tranche B 1LN, term loan 1 month U.S. LIBOR + 2.750% 7.7746% 10/19/27 (b)(c)(d) | | 9,404 | 9,113 |
| LBM Acquisition LLC Tranche B 1LN, term loan 1 month U.S. LIBOR + 3.750% 8.7746% 12/18/27 (b)(c)(d) | | 9,494 | 8,798 |
| Michaels Companies, Inc. 1LN, term loan 3 month U.S. LIBOR + 4.250% 9.4091% 4/15/28 (b)(c)(d) | | 30,975 | 28,318 |
| Red Ventures LLC Tranche B 1LN, term loan CME Term SOFR 1 Month Index + 3.000% 7.9822% 3/3/30 (b)(c)(d) | | 15,232 | 15,035 |
| RH: | | | |
| Tranche B 1LN, term loan 1 month U.S. LIBOR + 2.500% 7.3403% 10/20/28 (b)(c)(d) | | 26,565 | 24,545 |
| Tranche B2 1LN, term loan CME Term SOFR 1 Month Index + 3.250% 8.157% 10/20/28 (b)(c)(d) | | 9,333 | 8,663 |
TOTAL SUPER RETAIL | | | 478,034 |
| Technology - 15.8% | | | |
| A&V Holdings Midco LLC Tranche B 1LN, term loan 3 month U.S. LIBOR + 5.370% 10.5341% 3/10/27 (b)(c)(d) | | 15,755 | 15,420 |
| Acuris Finance U.S., Inc. 1LN, term loan CME Term SOFR 3 Month Index + 4.000% 9.0483% 2/16/28 (b)(c)(d) | | 7,455 | 7,202 |
| Alliance Laundry Systems LLC Tranche B 1LN, term loan 3 month U.S. LIBOR + 3.500% 8.5587% 10/8/27 (b)(c)(d) | | 10,968 | 10,891 |
| Anastasia Parent LLC Tranche B, term loan 3 month U.S. LIBOR + 3.750% 8.9091% 8/10/25 (b)(c)(d) | | 37,409 | 29,156 |
| Applied Systems, Inc. Tranche B 1LN, term loan CME Term SOFR 1 Month Index + 4.500% 9.3983% 9/19/26 (b)(c)(d) | | 18,875 | 18,893 |
| Aptean, Inc. 1LN, term loan 3 month U.S. LIBOR + 4.250% 9.157% 4/23/26 (b)(c)(d) | | 15,127 | 14,528 |
| Arches Buyer, Inc. Tranche B 1LN, term loan 1 month U.S. LIBOR + 3.250% 8.3322% 12/4/27 (b)(c)(d) | | 7,455 | 6,896 |
| Athenahealth Group, Inc.: | | | |
| Tranche B 1LN, term loan CME Term SOFR 1 Month Index + 3.500% 8.4643% 2/15/29 (b)(c)(d) | | 72,838 | 68,155 |
| Tranche DD 1LN, term loan CME Term SOFR 1 Month Index + 3.500% 2/15/29 (c)(d)(g) | | 8,948 | 8,373 |
| AZZ, Inc. Tranche B 1LN, term loan CME Term SOFR 1 Month Index + 4.250% 9.3322% 5/13/29 (b)(c)(d) | | 18,275 | 18,239 |
| Byju's Alpha, Inc. Tranche B 1LN, term loan 3 month U.S. LIBOR + 8.000% 12.9281% 11/24/26 (b)(c)(d) | | 20,791 | 16,870 |
| Camelot Finance SA: | | | |
| Tranche B 1LN, term loan 1 month U.S. LIBOR + 3.000% 8.0246% 10/31/26 (b)(c)(d) | | 24,078 | 24,033 |
| Tranche B, term loan 1 month U.S. LIBOR + 3.000% 8.0246% 10/31/26 (b)(c)(d) | | 26,743 | 26,704 |
| Central Parent, Inc. 1LN, term loan CME Term SOFR 3 Month Index + 4.250% 9.1483% 7/6/29 (b)(c)(d) | | 59,745 | 59,654 |
| Ceridian HCM Holding, Inc. Tranche B, term loan 1 month U.S. LIBOR + 2.500% 7.5246% 4/30/25 (b)(c)(d) | | 25,813 | 25,742 |
| Coherent Corp. Tranche B 1LN, term loan 1 month U.S. LIBOR + 2.750% 7.8467% 7/1/29 (b)(c)(d) | | 43,102 | 42,860 |
| CommScope, Inc. Tranche B 1LN, term loan 1 month U.S. LIBOR + 3.250% 8.2746% 4/4/26 (b)(c)(d) | | 41,971 | 38,802 |
| ConnectWise LLC Tranche B 1LN, term loan 3 month U.S. LIBOR + 3.500% 8.3403% 9/30/28 (b)(c)(d) | | 25,576 | 24,793 |
| Constant Contact, Inc. Tranche B 1LN, term loan 1 month U.S. LIBOR + 4.000% 9.1979% 2/10/28 (b)(c)(d) | | 9,862 | 9,270 |
| DCert Buyer, Inc.: | | | |
| 1LN, term loan CME Term SOFR 1 Month Index + 4.000% 8.6956% 10/16/26 (b)(c)(d) | | 43,746 | 43,282 |
| Tranche B 2LN, term loan 1 month U.S. LIBOR + 7.000% 11.6956% 2/19/29 (b)(c)(d) | | 14,248 | 13,112 |
| DG Investment Intermediate Holdings, Inc.: | | | |
| 2LN, term loan 1 month U.S. LIBOR + 6.750% 11.7746% 3/31/29 (b)(c)(d) | | 2,490 | 2,198 |
| Tranche B 1LN, term loan: | | | |
1 month U.S. LIBOR + 3.750% 8.7746% 3/31/28 (b)(c)(d) | | 10,769 | 10,501 |
CME Term SOFR 1 Month Index + 4.750% 9.7322% 3/31/28 (b)(c)(d) | | 3,169 | 3,098 |
| ECL Entertainment LLC 1LN, term loan 1 month U.S. LIBOR + 7.500% 12.5967% 4/30/28 (b)(c)(d) | | 4,913 | 4,866 |
| Entegris, Inc. Tranche B 1LN, term loan CME Term SOFR 1 Month Index + 2.750% 7.6609% 3/10/30 (b)(c)(d) | | 58,493 | 58,411 |
| Eos U.S. Finco LLC 1LN, term loan CME Term SOFR 3 Month Index + 6.000% 10.9086% 10/6/29 (b)(c)(d) | | 11,662 | 11,555 |
| Epicor Software Corp. Tranche B 1LN, term loan 1 month U.S. LIBOR + 3.250% 8.0903% 7/31/27 (b)(c)(d) | | 21,003 | 20,723 |
| Gen Digital, Inc. Tranche B 1LN, term loan CME Term SOFR 1 Month Index + 2.000% 7.0822% 9/12/29 (b)(c)(d) | | 63,852 | 63,123 |
| Go Daddy Operating Co. LLC Tranche B 1LN, term loan 1 month U.S. LIBOR + 2.000% 6.8403% 8/10/27 (b)(c)(d) | | 977 | 975 |
| GoDaddy, Inc. Tranche B 1LN, term loan CME Term SOFR 1 Month Index + 3.250% 8.057% 10/21/29 (b)(c)(d) | | 16,900 | 16,900 |
| Hunter U.S. Bidco, Inc. Tranche B 1LN, term loan 3 month U.S. LIBOR + 4.250% 9.4091% 8/19/28 (b)(c)(d) | | 10,414 | 10,349 |
| Icon Luxembourg Sarl Tranche B 1LN, term loan CME Term SOFR 3 Month Index + 2.250% 7.4099% 7/3/28 (b)(c)(d) | | 59,778 | 59,737 |
| Imprivata, Inc. Tranche B 1LN, term loan: | | | |
| 1 month U.S. LIBOR + 3.750% 8.5903% 12/1/27 (b)(c)(d) | | 9,800 | 9,475 |
| CME Term SOFR 1 Month Index + 4.250% 9.057% 12/1/27 (b)(c)(d) | | 993 | 971 |
| Maxar Technologies, Inc. Tranche B 1LN, term loan CME Term SOFR 1 Month Index + 4.250% 9.3322% 6/9/29 (b)(c)(d) | | 5,240 | 5,231 |
| McAfee Corp. Tranche B 1LN, term loan CME Term SOFR 1 Month Index + 3.750% 8.6534% 3/1/29 (b)(c)(d) | | 39,181 | 36,886 |
| MH Sub I LLC: | | | |
| 1LN, term loan: | | | |
1 month U.S. LIBOR + 3.750% 8.7746% 9/15/24 (b)(c)(d) | | 37,107 | 36,875 |
CME Term SOFR 1 Month Index + 4.250% 4/13/28 (c)(d)(f) | | 14,940 | 14,324 |
| Tranche B 2LN, term loan CME Term SOFR 1 Month Index + 6.250% 11.057% 2/23/29 (b)(c)(d) | | 14,080 | 13,018 |
| Tranche B, term loan 3 month U.S. LIBOR + 3.750% 8.7746% 9/15/24 (b)(c)(d) | | 34,657 | 34,476 |
| MKS Instruments, Inc. Tranche B 1LN, term loan CME Term SOFR 1 Month Index + 2.750% 7.8143% 8/17/29 (b)(c)(d) | | 28,491 | 28,333 |
| Motus Group LLC Tranche B 1LN, term loan 1 month U.S. LIBOR + 3.750% 8.7746% 12/10/28 (b)(c)(d) | | 5 | 5 |
| NAVEX TopCo, Inc.: | | | |
| 2LN, term loan 1 month U.S. LIBOR + 7.000% 12.0822% 9/4/26 (b)(c)(d) | | 2,225 | 2,179 |
| Tranche B 1LN, term loan 1 month U.S. LIBOR + 3.250% 8.3322% 9/5/25 (b)(c)(d) | | 9,217 | 9,198 |
| Open Text Corp. Tranche B 1LN, term loan CME Term SOFR 1 Month Index + 3.500% 8.5822% 8/25/29 (b)(c)(d) | | 44,434 | 44,385 |
| Osmosis Debt Merger Sub, Inc. Tranche B 1LN, term loan CME Term SOFR 1 Month Index + 4.000% 8.5839% 7/30/28 (b)(c)(d) | | 20,254 | 19,700 |
| Park Place Technologies LLC 1LN, term loan CME Term SOFR 1 Month Index + 5.000% 10.0822% 11/10/27 (b)(c)(d) | | 23,715 | 22,734 |
| Peraton Corp. Tranche B 1LN, term loan 1 month U.S. LIBOR + 3.750% 8.8322% 2/1/28 (b)(c)(d) | | 92,919 | 90,906 |
| Polaris Newco LLC Tranche B 1LN, term loan 3 month U.S. LIBOR + 4.000% 9.1591% 6/2/28 (b)(c)(d) | | 64,914 | 60,073 |
| Project Boost Purchaser LLC 1LN, term loan 1 month U.S. LIBOR + 3.500% 8.5246% 5/30/26 (b)(c)(d) | | 12,144 | 12,044 |
| Proofpoint, Inc. Tranche B 1LN, term loan 3 month U.S. LIBOR + 3.250% 8.2746% 8/31/28 (b)(c)(d) | | 45,101 | 44,068 |
| Rackspace Technology Global, Inc. Tranche B 1LN, term loan 3 month U.S. LIBOR + 2.750% 7.595% 2/15/28 (b)(c)(d) | | 33,135 | 13,536 |
| RealPage, Inc. Tranche B 1LN, term loan 1 month U.S. LIBOR + 3.000% 8.0246% 4/22/28 (b)(c)(d) | | 31,683 | 30,736 |
| Red Planet Borrower LLC Tranche B 1LN, term loan 1 month U.S. LIBOR + 3.750% 8.5903% 9/30/28 (b)(c)(d) | | 13,954 | 9,349 |
| Renaissance Holdings Corp.: | | | |
| 1LN, term loan CME Term SOFR 1 Month Index + 4.750% 9.5796% 3/16/30 (b)(c)(d) | | 36,815 | 36,106 |
| Tranche B 2LN, term loan 1 month U.S. LIBOR + 7.000% 11.8403% 5/31/26 (b)(c)(d) | | 7,642 | 7,450 |
| Roper Industrial Products Investment Tranche B 1LN, term loan CME Term SOFR 1 Month Index + 4.500% 9.3983% 11/22/29 (b)(c)(d) | | 9,020 | 8,957 |
| Sophia LP: | | | |
| 1LN, term loan CME Term SOFR 1 Month Index + 4.250% 9.2322% 10/7/27 (b)(c)(d) | | 14,664 | 14,499 |
| Tranche B 1LN, term loan 3 month U.S. LIBOR + 3.500% 8.6591% 10/7/27 (b)(c)(d) | | 13,976 | 13,778 |
| Sovos Compliance LLC Tranche B 1LN, term loan 1 month U.S. LIBOR + 4.500% 9.5246% 8/11/28 (b)(c)(d) | | 11,859 | 11,468 |
| SS&C Technologies, Inc.: | | | |
| Tranche B 3LN, term loan 1 month U.S. LIBOR + 1.750% 6.7746% 4/16/25 (b)(c)(d) | | 10,397 | 10,372 |
| Tranche B 4LN, term loan 1 month U.S. LIBOR + 1.750% 6.7746% 4/16/25 (b)(c)(d) | | 9,220 | 9,198 |
| Tranche B 5LN, term loan 1 month U.S. LIBOR + 1.750% 6.7746% 4/16/25 (b)(c)(d) | | 31,609 | 31,534 |
| Tranche B6 1LN, term loan CME Term SOFR 1 Month Index + 2.250% 7.3322% 3/22/29 (b)(c)(d) | | 6,560 | 6,526 |
| Tranche B7 1LN, term loan CME Term SOFR 1 Month Index + 2.250% 7.3322% 3/22/29 (b)(c)(d) | | 9,886 | 9,835 |
| Tempo Acquisition LLC 1LN, term loan U.S. Secured Overnight Fin. Rate (SOFR) Index + 3.000% 7.9822% 8/31/28 (b)(c)(d) | | 43,987 | 43,914 |
| TTM Technologies, Inc. Tranche B, term loan 3 month U.S. LIBOR + 2.500% 7.3476% 9/28/24 (b)(c)(d) | | 9,693 | 9,681 |
| UKG, Inc. 1LN, term loan 1 month U.S. LIBOR + 3.750% 8.8954% 5/4/26 (b)(c)(d) | | 23,763 | 23,342 |
| Ultimate Software Group, Inc.: | | | |
| 1LN, term loan 1 month U.S. LIBOR + 3.250% 8.2706% 5/3/26 (b)(c)(d) | | 60,102 | 58,449 |
| 2LN, term loan 3 month U.S. LIBOR + 5.250% 10.2706% 5/3/27 (b)(c)(d) | | 28,250 | 27,097 |
| Ust Global, Inc. Tranche B 1LN, term loan CME Term SOFR 1 Month Index + 3.750% 8.6715% 11/19/28 (b)(c)(d) | | 10,428 | 10,315 |
| Veritas U.S., Inc. Tranche B 1LN, term loan 3 month U.S. LIBOR + 5.000% 9.8403% 9/1/25 (b)(c)(d) | | 19,869 | 15,228 |
| Verscend Holding Corp. Tranche B 1LN, term loan 1 month U.S. LIBOR + 4.000% 9.0246% 8/27/25 (b)(c)(d) | | 15,722 | 15,692 |
| VFH Parent LLC Tranche B 1LN, term loan CME Term SOFR 1 Month Index + 3.000% 8.0643% 1/13/29 (b)(c)(d) | | 19,018 | 18,560 |
| Virgin Pulse, Inc.: | | | |
| 2LN, term loan 1 month U.S. LIBOR + 7.250% 12.2746% 4/6/29 (b)(c)(d) | | 745 | 552 |
| Tranche B 1LN, term loan 1 month U.S. LIBOR + 4.000% 9.0246% 4/6/28 (b)(c)(d) | | 14,055 | 11,610 |
| VM Consolidated, Inc. Tranche B 1LN, term loan 6 month U.S. LIBOR + 3.250% 8.3467% 3/27/28 (b)(c)(d) | | 21,430 | 21,398 |
| VS Buyer LLC Tranche B 1LN, term loan 1 month U.S. LIBOR + 2.000% 7.9034% 2/28/27 (b)(c)(d) | | 16,369 | 16,110 |
| Weber-Stephen Products LLC Tranche B 1LN, term loan: | | | |
| 1 month U.S. LIBOR + 3.250% 8.3322% 10/30/27 (b)(c)(d) | | 8,359 | 7,431 |
| CME Term SOFR 1 Month Index + 4.250% 9.3322% 10/30/27 (b)(c)(d) | | 5,737 | 5,120 |
| Zelis Payments Buyer, Inc. Tranche B 1LN, term loan 1 month U.S. LIBOR + 3.500% 8.5246% 9/30/26 (b)(c)(d) | | 26,208 | 26,058 |
TOTAL TECHNOLOGY | | | 1,794,093 |
| Telecommunications - 4.8% | | | |
| Altice Financing SA Tranche B 1LN, term loan CME Term SOFR 1 Month Index + 5.000% 9.9863% 10/31/27 (b)(c)(d) | | 11,803 | 11,560 |
| Altice France SA Tranche B14 1LN, term loan CME Term SOFR 1 Month Index + 5.500% 10.4863% 8/15/28 (b)(c)(d) | | 60,481 | 56,776 |
| Aventiv Technologies LLC Tranche B, term loan: | | | |
| 3 month U.S. LIBOR + 4.500% 9.6591% 11/1/24 (b)(c)(d) | | 35,901 | 25,473 |
| 3 month U.S. LIBOR + 8.250% 13.2746% 11/1/25 (b)(c)(d) | | 30,400 | 16,449 |
| Cablevision Lightpath LLC Tranche B 1LN, term loan 1 month U.S. LIBOR + 3.250% 8.1977% 11/30/27 (b)(c)(d) | | 5,265 | 5,162 |
| Ciena Corp. Tranche B 1LN, term loan CME Term SOFR 1 Month Index + 2.500% 7.4436% 1/12/30 (b)(c)(d) | | 6,425 | 6,417 |
| Connect U.S. Finco LLC Tranche B 1LN, term loan 1 month U.S. LIBOR + 3.500% 8.53% 12/12/26 (b)(c)(d) | | 10,380 | 10,315 |
| Consolidated Communications, Inc. Tranche B 1LN, term loan CME Term SOFR 1 Month Index + 3.500% 8.5967% 10/2/27 (b)(c)(d) | | 16,633 | 14,132 |
| Crown Subsea Communications Holding, Inc.: | | | |
| 1LN, term loan CME Term SOFR 1 Month Index + 5.250% 10.1679% 4/27/27 (b)(c)(d) | | 18,000 | 17,944 |
| Tranche B 1LN, term loan CME Term SOFR 1 Month Index + 4.750% 9.6679% 4/27/27 (b)(c)(d) | | 5,998 | 5,938 |
| Frontier Communications Holdings LLC Tranche B 1LN, term loan 3 month U.S. LIBOR + 3.750% 8.8125% 5/1/28 (b)(c)(d) | | 47,421 | 45,192 |
| GTT Communications, Inc. 1LN, term loan CME Term SOFR 3 Month Index + 9.000% 13.9983% 6/30/28 (b)(c)(d) | | 4,644 | 2,415 |
| Gtt Remainco LLC 1LN, term loan CME Term SOFR 1 Month Index + 7.000% 12.0822% 12/30/27 (b)(c)(d) | | 5,824 | 4,776 |
| Intelsat Jackson Holdings SA 1LN, term loan CME TERM SOFR 6 MONTH INDEX + 4.250% 9.0817% 2/1/29 (b)(c)(d) | | 121,778 | 120,084 |
| Level 3 Financing, Inc. Tranche B 1LN, term loan 1 month U.S. LIBOR + 1.750% 6.8467% 3/1/27 (b)(c)(d) | | 9,250 | 7,881 |
| Northwest Fiber LLC Tranche B 1LN, term loan 1 month U.S. LIBOR + 3.750% 8.8104% 4/30/27 (b)(c)(d) | | 31,869 | 30,788 |
| Patagonia Holdco LLC Tranche B 1LN, term loan CME Term SOFR 3 Month Index + 5.750% 10.4734% 8/1/29 (b)(c)(d) | | 22,671 | 18,382 |
| Radiate Holdco LLC Tranche B 1LN, term loan 1 month U.S. LIBOR + 3.250% 8.0903% 9/25/26 (b)(c)(d) | | 48,868 | 40,286 |
| SBA Senior Finance II, LLC Tranche B, term loan 1 month U.S. LIBOR + 1.750% 6.78% 4/11/25 (b)(c)(d) | | 17,246 | 17,221 |
| Windstream Services LLC Tranche B 1LN, term loan CME Term SOFR 1 Month Index + 6.250% 11.3322% 9/21/27 (b)(c)(d) | | 25,825 | 23,262 |
| Zayo Group Holdings, Inc. 1LN, term loan: | | | |
| 1 month U.S. LIBOR + 3.000% 8.0246% 3/9/27 (b)(c)(d) | | 58,966 | 47,776 |
| CME Term SOFR 1 Month Index + 4.250% 9.2322% 3/9/27 (b)(c)(d) | | 21,582 | 17,793 |
TOTAL TELECOMMUNICATIONS | | | 546,022 |
| Textiles/Apparel - 0.9% | | | |
| Canada Goose, Inc. Tranche B 1LN, term loan 3 month U.S. LIBOR + 3.500% 8.6591% 10/7/27 (b)(c)(d) | | 1,862 | 1,810 |
| Crocs, Inc. Tranche B1 LN, term loan CME Term SOFR 1 Month Index + 3.500% 8.5822% 2/17/29 (b)(c)(d) | | 51,601 | 51,519 |
| Fanatics Commerce Intermediate Holdco LLC Tranche B 1LN, term loan 3 month U.S. LIBOR + 3.250% 8.3125% 11/23/28 (b)(c)(d) | | 18,205 | 18,129 |
| Jo-Ann Stores LLC Tranche B 1LN, term loan 3 month U.S. LIBOR + 4.750% 10.0181% 7/7/28 (b)(c)(d) | | 14,707 | 7,925 |
| Tory Burch LLC Tranche B 1LN, term loan 1 month U.S. LIBOR + 3.500% 8.5246% 4/16/28 (b)(c)(d) | | 18,020 | 16,650 |
| Victoria's Secret & Co. Tranche B 1LN, term loan 3 month U.S. LIBOR + 3.250% 8.2357% 8/2/28 (b)(c)(d) | | 8,990 | 8,855 |
TOTAL TEXTILES/APPAREL | | | 104,888 |
| Transportation Ex Air/Rail - 0.0% | | | |
| ASP LS Acquisition Corp. 2LN, term loan 6 month U.S. LIBOR + 7.500% 12.6591% 5/7/29 (b)(c)(d)(e) | | 2,965 | 1,868 |
| Utilities - 1.8% | | | |
| Brookfield WEC Holdings, Inc.: | | | |
| 1LN, term loan CME Term SOFR 1 Month Index + 3.750% 8.557% 8/1/25 (b)(c)(d) | | 12,199 | 12,176 |
| Tranche B 1LN, term loan 1 month U.S. LIBOR + 2.750% 7.7746% 8/1/25 (b)(c)(d) | | 57,644 | 57,428 |
| ExGen Renewables IV, LLC Tranche B 1LN, term loan 3 month U.S. LIBOR + 2.500% 7.46% 12/15/27 (b)(c)(d) | | 3,690 | 3,670 |
| Limetree Bay Terminals LLC Tranche B 1LN, term loan 3 month U.S. LIBOR + 4.000% 10.1599% 2/15/24 (b)(c)(d) | | 16,650 | 13,695 |
| Luxembourg Investment Co. 428 SARL Tranche B 1LN, term loan CME Term SOFR 3 Month Index + 5.000% 10.0483% 1/3/29 (b)(c)(d) | | 13,056 | 10,371 |
| Osmose Utilities Services, Inc. Tranche B 1LN, term loan 1 month U.S. LIBOR + 3.250% 8.2746% 6/23/28 (b)(c)(d) | | 14,356 | 13,876 |
| PG&E Corp. Tranche B 1LN, term loan 1 month U.S. LIBOR + 3.000% 8.0625% 6/23/25 (b)(c)(d) | | 15,192 | 15,143 |
| Pike Corp. Tranche B 1LN, term loan: | | | |
| 1 month U.S. LIBOR + 3.000% 8.0967% 1/21/28 (b)(c)(d) | | 15,389 | 15,309 |
| CME Term SOFR 1 Month Index + 3.500% 8.4822% 1/21/28 (b)(c)(d) | | 4,478 | 4,472 |
| Vertiv Group Corp. Tranche B 1LN, term loan 1 month U.S. LIBOR + 2.750% 7.5976% 3/2/27 (b)(c)(d) | | 36,460 | 36,044 |
| Vistra Operations Co. LLC Tranche B 3LN, term loan 1 month U.S. LIBOR + 1.750% 6.7592% 12/31/25 (b)(c)(d) | | 24,521 | 24,402 |
TOTAL UTILITIES | | | 206,586 |
| TOTAL BANK LOAN OBLIGATIONS (Cost $10,557,693) | | | 10,079,027 |
| | | | |
| Nonconvertible Bonds - 4.8% |
| | | Principal Amount (a) (000s) | Value ($) (000s) |
| Aerospace - 0.2% | | | |
| TransDigm, Inc. 6.25% 3/15/26 (h) | | 22,000 | 22,104 |
| Air Transportation - 0.1% | | | |
| American Airlines, Inc. / AAdvantage Loyalty IP Ltd. 5.5% 4/20/26 (h) | | 4,290 | 4,213 |
| Delta Air Lines, Inc. / SkyMiles IP Ltd. 4.5% 10/20/25 (h) | | 2,392 | 2,345 |
TOTAL AIR TRANSPORTATION | | | 6,558 |
| Automotive & Auto Parts - 0.8% | | | |
| Clarios Global LP / Clarios U.S. Finance Co. 6.75% 5/15/28 (h)(i) | | 7,810 | 7,840 |
| Ford Motor Credit Co. LLC U.S. Secured Overnight Fin. Rate (SOFR) Index + 2.950% 7.7305% 3/6/26 (b)(c) | | 16,070 | 16,158 |
| Rivian Holdco & Rivian LLC & Rivian Automotive LLC 6 month U.S. LIBOR + 5.620% 10.9311% 10/15/26 (b)(c)(h) | | 67,095 | 66,019 |
TOTAL AUTOMOTIVE & AUTO PARTS | | | 90,017 |
| Broadcasting - 0.3% | | | |
| DISH Network Corp. 11.75% 11/15/27 (h) | | 19,930 | 18,827 |
| Univision Communications, Inc. 6.625% 6/1/27 (h) | | 15,545 | 14,968 |
TOTAL BROADCASTING | | | 33,795 |
| Building Materials - 0.0% | | | |
| SRS Distribution, Inc. 4.625% 7/1/28 (h) | | 660 | 581 |
| Cable/Satellite TV - 0.3% | | | |
| CCO Holdings LLC/CCO Holdings Capital Corp.: | | | |
| 5% 2/1/28 (h) | | 8,110 | 7,498 |
| 5.375% 6/1/29 (h) | | 16,225 | 14,880 |
| Radiate Holdco LLC/Radiate Financial Service Ltd. 4.5% 9/15/26 (h) | | 9,355 | 7,281 |
TOTAL CABLE/SATELLITE TV | | | 29,659 |
| Capital Goods - 0.0% | | | |
| Chart Industries, Inc. 7.5% 1/1/30 (h) | | 1,670 | 1,720 |
| Chemicals - 0.0% | | | |
| Kronos Acquisition Holdings, Inc. / KIK Custom Products, Inc. 5% 12/31/26 (h) | | 145 | 134 |
| Containers - 0.1% | | | |
| Ardagh Packaging Finance PLC/Ardagh MP Holdings U.S.A., Inc. 4.125% 8/15/26 (h) | | 11,245 | 10,573 |
| Energy - 0.2% | | | |
| Citgo Petroleum Corp.: | | | |
| 6.375% 6/15/26 (h) | | 2,115 | 2,060 |
| 7% 6/15/25 (h) | | 9,610 | 9,562 |
| New Fortress Energy, Inc.: | | | |
| 6.5% 9/30/26 (h) | | 4,395 | 4,047 |
| 6.75% 9/15/25 (h) | | 6,055 | 5,766 |
| Transocean Poseidon Ltd. 6.875% 2/1/27 (h) | | 5,062 | 4,937 |
TOTAL ENERGY | | | 26,372 |
| Gaming - 0.6% | | | |
| Affinity Gaming LLC 6.875% 12/15/27 (h) | | 7,315 | 6,580 |
| Caesars Entertainment, Inc. 7% 2/15/30 (h) | | 7,670 | 7,738 |
| Fertitta Entertainment LLC / Fertitta Entertainment Finance Co., Inc. 4.625% 1/15/29 (h) | | 37,830 | 33,123 |
| Golden Entertainment, Inc. 7.625% 4/15/26 (h) | | 5,940 | 5,999 |
| Sugarhouse HSP Gaming Prop Mezz LP/Sugarhouse HSP Gaming Finance Corp. 5.875% 5/15/25 (h) | | 7,363 | 7,142 |
| VICI Properties LP / VICI Note Co.: | | | |
| 3.5% 2/15/25 (h) | | 1,205 | 1,158 |
| 4.25% 12/1/26 (h) | | 1,725 | 1,644 |
| 4.625% 12/1/29 (h) | | 985 | 915 |
TOTAL GAMING | | | 64,299 |
| Healthcare - 0.2% | | | |
| Embecta Corp. 6.75% 2/15/30 (h) | | 8,365 | 7,579 |
| Tenet Healthcare Corp. 4.625% 7/15/24 | | 9,470 | 9,389 |
TOTAL HEALTHCARE | | | 16,968 |
| Homebuilders/Real Estate - 0.3% | | | |
| MPT Operating Partnership LP/MPT Finance Corp. 5% 10/15/27 | | 14,885 | 12,404 |
| Uniti Group LP / Uniti Group Finance, Inc. 10.5% 2/15/28 (h) | | 18,880 | 18,066 |
TOTAL HOMEBUILDERS/REAL ESTATE | | | 30,470 |
| Insurance - 0.1% | | | |
| Alliant Holdings Intermediate LLC 6.75% 4/15/28 (h) | | 16,655 | 16,634 |
| Leisure - 0.2% | | | |
| Carnival Corp. 7.625% 3/1/26 (h) | | 10,000 | 9,120 |
| Royal Caribbean Cruises Ltd.: | | | |
| 8.25% 1/15/29 (h) | | 7,970 | 8,392 |
| 11.625% 8/15/27 (h) | | 5,355 | 5,685 |
TOTAL LEISURE | | | 23,197 |
| Paper - 0.0% | | | |
| Ardagh Metal Packaging Finance U.S.A. LLC/Ardagh Metal Packaging Finance PLC 3.25% 9/1/28 (h) | | 3,430 | 3,003 |
| Restaurants - 0.0% | | | |
| 1011778 BC Unlimited Liability Co./New Red Finance, Inc. 5.75% 4/15/25 (h) | | 660 | 661 |
| CEC Entertainment LLC 6.75% 5/1/26 (h) | | 4,045 | 3,845 |
TOTAL RESTAURANTS | | | 4,506 |
| Services - 0.2% | | | |
| Adtalem Global Education, Inc. 5.5% 3/1/28 (h) | | 4,731 | 4,494 |
| Aramark Services, Inc. 6.375% 5/1/25 (h) | | 2,535 | 2,535 |
| GEMS MENASA Cayman Ltd. 7.125% 7/31/26 (h) | | 4,675 | 4,562 |
| PowerTeam Services LLC 9.033% 12/4/25 (h) | | 18,825 | 16,168 |
TOTAL SERVICES | | | 27,759 |
| Super Retail - 0.0% | | | |
| EG Global Finance PLC 6.75% 2/7/25 (h) | | 5,500 | 5,211 |
| Technology - 0.2% | | | |
| Cloud Software Group, Inc. 9% 9/30/29 (h) | | 8,495 | 7,300 |
| CommScope, Inc. 6% 3/1/26 (h) | | 5,800 | 5,539 |
| Maxar Technologies, Inc. 7.75% 6/15/27 (h) | | 7,895 | 8,367 |
TOTAL TECHNOLOGY | | | 21,206 |
| Telecommunications - 0.9% | | | |
| Altice Financing SA 5.75% 8/15/29 (h) | | 30,000 | 23,931 |
| Altice France SA: | | | |
| 5.125% 1/15/29 (h) | | 8,087 | 5,977 |
| 5.125% 7/15/29 (h) | | 10,905 | 8,062 |
| 5.5% 1/15/28 (h) | | 8,480 | 6,676 |
| 5.5% 10/15/29 (h) | | 8,370 | 6,266 |
| Consolidated Communications, Inc. 5% 10/1/28 (h) | | 410 | 301 |
| Frontier Communications Holdings LLC: | | | |
| 5% 5/1/28 (h) | | 4,005 | 3,517 |
| 8.75% 5/15/30 (h) | | 1,560 | 1,543 |
| Intelsat Jackson Holdings SA 6.5% 3/15/30 (h) | | 22,343 | 20,618 |
| LCPR Senior Secured Financing DAC: | | | |
| 5.125% 7/15/29 (h) | | 810 | 694 |
| 6.75% 10/15/27 (h) | | 8,250 | 7,836 |
| Northwest Fiber LLC/Northwest Fiber Finance Sub, Inc. 4.75% 4/30/27 (h) | | 710 | 616 |
| Windstream Escrow LLC 7.75% 8/15/28 (h) | | 18,810 | 15,492 |
TOTAL TELECOMMUNICATIONS | | | 101,529 |
| Textiles/Apparel - 0.0% | | | |
| Victoria's Secret & Co. 4.625% 7/15/29 (h) | | 4,010 | 3,243 |
| Utilities - 0.1% | | | |
| Exgen Texas Power LLC 3 month U.S. LIBOR + 6.750% 11.961% 10/8/26 (b)(c)(e) | | 8,608 | 8,672 |
| TOTAL NONCONVERTIBLE BONDS (Cost $576,914) | | | 548,210 |
| | | | |
| Common Stocks - 1.5% |
| | | Shares | Value ($) (000s) |
| Broadcasting - 0.0% | | | |
| ION Media Networks, Inc. (e)(j) | | 2,842 | 0 |
| Capital Goods - 0.0% | | | |
| TNT Crane & Rigging LLC (e)(j) | | 512,868 | 4,441 |
| TNT Crane & Rigging LLC warrants 10/31/25 (e)(j) | | 86,957 | 18 |
TOTAL CAPITAL GOODS | | | 4,459 |
| Diversified Financial Services - 0.1% | | | |
| ACNR Holdings, Inc. (e)(j) | | 115,087 | 10,916 |
| Lime Tree Bay Ltd. (e)(j) | | 2,899 | 83 |
TOTAL DIVERSIFIED FINANCIAL SERVICES | | | 10,999 |
| Energy - 1.1% | | | |
| California Resources Corp. | | 885,119 | 35,847 |
| California Resources Corp. warrants 10/27/24 (j) | | 48,025 | 457 |
| Chesapeake Energy Corp. | | 587,218 | 48,551 |
| Chesapeake Energy Corp. (j)(k) | | 4,049 | 335 |
| Denbury, Inc. (j) | | 391,783 | 36,585 |
| EP Energy Corp. (e)(j) | | 80,740 | 472 |
TOTAL ENERGY | | | 122,247 |
| Entertainment/Film - 0.0% | | | |
| Cineworld Group PLC warrants 11/23/25 (j) | | 1,189,800 | 0 |
| Restaurants - 0.1% | | | |
| CEC Entertainment, Inc. (e)(j) | | 542,500 | 8,902 |
| Super Retail - 0.0% | | | |
| David's Bridal, Inc. rights (e)(j) | | 4,171 | 0 |
| Telecommunications - 0.0% | | | |
| GTT Communications, Inc. (e) | | 118,360 | 1,462 |
| Utilities - 0.2% | | | |
| TexGen Power LLC (e)(j) | | 524,336 | 16,517 |
| TOTAL COMMON STOCKS (Cost $82,473) | | | 164,586 |
| | | | |
| Nonconvertible Preferred Stocks - 0.3% |
| | | Shares | Value ($) (000s) |
| Diversified Financial Services - 0.3% | | | |
ACNR Holdings, Inc. (e)(j) (Cost $8,235) | | 65,882 | 37,705 |
| | | | |
| Preferred Securities - 0.4% |
| | | Principal Amount (a) (000s) | Value ($) (000s) |
| Banks & Thrifts - 0.2% | | | |
| Bank of America Corp.: | | | |
| 5.2% (b)(l) | | 2,165 | 2,197 |
| 6.25% (b)(l) | | 11,615 | 11,465 |
| JPMorgan Chase & Co. 6% (b)(l) | | 7,500 | 7,543 |
TOTAL BANKS & THRIFTS | | | 21,205 |
| Energy - 0.2% | | | |
| Energy Transfer LP 3 month U.S. LIBOR + 4.020% 8.8916% (b)(c)(l) | | 32,180 | 29,296 |
| TOTAL PREFERRED SECURITIES (Cost $50,986) | | | 50,501 |
| | | | |
| Other - 0.8% |
| | | Shares | Value ($) (000s) |
| Other - 0.8% | | | |
Fidelity Private Credit Central Fund LLC (k)(n) (Cost $85,104) | | 8,556,722 | 84,883 |
| | | | |
| Money Market Funds - 3.2% |
| | | Shares | Value ($) (000s) |
Fidelity Cash Central Fund 4.88% (m) (Cost $361,862) | | 361,813,937 | 361,886 |
| | | | |
| TOTAL INVESTMENT IN SECURITIES - 99.8% (Cost $11,723,267) | 11,326,798 |
NET OTHER ASSETS (LIABILITIES) - 0.2% | 26,980 |
| NET ASSETS - 100.0% | 11,353,778 |
| | |
Any values shown as $0 in the Schedule of Investments may reflect amounts less than $500.
Legend
| (a) | Amount is stated in United States dollars unless otherwise noted. |
| (b) | Coupon rates for floating and adjustable rate securities reflect the rates in effect at period end. |
| (c) | Coupon is indexed to a floating interest rate which may be multiplied by a specified factor and/or subject to caps or floors. |
| (d) | Remaining maturities of bank loan obligations may be less than the stated maturities shown as a result of contractual or optional prepayments by the borrower. Such prepayments cannot be predicted with certainty. |
| (f) | The coupon rate will be determined upon settlement of the loan after period end. |
| (g) | Position or a portion of the position represents an unfunded loan commitment. At period end, the total principal amount and market value of unfunded commitments totaled $20,487,000 and $19,761,000, respectively. |
| (h) | Security exempt from registration under Rule 144A of the Securities Act of 1933. These securities may be resold in transactions exempt from registration, normally to qualified institutional buyers. At the end of the period, the value of these securities amounted to $501,587,000 or 4.4% of net assets. |
| (i) | Security or a portion of the security purchased on a delayed delivery or when-issued basis. |
| (k) | Restricted securities (including private placements) - Investment in securities not registered under the Securities Act of 1933 (excluding 144A issues). At the end of the period, the value of restricted securities (excluding 144A issues) amounted to $85,218,000 or 0.8% of net assets. |
| (l) | Security is perpetual in nature with no stated maturity date. |
| (m) | Affiliated fund that is generally available only to investment companies and other accounts managed by Fidelity Investments. The rate quoted is the annualized seven-day yield of the fund at period end. A complete unaudited listing of the fund's holdings as of its most recent quarter end is available upon request. In addition, each Fidelity Central Fund's financial statements are available on the SEC's website or upon request. |
| (n) | Affiliated fund that is generally available only to investment companies and other accounts managed by Fidelity Investments. |
| Additional information on each restricted holding is as follows: |
| Security | Acquisition Date | Acquisition Cost ($) (000s) |
| Chesapeake Energy Corp. | 2/10/21 | 38 |
| | | |
| Fidelity Private Credit Central Fund LLC | 12/09/21 - 4/28/23 | 85,104 |
| | | |
Affiliated Central Funds
Fiscal year to date information regarding the Fund's investments in Fidelity Central Funds, including the ownership percentage, is presented below.
| Affiliate (Amounts in thousands) | Value, beginning of period ($) | Purchases ($) | Sales Proceeds ($) | Dividend Income ($) | Realized Gain (loss) ($) | Change in Unrealized appreciation (depreciation) ($) | Value, end of period ($) | % ownership, end of period |
| Fidelity Cash Central Fund 4.88% | 817,241 | 1,272,990 | 1,728,344 | 13,103 | - | (1) | 361,886 | 0.9% |
| Fidelity Private Credit Central Fund LLC | 42,412 | 50,810 | 8,600 | 4,493 | - | 261 | 84,883 | 14.0% |
| Fidelity Securities Lending Cash Central Fund 4.88% | - | 150,615 | 150,615 | 5 | - | - | - | 0.0% |
| Total | 859,653 | 1,474,415 | 1,887,559 | 17,601 | - | 260 | 446,769 | |
| | | | | | | | | |
Amounts in the dividend income column in the above table include any capital gain distributions from underlying funds, which are presented in the corresponding line item in the Statement of Operations, if applicable.
Amounts in the dividend income column for Fidelity Securities Lending Cash Central Fund represents the income earned on investing cash collateral, less rebates paid to borrowers and any lending agent fees associated with the loan, plus any premium payments received for lending certain types of securities.
Amounts included in the purchases and sales proceeds columns may include in-kind transactions, if applicable.
Investment Valuation
The following is a summary of the inputs used, as of April 30, 2023, involving the Fund's assets and liabilities carried at fair value. The inputs or methodology used for valuing securities may not be an indication of the risk associated with investing in those securities. For more information on valuation inputs, and their aggregation into the levels used below, please refer to the Investment Valuation section in the accompanying Notes to Financial Statements.
Amounts in this Investment Valuation section exclude the value of Fidelity Private Credit Central Fund LLC as presented in the Schedule of Investments. Fidelity Private Credit Central Fund LLC is valued using NAV as a practical expedient.
| Valuation Inputs at Reporting Date: |
Description (Amounts in thousands) | Total ($) | Level 1 ($) | Level 2 ($) | Level 3 ($) |
Investments in Securities: | | | | |
|
| Equities: | | | | |
Communication Services | - | - | - | - |
Consumer Discretionary | 8,902 | - | - | 8,902 |
Energy | 122,247 | 121,775 | - | 472 |
Financials | 48,704 | - | - | 48,704 |
Industrials | 4,459 | - | - | 4,459 |
Information Technology | 1,462 | - | - | 1,462 |
Utilities | 16,517 | - | - | 16,517 |
|
| Bank Loan Obligations | 10,079,027 | - | 9,944,912 | 134,115 |
|
| Corporate Bonds | 548,210 | - | 539,538 | 8,672 |
|
| Preferred Securities | 50,501 | - | 50,501 | - |
|
| Money Market Funds | 361,886 | 361,886 | - | - |
| Total Investments in Securities: | 11,241,915 | 483,661 | 10,534,951 | 223,303 |
The following is a reconciliation of Investments in Securities for which Level 3 inputs were used in determining value:
| (Amounts in thousands) | |
| Investments in Securities: | |
| Bank Loan Obligations | | | |
| Beginning Balance | $ | 324,271 | |
| Net Realized Gain (Loss) on Investment Securities | | (150) | |
| Net Unrealized Gain (Loss) on Investment Securities | | (15) | |
| Cost of Purchases | | 24,927 | |
| Proceeds of Sales | | (14,310) | |
| Amortization/Accretion | | 153 | |
| Transfers into Level 3 | | 29,358 | |
| Transfers out of Level 3 | | (230,119) | |
| Ending Balance | $ | 134,115 | |
| The change in unrealized gain (loss) for the period attributable to Level 3 securities held at April 30, 2023 | $ | (222) | |
| Other Investments in Securities | | | |
| Beginning Balance | $ | 88,093 | |
| Net Realized Gain (Loss) on Investment Securities | | (9) | |
| Net Unrealized Gain (Loss) on Investment Securities | | (1,931) | |
| Cost of Purchases | | 3,432 | |
| Proceeds of Sales | | (397) | |
| Amortization/Accretion | | - | |
| Transfers into Level 3 | | - | |
| Transfers out of Level 3 | | - | |
| Ending Balance | $ | 89,188 | |
| The change in unrealized gain (loss) for the period attributable to Level 3 securities held at April 30, 2023 | $ | (1,931) | |
| The information used in the above reconciliation represents fiscal year to date activity for any Investments in Securities identified as using Level 3 inputs at either the beginning or the end of the current fiscal period. Cost of purchases and proceeds of sales may include securities received and/or delivered through in-kind transactions, corporate actions or exchanges. Transfers into Level 3 were attributable to a lack of observable market data resulting from decreases in market activity, decreases in liquidity, security restructurings or corporate actions. Transfers out of Level 3 were attributable to observable market data becoming available for those securities. Transfers in or out of Level 3 represent the beginning value of any Security or Instrument where a change in the pricing level occurred from the beginning to the end of the period. Realized and unrealized gains (losses) disclosed in the reconciliation are included in Net Gain (Loss) on the Fund's Statement of Operations. | |
| Statement of Assets and Liabilities |
| Amounts in thousands (except per-share amounts) | | | | April 30, 2023 (Unaudited) |
| | | | | |
| Assets | | | | |
| Investment in securities, at value - See accompanying schedule: | | | | |
Unaffiliated issuers (cost $11,276,301) | $ | 10,880,029 | | |
Fidelity Central Funds (cost $446,966) | | 446,769 | | |
| | | | | |
| | | | | |
| Total Investment in Securities (cost $11,723,267) | | | $ | 11,326,798 |
| Cash | | | | 10,427 |
| Receivable for investments sold | | | | 139,684 |
| Receivable for fund shares sold | | | | 10,300 |
| Interest receivable | | | | 63,511 |
| Distributions receivable from Fidelity Central Funds | | | | 1,391 |
| Prepaid expenses | | | | 5 |
| Other receivables | | | | 206 |
Total assets | | | | 11,552,322 |
| Liabilities | | | | |
| Payable for investments purchased | | | | |
Regular delivery | $ | 153,338 | | |
Delayed delivery | | 7,810 | | |
| Payable for fund shares redeemed | | 16,284 | | |
| Distributions payable | | 14,015 | | |
| Accrued management fee | | 5,208 | | |
| Distribution and service plan fees payable | | 226 | | |
| Other affiliated payables | | 1,126 | | |
| Other payables and accrued expenses | | 537 | | |
| Total Liabilities | | | | 198,544 |
| Commitments and contingent liabilities (see Commitments note) | | | | |
| Net Assets | | | $ | 11,353,778 |
| Net Assets consist of: | | | | |
| Paid in capital | | | $ | 12,849,117 |
| Total accumulated earnings (loss) | | | | (1,495,339) |
| Net Assets | | | $ | 11,353,778 |
| | | | | |
| Net Asset Value and Maximum Offering Price | | | | |
| Class A : | | | | |
Net Asset Value and redemption price per share ($550,365 ÷ 60,340 shares) (a) | | | $ | 9.12 |
| Maximum offering price per share (100/97.25 of $9.12) | | | $ | 9.38 |
| Class M : | | | | |
Net Asset Value and redemption price per share ($83,804 ÷ 9,201 shares) (a) | | | $ | 9.11 |
| Maximum offering price per share (100/97.25 of $9.11) | | | $ | 9.37 |
| Class C : | | | | |
Net Asset Value and offering price per share ($109,726 ÷ 12,032 shares) (a) | | | $ | 9.12 |
| Fidelity Floating Rate High Income Fund : | | | | |
Net Asset Value , offering price and redemption price per share ($6,217,016 ÷ 682,505 shares) | | | $ | 9.11 |
| Class I : | | | | |
Net Asset Value , offering price and redemption price per share ($1,847,132 ÷ 202,953 shares) | | | $ | 9.10 |
| Class Z : | | | | |
Net Asset Value , offering price and redemption price per share ($2,545,735 ÷ 279,571 shares) | | | $ | 9.11 |
(a)Redemption price per share is equal to net asset value less any applicable contingent deferred sales charge. |
| Statement of Operations |
| Amounts in thousands | | | | Six months ended April 30, 2023 (Unaudited) |
| Investment Income | | | | |
| Dividends | | | $ | 4,685 |
| Interest | | | | 479,681 |
| Income from Fidelity Central Funds (including $5 from security lending) | | | | 17,601 |
| Total Income | | | | 501,967 |
| Expenses | | | | |
| Management fee | $ | 32,563 | | |
| Transfer agent fees | | 6,089 | | |
| Distribution and service plan fees | | 1,407 | | |
| Accounting fees | | 789 | | |
| Custodian fees and expenses | | 58 | | |
| Independent trustees' fees and expenses | | 38 | | |
| Registration fees | | 183 | | |
| Audit | | 48 | | |
| Legal | | 10 | | |
| Miscellaneous | | 28 | | |
| Total expenses before reductions | | 41,213 | | |
| Expense reductions | | (204) | | |
| Total expenses after reductions | | | | 41,009 |
| Net Investment income (loss) | | | | 460,958 |
| Realized and Unrealized Gain (Loss) | | | | |
| Net realized gain (loss) on: | | | | |
| Investment Securities: | | | | |
| Unaffiliated issuers | | (51,053) | | |
| Total net realized gain (loss) | | | | (51,053) |
| Change in net unrealized appreciation (depreciation) on: | | | | |
| Investment Securities: | | | | |
| Unaffiliated issuers | | 254,259 | | |
| Fidelity Central Funds | | 260 | | |
| Total change in net unrealized appreciation (depreciation) | | | | 254,519 |
| Net gain (loss) | | | | 203,466 |
| Net increase (decrease) in net assets resulting from operations | | | $ | 664,424 |
| Statement of Changes in Net Assets |
| |
| Amount in thousands | | Six months ended April 30, 2023 (Unaudited) | | Year ended October 31, 2022 |
| Increase (Decrease) in Net Assets | | | | |
| Operations | | | | |
| Net investment income (loss) | $ | 460,958 | $ | 531,439 |
| Net realized gain (loss) | | (51,053) | | (66,166) |
| Change in net unrealized appreciation (depreciation) | | 254,519 | | (722,663) |
| Net increase (decrease) in net assets resulting from operations | | 664,424 | | (257,390) |
| Distributions to shareholders | | (473,414) | | (524,936) |
| Share transactions - net increase (decrease) | | (865,691) | | 2,079,697 |
| Total increase (decrease) in net assets | | (674,681) | | 1,297,371 |
| | | | | |
| Net Assets | | | | |
| Beginning of period | | 12,028,459 | | 10,731,088 |
| End of period | $ | 11,353,778 | $ | 12,028,459 |
| | | | | |
| | | | | |
Financial Highlights
| Fidelity Advisor® Floating Rate High Income Fund Class A |
| |
| | Six months ended (Unaudited) April 30, 2023 | | Years ended October 31, 2022 | | 2021 | | 2020 | | 2019 | | 2018 |
Selected Per-Share Data | | | | | | | | | | | | |
| Net asset value, beginning of period | $ | 8.98 | $ | 9.53 | $ | 8.98 | $ | 9.39 | $ | 9.61 | $ | 9.67 |
| Income from Investment Operations | | | | | | | | | | | | |
Net investment income (loss) A,B | | .340 | | .370 | | .298 | | .362 | | .461 | | .398 |
| Net realized and unrealized gain (loss) | | .150 | | (.556) | | .525 | | (.411) | | (.216) | | (.056) |
| Total from investment operations | | .490 | | (.186) | | .823 | | (.049) | | .245 | | .342 |
| Distributions from net investment income | | (.350) | | (.364) | | (.273) | | (.361) | | (.465) | | (.398) |
| Distributions from net realized gain | | - | | - | | - | | - | | - | | (.004) |
| Total distributions | | (.350) | | (.364) | | (.273) | | (.361) | | (.465) | | (.402) |
Redemption fees added to paid in capital A | | - | | - | | - | | - | | - | | - C |
| Net asset value, end of period | $ | 9.12 | $ | 8.98 | $ | 9.53 | $ | 8.98 | $ | 9.39 | $ | 9.61 |
Total Return D,E,F | | 5.53% | | (1.96)% | | 9.24% | | (.45)% | | 2.63% | | 3.60% |
Ratios to Average Net Assets B,G,H | | | | | | | | | | | | |
| Expenses before reductions | | .98% I | | .97% | | .98% | | .98% | | .98% | | .98% |
| Expenses net of fee waivers, if any | | .97% I | | .97% | | .98% | | .98% | | .98% | | .98% |
| Expenses net of all reductions | | .97% I | | .97% | | .97% | | .98% | | .98% | | .98% |
| Net investment income (loss) | | 7.54% I | | 4.00% | | 3.18% | | 4.01% | | 4.86% | | 4.13% |
| Supplemental Data | | | | | | | | | | | | |
| Net assets, end of period (in millions) | $ | 550 | $ | 575 | $ | 523 | $ | 411 | $ | 546 | $ | 598 |
Portfolio turnover rate J | | 32% I | | 27% | | 31% | | 37% | | 22% | | 47% |
A Calculated based on average shares outstanding during the period.
B Net investment income (loss) is affected by the timing of the declaration of dividends by any underlying mutual funds or exchange-traded funds (ETFs). Net investment income (loss) of any mutual funds or ETFs is not included in the Fund's net investment income (loss) ratio.
C Amount represents less than $.0005 per share.
D Total returns for periods of less than one year are not annualized.
E Total returns would have been lower if certain expenses had not been reduced during the applicable periods shown.
F Total returns do not include the effect of the sales charges.
G Fees and expenses of any underlying mutual funds or exchange-traded funds (ETFs) are not included in the Fund's expense ratio. The Fund indirectly bears its proportionate share of these expenses. For additional expense information related to investments in Fidelity Central Funds, please refer to the "Investments in Fidelity Central Funds" note found in the Notes to Financial Statements section of the most recent Annual or Semi-Annual report. For additional expense information related to investments in Fidelity Private Credit Central Fund LLC, please refer to the Investment in Fidelity Private Credit Central Fund LLC note found in the Notes to Financial Statements section of the most recent Annual or Semi-Annual report.
H Expense ratios reflect operating expenses of the class. Expenses before reductions do not reflect amounts reimbursed, waived, or reduced through arrangements with the investment adviser, brokerage services, or other offset arrangements, if applicable, and do not represent the amount paid by the class during periods when reimbursements, waivers or reductions occur.
I Annualized.
J Amount does not include the portfolio activity of any underlying mutual funds or exchange-traded funds (ETFs).
| Fidelity Advisor® Floating Rate High Income Fund Class M |
| |
| | Six months ended (Unaudited) April 30, 2023 | | Years ended October 31, 2022 | | 2021 | | 2020 | | 2019 | | 2018 |
Selected Per-Share Data | | | | | | | | | | | | |
| Net asset value, beginning of period | $ | 8.96 | $ | 9.51 | $ | 8.97 | $ | 9.38 | $ | 9.59 | $ | 9.65 |
| Income from Investment Operations | | | | | | | | | | | | |
Net investment income (loss) A,B | | .340 | | .369 | | .297 | | .361 | | .460 | | .396 |
| Net realized and unrealized gain (loss) | | .160 | | (.555) | | .514 | | (.411) | | (.206) | | (.055) |
| Total from investment operations | | .500 | | (.186) | | .811 | | (.050) | | .254 | | .341 |
| Distributions from net investment income | | (.350) | | (.364) | | (.271) | | (.360) | | (.464) | | (.397) |
| Distributions from net realized gain | | - | | - | | - | | - | | - | | (.004) |
| Total distributions | | (.350) | | (.364) | | (.271) | | (.360) | | (.464) | | (.401) |
Redemption fees added to paid in capital A | | - | | - | | - | | - | | - | | - C |
| Net asset value, end of period | $ | 9.11 | $ | 8.96 | $ | 9.51 | $ | 8.97 | $ | 9.38 | $ | 9.59 |
Total Return D,E,F | | 5.66% | | (1.97)% | | 9.12% | | (.46)% | | 2.72% | | 3.59% |
Ratios to Average Net Assets B,G,H | | | | | | | | | | | | |
| Expenses before reductions | | .96% I | | .97% | | .99% | | 1.00% | | .99% | | .99% |
| Expenses net of fee waivers, if any | | .96% I | | .96% | | .99% | | 1.00% | | .99% | | .99% |
| Expenses net of all reductions | | .96% I | | .96% | | .99% | | .99% | | .99% | | .99% |
| Net investment income (loss) | | 7.56% I | | 4.00% | | 3.16% | | 4.00% | | 4.86% | | 4.11% |
| Supplemental Data | | | | | | | | | | | | |
| Net assets, end of period (in millions) | $ | 84 | $ | 87 | $ | 65 | $ | 58 | $ | 84 | $ | 102 |
Portfolio turnover rate J | | 32% I | | 27% | | 31% | | 37% | | 22% | | 47% |
A Calculated based on average shares outstanding during the period.
B Net investment income (loss) is affected by the timing of the declaration of dividends by any underlying mutual funds or exchange-traded funds (ETFs). Net investment income (loss) of any mutual funds or ETFs is not included in the Fund's net investment income (loss) ratio.
C Amount represents less than $.0005 per share.
D Total returns for periods of less than one year are not annualized.
E Total returns would have been lower if certain expenses had not been reduced during the applicable periods shown.
F Total returns do not include the effect of the sales charges.
G Fees and expenses of any underlying mutual funds or exchange-traded funds (ETFs) are not included in the Fund's expense ratio. The Fund indirectly bears its proportionate share of these expenses. For additional expense information related to investments in Fidelity Central Funds, please refer to the "Investments in Fidelity Central Funds" note found in the Notes to Financial Statements section of the most recent Annual or Semi-Annual report. For additional expense information related to investments in Fidelity Private Credit Central Fund LLC, please refer to the Investment in Fidelity Private Credit Central Fund LLC note found in the Notes to Financial Statements section of the most recent Annual or Semi-Annual report.
H Expense ratios reflect operating expenses of the class. Expenses before reductions do not reflect amounts reimbursed, waived, or reduced through arrangements with the investment adviser, brokerage services, or other offset arrangements, if applicable, and do not represent the amount paid by the class during periods when reimbursements, waivers or reductions occur.
I Annualized.
J Amount does not include the portfolio activity of any underlying mutual funds or exchange-traded funds (ETFs).
| Fidelity Advisor® Floating Rate High Income Fund Class C |
| |
| | Six months ended (Unaudited) April 30, 2023 | | Years ended October 31, 2022 | | 2021 | | 2020 | | 2019 | | 2018 |
Selected Per-Share Data | | | | | | | | | | | | |
| Net asset value, beginning of period | $ | 8.97 | $ | 9.53 | $ | 8.98 | $ | 9.39 | $ | 9.61 | $ | 9.67 |
| Income from Investment Operations | | | | | | | | | | | | |
Net investment income (loss) A,B | | .306 | | .300 | | .228 | | .295 | | .392 | | .325 |
| Net realized and unrealized gain (loss) | | .159 | | (.565) | | .524 | | (.411) | | (.218) | | (.056) |
| Total from investment operations | | .465 | | (.265) | | .752 | | (.116) | | .174 | | .269 |
| Distributions from net investment income | | (.315) | | (.295) | | (.202) | | (.294) | | (.394) | | (.325) |
| Distributions from net realized gain | | - | | - | | - | | - | | - | | (.004) |
| Total distributions | | (.315) | | (.295) | | (.202) | | (.294) | | (.394) | | (.329) |
Redemption fees added to paid in capital A | | - | | - | | - | | - | | - | | - C |
| Net asset value, end of period | $ | 9.12 | $ | 8.97 | $ | 9.53 | $ | 8.98 | $ | 9.39 | $ | 9.61 |
Total Return D,E,F | | 5.25% | | (2.81)% | | 8.42% | | (1.19)% | | 1.86% | | 2.83% |
Ratios to Average Net Assets B,G,H | | | | | | | | | | | | |
| Expenses before reductions | | 1.73% I | | 1.72% | | 1.73% | | 1.74% | | 1.73% | | 1.73% |
| Expenses net of fee waivers, if any | | 1.73% I | | 1.72% | | 1.73% | | 1.74% | | 1.73% | | 1.73% |
| Expenses net of all reductions | | 1.73% I | | 1.72% | | 1.73% | | 1.74% | | 1.73% | | 1.73% |
| Net investment income (loss) | | 6.79% I | | 3.24% | | 2.42% | | 3.26% | | 4.11% | | 3.36% |
| Supplemental Data | | | | | | | | | | | | |
| Net assets, end of period (in millions) | $ | 110 | $ | 114 | $ | 109 | $ | 156 | $ | 261 | $ | 464 |
Portfolio turnover rate J | | 32% I | | 27% | | 31% | | 37% | | 22% | | 47% |
A Calculated based on average shares outstanding during the period.
B Net investment income (loss) is affected by the timing of the declaration of dividends by any underlying mutual funds or exchange-traded funds (ETFs). Net investment income (loss) of any mutual funds or ETFs is not included in the Fund's net investment income (loss) ratio.
C Amount represents less than $.0005 per share.
D Total returns for periods of less than one year are not annualized.
E Total returns would have been lower if certain expenses had not been reduced during the applicable periods shown.
F Total returns do not include the effect of the contingent deferred sales charge.
G Fees and expenses of any underlying mutual funds or exchange-traded funds (ETFs) are not included in the Fund's expense ratio. The Fund indirectly bears its proportionate share of these expenses. For additional expense information related to investments in Fidelity Central Funds, please refer to the "Investments in Fidelity Central Funds" note found in the Notes to Financial Statements section of the most recent Annual or Semi-Annual report. For additional expense information related to investments in Fidelity Private Credit Central Fund LLC, please refer to the Investment in Fidelity Private Credit Central Fund LLC note found in the Notes to Financial Statements section of the most recent Annual or Semi-Annual report.
H Expense ratios reflect operating expenses of the class. Expenses before reductions do not reflect amounts reimbursed, waived, or reduced through arrangements with the investment adviser, brokerage services, or other offset arrangements, if applicable, and do not represent the amount paid by the class during periods when reimbursements, waivers or reductions occur.
I Annualized.
J Amount does not include the portfolio activity of any underlying mutual funds or exchange-traded funds (ETFs).
| Fidelity® Floating Rate High Income Fund |
| |
| | Six months ended (Unaudited) April 30, 2023 | | Years ended October 31, 2022 | | 2021 | | 2020 | | 2019 | | 2018 |
Selected Per-Share Data | | | | | | | | | | | | |
| Net asset value, beginning of period | $ | 8.96 | $ | 9.52 | $ | 8.97 | $ | 9.38 | $ | 9.60 | $ | 9.65 |
| Income from Investment Operations | | | | | | | | | | | | |
Net investment income (loss) A,B | | .353 | | .397 | | .326 | | .391 | | .490 | | .426 |
| Net realized and unrealized gain (loss) | | .159 | | (.566) | | .525 | | (.413) | | (.218) | | (.046) |
| Total from investment operations | | .512 | | (.169) | | .851 | | (.022) | | .272 | | .380 |
| Distributions from net investment income | | (.362) | | (.391) | | (.301) | | (.388) | | (.492) | | (.426) |
| Distributions from net realized gain | | - | | - | | - | | - | | - | | (.004) |
| Total distributions | | (.362) | | (.391) | | (.301) | | (.388) | | (.492) | | (.430) |
Redemption fees added to paid in capital A | | - | | - | | - | | - | | - | | - C |
| Net asset value, end of period | $ | 9.11 | $ | 8.96 | $ | 9.52 | $ | 8.97 | $ | 9.38 | $ | 9.60 |
Total Return D,E | | 5.80% | | (1.79)% | | 9.58% | | (.15)% | | 2.93% | | 4.01% |
Ratios to Average Net Assets B,F,G | | | | | | | | | | | | |
| Expenses before reductions | | .68% H | | .68% | | .67% | | .68% | | .68% | | .69% |
| Expenses net of fee waivers, if any | | .68% H | | .68% | | .67% | | .68% | | .68% | | .68% |
| Expenses net of all reductions | | .68% H | | .68% | | .67% | | .68% | | .68% | | .68% |
| Net investment income (loss) | | 7.84% H | | 4.29% | | 3.48% | | 4.32% | | 5.16% | | 4.44% |
| Supplemental Data | | | | | | | | | | | | |
| Net assets, end of period (in millions) | $ | 6,217 | $ | 6,461 | $ | 6,419 | $ | 4,640 | $ | 7,130 | $ | 9,221 |
Portfolio turnover rate I | | 32% H | | 27% | | 31% | | 37% | | 22% | | 47% |
A Calculated based on average shares outstanding during the period.
B Net investment income (loss) is affected by the timing of the declaration of dividends by any underlying mutual funds or exchange-traded funds (ETFs). Net investment income (loss) of any mutual funds or ETFs is not included in the Fund's net investment income (loss) ratio.
C Amount represents less than $.0005 per share.
D Total returns for periods of less than one year are not annualized.
E Total returns would have been lower if certain expenses had not been reduced during the applicable periods shown.
F Fees and expenses of any underlying mutual funds or exchange-traded funds (ETFs) are not included in the Fund's expense ratio. The Fund indirectly bears its proportionate share of these expenses. For additional expense information related to investments in Fidelity Central Funds, please refer to the "Investments in Fidelity Central Funds" note found in the Notes to Financial Statements section of the most recent Annual or Semi-Annual report. For additional expense information related to investments in Fidelity Private Credit Central Fund LLC, please refer to the Investment in Fidelity Private Credit Central Fund LLC note found in the Notes to Financial Statements section of the most recent Annual or Semi-Annual report.
G Expense ratios reflect operating expenses of the class. Expenses before reductions do not reflect amounts reimbursed, waived, or reduced through arrangements with the investment adviser, brokerage services, or other offset arrangements, if applicable, and do not represent the amount paid by the class during periods when reimbursements, waivers or reductions occur.
H Annualized.
I Amount does not include the portfolio activity of any underlying mutual funds or exchange-traded funds (ETFs).
| Fidelity Advisor® Floating Rate High Income Fund Class I |
| |
| | Six months ended (Unaudited) April 30, 2023 | | Years ended October 31, 2022 | | 2021 | | 2020 | | 2019 | | 2018 |
Selected Per-Share Data | | | | | | | | | | | | |
| Net asset value, beginning of period | $ | 8.96 | $ | 9.51 | $ | 8.96 | $ | 9.37 | $ | 9.59 | $ | 9.65 |
| Income from Investment Operations | | | | | | | | | | | | |
Net investment income (loss) A,B | | .351 | | .391 | | .321 | | .388 | | .486 | | .419 |
| Net realized and unrealized gain (loss) | | .150 | | (.554) | | .525 | | (.414) | | (.218) | | (.056) |
| Total from investment operations | | .501 | | (.163) | | .846 | | (.026) | | .268 | | .363 |
| Distributions from net investment income | | (.361) | | (.387) | | (.296) | | (.384) | | (.488) | | (.419) |
| Distributions from net realized gain | | - | | - | | - | | - | | - | | (.004) |
| Total distributions | | (.361) | | (.387) | | (.296) | | (.384) | | (.488) | | (.423) |
Redemption fees added to paid in capital A | | - | | - | | - | | - | | - | | - C |
| Net asset value, end of period | $ | 9.10 | $ | 8.96 | $ | 9.51 | $ | 8.96 | $ | 9.37 | $ | 9.59 |
Total Return D,E | | 5.67% | | (1.73)% | | 9.54% | | (.20)% | | 2.88% | | 3.84% |
Ratios to Average Net Assets B,F,G | | | | | | | | | | | | |
| Expenses before reductions | | .71% H | | .72% | | .72% | | .73% | | .74% | | .75% |
| Expenses net of fee waivers, if any | | .71% H | | .72% | | .72% | | .72% | | .74% | | .75% |
| Expenses net of all reductions | | .71% H | | .72% | | .72% | | .72% | | .73% | | .75% |
| Net investment income (loss) | | 7.81% H | | 4.25% | | 3.43% | | 4.27% | | 5.11% | | 4.36% |
| Supplemental Data | | | | | | | | | | | | |
| Net assets, end of period (in millions) | $ | 1,847 | $ | 1,993 | $ | 1,167 | $ | 681 | $ | 1,190 | $ | 2,243 |
Portfolio turnover rate I | | 32% H | | 27% | | 31% | | 37% | | 22% | | 47% |
A Calculated based on average shares outstanding during the period.
B Net investment income (loss) is affected by the timing of the declaration of dividends by any underlying mutual funds or exchange-traded funds (ETFs). Net investment income (loss) of any mutual funds or ETFs is not included in the Fund's net investment income (loss) ratio.
C Amount represents less than $.0005 per share.
D Total returns for periods of less than one year are not annualized.
E Total returns would have been lower if certain expenses had not been reduced during the applicable periods shown.
F Fees and expenses of any underlying mutual funds or exchange-traded funds (ETFs) are not included in the Fund's expense ratio. The Fund indirectly bears its proportionate share of these expenses. For additional expense information related to investments in Fidelity Central Funds, please refer to the "Investments in Fidelity Central Funds" note found in the Notes to Financial Statements section of the most recent Annual or Semi-Annual report. For additional expense information related to investments in Fidelity Private Credit Central Fund LLC, please refer to the Investment in Fidelity Private Credit Central Fund LLC note found in the Notes to Financial Statements section of the most recent Annual or Semi-Annual report.
G Expense ratios reflect operating expenses of the class. Expenses before reductions do not reflect amounts reimbursed, waived, or reduced through arrangements with the investment adviser, brokerage services, or other offset arrangements, if applicable, and do not represent the amount paid by the class during periods when reimbursements, waivers or reductions occur.
H Annualized.
I Amount does not include the portfolio activity of any underlying mutual funds or exchange-traded funds (ETFs).
| Fidelity Advisor® Floating Rate High Income Fund Class Z |
| |
| | Six months ended (Unaudited) April 30, 2023 | | Years ended October 31, 2022 | | 2021 | | 2020 | | 2019 | | 2018 A |
Selected Per-Share Data | | | | | | | | | | | | |
| Net asset value, beginning of period | $ | 8.96 | $ | 9.51 | $ | 8.97 | $ | 9.37 | $ | 9.59 | $ | 9.65 |
| Income from Investment Operations | | | | | | | | | | | | |
Net investment income (loss) B,C | | .355 | | .401 | | .329 | | .388 | | .484 | | .051 |
| Net realized and unrealized gain (loss) | | .160 | | (.555) | | .516 | | (.396) | | (.207) | | (.076) |
| Total from investment operations | | .515 | | (.154) | | .845 | | (.008) | | .277 | | (.025) |
| Distributions from net investment income | | (.365) | | (.396) | | (.305) | | (.392) | | (.497) | | (.035) |
| Total distributions | | (.365) | | (.396) | | (.305) | | (.392) | | (.497) | | (.035) |
| Net asset value, end of period | $ | 9.11 | $ | 8.96 | $ | 9.51 | $ | 8.97 | $ | 9.37 | $ | 9.59 |
Total Return D,E | | 5.83% | | (1.63)% | | 9.52% | | .01% | | 2.98% | | (.26)% |
Ratios to Average Net Assets B,F,G | | | | | | | | | | | | |
| Expenses before reductions | | .62% H | | .62% | | .62% | | .63% | | .63% | | .62% H |
| Expenses net of fee waivers, if any | | .62% H | | .62% | | .62% | | .63% | | .62% | | .62% H |
| Expenses net of all reductions | | .62% H | | .62% | | .62% | | .63% | | .62% | | .62% H |
| Net investment income (loss) | | 7.90% H | | 4.35% | | 3.53% | | 4.37% | | 5.22% | | 7.64% H |
| Supplemental Data | | | | | | | | | | | | |
| Net assets, end of period (in millions) | $ | 2,546 | $ | 2,798 | $ | 2,449 | $ | 641 | $ | 439 | $ | 16 |
Portfolio turnover rate I | | 32% H | | 27% | | 31% | | 37% | | 22% | | 47% |
A For the period October 2, 2018 (commencement of sale of shares) through October 31, 2018.
B Net investment income (loss) is affected by the timing of the declaration of dividends by any underlying mutual funds or exchange-traded funds (ETFs). Net investment income (loss) of any mutual funds or ETFs is not included in the Fund's net investment income (loss) ratio.
C Calculated based on average shares outstanding during the period.
D Total returns for periods of less than one year are not annualized.
E Total returns would have been lower if certain expenses had not been reduced during the applicable periods shown.
F Fees and expenses of any underlying mutual funds or exchange-traded funds (ETFs) are not included in the Fund's expense ratio. The Fund indirectly bears its proportionate share of these expenses. For additional expense information related to investments in Fidelity Central Funds, please refer to the "Investments in Fidelity Central Funds" note found in the Notes to Financial Statements section of the most recent Annual or Semi-Annual report. For additional expense information related to investments in Fidelity Private Credit Central Fund LLC, please refer to the Investment in Fidelity Private Credit Central Fund LLC note found in the Notes to Financial Statements section of the most recent Annual or Semi-Annual report.
G Expense ratios reflect operating expenses of the class. Expenses before reductions do not reflect amounts reimbursed, waived, or reduced through arrangements with the investment adviser, brokerage services, or other offset arrangements, if applicable, and do not represent the amount paid by the class during periods when reimbursements, waivers or reductions occur.
H Annualized.
I Amount does not include the portfolio activity of any underlying mutual funds or exchange-traded funds (ETFs).
For the period ended April 30, 2023
( Amounts in thousands except percentages)
1. Organization.
Fidelity Advisor Floating Rate High Income Fund (the Fund) is a fund of Fidelity Advisor Series I (the Trust) and is authorized to issue an unlimited number of shares. The Trust is registered under the Investment Company Act of 1940, as amended (the 1940 Act), as an open-end management investment company organized as a Massachusetts business trust. The Fund offers Class A, Class M, Class C, Fidelity Floating Rate High Income Fund, Class I and Class Z shares, each of which has equal rights as to assets and voting privileges. Class A, Class M, Class C, Class I and Class Z are Fidelity Advisor classes. Each class has exclusive voting rights with respect to matters that affect that class. Class C shares will automatically convert to Class A shares after a holding period of eight years from the initial date of purchase, with certain exceptions.
2. Investments in Fidelity Central Funds.
Funds may invest in Fidelity Central Funds, which are open-end investment companies generally available only to other investment companies and accounts managed by the investment adviser and its affiliates. The Schedule of Investments lists any Fidelity Central Funds held as an investment as of period end, but does not include the underlying holdings of each Fidelity Central Fund. An investing fund indirectly bears its proportionate share of the expenses of the underlying Fidelity Central Funds.
Based on its investment objective, each Fidelity Central Fund may invest or participate in various investment vehicles or strategies that are similar to those of the investing fund. These strategies are consistent with the investment objectives of the investing fund and may involve certain economic risks which may cause a decline in value of each of the Fidelity Central Funds and thus a decline in the value of the investing fund.
| Fidelity Central Fund | Investment Manager | Investment Objective | Investment Practices | Expense Ratio A |
| Fidelity Money Market Central Funds | Fidelity Management & Research Company LLC (FMR) | Each fund seeks to obtain a high level of current income consistent with the preservation of capital and liquidity. | Short-term Investments | Less than .005% |
A Expenses expressed as a percentage of average net assets and are as of each underlying Central Fund's most recent annual or semi-annual shareholder report.
A complete unaudited list of holdings for each Fidelity Central Fund is available upon request or at the Securities and Exchange Commission website at www.sec.gov. In addition, the financial statements of the Fidelity Central Funds which contain the significant accounting policies (including investment valuation policies) of those funds, and are not covered by the Report of Independent Registered Public Accounting Firm, are available on the Securities and Exchange Commission website or upon request.
3. Investment in Fidelity Private Credit Central Fund LLC.
The Fund invests in Fidelity Private Credit Central Fund LLC (formerly Fidelity Direct Lending Fund, LP), which is a limited liability company available only to certain investment companies managed by the investment adviser and its affiliates. The Fund's units are not registered under the Securities Act of 1933, and are subject to substantial restrictions on transfer. The Fund has no redemption rights under the limited liability company agreement. There will be no trading market for the units.
Based on its investment objective, Fidelity Private Credit Central Fund LLC may invest or participate in various investments or strategies that are similar to those in which the Fund may invest or participate. These strategies are consistent with the investment objectives of the Fund and may involve certain economic risks which may cause a decline in value of Fidelity Private Credit Central Fund LLC and thus a decline in the value of the Fund. Fidelity Private Credit Central Fund LLC intends to invest primarily in direct loans made to private U.S. companies, specifically small- and middle-market companies.
The Schedule of Investments lists Fidelity Private Credit Central Fund LLC as an investment as of period end, but does not include the underlying holdings of Fidelity Private Credit Central Fund LLC. Fidelity Private Credit Central Fund LLC represented less than 5% of the Fund's net assets at period end. The Fund indirectly bears its proportionate share of the expenses of Fidelity Private Credit Central Fund LLC. The expense ratio for Fidelity Private Credit Central Fund LLC for the year ended December 31, 2022 was 2.46%.
4. Significant Accounting Policies.
The Fund is an investment company and applies the accounting and reporting guidance of the Financial Accounting Standards Board (FASB) Accounting Standards Codification Topic 946 Financial Services - Investment Companies . The financial statements have been prepared in conformity with accounting principles generally accepted in the United States of America (GAAP), which require management to make certain estimates and assumptions at the date of the financial statements. Actual results could differ from those estimates. Subsequent events, if any, through the date that the financial statements were issued have been evaluated in the preparation of the financial statements. The Fund's Schedule of Investments lists any underlying mutual funds or exchange-traded funds (ETFs) but does not include the underlying holdings of these funds. The following summarizes the significant accounting policies of the Fund:
Investment Valuation. Investments are valued as of 4:00 p.m. Eastern time on the last calendar day of the period. The Board of Trustees (the Board) has designated the Fund's investment adviser as the valuation designee responsible for the fair valuation function and performing fair value determinations as needed. The investment adviser has established a Fair Value Committee (the Committee) to carry out the day-to-day fair valuation responsibilities and has adopted policies and procedures to govern the fair valuation process and the activities of the Committee. In accordance with these fair valuation policies and procedures, which have been approved by the Board, the Fund attempts to obtain prices from one or more third party pricing services or brokers to value its investments. When current market prices, quotations or currency exchange rates are not readily available or reliable, investments will be fair valued in good faith by the Committee, in accordance with the policies and procedures. Factors used in determining fair value vary by investment type and may include market or investment specific events, transaction data, estimated cash flows, and market observations of comparable investments. The frequency that the fair valuation procedures are used cannot be predicted and they may be utilized to a significant extent. The Committee manages the Fund's fair valuation practices and maintains the fair valuation policies and procedures. The Fund's investment adviser reports to the Board information regarding the fair valuation process and related material matters.
The Fund categorizes the inputs to valuation techniques used to value its investments into a disclosure hierarchy consisting of three levels as shown below:
Level 1 - unadjusted quoted prices in active markets for identical investments
Level 2 - other significant observable inputs (including quoted prices for similar investments, interest rates, prepayment speeds, etc.)
Level 3 - unobservable inputs (including the Fund's own assumptions based on the best information available)
Valuation techniques used to value the Fund's investments by major category are as follows:
Debt securities, including restricted securities, are valued based on evaluated prices received from third party pricing services or from brokers who make markets in such securities. Corporate bonds, bank loan obligations and preferred securities are valued by pricing services who utilize matrix pricing which considers yield or price of bonds of comparable quality, coupon, maturity and type or by broker-supplied prices. When independent prices are unavailable or unreliable, debt securities may be valued utilizing pricing methodologies which consider similar factors that would be used by third party pricing services. Debt securities are generally categorized as Level 2 in the hierarchy but may be Level 3 depending on the circumstances. The Fund invests a significant portion of its assets in below investment grade securities. The value of these securities can be more volatile due to changes in the credit quality of the issuer and is sensitive to changes in economic, market and regulatory conditions.
Equity securities, including restricted securities, for which market quotations are readily available, are valued at the last reported sale price or official closing price as reported by a third party pricing service on the primary market or exchange on which they are traded and are categorized as Level 1 in the hierarchy. In the event there were no sales during the day or closing prices are not available, securities are valued at the last quoted bid price or may be valued using the last available price and are generally categorized as Level 2 in the hierarchy. For equity securities, including restricted securities, where observable inputs are limited, assumptions about market activity and risk are used and these securities may be categorized as Level 3 in the hierarchy.
Investments in open-end mutual funds, including the Fidelity Central Funds, are valued at their closing net asset value (NAV) each business day and are categorized as Level 1 in the hierarchy.
Fidelity Private Credit Central Fund LLC is valued using NAV as a practical expedient in accordance with the specialized accounting guidance for investment companies.
The following provides information on Level 3 securities held by the Fund that were valued at period end based on unobservable inputs. These amounts exclude valuations provided by a broker and valuations using NAV as a practical expedient.
| Asset Type | Fair Value | Valuation Technique(s) | Unobservable Input | Amount or Range/Weighted Average | Impact to Valuation from an Increase in Input A |
| Equities | $80,516 | Market comparable | Enterprise value/EBITDA multiple (EV/EBITDA) | 2.0 - 8.0 / 3.6 | Increase |
| | | | Capacity multiple ($/kW) | $238.00 | Increase |
| | | Recovery value | Recovery value | $0.00 | Increase |
| | | Market approach | Parity price | $12.35 | Increase |
| | | Discounted cash flow | Discount rate | 12.8% | Decrease |
| | | Black scholes | Discount rate | 4.0% - 4.1% / 4.1% | Increase |
| | | | Volatility | 20.0% - 45.0% / 24.5% | Increase |
| | | | Term | 1.8 - 2.5 / 1.9 | Increase |
| Corporate Bonds | $8,672 | Discounted cash flow | Yield | 10.6% | Decrease |
| Bank Loan Obligations | $134,115 | Market approach | Transaction price | $95.00 - $99.50 / $96.12 | Increase |
| | | Discounted cash flow | Discount rate | 10.0% - 13.5% / 11.0% | Decrease |
| | | | Yield | 14.3% - 19.8% / 34.1% | Decrease |
| | | Indicative market price | Evaluated bid | $63.00 - $97.00 / $93.14 | Increase |
A Represents the directional change in the fair value of the Level 3 investments that could have resulted from an increase in the corresponding input as of period end. A decrease to the unobservable input would have had the opposite effect. Significant changes in these inputs may have resulted in a significantly higher or lower fair value measurement at period end.
Changes in valuation techniques may result in transfers in or out of an assigned level within the disclosure hierarchy. The aggregate value of investments by input level as of April 30, 2023, as well as a roll forward of Level 3 investments, is included at the end of the Fund's Schedule of Investments.
Investment Transactions and Income. For financial reporting purposes, the Fund's investment holdings and NAV include trades executed through the end of the last business day of the period. The NAV per share for processing shareholder transactions is calculated as of the close of business of the New York Stock Exchange (NYSE), normally 4:00 p.m. Eastern time and includes trades executed through the end of the prior business day. Gains and losses on securities sold are determined on the basis of identified cost. Commissions paid to certain brokers with whom the investment adviser, or its affiliates, places trades on behalf of a fund include an amount in addition to trade execution, which may be rebated back to a fund. Any such rebates are included in net realized gain (loss) on investments in the Statement of Operations. Dividend income is recorded on the ex-dividend date except for certain dividends from foreign securities where the ex-dividend date may have passed, which are recorded as soon as the Fund is informed of the ex-dividend date. Non-cash dividends included in dividend income, if any, are recorded at the fair market value of the securities received. Income and capital gain distributions from Fidelity Central Funds, if any, are recorded on the ex-dividend date. Certain distributions received by the Fund represent a return of capital or capital gain. The Fund determines the components of these distributions subsequent to the ex-dividend date, based upon receipt of tax filings or other correspondence relating to the underlying investment. These distributions are recorded as a reduction of cost of investments and/or as a realized gain. Interest income is accrued as earned and includes coupon interest and amortization of premium and accretion of discount on debt securities as applicable. Debt obligations may be placed on non-accrual status and related interest income may be reduced by ceasing current accruals and writing off interest receivables when the collection of all or a portion of interest has become doubtful based on consistently applied procedures. A debt obligation is removed from non-accrual status when the issuer resumes interest payments or when collectability of interest is reasonably assured. The Fund earns certain fees in connection with its floating rate loan purchasing activities. These fees are in addition to interest payments earned and may include amendment fees, consent fees and prepayment fees. These fees are recorded as Interest in the accompanying financial statements.
Class Allocations and Expenses. Investment income, realized and unrealized capital gains and losses, common expenses of a fund, and certain fund-level expense reductions, if any, are allocated daily on a pro-rata basis to each class based on the relative net assets of each class to the total net assets of a fund. Each class differs with respect to transfer agent and distribution and service plan fees incurred, as applicable. Certain expense reductions may also differ by class, if applicable. For the reporting period, the allocated portion of income and expenses to each class as a percent of its average net assets may vary due to the timing of recording these transactions in relation to fluctuating net assets of the classes. Expenses directly attributable to a fund are charged to that fund. Expenses attributable to more than one fund are allocated among the respective funds on the basis of relative net assets or other appropriate methods. Expenses included in the accompanying financial statements reflect the expenses of that fund and do not include any expenses associated with any underlying mutual funds or exchange-traded funds. Although not included in a fund's expenses, a fund indirectly bears its proportionate share of these expenses through the net asset value of each underlying mutual fund or exchange-traded fund. Expense estimates are accrued in the period to which they relate and adjustments are made when actual amounts are known.
Deferred Trustee Compensation. Under a Deferred Compensation Plan (the Plan) for certain Funds, certain independent Trustees have elected to defer receipt of a portion of their annual compensation. Deferred amounts are invested in affiliated mutual funds, are marked-to-market and remain in a fund until distributed in accordance with the Plan. The investment of deferred amounts and the offsetting payable to the Trustees presented below are included in the accompanying Statement of Assets and Liabilities in other receivables and other payables and accrued expenses, as applicable.
| Fidelity Advisor Floating Rate High Income Fund | $206 |
Income Tax Information and Distributions to Shareholders. Each year, the Fund intends to qualify as a regulated investment company under Subchapter M of the Internal Revenue Code, including distributing substantially all of its taxable income and realized gains. As a result, no provision for U.S. Federal income taxes is required. The Fund files a U.S. federal tax return, in addition to state and local tax returns as required. The Fund's federal income tax returns are subject to examination by the Internal Revenue Service (IRS) for a period of three fiscal years after they are filed. State and local tax returns may be subject to examination for an additional fiscal year depending on the jurisdiction.
Distributions are declared and recorded daily and paid monthly from net investment income. Distributions from realized gains, if any, are declared and recorded on the ex-dividend date. Income and capital gain distributions are declared separately for each class. Income and capital gain distributions are determined in accordance with income tax regulations, which may differ from GAAP.
Capital accounts within the financial statements are adjusted for permanent book-tax differences. These adjustments have no impact on net assets or the results of operations. Capital accounts are not adjusted for temporary book-tax differences which will reverse in a subsequent period.
Book-tax differences are primarily due to market discount, capital loss carryforwards, partnerships and losses deferred due to wash sales.
As of period end, the cost and unrealized appreciation (depreciation) in securities, and derivatives if applicable, for federal income tax purposes were as follows:
| Gross unrealized appreciation | $192,973 |
| Gross unrealized depreciation | (559,688) |
| Net unrealized appreciation (depreciation) | $(366,715) |
| Tax cost | $11,693,513 |
Capital loss carryforwards are only available to offset future capital gains of the Fund to the extent provided by regulations and may be limited. The capital loss carryforward information presented below, including any applicable limitation, is estimated as of prior fiscal period end and is subject to adjustment.
| Short-term | $(65,760) |
| Long-term | (1,003,847) |
| Total capital loss carryforward | $(1,069,607) |
Delayed Delivery Transactions and When-Issued Securities. During the period, certain Funds transacted in securities on a delayed delivery or when-issued basis. Payment and delivery may take place after the customary settlement period for that security. The price of the underlying securities and the date when the securities will be delivered and paid for are fixed at the time the transaction is negotiated. Securities purchased on a delayed delivery or when-issued basis are identified as such in the Schedule of Investments. Compensation for interest forgone in the purchase of a delayed delivery or when-issued debt security may be received. With respect to purchase commitments, each applicable Fund identifies securities as segregated in its records with a value at least equal to the amount of the commitment. Payables and receivables associated with the purchases and sales of delayed delivery securities having the same coupon, settlement date and broker are offset. Delayed delivery or when-issued securities that have been purchased from and sold to different brokers are reflected as both payables and receivables in the Statement of Assets and Liabilities under the caption "Delayed delivery", as applicable. Losses may arise due to changes in the value of the underlying securities or if the counterparty does not perform under the contract's terms, or if the issuer does not issue the securities due to political, economic, or other factors.
Restricted Securities (including Private Placements). Funds may invest in securities that are subject to legal or contractual restrictions on resale. These securities generally may be resold in transactions exempt from registration or to the public if the securities are registered. Disposal of these securities may involve time-consuming negotiations and expense, and prompt sale at an acceptable price may be difficult. Information regarding restricted securities held at period end is included at the end of the Schedule of Investments, if applicable.
Loans and Other Direct Debt Instruments. Direct debt instruments are interests in amounts owed to lenders by corporate or other borrowers. These instruments may be in the form of loans, trade claims or other receivables and may include standby financing commitments such as revolving credit facilities that obligate a fund to supply additional cash to the borrower on demand. Loans may be acquired through assignment, participation, or may be made directly to a borrower. Such instruments are presented in the Bank Loan Obligations section in the Schedule of Investments. Certain funds may also invest in unfunded loan commitments, which are contractual obligations for future funding. Information regarding unfunded commitments is included at the end of the Schedule of Investments, if applicable.
Commitments. A commitment is an agreement to acquire an investment at a future date (subject to conditions) in connection with a potential public or non-public offering. The amount of commitments outstanding at period end are presented in the table below. These commitments are not included in the net assets of the Fund at period end.
| | Investment to be Acquired | Commitment Amount |
| Fidelity Advisor Floating Rate High Income Fund | Fidelity Private Credit Central Fund LLC | $22,588 |
LIBOR Accounting Pronouncement. In March 2020, the Financial Accounting Standards Board (FASB) issued an Accounting Standards Update (ASU), ASU 2020-04, which provides optional, temporary relief with respect to the financial reporting of contracts subject to certain types of modifications due to the planned discontinuation of the London Interbank Offered Rate (LIBOR) and other IBOR-based reference rates. The temporary relief provided by ASU 2020-04 is effective for certain reference rate-related contract modifications that occur during the period March 12, 2020 through December 31, 2024. Management does not expect the adoption of ASU 2020-04 to have a material impact on the Fund's financial statements.
5. Purchases and Sales of Investments.
Purchases and sales of securities, other than short-term securities and in-kind transactions, as applicable, are noted in the table below.
| | Purchases ($) | Sales ($) |
| Fidelity Advisor Floating Rate High Income Fund | 1,763,030 | 2,189,425 |
6. Fees and Other Transactions with Affiliates.
Management Fee. Fidelity Management & Research Company LLC (the investment adviser) and its affiliates provide the Fund with investment management related services for which the Fund pays a monthly management fee. The management fee is the sum of an individual fund fee rate that is based on an annual rate of .45% of the Fund's average net assets and an annualized group fee rate that averaged .10% during the period. The group fee rate is based upon the monthly average net assets of a group of registered investment companies with which the investment adviser has management contracts. The group fee rate decreases as assets under management increase and increases as assets under management decrease. For the reporting period, the total annualized management fee rate was .55% of the Fund's average net assets.
Distribution and Service Plan Fees. In accordance with Rule 12b-1 of the 1940 Act, the Fund has adopted separate Distribution and Service Plans for each class of shares. Certain classes pay Fidelity Distributors Company LLC (FDC), an affiliate of the investment adviser, separate Distribution and Service Fees, each of which is based on an annual percentage of each class' average net assets. In addition, FDC may pay financial intermediaries for selling shares of the Fund and providing shareholder support services. For the period, the Distribution and Service Fee rates, total fees and amounts retained by FDC were as follows:
| | Distribution Fee | Service Fee | Total Fees | Retained by FDC |
| Class A | - % | .25% | $713 | $53 |
| Class M | - % | .25% | 115 | 2 |
| Class C | .75% | .25% | 579 | 123 |
| | | | $1,407 | $178 |
Sales Load. FDC may receive a front-end sales charge of up to 2.75% for selling Class A shares and Class M shares, some of which is paid to financial intermediaries for selling shares of the Fund. Depending on the holding period, FDC may receive contingent deferred sales charges levied on Class A, Class M and Class C redemptions. The deferred sales charges are 1.00% for Class C shares or .50% for certain purchases of Class A shares and .25% for certain purchases of Class M shares.
For the period, sales charge amounts retained by FDC were as follows:
| | Retained by FDC |
| Class A | $79 |
| Class M | 7 |
Class C A | 29 |
| | $115 |
A When Class C shares are initially sold, FDC pays commissions from its own resources to financial intermediaries through which the sales are made.
Transfer Agent Fees. Fidelity Investments Institutional Operations Company LLC (FIIOC), an affiliate of the investment adviser, is the transfer, dividend disbursing and shareholder servicing agent for each class of the Fund. FIIOC receives account fees and asset-based fees that vary according to the account size and type of account of the shareholders of the respective classes of the Fund, except for Class Z. FIIOC receives an asset-based fee of Class Z's average net assets. FIIOC pays for typesetting, printing and mailing of shareholder reports, except proxy statements.
For the period, transfer agent fees for each class were as follows:
| | Amount | % of Class-Level Average Net Assets A |
| Class A | $428 | .15 |
| Class M | 62 | .13 |
| Class C | 87 | .15 |
| Fidelity Floating Rate High Income Fund | 3,437 | .11 |
| Class I | 1,393 | .14 |
| Class Z | 682 | .05 |
| | $6,089 | |
A Annualized
Accounting Fees. Fidelity Service Company, Inc. (FSC), an affiliate of the investment adviser, maintains the Fund's accounting records. The accounting fee is based on the level of average net assets for each month. For the period, the fees were equivalent to the following annualized rates:
| | % of Average Net Assets |
| Fidelity Advisor Floating Rate High Income Fund | .01 |
Interfund Trades. Funds may purchase from or sell securities to other Fidelity Funds under procedures adopted by the Board. The procedures have been designed to ensure these interfund trades are executed in accordance with Rule 17a-7 of the 1940 Act. Any interfund trades are included within the respective purchases and sales amounts shown in the Purchases and Sales of Investments note. During the period, there were no interfund trades.
7. Committed Line of Credit.
Certain Funds participate with other funds managed by the investment adviser or an affiliate in a $4.25 billion credit facility (the "line of credit") to be utilized for temporary or emergency purposes to fund shareholder redemptions or for other short-term liquidity purposes. The participating funds have agreed to pay commitment fees on their pro-rata portion of the line of credit, which are reflected in Miscellaneous expenses on the Statement of Operations, and are listed below. During the period, there were no borrowings on this line of credit.
| | Amount |
| Fidelity Advisor Floating Rate High Income Fund | $12 |
8. Security Lending.
Funds lend portfolio securities from time to time in order to earn additional income. Lending agents are used, including National Financial Services (NFS), an affiliate of the investment adviser. Pursuant to a securities lending agreement, NFS will receive a fee, which is capped at 9.9% of a fund's daily lending revenue, for its services as lending agent. A fund may lend securities to certain qualified borrowers, including NFS. On the settlement date of the loan, a fund receives collateral (in the form of U.S. Treasury obligations, letters of credit and/or cash) against the loaned securities and maintains collateral in an amount not less than 100% of the market value of the loaned securities during the period of the loan. The market value of the loaned securities is determined at the close of business of a fund and any additional required collateral is delivered to a fund on the next business day. A fund or borrower may terminate the loan at any time, and if the borrower defaults on its obligation to return the securities loaned because of insolvency or other reasons, a fund may apply collateral received from the borrower against the obligation. A fund may experience delays and costs in recovering the securities loaned. Any cash collateral received is invested in the Fidelity Securities Lending Cash Central Fund. Any loaned securities are identified as such in the Schedule of Investments, and the value of loaned securities and cash collateral at period end, as applicable, are presented in the Statement of Assets and Liabilities. Security lending income represents the income earned on investing cash collateral, less rebates paid to borrowers and any lending agent fees associated with the loan, plus any premium payments received for lending certain types of securities. Security lending income is presented in the Statement of Operations as a component of income from Fidelity Central Funds. Affiliated security lending activity, if any, was as follows:
| | Total Security Lending Fees Paid to NFS | Security Lending Income From Securities Loaned to NFS | Value of Securities Loaned to NFS at Period End |
| Fidelity Advisor Floating Rate High Income Fund | $- A | $- | $- |
A Amount represents less than five hundred dollars
9. Expense Reductions.
Through arrangements with the Fund's custodian and each class' transfer agent, credits realized as a result of certain uninvested cash balances were used to reduce the Fund's expenses. During the period, custodian credits reduced the Fund's expenses by $58. During the period, transfer agent credits reduced each class' expenses as noted in the table below.
A Amount represents less than five hundred dollars
In addition, during the period the investment adviser or an affiliate reimbursed and/or waived a portion of fund-level operating expenses in the amount of $146.
10. Distributions to Shareholders.
Distributions to shareholders of each class were as follows:
| | Six months ended April 30, 2023 | Year ended October 31, 2022 |
| Fidelity Advisor Floating Rate High Income Fund | | |
| Distributions to shareholders | | |
| Class A | $21,950 | $22,865 |
| Class M | 3,551 | 3,069 |
| Class C | 4,006 | 3,751 |
| Fidelity Floating Rate High Income Fund | 254,299 | 297,596 |
| Class I | 80,152 | 73,070 |
| Class Z | 109,456 | 124,585 |
| Total | $473,414 | $524,936 |
11. Share Transactions.
Share transactions for each class were as follows and may contain in-kind transactions, automatic conversions between classes or exchanges between affiliated funds:
| | Shares | Shares | Dollars | Dollars |
| | Six months ended April 30, 2023 | Year ended October 31, 2022 | Six months ended April 30, 2023 | Year ended October 31, 2022 |
| Fidelity Advisor Floating Rate High Income Fund | | | | |
| Class A | | | | |
| Shares sold | 8,126 | 24,973 | $73,847 | $233,302 |
| Reinvestment of distributions | 2,185 | 2,269 | 19,852 | 20,808 |
| Shares redeemed | (14,040) | (18,077) | (127,463) | (166,482) |
| Net increase (decrease) | (3,729) | 9,165 | $(33,764) | $87,628 |
| Class M | | | | |
| Shares sold | 1,868 | 4,348 | $16,903 | $40,355 |
| Reinvestment of distributions | 381 | 328 | 3,460 | 3,001 |
| Shares redeemed | (2,756) | (1,775) | (24,997) | (16,397) |
| Net increase (decrease) | (507) | 2,901 | $(4,634) | $26,959 |
| Class C | | | | |
| Shares sold | 2,767 | 6,502 | $25,045 | $60,564 |
| Reinvestment of distributions | 409 | 381 | 3,718 | 3,493 |
| Shares redeemed | (3,806) | (5,635) | (34,574) | (51,828) |
| Net increase (decrease) | (630) | 1,248 | $(5,811) | $12,229 |
| Fidelity Floating Rate High Income Fund | | | | |
| Shares sold | 112,355 | 372,901 | $1,019,869 | $3,487,680 |
| Reinvestment of distributions | 23,523 | 27,676 | 213,454 | 253,809 |
| Shares redeemed | (174,138) | (354,339) | (1,578,667) | (3,260,200) |
| Net increase (decrease) | (38,260) | 46,238 | $(345,344) | $481,289 |
| Class I | | | | |
| Shares sold | 56,993 | 221,155 | $515,952 | $2,044,293 |
| Reinvestment of distributions | 6,928 | 6,854 | 62,813 | 62,584 |
| Shares redeemed | (83,545) | (128,170) | (757,121) | (1,166,911) |
| Net increase (decrease) | (19,624) | 99,839 | $(178,356) | $939,966 |
| Class Z | | | | |
| Shares sold | 34,678 | 152,120 | $313,627 | $1,420,399 |
| Reinvestment of distributions | 9,511 | 10,907 | 86,286 | 99,897 |
| Shares redeemed | (76,900) | (108,199) | (697,695) | (988,670) |
| Net increase (decrease) | (32,711) | 54,828 | $(297,782) | $531,626 |
12. Other.
A fund's organizational documents provide former and current trustees and officers with a limited indemnification against liabilities arising in connection with the performance of their duties to the fund. In the normal course of business, a fund may also enter into contracts that provide general indemnifications. A fund's maximum exposure under these arrangements is unknown as this would be dependent on future claims that may be made against a fund. The risk of material loss from such claims is considered remote.
13. Risk and Uncertainties.
Many factors affect a fund's performance. Developments that disrupt global economies and financial markets, such as pandemics, epidemics, outbreaks of infectious diseases, war, terrorism, and environmental disasters, may significantly affect a fund's investment performance. The effects of these developments to a fund will be impacted by the types of securities in which a fund invests, the financial condition, industry, economic sector, and geographic location of an issuer, and a fund's level of investment in the securities of that issuer. Significant concentrations in security types, issuers, industries, sectors, and geographic locations may magnify the factors that affect a fund's performance.
As a shareholder, you incur two types of costs: (1) transaction costs, which may include sales charges (loads) on purchase payments or redemption proceeds, as applicable and (2) ongoing costs, which generally include management fees, distribution and/or service (12b-1) fees and other Fund expenses. This Example is intended to help you understand your ongoing costs (in dollars) of investing in a fund and to compare these costs with the ongoing costs of investing in other mutual funds.
| The Example is based on an investment of $1,000 invested at the beginning of the period and held for the entire period (November 1, 2022 to April 30, 2023). |
Actual Expenses
The first line of the accompanying table provides information about actual account values and actual expenses. You may use the information in this line, together with the amount you invested, to estimate the expenses that you paid over the period. Simply divide your account value by $1,000.00 (for example, an $8,600 account value divided by $1,000.00 = 8.6), then multiply the result by the number in the first line for a class/Fund under the heading entitled "Expenses Paid During Period" to estimate the expenses you paid on your account during this period. If any fund is a shareholder of any underlying mutual funds or exchange-traded funds (ETFs) (the Underlying Funds), such fund indirectly bears its proportional share of the expenses of the Underlying Funds in addition to the direct expenses incurred presented in the table. These fees and expenses are not included in the annualized expense ratio used to calculate the expense estimate in the table below.
Hypothetical Example for Comparison Purposes
The second line of the accompanying table provides information about hypothetical account values and hypothetical expenses based on the actual expense ratio and an assumed rate of return of 5% per year before expenses, which is not the actual return. The hypothetical account values and expenses may not be used to estimate the actual ending account balance or expenses you paid for the period. You may use this information to compare the ongoing costs of investing in the Fund and other funds. To do so, compare this 5% hypothetical example with the 5% hypothetical examples that appear in the shareholder reports of the other funds. If any fund is a shareholder of any Underlying Funds, such fund indirectly bears its proportional share of the expenses of the Underlying Funds in addition to the direct expenses as presented in the table. These fees and expenses are not included in the annualized expense ratio used to calculate the expense estimate in the table below.
Please note that the expenses shown in the table are meant to highlight your ongoing costs only and do not reflect any transaction costs. Therefore, the second line of the table is useful in comparing ongoing costs only, and will not help you determine the relative total costs of owning different funds. In addition, if these transactional costs were included, your costs would have been higher.
| | | | | Annualized Expense Ratio- A | | Beginning Account Value November 1, 2022 | | Ending Account Value April 30, 2023 | | Expenses Paid During Period- C November 1, 2022 to April 30, 2023 |
| Fidelity Advisor® Floating Rate High Income Fund | | | | | | | | | | |
| Class A | | | | .97% | | | | | | |
| Actual | | | | | | $ 1,000 | | $ 1,055.30 | | $ 4.94 |
Hypothetical- B | | | | | | $ 1,000 | | $ 1,019.98 | | $ 4.86 |
| Class M | | | | .96% | | | | | | |
| Actual | | | | | | $ 1,000 | | $ 1,056.60 | | $ 4.90 |
Hypothetical- B | | | | | | $ 1,000 | | $ 1,020.03 | | $ 4.81 |
| Class C | | | | 1.73% | | | | | | |
| Actual | | | | | | $ 1,000 | | $ 1,052.50 | | $ 8.80 |
Hypothetical- B | | | | | | $ 1,000 | | $ 1,016.22 | | $ 8.65 |
| Fidelity® Floating Rate High Income Fund | | | | .68% | | | | | | |
| Actual | | | | | | $ 1,000 | | $ 1,058.00 | | $ 3.47 |
Hypothetical- B | | | | | | $ 1,000 | | $ 1,021.42 | | $ 3.41 |
| Class I | | | | .71% | | | | | | |
| Actual | | | | | | $ 1,000 | | $ 1,056.70 | | $ 3.62 |
Hypothetical- B | | | | | | $ 1,000 | | $ 1,021.27 | | $ 3.56 |
| Class Z | | | | .62% | | | | | | |
| Actual | | | | | | $ 1,000 | | $ 1,058.30 | | $ 3.16 |
Hypothetical- B | | | | | | $ 1,000 | | $ 1,021.72 | | $ 3.11 |
| |
A Annualized expense ratio reflects expenses net of applicable fee waivers.
B 5% return per year before expenses
C Expenses are equal to the annualized expense ratio, multiplied by the average account value over the period, multiplied by 181/ 365 (to reflect the one-half year period). The fees and expenses of any Underlying Funds are not included in each annualized expense ratio.
The Securities and Exchange Commission adopted Rule 22e-4 under the Investment Company Act of 1940 (the Liquidity Rule) to promote effective liquidity risk management throughout the open-end investment company industry, thereby reducing the risk that funds will be unable to meet their redemption obligations and mitigating dilution of the interests of fund shareholders.
The Fund has adopted and implemented a liquidity risk management program (the Program) reasonably designed to assess and manage the Fund's liquidity risk and to comply with the requirements of the Liquidity Rule. The Fund's Board of Trustees (the Board) has designated the Fund's investment adviser as administrator of the Program. The Fidelity advisers have established a Liquidity Risk Management Committee (the LRM Committee) to manage the Program for each of the Fidelity Funds. The LRM Committee monitors the adequacy and effectiveness of implementation of the Program and on a periodic basis assesses each Fund's liquidity risk based on a variety of factors including (1) the Fund's investment strategy, (2) portfolio liquidity and cash flow projections during normal and reasonably foreseeable stressed conditions, (3) shareholder redemptions, (4) borrowings and other funding sources and (5) certain factors specific to ETFs including the effect of the Fund's prices and spreads, market participants, and basket compositions on the overall liquidity of the Fund's portfolio, as applicable.
In accordance with the Program, each of the Fund's portfolio investments is classified into one of four defined liquidity categories based on a determination of a reasonable expectation for how long it would take to convert the investment to cash (or sell or dispose of the investment) without significantly changing its market value.
- Highly liquid investments - cash or convertible to cash within three business days or less
- Moderately liquid investments - convertible to cash in three to seven calendar days
- Less liquid investments - can be sold or disposed of, but not settled, within seven calendar days
- Illiquid investments - cannot be sold or disposed of within seven calendar days
Liquidity classification determinations take into account a variety of factors including various market, trading and investment-specific considerations, as well as market depth, and generally utilize analysis from a third-party liquidity metrics service.
The Liquidity Rule places a 15% limit on a fund's illiquid investments and requires funds that do not primarily hold assets that are highly liquid investments to determine and maintain a minimum percentage of the fund's net assets to be invested in highly liquid investments (highly liquid investment minimum or HLIM). The Program includes provisions reasonably designed to comply with the 15% limit on illiquid investments and for determining, periodically reviewing and complying with the HLIM requirement as applicable.
At a recent meeting of the Fund's Board of Trustees, the LRM Committee provided a written report to the Board pertaining to the operation, adequacy, and effectiveness of the Program for the period December 1, 2021 through November 30, 2022. The report concluded that the Program is operating effectively and is reasonably designed to assess and manage the Fund's liquidity risk.
1.757235.122
AFR-SANN-0623
Fidelity Advisor® High Income Advantage Fund
Semi-Annual Report
April 30, 2023
Contents
To view a fund's proxy voting guidelines and proxy voting record for the 12-month period ended June 30, visit http://www.fidelity.com/proxyvotingresults or visit the Securities and Exchange Commission's (SEC) web site at http://www.sec.gov.
You may also call 1-877-208-0098 to request a free copy of the proxy voting guidelines.
Standard & Poor's, S&P and S&P 500 are registered service marks of The McGraw-Hill Companies, Inc. and have been licensed for use by Fidelity Distributors Corporation.
Other third-party marks appearing herein are the property of their respective owners.
All other marks appearing herein are registered or unregistered trademarks or service marks of FMR LLC or an affiliated company. © 2023 FMR LLC. All rights reserved.
This report and the financial statements contained herein are submitted for the general information of the shareholders of the Fund. This report is not authorized for distribution to prospective investors in the Fund unless preceded or accompanied by an effective prospectus.
A fund files its complete schedule of portfolio holdings with the SEC for the first and third quarters of each fiscal year on Form N-PORT. Forms N-PORT are available on the SEC's web site at http://www.sec.gov. A fund's Forms N-PORT may be reviewed and copied at the SEC's Public Reference Room in Washington, DC. Information regarding the operation of the SEC's Public Reference Room may be obtained by calling 1-800-SEC-0330.
For a complete list of a fund's portfolio holdings, view the most recent holdings listing, semiannual report, or annual report on Fidelity's web site at http://www.fidelity.com, http://www.institutional.fidelity.com, or http://www.401k.com, as applicable.
NOT FDIC INSURED •MAY LOSE VALUE •NO BANK GUARANTEE
Neither the Fund nor Fidelity Distributors Corporation is a bank.
| Top Bond Issuers (% of Fund's net assets) |
(with maturities greater than one year) |
| CCO Holdings LLC/CCO Holdings Capital Corp. | 2.9 | |
| TransDigm, Inc. | 2.8 | |
| Citigroup, Inc. | 2.2 | |
| JPMorgan Chase & Co. | 1.7 | |
| Tenet Healthcare Corp. | 1.6 | |
| Caesars Entertainment, Inc. | 1.6 | |
| Bank of America Corp. | 1.4 | |
| Altice France SA | 1.4 | |
| Ally Financial, Inc. | 1.2 | |
| Royal Caribbean Cruises Ltd. | 1.2 | |
| | 18.0 | |
| |
| Market Sectors (% of Fund's net assets) |
| |
| Energy | 12.3 | |
| Banks & Thrifts | 10.2 | |
| Technology | 8.5 | |
| Telecommunications | 5.4 | |
| Healthcare | 5.1 | |
| |
Quality Diversification (% of Fund's net assets) |
|
| |
| We have used ratings from Moody's Investors Service, Inc. Where Moody's® ratings are not available, we have used S&P® ratings. All ratings are as of the date indicated and do not reflect subsequent changes. |
Asset Allocation (% of Fund's net assets) |
|
|
Showing Percentage of Net Assets
| Corporate Bonds - 65.8% |
| | | Principal Amount (a) (000s) | Value ($) (000s) |
| Convertible Bonds - 0.9% | | | |
| Diversified Financial Services - 0.2% | | | |
| New Cotai LLC 5% 2/24/27 (b) | | 1,745 | 4,074 |
| Energy - 0.7% | | | |
| Mesquite Energy, Inc. 15% 7/15/23 (b)(c) | | 711 | 4,779 |
| Mesquite Energy, Inc. 15% 7/15/23 (b)(c) | | 1,228 | 8,252 |
| | | | 13,031 |
TOTAL CONVERTIBLE BONDS | | | 17,105 |
| Nonconvertible Bonds - 64.9% | | | |
| Aerospace - 3.6% | | | |
| ATI, Inc.: | | | |
| 4.875% 10/1/29 | | 845 | 779 |
| 5.125% 10/1/31 | | 750 | 675 |
| Bombardier, Inc.: | | | |
| 6% 2/15/28 (d) | | 830 | 787 |
| 7.125% 6/15/26 (d) | | 1,625 | 1,620 |
| 7.875% 4/15/27 (d) | | 3,970 | 3,961 |
| Kaiser Aluminum Corp. 4.625% 3/1/28 (d) | | 1,575 | 1,391 |
| Moog, Inc. 4.25% 12/15/27 (d) | | 480 | 451 |
| Rolls-Royce PLC 5.75% 10/15/27 (d) | | 1,440 | 1,437 |
| Spirit Aerosystems, Inc. 7.5% 4/15/25 (d) | | 1,414 | 1,405 |
| TransDigm UK Holdings PLC 6.875% 5/15/26 | | 1,820 | 1,831 |
| TransDigm, Inc.: | | | |
| 4.625% 1/15/29 | | 4,860 | 4,398 |
| 4.875% 5/1/29 | | 15,000 | 13,595 |
| 5.5% 11/15/27 | | 14,675 | 14,088 |
| 6.25% 3/15/26 (d) | | 6,870 | 6,902 |
| 6.75% 8/15/28 (d) | | 4,830 | 4,905 |
| 7.5% 3/15/27 | | 6,780 | 6,814 |
| Triumph Group, Inc. 9% 3/15/28 (d) | | 1,435 | 1,455 |
| | | | 66,494 |
| Air Transportation - 1.6% | | | |
| Air Canada 3.875% 8/15/26 (d) | | 1,240 | 1,148 |
| Allegiant Travel Co. 7.25% 8/15/27 (d) | | 1,320 | 1,304 |
| American Airlines, Inc. 7.25% 2/15/28 (d) | | 1,425 | 1,386 |
| Delta Air Lines, Inc. 7% 5/1/25 (d) | | 369 | 381 |
| Delta Air Lines, Inc. / SkyMiles IP Ltd.: | | | |
| 4.5% 10/20/25 (d) | | 5,379 | 5,275 |
| 4.75% 10/20/28 (d) | | 5,330 | 5,167 |
| Hawaiian Brand Intellectual Property Ltd. / HawaiianMiles Loyalty Ltd. 5.75% 1/20/26 (d) | | 3,145 | 2,930 |
| Mileage Plus Holdings LLC 6.5% 6/20/27 (d) | | 3,859 | 3,853 |
| Rand Parent LLC 8.5% 2/15/30 (d) | | 950 | 861 |
| Spirit Loyalty Cayman Ltd. / Spirit IP Cayman Ltd.: | | | |
| 8% 9/20/25 (d) | | 1,044 | 1,054 |
| 8% 9/20/25 (d) | | 470 | 475 |
| United Airlines, Inc.: | | | |
| 4.375% 4/15/26 (d) | | 3,965 | 3,787 |
| 4.625% 4/15/29 (d) | | 3,180 | 2,878 |
| | | | 30,499 |
| Automotive & Auto Parts - 1.8% | | | |
| Adient Global Holdings Ltd. 7% 4/15/28 (d) | | 960 | 984 |
| Allison Transmission, Inc. 5.875% 6/1/29 (d) | | 1,265 | 1,246 |
| Arko Corp. 5.125% 11/15/29 (d) | | 1,290 | 1,045 |
| Clarios Global LP / Clarios U.S. Finance Co. 6.75% 5/15/28 (d)(e) | | 960 | 964 |
| Dana, Inc.: | | | |
| 4.25% 9/1/30 | | 1,185 | 960 |
| 4.5% 2/15/32 | | 1,305 | 1,044 |
| Ford Motor Co. 3.25% 2/12/32 | | 3,965 | 3,065 |
| Ford Motor Credit Co. LLC: | | | |
| 3.375% 11/13/25 | | 2,500 | 2,322 |
| 4% 11/13/30 | | 5,460 | 4,682 |
| 5.113% 5/3/29 | | 1,330 | 1,239 |
| 6.8% 5/12/28 | | 4,500 | 4,504 |
| 7.35% 11/4/27 | | 3,800 | 3,908 |
| McLaren Finance PLC 7.5% 8/1/26 (d) | | 1,130 | 922 |
| Nesco Holdings II, Inc. 5.5% 4/15/29 (d) | | 1,850 | 1,672 |
| PECF USS Intermediate Holding III Corp. 8% 11/15/29 (d) | | 785 | 512 |
| Rivian Holdco & Rivian LLC & Rivian Automotive LLC 6 month U.S. LIBOR + 5.620% 10.9311% 10/15/26 (d)(f)(g) | | 4,255 | 4,187 |
| | | | 33,256 |
| Banks & Thrifts - 1.4% | | | |
| Ally Financial, Inc.: | | | |
| 8% 11/1/31 | | 3,105 | 3,285 |
| 8% 11/1/31 | | 16,957 | 17,887 |
| CQP Holdco LP / BIP-V Chinook Holdco LLC 5.5% 6/15/31 (d) | | 4,245 | 3,951 |
| Jane Street Group LLC/JSG Finance, Inc. 4.5% 11/15/29 (d) | | 1,240 | 1,110 |
| | | | 26,233 |
| Broadcasting - 1.2% | | | |
| Clear Channel Outdoor Holdings, Inc. 7.5% 6/1/29 (d) | | 1,615 | 1,195 |
| Diamond Sports Group LLC/Diamond Sports Finance Co. 5.375% 8/15/26 (d)(h) | | 6,155 | 415 |
| DISH Network Corp. 11.75% 11/15/27 (d) | | 4,730 | 4,468 |
| Gray Escrow II, Inc. 5.375% 11/15/31 (d) | | 2,810 | 1,801 |
| Lions Gate Capital Holdings LLC 5.5% 4/15/29 (d) | | 1,145 | 834 |
| Nexstar Media, Inc.: | | | |
| 4.75% 11/1/28 (d) | | 2,150 | 1,890 |
| 5.625% 7/15/27 (d) | | 1,975 | 1,855 |
| Scripps Escrow II, Inc. 3.875% 1/15/29 (d) | | 360 | 280 |
| Sirius XM Radio, Inc.: | | | |
| 3.875% 9/1/31 (d) | | 1,655 | 1,251 |
| 4% 7/15/28 (d) | | 1,695 | 1,431 |
| 5% 8/1/27 (d) | | 1,575 | 1,449 |
| Townsquare Media, Inc. 6.875% 2/1/26 (d) | | 725 | 676 |
| Univision Communications, Inc.: | | | |
| 4.5% 5/1/29 (d) | | 1,610 | 1,388 |
| 7.375% 6/30/30 (d) | | 2,850 | 2,735 |
| | | | 21,668 |
| Building Materials - 0.4% | | | |
| Advanced Drain Systems, Inc.: | | | |
| 5% 9/30/27 (d) | | 355 | 339 |
| 6.375% 6/15/30 (d) | | 890 | 880 |
| Brundage-Bone Concrete Pumping Holdings, Inc. 6% 2/1/26 (d) | | 835 | 785 |
| CP Atlas Buyer, Inc. 7% 12/1/28 (d) | | 710 | 534 |
| MIWD Holdco II LLC / MIWD Finance Corp. 5.5% 2/1/30 (d) | | 590 | 496 |
| Oscar Acquisition Co. LLC / Oscar Finance, Inc. 9.5% 4/15/30 (d) | | 1,345 | 1,177 |
| SRS Distribution, Inc.: | | | |
| 4.625% 7/1/28 (d) | | 1,540 | 1,356 |
| 6.125% 7/1/29 (d) | | 650 | 536 |
| Summit Materials LLC/Summit Materials Finance Corp. 5.25% 1/15/29 (d) | | 1,445 | 1,373 |
| | | | 7,476 |
| Cable/Satellite TV - 4.6% | | | |
| Block Communications, Inc. 4.875% 3/1/28 (d) | | 1,090 | 938 |
| CCO Holdings LLC/CCO Holdings Capital Corp.: | | | |
| 4.25% 2/1/31 (d) | | 2,275 | 1,863 |
| 4.5% 5/1/32 | | 21,015 | 16,824 |
| 4.75% 3/1/30 (d) | | 8,310 | 7,150 |
| 4.75% 2/1/32 (d) | | 3,745 | 3,099 |
| 5% 2/1/28 (d) | | 3,440 | 3,181 |
| 5.125% 5/1/27 (d) | | 16,615 | 15,677 |
| 6.375% 9/1/29 (d) | | 1,765 | 1,677 |
| 7.375% 3/1/31 (d) | | 4,660 | 4,567 |
| CSC Holdings LLC: | | | |
| 4.5% 11/15/31 (d) | | 4,015 | 2,813 |
| 5.375% 2/1/28 (d) | | 5,535 | 4,540 |
| 5.5% 4/15/27 (d) | | 9,040 | 7,729 |
| 6.5% 2/1/29 (d) | | 3,900 | 3,256 |
| 11.25% 5/15/28 (d) | | 960 | 957 |
| DISH DBS Corp. 5.75% 12/1/28 (d) | | 2,170 | 1,543 |
| Dolya Holdco 18 DAC 5% 7/15/28 (d) | | 900 | 807 |
| Radiate Holdco LLC/Radiate Financial Service Ltd. 4.5% 9/15/26 (d) | | 2,535 | 1,973 |
| VZ Secured Financing BV 5% 1/15/32 (d) | | 3,855 | 3,218 |
| Ziggo Bond Co. BV 5.125% 2/28/30 (d) | | 835 | 679 |
| Ziggo BV 4.875% 1/15/30 (d) | | 3,795 | 3,264 |
| | | | 85,755 |
| Capital Goods - 0.2% | | | |
| ATS Corp. 4.125% 12/15/28 (d) | | 1,015 | 909 |
| Chart Industries, Inc. 7.5% 1/1/30 (d) | | 2,500 | 2,575 |
| | | | 3,484 |
| Chemicals - 1.7% | | | |
| Compass Minerals International, Inc. 6.75% 12/1/27 (d) | | 3,850 | 3,692 |
| Gpd Companies, Inc. 10.125% 4/1/26 (d) | | 370 | 338 |
| Ingevity Corp. 3.875% 11/1/28 (d) | | 1,515 | 1,329 |
| Kronos Acquisition Holdings, Inc. / KIK Custom Products, Inc. 5% 12/31/26 (d) | | 495 | 458 |
| LSB Industries, Inc. 6.25% 10/15/28 (d) | | 3,360 | 2,957 |
| Olin Corp. 5% 2/1/30 | | 1,555 | 1,452 |
| Olympus Water U.S. Holding Corp.: | | | |
| 4.25% 10/1/28 (d) | | 1,695 | 1,446 |
| 7.125% 10/1/27 (d) | | 880 | 839 |
| SCIH Salt Holdings, Inc. 4.875% 5/1/28 (d) | | 1,035 | 932 |
| SCIL IV LLC / SCIL U.S.A. Holdings LLC 5.375% 11/1/26 (d) | | 1,985 | 1,828 |
| The Chemours Co. LLC: | | | |
| 4.625% 11/15/29 (d) | | 480 | 395 |
| 5.375% 5/15/27 | | 4,500 | 4,182 |
| 5.75% 11/15/28 (d) | | 2,355 | 2,093 |
| Tronox, Inc. 4.625% 3/15/29 (d) | | 1,705 | 1,415 |
| W.R. Grace Holding LLC: | | | |
| 5.625% 8/15/29 (d) | | 9,055 | 7,811 |
| 7.375% 3/1/31 (d) | | 950 | 951 |
| | | | 32,118 |
| Consumer Products - 1.0% | | | |
| Angi Group LLC 3.875% 8/15/28 (d) | | 750 | 587 |
| Foundation Building Materials, Inc. 6% 3/1/29 (d) | | 735 | 587 |
| Gannett Holdings LLC 6% 11/1/26 (d) | | 1,230 | 1,039 |
| HFC Prestige Products, Inc./HFC Prestige International U.S. LLC 4.75% 1/15/29 (d) | | 1,240 | 1,164 |
| Millennium Escrow Corp. 6.625% 8/1/26 (d) | | 1,660 | 1,123 |
| PetSmart, Inc. / PetSmart Finance Corp.: | | | |
| 4.75% 2/15/28 (d) | | 1,280 | 1,210 |
| 7.75% 2/15/29 (d) | | 1,120 | 1,104 |
| Spectrum Brands Holdings, Inc. 3.875% 3/15/31 (d) | | 1,080 | 886 |
| Tempur Sealy International, Inc.: | | | |
| 3.875% 10/15/31 (d) | | 2,230 | 1,849 |
| 4% 4/15/29 (d) | | 2,545 | 2,226 |
| The Scotts Miracle-Gro Co. 4% 4/1/31 | | 1,530 | 1,236 |
| TKC Holdings, Inc. 6.875% 5/15/28 (d) | | 5,855 | 5,204 |
| | | | 18,215 |
| Containers - 0.8% | | | |
| BWAY Holding Co. 7.875% 8/15/26 (d) | | 1,895 | 1,922 |
| Crown Americas LLC/Crown Americas Capital Corp. IV 4.75% 2/1/26 | | 4,780 | 4,686 |
| Crown Americas LLC/Crown Americas Capital Corp. V 4.25% 9/30/26 | | 1,210 | 1,158 |
| Graham Packaging Co., Inc. 7.125% 8/15/28 (d) | | 825 | 718 |
| Graphic Packaging International, Inc. 3.75% 2/1/30 (d) | | 1,125 | 1,003 |
| Intelligent Packaging Ltd. Finco, Inc. 6% 9/15/28 (d) | | 570 | 474 |
| LABL, Inc. 5.875% 11/1/28 (d) | | 2,095 | 1,933 |
| Sealed Air Corp./Sealed Air Cor 6.125% 2/1/28 (d) | | 950 | 964 |
| Trident Holdings, Inc. 12.75% 12/31/28 (d) | | 950 | 973 |
| Trivium Packaging Finance BV 5.5% 8/15/26 (d) | | 1,075 | 1,044 |
| | | | 14,875 |
| Diversified Financial Services - 2.4% | | | |
| Broadstreet Partners, Inc. 5.875% 4/15/29 (d) | | 2,115 | 1,835 |
| Cargo Aircraft Management, Inc. 4.75% 2/1/28 (d) | | 965 | 861 |
| Coinbase Global, Inc.: | | | |
| 3.375% 10/1/28 (d) | | 1,230 | 743 |
| 3.625% 10/1/31 (d) | | 1,270 | 710 |
| Compass Group Diversified Holdings LLC: | | | |
| 5% 1/15/32 (d) | | 870 | 706 |
| 5.25% 4/15/29 (d) | | 2,270 | 2,043 |
| Hightower Holding LLC 6.75% 4/15/29 (d) | | 785 | 681 |
| Icahn Enterprises LP/Icahn Enterprises Finance Corp.: | | | |
| 4.375% 2/1/29 | | 3,415 | 2,999 |
| 5.25% 5/15/27 | | 5,725 | 5,389 |
| 6.25% 5/15/26 | | 8,840 | 8,714 |
| LPL Holdings, Inc. 4% 3/15/29 (d) | | 2,520 | 2,263 |
| MSCI, Inc.: | | | |
| 3.25% 8/15/33 (d) | | 1,245 | 1,012 |
| 4% 11/15/29 (d) | | 900 | 811 |
| OneMain Finance Corp.: | | | |
| 4% 9/15/30 | | 720 | 544 |
| 5.375% 11/15/29 | | 9,325 | 7,845 |
| 6.625% 1/15/28 | | 1,185 | 1,099 |
| 6.875% 3/15/25 | | 775 | 758 |
| 7.125% 3/15/26 | | 4,710 | 4,590 |
| Shift4 Payments LLC / Shift4 Payments Finance Sub, Inc. 4.625% 11/1/26 (d) | | 510 | 480 |
| | | | 44,083 |
| Diversified Media - 0.1% | | | |
| Cmg Media Corp. 8.875% 12/15/27 (d) | | 1,910 | 1,481 |
| Energy - 8.7% | | | |
| Altus Midstream LP 5.875% 6/15/30 (d) | | 1,335 | 1,279 |
| Antero Midstream Partners LP/Antero Midstream Finance Corp.: | | | |
| 5.375% 6/15/29 (d) | | 1,205 | 1,128 |
| 5.75% 3/1/27 (d) | | 2,655 | 2,568 |
| 5.75% 1/15/28 (d) | | 1,705 | 1,652 |
| Atlantica Sustainable Infrastructure PLC 4.125% 6/15/28 (d) | | 1,045 | 954 |
| Callon Petroleum Co. 6.375% 7/1/26 | | 1,080 | 1,043 |
| Centennial Resource Production LLC 5.875% 7/1/29 (d) | | 1,165 | 1,098 |
| CGG SA 8.75% 4/1/27 (d) | | 1,530 | 1,316 |
| Cheniere Energy Partners LP: | | | |
| 3.25% 1/31/32 | | 1,270 | 1,058 |
| 4% 3/1/31 | | 7,980 | 7,138 |
| Chesapeake Energy Corp.: | | | |
| 4.875% 12/31/49 (b)(h) | | 2,950 | 0 |
| 5.75% 12/31/49 (b)(h) | | 1,890 | 0 |
| 5.875% 2/1/29 (d) | | 2,735 | 2,616 |
| 6.75% 4/15/29 (d) | | 1,150 | 1,138 |
| 7% 10/1/24 (b)(h) | | 840 | 0 |
| 8% 1/15/25 (b)(h) | | 480 | 0 |
| 8% 6/15/27 (b)(h) | | 300 | 0 |
| Citgo Holding, Inc. 9.25% 8/1/24 (d) | | 1,880 | 1,894 |
| Citgo Petroleum Corp.: | | | |
| 6.375% 6/15/26 (d) | | 1,105 | 1,076 |
| 7% 6/15/25 (d) | | 3,035 | 3,020 |
| CNX Midstream Partners LP 4.75% 4/15/30 (d) | | 900 | 754 |
| CNX Resources Corp.: | | | |
| 6% 1/15/29 (d) | | 690 | 638 |
| 7.375% 1/15/31 (d) | | 890 | 859 |
| Comstock Resources, Inc.: | | | |
| 5.875% 1/15/30 (d) | | 4,426 | 3,800 |
| 6.75% 3/1/29 (d) | | 7,095 | 6,424 |
| Crestwood Midstream Partners LP/Crestwood Midstream Finance Corp.: | | | |
| 5.625% 5/1/27 (d) | | 12,200 | 11,707 |
| 6% 2/1/29 (d) | | 8,530 | 8,040 |
| CrownRock LP/CrownRock Finance, Inc. 5% 5/1/29 (d) | | 665 | 628 |
| CVR Energy, Inc.: | | | |
| 5.25% 2/15/25 (d) | | 3,075 | 2,973 |
| 5.75% 2/15/28 (d) | | 3,170 | 2,833 |
| DCP Midstream Operating LP: | | | |
| 5.85% 5/21/43 (d)(f) | | 5,780 | 5,777 |
| 8.125% 8/16/30 | | 130 | 147 |
| Delek Logistics Partners LP 7.125% 6/1/28 (d) | | 2,645 | 2,409 |
| DT Midstream, Inc.: | | | |
| 4.125% 6/15/29 (d) | | 1,215 | 1,077 |
| 4.375% 6/15/31 (d) | | 1,215 | 1,056 |
| Endeavor Energy Resources LP/EER Finance, Inc. 5.75% 1/30/28 (d) | | 1,365 | 1,358 |
| EnLink Midstream LLC: | | | |
| 5.375% 6/1/29 | | 650 | 628 |
| 6.5% 9/1/30 (d) | | 2,725 | 2,753 |
| Hess Midstream Partners LP: | | | |
| 4.25% 2/15/30 (d) | | 1,345 | 1,196 |
| 5.125% 6/15/28 (d) | | 1,570 | 1,491 |
| 5.5% 10/15/30 (d) | | 890 | 828 |
| 5.625% 2/15/26 (d) | | 2,690 | 2,648 |
| Hilcorp Energy I LP/Hilcorp Finance Co. 6.25% 11/1/28 (d) | | 310 | 297 |
| Holly Energy Partners LP/Holly Energy Finance Corp.: | | | |
| 5% 2/1/28 (d) | | 1,060 | 988 |
| 6.375% 4/15/27 (d) | | 890 | 877 |
| KLX Energy Services Holdings, Inc. 11.5% 11/1/25 (d) | | 2,300 | 2,197 |
| Magnolia Oil & Gas Operating LLC 6% 8/1/26 (d) | | 2,055 | 1,993 |
| MEG Energy Corp. 7.125% 2/1/27 (d) | | 1,580 | 1,619 |
| Mesquite Energy, Inc. 7.25% 12/31/49 (b)(d)(h) | | 6,264 | 0 |
| Nabors Industries Ltd.: | | | |
| 7.25% 1/15/26 (d) | | 1,580 | 1,489 |
| 7.5% 1/15/28 (d) | | 1,360 | 1,238 |
| New Fortress Energy, Inc.: | | | |
| 6.5% 9/30/26 (d) | | 3,115 | 2,868 |
| 6.75% 9/15/25 (d) | | 3,630 | 3,457 |
| NGL Energy Operating LLC/NGL Energy Finance Corp. 7.5% 2/1/26 (d) | | 1,410 | 1,352 |
| Noble Finance II LLC 8% 4/15/30 (d) | | 960 | 983 |
| Occidental Petroleum Corp.: | | | |
| 3.5% 8/15/29 | | 1,870 | 1,697 |
| 5.875% 9/1/25 | | 3,000 | 3,032 |
| 6.2% 3/15/40 | | 800 | 821 |
| 6.375% 9/1/28 | | 2,410 | 2,514 |
| 6.45% 9/15/36 | | 2,650 | 2,812 |
| 6.625% 9/1/30 | | 2,995 | 3,197 |
| 7.2% 3/15/29 | | 545 | 576 |
| 7.5% 5/1/31 | | 155 | 173 |
| 8.875% 7/15/30 | | 1,595 | 1,874 |
| PBF Holding Co. LLC/PBF Finance Corp.: | | | |
| 6% 2/15/28 | | 3,845 | 3,537 |
| 7.25% 6/15/25 | | 2,125 | 2,117 |
| SM Energy Co.: | | | |
| 5.625% 6/1/25 | | 2,480 | 2,423 |
| 6.625% 1/15/27 | | 850 | 820 |
| 6.75% 9/15/26 | | 845 | 832 |
| Southwestern Energy Co. 5.375% 3/15/30 | | 1,665 | 1,550 |
| Suburban Propane Partners LP/Suburban Energy Finance Corp. 5% 6/1/31 (d) | | 1,610 | 1,410 |
| Summit Midstream Holdings LLC 8.5% (d)(i) | | 1,290 | 1,238 |
| Sunoco LP/Sunoco Finance Corp.: | | | |
| 4.5% 5/15/29 | | 1,320 | 1,189 |
| 4.5% 4/30/30 | | 1,710 | 1,526 |
| 6% 4/15/27 | | 4,740 | 4,714 |
| Tallgrass Energy Partners LP / Tallgrass Energy Finance Corp.: | | | |
| 5.5% 1/15/28 (d) | | 95 | 88 |
| 6% 3/1/27 (d) | | 950 | 917 |
| 6% 9/1/31 (d) | | 1,620 | 1,434 |
| 7.5% 10/1/25 (d) | | 1,120 | 1,129 |
| Targa Resources Partners LP/Targa Resources Partners Finance Corp. 4.875% 2/1/31 | | 1,405 | 1,324 |
| Teine Energy Ltd. 6.875% 4/15/29 (d) | | 1,145 | 1,046 |
| Transocean Titan Finance Ltd. 8.375% 2/1/28 (d) | | 1,977 | 2,015 |
| Transocean, Inc. 8.75% 2/15/30 (d) | | 4,710 | 4,752 |
| Venture Global Calcasieu Pass LLC: | | | |
| 3.875% 8/15/29 (d) | | 1,035 | 930 |
| 4.125% 8/15/31 (d) | | 1,035 | 917 |
| | | | 160,964 |
| Environmental - 0.8% | | | |
| Clean Harbors, Inc. 6.375% 2/1/31 (d) | | 790 | 806 |
| Covanta Holding Corp.: | | | |
| 4.875% 12/1/29 (d) | | 2,885 | 2,568 |
| 5% 9/1/30 | | 1,495 | 1,322 |
| Darling Ingredients, Inc.: | | | |
| 5.25% 4/15/27 (d) | | 2,655 | 2,602 |
| 6% 6/15/30 (d) | | 2,040 | 2,018 |
| GFL Environmental, Inc.: | | | |
| 4% 8/1/28 (d) | | 1,275 | 1,164 |
| 4.75% 6/15/29 (d) | | 1,625 | 1,512 |
| Madison IAQ LLC: | | | |
| 4.125% 6/30/28 (d) | | 1,535 | 1,350 |
| 5.875% 6/30/29 (d) | | 1,225 | 959 |
| | | | 14,301 |
| Food & Drug Retail - 1.1% | | | |
| Albertsons Companies LLC/Safeway, Inc./New Albertson's, Inc./Albertson's LLC: | | | |
| 3.5% 3/15/29 (d) | | 4,630 | 4,102 |
| 4.625% 1/15/27 (d) | | 4,225 | 4,084 |
| 4.875% 2/15/30 (d) | | 6,100 | 5,688 |
| BellRing Brands, Inc. 7% 3/15/30 (d) | | 2,425 | 2,484 |
| Murphy Oil U.S.A., Inc. 3.75% 2/15/31 (d) | | 675 | 577 |
| Parkland Corp.: | | | |
| 4.5% 10/1/29 (d) | | 1,145 | 1,003 |
| 4.625% 5/1/30 (d) | | 1,735 | 1,510 |
| SEG Holding LLC/SEG Finance Corp. 5.625% 10/15/28 (d) | | 1,470 | 1,393 |
| | | | 20,841 |
| Food/Beverage/Tobacco - 1.4% | | | |
| C&S Group Enterprises LLC 5% 12/15/28 (d) | | 1,110 | 876 |
| Chobani LLC/Finance Corp., Inc. 4.625% 11/15/28 (d) | | 855 | 785 |
| KeHE Distributors LLC / KeHE Finance Corp. 8.625% 10/15/26 (d) | | 1,185 | 1,185 |
| Lamb Weston Holdings, Inc.: | | | |
| 4.125% 1/31/30 (d) | | 1,720 | 1,575 |
| 4.375% 1/31/32 (d) | | 860 | 785 |
| Performance Food Group, Inc.: | | | |
| 4.25% 8/1/29 (d) | | 1,160 | 1,056 |
| 5.5% 10/15/27 (d) | | 1,353 | 1,326 |
| Pilgrim's Pride Corp.: | | | |
| 4.25% 4/15/31 | | 2,740 | 2,383 |
| 5.875% 9/30/27 (d) | | 1,110 | 1,104 |
| Post Holdings, Inc.: | | | |
| 4.5% 9/15/31 (d) | | 6,170 | 5,399 |
| 4.625% 4/15/30 (d) | | 2,050 | 1,852 |
| 5.5% 12/15/29 (d) | | 865 | 823 |
| 5.625% 1/15/28 (d) | | 3,640 | 3,557 |
| Simmons Foods, Inc. 4.625% 3/1/29 (d) | | 1,070 | 884 |
| TreeHouse Foods, Inc. 4% 9/1/28 | | 500 | 443 |
| Triton Water Holdings, Inc. 6.25% 4/1/29 (d) | | 810 | 680 |
| U.S. Foods, Inc. 4.625% 6/1/30 (d) | | 1,070 | 979 |
| United Natural Foods, Inc. 6.75% 10/15/28 (d) | | 1,055 | 1,001 |
| | | | 26,693 |
| Gaming - 3.0% | | | |
| Affinity Gaming LLC 6.875% 12/15/27 (d) | | 550 | 495 |
| Boyd Gaming Corp. 4.75% 6/15/31 (d) | | 4,225 | 3,868 |
| Caesars Entertainment, Inc.: | | | |
| 4.625% 10/15/29 (d) | | 2,530 | 2,220 |
| 6.25% 7/1/25 (d) | | 5,705 | 5,712 |
| 7% 2/15/30 (d) | | 2,845 | 2,870 |
| 8.125% 7/1/27 (d) | | 11,605 | 11,840 |
| Caesars Resort Collection LLC 5.75% 7/1/25 (d) | | 1,900 | 1,916 |
| CDI Escrow Issuer, Inc. 5.75% 4/1/30 (d) | | 890 | 858 |
| Churchill Downs, Inc. 6.75% 5/1/31 (d) | | 1,445 | 1,454 |
| Fertitta Entertainment LLC / Fertitta Entertainment Finance Co., Inc.: | | | |
| 4.625% 1/15/29 (d) | | 4,710 | 4,124 |
| 6.75% 1/15/30 (d) | | 4,950 | 4,010 |
| Jacobs Entertainment, Inc. 6.75% 2/15/29 (d) | | 1,250 | 1,088 |
| Melco Resorts Finance Ltd. 5.75% 7/21/28 (d) | | 600 | 521 |
| MGM Resorts International 4.75% 10/15/28 | | 1,470 | 1,374 |
| Premier Entertainment Sub LLC: | | | |
| 5.625% 9/1/29 (d) | | 4,840 | 3,510 |
| 5.875% 9/1/31 (d) | | 1,970 | 1,394 |
| Station Casinos LLC 4.625% 12/1/31 (d) | | 1,300 | 1,113 |
| Studio City Finance Ltd. 5% 1/15/29 (d) | | 725 | 568 |
| VICI Properties LP / VICI Note Co.: | | | |
| 3.875% 2/15/29 (d) | | 1,445 | 1,299 |
| 4.25% 12/1/26 (d) | | 3,015 | 2,873 |
| 4.625% 12/1/29 (d) | | 1,720 | 1,598 |
| | | | 54,705 |
| Healthcare - 4.2% | | | |
| 180 Medical, Inc. 3.875% 10/15/29 (d) | | 910 | 810 |
| Avantor Funding, Inc. 3.875% 11/1/29 (d) | | 860 | 758 |
| Cano Health, Inc. 6.25% 10/1/28 (d) | | 565 | 302 |
| Charles River Laboratories International, Inc.: | | | |
| 3.75% 3/15/29 (d) | | 1,365 | 1,198 |
| 4% 3/15/31 (d) | | 1,545 | 1,346 |
| 4.25% 5/1/28 (d) | | 485 | 442 |
| Community Health Systems, Inc.: | | | |
| 4.75% 2/15/31 (d) | | 2,860 | 2,307 |
| 5.25% 5/15/30 (d) | | 2,625 | 2,188 |
| 5.625% 3/15/27 (d) | | 945 | 872 |
| 6% 1/15/29 (d) | | 1,085 | 962 |
| 6.125% 4/1/30 (d) | | 2,910 | 2,071 |
| 8% 3/15/26 (d) | | 11,505 | 11,401 |
| DaVita HealthCare Partners, Inc.: | | | |
| 3.75% 2/15/31 (d) | | 535 | 431 |
| 4.625% 6/1/30 (d) | | 4,545 | 3,959 |
| Encompass Health Corp. 5.75% 9/15/25 | | 400 | 399 |
| Grifols Escrow Issuer SA 4.75% 10/15/28 (d) | | 850 | 678 |
| HealthEquity, Inc. 4.5% 10/1/29 (d) | | 895 | 800 |
| Hologic, Inc. 4.625% 2/1/28 (d) | | 645 | 627 |
| IQVIA, Inc. 5% 10/15/26 (d) | | 1,125 | 1,105 |
| Jazz Securities DAC 4.375% 1/15/29 (d) | | 1,635 | 1,503 |
| ModivCare Escrow Issuer, Inc. 5% 10/1/29 (d) | | 955 | 770 |
| Modivcare, Inc. 5.875% 11/15/25 (d) | | 1,105 | 1,056 |
| Molina Healthcare, Inc.: | | | |
| 3.875% 11/15/30 (d) | | 1,360 | 1,200 |
| 3.875% 5/15/32 (d) | | 1,730 | 1,483 |
| Option Care Health, Inc. 4.375% 10/31/29 (d) | | 950 | 854 |
| Organon & Co. / Organon Foreign Debt Co-Issuer BV: | | | |
| 4.125% 4/30/28 (d) | | 3,525 | 3,243 |
| 5.125% 4/30/31 (d) | | 2,410 | 2,147 |
| Owens & Minor, Inc. 4.5% 3/31/29 (d) | | 1,065 | 854 |
| Radiology Partners, Inc. 9.25% 2/1/28 (d) | | 2,350 | 1,040 |
| RP Escrow Issuer LLC 5.25% 12/15/25 (d) | | 1,340 | 940 |
| Tenet Healthcare Corp.: | | | |
| 4.25% 6/1/29 | | 8,360 | 7,670 |
| 4.375% 1/15/30 | | 6,245 | 5,738 |
| 6.125% 10/1/28 | | 1,470 | 1,426 |
| 6.125% 6/15/30 (d) | | 3,610 | 3,571 |
| 6.25% 2/1/27 | | 9,945 | 9,896 |
| Teva Pharmaceutical Finance Netherlands III BV: | | | |
| 4.75% 5/9/27 | | 865 | 810 |
| 5.125% 5/9/29 | | 865 | 805 |
| 7.875% 9/15/29 | | 960 | 1,008 |
| | | | 78,670 |
| Homebuilders/Real Estate - 1.8% | | | |
| Arcosa, Inc. 4.375% 4/15/29 (d) | | 1,075 | 979 |
| Ashton Woods U.S.A. LLC/Ashton Woods Finance Co. 4.625% 4/1/30 (d) | | 1,240 | 1,028 |
| Brookfield Residential Properties, Inc./Brookfield Residential U.S. Corp. 4.875% 2/15/30 (d) | | 1,080 | 842 |
| Century Communities, Inc. 3.875% 8/15/29 (d) | | 1,245 | 1,089 |
| MPT Operating Partnership LP/MPT Finance Corp.: | | | |
| 3.5% 3/15/31 | | 1,445 | 990 |
| 5% 10/15/27 | | 9,710 | 8,092 |
| Realogy Group LLC/Realogy Co-Issuer Corp. 5.75% 1/15/29 (d) | | 2,465 | 1,827 |
| Shea Homes Ltd. Partnership/Corp. 4.75% 4/1/29 | | 1,070 | 953 |
| Taylor Morrison Communities, Inc./Monarch Communities, Inc.: | | | |
| 5.125% 8/1/30 (d) | | 1,416 | 1,328 |
| 5.75% 1/15/28 (d) | | 2,100 | 2,081 |
| 5.875% 6/15/27 (d) | | 1,490 | 1,486 |
| TopBuild Corp. 3.625% 3/15/29 (d) | | 755 | 651 |
| TRI Pointe Homes, Inc. 5.7% 6/15/28 | | 1,965 | 1,928 |
| Uniti Group LP / Uniti Group Finance, Inc.: | | | |
| 4.75% 4/15/28 (d) | | 4,258 | 3,386 |
| 6.5% 2/15/29 (d) | | 5,265 | 3,178 |
| 10.5% 2/15/28 (d) | | 3,800 | 3,636 |
| Weekley Homes LLC/Weekley Finance Corp. 4.875% 9/15/28 (d) | | 675 | 586 |
| | | | 34,060 |
| Hotels - 0.3% | | | |
| Carnival Holdings (Bermuda) Ltd. 10.375% 5/1/28 (d) | | 2,825 | 3,037 |
| Hilton Domestic Operating Co., Inc.: | | | |
| 3.75% 5/1/29 (d) | | 725 | 653 |
| 4% 5/1/31 (d) | | 1,085 | 960 |
| 4.875% 1/15/30 | | 1,180 | 1,120 |
| | | | 5,770 |
| Insurance - 1.1% | | | |
| Acrisure LLC / Acrisure Finance, Inc.: | | | |
| 6% 8/1/29 (d) | | 1,240 | 1,026 |
| 7% 11/15/25 (d) | | 5,750 | 5,491 |
| Alliant Holdings Intermediate LLC: | | | |
| 4.25% 10/15/27 (d) | | 1,470 | 1,346 |
| 5.875% 11/1/29 (d) | | 1,290 | 1,113 |
| 6.75% 10/15/27 (d) | | 2,525 | 2,357 |
| 6.75% 4/15/28 (d) | | 1,900 | 1,898 |
| AmWINS Group, Inc. 4.875% 6/30/29 (d) | | 1,205 | 1,093 |
| AssuredPartners, Inc. 5.625% 1/15/29 (d) | | 845 | 732 |
| HUB International Ltd.: | | | |
| 5.625% 12/1/29 (d) | | 1,895 | 1,687 |
| 7% 5/1/26 (d) | | 1,750 | 1,742 |
| MGIC Investment Corp. 5.25% 8/15/28 | | 1,040 | 994 |
| | | | 19,479 |
| Leisure - 2.2% | | | |
| Boyne U.S.A., Inc. 4.75% 5/15/29 (d) | | 840 | 761 |
| Carnival Corp.: | | | |
| 4% 8/1/28 (d) | | 5,050 | 4,378 |
| 7.625% 3/1/26 (d) | | 2,775 | 2,531 |
| 9.875% 8/1/27 (d) | | 2,250 | 2,307 |
| NCL Corp. Ltd. 5.875% 2/15/27 (d) | | 1,770 | 1,669 |
| Royal Caribbean Cruises Ltd.: | | | |
| 5.375% 7/15/27 (d) | | 1,295 | 1,150 |
| 7.25% 1/15/30 (d) | | 950 | 953 |
| 8.25% 1/15/29 (d) | | 6,455 | 6,797 |
| 9.25% 1/15/29 (d) | | 5,340 | 5,698 |
| 11.5% 6/1/25 (d) | | 4,411 | 4,676 |
| 11.625% 8/15/27 (d) | | 1,765 | 1,874 |
| SeaWorld Parks & Entertainment, Inc. 5.25% 8/15/29 (d) | | 1,665 | 1,499 |
| Vail Resorts, Inc. 6.25% 5/15/25 (d) | | 850 | 856 |
| Viking Cruises Ltd. 13% 5/15/25 (d) | | 1,265 | 1,331 |
| Viking Ocean Cruises Ship VII Ltd. 5.625% 2/15/29 (d) | | 625 | 528 |
| Voc Escrow Ltd. 5% 2/15/28 (d) | | 4,075 | 3,624 |
| | | | 40,632 |
| Metals/Mining - 1.6% | | | |
| Alcoa Nederland Holding BV 4.125% 3/31/29 (d) | | 1,980 | 1,798 |
| Alpha Natural Resources, Inc. 9.75% 12/31/99 (b)(h) | | 1,770 | 0 |
| Arconic Corp.: | | | |
| 6% 5/15/25 (d) | | 900 | 895 |
| 6.125% 2/15/28 (d) | | 2,475 | 2,443 |
| Cleveland-Cliffs, Inc.: | | | |
| 4.625% 3/1/29 (d) | | 3,200 | 2,899 |
| 4.875% 3/1/31 (d) | | 1,480 | 1,300 |
| 5.875% 6/1/27 | | 4,015 | 3,942 |
| 6.75% 4/15/30 (d) | | 2,000 | 1,944 |
| Eldorado Gold Corp. 6.25% 9/1/29 (d) | | 1,895 | 1,762 |
| ERO Copper Corp. 6.5% 2/15/30 (d) | | 1,320 | 1,172 |
| First Quantum Minerals Ltd.: | | | |
| 6.875% 3/1/26 (d) | | 2,600 | 2,542 |
| 7.5% 4/1/25 (d) | | 5,335 | 5,308 |
| FMG Resources Pty Ltd. 4.375% 4/1/31 (d) | | 1,145 | 995 |
| HudBay Minerals, Inc. 4.5% 4/1/26 (d) | | 905 | 843 |
| Mineral Resources Ltd.: | | | |
| 8% 11/1/27 (d) | | 895 | 911 |
| 8.5% 5/1/30 (d) | | 660 | 672 |
| | | | 29,426 |
| Paper - 0.8% | | | |
| Ardagh Metal Packaging Finance U.S.A. LLC/Ardagh Metal Packaging Finance PLC: | | | |
| 3.25% 9/1/28 (d) | | 760 | 665 |
| 4% 9/1/29 (d) | | 1,515 | 1,229 |
| 6% 6/15/27 (d) | | 890 | 885 |
| Cascades, Inc.: | | | |
| 5.125% 1/15/26 (d) | | 790 | 751 |
| 5.375% 1/15/28 (d) | | 790 | 750 |
| Clydesdale Acquisition Holdings, Inc.: | | | |
| 6.625% 4/15/29 (d) | | 1,060 | 1,040 |
| 8.75% 4/15/30 (d) | | 6,555 | 6,033 |
| Enviva Partners LP / Enviva Partners Finance Corp. 6.5% 1/15/26 (d) | | 1,575 | 1,343 |
| Glatfelter Corp. 4.75% 11/15/29 (d) | | 1,290 | 918 |
| Mercer International, Inc. 5.125% 2/1/29 | | 1,920 | 1,603 |
| | | | 15,217 |
| Publishing/Printing - 0.1% | | | |
| Clear Channel International BV 6.625% 8/1/25 (d) | | 2,185 | 2,162 |
| Restaurants - 0.8% | | | |
| 1011778 BC Unlimited Liability Co./New Red Finance, Inc.: | | | |
| 3.875% 1/15/28 (d) | | 1,630 | 1,529 |
| 4% 10/15/30 (d) | | 5,185 | 4,526 |
| 4.375% 1/15/28 (d) | | 5,490 | 5,132 |
| Bloomin Brands, Inc. / OSI Restaurant Partners LLC 5.125% 4/15/29 (d) | | 715 | 645 |
| Garden SpinCo Corp. 8.625% 7/20/30 (d) | | 775 | 833 |
| Papa John's International, Inc. 3.875% 9/15/29 (d) | | 765 | 661 |
| Yum! Brands, Inc. 4.625% 1/31/32 | | 1,530 | 1,429 |
| | | | 14,755 |
| Services - 2.9% | | | |
| Adtalem Global Education, Inc. 5.5% 3/1/28 (d) | | 1,335 | 1,268 |
| Allied Universal Holdco LLC / Allied Universal Finance Corp. 6% 6/1/29 (d) | | 1,015 | 796 |
| ASGN, Inc. 4.625% 5/15/28 (d) | | 1,350 | 1,248 |
| Atlas Luxco 4 SARL / Allied Universal Holdco LLC / Allied Universal Finance Corp.: | | | |
| 4.625% 6/1/28 (d) | | 3,249 | 2,822 |
| 4.625% 6/1/28 (d) | | 1,921 | 1,672 |
| Booz Allen Hamilton, Inc.: | | | |
| 3.875% 9/1/28 (d) | | 1,385 | 1,269 |
| 4% 7/1/29 (d) | | 805 | 730 |
| CoreCivic, Inc. 8.25% 4/15/26 | | 7,790 | 7,870 |
| Fair Isaac Corp. 4% 6/15/28 (d) | | 1,530 | 1,425 |
| Gartner, Inc.: | | | |
| 3.625% 6/15/29 (d) | | 1,160 | 1,027 |
| 3.75% 10/1/30 (d) | | 1,535 | 1,340 |
| GEMS MENASA Cayman Ltd. 7.125% 7/31/26 (d) | | 1,360 | 1,327 |
| H&E Equipment Services, Inc. 3.875% 12/15/28 (d) | | 2,415 | 2,093 |
| Hertz Corp.: | | | |
| 4.625% 12/1/26 (d) | | 740 | 666 |
| 5% 12/1/29 (d) | | 1,435 | 1,174 |
| 5.5% 10/15/24 (b)(d)(h) | | 1,505 | 34 |
| 6% 1/15/28 (b)(d)(h) | | 1,385 | 81 |
| 6.25% 12/31/49 (b)(h) | | 1,605 | 2 |
| 7.125% 8/1/26 (b)(d)(h) | | 1,430 | 114 |
| Iron Mountain, Inc.: | | | |
| 4.5% 2/15/31 (d) | | 2,975 | 2,587 |
| 4.875% 9/15/29 (d) | | 3,800 | 3,466 |
| Neptune BidCo U.S., Inc. 9.29% 4/15/29 (d) | | 5,670 | 5,337 |
| Service Corp. International 4% 5/15/31 | | 1,610 | 1,419 |
| Sotheby's 7.375% 10/15/27 (d) | | 640 | 600 |
| Sotheby's/Bidfair Holdings, Inc. 5.875% 6/1/29 (d) | | 2,410 | 1,984 |
| The GEO Group, Inc.: | | | |
| 9.5% 12/31/28 (d) | | 1,360 | 1,326 |
| 10.5% 6/30/28 | | 3,459 | 3,498 |
| TriNet Group, Inc. 3.5% 3/1/29 (d) | | 1,135 | 993 |
| Uber Technologies, Inc.: | | | |
| 4.5% 8/15/29 (d) | | 3,730 | 3,430 |
| 6.25% 1/15/28 (d) | | 1,225 | 1,236 |
| WASH Multifamily Acquisition, Inc. 5.75% 4/15/26 (d) | | 1,285 | 1,205 |
| | | | 54,039 |
| Steel - 0.2% | | | |
| Commercial Metals Co. 3.875% 2/15/31 | | 780 | 683 |
| Infrabuild Australia Pty Ltd. 12% 10/1/24 (d) | | 1,745 | 1,662 |
| Roller Bearing Co. of America, Inc. 4.375% 10/15/29 (d) | | 610 | 553 |
| | | | 2,898 |
| Super Retail - 1.2% | | | |
| Asbury Automotive Group, Inc.: | | | |
| 4.5% 3/1/28 | | 492 | 447 |
| 4.625% 11/15/29 (d) | | 6,520 | 5,803 |
| 4.75% 3/1/30 | | 489 | 434 |
| 5% 2/15/32 (d) | | 1,535 | 1,323 |
| Bath & Body Works, Inc.: | | | |
| 6.625% 10/1/30 (d) | | 4,210 | 4,041 |
| 6.75% 7/1/36 | | 1,340 | 1,193 |
| 7.5% 6/15/29 | | 1,135 | 1,155 |
| Carvana Co.: | | | |
| 4.875% 9/1/29 (d) | | 325 | 131 |
| 5.5% 4/15/27 (d) | | 2,380 | 1,024 |
| 5.875% 10/1/28 (d) | | 235 | 98 |
| EG Global Finance PLC 8.5% 10/30/25 (d) | | 2,595 | 2,461 |
| LBM Acquisition LLC 6.25% 1/15/29 (d) | | 1,920 | 1,529 |
| Macy's Retail Holdings LLC: | | | |
| 5.875% 3/15/30 (d) | | 920 | 817 |
| 6.125% 3/15/32 (d) | | 885 | 775 |
| Michaels Companies, Inc. 5.25% 5/1/28 (d) | | 1,865 | 1,536 |
| | | | 22,767 |
| Technology - 4.2% | | | |
| Acuris Finance U.S. 5% 5/1/28 (d) | | 6,410 | 5,085 |
| Alteryx, Inc. 8.75% 3/15/28 (d) | | 960 | 933 |
| Black Knight InfoServ LLC 3.625% 9/1/28 (d) | | 1,545 | 1,394 |
| Block, Inc. 3.5% 6/1/31 | | 1,615 | 1,316 |
| CA Magnum Holdings 5.375% 10/31/26 (d) | | 690 | 605 |
| Camelot Finance SA 4.5% 11/1/26 (d) | | 1,515 | 1,434 |
| CDW LLC/CDW Finance Corp. 4.25% 4/1/28 | | 2,320 | 2,158 |
| Central Parent, Inc./Central Merger Sub, Inc. 7.25% 6/15/29 (d) | | 1,345 | 1,332 |
| Clarivate Science Holdings Corp.: | | | |
| 3.875% 7/1/28 (d) | | 1,440 | 1,296 |
| 4.875% 7/1/29 (d) | | 1,360 | 1,225 |
| Cloud Software Group, Inc.: | | | |
| 6.5% 3/31/29 (d) | | 2,885 | 2,598 |
| 9% 9/30/29 (d) | | 1,445 | 1,242 |
| Coherent Corp. 5% 12/15/29 (d) | | 1,350 | 1,215 |
| Crowdstrike Holdings, Inc. 3% 2/15/29 | | 1,130 | 983 |
| Elastic NV 4.125% 7/15/29 (d) | | 2,630 | 2,275 |
| Go Daddy Operating Co. LLC / GD Finance Co., Inc.: | | | |
| 3.5% 3/1/29 (d) | | 6,860 | 5,943 |
| 5.25% 12/1/27 (d) | | 1,495 | 1,436 |
| ION Trading Technologies Ltd. 5.75% 5/15/28 (d) | | 1,605 | 1,343 |
| Iron Mountain Information Management Services, Inc. 5% 7/15/32 (d) | | 1,295 | 1,134 |
| MicroStrategy, Inc. 6.125% 6/15/28 (d) | | 4,490 | 4,058 |
| NCR Corp.: | | | |
| 5% 10/1/28 (d) | | 750 | 654 |
| 5.125% 4/15/29 (d) | | 3,710 | 3,209 |
| 5.25% 10/1/30 (d) | | 750 | 631 |
| onsemi 3.875% 9/1/28 (d) | | 5,500 | 4,950 |
| Open Text Corp. 6.9% 12/1/27 (d) | | 1,685 | 1,740 |
| Open Text Holdings, Inc.: | | | |
| 4.125% 2/15/30 (d) | | 790 | 675 |
| 4.125% 12/1/31 (d) | | 780 | 646 |
| PTC, Inc.: | | | |
| 3.625% 2/15/25 (d) | | 925 | 892 |
| 4% 2/15/28 (d) | | 915 | 851 |
| Rackspace Hosting, Inc. 5.375% 12/1/28 (d) | | 830 | 197 |
| Roblox Corp. 3.875% 5/1/30 (d) | | 3,295 | 2,782 |
| Sensata Technologies BV 4% 4/15/29 (d) | | 1,530 | 1,383 |
| Synaptics, Inc. 4% 6/15/29 (d) | | 900 | 761 |
| TTM Technologies, Inc. 4% 3/1/29 (d) | | 1,135 | 973 |
| Twilio, Inc.: | | | |
| 3.625% 3/15/29 | | 6,425 | 5,485 |
| 3.875% 3/15/31 | | 1,340 | 1,120 |
| Uber Technologies, Inc.: | | | |
| 7.5% 9/15/27 (d) | | 4,885 | 5,039 |
| 8% 11/1/26 (d) | | 7,110 | 7,290 |
| Unisys Corp. 6.875% 11/1/27 (d) | | 830 | 553 |
| | | | 78,836 |
| Telecommunications - 5.1% | | | |
| Altice Financing SA: | | | |
| 5% 1/15/28 (d) | | 1,580 | 1,279 |
| 5.75% 8/15/29 (d) | | 7,315 | 5,835 |
| Altice France SA: | | | |
| 5.125% 7/15/29 (d) | | 9,000 | 6,654 |
| 5.5% 1/15/28 (d) | | 3,740 | 2,944 |
| 5.5% 10/15/29 (d) | | 14,870 | 11,132 |
| 8.125% 2/1/27 (d) | | 3,925 | 3,505 |
| C&W Senior Financing Designated Activity Co. 6.875% 9/15/27 (d) | | 7,020 | 6,090 |
| Cablevision Lightpath LLC 3.875% 9/15/27 (d) | | 735 | 613 |
| Cogent Communications Group, Inc. 7% 6/15/27 (d) | | 885 | 876 |
| Frontier Communications Holdings LLC: | | | |
| 5% 5/1/28 (d) | | 2,830 | 2,485 |
| 5.875% 10/15/27 (d) | | 1,375 | 1,266 |
| 8.75% 5/15/30 (d) | | 890 | 880 |
| Intelsat Jackson Holdings SA 6.5% 3/15/30 (d) | | 3,610 | 3,331 |
| LCPR Senior Secured Financing DAC: | | | |
| 5.125% 7/15/29 (d) | | 1,895 | 1,623 |
| 6.75% 10/15/27 (d) | | 1,453 | 1,380 |
| Level 3 Financing, Inc.: | | | |
| 3.625% 1/15/29 (d) | | 8,140 | 4,552 |
| 3.75% 7/15/29 (d) | | 3,160 | 1,778 |
| Millicom International Cellular SA 4.5% 4/27/31 (d) | | 235 | 181 |
| Northwest Fiber LLC/Northwest Fiber Finance Sub, Inc.: | | | |
| 4.75% 4/30/27 (d) | | 850 | 737 |
| 6% 2/15/28 (d) | | 565 | 421 |
| Sable International Finance Ltd. 5.75% 9/7/27 (d) | | 4,935 | 4,583 |
| SBA Communications Corp.: | | | |
| 3.125% 2/1/29 | | 1,695 | 1,450 |
| 3.875% 2/15/27 | | 6,375 | 5,946 |
| Sprint Capital Corp. 8.75% 3/15/32 | | 5,625 | 6,874 |
| Sprint Corp. 7.625% 3/1/26 | | 2,190 | 2,319 |
| Uniti Group, Inc. 6% 1/15/30 (d) | | 2,125 | 1,254 |
| Virgin Media Finance PLC 5% 7/15/30 (d) | | 4,635 | 3,906 |
| VMED O2 UK Financing I PLC 4.75% 7/15/31 (d) | | 2,875 | 2,450 |
| Windstream Escrow LLC 7.75% 8/15/28 (d) | | 8,515 | 7,013 |
| Zayo Group Holdings, Inc. 4% 3/1/27 (d) | | 2,675 | 2,025 |
| | | | 95,382 |
| Textiles/Apparel - 0.3% | | | |
| Crocs, Inc.: | | | |
| 4.125% 8/15/31 (d) | | 825 | 697 |
| 4.25% 3/15/29 (d) | | 1,110 | 985 |
| Foot Locker, Inc. 4% 10/1/29 (d) | | 850 | 719 |
| Kontoor Brands, Inc. 4.125% 11/15/29 (d) | | 760 | 646 |
| Victoria's Secret & Co. 4.625% 7/15/29 (d) | | 3,425 | 2,770 |
| | | | 5,817 |
| Transportation Ex Air/Rail - 0.1% | | | |
| Seaspan Corp. 5.5% 8/1/29 (d) | | 1,240 | 992 |
| Utilities - 2.2% | | | |
| Clearway Energy Operating LLC: | | | |
| 3.75% 2/15/31 (d) | | 1,705 | 1,459 |
| 3.75% 1/15/32 (d) | | 850 | 713 |
| 4.75% 3/15/28 (d) | | 970 | 919 |
| NRG Energy, Inc.: | | | |
| 3.375% 2/15/29 (d) | | 665 | 563 |
| 3.625% 2/15/31 (d) | | 1,320 | 1,069 |
| 3.875% 2/15/32 (d) | | 1,905 | 1,536 |
| 5.75% 1/15/28 | | 2,765 | 2,696 |
| Pacific Gas & Electric Co.: | | | |
| 3.45% 7/1/25 | | 400 | 382 |
| 3.75% 7/1/28 | | 400 | 370 |
| 3.75% 8/15/42 | | 640 | 455 |
| 3.95% 12/1/47 | | 2,589 | 1,832 |
| 4% 12/1/46 | | 3,005 | 2,133 |
| PG&E Corp.: | | | |
| 5% 7/1/28 | | 10,140 | 9,541 |
| 5.25% 7/1/30 | | 1,150 | 1,060 |
| Pike Corp. 5.5% 9/1/28 (d) | | 4,495 | 4,079 |
| Vistra Operations Co. LLC: | | | |
| 4.375% 5/1/29 (d) | | 3,105 | 2,778 |
| 5% 7/31/27 (d) | | 3,565 | 3,388 |
| 5.5% 9/1/26 (d) | | 1,822 | 1,785 |
| 5.625% 2/15/27 (d) | | 4,435 | 4,325 |
| | | | 41,083 |
TOTAL NONCONVERTIBLE BONDS | | | 1,205,126 |
| TOTAL CORPORATE BONDS (Cost $1,331,669) | | | 1,222,231 |
| | | | |
| Common Stocks - 10.6% |
| | | Shares | Value ($) (000s) |
| Air Transportation - 0.0% | | | |
| Delta Air Lines, Inc. (j) | | 23,450 | 805 |
| Automotive & Auto Parts - 0.0% | | | |
| UC Holdings, Inc. (b)(j) | | 29,835 | 177 |
| Banks & Thrifts - 0.0% | | | |
| Mr. Cooper Group, Inc. (j) | | 1,504 | 70 |
| Broadcasting - 0.1% | | | |
| Nexstar Broadcasting Group, Inc. Class A | | 10,463 | 1,815 |
| Building Materials - 0.1% | | | |
| Builders FirstSource, Inc. (j) | | 14,100 | 1,336 |
| WESCO International, Inc. | | 1,467 | 211 |
TOTAL BUILDING MATERIALS | | | 1,547 |
| Capital Goods - 0.2% | | | |
| Regal Rexnord Corp. | | 22,600 | 2,942 |
| Chemicals - 0.4% | | | |
| CF Industries Holdings, Inc. | | 29,300 | 2,097 |
| Olin Corp. | | 33,100 | 1,834 |
| The Chemours Co. LLC | | 88,500 | 2,573 |
TOTAL CHEMICALS | | | 6,504 |
| Consumer Products - 0.3% | | | |
| Tapestry, Inc. | | 47,300 | 1,930 |
| Tempur Sealy International, Inc. | | 108,311 | 4,058 |
TOTAL CONSUMER PRODUCTS | | | 5,988 |
| Containers - 0.3% | | | |
| Berry Global Group, Inc. | | 20,600 | 1,191 |
| Graphic Packaging Holding Co. | | 159,900 | 3,943 |
| WestRock Co. | | 45,700 | 1,368 |
TOTAL CONTAINERS | | | 6,502 |
| Diversified Financial Services - 0.4% | | | |
| Apollo Global Management, Inc. | | 25,200 | 1,597 |
| MasterCard, Inc. Class A | | 5,700 | 2,166 |
| OneMain Holdings, Inc. | | 102,000 | 3,914 |
TOTAL DIVERSIFIED FINANCIAL SERVICES | | | 7,677 |
| Energy - 2.0% | | | |
| Antero Resources Corp. (j) | | 47,902 | 1,101 |
| California Resources Corp. | | 221,951 | 8,989 |
| California Resources Corp. warrants 10/27/24 (j) | | 8,300 | 79 |
| Canadian Natural Resources Ltd. | | 30,900 | 1,883 |
| Cheniere Energy, Inc. | | 35,600 | 5,447 |
| Chesapeake Energy Corp. | | 61,888 | 5,117 |
| Chesapeake Energy Corp. (c)(j) | | 3,530 | 292 |
| Diamond Offshore Drilling, Inc. (j) | | 16,382 | 188 |
| Diamondback Energy, Inc. | | 10,600 | 1,507 |
| EP Energy Corp. (b)(j) | | 147,125 | 859 |
| Forbes Energy Services Ltd. (b)(j) | | 65,062 | 0 |
| Halliburton Co. | | 33,000 | 1,081 |
| Jonah Energy Parent LLC (b)(j) | | 73,213 | 3,295 |
| Mesquite Energy, Inc. (b)(j) | | 90,382 | 5,678 |
| Noble Corp. PLC | | 1,410 | 54 |
| PureWest Energy (b)(j) | | 3,289 | 32 |
| PureWest Energy rights (b)(j) | | 1,983 | 0 |
| Superior Energy Services, Inc. Class A (b)(j) | | 17,671 | 1,201 |
| Tidewater, Inc. warrants 11/14/42 (j) | | 12,651 | 627 |
TOTAL ENERGY | | | 37,430 |
| Entertainment/Film - 0.1% | | | |
| New Cotai LLC/New Cotai Capital Corp. (b)(c)(j) | | 1,458,195 | 1,283 |
| Environmental - 0.1% | | | |
| Darling Ingredients, Inc. (j) | | 21,937 | 1,307 |
| Food & Drug Retail - 0.4% | | | |
| Northeast Grocery, Inc. (b)(c)(j) | | 339,746 | 1,739 |
| Southeastern Grocers, Inc. (b)(c)(j) | | 250,623 | 6,155 |
TOTAL FOOD & DRUG RETAIL | | | 7,894 |
| Food/Beverage/Tobacco - 0.1% | | | |
| JBS SA | | 684,100 | 2,455 |
| Gaming - 0.7% | | | |
| Boyd Gaming Corp. | | 74,300 | 5,156 |
| Caesars Entertainment, Inc. (j) | | 142,000 | 6,431 |
| Studio City International Holdings Ltd.: | | | |
| ADR (d)(j) | | 32,338 | 240 |
| (NYSE) ADR (j) | | 35,600 | 264 |
TOTAL GAMING | | | 12,091 |
| Healthcare - 0.6% | | | |
| Charles River Laboratories International, Inc. (j) | | 5,000 | 951 |
| Humana, Inc. | | 3,400 | 1,804 |
| IQVIA Holdings, Inc. (j) | | 23,000 | 4,329 |
| Tenet Healthcare Corp. (j) | | 15,300 | 1,122 |
| UnitedHealth Group, Inc. | | 6,400 | 3,149 |
TOTAL HEALTHCARE | | | 11,355 |
| Homebuilders/Real Estate - 0.1% | | | |
| Arthur J. Gallagher & Co. | | 9,200 | 1,914 |
| Metals/Mining - 0.2% | | | |
| First Quantum Minerals Ltd. | | 116,000 | 2,819 |
| Freeport-McMoRan, Inc. | | 39,200 | 1,486 |
| Warrior Metropolitan Coal, Inc. | | 692 | 24 |
TOTAL METALS/MINING | | | 4,329 |
| Services - 0.3% | | | |
| ASGN, Inc. (j) | | 23,580 | 1,688 |
| Visa, Inc. Class A | | 13,200 | 3,072 |
TOTAL SERVICES | | | 4,760 |
| Super Retail - 0.6% | | | |
| Arena Brands Holding Corp. Class B (b)(c)(j) | | 42,253 | 453 |
| Booking Holdings, Inc. (j) | | 800 | 2,149 |
| Dick's Sporting Goods, Inc. | | 22,100 | 3,205 |
| Lowe's Companies, Inc. | | 18,500 | 3,845 |
| Williams-Sonoma, Inc. | | 11,300 | 1,368 |
TOTAL SUPER RETAIL | | | 11,020 |
| Technology - 3.2% | | | |
| Adobe, Inc. (j) | | 9,200 | 3,474 |
| Advanced Micro Devices, Inc. (j) | | 23,000 | 2,056 |
| Alphabet, Inc. Class A (j) | | 35,500 | 3,811 |
| Arista Networks, Inc. (j) | | 13,000 | 2,082 |
| ASML Holding NV (depository receipt) | | 3,400 | 2,165 |
| CDW Corp. | | 20,000 | 3,392 |
| Fiserv, Inc. (j) | | 28,300 | 3,456 |
| Global Payments, Inc. | | 25,600 | 2,885 |
| Marvell Technology, Inc. | | 63,800 | 2,519 |
| Meta Platforms, Inc. Class A (j) | | 28,500 | 6,849 |
| Microchip Technology, Inc. | | 54,800 | 4,000 |
| Microsoft Corp. | | 24,200 | 7,436 |
| NVIDIA Corp. | | 10,600 | 2,941 |
| NXP Semiconductors NV | | 14,900 | 2,440 |
| onsemi (j) | | 89,360 | 6,430 |
| SS&C Technologies Holdings, Inc. | | 19,563 | 1,145 |
| Synopsys, Inc. (j) | | 5,100 | 1,894 |
TOTAL TECHNOLOGY | | | 58,975 |
| Telecommunications - 0.1% | | | |
| GTT Communications, Inc. (b) | | 11,856 | 146 |
| Palo Alto Networks, Inc. (j) | | 10,600 | 1,934 |
TOTAL TELECOMMUNICATIONS | | | 2,080 |
| Textiles/Apparel - 0.0% | | | |
| Victoria's Secret & Co. (j) | | 13,333 | 413 |
| Utilities - 0.3% | | | |
| PG&E Corp. (j) | | 307,379 | 5,259 |
| TOTAL COMMON STOCKS (Cost $150,064) | | | 196,592 |
| | | | |
| Bank Loan Obligations - 6.4% |
| | | Principal Amount (a) (000s) | Value ($) (000s) |
| Air Transportation - 0.3% | | | |
| Air Canada Tranche B 1LN, term loan 3 month U.S. LIBOR + 3.500% 8.3694% 8/11/28 (f)(g)(k) | | 1,231 | 1,226 |
| Dynasty Acquisition Co., Inc.: | | | |
| Tranche B 1LN, term loan 1 month U.S. LIBOR + 3.500% 8.5822% 4/8/26 (f)(g)(k) | | 195 | 191 |
| Tranche B2 1LN, term loan 1 month U.S. LIBOR + 3.500% 8.5822% 4/4/26 (f)(g)(k) | | 105 | 103 |
| SkyMiles IP Ltd. Tranche B 1LN, term loan 3 month U.S. LIBOR + 3.750% 8.7985% 10/20/27 (f)(g)(k) | | 419 | 433 |
| United Airlines, Inc. Tranche B 1LN, term loan 3 month U.S. LIBOR + 3.750% 8.7704% 4/21/28 (f)(g)(k) | | 3,430 | 3,414 |
TOTAL AIR TRANSPORTATION | | | 5,367 |
| Automotive & Auto Parts - 0.0% | | | |
| Clarios Global LP Tranche B 1LN, term loan CME Term SOFR 1 Month Index + 3.750% 4/20/30 (g)(k)(l) | | 430 | 429 |
| PECF USS Intermediate Holding III Corp. Tranche B 1LN, term loan 1 month U.S. LIBOR + 4.250% 9.52% 12/17/28 (f)(g)(k) | | 326 | 267 |
TOTAL AUTOMOTIVE & AUTO PARTS | | | 696 |
| Banks & Thrifts - 0.1% | | | |
| Citadel Securities LP Tranche B 1LN, term loan CME Term SOFR 1 Month Index + 2.500% 7.5967% 2/27/28 (f)(g)(k) | | 1,215 | 1,206 |
| Broadcasting - 0.1% | | | |
| Diamond Sports Group LLC 1LN, term loan CME Term SOFR 1 Month Index + 8.000% 12.7755% 5/25/26 (f)(g)(k) | | 894 | 801 |
| Univision Communications, Inc.: | | | |
| 1LN, term loan CME Term SOFR 3 Month Index + 4.250% 9.1483% 6/24/29 (f)(g)(k) | | 114 | 113 |
| Tranche B 1LN, term loan 1 month U.S. LIBOR + 3.250% 8.2746% 1/31/29 (f)(g)(k) | | 995 | 978 |
TOTAL BROADCASTING | | | 1,892 |
| Building Materials - 0.3% | | | |
| Acproducts Holdings, Inc. Tranche B 1LN, term loan 1 month U.S. LIBOR + 4.250% 9.4091% 5/17/28 (f)(g)(k) | | 3,149 | 2,488 |
| Hunter Douglas, Inc. Tranche B 1LN, term loan CME Term SOFR 3 Month Index + 3.500% 8.3733% 2/25/29 (f)(g)(k) | | 3,320 | 3,013 |
| SRS Distribution, Inc. Tranche B 1LN, term loan 1 month U.S. LIBOR + 3.500% 8.5246% 6/4/28 (f)(g)(k) | | 850 | 809 |
TOTAL BUILDING MATERIALS | | | 6,310 |
| Capital Goods - 0.0% | | | |
| Chart Industries, Inc. 1LN, term loan CME Term SOFR 1 Month Index + 3.750% 8.7395% 3/15/30 (f)(g)(k) | | 275 | 275 |
| Chemicals - 0.4% | | | |
| Avient Corp. Tranche B 1LN, term loan CME Term SOFR 1 Month Index + 3.250% 8.2954% 8/29/29 (f)(g)(k) | | 84 | 85 |
| Discovery Purchaser Corp. 1LN, term loan CME Term SOFR 3 Month Index + 4.370% 9.2836% 10/4/29 (f)(g)(k) | | 6,185 | 5,917 |
| Olympus Water U.S. Holding Corp. Tranche B 1LN, term loan 3 month U.S. LIBOR + 3.750% 8.9375% 11/9/28 (f)(g)(k) | | 514 | 486 |
| W.R. Grace Holding LLC Tranche B 1LN, term loan 3 month U.S. LIBOR + 3.750% 8.9375% 9/22/28 (f)(g)(k) | | 375 | 375 |
TOTAL CHEMICALS | | | 6,863 |
| Consumer Products - 0.2% | | | |
| Kronos Acquisition Holdings, Inc. Tranche B 1LN, term loan 3 month U.S. LIBOR + 3.750% 8.7034% 12/22/26 (f)(g)(k) | | 2,515 | 2,449 |
| The Golub Corp. 2LN, term loan 3 month U.S. LIBOR + 13.500% 18.35% 5/8/26 (b)(f)(g)(k) | | 1,983 | 1,927 |
TOTAL CONSUMER PRODUCTS | | | 4,376 |
| Containers - 0.0% | | | |
| Kloeckner Pentaplast of America, Inc. Tranche B 1LN, term loan CME TERM SOFR 6 MONTH INDEX + 4.750% 10.1293% 2/9/26 (f)(g)(k) | | 186 | 170 |
| Energy - 0.0% | | | |
| Forbes Energy Services LLC Tranche B, term loan 0% (b)(f)(h)(k) | | 610 | 0 |
| Mesquite Energy, Inc.: | | | |
| 1LN, term loan 3 month U.S. LIBOR + 8.000% 0% (b)(g)(h)(k) | | 1,671 | 0 |
| term loan 3 month U.S. LIBOR + 0.000% 0% (b)(g)(h)(k) | | 721 | 0 |
| Natgasoline LLC Tranche B, term loan 1 month U.S. LIBOR + 3.500% 8.5625% 11/14/25 (f)(g)(k) | | 330 | 327 |
TOTAL ENERGY | | | 327 |
| Environmental - 0.0% | | | |
| Covanta Holding Corp.: | | | |
| Tranche B 1LN, term loan CME Term SOFR 1 Month Index + 2.500% 7.4822% 11/30/28 (f)(g)(k) | | 313 | 311 |
| Tranche C 1LN, term loan CME Term SOFR 1 Month Index + 2.500% 7.4965% 11/30/28 (f)(g)(k) | | 24 | 24 |
| Madison IAQ LLC Tranche B 1LN, term loan 3 month U.S. LIBOR + 3.250% 8.3023% 6/21/28 (f)(g)(k) | | 403 | 387 |
TOTAL ENVIRONMENTAL | | | 722 |
| Food/Beverage/Tobacco - 0.0% | | | |
| Bengal Debt Merger Sub LLC 1LN, term loan CME Term SOFR 3 Month Index + 3.250% 8.2483% 1/24/29 (f)(g)(k) | | 328 | 291 |
| Gaming - 0.4% | | | |
| Fertitta Entertainment LLC NV Tranche B 1LN, term loan CME Term SOFR 1 Month Index + 4.000% 8.9822% 1/27/29 (f)(g)(k) | | 7,410 | 7,201 |
| Scientific Games Corp. 1LN, term loan CME Term SOFR 1 Month Index + 3.000% 7.9812% 4/14/29 (f)(g)(k) | | 347 | 346 |
TOTAL GAMING | | | 7,547 |
| Healthcare - 0.3% | | | |
| Gainwell Acquisition Corp. Tranche B 1LN, term loan 3 month U.S. LIBOR + 4.000% 8.9983% 10/1/27 (f)(g)(k) | | 2,276 | 2,190 |
| Jazz Financing Lux SARL Tranche B 1LN, term loan 1 month U.S. LIBOR + 3.500% 8.5246% 5/5/28 (f)(g)(k) | | 824 | 822 |
| Organon & Co. Tranche B 1LN, term loan 3 month U.S. LIBOR + 3.000% 8% 6/2/28 (f)(g)(k) | | 1,962 | 1,958 |
| Phoenix Newco, Inc. Tranche B 1LN, term loan 1 month U.S. LIBOR + 3.250% 8.0903% 11/15/28 (f)(g)(k) | | 975 | 958 |
| PRA Health Sciences, Inc. Tranche B 1LN, term loan CME Term SOFR 3 Month Index + 2.250% 7.4099% 7/3/28 (f)(g)(k) | | 228 | 228 |
TOTAL HEALTHCARE | | | 6,156 |
| Homebuilders/Real Estate - 0.2% | | | |
| Breakwater Energy Tranche B 1LN, term loan 11% 9/1/26 (b)(f)(k) | | 3,351 | 3,183 |
| Hotels - 0.5% | | | |
| Carnival Finance LLC Tranche B 1LN, term loan 6 month U.S. LIBOR + 3.250% 8.2746% 10/18/28 (f)(g)(k) | | 9,031 | 8,854 |
| Insurance - 0.5% | | | |
| Acrisure LLC Tranche B 1LN, term loan 1 month U.S. LIBOR + 4.250% 9.2746% 2/15/27 (f)(g)(k) | | 202 | 196 |
| Alliant Holdings Intermediate LLC: | | | |
| Tranche B3 1LN, term loan 1 month U.S. LIBOR + 3.500% 8.51% 11/12/27 (f)(g)(k) | | 1,775 | 1,758 |
| Tranche B5 1LN, term loan CME Term SOFR 1 Month Index + 3.500% 8.3762% 11/6/27 (f)(g)(k) | | 994 | 985 |
| HUB International Ltd. Tranche B 1LN, term loan: | | | |
| 1 month U.S. LIBOR + 3.250% 8.51% 4/25/25 (f)(g)(k) | | 5,744 | 5,731 |
| CME Term SOFR 1 Month Index + 4.000% 8.7279% 11/10/29 (f)(g)(k) | | 150 | 149 |
TOTAL INSURANCE | | | 8,819 |
| Leisure - 0.1% | | | |
| Delta 2 SARL Tranche B 1LN, term loan CME Term SOFR 1 Month Index + 3.250% 8.2322% 1/15/30 (f)(g)(k) | | 545 | 545 |
| Topgolf Callaway Brands Corp. Tranche B 1LN, term loan CME Term SOFR 1 Month Index + 3.500% 8.5822% 3/9/30 (f)(g)(k) | | 475 | 474 |
TOTAL LEISURE | | | 1,019 |
| Paper - 0.3% | | | |
| Clydesdale Acquisition Holdings, Inc. 1LN, term loan CME Term SOFR 1 Month Index + 4.170% 9.2572% 4/13/29 (f)(g)(k) | | 5,515 | 5,382 |
| Services - 0.9% | | | |
| ABG Intermediate Holdings 2 LLC: | | | |
| Tranche B 2LN, term loan CME Term SOFR 1 Month Index + 6.000% 11.0822% 12/20/29 (f)(g)(k) | | 165 | 152 |
| Tranche B1 LN, term loan CME Term SOFR 1 Month Index + 3.500% 8.5822% 12/21/28 (f)(g)(k) | | 769 | 757 |
| Tranche B2 1LN, term loan CME Term SOFR 1 Month Index + 4.000% 9.4067% 12/21/28 (f)(g)(k) | | 1,804 | 1,782 |
| Tranche DD 1LN, term loan CME Term SOFR 1 Month Index + 3.750% 12/21/28 (g)(k)(m) | | 591 | 584 |
| Ascend Learning LLC: | | | |
| 2LN, term loan 1 month U.S. LIBOR + 5.750% 10.8322% 12/10/29 (f)(g)(k) | | 2,170 | 1,880 |
| Tranche B 1LN, term loan 1 month U.S. LIBOR + 3.500% 8.5822% 12/10/28 (f)(g)(k) | | 3,927 | 3,581 |
| KUEHG Corp.: | | | |
| Tranche B 2LN, term loan 3 month U.S. LIBOR + 8.250% 13.4091% 8/22/25 (f)(g)(k) | | 2,615 | 2,511 |
| Tranche B, term loan 1 month U.S. LIBOR + 3.750% 8.9091% 2/21/25 (f)(g)(k) | | 757 | 751 |
| Neptune BidCo U.S., Inc. Tranche B 1LN, term loan CME Term SOFR 1 Month Index + 5.000% 10.0044% 4/11/29 (f)(g)(k) | | 2,490 | 2,219 |
| Sabert Corp. Tranche B 1LN, term loan 1 month U.S. LIBOR + 4.500% 9.5625% 12/10/26 (f)(g)(k) | | 874 | 872 |
| Spin Holdco, Inc. Tranche B 1LN, term loan 3 month U.S. LIBOR + 4.000% 8.9857% 3/4/28 (f)(g)(k) | | 2,658 | 2,180 |
TOTAL SERVICES | | | 17,269 |
| Specialty Retailing - 0.0% | | | |
| New SK Holdco Sub LLC 1LN, term loan CME Term SOFR 1 Month Index + 8.350% 13.296% 6/30/27 (f)(g)(k) | | 112 | 95 |
| Super Retail - 0.3% | | | |
| LBM Acquisition LLC Tranche B 1LN, term loan 1 month U.S. LIBOR + 3.750% 8.7746% 12/18/27 (f)(g)(k) | | 4,429 | 4,104 |
| Michaels Companies, Inc. 1LN, term loan 3 month U.S. LIBOR + 4.250% 9.4091% 4/15/28 (f)(g)(k) | | 722 | 660 |
TOTAL SUPER RETAIL | | | 4,764 |
| Technology - 1.1% | | | |
| Acuris Finance U.S., Inc. 1LN, term loan CME Term SOFR 3 Month Index + 4.000% 9.0483% 2/16/28 (f)(g)(k) | | 142 | 137 |
| Athenahealth Group, Inc.: | | | |
| Tranche B 1LN, term loan CME Term SOFR 1 Month Index + 3.500% 8.4643% 2/15/29 (f)(g)(k) | | 4,306 | 4,029 |
| Tranche DD 1LN, term loan CME Term SOFR 1 Month Index + 3.500% 2/15/29 (g)(k)(m) | | 529 | 495 |
| Camelot Finance SA Tranche B, term loan 1 month U.S. LIBOR + 3.000% 8.0246% 10/31/26 (f)(g)(k) | | 135 | 134 |
| DG Investment Intermediate Holdings, Inc. Tranche B 1LN, term loan 1 month U.S. LIBOR + 3.750% 8.7746% 3/31/28 (f)(g)(k) | | 255 | 249 |
| Hunter U.S. Bidco, Inc. Tranche B 1LN, term loan 3 month U.S. LIBOR + 4.250% 9.4091% 8/19/28 (f)(g)(k) | | 1,570 | 1,560 |
| Icon Luxembourg Sarl Tranche B 1LN, term loan CME Term SOFR 3 Month Index + 2.250% 7.4099% 7/3/28 (f)(g)(k) | | 915 | 914 |
| MH Sub I LLC 1LN, term loan CME Term SOFR 1 Month Index + 4.250% 4/13/28 (g)(k)(l) | | 2,885 | 2,766 |
| Peraton Corp. Tranche B 1LN, term loan 1 month U.S. LIBOR + 3.750% 8.8322% 2/1/28 (f)(g)(k) | | 1,751 | 1,713 |
| Polaris Newco LLC Tranche B 1LN, term loan 3 month U.S. LIBOR + 4.000% 9.1591% 6/2/28 (f)(g)(k) | | 896 | 830 |
| Proofpoint, Inc. Tranche B 1LN, term loan 3 month U.S. LIBOR + 3.250% 8.2746% 8/31/28 (f)(g)(k) | | 879 | 859 |
| RealPage, Inc. Tranche B 1LN, term loan 1 month U.S. LIBOR + 3.000% 8.0246% 4/22/28 (f)(g)(k) | | 763 | 741 |
| STG-Fairway Holdings LLC Tranche B 1LN, term loan 1 month U.S. LIBOR + 2.750% 7.7746% 1/31/27 (f)(g)(k) | | 390 | 389 |
| Ultimate Software Group, Inc.: | | | |
| 1LN, term loan 1 month U.S. LIBOR + 3.250% 8.2706% 5/3/26 (f)(g)(k) | | 3,955 | 3,846 |
| 2LN, term loan 3 month U.S. LIBOR + 5.250% 10.2706% 5/3/27 (f)(g)(k) | | 570 | 547 |
| VS Buyer LLC Tranche B 1LN, term loan 1 month U.S. LIBOR + 2.000% 7.9034% 2/28/27 (f)(g)(k) | | 315 | 310 |
TOTAL TECHNOLOGY | | | 19,519 |
| Telecommunications - 0.2% | | | |
| Aventiv Technologies LLC Tranche B, term loan 3 month U.S. LIBOR + 4.500% 9.6591% 11/1/24 (f)(g)(k) | | 930 | 660 |
| Frontier Communications Holdings LLC Tranche B 1LN, term loan 3 month U.S. LIBOR + 3.750% 8.8125% 5/1/28 (f)(g)(k) | | 671 | 640 |
| GTT Communications, Inc. 1LN, term loan CME Term SOFR 3 Month Index + 9.000% 13.9983% 6/30/28 (f)(g)(k) | | 465 | 242 |
| Gtt Remainco LLC 1LN, term loan CME Term SOFR 1 Month Index + 7.000% 12.0822% 12/30/27 (f)(g)(k) | | 583 | 478 |
| Zayo Group Holdings, Inc. 1LN, term loan 1 month U.S. LIBOR + 3.000% 8.0246% 3/9/27 (f)(g)(k) | | 1,082 | 877 |
TOTAL TELECOMMUNICATIONS | | | 2,897 |
| Utilities - 0.2% | | | |
| PG&E Corp. Tranche B 1LN, term loan 1 month U.S. LIBOR + 3.000% 8.0625% 6/23/25 (f)(g)(k) | | 3,696 | 3,684 |
| TOTAL BANK LOAN OBLIGATIONS (Cost $123,770) | | | 117,683 |
| | | | |
| Preferred Securities - 7.2% |
| | | Principal Amount (a) (000s) | Value ($) (000s) |
| Banks & Thrifts - 6.3% | | | |
| Ally Financial, Inc. 4.7% (f)(i) | | 945 | 673 |
| Bank of America Corp.: | | | |
| 5.125% (f)(i) | | 12,000 | 11,745 |
| 5.875% (f)(i) | | 14,280 | 13,031 |
| 6.1% (f)(i) | | 2,590 | 2,561 |
| Citigroup, Inc.: | | | |
| 4.15% (f)(i) | | 10,000 | 8,312 |
| 4.7% (f)(i) | | 2,135 | 1,897 |
| 5% (f)(i) | | 13,000 | 12,274 |
| 5.35% (f)(i) | | 12,655 | 12,648 |
| 6.3% (f)(i) | | 4,585 | 4,458 |
| Goldman Sachs Group, Inc.: | | | |
| 4.4% (f)(i) | | 1,120 | 963 |
| 4.95% (f)(i) | | 1,880 | 1,778 |
| 5.3% (f)(i) | | 15,000 | 14,610 |
| JPMorgan Chase & Co.: | | | |
| 4% (f)(i) | | 4,755 | 4,294 |
| 4.6% (f)(i) | | 3,265 | 3,065 |
| 5% (f)(i) | | 24,800 | 24,072 |
TOTAL BANKS & THRIFTS | | | 116,381 |
| Energy - 0.9% | | | |
| Energy Transfer LP: | | | |
| 3 month U.S. LIBOR + 4.020% 8.8916% (f)(g)(i) | | 1,625 | 1,479 |
| 6.625% (f)(i) | | 456 | 355 |
| 7.125% (f)(i) | | 17,150 | 15,013 |
TOTAL ENERGY | | | 16,847 |
| TOTAL PREFERRED SECURITIES (Cost $145,413) | | | 133,228 |
| | | | |
| Other - 2.4% |
| | | Shares | Value ($) (000s) |
| Other - 2.4% | | | |
Fidelity Private Credit Central Fund LLC (c)(o) (Cost $44,780) | | 4,502,507 | 44,649 |
| | | | |
| Money Market Funds - 6.7% |
| | | Shares | Value ($) (000s) |
Fidelity Cash Central Fund 4.88% (n) (Cost $124,640) | | 124,615,538 | 124,640 |
| | | | |
| TOTAL INVESTMENT IN SECURITIES - 99.1% (Cost $1,920,336) | 1,839,023 |
NET OTHER ASSETS (LIABILITIES) - 0.9% | 17,546 |
| NET ASSETS - 100.0% | 1,856,569 |
| | |
Any values shown as $0 in the Schedule of Investments may reflect amounts less than $500.
Legend
| (a) | Amount is stated in United States dollars unless otherwise noted. |
| (c) | Restricted securities (including private placements) - Investment in securities not registered under the Securities Act of 1933 (excluding 144A issues). At the end of the period, the value of restricted securities (excluding 144A issues) amounted to $67,602,000 or 3.6% of net assets. |
| (d) | Security exempt from registration under Rule 144A of the Securities Act of 1933. These securities may be resold in transactions exempt from registration, normally to qualified institutional buyers. At the end of the period, the value of these securities amounted to $894,926,000 or 48.2% of net assets. |
| (e) | Security or a portion of the security purchased on a delayed delivery or when-issued basis. |
| (f) | Coupon rates for floating and adjustable rate securities reflect the rates in effect at period end. |
| (g) | Coupon is indexed to a floating interest rate which may be multiplied by a specified factor and/or subject to caps or floors. |
| (h) | Non-income producing - Security is in default. |
| (i) | Security is perpetual in nature with no stated maturity date. |
| (k) | Remaining maturities of bank loan obligations may be less than the stated maturities shown as a result of contractual or optional prepayments by the borrower. Such prepayments cannot be predicted with certainty. |
| (l) | The coupon rate will be determined upon settlement of the loan after period end. |
| (m) | Position or a portion of the position represents an unfunded loan commitment. At period end, the total principal amount and market value of unfunded commitments totaled $1,120,000 and $1,079,000, respectively. |
| (n) | Affiliated fund that is generally available only to investment companies and other accounts managed by Fidelity Investments. The rate quoted is the annualized seven-day yield of the fund at period end. A complete unaudited listing of the fund's holdings as of its most recent quarter end is available upon request. In addition, each Fidelity Central Fund's financial statements are available on the SEC's website or upon request. |
| (o) | Affiliated fund that is generally available only to investment companies and other accounts managed by Fidelity Investments. |
| Additional information on each restricted holding is as follows: |
| Security | Acquisition Date | Acquisition Cost ($) (000s) |
| Arena Brands Holding Corp. Class B | 6/18/97 - 7/13/98 | 1,538 |
| | | |
| Chesapeake Energy Corp. | 2/10/21 | 33 |
| | | |
| Fidelity Private Credit Central Fund LLC | 12/09/21 - 4/28/23 | 44,782 |
| | | |
| Mesquite Energy, Inc. 15% 7/15/23 | 7/10/20 - 1/18/22 | 711 |
| | | |
| Mesquite Energy, Inc. 15% 7/15/23 | 11/05/20 - 1/18/22 | 1,228 |
| | | |
| New Cotai LLC/New Cotai Capital Corp. | 9/11/20 | 7,224 |
| | | |
| Northeast Grocery, Inc. | 11/08/21 | 135 |
| | | |
| Southeastern Grocers, Inc. | 6/01/18 | 1,763 |
| | | |
Affiliated Central Funds
Fiscal year to date information regarding the Fund's investments in Fidelity Central Funds, including the ownership percentage, is presented below.
| Affiliate (Amounts in thousands) | Value, beginning of period ($) | Purchases ($) | Sales Proceeds ($) | Dividend Income ($) | Realized Gain (loss) ($) | Change in Unrealized appreciation (depreciation) ($) | Value, end of period ($) | % ownership, end of period |
| Fidelity Cash Central Fund 4.88% | 143,722 | 146,315 | 165,397 | 2,589 | - | - | 124,640 | 0.3% |
| Fidelity Private Credit Central Fund LLC | 22,391 | 26,643 | 4,508 | 2,366 | - | 123 | 44,649 | 7.3% |
| Fidelity Securities Lending Cash Central Fund 4.88% | 139 | 12,784 | 12,923 | - | - | - | - | 0.0% |
| Total | 166,252 | 185,742 | 182,828 | 4,955 | - | 123 | 169,289 | |
| | | | | | | | | |
Amounts in the dividend income column in the above table include any capital gain distributions from underlying funds, which are presented in the corresponding line item in the Statement of Operations, if applicable.
Amounts in the dividend income column for Fidelity Securities Lending Cash Central Fund represents the income earned on investing cash collateral, less rebates paid to borrowers and any lending agent fees associated with the loan, plus any premium payments received for lending certain types of securities.
Amounts included in the purchases and sales proceeds columns may include in-kind transactions, if applicable.
Investment Valuation
The following is a summary of the inputs used, as of April 30, 2023, involving the Fund's assets and liabilities carried at fair value. The inputs or methodology used for valuing securities may not be an indication of the risk associated with investing in those securities. For more information on valuation inputs, and their aggregation into the levels used below, please refer to the Investment Valuation section in the accompanying Notes to Financial Statements.
Amounts in this Investment Valuation section exclude the value of Fidelity Private Credit Central Fund LLC as presented in the Schedule of Investments. Fidelity Private Credit Central Fund LLC is valued using NAV as a practical expedient.
| Valuation Inputs at Reporting Date: |
Description (Amounts in thousands) | Total ($) | Level 1 ($) | Level 2 ($) | Level 3 ($) |
Investments in Securities: | | | | |
|
| Equities: | | | | |
Communication Services | 12,475 | 12,475 | - | - |
Consumer Discretionary | 30,972 | 29,059 | - | 1,913 |
Consumer Staples | 11,656 | 3,762 | - | 7,894 |
Energy | 37,398 | 25,738 | 627 | 11,033 |
Financials | 19,074 | 19,074 | - | - |
Health Care | 11,355 | 11,355 | - | - |
Industrials | 8,127 | 8,127 | - | - |
Information Technology | 42,909 | 42,763 | - | 146 |
Materials | 17,335 | 17,335 | - | - |
Utilities | 5,291 | 5,259 | - | 32 |
|
| Corporate Bonds | 1,222,231 | - | 1,204,895 | 17,336 |
|
| Bank Loan Obligations | 117,683 | - | 112,573 | 5,110 |
|
| Preferred Securities | 133,228 | - | 133,228 | - |
|
| Money Market Funds | 124,640 | 124,640 | - | - |
| Total Investments in Securities: | 1,794,374 | 299,587 | 1,451,323 | 43,464 |
The following is a reconciliation of Investments in Securities for which Level 3 inputs were used in determining value:
| (Amounts in thousands) | |
| Investments in Securities: | |
| Beginning Balance | $ | 35,385 | |
| Net Realized Gain (Loss) on Investment Securities | | 398 | |
| Net Unrealized Gain (Loss) on Investment Securities | | 6,043 | |
| Cost of Purchases | | 4,142 | |
| Proceeds of Sales | | (1,210) | |
| Amortization/Accretion | | 10 | |
| Transfers into Level 3 | | - | |
| Transfers out of Level 3 | | (1,304) | |
| Ending Balance | $ | 43,464 | |
| The change in unrealized gain (loss) for the period attributable to Level 3 securities held at April 30, 2023 | $ | 6,043 | |
| The information used in the above reconciliation represents fiscal year to date activity for any Investments in Securities identified as using Level 3 inputs at either the beginning or the end of the current fiscal period. Cost of purchases and proceeds of sales may include securities received and/or delivered through in-kind transactions, corporate actions or exchanges. Transfers into Level 3 were attributable to a lack of observable market data resulting from decreases in market activity, decreases in liquidity, security restructurings or corporate actions. Transfers out of Level 3 were attributable to observable market data becoming available for those securities. Transfers in or out of Level 3 represent the beginning value of any Security or Instrument where a change in the pricing level occurred from the beginning to the end of the period. Realized and unrealized gains (losses) disclosed in the reconciliation are included in Net Gain (Loss) on the Fund's Statement of Operations. | |
| Statement of Assets and Liabilities |
| Amounts in thousands (except per-share amounts) | | | | April 30, 2023 (Unaudited) |
| | | | | |
| Assets | | | | |
| Investment in securities, at value - See accompanying schedule: | | | | |
Unaffiliated issuers (cost $1,750,916) | $ | 1,669,734 | | |
Fidelity Central Funds (cost $169,420) | | 169,289 | | |
| | | | | |
| | | | | |
| Total Investment in Securities (cost $1,920,336) | | | $ | 1,839,023 |
| Cash | | | | 169 |
| Foreign currency held at value (cost $58) | | | | 57 |
| Receivable for investments sold | | | | 6,627 |
| Receivable for fund shares sold | | | | 1,932 |
| Dividends receivable | | | | 108 |
| Interest receivable | | | | 21,246 |
| Distributions receivable from Fidelity Central Funds | | | | 480 |
| Prepaid expenses | | | | 1 |
| Receivable from investment adviser for expense reductions | | | | 1 |
| Other receivables | | | | 8 |
Total assets | | | | 1,869,652 |
| Liabilities | | | | |
| Payable for investments purchased | | | | |
Regular delivery | $ | 7,688 | | |
Delayed delivery | | 960 | | |
| Payable for fund shares redeemed | | 2,300 | | |
| Distributions payable | | 797 | | |
| Accrued management fee | | 842 | | |
| Distribution and service plan fees payable | | 194 | | |
| Other affiliated payables | | 249 | | |
| Other payables and accrued expenses | | 53 | | |
| Total Liabilities | | | | 13,083 |
| Commitments and contingent liabilities (see Commitments note) | | | | |
| Net Assets | | | $ | 1,856,569 |
| Net Assets consist of: | | | | |
| Paid in capital | | | $ | 1,943,100 |
| Total accumulated earnings (loss) | | | | (86,531) |
| Net Assets | | | $ | 1,856,569 |
| | | | | |
| Net Asset Value and Maximum Offering Price | | | | |
| Class A : | | | | |
Net Asset Value and redemption price per share ($475,405 ÷ 43,885 shares) (a) | | | $ | 10.83 |
| Maximum offering price per share (100/96.00 of $10.83) | | | $ | 11.28 |
| Class M : | | | | |
Net Asset Value and redemption price per share ($235,697 ÷ 21,627 shares) (a) | | | $ | 10.90 |
| Maximum offering price per share (100/96.00 of $10.90) | | | $ | 11.35 |
| Class C : | | | | |
Net Asset Value and offering price per share ($56,615 ÷ 5,236 shares) (a) | | | $ | 10.81 |
| Class I : | | | | |
Net Asset Value , offering price and redemption price per share ($735,441 ÷ 72,817 shares) | | | $ | 10.10 |
| Class Z : | | | | |
Net Asset Value , offering price and redemption price per share ($353,411 ÷ 34,987 shares) | | | $ | 10.10 |
(a)Redemption price per share is equal to net asset value less any applicable contingent deferred sales charge. |
| Statement of Operations |
| Amounts in thousands | | | | Six months ended April 30, 2023 (Unaudited) |
| Investment Income | | | | |
| Dividends | | | $ | 6,590 |
| Interest | | | | 43,301 |
| Income from Fidelity Central Funds | | | | 4,955 |
| Total Income | | | | 54,846 |
| Expenses | | | | |
| Management fee | $ | 4,985 | | |
| Transfer agent fees | | 1,175 | | |
| Distribution and service plan fees | | 1,165 | | |
| Accounting fees | | 302 | | |
| Custodian fees and expenses | | 11 | | |
| Independent trustees' fees and expenses | | 6 | | |
| Registration fees | | 87 | | |
| Audit | | 41 | | |
| Legal | | 111 | | |
| Miscellaneous | | 4 | | |
| Total expenses before reductions | | 7,887 | | |
| Expense reductions | | (48) | | |
| Total expenses after reductions | | | | 7,839 |
| Net Investment income (loss) | | | | 47,007 |
| Realized and Unrealized Gain (Loss) | | | | |
| Net realized gain (loss) on: | | | | |
| Investment Securities: | | | | |
| Unaffiliated issuers | | (11,875) | | |
| Foreign currency transactions | | 3 | | |
| Total net realized gain (loss) | | | | (11,872) |
| Change in net unrealized appreciation (depreciation) on: | | | | |
| Investment Securities: | | | | |
| Unaffiliated issuers | | 63,485 | | |
| Fidelity Central Funds | | 123 | | |
| Assets and liabilities in foreign currencies | | (1) | | |
| Total change in net unrealized appreciation (depreciation) | | | | 63,607 |
| Net gain (loss) | | | | 51,735 |
| Net increase (decrease) in net assets resulting from operations | | | $ | 98,742 |
| Statement of Changes in Net Assets |
| |
| Amount in thousands | | Six months ended April 30, 2023 (Unaudited) | | Year ended October 31, 2022 |
| Increase (Decrease) in Net Assets | | | | |
| Operations | | | | |
| Net investment income (loss) | $ | 47,007 | $ | 77,687 |
| Net realized gain (loss) | | (11,872) | | 77,979 |
| Change in net unrealized appreciation (depreciation) | | 63,607 | | (381,046) |
| Net increase (decrease) in net assets resulting from operations | | 98,742 | | (225,380) |
| Distributions to shareholders | | (112,035) | | (118,721) |
| Share transactions - net increase (decrease) | | 80,139 | | (69,934) |
| Total increase (decrease) in net assets | | 66,846 | | (414,035) |
| | | | | |
| Net Assets | | | | |
| Beginning of period | | 1,789,723 | | 2,203,758 |
| End of period | $ | 1,856,569 | $ | 1,789,723 |
| | | | | |
| | | | | |
Financial Highlights
| Fidelity Advisor® High Income Advantage Fund Class A |
| |
| | Six months ended (Unaudited) April 30, 2023 | | Years ended October 31, 2022 | | 2021 | | 2020 | | 2019 | | 2018 |
Selected Per-Share Data | | | | | | | | | | | | |
| Net asset value, beginning of period | $ | 10.90 | $ | 12.94 | $ | 10.95 | $ | 11.12 | $ | 10.93 | $ | 11.41 |
| Income from Investment Operations | | | | | | | | | | | | |
Net investment income (loss) A,B | | .272 | | .455 | | .382 | | .422 | | .517 | | .606 |
| Net realized and unrealized gain (loss) | | .313 | | (1.803) | | 1.989 | | (.169) | | .260 | | (.543) |
| Total from investment operations | | .585 | | (1.348) | | 2.371 | | .253 | | .777 | | .063 |
| Distributions from net investment income | | (.288) | | (.433) | | (.381) | | (.417) | | (.587) | | (.543) |
| Distributions from net realized gain | | (.367) | | (.259) | | - | | (.006) | | - | | - |
| Total distributions | | (.655) | | (.692) | | (.381) | | (.423) | | (.587) | | (.543) |
Redemption fees added to paid in capital A | | - | | - | | - | | - | | - | | - C |
| Net asset value, end of period | $ | 10.83 | $ | 10.90 | $ | 12.94 | $ | 10.95 | $ | 11.12 | $ | 10.93 |
Total Return D,E,F | | 5.52% | | (10.75)% | | 21.85% | | 2.41% | | 7.41% | | .50% |
Ratios to Average Net Assets B,G,H | | | | | | | | | | | | |
| Expenses before reductions | | 1.02% I | | 1.01% | | .99% | | 1.00% | | 1.01% | | .99% |
| Expenses net of fee waivers, if any | | 1.01% I | | 1.01% | | .99% | | 1.00% | | 1.00% | | .99% |
| Expenses net of all reductions | | 1.01% I | | 1.01% | | .99% | | 1.00% | | 1.00% | | .99% |
| Net investment income (loss) | | 5.07% I | | 3.88% | | 3.07% | | 3.91% | | 4.70% | | 5.35% |
| Supplemental Data | | | | | | | | | | | | |
| Net assets, end of period (in millions) | $ | 475 | $ | 463 | $ | 566 | $ | 462 | $ | 515 | $ | 467 |
Portfolio turnover rate J | | 21% I | | 29% | | 27% | | 48% | | 53% | | 45% |
A Calculated based on average shares outstanding during the period.
B Net investment income (loss) is affected by the timing of the declaration of dividends by any underlying mutual funds or exchange-traded funds (ETFs). Net investment income (loss) of any mutual funds or ETFs is not included in the Fund's net investment income (loss) ratio.
C Amount represents less than $.0005 per share.
D Total returns for periods of less than one year are not annualized.
E Total returns would have been lower if certain expenses had not been reduced during the applicable periods shown.
F Total returns do not include the effect of the sales charges.
G Fees and expenses of any underlying mutual funds or exchange-traded funds (ETFs) are not included in the Fund's expense ratio. The Fund indirectly bears its proportionate share of these expenses. For additional expense information related to investments in Fidelity Central Funds, please refer to the "Investments in Fidelity Central Funds" note found in the Notes to Financial Statements section of the most recent Annual or Semi-Annual report. For additional expense information related to investments in Fidelity Private Credit Central Fund LLC, please refer to the Investment in Fidelity Private Credit Central Fund LLC note found in the Notes to Financial Statements section of the most recent Annual or Semi-Annual report.
H Expense ratios reflect operating expenses of the class. Expenses before reductions do not reflect amounts reimbursed, waived, or reduced through arrangements with the investment adviser, brokerage services, or other offset arrangements, if applicable, and do not represent the amount paid by the class during periods when reimbursements, waivers or reductions occur.
I Annualized.
J Amount does not include the portfolio activity of any underlying mutual funds or exchange-traded funds (ETFs).
| Fidelity Advisor® High Income Advantage Fund Class M |
| |
| | Six months ended (Unaudited) April 30, 2023 | | Years ended October 31, 2022 | | 2021 | | 2020 | | 2019 | | 2018 |
Selected Per-Share Data | | | | | | | | | | | | |
| Net asset value, beginning of period | $ | 10.96 | $ | 13.01 | $ | 11.01 | $ | 11.18 | $ | 10.99 | $ | 11.47 |
| Income from Investment Operations | | | | | | | | | | | | |
Net investment income (loss) A,B | | .274 | | .458 | | .385 | | .425 | | .521 | | .611 |
| Net realized and unrealized gain (loss) | | .322 | | (1.813) | | 1.998 | | (.169) | | .259 | | (.545) |
| Total from investment operations | | .596 | | (1.355) | | 2.383 | | .256 | | .780 | | .066 |
| Distributions from net investment income | | (.289) | | (.436) | | (.383) | | (.420) | | (.590) | | (.546) |
| Distributions from net realized gain | | (.367) | | (.259) | | - | | (.006) | | - | | - |
| Total distributions | | (.656) | | (.695) | | (.383) | | (.426) | | (.590) | | (.546) |
Redemption fees added to paid in capital A | | - | | - | | - | | - | | - | | - C |
| Net asset value, end of period | $ | 10.90 | $ | 10.96 | $ | 13.01 | $ | 11.01 | $ | 11.18 | $ | 10.99 |
Total Return D,E,F | | 5.60% | | (10.75)% | | 21.84% | | 2.43% | | 7.39% | | .53% |
Ratios to Average Net Assets B,G,H | | | | | | | | | | | | |
| Expenses before reductions | | 1.01% I | | 1.01% | | .99% | | 1.00% | | 1.00% | | .98% |
| Expenses net of fee waivers, if any | | 1.01% I | | 1.01% | | .99% | | 1.00% | | 1.00% | | .98% |
| Expenses net of all reductions | | 1.01% I | | 1.01% | | .99% | | 1.00% | | 1.00% | | .98% |
| Net investment income (loss) | | 5.07% I | | 3.89% | | 3.08% | | 3.91% | | 4.71% | | 5.36% |
| Supplemental Data | | | | | | | | | | | | |
| Net assets, end of period (in millions) | $ | 236 | $ | 238 | $ | 300 | $ | 266 | $ | 329 | $ | 337 |
Portfolio turnover rate J | | 21% I | | 29% | | 27% | | 48% | | 53% | | 45% |
A Calculated based on average shares outstanding during the period.
B Net investment income (loss) is affected by the timing of the declaration of dividends by any underlying mutual funds or exchange-traded funds (ETFs). Net investment income (loss) of any mutual funds or ETFs is not included in the Fund's net investment income (loss) ratio.
C Amount represents less than $.0005 per share.
D Total returns for periods of less than one year are not annualized.
E Total returns would have been lower if certain expenses had not been reduced during the applicable periods shown.
F Total returns do not include the effect of the sales charges.
G Fees and expenses of any underlying mutual funds or exchange-traded funds (ETFs) are not included in the Fund's expense ratio. The Fund indirectly bears its proportionate share of these expenses. For additional expense information related to investments in Fidelity Central Funds, please refer to the "Investments in Fidelity Central Funds" note found in the Notes to Financial Statements section of the most recent Annual or Semi-Annual report. For additional expense information related to investments in Fidelity Private Credit Central Fund LLC, please refer to the Investment in Fidelity Private Credit Central Fund LLC note found in the Notes to Financial Statements section of the most recent Annual or Semi-Annual report.
H Expense ratios reflect operating expenses of the class. Expenses before reductions do not reflect amounts reimbursed, waived, or reduced through arrangements with the investment adviser, brokerage services, or other offset arrangements, if applicable, and do not represent the amount paid by the class during periods when reimbursements, waivers or reductions occur.
I Annualized.
J Amount does not include the portfolio activity of any underlying mutual funds or exchange-traded funds (ETFs).
| Fidelity Advisor® High Income Advantage Fund Class C |
| |
| | Six months ended (Unaudited) April 30, 2023 | | Years ended October 31, 2022 | | 2021 | | 2020 | | 2019 | | 2018 |
Selected Per-Share Data | | | | | | | | | | | | |
| Net asset value, beginning of period | $ | 10.88 | $ | 12.92 | $ | 10.93 | $ | 11.10 | $ | 10.91 | $ | 11.39 |
| Income from Investment Operations | | | | | | | | | | | | |
Net investment income (loss) A,B | | .231 | | .366 | | .286 | | .339 | | .434 | | .520 |
| Net realized and unrealized gain (loss) | | .313 | | (1.804) | | 1.988 | | (.169) | | .258 | | (.543) |
| Total from investment operations | | .544 | | (1.438) | | 2.274 | | .170 | | .692 | | (.023) |
| Distributions from net investment income | | (.247) | | (.343) | | (.284) | | (.334) | | (.502) | | (.457) |
| Distributions from net realized gain | | (.367) | | (.259) | | - | | (.006) | | - | | - |
| Total distributions | | (.614) | | (.602) | | (.284) | | (.340) | | (.502) | | (.457) |
Redemption fees added to paid in capital A | | - | | - | | - | | - | | - | | - C |
| Net asset value, end of period | $ | 10.81 | $ | 10.88 | $ | 12.92 | $ | 10.93 | $ | 11.10 | $ | 10.91 |
Total Return D,E,F | | 5.14% | | (11.45)% | | 20.95% | | 1.63% | | 6.60% | | (.26)% |
Ratios to Average Net Assets B,G,H | | | | | | | | | | | | |
| Expenses before reductions | | 1.79% I | | 1.78% | | 1.76% | | 1.77% | | 1.77% | | 1.75% |
| Expenses net of fee waivers, if any | | 1.76% I | | 1.77% | | 1.76% | | 1.77% | | 1.77% | | 1.75% |
| Expenses net of all reductions | | 1.76% I | | 1.77% | | 1.76% | | 1.77% | | 1.76% | | 1.75% |
| Net investment income (loss) | | 4.32% I | | 3.12% | | 2.30% | | 3.14% | | 3.94% | | 4.59% |
| Supplemental Data | | | | | | | | | | | | |
| Net assets, end of period (in millions) | $ | 57 | $ | 56 | $ | 71 | $ | 68 | $ | 89 | $ | 130 |
Portfolio turnover rate J | | 21% I | | 29% | | 27% | | 48% | | 53% | | 45% |
A Calculated based on average shares outstanding during the period.
B Net investment income (loss) is affected by the timing of the declaration of dividends by any underlying mutual funds or exchange-traded funds (ETFs). Net investment income (loss) of any mutual funds or ETFs is not included in the Fund's net investment income (loss) ratio.
C Amount represents less than $.0005 per share.
D Total returns for periods of less than one year are not annualized.
E Total returns would have been lower if certain expenses had not been reduced during the applicable periods shown.
F Total returns do not include the effect of the contingent deferred sales charge.
G Fees and expenses of any underlying mutual funds or exchange-traded funds (ETFs) are not included in the Fund's expense ratio. The Fund indirectly bears its proportionate share of these expenses. For additional expense information related to investments in Fidelity Central Funds, please refer to the "Investments in Fidelity Central Funds" note found in the Notes to Financial Statements section of the most recent Annual or Semi-Annual report. For additional expense information related to investments in Fidelity Private Credit Central Fund LLC, please refer to the Investment in Fidelity Private Credit Central Fund LLC note found in the Notes to Financial Statements section of the most recent Annual or Semi-Annual report.
H Expense ratios reflect operating expenses of the class. Expenses before reductions do not reflect amounts reimbursed, waived, or reduced through arrangements with the investment adviser, brokerage services, or other offset arrangements, if applicable, and do not represent the amount paid by the class during periods when reimbursements, waivers or reductions occur.
I Annualized.
J Amount does not include the portfolio activity of any underlying mutual funds or exchange-traded funds (ETFs).
| Fidelity Advisor® High Income Advantage Fund Class I |
| |
| | Six months ended (Unaudited) April 30, 2023 | | Years ended October 31, 2022 | | 2021 | | 2020 | | 2019 | | 2018 |
Selected Per-Share Data | | | | | | | | | | | | |
| Net asset value, beginning of period | $ | 10.19 | $ | 12.12 | $ | 10.26 | $ | 10.42 | $ | 10.25 | $ | 10.70 |
| Income from Investment Operations | | | | | | | | | | | | |
Net investment income (loss) A,B | | .266 | | .454 | | .388 | | .422 | | .512 | | .590 |
| Net realized and unrealized gain (loss) | | .294 | | (1.691) | | 1.860 | | (.157) | | .241 | | (.499) |
| Total from investment operations | | .560 | | (1.237) | | 2.248 | | .265 | | .753 | | .091 |
| Distributions from net investment income | | (.283) | | (.434) | | (.388) | | (.419) | | (.583) | | (.541) |
| Distributions from net realized gain | | (.367) | | (.259) | | - | | (.006) | | - | | - |
| Total distributions | | (.650) | | (.693) | | (.388) | | (.425) | | (.583) | | (.541) |
Redemption fees added to paid in capital A | | - | | - | | - | | - | | - | | - C |
| Net asset value, end of period | $ | 10.10 | $ | 10.19 | $ | 12.12 | $ | 10.26 | $ | 10.42 | $ | 10.25 |
Total Return D,E | | 5.67% | | (10.56)% | | 22.13% | | 2.69% | | 7.67% | | .80% |
Ratios to Average Net Assets B,F,G | | | | | | | | | | | | |
| Expenses before reductions | | .76% H | | .76% | | .74% | | .75% | | .76% | | .75% |
| Expenses net of fee waivers, if any | | .76% H | | .76% | | .74% | | .75% | | .76% | | .75% |
| Expenses net of all reductions | | .76% H | | .76% | | .74% | | .74% | | .76% | | .75% |
| Net investment income (loss) | | 5.32% H | | 4.13% | | 3.32% | | 4.17% | | 4.95% | | 5.57% |
| Supplemental Data | | | | | | | | | | | | |
| Net assets, end of period (in millions) | $ | 735 | $ | 696 | $ | 903 | $ | 510 | $ | 612 | $ | 883 |
Portfolio turnover rate I | | 21% H | | 29% | | 27% | | 48% | | 53% | | 45% |
A Calculated based on average shares outstanding during the period.
B Net investment income (loss) is affected by the timing of the declaration of dividends by any underlying mutual funds or exchange-traded funds (ETFs). Net investment income (loss) of any mutual funds or ETFs is not included in the Fund's net investment income (loss) ratio.
C Amount represents less than $.0005 per share.
D Total returns for periods of less than one year are not annualized.
E Total returns would have been lower if certain expenses had not been reduced during the applicable periods shown.
F Fees and expenses of any underlying mutual funds or exchange-traded funds (ETFs) are not included in the Fund's expense ratio. The Fund indirectly bears its proportionate share of these expenses. For additional expense information related to investments in Fidelity Central Funds, please refer to the "Investments in Fidelity Central Funds" note found in the Notes to Financial Statements section of the most recent Annual or Semi-Annual report. For additional expense information related to investments in Fidelity Private Credit Central Fund LLC, please refer to the Investment in Fidelity Private Credit Central Fund LLC note found in the Notes to Financial Statements section of the most recent Annual or Semi-Annual report.
G Expense ratios reflect operating expenses of the class. Expenses before reductions do not reflect amounts reimbursed, waived, or reduced through arrangements with the investment adviser, brokerage services, or other offset arrangements, if applicable, and do not represent the amount paid by the class during periods when reimbursements, waivers or reductions occur.
H Annualized.
I Amount does not include the portfolio activity of any underlying mutual funds or exchange-traded funds (ETFs).
| Fidelity Advisor® High Income Advantage Fund Class Z |
| |
| | Six months ended (Unaudited) April 30, 2023 | | Years ended October 31, 2022 | | 2021 | | 2020 | | 2019 | | 2018 A |
Selected Per-Share Data | | | | | | | | | | | | |
| Net asset value, beginning of period | $ | 10.19 | $ | 12.12 | $ | 10.26 | $ | 10.42 | $ | 10.25 | $ | 10.69 |
| Income from Investment Operations | | | | | | | | | | | | |
Net investment income (loss) B,C | | .271 | | .463 | | .399 | | .430 | | .516 | | .034 |
| Net realized and unrealized gain (loss) | | .294 | | (1.690) | | 1.860 | | (.156) | | .248 | | (.438) |
| Total from investment operations | | .565 | | (1.227) | | 2.259 | | .274 | | .764 | | (.404) |
| Distributions from net investment income | | (.288) | | (.444) | | (.399) | | (.428) | | (.594) | | (.036) |
| Distributions from net realized gain | | (.367) | | (.259) | | - | | (.006) | | - | | - |
| Total distributions | | (.655) | | (.703) | | (.399) | | (.434) | | (.594) | | (.036) |
| Net asset value, end of period | $ | 10.10 | $ | 10.19 | $ | 12.12 | $ | 10.26 | $ | 10.42 | $ | 10.25 |
Total Return D,E | | 5.73% | | (10.47)% | | 22.25% | | 2.79% | | 7.79% | | (3.78)% |
Ratios to Average Net Assets C,F,G | | | | | | | | | | | | |
| Expenses before reductions | | .67% H | | .66% | | .64% | | .65% | | .65% | | .63% H |
| Expenses net of fee waivers, if any | | .66% H | | .66% | | .64% | | .65% | | .65% | | .63% H |
| Expenses net of all reductions | | .66% H | | .66% | | .64% | | .65% | | .65% | | .63% H |
| Net investment income (loss) | | 5.42% H | | 4.23% | | 3.42% | | 4.26% | | 5.06% | | 5.46% H |
| Supplemental Data | | | | | | | | | | | | |
| Net assets, end of period (in millions) | $ | 353 | $ | 337 | $ | 363 | $ | 159 | $ | 137 | $ | 18 |
Portfolio turnover rate I | | 21% H | | 29% | | 27% | | 48% | | 53% | | 45% |
A For the period October 2, 2018 (commencement of sale of shares) through October 31, 2018.
B Calculated based on average shares outstanding during the period.
C Net investment income (loss) is affected by the timing of the declaration of dividends by any underlying mutual funds or exchange-traded funds (ETFs). Net investment income (loss) of any mutual funds or ETFs is not included in the Fund's net investment income (loss) ratio.
D Total returns for periods of less than one year are not annualized.
E Total returns would have been lower if certain expenses had not been reduced during the applicable periods shown.
F Fees and expenses of any underlying mutual funds or exchange-traded funds (ETFs) are not included in the Fund's expense ratio. The Fund indirectly bears its proportionate share of these expenses. For additional expense information related to investments in Fidelity Central Funds, please refer to the "Investments in Fidelity Central Funds" note found in the Notes to Financial Statements section of the most recent Annual or Semi-Annual report. For additional expense information related to investments in Fidelity Private Credit Central Fund LLC, please refer to the Investment in Fidelity Private Credit Central Fund LLC note found in the Notes to Financial Statements section of the most recent Annual or Semi-Annual report.
G Expense ratios reflect operating expenses of the class. Expenses before reductions do not reflect amounts reimbursed, waived, or reduced through arrangements with the investment adviser, brokerage services, or other offset arrangements, if applicable, and do not represent the amount paid by the class during periods when reimbursements, waivers or reductions occur.
H Annualized.
I Amount does not include the portfolio activity of any underlying mutual funds or exchange-traded funds (ETFs).
For the period ended April 30, 2023
( Amounts in thousands except percentages)
1. Organization.
Fidelity Advisor High Income Advantage Fund (the Fund) is a fund of Fidelity Advisor Series I (the Trust) and is authorized to issue an unlimited number of shares. The Trust is registered under the Investment Company Act of 1940, as amended (the 1940 Act), as an open-end management investment company organized as a Massachusetts business trust. The Fund offers Class A, Class M, Class C, Class I and Class Z shares, each of which has equal rights as to assets and voting privileges. Class A, Class M, Class C, Class I and Class Z are Fidelity Advisor classes. Each class has exclusive voting rights with respect to matters that affect that class. Class C shares will automatically convert to Class A shares after a holding period of eight years from the initial date of purchase, with certain exceptions.
2. Investments in Fidelity Central Funds.
Funds may invest in Fidelity Central Funds, which are open-end investment companies generally available only to other investment companies and accounts managed by the investment adviser and its affiliates. The Schedule of Investments lists any Fidelity Central Funds held as an investment as of period end, but does not include the underlying holdings of each Fidelity Central Fund. An investing fund indirectly bears its proportionate share of the expenses of the underlying Fidelity Central Funds.
Based on its investment objective, each Fidelity Central Fund may invest or participate in various investment vehicles or strategies that are similar to those of the investing fund. These strategies are consistent with the investment objectives of the investing fund and may involve certain economic risks which may cause a decline in value of each of the Fidelity Central Funds and thus a decline in the value of the investing fund.
| Fidelity Central Fund | Investment Manager | Investment Objective | Investment Practices | Expense Ratio A |
| Fidelity Money Market Central Funds | Fidelity Management & Research Company LLC (FMR) | Each fund seeks to obtain a high level of current income consistent with the preservation of capital and liquidity. | Short-term Investments | Less than .005% |
A Expenses expressed as a percentage of average net assets and are as of each underlying Central Fund's most recent annual or semi-annual shareholder report.
A complete unaudited list of holdings for each Fidelity Central Fund is available upon request or at the Securities and Exchange Commission website at www.sec.gov. In addition, the financial statements of the Fidelity Central Funds which contain the significant accounting policies (including investment valuation policies) of those funds, and are not covered by the Report of Independent Registered Public Accounting Firm, are available on the Securities and Exchange Commission website or upon request.
3. Investment in Fidelity Private Credit Central Fund LLC.
The Fund invests in Fidelity Private Credit Central Fund LLC (formerly Fidelity Direct Lending Fund, LP), which is a limited liability company available only to certain investment companies managed by the investment adviser and its affiliates. The Fund's units are not registered under the Securities Act of 1933, and are subject to substantial restrictions on transfer. The Fund has no redemption rights under the limited liability company agreement. There will be no trading market for the units.
Based on its investment objective, Fidelity Private Credit Central Fund LLC may invest or participate in various investments or strategies that are similar to those in which the Fund may invest or participate. These strategies are consistent with the investment objectives of the Fund and may involve certain economic risks which may cause a decline in value of Fidelity Private Credit Central Fund LLC and thus a decline in the value of the Fund. Fidelity Private Credit Central Fund LLC intends to invest primarily in direct loans made to private U.S. companies, specifically small- and middle-market companies.
The Schedule of Investments lists Fidelity Private Credit Central Fund LLC as an investment as of period end, but does not include the underlying holdings of Fidelity Private Credit Central Fund LLC. Fidelity Private Credit Central Fund LLC represented less than 5% of the Fund's net assets at period end. The Fund indirectly bears its proportionate share of the expenses of Fidelity Private Credit Central Fund LLC. The expense ratio for Fidelity Private Credit Central Fund LLC for the year ended December 31, 2022 was 2.46%.
4. Significant Accounting Policies.
The Fund is an investment company and applies the accounting and reporting guidance of the Financial Accounting Standards Board (FASB) Accounting Standards Codification Topic 946 Financial Services - Investment Companies . The financial statements have been prepared in conformity with accounting principles generally accepted in the United States of America (GAAP), which require management to make certain estimates and assumptions at the date of the financial statements. Actual results could differ from those estimates. Subsequent events, if any, through the date that the financial statements were issued have been evaluated in the preparation of the financial statements. The Fund's Schedule of Investments lists any underlying mutual funds or exchange-traded funds (ETFs) but does not include the underlying holdings of these funds. The following summarizes the significant accounting policies of the Fund:
Investment Valuation. Investments are valued as of 4:00 p.m. Eastern time on the last calendar day of the period. The Board of Trustees (the Board) has designated the Fund's investment adviser as the valuation designee responsible for the fair valuation function and performing fair value determinations as needed. The investment adviser has established a Fair Value Committee (the Committee) to carry out the day-to-day fair valuation responsibilities and has adopted policies and procedures to govern the fair valuation process and the activities of the Committee. In accordance with these fair valuation policies and procedures, which have been approved by the Board, the Fund attempts to obtain prices from one or more third party pricing services or brokers to value its investments. When current market prices, quotations or currency exchange rates are not readily available or reliable, investments will be fair valued in good faith by the Committee, in accordance with the policies and procedures. Factors used in determining fair value vary by investment type and may include market or investment specific events, transaction data, estimated cash flows, and market observations of comparable investments. The frequency that the fair valuation procedures are used cannot be predicted and they may be utilized to a significant extent. The Committee manages the Fund's fair valuation practices and maintains the fair valuation policies and procedures. The Fund's investment adviser reports to the Board information regarding the fair valuation process and related material matters.
The Fund categorizes the inputs to valuation techniques used to value its investments into a disclosure hierarchy consisting of three levels as shown below:
Level 1 - unadjusted quoted prices in active markets for identical investments
Level 2 - other significant observable inputs (including quoted prices for similar investments, interest rates, prepayment speeds, etc.)
Level 3 - unobservable inputs (including the Fund's own assumptions based on the best information available)
Valuation techniques used to value the Fund's investments by major category are as follows:
Debt securities, including restricted securities, are valued based on evaluated prices received from third party pricing services or from brokers who make markets in such securities. Corporate bonds, bank loan obligations and preferred securities are valued by pricing services who utilize matrix pricing which considers yield or price of bonds of comparable quality, coupon, maturity and type or by broker-supplied prices. When independent prices are unavailable or unreliable, debt securities may be valued utilizing pricing methodologies which consider similar factors that would be used by third party pricing services. For foreign debt securities, when significant market or security specific events arise, valuations may be determined in good faith in accordance with procedures adopted by the Board. Debt securities are generally categorized as Level 2 in the hierarchy but may be Level 3 depending on the circumstances. The Fund invests a significant portion of its assets in below investment grade securities. The value of these securities can be more volatile due to changes in the credit quality of the issuer and is sensitive to changes in economic, market and regulatory conditions.
Equity securities, including restricted securities, for which market quotations are readily available, are valued at the last reported sale price or official closing price as reported by a third party pricing service on the primary market or exchange on which they are traded and are categorized as Level 1 in the hierarchy. In the event there were no sales during the day or closing prices are not available, securities are valued at the last quoted bid price or may be valued using the last available price and are generally categorized as Level 2 in the hierarchy. For foreign equity securities, when market or security specific events arise, comparisons to the valuation of American Depositary Receipts (ADRs), futures contracts, Exchange-Traded Funds (ETFs) and certain indexes as well as quoted prices for similar securities may be used and would be categorized as Level 2 in the hierarchy. For equity securities, including restricted securities, where observable inputs are limited, assumptions about market activity and risk are used and these securities may be categorized as Level 3 in the hierarchy. Securities, including private placements or other restricted securities, for which observable inputs are not available are valued using alternate valuation approaches, including the market approach, the income approach and cost approach, and are categorized as Level 3 in the hierarchy. The market approach considers factors including the price of recent investments in the same or a similar security or financial metrics of comparable securities. The income approach considers factors including expected future cash flows, security specific risks and corresponding discount rates. The cost approach considers factors including the value of the security's underlying assets and liabilities.
Investments in open-end mutual funds, including the Fidelity Central Funds, are valued at their closing net asset value (NAV) each business day and are categorized as Level 1 in the hierarchy.
Fidelity Private Credit Central Fund LLC is valued using NAV as a practical expedient in accordance with the specialized accounting guidance for investment companies.
The following provides information on Level 3 securities held by the Fund that were valued at period end based on unobservable inputs. These amounts exclude valuations provided by a broker and valuations using NAV as a practical expedient.
| Asset Type | Fair Value | Valuation Technique(s) | Unobservable Input | Amount or Range/Weighted Average | Impact to Valuation from an Increase in Input A |
| Equities | $21,018 | Market comparable | Enterprise value/EBITDA multiple (EV/EBITDA) | 2.6 - 6.5 / 3.6 | Increase |
| | | | Enterprise value/Revenue multiple (EV/R) | 0.3 | Increase |
| | | | Daily production multiple ($/Barrels of oil equivalent per day) | $18,500.00 | Increase |
| | | | Enterprise value/PV-10 multiple (EV/PV-10) | 0.3 - 0.5 / 0.3 | Increase |
| | | | Enterprise value/Proved reserves multiple | 0.8 - 4.2 / 4.2 | Increase |
| | | | Daily production multiple ($/Million cubic feet equivalent per day) | $3,000.00 | Increase |
| | | Recovery value | Recovery value | $0.00 | Increase |
| | | Market approach | Transaction price | $45.00 | Increase |
| | | | Parity price | $12.35 | Increase |
| | | Discounted cash flow | Discount rate | 10.0% - 12.8% / 10.4% | Decrease |
| | | | Reserve risk rate | 63.0% - 98.0% / 80.5% | Increase |
| | | Black scholes | Discount rate | 4.7% | Increase |
| | | | Volatility | 55.0% | Increase |
| | | | Term | 1.2 | Increase |
| Corporate Bonds | $17,336 | Market comparable | Enterprise value/EBITDA multiple (EV/EBITDA) | 2.6 | Increase |
| | | | Daily production multiple ($/Barrels of oil equivalent per day) | $18,500.00 | Increase |
| | | | Enterprise value/PV-10 multiple (EV/PV-10) | 0.3 | Increase |
| | | | Enterprise value/Proved reserves multiple | 4.2 | Increase |
| | | Recovery value | Recovery value | $0.00 | Increase |
| | | Discounted cash flow | Discount rate | 10.0% | Decrease |
| | | | Reserve risk rate | 63.0% - 98.0% / 80.5% | Increase |
| | | Indicative market price | Evaluated bid | $0.13 - $8.00 / $6.34 | Increase |
| | | Black scholes | Discount rate | 4.7% | Increase |
| | | | Volatility | 55.0% | Increase |
| | | | Term | 1.2 | Increase |
| Bank Loan Obligations | $5,110 | Recovery value | Recovery value | $0.00 | Increase |
| | | Market approach | Transaction price | $95.00 | Increase |
| | | Discounted cash flow | Discount rate | 18.7% | Decrease |
A Represents the directional change in the fair value of the Level 3 investments that could have resulted from an increase in the corresponding input as of period end. A decrease to the unobservable input would have had the opposite effect. Significant changes in these inputs may have resulted in a significantly higher or lower fair value measurement at period end.
Changes in valuation techniques may result in transfers in or out of an assigned level within the disclosure hierarchy. The aggregate value of investments by input level as of April 30, 2023, as well as a roll forward of Level 3 investments, is included at the end of the Fund's Schedule of Investments.
Foreign Currency. Certain Funds may use foreign currency contracts to facilitate transactions in foreign-denominated securities. Gains and losses from these transactions may arise from changes in the value of the foreign currency or if the counterparties do not perform under the contracts' terms.
Foreign-denominated assets, including investment securities, and liabilities are translated into U.S. dollars at the exchange rates at period end. Purchases and sales of investment securities, income and dividends received, and expenses denominated in foreign currencies are translated into U.S. dollars at the exchange rate in effect on the transaction date.
The effects of exchange rate fluctuations on investments are included with the net realized and unrealized gain (loss) on investment securities. Other foreign currency transactions resulting in realized and unrealized gain (loss) are disclosed separately.
Investment Transactions and Income. For financial reporting purposes, the Fund's investment holdings and NAV include trades executed through the end of the last business day of the period. The NAV per share for processing shareholder transactions is calculated as of the close of business of the New York Stock Exchange (NYSE), normally 4:00 p.m. Eastern time and includes trades executed through the end of the prior business day. Gains and losses on securities sold are determined on the basis of identified cost and include proceeds received from litigation. Commissions paid to certain brokers with whom the investment adviser, or its affiliates, places trades on behalf of a fund include an amount in addition to trade execution, which may be rebated back to a fund. Any such rebates are included in net realized gain (loss) on investments in the Statement of Operations. Dividend income is recorded on the ex-dividend date, except for certain dividends from foreign securities where the ex-dividend date may have passed, which are recorded as soon as the Fund is informed of the ex-dividend date. Non-cash dividends included in dividend income, if any, are recorded at the fair market value of the securities received. Income and capital gain distributions from Fidelity Central Funds, if any, are recorded on the ex-dividend date. Certain distributions received by the Fund represent a return of capital or capital gain. The Fund determines the components of these distributions subsequent to the ex-dividend date, based upon receipt of tax filings or other correspondence relating to the underlying investment. These distributions are recorded as a reduction of cost of investments and/or as a realized gain. Interest income is accrued as earned and includes coupon interest and amortization of premium and accretion of discount on debt securities as applicable. Investment income is recorded net of foreign taxes withheld where recovery of such taxes is uncertain. Debt obligations may be placed on non-accrual status and related interest income may be reduced by ceasing current accruals and writing off interest receivables when the collection of all or a portion of interest has become doubtful based on consistently applied procedures. A debt obligation is removed from non-accrual status when the issuer resumes interest payments or when collectability of interest is reasonably assured.
Class Allocations and Expenses. Investment income, realized and unrealized capital gains and losses, common expenses of a fund, and certain fund-level expense reductions, if any, are allocated daily on a pro-rata basis to each class based on the relative net assets of each class to the total net assets of a fund. Each class differs with respect to transfer agent and distribution and service plan fees incurred, as applicable. Certain expense reductions may also differ by class, if applicable. For the reporting period, the allocated portion of income and expenses to each class as a percent of its average net assets may vary due to the timing of recording these transactions in relation to fluctuating net assets of the classes. Expenses directly attributable to a fund are charged to that fund. Expenses attributable to more than one fund are allocated among the respective funds on the basis of relative net assets or other appropriate methods. Expenses included in the accompanying financial statements reflect the expenses of that fund and do not include any expenses associated with any underlying mutual funds or exchange-traded funds. Although not included in a fund's expenses, a fund indirectly bears its proportionate share of these expenses through the net asset value of each underlying mutual fund or exchange-traded fund. Expense estimates are accrued in the period to which they relate and adjustments are made when actual amounts are known.
Deferred Trustee Compensation. Under a Deferred Compensation Plan (the Plan) for certain Funds, certain independent Trustees have elected to defer receipt of a portion of their annual compensation. Deferred amounts are invested in affiliated mutual funds, are marked-to-market and remain in a fund until distributed in accordance with the Plan. The investment of deferred amounts and the offsetting payable to the Trustees presented below are included in the accompanying Statement of Assets and Liabilities in other receivables and other payables and accrued expenses, as applicable.
| Fidelity Advisor High Income Advantage Fund | $8 |
Income Tax Information and Distributions to Shareholders. Each year, the Fund intends to qualify as a regulated investment company under Subchapter M of the Internal Revenue Code, including distributing substantially all of its taxable income and realized gains. As a result, no provision for U.S. Federal income taxes is required. The Fund files a U.S. federal tax return, in addition to state and local tax returns as required. The Fund's federal income tax returns are subject to examination by the Internal Revenue Service (IRS) for a period of three fiscal years after they are filed. State and local tax returns may be subject to examination for an additional fiscal year depending on the jurisdiction. Foreign taxes are provided for based on the Fund's understanding of the tax rules and rates that exist in the foreign markets in which it invests.
Distributions are declared and recorded daily and paid monthly from net investment income. Distributions from realized gains, if any, are declared and recorded on the ex-dividend date. Income and capital gain distributions are declared separately for each class. Income and capital gain distributions are determined in accordance with income tax regulations, which may differ from GAAP.
Capital accounts within the financial statements are adjusted for permanent book-tax differences. These adjustments have no impact on net assets or the results of operations. Capital accounts are not adjusted for temporary book-tax differences which will reverse in a subsequent period.
Book-tax differences are primarily due to foreign currency transactions, market discount, partnerships, deferred trustees compensation and losses deferred due to wash sales.
As of period end, the cost and unrealized appreciation (depreciation) in securities, and derivatives if applicable, for federal income tax purposes were as follows:
| Gross unrealized appreciation | $89,373 |
| Gross unrealized depreciation | (168,415) |
| Net unrealized appreciation (depreciation) | $(79,042) |
| Tax cost | $1,918,065 |
Delayed Delivery Transactions and When-Issued Securities. During the period, certain Funds transacted in securities on a delayed delivery or when-issued basis. Payment and delivery may take place after the customary settlement period for that security. The price of the underlying securities and the date when the securities will be delivered and paid for are fixed at the time the transaction is negotiated. Securities purchased on a delayed delivery or when-issued basis are identified as such in the Schedule of Investments. Compensation for interest forgone in the purchase of a delayed delivery or when-issued debt security may be received. With respect to purchase commitments, each applicable Fund identifies securities as segregated in its records with a value at least equal to the amount of the commitment. Payables and receivables associated with the purchases and sales of delayed delivery securities having the same coupon, settlement date and broker are offset. Delayed delivery or when-issued securities that have been purchased from and sold to different brokers are reflected as both payables and receivables in the Statement of Assets and Liabilities under the caption "Delayed delivery", as applicable. Losses may arise due to changes in the value of the underlying securities or if the counterparty does not perform under the contract's terms, or if the issuer does not issue the securities due to political, economic, or other factors.
Restricted Securities (including Private Placements). Funds may invest in securities that are subject to legal or contractual restrictions on resale. These securities generally may be resold in transactions exempt from registration or to the public if the securities are registered. Disposal of these securities may involve time-consuming negotiations and expense, and prompt sale at an acceptable price may be difficult. Information regarding restricted securities held at period end is included at the end of the Schedule of Investments, if applicable.
Loans and Other Direct Debt Instruments. Direct debt instruments are interests in amounts owed to lenders by corporate or other borrowers. These instruments may be in the form of loans, trade claims or other receivables and may include standby financing commitments such as revolving credit facilities that obligate a fund to supply additional cash to the borrower on demand. Loans may be acquired through assignment, participation, or may be made directly to a borrower. Such instruments are presented in the Bank Loan Obligations section in the Schedule of Investments. Certain funds may also invest in unfunded loan commitments, which are contractual obligations for future funding. Information regarding unfunded commitments is included at the end of the Schedule of Investments, if applicable.
Commitments. A commitment is an agreement to acquire an investment at a future date (subject to conditions) in connection with a potential public or non-public offering. The amount of commitments outstanding at period end are presented in the table below. These commitments are not included in the net assets of the Fund at period end.
| | Investment to be Acquired | Commitment Amount |
| Fidelity Advisor High Income Advantage Fund | Fidelity Private Credit Central Fund LLC | $11,840 |
New Accounting Pronouncement. In June 2022, the Financial Accounting Standards Board (FASB) issued Accounting Standards Update (ASU) 2022-03 Fair Value Measurement (Topic 820): Fair Value Measurement of Equity Securities Subject to Contractual Sale Restrictions. The amendments in this ASU clarify that a contractual restriction on the sale of an equity security is not considered part of the unit of account of the equity security and, therefore, is not considered in measuring fair value. They also clarify that an entity cannot, as a separate unit of account, recognize and measure a contractual sale restriction. They also require additional disclosures for equity securities subject to contractual sale restrictions. ASU 2022-03 will be effective for fiscal years, including interim periods within those fiscal years, beginning after December 15, 2023, and allows for early adoption. ASU 2022-03 will only be applicable to an equity security in which the contractual arrangement that restricts its sale is executed or modified on or after the adoption date. Management is currently evaluating the potential impact of ASU 2022-03 to the financial statements.
5. Purchases and Sales of Investments.
Purchases and sales of securities, other than short-term securities and in-kind transactions, as applicable, are noted in the table below.
| | Purchases ($) | Sales ($) |
| Fidelity Advisor High Income Advantage Fund | 209,303 | 179,180 |
6. Fees and Other Transactions with Affiliates.
Management Fee. Fidelity Management & Research Company LLC (the investment adviser) and its affiliates provide the Fund with investment management related services for which the Fund pays a monthly management fee. The management fee is the sum of an individual fund fee rate that is based on an annual rate of .45% of the Fund's average net assets and an annualized group fee rate that averaged .10% during the period. The group fee rate is based upon the monthly average net assets of a group of registered investment companies with which the investment adviser has management contracts. The group fee rate decreases as assets under management increase and increases as assets under management decrease. For the reporting period, the total annualized management fee rate was .55% of the Fund's average net assets.
Distribution and Service Plan Fees. In accordance with Rule 12b-1 of the 1940 Act, the Fund has adopted separate Distribution and Service Plans for each class of shares. Certain classes pay Fidelity Distributors Company LLC (FDC), an affiliate of the investment adviser, separate Distribution and Service Fees, each of which is based on an annual percentage of each class' average net assets. In addition, FDC may pay financial intermediaries for selling shares of the Fund and providing shareholder support services. For the period, the Distribution and Service Fee rates, total fees and amounts retained by FDC were as follows:
| | Distribution Fee | Service Fee | Total Fees | Retained by FDC |
| Class A | - % | .25% | $585 | $14 |
| Class M | - % | .25% | 297 | 3 |
| Class C | .75% | .25% | 283 | 41 |
| | | | $1,165 | $58 |
Sales Load. FDC may receive a front-end sales charge of up to 4.00% for selling Class A shares and Class M shares, some of which is paid to financial intermediaries for selling shares of the Fund. Depending on the holding period, FDC may receive contingent deferred sales charges levied on Class A, Class M and Class C redemptions. The deferred sales charges are 1.00% for Class C shares, 1.00% for certain purchases of Class A shares and .25% for certain purchases of Class M shares.
For the period, sales charge amounts retained by FDC were as follows:
| | Retained by FDC |
| Class A | $103 |
| Class M | 2 |
Class C A | 22 |
| | $127 |
A When Class C shares are initially sold, FDC pays commissions from its own resources to financial intermediaries through which the sales are made.
Transfer Agent Fees. Fidelity Investments Institutional Operations Company LLC (FIIOC), an affiliate of the investment adviser, is the transfer, dividend disbursing and shareholder servicing agent for each class of the Fund. FIIOC receives account fees and asset-based fees that vary according to the account size and type of account of the shareholders of the respective classes of the Fund, except for Class Z. FIIOC receives an asset-based fee of Class Z's average net assets. FIIOC pays for typesetting, printing and mailing of shareholder reports, except proxy statements.
For the period, transfer agent fees for each class were as follows:
| | Amount | % of Class-Level Average Net Assets A |
| Class A | $348 | .15 |
| Class M | 171 | .15 |
| Class C | 48 | .17 |
| Class I | 521 | .15 |
| Class Z | 87 | .05 |
| | $1,175 | |
A Annualized
Accounting Fees. Fidelity Service Company, Inc. (FSC), an affiliate of the investment adviser, maintains the Fund's accounting records. The accounting fee is based on the level of average net assets for each month. For the period, the fees were equivalent to the following annualized rates:
| | % of Average Net Assets |
| Fidelity Advisor High Income Advantage Fund | .03 |
Brokerage Commissions. A portion of portfolio transactions were placed with brokerage firms which are affiliates of the investment adviser. Brokerage commissions are included in net realized gain (loss) and change in net unrealized appreciation (depreciation) in the Statement of Operations. The commissions paid to these affiliated firms were as follows:
| | Amount |
| Fidelity Advisor High Income Advantage Fund | $1 |
Interfund Trades. Funds may purchase from or sell securities to other Fidelity Funds under procedures adopted by the Board. The procedures have been designed to ensure these interfund trades are executed in accordance with Rule 17a-7 of the 1940 Act. Any interfund trades are included within the respective purchases and sales amounts shown in the Purchases and Sales of Investments note. Interfund trades during the period are noted in the table below.
| | Purchases ($) | Sales ($) | Realized Gain (Loss) ($) |
| Fidelity Advisor High Income Advantage Fund | 3,570 | 897 | (472) |
7. Committed Line of Credit.
Certain Funds participate with other funds managed by the investment adviser or an affiliate in a $4.25 billion credit facility (the "line of credit") to be utilized for temporary or emergency purposes to fund shareholder redemptions or for other short-term liquidity purposes. The participating funds have agreed to pay commitment fees on their pro-rata portion of the line of credit, which are reflected in Miscellaneous expenses on the Statement of Operations, and are listed below. During the period, there were no borrowings on this line of credit.
| | Amount |
| Fidelity Advisor High Income Advantage Fund | $2 |
8. Security Lending.
Funds lend portfolio securities from time to time in order to earn additional income. Lending agents are used, including National Financial Services (NFS), an affiliate of the investment adviser. Pursuant to a securities lending agreement, NFS will receive a fee, which is capped at 9.9% of a fund's daily lending revenue, for its services as lending agent. A fund may lend securities to certain qualified borrowers, including NFS. On the settlement date of the loan, a fund receives collateral (in the form of U.S. Treasury obligations, letters of credit and/or cash) against the loaned securities and maintains collateral in an amount not less than 100% of the market value of the loaned securities during the period of the loan. The market value of the loaned securities is determined at the close of business of a fund and any additional required collateral is delivered to a fund on the next business day. A fund or borrower may terminate the loan at any time, and if the borrower defaults on its obligation to return the securities loaned because of insolvency or other reasons, a fund may apply collateral received from the borrower against the obligation. A fund may experience delays and costs in recovering the securities loaned. Any cash collateral received is invested in the Fidelity Securities Lending Cash Central Fund. Any loaned securities are identified as such in the Schedule of Investments, and the value of loaned securities and cash collateral at period end, as applicable, are presented in the Statement of Assets and Liabilities. Security lending income represents the income earned on investing cash collateral, less rebates paid to borrowers and any lending agent fees associated with the loan, plus any premium payments received for lending certain types of securities. Security lending income is presented in the Statement of Operations as a component of income from Fidelity Central Funds. Affiliated security lending activity, if any, was as follows:
| | Total Security Lending Fees Paid to NFS | Security Lending Income From Securities Loaned to NFS | Value of Securities Loaned to NFS at Period End |
| Fidelity Advisor High Income Advantage Fund | $- A | $- | $- |
A Amount represents less than five hundred dollars.
9. Expense Reductions.
The investment adviser contractually agreed to reimburse expenses of each class to the extent annual operating expenses exceeded certain levels of class-level average net assets as noted in the table below. This reimbursement will remain in place through February 29, 2024. Some expenses, for example the compensation of the independent Trustees, and certain other expenses such as interest expense, are excluded from this reimbursement.
The following classes were in reimbursement during the period:
| | Expense Limitations | Reimbursement |
| Class A | 1.00% | $10 |
| Class C | 1.75% | 9 |
| Class I | .75% | 3 |
| | | $22 |
Through arrangements with the Fund's custodian, credits realized as a result of certain uninvested cash balances were used to reduce the Fund's expenses. During the period, custodian credits reduced the Fund's expenses by $4.
In addition, during the period the investment adviser or an affiliate reimbursed and/or waived a portion of fund-level operating expenses in the amount of $22.
10. Distributions to Shareholders.
Distributions to shareholders of each class were as follows:
| | Six months ended April 30, 2023 | Year ended October 31, 2022 |
| Fidelity Advisor High Income Advantage Fund | | |
| Distributions to shareholders | | |
| Class A | $27,989 | $30,360 |
| Class M | 14,247 | 15,770 |
| Class C | 3,201 | 3,323 |
| Class I | 44,621 | 51,542 |
| Class Z | 21,977 | 17,726 |
Total | $112,035 | $118,721 |
11. Share Transactions.
Share transactions for each class were as follows and may contain in-kind transactions, automatic conversions between classes or exchanges between affiliated funds:
| | Shares | Shares | Dollars | Dollars |
| | Six months ended April 30, 2023 | Year ended October 31, 2022 | Six months ended April 30, 2023 | Year ended October 31, 2022 |
| Fidelity Advisor High Income Advantage Fund | | | | |
| Class A | | | | |
| Shares sold | 4,072 | 6,812 | $43,833 | $81,309 |
| Reinvestment of distributions | 2,411 | 2,336 | 25,956 | 27,862 |
| Shares redeemed | (5,061) | (10,414) | (54,554) | (122,480) |
| Net increase (decrease) | 1,422 | (1,266) | $15,235 | $(13,309) |
| Class M | | | | |
| Shares sold | 617 | 1,587 | $6,697 | $18,925 |
| Reinvestment of distributions | 1,247 | 1,238 | 13,501 | 14,858 |
| Shares redeemed | (1,985) | (4,119) | (21,535) | (48,599) |
| Net increase (decrease) | (121) | (1,294) | $(1,337) | $(14,816) |
| Class C | | | | |
| Shares sold | 636 | 1,146 | $6,868 | $13,607 |
| Reinvestment of distributions | 285 | 267 | 3,057 | 3,187 |
| Shares redeemed | (836) | (1,763) | (8,982) | (20,501) |
| Net increase (decrease) | 85 | (350) | $943 | $(3,707) |
| Class I | | | | |
| Shares sold | 15,283 | 30,137 | $154,078 | $335,242 |
| Reinvestment of distributions | 3,985 | 4,179 | 40,006 | 46,661 |
| Shares redeemed | (14,729) | (40,602) | (148,491) | (442,243) |
| Net increase (decrease) | 4,539 | (6,286) | $45,593 | $(60,340) |
| Class Z | | | | |
| Shares sold | 5,617 | 23,041 | $56,681 | $244,497 |
| Reinvestment of distributions | 1,856 | 1,225 | 18,632 | 13,627 |
| Shares redeemed | (5,520) | (21,230) | (55,608) | (235,886) |
| Net increase (decrease) | 1,953 | 3,036 | $19,705 | $22,238 |
12. Other.
A fund's organizational documents provide former and current trustees and officers with a limited indemnification against liabilities arising in connection with the performance of their duties to the fund. In the normal course of business, a fund may also enter into contracts that provide general indemnifications. A fund's maximum exposure under these arrangements is unknown as this would be dependent on future claims that may be made against a fund. The risk of material loss from such claims is considered remote.
13. Litigation.
The Fund and other entities managed by FMR or its affiliates are involved with proceedings pending in the United States Bankruptcy Court for the Southern District of Texas ("Bankruptcy Court"), relating to the In re Sanchez Energy Corporation chapter 11 bankruptcy case (Case No. 19-34508). A Bankruptcy Court-appointed representative of unsecured creditors asserts that eight million shares of Mesquite Energy, Inc. (formerly known as Sanchez Energy Corporation) (the "Company"), currently held in escrow pursuant to the terms of the Company's confirmed chapter 11 plan, should be awarded to the unsecured creditors instead of the Company's current equity holders, including the Fund, which were providers of debtor-in-possession financing to the Company during its chapter 11 case and holders of secured notes issued by the Company in 2018. The unsecured creditors also assert that convertible notes and additional equity issued by the Company in 2020 in connection with two post-bankruptcy financings, also held by the Fund, are invalid. If the unsecured creditors prevail in the two disputes, the current value of the Fund's holdings in Mesquite may be diluted. Both disputes are pending before the Bankruptcy Court. At this time, Management cannot determine the amount of loss that may be realized. The Fund is also incurring legal costs in defending the disputes.
14. Risk and Uncertainties.
Many factors affect a fund's performance. Developments that disrupt global economies and financial markets, such as pandemics, epidemics, outbreaks of infectious diseases, war, terrorism, and environmental disasters, may significantly affect a fund's investment performance. The effects of these developments to a fund will be impacted by the types of securities in which a fund invests, the financial condition, industry, economic sector, and geographic location of an issuer, and a fund's level of investment in the securities of that issuer. Significant concentrations in security types, issuers, industries, sectors, and geographic locations may magnify the factors that affect a fund's performance.
As a shareholder, you incur two types of costs: (1) transaction costs, which may include sales charges (loads) on purchase payments or redemption proceeds, as applicable and (2) ongoing costs, which generally include management fees, distribution and/or service (12b-1) fees and other Fund expenses. This Example is intended to help you understand your ongoing costs (in dollars) of investing in a fund and to compare these costs with the ongoing costs of investing in other mutual funds.
| The Example is based on an investment of $1,000 invested at the beginning of the period and held for the entire period (November 1, 2022 to April 30, 2023). |
Actual Expenses
The first line of the accompanying table provides information about actual account values and actual expenses. You may use the information in this line, together with the amount you invested, to estimate the expenses that you paid over the period. Simply divide your account value by $1,000.00 (for example, an $8,600 account value divided by $1,000.00 = 8.6), then multiply the result by the number in the first line for a class/Fund under the heading entitled "Expenses Paid During Period" to estimate the expenses you paid on your account during this period. If any fund is a shareholder of any underlying mutual funds or exchange-traded funds (ETFs) (the Underlying Funds), such fund indirectly bears its proportional share of the expenses of the Underlying Funds in addition to the direct expenses incurred presented in the table. These fees and expenses are not included in the annualized expense ratio used to calculate the expense estimate in the table below.
Hypothetical Example for Comparison Purposes
The second line of the accompanying table provides information about hypothetical account values and hypothetical expenses based on the actual expense ratio and an assumed rate of return of 5% per year before expenses, which is not the actual return. The hypothetical account values and expenses may not be used to estimate the actual ending account balance or expenses you paid for the period. You may use this information to compare the ongoing costs of investing in the Fund and other funds. To do so, compare this 5% hypothetical example with the 5% hypothetical examples that appear in the shareholder reports of the other funds. If any fund is a shareholder of any Underlying Funds, such fund indirectly bears its proportional share of the expenses of the Underlying Funds in addition to the direct expenses as presented in the table. These fees and expenses are not included in the annualized expense ratio used to calculate the expense estimate in the table below.
Please note that the expenses shown in the table are meant to highlight your ongoing costs only and do not reflect any transaction costs. Therefore, the second line of the table is useful in comparing ongoing costs only, and will not help you determine the relative total costs of owning different funds. In addition, if these transactional costs were included, your costs would have been higher.
| | | | | Annualized Expense Ratio- A | | Beginning Account Value November 1, 2022 | | Ending Account Value April 30, 2023 | | Expenses Paid During Period- C November 1, 2022 to April 30, 2023 |
| Fidelity Advisor® High Income Advantage Fund | | | | | | | | | | |
| Class A | | | | 1.01% | | | | | | |
| Actual | | | | | | $ 1,000 | | $ 1,055.20 | | $ 5.15 |
Hypothetical- B | | | | | | $ 1,000 | | $ 1,019.79 | | $ 5.06 |
| Class M | | | | 1.01% | | | | | | |
| Actual | | | | | | $ 1,000 | | $ 1,056.00 | | $ 5.15 |
Hypothetical- B | | | | | | $ 1,000 | | $ 1,019.79 | | $ 5.06 |
| Class C | | | | 1.76% | | | | | | |
| Actual | | | | | | $ 1,000 | | $ 1,051.40 | | $ 8.95 |
Hypothetical- B | | | | | | $ 1,000 | | $ 1,016.07 | | $ 8.80 |
| Class I | | | | .76% | | | | | | |
| Actual | | | | | | $ 1,000 | | $ 1,056.70 | | $ 3.88 |
Hypothetical- B | | | | | | $ 1,000 | | $ 1,021.03 | | $ 3.81 |
| Class Z | | | | .66% | | | | | | |
| Actual | | | | | | $ 1,000 | | $ 1,057.30 | | $ 3.37 |
Hypothetical- B | | | | | | $ 1,000 | | $ 1,021.52 | | $ 3.31 |
| |
A Annualized expense ratio reflects expenses net of applicable fee waivers.
B 5% return per year before expenses
C Expenses are equal to the annualized expense ratio, multiplied by the average account value over the period, multiplied by 181/ 365 (to reflect the one-half year period). The fees and expenses of any Underlying Funds are not included in each annualized expense ratio.
The Securities and Exchange Commission adopted Rule 22e-4 under the Investment Company Act of 1940 (the Liquidity Rule) to promote effective liquidity risk management throughout the open-end investment company industry, thereby reducing the risk that funds will be unable to meet their redemption obligations and mitigating dilution of the interests of fund shareholders.
The Fund has adopted and implemented a liquidity risk management program (the Program) reasonably designed to assess and manage the Fund's liquidity risk and to comply with the requirements of the Liquidity Rule. The Fund's Board of Trustees (the Board) has designated the Fund's investment adviser as administrator of the Program. The Fidelity advisers have established a Liquidity Risk Management Committee (the LRM Committee) to manage the Program for each of the Fidelity Funds. The LRM Committee monitors the adequacy and effectiveness of implementation of the Program and on a periodic basis assesses each Fund's liquidity risk based on a variety of factors including (1) the Fund's investment strategy, (2) portfolio liquidity and cash flow projections during normal and reasonably foreseeable stressed conditions, (3) shareholder redemptions, (4) borrowings and other funding sources and (5) certain factors specific to ETFs including the effect of the Fund's prices and spreads, market participants, and basket compositions on the overall liquidity of the Fund's portfolio, as applicable.
In accordance with the Program, each of the Fund's portfolio investments is classified into one of four defined liquidity categories based on a determination of a reasonable expectation for how long it would take to convert the investment to cash (or sell or dispose of the investment) without significantly changing its market value.
- Highly liquid investments - cash or convertible to cash within three business days or less
- Moderately liquid investments - convertible to cash in three to seven calendar days
- Less liquid investments - can be sold or disposed of, but not settled, within seven calendar days
- Illiquid investments - cannot be sold or disposed of within seven calendar days
Liquidity classification determinations take into account a variety of factors including various market, trading and investment-specific considerations, as well as market depth, and generally utilize analysis from a third-party liquidity metrics service.
The Liquidity Rule places a 15% limit on a fund's illiquid investments and requires funds that do not primarily hold assets that are highly liquid investments to determine and maintain a minimum percentage of the fund's net assets to be invested in highly liquid investments (highly liquid investment minimum or HLIM). The Program includes provisions reasonably designed to comply with the 15% limit on illiquid investments and for determining, periodically reviewing and complying with the HLIM requirement as applicable.
At a recent meeting of the Fund's Board of Trustees, the LRM Committee provided a written report to the Board pertaining to the operation, adequacy, and effectiveness of the Program for the period December 1, 2021 through November 30, 2022. The report concluded that the Program is operating effectively and is reasonably designed to assess and manage the Fund's liquidity risk.
1.703458.125
HY-SANN-0623
Fidelity Advisor® Value Fund
Semi-Annual Report
April 30, 2023
Contents
To view a fund's proxy voting guidelines and proxy voting record for the 12-month period ended June 30, visit http://www.fidelity.com/proxyvotingresults or visit the Securities and Exchange Commission's (SEC) web site at http://www.sec.gov.
You may also call 1-877-208-0098 to request a free copy of the proxy voting guidelines.
Standard & Poor's, S&P and S&P 500 are registered service marks of The McGraw-Hill Companies, Inc. and have been licensed for use by Fidelity Distributors Corporation.
Other third-party marks appearing herein are the property of their respective owners.
All other marks appearing herein are registered or unregistered trademarks or service marks of FMR LLC or an affiliated company. © 2023 FMR LLC. All rights reserved.
This report and the financial statements contained herein are submitted for the general information of the shareholders of the Fund. This report is not authorized for distribution to prospective investors in the Fund unless preceded or accompanied by an effective prospectus.
A fund files its complete schedule of portfolio holdings with the SEC for the first and third quarters of each fiscal year on Form N-PORT. Forms N-PORT are available on the SEC's web site at http://www.sec.gov. A fund's Forms N-PORT may be reviewed and copied at the SEC's Public Reference Room in Washington, DC. Information regarding the operation of the SEC's Public Reference Room may be obtained by calling 1-800-SEC-0330.
For a complete list of a fund's portfolio holdings, view the most recent holdings listing, semiannual report, or annual report on Fidelity's web site at http://www.fidelity.com, http://www.institutional.fidelity.com, or http://www.401k.com, as applicable.
NOT FDIC INSURED •MAY LOSE VALUE •NO BANK GUARANTEE
Neither the Fund nor Fidelity Distributors Corporation is a bank.
Top Holdings (% of Fund's net assets) |
| |
| PG&E Corp. | 1.5 | |
| Edison International | 1.5 | |
| Hess Corp. | 1.4 | |
| Welltower, Inc. | 1.3 | |
| Antero Resources Corp. | 1.1 | |
| Denbury, Inc. | 1.1 | |
| Constellation Energy Corp. | 1.0 | |
| Celanese Corp. Class A | 1.0 | |
| Apollo Global Management, Inc. | 1.0 | |
| CubeSmart | 1.0 | |
| | 11.9 | |
| |
| Market Sectors (% of Fund's net assets) |
| |
| Financials | 15.7 | |
| Industrials | 15.4 | |
| Materials | 14.3 | |
| Consumer Discretionary | 13.3 | |
| Energy | 12.7 | |
| Utilities | 6.9 | |
| Health Care | 6.6 | |
| Real Estate | 6.0 | |
| Consumer Staples | 3.3 | |
| Information Technology | 3.2 | |
| Communication Services | 2.1 | |
| |
Asset Allocation (% of Fund's net assets) |
|
Futures - 0.3% |
|
Showing Percentage of Net Assets
| Common Stocks - 99.5% |
| | | Shares | Value ($) |
| COMMUNICATION SERVICES - 2.1% | | | |
| Diversified Telecommunication Services - 0.5% | | | |
| Cellnex Telecom SA (a) | | 45,640 | 1,921,626 |
| Interactive Media & Services - 0.1% | | | |
| Ziff Davis, Inc. (b) | | 4,040 | 295,486 |
| Media - 1.5% | | | |
| DISH Network Corp. Class A (b) | | 29,505 | 221,583 |
| News Corp. Class A | | 58,521 | 1,030,555 |
| Nexstar Broadcasting Group, Inc. Class A | | 6,833 | 1,185,184 |
| Scholastic Corp. (c) | | 34,655 | 1,333,178 |
| Thryv Holdings, Inc. (b) | | 70,240 | 1,577,590 |
| | | | 5,348,090 |
TOTAL COMMUNICATION SERVICES | | | 7,565,202 |
| CONSUMER DISCRETIONARY - 13.3% | | | |
| Automobile Components - 1.1% | | | |
| Adient PLC (b) | | 44,482 | 1,643,165 |
| Autoliv, Inc. | | 20,605 | 1,768,115 |
| Cie Automotive SA | | 24,770 | 745,674 |
| | | | 4,156,954 |
| Automobiles - 0.7% | | | |
| Harley-Davidson, Inc. | | 66,448 | 2,465,221 |
| Broadline Retail - 0.6% | | | |
| Kohl's Corp. (c) | | 66,300 | 1,460,589 |
| Nordstrom, Inc. (c) | | 41,605 | 643,213 |
| | | | 2,103,802 |
| Diversified Consumer Services - 0.7% | | | |
| Adtalem Global Education, Inc. (b) | | 44,219 | 1,793,965 |
| H&R Block, Inc. | | 23,300 | 790,103 |
| | | | 2,584,068 |
| Hotels, Restaurants & Leisure - 2.6% | | | |
| ARAMARK Holdings Corp. | | 49,598 | 1,721,051 |
| Bowlero Corp. Class A (b) | | 92,380 | 1,351,519 |
| Brinker International, Inc. (b) | | 31,108 | 1,241,831 |
| Hilton Grand Vacations, Inc. (b) | | 42,520 | 1,819,856 |
| Hyatt Hotels Corp. Class A (b) | | 9,484 | 1,084,021 |
| Red Rock Resorts, Inc. | | 44,300 | 2,161,840 |
| | | | 9,380,118 |
| Household Durables - 1.1% | | | |
| Mohawk Industries, Inc. (b) | | 13,960 | 1,478,364 |
| Tempur Sealy International, Inc. | | 62,972 | 2,359,561 |
| | | | 3,837,925 |
| Leisure Products - 1.2% | | | |
| BRP, Inc. | | 11,420 | 853,181 |
| Brunswick Corp. | | 14,810 | 1,255,740 |
| Mattel, Inc. (b) | | 122,671 | 2,208,078 |
| | | | 4,316,999 |
| Specialty Retail - 4.5% | | | |
| Academy Sports & Outdoors, Inc. | | 19,489 | 1,237,941 |
| American Eagle Outfitters, Inc. | | 163,410 | 2,188,060 |
| Bath & Body Works, Inc. | | 28,130 | 987,363 |
| Camping World Holdings, Inc. | | 54,082 | 1,210,896 |
| Franchise Group, Inc. (c) | | 61,620 | 1,802,385 |
| Lithia Motors, Inc. Class A (sub. vtg.) (c) | | 8,916 | 1,969,455 |
| Sally Beauty Holdings, Inc. (b) | | 66,020 | 939,465 |
| Signet Jewelers Ltd. (c) | | 23,098 | 1,699,551 |
| Upbound Group, Inc. | | 79,364 | 2,115,844 |
| Victoria's Secret & Co. (b) | | 62,554 | 1,939,800 |
| | | | 16,090,760 |
| Textiles, Apparel & Luxury Goods - 0.8% | | | |
| Capri Holdings Ltd. (b) | | 47,118 | 1,955,397 |
| Wolverine World Wide, Inc. | | 53,940 | 902,956 |
| | | | 2,858,353 |
TOTAL CONSUMER DISCRETIONARY | | | 47,794,200 |
| CONSUMER STAPLES - 3.3% | | | |
| Beverages - 0.4% | | | |
| Primo Water Corp. | | 92,680 | 1,407,809 |
| Consumer Staples Distribution & Retail - 0.8% | | | |
| U.S. Foods Holding Corp. (b) | | 75,697 | 2,906,765 |
| Food Products - 1.4% | | | |
| Bunge Ltd. | | 24,460 | 2,289,456 |
| Darling Ingredients, Inc. (b) | | 43,129 | 2,569,195 |
| | | | 4,858,651 |
| Household Products - 0.6% | | | |
| Energizer Holdings, Inc. | | 47,720 | 1,595,280 |
| Spectrum Brands Holdings, Inc. | | 6,070 | 403,655 |
| | | | 1,998,935 |
| Personal Care Products - 0.1% | | | |
| Olaplex Holdings, Inc. (b) | | 135,980 | 503,126 |
TOTAL CONSUMER STAPLES | | | 11,675,286 |
| ENERGY - 12.7% | | | |
| Energy Equipment & Services - 2.8% | | | |
| Championx Corp. | | 29,460 | 797,777 |
| Expro Group Holdings NV (b) | | 140,570 | 2,795,937 |
| Liberty Oilfield Services, Inc. Class A | | 42,098 | 539,275 |
| TechnipFMC PLC (b) | | 162,775 | 2,228,390 |
| Tenaris SA | | 80,470 | 1,151,145 |
| Valaris Ltd. (b) | | 30,300 | 1,818,000 |
| Vallourec SA (b) | | 64,320 | 732,485 |
| | | | 10,063,009 |
| Oil, Gas & Consumable Fuels - 9.9% | | | |
| Advantage Energy Ltd. (b) | | 112,430 | 632,333 |
| Antero Resources Corp. (b) | | 178,668 | 4,107,577 |
| APA Corp. | | 11,981 | 441,500 |
| Arch Resources, Inc. | | 5,050 | 617,363 |
| Canadian Natural Resources Ltd. | | 35,976 | 2,192,256 |
| Cenovus Energy, Inc. (Canada) | | 130,543 | 2,191,053 |
| Delek U.S. Holdings, Inc. | | 54,540 | 1,186,245 |
| Denbury, Inc. (b) | | 41,037 | 3,832,035 |
| Devon Energy Corp. | | 13,208 | 705,703 |
| Diamondback Energy, Inc. | | 3,638 | 517,324 |
| Energy Transfer LP | | 125,606 | 1,617,805 |
| EQT Corp. | | 16,468 | 573,745 |
| Genesis Energy LP | | 157,337 | 1,755,881 |
| Hess Corp. | | 34,827 | 5,052,005 |
| Imperial Oil Ltd. | | 33,691 | 1,717,312 |
| Kosmos Energy Ltd. (b) | | 254,374 | 1,627,994 |
| Parkland Corp. | | 40,190 | 947,758 |
| Talos Energy, Inc. (b) | | 60,680 | 827,068 |
| Targa Resources Corp. | | 30,895 | 2,333,499 |
| The Williams Companies, Inc. | | 12,802 | 387,389 |
| Tourmaline Oil Corp. (c) | | 27,755 | 1,246,962 |
| Valero Energy Corp. | | 6,917 | 793,172 |
| | | | 35,303,979 |
TOTAL ENERGY | | | 45,366,988 |
| FINANCIALS - 15.7% | | | |
| Banks - 4.3% | | | |
| Axos Financial, Inc. (b) | | 31,821 | 1,294,160 |
| Bank of Kyoto Ltd. | | 16,072 | 790,782 |
| Comerica, Inc. | | 19,730 | 855,690 |
| East West Bancorp, Inc. | | 43,540 | 2,250,583 |
| First Citizens Bancshares, Inc. | | 2,449 | 2,466,584 |
| First Citizens Bancshares, Inc. Class B | | 210 | 193,820 |
| M&T Bank Corp. | | 17,827 | 2,242,637 |
| New York Community Bancorp, Inc. | | 92,840 | 992,460 |
| Popular, Inc. | | 15,840 | 950,558 |
| U.S. Bancorp | | 61,410 | 2,105,135 |
| Wintrust Financial Corp. | | 16,075 | 1,099,048 |
| | | | 15,241,457 |
| Capital Markets - 2.4% | | | |
| Ameriprise Financial, Inc. | | 7,165 | 2,186,185 |
| Carlyle Group LP (c) | | 23,410 | 710,025 |
| LPL Financial | | 10,222 | 2,134,762 |
| Onex Corp. (sub. vtg.) | | 9,440 | 434,706 |
| Petershill Partners PLC (a) | | 352,894 | 739,757 |
| Raymond James Financial, Inc. | | 21,020 | 1,902,941 |
| UBS Group AG | | 29,630 | 598,832 |
| | | | 8,707,208 |
| Consumer Finance - 1.7% | | | |
| OneMain Holdings, Inc. | | 57,567 | 2,208,846 |
| PROG Holdings, Inc. (b) | | 55,190 | 1,668,394 |
| SLM Corp. | | 150,920 | 2,266,818 |
| | | | 6,144,058 |
| Financial Services - 4.0% | | | |
| Apollo Global Management, Inc. | | 54,861 | 3,477,639 |
| Corebridge Financial, Inc. (c) | | 53,250 | 897,795 |
| ECN Capital Corp. | | 166,658 | 388,707 |
| Essent Group Ltd. | | 39,003 | 1,656,457 |
| Global Payments, Inc. | | 24,990 | 2,816,623 |
| Voya Financial, Inc. (c) | | 27,170 | 2,077,962 |
| Walker & Dunlop, Inc. | | 27,119 | 1,825,380 |
| WEX, Inc. (b) | | 7,330 | 1,299,976 |
| | | | 14,440,539 |
| Insurance - 3.3% | | | |
| AMBAC Financial Group, Inc. (b) | | 21,573 | 344,089 |
| American Financial Group, Inc. | | 15,733 | 1,930,911 |
| Assurant, Inc. | | 19,880 | 2,447,824 |
| First American Financial Corp. | | 32,709 | 1,884,365 |
| Primerica, Inc. | | 2,910 | 531,104 |
| Reinsurance Group of America, Inc. | | 14,717 | 2,094,523 |
| The Travelers Companies, Inc. | | 13,890 | 2,516,035 |
| | | | 11,748,851 |
TOTAL FINANCIALS | | | 56,282,113 |
| HEALTH CARE - 6.6% | | | |
| Biotechnology - 0.6% | | | |
| Biogen, Inc. (b) | | 2,081 | 633,103 |
| BioMarin Pharmaceutical, Inc. (b) | | 2,931 | 281,493 |
| Exact Sciences Corp. (b) | | 2,759 | 176,769 |
| Galapagos NV (b) | | 20,210 | 784,134 |
| Poseida Therapeutics, Inc. (b) | | 19,940 | 52,642 |
| United Therapeutics Corp. (b) | | 788 | 181,342 |
| | | | 2,109,483 |
| Health Care Equipment & Supplies - 0.6% | | | |
| Align Technology, Inc. (b) | | 354 | 115,156 |
| Hologic, Inc. (b) | | 3,925 | 337,589 |
| Masimo Corp. (b) | | 440 | 83,222 |
| STERIS PLC | | 2,070 | 390,299 |
| Teleflex, Inc. | | 1,081 | 294,594 |
| The Cooper Companies, Inc. | | 1,389 | 529,834 |
| Zimmer Biomet Holdings, Inc. | | 2,521 | 349,007 |
| | | | 2,099,701 |
| Health Care Providers & Services - 3.7% | | | |
| Acadia Healthcare Co., Inc. (b) | | 1,229 | 88,844 |
| AdaptHealth Corp. (b) | | 142,912 | 1,697,795 |
| agilon health, Inc. (b) | | 5,854 | 142,077 |
| Amedisys, Inc. (b) | | 112 | 8,994 |
| AmerisourceBergen Corp. | | 3,598 | 600,326 |
| Centene Corp. (b) | | 49,216 | 3,392,459 |
| Cigna Group | | 8,799 | 2,228,699 |
| Encompass Health Corp. | | 1,659 | 106,425 |
| Laboratory Corp. of America Holdings | | 1,688 | 382,686 |
| Molina Healthcare, Inc. (b) | | 1,451 | 432,238 |
| Owens & Minor, Inc. (b) | | 125,830 | 1,955,398 |
| Premier, Inc. | | 12,980 | 432,623 |
| Quest Diagnostics, Inc. | | 1,257 | 174,484 |
| Tenet Healthcare Corp. (b) | | 21,858 | 1,602,629 |
| | | | 13,245,677 |
| Health Care Technology - 0.0% | | | |
| Evolent Health, Inc. (b) | | 2,222 | 80,903 |
| Life Sciences Tools & Services - 0.8% | | | |
| Agilent Technologies, Inc. | | 2,790 | 377,850 |
| Avantor, Inc. (b) | | 6,692 | 130,360 |
| Bio-Rad Laboratories, Inc. Class A (b) | | 1,066 | 480,542 |
| Charles River Laboratories International, Inc. (b) | | 248 | 47,150 |
| IQVIA Holdings, Inc. (b) | | 1,067 | 200,841 |
| PerkinElmer, Inc. | | 2,685 | 350,366 |
| Syneos Health, Inc. (b) | | 34,510 | 1,354,863 |
| | | | 2,941,972 |
| Pharmaceuticals - 0.9% | | | |
| Catalent, Inc. (b) | | 2,906 | 145,649 |
| Elanco Animal Health, Inc. (b) | | 23,720 | 224,628 |
| Jazz Pharmaceuticals PLC (b) | | 15,097 | 2,120,676 |
| Royalty Pharma PLC | | 12,073 | 424,366 |
| Viatris, Inc. | | 23,792 | 221,979 |
| | | | 3,137,298 |
TOTAL HEALTH CARE | | | 23,615,034 |
| INDUSTRIALS - 15.4% | | | |
| Air Freight & Logistics - 1.2% | | | |
| C.H. Robinson Worldwide, Inc. (c) | | 10,320 | 1,040,978 |
| Deutsche Post AG | | 11,380 | 547,373 |
| FedEx Corp. | | 11,254 | 2,563,436 |
| | | | 4,151,787 |
| Building Products - 1.3% | | | |
| Builders FirstSource, Inc. (b) | | 24,165 | 2,290,117 |
| Carlisle Companies, Inc. | | 4,980 | 1,074,933 |
| UFP Industries, Inc. | | 14,537 | 1,141,445 |
| | | | 4,506,495 |
| Commercial Services & Supplies - 0.7% | | | |
| HNI Corp. | | 17,279 | 448,908 |
| The Brink's Co. | | 31,975 | 2,009,629 |
| | | | 2,458,537 |
| Construction & Engineering - 2.2% | | | |
| Fluor Corp. (b) | | 59,600 | 1,731,976 |
| Granite Construction, Inc. | | 48,843 | 1,862,384 |
| MDU Resources Group, Inc. (c) | | 72,781 | 2,126,661 |
| Willscot Mobile Mini Holdings (b) | | 49,792 | 2,260,557 |
| | | | 7,981,578 |
| Electrical Equipment - 2.1% | | | |
| Generac Holdings, Inc. (b) | | 13,300 | 1,359,526 |
| GrafTech International Ltd. | | 234,455 | 1,104,283 |
| Regal Rexnord Corp. | | 22,149 | 2,882,914 |
| Sensata Technologies, Inc. PLC | | 46,520 | 2,021,294 |
| | | | 7,368,017 |
| Ground Transportation - 2.9% | | | |
| ArcBest Corp. | | 4,890 | 461,616 |
| Knight-Swift Transportation Holdings, Inc. Class A | | 17,290 | 973,773 |
| RXO, Inc. | | 42,733 | 773,040 |
| Ryder System, Inc. | | 21,952 | 1,737,720 |
| TFI International, Inc. (Canada) | | 14,713 | 1,585,705 |
| U-Haul Holding Co. (non-vtg.) | | 33,840 | 1,830,744 |
| XPO, Inc. (b) | | 70,333 | 3,107,312 |
| | | | 10,469,910 |
| Machinery - 3.2% | | | |
| Allison Transmission Holdings, Inc. | | 45,544 | 2,222,092 |
| Chart Industries, Inc. (b)(c) | | 16,860 | 2,244,066 |
| Crane Nxt Co. | | 6,440 | 304,998 |
| Flowserve Corp. | | 61,305 | 2,046,974 |
| Gates Industrial Corp. PLC (b) | | 62,680 | 844,300 |
| Kennametal, Inc. (c) | | 62,570 | 1,624,317 |
| Timken Co. | | 28,720 | 2,207,132 |
| | | | 11,493,879 |
| Professional Services - 1.0% | | | |
| Concentrix Corp. | | 21,226 | 2,048,521 |
| Manpower, Inc. | | 21,019 | 1,591,348 |
| | | | 3,639,869 |
| Trading Companies & Distributors - 0.8% | | | |
| Beacon Roofing Supply, Inc. (b) | | 12,918 | 777,405 |
| Custom Truck One Source, Inc. Class A (b) | | 162,934 | 1,023,226 |
| Herc Holdings, Inc. | | 12,628 | 1,263,053 |
| | | | 3,063,684 |
TOTAL INDUSTRIALS | | | 55,133,756 |
| INFORMATION TECHNOLOGY - 3.2% | | | |
| Communications Equipment - 0.6% | | | |
| Lumentum Holdings, Inc. (b) | | 41,935 | 2,023,364 |
| Electronic Equipment, Instruments & Components - 1.8% | | | |
| Coherent Corp. (b)(c) | | 26,000 | 887,640 |
| Flex Ltd. (b) | | 114,647 | 2,358,289 |
| Knowles Corp. (b) | | 66,980 | 1,130,622 |
| Vontier Corp. | | 77,174 | 2,093,731 |
| | | | 6,470,282 |
| IT Services - 0.0% | | | |
| Cyxtera Technologies, Inc. Class A (b)(c) | | 304,669 | 99,078 |
| Semiconductors & Semiconductor Equipment - 0.3% | | | |
| Skyworks Solutions, Inc. | | 10,370 | 1,098,183 |
| Software - 0.5% | | | |
| NCR Corp. (b) | | 88,202 | 1,966,023 |
TOTAL INFORMATION TECHNOLOGY | | | 11,656,930 |
| MATERIALS - 14.3% | | | |
| Chemicals - 6.7% | | | |
| Axalta Coating Systems Ltd. (b) | | 67,913 | 2,144,013 |
| Cabot Corp. | | 21,722 | 1,558,771 |
| Celanese Corp. Class A | | 33,146 | 3,521,431 |
| CF Industries Holdings, Inc. | | 16,020 | 1,146,712 |
| Corteva, Inc. | | 28,135 | 1,719,611 |
| Eastman Chemical Co. | | 20,214 | 1,703,434 |
| Methanex Corp. (c) | | 70,122 | 3,140,764 |
| Olin Corp. | | 35,515 | 1,967,531 |
| The Chemours Co. LLC | | 80,900 | 2,351,763 |
| Trinseo PLC | | 15,967 | 289,322 |
| Tronox Holdings PLC | | 112,737 | 1,543,370 |
| Westlake Corp. | | 24,666 | 2,806,497 |
| | | | 23,893,219 |
| Construction Materials - 1.2% | | | |
| Eagle Materials, Inc. | | 10,046 | 1,488,918 |
| GCC S.A.B. de CV | | 146,008 | 1,160,707 |
| Martin Marietta Materials, Inc. | | 3,272 | 1,188,390 |
| Summit Materials, Inc. | | 16,195 | 443,905 |
| | | | 4,281,920 |
| Containers & Packaging - 1.8% | | | |
| Crown Holdings, Inc. | | 31,568 | 2,707,903 |
| Graphic Packaging Holding Co. | | 20,970 | 517,120 |
| O-I Glass, Inc. (b) | | 93,257 | 2,095,485 |
| WestRock Co. | | 37,960 | 1,136,143 |
| | | | 6,456,651 |
| Metals & Mining - 3.8% | | | |
| Arconic Corp. (b) | | 107,989 | 2,672,728 |
| ATI, Inc. (b) | | 38,596 | 1,490,578 |
| Carpenter Technology Corp. | | 29,205 | 1,540,272 |
| Constellium NV (b) | | 214,039 | 3,178,479 |
| First Quantum Minerals Ltd. | | 45,042 | 1,094,426 |
| Freeport-McMoRan, Inc. | | 47,298 | 1,793,067 |
| Schnitzer Steel Industries, Inc. Class A | | 22,667 | 654,850 |
| Steel Dynamics, Inc. | | 12,674 | 1,317,462 |
| | | | 13,741,862 |
| Paper & Forest Products - 0.8% | | | |
| Louisiana-Pacific Corp. | | 50,407 | 3,011,314 |
TOTAL MATERIALS | | | 51,384,966 |
| REAL ESTATE - 6.0% | | | |
| Equity Real Estate Investment Trusts (REITs) - 5.2% | | | |
| CubeSmart | | 74,698 | 3,398,012 |
| Douglas Emmett, Inc. | | 63,570 | 818,782 |
| Equity Lifestyle Properties, Inc. | | 19,409 | 1,337,280 |
| Essex Property Trust, Inc. | | 11,820 | 2,597,209 |
| Lamar Advertising Co. Class A | | 11,924 | 1,260,128 |
| Outfront Media, Inc. | | 84,690 | 1,410,935 |
| Prologis (REIT), Inc. | | 23,266 | 2,914,067 |
| Welltower, Inc. | | 60,191 | 4,768,331 |
| | | | 18,504,744 |
| Real Estate Management & Development - 0.8% | | | |
| Compass, Inc. (b) | | 175,500 | 410,670 |
| Jones Lang LaSalle, Inc. (b) | | 17,181 | 2,388,846 |
| WeWork, Inc. (b)(c) | | 273,771 | 115,394 |
| | | | 2,914,910 |
TOTAL REAL ESTATE | | | 21,419,654 |
| UTILITIES - 6.9% | | | |
| Electric Utilities - 4.8% | | | |
| Constellation Energy Corp. | | 45,749 | 3,540,973 |
| Edison International | | 70,459 | 5,185,782 |
| Entergy Corp. | | 27,573 | 2,966,303 |
| PG&E Corp. (b) | | 321,760 | 5,505,311 |
| | | | 17,198,369 |
| Independent Power and Renewable Electricity Producers - 1.2% | | | |
| The AES Corp. | | 109,493 | 2,590,604 |
| Vistra Corp. | | 70,156 | 1,673,922 |
| | | | 4,264,526 |
| Multi-Utilities - 0.9% | | | |
| Algonquin Power & Utilities Corp. | | 154,540 | 1,314,021 |
| Sempra Energy | | 13,106 | 2,037,852 |
| | | | 3,351,873 |
TOTAL UTILITIES | | | 24,814,768 |
| TOTAL COMMON STOCKS (Cost $328,887,666) | | | 356,708,897 |
| | | | |
| U.S. Treasury Obligations - 0.1% |
| | | Principal Amount (d) | Value ($) |
U.S. Treasury Bills, yield at date of purchase 4.46% 6/1/23 (e) (Cost $239,083) | | 240,000 | 239,116 |
| | | | |
| Money Market Funds - 4.5% |
| | | Shares | Value ($) |
| Fidelity Cash Central Fund 4.88% (f) | | 2,013,300 | 2,013,702 |
| Fidelity Securities Lending Cash Central Fund 4.88% (f)(g) | | 14,153,324 | 14,154,739 |
| TOTAL MONEY MARKET FUNDS (Cost $16,168,427) | | | 16,168,441 |
| | | | |
| TOTAL INVESTMENT IN SECURITIES - 104.1% (Cost $345,295,176) | 373,116,454 |
NET OTHER ASSETS (LIABILITIES) - (4.1)% | (14,746,627) |
| NET ASSETS - 100.0% | 358,369,827 |
| | |
| Futures Contracts |
| | Number of contracts | Expiration Date | Notional Amount ($) | Value ($) | Unrealized Appreciation/ (Depreciation) ($) |
| Purchased | | | | | |
| | | | | | |
| Equity Index Contracts | | | | | |
| CME E-mini S&P MidCap 400 Index Contracts (United States) | 5 | Jun 2023 | 1,250,300 | 2,979 | 2,979 |
| | | | | | |
| The notional amount of futures purchased as a percentage of Net Assets is 0.3% |
Legend
| (a) | Security exempt from registration under Rule 144A of the Securities Act of 1933. These securities may be resold in transactions exempt from registration, normally to qualified institutional buyers. At the end of the period, the value of these securities amounted to $2,661,383 or 0.7% of net assets. |
| (c) | Security or a portion of the security is on loan at period end. |
| (d) | Amount is stated in United States dollars unless otherwise noted. |
| (e) | Security or a portion of the security was pledged to cover margin requirements for futures contracts. At period end, the value of securities pledged amounted to $218,193. |
| (f) | Affiliated fund that is generally available only to investment companies and other accounts managed by Fidelity Investments. The rate quoted is the annualized seven-day yield of the fund at period end. A complete unaudited listing of the fund's holdings as of its most recent quarter end is available upon request. In addition, each Fidelity Central Fund's financial statements are available on the SEC's website or upon request. |
| (g) | Investment made with cash collateral received from securities on loan. |
Affiliated Central Funds
Fiscal year to date information regarding the Fund's investments in Fidelity Central Funds, including the ownership percentage, is presented below.
| Affiliate | Value, beginning of period ($) | Purchases ($) | Sales Proceeds ($) | Dividend Income ($) | Realized Gain (loss) ($) | Change in Unrealized appreciation (depreciation) ($) | Value, end of period ($) | % ownership, end of period |
| Fidelity Cash Central Fund 4.88% | 8,563,889 | 95,094,411 | 101,644,598 | 129,258 | - | - | 2,013,702 | 0.0% |
| Fidelity Securities Lending Cash Central Fund 4.88% | 10,739,930 | 74,697,299 | 71,282,490 | 31,958 | - | - | 14,154,739 | 0.0% |
| Total | 19,303,819 | 169,791,710 | 172,927,088 | 161,216 | - | - | 16,168,441 | |
| | | | | | | | | |
Amounts in the dividend income column in the above table include any capital gain distributions from underlying funds, which are presented in the corresponding line item in the Statement of Operations, if applicable.
Amounts in the dividend income column for Fidelity Securities Lending Cash Central Fund represents the income earned on investing cash collateral, less rebates paid to borrowers and any lending agent fees associated with the loan, plus any premium payments received for lending certain types of securities.
Amounts included in the purchases and sales proceeds columns may include in-kind transactions, if applicable.
Investment Valuation
The following is a summary of the inputs used, as of April 30, 2023, involving the Fund's assets and liabilities carried at fair value. The inputs or methodology used for valuing securities may not be an indication of the risk associated with investing in those securities. For more information on valuation inputs, and their aggregation into the levels used below, please refer to the Investment Valuation section in the accompanying Notes to Financial Statements.
| Valuation Inputs at Reporting Date: |
| Description | Total ($) | Level 1 ($) | Level 2 ($) | Level 3 ($) |
Investments in Securities: | | | | |
|
| Equities: | | | | |
Communication Services | 7,565,202 | 5,643,576 | 1,921,626 | - |
Consumer Discretionary | 47,794,200 | 47,794,200 | - | - |
Consumer Staples | 11,675,286 | 11,675,286 | - | - |
Energy | 45,366,988 | 44,215,843 | 1,151,145 | - |
Financials | 56,282,113 | 55,491,331 | 790,782 | - |
Health Care | 23,615,034 | 22,830,900 | 784,134 | - |
Industrials | 55,133,756 | 54,586,383 | 547,373 | - |
Information Technology | 11,656,930 | 11,656,930 | - | - |
Materials | 51,384,966 | 51,384,966 | - | - |
Real Estate | 21,419,654 | 21,419,654 | - | - |
Utilities | 24,814,768 | 24,814,768 | - | - |
|
| U.S. Government and Government Agency Obligations | 239,116 | - | 239,116 | - |
|
| Money Market Funds | 16,168,441 | 16,168,441 | - | - |
| Total Investments in Securities: | 373,116,454 | 367,682,278 | 5,434,176 | - |
Derivative Instruments: | | | | |
|
| Assets | | | | |
Futures Contracts | 2,979 | 2,979 | - | - |
| Total Assets | 2,979 | 2,979 | - | - |
| Total Derivative Instruments: | 2,979 | 2,979 | - | - |
Value of Derivative Instruments
The following table is a summary of the Fund's value of derivative instruments by primary risk exposure as of April 30, 2023. For additional information on derivative instruments, please refer to the Derivative Instruments section in the accompanying Notes to Financial Statements.
Primary Risk Exposure / Derivative Type | Value |
| Asset ($) | Liability ($) |
| Equity Risk | | |
Futures Contracts (a) | 2,979 | 0 |
| Total Equity Risk | 2,979 | 0 |
| Total Value of Derivatives | 2,979 | 0 |
(a)Reflects gross cumulative appreciation (depreciation) on futures contracts as presented in the Schedule of Investments. In the Statement of Assets and Liabilities, the period end daily variation margin is included in receivable or payable for daily variation margin on futures contracts, and the net cumulative appreciation (depreciation) is included in Total accumulated earnings (loss).
| Statement of Assets and Liabilities |
| | | | April 30, 2023 (Unaudited) |
| | | | | |
| Assets | | | | |
| Investment in securities, at value (including securities loaned of $13,712,920) - See accompanying schedule: | | | | |
Unaffiliated issuers (cost $329,126,749) | $ | 356,948,013 | | |
Fidelity Central Funds (cost $16,168,427) | | 16,168,441 | | |
| | | | | |
| | | | | |
| Total Investment in Securities (cost $345,295,176) | | | $ | 373,116,454 |
| Receivable for investments sold | | | | 2,753,866 |
| Receivable for fund shares sold | | | | 339,144 |
| Dividends receivable | | | | 222,239 |
| Distributions receivable from Fidelity Central Funds | | | | 11,021 |
| Receivable for daily variation margin on futures contracts | | | | 17,129 |
| Prepaid expenses | | | | 142 |
| Receivable from investment adviser for expense reductions | | | | 823 |
Total assets | | | | 376,460,818 |
| Liabilities | | | | |
| Payable to custodian bank | $ | 381,369 | | |
| Payable for investments purchased | | 1,503,444 | | |
| Payable for fund shares redeemed | | 1,701,444 | | |
| Accrued management fee | | 202,905 | | |
| Distribution and service plan fees payable | | 41,737 | | |
| Other affiliated payables | | 61,351 | | |
| Other payables and accrued expenses | | 44,348 | | |
| Collateral on securities loaned | | 14,154,393 | | |
| Total Liabilities | | | | 18,090,991 |
| Net Assets | | | $ | 358,369,827 |
| Net Assets consist of: | | | | |
| Paid in capital | | | $ | 345,374,870 |
| Total accumulated earnings (loss) | | | | 12,994,957 |
| Net Assets | | | $ | 358,369,827 |
| | | | | |
| Net Asset Value and Maximum Offering Price | | | | |
| Class A : | | | | |
Net Asset Value and redemption price per share ($98,164,407 ÷ 3,252,681 shares) (a) | | | $ | 30.18 |
| Maximum offering price per share (100/94.25 of $30.18) | | | $ | 32.02 |
| Class M : | | | | |
Net Asset Value and redemption price per share ($22,707,147 ÷ 760,718 shares) (a) | | | $ | 29.85 |
| Maximum offering price per share (100/96.50 of $29.85) | | | $ | 30.93 |
| Class C : | | | | |
Net Asset Value and offering price per share ($13,966,423 ÷ 495,676 shares) (a) | | | $ | 28.18 |
| Class I : | | | | |
Net Asset Value , offering price and redemption price per share ($164,537,420 ÷ 5,389,665 shares) | | | $ | 30.53 |
| Class Z : | | | | |
Net Asset Value , offering price and redemption price per share ($58,994,430 ÷ 1,932,943 shares) | | | $ | 30.52 |
(a)Redemption price per share is equal to net asset value less any applicable contingent deferred sales charge. |
| Statement of Operations |
| | | | Six months ended April 30, 2023 (Unaudited) |
| Investment Income | | | | |
| Dividends | | | $ | 3,529,610 |
| Interest | | | | 11,155 |
| Income from Fidelity Central Funds (including $31,958 from security lending) | | | | 161,216 |
| Total Income | | | | 3,701,981 |
| Expenses | | | | |
| Management fee | | | | |
| Basic fee | $ | 1,067,095 | | |
| Performance adjustment | | 239,199 | | |
| Transfer agent fees | | 314,696 | | |
| Distribution and service plan fees | | 273,726 | | |
| Accounting fees | | 71,764 | | |
| Custodian fees and expenses | | 28,016 | | |
| Independent trustees' fees and expenses | | 1,257 | | |
| Registration fees | | 72,598 | | |
| Audit | | 31,002 | | |
| Legal | | 1,458 | | |
| Interest | | 6,741 | | |
| Miscellaneous | | 832 | | |
| Total expenses before reductions | | 2,108,384 | | |
| Expense reductions | | (69,285) | | |
| Total expenses after reductions | | | | 2,039,099 |
| Net Investment income (loss) | | | | 1,662,882 |
| Realized and Unrealized Gain (Loss) | | | | |
| Net realized gain (loss) on: | | | | |
| Investment Securities: | | | | |
| Unaffiliated issuers | | (11,193,081) | | |
| Foreign currency transactions | | 406 | | |
| Futures contracts | | 331,705 | | |
| Total net realized gain (loss) | | | | (10,860,970) |
| Change in net unrealized appreciation (depreciation) on: | | | | |
| Investment Securities: | | | | |
| Unaffiliated issuers | | 15,820,571 | | |
| Assets and liabilities in foreign currencies | | 880 | | |
| Futures contracts | | 52,615 | | |
| Total change in net unrealized appreciation (depreciation) | | | | 15,874,066 |
| Net gain (loss) | | | | 5,013,096 |
| Net increase (decrease) in net assets resulting from operations | | | $ | 6,675,978 |
| Statement of Changes in Net Assets |
| |
| | Six months ended April 30, 2023 (Unaudited) | | Year ended October 31, 2022 |
| Increase (Decrease) in Net Assets | | | | |
| Operations | | | | |
| Net investment income (loss) | $ | 1,662,882 | $ | 3,312,639 |
| Net realized gain (loss) | | (10,860,970) | | (3,866,612) |
| Change in net unrealized appreciation (depreciation) | | 15,874,066 | | (30,032,655) |
| Net increase (decrease) in net assets resulting from operations | | 6,675,978 | | (30,586,628) |
| Distributions to shareholders | | (2,171,130) | | (13,471,817) |
| Share transactions - net increase (decrease) | | (43,843,584) | | 151,885,468 |
| Total increase (decrease) in net assets | | (39,338,736) | | 107,827,023 |
| | | | | |
| Net Assets | | | | |
| Beginning of period | | 397,708,563 | | 289,881,540 |
| End of period | $ | 358,369,827 | $ | 397,708,563 |
| | | | | |
| | | | | |
Financial Highlights
| Fidelity Advisor® Value Fund Class A |
| |
| | Six months ended (Unaudited) April 30, 2023 | | Years ended October 31, 2022 | | 2021 | | 2020 | | 2019 | | 2018 |
Selected Per-Share Data | | | | | | | | | | | | |
| Net asset value, beginning of period | $ | 29.71 | $ | 33.55 | $ | 20.40 | $ | 22.44 | $ | 23.40 | $ | 25.37 |
| Income from Investment Operations | | | | | | | | | | | | |
Net investment income (loss) A,B | | .10 | | .24 | | .11 | | .14 | | .19 | | .17 |
| Net realized and unrealized gain (loss) | | .49 | | (2.61) | | 13.15 | | (1.46) | | 1.57 | | (1.31) |
| Total from investment operations | | .59 | | (2.37) | | 13.26 | | (1.32) | | 1.76 | | (1.14) |
| Distributions from net investment income | | (.12) | | (.24) | | (.11) | | (.17) C | | (.10) C | | (.22) |
| Distributions from net realized gain | | - | | (1.24) | | - | | (.55) C | | (2.62) C | | (.61) |
| Total distributions | | (.12) | | (1.47) D | | (.11) | | (.72) | | (2.72) | | (.83) |
| Net asset value, end of period | $ | 30.18 | $ | 29.71 | $ | 33.55 | $ | 20.40 | $ | 22.44 | $ | 23.40 |
Total Return E,F,G | | 1.98% | | (7.25)% | | 65.21% | | (6.24)% | | 9.00% | | (4.73)% |
Ratios to Average Net Assets B,H,I | | | | | | | | | | | | |
| Expenses before reductions | | 1.19% J | | 1.15% | | 1.21% | | 1.17% | | 1.10% | | 1.12% |
| Expenses net of fee waivers, if any | | 1.15% J | | 1.15% | | 1.20% | | 1.16% | | 1.10% | | 1.12% |
| Expenses net of all reductions | | 1.15% J | | 1.15% | | 1.20% | | 1.14% | | 1.10% | | 1.11% |
| Net investment income (loss) | | .68% J | | .76% | | .35% | | .71% | | .87% | | .66% |
| Supplemental Data | | | | | | | | | | | | |
| Net assets, end of period (000 omitted) | $ | 98,164 | $ | 108,439 | $ | 100,604 | $ | 36,269 | $ | 47,465 | $ | 45,006 |
Portfolio turnover rate K | | 76% J | | 67% | | 64% | | 91% | | 77% | | 98% |
A Calculated based on average shares outstanding during the period.
B Net investment income (loss) is affected by the timing of the declaration of dividends by any underlying mutual funds or exchange-traded funds (ETFs). Net investment income (loss) of any mutual funds or ETFs is not included in the Fund's net investment income (loss) ratio.
C The amount shown reflects reclassifications related to book to tax differences that were made in the year shown.
D Total distributions per share do not sum due to rounding.
E Total returns for periods of less than one year are not annualized.
F Total returns would have been lower if certain expenses had not been reduced during the applicable periods shown.
G Total returns do not include the effect of the sales charges.
H Fees and expenses of any underlying mutual funds or exchange-traded funds (ETFs) are not included in the Fund's expense ratio. The Fund indirectly bears its proportionate share of these expenses. For additional expense information related to investments in Fidelity Central Funds, please refer to the "Investments in Fidelity Central Funds" note found in the Notes to Financial Statements section of the most recent Annual or Semi-Annual report.
I Expense ratios reflect operating expenses of the class. Expenses before reductions do not reflect amounts reimbursed, waived, or reduced through arrangements with the investment adviser, brokerage services, or other offset arrangements, if applicable, and do not represent the amount paid by the class during periods when reimbursements, waivers or reductions occur.
J Annualized.
K Amount does not include the portfolio activity of any underlying mutual funds or exchange-traded funds (ETFs).
| Fidelity Advisor® Value Fund Class M |
| |
| | Six months ended (Unaudited) April 30, 2023 | | Years ended October 31, 2022 | | 2021 | | 2020 | | 2019 | | 2018 |
Selected Per-Share Data | | | | | | | | | | | | |
| Net asset value, beginning of period | $ | 29.34 | $ | 33.13 | $ | 20.15 | $ | 22.19 | $ | 23.15 | $ | 25.10 |
| Income from Investment Operations | | | | | | | | | | | | |
Net investment income (loss) A,B | | .07 | | .16 | | .03 | | .09 | | .12 | | .10 |
| Net realized and unrealized gain (loss) | | .48 | | (2.57) | | 13.01 | | (1.47) | | 1.57 | | (1.30) |
| Total from investment operations | | .55 | | (2.41) | | 13.04 | | (1.38) | | 1.69 | | (1.20) |
| Distributions from net investment income | | (.04) | | (.15) | | (.06) | | (.11) C | | (.03) C | | (.14) |
| Distributions from net realized gain | | - | | (1.24) | | - | | (.55) C | | (2.62) C | | (.61) |
| Total distributions | | (.04) | | (1.38) D | | (.06) | | (.66) | | (2.65) | | (.75) |
| Net asset value, end of period | $ | 29.85 | $ | 29.34 | $ | 33.13 | $ | 20.15 | $ | 22.19 | $ | 23.15 |
Total Return E,F,G | | 1.86% | | (7.46)% | | 64.81% | | (6.55)% | | 8.74% | | (5.01)% |
Ratios to Average Net Assets B,H,I | | | | | | | | | | | | |
| Expenses before reductions | | 1.43% J | | 1.40% | | 1.47% | | 1.45% | | 1.39% | | 1.39% |
| Expenses net of fee waivers, if any | | 1.40% J | | 1.40% | | 1.45% | | 1.43% | | 1.38% | | 1.39% |
| Expenses net of all reductions | | 1.40% J | | 1.40% | | 1.45% | | 1.42% | | 1.38% | | 1.37% |
| Net investment income (loss) | | .43% J | | .51% | | .10% | | .43% | | .58% | | .40% |
| Supplemental Data | | | | | | | | | | | | |
| Net assets, end of period (000 omitted) | $ | 22,707 | $ | 22,540 | $ | 23,323 | $ | 12,736 | $ | 15,006 | $ | 14,961 |
Portfolio turnover rate K | | 76% J | | 67% | | 64% | | 91% | | 77% | | 98% |
A Calculated based on average shares outstanding during the period.
B Net investment income (loss) is affected by the timing of the declaration of dividends by any underlying mutual funds or exchange-traded funds (ETFs). Net investment income (loss) of any mutual funds or ETFs is not included in the Fund's net investment income (loss) ratio.
C The amount shown reflects reclassifications related to book to tax differences that were made in the year shown.
D Total distributions per share do not sum due to rounding.
E Total returns for periods of less than one year are not annualized.
F Total returns would have been lower if certain expenses had not been reduced during the applicable periods shown.
G Total returns do not include the effect of the sales charges.
H Fees and expenses of any underlying mutual funds or exchange-traded funds (ETFs) are not included in the Fund's expense ratio. The Fund indirectly bears its proportionate share of these expenses. For additional expense information related to investments in Fidelity Central Funds, please refer to the "Investments in Fidelity Central Funds" note found in the Notes to Financial Statements section of the most recent Annual or Semi-Annual report.
I Expense ratios reflect operating expenses of the class. Expenses before reductions do not reflect amounts reimbursed, waived, or reduced through arrangements with the investment adviser, brokerage services, or other offset arrangements, if applicable, and do not represent the amount paid by the class during periods when reimbursements, waivers or reductions occur.
J Annualized.
K Amount does not include the portfolio activity of any underlying mutual funds or exchange-traded funds (ETFs).
| Fidelity Advisor® Value Fund Class C |
| |
| | Six months ended (Unaudited) April 30, 2023 | | Years ended October 31, 2022 | | 2021 | | 2020 | | 2019 | | 2018 |
Selected Per-Share Data | | | | | | | | | | | | |
| Net asset value, beginning of period | $ | 27.73 | $ | 31.45 | $ | 19.18 | $ | 21.15 | $ | 22.16 | $ | 24.02 |
| Income from Investment Operations | | | | | | | | | | | | |
Net investment income (loss) A,B | | (.01) | | - C | | (.12) | | (.02) | | .01 | | (.04) |
| Net realized and unrealized gain (loss) | | .46 | | (2.43) | | 12.39 | | (1.40) | | 1.49 | | (1.25) |
| Total from investment operations | | .45 | | (2.43) | | 12.27 | | (1.42) | | 1.50 | | (1.29) |
| Distributions from net investment income | | - | | (.08) | | - | | - | | - | | - |
| Distributions from net realized gain | | - | | (1.21) | | - | | (.55) | | (2.51) | | (.57) |
| Total distributions | | - | | (1.29) | | - | | (.55) | | (2.51) | | (.57) |
| Net asset value, end of period | $ | 28.18 | $ | 27.73 | $ | 31.45 | $ | 19.18 | $ | 21.15 | $ | 22.16 |
Total Return D,E,F | | 1.62% | | (7.94)% | | 63.97% | | (7.02)% | | 8.13% | | (5.55)% |
Ratios to Average Net Assets B,G,H | | | | | | | | | | | | |
| Expenses before reductions | | 1.98% I | | 1.93% | | 2.01% | | 1.98% | | 1.92% | | 1.93% |
| Expenses net of fee waivers, if any | | 1.90% I | | 1.90% | | 1.96% | | 1.97% | | 1.92% | | 1.93% |
| Expenses net of all reductions | | 1.90% I | | 1.90% | | 1.96% | | 1.95% | | 1.91% | | 1.92% |
| Net investment income (loss) | | (.07)% I | | -% J | | (.41)% | | (.11)% | | .05% | | (.15)% |
| Supplemental Data | | | | | | | | | | | | |
| Net assets, end of period (000 omitted) | $ | 13,966 | $ | 14,661 | $ | 15,726 | $ | 6,331 | $ | 8,777 | $ | 14,405 |
Portfolio turnover rate K | | 76% I | | 67% | | 64% | | 91% | | 77% | | 98% |
A Calculated based on average shares outstanding during the period.
B Net investment income (loss) is affected by the timing of the declaration of dividends by any underlying mutual funds or exchange-traded funds (ETFs). Net investment income (loss) of any mutual funds or ETFs is not included in the Fund's net investment income (loss) ratio.
C Amount represents less than $.005 per share.
D Total returns for periods of less than one year are not annualized.
E Total returns would have been lower if certain expenses had not been reduced during the applicable periods shown.
F Total returns do not include the effect of the contingent deferred sales charge.
G Fees and expenses of any underlying mutual funds or exchange-traded funds (ETFs) are not included in the Fund's expense ratio. The Fund indirectly bears its proportionate share of these expenses. For additional expense information related to investments in Fidelity Central Funds, please refer to the "Investments in Fidelity Central Funds" note found in the Notes to Financial Statements section of the most recent Annual or Semi-Annual report.
H Expense ratios reflect operating expenses of the class. Expenses before reductions do not reflect amounts reimbursed, waived, or reduced through arrangements with the investment adviser, brokerage services, or other offset arrangements, if applicable, and do not represent the amount paid by the class during periods when reimbursements, waivers or reductions occur.
I Annualized.
J Amount represents less than .005%.
K Amount does not include the portfolio activity of any underlying mutual funds or exchange-traded funds (ETFs).
| Fidelity Advisor® Value Fund Class I |
| |
| | Six months ended (Unaudited) April 30, 2023 | | Years ended October 31, 2022 | | 2021 | | 2020 | | 2019 | | 2018 |
Selected Per-Share Data | | | | | | | | | | | | |
| Net asset value, beginning of period | $ | 30.09 | $ | 33.96 | $ | 20.64 | $ | 22.70 | $ | 23.66 | $ | 25.65 |
| Income from Investment Operations | | | | | | | | | | | | |
Net investment income (loss) A,B | | .14 | | .32 | | .20 | | .21 | | .26 | | .25 |
| Net realized and unrealized gain (loss) | | .49 | | (2.63) | | 13.30 | | (1.48) | | 1.59 | | (1.34) |
| Total from investment operations | | .63 | | (2.31) | | 13.50 | | (1.27) | | 1.85 | | (1.09) |
| Distributions from net investment income | | (.19) | | (.33) | | (.18) | | (.25) C | | (.19) C | | (.29) |
| Distributions from net realized gain | | - | | (1.24) | | - | | (.55) C | | (2.62) C | | (.61) |
| Total distributions | | (.19) | | (1.56) D | | (.18) | | (.79) D | | (2.81) | | (.90) |
| Net asset value, end of period | $ | 30.53 | $ | 30.09 | $ | 33.96 | $ | 20.64 | $ | 22.70 | $ | 23.66 |
Total Return E,F | | 2.11% | | (6.99)% | | 65.68% | | (5.95)% | | 9.34% | | (4.48)% |
Ratios to Average Net Assets B,G,H | | | | | | | | | | | | |
| Expenses before reductions | | .92% I | | .88% | | .92% | | .87% | | .79% | | .82% |
| Expenses net of fee waivers, if any | | .90% I | | .88% | | .92% | | .85% | | .79% | | .81% |
| Expenses net of all reductions | | .90% I | | .88% | | .92% | | .84% | | .79% | | .80% |
| Net investment income (loss) | | .93% I | | 1.02% | | .63% | | 1.01% | | 1.18% | | .97% |
| Supplemental Data | | | | | | | | | | | | |
| Net assets, end of period (000 omitted) | $ | 164,537 | $ | 170,764 | $ | 104,393 | $ | 8,861 | $ | 11,097 | $ | 12,342 |
Portfolio turnover rate J | | 76% I | | 67% | | 64% | | 91% | | 77% | | 98% |
A Calculated based on average shares outstanding during the period.
B Net investment income (loss) is affected by the timing of the declaration of dividends by any underlying mutual funds or exchange-traded funds (ETFs). Net investment income (loss) of any mutual funds or ETFs is not included in the Fund's net investment income (loss) ratio.
C The amount shown reflects reclassifications related to book to tax differences that were made in the year shown.
D Total distributions per share do not sum due to rounding.
E Total returns for periods of less than one year are not annualized.
F Total returns would have been lower if certain expenses had not been reduced during the applicable periods shown.
G Fees and expenses of any underlying mutual funds or exchange-traded funds (ETFs) are not included in the Fund's expense ratio. The Fund indirectly bears its proportionate share of these expenses. For additional expense information related to investments in Fidelity Central Funds, please refer to the "Investments in Fidelity Central Funds" note found in the Notes to Financial Statements section of the most recent Annual or Semi-Annual report.
H Expense ratios reflect operating expenses of the class. Expenses before reductions do not reflect amounts reimbursed, waived, or reduced through arrangements with the investment adviser, brokerage services, or other offset arrangements, if applicable, and do not represent the amount paid by the class during periods when reimbursements, waivers or reductions occur.
I Annualized.
J Amount does not include the portfolio activity of any underlying mutual funds or exchange-traded funds (ETFs).
| Fidelity Advisor® Value Fund Class Z |
| |
| | Six months ended (Unaudited) April 30, 2023 | | Years ended October 31, 2022 | | 2021 | | 2020 | | 2019 | | 2018 |
Selected Per-Share Data | | | | | | | | | | | | |
| Net asset value, beginning of period | $ | 30.10 | $ | 33.96 | $ | 20.63 | $ | 22.69 | $ | 23.67 | $ | 25.67 |
| Income from Investment Operations | | | | | | | | | | | | |
Net investment income (loss) A,B | | .17 | | .36 | | .25 | | .23 | | .28 | | .28 |
| Net realized and unrealized gain (loss) | | .49 | | (2.62) | | 13.28 | | (1.47) | | 1.58 | | (1.34) |
| Total from investment operations | | .66 | | (2.26) | | 13.53 | | (1.24) | | 1.86 | | (1.06) |
| Distributions from net investment income | | (.24) | | (.36) | | (.20) | | (.27) C | | (.22) C | | (.33) |
| Distributions from net realized gain | | - | | (1.24) | | - | | (.55) C | | (2.62) C | | (.61) |
| Total distributions | | (.24) | | (1.60) | | (.20) | | (.82) | | (2.84) | | (.94) |
| Net asset value, end of period | $ | 30.52 | $ | 30.10 | $ | 33.96 | $ | 20.63 | $ | 22.69 | $ | 23.67 |
Total Return D,E | | 2.18% | | (6.86)% | | 65.88% | | (5.84)% | | 9.45% | | (4.36)% |
Ratios to Average Net Assets B,F,G | | | | | | | | | | | | |
| Expenses before reductions | | .79% H | | .76% | | .77% | | .75% | | .69% | | .70% |
| Expenses net of fee waivers, if any | | .75% H | | .75% | | .77% | | .74% | | .68% | | .70% |
| Expenses net of all reductions | | .75% H | | .75% | | .77% | | .72% | | .68% | | .68% |
| Net investment income (loss) | | 1.08% H | | 1.16% | | .78% | | 1.13% | | 1.28% | | 1.09% |
| Supplemental Data | | | | | | | | | | | | |
| Net assets, end of period (000 omitted) | $ | 58,994 | $ | 81,306 | $ | 45,835 | $ | 1,712 | $ | 2,772 | $ | 834 |
Portfolio turnover rate I | | 76% H | | 67% | | 64% | | 91% | | 77% | | 98% |
A Calculated based on average shares outstanding during the period.
B Net investment income (loss) is affected by the timing of the declaration of dividends by any underlying mutual funds or exchange-traded funds (ETFs). Net investment income (loss) of any mutual funds or ETFs is not included in the Fund's net investment income (loss) ratio.
C The amount shown reflects reclassifications related to book to tax differences that were made in the year shown.
D Total returns for periods of less than one year are not annualized.
E Total returns would have been lower if certain expenses had not been reduced during the applicable periods shown.
F Fees and expenses of any underlying mutual funds or exchange-traded funds (ETFs) are not included in the Fund's expense ratio. The Fund indirectly bears its proportionate share of these expenses. For additional expense information related to investments in Fidelity Central Funds, please refer to the "Investments in Fidelity Central Funds" note found in the Notes to Financial Statements section of the most recent Annual or Semi-Annual report.
G Expense ratios reflect operating expenses of the class. Expenses before reductions do not reflect amounts reimbursed, waived, or reduced through arrangements with the investment adviser, brokerage services, or other offset arrangements, if applicable, and do not represent the amount paid by the class during periods when reimbursements, waivers or reductions occur.
H Annualized.
I Amount does not include the portfolio activity of any underlying mutual funds or exchange-traded funds (ETFs).
For the period ended April 30, 2023
1. Organization.
Fidelity Advisor Value Fund (the Fund) is a fund of Fidelity Advisor Series I (the Trust) and is authorized to issue an unlimited number of shares. The Trust is registered under the Investment Company Act of 1940, as amended (the 1940 Act), as an open-end management investment company organized as a Massachusetts business trust. The Fund offers Class A, Class M, Class C, Class I and Class Z shares, each of which has equal rights as to assets and voting privileges. Class A, Class M, Class C, Class I and Class Z are Fidelity Advisor classes. Each class has exclusive voting rights with respect to matters that affect that class. Class C shares will automatically convert to Class A shares after a holding period of eight years from the initial date of purchase, with certain exceptions.
2. Investments in Fidelity Central Funds.
Funds may invest in Fidelity Central Funds, which are open-end investment companies generally available only to other investment companies and accounts managed by the investment adviser and its affiliates. The Schedule of Investments lists any Fidelity Central Funds held as an investment as of period end, but does not include the underlying holdings of each Fidelity Central Fund. An investing fund indirectly bears its proportionate share of the expenses of the underlying Fidelity Central Funds.
Based on its investment objective, each Fidelity Central Fund may invest or participate in various investment vehicles or strategies that are similar to those of the investing fund. These strategies are consistent with the investment objectives of the investing fund and may involve certain economic risks which may cause a decline in value of each of the Fidelity Central Funds and thus a decline in the value of the investing fund.
| Fidelity Central Fund | Investment Manager | Investment Objective | Investment Practices | Expense Ratio A |
| Fidelity Money Market Central Funds | Fidelity Management & Research Company LLC (FMR) | Each fund seeks to obtain a high level of current income consistent with the preservation of capital and liquidity. | Short-term Investments | Less than .005% |
A Expenses expressed as a percentage of average net assets and are as of each underlying Central Fund's most recent annual or semi-annual shareholder report.
A complete unaudited list of holdings for each Fidelity Central Fund is available upon request or at the Securities and Exchange Commission website at www.sec.gov. In addition, the financial statements of the Fidelity Central Funds which contain the significant accounting policies (including investment valuation policies) of those funds, and are not covered by the Report of Independent Registered Public Accounting Firm, are available on the Securities and Exchange Commission website or upon request.
3. Significant Accounting Policies.
The Fund is an investment company and applies the accounting and reporting guidance of the Financial Accounting Standards Board (FASB) Accounting Standards Codification Topic 946 Financial Services - Investment Companies . The financial statements have been prepared in conformity with accounting principles generally accepted in the United States of America (GAAP), which require management to make certain estimates and assumptions at the date of the financial statements. Actual results could differ from those estimates. Subsequent events, if any, through the date that the financial statements were issued have been evaluated in the preparation of the financial statements. The Fund's Schedule of Investments lists any underlying mutual funds or exchange-traded funds (ETFs) but does not include the underlying holdings of these funds. The following summarizes the significant accounting policies of the Fund:
Investment Valuation. Investments are valued as of 4:00 p.m. Eastern time on the last calendar day of the period. The Board of Trustees (the Board) has designated the Fund's investment adviser as the valuation designee responsible for the fair valuation function and performing fair value determinations as needed. The investment adviser has established a Fair Value Committee (the Committee) to carry out the day-to-day fair valuation responsibilities and has adopted policies and procedures to govern the fair valuation process and the activities of the Committee. In accordance with these fair valuation policies and procedures, which have been approved by the Board, the Fund attempts to obtain prices from one or more third party pricing services or brokers to value its investments. When current market prices, quotations or currency exchange rates are not readily available or reliable, investments will be fair valued in good faith by the Committee, in accordance with the policies and procedures. Factors used in determining fair value vary by investment type and may include market or investment specific events, transaction data, estimated cash flows, and market observations of comparable investments. The frequency that the fair valuation procedures are used cannot be predicted and they may be utilized to a significant extent. The Committee manages the Fund's fair valuation practices and maintains the fair valuation policies and procedures. The Fund's investment adviser reports to the Board information regarding the fair valuation process and related material matters.
The Fund categorizes the inputs to valuation techniques used to value its investments into a disclosure hierarchy consisting of three levels as shown below:
Level 1 - unadjusted quoted prices in active markets for identical investments
Level 2 - other significant observable inputs (including quoted prices for similar investments, interest rates, prepayment speeds, etc.)
Level 3 - unobservable inputs (including the Fund's own assumptions based on the best information available)
Valuation techniques used to value the Fund's investments by major category are as follows:
Equity securities, including restricted securities, for which market quotations are readily available, are valued at the last reported sale price or official closing price as reported by a third party pricing service on the primary market or exchange on which they are traded and are categorized as Level 1 in the hierarchy. In the event there were no sales during the day or closing prices are not available, securities are valued at the last quoted bid price or may be valued using the last available price and are generally categorized as Level 2 in the hierarchy. For foreign equity securities, when market or security specific events arise, comparisons to the valuation of American Depositary Receipts (ADRs), futures contracts, ETFs and certain indexes as well as quoted prices for similar securities may be used and would be categorized as Level 2 in the hierarchy. For equity securities, including restricted securities, where observable inputs are limited, assumptions about market activity and risk are used and these securities may be categorized as Level 3 in the hierarchy.
Debt securities, including restricted securities, are valued based on evaluated prices received from third party pricing services or from brokers who make markets in such securities. U.S. government and government agency obligations are valued by pricing services who utilize matrix pricing which considers yield or price of bonds of comparable quality, coupon, maturity and type or by broker-supplied prices. When independent prices are unavailable or unreliable, debt securities may be valued utilizing pricing methodologies which consider similar factors that would be used by third party pricing services. Debt securities are generally categorized as Level 2 in the hierarchy but may be Level 3 depending on the circumstances.
Futures contracts are valued at the settlement price established each day by the board of trade or exchange on which they are traded and are categorized as Level 1 in the hierarchy. Investments in open-end mutual funds, including the Fidelity Central Funds, are valued at their closing net asset value (NAV) each business day and are categorized as Level 1 in the hierarchy.
Changes in valuation techniques may result in transfers in or out of an assigned level within the disclosure hierarchy. The aggregate value of investments by input level as of April 30, 2023 is included at the end of the Fund's Schedule of Investments.
Foreign Currency. Certain Funds may use foreign currency contracts to facilitate transactions in foreign-denominated securities. Gains and losses from these transactions may arise from changes in the value of the foreign currency or if the counterparties do not perform under the contracts' terms.
Foreign-denominated assets, including investment securities, and liabilities are translated into U.S. dollars at the exchange rates at period end. Purchases and sales of investment securities, income and dividends received, and expenses denominated in foreign currencies are translated into U.S. dollars at the exchange rate in effect on the transaction date.
The effects of exchange rate fluctuations on investments are included with the net realized and unrealized gain (loss) on investment securities. Other foreign currency transactions resulting in realized and unrealized gain (loss) are disclosed separately.
Investment Transactions and Income. For financial reporting purposes, the Fund's investment holdings and NAV include trades executed through the end of the last business day of the period. The NAV per share for processing shareholder transactions is calculated as of the close of business of the New York Stock Exchange (NYSE), normally 4:00 p.m. Eastern time and includes trades executed through the end of the prior business day. Gains and losses on securities sold are determined on the basis of identified cost and include proceeds received from litigation. Commissions paid to certain brokers with whom the investment adviser, or its affiliates, places trades on behalf of a fund include an amount in addition to trade execution, which may be rebated back to a fund. Any such rebates are included in net realized gain (loss) on investments in the Statement of Operations. Dividend income is recorded on the ex-dividend date, except for certain dividends from foreign securities where the ex-dividend date may have passed, which are recorded as soon as the Fund is informed of the ex-dividend date. Non-cash dividends included in dividend income, if any, are recorded at the fair market value of the securities received. Income and capital gain distributions from Fidelity Central Funds, if any, are recorded on the ex-dividend date. Certain distributions received by the Fund represent a return of capital or capital gain. The Fund determines the components of these distributions subsequent to the ex-dividend date, based upon receipt of tax filings or other correspondence relating to the underlying investment. These distributions are recorded as a reduction of cost of investments and/or as a realized gain. Interest income is accrued as earned and includes coupon interest and amortization of premium and accretion of discount on debt securities as applicable. Investment income is recorded net of foreign taxes withheld where recovery of such taxes is uncertain. Funds may file withholding tax reclaims in certain jurisdictions to recover a portion of amounts previously withheld. Any withholding tax reclaims income is included in the Statement of Operations in dividends. Any receivables for withholding tax reclaims are included in the Statement of Assets and Liabilities in dividends receivable.
Class Allocations and Expenses. Investment income, realized and unrealized capital gains and losses, common expenses of a fund, and certain fund-level expense reductions, if any, are allocated daily on a pro-rata basis to each class based on the relative net assets of each class to the total net assets of a fund. Each class differs with respect to transfer agent and distribution and service plan fees incurred, as applicable. Certain expense reductions may also differ by class, if applicable. For the reporting period, the allocated portion of income and expenses to each class as a percent of its average net assets may vary due to the timing of recording these transactions in relation to fluctuating net assets of the classes. Expenses directly attributable to a fund are charged to that fund. Expenses attributable to more than one fund are allocated among the respective funds on the basis of relative net assets or other appropriate methods. Expenses included in the accompanying financial statements reflect the expenses of that fund and do not include any expenses associated with any underlying mutual funds or exchange-traded funds. Although not included in a fund's expenses, a fund indirectly bears its proportionate share of these expenses through the net asset value of each underlying mutual fund or exchange-traded fund. Expense estimates are accrued in the period to which they relate and adjustments are made when actual amounts are known.
Income Tax Information and Distributions to Shareholders. Each year, the Fund intends to qualify as a regulated investment company under Subchapter M of the Internal Revenue Code, including distributing substantially all of its taxable income and realized gains. As a result, no provision for U.S. Federal income taxes is required. The Fund files a U.S. federal tax return, in addition to state and local tax returns as required. The Fund's federal income tax returns are subject to examination by the Internal Revenue Service (IRS) for a period of three fiscal years after they are filed. State and local tax returns may be subject to examination for an additional fiscal year depending on the jurisdiction. Foreign taxes are provided for based on the Fund's understanding of the tax rules and rates that exist in the foreign markets in which it invests.
Distributions are declared and recorded on the ex-dividend date. Income and capital gain distributions are declared separately for each class. Income and capital gain distributions are determined in accordance with income tax regulations, which may differ from GAAP.
Capital accounts within the financial statements are adjusted for permanent book-tax differences. These adjustments have no impact on net assets or the results of operations. Capital accounts are not adjusted for temporary book-tax differences which will reverse in a subsequent period.
Book-tax differences are primarily due to futures contracts, foreign currency transactions, passive foreign investment companies (PFIC), capital loss carryforwards, partnerships and losses deferred due to wash sales.
As of period end, the cost and unrealized appreciation (depreciation) in securities, and derivatives if applicable, for federal income tax purposes were as follows:
| Gross unrealized appreciation | $53,194,349 |
| Gross unrealized depreciation | (28,280,021) |
| Net unrealized appreciation (depreciation) | $24,914,328 |
| Tax cost | $348,205,105 |
Capital loss carryforwards are only available to offset future capital gains of the Fund to the extent provided by regulations and may be limited. The capital loss carryforward information presented below, including any applicable limitation, is estimated as of prior fiscal period end and is subject to adjustment.
Restricted Securities (including Private Placements). Funds may invest in securities that are subject to legal or contractual restrictions on resale. These securities generally may be resold in transactions exempt from registration or to the public if the securities are registered. Disposal of these securities may involve time-consuming negotiations and expense, and prompt sale at an acceptable price may be difficult. Information regarding restricted securities held at period end is included at the end of the Schedule of Investments, if applicable.
4. Derivative Instruments.
Risk Exposures and the Use of Derivative Instruments. The Fund's investment objectives allow for various types of derivative instruments, including futures contracts. Derivatives are investments whose value is primarily derived from underlying assets, indices or reference rates and may be transacted on an exchange or over-the-counter (OTC). Derivatives may involve a future commitment to buy or sell a specified asset based on specified terms, to exchange future cash flows at periodic intervals based on a notional principal amount, or for one party to make one or more payments upon the occurrence of specified events in exchange for periodic payments from the other party.
Derivatives were used to increase returns and to manage exposure to certain risks as defined below. The success of any strategy involving derivatives depends on analysis of numerous economic factors, and if the strategies for investment do not work as intended, the objectives may not be achieved.
Derivatives were used to increase or decrease exposure to the following risk(s):
| | |
| Equity Risk | Equity risk relates to the fluctuations in the value of financial instruments as a result of changes in market prices (other than those arising from interest rate risk or foreign exchange risk), whether caused by factors specific to an individual investment, its issuer, or all factors affecting all instruments traded in a market or market segment. |
Funds are also exposed to additional risks from investing in derivatives, such as liquidity risk and counterparty credit risk. Liquidity risk is the risk that a fund will be unable to close out the derivative in the open market in a timely manner. Counterparty credit risk is the risk that the counterparty will not be able to fulfill its obligation to a fund. Counterparty credit risk related to exchange-traded contracts may be mitigated by the protection provided by the exchange on which they trade.
Investing in derivatives may involve greater risks than investing in the underlying assets directly and, to varying degrees, may involve risk of loss in excess of any initial investment and collateral received and amounts recognized in the Statement of Assets and Liabilities. In addition, there may be the risk that the change in value of the derivative contract does not correspond to the change in value of the underlying instrument.
Futures Contracts. A futures contract is an agreement between two parties to buy or sell a specified underlying instrument for a fixed price at a specified future date. Futures contracts were used to manage exposure to the stock market.
Upon entering into a futures contract, a fund is required to deposit either cash or securities (initial margin) with a clearing broker in an amount equal to a certain percentage of the face value of the contract. Futures contracts are marked-to-market daily and subsequent daily payments are made or received by a fund depending on the daily fluctuations in the value of the futures contracts and are recorded as unrealized appreciation or (depreciation). This receivable and/or payable, if any, is included in daily variation margin on futures contracts in the Statement of Assets and Liabilities. Realized gain or (loss) is recorded upon the expiration or closing of a futures contract. The net realized gain (loss) and change in net unrealized appreciation (depreciation) on futures contracts during the period is presented in the Statement of Operations.
Any open futures contracts at period end are presented in the Schedule of Investments under the caption "Futures Contracts". The notional amount at value reflects each contract's exposure to the underlying instrument or index at period end, and is representative of volume of activity during the period unless an average notional amount is presented. Any securities deposited to meet initial margin requirements are identified in the Schedule of Investments. Any cash deposited to meet initial margin requirements is presented as segregated cash with brokers for derivative instruments in the Statement of Assets and Liabilities.
5. Purchases and Sales of Investments.
Purchases and sales of securities, other than short-term securities, U.S. government securities and in-kind transactions, as applicable, are noted in the table below.
| | Purchases ($) | Sales ($) |
| Fidelity Advisor Value Fund | 150,424,015 | 187,380,860 |
6. Fees and Other Transactions with Affiliates.
Management Fee. Fidelity Management & Research Company LLC (the investment adviser) and its affiliates provide the Fund with investment management related services for which the Fund pays a monthly management fee. The management fee is the sum of an individual fund fee rate that is based on an annual rate of .30% of the Fund's average net assets and an annualized group fee rate that averaged .23% during the period. The group fee rate is based upon the monthly average net assets of a group of registered investment companies with which the investment adviser has management contracts. The group fee rate decreases as assets under management increase and increases as assets under management decrease. In addition, the management fee is subject to a performance adjustment (up to a maximum of +/- .20% of the Fund's average net assets over a 36 month performance period). The upward or downward adjustment to the management fee is based on the relative investment performance of Class I as compared to its benchmark index, the Russell Midcap Value Index, over the same 36 month performance period. For the reporting period, the total annualized management fee rate, including the performance adjustment, was .64% of the Fund's average net assets. The performance adjustment included in the management fee rate may be higher or lower than the maximum performance adjustment rate due to the difference between the average net assets for the reporting and performance periods.
Distribution and Service Plan Fees. In accordance with Rule 12b-1 of the 1940 Act, the Fund has adopted separate Distribution and Service Plans for each class of shares. Certain classes pay Fidelity Distributors Company LLC (FDC), an affiliate of the investment adviser, separate Distribution and Service Fees, each of which is based on an annual percentage of each class' average net assets. In addition, FDC may pay financial intermediaries for selling shares of the Fund and providing shareholder support services. For the period, the Distribution and Service Fee rates, total fees and amounts retained by FDC were as follows:
| | Distribution Fee | Service Fee | Total Fees | Retained by FDC |
| Class A | - % | .25% | $138,689 | $5,428 |
| Class M | .25% | .25% | 58,928 | 873 |
| Class C | .75% | .25% | 76,109 | 15,762 |
| | | | $273,726 | $22,063 |
Sales Load. FDC may receive a front-end sales charge of up to 5.75% for selling Class A shares and 3.50% for selling Class M shares, some of which is paid to financial intermediaries for selling shares of the Fund. Depending on the holding period, FDC may receive contingent deferred sales charges levied on Class A, Class M and Class C redemptions. The deferred sales charges are 1.00% for Class C shares, 1.00% for certain purchases of Class A shares and .25% for certain purchases of Class M shares.
For the period, sales charge amounts retained by FDC were as follows:
| | Retained by FDC |
| Class A | $52,110 |
| Class M | 1,221 |
Class C A | 2,835 |
| | $56,166 |
A When Class C shares are initially sold, FDC pays commissions from its own resources to financial intermediaries through which the sales are made.
Transfer Agent Fees. Fidelity Investments Institutional Operations Company LLC (FIIOC), an affiliate of the investment adviser, is the transfer, dividend disbursing and shareholder servicing agent for each class of the Fund. FIIOC receives account fees and asset-based fees that vary according to the account size and type of account of the shareholders of the respective classes of the Fund, except for Class Z. FIIOC receives an asset-based fee of Class Z's average net assets. FIIOC pays for typesetting, printing and mailing of shareholder reports, except proxy statements.
For the period, transfer agent fees for each class were as follows:
| | Amount | % of Class-Level Average Net Assets A |
| Class A | $104,510 | .19 |
| Class M | 21,482 | .18 |
| Class C | 17,036 | .22 |
| Class I | 155,608 | .17 |
| Class Z | 16,060 | .04 |
| | $314,696 | |
A Annualized
Accounting Fees. Fidelity Service Company, Inc. (FSC), an affiliate of the investment adviser, maintains the Fund's accounting records. The accounting fee is based on the level of average net assets for each month. For the period, the fees were equivalent to the following annualized rates:
| | % of Average Net Assets |
| Fidelity Advisor Value Fund | .04 |
Brokerage Commissions. A portion of portfolio transactions were placed with brokerage firms which are affiliates of the investment adviser. Brokerage commissions are included in net realized gain (loss) and change in net unrealized appreciation (depreciation) in the Statement of Operations. The commissions paid to these affiliated firms were as follows:
| | Amount |
| Fidelity Advisor Value Fund | $5,422 |
Interfund Lending Program. Pursuant to an Exemptive Order issued by the Securities and Exchange Commission (the SEC), the Fund, along with other registered investment companies having management contracts with Fidelity Management & Research Company LLC (FMR), or other affiliated entities of FMR, may participate in an interfund lending program. This program provides an alternative credit facility allowing the Fund to borrow from, or lend money to, other participating affiliated funds. At period end, there were no interfund loans outstanding. Activity in this program during the period for which loans were outstanding was as follows:
| | Borrower or Lender | Average Loan Balance | Weighted Average Interest Rate | Interest Expense |
| Fidelity Advisor Value Fund | Borrower | $ 8,158,000 | 4.96% | $6,741 |
Interfund Trades. Funds may purchase from or sell securities to other Fidelity Funds under procedures adopted by the Board. The procedures have been designed to ensure these interfund trades are executed in accordance with Rule 17a-7 of the 1940 Act. Any interfund trades are included within the respective purchases and sales amounts shown in the Purchases and Sales of Investments note. Interfund trades during the period are noted in the table below.
| | Purchases ($) | Sales ($) | Realized Gain (Loss) ($) |
| Fidelity Advisor Value Fund | 11,404,295 | 12,221,673 | (388,648) |
7. Committed Line of Credit.
Certain Funds participate with other funds managed by the investment adviser or an affiliate in a $4.25 billion credit facility (the "line of credit") to be utilized for temporary or emergency purposes to fund shareholder redemptions or for other short-term liquidity purposes. The participating funds have agreed to pay commitment fees on their pro-rata portion of the line of credit, which are reflected in Miscellaneous expenses on the Statement of Operations, and are listed below. During the period, there were no borrowings on this line of credit.
| | Amount |
| Fidelity Advisor Value Fund | $406 |
8. Security Lending.
Funds lend portfolio securities from time to time in order to earn additional income. Lending agents are used, including National Financial Services (NFS), an affiliate of the investment adviser. Pursuant to a securities lending agreement, NFS will receive a fee, which is capped at 9.9% of a fund's daily lending revenue, for its services as lending agent. A fund may lend securities to certain qualified borrowers, including NFS. On the settlement date of the loan, a fund receives collateral (in the form of U.S. Treasury obligations, letters of credit and/or cash) against the loaned securities and maintains collateral in an amount not less than 100% of the market value of the loaned securities during the period of the loan. The market value of the loaned securities is determined at the close of business of a fund and any additional required collateral is delivered to a fund on the next business day. A fund or borrower may terminate the loan at any time, and if the borrower defaults on its obligation to return the securities loaned because of insolvency or other reasons, a fund may apply collateral received from the borrower against the obligation. A fund may experience delays and costs in recovering the securities loaned. Any cash collateral received is invested in the Fidelity Securities Lending Cash Central Fund. Any loaned securities are identified as such in the Schedule of Investments, and the value of loaned securities and cash collateral at period end, as applicable, are presented in the Statement of Assets and Liabilities. Security lending income represents the income earned on investing cash collateral, less rebates paid to borrowers and any lending agent fees associated with the loan, plus any premium payments received for lending certain types of securities. Security lending income is presented in the Statement of Operations as a component of income from Fidelity Central Funds. Affiliated security lending activity, if any, was as follows:
| | Total Security Lending Fees Paid to NFS | Security Lending Income From Securities Loaned to NFS | Value of Securities Loaned to NFS at Period End |
| Fidelity Advisor Value Fund | $3,438 | $ 3,681 | $69,170 |
9. Expense Reductions.
The investment adviser contractually agreed to reimburse expenses of each class to the extent annual operating expenses exceeded certain levels of class-level average net assets as noted in the table below. This reimbursement will remain in place through February 29, 2024. Some expenses, for example the compensation of the independent Trustees, and certain miscellaneous expenses such as proxy and shareholder meeting expenses, are excluded from this reimbursement.
The following classes were in reimbursement during the period:
| | Expense Limitations | Reimbursement |
| Class A | 1.15% | $19,478 |
| Class M | 1.40% | 3,523 |
| Class C | 1.90% | 5,396 |
| Class I | .90% | 16,903 |
| Class Z | .75% | 14,345 |
| | | $59,645 |
During the period, transfer agent credits reduced each class' expenses as noted in the table below.
| | Expense reduction |
| Class A | $36 |
| Class M | 292 |
| | $328 |
In addition, during the period the investment adviser or an affiliate reimbursed and/or waived a portion of fund-level operating expenses in the amount of $9,312.
10. Distributions to Shareholders.
Distributions to shareholders of each class were as follows:
| | Six months ended April 30, 2023 | Year ended October 31, 2022 |
| Fidelity Advisor Value Fund | | |
| Distributions to shareholders | | |
| Class A | $432,386 | $4,405,947 |
| Class M | 26,680 | 990,545 |
| Class C | - | 660,630 |
| Class I | 1,087,478 | 5,021,021 |
| Class Z | 624,586 | 2,393,674 |
Total | $2,171,130 | $13,471,817 |
11. Share Transactions.
Share transactions for each class were as follows and may contain in-kind transactions, automatic conversions between classes or exchanges between affiliated funds:
| | Shares | Shares | Dollars | Dollars |
| | Six months ended April 30, 2023 | Year ended October 31, 2022 | Six months ended April 30, 2023 | Year ended October 31, 2022 |
| Fidelity Advisor Value Fund | | | | |
| Class A | | | | |
| Shares sold | 443,382 | 1,692,576 | $13,876,920 | $53,594,255 |
| Reinvestment of distributions | 14,231 | 137,847 | 427,936 | 4,297,977 |
| Shares redeemed | (854,704) | (1,179,626) | (26,431,471) | (37,522,482) |
| Net increase (decrease) | (397,091) | 650,797 | $(12,126,615) | $20,369,750 |
| Class M | | | | |
| Shares sold | 52,032 | 134,897 | $1,588,022 | $4,251,310 |
| Reinvestment of distributions | 888 | 31,736 | 26,425 | 979,513 |
| Shares redeemed | (60,370) | (102,350) | (1,854,458) | (3,170,588) |
| Net increase (decrease) | (7,450) | 64,283 | $(240,011) | $2,060,235 |
| Class C | | | | |
| Shares sold | 132,403 | 217,748 | $3,827,009 | $6,554,230 |
| Reinvestment of distributions | - | 22,308 | - | 654,000 |
| Shares redeemed | (165,332) | (211,462) | (4,688,335) | (6,050,103) |
| Net increase (decrease) | (32,929) | 28,594 | $(861,326) | $1,158,127 |
| Class I | | | | |
| Shares sold | 1,692,536 | 5,343,179 | $53,437,634 | $171,305,654 |
| Reinvestment of distributions | 35,458 | 157,060 | 1,077,559 | 4,946,432 |
| Shares redeemed | (2,013,809) | (2,899,066) | (62,163,109) | (90,414,411) |
| Net increase (decrease) | (285,815) | 2,601,173 | $(7,647,916) | $85,837,675 |
| Class Z | | | | |
| Shares sold | 604,990 | 2,344,555 | $19,236,027 | $74,364,664 |
| Reinvestment of distributions | 17,943 | 65,065 | 544,763 | 2,047,896 |
| Shares redeemed | (1,391,226) | (1,058,038) | (42,748,506) | (33,952,879) |
| Net increase (decrease) | (768,293) | 1,351,582 | $(22,967,716) | $42,459,681 |
12. Other.
A fund's organizational documents provide former and current trustees and officers with a limited indemnification against liabilities arising in connection with the performance of their duties to the fund. In the normal course of business, a fund may also enter into contracts that provide general indemnifications. A fund's maximum exposure under these arrangements is unknown as this would be dependent on future claims that may be made against a fund. The risk of material loss from such claims is considered remote.
13. Risk and Uncertainties.
Many factors affect a fund's performance. Developments that disrupt global economies and financial markets, such as pandemics, epidemics, outbreaks of infectious diseases, war, terrorism, and environmental disasters, may significantly affect a fund's investment performance. The effects of these developments to a fund will be impacted by the types of securities in which a fund invests, the financial condition, industry, economic sector, and geographic location of an issuer, and a fund's level of investment in the securities of that issuer. Significant concentrations in security types, issuers, industries, sectors, and geographic locations may magnify the factors that affect a fund's performance.
As a shareholder, you incur two types of costs: (1) transaction costs, which may include sales charges (loads) on purchase payments or redemption proceeds, as applicable and (2) ongoing costs, which generally include management fees, distribution and/or service (12b-1) fees and other Fund expenses. This Example is intended to help you understand your ongoing costs (in dollars) of investing in a fund and to compare these costs with the ongoing costs of investing in other mutual funds.
| The Example is based on an investment of $1,000 invested at the beginning of the period and held for the entire period (November 1, 2022 to April 30, 2023). |
Actual Expenses
The first line of the accompanying table provides information about actual account values and actual expenses. You may use the information in this line, together with the amount you invested, to estimate the expenses that you paid over the period. Simply divide your account value by $1,000.00 (for example, an $8,600 account value divided by $1,000.00 = 8.6), then multiply the result by the number in the first line for a class/Fund under the heading entitled "Expenses Paid During Period" to estimate the expenses you paid on your account during this period. If any fund is a shareholder of any underlying mutual funds or exchange-traded funds (ETFs) (the Underlying Funds), such fund indirectly bears its proportional share of the expenses of the Underlying Funds in addition to the direct expenses incurred presented in the table. These fees and expenses are not included in the annualized expense ratio used to calculate the expense estimate in the table below.
Hypothetical Example for Comparison Purposes
The second line of the accompanying table provides information about hypothetical account values and hypothetical expenses based on the actual expense ratio and an assumed rate of return of 5% per year before expenses, which is not the actual return. The hypothetical account values and expenses may not be used to estimate the actual ending account balance or expenses you paid for the period. You may use this information to compare the ongoing costs of investing in the Fund and other funds. To do so, compare this 5% hypothetical example with the 5% hypothetical examples that appear in the shareholder reports of the other funds. If any fund is a shareholder of any Underlying Funds, such fund indirectly bears its proportional share of the expenses of the Underlying Funds in addition to the direct expenses as presented in the table. These fees and expenses are not included in the annualized expense ratio used to calculate the expense estimate in the table below.
Please note that the expenses shown in the table are meant to highlight your ongoing costs only and do not reflect any transaction costs. Therefore, the second line of the table is useful in comparing ongoing costs only, and will not help you determine the relative total costs of owning different funds. In addition, if these transactional costs were included, your costs would have been higher.
| | | | | Annualized Expense Ratio- A | | Beginning Account Value November 1, 2022 | | Ending Account Value April 30, 2023 | | Expenses Paid During Period- C November 1, 2022 to April 30, 2023 |
| Fidelity Advisor® Value Fund | | | | | | | | | | |
| Class A | | | | 1.15% | | | | | | |
| Actual | | | | | | $ 1,000 | | $ 1,019.80 | | $ 5.76 |
Hypothetical- B | | | | | | $ 1,000 | | $ 1,019.09 | | $ 5.76 |
| Class M | | | | 1.40% | | | | | | |
| Actual | | | | | | $ 1,000 | | $ 1,018.60 | | $ 7.01 |
Hypothetical- B | | | | | | $ 1,000 | | $ 1,017.85 | | $ 7.00 |
| Class C | | | | 1.90% | | | | | | |
| Actual | | | | | | $ 1,000 | | $ 1,016.20 | | $ 9.50 |
Hypothetical- B | | | | | | $ 1,000 | | $ 1,015.37 | | $ 9.49 |
| Class I | | | | .90% | | | | | | |
| Actual | | | | | | $ 1,000 | | $ 1,021.10 | | $ 4.51 |
Hypothetical- B | | | | | | $ 1,000 | | $ 1,020.33 | | $ 4.51 |
| Class Z | | | | .75% | | | | | | |
| Actual | | | | | | $ 1,000 | | $ 1,021.80 | | $ 3.76 |
Hypothetical- B | | | | | | $ 1,000 | | $ 1,021.08 | | $ 3.76 |
| |
A Annualized expense ratio reflects expenses net of applicable fee waivers.
B 5% return per year before expenses
C Expenses are equal to the annualized expense ratio, multiplied by the average account value over the period, multiplied by 181/ 365 (to reflect the one-half year period). The fees and expenses of any Underlying Funds are not included in each annualized expense ratio.
The Securities and Exchange Commission adopted Rule 22e-4 under the Investment Company Act of 1940 (the Liquidity Rule) to promote effective liquidity risk management throughout the open-end investment company industry, thereby reducing the risk that funds will be unable to meet their redemption obligations and mitigating dilution of the interests of fund shareholders.
The Fund has adopted and implemented a liquidity risk management program (the Program) reasonably designed to assess and manage the Fund's liquidity risk and to comply with the requirements of the Liquidity Rule. The Fund's Board of Trustees (the Board) has designated the Fund's investment adviser as administrator of the Program. The Fidelity advisers have established a Liquidity Risk Management Committee (the LRM Committee) to manage the Program for each of the Fidelity Funds. The LRM Committee monitors the adequacy and effectiveness of implementation of the Program and on a periodic basis assesses each Fund's liquidity risk based on a variety of factors including (1) the Fund's investment strategy, (2) portfolio liquidity and cash flow projections during normal and reasonably foreseeable stressed conditions, (3) shareholder redemptions, (4) borrowings and other funding sources and (5) certain factors specific to ETFs including the effect of the Fund's prices and spreads, market participants, and basket compositions on the overall liquidity of the Fund's portfolio, as applicable.
In accordance with the Program, each of the Fund's portfolio investments is classified into one of four defined liquidity categories based on a determination of a reasonable expectation for how long it would take to convert the investment to cash (or sell or dispose of the investment) without significantly changing its market value.
- Highly liquid investments - cash or convertible to cash within three business days or less
- Moderately liquid investments - convertible to cash in three to seven calendar days
- Less liquid investments - can be sold or disposed of, but not settled, within seven calendar days
- Illiquid investments - cannot be sold or disposed of within seven calendar days
Liquidity classification determinations take into account a variety of factors including various market, trading and investment-specific considerations, as well as market depth, and generally utilize analysis from a third-party liquidity metrics service.
The Liquidity Rule places a 15% limit on a fund's illiquid investments and requires funds that do not primarily hold assets that are highly liquid investments to determine and maintain a minimum percentage of the fund's net assets to be invested in highly liquid investments (highly liquid investment minimum or HLIM). The Program includes provisions reasonably designed to comply with the 15% limit on illiquid investments and for determining, periodically reviewing and complying with the HLIM requirement as applicable.
At a recent meeting of the Fund's Board of Trustees, the LRM Committee provided a written report to the Board pertaining to the operation, adequacy, and effectiveness of the Program for the period December 1, 2021 through November 30, 2022. The report concluded that the Program is operating effectively and is reasonably designed to assess and manage the Fund's liquidity risk.
1.800650.119
FAV-SANN-0623
Item 2.
Code of Ethics
Not applicable.
Item 3.
Audit Committee Financial Expert
Not applicable.
Item 4.
Principal Accountant Fees and Services
Not applicable.
Item 5.
Audit Committee of Listed Registrants
Not applicable.
Item 6.
Investments
(a)
Not applicable.
(b)
Not applicable
Item 7.
Disclosure of Proxy Voting Policies and Procedures for Closed-End Management Investment Companies
Not applicable.
Item 8.
Portfolio Managers of Closed-End Management Investment Companies
Not applicable.
Item 9.
Purchase of Equity Securities by Closed-End Management Investment Company and Affiliated Purchasers
Not applicable.
Item 10.
Submission of Matters to a Vote of Security Holders
There were no material changes to the procedures by which shareholders may recommend nominees to the Fidelity Advisor Series I’s Board of Trustees.
Item 11.
Controls and Procedures
(a)(i) The President and Treasurer and the Chief Financial Officer have concluded that the Fidelity Advisor Series I’s (the “Trust”) disclosure controls and procedures (as defined in Rule 30a-3(c) under the Investment Company Act) provide reasonable
assurances that material information relating to the Trust is made known to them by the appropriate persons, based on their evaluation of these controls and procedures as of a date within 90 days of the filing date of this report.
(a)(ii) There was no change in the Trust’s internal control over financial reporting (as defined in Rule 30a-3(d) under the Investment Company Act) that occurred during the period covered by this report that has materially affected, or is reasonably likely to materially affect, the Trust’s internal control over financial reporting.
Item 12.
Disclosure of Securities Lending Activities for Closed-End Management
Investment Companies
Not applicable.
Item 13.
Exhibits
SIGNATURES
Pursuant to the requirements of the Securities Exchange Act of 1934 and the Investment Company Act of 1940, the registrant has duly caused this report to be signed on its behalf by the undersigned, thereunto duly authorized.
Fidelity Advisor Series I
| |
By: | /s/Stacie M. Smith |
| Stacie M. Smith |
| President and Treasurer |
|
|
Date: | June 22, 2023 |
Pursuant to the requirements of the Securities Exchange Act of 1934 and the Investment Company Act of 1940, this report has been signed below by the following persons on behalf of the registrant and in the capacities and on the dates indicated.
| |
By: | /s/Stacie M. Smith |
| Stacie M. Smith |
| President and Treasurer |
|
|
Date: | June 22, 2023 |
| |
By: | /s/John J. Burke III |
| John J. Burke III |
| Chief Financial Officer |
|
|
Date: | June 22, 2023 |