UNITED STATES
SECURITIES AND EXCHANGE COMMISSION
Washington, D.C. 20549
FORM N-CSR
CERTIFIED SHAREHOLDER REPORT OF REGISTERED
MANAGEMENT INVESTMENT COMPANIES
Investment Company Act file number 811-03785
Fidelity Advisor Series I
(Exact name of registrant as specified in charter)
245 Summer St., Boston, Massachusetts 02210
(Address of principal executive offices) (Zip code)
Margaret Carey, Secretary
245 Summer St.
Boston, Massachusetts 02210
(Name and address of agent for service)
Registrant's telephone number, including area code:
617-563-7000
Date of fiscal year end: | October 31 |
Date of reporting period: | October 31, 2023 |
Item 1.
Reports to Stockholders


Contents
| Average Annual Total Returns | |||
Periods ended October 31, 2023 | Past 1 year | Past 5 years | Past 10 years |
Class A (incl. 5.75% sales charge) | -5.06% | 8.25% | 7.03% |
Class M (incl. 3.50% sales charge) | -3.02% | 8.49% | 7.00% |
Class C (incl. contingent deferred sales charge) | -1.00% | 8.70% | 6.98% |
| Class I | 0.97% | 9.85% | 7.97% |
| Class Z | 1.14% | 10.00% | 8.06% |
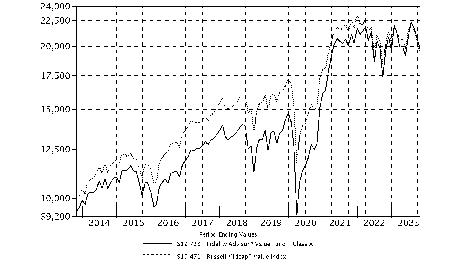
| $10,000 Over 10 Years |
Let's say hypothetically that $10,000 was invested in Fidelity Advisor® Value Fund - Class A, a class of the fund, on October 31, 2013, and the current 5.75% sales charge was paid. The chart shows how the value of your investment would have changed, and also shows how the Russell Midcap® Value Index performed over the same period. |
 |
Top Holdings (% of Fund's net assets) | ||
| Antero Resources Corp. | 1.6 | |
| Constellation Energy Corp. | 1.5 | |
| PG&E Corp. | 1.3 | |
| Global Payments, Inc. | 1.2 | |
| Celanese Corp. Class A | 1.1 | |
| Welltower, Inc. | 1.1 | |
| Flex Ltd. | 1.1 | |
| Constellium NV | 0.9 | |
| Apollo Global Management, Inc. | 0.9 | |
| Westlake Corp. | 0.9 | |
| 11.6 | ||
| Market Sectors (% of Fund's net assets) | ||
| Financials | 18.9 | |
| Industrials | 17.0 | |
| Consumer Discretionary | 12.6 | |
| Materials | 11.0 | |
| Energy | 10.3 | |
| Utilities | 7.7 | |
| Real Estate | 6.2 | |
| Health Care | 6.2 | |
| Information Technology | 3.6 | |
| Consumer Staples | 3.3 | |
| Communication Services | 2.1 | |
Asset Allocation (% of Fund's net assets) |
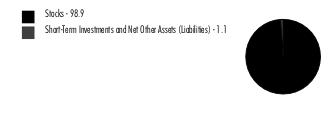 |
Futures - 0.8% |
| Common Stocks - 98.9% | |||
| Shares | Value ($) | ||
| COMMUNICATION SERVICES - 2.1% | |||
| Diversified Telecommunication Services - 0.4% | |||
| Cellnex Telecom SA (a) | 35,740 | 1,050,617 | |
| Media - 1.7% | |||
| DISH Network Corp. Class A (b)(c) | 25,605 | 125,465 | |
| Interpublic Group of Companies, Inc. | 21,070 | 598,388 | |
| News Corp. Class A | 51,521 | 1,065,454 | |
| Nexstar Broadcasting Group, Inc. Class A | 7,343 | 1,028,607 | |
| Scholastic Corp. | 17,018 | 627,964 | |
| Thryv Holdings, Inc. (b) | 70,240 | 1,224,283 | |
| WPP PLC | 73,630 | 634,045 | |
| 5,304,206 | |||
TOTAL COMMUNICATION SERVICES | 6,354,823 | ||
| CONSUMER DISCRETIONARY - 12.6% | |||
| Automobile Components - 1.4% | |||
| Adient PLC (b) | 47,371 | 1,595,929 | |
| Atmus Filtration Technologies, Inc. (c) | 36,970 | 693,557 | |
| Autoliv, Inc. | 15,531 | 1,423,416 | |
| Cie Automotive SA | 21,470 | 546,581 | |
| 4,259,483 | |||
| Automobiles - 0.6% | |||
| Harley-Davidson, Inc. | 66,151 | 1,776,154 | |
| Broadline Retail - 0.5% | |||
| Kohl's Corp. (c) | 71,677 | 1,616,316 | |
| Diversified Consumer Services - 0.3% | |||
| H&R Block, Inc. | 19,547 | 802,404 | |
| Hotels, Restaurants & Leisure - 1.5% | |||
| Brinker International, Inc. (b) | 32,227 | 1,093,140 | |
| Hilton Grand Vacations, Inc. (b) | 33,381 | 1,200,047 | |
| Light & Wonder, Inc. Class A (b) | 13,275 | 970,535 | |
| Red Rock Resorts, Inc. | 31,183 | 1,233,288 | |
| 4,497,010 | |||
| Household Durables - 1.2% | |||
| Mohawk Industries, Inc. (b) | 10,837 | 871,078 | |
| Newell Brands, Inc. | 159,510 | 1,071,907 | |
| Tempur Sealy International, Inc. | 44,788 | 1,788,385 | |
| 3,731,370 | |||
| Leisure Products - 1.7% | |||
| BRP, Inc. | 19,058 | 1,288,124 | |
| Brunswick Corp. | 17,050 | 1,184,464 | |
| Mattel, Inc. (b) | 75,832 | 1,446,875 | |
| Topgolf Callaway Brands Corp. (b) | 106,951 | 1,306,941 | |
| 5,226,404 | |||
| Specialty Retail - 4.2% | |||
| Academy Sports & Outdoors, Inc. | 17,489 | 784,207 | |
| American Eagle Outfitters, Inc. | 111,875 | 1,954,456 | |
| Aritzia, Inc. (b) | 40,810 | 634,773 | |
| Camping World Holdings, Inc. (c) | 52,647 | 881,837 | |
| Lithia Motors, Inc. Class A (sub. vtg.) | 7,708 | 1,866,955 | |
| Sally Beauty Holdings, Inc. (b) | 105,705 | 898,493 | |
| Signet Jewelers Ltd. (c) | 27,063 | 1,889,809 | |
| Upbound Group, Inc. | 61,091 | 1,592,031 | |
| Victoria's Secret & Co. (b) | 72,727 | 1,300,359 | |
| Williams-Sonoma, Inc. | 5,620 | 844,349 | |
| 12,647,269 | |||
| Textiles, Apparel & Luxury Goods - 1.2% | |||
| Gildan Activewear, Inc. | 65,482 | 1,859,986 | |
| PVH Corp. | 9,570 | 711,530 | |
| Samsonite International SA (a)(b) | 218,390 | 676,380 | |
| Wolverine World Wide, Inc. | 57,740 | 464,807 | |
| 3,712,703 | |||
TOTAL CONSUMER DISCRETIONARY | 38,269,113 | ||
| CONSUMER STAPLES - 3.3% | |||
| Consumer Staples Distribution & Retail - 0.7% | |||
| U.S. Foods Holding Corp. (b) | 56,283 | 2,191,660 | |
| Food Products - 2.0% | |||
| Bunge Ltd. | 19,786 | 2,096,920 | |
| Darling Ingredients, Inc. (b) | 57,164 | 2,531,794 | |
| Tyson Foods, Inc. Class A | 31,063 | 1,439,770 | |
| 6,068,484 | |||
| Household Products - 0.5% | |||
| Energizer Holdings, Inc. | 45,209 | 1,427,700 | |
| Personal Care Products - 0.1% | |||
| Kenvue, Inc. | 26,440 | 491,784 | |
TOTAL CONSUMER STAPLES | 10,179,628 | ||
| ENERGY - 10.3% | |||
| Energy Equipment & Services - 2.6% | |||
| Championx Corp. | 45,191 | 1,391,883 | |
| Expro Group Holdings NV (b) | 129,572 | 2,040,759 | |
| Liberty Oilfield Services, Inc. Class A | 33,864 | 667,121 | |
| Tenaris SA | 74,070 | 1,163,062 | |
| Valaris Ltd. (b) | 25,026 | 1,652,717 | |
| Vallourec SA (b) | 86,758 | 1,039,620 | |
| 7,955,162 | |||
| Oil, Gas & Consumable Fuels - 7.7% | |||
| Advantage Energy Ltd. (b) | 56,540 | 410,570 | |
| Antero Resources Corp. (b) | 165,438 | 4,870,492 | |
| APA Corp. | 10,268 | 407,845 | |
| Canadian Natural Resources Ltd. | 25,478 | 1,617,878 | |
| Cenovus Energy, Inc. (Canada) | 80,510 | 1,533,856 | |
| Delek U.S. Holdings, Inc. | 38,419 | 1,012,341 | |
| Denbury, Inc. (b) | 1,997 | 177,513 | |
| Diamondback Energy, Inc. | 6,071 | 973,303 | |
| Energy Transfer LP | 98,608 | 1,296,695 | |
| EQT Corp. | 16,049 | 680,157 | |
| Hess Corp. | 10,204 | 1,473,458 | |
| Imperial Oil Ltd. | 31,648 | 1,803,599 | |
| Kosmos Energy Ltd. (b) | 163,230 | 1,181,785 | |
| Parkland Corp. | 36,590 | 1,107,397 | |
| Range Resources Corp. | 24,200 | 867,328 | |
| Talos Energy, Inc. (b) | 22,987 | 356,299 | |
| Targa Resources Corp. | 25,989 | 2,172,940 | |
| Tourmaline Oil Corp. (c) | 21,997 | 1,163,180 | |
| Valero Energy Corp. | 3,271 | 415,417 | |
| 23,522,053 | |||
TOTAL ENERGY | 31,477,215 | ||
| FINANCIALS - 18.9% | |||
| Banks - 4.2% | |||
| Axos Financial, Inc. (b) | 31,311 | 1,128,135 | |
| East West Bancorp, Inc. | 27,999 | 1,501,306 | |
| First Citizens Bancshares, Inc. | 1,530 | 2,112,532 | |
| First Citizens Bancshares, Inc. Class B | 210 | 260,236 | |
| KeyCorp | 119,560 | 1,221,903 | |
| Kyoto Financial Group, Inc. | 14,072 | 797,795 | |
| Popular, Inc. | 20,540 | 1,335,922 | |
| U.S. Bancorp | 60,900 | 1,941,492 | |
| Webster Financial Corp. | 46,180 | 1,753,455 | |
| Wintrust Financial Corp. | 8,175 | 610,591 | |
| 12,663,367 | |||
| Capital Markets - 3.2% | |||
| Ameriprise Financial, Inc. | 4,281 | 1,346,674 | |
| BGC Group, Inc. Class A | 233,050 | 1,368,004 | |
| Carlyle Group LP | 49,062 | 1,351,167 | |
| LPL Financial | 7,895 | 1,772,585 | |
| Onex Corp. (sub. vtg.) | 11,560 | 647,877 | |
| Petershill Partners PLC (a) | 305,394 | 547,878 | |
| Raymond James Financial, Inc. | 19,994 | 1,908,227 | |
| UBS Group AG | 36,080 | 841,662 | |
| 9,784,074 | |||
| Consumer Finance - 1.9% | |||
| Ally Financial, Inc. | 40,320 | 975,341 | |
| Discover Financial Services | 5,170 | 424,354 | |
| OneMain Holdings, Inc. | 55,737 | 2,002,630 | |
| PROG Holdings, Inc. (b) | 43,900 | 1,202,421 | |
| SLM Corp. | 101,511 | 1,319,643 | |
| 5,924,389 | |||
| Financial Services - 4.6% | |||
| Apollo Global Management, Inc. | 36,097 | 2,795,352 | |
| Corebridge Financial, Inc. (c) | 57,259 | 1,145,180 | |
| ECN Capital Corp. | 318,688 | 441,234 | |
| Essent Group Ltd. | 39,303 | 1,856,674 | |
| Global Payments, Inc. | 33,833 | 3,593,741 | |
| NCR Atleos Corp. | 40,064 | 883,812 | |
| Voya Financial, Inc. | 27,850 | 1,859,545 | |
| Walker & Dunlop, Inc. | 21,332 | 1,382,314 | |
| 13,957,852 | |||
| Insurance - 5.0% | |||
| AMBAC Financial Group, Inc. (b) | 48,301 | 585,891 | |
| American Financial Group, Inc. | 21,193 | 2,317,666 | |
| Assurant, Inc. | 15,480 | 2,304,972 | |
| First American Financial Corp. | 37,949 | 1,952,097 | |
| Globe Life, Inc. | 8,120 | 944,843 | |
| Hartford Financial Services Group, Inc. | 22,660 | 1,664,377 | |
| Primerica, Inc. | 3,180 | 607,889 | |
| Reinsurance Group of America, Inc. | 13,206 | 1,973,901 | |
| The Travelers Companies, Inc. | 12,805 | 2,144,069 | |
| Willis Towers Watson PLC | 3,630 | 856,281 | |
| 15,351,986 | |||
TOTAL FINANCIALS | 57,681,668 | ||
| HEALTH CARE - 6.2% | |||
| Biotechnology - 0.6% | |||
| Biogen, Inc. (b) | 2,266 | 538,266 | |
| BioMarin Pharmaceutical, Inc. (b) | 2,109 | 171,778 | |
| Exact Sciences Corp. (b) | 1,553 | 95,649 | |
| Galapagos NV (b) | 29,318 | 975,447 | |
| United Therapeutics Corp. (b) | 612 | 136,390 | |
| 1,917,530 | |||
| Health Care Equipment & Supplies - 1.0% | |||
| Baxter International, Inc. | 40,222 | 1,304,399 | |
| Dentsply Sirona, Inc. | 2,278 | 69,274 | |
| Envista Holdings Corp. (b) | 3,755 | 87,379 | |
| Globus Medical, Inc. (b) | 1,303 | 59,560 | |
| Hologic, Inc. (b) | 3,146 | 208,171 | |
| ICU Medical, Inc. (b) | 116 | 11,375 | |
| Masimo Corp. (b) | 742 | 60,198 | |
| STERIS PLC | 1,193 | 250,506 | |
| Teleflex, Inc. | 676 | 124,891 | |
| The Cooper Companies, Inc. | 1,137 | 354,460 | |
| Zimmer Biomet Holdings, Inc. | 6,430 | 671,356 | |
| 3,201,569 | |||
| Health Care Providers & Services - 3.4% | |||
| Acadia Healthcare Co., Inc. (b) | 2,764 | 203,182 | |
| AdaptHealth Corp. (b) | 104,562 | 766,439 | |
| Cencora, Inc. | 2,717 | 503,053 | |
| Centene Corp. (b) | 37,440 | 2,582,611 | |
| Chemed Corp. | 280 | 157,542 | |
| Cigna Group | 7,469 | 2,309,415 | |
| CVS Health Corp. | 21,045 | 1,452,315 | |
| Encompass Health Corp. | 2,570 | 160,779 | |
| Henry Schein, Inc. (b) | 2,105 | 136,783 | |
| Molina Healthcare, Inc. (b) | 1,280 | 426,176 | |
| Owens & Minor, Inc. (b) | 75,200 | 1,077,616 | |
| Quest Diagnostics, Inc. | 3,181 | 413,848 | |
| R1 RCM, Inc. (b) | 1,292 | 15,233 | |
| Tenet Healthcare Corp. (b) | 1,381 | 74,160 | |
| 10,279,152 | |||
| Life Sciences Tools & Services - 0.5% | |||
| Agilent Technologies, Inc. | 2,791 | 288,506 | |
| Avantor, Inc. (b) | 5,554 | 96,806 | |
| Bio-Rad Laboratories, Inc. Class A (b) | 934 | 257,112 | |
| Charles River Laboratories International, Inc. (b) | 1,793 | 301,869 | |
| ICON PLC (b) | 1,861 | 454,010 | |
| Illumina, Inc. (b) | 1,267 | 138,635 | |
| 1,536,938 | |||
| Pharmaceuticals - 0.7% | |||
| Catalent, Inc. (b) | 1,946 | 66,923 | |
| Jazz Pharmaceuticals PLC (b) | 12,181 | 1,547,231 | |
| Royalty Pharma PLC | 15,001 | 403,077 | |
| 2,017,231 | |||
TOTAL HEALTH CARE | 18,952,420 | ||
| INDUSTRIALS - 17.0% | |||
| Air Freight & Logistics - 0.8% | |||
| DHL Group | 9,980 | 388,180 | |
| FedEx Corp. | 7,982 | 1,916,478 | |
| 2,304,658 | |||
| Building Products - 2.1% | |||
| Armstrong World Industries, Inc. | 14,670 | 1,113,306 | |
| Builders FirstSource, Inc. (b) | 13,458 | 1,460,462 | |
| Carlisle Companies, Inc. | 5,765 | 1,464,829 | |
| Johnson Controls International PLC | 13,650 | 669,123 | |
| Tecnoglass, Inc. | 13,500 | 441,180 | |
| UFP Industries, Inc. | 14,032 | 1,335,425 | |
| 6,484,325 | |||
| Commercial Services & Supplies - 1.1% | |||
| HNI Corp. | 26,378 | 915,053 | |
| The Brink's Co. | 28,038 | 1,874,621 | |
| The GEO Group, Inc. (b) | 77,920 | 681,021 | |
| 3,470,695 | |||
| Construction & Engineering - 2.1% | |||
| Fluor Corp. (b) | 42,670 | 1,420,484 | |
| Granite Construction, Inc. | 38,052 | 1,540,345 | |
| MDU Resources Group, Inc. | 80,138 | 1,491,368 | |
| Willscot Mobile Mini Holdings (b) | 46,941 | 1,849,945 | |
| 6,302,142 | |||
| Electrical Equipment - 1.3% | |||
| Acuity Brands, Inc. | 8,325 | 1,348,400 | |
| GrafTech International Ltd. | 198,965 | 686,429 | |
| Regal Rexnord Corp. | 15,949 | 1,888,521 | |
| 3,923,350 | |||
| Ground Transportation - 3.4% | |||
| ArcBest Corp. | 10,180 | 1,108,398 | |
| Knight-Swift Transportation Holdings, Inc. Class A | 27,655 | 1,352,053 | |
| RXO, Inc. | 30,343 | 531,306 | |
| Ryder System, Inc. | 21,193 | 2,067,165 | |
| TFI International, Inc. (Canada) | 11,529 | 1,275,402 | |
| U-Haul Holding Co. (non-vtg.) | 33,829 | 1,597,067 | |
| XPO, Inc. (b) | 31,184 | 2,364,059 | |
| 10,295,450 | |||
| Machinery - 2.8% | |||
| Allison Transmission Holdings, Inc. | 34,896 | 1,759,456 | |
| Barnes Group, Inc. | 41,390 | 860,498 | |
| Chart Industries, Inc. (b)(c) | 7,930 | 921,704 | |
| Gates Industrial Corp. PLC (b) | 84,780 | 925,798 | |
| Kennametal, Inc. | 40,605 | 938,382 | |
| Mueller Water Products, Inc. Class A | 54,820 | 678,123 | |
| Terex Corp. | 13,838 | 633,780 | |
| Timken Co. | 24,881 | 1,719,775 | |
| 8,437,516 | |||
| Professional Services - 1.3% | |||
| Concentrix Corp. | 21,856 | 1,665,646 | |
| Leidos Holdings, Inc. | 6,522 | 646,461 | |
| Manpower, Inc. | 16,609 | 1,162,132 | |
| TransUnion Holding Co., Inc. | 1,940 | 85,127 | |
| WNS Holdings Ltd. sponsored ADR (b) | 9,060 | 492,139 | |
| 4,051,505 | |||
| Trading Companies & Distributors - 2.1% | |||
| Beacon Roofing Supply, Inc. (b) | 12,954 | 921,936 | |
| Core & Main, Inc. (b) | 38,230 | 1,149,958 | |
| Custom Truck One Source, Inc. Class A (b) | 55,706 | 321,424 | |
| Herc Holdings, Inc. | 12,598 | 1,345,340 | |
| McGrath RentCorp. | 8,830 | 888,298 | |
| WESCO International, Inc. | 14,421 | 1,848,772 | |
| 6,475,728 | |||
TOTAL INDUSTRIALS | 51,745,369 | ||
| INFORMATION TECHNOLOGY - 3.6% | |||
| Communications Equipment - 0.6% | |||
| Lumentum Holdings, Inc. (b) | 46,224 | 1,812,443 | |
| Electronic Equipment, Instruments & Components - 1.8% | |||
| Coherent Corp. (b) | 26,938 | 797,365 | |
| Crane Nxt Co. | 13,833 | 719,316 | |
| Flex Ltd. (b) | 123,718 | 3,182,027 | |
| Vontier Corp. | 24,895 | 735,896 | |
| 5,434,604 | |||
| Semiconductors & Semiconductor Equipment - 0.2% | |||
| Skyworks Solutions, Inc. | 6,790 | 588,965 | |
| Software - 0.4% | |||
| NCR Corp. (b) | 91,269 | 1,395,503 | |
| Technology Hardware, Storage & Peripherals - 0.6% | |||
| Seagate Technology Holdings PLC | 26,093 | 1,780,847 | |
TOTAL INFORMATION TECHNOLOGY | 11,012,362 | ||
| MATERIALS - 11.0% | |||
| Chemicals - 5.3% | |||
| Axalta Coating Systems Ltd. (b) | 42,149 | 1,105,568 | |
| Cabot Corp. | 18,562 | 1,234,002 | |
| Celanese Corp. Class A | 29,690 | 3,399,802 | |
| Corteva, Inc. | 17,088 | 822,616 | |
| Methanex Corp. | 46,457 | 1,916,351 | |
| Olin Corp. | 40,936 | 1,748,786 | |
| The Chemours Co. LLC | 80,079 | 1,930,705 | |
| Tronox Holdings PLC | 122,437 | 1,308,852 | |
| Westlake Corp. | 22,641 | 2,611,866 | |
| 16,078,548 | |||
| Construction Materials - 1.0% | |||
| Eagle Materials, Inc. | 5,989 | 921,767 | |
| GCC S.A.B. de CV | 122,108 | 1,087,248 | |
| Martin Marietta Materials, Inc. | 2,543 | 1,039,934 | |
| 3,048,949 | |||
| Containers & Packaging - 1.6% | |||
| Crown Holdings, Inc. | 18,597 | 1,498,918 | |
| Graphic Packaging Holding Co. | 64,430 | 1,385,889 | |
| O-I Glass, Inc. (b) | 65,128 | 1,006,228 | |
| WestRock Co. | 29,290 | 1,052,390 | |
| 4,943,425 | |||
| Metals & Mining - 2.3% | |||
| ATI, Inc. (b) | 25,090 | 947,649 | |
| Carpenter Technology Corp. | 16,023 | 1,004,963 | |
| Constellium NV (b) | 178,393 | 2,818,609 | |
| First Quantum Minerals Ltd. | 45,042 | 521,958 | |
| Schnitzer Steel Industries, Inc. Class A | 25,734 | 584,419 | |
| Steel Dynamics, Inc. | 9,923 | 1,056,899 | |
| 6,934,497 | |||
| Paper & Forest Products - 0.8% | |||
| Interfor Corp. (b) | 52,450 | 647,139 | |
| Louisiana-Pacific Corp. | 34,583 | 1,773,416 | |
| 2,420,555 | |||
TOTAL MATERIALS | 33,425,974 | ||
| REAL ESTATE - 6.2% | |||
| Equity Real Estate Investment Trusts (REITs) - 5.1% | |||
| Camden Property Trust (SBI) | 7,620 | 646,786 | |
| CubeSmart | 27,644 | 942,384 | |
| Digital Realty Trust, Inc. | 16,348 | 2,033,037 | |
| Douglas Emmett, Inc. | 63,280 | 709,369 | |
| Essex Property Trust, Inc. | 7,375 | 1,577,660 | |
| Lamar Advertising Co. Class A | 11,354 | 934,094 | |
| Outfront Media, Inc. | 155,250 | 1,515,240 | |
| Prologis (REIT), Inc. | 14,408 | 1,451,606 | |
| Ventas, Inc. | 57,407 | 2,437,501 | |
| Welltower, Inc. | 39,291 | 3,285,121 | |
| 15,532,798 | |||
| Real Estate Management & Development - 1.1% | |||
| Colliers International Group, Inc. | 11,940 | 1,082,371 | |
| Compass, Inc. (b) | 253,010 | 500,960 | |
| Jones Lang LaSalle, Inc. (b) | 13,011 | 1,664,367 | |
| Marcus & Millichap, Inc. | 9,266 | 265,934 | |
| 3,513,632 | |||
TOTAL REAL ESTATE | 19,046,430 | ||
| UTILITIES - 7.7% | |||
| Electric Utilities - 5.6% | |||
| Constellation Energy Corp. | 41,592 | 4,696,569 | |
| Edison International | 39,271 | 2,476,429 | |
| Entergy Corp. | 15,430 | 1,474,954 | |
| FirstEnergy Corp. | 67,450 | 2,401,220 | |
| NextEra Energy, Inc. | 35,910 | 2,093,553 | |
| PG&E Corp. (b) | 240,255 | 3,916,157 | |
| 17,058,882 | |||
| Gas Utilities - 0.0% | |||
| Southwest Gas Holdings, Inc. | 1,470 | 86,157 | |
| Independent Power and Renewable Electricity Producers - 1.5% | |||
| The AES Corp. | 174,215 | 2,595,804 | |
| Vistra Corp. | 58,336 | 1,908,754 | |
| 4,504,558 | |||
| Multi-Utilities - 0.6% | |||
| Sempra | 26,682 | 1,868,540 | |
TOTAL UTILITIES | 23,518,137 | ||
| TOTAL COMMON STOCKS (Cost $280,963,488) | 301,663,139 | ||
| U.S. Treasury Obligations - 0.1% | |||
Principal Amount (d) | Value ($) | ||
U.S. Treasury Bills, yield at date of purchase 5.37% to 5.41% 12/7/23 to 1/18/24 (e) (Cost $307,513) | 310,000 | 307,522 | |
| Money Market Funds - 3.6% | |||
| Shares | Value ($) | ||
| Fidelity Cash Central Fund 5.40% (f) | 3,865,706 | 3,866,479 | |
| Fidelity Securities Lending Cash Central Fund 5.40% (f)(g) | 7,139,472 | 7,140,186 | |
| TOTAL MONEY MARKET FUNDS (Cost $11,006,651) | 11,006,665 | ||
| TOTAL INVESTMENT IN SECURITIES - 102.6% (Cost $292,277,652) | 312,977,326 |
NET OTHER ASSETS (LIABILITIES) - (2.6)% | (7,885,546) |
| NET ASSETS - 100.0% | 305,091,780 |
| Futures Contracts | |||||
Number of contracts | Expiration Date | Notional Amount ($) | Value ($) | Unrealized Appreciation/ (Depreciation) ($) | |
| Purchased | |||||
| Equity Index Contracts | |||||
| CME E-mini S&P MidCap 400 Index Contracts (United States) | 10 | Dec 2023 | 2,375,100 | (105,715) | (105,715) |
| The notional amount of futures purchased as a percentage of Net Assets is 0.8% | |||||
| (a) | Security exempt from registration under Rule 144A of the Securities Act of 1933. These securities may be resold in transactions exempt from registration, normally to qualified institutional buyers. At the end of the period, the value of these securities amounted to $2,274,875 or 0.7% of net assets. |
| (b) | Non-income producing |
| (c) | Security or a portion of the security is on loan at period end. |
| (d) | Amount is stated in United States dollars unless otherwise noted. |
| (e) | Security or a portion of the security was pledged to cover margin requirements for futures contracts. At period end, the value of securities pledged amounted to $188,280. |
| (f) | Affiliated fund that is generally available only to investment companies and other accounts managed by Fidelity Investments. The rate quoted is the annualized seven-day yield of the fund at period end. A complete unaudited listing of the fund's holdings as of its most recent quarter end is available upon request. In addition, each Fidelity Central Fund's financial statements, which are not covered by the Fund's Report of Independent Registered Public Accounting Firm, are available on the SEC's website or upon request. |
| (g) | Investment made with cash collateral received from securities on loan. |
| Affiliate | Value, beginning of period ($) | Purchases ($) | Sales Proceeds ($) | Dividend Income ($) | Realized Gain (loss) ($) | Change in Unrealized appreciation (depreciation) ($) | Value, end of period ($) | % ownership, end of period |
| Fidelity Cash Central Fund 5.40% | 8,563,889 | 161,781,457 | 166,478,867 | 195,352 | - | - | 3,866,479 | 0.0% |
| Fidelity Securities Lending Cash Central Fund 5.40% | 10,739,930 | 120,002,446 | 123,602,190 | 42,952 | - | - | 7,140,186 | 0.0% |
| Total | 19,303,819 | 281,783,903 | 290,081,057 | 238,304 | - | - | 11,006,665 | |
| Valuation Inputs at Reporting Date: | ||||
| Description | Total ($) | Level 1 ($) | Level 2 ($) | Level 3 ($) |
Investments in Securities: | ||||
| Equities: | ||||
Communication Services | 6,354,823 | 4,670,161 | 1,684,662 | - |
Consumer Discretionary | 38,269,113 | 37,592,733 | 676,380 | - |
Consumer Staples | 10,179,628 | 10,179,628 | - | - |
Energy | 31,477,215 | 31,477,215 | - | - |
Financials | 57,681,668 | 56,883,873 | 797,795 | - |
Health Care | 18,952,420 | 17,976,973 | 975,447 | - |
Industrials | 51,745,369 | 51,745,369 | - | - |
Information Technology | 11,012,362 | 11,012,362 | - | - |
Materials | 33,425,974 | 33,425,974 | - | - |
Real Estate | 19,046,430 | 19,046,430 | - | - |
Utilities | 23,518,137 | 23,518,137 | - | - |
| U.S. Government and Government Agency Obligations | 307,522 | - | 307,522 | - |
| Money Market Funds | 11,006,665 | 11,006,665 | - | - |
| Total Investments in Securities: | 312,977,326 | 308,535,520 | 4,441,806 | - |
Derivative Instruments: Liabilities | ||||
Futures Contracts | (105,715) | (105,715) | - | - |
| Total Liabilities | (105,715) | (105,715) | - | - |
| Total Derivative Instruments: | (105,715) | (105,715) | - | - |
Primary Risk Exposure / Derivative Type | Value | |
| Asset ($) | Liability ($) | |
| Equity Risk | ||
Futures Contracts (a) | 0 | (105,715) |
| Total Equity Risk | 0 | (105,715) |
| Total Value of Derivatives | 0 | (105,715) |
| Statement of Assets and Liabilities | ||||
| October 31, 2023 | ||||
| Assets | ||||
| Investment in securities, at value (including securities loaned of $6,972,815) - See accompanying schedule: | ||||
Unaffiliated issuers (cost $281,271,001) | $ | 301,970,661 | ||
Fidelity Central Funds (cost $11,006,651) | 11,006,665 | |||
| Total Investment in Securities (cost $292,277,652) | $ | 312,977,326 | ||
| Cash | 35,356 | |||
| Foreign currency held at value (cost $709) | 709 | |||
| Receivable for investments sold | 1,412,018 | |||
| Receivable for fund shares sold | 231,837 | |||
| Dividends receivable | 219,082 | |||
| Distributions receivable from Fidelity Central Funds | 16,990 | |||
| Receivable for daily variation margin on futures contracts | 21,300 | |||
| Prepaid expenses | 468 | |||
| Receivable from investment adviser for expense reductions | 38,882 | |||
| Other receivables | 82 | |||
Total assets | 314,954,050 | |||
| Liabilities | ||||
| Payable for investments purchased | $ | 1,900,020 | ||
| Payable for fund shares redeemed | 489,352 | |||
| Accrued management fee | 187,128 | |||
| Distribution and service plan fees payable | 37,736 | |||
| Other affiliated payables | 52,061 | |||
| Other payables and accrued expenses | 56,133 | |||
| Collateral on securities loaned | 7,139,840 | |||
| Total Liabilities | 9,862,270 | |||
| Net Assets | $ | 305,091,780 | ||
| Net Assets consist of: | ||||
| Paid in capital | $ | 294,354,034 | ||
| Total accumulated earnings (loss) | 10,737,746 | |||
| Net Assets | $ | 305,091,780 | ||
| Net Asset Value and Maximum Offering Price | ||||
| Class A : | ||||
Net Asset Value and redemption price per share ($86,043,844 ÷ 2,886,296 shares)(a) | $ | 29.81 | ||
| Maximum offering price per share (100/94.25 of $29.81) | $ | 31.63 | ||
| Class M : | ||||
Net Asset Value and redemption price per share ($21,707,891 ÷ 737,153 shares)(a) | $ | 29.45 | ||
| Maximum offering price per share (100/96.50 of $29.45) | $ | 30.52 | ||
| Class C : | ||||
Net Asset Value and offering price per share ($11,801,786 ÷ 425,617 shares)(a) | $ | 27.73 | ||
| Class I : | ||||
Net Asset Value, offering price and redemption price per share ($134,095,464 ÷ 4,441,175 shares) | $ | 30.19 | ||
| Class Z : | ||||
Net Asset Value, offering price and redemption price per share ($51,442,795 ÷ 1,702,893 shares) | $ | 30.21 | ||
(a)Redemption price per share is equal to net asset value less any applicable contingent deferred sales charge. | ||||
| Statement of Operations | ||||
Year ended October 31, 2023 | ||||
| Investment Income | ||||
| Dividends | $ | 6,729,667 | ||
| Interest | 16,565 | |||
| Income from Fidelity Central Funds (including $42,952 from security lending) | 238,304 | |||
| Total Income | 6,984,536 | |||
| Expenses | ||||
| Management fee | ||||
| Basic fee | $ | 1,949,157 | ||
| Performance adjustment | 528,459 | |||
| Transfer agent fees | 576,000 | |||
| Distribution and service plan fees | 513,957 | |||
| Accounting fees | 131,434 | |||
| Custodian fees and expenses | 85,549 | |||
| Independent trustees' fees and expenses | 2,129 | |||
| Registration fees | 92,567 | |||
| Audit | 63,580 | |||
| Legal | 9,346 | |||
| Interest | 6,741 | |||
| Miscellaneous | 1,497 | |||
| Total expenses before reductions | 3,960,416 | |||
| Expense reductions | (224,018) | |||
| Total expenses after reductions | 3,736,398 | |||
| Net Investment income (loss) | 3,248,138 | |||
| Realized and Unrealized Gain (Loss) | ||||
| Net realized gain (loss) on: | ||||
| Investment Securities: | ||||
| Unaffiliated issuers | (7,956,117) | |||
| Foreign currency transactions | (1,579) | |||
| Futures contracts | 507,723 | |||
| Total net realized gain (loss) | (7,449,973) | |||
| Change in net unrealized appreciation (depreciation) on: | ||||
| Investment Securities: | ||||
| Unaffiliated issuers | 8,698,967 | |||
| Assets and liabilities in foreign currencies | 234 | |||
| Futures contracts | (56,079) | |||
| Total change in net unrealized appreciation (depreciation) | 8,643,122 | |||
| Net gain (loss) | 1,193,149 | |||
| Net increase (decrease) in net assets resulting from operations | $ | 4,441,287 | ||
| Statement of Changes in Net Assets | ||||
Year ended October 31, 2023 | Year ended October 31, 2022 | |||
| Increase (Decrease) in Net Assets | ||||
| Operations | ||||
| Net investment income (loss) | $ | 3,248,138 | $ | 3,312,639 |
| Net realized gain (loss) | (7,449,973) | (3,866,612) | ||
| Change in net unrealized appreciation (depreciation) | 8,643,122 | (30,032,655) | ||
| Net increase (decrease) in net assets resulting from operations | 4,441,287 | (30,586,628) | ||
| Distributions to shareholders | (2,171,133) | (13,471,817) | ||
| Share transactions - net increase (decrease) | (94,886,937) | 151,885,468 | ||
| Total increase (decrease) in net assets | (92,616,783) | 107,827,023 | ||
| Net Assets | ||||
| Beginning of period | 397,708,563 | 289,881,540 | ||
| End of period | $ | 305,091,780 | $ | 397,708,563 |
| Fidelity Advisor® Value Fund Class A |
| Years ended October 31, | 2023 | 2022 | 2021 | 2020 | 2019 | |||||
Selected Per-Share Data | ||||||||||
| Net asset value, beginning of period | $ | 29.71 | $ | 33.55 | $ | 20.40 | $ | 22.44 | $ | 23.40 |
| Income from Investment Operations | ||||||||||
Net investment income (loss) A,B | .23 | .24 | .11 | .14 | .19 | |||||
| Net realized and unrealized gain (loss) | (.01) C | (2.61) | 13.15 | (1.46) | 1.57 | |||||
| Total from investment operations | .22 | (2.37) | 13.26 | (1.32) | 1.76 | |||||
| Distributions from net investment income | (.12) | (.24) | (.11) | (.17) D | (.10) D | |||||
| Distributions from net realized gain | - | (1.24) | - | (.55) D | (2.62) D | |||||
| Total distributions | (.12) | (1.47) E | (.11) | (.72) | (2.72) | |||||
| Net asset value, end of period | $ | 29.81 | $ | 29.71 | $ | 33.55 | $ | 20.40 | $ | 22.44 |
Total Return F,G | .73% | (7.25)% | 65.21% | (6.24)% | 9.00% | |||||
Ratios to Average Net Assets B,H,I | ||||||||||
| Expenses before reductions | 1.22% | 1.15% | 1.21% | 1.17% | 1.10% | |||||
| Expenses net of fee waivers, if any | 1.15% | 1.15% | 1.20% | 1.16% | 1.10% | |||||
| Expenses net of all reductions | 1.15% | 1.15% | 1.20% | 1.14% | 1.10% | |||||
| Net investment income (loss) | .74% | .76% | .35% | .71% | .87% | |||||
| Supplemental Data | ||||||||||
| Net assets, end of period (000 omitted) | $ | 86,044 | $ | 108,439 | $ | 100,604 | $ | 36,269 | $ | 47,465 |
Portfolio turnover rate J | 75% | 67% | 64% | 91% | 77% |
| Fidelity Advisor® Value Fund Class M |
| Years ended October 31, | 2023 | 2022 | 2021 | 2020 | 2019 | |||||
Selected Per-Share Data | ||||||||||
| Net asset value, beginning of period | $ | 29.34 | $ | 33.13 | $ | 20.15 | $ | 22.19 | $ | 23.15 |
| Income from Investment Operations | ||||||||||
Net investment income (loss) A,B | .15 | .16 | .03 | .09 | .12 | |||||
| Net realized and unrealized gain (loss) | - C | (2.57) | 13.01 | (1.47) | 1.57 | |||||
| Total from investment operations | .15 | (2.41) | 13.04 | (1.38) | 1.69 | |||||
| Distributions from net investment income | (.04) | (.15) | (.06) | (.11) D | (.03) D | |||||
| Distributions from net realized gain | - | (1.24) | - | (.55) D | (2.62) D | |||||
| Total distributions | (.04) | (1.38) E | (.06) | (.66) | (2.65) | |||||
| Net asset value, end of period | $ | 29.45 | $ | 29.34 | $ | 33.13 | $ | 20.15 | $ | 22.19 |
Total Return F,G | .49% | (7.46)% | 64.81% | (6.55)% | 8.74% | |||||
Ratios to Average Net Assets B,H,I | ||||||||||
| Expenses before reductions | 1.46% | 1.40% | 1.47% | 1.45% | 1.39% | |||||
| Expenses net of fee waivers, if any | 1.40% | 1.40% | 1.45% | 1.43% | 1.38% | |||||
| Expenses net of all reductions | 1.39% | 1.40% | 1.45% | 1.42% | 1.38% | |||||
| Net investment income (loss) | .49% | .51% | .10% | .43% | .58% | |||||
| Supplemental Data | ||||||||||
| Net assets, end of period (000 omitted) | $ | 21,708 | $ | 22,540 | $ | 23,323 | $ | 12,736 | $ | 15,006 |
Portfolio turnover rate J | 75% | 67% | 64% | 91% | 77% |
| Fidelity Advisor® Value Fund Class C |
| Years ended October 31, | 2023 | 2022 | 2021 | 2020 | 2019 | |||||
Selected Per-Share Data | ||||||||||
| Net asset value, beginning of period | $ | 27.73 | $ | 31.45 | $ | 19.18 | $ | 21.15 | $ | 22.16 |
| Income from Investment Operations | ||||||||||
Net investment income (loss) A,B | - C | - C | (.12) | (.02) | .01 | |||||
| Net realized and unrealized gain (loss) | - C | (2.43) | 12.39 | (1.40) | 1.49 | |||||
| Total from investment operations | - C | (2.43) | 12.27 | (1.42) | 1.50 | |||||
| Distributions from net investment income | - | (.08) | - | - | - | |||||
| Distributions from net realized gain | - | (1.21) | - | (.55) | (2.51) | |||||
| Total distributions | - | (1.29) | - | (.55) | (2.51) | |||||
| Net asset value, end of period | $ | 27.73 | $ | 27.73 | $ | 31.45 | $ | 19.18 | $ | 21.15 |
Total Return D,E | -% | (7.94)% | 63.97% | (7.02)% | 8.13% | |||||
Ratios to Average Net Assets B,F,G | ||||||||||
| Expenses before reductions | 2.00% | 1.93% | 2.01% | 1.98% | 1.92% | |||||
| Expenses net of fee waivers, if any | 1.90% | 1.90% | 1.96% | 1.97% | 1.92% | |||||
| Expenses net of all reductions | 1.90% | 1.90% | 1.96% | 1.95% | 1.91% | |||||
| Net investment income (loss) | (.01)% | -% H | (.41)% | (.11)% | .05% | |||||
| Supplemental Data | ||||||||||
| Net assets, end of period (000 omitted) | $ | 11,802 | $ | 14,661 | $ | 15,726 | $ | 6,331 | $ | 8,777 |
Portfolio turnover rate I | 75% | 67% | 64% | 91% | 77% |
| Fidelity Advisor® Value Fund Class I |
| Years ended October 31, | 2023 | 2022 | 2021 | 2020 | 2019 | |||||
Selected Per-Share Data | ||||||||||
| Net asset value, beginning of period | $ | 30.09 | $ | 33.96 | $ | 20.64 | $ | 22.70 | $ | 23.66 |
| Income from Investment Operations | ||||||||||
Net investment income (loss) A,B | .31 | .32 | .20 | .21 | .26 | |||||
| Net realized and unrealized gain (loss) | (.02) C | (2.63) | 13.30 | (1.48) | 1.59 | |||||
| Total from investment operations | .29 | (2.31) | 13.50 | (1.27) | 1.85 | |||||
| Distributions from net investment income | (.19) | (.33) | (.18) | (.25) D | (.19) D | |||||
| Distributions from net realized gain | - | (1.24) | - | (.55) D | (2.62) D | |||||
| Total distributions | (.19) | (1.56) E | (.18) | (.79) E | (2.81) | |||||
| Net asset value, end of period | $ | 30.19 | $ | 30.09 | $ | 33.96 | $ | 20.64 | $ | 22.70 |
Total Return F | .97% | (6.99)% | 65.68% | (5.95)% | 9.34% | |||||
Ratios to Average Net Assets B,G,H | ||||||||||
| Expenses before reductions | .94% | .88% | .92% | .87% | .79% | |||||
| Expenses net of fee waivers, if any | .90% | .88% | .92% | .85% | .79% | |||||
| Expenses net of all reductions | .90% | .88% | .92% | .84% | .79% | |||||
| Net investment income (loss) | .99% | 1.02% | .63% | 1.01% | 1.18% | |||||
| Supplemental Data | ||||||||||
| Net assets, end of period (000 omitted) | $ | 134,095 | $ | 170,764 | $ | 104,393 | $ | 8,861 | $ | 11,097 |
Portfolio turnover rate I | 75% | 67% | 64% | 91% | 77% |
| Fidelity Advisor® Value Fund Class Z |
| Years ended October 31, | 2023 | 2022 | 2021 | 2020 | 2019 | |||||
Selected Per-Share Data | ||||||||||
| Net asset value, beginning of period | $ | 30.10 | $ | 33.96 | $ | 20.63 | $ | 22.69 | $ | 23.67 |
| Income from Investment Operations | ||||||||||
Net investment income (loss) A,B | .36 | .36 | .25 | .23 | .28 | |||||
| Net realized and unrealized gain (loss) | (.01) C | (2.62) | 13.28 | (1.47) | 1.58 | |||||
| Total from investment operations | .35 | (2.26) | 13.53 | (1.24) | 1.86 | |||||
| Distributions from net investment income | (.24) | (.36) | (.20) | (.27) D | (.22) D | |||||
| Distributions from net realized gain | - | (1.24) | - | (.55) D | (2.62) D | |||||
| Total distributions | (.24) | (1.60) | (.20) | (.82) | (2.84) | |||||
| Net asset value, end of period | $ | 30.21 | $ | 30.10 | $ | 33.96 | $ | 20.63 | $ | 22.69 |
Total Return E | 1.14% | (6.86)% | 65.88% | (5.84)% | 9.45% | |||||
Ratios to Average Net Assets B,F,G | ||||||||||
| Expenses before reductions | .82% | .76% | .77% | .75% | .69% | |||||
| Expenses net of fee waivers, if any | .75% | .75% | .77% | .74% | .68% | |||||
| Expenses net of all reductions | .75% | .75% | .77% | .72% | .68% | |||||
| Net investment income (loss) | 1.14% | 1.16% | .78% | 1.13% | 1.28% | |||||
| Supplemental Data | ||||||||||
| Net assets, end of period (000 omitted) | $ | 51,443 | $ | 81,306 | $ | 45,835 | $ | 1,712 | $ | 2,772 |
Portfolio turnover rate H | 75% | 67% | 64% | 91% | 77% |
| Fidelity Central Fund | Investment Manager | Investment Objective | Investment Practices | Expense RatioA |
| Fidelity Money Market Central Funds | Fidelity Management & Research Company LLC (FMR) | Each fund seeks to obtain a high level of current income consistent with the preservation of capital and liquidity. | Short-term Investments | Less than .005% |
| Gross unrealized appreciation | $46,308,668 |
| Gross unrealized depreciation | (27,709,886) |
| Net unrealized appreciation (depreciation) | $18,598,782 |
| Tax Cost | $294,378,544 |
| Undistributed ordinary income | $2,490,917 |
| Capital loss carryforward | $(10,226,721) |
| Net unrealized appreciation (depreciation) on securities and other investments | $18,473,549 |
| Short-term | $(10,226,721) |
| Total capital loss carryforward | $(10,226,721) |
| October 31, 2023 | October 31, 2022 | |
| Ordinary Income | $2,171,133 | $ 7,667,872 |
| Long-term Capital Gains | - | 5,803,945 |
| Total | $2,171,133 | $ 13,471,817 |
| Equity Risk | Equity risk relates to the fluctuations in the value of financial instruments as a result of changes in market prices (other than those arising from interest rate risk or foreign exchange risk), whether caused by factors specific to an individual investment, its issuer, or all factors affecting all instruments traded in a market or market segment. |
| Purchases ($) | Sales ($) | |
| Fidelity Advisor Value Fund | 275,594,806 | 363,663,185 |
| Distribution Fee | Service Fee | Total Fees | Retained by FDC | |
| Class A | - % | .25% | $255,098 | $7,867 |
| Class M | .25% | .25% | 116,674 | 468 |
| Class C | .75% | .25% | 142,185 | 25,190 |
| $513,957 | $33,525 |
| Retained by FDC | |
| Class A | $37,226 |
| Class M | 1,686 |
Class CA | 267 |
| $39,179 |
| Amount | % of Class-Level Average Net Assets | |
| Class A | $193,757 | .19 |
| Class M | 42,492 | .18 |
| Class C | 31,694 | .22 |
| Class I | 280,296 | .17 |
| Class Z | 27,761 | .04 |
| $576,000 |
| % of Class-Level Average Net Assets | |
| Class A | 0.1895% |
| Class M | 0.1801% |
| Class C | 0.2000% |
| Class I | 0.1646% |
| % of Average Net Assets | |
| Fidelity Advisor Value Fund | .04 |
| % of Average Net Assets | |
| Fidelity Advisor Value Fund | 0.0354% |
| Borrower or Lender | Average Loan Balance | Weighted Average Interest Rate | Interest Expense | |
| Fidelity Advisor Value Fund | Borrower | $ 8,158,000 | 4.96% | $6,741 |
| Amount | |
| Fidelity Advisor Value Fund | $ 10,327 |
| Purchases ($) | Sales ($) | Realized Gain (Loss) ($) | |
| Fidelity Advisor Value Fund | 18,240,360 | 23,544,324 | 32,084 |
| Amount | |
| Fidelity Advisor Value Fund | $695 |
| Total Security Lending Fees Paid to NFS | Security Lending Income From Securities Loaned to NFS | Value of Securities Loaned to NFS at Period End | |
| Fidelity Advisor Value Fund | $4,561 | $4,098 | $- |
| Expense Limitations | Reimbursement | |
| Class A | 1.15% | $64,634 |
| Class M | 1.40% | 13,215 |
| Class C | 1.90% | 13,850 |
| Class I | .90% | 68,009 |
| Class Z | .75% | 41,910 |
| $201,618 |
| Expense reduction | |
| Class M | $348 |
Year ended October 31, 2023 | Year ended October 31, 2022 | |
| Fidelity Advisor Value Fund | ||
| Distributions to shareholders | ||
| Class A | $432,389 | $4,405,947 |
| Class M | 26,680 | 990,545 |
| Class C | - | 660,630 |
| Class I | 1,087,478 | 5,021,021 |
| Class Z | 624,586 | 2,393,674 |
Total | $2,171,133 | $13,471,817 |
| Shares | Shares | Dollars | Dollars | |
Year ended October 31, 2023 | Year ended October 31, 2022 | Year ended October 31, 2023 | Year ended October 31, 2022 | |
| Fidelity Advisor Value Fund | ||||
| Class A | ||||
| Shares sold | 645,294 | 1,692,576 | $20,203,230 | $53,594,255 |
| Reinvestment of distributions | 14,231 | 137,847 | 427,939 | 4,297,977 |
| Shares redeemed | (1,423,001) | (1,179,626) | (43,844,893) | (37,522,482) |
| Net increase (decrease) | (763,476) | 650,797 | $(23,213,724) | $20,369,750 |
| Class M | ||||
| Shares sold | 72,556 | 134,897 | $2,224,101 | $4,251,310 |
| Reinvestment of distributions | 888 | 31,736 | 26,425 | 979,513 |
| Shares redeemed | (104,459) | (102,350) | (3,211,772) | (3,170,588) |
| Net increase (decrease) | (31,015) | 64,283 | $(961,246) | $2,060,235 |
| Class C | ||||
| Shares sold | 156,850 | 217,748 | $4,543,881 | $6,554,230 |
| Reinvestment of distributions | - | 22,308 | - | 654,000 |
| Shares redeemed | (259,838) | (211,462) | (7,440,188) | (6,050,103) |
| Net increase (decrease) | (102,988) | 28,594 | $(2,896,307) | $1,158,127 |
| Class I | ||||
| Shares sold | 2,295,758 | 5,343,179 | $72,434,977 | $171,305,654 |
| Reinvestment of distributions | 35,458 | 157,060 | 1,077,559 | 4,946,432 |
| Shares redeemed | (3,565,521) | (2,899,066) | (111,308,941) | (90,414,411) |
| Net increase (decrease) | (1,234,305) | 2,601,173 | $(37,796,405) | $85,837,675 |
| Class Z | ||||
| Shares sold | 823,282 | 2,344,555 | $26,158,948 | $74,364,664 |
| Reinvestment of distributions | 17,943 | 65,065 | 544,763 | 2,047,896 |
| Shares redeemed | (1,839,568) | (1,058,038) | (56,722,966) | (33,952,879) |
| Net increase (decrease) | (998,343) | 1,351,582 | $(30,019,255) | $42,459,681 |
| The Example is based on an investment of $1,000 invested at the beginning of the period and held for the entire period (May 1, 2023 to October 31, 2023). |
Annualized Expense Ratio- A | Beginning Account Value May 1, 2023 | Ending Account Value October 31, 2023 | Expenses Paid During Period- C May 1, 2023 to October 31, 2023 | |||||||
| Fidelity Advisor® Value Fund | ||||||||||
| Class A | 1.14% | |||||||||
| Actual | $ 1,000 | $ 987.70 | $ 5.71 | |||||||
Hypothetical-B | $ 1,000 | $ 1,019.46 | $ 5.80 | |||||||
| Class M | 1.39% | |||||||||
| Actual | $ 1,000 | $ 986.60 | $ 6.96 | |||||||
Hypothetical-B | $ 1,000 | $ 1,018.20 | $ 7.07 | |||||||
| Class C | 1.89% | |||||||||
| Actual | $ 1,000 | $ 984.00 | $ 9.45 | |||||||
Hypothetical-B | $ 1,000 | $ 1,015.68 | $ 9.60 | |||||||
| Class I | .89% | |||||||||
| Actual | $ 1,000 | $ 988.90 | $ 4.46 | |||||||
Hypothetical-B | $ 1,000 | $ 1,020.72 | $ 4.53 | |||||||
| Class Z | .74% | |||||||||
| Actual | $ 1,000 | $ 989.80 | $ 3.71 | |||||||
Hypothetical-B | $ 1,000 | $ 1,021.48 | $ 3.77 | |||||||
 |


Contents
| Average Annual Total Returns | |||
Periods ended October 31, 2023 | Past 1 year | Past 5 years | Past 10 years |
Class A (incl. 2.75% sales charge) | 7.51% | 3.30% | 3.19% |
Class M (incl. 2.75% sales charge) | 7.64% | 3.32% | 3.16% |
Class C (incl. contingent deferred sales charge) | 8.84% | 3.10% | 2.86% |
| Fidelity® Floating Rate High Income Fund | 10.99% | 4.19% | 3.78% |
| Class I | 10.84% | 4.14% | 3.73% |
| Class Z | 11.05% | 4.26% | 3.79% |
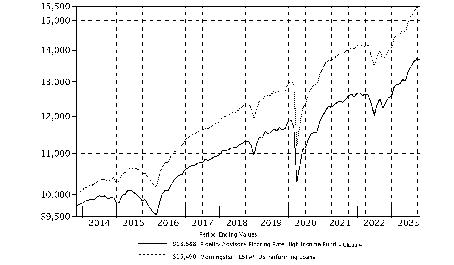
| $10,000 Over 10 Years |
Let's say hypothetically that $10,000 was invested in Fidelity Advisor® Floating Rate High Income Fund - Class A, a class of the fund, on October 31, 2013, and the current 2.75% sales charge was paid. The chart shows how the value of your investment would have changed, and also shows how the Morningstar® LSTA® US Performing Loans performed over the same period. |
 |
| Top Bond Issuers (% of Fund's net assets) | ||
(with maturities greater than one year) | ||
| Bass Pro Group LLC | 2.5 | |
| Asurion LLC | 2.1 | |
| Acrisure LLC | 1.2 | |
| Fertitta Entertainment LLC NV | 1.1 | |
| Ukg, Inc. | 1.0 | |
| Caesars Entertainment, Inc. | 0.9 | |
| Polaris Newco LLC | 0.9 | |
| TransDigm, Inc. | 0.8 | |
| MH Sub I LLC | 0.8 | |
| Clydesdale Acquisition Holdings, Inc. | 0.8 | |
| 12.1 | ||
| Market Sectors (% of Fund's net assets) | ||
| Technology | 15.5 | |
| Services | 9.6 | |
| Insurance | 5.6 | |
| Healthcare | 5.2 | |
| Energy | 4.7 | |
Quality Diversification (% of Fund's net assets) |
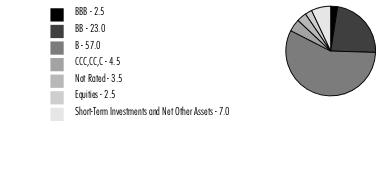 |
| We have used ratings from Moody's Investors Service, Inc. Where Moody's® ratings are not available, we have used S&P® ratings. All ratings are as of the date indicated and do not reflect subsequent changes. |
Asset Allocation (% of Fund's net assets) |
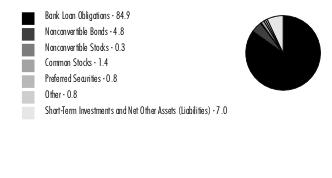 |
| Bank Loan Obligations - 84.9% | |||
Principal Amount (a) (000s) | Value ($) (000s) | ||
| Aerospace - 0.7% | |||
| ADS Tactical, Inc. Tranche B 1LN, term loan CME Term SOFR 1 Month Index + 5.750% 11.1886% 3/19/26 (b)(c)(d) | 12,819 | 12,509 | |
| Gemini HDPE LLC Tranche B 1LN, term loan CME Term SOFR 3 Month Index + 3.000% 8.6448% 12/31/27 (b)(c)(d) | 4,014 | 3,995 | |
| TransDigm, Inc.: | |||
| 1LN, term loan CME Term SOFR 1 Month Index + 3.250% 8.6401% 8/24/28 (b)(c)(d) | 38,825 | 38,764 | |
| Tranche H 1LN, term loan CME Term SOFR 1 Month Index + 3.250% 8.6401% 2/22/27 (b)(c)(d) | 36,618 | 36,579 | |
TOTAL AEROSPACE | 91,847 | ||
| Air Transportation - 1.4% | |||
| AAdvantage Loyalty IP Ltd. Tranche B 1LN, term loan CME Term SOFR 3 Month Index + 4.750% 10.4274% 4/20/28 (b)(c)(d) | 26,394 | 26,724 | |
| Air Canada Tranche B 1LN, term loan CME Term SOFR 3 Month Index + 3.500% 9.1284% 8/11/28 (b)(c)(d) | 17,269 | 17,239 | |
| Echo Global Logistics, Inc.: | |||
| 1LN, term loan: | |||
CME Term SOFR 1 Month Index + 3.500% 8.9241% 11/23/28 (b)(c)(d) | 13,246 | 12,656 | |
CME Term SOFR 3 Month Index + 4.750% 10.1741% 11/23/28 (b)(c)(d)(e) | 19,256 | 19,256 | |
| 2LN, term loan: | |||
CME Term SOFR 3 Month Index + 7.000% 12.3161% 11/23/29 (b)(c)(d)(e) | 8,145 | 8,080 | |
CME Term SOFR 3 Month Index + 8.000% 13.4832% 11/23/29 (b)(c)(d)(e) | 4,100 | 4,100 | |
| Mileage Plus Holdings LLC Tranche B 1LN, term loan 3 month U.S. LIBOR + 5.250% 10.7979% 7/2/27 (b)(c)(d) | 20,423 | 21,016 | |
| Rand Parent LLC Tranche B 1LN, term loan CME Term SOFR 1 Month Index + 4.250% 9.6401% 3/17/30 (b)(c)(d) | 5,313 | 5,104 | |
| SkyMiles IP Ltd. Tranche B 1LN, term loan CME Term SOFR 1 Month Index + 3.750% 9.1658% 10/20/27 (b)(c)(d) | 18,392 | 18,817 | |
| STG Logistics, Inc. 1LN, term loan CME Term SOFR 1 Month Index + 6.000% 11.5401% 3/24/28 (b)(c)(d)(e) | 12,248 | 11,514 | |
| United Airlines, Inc. Tranche B 1LN, term loan CME Term SOFR 3 Month Index + 3.750% 9.1894% 4/21/28 (b)(c)(d) | 24,513 | 24,421 | |
TOTAL AIR TRANSPORTATION | 168,927 | ||
| Automotive & Auto Parts - 1.4% | |||
| American Trailer World Corp. Tranche B 1LN, term loan CME Term SOFR 1 Month Index + 3.750% 9.1741% 3/5/28 (b)(c)(d) | 18,862 | 17,688 | |
| Belron Finance U.S. LLC Tranche B 1LN, term loan CME Term SOFR 3 Month Index + 2.750% 8.245% 4/18/29 (b)(c)(d) | 5,227 | 5,230 | |
| Clarios Global LP Tranche B 1LN, term loan CME Term SOFR 1 Month Index + 3.750% 9.0741% 4/20/30 (b)(c)(d) | 26,480 | 26,414 | |
| CWGS Group LLC Tranche B 1LN, term loan CME Term SOFR 1 Month Index + 2.500% 7.9485% 6/3/28 (b)(c)(d) | 39,583 | 36,417 | |
| Driven Holdings LLC Tranche B 1LN, term loan CME Term SOFR 1 Month Index + 3.000% 8.4389% 12/17/28 (b)(c)(d) | 12,982 | 12,609 | |
| Ls Group Opco Acquistion LLC Tranche B 1LN, term loan CME Term SOFR 1 Month Index + 3.250% 8.692% 11/2/27 (b)(c)(d) | 15,180 | 15,104 | |
| PECF USS Intermediate Holding III Corp. Tranche B 1LN, term loan CME Term SOFR 1 Month Index + 4.250% 9.8943% 12/17/28 (b)(c)(d) | 26,562 | 19,998 | |
| Power Stop LLC 1LN, term loan CME Term SOFR 1 Month Index + 4.750% 10.1741% 1/26/29 (b)(c)(d) | 18,345 | 15,074 | |
| Realtruck Group, Inc. Tranche B 1LN, term loan CME Term SOFR 1 Month Index + 3.750% 9.1886% 1/29/28 (b)(c)(d) | 16,031 | 15,289 | |
| Rough Country LLC: | |||
| 2LN, term loan CME Term SOFR 3 Month Index + 6.500% 11.7332% 7/28/29 (b)(c)(d) | 6,095 | 5,706 | |
| Tranche B 1LN, term loan CME Term SOFR 3 Month Index + 3.500% 8.8948% 7/28/28 (b)(c)(d) | 3,631 | 3,552 | |
TOTAL AUTOMOTIVE & AUTO PARTS | 173,081 | ||
| Banks & Thrifts - 0.6% | |||
| Citadel Securities LP Tranche B 1LN, term loan CME Term SOFR 1 Month Index + 2.500% 7.9386% 7/25/30 (b)(c)(d) | 42,800 | 42,604 | |
| Deerfield Dakota Holding LLC Tranche B 1LN, term loan CME Term SOFR 3 Month Index + 3.750% 9.1401% 4/9/27 (b)(c)(d) | 12,563 | 12,113 | |
| Novae LLC 1LN, term loan CME Term SOFR 3 Month Index + 5.000% 10.4387% 12/22/28 (b)(c)(d) | 11,499 | 10,694 | |
| Superannuation & Investments U.S. LLC 1LN, term loan CME Term SOFR 1 Month Index + 3.750% 9.1886% 12/1/28 (b)(c)(d) | 6,465 | 6,441 | |
TOTAL BANKS & THRIFTS | 71,852 | ||
| Broadcasting - 1.5% | |||
| AppLovin Corp. Tranche B 1LN, term loan: | |||
| CME Term SOFR 1 Month Index + 3.000% 8.4241% 10/25/28 (b)(c)(d) | 8,035 | 8,008 | |
| CME Term SOFR 1 Month Index + 3.100% 8.4241% 8/15/30 (b)(c)(d) | 22,819 | 22,730 | |
| Diamond Sports Group LLC: | |||
| 1LN, term loan CME Term SOFR 1 Month Index + 8.000% 15.4146% 8/24/26 (b)(c)(d) | 8,575 | 3,221 | |
| 2LN, term loan CME Term SOFR 1 Month Index + 3.250% 10.6625% (b)(c)(d)(f) | 71,092 | 756 | |
| Dotdash Meredith, Inc. Tranche B 1LN, term loan CME Term SOFR 1 Month Index + 4.000% 9.4146% 12/1/28 (b)(c)(d) | 43,642 | 41,242 | |
| Nexstar Media, Inc. Tranche B, term loan CME Term SOFR 1 Month Index + 2.500% 7.9386% 9/19/26 (b)(c)(d) | 20,599 | 20,588 | |
| Sinclair Television Group, Inc.: | |||
| Tranche B 1LN, term loan: | |||
CME Term SOFR 1 Month Index + 2.500% 7.9386% 9/30/26 (b)(c)(d) | 5,206 | 4,360 | |
CME Term SOFR 1 Month Index + 3.000% 8.4386% 4/1/28 (b)(c)(d) | 2,933 | 2,051 | |
| Tranche B4 1LN, term loan CME Term SOFR 1 Month Index + 2.750% 9.1741% 4/21/29 (b)(c)(d) | 13,727 | 9,326 | |
| Springer Nature Deutschland GmbH Tranche B18 1LN, term loan CME Term SOFR 3 Month Index + 3.000% 8.6517% 8/14/26 (b)(c)(d) | 11,742 | 11,721 | |
| Univision Communications, Inc.: | |||
| 1LN, term loan CME Term SOFR 3 Month Index + 4.250% 9.6401% 6/24/29 (b)(c)(d) | 7,801 | 7,772 | |
| Tranche B 1LN, term loan: | |||
CME Term SOFR 1 Month Index + 3.250% 8.6886% 3/24/26 (b)(c)(d) | 8,623 | 8,544 | |
CME Term SOFR 1 Month Index + 3.250% 8.6886% 1/31/29 (b)(c)(d) | 38,927 | 38,234 | |
TOTAL BROADCASTING | 178,553 | ||
| Building Materials - 3.0% | |||
| Acproducts Holdings, Inc. Tranche B 1LN, term loan CME Term SOFR 3 Month Index + 4.250% 9.9017% 5/17/28 (b)(c)(d) | 49,247 | 38,987 | |
| APi Group DE, Inc. Tranche B 1LN, term loan CME Term SOFR 1 Month Index + 2.500% 7.9386% 1/3/29 (b)(c)(d) | 25,229 | 25,236 | |
| Emerson Climate Technologies Tranche B 1LN, term loan CME Term SOFR 1 Month Index + 3.000% 8.3241% 5/31/30 (b)(c)(d) | 23,794 | 23,730 | |
| Foley Products Co. LLC 1LN, term loan CME Term SOFR 3 Month Index + 4.750% 10.2901% 12/29/28 (b)(c)(d) | 5,852 | 5,830 | |
| Hunter Douglas, Inc. Tranche B 1LN, term loan CME Term SOFR 3 Month Index + 3.500% 8.8911% 2/25/29 (b)(c)(d) | 96,659 | 91,162 | |
| Ingersoll-Rand Services Co. Tranche B 1LN, term loan CME Term SOFR 1 Month Index + 1.750% 7.1661% 2/28/27 (b)(c)(d) | 3,377 | 3,379 | |
| Janus International Group LLC Tranche B 1LN, term loan CME Term SOFR 1 Month Index + 3.250% 8.7643% 8/3/30 (b)(c)(d) | 4,175 | 4,134 | |
| Oscar AcquisitionCo LLC 1LN, term loan CME Term SOFR 3 Month Index + 4.500% 9.9901% 4/29/29 (b)(c)(d) | 44,445 | 43,242 | |
| Smyrna Ready Mix LLC Tranche B 1lN, term loan CME Term SOFR 1 Month Index + 4.250% 9.6741% 4/1/29 (b)(c)(d) | 19,961 | 19,961 | |
| Specialty Building Products Holdings LLC Tranche B 1LN, term loan CME Term SOFR 1 Month Index + 3.250% 9.1741% 10/15/28 (b)(c)(d) | 8,993 | 8,818 | |
| SRS Distribution, Inc. Tranche B 1LN, term loan: | |||
| CME Term SOFR 1 Month Index + 3.500% 8.9386% 6/4/28 (b)(c)(d) | 40,655 | 39,639 | |
| CME Term SOFR 3 Month Index + 3.500% 8.9241% 6/2/28 (b)(c)(d) | 11,353 | 11,051 | |
| Standard Industries, Inc./New Jersey Tranche B 1LN, term loan CME Term SOFR 1 Month Index + 2.250% 7.9531% 9/22/28 (b)(c)(d) | 19,737 | 19,754 | |
| Traverse Midstream Partners Ll Tranche B, term loan CME TERM SOFR 6 MONTH INDEX + 4.250% 9.24% 2/16/28 (b)(c)(d) | 9,572 | 9,536 | |
| USIC Holdings, Inc. Tranche B 1LN, term loan CME Term SOFR 1 Month Index + 3.500% 8.9386% 5/14/28 (b)(c)(d) | 11,314 | 10,913 | |
| White Capital Buyer LLC Tranche B 1LN, term loan 1 month U.S. LIBOR + 4.000% 9.0741% 10/19/27 (b)(c)(d) | 9,702 | 9,625 | |
TOTAL BUILDING MATERIALS | 364,997 | ||
| Cable/Satellite TV - 1.8% | |||
| Charter Communication Operating LLC Tranche B2 1LN, term loan CME Term SOFR 1 Month Index + 1.750% 7.1331% 2/1/27 (b)(c)(d) | 64,859 | 64,682 | |
| Coral-U.S. Co.-Borrower LLC: | |||
| Tranche B, term loan CME Term SOFR 1 Month Index + 2.250% 7.699% 1/31/28 (b)(c)(d) | 31,425 | 30,940 | |
| Tranche B6 1LN, term loan CME Term SOFR 1 Month Index + 3.000% 8.449% 10/15/29 (b)(c)(d) | 2,855 | 2,824 | |
| CSC Holdings LLC: | |||
| Tranche B 5LN, term loan CME Term SOFR 1 Month Index + 2.500% 7.949% 4/15/27 (b)(c)(d) | 21,271 | 19,151 | |
| Tranche B6 LN, term loan CME Term SOFR 1 Month Index + 4.500% 9.8345% 1/18/28 (b)(c)(d) | 47,897 | 44,664 | |
| DIRECTV Financing LLC 1LN, term loan CME Term SOFR 1 Month Index + 5.000% 10.4386% 8/2/27 (b)(c)(d) | 12,863 | 12,498 | |
| Virgin Media Bristol LLC: | |||
| Tranche N, term loan CME Term SOFR 1 Month Index + 2.500% 7.949% 1/31/28 (b)(c)(d) | 21,915 | 21,271 | |
| Tranche Y 1LN, term loan CME Term SOFR 1 Month Index + 3.250% 8.7899% 3/6/31 (b)(c)(d) | 30,800 | 30,083 | |
TOTAL CABLE/SATELLITE TV | 226,113 | ||
| Capital Goods - 0.6% | |||
| Ali Group North America Corp. Tranche B 1LN, term loan CME Term SOFR 1 Month Index + 2.000% 7.4386% 7/22/29 (b)(c)(d) | 8,306 | 8,292 | |
| Chart Industries, Inc. Tranche B 1LN, term loan CME Term SOFR 1 Month Index + 3.250% 8.6646% 3/17/30 (b)(c)(d) | 24,505 | 24,424 | |
| CPM Holdings, Inc. 1LN, term loan CME Term SOFR 1 Month Index + 4.500% 9.8269% 9/28/28 (b)(c)(d) | 10,402 | 10,386 | |
| Griffon Corp. Tranche B 1LN, term loan CME Term SOFR 1 Month Index + 2.750% 7.7911% 1/24/29 (b)(c)(d) | 15,242 | 15,169 | |
| TNT Crane & Rigging LLC 2LN, term loan 3 month U.S. LIBOR + 8.750% 14.4064% 4/16/25 (b)(c)(d)(e) | 4,773 | 4,469 | |
| Vertical U.S. Newco, Inc. Tranche B 1LN, term loan CME TERM SOFR 6 MONTH INDEX + 3.500% 9.3811% 7/31/27 (b)(c)(d) | 9,376 | 9,304 | |
TOTAL CAPITAL GOODS | 72,044 | ||
| Chemicals - 3.7% | |||
| ARC Falcon I, Inc.: | |||
| Tranche B 1LN, term loan CME Term SOFR 1 Month Index + 3.750% 9.1741% 9/30/28 (b)(c)(d) | 28,981 | 27,851 | |
| Tranche B 2LN, term loan CME Term SOFR 1 Month Index + 7.000% 12.4241% 9/22/29 (b)(c)(d) | 3,385 | 3,038 | |
| Aruba Investment Holdings LLC: | |||
| 1LN, term loan CME Term SOFR 1 Month Index + 4.750% 10.0741% 11/24/27 (b)(c)(d) | 10,431 | 10,183 | |
| 2LN, term loan CME Term SOFR 1 Month Index + 7.750% 13.1741% 11/24/28 (b)(c)(d) | 12,310 | 11,381 | |
| Tranche B 1LN, term loan CME Term SOFR 1 Month Index + 4.000% 9.4241% 11/24/27 (b)(c)(d) | 19,029 | 18,696 | |
| Avient Corp. Tranche B7 1LN, term loan CME Term SOFR 1 Month Index + 2.500% 7.8718% 8/29/29 (b)(c)(d) | 5,918 | 5,927 | |
| Bakelite U.S. Holding Ltd. 1LN, term loan CME Term SOFR 3 Month Index + 4.000% 9.5401% 5/27/29 (b)(c)(d) | 15,306 | 14,809 | |
| Consolidated Energy Finance SA: | |||
| Tranche B 1LN, term loan CME Term SOFR 1 Month Index + 3.500% 8.9241% 5/7/25 (b)(c)(d)(e) | 11,515 | 11,170 | |
| Tranche B, term loan CME Term SOFR 1 Month Index + 2.500% 7.9241% 5/7/25 (b)(c)(d) | 4,063 | 3,986 | |
| Cyanco Intermediate 2 Corp. Tranche B 1LN, term loan CME Term SOFR 1 Month Index + 4.750% 10.0741% 7/7/28 (b)(c)(d) | 5,465 | 5,424 | |
| Derby Buyer LLC 1LN, term loan CME Term SOFR 1 Month Index + 4.250% 10/12/30 (c)(d)(g) | 17,680 | 17,592 | |
| Discovery Purchaser Corp. 1LN, term loan CME Term SOFR 3 Month Index + 4.370% 9.7651% 10/4/29 (b)(c)(d) | 35,692 | 33,085 | |
| Groupe Solmax, Inc. Tranche B 1LN, term loan CME Term SOFR 3 Month Index + 4.750% 10.3032% 5/27/28 (b)(c)(d) | 25,825 | 24,006 | |
| Herens U.S. Holdco Corp. Tranche B 1LN, term loan CME Term SOFR 3 Month Index + 3.920% 9.4151% 7/3/28 (b)(c)(d) | 13,415 | 11,274 | |
| Hexion Holdings Corp. 1LN, term loan CME Term SOFR 3 Month Index + 4.500% 10.0332% 3/15/29 (b)(c)(d) | 47,222 | 43,538 | |
| Hexion, Inc. 2LN, term loan CME Term SOFR 1 Month Index + 7.430% 12.8644% 3/15/30 (b)(c)(d) | 8,290 | 6,660 | |
| ICP Group Tranche B 1LN, term loan CME Term SOFR 1 Month Index + 3.750% 9.4017% 12/29/27 (b)(c)(d) | 7,689 | 6,012 | |
| INEOS U.S. Finance LLC Tranche B 1LN, term loan CME Term SOFR 1 Month Index + 3.500% 8.9241% 2/10/30 (b)(c)(d) | 7,571 | 7,393 | |
| INEOS U.S. Petrochem LLC: | |||
| 1LN, term loan CME Term SOFR 1 Month Index + 3.750% 9.1741% 3/1/30 (b)(c)(d) | 7,819 | 7,604 | |
| Tranche B 1LN, term loan CME Term SOFR 1 Month Index + 2.750% 8.1886% 1/20/26 (b)(c)(d) | 24,447 | 23,983 | |
| Manchester Acquisition Sub LLC Tranche B 1LN, term loan CME Term SOFR 3 Month Index + 5.750% 11.3096% 12/1/26 (b)(c)(d) | 14,046 | 12,536 | |
| Olympus Water U.S. Holding Corp. Tranche B 1LN, term loan: | |||
| CME Term SOFR 1 Month Index + 5.000% 10.3901% 11/9/28 (b)(c)(d) | 13,929 | 13,769 | |
| CME Term SOFR 3 Month Index + 3.750% 9.4017% 11/9/28 (b)(c)(d) | 24,047 | 23,416 | |
| CME Term SOFR 3 Month Index + 4.500% 9.9901% 11/9/28 (b)(c)(d) | 12,357 | 12,178 | |
| Starfruit U.S. Holdco LLC Tranche B 1LN, term loan: | |||
| CME Term SOFR 1 Month Index + 4.000% 9.419% 4/3/28 (b)(c)(d) | 9,915 | 9,670 | |
| CME Term SOFR 1 Month Index + 4.000% 9.4335% 4/3/28 (b)(c)(d) | 26,577 | 25,954 | |
| The Chemours Co. LLC Tranche B2 1LN, term loan CME Term SOFR 1 Month Index + 3.500% 8.8241% 8/18/28 (b)(c)(d) | 44,554 | 43,217 | |
| U.S. Coatings Acquisition, Inc. Tranche B5 1LN, term loan CME Term SOFR 1 Month Index + 2.500% 7.8901% 12/20/29 (b)(c)(d) | 6,336 | 6,338 | |
| W.R. Grace Holding LLC Tranche B 1LN, term loan 3 month U.S. LIBOR + 3.750% 9.4017% 9/22/28 (b)(c)(d) | 17,405 | 17,042 | |
TOTAL CHEMICALS | 457,732 | ||
| Consumer Products - 2.1% | |||
| 19Th Holdings Golf LLC Tranche B 1LN, term loan CME Term SOFR 1 Month Index + 3.250% 8.6775% 2/7/29 (b)(c)(d) | 22,893 | 21,634 | |
| Aip Rd Buyer Corp.: | |||
| 1LN, term loan CME Term SOFR 1 Month Index + 4.250% 9.5741% 12/22/28 (b)(c)(d) | 9,165 | 9,089 | |
| Tranche B 1LN, term loan CME Term SOFR 1 Month Index + 5.000% 10.3241% 12/23/28 (b)(c)(d) | 17,581 | 17,493 | |
| BCPE Empire Holdings, Inc. Tranche B 1LN, term loan CME Term SOFR 1 Month Index + 4.750% 10.0741% 12/10/28 (b)(c)(d) | 31,005 | 30,935 | |
| Bombardier Recreational Products, Inc.: | |||
| Tranche B 1LN, term loan CME Term SOFR 1 Month Index + 2.000% 7.4241% 5/23/27 (b)(c)(d) | 9,512 | 9,416 | |
| Tranche B3 1LN, term loan CME Term SOFR 1 Month Index + 2.750% 8.0741% 12/13/29 (b)(c)(d) | 11,452 | 11,417 | |
| CNT Holdings I Corp. Tranche B 1LN, term loan CME Term SOFR 1 Month Index + 3.500% 8.9258% 11/8/27 (b)(c)(d) | 19,956 | 19,840 | |
| Conair Holdings LLC Tranche B 1LN, term loan 3 month U.S. LIBOR + 3.750% 9.4017% 5/17/28 (b)(c)(d) | 11,424 | 10,561 | |
| Gloves Buyer, Inc. Tranche B 1LN, term loan CME Term SOFR 1 Month Index + 4.000% 9.4386% 1/6/28 (b)(c)(d) | 1,527 | 1,485 | |
| Kronos Acquisition Holdings, Inc. Tranche B 1LN, term loan CME Term SOFR 3 Month Index + 3.750% 9.4017% 12/22/26 (b)(c)(d) | 18,744 | 18,333 | |
| Mattress Firm, Inc. Tranche B 1LN, term loan 6 month U.S. LIBOR + 4.250% 9.95% 9/24/28 (b)(c)(d) | 29,334 | 28,925 | |
| Petco Health & Wellness Co., Inc. Tranche B 1LN, term loan CME Term SOFR 3 Month Index + 3.250% 8.9017% 3/4/28 (b)(c)(d) | 8,045 | 7,857 | |
| Runner Buyer, Inc. Tranche B 1LN, term loan CME Term SOFR 3 Month Index + 5.500% 11.0369% 10/21/28 (b)(c)(d) | 12,669 | 9,882 | |
| Sweetwater Borrower LLC Tranche B 1LN, term loan CME Term SOFR 1 Month Index + 4.250% 9.6886% 8/5/28 (b)(c)(d) | 26,514 | 25,454 | |
| Windsor Holdings III, LLC Tranche B 1LN, term loan CME Term SOFR 3 Month Index + 4.500% 9.8146% 8/1/30 (b)(c)(d) | 21,240 | 21,134 | |
| Woof Holdings LLC: | |||
| Tranche B 1LN, term loan CME Term SOFR 1 Month Index + 3.750% 9.3972% 12/21/27 (b)(c)(d) | 14,441 | 11,673 | |
| Tranche B 2LN, term loan CME Term SOFR 3 Month Index + 7.250% 12.7485% 12/21/28 (b)(c)(d) | 2,135 | 1,420 | |
TOTAL CONSUMER PRODUCTS | 256,548 | ||
| Containers - 1.5% | |||
| AOT Packaging Products AcquisitionCo LLC 1LN, term loan CME Term SOFR 1 Month Index + 3.250% 8.6886% 3/3/28 (b)(c)(d) | 27,749 | 26,848 | |
| Berlin Packaging, LLC Tranche B 1LN, term loan: | |||
| CME Term SOFR 3 Month Index + 3.250% 8.5816% 3/11/28 (b)(c)(d) | 20,963 | 20,281 | |
| CME Term SOFR 3 Month Index + 3.750% 9.1893% 3/11/28 (b)(c)(d) | 10,568 | 10,306 | |
| Berry Global, Inc. Tranche AA 1LN, term loan CME Term SOFR 1 Month Index + 1.750% 7.2005% 7/1/29 (b)(c)(d) | 24,548 | 24,305 | |
| Charter NEX U.S., Inc. 1LN, term loan CME Term SOFR 1 Month Index + 3.750% 9.1886% 12/1/27 (b)(c)(d) | 19,024 | 18,501 | |
| Graham Packaging Co., Inc. Tranche B 1LN, term loan CME Term SOFR 1 Month Index + 3.000% 8.4386% 8/4/27 (b)(c)(d) | 18,207 | 18,007 | |
| Kloeckner Pentaplast of America, Inc. Tranche B 1LN, term loan CME TERM SOFR 6 MONTH INDEX + 4.750% 10.476% 2/9/26 (b)(c)(d) | 11,680 | 10,994 | |
| Pregis TopCo Corp. 1LN, term loan: | |||
| CME Term SOFR 1 Month Index + 3.750% 9.1886% 8/1/26 (b)(c)(d) | 1,960 | 1,952 | |
| CME Term SOFR 1 Month Index + 4.000% 9.0741% 7/31/26 (b)(c)(d) | 9,625 | 9,490 | |
| Reynolds Consumer Products LLC Tranche B 1LN, term loan CME Term SOFR 1 Month Index + 1.750% 7.1741% 1/30/27 (b)(c)(d) | 17,500 | 17,448 | |
| Reynolds Group Holdings, Inc. Tranche B 1LN, term loan: | |||
| CME Term SOFR 1 Month Index + 3.250% 8.6886% 2/5/26 (b)(c)(d) | 10,232 | 10,205 | |
| CME Term SOFR 1 Month Index + 3.250% 8.6886% 9/24/28 (b)(c)(d) | 10,501 | 10,441 | |
| Ring Container Technologies Group LLC Tranche B 1LN, term loan CME Term SOFR 1 Month Index + 3.500% 8.9386% 8/12/28 (b)(c)(d) | 9,085 | 9,060 | |
TOTAL CONTAINERS | 187,838 | ||
| Diversified Financial Services - 3.3% | |||
| AlixPartners LLP Tranche B 1LN, term loan CME Term SOFR 1 Month Index + 2.750% 8.1886% 2/4/28 (b)(c)(d) | 14,518 | 14,497 | |
| AVSC Holding Corp.: | |||
| Tranche B 1LN, term loan CME Term SOFR 1 Month Index + 3.500% 8.9241% 3/1/25 (b)(c)(d) | 6,486 | 6,077 | |
| Tranche B2 1LN, term loan 3 month U.S. LIBOR + 5.500% 10.9241% 10/15/26 (b)(c)(d) | 6,161 | 5,821 | |
| BCP Renaissance Parent LLC Tranche B 1LN, term loan CME Term SOFR 1 Month Index + 3.500% 8.8998% 10/31/28 (b)(c)(d) | 4,078 | 4,053 | |
| Broadstreet Partners, Inc.: | |||
| Tranche B 1LN, term loan CME Term SOFR 1 Month Index + 3.250% 8.6886% 1/27/27 (b)(c)(d) | 6,512 | 6,442 | |
| Tranche B3 1LN, term loan CME Term SOFR 1 Month Index + 4.000% 9.3241% 1/26/29 (b)(c)(d) | 12,105 | 12,062 | |
| Clue Opco LLC Tranche B 1LN, term loan CME Term SOFR 1 Month Index + 4.500% 9/22/30 (c)(d)(g) | 28,160 | 26,787 | |
| DXP Enterprises, Inc. Tranche B 1LN, term loan CME Term SOFR 1 Month Index + 4.750% 10.2906% 10/6/30 (b)(c)(d) | 8,140 | 8,048 | |
| Eagle 4 Ltd. Tranche B 1LN, term loan CME Term SOFR 3 Month Index + 3.750% 9.4017% 7/12/28 (b)(c)(d) | 5,750 | 5,735 | |
| FinCo I LLC Tranche B 1LN, term loan CME Term SOFR 1 Month Index + 3.000% 8.3832% 6/27/29 (b)(c)(d) | 4,706 | 4,703 | |
| Focus Financial Partners LLC: | |||
| Tranche B 1LN, term loan CME Term SOFR 1 Month Index + 2.500% 7.8241% 6/24/28 (b)(c)(d) | 13,911 | 13,767 | |
| Tranche B5 1LN, term loan CME Term SOFR 1 Month Index + 3.250% 8.5741% 6/30/28 (b)(c)(d) | 17,247 | 17,159 | |
| GT Polaris, Inc. Tranche B 1LN, term loan 1 month U.S. LIBOR + 3.750% 9.3948% 9/24/27 (b)(c)(d) | 7,064 | 6,664 | |
| GTCR W-2 Merger Sub LLC Tranche B 1LN, term loan CME Term SOFR 1 Month Index + 3.000% 9/21/30 (c)(d)(g) | 84,290 | 83,622 | |
| HarbourVest Partners LLC Tranche B 1LN, term loan CME Term SOFR 1 Month Index + 2.750% 8.3901% 4/20/30 (b)(c)(d) | 19,509 | 19,460 | |
| Hightower Holding LLC Tranche B 1LN, term loan CME Term SOFR 3 Month Index + 4.000% 9.3796% 4/21/28 (b)(c)(d) | 13,248 | 12,944 | |
| LSF11 Trinity Bidco, Inc. Tranche B 1LN, term loan CME Term SOFR 1 Month Index + 4.500% 9.8345% 6/15/30 (b)(c)(d) | 4,349 | 4,333 | |
| Nexus Buyer LLC: | |||
| 2LN, term loan CME Term SOFR 1 Month Index + 6.250% 11.6741% 11/1/29 (b)(c)(d) | 14,420 | 13,699 | |
| Tranche B 1LN, term loan CME Term SOFR 1 Month Index + 3.750% 9.1741% 11/8/26 (b)(c)(d) | 17,061 | 16,680 | |
| RCS Capital Corp. 1LN, term loan CME Term SOFR 1 Month Index + 4.500% 9.9241% 8/9/30 (b)(c)(d) | 34,766 | 33,716 | |
| Recess Holdings, Inc. 1LN, term loan CME Term SOFR 1 Month Index + 4.000% 9.3831% 3/24/27 (b)(c)(d) | 7,000 | 6,956 | |
| TransUnion LLC: | |||
| Tranche B5 1LN, term loan CME Term SOFR 1 Month Index + 1.750% 7.1741% 11/16/26 (b)(c)(d) | 21,977 | 21,922 | |
| Tranche B6 1LN, term loan CME Term SOFR 1 Month Index + 2.250% 7.6886% 12/1/28 (b)(c)(d) | 12,392 | 12,362 | |
| UFC Holdings LLC Tranche B 1LN, term loan CME Term SOFR 1 Month Index + 2.750% 8.3991% 4/29/26 (b)(c)(d) | 9,722 | 9,707 | |
| WH Borrower LLC Tranche B 1LN, term loan: | |||
| CME Term SOFR 1 Month Index + 5.500% 10.9028% 2/9/27 (b)(c)(d) | 22,826 | 22,612 | |
| CME Term SOFR 1 Month Index + 5.500% 10.9028% 2/15/27 (b)(c)(d) | 13,253 | 13,121 | |
TOTAL DIVERSIFIED FINANCIAL SERVICES | 402,949 | ||
| Diversified Media - 0.7% | |||
| Advantage Sales & Marketing, Inc. Tranche B 1LN, term loan CME Term SOFR 1 Month Index + 4.500% 10.1759% 10/28/27 (b)(c)(d) | 11,873 | 11,207 | |
| Allen Media LLC Tranche B 1LN, term loan CME Term SOFR 3 Month Index + 5.500% 11.0401% 2/10/27 (b)(c)(d) | 39,693 | 34,979 | |
| Cmg Media Corp. Tranche B 1LN, term loan CME Term SOFR 3 Month Index + 3.500% 8.9901% 12/17/26 (b)(c)(d) | 49,955 | 44,835 | |
TOTAL DIVERSIFIED MEDIA | 91,021 | ||
| Energy - 2.9% | |||
| Apro LLC Tranche B 1LN, term loan 3 month U.S. LIBOR + 3.750% 9.192% 11/14/26 (b)(c)(d) | 17,620 | 17,594 | |
| Array Technologies, Inc. Tranche B 1LN, term loan CME Term SOFR 3 Month Index + 3.250% 8.9274% 10/14/27 (b)(c)(d) | 19,802 | 19,517 | |
| BW Gas & Convenience Holdings LLC Tranche B 1LN, term loan CME Term SOFR 3 Month Index + 3.500% 8.9386% 3/17/28 (b)(c)(d) | 9,002 | 8,867 | |
| Calpine Construction Finance Co. LP Tranche B 1LN, term loan CME Term SOFR 1 Month Index + 2.250% 7.5741% 7/20/30 (b)(c)(d) | 7,175 | 7,110 | |
| CQP Holdco LP / BIP-V Chinook Holdco LLC Tranche B 1LN, term loan CME Term SOFR 1 Month Index + 3.500% 8.9901% 6/4/28 (b)(c)(d) | 65,760 | 65,664 | |
| Delek U.S. Holdings, Inc. Tranche B 1LN, term loan CME Term SOFR 1 Month Index + 3.500% 8.9241% 11/19/29 (b)(c)(d) | 29,098 | 28,827 | |
| EG America LLC: | |||
| 1LN, term loan CME Term SOFR 1 Month Index + 5.500% 9.4763% 2/7/28 (b)(c)(d) | 14,403 | 13,701 | |
| Tranche B 1LN, term loan CME Term SOFR 1 Month Index + 5.500% 9.6645% 2/7/28 (b)(c)(d)(e) | 15,725 | 15,096 | |
| Tranche BB 1LN, term loan: | |||
CME Term SOFR 1 Month Index + 4.000% 9.4145% 2/5/25 (b)(c)(d) | 6,808 | 6,791 | |
CME Term SOFR 1 Month Index + 4.250% 9.6645% 3/12/26 (b)(c)(d) | 3,123 | 3,111 | |
CME Term SOFR 3 Month Index + 4.000% 9.4145% 2/5/25 (b)(c)(d) | 1,218 | 1,213 | |
| Tranche BC 1LN, term loan: | |||
CME Term SOFR 1 Month Index + 4.250% 9.6645% 2/7/28 (b)(c)(d) | 6,138 | 5,831 | |
CME Term SOFR 1 Month Index + 5.500% 9.4145% 2/7/28 (b)(c)(d)(e) | 2,835 | 2,707 | |
| Esdec Solar Group BV Tranche B 1LN, term loan 6 month U.S. LIBOR + 4.750% 10.4017% 8/27/28 (b)(c)(d) | 15,149 | 14,619 | |
| GIP II Blue Holding LP Tranche B 1LN, term loan CME Term SOFR 1 Month Index + 4.500% 9.9386% 9/29/28 (b)(c)(d) | 44,503 | 44,495 | |
| GIP III Stetson I LP: | |||
| Tranche B 1LN, term loan CME Term SOFR 1 Month Index + 4.250% 10/5/28 (c)(d)(g) | 4,485 | 4,453 | |
| Tranche B, term loan CME Term SOFR 1 Month Index + 4.250% 9.6661% 7/18/25 (b)(c)(d) | 16,893 | 16,877 | |
| Natgasoline LLC Tranche B, term loan CME Term SOFR 1 Month Index + 3.500% 8.9386% 11/14/25 (b)(c)(d) | 11,220 | 11,136 | |
| New Fortress Energy, Inc. Tranche B 1LN, term loan CME Term SOFR 1 Month Index + 5.000% 10/30/28 (c)(d)(g) | 50,940 | 46,865 | |
| Par Petroleum LLC Tranche B 1LN, term loan CME Term SOFR 1 Month Index + 4.250% 9.7725% 2/14/30 (b)(c)(d) | 11,494 | 11,433 | |
| Rockwood Service Corp. Tranche B 1LN, term loan CME Term SOFR 1 Month Index + 4.000% 9.4386% 1/23/27 (b)(c)(d) | 8,212 | 8,207 | |
| Win Waste Innovations Holdings Tranche B 1LN, term loan CME Term SOFR 1 Month Index + 2.750% 8.1886% 3/25/28 (b)(c)(d) | 9,670 | 8,583 | |
TOTAL ENERGY | 362,697 | ||
| Entertainment/Film - 0.1% | |||
| AP Core Holdings II LLC: | |||
| Tranche B1 1LN, term loan CME Term SOFR 1 Month Index + 5.500% 10.9386% 9/1/27 (b)(c)(d) | 10,514 | 10,186 | |
| Tranche B2 1LN, term loan CME Term SOFR 1 Month Index + 5.500% 10.9386% 9/1/27 (b)(c)(d) | 7,520 | 7,287 | |
TOTAL ENTERTAINMENT/FILM | 17,473 | ||
| Environmental - 0.4% | |||
| Covanta Holding Corp.: | |||
| Tranche B 1LN, term loan: | |||
CME Term SOFR 1 Month Index + 2.500% 7.8241% 11/30/28 (b)(c)(d) | 10,336 | 10,176 | |
CME Term SOFR 1 Month Index + 3.000% 8.3324% 11/30/28 (b)(c)(d) | 4,902 | 4,853 | |
| Tranche C 1LN, term loan: | |||
CME Term SOFR 1 Month Index + 2.500% 7.8241% 11/30/28 (b)(c)(d) | 786 | 774 | |
CME Term SOFR 1 Month Index + 3.000% 8.3324% 11/30/28 (b)(c)(d) | 368 | 364 | |
| Madison IAQ LLC Tranche B 1LN, term loan CME Term SOFR 1 Month Index + 3.250% 8.7031% 6/21/28 (b)(c)(d) | 32,178 | 30,989 | |
TOTAL ENVIRONMENTAL | 47,156 | ||
| Food & Drug Retail - 0.6% | |||
| 8th Avenue Food & Provisions, Inc. Tranche B 1LN, term loan CME Term SOFR 1 Month Index + 4.750% 10.1886% 10/1/25 (b)(c)(d) | 3,295 | 3,105 | |
| Cardenas Merger Sub, LLC 1LN, term loan CME TERM SOFR 6 MONTH INDEX + 6.750% 12.2401% 8/1/29 (b)(c)(d) | 25,187 | 25,155 | |
| Froneri U.S., Inc. Tranche B 1LN, term loan CME Term SOFR 1 Month Index + 2.250% 7.6741% 1/29/27 (b)(c)(d) | 12,783 | 12,706 | |
| JP Intermediate B LLC term loan CME Term SOFR 1 Month Index + 5.500% 11.1448% 11/20/27 (b)(c)(d) | 18,384 | 6,159 | |
| Primary Products Finance LLC 1LN, term loan CME Term SOFR 3 Month Index + 4.000% 9.5455% 4/1/29 (b)(c)(d) | 6,209 | 6,180 | |
| Upfield U.S.A. Corp. Tranche B 1LN, term loan CME Term SOFR 1 Month Index + 4.750% 10.1976% 1/31/28 (b)(c)(d) | 18,705 | 18,107 | |
TOTAL FOOD & DRUG RETAIL | 71,412 | ||
| Food/Beverage/Tobacco - 1.3% | |||
| 8th Avenue Food & Provisions, Inc.: | |||
| 2LN, term loan CME Term SOFR 1 Month Index + 7.750% 13.1886% 10/1/26 (b)(c)(d) | 2,240 | 1,684 | |
| Tranche B 1LN, term loan CME Term SOFR 1 Month Index + 3.750% 9.1886% 10/1/25 (b)(c)(d) | 4,365 | 4,112 | |
| Bengal Debt Merger Sub LLC: | |||
| 1LN, term loan CME Term SOFR 3 Month Index + 3.250% 8.7401% 1/24/29 (b)(c)(d) | 33,301 | 30,543 | |
| 2LN, term loan CME Term SOFR 3 Month Index + 6.000% 11.4901% 1/24/30 (b)(c)(d) | 8,175 | 6,532 | |
| Chobani LLC Tranche B 1LN, term loan CME Term SOFR 1 Month Index + 3.500% 8.9386% 10/23/27 (b)(c)(d) | 20,320 | 20,263 | |
| Del Monte Foods, Inc. Tranche B 1LN, term loan CME Term SOFR 1 Month Index + 4.250% 9.6769% 5/16/29 (b)(c)(d) | 41,238 | 39,794 | |
| Shearer's Foods, Inc. Tranche B 1LN, term loan CME Term SOFR 1 Month Index + 3.500% 8.9386% 9/23/27 (b)(c)(d) | 9,182 | 9,148 | |
| Triton Water Holdings, Inc. Tranche B 1LN, term loan CME Term SOFR 1 Month Index + 3.250% 8.9017% 3/31/28 (b)(c)(d) | 54,620 | 51,666 | |
TOTAL FOOD/BEVERAGE/TOBACCO | 163,742 | ||
| Gaming - 3.9% | |||
| Caesars Entertainment, Inc. Tranche B 1LN, term loan CME Term SOFR 1 Month Index + 3.250% 8.6741% 1/26/30 (b)(c)(d) | 103,400 | 102,898 | |
| Fertitta Entertainment LLC NV Tranche B 1LN, term loan CME Term SOFR 1 Month Index + 4.000% 9.3241% 1/27/29 (b)(c)(d) | 133,114 | 130,003 | |
| Flutter Financing B.V. Tranche B 1LN, term loan CME Term SOFR 1 Month Index + 3.250% 8.9017% 7/4/28 (b)(c)(d) | 12,867 | 12,867 | |
| Golden Entertainment, Inc. Tranche B 1LN, term loan CME Term SOFR 1 Month Index + 2.750% 8.1761% 5/26/30 (b)(c)(d) | 24,608 | 24,536 | |
| GVC Holdings Gibraltar Ltd.: | |||
| Tranche B2 1LN, term loan CME TERM SOFR 6 MONTH INDEX + 3.500% 8.9901% 10/31/29 (b)(c)(d) | 13,847 | 13,847 | |
| Tranche B4 1LN, term loan CME TERM SOFR 6 MONTH INDEX + 2.250% 7.9901% 3/16/27 (b)(c)(d) | 12,854 | 12,854 | |
| J&J Ventures Gaming LLC: | |||
| 1LN, term loan 3 month U.S. LIBOR + 4.000% 9.6517% 4/26/28 (b)(c)(d) | 12,191 | 11,545 | |
| Tranche B 1LN, term loan CME Term SOFR 1 Month Index + 3.000% 9.6886% 4/26/28 (b)(c)(d) | 5,070 | 4,772 | |
| Tranche DD2 1LN, term loan CME Term SOFR 1 Month Index + 4.250% 4/26/28 (c)(d)(g) | 9,127 | 8,590 | |
| Ontario Gaming GTA LP Tranche B 1LN, term loan CME Term SOFR 1 Month Index + 4.250% 9.6401% 8/1/30 (b)(c)(d) | 9,430 | 9,416 | |
| PCI Gaming Authority 1LN, term loan CME Term SOFR 1 Month Index + 2.500% 7.9386% 5/29/26 (b)(c)(d) | 3,424 | 3,419 | |
| Penn Entertainment, Inc. Tranche B 1LN, term loan CME Term SOFR 1 Month Index + 2.750% 8.1741% 5/3/29 (b)(c)(d) | 10,191 | 10,171 | |
| Scientific Games Corp. 1LN, term loan CME Term SOFR 1 Month Index + 3.000% 8.5345% 4/14/29 (b)(c)(d) | 25,117 | 25,035 | |
| Scientific Games Holdings LP term loan CME Term SOFR 3 Month Index + 3.500% 8.9143% 4/4/29 (b)(c)(d) | 38,163 | 37,481 | |
| Stars Group Holdings BV Tranche B 1LN, term loan CME Term SOFR 3 Month Index + 2.250% 7.9017% 7/21/26 (b)(c)(d) | 33,562 | 33,527 | |
| Station Casinos LLC Tranche B 1LN, term loan CME Term SOFR 1 Month Index + 2.250% 7.6741% 2/7/27 (b)(c)(d) | 35,922 | 35,648 | |
TOTAL GAMING | 476,609 | ||
| Healthcare - 5.1% | |||
| Accelerated Health Systems LLC Tranche B1 LN, term loan CME Term SOFR 3 Month Index + 4.250% 9.7901% 2/15/29 (b)(c)(d) | 13,605 | 11,468 | |
| AHP Health Partners, Inc. Tranche B 1LN, term loan CME Term SOFR 1 Month Index + 3.500% 8.9386% 8/24/28 (b)(c)(d) | 14,493 | 14,475 | |
| Avantor Funding, Inc. Tranche B5 1LN, term loan CME Term SOFR 1 Month Index + 2.250% 7.6741% 11/6/27 (b)(c)(d) | 10,098 | 10,087 | |
| Charlotte Buyer, Inc. Tranche B 1LN, term loan CME Term SOFR 3 Month Index + 5.250% 10.5911% 2/12/28 (b)(c)(d) | 21,153 | 20,900 | |
| Da Vinci Purchaser Corp. Tranche B 1LN, term loan CME Term SOFR 1 Month Index + 4.000% 9.4386% 1/8/27 (b)(c)(d) | 18,107 | 17,843 | |
| Elanco Animal Health, Inc. Tranche B 1LN, term loan CME Term SOFR 1 Month Index + 1.750% 7.1646% 8/1/27 (b)(c)(d) | 15,842 | 15,460 | |
| Electron BidCo, Inc. Tranche B 1LN, term loan CME Term SOFR 1 Month Index + 3.000% 8.4386% 11/1/28 (b)(c)(d) | 12,007 | 11,874 | |
| Embecta Corp. Tranche B 1LN, term loan CME Term SOFR 1 Month Index + 3.000% 8.3367% 3/31/29 (b)(c)(d) | 18,296 | 17,687 | |
| Gainwell Acquisition Corp. Tranche B 1LN, term loan CME Term SOFR 3 Month Index + 4.000% 9.4901% 10/1/27 (b)(c)(d) | 83,352 | 79,532 | |
| HAH Group Holding Co. LLC: | |||
| 1LN, term loan: | |||
CME Term SOFR 1 Month Index + 5.000% 10.43% 10/29/27 (b)(c)(d) | 2,954 | 2,909 | |
CME Term SOFR 3 Month Index + 5.000% 10.43% 10/29/27 (b)(c)(d) | 5,991 | 5,916 | |
| Tranche DD 1LN, term loan CME Term SOFR 3 Month Index + 5.000% 10.43% 10/29/27 (b)(c)(d) | 374 | 368 | |
| ICU Medical, Inc. Tranche B 1LN, term loan CME Term SOFR 1 Month Index + 2.500% 8.0401% 1/6/29 (b)(c)(d) | 13,258 | 13,185 | |
| Insulet Corp. Tranche B 1LN, term loan CME Term SOFR 1 Month Index + 3.250% 8.6886% 5/4/28 (b)(c)(d) | 69,413 | 69,095 | |
| Jazz Financing Lux SARL Tranche B 1LN, term loan CME Term SOFR 1 Month Index + 3.500% 8.9386% 5/5/28 (b)(c)(d) | 34,075 | 34,056 | |
| Maravai Intermediate Holdings LLC Tranche B 1LN, term loan CME Term SOFR 3 Month Index + 3.000% 8.3968% 10/19/27 (b)(c)(d) | 11,378 | 11,036 | |
| MED ParentCo LP: | |||
| 1LN, term loan CME Term SOFR 1 Month Index + 4.250% 9.6886% 8/31/26 (b)(c)(d) | 12,111 | 11,410 | |
| 2LN, term loan CME Term SOFR 1 Month Index + 8.250% 13.6886% 8/30/27 (b)(c)(d) | 2,851 | 2,460 | |
| Mozart Borrower LP Tranche B 1LN, term loan CME Term SOFR 1 Month Index + 3.250% 8.6886% 10/23/28 (b)(c)(d) | 82,746 | 82,177 | |
| National Mentor Holdings, Inc.: | |||
| Tranche B 1LN, term loan CME Term SOFR 1 Month Index + 3.750% 9.1873% 3/2/28 (b)(c)(d) | 13,364 | 11,623 | |
| Tranche C 1LN, term loan CME Term SOFR 1 Month Index + 3.750% 9.2401% 3/2/28 (b)(c)(d) | 225 | 195 | |
| Organon & Co. Tranche B 1LN, term loan CME Term SOFR 3 Month Index + 3.000% 8.4505% 6/2/28 (b)(c)(d) | 37,823 | 37,700 | |
| Packaging Coordinators Midco, Inc. Tranche B 1LN, term loan CME Term SOFR 3 Month Index + 3.500% 9.1517% 11/30/27 (b)(c)(d) | 19,786 | 19,513 | |
| Pathway Vet Alliance LLC Tranche B 1LN, term loan CME Term SOFR 1 Month Index + 3.750% 9.1886% 3/31/27 (b)(c)(d) | 15,676 | 14,230 | |
| Perrigo Investments LLC Tranche B 1LN, term loan CME Term SOFR 1 Month Index + 2.500% 7.6741% 4/20/29 (b)(c)(d) | 16,659 | 16,555 | |
| Phoenix Newco, Inc. Tranche B 1LN, term loan CME Term SOFR 1 Month Index + 3.250% 8.6886% 11/15/28 (b)(c)(d) | 45,047 | 44,473 | |
| PRA Health Sciences, Inc. Tranche B 1LN, term loan CME Term SOFR 3 Month Index + 2.250% 7.9017% 7/3/28 (b)(c)(d) | 13,109 | 13,112 | |
| Surgery Center Holdings, Inc. 1LN, term loan CME Term SOFR 1 Month Index + 3.750% 9.2031% 8/31/26 (b)(c)(d) | 17,450 | 17,424 | |
| U.S. Anesthesia Partners, Inc.: | |||
| 2LN, term loan CME Term SOFR 1 Month Index + 7.500% 12.9291% 10/1/29 (b)(c)(d)(e) | 2,820 | 2,468 | |
| Tranche B 1LN, term loan CME Term SOFR 1 Month Index + 4.250% 9.6791% 10/1/28 (b)(c)(d) | 4,997 | 4,328 | |
| U.S. Radiology Specialists, Inc. Tranche B 1LN, term loan 3 month U.S. LIBOR + 5.250% 10.7401% 12/15/27 (b)(c)(d) | 14,769 | 13,932 | |
| Upstream Newco, Inc. 1LN, term loan 1 month U.S. LIBOR + 4.250% 9.6886% 11/20/26 (b)(c)(d) | 4,438 | 4,183 | |
TOTAL HEALTHCARE | 631,674 | ||
| Homebuilders/Real Estate - 0.8% | |||
| Breakwater Energy Partners LLC Tranche B 1LN, term loan 11.25% 9/1/26 (b)(c)(d)(e) | 23,887 | 23,082 | |
| DTZ U.S. Borrower LLC Tranche B 1LN, term loan: | |||
| CME Term SOFR 1 Month Index + 2.750% 8.1886% 8/21/25 (b)(c)(d) | 1,742 | 1,736 | |
| CME Term SOFR 1 Month Index + 3.250% 8.6741% 1/31/30 (b)(c)(d) | 19,348 | 18,429 | |
| CME Term SOFR 1 Month Index + 4.000% 9.3241% 1/31/30 (b)(c)(d) | 7,360 | 7,047 | |
| Fluidra Finco SL Tranche B 1LN, term loan CME Term SOFR 1 Month Index + 2.000% 7.3491% 1/27/29 (b)(c)(d) | 11,270 | 11,189 | |
| Greystar Real Estate Partners 1LN, term loan CME Term SOFR 1 Month Index + 3.750% 9.147% 8/21/30 (b)(c)(d) | 9,415 | 9,391 | |
| Jones DesLauriers Insurance Management, Inc. Tranche B 1LN, term loan CME Term SOFR 1 Month Index + 4.250% 9.6153% 3/16/30 (b)(c)(d) | 10,395 | 10,369 | |
| Ryan Specialty Group LLC Tranche B 1LN, term loan CME Term SOFR 1 Month Index + 3.000% 8.4241% 9/1/27 (b)(c)(d) | 18,761 | 18,714 | |
TOTAL HOMEBUILDERS/REAL ESTATE | 99,957 | ||
| Hotels - 2.1% | |||
| ASP LS Acquisition Corp. Tranche B 1LN, term loan CME Term SOFR 3 Month Index + 4.500% 10.3958% 5/7/28 (b)(c)(d) | 11,537 | 10,300 | |
| BRE/Everbright M6 Borrower LLC Tranche B 1LN, term loan CME Term SOFR 1 Month Index + 5.000% 10.4335% 9/9/26 (b)(c)(d) | 8,616 | 8,546 | |
| Carnival Finance LLC Tranche B 1LN, term loan CME Term SOFR 1 Month Index + 3.250% 8.6886% 10/18/28 (b)(c)(d) | 21,539 | 21,118 | |
| Four Seasons Hotels Ltd. Tranche B 1LN, term loan CME Term SOFR 1 Month Index + 2.500% 7.9241% 11/30/29 (b)(c)(d) | 31,860 | 31,843 | |
| Hilton Grand Vacations Borrower LLC Tranche B 1LN, term loan CME Term SOFR 1 Month Index + 3.000% 8.1886% 8/2/28 (b)(c)(d) | 73,289 | 73,210 | |
| Hilton Worldwide Finance LLC Tranche B 1LN, term loan CME Term SOFR 3 Month Index + 1.750% 7.1744% 6/21/26 (b)(c)(d) | 21,135 | 21,108 | |
| Marriott Ownership Resorts, Inc. Tranche B 1LN, term loan CME Term SOFR 1 Month Index + 1.750% 7.1741% 8/31/25 (b)(c)(d) | 27,581 | 27,478 | |
| Oravel Stays Singapore Pte Ltd. Tranche B 1LN, term loan 3 month U.S. LIBOR + 8.250% 13.9077% 6/23/26 (b)(c)(d) | 7,776 | 6,765 | |
| Playa Resorts Holding BV Tranche B 1LN, term loan CME Term SOFR 1 Month Index + 4.250% 9.5845% 1/5/29 (b)(c)(d) | 13,384 | 13,325 | |
| Travelport Finance Luxembourg SARL 1LN, term loan: | |||
| CME Term SOFR 3 Month Index + 8.750% 12.6517% 2/28/25 (b)(c)(d) | 20,080 | 19,227 | |
| U.S. Secured Overnight Fin. Rate (SOFR) Index + 6.750% 13.8901% 5/29/26 (b)(c)(d) | 21,007 | 10,713 | |
| Wyndham Hotels & Resorts, Inc. Tranche B 1LN, term loan CME Term SOFR 1 Month Index + 2.250% 7.6741% 5/25/30 (b)(c)(d) | 9,500 | 9,506 | |
TOTAL HOTELS | 253,139 | ||
| Insurance - 5.5% | |||
| Acrisure LLC: | |||
| Tranche B 1LN, term loan: | |||
CME Term SOFR 1 Month Index + 3.500% 8.9386% 2/15/27 (b)(c)(d) | 62,455 | 60,727 | |
CME Term SOFR 1 Month Index + 4.250% 9.6886% 2/15/27 (b)(c)(d) | 13,963 | 13,852 | |
CME Term SOFR 1 Month Index + 5.750% 11.1206% 2/15/27 (b)(c)(d) | 55,271 | 55,271 | |
| Tranche B-2 1LN, term loan CME Term SOFR 1 Month Index + 3.750% 9.1886% 2/15/27 (b)(c)(d) | 11,760 | 11,525 | |
| Tranche B5 1LN, term loan CME Term SOFR 1 Month Index + 4.500% 10/19/30 (c)(d)(g) | 9,550 | 9,439 | |
| Alliant Holdings Intermediate LLC: | |||
| Tranche B3 1LN, term loan 1 month U.S. LIBOR + 3.500% 8.9386% 11/5/27 (b)(c)(d) | 33,400 | 33,268 | |
| Tranche B5 1LN, term loan CME Term SOFR 1 Month Index + 3.500% 8.8347% 11/6/27 (b)(c)(d) | 25,123 | 25,026 | |
| AmWINS Group, Inc. Tranche B 1LN, term loan: | |||
| CME Term SOFR 1 Month Index + 2.250% 7.6886% 2/19/28 (b)(c)(d) | 22,512 | 22,300 | |
| CME Term SOFR 1 Month Index + 2.750% 8.1886% 2/19/28 (b)(c)(d) | 6,010 | 5,990 | |
| Amynta Agency Borrower, Inc. Tranche B 1LN, term loan CME Term SOFR 1 Month Index + 5.000% 10.4241% 2/28/28 (b)(c)(d) | 15,506 | 15,472 | |
| AssuredPartners, Inc.: | |||
| 1 LN, term loan CME Term SOFR 1 Month Index + 3.500% 8.8241% 2/13/27 (b)(c)(d) | 12,155 | 12,042 | |
| Tranche B 1LN, term loan: | |||
CME Term SOFR 1 Month Index + 3.500% 8.9386% 2/13/27 (b)(c)(d) | 738 | 731 | |
CME Term SOFR 1 Month Index + 3.500% 8.9386% 2/13/27 (b)(c)(d) | 17,929 | 17,759 | |
| Tranche B4 1LN, term loan CME Term SOFR 1 Month Index + 3.750% 9.0741% 2/13/27 (b)(c)(d) | 6,725 | 6,689 | |
| Asurion LLC: | |||
| 1LN, term loan CME Term SOFR 3 Month Index + 4.000% 9.4241% 8/19/28 (b)(c)(d) | 33,645 | 32,052 | |
| Tranche B11 1LN, term loan CME Term SOFR 1 Month Index + 4.250% 9.6741% 8/19/28 (b)(c)(d) | 47,146 | 44,951 | |
| Tranche B3 2LN, term loan CME Term SOFR 1 Month Index + 5.250% 10.6886% 1/31/28 (b)(c)(d) | 63,518 | 55,011 | |
| Tranche B4 2LN, term loan CME Term SOFR 1 Month Index + 5.250% 10.6886% 1/20/29 (b)(c)(d) | 66,726 | 56,813 | |
| Tranche B8 1LN, term loan CME Term SOFR 1 Month Index + 3.250% 8.6886% 12/23/26 (b)(c)(d) | 31,906 | 30,789 | |
| Tranche B9 1LN, term loan CME Term SOFR 1 Month Index + 3.250% 8.6886% 7/31/27 (b)(c)(d) | 32,704 | 31,219 | |
| HUB International Ltd. Tranche B 1LN, term loan: | |||
| CME Term SOFR 1 Month Index + 4.250% 9.6619% 7/1/30 (b)(c)(d) | 74,454 | 74,401 | |
| CME Term SOFR 3 Month Index + 4.000% 9.3653% 11/10/29 (b)(c)(d) | 9,682 | 9,664 | |
| USI, Inc.: | |||
| 1LN, term loan CME Term SOFR 1 Month Index + 3.750% 9.1401% 11/22/29 (b)(c)(d) | 43,783 | 43,628 | |
| Tranche B 1LN, term loan: | |||
CME Term SOFR 1 Month Index + 3.250% 9/14/30 (c)(d)(g) | 3,855 | 3,831 | |
CME Term SOFR 1 Month Index + 3.250% 8.6401% 9/29/30 (b)(c)(d) | 6,040 | 6,015 | |
TOTAL INSURANCE | 678,465 | ||
| Leisure - 2.4% | |||
| Alterra Mountain Co. Tranche B 1LN, term loan: | |||
| CME Term SOFR 1 Month Index + 3.500% 8.9386% 8/17/28 (b)(c)(d) | 18,183 | 18,160 | |
| CME Term SOFR 1 Month Index + 3.750% 9.1741% 5/31/30 (b)(c)(d) | 1,347 | 1,346 | |
| Arcis Golf LLC: | |||
| Tranche B 1LN, term loan CME Term SOFR 1 Month Index + 4.250% 9.6913% 11/24/28 (b)(c)(d) | 10,456 | 10,438 | |
| Tranche DD 1LN, term loan CME Term SOFR 1 Month Index + 4.250% 9.6806% 11/24/28 (b)(c)(d) | 787 | 786 | |
| Carnival Finance LLC Tranche B 1LN, term loan CME Term SOFR 1 Month Index + 3.000% 8.336% 8/8/27 (b)(c)(d) | 20,020 | 19,644 | |
| City Football Group Ltd. Tranche B 1LN, term loan CME Term SOFR 1 Month Index + 3.000% 8.4531% 7/21/28 (b)(c)(d) | 44,653 | 44,165 | |
| ClubCorp Holdings, Inc. Tranche B 1LN, term loan 3 month U.S. LIBOR + 2.750% 8.1806% 9/18/24 (b)(c)(d) | 9,733 | 9,422 | |
| Crown Finance U.S., Inc. 1LN, term loan CME Term SOFR 1 Month Index + 8.500% 14.3811% 7/31/28 (b)(c)(d) | 11,494 | 11,709 | |
| Delta 2 SARL Tranche B 1LN, term loan CME Term SOFR 1 Month Index + 3.000% 7.5741% 1/15/30 (b)(c)(d) | 36,555 | 36,521 | |
| Equinox Holdings, Inc.: | |||
| Tranche 2LN, term loan 3 month U.S. LIBOR + 7.000% 12.731% 9/8/24 (b)(c)(d) | 7,325 | 6,600 | |
| Tranche B-1, term loan 3 month U.S. LIBOR + 3.000% 8.731% 3/8/24 (b)(c)(d) | 28,917 | 27,820 | |
| Herschend Entertainment Co. LLC Tranche B 1LN, term loan CME Term SOFR 1 Month Index + 3.750% 9.1886% 8/27/28 (b)(c)(d) | 6,571 | 6,557 | |
| Lids Holdings, Inc. 1LN, term loan CME Term SOFR 3 Month Index + 5.500% 11.0601% 12/14/26 (b)(c)(d)(e) | 21,539 | 20,732 | |
| SeaWorld Parks & Entertainment, Inc. Tranche B 1LN, term loan CME Term SOFR 1 Month Index + 3.000% 8.4386% 8/25/28 (b)(c)(d) | 18,000 | 17,948 | |
| Topgolf Callaway Brands Corp. Tranche B 1LN, term loan CME Term SOFR 1 Month Index + 3.500% 8.9241% 3/9/30 (b)(c)(d) | 30,835 | 30,662 | |
| United PF Holdings LLC: | |||
| 1LN, term loan CME Term SOFR 1 Month Index + 4.000% 9.6448% 12/30/26 (b)(c)(d) | 34,540 | 29,733 | |
| 2LN, term loan 3 month U.S. LIBOR + 8.500% 14.1448% 12/30/27 (b)(c)(d)(e) | 3,500 | 2,450 | |
| Tranche B 1LN, term loan CME Term SOFR 1 Month Index + 8.500% 14.1448% 12/30/26 (b)(c)(d) | 3,531 | 3,301 | |
TOTAL LEISURE | 297,994 | ||
| Metals/Mining - 0.2% | |||
| Arsenal AIC Parent LLC Tranche B 1LN, term loan CME Term SOFR 1 Month Index + 4.500% 9.8792% 8/18/30 (b)(c)(d) | 15,940 | 15,889 | |
| U.S. Silica Co. Tranche B 1LN, term loan CME Term SOFR 1 Month Index + 4.750% 10.1741% 3/23/30 (b)(c)(d) | 11,875 | 11,864 | |
TOTAL METALS/MINING | 27,753 | ||
| Paper - 0.8% | |||
| Ahlstrom-Munksjo OYJ 1LN, term loan 3 month U.S. LIBOR + 4.000% 9.6517% 2/4/28 (b)(c)(d) | 6,651 | 6,393 | |
| Clydesdale Acquisition Holdings, Inc. 1LN, term loan CME Term SOFR 1 Month Index + 4.170% 9.5991% 4/13/29 (b)(c)(d) | 98,065 | 94,723 | |
TOTAL PAPER | 101,116 | ||
| Publishing/Printing - 0.6% | |||
| Century DE Buyer LLC 1LN, term loan CME Term SOFR 1 Month Index + 4.000% 9/27/30 (c)(d)(g) | 17,585 | 17,439 | |
| Harland Clarke Holdings Corp. 1LN, term loan CME Term SOFR 1 Month Index + 7.750% 13.4017% 6/16/26 (b)(c)(d) | 15,246 | 14,255 | |
| Learning Care Group (U.S.) No 2, Inc. Tranche B 1LN, term loan CME Term SOFR 1 Month Index + 4.750% 10.1408% 8/11/28 (b)(c)(d) | 12,295 | 12,287 | |
| MJH Healthcare Holdings LLC Tranche B 1LN, term loan CME Term SOFR 1 Month Index + 3.500% 8.9241% 1/28/29 (b)(c)(d) | 13,144 | 12,996 | |
| RLG Holdings LLC: | |||
| 2LN, term loan CME Term SOFR 1 Month Index + 7.500% 12.9386% 7/2/29 (b)(c)(d) | 2,290 | 2,078 | |
| Tranche B 1LN, term loan CME Term SOFR 1 Month Index + 4.250% 9.6886% 7/8/28 (b)(c)(d) | 9,000 | 8,297 | |
TOTAL PUBLISHING/PRINTING | 67,352 | ||
| Railroad - 0.5% | |||
| AIT Worldwide Logistics Holdings, Inc. 1LN, term loan CME Term SOFR 1 Month Index + 4.750% 10.1911% 4/6/28 (b)(c)(d) | 16,516 | 16,399 | |
| Genesee & Wyoming, Inc. 1LN, term loan CME Term SOFR 3 Month Index + 2.000% 7.4901% 12/30/26 (b)(c)(d) | 18,221 | 18,198 | |
| Wwex Unified Topco Holdings LLC: | |||
| 1LN, term loan CME Term SOFR 1 Month Index + 4.250% 9.6517% 7/26/28 (b)(c)(d) | 25,228 | 24,085 | |
| Tranche B 2LN, term loan CME Term SOFR 3 Month Index + 7.000% 12.6517% 7/22/29 (b)(c)(d) | 4,920 | 4,121 | |
TOTAL RAILROAD | 62,803 | ||
| Restaurants - 1.1% | |||
| Burger King Worldwide, Inc. Tranche B5 1LN, term loan CME Term SOFR 1 Month Index + 2.250% 7.5741% 9/21/30 (b)(c)(d) | 25,074 | 24,817 | |
| Dave & Buster's, Inc. Tranche B 1LN, term loan CME Term SOFR 1 Month Index + 3.750% 9.1875% 6/29/29 (b)(c)(d) | 12,217 | 12,186 | |
| Flynn Restaurant Group LP Tranche B 1LN, term loan CME Term SOFR 1 Month Index + 4.250% 9.6886% 12/1/28 (b)(c)(d) | 8,339 | 8,297 | |
| KFC Holding Co. Tranche B 1LN, term loan CME Term SOFR 1 Month Index + 1.750% 7.2579% 3/15/28 (b)(c)(d) | 13,651 | 13,619 | |
| Pacific Bells LLC Tranche B 1LN, term loan CME Term SOFR 3 Month Index + 4.500% 10.1517% 10/20/28 (b)(c)(d) | 10,661 | 10,468 | |
| PFC Acquisition Corp. Tranche B 1LN, term loan CME Term SOFR 3 Month Index + 6.250% 11.7829% 3/1/26 (b)(c)(d) | 12,440 | 11,779 | |
| Restaurant Technologies, Inc. Tranche B 1LN, term loan CME Term SOFR 3 Month Index + 4.250% 9.6401% 4/1/29 (b)(c)(d) | 13,024 | 12,443 | |
| Whatabrands LLC Tranche B 1LN, term loan CME Term SOFR 1 Month Index + 3.000% 8.4386% 8/3/28 (b)(c)(d) | 38,588 | 38,198 | |
TOTAL RESTAURANTS | 131,807 | ||
| Services - 9.3% | |||
| ABG Intermediate Holdings 2 LLC: | |||
| Tranche B 2LN, term loan CME Term SOFR 1 Month Index + 6.000% 11.4269% 12/20/29 (b)(c)(d) | 4,912 | 4,927 | |
| Tranche B1 LN, term loan CME Term SOFR 1 Month Index + 3.500% 8.9241% 12/21/28 (b)(c)(d) | 51,639 | 51,482 | |
| Tranche B2 1LN, term loan CME Term SOFR 1 Month Index + 4.000% 9.4241% 12/21/28 (b)(c)(d) | 38,405 | 38,309 | |
| AEA International Holdings Luxembourg SARL Tranche B 1LN, term loan CME Term SOFR 3 Month Index + 3.750% 9.4017% 9/7/28 (b)(c)(d) | 5,433 | 5,406 | |
| All-Star Bidco AB: | |||
| Tranche B 1LN, term loan CME Term SOFR 3 Month Index + 3.900% 8.95% 11/16/28 (b)(c)(d) | 6,460 | 6,347 | |
| Tranche B1 1LN, term loan CME Term SOFR 3 Month Index + 3.500% 8.45% 11/16/28 (b)(c)(d) | 16,457 | 16,200 | |
| Allied Universal Holdco LLC Tranche B 1LN, term loan: | |||
| CME Term SOFR 1 Month Index + 3.750% 9.1741% 5/14/28 (b)(c)(d) | 55,967 | 53,050 | |
| CME Term SOFR 1 Month Index + 4.750% 10.0741% 5/14/28 (b)(c)(d) | 2,810 | 2,720 | |
| APX Group, Inc. Tranche B 1LN, term loan CME Term SOFR 1 Month Index + 3.250% 8.9291% 7/9/28 (b)(c)(d) | 22,849 | 22,814 | |
| Aramark Services, Inc.: | |||
| Tranche B 1LN, term loan: | |||
CME Term SOFR 1 Month Index + 2.500% 7.9386% 4/6/28 (b)(c)(d) | 26,696 | 26,635 | |
CME Term SOFR 1 Month Index + 2.500% 7.9386% 6/22/30 (b)(c)(d) | 575 | 573 | |
| Tranche B-4 1LN, term loan CME Term SOFR 1 Month Index + 1.750% 7.1886% 1/15/27 (b)(c)(d) | 4,663 | 4,639 | |
| Archkey Holdings, Inc. Tranche B 1LN, term loan CME Term SOFR 1 Month Index + 5.250% 10.6886% 6/30/28 (b)(c)(d) | 7,061 | 6,955 | |
| Ascend Learning LLC: | |||
| 2LN, term loan CME Term SOFR 1 Month Index + 5.750% 11.1741% 12/10/29 (b)(c)(d) | 23,235 | 19,537 | |
| Tranche B 1LN, term loan CME Term SOFR 1 Month Index + 3.500% 8.9241% 12/10/28 (b)(c)(d) | 45,165 | 41,933 | |
| Avis Budget Group, Inc. 1LN, term loan CME Term SOFR 1 Month Index + 3.500% 8.9241% 3/16/29 (b)(c)(d) | 15,056 | 15,050 | |
| Brand Energy & Infrastructure Services, Inc. Tranche B 1LN, term loan CME Term SOFR 1 Month Index + 5.500% 10.8719% 8/1/30 (b)(c)(d) | 41,500 | 39,944 | |
| Cast & Crew Payroll LLC Tranche B 1LN, term loan: | |||
| CME Term SOFR 1 Month Index + 3.500% 8.9386% 2/7/26 (b)(c)(d) | 28,214 | 27,756 | |
| CME Term SOFR 1 Month Index + 3.750% 9.0741% 12/30/28 (b)(c)(d) | 13,315 | 12,993 | |
| CHG Healthcare Services, Inc. 1LN, term loan: | |||
| CME Term SOFR 1 Month Index + 3.250% 8.6886% 9/30/28 (b)(c)(d) | 5,613 | 5,550 | |
| CME Term SOFR 1 Month Index + 3.750% 9.1448% 9/30/28 (b)(c)(d) | 5,390 | 5,336 | |
| Congruex Group LLC Tranche B 1LN, term loan CME Term SOFR 3 Month Index + 5.750% 11.2832% 5/3/29 (b)(c)(d) | 18,061 | 17,723 | |
| CoreLogic, Inc. Tranche B 1LN, term loan CME Term SOFR 1 Month Index + 3.500% 8.9386% 6/2/28 (b)(c)(d) | 50,401 | 45,757 | |
| EAB Global, Inc. Tranche B 1LN, term loan 3 month U.S. LIBOR + 3.500% 8.9386% 8/16/28 (b)(c)(d) | 13,770 | 13,537 | |
| EmployBridge LLC Tranche B 1LN, term loan 3 month U.S. LIBOR + 4.750% 10.4071% 7/19/28 (b)(c)(d) | 28,805 | 24,744 | |
| Ensemble RCM LLC 1LN, term loan CME Term SOFR 1 Month Index + 3.750% 9.2332% 8/1/26 (b)(c)(d) | 11,666 | 11,656 | |
| Filtration Group Corp.: | |||
| 1LN, term loan CME Term SOFR 1 Month Index + 4.250% 9.6886% 10/19/28 (b)(c)(d) | 9,350 | 9,346 | |
| Tranche B 1LN, term loan CME Term SOFR 1 Month Index + 3.500% 8.9386% 10/21/28 (b)(c)(d) | 11,440 | 11,343 | |
| Flexera Software LLC Tranche B 1LN, term loan CME Term SOFR 1 Month Index + 3.750% 9.1886% 3/3/28 (b)(c)(d) | 18,441 | 18,183 | |
| Franchise Group, Inc. Tranche B 1LN, term loan: | |||
| CME Term SOFR 3 Month Index + 4.750% 10.3769% 3/10/26 (b)(c)(d) | 9,084 | 8,176 | |
| CME Term SOFR 3 Month Index + 4.750% 10.4374% 3/10/26 (b)(c)(d) | 31,747 | 28,314 | |
| Galaxy U.S. Opco, Inc. 1LN, term loan CME Term SOFR 1 Month Index + 4.750% 10.1332% 4/29/29 (b)(c)(d) | 13,017 | 12,041 | |
| GEMS MENASA Cayman Ltd. Tranche B 1LN, term loan CME Term SOFR 3 Month Index + 4.750% 10.4341% 7/30/26 (b)(c)(d) | 15,853 | 15,856 | |
| Greeneden U.S. Holdings II LLC Tranche B 1LN, term loan CME Term SOFR 1 Month Index + 4.000% 9.4386% 12/1/27 (b)(c)(d) | 9,998 | 9,982 | |
| HomeServe U.S.A. Corp. Tranche B 1LN, term loan CME Term SOFR 1 Month Index + 3.000% 8.3387% 10/13/30 (b)(c)(d) | 22,840 | 22,726 | |
| Indy U.S. Bidco LLC Tranche B 1LN, term loan CME Term SOFR 1 Month Index + 3.750% 9.0741% 3/5/28 (b)(c)(d) | 4,559 | 4,274 | |
| Ion Trading Finance Ltd. Tranche B 1LN, term loan CME Term SOFR 3 Month Index + 4.750% 10.2401% 3/26/28 (b)(c)(d) | 23,037 | 22,245 | |
| KNS Acquisitions, Inc. Tranche B 1LN, term loan CME Term SOFR 1 Month Index + 6.250% 11.6886% 4/21/27 (b)(c)(d) | 14,445 | 12,188 | |
| KUEHG Corp. 1LN, term loan CME Term SOFR 1 Month Index + 5.000% 10.3901% 6/12/30 (b)(c)(d) | 51,560 | 51,478 | |
| Life Time, Inc. Tranche B 1LN, term loan CME Term SOFR 1 Month Index + 4.750% 10.6113% 1/15/26 (b)(c)(d) | 2,315 | 2,313 | |
| Maverick Purchaser Sub LLC: | |||
| Tranche B 1LN, term loan: | |||
CME Term SOFR 1 Month Index + 4.000% 9.3347% 2/15/29 (b)(c)(d) | 26,660 | 26,019 | |
CME Term SOFR 1 Month Index + 4.000% 9.4386% 1/23/27 (b)(c)(d) | 18,944 | 18,565 | |
| Tranche B 2LN, term loan CME Term SOFR 1 Month Index + 8.750% 14.1886% 1/31/28 (b)(c)(d) | 10,815 | 9,744 | |
| Neptune BidCo U.S., Inc.: | |||
| term loan CME Term SOFR 1 Month Index + 4.750% 10.2567% 10/11/28 (b)(c)(d) | 2,938 | 2,537 | |
| Tranche B 1LN, term loan CME Term SOFR 1 Month Index + 5.000% 10.5067% 4/11/29 (b)(c)(d) | 78,556 | 68,491 | |
| Omnia Partners LLC: | |||
| 1LN, term loan CME Term SOFR 1 Month Index + 4.250% 9.6282% 7/25/30 (b)(c)(d) | 19,215 | 19,167 | |
| Tranche DD 1LN, term loan CME Term SOFR 1 Month Index + 4.250% 7/19/30 (c)(d)(h) | 1,805 | 1,801 | |
| Optiv Security, Inc. Tranche B 1LN, term loan CME Term SOFR 1 Month Index + 5.250% 10.6296% 8/14/26 (b)(c)(d) | 14,405 | 13,678 | |
| Pilot Travel Centers LLC Tranche B 1LN, term loan CME Term SOFR 1 Month Index + 2.000% 7.4241% 8/4/28 (b)(c)(d) | 36,247 | 36,225 | |
| PowerTeam Services LLC: | |||
| 1LN, term loan CME Term SOFR 3 Month Index + 3.250% 8.7401% 3/5/25 (b)(c)(d) | 1,458 | 1,312 | |
| Tranche B 1LN, term loan CME Term SOFR 3 Month Index + 3.500% 8.8901% 3/6/25 (b)(c)(d) | 13,195 | 11,897 | |
| Sabert Corp. Tranche B 1LN, term loan CME Term SOFR 1 Month Index + 4.500% 9.9386% 12/10/26 (b)(c)(d) | 10,552 | 10,519 | |
| Sedgwick Claims Management Services, Inc. Tranche B 1LN, term loan CME Term SOFR 1 Month Index + 3.750% 9.0741% 2/24/28 (b)(c)(d) | 9,422 | 9,381 | |
| Sitel Worldwide Corp. Tranche B 1LN, term loan CME Term SOFR 1 Month Index + 3.750% 9.1886% 8/27/28 (b)(c)(d) | 8,287 | 7,966 | |
| Sotheby's Tranche B 1LN, term loan CME Term SOFR 1 Month Index + 4.500% 10.1555% 1/15/27 (b)(c)(d) | 11,176 | 10,789 | |
| Spin Holdco, Inc. Tranche B 1LN, term loan 3 month U.S. LIBOR + 4.000% 9.6639% 3/4/28 (b)(c)(d) | 101,788 | 86,774 | |
| SuperMoose Borrower LLC Tranche B 1LN, term loan CME Term SOFR 3 Month Index + 3.750% 9.2901% 8/29/25 (b)(c)(d) | 13,624 | 12,813 | |
| The GEO Group, Inc. Tranche 1B 1LN, term loan CME Term SOFR 1 Month Index + 7.120% 12.4491% 3/23/27 (b)(c)(d) | 5,472 | 5,561 | |
| Uber Technologies, Inc. Tranche B 1LN, term loan CME Term SOFR 1 Month Index + 3.000% 8.1594% 3/3/30 (b)(c)(d) | 32,170 | 32,126 | |
| WMB Holdings, Inc. Tranche B 1LN, term loan CME Term SOFR 1 Month Index + 3.250% 8.6741% 11/3/29 (b)(c)(d) | 5,419 | 5,416 | |
TOTAL SERVICES | 1,140,819 | ||
| Specialty Retailing - 0.1% | |||
| New SK Holdco Sub LLC 1LN, term loan CME Term SOFR 1 Month Index + 8.350% 13.6887% 6/30/27 (b)(c)(d) | 17,532 | 16,445 | |
| Steel - 0.1% | |||
| JMC Steel Group, Inc. 1LN, term loan CME Term SOFR 1 Month Index + 2.000% 7.4492% 1/24/27 (b)(c)(d) | 11,550 | 11,505 | |
| Super Retail - 3.5% | |||
| Academy Ltd. Tranche B 1LN, term loan CME Term SOFR 1 Month Index + 3.750% 9.1791% 11/6/27 (b)(c)(d) | 12,981 | 12,961 | |
| At Home Group, Inc. Tranche B 1LN, term loan CME Term SOFR 1 Month Index + 4.250% 9.6791% 7/24/28 (b)(c)(d) | 17,456 | 6,214 | |
| Bass Pro Group LLC Tranche B 1LN, term loan CME Term SOFR 1 Month Index + 3.750% 9.4017% 3/5/28 (b)(c)(d) | 311,038 | 308,247 | |
| BJ's Wholesale Club, Inc. Tranche B 1LN, term loan CME Term SOFR 1 Month Index + 2.000% 7.3488% 2/3/29 (b)(c)(d) | 10,200 | 10,210 | |
| Empire Today LLC Tranche B 1LN, term loan CME Term SOFR 1 Month Index + 5.000% 10.4531% 4/1/28 (b)(c)(d) | 14,534 | 11,185 | |
| Hanesbrands, Inc. Tranche B 1LN, term loan CME Term SOFR 1 Month Index + 3.750% 9.0741% 3/8/30 (b)(c)(d) | 8,890 | 8,768 | |
| Harbor Freight Tools U.S.A., Inc. Tranche B 1LN, term loan CME Term SOFR 1 Month Index + 2.750% 8.1886% 10/19/27 (b)(c)(d) | 7,505 | 7,403 | |
| LBM Acquisition LLC Tranche B 1LN, term loan CME Term SOFR 1 Month Index + 3.750% 9.1741% 12/18/27 (b)(c)(d) | 18,544 | 17,617 | |
| Michaels Companies, Inc. 1LN, term loan CME Term SOFR 3 Month Index + 4.250% 9.9017% 4/15/28 (b)(c)(d) | 23,360 | 19,453 | |
| Red Ventures LLC Tranche B 1LN, term loan CME Term SOFR 1 Month Index + 3.000% 8.3241% 3/3/30 (b)(c)(d) | 10,620 | 10,510 | |
| RH: | |||
| Tranche B 1LN, term loan CME Term SOFR 1 Month Index + 2.500% 7.9386% 10/20/28 (b)(c)(d) | 6,688 | 6,237 | |
| Tranche B2 1LN, term loan CME Term SOFR 1 Month Index + 3.250% 8.6741% 10/20/28 (b)(c)(d) | 9,286 | 8,743 | |
TOTAL SUPER RETAIL | 427,548 | ||
| Technology - 15.4% | |||
| A&V Holdings Midco LLC Tranche B 1LN, term loan CME Term SOFR 3 Month Index + 5.370% 11.14% 3/10/27 (b)(c)(d) | 15,292 | 14,986 | |
| Acuris Finance U.S., Inc. 1LN, term loan CME Term SOFR 3 Month Index + 4.000% 9.5401% 2/16/28 (b)(c)(d) | 7,455 | 7,334 | |
| AI Aqua Merger Sub, Inc. Tranche B 1LN, term loan CME Term SOFR 1 Month Index + 3.750% 9.0824% 7/30/28 (b)(c)(d) | 43,729 | 42,849 | |
| Alliance Laundry Systems LLC Tranche B 1LN, term loan CME Term SOFR 3 Month Index + 3.500% 8.9926% 10/8/27 (b)(c)(d) | 10,506 | 10,478 | |
| Anastasia Parent LLC Tranche B, term loan CME Term SOFR 3 Month Index + 3.750% 9.4017% 8/10/25 (b)(c)(d) | 37,213 | 25,464 | |
| Applied Systems, Inc. Tranche B 1LN, term loan CME Term SOFR 3 Month Index + 4.500% 9.8901% 9/19/26 (b)(c)(d) | 18,781 | 18,809 | |
| Aptean, Inc. 1LN, term loan CME Term SOFR 1 Month Index + 4.250% 9.6741% 4/23/26 (b)(c)(d) | 15,048 | 14,970 | |
| Athenahealth Group, Inc. Tranche B 1LN, term loan CME Term SOFR 1 Month Index + 3.500% 8.5769% 2/15/29 (b)(c)(d) | 78,262 | 75,704 | |
| AZZ, Inc. Tranche B 1LN, term loan CME Term SOFR 1 Month Index + 3.750% 9.0741% 5/13/29 (b)(c)(d) | 18,275 | 18,262 | |
| Byju's Alpha, Inc. Tranche B 1LN, term loan 3 month U.S. LIBOR + 8.000% 15.5% 11/24/26 (b)(c)(d) | 23,756 | 7,150 | |
| Camelot Finance SA: | |||
| Tranche B 1LN, term loan CME Term SOFR 1 Month Index + 3.000% 8.4386% 10/31/26 (b)(c)(d) | 24,078 | 24,036 | |
| Tranche B, term loan CME Term SOFR 1 Month Index + 3.000% 8.4386% 10/31/26 (b)(c)(d) | 26,743 | 26,693 | |
| Central Parent, Inc. Tranche B 1LN, term loan CME Term SOFR 1 Month Index + 4.000% 9.4062% 7/6/29 (b)(c)(d) | 28,034 | 27,851 | |
| Ceridian HCM Holding, Inc. Tranche B, term loan CME Term SOFR 1 Month Index + 2.500% 7.9386% 4/30/25 (b)(c)(d) | 25,678 | 25,646 | |
| Cloud Software Group, Inc.: | |||
| Tranche A 1LN, term loan CME Term SOFR 3 Month Index + 4.500% 9.9901% 9/30/28 (b)(c)(d) | 5,853 | 5,549 | |
| Tranche B 1LN, term loan CME Term SOFR 3 Month Index + 4.500% 9.9901% 3/30/29 (b)(c)(d) | 48,609 | 46,123 | |
| Coherent Corp. Tranche B 1LN, term loan CME Term SOFR 1 Month Index + 2.750% 8.1886% 7/1/29 (b)(c)(d) | 40,032 | 39,894 | |
| CommScope, Inc. Tranche B 1LN, term loan CME Term SOFR 1 Month Index + 3.250% 8.6886% 4/4/26 (b)(c)(d) | 35,229 | 30,106 | |
| ConnectWise LLC Tranche B 1LN, term loan CME Term SOFR 1 Month Index + 3.500% 8.9386% 9/30/28 (b)(c)(d) | 31,472 | 30,575 | |
| Constant Contact, Inc. Tranche B 1LN, term loan CME Term SOFR 1 Month Index + 4.000% 9.6874% 2/10/28 (b)(c)(d) | 9,823 | 9,147 | |
| DCert Buyer, Inc.: | |||
| 1LN, term loan CME Term SOFR 1 Month Index + 4.000% 9.3241% 10/16/26 (b)(c)(d) | 41,676 | 40,862 | |
| Tranche B 2LN, term loan CME Term SOFR 3 Month Index + 7.000% 12.3241% 2/19/29 (b)(c)(d) | 14,248 | 12,704 | |
| DG Investment Intermediate Holdings, Inc.: | |||
| 2LN, term loan CME Term SOFR 1 Month Index + 6.750% 12.1886% 3/31/29 (b)(c)(d) | 2,490 | 2,213 | |
| Tranche B 1LN, term loan: | |||
CME Term SOFR 1 Month Index + 3.750% 9.1998% 3/31/28 (b)(c)(d) | 15,272 | 14,760 | |
CME Term SOFR 1 Month Index + 4.750% 10.0741% 3/31/28 (b)(c)(d) | 5,920 | 5,812 | |
| ECL Entertainment LLC Tranche B 1LN, term loan CME Term SOFR 1 Month Index + 4.750% 8/31/30 (c)(d)(g) | 7,640 | 7,615 | |
| Entegris, Inc. Tranche B 1LN, term loan CME Term SOFR 1 Month Index + 2.750% 7.8901% 7/6/29 (b)(c)(d) | 29,199 | 29,209 | |
| Eos U.S. Finco LLC 1LN, term loan CME Term SOFR 3 Month Index + 6.000% 11.1643% 10/6/29 (b)(c)(d) | 11,515 | 10,786 | |
| Epicor Software Corp.: | |||
| 1LN, term loan CME Term SOFR 1 Month Index + 3.750% 9.0741% 7/31/27 (b)(c)(d) | 4,035 | 4,036 | |
| Tranche B 1LN, term loan 1 month U.S. LIBOR + 3.250% 8.6886% 7/31/27 (b)(c)(d) | 20,896 | 20,769 | |
| Gen Digital, Inc. Tranche B 1LN, term loan CME Term SOFR 1 Month Index + 2.000% 7.4241% 9/12/29 (b)(c)(d) | 54,751 | 54,226 | |
| GoDaddy, Inc. Tranche B 1LN, term loan CME Term SOFR 1 Month Index + 3.250% 7.8241% 11/9/29 (b)(c)(d) | 16,816 | 16,820 | |
| Helios Software Holdings, Inc. Tranche B 1LN, term loan CME Term SOFR 1 Month Index + 4.250% 9.7401% 7/18/30 (b)(c)(d) | 4,545 | 4,501 | |
| Hunter U.S. Bidco, Inc. Tranche B 1LN, term loan CME Term SOFR 3 Month Index + 4.250% 9.7401% 8/19/28 (b)(c)(d) | 10,414 | 10,290 | |
| Icon Luxembourg Sarl Tranche B 1LN, term loan CME Term SOFR 3 Month Index + 2.250% 7.9017% 7/3/28 (b)(c)(d) | 52,615 | 52,627 | |
| Imprivata, Inc. Tranche B 1LN, term loan: | |||
| CME Term SOFR 1 Month Index + 3.750% 9.1886% 12/1/27 (b)(c)(d) | 9,750 | 9,701 | |
| CME Term SOFR 1 Month Index + 4.250% 9.5741% 12/1/27 (b)(c)(d) | 988 | 985 | |
| McAfee Corp. Tranche B 1LN, term loan CME Term SOFR 1 Month Index + 3.750% 9.1646% 3/1/29 (b)(c)(d) | 38,658 | 36,895 | |
| MH Sub I LLC: | |||
| Tranche B 1LN, term loan CME Term SOFR 1 Month Index + 4.250% 9.5741% 5/3/28 (b)(c)(d) | 87,983 | 83,975 | |
| Tranche B 2LN, term loan CME Term SOFR 1 Month Index + 6.250% 11.5741% 2/23/29 (b)(c)(d) | 12,580 | 10,897 | |
| MKS Instruments, Inc. Tranche B 1LN, term loan CME Term SOFR 1 Month Index + 2.500% 7.819% 8/17/29 (b)(c)(d) | 27,601 | 27,348 | |
| NAVEX TopCo, Inc.: | |||
| 2LN, term loan CME Term SOFR 1 Month Index + 7.000% 12.4241% 9/4/26 (b)(c)(d) | 2,225 | 2,184 | |
| Tranche B 1LN, term loan CME Term SOFR 1 Month Index + 3.250% 8.6741% 9/5/25 (b)(c)(d) | 9,169 | 9,136 | |
| NCR Atleos Corp. Tranche B 1LN, term loan CME Term SOFR 1 Month Index + 4.750% 10.1761% 3/27/29 (b)(c)(d) | 21,490 | 20,505 | |
| Open Text Corp. Tranche B 1LN, term loan CME Term SOFR 1 Month Index + 2.750% 8.1741% 1/31/30 (b)(c)(d) | 45,639 | 45,589 | |
| Park Place Technologies LLC 1LN, term loan CME Term SOFR 1 Month Index + 5.000% 10.4241% 11/10/27 (b)(c)(d) | 23,594 | 23,054 | |
| Peraton Corp. Tranche B 1LN, term loan CME Term SOFR 1 Month Index + 3.750% 9.1741% 2/1/28 (b)(c)(d) | 90,445 | 88,636 | |
| Polaris Newco LLC Tranche B 1LN, term loan CME Term SOFR 1 Month Index + 4.000% 9.4386% 6/2/28 (b)(c)(d) | 114,722 | 108,126 | |
| Project Alpha Intermediate Holding, Inc. Tranche B 1LN, term loan CME Term SOFR 1 Month Index + 4.750% 10.0749% 10/19/30 (b)(c)(d) | 33,190 | 32,168 | |
| Project Boost Purchaser LLC: | |||
| 1LN, term loan CME Term SOFR 1 Month Index + 3.500% 8.9386% 5/30/26 (b)(c)(d) | 12,082 | 11,993 | |
| Tranche B 1LN, term loan CME Term SOFR 1 Month Index + 3.500% 6.6153% 5/30/26 (b)(c)(d) | 7,130 | 7,077 | |
| Proofpoint, Inc. Tranche B 1LN, term loan CME Term SOFR 1 Month Index + 3.250% 8.6886% 8/31/28 (b)(c)(d) | 43,381 | 42,609 | |
| Rackspace Technology Global, Inc. Tranche B 1LN, term loan CME Term SOFR 1 Month Index + 2.750% 8.2056% 2/15/28 (b)(c)(d) | 32,966 | 14,370 | |
| RealPage, Inc. Tranche B 1LN, term loan CME Term SOFR 1 Month Index + 3.000% 8.4386% 4/22/28 (b)(c)(d) | 30,775 | 30,051 | |
| Red Planet Borrower LLC Tranche B 1LN, term loan CME Term SOFR 1 Month Index + 3.750% 9.1741% 9/30/28 (b)(c)(d) | 24,765 | 23,018 | |
| Renaissance Holdings Corp.: | |||
| 1LN, term loan CME Term SOFR 1 Month Index + 4.750% 10.0741% 4/7/30 (b)(c)(d) | 34,900 | 34,350 | |
| Tranche B 2LN, term loan CME Term SOFR 1 Month Index + 7.000% 12.4161% 5/31/26 (b)(c)(d) | 343 | 342 | |
| Roper Industrial Products Investment Co. Tranche B 1LN, term loan CME Term SOFR 1 Month Index + 4.250% 9.8901% 11/22/29 (b)(c)(d) | 8,975 | 8,952 | |
| Sophia LP: | |||
| 1LN, term loan CME Term SOFR 1 Month Index + 4.250% 9.5741% 10/7/27 (b)(c)(d) | 14,590 | 14,408 | |
| Tranche B 1LN, term loan CME Term SOFR 3 Month Index + 3.500% 8.9241% 10/7/27 (b)(c)(d) | 13,905 | 13,713 | |
| Sovos Compliance LLC Tranche B 1LN, term loan CME Term SOFR 1 Month Index + 4.500% 9.9386% 8/11/28 (b)(c)(d) | 20,444 | 19,995 | |
| SS&C Technologies, Inc.: | |||
| Tranche B 3LN, term loan CME Term SOFR 1 Month Index + 1.750% 7.1886% 4/16/25 (b)(c)(d) | 6,845 | 6,839 | |
| Tranche B 4LN, term loan CME Term SOFR 1 Month Index + 1.750% 7.1886% 4/16/25 (b)(c)(d) | 6,464 | 6,458 | |
| Tranche B 5LN, term loan CME Term SOFR 1 Month Index + 1.750% 7.1886% 4/16/25 (b)(c)(d) | 30,559 | 30,532 | |
| Tranche B6 1LN, term loan CME Term SOFR 1 Month Index + 2.250% 7.6741% 3/22/29 (b)(c)(d) | 6,209 | 6,200 | |
| Tranche B7 1LN, term loan CME Term SOFR 1 Month Index + 2.250% 7.6741% 3/22/29 (b)(c)(d) | 9,836 | 9,821 | |
| Tempo Acquisition LLC Tranche B 1LN, term loan CME Term SOFR 1 Month Index + 2.750% 8.0741% 8/31/28 (b)(c)(d) | 43,766 | 43,698 | |
| TTM Technologies, Inc. Tranche B 1LN, term loan CME Term SOFR 1 Month Index + 2.750% 8.0646% 5/30/30 (b)(c)(d) | 9,668 | 9,656 | |
| Ukg, Inc.: | |||
| 1LN, term loan: | |||
CME Term SOFR 1 Month Index + 4.500% 10.0225% 5/4/26 (b)(c)(d) | 10,618 | 10,609 | |
CME Term SOFR 3 Month Index + 3.250% 8.7643% 5/4/26 (b)(c)(d) | 59,300 | 58,936 | |
CME Term SOFR 3 Month Index + 3.750% 9.2332% 5/4/26 (b)(c)(d) | 27,649 | 27,575 | |
| 2LN, term loan CME Term SOFR 3 Month Index + 5.250% 10.7643% 5/3/27 (b)(c)(d) | 28,250 | 28,186 | |
| Veritas U.S., Inc. Tranche B 1LN, term loan CME Term SOFR 1 Month Index + 5.000% 10.4386% 9/1/25 (b)(c)(d) | 25,433 | 21,431 | |
| Verscend Holding Corp. Tranche B 1LN, term loan CME Term SOFR 1 Month Index + 4.000% 9.4386% 8/27/25 (b)(c)(d) | 15,642 | 15,619 | |
| VFH Parent LLC Tranche B 1LN, term loan CME Term SOFR 1 Month Index + 3.000% 8.4269% 1/13/29 (b)(c)(d) | 22,678 | 22,494 | |
| Virgin Pulse, Inc.: | |||
| 2LN, term loan CME Term SOFR 1 Month Index + 7.250% 12.6886% 4/6/29 (b)(c)(d) | 745 | 744 | |
| Tranche B 1LN, term loan CME Term SOFR 1 Month Index + 4.000% 9.1886% 4/6/28 (b)(c)(d) | 19,318 | 19,291 | |
| VM Consolidated, Inc. Tranche B 1LN, term loan CME Term SOFR 1 Month Index + 3.250% 8.6886% 3/27/28 (b)(c)(d) | 18,390 | 18,410 | |
| VS Buyer LLC Tranche B 1LN, term loan CME Term SOFR 1 Month Index + 3.000% 8.6741% 2/28/27 (b)(c)(d) | 16,284 | 16,135 | |
| Weber-Stephen Products LLC Tranche B 1LN, term loan: | |||
| CME Term SOFR 1 Month Index + 3.250% 8.6886% 10/30/27 (b)(c)(d) | 8,307 | 7,245 | |
| CME Term SOFR 1 Month Index + 4.250% 9.6741% 10/30/27 (b)(c)(d) | 5,708 | 4,966 | |
| Zelis Payments Buyer, Inc. Tranche B 1LN, term loan CME Term SOFR 1 Month Index + 3.500% 8.9386% 9/30/26 (b)(c)(d) | 26,074 | 26,046 | |
TOTAL TECHNOLOGY | 1,899,824 | ||
| Telecommunications - 3.6% | |||
| Altice Financing SA Tranche B 1LN, term loan CME Term SOFR 1 Month Index + 5.000% 10.3939% 10/31/27 (b)(c)(d) | 11,744 | 10,927 | |
| Altice France SA Tranche B14 1LN, term loan CME Term SOFR 1 Month Index + 5.500% 10.8939% 8/15/28 (b)(c)(d) | 59,681 | 52,892 | |
| Aventiv Technologies LLC Tranche B, term loan: | |||
| 3 month U.S. LIBOR + 4.500% 10.231% 11/1/24 (b)(c)(d) | 35,711 | 30,243 | |
| 3 month U.S. LIBOR + 8.250% 13.981% 11/1/25 (b)(c)(d) | 30,400 | 21,269 | |
| Cablevision Lightpath LLC Tranche B 1LN, term loan CME Term SOFR 1 Month Index + 3.250% 8.699% 11/30/27 (b)(c)(d) | 5,238 | 5,174 | |
| Ciena Corp. Tranche B 1LN, term loan CME Term SOFR 1 Month Index + 2.500% 7.8445% 1/18/30 (b)(c)(d) | 6,393 | 6,390 | |
| Connect U.S. Finco LLC Tranche B 1LN, term loan CME Term SOFR 1 Month Index + 3.500% 8.8241% 12/12/26 (b)(c)(d) | 4,722 | 4,602 | |
| Consolidated Communications, Inc. Tranche B 1LN, term loan CME Term SOFR 1 Month Index + 3.500% 8.9386% 10/2/27 (b)(c)(d) | 16,633 | 14,910 | |
| Crown Subsea Communications Holding, Inc.: | |||
| 1LN, term loan CME Term SOFR 1 Month Index + 5.250% 10.6791% 4/27/27 (b)(c)(d) | 17,775 | 17,753 | |
| Tranche B 1LN, term loan CME Term SOFR 1 Month Index + 5.000% 10.4291% 4/27/27 (b)(c)(d) | 5,998 | 5,988 | |
| Frontier Communications Holdings LLC Tranche B 1LN, term loan CME Term SOFR 1 Month Index + 3.750% 9.1886% 10/8/27 (b)(c)(d) | 47,179 | 45,351 | |
| GTT Communications, Inc. 1LN, term loan CME Term SOFR 3 Month Index + 9.000% 14.4901% 6/30/28 (b)(c)(d) | 4,982 | 2,940 | |
| Gtt Remainco LLC 1LN, term loan CME Term SOFR 1 Month Index + 7.000% 12.4269% 12/30/27 (b)(c)(d) | 6,202 | 5,333 | |
| Northwest Fiber LLC Tranche B 1LN, term loan CME Term SOFR 1 Month Index + 3.750% 9.3898% 4/30/27 (b)(c)(d) | 30,463 | 29,944 | |
| Patagonia Holdco LLC Tranche B 1LN, term loan CME Term SOFR 3 Month Index + 5.750% 11.1174% 8/1/29 (b)(c)(d) | 22,557 | 19,456 | |
| Radiate Holdco LLC Tranche B 1LN, term loan 1 month U.S. LIBOR + 3.250% 8.6886% 9/25/26 (b)(c)(d) | 48,372 | 39,916 | |
| SBA Senior Finance II, LLC Tranche B, term loan CME Term SOFR 1 Month Index + 1.750% 7.18% 4/11/25 (b)(c)(d) | 15,663 | 15,651 | |
| Windstream Services LLC Tranche B 1LN, term loan CME Term SOFR 1 Month Index + 6.250% 11.6741% 9/21/27 (b)(c)(d) | 25,690 | 23,688 | |
| Zayo Group Holdings, Inc. 1LN, term loan: | |||
| CME Term SOFR 1 Month Index + 3.000% 8.4386% 3/9/27 (b)(c)(d) | 82,130 | 69,105 | |
| CME Term SOFR 1 Month Index + 4.320% 9.6491% 3/9/27 (b)(c)(d) | 21,473 | 18,051 | |
TOTAL TELECOMMUNICATIONS | 439,583 | ||
| Textiles/Apparel - 0.7% | |||
| Canada Goose, Inc. Tranche B 1LN, term loan CME Term SOFR 1 Month Index + 3.500% 8.9386% 10/7/27 (b)(c)(d) | 1,853 | 1,820 | |
| Crocs, Inc. Tranche B 1LN, term loan CME Term SOFR 1 Month Index + 3.000% 8.5325% 2/19/29 (b)(c)(d) | 28,655 | 28,686 | |
| Fanatics Commerce Intermediate Holdco LLC Tranche B 1LN, term loan CME Term SOFR 3 Month Index + 3.250% 8.6886% 11/23/28 (b)(c)(d) | 23,112 | 22,881 | |
| Jo-Ann Stores LLC Tranche B 1LN, term loan CME Term SOFR 3 Month Index + 4.750% 10.3912% 7/7/28 (b)(c)(d) | 14,632 | 4,243 | |
| Tory Burch LLC Tranche B 1LN, term loan CME Term SOFR 1 Month Index + 3.500% 8.6886% 4/16/28 (b)(c)(d) | 16,809 | 16,459 | |
| Victoria's Secret & Co. Tranche B 1LN, term loan CME Term SOFR 1 Month Index + 3.250% 8.9027% 8/2/28 (b)(c)(d) | 8,944 | 8,676 | |
TOTAL TEXTILES/APPAREL | 82,765 | ||
| Transportation Ex Air/Rail - 0.0% | |||
| ASP LS Acquisition Corp. 2LN, term loan CME Term SOFR 3 Month Index + 7.500% 13.3958% 5/7/29 (b)(c)(d) | 2,965 | 2,387 | |
| Utilities - 1.6% | |||
| Brookfield WEC Holdings, Inc. Tranche B 1LN, term loan CME Term SOFR 1 Month Index + 2.750% 8.1886% 8/1/25 (b)(c)(d) | 54,365 | 54,271 | |
| ExGen Renewables IV, LLC Tranche B 1LN, term loan 3 month U.S. LIBOR + 2.500% 8.1841% 12/15/27 (b)(c)(d) | 3,480 | 3,461 | |
| Limetree Bay Terminals LLC Tranche B 1LN, term loan 3 month U.S. LIBOR + 4.000% 10.6517% 2/15/24 (b)(c)(d) | 16,649 | 15,270 | |
| Luxembourg Investment Co. 428 SARL Tranche B 1LN, term loan CME Term SOFR 3 Month Index + 5.000% 10.5401% 1/3/29 (b)(c)(d) | 11,806 | 8,116 | |
| Osmose Utilities Services, Inc. Tranche B 1LN, term loan CME Term SOFR 1 Month Index + 3.250% 8.6886% 6/23/28 (b)(c)(d) | 14,284 | 13,977 | |
| PG&E Corp. Tranche B 1LN, term loan CME Term SOFR 1 Month Index + 3.000% 8.4386% 6/23/25 (b)(c)(d) | 22,939 | 22,881 | |
| Pike Corp. Tranche B 1LN, term loan: | |||
| CME Term SOFR 1 Month Index + 3.000% 8.4386% 1/21/28 (b)(c)(d) | 15,389 | 15,340 | |
| CME Term SOFR 1 Month Index + 3.500% 8.8241% 1/21/28 (b)(c)(d) | 4,455 | 4,449 | |
| Vertiv Group Corp. Tranche B 1LN, term loan CME Term SOFR 1 Month Index + 2.750% 8.1791% 3/2/27 (b)(c)(d) | 36,274 | 36,174 | |
| Vistra Operations Co. LLC Tranche B 3LN, term loan CME Term SOFR 1 Month Index + 1.750% 7.1886% 12/31/25 (b)(c)(d) | 22,523 | 22,502 | |
TOTAL UTILITIES | 196,441 | ||
| TOTAL BANK LOAN OBLIGATIONS (Cost $10,854,821) | 10,451,968 | ||
| Nonconvertible Bonds - 4.8% | |||
Principal Amount (a) (000s) | Value ($) (000s) | ||
| Aerospace - 0.2% | |||
| TransDigm, Inc. 6.25% 3/15/26 (i) | 22,000 | 21,482 | |
| Air Transportation - 0.0% | |||
| American Airlines, Inc. / AAdvantage Loyalty IP Ltd. 5.5% 4/20/26 (i) | 3,575 | 3,477 | |
| Delta Air Lines, Inc. / SkyMiles IP Ltd. 4.5% 10/20/25 (i) | 1,911 | 1,857 | |
TOTAL AIR TRANSPORTATION | 5,334 | ||
| Automotive & Auto Parts - 0.8% | |||
| Clarios Global LP / Clarios U.S. Finance Co. 6.75% 5/15/28 (i) | 7,810 | 7,614 | |
| Ford Motor Credit Co. LLC U.S. Secured Overnight Fin. Rate (SOFR) Index + 2.950% 8.2802% 3/6/26 (b)(c) | 16,070 | 16,194 | |
| Rivian Holdco & Rivian LLC & Rivian Automotive LLC 6 month U.S. LIBOR + 5.620% 11.4932% 10/15/26 (b)(c)(i) | 72,950 | 72,756 | |
TOTAL AUTOMOTIVE & AUTO PARTS | 96,564 | ||
| Broadcasting - 0.4% | |||
| DISH Network Corp. 11.75% 11/15/27 (i) | 19,930 | 19,742 | |
| Univision Communications, Inc.: | |||
| 6.625% 6/1/27 (i) | 26,085 | 23,826 | |
| 8% 8/15/28 (i) | 6,375 | 6,020 | |
TOTAL BROADCASTING | 49,588 | ||
| Building Materials - 0.0% | |||
| SRS Distribution, Inc. 4.625% 7/1/28 (i) | 660 | 576 | |
| Cable/Satellite TV - 0.2% | |||
| CCO Holdings LLC/CCO Holdings Capital Corp.: | |||
| 5% 2/1/28 (i) | 8,110 | 7,282 | |
| 5.375% 6/1/29 (i) | 16,225 | 14,201 | |
TOTAL CABLE/SATELLITE TV | 21,483 | ||
| Capital Goods - 0.0% | |||
| Chart Industries, Inc. 7.5% 1/1/30 (i) | 1,670 | 1,640 | |
| Chemicals - 0.1% | |||
| Kronos Acquisition Holdings, Inc. / KIK Custom Products, Inc. 5% 12/31/26 (i) | 145 | 131 | |
| Olympus Water U.S. Holding Corp. 9.75% 11/15/28 (i) | 8,380 | 8,185 | |
TOTAL CHEMICALS | 8,316 | ||
| Containers - 0.1% | |||
| Ardagh Packaging Finance PLC/Ardagh MP Holdings U.S.A., Inc. 4.125% 8/15/26 (i) | 11,245 | 9,883 | |
| Energy - 0.5% | |||
| Citgo Petroleum Corp.: | |||
| 6.375% 6/15/26 (i) | 2,115 | 2,078 | |
| 7% 6/15/25 (i) | 9,610 | 9,443 | |
| 8.375% 1/15/29 (i) | 7,770 | 7,695 | |
| New Fortress Energy, Inc.: | |||
| 6.5% 9/30/26 (i) | 18,966 | 16,988 | |
| 6.75% 9/15/25 (i) | 16,640 | 15,438 | |
| Transocean Poseidon Ltd. 6.875% 2/1/27 (i) | 4,673 | 4,579 | |
TOTAL ENERGY | 56,221 | ||
| Gaming - 0.5% | |||
| Affinity Gaming LLC 6.875% 12/15/27 (i) | 7,315 | 5,962 | |
| Caesars Entertainment, Inc. 7% 2/15/30 (i) | 7,670 | 7,402 | |
| Fertitta Entertainment LLC / Fertitta Entertainment Finance Co., Inc. 4.625% 1/15/29 (i) | 37,830 | 31,790 | |
| Golden Entertainment, Inc. 7.625% 4/15/26 (i) | 5,940 | 5,940 | |
| Ontario Gaming GTA LP 8% 8/1/30 (i) | 605 | 591 | |
| Sugarhouse HSP Gaming Prop Mezz LP/Sugarhouse HSP Gaming Finance Corp. 5.875% 5/15/25 (i) | 7,363 | 7,050 | |
| VICI Properties LP / VICI Note Co.: | |||
| 3.5% 2/15/25 (i) | 1,205 | 1,149 | |
| 4.25% 12/1/26 (i) | 1,725 | 1,592 | |
| 4.625% 12/1/29 (i) | 985 | 852 | |
TOTAL GAMING | 62,328 | ||
| Healthcare - 0.1% | |||
| Embecta Corp. 6.75% 2/15/30 (i) | 8,365 | 6,935 | |
| Homebuilders/Real Estate - 0.3% | |||
| MPT Operating Partnership LP/MPT Finance Corp. 5% 10/15/27 | 27,055 | 20,890 | |
| Uniti Group LP / Uniti Group Finance, Inc. 10.5% 2/15/28 (i) | 18,880 | 18,181 | |
TOTAL HOMEBUILDERS/REAL ESTATE | 39,071 | ||
| Insurance - 0.1% | |||
| Alliant Holdings Intermediate LLC 6.75% 4/15/28 (i) | 16,655 | 15,826 | |
| Leisure - 0.2% | |||
| Carnival Corp. 7.625% 3/1/26 (i) | 14,205 | 13,813 | |
| Royal Caribbean Cruises Ltd.: | |||
| 8.25% 1/15/29 (i) | 7,970 | 8,143 | |
| 11.625% 8/15/27 (i) | 5,355 | 5,809 | |
TOTAL LEISURE | 27,765 | ||
| Metals/Mining - 0.0% | |||
| Arsenal AIC Parent LLC 8% 10/1/30 (i) | 680 | 672 | |
| Paper - 0.0% | |||
| Ardagh Metal Packaging Finance U.S.A. LLC/Ardagh Metal Packaging Finance PLC 3.25% 9/1/28 (i) | 3,430 | 2,793 | |
| Restaurants - 0.0% | |||
| 1011778 BC Unlimited Liability Co./New Red Finance, Inc. 5.75% 4/15/25 (i) | 660 | 655 | |
| CEC Entertainment LLC 6.75% 5/1/26 (i) | 4,045 | 3,778 | |
TOTAL RESTAURANTS | 4,433 | ||
| Services - 0.3% | |||
| Brand Energy & Infrastructure Services, Inc. 10.375% 8/1/30 (i) | 4,560 | 4,526 | |
| GEMS MENASA Cayman Ltd. 7.125% 7/31/26 (i) | 4,675 | 4,476 | |
| Neptune BidCo U.S., Inc. 9.29% 4/15/29 (i) | 6,300 | 5,560 | |
| PowerTeam Services LLC 9.033% 12/4/25 (i) | 18,825 | 16,943 | |
TOTAL SERVICES | 31,505 | ||
| Super Retail - 0.1% | |||
| EG Global Finance PLC: | |||
| 6.75% 2/7/25 (i) | 11,562 | 11,439 | |
| 8.5% 10/30/25 (i) | 2,379 | 2,340 | |
TOTAL SUPER RETAIL | 13,779 | ||
| Technology - 0.1% | |||
| Cloud Software Group, Inc. 9% 9/30/29 (i) | 8,495 | 7,234 | |
| CNT PRNT/CDK GLO II/FIN 8% 6/15/29 (i) | 3,905 | 3,857 | |
TOTAL TECHNOLOGY | 11,091 | ||
| Telecommunications - 0.8% | |||
| Altice Financing SA 5.75% 8/15/29 (i) | 30,000 | 23,199 | |
| Altice France SA: | |||
| 5.125% 1/15/29 (i) | 8,087 | 5,582 | |
| 5.125% 7/15/29 (i) | 10,905 | 7,467 | |
| 5.5% 1/15/28 (i) | 8,480 | 6,301 | |
| 5.5% 10/15/29 (i) | 8,370 | 5,758 | |
| Consolidated Communications, Inc. 5% 10/1/28 (i) | 410 | 309 | |
| Frontier Communications Holdings LLC: | |||
| 5% 5/1/28 (i) | 4,005 | 3,458 | |
| 8.75% 5/15/30 (i) | 1,560 | 1,486 | |
| Intelsat Jackson Holdings SA 6.5% 3/15/30 (i) | 22,343 | 19,618 | |
| LCPR Senior Secured Financing DAC: | |||
| 5.125% 7/15/29 (i) | 810 | 631 | |
| 6.75% 10/15/27 (i) | 8,250 | 7,443 | |
| Northwest Fiber LLC/Northwest Fiber Finance Sub, Inc. 4.75% 4/30/27 (i) | 710 | 634 | |
| Windstream Escrow LLC 7.75% 8/15/28 (i) | 18,810 | 14,916 | |
TOTAL TELECOMMUNICATIONS | 96,802 | ||
| Textiles/Apparel - 0.0% | |||
| Victoria's Secret & Co. 4.625% 7/15/29 (i) | 4,010 | 2,948 | |
| Utilities - 0.0% | |||
| Exgen Texas Power LLC 3 month U.S. LIBOR + 6.750% 12.4178% 10/8/26 (b)(c)(e) | 5,945 | 6,004 | |
| TOTAL NONCONVERTIBLE BONDS (Cost $634,214) | 593,039 | ||
| Common Stocks - 1.4% | |||
| Shares | Value ($) (000s) | ||
| Broadcasting - 0.0% | |||
| ION Media Networks, Inc. (e)(j) | 2,842 | 0 | |
| Capital Goods - 0.0% | |||
| TNT Crane & Rigging LLC (e)(j) | 512,868 | 2,990 | |
| TNT Crane & Rigging LLC warrants 10/31/25 (e)(j) | 86,957 | 1 | |
TOTAL CAPITAL GOODS | 2,991 | ||
| Diversified Financial Services - 0.1% | |||
| ACNR Holdings, Inc. (e)(j) | 115,087 | 10,224 | |
| Carnelian Point Holdings LP warrants (e)(j) | 18,944 | 55 | |
| Lime Tree Bay Ltd. (e)(j) | 2,899 | 148 | |
TOTAL DIVERSIFIED FINANCIAL SERVICES | 10,427 | ||
| Energy - 1.0% | |||
| California Resources Corp. | 635,843 | 33,439 | |
| California Resources Corp. warrants 10/27/24 (j) | 48,025 | 857 | |
| Chesapeake Energy Corp. (k) | 587,218 | 50,548 | |
| Chesapeake Energy Corp. (j)(l) | 4,049 | 349 | |
| Denbury, Inc. (j) | 391,783 | 34,826 | |
| EP Energy Corp. (e)(j) | 80,740 | 133 | |
TOTAL ENERGY | 120,152 | ||
| Entertainment/Film - 0.1% | |||
| New Cineworld Ltd. (e) | 533,906 | 10,678 | |
| Restaurants - 0.1% | |||
| CEC Entertainment, Inc. (e)(j) | 542,500 | 8,658 | |
| Super Retail - 0.0% | |||
| David's Bridal, Inc. rights (e)(j) | 4,171 | 0 | |
| Telecommunications - 0.0% | |||
| GTT Communications, Inc. (e) | 118,360 | 3,370 | |
| Utilities - 0.1% | |||
| TexGen Power LLC (e)(j) | 524,336 | 20,659 | |
| TOTAL COMMON STOCKS (Cost $110,942) | 176,935 | ||
| Nonconvertible Preferred Stocks - 0.3% | |||
| Shares | Value ($) (000s) | ||
| Diversified Financial Services - 0.3% | |||
ACNR Holdings, Inc. (e)(j) (Cost $8,235) | 65,882 | 35,438 | |
| Preferred Securities - 0.8% | |||
Principal Amount (a) (000s) | Value ($) (000s) | ||
| Banks & Thrifts - 0.5% | |||
| Bank of America Corp.: | |||
| CME Term SOFR 3 Month Index + 3.390% 8.8062% (b)(c)(m) | 6,970 | 7,077 | |
| 6.25% (b)(m) | 24,265 | 24,086 | |
| JPMorgan Chase & Co.: | |||
| CME Term SOFR 3 Month Index + 3.560% 8.9335% (b)(c)(m) | 7,500 | 7,682 | |
| 6.1% (b)(m) | 7,795 | 7,728 | |
| 6.75% (b)(m) | 11,615 | 11,802 | |
TOTAL BANKS & THRIFTS | 58,375 | ||
| Energy - 0.3% | |||
| Energy Transfer LP 3 month U.S. LIBOR + 4.020% 9.6542% (b)(c)(m) | 41,855 | 40,317 | |
| TOTAL PREFERRED SECURITIES (Cost $97,115) | 98,692 | ||
| Other - 0.8% | |||
| Shares | Value ($) (000s) | ||
| Other - 0.8% | |||
Fidelity Private Credit Central Fund LLC (l)(p) (Cost $93,115) | 9,357,089 | 94,881 | |
| Money Market Funds - 10.9% | |||
| Shares | Value ($) (000s) | ||
| Fidelity Cash Central Fund 5.40% (n) | 1,286,195,628 | 1,286,453 | |
| Fidelity Securities Lending Cash Central Fund 5.40% (n)(o) | 51,374,863 | 51,380 | |
| TOTAL MONEY MARKET FUNDS (Cost $1,337,808) | 1,337,833 | ||
| TOTAL INVESTMENT IN SECURITIES - 103.9% (Cost $13,136,250) | 12,788,786 |
NET OTHER ASSETS (LIABILITIES) - (3.9)% | (480,243) |
| NET ASSETS - 100.0% | 12,308,543 |
| (a) | Amount is stated in United States dollars unless otherwise noted. |
| (b) | Coupon rates for floating and adjustable rate securities reflect the rates in effect at period end. |
| (c) | Coupon is indexed to a floating interest rate which may be multiplied by a specified factor and/or subject to caps or floors. |
| (d) | Remaining maturities of bank loan obligations may be less than the stated maturities shown as a result of contractual or optional prepayments by the borrower. Such prepayments cannot be predicted with certainty. |
| (e) | Level 3 security |
| (f) | Non-income producing - Security is in default. |
| (g) | The coupon rate will be determined upon settlement of the loan after period end. |
| (h) | Position or a portion of the position represents an unfunded loan commitment. At period end, the total principal amount and market value of unfunded commitments totaled $1,805,000 and $1,801,000, respectively. |
| (i) | Security exempt from registration under Rule 144A of the Securities Act of 1933. These securities may be resold in transactions exempt from registration, normally to qualified institutional buyers. At the end of the period, the value of these securities amounted to $549,951,000 or 4.5% of net assets. |
| (j) | Non-income producing |
| (k) | Security or a portion of the security is on loan at period end. |
| (l) | Restricted securities (including private placements) - Investment in securities not registered under the Securities Act of 1933 (excluding 144A issues). At the end of the period, the value of restricted securities (excluding 144A issues) amounted to $95,230,000 or 0.8% of net assets. |
| (m) | Security is perpetual in nature with no stated maturity date. |
| (n) | Affiliated fund that is generally available only to investment companies and other accounts managed by Fidelity Investments. The rate quoted is the annualized seven-day yield of the fund at period end. A complete unaudited listing of the fund's holdings as of its most recent quarter end is available upon request. In addition, each Fidelity Central Fund's financial statements, which are not covered by the Fund's Report of Independent Registered Public Accounting Firm, are available on the SEC's website or upon request. |
| (o) | Investment made with cash collateral received from securities on loan. |
| (p) | Affiliated fund that is generally available only to investment companies and other accounts managed by Fidelity Investments. |
| Additional information on each restricted holding is as follows: | ||
| Security | Acquisition Date | Acquisition Cost ($) (000s) |
| Chesapeake Energy Corp. | 2/10/21 | 38 |
| Fidelity Private Credit Central Fund LLC | 5/01/22 - 10/27/23 | 93,115 |
| Affiliate (Amounts in thousands) | Value, beginning of period ($) | Purchases ($) | Sales Proceeds ($) | Dividend Income ($) | Realized Gain (loss) ($) | Change in Unrealized appreciation (depreciation) ($) | Value, end of period ($) | % ownership, end of period |
| Fidelity Cash Central Fund 5.40% | 817,241 | 2,917,898 | 2,448,686 | 30,679 | - | - | 1,286,453 | 2.8% |
| Fidelity Private Credit Central Fund LLC | 42,412 | 58,822 | 8,600 | 9,351 | - | 2,247 | 94,881 | 14.2% |
| Fidelity Securities Lending Cash Central Fund 5.40% | - | 294,888 | 243,508 | 26 | - | - | 51,380 | 0.2% |
| Total | 859,653 | 3,271,608 | 2,700,794 | 40,056 | - | 2,247 | 1,432,714 | |
| Valuation Inputs at Reporting Date: | ||||
Description (Amounts in thousands) | Total ($) | Level 1 ($) | Level 2 ($) | Level 3 ($) |
Investments in Securities: | ||||
| Equities: | ||||
Communication Services | 10,678 | - | - | 10,678 |
Consumer Discretionary | 8,658 | - | - | 8,658 |
Energy | 120,152 | 120,019 | - | 133 |
Financials | 45,865 | - | - | 45,865 |
Industrials | 2,991 | - | - | 2,991 |
Information Technology | 3,370 | - | - | 3,370 |
Utilities | 20,659 | - | - | 20,659 |
| Bank Loan Obligations | 10,451,968 | - | 10,326,844 | 125,124 |
| Corporate Bonds | 593,039 | - | 587,035 | 6,004 |
| Preferred Securities | 98,692 | - | 98,692 | - |
| Other | 94,881 | - | 94,881 | - |
| Money Market Funds | 1,337,833 | 1,337,833 | - | - |
| Total Investments in Securities: | 12,788,786 | 1,457,852 | 11,107,452 | 223,482 |
| Net Unrealized Appreciation on Unfunded Commitments | 87 | - | 87 | - |
| Total | 87 | - | 87 | - |
| (Amounts in thousands) | |||
| Investments in Securities: | |||
| Bank Loan Obligations | |||
| Beginning Balance | $ | 324,271 | |
| Net Realized Gain (Loss) on Investment Securities | 152 | ||
| Net Unrealized Gain (Loss) on Investment Securities | 1,417 | ||
| Cost of Purchases | 44,462 | ||
| Proceeds of Sales | (37,809) | ||
| Amortization/Accretion | 428 | ||
| Transfers into Level 3 | 19,174 | ||
| Transfers out of Level 3 | (226,971) | ||
| Ending Balance | $ | 125,124 | |
| The change in unrealized gain (loss) for the period attributable to Level 3 securities held at October 31, 2023 | $ | 1,050 | |
| Other Investments in Securities | |||
| Beginning Balance | $ | 88,093 | |
| Net Realized Gain (Loss) on Investment Securities | (69) | ||
| Net Unrealized Gain (Loss) on Investment Securities | (23,637) | ||
| Cost of Purchases | 37,395 | ||
| Proceeds of Sales | (3,424) | ||
| Amortization/Accretion | - | ||
| Transfers into Level 3 | - | ||
| Transfers out of Level 3 | - | ||
| Ending Balance | $ | 98,358 | |
| The change in unrealized gain (loss) for the period attributable to Level 3 securities held at October 31, 2023 | $ | (24,061) | |
| The information used in the above reconciliation represents fiscal year to date activity for any Investments in Securities identified as using Level 3 inputs at either the beginning or the end of the current fiscal period. Cost of purchases and proceeds of sales may include securities received and/or delivered through in-kind transactions, corporate actions or exchanges. Transfers into Level 3 were attributable to a lack of observable market data resulting from decreases in market activity, decreases in liquidity, security restructurings or corporate actions. Transfers out of Level 3 were attributable to observable market data becoming available for those securities. Transfers in or out of Level 3 represent the beginning value of any Security or Instrument where a change in the pricing level occurred from the beginning to the end of the period. Realized and unrealized gains (losses) disclosed in the reconciliation are included in Net Gain (Loss) on the Fund's Statement of Operations. | |||
| Statement of Assets and Liabilities | ||||
| Amounts in thousands (except per-share amounts) | October 31, 2023 | |||
| Assets | ||||
| Investment in securities, at value (including securities loaned of $50,546) - See accompanying schedule: | ||||
Unaffiliated issuers (cost $11,705,327) | $ | 11,356,072 | ||
Fidelity Central Funds (cost $1,430,923) | 1,432,714 | |||
| Total Investment in Securities (cost $13,136,250) | $ | 12,788,786 | ||
| Cash | 16,651 | |||
| Receivable for investments sold | 61,841 | |||
| Unrealized appreciation on unfunded commitments | 87 | |||
| Receivable for fund shares sold | 58,479 | |||
| Interest receivable | 58,685 | |||
| Distributions receivable from Fidelity Central Funds | 4,844 | |||
| Prepaid expenses | 15 | |||
| Other receivables | 217 | |||
Total assets | 12,989,605 | |||
| Liabilities | ||||
| Payable for investments purchased | $ | 577,973 | ||
| Payable for fund shares redeemed | 28,264 | |||
| Distributions payable | 16,341 | |||
| Accrued management fee | 5,411 | |||
| Distribution and service plan fees payable | 233 | |||
| Other affiliated payables | 1,134 | |||
| Other payables and accrued expenses | 326 | |||
| Collateral on securities loaned | 51,380 | |||
| Total Liabilities | 681,062 | |||
| Commitments and contingent liabilities (see Commitments note) | ||||
| Net Assets | $ | 12,308,543 | ||
| Net Assets consist of: | ||||
| Paid in capital | $ | 13,745,977 | ||
| Total accumulated earnings (loss) | (1,437,434) | |||
| Net Assets | $ | 12,308,543 | ||
| Net Asset Value and Maximum Offering Price | ||||
| Class A : | ||||
Net Asset Value and redemption price per share ($601,482 ÷ 65,568 shares)(a) | $ | 9.17 | ||
| Maximum offering price per share (100/97.25 of $9.17) | $ | 9.43 | ||
| Class M : | ||||
Net Asset Value and redemption price per share ($86,390 ÷ 9,430 shares)(a) | $ | 9.16 | ||
| Maximum offering price per share (100/97.25 of $9.16) | $ | 9.42 | ||
| Class C : | ||||
Net Asset Value and offering price per share ($109,760 ÷ 11,967 shares)(a) | $ | 9.17 | ||
| Fidelity Floating Rate High Income Fund : | ||||
Net Asset Value, offering price and redemption price per share ($7,026,215 ÷ 766,932 shares) | $ | 9.16 | ||
| Class I : | ||||
Net Asset Value, offering price and redemption price per share ($1,971,623 ÷ 215,394 shares) | $ | 9.15 | ||
| Class Z : | ||||
Net Asset Value, offering price and redemption price per share ($2,513,073 ÷ 274,408 shares) | $ | 9.16 | ||
(a)Redemption price per share is equal to net asset value less any applicable contingent deferred sales charge. | ||||
| Statement of Operations | ||||
| Amounts in thousands | Year ended October 31, 2023 | |||
| Investment Income | ||||
| Dividends | $ | 9,742 | ||
| Interest | 993,590 | |||
| Income from Fidelity Central Funds (including $26 from security lending) | 40,056 | |||
| Total Income | 1,043,388 | |||
| Expenses | ||||
| Management fee | $ | 63,974 | ||
| Transfer agent fees | 11,909 | |||
| Distribution and service plan fees | 2,758 | |||
| Accounting fees | 1,571 | |||
| Custodian fees and expenses | 107 | |||
| Independent trustees' fees and expenses | 67 | |||
| Registration fees | 365 | |||
| Audit | 97 | |||
| Legal | 14 | |||
| Miscellaneous | 58 | |||
| Total expenses before reductions | 80,920 | |||
| Expense reductions | (673) | |||
| Total expenses after reductions | 80,247 | |||
| Net Investment income (loss) | 963,141 | |||
| Realized and Unrealized Gain (Loss) | ||||
| Net realized gain (loss) on: | ||||
| Investment Securities: | ||||
| Unaffiliated issuers | (56,353) | |||
| Total net realized gain (loss) | (56,353) | |||
| Change in net unrealized appreciation (depreciation) on: | ||||
| Investment Securities: | ||||
| Unaffiliated issuers | 301,277 | |||
| Affiliated issuers | 2,247 | |||
| Unfunded commitments | 87 | |||
| Total change in net unrealized appreciation (depreciation) | 303,611 | |||
| Net gain (loss) | 247,258 | |||
| Net increase (decrease) in net assets resulting from operations | $ | 1,210,399 | ||
| Statement of Changes in Net Assets | ||||
| Amount in thousands | Year ended October 31, 2023 | Year ended October 31, 2022 | ||
| Increase (Decrease) in Net Assets | ||||
| Operations | ||||
| Net investment income (loss) | $ | 963,141 | $ | 531,439 |
| Net realized gain (loss) | (56,353) | (66,166) | ||
| Change in net unrealized appreciation (depreciation) | 303,611 | (722,663) | ||
| Net increase (decrease) in net assets resulting from operations | 1,210,399 | (257,390) | ||
| Distributions to shareholders | (961,832) | (524,936) | ||
| Share transactions - net increase (decrease) | 31,517 | 2,079,697 | ||
| Total increase (decrease) in net assets | 280,084 | 1,297,371 | ||
| Net Assets | ||||
| Beginning of period | 12,028,459 | 10,731,088 | ||
| End of period | $ | 12,308,543 | $ | 12,028,459 |
| Fidelity Advisor® Floating Rate High Income Fund Class A |
| Years ended October 31, | 2023 | 2022 | 2021 | 2020 | 2019 | |||||
Selected Per-Share Data | ||||||||||
| Net asset value, beginning of period | $ | 8.98 | $ | 9.53 | $ | 8.98 | $ | 9.39 | $ | 9.61 |
| Income from Investment Operations | ||||||||||
Net investment income (loss) A,B | .727 | .370 | .298 | .362 | .461 | |||||
| Net realized and unrealized gain (loss) | .190 | (.556) | .525 | (.411) | (.216) | |||||
| Total from investment operations | .917 | (.186) | .823 | (.049) | .245 | |||||
| Distributions from net investment income | (.727) | (.364) | (.273) | (.361) | (.465) | |||||
| Total distributions | (.727) | (.364) | (.273) | (.361) | (.465) | |||||
| Net asset value, end of period | $ | 9.17 | $ | 8.98 | $ | 9.53 | $ | 8.98 | $ | 9.39 |
Total Return C,D | 10.55% | (1.96)% | 9.24% | (.45)% | 2.63% | |||||
Ratios to Average Net Assets B,E,F | ||||||||||
| Expenses before reductions | .97% | .97% | .98% | .98% | .98% | |||||
| Expenses net of fee waivers, if any | .96% | .97% | .98% | .98% | .98% | |||||
| Expenses net of all reductions | .96% | .97% | .97% | .98% | .98% | |||||
| Net investment income (loss) | 7.96% | 4.00% | 3.18% | 4.01% | 4.86% | |||||
| Supplemental Data | ||||||||||
| Net assets, end of period (in millions) | $ | 601 | $ | 575 | $ | 523 | $ | 411 | $ | 546 |
Portfolio turnover rate G | 35% | 27% | 31% | 37% | 22% |
| Fidelity Advisor® Floating Rate High Income Fund Class M |
| Years ended October 31, | 2023 | 2022 | 2021 | 2020 | 2019 | |||||
Selected Per-Share Data | ||||||||||
| Net asset value, beginning of period | $ | 8.96 | $ | 9.51 | $ | 8.97 | $ | 9.38 | $ | 9.59 |
| Income from Investment Operations | ||||||||||
Net investment income (loss) A,B | .728 | .369 | .297 | .361 | .460 | |||||
| Net realized and unrealized gain (loss) | .200 | (.555) | .514 | (.411) | (.206) | |||||
| Total from investment operations | .928 | (.186) | .811 | (.050) | .254 | |||||
| Distributions from net investment income | (.728) | (.364) | (.271) | (.360) | (.464) | |||||
| Total distributions | (.728) | (.364) | (.271) | (.360) | (.464) | |||||
| Net asset value, end of period | $ | 9.16 | $ | 8.96 | $ | 9.51 | $ | 8.97 | $ | 9.38 |
Total Return C,D | 10.69% | (1.97)% | 9.12% | (.46)% | 2.72% | |||||
Ratios to Average Net Assets B,E,F | ||||||||||
| Expenses before reductions | .95% | .97% | .99% | 1.00% | .99% | |||||
| Expenses net of fee waivers, if any | .95% | .96% | .99% | 1.00% | .99% | |||||
| Expenses net of all reductions | .95% | .96% | .99% | .99% | .99% | |||||
| Net investment income (loss) | 7.98% | 4.00% | 3.16% | 4.00% | 4.86% | |||||
| Supplemental Data | ||||||||||
| Net assets, end of period (in millions) | $ | 86 | $ | 87 | $ | 65 | $ | 58 | $ | 84 |
Portfolio turnover rate G | 35% | 27% | 31% | 37% | 22% |
| Fidelity Advisor® Floating Rate High Income Fund Class C |
| Years ended October 31, | 2023 | 2022 | 2021 | 2020 | 2019 | |||||
Selected Per-Share Data | ||||||||||
| Net asset value, beginning of period | $ | 8.97 | $ | 9.53 | $ | 8.98 | $ | 9.39 | $ | 9.61 |
| Income from Investment Operations | ||||||||||
Net investment income (loss) A,B | .659 | .300 | .228 | .295 | .392 | |||||
| Net realized and unrealized gain (loss) | .199 | (.565) | .524 | (.411) | (.218) | |||||
| Total from investment operations | .858 | (.265) | .752 | (.116) | .174 | |||||
| Distributions from net investment income | (.658) | (.295) | (.202) | (.294) | (.394) | |||||
| Total distributions | (.658) | (.295) | (.202) | (.294) | (.394) | |||||
| Net asset value, end of period | $ | 9.17 | $ | 8.97 | $ | 9.53 | $ | 8.98 | $ | 9.39 |
Total Return C,D | 9.84% | (2.81)% | 8.42% | (1.19)% | 1.86% | |||||
Ratios to Average Net Assets B,E,F | ||||||||||
| Expenses before reductions | 1.72% | 1.72% | 1.73% | 1.74% | 1.73% | |||||
| Expenses net of fee waivers, if any | 1.71% | 1.72% | 1.73% | 1.74% | 1.73% | |||||
| Expenses net of all reductions | 1.71% | 1.72% | 1.73% | 1.74% | 1.73% | |||||
| Net investment income (loss) | 7.21% | 3.24% | 2.42% | 3.26% | 4.11% | |||||
| Supplemental Data | ||||||||||
| Net assets, end of period (in millions) | $ | 110 | $ | 114 | $ | 109 | $ | 156 | $ | 261 |
Portfolio turnover rate G | 35% | 27% | 31% | 37% | 22% |
| Fidelity® Floating Rate High Income Fund |
| Years ended October 31, | 2023 | 2022 | 2021 | 2020 | 2019 | |||||
Selected Per-Share Data | ||||||||||
| Net asset value, beginning of period | $ | 8.96 | $ | 9.52 | $ | 8.97 | $ | 9.38 | $ | 9.60 |
| Income from Investment Operations | ||||||||||
Net investment income (loss) A,B | .753 | .397 | .326 | .391 | .490 | |||||
| Net realized and unrealized gain (loss) | .200 | (.566) | .525 | (.413) | (.218) | |||||
| Total from investment operations | .953 | (.169) | .851 | (.022) | .272 | |||||
| Distributions from net investment income | (.753) | (.391) | (.301) | (.388) | (.492) | |||||
| Total distributions | (.753) | (.391) | (.301) | (.388) | (.492) | |||||
| Net asset value, end of period | $ | 9.16 | $ | 8.96 | $ | 9.52 | $ | 8.97 | $ | 9.38 |
Total Return C | 10.99% | (1.79)% | 9.58% | (.15)% | 2.93% | |||||
Ratios to Average Net Assets B,D,E | ||||||||||
| Expenses before reductions | .67% | .68% | .67% | .68% | .68% | |||||
| Expenses net of fee waivers, if any | .67% | .68% | .67% | .68% | .68% | |||||
| Expenses net of all reductions | .67% | .68% | .67% | .68% | .68% | |||||
| Net investment income (loss) | 8.26% | 4.29% | 3.48% | 4.32% | 5.16% | |||||
| Supplemental Data | ||||||||||
| Net assets, end of period (in millions) | $ | 7,026 | $ | 6,461 | $ | 6,419 | $ | 4,640 | $ | 7,130 |
Portfolio turnover rate F | 35% | 27% | 31% | 37% | 22% |
| Fidelity Advisor® Floating Rate High Income Fund Class I |
| Years ended October 31, | 2023 | 2022 | 2021 | 2020 | 2019 | |||||
Selected Per-Share Data | ||||||||||
| Net asset value, beginning of period | $ | 8.96 | $ | 9.51 | $ | 8.96 | $ | 9.37 | $ | 9.59 |
| Income from Investment Operations | ||||||||||
Net investment income (loss) A,B | .750 | .391 | .321 | .388 | .486 | |||||
| Net realized and unrealized gain (loss) | .190 | (.554) | .525 | (.414) | (.218) | |||||
| Total from investment operations | .940 | (.163) | .846 | (.026) | .268 | |||||
| Distributions from net investment income | (.750) | (.387) | (.296) | (.384) | (.488) | |||||
| Total distributions | (.750) | (.387) | (.296) | (.384) | (.488) | |||||
| Net asset value, end of period | $ | 9.15 | $ | 8.96 | $ | 9.51 | $ | 8.96 | $ | 9.37 |
Total Return C | 10.84% | (1.73)% | 9.54% | (.20)% | 2.88% | |||||
Ratios to Average Net Assets B,D,E | ||||||||||
| Expenses before reductions | .70% | .72% | .72% | .73% | .74% | |||||
| Expenses net of fee waivers, if any | .70% | .72% | .72% | .72% | .74% | |||||
| Expenses net of all reductions | .70% | .72% | .72% | .72% | .73% | |||||
| Net investment income (loss) | 8.23% | 4.25% | 3.43% | 4.27% | 5.11% | |||||
| Supplemental Data | ||||||||||
| Net assets, end of period (in millions) | $ | 1,972 | $ | 1,993 | $ | 1,167 | $ | 681 | $ | 1,190 |
Portfolio turnover rate F | 35% | 27% | 31% | 37% | 22% |
| Fidelity Advisor® Floating Rate High Income Fund Class Z |
| Years ended October 31, | 2023 | 2022 | 2021 | 2020 | 2019 | |||||
Selected Per-Share Data | ||||||||||
| Net asset value, beginning of period | $ | 8.96 | $ | 9.51 | $ | 8.97 | $ | 9.37 | $ | 9.59 |
| Income from Investment Operations | ||||||||||
Net investment income (loss) A,B | .759 | .401 | .329 | .388 | .484 | |||||
| Net realized and unrealized gain (loss) | .198 | (.555) | .516 | (.396) | (.207) | |||||
| Total from investment operations | .957 | (.154) | .845 | (.008) | .277 | |||||
| Distributions from net investment income | (.757) | (.396) | (.305) | (.392) | (.497) | |||||
| Total distributions | (.757) | (.396) | (.305) | (.392) | (.497) | |||||
| Net asset value, end of period | $ | 9.16 | $ | 8.96 | $ | 9.51 | $ | 8.97 | $ | 9.37 |
Total Return C,D | 11.05% | (1.63)% | 9.52% | .01% | 2.98% | |||||
Ratios to Average Net Assets B,E,F | ||||||||||
| Expenses before reductions | .62% | .62% | .62% | .63% | .63% | |||||
| Expenses net of fee waivers, if any | .61% | .62% | .62% | .63% | .62% | |||||
| Expenses net of all reductions | .61% | .62% | .62% | .63% | .62% | |||||
| Net investment income (loss) | 8.31% | 4.35% | 3.53% | 4.37% | 5.22% | |||||
| Supplemental Data | ||||||||||
| Net assets, end of period (in millions) | $ | 2,513 | $ | 2,798 | $ | 2,449 | $ | 641 | $ | 439 |
Portfolio turnover rate G | 35% | 27% | 31% | 37% | 22% |
| Fidelity Central Fund | Investment Manager | Investment Objective | Investment Practices | Expense RatioA |
| Fidelity Money Market Central Funds | Fidelity Management & Research Company LLC (FMR) | Each fund seeks to obtain a high level of current income consistent with the preservation of capital and liquidity. | Short-term Investments | Less than .005% |
| Asset Type | Fair Value | Valuation Technique(s) | Unobservable Input | Amount or Range/Weighted Average | Impact to Valuation from an Increase in InputA |
| Equities | $92,354 | Market comparable | Enterprise value/EBITDA multiple (EV/EBITDA) | 2.1 - 9.0 / 3.7 | Increase |
| Capacity multiple ($/kW) | $238.00 | Increase | |||
| Market approach | Transaction price | $2.92 | Increase | ||
| Recovery value | Recovery value | $0.00 | Increase | ||
| Discounted cash flow | Discount rate | 13.5% | Decrease | ||
| Black scholes | Discount rate | 5.1% - 5.4% / 5.4% | Increase | ||
| Volatility | 32.5% - 42.5% / 32.6% | Increase | |||
| Term | 1.3 - 2.0 / 1.3 | Increase | |||
| Corporate Bonds | $6,004 | Discounted cash flow | Yield | 11.1% | Decrease |
| Bank Loan Obligations | $125,124 | Market comparable | Enterprise value/EBITDA multiple (EV/EBITDA) | 2.5 | Increase |
| Indicative market price | Evaluated bid | $70.00 - $97.00 / $94.72 | Increase | ||
| Discounted cash flow | Yield | 9.4% - 16.2% / 12.9% | Decrease | ||
| Fidelity Advisor Floating Rate High Income Fund | $217 |
| Gross unrealized appreciation | $211,314 |
| Gross unrealized depreciation | (525,653) |
| Net unrealized appreciation (depreciation) | $(314,339) |
| Tax Cost | $13,103,212 |
| Capital loss carryforward | $(1,118,660) |
| Net unrealized appreciation (depreciation) on securities and other investments | $(314,339) |
| Short-term | $(63,873) |
| Long-term | (1,054,787) |
| Total Capital loss carryforward | $(1,118,660) |
| October 31, 2023 | October 31, 2022 | |
| Ordinary Income | $961,832 | $524,936 |
| Investment to be Acquired | Commitment Amount | Unrealized Appreciation (Depreciation) | |
| Fidelity Advisor Floating Rate High Income Fund | Fidelity Private Credit Central Fund LLC | $19,426 | $- |
| Fidelity Advisor Floating Rate High Income Fund | WH Borrower LLC | $9,520 | $87 |
| Purchases ($) | Sales ($) | |
| Fidelity Advisor Floating Rate High Income Fund | 3,901,613 | 3,882,401 |
| Distribution Fee | Service Fee | Total Fees | Retained by FDC | |
| Class A | - % | .25% | $1,413 | $92 |
| Class M | - % | .25% | 221 | 2 |
| Class C | .75% | .25% | 1,124 | 211 |
| $2,758 | $305 |
| Retained by FDC | |
| Class A | $44 |
| Class M | 4 |
Class C A | 4 |
| $52 |
| Amount | % of Class-Level Average Net Assets | |
| Class A | $ 840 | .15 |
| Class M | 119 | .13 |
| Class C | 168 | .15 |
| Fidelity Floating Rate High Income Fund | 6,828 | .11 |
| Class I | 2,649 | .14 |
| Class Z | 1,305 | .05 |
| $11,909 |
| % of Class-Level Average Net Assets | |
| Class A | 0.1483% |
| Class M | 0.1367% |
| Class C | 0.1492% |
| Fidelity Floating Rate High Income Fund | 0.1064% |
| Class I | 0.1372% |
| % of Average Net Assets | |
| Fidelity Advisor Floating Rate High Income Fund | .01 |
% of Average Net Assets | |
| Fidelity Advisor Floating Rate High Income Fund | 0.0137% |
| Amount | |
| Fidelity Advisor Floating Rate High Income Fund | $-A |
| Amount | |
| Fidelity Advisor Floating Rate High Income Fund | $21 |
| Total Security Lending Fees Paid to NFS | Security Lending Income From Securities Loaned to NFS | Value of Securities Loaned to NFS at Period End | |
| Fidelity Advisor Floating Rate High Income Fund | $3 | $- | $- |
Year ended October 31, 2023 | Year ended October 31, 2022 | |
| Fidelity Advisor Floating Rate High Income Fund | ||
| Distributions to shareholders | ||
| Class A | $44,976 | $22,865 |
| Class M | 7,043 | 3,069 |
| Class C | 8,076 | 3,751 |
| Fidelity Floating Rate High Income Fund | 526,804 | 297,596 |
| Class I | 158,730 | 73,070 |
| Class Z | 216,203 | 124,585 |
Total | $961,832 | $524,936 |
| Shares | Shares | Dollars | Dollars | |
Year ended October 31, 2023 | Year ended October 31, 2022 | Year ended October 31, 2023 | Year ended October 31, 2022 | |
| Fidelity Advisor Floating Rate High Income Fund | ||||
| Class A | ||||
| Shares sold | 20,522 | 24,973 | $187,909 | $233,302 |
| Reinvestment of distributions | 4,454 | 2,269 | 40,696 | 20,808 |
| Shares redeemed | (23,477) | (18,077) | (214,086) | (166,482) |
| Net increase (decrease) | 1,499 | 9,165 | $14,519 | $87,628 |
| Class M | ||||
| Shares sold | 2,976 | 4,348 | $27,078 | $40,355 |
| Reinvestment of distributions | 755 | 328 | 6,886 | 3,001 |
| Shares redeemed | (4,009) | (1,775) | (36,464) | (16,397) |
| Net increase (decrease) | (278) | 2,901 | $(2,500) | $26,959 |
| Class C | ||||
| Shares sold | 4,587 | 6,502 | $41,782 | $60,564 |
| Reinvestment of distributions | 823 | 381 | 7,523 | 3,493 |
| Shares redeemed | (6,105) | (5,635) | (55,688) | (51,828) |
| Net increase (decrease) | (695) | 1,248 | $(6,383) | $12,229 |
| Fidelity Floating Rate High Income Fund | ||||
| Shares sold | 282,875 | 372,901 | $2,586,129 | $3,487,680 |
| Reinvestment of distributions | 48,217 | 27,676 | 440,050 | 253,809 |
| Shares redeemed | (284,925) | (354,339) | (2,593,072) | (3,260,200) |
| Net increase (decrease) | 46,167 | 46,238 | $433,107 | $481,289 |
| Class I | ||||
| Shares sold | 113,232 | 221,155 | $1,032,650 | $2,044,293 |
| Reinvestment of distributions | 13,504 | 6,854 | 123,082 | 62,584 |
| Shares redeemed | (133,919) | (128,170) | (1,218,642) | (1,166,911) |
| Net increase (decrease) | (7,183) | 99,839 | $(62,910) | $939,966 |
| Class Z | ||||
| Shares sold | 66,053 | 152,120 | $601,643 | $1,420,399 |
| Reinvestment of distributions | 18,534 | 10,907 | 169,022 | 99,897 |
| Shares redeemed | (122,461) | (108,199) | (1,114,981) | (988,670) |
| Net increase (decrease) | (37,874) | 54,828 | $(344,316) | $531,626 |
| The Example is based on an investment of $1,000 invested at the beginning of the period and held for the entire period (May 1, 2023 to October 31, 2023). |
Annualized Expense Ratio- A | Beginning Account Value May 1, 2023 | Ending Account Value October 31, 2023 | Expenses Paid During Period- C May 1, 2023 to October 31, 2023 | |||||||
| Fidelity Advisor® Floating Rate High Income Fund | ||||||||||
| Class A | .95% | |||||||||
| Actual | $ 1,000 | $ 1,047.50 | $ 4.90 | |||||||
Hypothetical-B | $ 1,000 | $ 1,020.42 | $ 4.84 | |||||||
| Class M | .94% | |||||||||
| Actual | $ 1,000 | $ 1,047.60 | $ 4.85 | |||||||
Hypothetical-B | $ 1,000 | $ 1,020.47 | $ 4.79 | |||||||
| Class C | 1.69% | |||||||||
| Actual | $ 1,000 | $ 1,043.60 | $ 8.71 | |||||||
Hypothetical-B | $ 1,000 | $ 1,016.69 | $ 8.59 | |||||||
| Fidelity® Floating Rate High Income Fund | .66% | |||||||||
| Actual | $ 1,000 | $ 1,049.00 | $ 3.41 | |||||||
Hypothetical-B | $ 1,000 | $ 1,021.88 | $ 3.36 | |||||||
| Class I | .69% | |||||||||
| Actual | $ 1,000 | $ 1,048.90 | $ 3.56 | |||||||
Hypothetical-B | $ 1,000 | $ 1,021.73 | $ 3.52 | |||||||
| Class Z | .60% | |||||||||
| Actual | $ 1,000 | $ 1,049.30 | $ 3.10 | |||||||
Hypothetical-B | $ 1,000 | $ 1,022.18 | $ 3.06 | |||||||
 |


Contents
| Average Annual Total Returns | |||
Periods ended October 31, 2023 | Past 1 year | Past 5 years | Past 10 years |
Class A (incl. 4.00% sales charge) | 0.96% | 3.84% | 4.51% |
Class M (incl. 4.00% sales charge) | 0.96% | 3.84% | 4.52% |
Class C (incl. contingent deferred sales charge) | 3.31% | 3.88% | 4.31% |
| Class I | 5.35% | 4.94% | 5.19% |
| Class Z | 5.45% | 5.04% | 5.24% |
| $10,000 Over 10 Years |
Let's say hypothetically that $10,000 was invested in Fidelity Advisor® High Income Advantage Fund - Class A, a class of the fund, on October 31, 2013, and the current 4.00% sales charge was paid. The chart shows how the value of your investment would have changed, and also shows how the ICE® BofA® US High Yield Constrained Index performed over the same period. |
 |
| Top Bond Issuers (% of Fund's net assets) | ||
(with maturities greater than one year) | ||
| TransDigm, Inc. | 3.2 | |
| JPMorgan Chase & Co. | 2.1 | |
| CCO Holdings LLC/CCO Holdings Capital Corp. | 2.0 | |
| Citigroup, Inc. | 1.8 | |
| Tenet Healthcare Corp. | 1.5 | |
| Bank of America Corp. | 1.4 | |
| Energy Transfer LP | 1.3 | |
| Caesars Entertainment, Inc. | 1.1 | |
| Crestwood Midstream Partners LP/Crestwood Midstream Finance Corp. | 1.0 | |
| Ally Financial, Inc. | 1.0 | |
| 16.4 | ||
| Market Sectors (% of Fund's net assets) | ||
| Energy | 11.3 | |
| Banks & Thrifts | 10.9 | |
| Technology | 10.8 | |
| Services | 5.1 | |
| Healthcare | 4.8 | |
Quality Diversification (% of Fund's net assets) |
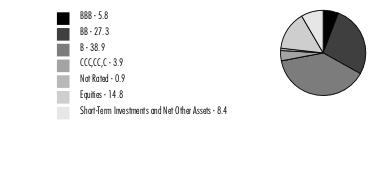 |
| We have used ratings from Moody's Investors Service, Inc. Where Moody's® ratings are not available, we have used S&P® ratings. All ratings are as of the date indicated and do not reflect subsequent changes. |
Asset Allocation (% of Fund's net assets) |
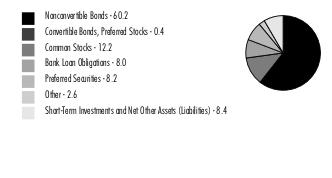 |
| Corporate Bonds - 60.6% | |||
Principal Amount (a) (000s) | Value ($) (000s) | ||
| Convertible Bonds - 0.4% | |||
| Broadcasting - 0.2% | |||
| DISH Network Corp. 3.375% 8/15/26 | 7,730 | 3,962 | |
| Diversified Financial Services - 0.2% | |||
| New Cotai LLC 5% 2/24/27 (b) | 1,789 | 2,749 | |
TOTAL CONVERTIBLE BONDS | 6,711 | ||
| Nonconvertible Bonds - 60.2% | |||
| Aerospace - 4.0% | |||
| ATI, Inc.: | |||
| 4.875% 10/1/29 | 845 | 720 | |
| 5.125% 10/1/31 | 750 | 619 | |
| 7.25% 8/15/30 | 975 | 939 | |
| Bombardier, Inc.: | |||
| 6% 2/15/28 (c) | 830 | 734 | |
| 7.125% 6/15/26 (c) | 1,625 | 1,564 | |
| 7.875% 4/15/27 (c) | 3,970 | 3,820 | |
| Kaiser Aluminum Corp. 4.625% 3/1/28 (c) | 1,575 | 1,312 | |
| Moog, Inc. 4.25% 12/15/27 (c) | 480 | 427 | |
| Rolls-Royce PLC 5.75% 10/15/27 (c) | 1,440 | 1,365 | |
| TransDigm, Inc.: | |||
| 4.625% 1/15/29 | 4,860 | 4,190 | |
| 4.875% 5/1/29 | 15,000 | 12,996 | |
| 5.5% 11/15/27 | 14,675 | 13,629 | |
| 6.25% 3/15/26 (c) | 6,870 | 6,708 | |
| 6.75% 8/15/28 (c) | 8,160 | 7,923 | |
| 6.875% 12/15/30 (c) | 7,770 | 7,502 | |
| 7.5% 3/15/27 | 6,780 | 6,772 | |
| Triumph Group, Inc. 9% 3/15/28 (c) | 1,435 | 1,394 | |
| VistaJet Malta Finance PLC / XO Management Holding, Inc. 9.5% 6/1/28 (c) | 1,440 | 1,103 | |
| 73,717 | |||
| Air Transportation - 1.3% | |||
| Air Canada 3.875% 8/15/26 (c) | 1,240 | 1,128 | |
| Allegiant Travel Co. 7.25% 8/15/27 (c) | 1,320 | 1,195 | |
| American Airlines, Inc.: | |||
| 7.25% 2/15/28 (c) | 3,155 | 2,934 | |
| 11.75% 7/15/25 (c) | 2,105 | 2,230 | |
| American Airlines, Inc. / AAdvantage Loyalty IP Ltd. 5.75% 4/20/29 (c) | 4,820 | 4,348 | |
| Hawaiian Brand Intellectual Property Ltd. / HawaiianMiles Loyalty Ltd. 5.75% 1/20/26 (c) | 3,145 | 2,324 | |
| Rand Parent LLC 8.5% 2/15/30 (c) | 2,390 | 2,183 | |
| Spirit Loyalty Cayman Ltd. / Spirit IP Cayman Ltd.: | |||
| 8% 9/20/25 (c) | 470 | 371 | |
| 8% 9/20/25 (c) | 1,044 | 770 | |
| United Airlines, Inc.: | |||
| 4.375% 4/15/26 (c) | 3,965 | 3,678 | |
| 4.625% 4/15/29 (c) | 3,180 | 2,686 | |
| 23,847 | |||
| Automotive & Auto Parts - 1.7% | |||
| Adient Global Holdings Ltd. 7% 4/15/28 (c) | 960 | 945 | |
| Allison Transmission, Inc. 5.875% 6/1/29 (c) | 1,265 | 1,173 | |
| Arko Corp. 5.125% 11/15/29 (c) | 1,290 | 1,046 | |
| Clarios Global LP / Clarios U.S. Finance Co. 6.75% 5/15/28 (c) | 1,920 | 1,872 | |
| Dana, Inc.: | |||
| 4.25% 9/1/30 | 1,185 | 938 | |
| 4.5% 2/15/32 | 1,305 | 1,022 | |
| Ford Motor Credit Co. LLC: | |||
| 3.375% 11/13/25 | 2,500 | 2,333 | |
| 6.8% 5/12/28 | 4,500 | 4,487 | |
| 6.95% 6/10/26 | 1,915 | 1,920 | |
| 7.35% 11/4/27 | 3,800 | 3,846 | |
| LCM Investments Holdings 8.25% 8/1/31 (c) | 1,160 | 1,104 | |
| Macquarie AirFinance Holdings 8.125% 3/30/29 (c) | 1,475 | 1,453 | |
| McLaren Finance PLC 7.5% 8/1/26 (c) | 1,130 | 966 | |
| Nesco Holdings II, Inc. 5.5% 4/15/29 (c) | 1,850 | 1,586 | |
| Rivian Holdco & Rivian LLC & Rivian Automotive LLC 6 month U.S. LIBOR + 5.620% 11.4932% 10/15/26 (c)(d)(e) | 4,255 | 4,244 | |
| Tenneco, Inc. 8% 11/17/28 (c) | 2,915 | 2,339 | |
| 31,274 | |||
| Banks & Thrifts - 1.3% | |||
| Ally Financial, Inc.: | |||
| 8% 11/1/31 | 3,105 | 3,015 | |
| 8% 11/1/31 | 16,223 | 15,834 | |
| CQP Holdco LP / BIP-V Chinook Holdco LLC 5.5% 6/15/31 (c) | 4,245 | 3,692 | |
| Jane Street Group LLC/JSG Finance, Inc. 4.5% 11/15/29 (c) | 1,240 | 1,057 | |
| 23,598 | |||
| Broadcasting - 1.0% | |||
| DISH Network Corp. 11.75% 11/15/27 (c) | 6,645 | 6,582 | |
| Scripps Escrow II, Inc. 3.875% 1/15/29 (c) | 360 | 273 | |
| Sirius XM Radio, Inc.: | |||
| 3.875% 9/1/31 (c) | 1,655 | 1,247 | |
| 4% 7/15/28 (c) | 1,695 | 1,441 | |
| 5% 8/1/27 (c) | 1,575 | 1,444 | |
| Univision Communications, Inc.: | |||
| 4.5% 5/1/29 (c) | 1,610 | 1,280 | |
| 7.375% 6/30/30 (c) | 6,430 | 5,662 | |
| 17,929 | |||
| Building Materials - 0.3% | |||
| Advanced Drain Systems, Inc.: | |||
| 5% 9/30/27 (c) | 355 | 331 | |
| 6.375% 6/15/30 (c) | 890 | 840 | |
| Brundage-Bone Concrete Pumping Holdings, Inc. 6% 2/1/26 (c) | 835 | 790 | |
| MIWD Holdco II LLC / MIWD Finance Corp. 5.5% 2/1/30 (c) | 590 | 468 | |
| SRS Distribution, Inc.: | |||
| 4.625% 7/1/28 (c) | 1,540 | 1,343 | |
| 6.125% 7/1/29 (c) | 650 | 544 | |
| Summit Materials LLC/Summit Materials Finance Corp. 5.25% 1/15/29 (c) | 1,445 | 1,308 | |
| 5,624 | |||
| Cable/Satellite TV - 2.7% | |||
| CCO Holdings LLC/CCO Holdings Capital Corp.: | |||
| 4.25% 2/1/31 (c) | 2,275 | 1,770 | |
| 4.5% 5/1/32 | 16,160 | 12,370 | |
| 4.75% 3/1/30 (c) | 8,310 | 6,855 | |
| 4.75% 2/1/32 (c) | 3,745 | 2,923 | |
| 5% 2/1/28 (c) | 3,440 | 3,089 | |
| 5.125% 5/1/27 (c) | 8,920 | 8,213 | |
| 6.375% 9/1/29 (c) | 1,765 | 1,615 | |
| CSC Holdings LLC: | |||
| 5.375% 2/1/28 (c) | 3,695 | 2,942 | |
| 5.5% 4/15/27 (c) | 3,055 | 2,553 | |
| 6.5% 2/1/29 (c) | 65 | 51 | |
| DISH DBS Corp. 5.75% 12/1/28 (c) | 2,170 | 1,576 | |
| VZ Secured Financing BV 5% 1/15/32 (c) | 3,855 | 2,925 | |
| Ziggo BV 4.875% 1/15/30 (c) | 3,795 | 3,031 | |
| 49,913 | |||
| Capital Goods - 0.2% | |||
| ATS Corp. 4.125% 12/15/28 (c) | 1,015 | 872 | |
| Chart Industries, Inc. 7.5% 1/1/30 (c) | 2,500 | 2,455 | |
| 3,327 | |||
| Chemicals - 1.8% | |||
| Compass Minerals International, Inc. 6.75% 12/1/27 (c) | 3,850 | 3,627 | |
| Ingevity Corp. 3.875% 11/1/28 (c) | 1,515 | 1,230 | |
| LSB Industries, Inc. 6.25% 10/15/28 (c) | 3,360 | 2,981 | |
| Olin Corp. 5% 2/1/30 | 1,555 | 1,343 | |
| Olympus Water U.S. Holding Corp.: | |||
| 4.25% 10/1/28 (c) | 3,370 | 2,689 | |
| 7.125% 10/1/27 (c) | 1,070 | 985 | |
| 9.75% 11/15/28 (c) | 4,875 | 4,761 | |
| SCIH Salt Holdings, Inc. 4.875% 5/1/28 (c) | 1,035 | 894 | |
| SCIL IV LLC / SCIL U.S.A. Holdings LLC 5.375% 11/1/26 (c) | 1,985 | 1,761 | |
| The Chemours Co. LLC: | |||
| 4.625% 11/15/29 (c) | 575 | 444 | |
| 5.375% 5/15/27 | 4,500 | 4,065 | |
| 5.75% 11/15/28 (c) | 2,355 | 1,992 | |
| Tronox, Inc. 4.625% 3/15/29 (c) | 1,705 | 1,343 | |
| W.R. Grace Holding LLC: | |||
| 5.625% 8/15/29 (c) | 4,675 | 3,623 | |
| 7.375% 3/1/31 (c) | 950 | 880 | |
| 32,618 | |||
| Consumer Products - 1.1% | |||
| Angi Group LLC 3.875% 8/15/28 (c) | 750 | 562 | |
| Foundation Building Materials, Inc. 6% 3/1/29 (c) | 735 | 606 | |
| Gannett Holdings LLC 6% 11/1/26 (c) | 1,230 | 1,033 | |
| HFC Prestige Products, Inc./HFC Prestige International U.S. LLC 4.75% 1/15/29 (c) | 1,240 | 1,098 | |
| PetSmart, Inc. / PetSmart Finance Corp.: | |||
| 4.75% 2/15/28 (c) | 2,260 | 2,000 | |
| 7.75% 2/15/29 (c) | 2,540 | 2,338 | |
| Spectrum Brands Holdings, Inc. 3.875% 3/15/31 (c) | 1,080 | 864 | |
| Tempur Sealy International, Inc.: | |||
| 3.875% 10/15/31 (c) | 2,230 | 1,670 | |
| 4% 4/15/29 (c) | 2,545 | 2,088 | |
| The Scotts Miracle-Gro Co. 4% 4/1/31 | 1,530 | 1,138 | |
| TKC Holdings, Inc. 6.875% 5/15/28 (c) | 5,855 | 5,065 | |
| Windsor Holdings III, LLC 8.5% 6/15/30 (c) | 955 | 930 | |
| 19,392 | |||
| Containers - 0.7% | |||
| BWAY Holding Co. 7.875% 8/15/26 (c) | 1,895 | 1,775 | |
| Crown Americas LLC/Crown Americas Capital Corp. IV 4.75% 2/1/26 | 4,780 | 4,597 | |
| Crown Americas LLC/Crown Americas Capital Corp. V 4.25% 9/30/26 | 1,210 | 1,144 | |
| Graham Packaging Co., Inc. 7.125% 8/15/28 (c) | 825 | 632 | |
| Graphic Packaging International, Inc. 3.75% 2/1/30 (c) | 1,125 | 920 | |
| Intelligent Packaging Ltd. Finco, Inc. 6% 9/15/28 (c) | 570 | 467 | |
| LABL, Inc. 5.875% 11/1/28 (c) | 2,095 | 1,773 | |
| Sealed Air Corp./Sealed Air Cor 6.125% 2/1/28 (c) | 950 | 904 | |
| Trident Holdings, Inc. 12.75% 12/31/28 (c) | 950 | 971 | |
| 13,183 | |||
| Diversified Financial Services - 2.3% | |||
| Broadstreet Partners, Inc. 5.875% 4/15/29 (c) | 2,115 | 1,844 | |
| Cargo Aircraft Management, Inc. 4.75% 2/1/28 (c) | 965 | 849 | |
| Coinbase Global, Inc.: | |||
| 3.375% 10/1/28 (c) | 4,600 | 3,378 | |
| 3.625% 10/1/31 (c) | 2,715 | 1,846 | |
| Compass Group Diversified Holdings LLC: | |||
| 5% 1/15/32 (c) | 870 | 684 | |
| 5.25% 4/15/29 (c) | 2,270 | 1,938 | |
| Hightower Holding LLC 6.75% 4/15/29 (c) | 785 | 670 | |
| Icahn Enterprises LP/Icahn Enterprises Finance Corp.: | |||
| 4.375% 2/1/29 | 3,415 | 2,630 | |
| 5.25% 5/15/27 | 5,030 | 4,307 | |
| 6.25% 5/15/26 | 5,825 | 5,324 | |
| LPL Holdings, Inc. 4% 3/15/29 (c) | 2,520 | 2,167 | |
| MSCI, Inc.: | |||
| 3.25% 8/15/33 (c) | 1,245 | 921 | |
| 4% 11/15/29 (c) | 900 | 775 | |
| OneMain Finance Corp.: | |||
| 4% 9/15/30 | 720 | 527 | |
| 5.375% 11/15/29 | 9,325 | 7,667 | |
| 6.625% 1/15/28 | 1,185 | 1,078 | |
| 6.875% 3/15/25 | 775 | 765 | |
| 7.125% 3/15/26 | 4,710 | 4,574 | |
| Williams Scotsman, Inc. 7.375% 10/1/31 (c) | 985 | 969 | |
| 42,913 | |||
| Energy - 8.3% | |||
| Altus Midstream LP 5.875% 6/15/30 (c) | 1,335 | 1,225 | |
| Antero Midstream Partners LP/Antero Midstream Finance Corp.: | |||
| 5.375% 6/15/29 (c) | 1,205 | 1,094 | |
| 5.75% 3/1/27 (c) | 2,655 | 2,538 | |
| 5.75% 1/15/28 (c) | 1,705 | 1,598 | |
| Atlantica Sustainable Infrastructure PLC 4.125% 6/15/28 (c) | 1,045 | 902 | |
| Borr IHC Ltd. / Borr Finance Ltd.: | |||
| 10% 11/15/28 (c)(f) | 1,475 | 1,468 | |
| 10.375% 11/15/30 (c)(f) | 490 | 486 | |
| Callon Petroleum Co. 6.375% 7/1/26 | 1,080 | 1,055 | |
| Centennial Resource Production LLC 5.875% 7/1/29 (c) | 1,165 | 1,083 | |
| CGG SA 8.75% 4/1/27 (c) | 1,530 | 1,350 | |
| Chesapeake Energy Corp.: | |||
| 4.875% (b)(g) | 2,950 | 0 | |
| 5.75% (b)(g) | 1,890 | 0 | |
| 5.875% 2/1/29 (c) | 2,735 | 2,575 | |
| 6.75% 4/15/29 (c) | 1,150 | 1,125 | |
| 7% (b)(g) | 840 | 0 | |
| 8% (b)(g) | 300 | 0 | |
| 8% (b)(g) | 480 | 0 | |
| Citgo Petroleum Corp.: | |||
| 6.375% 6/15/26 (c) | 1,105 | 1,086 | |
| 7% 6/15/25 (c) | 3,035 | 2,982 | |
| 8.375% 1/15/29 (c) | 4,325 | 4,283 | |
| Civitas Resources, Inc. 8.625% 11/1/30 (c) | �� | 1,985 | 2,020 |
| CNX Midstream Partners LP 4.75% 4/15/30 (c) | 900 | 741 | |
| CNX Resources Corp.: | |||
| 6% 1/15/29 (c) | 690 | 633 | |
| 7.375% 1/15/31 (c) | 890 | 850 | |
| Comstock Resources, Inc.: | |||
| 5.875% 1/15/30 (c) | 4,426 | 3,784 | |
| 6.75% 3/1/29 (c) | 7,095 | 6,457 | |
| Crestwood Midstream Partners LP/Crestwood Midstream Finance Corp.: | |||
| 5.625% 5/1/27 (c) | 12,200 | 11,735 | |
| 6% 2/1/29 (c) | 8,530 | 8,253 | |
| CrownRock LP/CrownRock Finance, Inc. 5% 5/1/29 (c) | 665 | 627 | |
| CVR Energy, Inc.: | |||
| 5.25% 2/15/25 (c) | 3,075 | 3,016 | |
| 5.75% 2/15/28 (c) | 3,170 | 2,848 | |
| DCP Midstream Operating LP 8.125% 8/16/30 | 130 | 142 | |
| Delek Logistics Partners LP 7.125% 6/1/28 (c) | 2,645 | 2,407 | |
| Diamond Foreign Asset Co. / Diamond Finance, LLC 8.5% 10/1/30 (c) | 985 | 960 | |
| DT Midstream, Inc.: | |||
| 4.125% 6/15/29 (c) | 1,215 | 1,045 | |
| 4.375% 6/15/31 (c) | 1,215 | 1,009 | |
| Endeavor Energy Resources LP/EER Finance, Inc. 5.75% 1/30/28 (c) | 1,365 | 1,309 | |
| EnLink Midstream LLC: | |||
| 5.375% 6/1/29 | 650 | 595 | |
| 6.5% 9/1/30 (c) | 2,725 | 2,616 | |
| Hess Midstream Partners LP: | |||
| 4.25% 2/15/30 (c) | 1,345 | 1,151 | |
| 5.125% 6/15/28 (c) | 1,570 | 1,450 | |
| 5.5% 10/15/30 (c) | 890 | 808 | |
| 5.625% 2/15/26 (c) | 2,690 | 2,605 | |
| Hilcorp Energy I LP/Hilcorp Finance Co. 6.25% 11/1/28 (c) | 310 | 290 | |
| Holly Energy Partners LP/Holly Energy Finance Corp.: | |||
| 5% 2/1/28 (c) | 1,060 | 981 | |
| 6.375% 4/15/27 (c) | 890 | 862 | |
| Howard Midstream Energy Partners LLC 8.875% 7/15/28 (c) | 2,400 | 2,413 | |
| Jonah Energy Parent LLC 12% 11/5/25 (b)(h) | 1,621 | 1,664 | |
| KLX Energy Services Holdings, Inc. 11.5% 11/1/25 (c) | 2,300 | 2,273 | |
| Magnolia Oil & Gas Operating LLC 6% 8/1/26 (c) | 2,055 | 1,973 | |
| MEG Energy Corp. 7.125% 2/1/27 (c) | 1,580 | 1,591 | |
| Mesquite Energy, Inc. 7.25% (b)(c)(g) | 6,264 | 0 | |
| Nabors Industries Ltd.: | |||
| 7.25% 1/15/26 (c) | 1,580 | 1,484 | |
| 7.5% 1/15/28 (c) | 1,360 | 1,201 | |
| New Fortress Energy, Inc.: | |||
| 6.5% 9/30/26 (c) | 3,115 | 2,790 | |
| 6.75% 9/15/25 (c) | 3,630 | 3,368 | |
| NGL Energy Operating LLC/NGL Energy Finance Corp. 7.5% 2/1/26 (c) | 1,410 | 1,376 | |
| Noble Finance II LLC 8% 4/15/30 (c) | 960 | 959 | |
| Northern Oil & Gas, Inc.: | |||
| 8.125% 3/1/28 (c) | 990 | 978 | |
| 8.75% 6/15/31 (c) | 1,950 | 1,940 | |
| Occidental Petroleum Corp. 7.2% 3/15/29 | 545 | 556 | |
| PBF Holding Co. LLC/PBF Finance Corp.: | |||
| 6% 2/15/28 | 3,845 | 3,535 | |
| 7.875% 9/15/30 (c) | 1,460 | 1,415 | |
| Seadrill Finance Ltd. 8.375% 8/1/30 (c) | 1,925 | 1,926 | |
| Sitio Royalties OP / Sitio Finance Corp. 7.875% 11/1/28 (c) | 1,480 | 1,460 | |
| SM Energy Co.: | |||
| 5.625% 6/1/25 | 2,480 | 2,414 | |
| 6.625% 1/15/27 | 850 | 826 | |
| 6.75% 9/15/26 | 845 | 830 | |
| Southwestern Energy Co. 5.375% 3/15/30 | 1,665 | 1,527 | |
| Suburban Propane Partners LP/Suburban Energy Finance Corp. 5% 6/1/31 (c) | 1,610 | 1,334 | |
| Sunoco LP/Sunoco Finance Corp.: | |||
| 4.5% 5/15/29 | 1,320 | 1,143 | |
| 4.5% 4/30/30 | 1,710 | 1,461 | |
| 6% 4/15/27 | 4,740 | 4,564 | |
| 7% 9/15/28 (c) | 985 | 959 | |
| Tallgrass Energy Partners LP / Tallgrass Energy Finance Corp.: | |||
| 5.5% 1/15/28 (c) | 95 | 83 | |
| 6% 3/1/27 (c) | 950 | 869 | |
| 6% 9/1/31 (c) | 1,620 | 1,363 | |
| 7.5% 10/1/25 (c) | 1,120 | 1,103 | |
| Targa Resources Partners LP/Targa Resources Partners Finance Corp. 4.875% 2/1/31 | 1,405 | 1,239 | |
| Teine Energy Ltd. 6.875% 4/15/29 (c) | 1,145 | 1,061 | |
| Transocean Titan Finance Ltd. 8.375% 2/1/28 (c) | 1,977 | 1,983 | |
| Transocean, Inc.: | |||
| 7.5% 1/15/26 (c) | 480 | 460 | |
| 8% 2/1/27 (c) | 1,430 | 1,342 | |
| 8.75% 2/15/30 (c) | 4,475 | 4,461 | |
| 11.5% 1/30/27 (c) | 1,975 | 2,055 | |
| Valaris Ltd. 8.375% 4/30/30 (c) | 975 | 957 | |
| Venture Global Calcasieu Pass LLC: | |||
| 3.875% 8/15/29 (c) | 1,035 | 861 | |
| 4.125% 8/15/31 (c) | 1,035 | 832 | |
| 6.25% 1/15/30 (c) | 3,835 | 3,618 | |
| 154,291 | |||
| Environmental - 0.8% | |||
| Clean Harbors, Inc. 6.375% 2/1/31 (c) | 790 | 751 | |
| Covanta Holding Corp.: | |||
| 4.875% 12/1/29 (c) | 4,810 | 3,752 | |
| 5% 9/1/30 | 1,940 | 1,501 | |
| Darling Ingredients, Inc.: | |||
| 5.25% 4/15/27 (c) | 2,655 | 2,526 | |
| 6% 6/15/30 (c) | 2,040 | 1,914 | |
| GFL Environmental, Inc.: | |||
| 4% 8/1/28 (c) | 1,275 | 1,097 | |
| 4.75% 6/15/29 (c) | 1,625 | 1,423 | |
| Madison IAQ LLC: | |||
| 4.125% 6/30/28 (c) | 1,535 | 1,282 | |
| 5.875% 6/30/29 (c) | 1,225 | 949 | |
| 15,195 | |||
| Food & Drug Retail - 1.1% | |||
| Albertsons Companies LLC/Safeway, Inc./New Albertson's, Inc./Albertson's LLC: | |||
| 3.5% 3/15/29 (c) | 4,630 | 3,948 | |
| 4.625% 1/15/27 (c) | 4,225 | 3,960 | |
| 4.875% 2/15/30 (c) | 6,100 | 5,446 | |
| BellRing Brands, Inc. 7% 3/15/30 (c) | 2,425 | 2,355 | |
| Murphy Oil U.S.A., Inc. 3.75% 2/15/31 (c) | 675 | 542 | |
| Parkland Corp.: | |||
| 4.5% 10/1/29 (c) | 1,145 | 985 | |
| 4.625% 5/1/30 (c) | 1,735 | 1,479 | |
| SEG Holding LLC/SEG Finance Corp. 5.625% 10/15/28 (c) | 1,470 | 1,473 | |
| 20,188 | |||
| Food/Beverage/Tobacco - 1.2% | |||
| C&S Group Enterprises LLC 5% 12/15/28 (c) | 1,110 | 859 | |
| Chobani LLC/Finance Corp., Inc. 4.625% 11/15/28 (c) | 855 | 739 | |
| KeHE Distributors LLC / KeHE Finance Corp. 8.625% 10/15/26 (c) | 1,185 | 1,185 | |
| Lamb Weston Holdings, Inc.: | |||
| 4.125% 1/31/30 (c) | 1,720 | 1,459 | |
| 4.375% 1/31/32 (c) | 860 | 712 | |
| Performance Food Group, Inc.: | |||
| 4.25% 8/1/29 (c) | 1,160 | 979 | |
| 5.5% 10/15/27 (c) | 1,353 | 1,265 | |
| Post Holdings, Inc.: | |||
| 4.5% 9/15/31 (c) | 6,170 | 4,992 | |
| 4.625% 4/15/30 (c) | 2,050 | 1,717 | |
| 5.5% 12/15/29 (c) | 865 | 771 | |
| 5.625% 1/15/28 (c) | 3,640 | 3,383 | |
| Simmons Foods, Inc. 4.625% 3/1/29 (c) | 1,070 | 869 | |
| Triton Water Holdings, Inc. 6.25% 4/1/29 (c) | 810 | 668 | |
| U.S. Foods, Inc.: | |||
| 4.625% 6/1/30 (c) | 1,070 | 914 | |
| 7.25% 1/15/32 (c) | 985 | 967 | |
| United Natural Foods, Inc. 6.75% 10/15/28 (c) | 1,055 | 830 | |
| 22,309 | |||
| Gaming - 2.7% | |||
| Affinity Gaming LLC 6.875% 12/15/27 (c) | 550 | 448 | |
| Boyd Gaming Corp. 4.75% 6/15/31 (c) | 4,225 | 3,506 | |
| Caesars Entertainment, Inc.: | |||
| 4.625% 10/15/29 (c) | 660 | 542 | |
| 6.25% 7/1/25 (c) | 5,705 | 5,613 | |
| 7% 2/15/30 (c) | 2,845 | 2,746 | |
| 8.125% 7/1/27 (c) | 11,605 | 11,499 | |
| CDI Escrow Issuer, Inc. 5.75% 4/1/30 (c) | 2,330 | 2,082 | |
| Churchill Downs, Inc. 6.75% 5/1/31 (c) | 1,925 | 1,776 | |
| Fertitta Entertainment LLC / Fertitta Entertainment Finance Co., Inc.: | |||
| 4.625% 1/15/29 (c) | 4,710 | 3,958 | |
| 6.75% 1/15/30 (c) | 4,950 | 3,934 | |
| Jacobs Entertainment, Inc. 6.75% 2/15/29 (c) | 1,250 | 1,063 | |
| Melco Resorts Finance Ltd. 5.75% 7/21/28 (c) | 600 | 507 | |
| MGM Resorts International 4.75% 10/15/28 | 1,470 | 1,283 | |
| Ontario Gaming GTA LP 8% 8/1/30 (c) | 2,005 | 1,960 | |
| Premier Entertainment Sub LLC: | |||
| 5.625% 9/1/29 (c) | 2,410 | 1,695 | |
| 5.875% 9/1/31 (c) | 370 | 251 | |
| Scientific Games Corp. 7.5% 9/1/31 (c) | 970 | 947 | |
| Station Casinos LLC 4.625% 12/1/31 (c) | 1,300 | 1,026 | |
| Studio City Finance Ltd. 5% 1/15/29 (c) | 725 | 517 | |
| VICI Properties LP / VICI Note Co.: | |||
| 3.875% 2/15/29 (c) | 1,445 | 1,227 | |
| 4.25% 12/1/26 (c) | 3,015 | 2,783 | |
| 4.625% 12/1/29 (c) | 1,720 | 1,488 | |
| 50,851 | |||
| Healthcare - 4.0% | |||
| 180 Medical, Inc. 3.875% 10/15/29 (c) | 910 | 756 | |
| Avantor Funding, Inc. 3.875% 11/1/29 (c) | 860 | 720 | |
| Bausch & Lomb Escrow Corp. 8.375% 10/1/28 (c) | 1,970 | 1,957 | |
| Bausch Health Companies, Inc.: | |||
| 5.75% 8/15/27 (c) | 2,955 | 1,537 | |
| 6.125% 2/1/27 (c) | 1,970 | 1,099 | |
| Cano Health, Inc. 6.25% 10/1/28 (c) | 565 | 226 | |
| Charles River Laboratories International, Inc.: | |||
| 3.75% 3/15/29 (c) | 1,365 | 1,152 | |
| 4% 3/15/31 (c) | 1,545 | 1,261 | |
| 4.25% 5/1/28 (c) | 485 | 431 | |
| Community Health Systems, Inc.: | |||
| 4.75% 2/15/31 (c) | 2,860 | 1,917 | |
| 5.25% 5/15/30 (c) | 2,625 | 1,864 | |
| 6% 1/15/29 (c) | 1,085 | 822 | |
| 6.125% 4/1/30 (c) | 2,910 | 1,128 | |
| 8% 3/15/26 (c) | 9,530 | 8,711 | |
| DaVita HealthCare Partners, Inc.: | |||
| 3.75% 2/15/31 (c) | 535 | 385 | |
| 4.625% 6/1/30 (c) | 4,545 | 3,562 | |
| Encompass Health Corp. 5.75% 9/15/25 | 400 | 389 | |
| Grifols SA 4.75% 10/15/28 (c) | 850 | 712 | |
| HealthEquity, Inc. 4.5% 10/1/29 (c) | 895 | 767 | |
| Hologic, Inc. 4.625% 2/1/28 (c) | 645 | 587 | |
| IQVIA, Inc. 5% 10/15/26 (c) | 1,125 | 1,072 | |
| Jazz Securities DAC 4.375% 1/15/29 (c) | 1,635 | 1,422 | |
| ModivCare Escrow Issuer, Inc. 5% 10/1/29 (c) | 955 | 696 | |
| Modivcare, Inc. 5.875% 11/15/25 (c) | 1,105 | 1,044 | |
| Molina Healthcare, Inc.: | |||
| 3.875% 11/15/30 (c) | 1,360 | 1,109 | |
| 3.875% 5/15/32 (c) | 1,730 | 1,359 | |
| Organon & Co. / Organon Foreign Debt Co-Issuer BV: | |||
| 4.125% 4/30/28 (c) | 3,525 | 3,045 | |
| 5.125% 4/30/31 (c) | 2,410 | 1,882 | |
| Owens & Minor, Inc. 4.5% 3/31/29 (c) | 1,065 | 854 | |
| RP Escrow Issuer LLC 5.25% 12/15/25 (c) | 1,340 | 955 | |
| Tenet Healthcare Corp.: | |||
| 4.25% 6/1/29 | 8,360 | 7,154 | |
| 4.375% 1/15/30 | 6,245 | 5,283 | |
| 6.125% 6/15/30 | 4,600 | 4,258 | |
| 6.25% 2/1/27 | 9,945 | 9,537 | |
| 6.75% 5/15/31 (c) | 990 | 940 | |
| Teva Pharmaceutical Finance Netherlands III BV: | |||
| 4.75% 5/9/27 | 865 | 785 | |
| 5.125% 5/9/29 | 865 | 755 | |
| 7.875% 9/15/29 | 960 | 947 | |
| 73,080 | |||
| Homebuilders/Real Estate - 1.5% | |||
| Arcosa, Inc. 4.375% 4/15/29 (c) | 1,075 | 938 | |
| Ashton Woods U.S.A. LLC/Ashton Woods Finance Co. 4.625% 4/1/30 (c) | 1,240 | 960 | |
| Brookfield Residential Properties, Inc./Brookfield Residential U.S. Corp. 4.875% 2/15/30 (c) | 1,080 | 821 | |
| Century Communities, Inc. 3.875% 8/15/29 (c) | 1,245 | 1,005 | |
| Greystar Real Estate Partners 7.75% 9/1/30 (c) | 860 | 845 | |
| MPT Operating Partnership LP/MPT Finance Corp.: | |||
| 3.5% 3/15/31 | 1,445 | 876 | |
| 5% 10/15/27 | 9,710 | 7,497 | |
| Shea Homes Ltd. Partnership/Corp. 4.75% 4/1/29 | 1,070 | 903 | |
| Taylor Morrison Communities, Inc./Monarch Communities, Inc.: | |||
| 5.125% 8/1/30 (c) | 1,416 | 1,190 | |
| 5.75% 1/15/28 (c) | 2,100 | 1,906 | |
| 5.875% 6/15/27 (c) | 1,490 | 1,397 | |
| TopBuild Corp. 3.625% 3/15/29 (c) | 755 | 629 | |
| TRI Pointe Homes, Inc. 5.7% 6/15/28 | 1,965 | 1,750 | |
| Uniti Group LP / Uniti Group Finance, Inc.: | |||
| 4.75% 4/15/28 (c) | 4,258 | 3,441 | |
| 6.5% 2/15/29 (c) | 2,070 | 1,344 | |
| 10.5% 2/15/28 (c) | 1,265 | 1,218 | |
| Weekley Homes LLC/Weekley Finance Corp. 4.875% 9/15/28 (c) | 675 | 580 | |
| 27,300 | |||
| Hotels - 0.3% | |||
| Carnival Holdings (Bermuda) Ltd. 10.375% 5/1/28 (c) | 2,825 | 3,012 | |
| Hilton Domestic Operating Co., Inc.: | |||
| 3.75% 5/1/29 (c) | 725 | 624 | |
| 4% 5/1/31 (c) | 1,085 | 899 | |
| 4.875% 1/15/30 | 1,180 | 1,059 | |
| 5,594 | |||
| Insurance - 2.2% | |||
| Acrisure LLC / Acrisure Finance, Inc.: | |||
| 6% 8/1/29 (c) | 1,240 | 1,000 | |
| 7% 11/15/25 (c) | 5,750 | 5,575 | |
| 10.125% 8/1/26 (c) | 295 | 297 | |
| Alliant Holdings Intermediate LLC: | |||
| 4.25% 10/15/27 (c) | 1,470 | 1,292 | |
| 5.875% 11/1/29 (c) | 1,290 | 1,071 | |
| 6.75% 10/15/27 (c) | 7,995 | 7,302 | |
| 6.75% 4/15/28 (c) | 5,690 | 5,407 | |
| AmWINS Group, Inc. 4.875% 6/30/29 (c) | 1,205 | 1,032 | |
| AssuredPartners, Inc.: | |||
| 5.625% 1/15/29 (c) | 1,140 | 967 | |
| 7% 8/15/25 (c) | 10 | 10 | |
| GTCR AP Finance, Inc. 8% 5/15/27 (c) | 985 | 959 | |
| HUB International Ltd.: | |||
| 5.625% 12/1/29 (c) | 5,635 | 4,853 | |
| 7% 5/1/26 (c) | 1,750 | 1,703 | |
| 7.25% 6/15/30 (c) | 4,770 | 4,653 | |
| MGIC Investment Corp. 5.25% 8/15/28 | 1,040 | 956 | |
| National Financial Partners Corp.: | |||
| 4.875% 8/15/28 (c) | 1,980 | 1,734 | |
| 6.875% 8/15/28 (c) | 1,922 | 1,641 | |
| 8.5% 10/1/31 (c) | 1,135 | 1,116 | |
| 41,568 | |||
| Leisure - 2.3% | |||
| Boyne U.S.A., Inc. 4.75% 5/15/29 (c) | 840 | 731 | |
| Carnival Corp.: | |||
| 4% 8/1/28 (c) | 9,210 | 8,012 | |
| 7% 8/15/29 (c) | 990 | 971 | |
| 7.625% 3/1/26 (c) | 2,775 | 2,698 | |
| 9.875% 8/1/27 (c) | 2,250 | 2,345 | |
| NCL Corp. Ltd. 5.875% 2/15/27 (c) | 1,770 | 1,629 | |
| Royal Caribbean Cruises Ltd.: | |||
| 5.375% 7/15/27 (c) | 1,295 | 1,193 | |
| 7.25% 1/15/30 (c) | 950 | 937 | |
| 8.25% 1/15/29 (c) | 6,455 | 6,595 | |
| 9.25% 1/15/29 (c) | 5,340 | 5,574 | |
| 11.5% 6/1/25 (c) | 1,585 | 1,677 | |
| 11.625% 8/15/27 (c) | 1,765 | 1,915 | |
| SeaWorld Parks & Entertainment, Inc. 5.25% 8/15/29 (c) | 1,665 | 1,450 | |
| Vail Resorts, Inc. 6.25% 5/15/25 (c) | 850 | 845 | |
| Viking Ocean Cruises Ship VII Ltd. 5.625% 2/15/29 (c) | 625 | 554 | |
| Voc Escrow Ltd. 5% 2/15/28 (c) | 5,510 | 4,950 | |
| 42,076 | |||
| Metals/Mining - 1.3% | |||
| Alcoa Nederland Holding BV 4.125% 3/31/29 (c) | 1,980 | 1,724 | |
| Alpha Natural Resources, Inc. 9.75% (b)(g) | 1,770 | 0 | |
| Arsenal AIC Parent LLC 8% 10/1/30 (c) | 1,145 | 1,131 | |
| Cleveland-Cliffs, Inc.: | |||
| 4.625% 3/1/29 (c) | 3,200 | 2,758 | |
| 4.875% 3/1/31 (c) | 1,480 | 1,221 | |
| 6.75% 4/15/30 (c) | 2,000 | 1,854 | |
| Eldorado Gold Corp. 6.25% 9/1/29 (c) | 1,895 | 1,618 | |
| ERO Copper Corp. 6.5% 2/15/30 (c) | 1,320 | 1,120 | |
| First Quantum Minerals Ltd.: | |||
| 6.875% 3/1/26 (c) | 2,600 | 2,281 | |
| 8.625% 6/1/31 (c) | 2,470 | 2,085 | |
| FMG Resources Pty Ltd. 4.375% 4/1/31 (c) | 1,145 | 923 | |
| HudBay Minerals, Inc. 4.5% 4/1/26 (c) | 905 | 842 | |
| Mineral Resources Ltd.: | |||
| 8% 11/1/27 (c) | 3,895 | 3,764 | |
| 8.5% 5/1/30 (c) | 660 | 635 | |
| 9.25% 10/1/28 (c) | 1,745 | 1,745 | |
| 23,701 | |||
| Paper - 0.6% | |||
| Ardagh Metal Packaging Finance U.S.A. LLC/Ardagh Metal Packaging Finance PLC: | |||
| 3.25% 9/1/28 (c) | 760 | 619 | |
| 4% 9/1/29 (c) | 1,515 | 1,136 | |
| 6% 6/15/27 (c) | 890 | 841 | |
| Cascades, Inc.: | |||
| 5.125% 1/15/26 (c) | 790 | 750 | |
| 5.375% 1/15/28 (c) | 790 | 714 | |
| Clydesdale Acquisition Holdings, Inc.: | |||
| 6.625% 4/15/29 (c) | 1,060 | 963 | |
| 8.75% 4/15/30 (c) | 6,750 | 5,380 | |
| Mercer International, Inc. 5.125% 2/1/29 | 1,920 | 1,506 | |
| 11,909 | |||
| Publishing/Printing - 0.1% | |||
| Clear Channel International BV 6.625% 8/1/25 (c) | 2,185 | 2,136 | |
| Restaurants - 0.8% | |||
| 1011778 BC Unlimited Liability Co./New Red Finance, Inc.: | |||
| 3.875% 1/15/28 (c) | 1,630 | 1,455 | |
| 4% 10/15/30 (c) | 5,185 | 4,247 | |
| 4.375% 1/15/28 (c) | 5,490 | 4,943 | |
| Bloomin Brands, Inc. / OSI Restaurant Partners LLC 5.125% 4/15/29 (c) | 715 | 620 | |
| Garden SpinCo Corp. 8.625% 7/20/30 (c) | 775 | 800 | |
| Papa John's International, Inc. 3.875% 9/15/29 (c) | 765 | 628 | |
| Yum! Brands, Inc. 4.625% 1/31/32 | 1,530 | 1,304 | |
| 13,997 | |||
| Services - 3.8% | |||
| Adtalem Global Education, Inc. 5.5% 3/1/28 (c) | 1,335 | 1,216 | |
| ASGN, Inc. 4.625% 5/15/28 (c) | 1,350 | 1,195 | |
| Atlas Luxco 4 SARL / Allied Universal Holdco LLC / Allied Universal Finance Corp.: | |||
| 4.625% 6/1/28 (c) | 1,549 | 1,267 | |
| 4.625% 6/1/28 (c) | 846 | 689 | |
| Booz Allen Hamilton, Inc.: | |||
| 3.875% 9/1/28 (c) | 1,385 | 1,238 | |
| 4% 7/1/29 (c) | 805 | 710 | |
| Brand Energy & Infrastructure Services, Inc. 10.375% 8/1/30 (c) | 7,245 | 7,191 | |
| CoreCivic, Inc. 8.25% 4/15/26 | 7,790 | 7,887 | |
| Fair Isaac Corp. 4% 6/15/28 (c) | 1,530 | 1,362 | |
| Gartner, Inc.: | |||
| 3.625% 6/15/29 (c) | 1,160 | 980 | |
| 3.75% 10/1/30 (c) | 1,535 | 1,271 | |
| GEMS MENASA Cayman Ltd. 7.125% 7/31/26 (c) | 1,360 | 1,302 | |
| H&E Equipment Services, Inc. 3.875% 12/15/28 (c) | 2,415 | 2,046 | |
| Hertz Corp.: | |||
| 4.625% 12/1/26 (c) | 740 | 620 | |
| 5% 12/1/29 (c) | 1,435 | 1,030 | |
| 5.5% (b)(c)(g) | 1,505 | 53 | |
| 6% (b)(c)(g) | 1,385 | 81 | |
| 6.25% (b)(g) | 1,605 | 56 | |
| 7.125% (b)(c)(g) | 1,430 | 125 | |
| Iron Mountain, Inc.: | |||
| 4.5% 2/15/31 (c) | 2,975 | 2,434 | |
| 4.875% 9/15/29 (c) | 3,800 | 3,310 | |
| Neptune BidCo U.S., Inc. 9.29% 4/15/29 (c) | 7,590 | 6,699 | |
| PowerTeam Services LLC 9.033% 12/4/25 (c) | 200 | 180 | |
| Service Corp. International 4% 5/15/31 | 1,610 | 1,303 | |
| Sotheby's 7.375% 10/15/27 (c) | 640 | 572 | |
| Sotheby's/Bidfair Holdings, Inc. 5.875% 6/1/29 (c) | 2,410 | 1,922 | |
| The GEO Group, Inc.: | |||
| 9.5% 12/31/28 (c) | 1,360 | 1,309 | |
| 10.5% 6/30/28 | 3,459 | 3,450 | |
| TriNet Group, Inc. 3.5% 3/1/29 (c) | 1,135 | 937 | |
| Uber Technologies, Inc.: | |||
| 4.5% 8/15/29 (c) | 3,730 | 3,290 | |
| 6.25% 1/15/28 (c) | 1,225 | 1,179 | |
| 7.5% 9/15/27 (c) | 4,885 | 4,897 | |
| 8% 11/1/26 (c) | 7,110 | 7,160 | |
| WASH Multifamily Acquisition, Inc. 5.75% 4/15/26 (c) | 1,285 | 1,189 | |
| 70,150 | |||
| Steel - 0.0% | |||
| Commercial Metals Co. 3.875% 2/15/31 | 780 | 632 | |
| Roller Bearing Co. of America, Inc. 4.375% 10/15/29 (c) | 610 | 517 | |
| 1,149 | |||
| Super Retail - 1.3% | |||
| Asbury Automotive Group, Inc.: | |||
| 4.5% 3/1/28 | 492 | 436 | |
| 4.625% 11/15/29 (c) | 6,520 | 5,515 | |
| 4.75% 3/1/30 | 489 | 415 | |
| 5% 2/15/32 (c) | 1,535 | 1,245 | |
| Bath & Body Works, Inc.: | |||
| 6.625% 10/1/30 (c) | 4,585 | 4,245 | |
| 6.75% 7/1/36 | 1,340 | 1,156 | |
| 7.5% 6/15/29 | 1,135 | 1,108 | |
| Carvana Co.: | |||
| 9% 12/1/28 pay-in-kind (c)(d) | 512 | 381 | |
| 9% 6/1/30 pay-in-kind (c)(d) | 769 | 569 | |
| 9% 6/1/31 pay-in-kind (c)(d) | 910 | 678 | |
| EG Global Finance PLC: | |||
| 6.75% 2/7/25 (c) | 882 | 873 | |
| 8.5% 10/30/25 (c) | 4,767 | 4,690 | |
| LBM Acquisition LLC 6.25% 1/15/29 (c) | 2,880 | 2,275 | |
| 23,586 | |||
| Technology - 4.1% | |||
| Acuris Finance U.S. 5% 5/1/28 (c) | 6,410 | 5,048 | |
| Block, Inc. 3.5% 6/1/31 | 1,615 | 1,246 | |
| CA Magnum Holdings 5.375% 10/31/26 (c) | 690 | 601 | |
| Camelot Finance SA 4.5% 11/1/26 (c) | 1,515 | 1,400 | |
| Clarivate Science Holdings Corp.: | |||
| 3.875% 7/1/28 (c) | 1,440 | 1,236 | |
| 4.875% 7/1/29 (c) | 1,360 | 1,147 | |
| Cloud Software Group, Inc.: | |||
| 6.5% 3/31/29 (c) | 13,550 | 11,896 | |
| 9% 9/30/29 (c) | 1,445 | 1,231 | |
| Coherent Corp. 5% 12/15/29 (c) | 1,350 | 1,146 | |
| Crowdstrike Holdings, Inc. 3% 2/15/29 | 1,130 | 945 | |
| Elastic NV 4.125% 7/15/29 (c) | 3,785 | 3,190 | |
| Go Daddy Operating Co. LLC / GD Finance Co., Inc.: | |||
| 3.5% 3/1/29 (c) | 6,860 | 5,759 | |
| 5.25% 12/1/27 (c) | 1,495 | 1,401 | |
| ION Trading Technologies Ltd. 5.75% 5/15/28 (c) | 1,605 | 1,332 | |
| Iron Mountain Information Management Services, Inc. 5% 7/15/32 (c) | 1,295 | 1,060 | |
| MicroStrategy, Inc. 6.125% 6/15/28 (c) | 4,490 | 4,063 | |
| NCR Atleos Escrow Corp. 9.5% 4/1/29 (c) | 1,480 | 1,451 | |
| NCR Corp.: | |||
| 5% 10/1/28 (c) | 750 | 648 | |
| 5.125% 4/15/29 (c) | 3,710 | 3,190 | |
| 5.25% 10/1/30 (c) | 750 | 621 | |
| ON Semiconductor Corp. 3.875% 9/1/28 (c) | 5,500 | 4,725 | |
| Open Text Corp. 6.9% 12/1/27 (c) | 1,685 | 1,677 | |
| Open Text Holdings, Inc.: | |||
| 4.125% 2/15/30 (c) | 790 | 655 | |
| 4.125% 12/1/31 (c) | 780 | 613 | |
| PTC, Inc.: | |||
| 3.625% 2/15/25 (c) | 925 | 892 | |
| 4% 2/15/28 (c) | 915 | 811 | |
| Rackspace Hosting, Inc. 5.375% 12/1/28 (c) | 830 | 243 | |
| Roblox Corp. 3.875% 5/1/30 (c) | 3,295 | 2,674 | |
| Seagate HDD Cayman: | |||
| 8.25% 12/15/29 (c) | 3,160 | 3,211 | |
| 8.5% 7/15/31 (c) | 2,045 | 2,081 | |
| Sensata Technologies BV 4% 4/15/29 (c) | 1,530 | 1,301 | |
| Synaptics, Inc. 4% 6/15/29 (c) | 900 | 743 | |
| TTM Technologies, Inc. 4% 3/1/29 (c) | 1,135 | 931 | |
| Twilio, Inc.: | |||
| 3.625% 3/15/29 | 6,425 | 5,342 | |
| 3.875% 3/15/31 | 1,340 | 1,070 | |
| Unisys Corp. 6.875% 11/1/27 (c) | 830 | 608 | |
| Veritas U.S., Inc./Veritas Bermuda Ltd. 7.5% 9/1/25 (c) | 1,430 | 1,171 | |
| 77,359 | |||
| Telecommunications - 3.1% | |||
| Altice Financing SA: | |||
| 5% 1/15/28 (c) | 1,580 | 1,285 | |
| 5.75% 8/15/29 (c) | 4,975 | 3,847 | |
| Altice France SA: | |||
| 5.125% 7/15/29 (c) | 7,670 | 5,252 | |
| 5.5% 1/15/28 (c) | 2,465 | 1,832 | |
| 5.5% 10/15/29 (c) | 14,870 | 10,229 | |
| C&W Senior Financing Designated Activity Co. 6.875% 9/15/27 (c) | 6,730 | 5,753 | |
| Frontier Communications Holdings LLC: | |||
| 5% 5/1/28 (c) | 2,830 | 2,443 | |
| 5.875% 10/15/27 (c) | 1,375 | 1,254 | |
| Intelsat Jackson Holdings SA 6.5% 3/15/30 (c) | 3,610 | 3,170 | |
| LCPR Senior Secured Financing DAC: | |||
| 5.125% 7/15/29 (c) | 1,895 | 1,476 | |
| 6.75% 10/15/27 (c) | 1,453 | 1,311 | |
| Millicom International Cellular SA 4.5% 4/27/31 (c) | 235 | 175 | |
| Northwest Fiber LLC/Northwest Fiber Finance Sub, Inc. 4.75% 4/30/27 (c) | 850 | 759 | |
| Sable International Finance Ltd. 5.75% 9/7/27 (c) | 5,225 | 4,677 | |
| SBA Communications Corp.: | |||
| 3.125% 2/1/29 | 1,695 | 1,401 | |
| 3.875% 2/15/27 | 6,375 | 5,806 | |
| Uniti Group, Inc. 6% 1/15/30 (c) | 1,120 | 679 | |
| VMED O2 UK Financing I PLC 4.75% 7/15/31 (c) | 2,875 | 2,314 | |
| Windstream Escrow LLC 7.75% 8/15/28 (c) | 2,345 | 1,860 | |
| Zayo Group Holdings, Inc. 4% 3/1/27 (c) | 1,915 | 1,441 | |
| 56,964 | |||
| Textiles/Apparel - 0.1% | |||
| Crocs, Inc.: | |||
| 4.125% 8/15/31 (c) | 825 | 627 | |
| 4.25% 3/15/29 (c) | 1,110 | 910 | |
| Kontoor Brands, Inc. 4.125% 11/15/29 (c) | 760 | 626 | |
| 2,163 | |||
| Transportation Ex Air/Rail - 0.1% | |||
| Seaspan Corp. 5.5% 8/1/29 (c) | 1,240 | 951 | |
| XPO, Inc. 6.25% 6/1/28 (c) | 960 | 920 | |
| 1,871 | |||
| Utilities - 2.1% | |||
| Clearway Energy Operating LLC: | |||
| 3.75% 2/15/31 (c) | 1,705 | 1,329 | |
| 3.75% 1/15/32 (c) | 850 | 644 | |
| 4.75% 3/15/28 (c) | 970 | 866 | |
| NRG Energy, Inc.: | |||
| 3.375% 2/15/29 (c) | 665 | 541 | |
| 3.625% 2/15/31 (c) | 1,320 | 996 | |
| 3.875% 2/15/32 (c) | 1,905 | 1,416 | |
| 5.75% 1/15/28 | 2,765 | 2,588 | |
| Pacific Gas & Electric Co.: | |||
| 3.45% 7/1/25 | 400 | 379 | |
| 3.75% 7/1/28 | 400 | 351 | |
| 3.95% 12/1/47 | 885 | 528 | |
| 4% 12/1/46 | 2,184 | 1,321 | |
| PG&E Corp.: | |||
| 5% 7/1/28 | 10,140 | 9,186 | |
| 5.25% 7/1/30 | 1,150 | 1,007 | |
| Pike Corp. 5.5% 9/1/28 (c) | 5,395 | 4,614 | |
| Vistra Operations Co. LLC: | |||
| 4.375% 5/1/29 (c) | 3,105 | 2,637 | |
| 5% 7/31/27 (c) | 3,565 | 3,261 | |
| 5.5% 9/1/26 (c) | 1,822 | 1,733 | |
| 5.625% 2/15/27 (c) | 4,435 | 4,173 | |
| 7.75% 10/15/31 (c) | 1,965 | 1,897 | |
| 39,467 | |||
TOTAL NONCONVERTIBLE BONDS | 1,114,239 | ||
| TOTAL CORPORATE BONDS (Cost $1,254,045) | 1,120,950 | ||
| Common Stocks - 12.2% | |||
| Shares | Value ($) (000s) | ||
| Aerospace - 0.1% | |||
| TransDigm Group, Inc. (i) | 2,100 | 1,739 | |
| Air Transportation - 0.0% | |||
| Air Canada (i) | 3,800 | 46 | |
| Delta Air Lines, Inc. | 23,450 | 733 | |
TOTAL AIR TRANSPORTATION | 779 | ||
| Automotive & Auto Parts - 0.0% | |||
| UC Holdings, Inc. (b)(i) | 29,835 | 51 | |
| Banks & Thrifts - 0.0% | |||
| Mr. Cooper Group, Inc. (i) | 1,504 | 85 | |
| Broadcasting - 0.1% | |||
| Nexstar Broadcasting Group, Inc. Class A | 8,363 | 1,171 | |
| Building Materials - 0.4% | |||
| Builders FirstSource, Inc. (i) | 14,100 | 1,530 | |
| Carlisle Companies, Inc. | 5,600 | 1,423 | |
| Carrier Global Corp. | 50,300 | 2,397 | |
| WESCO International, Inc. | 12,467 | 1,598 | |
TOTAL BUILDING MATERIALS | 6,948 | ||
| Capital Goods - 0.3% | |||
| Deere & Co. | 2,400 | 877 | |
| Parker Hannifin Corp. | 5,400 | 1,992 | |
| Regal Rexnord Corp. | 22,600 | 2,676 | |
TOTAL CAPITAL GOODS | 5,545 | ||
| Chemicals - 0.3% | |||
| Olin Corp. | 55,900 | 2,388 | |
| The Chemours Co. LLC | 71,500 | 1,724 | |
| Westlake Corp. | 8,200 | 946 | |
TOTAL CHEMICALS | 5,058 | ||
| Consumer Products - 0.1% | |||
| Tapestry, Inc. | 47,300 | 1,304 | |
| Tempur Sealy International, Inc. | 20,511 | 819 | |
TOTAL CONSUMER PRODUCTS | 2,123 | ||
| Containers - 0.2% | |||
| Graphic Packaging Holding Co. | 159,900 | 3,439 | |
| Diversified Financial Services - 0.6% | |||
| Apollo Global Management, Inc. | 45,100 | 3,493 | |
| Carnelian Point Holdings LP warrants (b)(i) | 118 | 0 | |
| MasterCard, Inc. Class A | 10,600 | 3,989 | |
| OneMain Holdings, Inc. | 102,000 | 3,665 | |
TOTAL DIVERSIFIED FINANCIAL SERVICES | 11,147 | ||
| Energy - 1.7% | |||
| Antero Resources Corp. (i) | 47,902 | 1,410 | |
| California Resources Corp. | 171,351 | 9,011 | |
| California Resources Corp. warrants 10/27/24 (i) | 8,300 | 148 | |
| Cheniere Energy, Inc. | 33,200 | 5,525 | |
| Chesapeake Energy Corp. (j) | 45,388 | 3,907 | |
| Chesapeake Energy Corp. (h)(i) | 3,530 | 304 | |
| Diamond Offshore Drilling, Inc. (i) | 16,382 | 203 | |
| EP Energy Corp. (b)(i) | 147,125 | 243 | |
| Forbes Energy Services Ltd. (b)(i) | 65,062 | 0 | |
| Halliburton Co. | 33,000 | 1,298 | |
| Mesquite Energy, Inc. (b)(i) | 90,382 | 7,175 | |
| Noble Corp. PLC | 1,410 | 66 | |
| PureWest Energy (b)(i) | 3,289 | 6 | |
| PureWest Energy rights (b)(i) | 1,983 | 0 | |
| SolarEdge Technologies, Inc. (i) | 7,400 | 562 | |
| Superior Energy Services, Inc. Class A (b)(i) | 17,671 | 1,338 | |
| Tidewater, Inc. warrants 11/14/42 (i) | 12,651 | 951 | |
TOTAL ENERGY | 32,147 | ||
| Entertainment/Film - 0.0% | |||
| New Cotai LLC/New Cotai Capital Corp. (b)(h)(i) | 1,458,195 | 831 | |
| Food & Drug Retail - 0.4% | |||
| Northeast Grocery, Inc. (b)(h)(i) | 339,746 | 1,610 | |
| Southeastern Grocers, Inc. (b)(h)(i) | 250,623 | 6,699 | |
TOTAL FOOD & DRUG RETAIL | 8,309 | ||
| Food/Beverage/Tobacco - 0.1% | |||
| JBS SA | 684,100 | 2,718 | |
| Gaming - 0.3% | |||
| Boyd Gaming Corp. | 74,300 | 4,105 | |
| Caesars Entertainment, Inc. (i) | 21,500 | 858 | |
| Studio City International Holdings Ltd.: | |||
| ADR (c)(i) | 32,338 | 162 | |
| (NYSE) ADR (i) | 35,600 | 178 | |
TOTAL GAMING | 5,303 | ||
| Healthcare - 0.5% | |||
| Charles River Laboratories International, Inc. (i) | 5,000 | 842 | |
| Humana, Inc. | 3,400 | 1,781 | |
| IQVIA Holdings, Inc. (i) | 16,600 | 3,002 | |
| Tenet Healthcare Corp. (i) | 15,300 | 822 | |
| UnitedHealth Group, Inc. | 6,400 | 3,428 | |
TOTAL HEALTHCARE | 9,875 | ||
| Homebuilders/Real Estate - 0.5% | |||
| Arthur J. Gallagher & Co. | 18,100 | 4,262 | |
| TopBuild Corp. (i) | 7,000 | 1,601 | |
| Willscot Mobile Mini Holdings (i) | 72,600 | 2,861 | |
TOTAL HOMEBUILDERS/REAL ESTATE | 8,724 | ||
| Metals/Mining - 0.0% | |||
| First Quantum Minerals Ltd. | 44,840 | 520 | |
| Warrior Metropolitan Coal, Inc. | 692 | 34 | |
TOTAL METALS/MINING | 554 | ||
| Restaurants - 0.1% | |||
| Domino's Pizza, Inc. | 4,900 | 1,661 | |
| Services - 0.5% | |||
| Airbnb, Inc. Class A (i) | 11,900 | 1,408 | |
| ASGN, Inc. (i) | 10,394 | 867 | |
| Visa, Inc. Class A | 28,500 | 6,700 | |
TOTAL SERVICES | 8,975 | ||
| Super Retail - 0.6% | |||
| Amazon.com, Inc. (i) | 14,400 | 1,916 | |
| Arena Brands Holding Corp. Class B (b)(h)(i) | 42,253 | 511 | |
| Booking Holdings, Inc. (i) | 800 | 2,232 | |
| Dick's Sporting Goods, Inc. | 22,100 | 2,364 | |
| Lowe's Companies, Inc. | 8,600 | 1,639 | |
| Williams-Sonoma, Inc. | 11,300 | 1,698 | |
TOTAL SUPER RETAIL | 10,360 | ||
| Technology - 4.6% | |||
| Accenture PLC Class A | 6,100 | 1,812 | |
| Adobe, Inc. (i) | 9,200 | 4,895 | |
| Alphabet, Inc. Class A (i) | 44,300 | 5,497 | |
| AMETEK, Inc. | 12,700 | 1,788 | |
| Arista Networks, Inc. (i) | 15,600 | 3,126 | |
| ASML Holding NV (depository receipt) | 3,400 | 2,036 | |
| CDW Corp. | 8,800 | 1,764 | |
| Dynatrace, Inc. (i) | 54,100 | 2,419 | |
| Eaton Corp. PLC | 9,300 | 1,934 | |
| Fiserv, Inc. (i) | 39,500 | 4,493 | |
| Gen Digital, Inc. | 98,300 | 1,638 | |
| Global Payments, Inc. | 12,900 | 1,370 | |
| Marvell Technology, Inc. | 45,200 | 2,134 | |
| Meta Platforms, Inc. Class A (i) | 34,400 | 10,364 | |
| Microchip Technology, Inc. | 50,500 | 3,600 | |
| Microsoft Corp. | 20,600 | 6,965 | |
| nVent Electric PLC | 17,500 | 842 | |
| NVIDIA Corp. | 21,800 | 8,890 | |
| NXP Semiconductors NV | 7,900 | 1,362 | |
| ON Semiconductor Corp. (i) | 83,960 | 5,259 | |
| Oracle Corp. | 33,200 | 3,433 | |
| Salesforce, Inc. (i) | 13,000 | 2,611 | |
| Splunk, Inc. (i) | 18,300 | 2,693 | |
| Synopsys, Inc. (i) | 5,100 | 2,394 | |
| Vertiv Holdings Co. | 45,300 | 1,779 | |
TOTAL TECHNOLOGY | 85,098 | ||
| Telecommunications - 0.1% | |||
| GTT Communications, Inc. (b) | 11,856 | 338 | |
| Palo Alto Networks, Inc. (i) | 8,800 | 2,139 | |
TOTAL TELECOMMUNICATIONS | 2,477 | ||
| Textiles/Apparel - 0.1% | |||
| LVMH Moet Hennessy Louis Vuitton SE | 1,900 | 1,360 | |
| Utilities - 0.6% | |||
| Constellation Energy Corp. | 29,600 | 3,342 | |
| PG&E Corp. (i) | 307,379 | 5,010 | |
| Vistra Corp. | 61,900 | 2,025 | |
TOTAL UTILITIES | 10,377 | ||
| TOTAL COMMON STOCKS (Cost $191,447) | 226,854 | ||
| Bank Loan Obligations - 8.0% | |||
Principal Amount (a) (000s) | Value ($) (000s) | ||
| Air Transportation - 0.2% | |||
| Air Canada Tranche B 1LN, term loan CME Term SOFR 3 Month Index + 3.500% 9.1284% 8/11/28 (d)(e)(k) | 1,225 | 1,222 | |
| SkyMiles IP Ltd. Tranche B 1LN, term loan CME Term SOFR 1 Month Index + 3.750% 9.1658% 10/20/27 (d)(e)(k) | 372 | 381 | |
| United Airlines, Inc. Tranche B 1LN, term loan CME Term SOFR 3 Month Index + 3.750% 9.1894% 4/21/28 (d)(e)(k) | 2,716 | 2,706 | |
TOTAL AIR TRANSPORTATION | 4,309 | ||
| Automotive & Auto Parts - 0.1% | |||
| Clarios Global LP Tranche B 1LN, term loan CME Term SOFR 1 Month Index + 3.750% 9.0741% 4/20/30 (d)(e)(k) | 430 | 429 | |
| PECF USS Intermediate Holding III Corp. Tranche B 1LN, term loan CME Term SOFR 1 Month Index + 4.250% 9.8943% 12/17/28 (d)(e)(k) | 1,012 | 762 | |
TOTAL AUTOMOTIVE & AUTO PARTS | 1,191 | ||
| Banks & Thrifts - 0.1% | |||
| Citadel Securities LP Tranche B 1LN, term loan CME Term SOFR 1 Month Index + 2.500% 7.9386% 7/25/30 (d)(e)(k) | 1,209 | 1,204 | |
| Broadcasting - 0.1% | |||
| Diamond Sports Group LLC 1LN, term loan CME Term SOFR 1 Month Index + 8.000% 15.4146% 8/24/26 (d)(e)(k) | 894 | 336 | |
| Univision Communications, Inc.: | |||
| 1LN, term loan CME Term SOFR 3 Month Index + 4.250% 9.6401% 6/24/29 (d)(e)(k) | 114 | 113 | |
| Tranche B 1LN, term loan CME Term SOFR 1 Month Index + 3.250% 8.6886% 1/31/29 (d)(e)(k) | 990 | 972 | |
TOTAL BROADCASTING | 1,421 | ||
| Building Materials - 0.3% | |||
| Acproducts Holdings, Inc. Tranche B 1LN, term loan CME Term SOFR 3 Month Index + 4.250% 9.9017% 5/17/28 (d)(e)(k) | 3,133 | 2,480 | |
| Hunter Douglas, Inc. Tranche B 1LN, term loan CME Term SOFR 3 Month Index + 3.500% 8.8911% 2/25/29 (d)(e)(k) | 3,303 | 3,115 | |
| SRS Distribution, Inc. Tranche B 1LN, term loan CME Term SOFR 1 Month Index + 3.500% 8.9386% 6/4/28 (d)(e)(k) | 846 | 824 | |
TOTAL BUILDING MATERIALS | 6,419 | ||
| Capital Goods - 0.0% | |||
| Chart Industries, Inc. Tranche B 1LN, term loan CME Term SOFR 1 Month Index + 3.250% 8.6646% 3/17/30 (d)(e)(k) | 274 | 273 | |
| Chemicals - 0.5% | |||
| Discovery Purchaser Corp. 1LN, term loan CME Term SOFR 3 Month Index + 4.370% 9.7651% 10/4/29 (d)(e)(k) | 6,154 | 5,704 | |
| Olympus Water U.S. Holding Corp. Tranche B 1LN, term loan CME Term SOFR 3 Month Index + 3.750% 9.4017% 11/9/28 (d)(e)(k) | 511 | 497 | |
| W.R. Grace Holding LLC Tranche B 1LN, term loan 3 month U.S. LIBOR + 3.750% 9.4017% 9/22/28 (d)(e)(k) | 2,358 | 2,309 | |
TOTAL CHEMICALS | 8,510 | ||
| Consumer Products - 0.2% | |||
| Kronos Acquisition Holdings, Inc. Tranche B 1LN, term loan CME Term SOFR 3 Month Index + 3.750% 9.4017% 12/22/26 (d)(e)(k) | 2,502 | 2,447 | |
| The Golub Corp. 2LN, term loan 3 month U.S. LIBOR + 13.500% 18.9347% 5/8/26 (b)(d)(e)(k) | 1,984 | 1,962 | |
TOTAL CONSUMER PRODUCTS | 4,409 | ||
| Containers - 0.0% | |||
| Kloeckner Pentaplast of America, Inc. Tranche B 1LN, term loan CME TERM SOFR 6 MONTH INDEX + 4.750% 10.476% 2/9/26 (d)(e)(k) | 185 | 174 | |
| Energy - 0.0% | |||
| Forbes Energy Services LLC Tranche B, term loan 0% (b)(g)(k) | 610 | 0 | |
| Mesquite Energy, Inc.: | |||
| 1LN, term loan 3 month U.S. LIBOR + 8.000% 0% (b)(e)(g)(k) | 1,671 | 0 | |
| term loan 3 month U.S. LIBOR + 0.000% 0% (b)(e)(g)(k) | 721 | 0 | |
| Natgasoline LLC Tranche B, term loan CME Term SOFR 1 Month Index + 3.500% 8.9386% 11/14/25 (d)(e)(k) | 319 | 317 | |
TOTAL ENERGY | 317 | ||
| Environmental - 0.0% | |||
| Covanta Holding Corp.: | |||
| Tranche B 1LN, term loan CME Term SOFR 1 Month Index + 2.500% 7.8241% 11/30/28 (d)(e)(k) | 312 | 307 | |
| Tranche C 1LN, term loan CME Term SOFR 1 Month Index + 2.500% 7.8241% 11/30/28 (d)(e)(k) | 24 | 23 | |
| Madison IAQ LLC Tranche B 1LN, term loan CME Term SOFR 1 Month Index + 3.250% 8.7031% 6/21/28 (d)(e)(k) | 401 | 386 | |
TOTAL ENVIRONMENTAL | 716 | ||
| Food/Beverage/Tobacco - 0.0% | |||
| Bengal Debt Merger Sub LLC 1LN, term loan CME Term SOFR 3 Month Index + 3.250% 8.7401% 1/24/29 (d)(e)(k) | 326 | 299 | |
| Gaming - 0.5% | |||
| Fertitta Entertainment LLC NV Tranche B 1LN, term loan CME Term SOFR 1 Month Index + 4.000% 9.3241% 1/27/29 (d)(e)(k) | 7,372 | 7,200 | |
| Ontario Gaming GTA LP Tranche B 1LN, term loan CME Term SOFR 1 Month Index + 4.250% 9.6401% 8/1/30 (d)(e)(k) | 990 | 989 | |
| Scientific Games Corp. 1LN, term loan CME Term SOFR 1 Month Index + 3.000% 8.5345% 4/14/29 (d)(e)(k) | 346 | 344 | |
TOTAL GAMING | 8,533 | ||
| Healthcare - 0.3% | |||
| Gainwell Acquisition Corp. Tranche B 1LN, term loan CME Term SOFR 3 Month Index + 4.000% 9.4901% 10/1/27 (d)(e)(k) | 2,265 | 2,161 | |
| Jazz Financing Lux SARL Tranche B 1LN, term loan CME Term SOFR 1 Month Index + 3.500% 8.9386% 5/5/28 (d)(e)(k) | 819 | 819 | |
| Mozart Borrower LP Tranche B 1LN, term loan CME Term SOFR 1 Month Index + 3.250% 8.6886% 10/23/28 (d)(e)(k) | 160 | 158 | |
| Organon & Co. Tranche B 1LN, term loan CME Term SOFR 3 Month Index + 3.000% 8.4505% 6/2/28 (d)(e)(k) | 1,962 | 1,956 | |
| Phoenix Newco, Inc. Tranche B 1LN, term loan CME Term SOFR 1 Month Index + 3.250% 8.6886% 11/15/28 (d)(e)(k) | 970 | 958 | |
| PRA Health Sciences, Inc. Tranche B 1LN, term loan CME Term SOFR 3 Month Index + 2.250% 7.9017% 7/3/28 (d)(e)(k) | 202 | 202 | |
TOTAL HEALTHCARE | 6,254 | ||
| Homebuilders/Real Estate - 0.2% | |||
| Breakwater Energy Partners LLC Tranche B 1LN, term loan 11.25% 9/1/26 (b)(d)(e)(k) | 3,096 | 2,992 | |
| Hotels - 0.5% | |||
| Carnival Finance LLC Tranche B 1LN, term loan CME Term SOFR 1 Month Index + 3.250% 8.6886% 10/18/28 (d)(e)(k) | 8,985 | 8,809 | |
| Insurance - 0.7% | |||
| Acrisure LLC: | |||
| Tranche B 1LN, term loan: | |||
CME Term SOFR 1 Month Index + 3.500% 8.9386% 2/15/27 (d)(e)(k) | 2,947 | 2,866 | |
CME Term SOFR 1 Month Index + 4.250% 9.6886% 2/15/27 (d)(e)(k) | 201 | 200 | |
| Tranche B5 1LN, term loan CME Term SOFR 1 Month Index + 4.500% 10/19/30 (e)(k)(l) | 510 | 504 | |
| Alliant Holdings Intermediate LLC: | |||
| Tranche B3 1LN, term loan 1 month U.S. LIBOR + 3.500% 8.9386% 11/5/27 (d)(e)(k) | 1,766 | 1,759 | |
| Tranche B5 1LN, term loan CME Term SOFR 1 Month Index + 3.500% 8.8347% 11/6/27 (d)(e)(k) | 989 | 985 | |
| HUB International Ltd. Tranche B 1LN, term loan: | |||
| CME Term SOFR 1 Month Index + 4.250% 9.6619% 7/1/30 (d)(e)(k) | 5,564 | 5,560 | |
| CME Term SOFR 3 Month Index + 4.000% 9.3653% 11/10/29 (d)(e)(k) | 149 | 149 | |
TOTAL INSURANCE | 12,023 | ||
| Leisure - 0.0% | |||
| Carnival Finance LLC Tranche B 1LN, term loan CME Term SOFR 1 Month Index + 3.000% 8.336% 8/8/27 (d)(e)(k) | 339 | 333 | |
| Topgolf Callaway Brands Corp. Tranche B 1LN, term loan CME Term SOFR 1 Month Index + 3.500% 8.9241% 3/9/30 (d)(e)(k) | 473 | 470 | |
TOTAL LEISURE | 803 | ||
| Metals/Mining - 0.0% | |||
| Arsenal AIC Parent LLC Tranche B 1LN, term loan CME Term SOFR 1 Month Index + 4.500% 9.8792% 8/18/30 (d)(e)(k) | 265 | 264 | |
| Paper - 0.5% | |||
| Clydesdale Acquisition Holdings, Inc. 1LN, term loan CME Term SOFR 1 Month Index + 4.170% 9.5991% 4/13/29 (d)(e)(k) | 9,407 | 9,087 | |
| Services - 0.8% | |||
| ABG Intermediate Holdings 2 LLC: | |||
| Tranche B 2LN, term loan CME Term SOFR 1 Month Index + 6.000% 11.4269% 12/20/29 (d)(e)(k) | 66 | 66 | |
| Tranche B1 LN, term loan CME Term SOFR 1 Month Index + 3.500% 8.9241% 12/21/28 (d)(e)(k) | 765 | 763 | |
| Tranche B2 1LN, term loan CME Term SOFR 1 Month Index + 4.000% 9.4241% 12/21/28 (d)(e)(k) | 2,006 | 2,001 | |
| Tranche DD 1LN, term loan CME Term SOFR 1 Month Index + 4.000% 12/21/28 (e)(k)(m) | 384 | 383 | |
| Ascend Learning LLC: | |||
| 2LN, term loan CME Term SOFR 1 Month Index + 5.750% 11.1741% 12/10/29 (d)(e)(k) | 2,170 | 1,825 | |
| Tranche B 1LN, term loan CME Term SOFR 1 Month Index + 3.500% 8.9241% 12/10/28 (d)(e)(k) | 2,895 | 2,687 | |
| Brand Energy & Infrastructure Services, Inc. Tranche B 1LN, term loan CME Term SOFR 1 Month Index + 5.500% 10.8719% 8/1/30 (d)(e)(k) | 975 | 938 | |
| Neptune BidCo U.S., Inc. Tranche B 1LN, term loan CME Term SOFR 1 Month Index + 5.000% 10.5067% 4/11/29 (d)(e)(k) | 2,478 | 2,160 | |
| PowerTeam Services LLC Tranche B 1LN, term loan CME Term SOFR 3 Month Index + 3.500% 8.8901% 3/6/25 (d)(e)(k) | 1,980 | 1,785 | |
| Sabert Corp. Tranche B 1LN, term loan CME Term SOFR 1 Month Index + 4.500% 9.9386% 12/10/26 (d)(e)(k) | 762 | 759 | |
| Spin Holdco, Inc. Tranche B 1LN, term loan 3 month U.S. LIBOR + 4.000% 9.6639% 3/4/28 (d)(e)(k) | 2,644 | 2,254 | |
TOTAL SERVICES | 15,621 | ||
| Specialty Retailing - 0.0% | |||
| New SK Holdco Sub LLC 1LN, term loan CME Term SOFR 1 Month Index + 8.350% 13.6887% 6/30/27 (d)(e)(k) | 113 | 106 | |
| Super Retail - 0.6% | |||
| LBM Acquisition LLC Tranche B 1LN, term loan CME Term SOFR 1 Month Index + 3.750% 9.1741% 12/18/27 (d)(e)(k) | 11,739 | 11,152 | |
| Technology - 2.1% | |||
| Acuris Finance U.S., Inc. 1LN, term loan CME Term SOFR 3 Month Index + 4.000% 9.5401% 2/16/28 (d)(e)(k) | 142 | 140 | |
| Athenahealth Group, Inc. Tranche B 1LN, term loan CME Term SOFR 1 Month Index + 3.500% 8.5769% 2/15/29 (d)(e)(k) | 4,284 | 4,144 | |
| Camelot Finance SA Tranche B, term loan CME Term SOFR 1 Month Index + 3.000% 8.4386% 10/31/26 (d)(e)(k) | 135 | 134 | |
| DG Investment Intermediate Holdings, Inc. Tranche B 1LN, term loan CME Term SOFR 1 Month Index + 3.750% 9.1998% 3/31/28 (d)(e)(k) | 254 | 246 | |
| Hunter U.S. Bidco, Inc. Tranche B 1LN, term loan CME Term SOFR 3 Month Index + 4.250% 9.7401% 8/19/28 (d)(e)(k) | 1,570 | 1,552 | |
| Icon Luxembourg Sarl Tranche B 1LN, term loan CME Term SOFR 3 Month Index + 2.250% 7.9017% 7/3/28 (d)(e)(k) | 811 | 811 | |
| McAfee Corp. Tranche B 1LN, term loan CME Term SOFR 1 Month Index + 3.750% 9.1646% 3/1/29 (d)(e)(k) | 5,097 | 4,865 | |
| MH Sub I LLC Tranche B 1LN, term loan CME Term SOFR 1 Month Index + 4.250% 9.5741% 5/3/28 (d)(e)(k) | 2,878 | 2,747 | |
| Peraton Corp. Tranche B 1LN, term loan CME Term SOFR 1 Month Index + 3.750% 9.1741% 2/1/28 (d)(e)(k) | 1,737 | 1,702 | |
| Polaris Newco LLC Tranche B 1LN, term loan CME Term SOFR 1 Month Index + 4.000% 9.4386% 6/2/28 (d)(e)(k) | 892 | 841 | |
| Project Alpha Intermediate Holding, Inc. Tranche B 1LN, term loan CME Term SOFR 1 Month Index + 4.750% 10.0749% 10/19/30 (d)(e)(k) | 1,975 | 1,914 | |
| Proofpoint, Inc. Tranche B 1LN, term loan CME Term SOFR 1 Month Index + 3.250% 8.6886% 8/31/28 (d)(e)(k) | 6,852 | 6,730 | |
| RealPage, Inc. Tranche B 1LN, term loan CME Term SOFR 1 Month Index + 3.000% 8.4386% 4/22/28 (d)(e)(k) | 760 | 742 | |
| STG-Fairway Holdings LLC Tranche B 1LN, term loan CME Term SOFR 1 Month Index + 2.750% 8.1886% 1/31/27 (d)(e)(k) | 390 | 390 | |
| Ukg, Inc.: | |||
| 1LN, term loan CME Term SOFR 3 Month Index + 3.250% 8.7643% 5/4/26 (d)(e)(k) | 5,905 | 5,868 | |
| 2LN, term loan CME Term SOFR 3 Month Index + 5.250% 10.7643% 5/3/27 (d)(e)(k) | 570 | 569 | |
| Veritas U.S., Inc. Tranche B 1LN, term loan CME Term SOFR 1 Month Index + 5.000% 10.4386% 9/1/25 (d)(e)(k) | 950 | 801 | |
| VS Buyer LLC Tranche B 1LN, term loan CME Term SOFR 1 Month Index + 3.000% 8.6741% 2/28/27 (d)(e)(k) | 3,744 | 3,709 | |
TOTAL TECHNOLOGY | 37,905 | ||
| Telecommunications - 0.1% | |||
| Aventiv Technologies LLC Tranche B, term loan 3 month U.S. LIBOR + 4.500% 10.231% 11/1/24 (d)(e)(k) | 926 | 784 | |
| GTT Communications, Inc. 1LN, term loan CME Term SOFR 3 Month Index + 9.000% 14.4901% 6/30/28 (d)(e)(k) | 499 | 294 | |
| Gtt Remainco LLC 1LN, term loan CME Term SOFR 1 Month Index + 7.000% 12.4269% 12/30/27 (d)(e)(k) | 621 | 534 | |
TOTAL TELECOMMUNICATIONS | 1,612 | ||
| Utilities - 0.2% | |||
| PG&E Corp. Tranche B 1LN, term loan CME Term SOFR 1 Month Index + 3.000% 8.4386% 6/23/25 (d)(e)(k) | 3,677 | 3,667 | |
| TOTAL BANK LOAN OBLIGATIONS (Cost $154,286) | 148,070 | ||
| Preferred Securities - 8.2% | |||
Principal Amount (a) (000s) | Value ($) (000s) | ||
| Banks & Thrifts - 6.9% | |||
| Ally Financial, Inc. 4.7% (d)(n) | 945 | 561 | |
| Bank of America Corp.: | |||
| 5.125% (d)(n) | 12,000 | 11,932 | |
| 5.875% (d)(n) | 14,280 | 12,403 | |
| 6.1% (d)(n) | 2,590 | 2,517 | |
| Citigroup, Inc.: | |||
| 4.7% (d)(n) | 2,135 | 1,935 | |
| 5% (d)(n) | 13,000 | 12,393 | |
| 6.3% (d)(n) | 4,585 | 4,580 | |
| 9.0922% (d)(e)(n) | 12,655 | 12,925 | |
| Goldman Sachs Group, Inc.: | |||
| 4.95% (d)(n) | 1,325 | 1,235 | |
| 5.3% (d)(n) | 15,000 | 14,360 | |
| JPMorgan Chase & Co.: | |||
| 4% (d)(n) | 3,555 | 3,252 | |
| 4.6% (d)(n) | 4,465 | 4,211 | |
| 5% (d)(n) | 24,800 | 24,300 | |
| 6.75% (d)(n) | 8,000 | 8,129 | |
| Wells Fargo & Co.: | |||
| 5.875% (d)(n) | 7,645 | 7,598 | |
| 7.625% (d)(n) | 5,740 | 5,802 | |
TOTAL BANKS & THRIFTS | 128,133 | ||
| Energy - 1.3% | |||
| Energy Transfer LP: | |||
| 3 month U.S. LIBOR + 4.020% 9.6542% (d)(e)(n) | 8,125 | 7,826 | |
| 6.625% (d)(n) | 456 | 359 | |
| 7.125% (d)(n) | 17,150 | 14,806 | |
TOTAL ENERGY | 22,991 | ||
| TOTAL PREFERRED SECURITIES (Cost $161,228) | 151,124 | ||
| Other - 2.6% | |||
| Shares | Value ($) (000s) | ||
| Other - 2.6% | |||
Fidelity Private Credit Central Fund LLC (h)(q) (Cost $47,266) | 4,750,615 | 48,171 | |
| Money Market Funds - 8.4% | |||
| Shares | Value ($) (000s) | ||
| Fidelity Cash Central Fund 5.40% (o) | 152,774,506 | 152,805 | |
| Fidelity Securities Lending Cash Central Fund 5.40% (o)(p) | 3,359,664 | 3,360 | |
| TOTAL MONEY MARKET FUNDS (Cost $156,165) | 156,165 | ||
| TOTAL INVESTMENT IN SECURITIES - 100.0% (Cost $1,964,437) | 1,851,334 |
NET OTHER ASSETS (LIABILITIES) - 0.0% | (249) |
| NET ASSETS - 100.0% | 1,851,085 |
| (a) | Amount is stated in United States dollars unless otherwise noted. |
| (b) | Level 3 security |
| (c) | Security exempt from registration under Rule 144A of the Securities Act of 1933. These securities may be resold in transactions exempt from registration, normally to qualified institutional buyers. At the end of the period, the value of these securities amounted to $872,705,000 or 47.1% of net assets. |
| (d) | Coupon rates for floating and adjustable rate securities reflect the rates in effect at period end. |
| (e) | Coupon is indexed to a floating interest rate which may be multiplied by a specified factor and/or subject to caps or floors. |
| (f) | Security or a portion of the security purchased on a delayed delivery or when-issued basis. |
| (g) | Non-income producing - Security is in default. |
| (h) | Restricted securities (including private placements) - Investment in securities not registered under the Securities Act of 1933 (excluding 144A issues). At the end of the period, the value of restricted securities (excluding 144A issues) amounted to $59,790,000 or 3.2% of net assets. |
| (i) | Non-income producing |
| (j) | Security or a portion of the security is on loan at period end. |
| (k) | Remaining maturities of bank loan obligations may be less than the stated maturities shown as a result of contractual or optional prepayments by the borrower. Such prepayments cannot be predicted with certainty. |
| (l) | The coupon rate will be determined upon settlement of the loan after period end. |
| (m) | Position or a portion of the position represents an unfunded loan commitment. At period end, the total principal amount and market value of unfunded commitments totaled $384,000 and $383,000, respectively. |
| (n) | Security is perpetual in nature with no stated maturity date. |
| (o) | Affiliated fund that is generally available only to investment companies and other accounts managed by Fidelity Investments. The rate quoted is the annualized seven-day yield of the fund at period end. A complete unaudited listing of the fund's holdings as of its most recent quarter end is available upon request. In addition, each Fidelity Central Fund's financial statements, which are not covered by the Fund's Report of Independent Registered Public Accounting Firm, are available on the SEC's website or upon request. |
| (p) | Investment made with cash collateral received from securities on loan. |
| (q) | Affiliated fund that is generally available only to investment companies and other accounts managed by Fidelity Investments. |
| Additional information on each restricted holding is as follows: | ||
| Security | Acquisition Date | Acquisition Cost ($) (000s) |
| Arena Brands Holding Corp. Class B | 6/18/97 - 7/13/98 | 1,538 |
| Chesapeake Energy Corp. | 2/10/21 | 33 |
| Fidelity Private Credit Central Fund LLC | 4/28/22 - 10/27/23 | 47,266 |
| Jonah Energy Parent LLC 12% 11/5/25 | 5/05/23 | 1,589 |
| New Cotai LLC/New Cotai Capital Corp. | 9/11/20 | 7,224 |
| Northeast Grocery, Inc. | 11/08/21 | 135 |
| Southeastern Grocers, Inc. | 6/01/18 | 1,763 |
| Affiliate (Amounts in thousands) | Value, beginning of period ($) | Purchases ($) | Sales Proceeds ($) | Dividend Income ($) | Realized Gain (loss) ($) | Change in Unrealized appreciation (depreciation) ($) | Value, end of period ($) | % ownership, end of period |
| Fidelity Cash Central Fund 5.40% | 143,722 | 381,039 | 371,956 | 5,867 | - | - | 152,805 | 0.3% |
| Fidelity Private Credit Central Fund LLC | 22,391 | 29,129 | 4,508 | 4,902 | - | 1,159 | 48,171 | 7.2% |
| Fidelity Securities Lending Cash Central Fund 5.40% | 139 | 46,380 | 43,159 | 1 | - | - | 3,360 | 0.0% |
| Total | 166,252 | 456,548 | 419,623 | 10,770 | - | 1,159 | 204,336 | |
| Valuation Inputs at Reporting Date: | ||||
Description (Amounts in thousands) | Total ($) | Level 1 ($) | Level 2 ($) | Level 3 ($) |
Investments in Securities: | ||||
| Equities: | ||||
Communication Services | 17,032 | 17,032 | - | - |
Consumer Discretionary | 24,698 | 21,945 | 1,360 | 1,393 |
Consumer Staples | 11,027 | 2,718 | - | 8,309 |
Energy | 31,579 | 21,872 | 951 | 8,756 |
Financials | 28,057 | 28,057 | - | - |
Health Care | 9,875 | 9,875 | - | - |
Industrials | 25,082 | 25,082 | - | - |
Information Technology | 60,070 | 59,732 | - | 338 |
Materials | 9,051 | 9,051 | - | - |
Utilities | 10,383 | 10,377 | - | 6 |
| Corporate Bonds | 1,120,950 | - | 1,116,222 | 4,728 |
| Bank Loan Obligations | 148,070 | - | 143,116 | 4,954 |
| Preferred Securities | 151,124 | - | 151,124 | - |
| Other | 48,171 | - | 48,171 | - |
| Money Market Funds | 156,165 | 156,165 | - | - |
| Total Investments in Securities: | 1,851,334 | 361,906 | 1,460,944 | 28,484 |
| (Amounts in thousands) | |||
| Investments in Securities: | |||
| Beginning Balance | $ | 35,385 | |
| Net Realized Gain (Loss) on Investment Securities | 3,386 | ||
| Net Unrealized Gain (Loss) on Investment Securities | (7,437) | ||
| Cost of Purchases | 5,246 | ||
| Proceeds of Sales | (6,834) | ||
| Amortization/Accretion | 42 | ||
| Transfers into Level 3 | - | ||
| Transfers out of Level 3 | (1,304) | ||
| Ending Balance | $ | 28,484 | |
| The change in unrealized gain (loss) for the period attributable to Level 3 securities held at October 31, 2023 | $ | 5,788 | |
| The information used in the above reconciliation represents fiscal year to date activity for any Investments in Securities identified as using Level 3 inputs at either the beginning or the end of the current fiscal period. Cost of purchases and proceeds of sales may include securities received and/or delivered through in-kind transactions, corporate actions or exchanges. Transfers into Level 3 were attributable to a lack of observable market data resulting from decreases in market activity, decreases in liquidity, security restructurings or corporate actions. Transfers out of Level 3 were attributable to observable market data becoming available for those securities. Transfers in or out of Level 3 represent the beginning value of any Security or Instrument where a change in the pricing level occurred from the beginning to the end of the period. Realized and unrealized gains (losses) disclosed in the reconciliation are included in Net Gain (Loss) on the Fund's Statement of Operations. | |||
| Statement of Assets and Liabilities | ||||
| Amounts in thousands (except per-share amounts) | October 31, 2023 | |||
| Assets | ||||
| Investment in securities, at value (including securities loaned of $3,305) - See accompanying schedule: | ||||
Unaffiliated issuers (cost $1,761,006) | $ | 1,646,998 | ||
Fidelity Central Funds (cost $203,431) | 204,336 | |||
| Total Investment in Securities (cost $1,964,437) | $ | 1,851,334 | ||
| Cash | 429 | |||
| Foreign currency held at value (cost $57) | 56 | |||
| Receivable for investments sold | 12,941 | |||
| Receivable for fund shares sold | 1,857 | |||
| Dividends receivable | 122 | |||
| Interest receivable | 20,256 | |||
| Distributions receivable from Fidelity Central Funds | 683 | |||
| Prepaid expenses | 3 | |||
| Receivable from investment adviser for expense reductions | 425 | |||
| Other receivables | 8 | |||
Total assets | 1,888,114 | |||
| Liabilities | ||||
| Payable for investments purchased | ||||
Regular delivery | $ | 16,986 | ||
Delayed delivery | 1,917 | |||
| Payable for fund shares redeemed | 12,530 | |||
| Distributions payable | 874 | |||
| Accrued management fee | 832 | |||
| Distribution and service plan fees payable | 190 | |||
| Other affiliated payables | 258 | |||
| Other payables and accrued expenses | 82 | |||
| Collateral on securities loaned | 3,360 | |||
| Total Liabilities | 37,029 | |||
| Commitments and contingent liabilities (see Commitments note) | ||||
| Net Assets | $ | 1,851,085 | ||
| Net Assets consist of: | ||||
| Paid in capital | $ | 1,990,699 | ||
| Total accumulated earnings (loss) | (139,614) | |||
| Net Assets | $ | 1,851,085 | ||
| Net Asset Value and Maximum Offering Price | ||||
| Class A : | ||||
Net Asset Value and redemption price per share ($466,886 ÷ 44,316 shares)(a) | $ | 10.54 | ||
| Maximum offering price per share (100/96.00 of $10.54) | $ | 10.98 | ||
| Class M : | ||||
Net Asset Value and redemption price per share ($223,836 ÷ 21,118 shares)(a) | $ | 10.60 | ||
| Maximum offering price per share (100/96.00 of $10.60) | $ | 11.04 | ||
| Class C : | ||||
Net Asset Value and offering price per share ($54,054 ÷ 5,141 shares)(a) | $ | 10.51 | ||
| Class I : | ||||
Net Asset Value, offering price and redemption price per share ($745,215 ÷ 75,867 shares) | $ | 9.82 | ||
| Class Z : | ||||
Net Asset Value, offering price and redemption price per share ($361,094 ÷ 36,757 shares) | $ | 9.82 | ||
(a)Redemption price per share is equal to net asset value less any applicable contingent deferred sales charge. | ||||
| Statement of Operations | ||||
| Amounts in thousands | Year ended October 31, 2023 | |||
| Investment Income | ||||
| Dividends | $ | 12,185 | ||
| Interest | 89,290 | |||
| Income from Fidelity Central Funds (including $1 from security lending) | 10,771 | |||
| Total Income | 112,246 | |||
| Expenses | ||||
| Management fee | $ | 10,101 | ||
| Transfer agent fees | 2,395 | |||
| Distribution and service plan fees | 2,329 | |||
| Accounting fees | 613 | |||
| Custodian fees and expenses | 23 | |||
| Independent trustees' fees and expenses | 10 | |||
| Registration fees | 146 | |||
| Audit | 83 | |||
| Legal | (185) | |||
| Miscellaneous | 9 | |||
| Total expenses before reductions | 15,524 | |||
| Expense reductions | (175) | |||
| Total expenses after reductions | 15,349 | |||
| Net Investment income (loss) | 96,897 | |||
| Realized and Unrealized Gain (Loss) | ||||
| Net realized gain (loss) on: | ||||
| Investment Securities: | ||||
| Unaffiliated issuers | (37,304) | |||
| Total net realized gain (loss) | (37,304) | |||
| Change in net unrealized appreciation (depreciation) on: | ||||
| Investment Securities: | ||||
| Unaffiliated issuers | 30,659 | |||
| Fidelity Central Funds | 1,159 | |||
| Assets and liabilities in foreign currencies | (1) | |||
| Total change in net unrealized appreciation (depreciation) | 31,817 | |||
| Net gain (loss) | (5,487) | |||
| Net increase (decrease) in net assets resulting from operations | $ | 91,410 | ||
| Statement of Changes in Net Assets | ||||
| Amount in thousands | Year ended October 31, 2023 | Year ended October 31, 2022 | ||
| Increase (Decrease) in Net Assets | ||||
| Operations | ||||
| Net investment income (loss) | $ | 96,897 | $ | 77,687 |
| Net realized gain (loss) | (37,304) | 77,979 | ||
| Change in net unrealized appreciation (depreciation) | 31,817 | (381,046) | ||
| Net increase (decrease) in net assets resulting from operations | 91,410 | (225,380) | ||
| Distributions to shareholders | (157,937) | (118,721) | ||
| Share transactions - net increase (decrease) | 127,889 | (69,934) | ||
| Total increase (decrease) in net assets | 61,362 | (414,035) | ||
| Net Assets | ||||
| Beginning of period | 1,789,723 | 2,203,758 | ||
| End of period | $ | 1,851,085 | $ | 1,789,723 |
| Fidelity Advisor® High Income Advantage Fund Class A |
| Years ended October 31, | 2023 | 2022 | 2021 | 2020 | 2019 | |||||
Selected Per-Share Data | ||||||||||
| Net asset value, beginning of period | $ | 10.90 | $ | 12.94 | $ | 10.95 | $ | 11.12 | $ | 10.93 |
| Income from Investment Operations | ||||||||||
Net investment income (loss) A,B | .551 | .455 | .382 | .422 | .517 | |||||
| Net realized and unrealized gain (loss) | - C | (1.803) | 1.989 | (.169) | .260 | |||||
| Total from investment operations | .551 | (1.348) | 2.371 | .253 | .777 | |||||
| Distributions from net investment income | (.544) | (.433) | (.381) | (.417) | (.587) | |||||
| Distributions from net realized gain | (.367) | (.259) | - | (.006) | - | |||||
| Total distributions | (.911) | (.692) | (.381) | (.423) | (.587) | |||||
| Net asset value, end of period | $ | 10.54 | $ | 10.90 | $ | 12.94 | $ | 10.95 | $ | 11.12 |
Total Return D,E | 5.16% | (10.75)% | 21.85% | 2.41% | 7.41% | |||||
Ratios to Average Net Assets B,F,G | ||||||||||
| Expenses before reductions | .98% | 1.01% | .99% | 1.00% | 1.01% | |||||
| Expenses net of fee waivers, if any | .98% | 1.01% | .99% | 1.00% | 1.00% | |||||
| Expenses net of all reductions | .98% | 1.01% | .99% | 1.00% | 1.00% | |||||
| Net investment income (loss) | 5.11% | 3.88% | 3.07% | 3.91% | 4.70% | |||||
| Supplemental Data | ||||||||||
| Net assets, end of period (in millions) | $ | 467 | $ | 463 | $ | 566 | $ | 462 | $ | 515 |
Portfolio turnover rate H | 29% | 29% | 27% | 48% | 53% |
| Fidelity Advisor® High Income Advantage Fund Class M |
| Years ended October 31, | 2023 | 2022 | 2021 | 2020 | 2019 | |||||
Selected Per-Share Data | ||||||||||
| Net asset value, beginning of period | $ | 10.96 | $ | 13.01 | $ | 11.01 | $ | 11.18 | $ | 10.99 |
| Income from Investment Operations | ||||||||||
Net investment income (loss) A,B | .556 | .458 | .385 | .425 | .521 | |||||
| Net realized and unrealized gain (loss) | (.001) | (1.813) | 1.998 | (.169) | .259 | |||||
| Total from investment operations | .555 | (1.355) | 2.383 | .256 | .780 | |||||
| Distributions from net investment income | (.548) | (.436) | (.383) | (.420) | (.590) | |||||
| Distributions from net realized gain | (.367) | (.259) | - | (.006) | - | |||||
| Total distributions | (.915) | (.695) | (.383) | (.426) | (.590) | |||||
| Net asset value, end of period | $ | 10.60 | $ | 10.96 | $ | 13.01 | $ | 11.01 | $ | 11.18 |
Total Return C,D | 5.17% | (10.75)% | 21.84% | 2.43% | 7.39% | |||||
Ratios to Average Net Assets B,E,F | ||||||||||
| Expenses before reductions | .98% | 1.01% | .99% | 1.00% | 1.00% | |||||
| Expenses net of fee waivers, if any | .97% | 1.01% | .99% | 1.00% | 1.00% | |||||
| Expenses net of all reductions | .97% | 1.01% | .99% | 1.00% | 1.00% | |||||
| Net investment income (loss) | 5.11% | 3.89% | 3.08% | 3.91% | 4.71% | |||||
| Supplemental Data | ||||||||||
| Net assets, end of period (in millions) | $ | 224 | $ | 238 | $ | 300 | $ | 266 | $ | 329 |
Portfolio turnover rate G | 29% | 29% | 27% | 48% | 53% |
| Fidelity Advisor® High Income Advantage Fund Class C |
| Years ended October 31, | 2023 | 2022 | 2021 | 2020 | 2019 | |||||
Selected Per-Share Data | ||||||||||
| Net asset value, beginning of period | $ | 10.88 | $ | 12.92 | $ | 10.93 | $ | 11.10 | $ | 10.91 |
| Income from Investment Operations | ||||||||||
Net investment income (loss) A,B | .469 | .366 | .286 | .339 | .434 | |||||
| Net realized and unrealized gain (loss) | (.010) | (1.804) | 1.988 | (.169) | .258 | |||||
| Total from investment operations | .459 | (1.438) | 2.274 | .170 | .692 | |||||
| Distributions from net investment income | (.462) | (.343) | (.284) | (.334) | (.502) | |||||
| Distributions from net realized gain | (.367) | (.259) | - | (.006) | - | |||||
| Total distributions | (.829) | (.602) | (.284) | (.340) | (.502) | |||||
| Net asset value, end of period | $ | 10.51 | $ | 10.88 | $ | 12.92 | $ | 10.93 | $ | 11.10 |
Total Return C,D | 4.27% | (11.45)% | 20.95% | 1.63% | 6.60% | |||||
Ratios to Average Net Assets B,E,F | ||||||||||
| Expenses before reductions | 1.76% | 1.78% | 1.76% | 1.77% | 1.77% | |||||
| Expenses net of fee waivers, if any | 1.73% | 1.77% | 1.76% | 1.77% | 1.77% | |||||
| Expenses net of all reductions | 1.73% | 1.77% | 1.76% | 1.77% | 1.76% | |||||
| Net investment income (loss) | 4.35% | 3.12% | 2.30% | 3.14% | 3.94% | |||||
| Supplemental Data | ||||||||||
| Net assets, end of period (in millions) | $ | 54 | $ | 56 | $ | 71 | $ | 68 | $ | 89 |
Portfolio turnover rate G | 29% | 29% | 27% | 48% | 53% |
| Fidelity Advisor® High Income Advantage Fund Class I |
| Years ended October 31, | 2023 | 2022 | 2021 | 2020 | 2019 | |||||
Selected Per-Share Data | ||||||||||
| Net asset value, beginning of period | $ | 10.19 | $ | 12.12 | $ | 10.26 | $ | 10.42 | $ | 10.25 |
| Income from Investment Operations | ||||||||||
Net investment income (loss) A,B | .539 | .454 | .388 | .422 | .512 | |||||
| Net realized and unrealized gain (loss) | (.007) | (1.691) | 1.860 | (.157) | .241 | |||||
| Total from investment operations | .532 | (1.237) | 2.248 | .265 | .753 | |||||
| Distributions from net investment income | (.535) | (.434) | (.388) | (.419) | (.583) | |||||
| Distributions from net realized gain | (.367) | (.259) | - | (.006) | - | |||||
| Total distributions | (.902) | (.693) | (.388) | (.425) | (.583) | |||||
| Net asset value, end of period | $ | 9.82 | $ | 10.19 | $ | 12.12 | $ | 10.26 | $ | 10.42 |
Total Return C | 5.35% | (10.56)% | 22.13% | 2.69% | 7.67% | |||||
Ratios to Average Net Assets B,D,E | ||||||||||
| Expenses before reductions | .73% | .76% | .74% | .75% | .76% | |||||
| Expenses net of fee waivers, if any | .72% | .76% | .74% | .75% | .76% | |||||
| Expenses net of all reductions | .72% | .76% | .74% | .74% | .76% | |||||
| Net investment income (loss) | 5.36% | 4.13% | 3.32% | 4.17% | 4.95% | |||||
| Supplemental Data | ||||||||||
| Net assets, end of period (in millions) | $ | 745 | $ | 696 | $ | 903 | $ | 510 | $ | 612 |
Portfolio turnover rate F | 29% | 29% | 27% | 48% | 53% |
| Fidelity Advisor® High Income Advantage Fund Class Z |
| Years ended October 31, | 2023 | 2022 | 2021 | 2020 | 2019 | |||||
Selected Per-Share Data | ||||||||||
| Net asset value, beginning of period | $ | 10.19 | $ | 12.12 | $ | 10.26 | $ | 10.42 | $ | 10.25 |
| Income from Investment Operations | ||||||||||
Net investment income (loss) A,B | .549 | .463 | .399 | .430 | .516 | |||||
| Net realized and unrealized gain (loss) | (.007) | (1.690) | 1.860 | (.156) | .248 | |||||
| Total from investment operations | .542 | (1.227) | 2.259 | .274 | .764 | |||||
| Distributions from net investment income | (.545) | (.444) | (.399) | (.428) | (.594) | |||||
| Distributions from net realized gain | (.367) | (.259) | - | (.006) | - | |||||
| Total distributions | (.912) | (.703) | (.399) | (.434) | (.594) | |||||
| Net asset value, end of period | $ | 9.82 | $ | 10.19 | $ | 12.12 | $ | 10.26 | $ | 10.42 |
Total Return C | 5.45% | (10.47)% | 22.25% | 2.79% | 7.79% | |||||
Ratios to Average Net Assets B,D,E | ||||||||||
| Expenses before reductions | .64% | .66% | .64% | .65% | .65% | |||||
| Expenses net of fee waivers, if any | .63% | .66% | .64% | .65% | .65% | |||||
| Expenses net of all reductions | .63% | .66% | .64% | .65% | .65% | |||||
| Net investment income (loss) | 5.46% | 4.23% | 3.42% | 4.26% | 5.06% | |||||
| Supplemental Data | ||||||||||
| Net assets, end of period (in millions) | $ | 361 | $ | 337 | $ | 363 | $ | 159 | $ | 137 |
Portfolio turnover rate F | 29% | 29% | 27% | 48% | 53% |
| Fidelity Central Fund | Investment Manager | Investment Objective | Investment Practices | Expense RatioA |
| Fidelity Money Market Central Funds | Fidelity Management & Research Company LLC (FMR) | Each fund seeks to obtain a high level of current income consistent with the preservation of capital and liquidity. | Short-term Investments | Less than .005% |
| Asset Type | Fair Value | Valuation Technique(s) | Unobservable Input | Amount or Range/Weighted Average | Impact to Valuation from an Increase in InputA |
| Equities | $18,802 | Market comparable | Enterprise value/EBITDA multiple (EV/EBITDA) | 4.0 - 6.8 / 4.4 | Increase |
| Market approach | Transaction price | $0.00 - $79.39 / $79.39 | Increase | ||
| Recovery value | Recovery value | $0.00 - $1.86 / $1.86 | Increase | ||
| Discounted cash flow | Discount rate | 13.5% | Decrease | ||
| Black scholes | Discount rate | 5.5% | Increase | ||
| Volatility | 45.0% | Increase | |||
| Term | 0.7 | Increase | |||
| Corporate Bonds | $4,728 | Market comparable | Enterprise value/EBITDA multiple (EV/EBITDA) | 6.5 | Increase |
| Enterprise value/Proved reserves multiple (EV/PR) | 0.8 | Increase | |||
| Enterprise value/PV-10 multiple (EV/PV-10) | 0.3 | Increase | |||
| Daily production multiple ($/Million cubic feet per day) | $3,850.00 | Increase | |||
| Indicative market price | Evaluated bid | $3.50 - $8.75 / $6.20 | Increase | ||
| Recovery value | Recovery value | $0.00 | Increase | ||
| Discounted cash flow | Yield | 19.1% | Decrease | ||
| Black scholes | Discount rate | 5.5% | Increase | ||
| Volatility | 45.0% | Increase | |||
| Term | 0.7 | Increase | |||
| Bank Loan Obligations | $4,954 | Market comparable | Enterprise value/EBITDA multiple (EV/EBITDA) | 2.5 | Increase |
| Recovery value | Recovery value | $0.00 | Increase | ||
| Discounted cash flow | Yield | 15.0% | Decrease | ||
| Discount rate | 20.0% | Decrease |
| Fidelity Advisor High Income Advantage Fund | $9 |
| Gross unrealized appreciation | $66,320 |
| Gross unrealized depreciation | (172,818) |
| Net unrealized appreciation (depreciation) | $(106,498) |
| Tax Cost | $1,957,832 |
| Undistributed ordinary income | $4,216 |
| Capital loss carryforward | $(37,333) |
| Net unrealized appreciation (depreciation) on securities and other investments | $(106,500) |
| Short-term | $(2,202) |
| Long-term | (35,132) |
Total capital less carryforward | $(37,333) |
| October 31, 2023 | October 31, 2022 | |
| Ordinary Income | $95,815 | $82,840 |
| Long-term Capital Gains | 62,122 | 35,881 |
| Total | $157,937 | $118,721 |
| Investment to be Acquired | Commitment Amount | |
| Fidelity Advisor High Income Advantage Fund | Fidelity Private Credit Central Fund LLC | $10,184 |
| Purchases ($) | Sales ($) | |
| Fidelity Advisor High Income Advantage Fund | 556,938 | 491,325 |
| Distribution Fee | Service Fee | Total Fees | Retained by FDC | |
| Class A | - % | .25% | $1,179 | $24 |
| Class M | - % | .25% | 588 | 2 |
| Class C | .75% | .25% | 562 | 83 |
| $2,329 | $109 |
| Retained by FDC | |
| Class A | $46 |
| Class M | 4 |
Class CA | -B |
| $50 |
| Amount | % of Class-Level Average Net Assets | |
| Class A | $703 | .15 |
| Class M | 339 | .14 |
| Class C | 95 | .17 |
| Class I | 1,082 | .15 |
| Class Z | 176 | .05 |
| $2,395 |
| % of Class-Level Average Net Assets | |
| Class A | 0.1485% |
| Class M | 0.1430% |
| Class C | 0.1686% |
| Class I | 0.1477% |
| % of Average Net Assets | |
| Fidelity Advisor High Income Advantage Fund | .03 |
| % of Average Net Assets | |
| Fidelity Advisor High Income Advantage Fund | 0.0331% |
| Amount | |
| Fidelity Advisor High Income Advantage Fund | $1 |
| Purchases ($) | Sales ($) | Realized Gain (Loss) ($) | |
| Fidelity Advisor High Income Advantage Fund | 7,183 | 3,800 | (552) |
| Amount ($) | |
| Fidelity Advisor High Income Advantage Fund | 7 |
| Amount | |
| Fidelity Advisor High Income Advantage Fund | $3 |
| Total Security Lending Fees Paid to NFS | Security Lending Income From Securities Loaned to NFS | Value of Securities Loaned to NFS at Period End | |
| Fidelity Advisor High Income Advantage Fund | $-A | $- | $- |
| Expense Limitations | Reimbursement | |
| Class C | 1.75% | $8 |
Year ended October 31, 2023 | Year ended October 31, 2022 | |
| Fidelity Advisor High Income Advantage Fund | ||
| Distributions to shareholders | ||
| Class A | $39,255 | $30,360 |
| Class M | 19,798 | 15,770 |
| Class C | 4,315 | 3,323 |
| Class I | 63,485 | 51,542 |
| Class Z | 31,084 | 17,726 |
Total | $157,937 | $118,721 |
| Shares | Shares | Dollars | Dollars | |
Year ended October 31, 2023 | Year ended October 31, 2022 | Year ended October 31, 2023 | Year ended October 31, 2022 | |
| Fidelity Advisor High Income Advantage Fund | ||||
| Class A | ||||
| Shares sold | 8,033 | 6,812 | $86,668 | $81,309 |
| Reinvestment of distributions | 3,371 | 2,336 | 36,314 | 27,862 |
| Shares redeemed | (9,551) | (10,414) | (103,071) | (122,480) |
| Net increase (decrease) | 1,853 | (1,266) | $19,911 | $(13,309) |
| Class M | ||||
| Shares sold | 1,730 | 1,587 | $18,846 | $18,925 |
| Reinvestment of distributions | 1,723 | 1,238 | 18,671 | 14,858 |
| Shares redeemed | (4,083) | (4,119) | (44,308) | (48,599) |
| Net increase (decrease) | (630) | (1,294) | $(6,791) | $(14,816) |
| Class C | ||||
| Shares sold | 1,180 | 1,146 | $12,722 | $13,607 |
| Reinvestment of distributions | 383 | 267 | 4,121 | 3,187 |
| Shares redeemed | (1,573) | (1,763) | (16,924) | (20,501) |
| Net increase (decrease) | (10) | (350) | $(81) | $(3,707) |
| Class I | ||||
| Shares sold | 32,016 | 30,137 | $322,869 | $335,242 |
| Reinvestment of distributions | 5,641 | 4,179 | 56,655 | 46,661 |
| Shares redeemed | (30,068) | (40,602) | (302,382) | (442,243) |
| Net increase (decrease) | 7,589 | (6,286) | $77,142 | $(60,340) |
| Class Z | ||||
| Shares sold | 11,358 | 23,041 | $114,612 | $244,497 |
| Reinvestment of distributions | 2,620 | 1,225 | 26,318 | 13,627 |
| Shares redeemed | (10,255) | (21,230) | (103,222) | (235,886) |
| Net increase (decrease) | 3,723 | 3,036 | $37,708 | $22,238 |
| The Example is based on an investment of $1,000 invested at the beginning of the period and held for the entire period (May 1, 2023 to October 31, 2023). |
Annualized Expense Ratio- A | Beginning Account Value May 1, 2023 | Ending Account Value October 31, 2023 | Expenses Paid During Period- C May 1, 2023 to October 31, 2023 | |||||||
| Fidelity Advisor® High Income Advantage Fund | ||||||||||
| Class A | .94% | |||||||||
| Actual | $ 1,000 | $ 996.60 | $ 4.73 | |||||||
Hypothetical-B | $ 1,000 | $ 1,020.47 | $ 4.79 | |||||||
| Class M | .93% | |||||||||
| Actual | $ 1,000 | $ 995.90 | $ 4.68 | |||||||
Hypothetical-B | $ 1,000 | $ 1,020.52 | $ 4.74 | |||||||
| Class C | 1.70% | |||||||||
| Actual | $ 1,000 | $ 991.80 | $ 8.53 | |||||||
Hypothetical-B | $ 1,000 | $ 1,016.64 | $ 8.64 | |||||||
| Class I | .69% | |||||||||
| Actual | $ 1,000 | $ 996.90 | $ 3.47 | |||||||
Hypothetical-B | $ 1,000 | $ 1,021.73 | $ 3.52 | |||||||
| Class Z | .59% | |||||||||
| Actual | $ 1,000 | $ 997.40 | $ 2.97 | |||||||
Hypothetical-B | $ 1,000 | $ 1,022.23 | $ 3.01 | |||||||
 |
Item 2.
Code of Ethics
As of the end of the period, October 31, 2023, Fidelity Advisor Series I (the trust) has adopted a code of ethics, as defined in Item 2 of Form N-CSR, that applies to its President and Treasurer and its Chief Financial Officer. A copy of the code of ethics is filed as an exhibit to this Form N-CSR.
Item 3.
Audit Committee Financial Expert
The Board of Trustees of the trust has determined that Donald F. Donahue is an audit committee financial expert, as defined in Item 3 of Form N-CSR. Mr. Donahue is independent for purposes of Item 3 of Form N-CSR.
Item 4.
Principal Accountant Fees and Services
Fees and Services
The following table presents fees billed by Deloitte & Touche LLP, the member firms of Deloitte Touche Tohmatsu, and their respective affiliates (collectively, “Deloitte Entities”) in each of the last two fiscal years for services rendered to Fidelity Advisor Floating Rate High Income Fund, Fidelity Advisor High Income Advantage Fund and Fidelity Advisor Value Fund (the “Fund(s)”):
Services Billed by Deloitte Entities
October 31, 2023 FeesA
Audit Fees | Audit-Related Fees | Tax Fees | All Other Fees | |
Fidelity Advisor Floating Rate High Income Fund | $78,200 | $- | $9,700 | $1,900 |
Fidelity Advisor High Income Advantage Fund | $66,100 | $- | $9,700 | $1,600 |
Fidelity Advisor Value Fund | $42,700 | $- | $11,400 | $1,100 |
October 31, 2022 FeesA
Audit Fees | Audit-Related Fees | Tax Fees | All Other Fees | |
Fidelity Advisor Floating Rate High Income Fund | $77,700 | $- | $8,800 | $1,700 |
Fidelity Advisor High Income Advantage Fund | $66,100 | $- | $8,800 | $1,500 |
Fidelity Advisor Value Fund | $42,900 | $- | $10,000 | $1,100 |
A Amounts may reflect rounding.
The following table(s) present(s) fees billed by Deloitte Entities that were required to be approved by the Audit Committee for services that relate directly to the operations and financial reporting of the Fund(s) and that are rendered on behalf of Fidelity Management & Research Company LLC ("FMR") and entities controlling, controlled by, or under common control with FMR (not including any sub-adviser whose role is primarily portfolio management and is subcontracted with or overseen by another investment adviser) that provide ongoing services to the Fund(s) (“Fund Service Providers”):
Services Billed by Deloitte Entities
October 31, 2023A | October 31, 2022A | |
Audit-Related Fees | $- | $- |
Tax Fees | $- | $- |
All Other Fees | $- | $- |
A Amounts may reflect rounding.
“Audit-Related Fees” represent fees billed for assurance and related services that are reasonably related to the performance of the fund audit or the review of the fund's financial statements and that are not reported under Audit Fees.
“Tax Fees” represent fees billed for tax compliance, tax advice or tax planning that relate directly to the operations and financial reporting of the fund.
“All Other Fees” represent fees billed for services provided to the fund or Fund Service Provider, a significant portion of which are assurance related, that relate directly to the operations and financial reporting of the fund, excluding those services that are reported under Audit Fees, Audit-Related Fees or Tax Fees.
Assurance services must be performed by an independent public accountant.
* * *
The aggregate non-audit fees billed by Deloitte Entities for services rendered to the Fund(s), FMR (not including any sub-adviser whose role is primarily portfolio management and is subcontracted with or overseen by another investment adviser), and any Fund Service Provider for each of the last two fiscal years of the Fund(s) are as follows:
Billed By | October 31, 2023A | October 31, 2022A |
Deloitte Entities | $278,000 | $489,500 |
A Amounts may reflect rounding.
The trust's Audit Committee has considered non-audit services that were not pre-approved that were provided by Deloitte Entities to Fund Service Providers to be compatible with maintaining the independence of Deloitte Entities in its(their) audit of the Fund(s), taking into account representations from Deloitte Entities, in accordance with Public Company Accounting Oversight Board rules, regarding its independence from the Fund(s) and its(their) related entities and FMR’s review of the appropriateness and permissibility under applicable law of such non-audit services prior to their provision to the Fund(s) Service Providers.
Audit Committee Pre-Approval Policies and Procedures
The trust’s Audit Committee must pre-approve all audit and non-audit services provided by a fund’s independent registered public accounting firm relating to the operations or financial reporting of the fund. Prior to the commencement of any audit or non-audit services to a fund, the Audit Committee reviews the services to determine whether they are appropriate and permissible under applicable law.
The Audit Committee has adopted policies and procedures to, among other purposes, provide a framework for the Committee’s consideration of non-audit services by the audit firms that audit the Fidelity funds. The policies and procedures require that any non-audit service provided by a fund audit firm to a Fidelity fund and any non-audit service provided by a fund auditor to a Fund Service Provider that relates directly to the operations and financial reporting of a Fidelity fund (“Covered Service”) are subject to approval by the Audit Committee before such service is provided.
All Covered Services must be approved in advance of provision of the service either: (i) by formal resolution of the Audit Committee, or (ii) by oral or written approval of the service by the Chair of the Audit Committee (or if the Chair is unavailable, such other member of the Audit Committee as may be designated by the Chair to act in the Chair’s absence). The approval contemplated by (ii) above is permitted where the Treasurer determines that action on such an engagement is necessary before the next meeting of the Audit Committee.
Non-audit services provided by a fund audit firm to a Fund Service Provider that do not relate directly to the operations and financial reporting of a Fidelity fund are reported to the Audit Committee periodically.
Non-Audit Services Approved Pursuant to Rule 2-01(c)(7)(i)(C) and (ii) of Regulation S-X (“De Minimis Exception”)
There were no non-audit services approved or required to be approved by the Audit Committee pursuant to the De Minimis Exception during the Fund’s(s’) last two fiscal years relating to services provided to (i) the Fund(s) or (ii) any Fund Service Provider that relate directly to the operations and financial reporting of the Fund(s).
The Registrant has not retained, for the preparation of the audit report on the financial statements included in the Form N-CSR, a registered public accounting firm that has a branch or office that is located in a foreign jurisdiction and that the Public Company Accounting Oversight Board (the “PCAOB”) has determined that the PCAOB is unable to inspect or investigate completely because of a position taken by an authority in the foreign jurisdiction.
The Registrant is not a “foreign issuer,” as defined in 17 CFR 240.3b-4.
Item 5.
Audit Committee of Listed Registrants
Not applicable.
Item 6.
Investments
(a)
Not applicable.
(b)
Not applicable.
Item 7.
Disclosure of Proxy Voting Policies and Procedures for Closed-End Management Investment Companies
Not applicable.
Item 8.
Portfolio Managers of Closed-End Management Investment Companies
Not applicable.
Item 9.
Purchase of Equity Securities by Closed-End Management Investment Company and Affiliated Purchasers
Not applicable.
Item 10.
Submission of Matters to a Vote of Security Holders
There were no material changes to the procedures by which shareholders may recommend nominees to the trust’s Board of Trustees.
Item 11.
Controls and Procedures
(a)(i) The President and Treasurer and the Chief Financial Officer have concluded that the trust’s disclosure controls and procedures (as defined in Rule 30a-3(c) under the Investment Company Act) provide reasonable assurances that material information relating to the trust is made known to them by the appropriate persons, based on their evaluation of these controls and procedures as of a date within 90 days of the filing date of this report.
(a)(ii) There was no change in the trust’s internal control over financial reporting (as defined in Rule 30a-3(d) under the Investment Company Act) that occurred during the period covered by this report that has materially affected, or is reasonably likely to materially affect, the trust’s internal control over financial reporting.
Item 12.
Disclosure of Securities Lending Activities for Closed-End Management
Investment Companies
Not applicable.
Item 18.
Recovery of Erroneously Awarded Compensation
(a)
Not applicable.
(b)
Not applicable.
Item 19.
Exhibits
(a) | (1) | Code of Ethics pursuant to Item 2 of Form N-CSR is filed and attached hereto as EX-99.CODE ETH. |
(a) | (2) | |
(a) | (3) | Not applicable. |
(b) |
SIGNATURES
Pursuant to the requirements of the Securities Exchange Act of 1934 and the Investment Company Act of 1940, the registrant has duly caused this report to be signed on its behalf by the undersigned, thereunto duly authorized.
Fidelity Advisor Series I
By: | /s/Stacie M. Smith |
Stacie M. Smith | |
President and Treasurer | |
Date: | December 21, 2023 |
Pursuant to the requirements of the Securities Exchange Act of 1934 and the Investment Company Act of 1940, this report has been signed below by the following persons on behalf of the registrant and in the capacities and on the dates indicated.
By: | /s/Stacie M. Smith |
Stacie M. Smith | |
President and Treasurer | |
Date: | December 21, 2023 |
By: | /s/John J. Burke III |
John J. Burke III | |
Chief Financial Officer | |
Date: | December 21, 2023 |