UNITED STATES
SECURITIES AND EXCHANGE COMMISSION
Washington, D.C. 20549
FORM N-CSR
CERTIFIED SHAREHOLDER REPORT OF REGISTERED
MANAGEMENT INVESTMENT COMPANIES
Investment Company Act file number 811-03785
Fidelity Advisor Series I
(Exact name of registrant as specified in charter)
245 Summer St., Boston, Massachusetts 02210
(Address of principal executive offices) (Zip code)
Nicole Macarchuk, Secretary
245 Summer St.
Boston, Massachusetts 02210
(Name and address of agent for service)
Registrant's telephone number, including area code:
617-563-7000
Date of fiscal year end: | October 31 |
Date of reporting period: | October 31, 2024 |
Item 1.
Reports to Stockholders
ANNUAL SHAREHOLDER REPORT | AS OF OCTOBER 31, 2024 | This report describes changes to the Fund that occurred during the reporting period. | |
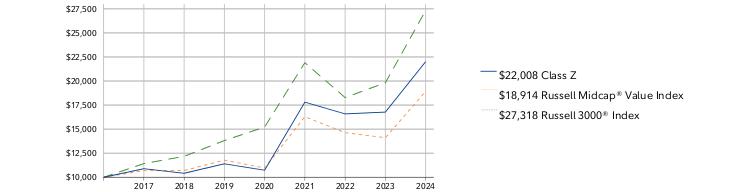
| | Fidelity Advisor® Value Fund Fidelity Advisor® Value Fund Class Z : FVLZX | |
| Costs of a $10,000 investment | Costs paid as a percentage of a $10,000 investment | ||
| Class Z | $ 87 | 0.75% |
Class Z | $10,000 | $10,891 | $10,416 | $11,400 | $10,734 | $17,805 | $16,584 | $16,773 |
Russell Midcap® Value Index | $10,000 | $10,684 | $10,701 | $11,780 | $10,963 | $16,290 | $14,633 | $14,111 |
Russell 3000® Index | $10,000 | $11,422 | $12,175 | $13,818 | $15,220 | $21,902 | $18,284 | $19,816 |
| 2017 | 2018 | 2019 | 2020 | 2021 | 2022 | 2023 | 2024 |
 |
| 1 Year | 5 Year | Life of Fund A | |
| Class Z | 31.21% | 14.06% | 10.71% |
| Russell Midcap® Value Index | 34.03% | 9.93% | 8.57% |
| Russell 3000® Index | 37.86% | 14.60% | 13.84% |
Visit institutional.fidelity.com for more recent performance information. |
The Fund's past performance is not a good predictor of the Fund's future performance. The graph and table do not reflect the deduction of taxes that a shareholder would pay on fund distributions or redemption of fund shares. |
KEY FACTS | ||
| Fund Size | $380,025,415 | |
| Number of Holdings | 268 | |
| Total Advisory Fee | $2,906,123 | |
| Portfolio Turnover | 80% |
(as of October 31, 2024)
MARKET SECTORS (% of Fund's net assets) | ||
| Industrials | 19.2 | |
| Financials | 16.7 | |
| Consumer Discretionary | 10.3 | |
| Materials | 10.3 | |
| Energy | 9.2 | |
| Health Care | 8.8 | |
| Utilities | 6.9 | |
| Real Estate | 5.3 | |
| Consumer Staples | 5.2 | |
| Information Technology | 4.3 | |
| Communication Services | 2.8 | |
| Common Stocks | 99.0 |
| Short-Term Investments and Net Other Assets (Liabilities) | 1.0 |
ASSET ALLOCATION (% of Fund's net assets) |
 |
| United States | 86.3 |
| Canada | 6.0 |
| United Kingdom | 1.2 |
| Germany | 1.1 |
| Puerto Rico | 0.6 |
| Belgium | 0.6 |
| Zambia | 0.6 |
| India | 0.5 |
| France | 0.5 |
| Others | 2.6 |
GEOGRAPHIC DIVERSIFICATION (% of Fund's net assets) |
 |
TOP HOLDINGS (% of Fund's net assets) | ||
| PG&E Corp | 1.2 | |
| Vistra Corp | 1.2 | |
| Ventas Inc | 1.0 | |
| Global Payments Inc | 1.0 | |
| Molina Healthcare Inc | 0.9 | |
| Smurfit WestRock PLC | 0.9 | |
| Lithia Motors Inc Class A | 0.9 | |
| Lumentum Holdings Inc | 0.8 | |
| International Paper Co | 0.8 | |
| Lamb Weston Holdings Inc | 0.8 | |
| 9.5 |
The fund's transfer agent and pricing & bookkeeping fees were changed to a fixed rate effective December 1, 2023, through February 29, 2024, in anticipation of the transition to a new management fee structure. Effective March 1, 2024, the fund's management contract was amended to incorporate administrative services previously covered under separate services agreements (transfer agent and pricing & bookkeeping). The amended contract incorporates a basic fee rate that may vary by class (subject to a performance adjustment). The Adviser or an affiliate pays certain expenses of managing and operating the fund out of each class's management fee. |
| Fidelity, the Fidelity Investments Logo and all other Fidelity trademarks or service marks used herein are trademarks or service marks of FMR LLC. Any third-party marks that are used herein are trademarks or service marks of their respective owners. © 2024 FMR LLC. All rights reserved. | ||
 | For additional information about the Fund; including its prospectus, financial information, holdings and proxy information, scan the QR code or visit fundresearch.fidelity.com/prospectus/sec 1.9913929.100 2890-TSRA-1224 | |
ANNUAL SHAREHOLDER REPORT | AS OF OCTOBER 31, 2024 | This report describes changes to the Fund that occurred during the reporting period. | |
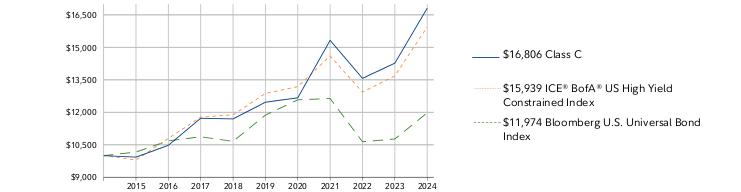
| | Fidelity Advisor® High Income Advantage Fund Fidelity Advisor® High Income Advantage Fund Class C : FAHEX | |
| Costs of a $10,000 investment | Costs paid as a percentage of a $10,000 investment | ||
| Class C | $ 187 | 1.72% |
Class C | $10,000 | $9,930 | $10,477 | $11,725 | $11,694 | $12,466 | $12,669 | $15,323 | $13,568 | $14,269 | $16,806 |
ICE® BofA® US High Yield Constrained Index | $10,000 | $9,797 | $10,795 | $11,781 | $11,883 | $12,872 | $13,187 | $14,602 | $12,932 | $13,683 | $15,939 |
Bloomberg U.S. Universal Bond Index | $10,000 | $10,167 | $10,682 | $10,870 | $10,658 | $11,869 | $12,576 | $12,636 | $10,641 | $10,768 | $11,974 |
| 2014 | 2015 | 2016 | 2017 | 2018 | 2019 | 2020 | 2021 | 2022 | 2023 | 2024 |
 |
| 1 Year | 5 Year | 10 Year | |
| Class C (incl. contingent deferred sales charge) | 16.04% | 5.84% | 5.33% |
| Class C | 17.04% | 5.84% | 5.33% |
| ICE® BofA® US High Yield Constrained Index | 16.49% | 4.37% | 4.77% |
| Bloomberg U.S. Universal Bond Index | 11.20% | 0.18% | 1.82% |
Visit institutional.fidelity.com for more recent performance information. |
The Fund's past performance is not a good predictor of the Fund's future performance. The graph and table do not reflect the deduction of taxes that a shareholder would pay on fund distributions or redemption of fund shares. |
KEY FACTS | ||
| Fund Size | $2,310,946,691 | |
| Number of Holdings | 717 | |
| Total Advisory Fee | $13,652,978 | |
| Portfolio Turnover | 29% |
(as of October 31, 2024)
| BBB | 4.8 |
| BB | 20.7 |
| B | 30.9 |
| CCC,CC,C | 6.6 |
| Not Rated | 2.9 |
| Equities | 22.3 |
| Short-Term Investments and Net Other Assets (Liabilities) | 11.8 |
QUALITY DIVERSIFICATION (% of Fund's net assets) |
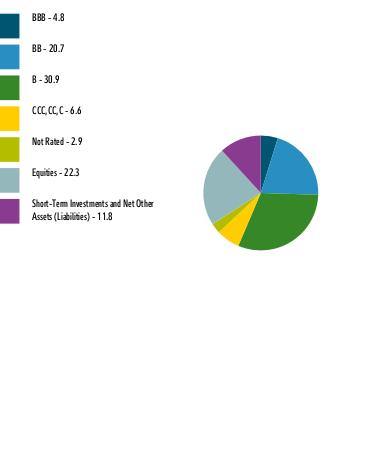 |
| We have used ratings from Moody's Investors Service, Inc. Where Moody's® ratings are not available, we have used S&P® ratings. All ratings are as of the date indicated and do not reflect subsequent changes. |
| Corporate Bonds | 51.5 |
| Common Stocks | 20.1 |
| Bank Loan Obligations | 10.1 |
| Preferred Securities | 4.1 |
| Alternative Funds | 2.2 |
| Asset-Backed Securities | 0.2 |
| Short-Term Investments and Net Other Assets (Liabilities) | 11.8 |
ASSET ALLOCATION (% of Fund's net assets) |
 |
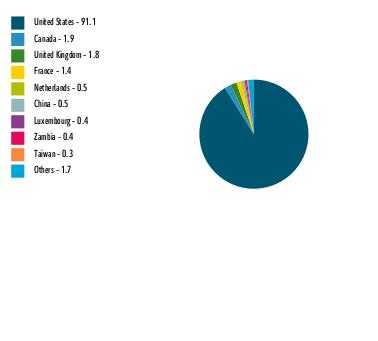
| United States | 91.1 |
| Canada | 1.9 |
| United Kingdom | 1.8 |
| France | 1.4 |
| Netherlands | 0.5 |
| China | 0.5 |
| Luxembourg | 0.4 |
| Zambia | 0.4 |
| Taiwan | 0.3 |
| Others | 1.7 |
GEOGRAPHIC DIVERSIFICATION (% of Fund's net assets) |
 |
TOP HOLDINGS (% of Fund's net assets) | ||
| TransDigm Inc | 2.6 | |
| Fidelity Private Credit Company LLC | 2.2 | |
| Energy Transfer LP | 2.1 | |
| NVIDIA Corp | 1.4 | |
| Tenet Healthcare Corp | 1.4 | |
| LBM Acquisition LLC | 1.2 | |
| Altice France SA | 1.1 | |
| eG Global Finance PLC | 1.1 | |
| Carnival Corp | 1.1 | |
| Meta Platforms Inc Class A | 1.1 | |
| 15.3 |
The fund's transfer agent and pricing and bookkeeping fees were changed to a fixed rate effective December 1, 2023, through February 29, 2024, in anticipation of the transition to a new management fee structure. Effective March 1, 2024, the fund's management contract was amended to incorporate administrative services previously covered under separate services agreements (transfer agent and pricing and bookkeeping). The amended contract incorporates a management fee rate that may vary by class. The Adviser or an affiliate pays certain expenses of managing and operating the fund out of each class's management fee. |
| Fidelity, the Fidelity Investments Logo and all other Fidelity trademarks or service marks used herein are trademarks or service marks of FMR LLC. Any third-party marks that are used herein are trademarks or service marks of their respective owners. © 2024 FMR LLC. All rights reserved. | ||
 | For additional information about the Fund; including its prospectus, financial information, holdings and proxy information, scan the QR code or visit fundresearch.fidelity.com/prospectus/sec 1.9913816.100 521-TSRA-1224 | |
ANNUAL SHAREHOLDER REPORT | AS OF OCTOBER 31, 2024 | This report describes changes to the Fund that occurred during the reporting period. | |
| | Fidelity Advisor® High Income Advantage Fund Fidelity Advisor® High Income Advantage Fund Class A : FAHDX | |
| Costs of a $10,000 investment | Costs paid as a percentage of a $10,000 investment | ||
| Class A | $ 105 | 0.97% |
Class A | $9,600 | $9,606 | $10,211 | $11,513 | $11,571 | $12,428 | $12,728 | $15,509 | $13,841 | $14,555 | $17,144 |
ICE® BofA® US High Yield Constrained Index | $10,000 | $9,797 | $10,795 | $11,781 | $11,883 | $12,872 | $13,187 | $14,602 | $12,932 | $13,683 | $15,939 |
Bloomberg U.S. Universal Bond Index | $10,000 | $10,167 | $10,682 | $10,870 | $10,658 | $11,869 | $12,576 | $12,636 | $10,641 | $10,768 | $11,974 |
| 2014 | 2015 | 2016 | 2017 | 2018 | 2019 | 2020 | 2021 | 2022 | 2023 | 2024 |
 |
| 1 Year | 5 Year | 10 Year | |
| Class A (incl. 4.00% sales charge) | 13.07% | 5.78% | 5.54% |
| Class A (without 4.00% sales charge) | 17.78% | 6.64% | 5.97% |
| ICE® BofA® US High Yield Constrained Index | 16.49% | 4.37% | 4.77% |
| Bloomberg U.S. Universal Bond Index | 11.20% | 0.18% | 1.82% |
Visit institutional.fidelity.com for more recent performance information. |
The Fund's past performance is not a good predictor of the Fund's future performance. The graph and table do not reflect the deduction of taxes that a shareholder would pay on fund distributions or redemption of fund shares. |
KEY FACTS | ||
| Fund Size | $2,310,946,691 | |
| Number of Holdings | 717 | |
| Total Advisory Fee | $13,652,978 | |
| Portfolio Turnover | 29% |
(as of October 31, 2024)
| BBB | 4.8 |
| BB | 20.7 |
| B | 30.9 |
| CCC,CC,C | 6.6 |
| Not Rated | 2.9 |
| Equities | 22.3 |
| Short-Term Investments and Net Other Assets (Liabilities) | 11.8 |
QUALITY DIVERSIFICATION (% of Fund's net assets) |
|
| We have used ratings from Moody's Investors Service, Inc. Where Moody's® ratings are not available, we have used S&P® ratings. All ratings are as of the date indicated and do not reflect subsequent changes. |
| Corporate Bonds | 51.5 |
| Common Stocks | 20.1 |
| Bank Loan Obligations | 10.1 |
| Preferred Securities | 4.1 |
| Alternative Funds | 2.2 |
| Asset-Backed Securities | 0.2 |
| Short-Term Investments and Net Other Assets (Liabilities) | 11.8 |
ASSET ALLOCATION (% of Fund's net assets) |
|
| United States | 91.1 |
| Canada | 1.9 |
| United Kingdom | 1.8 |
| France | 1.4 |
| Netherlands | 0.5 |
| China | 0.5 |
| Luxembourg | 0.4 |
| Zambia | 0.4 |
| Taiwan | 0.3 |
| Others | 1.7 |
GEOGRAPHIC DIVERSIFICATION (% of Fund's net assets) |
|
TOP HOLDINGS (% of Fund's net assets) | ||
| TransDigm Inc | 2.6 | |
| Fidelity Private Credit Company LLC | 2.2 | |
| Energy Transfer LP | 2.1 | |
| NVIDIA Corp | 1.4 | |
| Tenet Healthcare Corp | 1.4 | |
| LBM Acquisition LLC | 1.2 | |
| Altice France SA | 1.1 | |
| eG Global Finance PLC | 1.1 | |
| Carnival Corp | 1.1 | |
| Meta Platforms Inc Class A | 1.1 | |
| 15.3 |
The fund's transfer agent and pricing and bookkeeping fees were changed to a fixed rate effective December 1, 2023, through February 29, 2024, in anticipation of the transition to a new management fee structure. Effective March 1, 2024, the fund's management contract was amended to incorporate administrative services previously covered under separate services agreements (transfer agent and pricing and bookkeeping). The amended contract incorporates a management fee rate that may vary by class. The Adviser or an affiliate pays certain expenses of managing and operating the fund out of each class's management fee. |
| Fidelity, the Fidelity Investments Logo and all other Fidelity trademarks or service marks used herein are trademarks or service marks of FMR LLC. Any third-party marks that are used herein are trademarks or service marks of their respective owners. © 2024 FMR LLC. All rights reserved. | ||
 | For additional information about the Fund; including its prospectus, financial information, holdings and proxy information, scan the QR code or visit fundresearch.fidelity.com/prospectus/sec 1.9913814.100 258-TSRA-1224 | |
ANNUAL SHAREHOLDER REPORT | AS OF OCTOBER 31, 2024 | This report describes changes to the Fund that occurred during the reporting period. | |
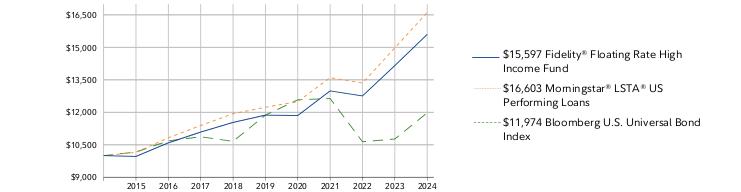
| | Fidelity Advisor® Floating Rate High Income Fund Fidelity® Floating Rate High Income Fund : FFRHX | |
| Costs of a $10,000 investment | Costs paid as a percentage of a $10,000 investment | ||
| Fidelity® Floating Rate High Income Fund | $ 70 | 0.66% |
Fidelity® Floating Rate High Income Fund | $10,000 | $9,964 | $10,590 | $11,088 | $11,533 | $11,870 | $11,853 | $12,988 | $12,756 | $14,158 | $15,597 |
Morningstar® LSTA® US Performing Loans | $10,000 | $10,151 | $10,824 | $11,392 | $11,936 | $12,235 | $12,491 | $13,602 | $13,349 | $14,977 | $16,603 |
Bloomberg U.S. Universal Bond Index | $10,000 | $10,167 | $10,682 | $10,870 | $10,658 | $11,869 | $12,576 | $12,636 | $10,641 | $10,768 | $11,974 |
| 2014 | 2015 | 2016 | 2017 | 2018 | 2019 | 2020 | 2021 | 2022 | 2023 | 2024 |
 |
| 1 Year | 5 Year | 10 Year | |
| Fidelity® Floating Rate High Income Fund | 10.16% | 5.61% | 4.54% |
| Morningstar® LSTA® US Performing Loans | 10.86% | 6.29% | 5.20% |
| Bloomberg U.S. Universal Bond Index | 11.20% | 0.18% | 1.82% |
Visit www.fidelity.com for more recent performance information. |
The Fund's past performance is not a good predictor of the Fund's future performance. The graph and table do not reflect the deduction of taxes that a shareholder would pay on fund distributions or redemption of fund shares. |
KEY FACTS | ||
| Fund Size | $14,682,141,753 | |
| Number of Holdings | 623 | |
| Total Advisory Fee | $84,188,738 | |
| Portfolio Turnover | 41% |
(as of October 31, 2024)
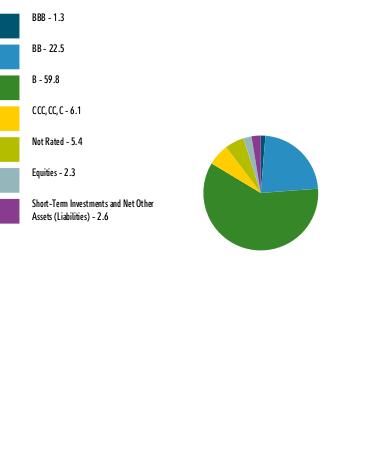
| BBB | 1.3 |
| BB | 22.5 |
| B | 59.8 |
| CCC,CC,C | 6.1 |
| Not Rated | 5.4 |
| Equities | 2.3 |
| Short-Term Investments and Net Other Assets (Liabilities) | 2.6 |
QUALITY DIVERSIFICATION (% of Fund's net assets) |
 |
| We have used ratings from Moody's Investors Service, Inc. Where Moody's® ratings are not available, we have used S&P® ratings. All ratings are as of the date indicated and do not reflect subsequent changes. |
| Bank Loan Obligations | 90.1 |
| Corporate Bonds | 4.5 |
| Common Stocks | 1.5 |
| Alternative Funds | 0.8 |
| Preferred Securities | 0.3 |
| Asset-Backed Securities | 0.2 |
| Short-Term Investments and Net Other Assets (Liabilities) | 2.6 |
ASSET ALLOCATION (% of Fund's net assets) |
 |
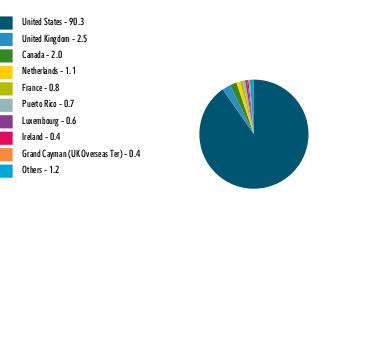
| United States | 90.3 |
| United Kingdom | 2.5 |
| Canada | 2.0 |
| Netherlands | 1.1 |
| France | 0.8 |
| Puerto Rico | 0.7 |
| Luxembourg | 0.6 |
| Ireland | 0.4 |
| Grand Cayman (UK Overseas Ter) | 0.4 |
| Others | 1.2 |
GEOGRAPHIC DIVERSIFICATION (% of Fund's net assets) |
 |
TOP HOLDINGS (% of Fund's net assets) | ||
| Asurion LLC | 2.2 | |
| Great Outdoors Group LLC | 2.2 | |
| Fertitta Entertainment LLC/NV | 1.2 | |
| Acrisure LLC | 1.2 | |
| Caesars Entertainment Inc | 1.2 | |
| Polaris Newco LLC | 1.0 | |
| MH Sub I LLC | 1.0 | |
| TransDigm Inc | 1.0 | |
| Medline Borrower LP | 0.9 | |
| UKG Inc | 0.9 | |
| 12.8 |
The fund's transfer agent and pricing & bookkeeping fees were changed to a fixed rate effective December 1, 2023, through February 29, 2024, in anticipation of the transition to a new management fee structure. Effective March 1, 2024, the fund's management contract was amended to incorporate administrative services previously covered under separate services agreements (transfer agent and pricing & bookkeeping). The amended contract incorporates a management fee rate that may vary by class. The Adviser or an affiliate pays certain expenses of managing and operating the fund out of each class's management fee. |
| Fidelity, the Fidelity Investments Logo and all other Fidelity trademarks or service marks used herein are trademarks or service marks of FMR LLC. Any third-party marks that are used herein are trademarks or service marks of their respective owners. © 2024 FMR LLC. All rights reserved. | ||
 | For additional information about the Fund; including its prospectus, financial information, holdings and proxy information, scan the QR code or visit fundresearch.fidelity.com/prospectus/sec 1.9913809.100 814-TSRA-1224 | |
ANNUAL SHAREHOLDER REPORT | AS OF OCTOBER 31, 2024 | This report describes changes to the Fund that occurred during the reporting period. | |
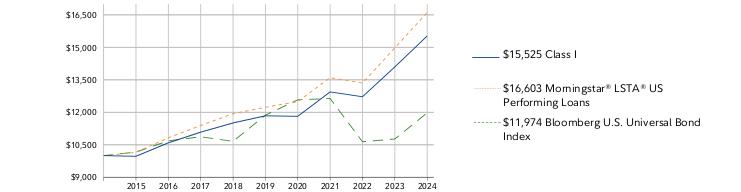
| | Fidelity Advisor® Floating Rate High Income Fund Fidelity Advisor® Floating Rate High Income Fund Class I : FFRIX | |
| Costs of a $10,000 investment | Costs paid as a percentage of a $10,000 investment | ||
| Class I | $ 72 | 0.68% |
Class I | $10,000 | $9,970 | $10,591 | $11,083 | $11,508 | $11,839 | $11,816 | $12,942 | $12,718 | $14,097 | $15,525 |
Morningstar® LSTA® US Performing Loans | $10,000 | $10,151 | $10,824 | $11,392 | $11,936 | $12,235 | $12,491 | $13,602 | $13,349 | $14,977 | $16,603 |
Bloomberg U.S. Universal Bond Index | $10,000 | $10,167 | $10,682 | $10,870 | $10,658 | $11,869 | $12,576 | $12,636 | $10,641 | $10,768 | $11,974 |
| 2014 | 2015 | 2016 | 2017 | 2018 | 2019 | 2020 | 2021 | 2022 | 2023 | 2024 |
 |
| 1 Year | 5 Year | 10 Year | |
| Class I | 10.13% | 5.57% | 4.50% |
| Morningstar® LSTA® US Performing Loans | 10.86% | 6.29% | 5.20% |
| Bloomberg U.S. Universal Bond Index | 11.20% | 0.18% | 1.82% |
Visit institutional.fidelity.com for more recent performance information. |
The Fund's past performance is not a good predictor of the Fund's future performance. The graph and table do not reflect the deduction of taxes that a shareholder would pay on fund distributions or redemption of fund shares. |
KEY FACTS | ||
| Fund Size | $14,682,141,753 | |
| Number of Holdings | 623 | |
| Total Advisory Fee | $84,188,738 | |
| Portfolio Turnover | 41% |
(as of October 31, 2024)
| BBB | 1.3 |
| BB | 22.5 |
| B | 59.8 |
| CCC,CC,C | 6.1 |
| Not Rated | 5.4 |
| Equities | 2.3 |
| Short-Term Investments and Net Other Assets (Liabilities) | 2.6 |
QUALITY DIVERSIFICATION (% of Fund's net assets) |
|
| We have used ratings from Moody's Investors Service, Inc. Where Moody's® ratings are not available, we have used S&P® ratings. All ratings are as of the date indicated and do not reflect subsequent changes. |
| Bank Loan Obligations | 90.1 |
| Corporate Bonds | 4.5 |
| Common Stocks | 1.5 |
| Alternative Funds | 0.8 |
| Preferred Securities | 0.3 |
| Asset-Backed Securities | 0.2 |
| Short-Term Investments and Net Other Assets (Liabilities) | 2.6 |
ASSET ALLOCATION (% of Fund's net assets) |
|
| United States | 90.3 |
| United Kingdom | 2.5 |
| Canada | 2.0 |
| Netherlands | 1.1 |
| France | 0.8 |
| Puerto Rico | 0.7 |
| Luxembourg | 0.6 |
| Ireland | 0.4 |
| Grand Cayman (UK Overseas Ter) | 0.4 |
| Others | 1.2 |
GEOGRAPHIC DIVERSIFICATION (% of Fund's net assets) |
|
TOP HOLDINGS (% of Fund's net assets) | ||
| Asurion LLC | 2.2 | |
| Great Outdoors Group LLC | 2.2 | |
| Fertitta Entertainment LLC/NV | 1.2 | |
| Acrisure LLC | 1.2 | |
| Caesars Entertainment Inc | 1.2 | |
| Polaris Newco LLC | 1.0 | |
| MH Sub I LLC | 1.0 | |
| TransDigm Inc | 1.0 | |
| Medline Borrower LP | 0.9 | |
| UKG Inc | 0.9 | |
| 12.8 |
The fund's transfer agent and pricing & bookkeeping fees were changed to a fixed rate effective December 1, 2023, through February 29, 2024, in anticipation of the transition to a new management fee structure. Effective March 1, 2024, the fund's management contract was amended to incorporate administrative services previously covered under separate services agreements (transfer agent and pricing & bookkeeping). The amended contract incorporates a management fee rate that may vary by class. The Adviser or an affiliate pays certain expenses of managing and operating the fund out of each class's management fee. |
| Fidelity, the Fidelity Investments Logo and all other Fidelity trademarks or service marks used herein are trademarks or service marks of FMR LLC. Any third-party marks that are used herein are trademarks or service marks of their respective owners. © 2024 FMR LLC. All rights reserved. | ||
 | For additional information about the Fund; including its prospectus, financial information, holdings and proxy information, scan the QR code or visit fundresearch.fidelity.com/prospectus/sec 1.9913807.100 279-TSRA-1224 | |
ANNUAL SHAREHOLDER REPORT | AS OF OCTOBER 31, 2024 | This report describes changes to the Fund that occurred during the reporting period. | |
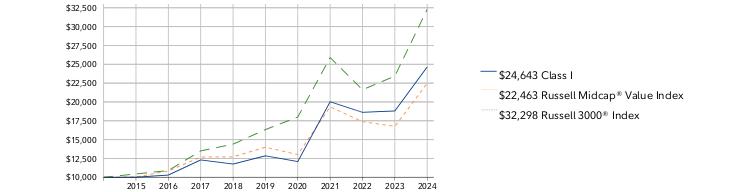
| | Fidelity Advisor® Value Fund Fidelity Advisor® Value Fund Class I : FVIFX | |
| Costs of a $10,000 investment | Costs paid as a percentage of a $10,000 investment | ||
| Class I | $ 104 | 0.90% |
Class I | $10,000 | $10,013 | $10,295 | $12,307 | $11,755 | $12,852 | $12,087 | $20,026 | $18,626 | $18,806 | $24,643 |
Russell Midcap® Value Index | $10,000 | $10,047 | $10,834 | $12,689 | $12,710 | $13,990 | $13,020 | $19,347 | $17,379 | $16,759 | $22,463 |
Russell 3000® Index | $10,000 | $10,449 | $10,892 | $13,504 | $14,395 | $16,337 | $17,995 | $25,894 | $21,617 | $23,429 | $32,298 |
| 2014 | 2015 | 2016 | 2017 | 2018 | 2019 | 2020 | 2021 | 2022 | 2023 | 2024 |
 |
| 1 Year | 5 Year | 10 Year | |
| Class I | 31.04% | 13.90% | 9.44% |
| Russell Midcap® Value Index | 34.03% | 9.93% | 8.43% |
| Russell 3000® Index | 37.86% | 14.60% | 12.44% |
Visit institutional.fidelity.com for more recent performance information. |
The Fund's past performance is not a good predictor of the Fund's future performance. The graph and table do not reflect the deduction of taxes that a shareholder would pay on fund distributions or redemption of fund shares. |
KEY FACTS | ||
| Fund Size | $380,025,415 | |
| Number of Holdings | 268 | |
| Total Advisory Fee | $2,906,123 | |
| Portfolio Turnover | 80% |
(as of October 31, 2024)
MARKET SECTORS (% of Fund's net assets) | ||
| Industrials | 19.2 | |
| Financials | 16.7 | |
| Consumer Discretionary | 10.3 | |
| Materials | 10.3 | |
| Energy | 9.2 | |
| Health Care | 8.8 | |
| Utilities | 6.9 | |
| Real Estate | 5.3 | |
| Consumer Staples | 5.2 | |
| Information Technology | 4.3 | |
| Communication Services | 2.8 | |
| Common Stocks | 99.0 |
| Short-Term Investments and Net Other Assets (Liabilities) | 1.0 |
ASSET ALLOCATION (% of Fund's net assets) |
|
| United States | 86.3 |
| Canada | 6.0 |
| United Kingdom | 1.2 |
| Germany | 1.1 |
| Puerto Rico | 0.6 |
| Belgium | 0.6 |
| Zambia | 0.6 |
| India | 0.5 |
| France | 0.5 |
| Others | 2.6 |
GEOGRAPHIC DIVERSIFICATION (% of Fund's net assets) |
|
TOP HOLDINGS (% of Fund's net assets) | ||
| PG&E Corp | 1.2 | |
| Vistra Corp | 1.2 | |
| Ventas Inc | 1.0 | |
| Global Payments Inc | 1.0 | |
| Molina Healthcare Inc | 0.9 | |
| Smurfit WestRock PLC | 0.9 | |
| Lithia Motors Inc Class A | 0.9 | |
| Lumentum Holdings Inc | 0.8 | |
| International Paper Co | 0.8 | |
| Lamb Weston Holdings Inc | 0.8 | |
| 9.5 |
The fund's transfer agent and pricing & bookkeeping fees were changed to a fixed rate effective December 1, 2023, through February 29, 2024, in anticipation of the transition to a new management fee structure. Effective March 1, 2024, the fund's management contract was amended to incorporate administrative services previously covered under separate services agreements (transfer agent and pricing & bookkeeping). The amended contract incorporates a basic fee rate that may vary by class (subject to a performance adjustment). The Adviser or an affiliate pays certain expenses of managing and operating the fund out of each class's management fee. |
| Fidelity, the Fidelity Investments Logo and all other Fidelity trademarks or service marks used herein are trademarks or service marks of FMR LLC. Any third-party marks that are used herein are trademarks or service marks of their respective owners. © 2024 FMR LLC. All rights reserved. | ||
 | For additional information about the Fund; including its prospectus, financial information, holdings and proxy information, scan the QR code or visit fundresearch.fidelity.com/prospectus/sec 1.9913928.100 1320-TSRA-1224 | |
ANNUAL SHAREHOLDER REPORT | AS OF OCTOBER 31, 2024 | This report describes changes to the Fund that occurred during the reporting period. | |
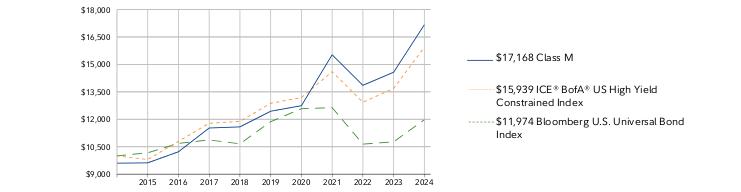
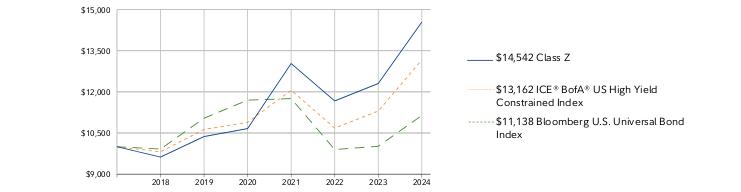
| | Fidelity Advisor® High Income Advantage Fund Fidelity Advisor® High Income Advantage Fund Class M : FAHYX | |
| Costs of a $10,000 investment | Costs paid as a percentage of a $10,000 investment | ||
| Class M | $ 104 | 0.96% |
Class M | $9,600 | $9,617 | $10,223 | $11,523 | $11,584 | $12,440 | $12,742 | $15,525 | $13,856 | $14,572 | $17,168 |
ICE® BofA® US High Yield Constrained Index | $10,000 | $9,797 | $10,795 | $11,781 | $11,883 | $12,872 | $13,187 | $14,602 | $12,932 | $13,683 | $15,939 |
Bloomberg U.S. Universal Bond Index | $10,000 | $10,167 | $10,682 | $10,870 | $10,658 | $11,869 | $12,576 | $12,636 | $10,641 | $10,768 | $11,974 |
| 2014 | 2015 | 2016 | 2017 | 2018 | 2019 | 2020 | 2021 | 2022 | 2023 | 2024 |
 |
| 1 Year | 5 Year | 10 Year | |
| Class M (incl. 4.00% sales charge) | 13.10% | 5.79% | 5.55% |
| Class M (without 4.00% sales charge) | 17.82% | 6.65% | 5.98% |
| ICE® BofA® US High Yield Constrained Index | 16.49% | 4.37% | 4.77% |
| Bloomberg U.S. Universal Bond Index | 11.20% | 0.18% | 1.82% |
Visit institutional.fidelity.com for more recent performance information. |
The Fund's past performance is not a good predictor of the Fund's future performance. The graph and table do not reflect the deduction of taxes that a shareholder would pay on fund distributions or redemption of fund shares. |
KEY FACTS | ||
| Fund Size | $2,310,946,691 | |
| Number of Holdings | 717 | |
| Total Advisory Fee | $13,652,978 | |
| Portfolio Turnover | 29% |
(as of October 31, 2024)
| BBB | 4.8 |
| BB | 20.7 |
| B | 30.9 |
| CCC,CC,C | 6.6 |
| Not Rated | 2.9 |
| Equities | 22.3 |
| Short-Term Investments and Net Other Assets (Liabilities) | 11.8 |
QUALITY DIVERSIFICATION (% of Fund's net assets) |
|
| We have used ratings from Moody's Investors Service, Inc. Where Moody's® ratings are not available, we have used S&P® ratings. All ratings are as of the date indicated and do not reflect subsequent changes. |
| Corporate Bonds | 51.5 |
| Common Stocks | 20.1 |
| Bank Loan Obligations | 10.1 |
| Preferred Securities | 4.1 |
| Alternative Funds | 2.2 |
| Asset-Backed Securities | 0.2 |
| Short-Term Investments and Net Other Assets (Liabilities) | 11.8 |
ASSET ALLOCATION (% of Fund's net assets) |
|
| United States | 91.1 |
| Canada | 1.9 |
| United Kingdom | 1.8 |
| France | 1.4 |
| Netherlands | 0.5 |
| China | 0.5 |
| Luxembourg | 0.4 |
| Zambia | 0.4 |
| Taiwan | 0.3 |
| Others | 1.7 |
GEOGRAPHIC DIVERSIFICATION (% of Fund's net assets) |
|
TOP HOLDINGS (% of Fund's net assets) | ||
| TransDigm Inc | 2.6 | |
| Fidelity Private Credit Company LLC | 2.2 | |
| Energy Transfer LP | 2.1 | |
| NVIDIA Corp | 1.4 | |
| Tenet Healthcare Corp | 1.4 | |
| LBM Acquisition LLC | 1.2 | |
| Altice France SA | 1.1 | |
| eG Global Finance PLC | 1.1 | |
| Carnival Corp | 1.1 | |
| Meta Platforms Inc Class A | 1.1 | |
| 15.3 |
The fund's transfer agent and pricing and bookkeeping fees were changed to a fixed rate effective December 1, 2023, through February 29, 2024, in anticipation of the transition to a new management fee structure. Effective March 1, 2024, the fund's management contract was amended to incorporate administrative services previously covered under separate services agreements (transfer agent and pricing and bookkeeping). The amended contract incorporates a management fee rate that may vary by class. The Adviser or an affiliate pays certain expenses of managing and operating the fund out of each class's management fee. |
| Fidelity, the Fidelity Investments Logo and all other Fidelity trademarks or service marks used herein are trademarks or service marks of FMR LLC. Any third-party marks that are used herein are trademarks or service marks of their respective owners. © 2024 FMR LLC. All rights reserved. | ||
 | For additional information about the Fund; including its prospectus, financial information, holdings and proxy information, scan the QR code or visit fundresearch.fidelity.com/prospectus/sec 1.9913813.100 218-TSRA-1224 | |
ANNUAL SHAREHOLDER REPORT | AS OF OCTOBER 31, 2024 | This report describes changes to the Fund that occurred during the reporting period. | |
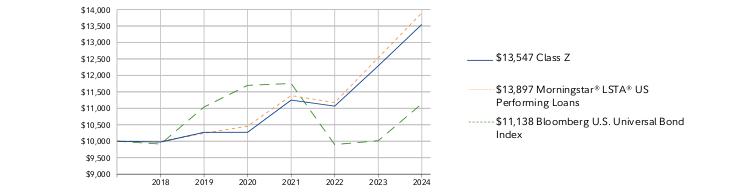
| | Fidelity Advisor® Floating Rate High Income Fund Fidelity Advisor® Floating Rate High Income Fund Class Z : FIQSX | |
| Costs of a $10,000 investment | Costs paid as a percentage of a $10,000 investment | ||
| Class Z | $ 61 | 0.58% |
Class Z | $10,000 | $9,974 | $10,271 | $10,272 | $11,249 | $11,066 | $12,289 |
Morningstar® LSTA® US Performing Loans | $10,000 | $9,991 | $10,242 | $10,456 | $11,386 | $11,174 | $12,536 |
Bloomberg U.S. Universal Bond Index | $10,000 | $9,913 | $11,039 | $11,697 | $11,754 | $9,898 | $10,016 |
| 2018 | 2019 | 2020 | 2021 | 2022 | 2023 | 2024 |
 |
| 1 Year | 5 Year | Life of Fund A | |
| Class Z | 10.24% | 5.69% | 5.12% |
| Morningstar® LSTA® US Performing Loans | 10.86% | 6.29% | 5.56% |
| Bloomberg U.S. Universal Bond Index | 11.20% | 0.18% | 1.79% |
Visit institutional.fidelity.com for more recent performance information. |
The Fund's past performance is not a good predictor of the Fund's future performance. The graph and table do not reflect the deduction of taxes that a shareholder would pay on fund distributions or redemption of fund shares. |
KEY FACTS | ||
| Fund Size | $14,682,141,753 | |
| Number of Holdings | 623 | |
| Total Advisory Fee | $84,188,738 | |
| Portfolio Turnover | 41% |
(as of October 31, 2024)
| BBB | 1.3 |
| BB | 22.5 |
| B | 59.8 |
| CCC,CC,C | 6.1 |
| Not Rated | 5.4 |
| Equities | 2.3 |
| Short-Term Investments and Net Other Assets (Liabilities) | 2.6 |
QUALITY DIVERSIFICATION (% of Fund's net assets) |
|
| We have used ratings from Moody's Investors Service, Inc. Where Moody's® ratings are not available, we have used S&P® ratings. All ratings are as of the date indicated and do not reflect subsequent changes. |
| Bank Loan Obligations | 90.1 |
| Corporate Bonds | 4.5 |
| Common Stocks | 1.5 |
| Alternative Funds | 0.8 |
| Preferred Securities | 0.3 |
| Asset-Backed Securities | 0.2 |
| Short-Term Investments and Net Other Assets (Liabilities) | 2.6 |
ASSET ALLOCATION (% of Fund's net assets) |
|
| United States | 90.3 |
| United Kingdom | 2.5 |
| Canada | 2.0 |
| Netherlands | 1.1 |
| France | 0.8 |
| Puerto Rico | 0.7 |
| Luxembourg | 0.6 |
| Ireland | 0.4 |
| Grand Cayman (UK Overseas Ter) | 0.4 |
| Others | 1.2 |
GEOGRAPHIC DIVERSIFICATION (% of Fund's net assets) |
|
TOP HOLDINGS (% of Fund's net assets) | ||
| Asurion LLC | 2.2 | |
| Great Outdoors Group LLC | 2.2 | |
| Fertitta Entertainment LLC/NV | 1.2 | |
| Acrisure LLC | 1.2 | |
| Caesars Entertainment Inc | 1.2 | |
| Polaris Newco LLC | 1.0 | |
| MH Sub I LLC | 1.0 | |
| TransDigm Inc | 1.0 | |
| Medline Borrower LP | 0.9 | |
| UKG Inc | 0.9 | |
| 12.8 |
The fund's transfer agent and pricing & bookkeeping fees were changed to a fixed rate effective December 1, 2023, through February 29, 2024, in anticipation of the transition to a new management fee structure. Effective March 1, 2024, the fund's management contract was amended to incorporate administrative services previously covered under separate services agreements (transfer agent and pricing & bookkeeping). The amended contract incorporates a management fee rate that may vary by class. The Adviser or an affiliate pays certain expenses of managing and operating the fund out of each class's management fee. |
| Fidelity, the Fidelity Investments Logo and all other Fidelity trademarks or service marks used herein are trademarks or service marks of FMR LLC. Any third-party marks that are used herein are trademarks or service marks of their respective owners. © 2024 FMR LLC. All rights reserved. | ||
 | For additional information about the Fund; including its prospectus, financial information, holdings and proxy information, scan the QR code or visit fundresearch.fidelity.com/prospectus/sec 1.9913808.100 3277-TSRA-1224 | |
ANNUAL SHAREHOLDER REPORT | AS OF OCTOBER 31, 2024 | This report describes changes to the Fund that occurred during the reporting period. | |
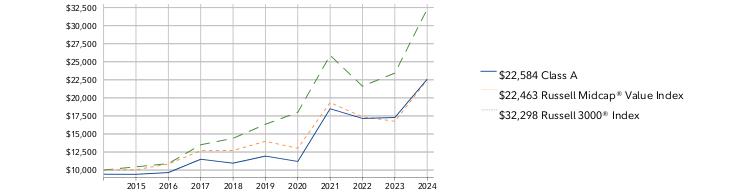
| | Fidelity Advisor® Value Fund Fidelity Advisor® Value Fund Class A : FAVFX | |
| Costs of a $10,000 investment | Costs paid as a percentage of a $10,000 investment | ||
| Class A | $ 133 | 1.15% |
Class A | $9,425 | $9,414 | $9,652 | $11,497 | $10,953 | $11,939 | $11,194 | $18,493 | $17,152 | $17,277 | $22,584 |
Russell Midcap® Value Index | $10,000 | $10,047 | $10,834 | $12,689 | $12,710 | $13,990 | $13,020 | $19,347 | $17,379 | $16,759 | $22,463 |
Russell 3000® Index | $10,000 | $10,449 | $10,892 | $13,504 | $14,395 | $16,337 | $17,995 | $25,894 | $21,617 | $23,429 | $32,298 |
| 2014 | 2015 | 2016 | 2017 | 2018 | 2019 | 2020 | 2021 | 2022 | 2023 | 2024 |
 |
| 1 Year | 5 Year | 10 Year | |
| Class A (incl. 5.75% sales charge) | 23.20% | 12.26% | 8.49% |
| Class A (without 5.75% sales charge) | 30.72% | 13.60% | 9.13% |
| Russell Midcap® Value Index | 34.03% | 9.93% | 8.43% |
| Russell 3000® Index | 37.86% | 14.60% | 12.44% |
Visit institutional.fidelity.com for more recent performance information. |
The Fund's past performance is not a good predictor of the Fund's future performance. The graph and table do not reflect the deduction of taxes that a shareholder would pay on fund distributions or redemption of fund shares. |
KEY FACTS | ||
| Fund Size | $380,025,415 | |
| Number of Holdings | 268 | |
| Total Advisory Fee | $2,906,123 | |
| Portfolio Turnover | 80% |
(as of October 31, 2024)
MARKET SECTORS (% of Fund's net assets) | ||
| Industrials | 19.2 | |
| Financials | 16.7 | |
| Consumer Discretionary | 10.3 | |
| Materials | 10.3 | |
| Energy | 9.2 | |
| Health Care | 8.8 | |
| Utilities | 6.9 | |
| Real Estate | 5.3 | |
| Consumer Staples | 5.2 | |
| Information Technology | 4.3 | |
| Communication Services | 2.8 | |
| Common Stocks | 99.0 |
| Short-Term Investments and Net Other Assets (Liabilities) | 1.0 |
ASSET ALLOCATION (% of Fund's net assets) |
|
| United States | 86.3 |
| Canada | 6.0 |
| United Kingdom | 1.2 |
| Germany | 1.1 |
| Puerto Rico | 0.6 |
| Belgium | 0.6 |
| Zambia | 0.6 |
| India | 0.5 |
| France | 0.5 |
| Others | 2.6 |
GEOGRAPHIC DIVERSIFICATION (% of Fund's net assets) |
|
TOP HOLDINGS (% of Fund's net assets) | ||
| PG&E Corp | 1.2 | |
| Vistra Corp | 1.2 | |
| Ventas Inc | 1.0 | |
| Global Payments Inc | 1.0 | |
| Molina Healthcare Inc | 0.9 | |
| Smurfit WestRock PLC | 0.9 | |
| Lithia Motors Inc Class A | 0.9 | |
| Lumentum Holdings Inc | 0.8 | |
| International Paper Co | 0.8 | |
| Lamb Weston Holdings Inc | 0.8 | |
| 9.5 |
The fund's transfer agent and pricing & bookkeeping fees were changed to a fixed rate effective December 1, 2023, through February 29, 2024, in anticipation of the transition to a new management fee structure. Effective March 1, 2024, the fund's management contract was amended to incorporate administrative services previously covered under separate services agreements (transfer agent and pricing & bookkeeping). The amended contract incorporates a basic fee rate that may vary by class (subject to a performance adjustment). The Adviser or an affiliate pays certain expenses of managing and operating the fund out of each class's management fee. |
| Fidelity, the Fidelity Investments Logo and all other Fidelity trademarks or service marks used herein are trademarks or service marks of FMR LLC. Any third-party marks that are used herein are trademarks or service marks of their respective owners. © 2024 FMR LLC. All rights reserved. | ||
 | For additional information about the Fund; including its prospectus, financial information, holdings and proxy information, scan the QR code or visit fundresearch.fidelity.com/prospectus/sec 1.9913925.100 1316-TSRA-1224 | |
ANNUAL SHAREHOLDER REPORT | AS OF OCTOBER 31, 2024 | This report describes changes to the Fund that occurred during the reporting period. | |
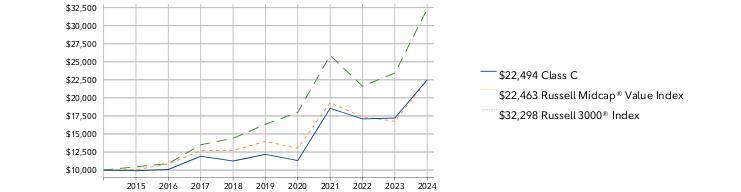
| | Fidelity Advisor® Value Fund Fidelity Advisor® Value Fund Class C : FCVFX | |
| Costs of a $10,000 investment | Costs paid as a percentage of a $10,000 investment | ||
| Class C | $ 218 | 1.90% |
Class C | $10,000 | $9,911 | $10,082 | $11,917 | $11,256 | $12,171 | $11,317 | $18,557 | $17,084 | $17,208 | $22,494 |
Russell Midcap® Value Index | $10,000 | $10,047 | $10,834 | $12,689 | $12,710 | $13,990 | $13,020 | $19,347 | $17,379 | $16,759 | $22,463 |
Russell 3000® Index | $10,000 | $10,449 | $10,892 | $13,504 | $14,395 | $16,337 | $17,995 | $25,894 | $21,617 | $23,429 | $32,298 |
| 2014 | 2015 | 2016 | 2017 | 2018 | 2019 | 2020 | 2021 | 2022 | 2023 | 2024 |
 |
| 1 Year | 5 Year | 10 Year | |
| Class C (incl. contingent deferred sales charge) | 28.70% | 12.73% | 8.44% |
| Class C | 29.70% | 12.73% | 8.44% |
| Russell Midcap® Value Index | 34.03% | 9.93% | 8.43% |
| Russell 3000® Index | 37.86% | 14.60% | 12.44% |
Visit institutional.fidelity.com for more recent performance information. |
The Fund's past performance is not a good predictor of the Fund's future performance. The graph and table do not reflect the deduction of taxes that a shareholder would pay on fund distributions or redemption of fund shares. |
KEY FACTS | ||
| Fund Size | $380,025,415 | |
| Number of Holdings | 268 | |
| Total Advisory Fee | $2,906,123 | |
| Portfolio Turnover | 80% |
(as of October 31, 2024)
MARKET SECTORS (% of Fund's net assets) | ||
| Industrials | 19.2 | |
| Financials | 16.7 | |
| Consumer Discretionary | 10.3 | |
| Materials | 10.3 | |
| Energy | 9.2 | |
| Health Care | 8.8 | |
| Utilities | 6.9 | |
| Real Estate | 5.3 | |
| Consumer Staples | 5.2 | |
| Information Technology | 4.3 | |
| Communication Services | 2.8 | |
| Common Stocks | 99.0 |
| Short-Term Investments and Net Other Assets (Liabilities) | 1.0 |
ASSET ALLOCATION (% of Fund's net assets) |
|
| United States | 86.3 |
| Canada | 6.0 |
| United Kingdom | 1.2 |
| Germany | 1.1 |
| Puerto Rico | 0.6 |
| Belgium | 0.6 |
| Zambia | 0.6 |
| India | 0.5 |
| France | 0.5 |
| Others | 2.6 |
GEOGRAPHIC DIVERSIFICATION (% of Fund's net assets) |
|
TOP HOLDINGS (% of Fund's net assets) | ||
| PG&E Corp | 1.2 | |
| Vistra Corp | 1.2 | |
| Ventas Inc | 1.0 | |
| Global Payments Inc | 1.0 | |
| Molina Healthcare Inc | 0.9 | |
| Smurfit WestRock PLC | 0.9 | |
| Lithia Motors Inc Class A | 0.9 | |
| Lumentum Holdings Inc | 0.8 | |
| International Paper Co | 0.8 | |
| Lamb Weston Holdings Inc | 0.8 | |
| 9.5 |
The fund's transfer agent and pricing & bookkeeping fees were changed to a fixed rate effective December 1, 2023, through February 29, 2024, in anticipation of the transition to a new management fee structure. Effective March 1, 2024, the fund's management contract was amended to incorporate administrative services previously covered under separate services agreements (transfer agent and pricing & bookkeeping). The amended contract incorporates a basic fee rate that may vary by class (subject to a performance adjustment). The Adviser or an affiliate pays certain expenses of managing and operating the fund out of each class's management fee. |
| Fidelity, the Fidelity Investments Logo and all other Fidelity trademarks or service marks used herein are trademarks or service marks of FMR LLC. Any third-party marks that are used herein are trademarks or service marks of their respective owners. © 2024 FMR LLC. All rights reserved. | ||
 | For additional information about the Fund; including its prospectus, financial information, holdings and proxy information, scan the QR code or visit fundresearch.fidelity.com/prospectus/sec 1.9913926.100 1318-TSRA-1224 | |
ANNUAL SHAREHOLDER REPORT | AS OF OCTOBER 31, 2024 | This report describes changes to the Fund that occurred during the reporting period. | |
| | Fidelity Advisor® Floating Rate High Income Fund Fidelity Advisor® Floating Rate High Income Fund Class A : FFRAX | |
| Costs of a $10,000 investment | Costs paid as a percentage of a $10,000 investment | ||
| Class A | $ 99 | 0.94% |
Class A | $9,725 | $9,674 | $10,252 | $10,703 | $11,089 | $11,380 | $11,329 | $12,376 | $12,133 | $13,413 | $14,733 |
Morningstar® LSTA® US Performing Loans | $10,000 | $10,151 | $10,824 | $11,392 | $11,936 | $12,235 | $12,491 | $13,602 | $13,349 | $14,977 | $16,603 |
Bloomberg U.S. Universal Bond Index | $10,000 | $10,167 | $10,682 | $10,870 | $10,658 | $11,869 | $12,576 | $12,636 | $10,641 | $10,768 | $11,974 |
| 2014 | 2015 | 2016 | 2017 | 2018 | 2019 | 2020 | 2021 | 2022 | 2023 | 2024 |
 |
| 1 Year | 5 Year | 10 Year | |
| Class A (incl. 2.75% sales charge) | 6.82% | 4.72% | 3.95% |
| Class A (without 2.75% sales charge) | 9.85% | 5.30% | 4.24% |
| Morningstar® LSTA® US Performing Loans | 10.86% | 6.29% | 5.20% |
| Bloomberg U.S. Universal Bond Index | 11.20% | 0.18% | 1.82% |
Visit institutional.fidelity.com for more recent performance information. |
The Fund's past performance is not a good predictor of the Fund's future performance. The graph and table do not reflect the deduction of taxes that a shareholder would pay on fund distributions or redemption of fund shares. |
KEY FACTS | ||
| Fund Size | $14,682,141,753 | |
| Number of Holdings | 623 | |
| Total Advisory Fee | $84,188,738 | |
| Portfolio Turnover | 41% |
(as of October 31, 2024)
| BBB | 1.3 |
| BB | 22.5 |
| B | 59.8 |
| CCC,CC,C | 6.1 |
| Not Rated | 5.4 |
| Equities | 2.3 |
| Short-Term Investments and Net Other Assets (Liabilities) | 2.6 |
QUALITY DIVERSIFICATION (% of Fund's net assets) |
|
| We have used ratings from Moody's Investors Service, Inc. Where Moody's® ratings are not available, we have used S&P® ratings. All ratings are as of the date indicated and do not reflect subsequent changes. |
| Bank Loan Obligations | 90.1 |
| Corporate Bonds | 4.5 |
| Common Stocks | 1.5 |
| Alternative Funds | 0.8 |
| Preferred Securities | 0.3 |
| Asset-Backed Securities | 0.2 |
| Short-Term Investments and Net Other Assets (Liabilities) | 2.6 |
ASSET ALLOCATION (% of Fund's net assets) |
|
| United States | 90.3 |
| United Kingdom | 2.5 |
| Canada | 2.0 |
| Netherlands | 1.1 |
| France | 0.8 |
| Puerto Rico | 0.7 |
| Luxembourg | 0.6 |
| Ireland | 0.4 |
| Grand Cayman (UK Overseas Ter) | 0.4 |
| Others | 1.2 |
GEOGRAPHIC DIVERSIFICATION (% of Fund's net assets) |
|
TOP HOLDINGS (% of Fund's net assets) | ||
| Asurion LLC | 2.2 | |
| Great Outdoors Group LLC | 2.2 | |
| Fertitta Entertainment LLC/NV | 1.2 | |
| Acrisure LLC | 1.2 | |
| Caesars Entertainment Inc | 1.2 | |
| Polaris Newco LLC | 1.0 | |
| MH Sub I LLC | 1.0 | |
| TransDigm Inc | 1.0 | |
| Medline Borrower LP | 0.9 | |
| UKG Inc | 0.9 | |
| 12.8 |
The fund's transfer agent and pricing & bookkeeping fees were changed to a fixed rate effective December 1, 2023, through February 29, 2024, in anticipation of the transition to a new management fee structure. Effective March 1, 2024, the fund's management contract was amended to incorporate administrative services previously covered under separate services agreements (transfer agent and pricing & bookkeeping). The amended contract incorporates a management fee rate that may vary by class. The Adviser or an affiliate pays certain expenses of managing and operating the fund out of each class's management fee. |
| Fidelity, the Fidelity Investments Logo and all other Fidelity trademarks or service marks used herein are trademarks or service marks of FMR LLC. Any third-party marks that are used herein are trademarks or service marks of their respective owners. © 2024 FMR LLC. All rights reserved. | ||
 | For additional information about the Fund; including its prospectus, financial information, holdings and proxy information, scan the QR code or visit fundresearch.fidelity.com/prospectus/sec 1.9913810.100 861-TSRA-1224 | |
ANNUAL SHAREHOLDER REPORT | AS OF OCTOBER 31, 2024 | This report describes changes to the Fund that occurred during the reporting period. | |
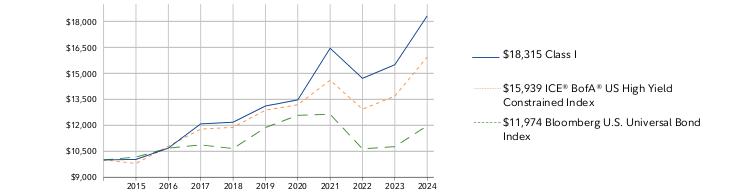
| | Fidelity Advisor® High Income Advantage Fund Fidelity Advisor® High Income Advantage Fund Class I : FAHCX | |
| Costs of a $10,000 investment | Costs paid as a percentage of a $10,000 investment | ||
| Class I | $ 80 | 0.73% |
Class I | $10,000 | $10,031 | $10,686 | $12,082 | $12,178 | $13,113 | $13,466 | $16,447 | $14,710 | $15,497 | $18,315 |
ICE® BofA® US High Yield Constrained Index | $10,000 | $9,797 | $10,795 | $11,781 | $11,883 | $12,872 | $13,187 | $14,602 | $12,932 | $13,683 | $15,939 |
Bloomberg U.S. Universal Bond Index | $10,000 | $10,167 | $10,682 | $10,870 | $10,658 | $11,869 | $12,576 | $12,636 | $10,641 | $10,768 | $11,974 |
| 2014 | 2015 | 2016 | 2017 | 2018 | 2019 | 2020 | 2021 | 2022 | 2023 | 2024 |
 |
| 1 Year | 5 Year | 10 Year | |
| Class I | 18.18% | 6.91% | 6.24% |
| ICE® BofA® US High Yield Constrained Index | 16.49% | 4.37% | 4.77% |
| Bloomberg U.S. Universal Bond Index | 11.20% | 0.18% | 1.82% |
Visit institutional.fidelity.com for more recent performance information. |
The Fund's past performance is not a good predictor of the Fund's future performance. The graph and table do not reflect the deduction of taxes that a shareholder would pay on fund distributions or redemption of fund shares. |
KEY FACTS | ||
| Fund Size | $2,310,946,691 | |
| Number of Holdings | 717 | |
| Total Advisory Fee | $13,652,978 | |
| Portfolio Turnover | 29% |
(as of October 31, 2024)
| BBB | 4.8 |
| BB | 20.7 |
| B | 30.9 |
| CCC,CC,C | 6.6 |
| Not Rated | 2.9 |
| Equities | 22.3 |
| Short-Term Investments and Net Other Assets (Liabilities) | 11.8 |
QUALITY DIVERSIFICATION (% of Fund's net assets) |
|
| We have used ratings from Moody's Investors Service, Inc. Where Moody's® ratings are not available, we have used S&P® ratings. All ratings are as of the date indicated and do not reflect subsequent changes. |
| Corporate Bonds | 51.5 |
| Common Stocks | 20.1 |
| Bank Loan Obligations | 10.1 |
| Preferred Securities | 4.1 |
| Alternative Funds | 2.2 |
| Asset-Backed Securities | 0.2 |
| Short-Term Investments and Net Other Assets (Liabilities) | 11.8 |
ASSET ALLOCATION (% of Fund's net assets) |
|
| United States | 91.1 |
| Canada | 1.9 |
| United Kingdom | 1.8 |
| France | 1.4 |
| Netherlands | 0.5 |
| China | 0.5 |
| Luxembourg | 0.4 |
| Zambia | 0.4 |
| Taiwan | 0.3 |
| Others | 1.7 |
GEOGRAPHIC DIVERSIFICATION (% of Fund's net assets) |
|
TOP HOLDINGS (% of Fund's net assets) | ||
| TransDigm Inc | 2.6 | |
| Fidelity Private Credit Company LLC | 2.2 | |
| Energy Transfer LP | 2.1 | |
| NVIDIA Corp | 1.4 | |
| Tenet Healthcare Corp | 1.4 | |
| LBM Acquisition LLC | 1.2 | |
| Altice France SA | 1.1 | |
| eG Global Finance PLC | 1.1 | |
| Carnival Corp | 1.1 | |
| Meta Platforms Inc Class A | 1.1 | |
| 15.3 |
The fund's transfer agent and pricing and bookkeeping fees were changed to a fixed rate effective December 1, 2023, through February 29, 2024, in anticipation of the transition to a new management fee structure. Effective March 1, 2024, the fund's management contract was amended to incorporate administrative services previously covered under separate services agreements (transfer agent and pricing and bookkeeping). The amended contract incorporates a management fee rate that may vary by class. The Adviser or an affiliate pays certain expenses of managing and operating the fund out of each class's management fee. |
| Fidelity, the Fidelity Investments Logo and all other Fidelity trademarks or service marks used herein are trademarks or service marks of FMR LLC. Any third-party marks that are used herein are trademarks or service marks of their respective owners. © 2024 FMR LLC. All rights reserved. | ||
 | For additional information about the Fund; including its prospectus, financial information, holdings and proxy information, scan the QR code or visit fundresearch.fidelity.com/prospectus/sec 1.9913817.100 644-TSRA-1224 | |
ANNUAL SHAREHOLDER REPORT | AS OF OCTOBER 31, 2024 | This report describes changes to the Fund that occurred during the reporting period. | |
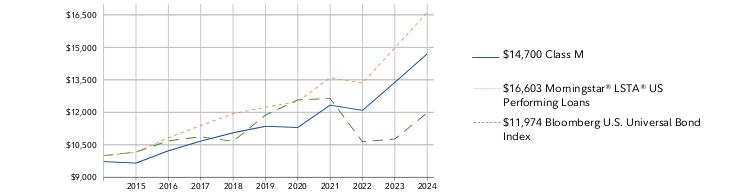
| | Fidelity Advisor® Floating Rate High Income Fund Fidelity Advisor® Floating Rate High Income Fund Class M : FFRTX | |
| Costs of a $10,000 investment | Costs paid as a percentage of a $10,000 investment | ||
| Class M | $ 97 | 0.93% |
Class M | $9,725 | $9,655 | $10,223 | $10,670 | $11,053 | $11,354 | $11,301 | $12,332 | $12,089 | $13,381 | $14,700 |
Morningstar® LSTA® US Performing Loans | $10,000 | $10,151 | $10,824 | $11,392 | $11,936 | $12,235 | $12,491 | $13,602 | $13,349 | $14,977 | $16,603 |
Bloomberg U.S. Universal Bond Index | $10,000 | $10,167 | $10,682 | $10,870 | $10,658 | $11,869 | $12,576 | $12,636 | $10,641 | $10,768 | $11,974 |
| 2014 | 2015 | 2016 | 2017 | 2018 | 2019 | 2020 | 2021 | 2022 | 2023 | 2024 |
 |
| 1 Year | 5 Year | 10 Year | |
| Class M (incl. 2.75% sales charge) | 6.84% | 4.72% | 3.93% |
| Class M (without 2.75% sales charge) | 9.86% | 5.30% | 4.22% |
| Morningstar® LSTA® US Performing Loans | 10.86% | 6.29% | 5.20% |
| Bloomberg U.S. Universal Bond Index | 11.20% | 0.18% | 1.82% |
Visit institutional.fidelity.com for more recent performance information. |
The Fund's past performance is not a good predictor of the Fund's future performance. The graph and table do not reflect the deduction of taxes that a shareholder would pay on fund distributions or redemption of fund shares. |
KEY FACTS | ||
| Fund Size | $14,682,141,753 | |
| Number of Holdings | 623 | |
| Total Advisory Fee | $84,188,738 | |
| Portfolio Turnover | 41% |
(as of October 31, 2024)
| BBB | 1.3 |
| BB | 22.5 |
| B | 59.8 |
| CCC,CC,C | 6.1 |
| Not Rated | 5.4 |
| Equities | 2.3 |
| Short-Term Investments and Net Other Assets (Liabilities) | 2.6 |
QUALITY DIVERSIFICATION (% of Fund's net assets) |
|
| We have used ratings from Moody's Investors Service, Inc. Where Moody's® ratings are not available, we have used S&P® ratings. All ratings are as of the date indicated and do not reflect subsequent changes. |
| Bank Loan Obligations | 90.1 |
| Corporate Bonds | 4.5 |
| Common Stocks | 1.5 |
| Alternative Funds | 0.8 |
| Preferred Securities | 0.3 |
| Asset-Backed Securities | 0.2 |
| Short-Term Investments and Net Other Assets (Liabilities) | 2.6 |
ASSET ALLOCATION (% of Fund's net assets) |
|
| United States | 90.3 |
| United Kingdom | 2.5 |
| Canada | 2.0 |
| Netherlands | 1.1 |
| France | 0.8 |
| Puerto Rico | 0.7 |
| Luxembourg | 0.6 |
| Ireland | 0.4 |
| Grand Cayman (UK Overseas Ter) | 0.4 |
| Others | 1.2 |
GEOGRAPHIC DIVERSIFICATION (% of Fund's net assets) |
|
TOP HOLDINGS (% of Fund's net assets) | ||
| Asurion LLC | 2.2 | |
| Great Outdoors Group LLC | 2.2 | |
| Fertitta Entertainment LLC/NV | 1.2 | |
| Acrisure LLC | 1.2 | |
| Caesars Entertainment Inc | 1.2 | |
| Polaris Newco LLC | 1.0 | |
| MH Sub I LLC | 1.0 | |
| TransDigm Inc | 1.0 | |
| Medline Borrower LP | 0.9 | |
| UKG Inc | 0.9 | |
| 12.8 |
The fund's transfer agent and pricing & bookkeeping fees were changed to a fixed rate effective December 1, 2023, through February 29, 2024, in anticipation of the transition to a new management fee structure. Effective March 1, 2024, the fund's management contract was amended to incorporate administrative services previously covered under separate services agreements (transfer agent and pricing & bookkeeping). The amended contract incorporates a management fee rate that may vary by class. The Adviser or an affiliate pays certain expenses of managing and operating the fund out of each class's management fee. |
| Fidelity, the Fidelity Investments Logo and all other Fidelity trademarks or service marks used herein are trademarks or service marks of FMR LLC. Any third-party marks that are used herein are trademarks or service marks of their respective owners. © 2024 FMR LLC. All rights reserved. | ||
 | For additional information about the Fund; including its prospectus, financial information, holdings and proxy information, scan the QR code or visit fundresearch.fidelity.com/prospectus/sec 1.9913812.100 872-TSRA-1224 | |
ANNUAL SHAREHOLDER REPORT | AS OF OCTOBER 31, 2024 | This report describes changes to the Fund that occurred during the reporting period. | |
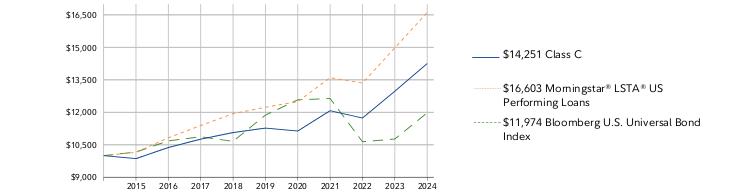
| | Fidelity Advisor® Floating Rate High Income Fund Fidelity Advisor® Floating Rate High Income Fund Class C : FFRCX | |
| Costs of a $10,000 investment | Costs paid as a percentage of a $10,000 investment | ||
| Class C | $ 177 | 1.69% |
Class C | $10,000 | $9,862 | $10,374 | $10,761 | $11,065 | $11,271 | $11,137 | $12,075 | $11,736 | $12,974 | $14,251 |
Morningstar® LSTA® US Performing Loans | $10,000 | $10,151 | $10,824 | $11,392 | $11,936 | $12,235 | $12,491 | $13,602 | $13,349 | $14,977 | $16,603 |
Bloomberg U.S. Universal Bond Index | $10,000 | $10,167 | $10,682 | $10,870 | $10,658 | $11,869 | $12,576 | $12,636 | $10,641 | $10,768 | $11,974 |
| 2014 | 2015 | 2016 | 2017 | 2018 | 2019 | 2020 | 2021 | 2022 | 2023 | 2024 |
 |
| 1 Year | 5 Year | 10 Year | |
| Class C (incl. contingent deferred sales charge) | 8.03% | 4.51% | 3.61% |
| Class C | 9.03% | 4.51% | 3.61% |
| Morningstar® LSTA® US Performing Loans | 10.86% | 6.29% | 5.20% |
| Bloomberg U.S. Universal Bond Index | 11.20% | 0.18% | 1.82% |
Visit institutional.fidelity.com for more recent performance information. |
The Fund's past performance is not a good predictor of the Fund's future performance. The graph and table do not reflect the deduction of taxes that a shareholder would pay on fund distributions or redemption of fund shares. |
KEY FACTS | ||
| Fund Size | $14,682,141,753 | |
| Number of Holdings | 623 | |
| Total Advisory Fee | $84,188,738 | |
| Portfolio Turnover | 41% |
(as of October 31, 2024)
| BBB | 1.3 |
| BB | 22.5 |
| B | 59.8 |
| CCC,CC,C | 6.1 |
| Not Rated | 5.4 |
| Equities | 2.3 |
| Short-Term Investments and Net Other Assets (Liabilities) | 2.6 |
QUALITY DIVERSIFICATION (% of Fund's net assets) |
|
| We have used ratings from Moody's Investors Service, Inc. Where Moody's® ratings are not available, we have used S&P® ratings. All ratings are as of the date indicated and do not reflect subsequent changes. |
| Bank Loan Obligations | 90.1 |
| Corporate Bonds | 4.5 |
| Common Stocks | 1.5 |
| Alternative Funds | 0.8 |
| Preferred Securities | 0.3 |
| Asset-Backed Securities | 0.2 |
| Short-Term Investments and Net Other Assets (Liabilities) | 2.6 |
ASSET ALLOCATION (% of Fund's net assets) |
|
| United States | 90.3 |
| United Kingdom | 2.5 |
| Canada | 2.0 |
| Netherlands | 1.1 |
| France | 0.8 |
| Puerto Rico | 0.7 |
| Luxembourg | 0.6 |
| Ireland | 0.4 |
| Grand Cayman (UK Overseas Ter) | 0.4 |
| Others | 1.2 |
GEOGRAPHIC DIVERSIFICATION (% of Fund's net assets) |
|
TOP HOLDINGS (% of Fund's net assets) | ||
| Asurion LLC | 2.2 | |
| Great Outdoors Group LLC | 2.2 | |
| Fertitta Entertainment LLC/NV | 1.2 | |
| Acrisure LLC | 1.2 | |
| Caesars Entertainment Inc | 1.2 | |
| Polaris Newco LLC | 1.0 | |
| MH Sub I LLC | 1.0 | |
| TransDigm Inc | 1.0 | |
| Medline Borrower LP | 0.9 | |
| UKG Inc | 0.9 | |
| 12.8 |
The fund's transfer agent and pricing & bookkeeping fees were changed to a fixed rate effective December 1, 2023, through February 29, 2024, in anticipation of the transition to a new management fee structure. Effective March 1, 2024, the fund's management contract was amended to incorporate administrative services previously covered under separate services agreements (transfer agent and pricing & bookkeeping). The amended contract incorporates a management fee rate that may vary by class. The Adviser or an affiliate pays certain expenses of managing and operating the fund out of each class's management fee. |
| Fidelity, the Fidelity Investments Logo and all other Fidelity trademarks or service marks used herein are trademarks or service marks of FMR LLC. Any third-party marks that are used herein are trademarks or service marks of their respective owners. © 2024 FMR LLC. All rights reserved. | ||
 | For additional information about the Fund; including its prospectus, financial information, holdings and proxy information, scan the QR code or visit fundresearch.fidelity.com/prospectus/sec 1.9913811.100 871-TSRA-1224 | |
ANNUAL SHAREHOLDER REPORT | AS OF OCTOBER 31, 2024 | This report describes changes to the Fund that occurred during the reporting period. | |
| | Fidelity Advisor® Value Fund Fidelity Advisor® Value Fund Class M : FTVFX | |
| Costs of a $10,000 investment | Costs paid as a percentage of a $10,000 investment | ||
| Class M | $ 161 | 1.40% |
Class M | $9,650 | $9,608 | $9,827 | $11,673 | $11,088 | $12,058 | $11,268 | $18,571 | $17,186 | $17,271 | $22,514 |
Russell Midcap® Value Index | $10,000 | $10,047 | $10,834 | $12,689 | $12,710 | $13,990 | $13,020 | $19,347 | $17,379 | $16,759 | $22,463 |
Russell 3000® Index | $10,000 | $10,449 | $10,892 | $13,504 | $14,395 | $16,337 | $17,995 | $25,894 | $21,617 | $23,429 | $32,298 |
| 2014 | 2015 | 2016 | 2017 | 2018 | 2019 | 2020 | 2021 | 2022 | 2023 | 2024 |
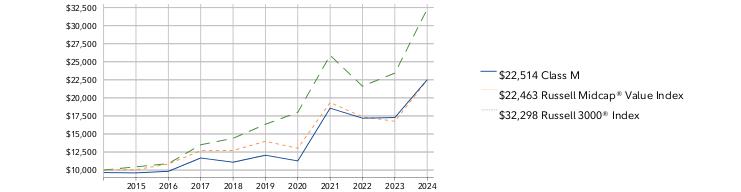 |
| 1 Year | 5 Year | 10 Year | |
| Class M (incl. 3.50% sales charge) | 25.80% | 12.50% | 8.45% |
| Class M (without 3.50% sales charge) | 30.36% | 13.30% | 8.84% |
| Russell Midcap® Value Index | 34.03% | 9.93% | 8.43% |
| Russell 3000® Index | 37.86% | 14.60% | 12.44% |
Visit institutional.fidelity.com for more recent performance information. |
The Fund's past performance is not a good predictor of the Fund's future performance. The graph and table do not reflect the deduction of taxes that a shareholder would pay on fund distributions or redemption of fund shares. |
KEY FACTS | ||
| Fund Size | $380,025,415 | |
| Number of Holdings | 268 | |
| Total Advisory Fee | $2,906,123 | |
| Portfolio Turnover | 80% |
(as of October 31, 2024)
MARKET SECTORS (% of Fund's net assets) | ||
| Industrials | 19.2 | |
| Financials | 16.7 | |
| Consumer Discretionary | 10.3 | |
| Materials | 10.3 | |
| Energy | 9.2 | |
| Health Care | 8.8 | |
| Utilities | 6.9 | |
| Real Estate | 5.3 | |
| Consumer Staples | 5.2 | |
| Information Technology | 4.3 | |
| Communication Services | 2.8 | |
| Common Stocks | 99.0 |
| Short-Term Investments and Net Other Assets (Liabilities) | 1.0 |
ASSET ALLOCATION (% of Fund's net assets) |
|
| United States | 86.3 |
| Canada | 6.0 |
| United Kingdom | 1.2 |
| Germany | 1.1 |
| Puerto Rico | 0.6 |
| Belgium | 0.6 |
| Zambia | 0.6 |
| India | 0.5 |
| France | 0.5 |
| Others | 2.6 |
GEOGRAPHIC DIVERSIFICATION (% of Fund's net assets) |
|
TOP HOLDINGS (% of Fund's net assets) | ||
| PG&E Corp | 1.2 | |
| Vistra Corp | 1.2 | |
| Ventas Inc | 1.0 | |
| Global Payments Inc | 1.0 | |
| Molina Healthcare Inc | 0.9 | |
| Smurfit WestRock PLC | 0.9 | |
| Lithia Motors Inc Class A | 0.9 | |
| Lumentum Holdings Inc | 0.8 | |
| International Paper Co | 0.8 | |
| Lamb Weston Holdings Inc | 0.8 | |
| 9.5 |
The fund's transfer agent and pricing & bookkeeping fees were changed to a fixed rate effective December 1, 2023, through February 29, 2024, in anticipation of the transition to a new management fee structure. Effective March 1, 2024, the fund's management contract was amended to incorporate administrative services previously covered under separate services agreements (transfer agent and pricing & bookkeeping). The amended contract incorporates a basic fee rate that may vary by class (subject to a performance adjustment). The Adviser or an affiliate pays certain expenses of managing and operating the fund out of each class's management fee. |
| Fidelity, the Fidelity Investments Logo and all other Fidelity trademarks or service marks used herein are trademarks or service marks of FMR LLC. Any third-party marks that are used herein are trademarks or service marks of their respective owners. © 2024 FMR LLC. All rights reserved. | ||
 | For additional information about the Fund; including its prospectus, financial information, holdings and proxy information, scan the QR code or visit fundresearch.fidelity.com/prospectus/sec 1.9913927.100 1319-TSRA-1224 | |
ANNUAL SHAREHOLDER REPORT | AS OF OCTOBER 31, 2024 | This report describes changes to the Fund that occurred during the reporting period. | |
| | Fidelity Advisor® High Income Advantage Fund Fidelity Advisor® High Income Advantage Fund Class Z : FIQTX | |
| Costs of a $10,000 investment | Costs paid as a percentage of a $10,000 investment | ||
| Class Z | $ 69 | 0.63% |
Class Z | $10,000 | $9,622 | $10,371 | $10,661 | $13,032 | $11,668 | $12,304 |
ICE® BofA® US High Yield Constrained Index | $10,000 | $9,813 | $10,630 | $10,890 | $12,058 | $10,679 | $11,299 |
Bloomberg U.S. Universal Bond Index | $10,000 | $9,913 | $11,039 | $11,697 | $11,754 | $9,898 | $10,016 |
| 2018 | 2019 | 2020 | 2021 | 2022 | 2023 | 2024 |
 |
| 1 Year | 5 Year | Life of Fund A | |
| Class Z | 18.20% | 6.99% | 6.35% |
| ICE® BofA® US High Yield Constrained Index | 16.49% | 4.37% | 4.62% |
| Bloomberg U.S. Universal Bond Index | 11.20% | 0.18% | 1.79% |
Visit institutional.fidelity.com for more recent performance information. |
The Fund's past performance is not a good predictor of the Fund's future performance. The graph and table do not reflect the deduction of taxes that a shareholder would pay on fund distributions or redemption of fund shares. |
KEY FACTS | ||
| Fund Size | $2,310,946,691 | |
| Number of Holdings | 717 | |
| Total Advisory Fee | $13,652,978 | |
| Portfolio Turnover | 29% |
(as of October 31, 2024)
| BBB | 4.8 |
| BB | 20.7 |
| B | 30.9 |
| CCC,CC,C | 6.6 |
| Not Rated | 2.9 |
| Equities | 22.3 |
| Short-Term Investments and Net Other Assets (Liabilities) | 11.8 |
QUALITY DIVERSIFICATION (% of Fund's net assets) |
|
| We have used ratings from Moody's Investors Service, Inc. Where Moody's® ratings are not available, we have used S&P® ratings. All ratings are as of the date indicated and do not reflect subsequent changes. |
| Corporate Bonds | 51.5 |
| Common Stocks | 20.1 |
| Bank Loan Obligations | 10.1 |
| Preferred Securities | 4.1 |
| Alternative Funds | 2.2 |
| Asset-Backed Securities | 0.2 |
| Short-Term Investments and Net Other Assets (Liabilities) | 11.8 |
ASSET ALLOCATION (% of Fund's net assets) |
|
| United States | 91.1 |
| Canada | 1.9 |
| United Kingdom | 1.8 |
| France | 1.4 |
| Netherlands | 0.5 |
| China | 0.5 |
| Luxembourg | 0.4 |
| Zambia | 0.4 |
| Taiwan | 0.3 |
| Others | 1.7 |
GEOGRAPHIC DIVERSIFICATION (% of Fund's net assets) |
|
TOP HOLDINGS (% of Fund's net assets) | ||
| TransDigm Inc | 2.6 | |
| Fidelity Private Credit Company LLC | 2.2 | |
| Energy Transfer LP | 2.1 | |
| NVIDIA Corp | 1.4 | |
| Tenet Healthcare Corp | 1.4 | |
| LBM Acquisition LLC | 1.2 | |
| Altice France SA | 1.1 | |
| eG Global Finance PLC | 1.1 | |
| Carnival Corp | 1.1 | |
| Meta Platforms Inc Class A | 1.1 | |
| 15.3 |
The fund's transfer agent and pricing and bookkeeping fees were changed to a fixed rate effective December 1, 2023, through February 29, 2024, in anticipation of the transition to a new management fee structure. Effective March 1, 2024, the fund's management contract was amended to incorporate administrative services previously covered under separate services agreements (transfer agent and pricing and bookkeeping). The amended contract incorporates a management fee rate that may vary by class. The Adviser or an affiliate pays certain expenses of managing and operating the fund out of each class's management fee. |
| Fidelity, the Fidelity Investments Logo and all other Fidelity trademarks or service marks used herein are trademarks or service marks of FMR LLC. Any third-party marks that are used herein are trademarks or service marks of their respective owners. © 2024 FMR LLC. All rights reserved. | ||
 | For additional information about the Fund; including its prospectus, financial information, holdings and proxy information, scan the QR code or visit fundresearch.fidelity.com/prospectus/sec 1.9913815.100 3278-TSRA-1224 | |
Item 2.
Code of Ethics
As of the end of the period, October 31, 2024, Fidelity Advisor Series I (the trust) has adopted a code of ethics, as defined in Item 2 of Form N-CSR, that applies to its President and Treasurer and its Chief Financial Officer. A copy of the code of ethics is filed as an exhibit to this Form N-CSR.
Item 3.
Audit Committee Financial Expert
The Board of Trustees of the trust has determined that Donald F. Donahue is an audit committee financial expert, as defined in Item 3 of Form N-CSR. Mr. Donahue is independent for purposes of Item 3 of Form N-CSR.
Item 4.
Principal Accountant Fees and Services
Fees and Services
The following table presents fees billed by Deloitte & Touche LLP, the member firms of Deloitte Touche Tohmatsu, and their respective affiliates (collectively, “Deloitte Entities”) in each of the last two fiscal years for services rendered to Fidelity Advisor Floating Rate High Income Fund, Fidelity Advisor High Income Advantage Fund and Fidelity Advisor Value Fund (the “Fund(s)”):
Services Billed by Deloitte Entities
October 31, 2024 FeesA
Audit Fees | Audit-Related Fees | Tax Fees | All Other Fees | |
Fidelity Advisor Floating Rate High Income Fund | $78,000 | $- | $9,700 | $1,700 |
Fidelity Advisor High Income Advantage Fund | $65,800 | $- | $9,700 | $1,500 |
Fidelity Advisor Value Fund | $42,500 | $- | $11,200 | $1,000 |
October 31, 2023 FeesA
Audit Fees | Audit-Related Fees | Tax Fees | All Other Fees | |
Fidelity Advisor Floating Rate High Income Fund | $78,200 | $- | $9,700 | $1,900 |
Fidelity Advisor High Income Advantage Fund | $66,100 | $- | $9,700 | $1,600 |
Fidelity Advisor Value Fund | $42,700 | $- | $11,400 | $1,100 |
A Amounts may reflect rounding.
The following table(s) present(s) fees billed by Deloitte Entities that were required to be approved by the Audit Committee for services that relate directly to the operations and financial reporting of the Fund(s) and that are rendered on behalf of Fidelity Management & Research Company LLC ("FMR") and entities controlling, controlled by, or under common control with FMR (not including any sub-adviser whose role is primarily portfolio management and is subcontracted with or overseen by another investment adviser) that provide ongoing services to the Fund(s) (“Fund Service Providers”):
Services Billed by Deloitte Entities
October 31, 2024A | October 31, 2023A | |
Audit-Related Fees | $125,000 | $75,000 |
Tax Fees | $- | $- |
All Other Fees | $2,929,500 | $- |
A Amounts may reflect rounding.
“Audit-Related Fees” represent fees billed for assurance and related services that are reasonably related to the performance of the fund audit or the review of the fund's financial statements and that are not reported under Audit Fees.
“Tax Fees” represent fees billed for tax compliance, tax advice or tax planning that relate directly to the operations and financial reporting of the fund.
“All Other Fees” represent fees billed for services provided to the fund or Fund Service Provider, a significant portion of which are assurance related, that relate directly to the operations and financial reporting of the fund, excluding those services that are reported under Audit Fees, Audit-Related Fees or Tax Fees.
Assurance services must be performed by an independent public accountant.
* * *
The aggregate non-audit fees billed by Deloitte Entities for services rendered to the Fund(s), FMR (not including any sub-adviser whose role is primarily portfolio management and is subcontracted with or overseen by another investment adviser), and any Fund Service Provider for each of the last two fiscal years of the Fund(s) are as follows:
Billed By | October 31, 2024A | October 31, 2023A |
Deloitte Entities | $3,383,800 | $5,842,500 |
A Amounts may reflect rounding.
The trust's Audit Committee has considered non-audit services that were not pre-approved that were provided by Deloitte Entities to Fund Service Providers to be compatible with maintaining the independence of Deloitte Entities in its(their) audit of the Fund(s), taking into account representations from Deloitte Entities, in accordance with Public Company Accounting Oversight Board rules, regarding its independence from the Fund(s) and its(their) related entities and FMR’s review of the appropriateness and permissibility under applicable law of such non-audit services prior to their provision to the Fund(s) Service Providers.
Audit Committee Pre-Approval Policies and Procedures
The trust’s Audit Committee must pre-approve all audit and non-audit services provided by a fund’s independent registered public accounting firm relating to the operations or financial reporting of the fund. Prior to the commencement of any audit or non-audit services to a fund, the Audit Committee reviews the services to determine whether they are appropriate and permissible under applicable law.
The Audit Committee has adopted policies and procedures to, among other purposes, provide a framework for the Committee’s consideration of non-audit services by the audit firms that audit the Fidelity funds. The policies and procedures require that any non-audit service provided by a fund audit firm to a Fidelity fund and any non-audit service provided by a fund auditor to a Fund Service Provider that relates directly to the operations and financial reporting of a Fidelity fund (“Covered Service”) are subject to approval by the Audit Committee before such service is provided.
All Covered Services must be approved in advance of provision of the service either: (i) by formal resolution of the Audit Committee, or (ii) by oral or written approval of the service by the Chair of the Audit Committee (or if the Chair is unavailable, such other member of the Audit Committee as may be designated by the Chair to act in the Chair’s absence). The approval contemplated by (ii) above is permitted where the Treasurer determines that action on such an engagement is necessary before the next meeting of the Audit Committee.
Non-audit services provided by a fund audit firm to a Fund Service Provider that do not relate directly to the operations and financial reporting of a Fidelity fund are reported to the Audit Committee periodically.
Non-Audit Services Approved Pursuant to Rule 2-01(c)(7)(i)(C) and (ii) of Regulation S-X (“De Minimis Exception”)
There were no non-audit services approved or required to be approved by the Audit Committee pursuant to the De Minimis Exception during the Fund’s(s’) last two fiscal years relating to services provided to (i) the Fund(s) or (ii) any Fund Service Provider that relate directly to the operations and financial reporting of the Fund(s).
The Registrant has not retained, for the preparation of the audit report on the financial statements included in the Form N-CSR, a registered public accounting firm that has a branch or office that is located in a foreign jurisdiction and that the Public Company Accounting Oversight Board (the “PCAOB”) has determined that the PCAOB is unable to inspect or investigate completely because of a position taken by an authority in the foreign jurisdiction.
The Registrant is not a “foreign issuer,” as defined in 17 CFR 240.3b-4.
Item 5.
Audit Committee of Listed Registrants
Not applicable.
Item 6.
Investments
(a)
Not applicable.
(b)
Not applicable.
Item 7.
Financial Statements and Financial Highlights for Open-End Management Investment Companies


Contents
| Common Stocks - 99.0% | |||
| Shares | Value ($) | ||
| COMMUNICATION SERVICES - 2.8% | |||
| Diversified Telecommunication Services - 0.5% | |||
| Cellnex Telecom SA (a) | 40,260 | 1,475,818 | |
| Liberty Latin America Ltd. Class C (b) | 51,900 | 502,392 | |
| 1,978,210 | |||
| Entertainment - 0.1% | |||
| Ubisoft Entertainment SA (b) | 34,320 | 517,188 | |
| Interactive Media & Services - 0.6% | |||
| Zoominfo Technologies, Inc. (b) | 190,573 | 2,105,832 | |
| Media - 1.6% | |||
| Grupo Televisa SA de CV (CPO) sponsored ADR | 403,909 | 1,009,773 | |
| Nexstar Media Group, Inc. | 9,906 | 1,742,664 | |
| Thryv Holdings, Inc. (b) | 111,351 | 1,601,227 | |
| WPP PLC | 145,711 | 1,531,557 | |
| 5,885,221 | |||
TOTAL COMMUNICATION SERVICES | 10,486,451 | ||
| CONSUMER DISCRETIONARY - 10.4% | |||
| Automobile Components - 0.9% | |||
| Aptiv PLC (b) | 37,581 | 2,135,728 | |
| Autoliv, Inc. | 14,290 | 1,327,255 | |
| 3,462,983 | |||
| Automobiles - 0.4% | |||
| Harley-Davidson, Inc. | 53,792 | 1,718,654 | |
| Broadline Retail - 0.3% | |||
| Kohl's Corp. | 53,801 | 994,242 | |
| Distributors - 0.4% | |||
| LKQ Corp. | 45,178 | 1,662,099 | |
| Hotels, Restaurants & Leisure - 0.5% | |||
| Hilton Grand Vacations, Inc. (b)(c) | 55,185 | 2,035,223 | |
| Household Durables - 1.2% | |||
| Mohawk Industries, Inc. (b) | 15,187 | 2,039,158 | |
| Newell Brands, Inc. | 97,400 | 857,120 | |
| Tempur Sealy International, Inc. | 38,938 | 1,865,520 | |
| 4,761,798 | |||
| Leisure Products - 1.0% | |||
| BRP, Inc. Subordinate Voting Shares (c) | 30,106 | 1,484,380 | |
| Brunswick Corp. | 14,130 | 1,126,726 | |
| Topgolf Callaway Brands Corp. (b)(c) | 104,391 | 1,013,637 | |
| 3,624,743 | |||
| Specialty Retail - 3.0% | |||
| Academy Sports & Outdoors, Inc. | 17,189 | 874,233 | |
| Advance Auto Parts, Inc. (c) | 3,070 | 109,568 | |
| Camping World Holdings, Inc. Class A | 62,502 | 1,253,790 | |
| Gap, Inc. | 63,077 | 1,310,109 | |
| Lithia Motors, Inc. Class A (sub. vtg.) | 9,087 | 3,020,246 | |
| Sally Beauty Holdings, Inc. (b) | 76,714 | 997,282 | |
| Signet Jewelers Ltd. (c) | 18,213 | 1,669,768 | |
| Upbound Group, Inc. | 68,195 | 1,994,022 | |
| 11,229,018 | |||
| Textiles, Apparel & Luxury Goods - 2.7% | |||
| Capri Holdings Ltd. (b) | 46,647 | 920,812 | |
| Dr. Martens Ltd. (c) | 694,620 | 489,936 | |
| Gildan Activewear, Inc. | 62,662 | 3,066,606 | |
| PVH Corp. | 26,440 | 2,603,282 | |
| Samsonite International SA (a) | 699,690 | 1,644,206 | |
| Tapestry, Inc. | 30,020 | 1,424,449 | |
| 10,149,291 | |||
TOTAL CONSUMER DISCRETIONARY | 39,638,051 | ||
| CONSUMER STAPLES - 5.2% | |||
| Beverages - 0.6% | |||
| Keurig Dr. Pepper, Inc. | 34,430 | 1,134,469 | |
| Primo Water Corp. | 37,360 | 979,953 | |
| 2,114,422 | |||
| Consumer Staples Distribution & Retail - 1.3% | |||
| Albertsons Companies, Inc. | 76,900 | 1,391,890 | |
| Dollar Tree, Inc. (b) | 32,491 | 2,100,218 | |
| U.S. Foods Holding Corp. (b) | 23,934 | 1,475,531 | |
| 4,967,639 | |||
| Food Products - 2.3% | |||
| Bunge Global SA | 26,002 | 2,184,688 | |
| Darling Ingredients, Inc. (b) | 57,922 | 2,265,329 | |
| Lamb Weston Holdings, Inc. | 40,611 | 3,155,069 | |
| The J.M. Smucker Co. | 9,596 | 1,089,242 | |
| 8,694,328 | |||
| Personal Care Products - 0.6% | |||
| Kenvue, Inc. | 104,973 | 2,407,031 | |
| Tobacco - 0.4% | |||
| Philip Morris International, Inc. | 11,553 | 1,533,083 | |
TOTAL CONSUMER STAPLES | 19,716,503 | ||
| ENERGY - 9.1% | |||
| Energy Equipment & Services - 2.3% | |||
| Expro Group Holdings NV (b) | 99,158 | 1,264,265 | |
| Kodiak Gas Services, Inc. | 41,640 | 1,327,483 | |
| Liberty Energy, Inc. Class A | 29,581 | 504,948 | |
| Tenaris SA | 68,580 | 1,129,888 | |
| TGS ASA | 74,770 | 679,035 | |
| Tidewater, Inc. (b) | 13,448 | 807,821 | |
| Valaris Ltd. (b) | 22,382 | 1,132,529 | |
| Vallourec SA (b) | 86,058 | 1,408,824 | |
| Weatherford International PLC | 3,555 | 280,845 | |
| 8,535,638 | |||
| Oil, Gas & Consumable Fuels - 6.8% | |||
| Antero Resources Corp. (b) | 89,780 | 2,323,506 | |
| Canadian Natural Resources Ltd. | 54,576 | 1,855,980 | |
| Cenovus Energy, Inc. (Canada) | 120,205 | 1,932,984 | |
| Cheniere Energy, Inc. | 14,580 | 2,790,320 | |
| Delek U.S. Holdings, Inc. | 56,269 | 881,735 | |
| Diamondback Energy, Inc. | 5,695 | 1,006,705 | |
| Energy Transfer LP | 85,408 | 1,407,524 | |
| Galp Energia SGPS SA | 94,400 | 1,609,052 | |
| Imperial Oil Ltd. | 28,320 | 2,113,296 | |
| Imperial Oil Ltd. (U.S.) | 5,300 | 394,744 | |
| Kosmos Energy Ltd. (b)(c) | 152,130 | 572,009 | |
| MEG Energy Corp. | 34,100 | 623,295 | |
| Phillips 66 Co. | 14,022 | 1,708,160 | |
| Range Resources Corp. | 21,895 | 657,507 | |
| Secure Energy Services, Inc. | 209,260 | 2,331,039 | |
| South Bow Corp. | 37,450 | 935,208 | |
| Targa Resources Corp. | 16,849 | 2,813,109 | |
| 25,956,173 | |||
TOTAL ENERGY | 34,491,811 | ||
| FINANCIALS - 16.7% | |||
| Banks - 2.8% | |||
| Barclays PLC | 299,283 | 917,453 | |
| East West Bancorp, Inc. | 27,088 | 2,640,809 | |
| First Citizens Bancshares, Inc. | 1,447 | 2,803,345 | |
| First Citizens Bancshares, Inc. Class B | 210 | 358,262 | |
| KeyCorp | 118,920 | 2,051,370 | |
| Popular, Inc. | 21,840 | 1,948,783 | |
| 10,720,022 | |||
| Capital Markets - 3.7% | |||
| Ameriprise Financial, Inc. | 4,115 | 2,099,885 | |
| BGC Group, Inc. Class A | 247,990 | 2,323,666 | |
| Carlyle Group LP | 51,782 | 2,590,653 | |
| LPL Financial | 8,256 | 2,329,678 | |
| Onex Corp. (sub. vtg.) | 10,240 | 737,065 | |
| Petershill Partners PLC (a) | 213,894 | 598,498 | |
| Raymond James Financial, Inc. | 13,153 | 1,949,538 | |
| UBS Group AG | 43,110 | 1,324,925 | |
| 13,953,908 | |||
| Consumer Finance - 1.8% | |||
| Ally Financial, Inc. | 35,926 | 1,259,206 | |
| Navient Corp. | 53,270 | 758,032 | |
| OneMain Holdings, Inc. | 42,327 | 2,102,382 | |
| PROG Holdings, Inc. | 31,182 | 1,361,718 | |
| SLM Corp. | 56,031 | 1,234,363 | |
| 6,715,701 | |||
| Financial Services - 4.1% | |||
| Apollo Global Management, Inc. | 13,933 | 1,996,042 | |
| ECN Capital Corp. | 412,188 | 654,243 | |
| Essent Group Ltd. | 29,159 | 1,749,832 | |
| Global Payments, Inc. | 33,771 | 3,502,390 | |
| NCR Atleos Corp. | 63,245 | 1,655,754 | |
| PennyMac Financial Services, Inc. | 16,480 | 1,642,726 | |
| Voya Financial, Inc. | 23,880 | 1,917,564 | |
| WEX, Inc. (b) | 14,775 | 2,550,165 | |
| 15,668,716 | |||
| Insurance - 4.3% | |||
| AMBAC Financial Group, Inc. (b) | 60,958 | 689,435 | |
| American Financial Group, Inc. | 15,158 | 1,954,321 | |
| Assurant, Inc. | 10,840 | 2,078,028 | |
| Hartford Financial Services Group, Inc. | 19,677 | 2,173,128 | |
| Primerica, Inc. | 5,420 | 1,500,310 | |
| Prudential PLC | 102,477 | 853,106 | |
| Reinsurance Group of America, Inc. | 12,934 | 2,730,109 | |
| Stewart Information Services Corp. | 17,580 | 1,209,504 | |
| The Travelers Companies, Inc. | 9,829 | 2,417,344 | |
| Unum Group | 12,057 | 773,818 | |
| 16,379,103 | |||
TOTAL FINANCIALS | 63,437,450 | ||
| HEALTH CARE - 8.9% | |||
| Biotechnology - 0.6% | |||
| Alnylam Pharmaceuticals, Inc. (b) | 316 | 84,242 | |
| BioMarin Pharmaceutical, Inc. (b) | 819 | 53,964 | |
| BioNTech SE ADR (b) | 3,770 | 426,387 | |
| Exact Sciences Corp. (b) | 5,551 | 382,630 | |
| Galapagos NV (b) | 31,298 | 835,547 | |
| Legend Biotech Corp. ADR (b) | 1,020 | 45,920 | |
| Moderna, Inc. (b) | 7,880 | 428,357 | |
| 2,257,047 | |||
| Health Care Equipment & Supplies - 1.7% | |||
| Align Technology, Inc. (b) | 1,286 | 263,669 | |
| Baxter International, Inc. | 7,429 | 265,215 | |
| GE Healthcare Technologies, Inc. | 6,988 | 610,402 | |
| Globus Medical, Inc. Class A (b) | 968 | 71,187 | |
| Hologic, Inc. (b) | 3,126 | 252,800 | |
| Lantheus Holdings, Inc. (b) | 1,007 | 110,609 | |
| Masimo Corp. (b) | 1,802 | 259,506 | |
| QuidelOrtho Corp. (b) | 38,437 | 1,462,528 | |
| Solventum Corp. | 1,852 | 134,418 | |
| STERIS PLC | 2,175 | 482,524 | |
| Teleflex, Inc. | 1,190 | 239,261 | |
| The Cooper Companies, Inc. (b) | 4,759 | 498,172 | |
| Zimmer Biomet Holdings, Inc. | 16,706 | 1,786,206 | |
| 6,436,497 | |||
| Health Care Providers & Services - 3.7% | |||
| Acadia Healthcare Co., Inc. (b) | 33,330 | 1,422,858 | |
| AdaptHealth Corp. (b) | 164,547 | 1,693,189 | |
| BrightSpring Health Services, Inc. (b) | 66,370 | 993,559 | |
| Cencora, Inc. | 2,285 | 521,163 | |
| Centene Corp. (b) | 4,486 | 279,298 | |
| Chemed Corp. | 745 | 402,479 | |
| CVS Health Corp. | 48,345 | 2,729,559 | |
| Encompass Health Corp. | 3,789 | 376,854 | |
| Henry Schein, Inc. (b) | 19,037 | 1,336,969 | |
| Humana, Inc. | 1,671 | 430,834 | |
| Labcorp Holdings, Inc. | 587 | 133,994 | |
| Molina Healthcare, Inc. (b) | 10,689 | 3,433,521 | |
| Privia Health Group, Inc. (b) | 2,019 | 37,069 | |
| Tenet Healthcare Corp. (b) | 1,698 | 263,224 | |
| 14,054,570 | |||
| Life Sciences Tools & Services - 1.1% | |||
| Agilent Technologies, Inc. | 5,795 | 755,146 | |
| Avantor, Inc. (b)(c) | 16,703 | 373,646 | |
| Bio-Rad Laboratories, Inc. Class A (b) | 165 | 59,101 | |
| Bruker Corp. | 526 | 29,777 | |
| Charles River Laboratories International, Inc. (b) | 257 | 45,895 | |
| Fortrea Holdings, Inc. (b) | 97,300 | 1,636,586 | |
| Illumina, Inc. (b) | 972 | 140,104 | |
| IQVIA Holdings, Inc. (b) | 3,389 | 697,524 | |
| Mettler-Toledo International, Inc. (b) | 118 | 152,427 | |
| West Pharmaceutical Services, Inc. | 909 | 279,908 | |
| 4,170,114 | |||
| Pharmaceuticals - 1.8% | |||
| Elanco Animal Health, Inc. (b) | 7,286 | 92,095 | |
| Jazz Pharmaceuticals PLC (b) | 10,487 | 1,153,885 | |
| Perrigo Co. PLC | 83,097 | 2,129,776 | |
| Royalty Pharma PLC Class A | 6,581 | 177,687 | |
| Teva Pharmaceutical Industries Ltd. sponsored ADR (b) | 69,540 | 1,282,318 | |
| Viatris, Inc. | 167,153 | 1,938,975 | |
| 6,774,736 | |||
TOTAL HEALTH CARE | 33,692,964 | ||
| INDUSTRIALS - 19.1% | |||
| Air Freight & Logistics - 0.6% | |||
| Deutsche Post AG ADR | 15,191 | 610,215 | |
| FedEx Corp. | 6,630 | 1,815,626 | |
| 2,425,841 | |||
| Building Products - 1.8% | |||
| AZZ, Inc. | 11,332 | 863,272 | |
| Builders FirstSource, Inc. (b) | 16,196 | 2,775,994 | |
| Tecnoglass, Inc. | 20,984 | 1,438,034 | |
| UFP Industries, Inc. | 12,918 | 1,580,388 | |
| 6,657,688 | |||
| Commercial Services & Supplies - 2.2% | |||
| Driven Brands Holdings, Inc. (b) | 119,460 | 1,773,981 | |
| HNI Corp. | 30,278 | 1,492,100 | |
| Millerknoll, Inc. | 30,830 | 689,359 | |
| The Brink's Co. | 18,044 | 1,854,743 | |
| The GEO Group, Inc. (b) | 70,020 | 1,062,904 | |
| Vestis Corp. | 123,782 | 1,673,533 | |
| 8,546,620 | |||
| Construction & Engineering - 0.7% | |||
| Centuri Holdings, Inc. (c) | 77,350 | 1,451,860 | |
| Fluor Corp. (b) | 23,539 | 1,230,619 | |
| 2,682,479 | |||
| Electrical Equipment - 2.2% | |||
| Acuity Brands, Inc. | 4,508 | 1,355,511 | |
| GrafTech International Ltd. (b) | 178,065 | 302,711 | |
| Regal Rexnord Corp. | 17,479 | 2,910,953 | |
| Sensata Technologies PLC | 50,608 | 1,737,879 | |
| Siemens Energy AG (b) | 47,346 | 1,932,818 | |
| 8,239,872 | |||
| Ground Transportation - 1.8% | |||
| Ryder System, Inc. | 14,973 | 2,190,250 | |
| TFI International, Inc. (Canada) | 10,229 | 1,368,887 | |
| U-Haul Holding Co. Class N | 26,297 | 1,795,033 | |
| XPO, Inc. (b) | 12,114 | 1,581,240 | |
| 6,935,410 | |||
| Machinery - 4.9% | |||
| Allison Transmission Holdings, Inc. | 24,216 | 2,587,722 | |
| Atmus Filtration Technologies, Inc. | 44,710 | 1,741,007 | |
| ATS Corp. (b) | 29,750 | 891,635 | |
| Chart Industries, Inc. (b)(c) | 10,465 | 1,263,335 | |
| CNH Industrial NV Class A | 156,553 | 1,758,090 | |
| Gates Industrial Corp. PLC (b) | 121,940 | 2,359,539 | |
| NFI Group, Inc. (b) | 96,190 | 1,094,992 | |
| Oshkosh Corp. | 19,135 | 1,956,362 | |
| PACCAR, Inc. | 11,291 | 1,177,425 | |
| Terex Corp. | 34,068 | 1,761,656 | |
| Timken Co. | 25,266 | 2,097,078 | |
| 18,688,841 | |||
| Professional Services - 2.5% | |||
| Clarivate PLC (b)(c) | 164,487 | 1,085,614 | |
| Concentrix Corp. (c) | 31,151 | 1,324,229 | |
| Dun & Bradstreet Holdings, Inc. | 108,686 | 1,292,277 | |
| First Advantage Corp. (b)(c) | 77,184 | 1,398,574 | |
| Genpact Ltd. | 32,580 | 1,243,579 | |
| ManpowerGroup, Inc. | 16,559 | 1,040,733 | |
| WNS Holdings Ltd. | 42,250 | 2,027,578 | |
| 9,412,584 | |||
| Trading Companies & Distributors - 2.4% | |||
| Beacon Roofing Supply, Inc. (b) | 10,524 | 968,945 | |
| GMS, Inc. (b) | 18,359 | 1,650,291 | |
| Herc Holdings, Inc. (c) | 11,758 | 2,459,068 | |
| McGrath RentCorp. | 10,870 | 1,235,919 | |
| WESCO International, Inc. | 14,474 | 2,778,574 | |
| 9,092,797 | |||
TOTAL INDUSTRIALS | 72,682,132 | ||
| INFORMATION TECHNOLOGY - 4.3% | |||
| Communications Equipment - 0.8% | |||
| Lumentum Holdings, Inc. (b) | 49,932 | 3,189,157 | |
| Electronic Equipment, Instruments & Components - 2.0% | |||
| Arrow Electronics, Inc. (b) | 12,350 | 1,465,575 | |
| Crane NXT Co. | 18,598 | 1,009,313 | |
| Flex Ltd. (b) | 35,267 | 1,222,707 | |
| Jabil, Inc. | 23,842 | 2,934,712 | |
| Vontier Corp. | 28,600 | 1,060,488 | |
| 7,692,795 | |||
| Semiconductors & Semiconductor Equipment - 1.0% | |||
| First Solar, Inc. (b) | 5,840 | 1,135,763 | |
| ON Semiconductor Corp. (b) | 35,360 | 2,492,526 | |
| 3,628,289 | |||
| Software - 0.5% | |||
| NCR Voyix Corp. (b) | 140,275 | 1,796,923 | |
TOTAL INFORMATION TECHNOLOGY | 16,307,164 | ||
| MATERIALS - 10.3% | |||
| Chemicals - 3.6% | |||
| Air Products & Chemicals, Inc. | 1,100 | 341,583 | |
| Celanese Corp. | 5,306 | 668,397 | |
| Corteva, Inc. | 27,445 | 1,671,949 | |
| Lanxess AG | 39,262 | 1,135,158 | |
| Methanex Corp. | 41,767 | 1,636,013 | |
| Minerals Technologies, Inc. | 10,840 | 816,144 | |
| Olin Corp. | 38,446 | 1,577,439 | |
| Syensqo SA | 20,070 | 1,550,666 | |
| The Chemours Co. LLC | 96,354 | 1,749,789 | |
| Tronox Holdings PLC | 62,809 | 761,245 | |
| Westlake Corp. | 13,840 | 1,826,050 | |
| 13,734,433 | |||
| Construction Materials - 0.4% | |||
| GCC S.A.B. de CV | 53,708 | 439,230 | |
| Martin Marietta Materials, Inc. | 1,687 | 999,278 | |
| Titan Cement International Trading SA | 4,030 | 143,783 | |
| 1,582,291 | |||
| Containers & Packaging - 2.7% | |||
| Berry Global Group, Inc. | 32,347 | 2,278,846 | |
| International Paper Co. | 57,263 | 3,180,387 | |
| O-I Glass, Inc. (b) | 125,691 | 1,396,427 | |
| Smurfit Westrock PLC | 65,965 | 3,397,198 | |
| 10,252,858 | |||
| Metals & Mining - 2.8% | |||
| Algoma Steel Group, Inc. | 78,380 | 811,233 | |
| Arch Resources, Inc. Class A, | 14,880 | 2,183,789 | |
| Compass Minerals International, Inc. (c) | 28,826 | 354,848 | |
| Constellium NV (b) | 161,529 | 1,792,972 | |
| First Quantum Minerals Ltd. (b) | 178,892 | 2,311,392 | |
| Gerdau SA | 43,900 | 135,628 | |
| Radius Recycling, Inc. Class A | 26,134 | 423,109 | |
| Reliance, Inc. | 5,720 | 1,637,865 | |
| Steel Dynamics, Inc. | 6,712 | 875,916 | |
| 10,526,752 | |||
| Paper & Forest Products - 0.8% | |||
| Interfor Corp. (b) | 140,079 | 1,930,632 | |
| Louisiana-Pacific Corp. | 12,207 | 1,207,272 | |
| 3,137,904 | |||
TOTAL MATERIALS | 39,234,238 | ||
| REAL ESTATE - 5.3% | |||
| Equity Real Estate Investment Trusts (REITs) - 4.4% | |||
| American Healthcare (REIT), Inc. | 53,070 | 1,411,662 | |
| EastGroup Properties, Inc. | 11,787 | 2,018,877 | |
| Lamar Advertising Co. Class A | 6,504 | 858,528 | |
| Outfront Media, Inc. | 100,670 | 1,787,899 | |
| Prologis, Inc. | 10,618 | 1,199,197 | |
| Sun Communities, Inc. | 22,276 | 2,955,580 | |
| Ventas, Inc. | 57,527 | 3,767,443 | |
| Welltower, Inc. | 18,815 | 2,537,767 | |
| 16,536,953 | |||
| Real Estate Management & Development - 0.9% | |||
| Compass, Inc. Class A (b) | 334,640 | 2,124,964 | |
| Newmark Group, Inc. Class A | 89,570 | 1,342,654 | |
| 3,467,618 | |||
TOTAL REAL ESTATE | 20,004,571 | ||
| UTILITIES - 6.9% | |||
| Electric Utilities - 4.1% | |||
| Constellation Energy Corp. | 8,104 | 2,131,028 | |
| Edison International | 27,167 | 2,238,561 | |
| Entergy Corp. | 19,337 | 2,992,981 | |
| FirstEnergy Corp. | 64,251 | 2,687,619 | |
| PG&E Corp. | 227,113 | 4,592,224 | |
| SSE PLC | 36,633 | 831,833 | |
| 15,474,246 | |||
| Gas Utilities - 0.4% | |||
| UGI Corp. | 68,100 | 1,628,271 | |
| Independent Power and Renewable Electricity Producers - 1.9% | |||
| The AES Corp. | 167,451 | 2,761,267 | |
| Vistra Corp. | 35,202 | 4,398,842 | |
| 7,160,109 | |||
| Multi-Utilities - 0.5% | |||
| Sempra | 25,859 | 2,155,865 | |
TOTAL UTILITIES | 26,418,491 | ||
| TOTAL COMMON STOCKS (Cost $318,127,087) | 376,109,826 | ||
| U.S. Treasury Obligations - 0.0% | |||
Principal Amount (d) | Value ($) | ||
U.S. Treasury Bills, yield at date of purchase 4.55% to 5.09% 11/21/24 to 12/26/24 (e) (Cost $209,042) | 210,000 | 209,090 | |
| Money Market Funds - 4.5% | |||
| Shares | Value ($) | ||
| Fidelity Cash Central Fund 4.87% (f) | 5,079,258 | 5,080,273 | |
| Fidelity Securities Lending Cash Central Fund 4.87% (f)(g) | 11,849,978 | 11,851,163 | |
| TOTAL MONEY MARKET FUNDS (Cost $16,931,423) | 16,931,436 | ||
| TOTAL INVESTMENT IN SECURITIES - 103.5% (Cost $335,267,552) | 393,250,352 |
NET OTHER ASSETS (LIABILITIES) - (3.5)% | (13,224,937) |
| NET ASSETS - 100.0% | 380,025,415 |
| Futures Contracts | |||||
Number of contracts | Expiration Date | Notional Amount ($) | Value ($) | Unrealized Appreciation/ (Depreciation) ($) | |
| Purchased | |||||
| Equity Index Contracts | |||||
| CME E-mini S&P MidCap 400 Index Contracts (United States) | 10 | Dec 2024 | 3,113,600 | 16,413 | 16,413 |
| The notional amount of futures purchased as a percentage of Net Assets is 0.8% | |||||
| (a) | Security exempt from registration under Rule 144A of the Securities Act of 1933. These securities may be resold in transactions exempt from registration, normally to qualified institutional buyers. At the end of the period, the value of these securities amounted to $3,718,522 or 1.0% of net assets. |
| (b) | Non-income producing |
| (c) | Security or a portion of the security is on loan at period end. |
| (d) | Amount is stated in United States dollars unless otherwise noted. |
| (e) | Security or a portion of the security was pledged to cover margin requirements for futures contracts. At period end, the value of securities pledged amounted to $209,090. |
| (f) | Affiliated fund that is generally available only to investment companies and other accounts managed by Fidelity Investments. The rate quoted is the annualized seven-day yield of the fund at period end. A complete unaudited listing of the fund's holdings as of its most recent quarter end is available upon request. In addition, each Fidelity Central Fund's financial statements, which are not covered by the Fund's Report of Independent Registered Public Accounting Firm, are available on the SEC's website or upon request. |
| (g) | Investment made with cash collateral received from securities on loan. |
| Affiliate | Value, beginning of period ($) | Purchases ($) | Sales Proceeds ($) | Dividend Income ($) | Realized Gain (loss) ($) | Change in Unrealized appreciation (depreciation) ($) | Value, end of period ($) | % ownership, end of period |
| Fidelity Cash Central Fund 4.87% | 3,866,479 | 112,868,675 | 111,655,024 | 220,117 | 144 | (1) | 5,080,273 | 0.0% |
| Fidelity Securities Lending Cash Central Fund 4.87% | 7,140,186 | 98,297,861 | 93,586,884 | 87,392 | - | - | 11,851,163 | 0.0% |
| Total | 11,006,665 | 211,166,536 | 205,241,908 | 307,509 | 144 | (1) | 16,931,436 | |
| Valuation Inputs at Reporting Date: | ||||
| Description | Total ($) | Level 1 ($) | Level 2 ($) | Level 3 ($) |
Investments in Securities: | ||||
| Equities: | ||||
Communication Services | 10,486,451 | 8,437,706 | 2,048,745 | - |
Consumer Discretionary | 39,638,051 | 37,993,845 | 1,644,206 | - |
Consumer Staples | 19,716,503 | 19,716,503 | - | - |
Energy | 34,491,811 | 33,361,923 | 1,129,888 | - |
Financials | 63,437,450 | 61,666,891 | 1,770,559 | - |
Health Care | 33,692,964 | 32,857,417 | 835,547 | - |
Industrials | 72,682,132 | 72,071,917 | 610,215 | - |
Information Technology | 16,307,164 | 16,307,164 | - | - |
Materials | 39,234,238 | 39,234,238 | - | - |
Real Estate | 20,004,571 | 20,004,571 | - | - |
Utilities | 26,418,491 | 26,418,491 | - | - |
| U.S. Government and Government Agency Obligations | 209,090 | - | 209,090 | - |
| Money Market Funds | 16,931,436 | 16,931,436 | - | - |
| Total Investments in Securities: | 393,250,352 | 385,002,102 | 8,248,250 | - |
| Net Unrealized Depreciation on Unfunded Commitments | (77,516) | (77,516) | - | - |
| Total | (77,516) | (77,516) | - | - |
Derivative Instruments: Assets | ||||
Futures Contracts | 16,413 | 16,413 | - | - |
| Total Assets | 16,413 | 16,413 | - | - |
| Total Derivative Instruments: | 16,413 | 16,413 | - | - |
Primary Risk Exposure / Derivative Type | Value | |
| Asset ($) | Liability ($) | |
| Equity Risk | ||
Futures Contracts (a) | 16,413 | 0 |
| Total Equity Risk | 16,413 | 0 |
| Total Value of Derivatives | 16,413 | 0 |
| Statement of Assets and Liabilities | ||||
As of October 31, 2024 | ||||
| Assets | ||||
| Investment in securities, at value (including securities loaned of $11,299,697) - See accompanying schedule: | ||||
Unaffiliated issuers (cost $318,336,129) | $ | 376,318,916 | ||
Fidelity Central Funds (cost $16,931,423) | 16,931,436 | |||
| Total Investment in Securities (cost $335,267,552) | $ | 393,250,352 | ||
| Cash | 110,068 | |||
| Foreign currency held at value (cost $3,008) | 3,008 | |||
| Receivable for investments sold | 290,724 | |||
| Receivable for fund shares sold | 259,252 | |||
| Dividends receivable | 134,788 | |||
| Distributions receivable from Fidelity Central Funds | 32,979 | |||
| Prepaid expenses | 436 | |||
| Other receivables | 4,511 | |||
Total assets | 394,086,118 | |||
| Liabilities | ||||
| Payable for investments purchased | $ | 1,472,507 | ||
| Unrealized depreciation on unfunded commitments | 77,516 | |||
| Payable for fund shares redeemed | 244,223 | |||
| Accrued management fee | 261,948 | |||
| Distribution and service plan fees payable | 43,818 | |||
| Payable for daily variation margin on futures contracts | 43,940 | |||
| Other payables and accrued expenses | 65,934 | |||
| Collateral on securities loaned | 11,850,817 | |||
| Total liabilities | 14,060,703 | |||
| Commitments and contingent liabilities (see Significant Accounting Policies note) | ||||
| Net Assets | $ | 380,025,415 | ||
| Net Assets consist of: | ||||
| Paid in capital | $ | 282,590,980 | ||
| Total accumulated earnings (loss) | 97,434,435 | |||
| Net Assets | $ | 380,025,415 | ||
| Net Asset Value and Maximum Offering Price | ||||
| Class A : | ||||
Net Asset Value and redemption price per share ($103,886,770 ÷ 2,689,548 shares)(a) | $ | 38.63 | ||
| Maximum offering price per share (100/94.25 of $38.63) | $ | 40.99 | ||
| Class M : | ||||
Net Asset Value and redemption price per share ($26,299,043 ÷ 689,554 shares)(a) | $ | 38.14 | ||
| Maximum offering price per share (100/96.50 of $38.14) | $ | 39.52 | ||
| Class C : | ||||
Net Asset Value and offering price per share ($12,488,665 ÷ 347,657 shares)(a) | $ | 35.92 | ||
| Class I : | ||||
Net Asset Value, offering price and redemption price per share ($160,791,435 ÷ 4,110,500 shares) | $ | 39.12 | ||
| Class Z : | ||||
Net Asset Value, offering price and redemption price per share ($76,559,502 ÷ 1,955,616 shares) | $ | 39.15 | ||
(a)Redemption price per share is equal to net asset value less any applicable contingent deferred sales charge. | ||||
| Statement of Operations | ||||
| Year ended October 31, 2024 | ||||
| Investment Income | ||||
| Dividends | $ | 6,496,107 | ||
| Interest | 13,829 | |||
| Income from Fidelity Central Funds (including $87,392 from security lending) | 307,509 | |||
| Total income | 6,817,445 | |||
| Expenses | ||||
| Management fee | ||||
| Basic fee | $ | 2,273,818 | ||
| Performance adjustment | 648,310 | |||
| Transfer agent fees | 176,454 | |||
| Distribution and service plan fees | 509,298 | |||
| Accounting fees | 41,256 | |||
| Custodian fees and expenses | 65,215 | |||
| Independent trustees' fees and expenses | 1,626 | |||
| Registration fees | 85,629 | |||
| Audit fees | 59,594 | |||
| Legal | 5,787 | |||
| Miscellaneous | 17,822 | |||
| Total expenses before reductions | 3,884,809 | |||
| Expense reductions | (179,895) | |||
| Total expenses after reductions | 3,704,914 | |||
| Net Investment income (loss) | 3,112,531 | |||
| Realized and Unrealized Gain (Loss) | ||||
| Net realized gain (loss) on: | ||||
| Investment Securities: | ||||
| Unaffiliated issuers | 52,443,898 | |||
| Fidelity Central Funds | 144 | |||
| Foreign currency transactions | 2,037 | |||
| Futures contracts | 856,014 | |||
| Total net realized gain (loss) | 53,302,093 | |||
| Change in net unrealized appreciation (depreciation) on: | ||||
| Investment Securities: | ||||
| Unaffiliated issuers | 37,283,127 | |||
| Fidelity Central Funds | (1) | |||
| Unfunded commitments | (77,516) | |||
| Assets and liabilities in foreign currencies | 547 | |||
| Futures contracts | 122,128 | |||
| Total change in net unrealized appreciation (depreciation) | 37,328,285 | |||
| Net gain (loss) | 90,630,378 | |||
| Net increase (decrease) in net assets resulting from operations | $ | 93,742,909 | ||
| Statement of Changes in Net Assets | ||||
Year ended October 31, 2024 | Year ended October 31, 2023 | |||
| Increase (Decrease) in Net Assets | ||||
| Operations | ||||
| Net investment income (loss) | $ | 3,112,531 | $ | 3,248,138 |
| Net realized gain (loss) | 53,302,093 | (7,449,973) | ||
| Change in net unrealized appreciation (depreciation) | 37,328,285 | 8,643,122 | ||
| Net increase (decrease) in net assets resulting from operations | 93,742,909 | 4,441,287 | ||
| Distributions to shareholders | (3,454,881) | (2,171,133) | ||
| Share transactions - net increase (decrease) | (15,354,393) | (94,886,937) | ||
| Total increase (decrease) in net assets | 74,933,635 | (92,616,783) | ||
| Net Assets | ||||
| Beginning of period | 305,091,780 | 397,708,563 | ||
| End of period | $ | 380,025,415 | $ | 305,091,780 |
Fidelity Advisor® Value Fund Class A |
| Years ended October 31, | 2024 | 2023 | 2022 | 2021 | 2020 | |||||
Selected Per-Share Data | ||||||||||
| Net asset value, beginning of period | $ | 29.81 | $ | 29.71 | $ | 33.55 | $ | 20.40 | $ | 22.44 |
| Income from Investment Operations | ||||||||||
Net investment income (loss) A,B | .26 | .23 | .24 | .11 | .14 | |||||
| Net realized and unrealized gain (loss) | 8.85 | (.01) C | (2.61) | 13.15 | (1.46) | |||||
| Total from investment operations | 9.11 | .22 | (2.37) | 13.26 | (1.32) | |||||
| Distributions from net investment income | (.29) | (.12) | (.24) | (.11) | (.17) D | |||||
| Distributions from net realized gain | - | - | (1.24) | - | (.55) D | |||||
| Total distributions | (.29) | (.12) | (1.47) E | (.11) | (.72) | |||||
| Net asset value, end of period | $ | 38.63 | $ | 29.81 | $ | 29.71 | $ | 33.55 | $ | 20.40 |
Total Return F,G | 30.72 % | .73% | (7.25)% | 65.21% | (6.24)% | |||||
Ratios to Average Net Assets A,H,I | ||||||||||
| Expenses before reductions | 1.21% | 1.22% | 1.15% | 1.21% | 1.17% | |||||
| Expenses net of fee waivers, if any | 1.15 % | 1.15% | 1.15% | 1.20% | 1.16% | |||||
| Expenses net of all reductions | 1.15% | 1.15% | 1.15% | 1.20% | 1.14% | |||||
| Net investment income (loss) | .71% | .74% | .76% | .35% | .71% | |||||
| Supplemental Data | ||||||||||
| Net assets, end of period (000 omitted) | $ | 103,887 | $ | 86,044 | $ | 108,439 | $ | 100,604 | $ | 36,269 |
Portfolio turnover rate J | 80 % | 75% | 67% | 64% | 91% |
Fidelity Advisor® Value Fund Class M |
| Years ended October 31, | 2024 | 2023 | 2022 | 2021 | 2020 | |||||
Selected Per-Share Data | ||||||||||
| Net asset value, beginning of period | $ | 29.45 | $ | 29.34 | $ | 33.13 | $ | 20.15 | $ | 22.19 |
| Income from Investment Operations | ||||||||||
Net investment income (loss) A,B | .17 | .15 | .16 | .03 | .09 | |||||
| Net realized and unrealized gain (loss) | 8.74 | - C | (2.57) | 13.01 | (1.47) | |||||
| Total from investment operations | 8.91 | .15 | (2.41) | 13.04 | (1.38) | |||||
| Distributions from net investment income | (.22) | (.04) | (.15) | (.06) | (.11) D | |||||
| Distributions from net realized gain | - | - | (1.24) | - | (.55) D | |||||
| Total distributions | (.22) | (.04) | (1.38) E | (.06) | (.66) | |||||
| Net asset value, end of period | $ | 38.14 | $ | 29.45 | $ | 29.34 | $ | 33.13 | $ | 20.15 |
Total Return F,G | 30.36 % | .49% | (7.46)% | 64.81% | (6.55)% | |||||
Ratios to Average Net Assets B,H,I | ||||||||||
| Expenses before reductions | 1.45% | 1.46% | 1.40% | 1.47% | 1.45% | |||||
| Expenses net of fee waivers, if any | 1.40 % | 1.40% | 1.40% | 1.45% | 1.43% | |||||
| Expenses net of all reductions | 1.40% | 1.39% | 1.40% | 1.45% | 1.42% | |||||
| Net investment income (loss) | .46% | .49% | .51% | .10% | .43% | |||||
| Supplemental Data | ||||||||||
| Net assets, end of period (000 omitted) | $ | 26,299 | $ | 21,708 | $ | 22,540 | $ | 23,323 | $ | 12,736 |
Portfolio turnover rate J | 80 % | 75% | 67% | 64% | 91% |
Fidelity Advisor® Value Fund Class C |
| Years ended October 31, | 2024 | 2023 | 2022 | 2021 | 2020 | |||||
Selected Per-Share Data | ||||||||||
| Net asset value, beginning of period | $ | 27.73 | $ | 27.73 | $ | 31.45 | $ | 19.18 | $ | 21.15 |
| Income from Investment Operations | ||||||||||
Net investment income (loss) A,B | (.01) | - C | - C | (.12) | (.02) | |||||
| Net realized and unrealized gain (loss) | 8.24 | - C | (2.43) | 12.39 | (1.40) | |||||
| Total from investment operations | 8.23 | - C | (2.43) | 12.27 | (1.42) | |||||
| Distributions from net investment income | (.04) | - | (.08) | - | - | |||||
| Distributions from net realized gain | - | - | (1.21) | - | (.55) | |||||
| Total distributions | (.04) | - | (1.29) | - | (.55) | |||||
| Net asset value, end of period | $ | 35.92 | $ | 27.73 | $ | 27.73 | $ | 31.45 | $ | 19.18 |
Total Return D,E | 29.70 % | -% | (7.94)% | 63.97% | (7.02)% | |||||
Ratios to Average Net Assets B,F,G | ||||||||||
| Expenses before reductions | 1.97% | 2.00% | 1.93% | 2.01% | 1.98% | |||||
| Expenses net of fee waivers, if any | 1.90 % | 1.90% | 1.90% | 1.96% | 1.97% | |||||
| Expenses net of all reductions | 1.90% | 1.90% | 1.90% | 1.96% | 1.95% | |||||
| Net investment income (loss) | (.04)% | (.01)% | -% H | (.41)% | (.11)% | |||||
| Supplemental Data | ||||||||||
| Net assets, end of period (000 omitted) | $ | 12,489 | $ | 11,802 | $ | 14,661 | $ | 15,726 | $ | 6,331 |
Portfolio turnover rate I | 80 % | 75% | 67% | 64% | 91% |
Fidelity Advisor® Value Fund Class I |
| Years ended October 31, | 2024 | 2023 | 2022 | 2021 | 2020 | |||||
Selected Per-Share Data | ||||||||||
| Net asset value, beginning of period | $ | 30.19 | $ | 30.09 | $ | 33.96 | $ | 20.64 | $ | 22.70 |
| Income from Investment Operations | ||||||||||
Net investment income (loss) A,B | .35 | .31 | .32 | .20 | .21 | |||||
| Net realized and unrealized gain (loss) | 8.96 | (.02) C | (2.63) | 13.30 | (1.48) | |||||
| Total from investment operations | 9.31 | .29 | (2.31) | 13.50 | (1.27) | |||||
| Distributions from net investment income | (.38) | (.19) | (.33) | (.18) | (.25) D | |||||
| Distributions from net realized gain | - | - | (1.24) | - | (.55) D | |||||
| Total distributions | (.38) | (.19) | (1.56) E | (.18) | (.79) E | |||||
| Net asset value, end of period | $ | 39.12 | $ | 30.19 | $ | 30.09 | $ | 33.96 | $ | 20.64 |
Total Return F | 31.04 % | .97% | (6.99)% | 65.68% | (5.95)% | |||||
Ratios to Average Net Assets B,G,H | ||||||||||
| Expenses before reductions | .93% | .94% | .88% | .92% | .87% | |||||
| Expenses net of fee waivers, if any | .90 % | .90% | .88% | .92% | .85% | |||||
| Expenses net of all reductions | .90% | .90% | .88% | .92% | .84% | |||||
| Net investment income (loss) | .96% | .99% | 1.02% | .63% | 1.01% | |||||
| Supplemental Data | ||||||||||
| Net assets, end of period (000 omitted) | $ | 160,791 | $ | 134,095 | $ | 170,764 | $ | 104,393 | $ | 8,861 |
Portfolio turnover rate I | 80 % | 75% | 67% | 64% | 91% |
Fidelity Advisor® Value Fund Class Z |
| Years ended October 31, | 2024 | 2023 | 2022 | 2021 | 2020 | |||||
Selected Per-Share Data | ||||||||||
| Net asset value, beginning of period | $ | 30.21 | $ | 30.10 | $ | 33.96 | $ | 20.63 | $ | 22.69 |
| Income from Investment Operations | ||||||||||
Net investment income (loss) A,B | .41 | .36 | .36 | .25 | .23 | |||||
| Net realized and unrealized gain (loss) | 8.95 | (.01) C | (2.62) | 13.28 | (1.47) | |||||
| Total from investment operations | 9.36 | .35 | (2.26) | 13.53 | (1.24) | |||||
| Distributions from net investment income | (.42) | (.24) | (.36) | (.20) | (.27) D | |||||
| Distributions from net realized gain | - | - | (1.24) | - | (.55) D | |||||
| Total distributions | (.42) | (.24) | (1.60) | (.20) | (.82) | |||||
| Net asset value, end of period | $ | 39.15 | $ | 30.21 | $ | 30.10 | $ | 33.96 | $ | 20.63 |
Total Return E | 31.21 % | 1.14% | (6.86)% | 65.88% | (5.84)% | |||||
Ratios to Average Net Assets B,F,G | ||||||||||
| Expenses before reductions | .81% | .82% | .76% | .77% | .75% | |||||
| Expenses net of fee waivers, if any | .75 % | .75% | .75% | .77% | .74% | |||||
| Expenses net of all reductions | .75% | .75% | .75% | .77% | .72% | |||||
| Net investment income (loss) | 1.11% | 1.14% | 1.16% | .78% | 1.13% | |||||
| Supplemental Data | ||||||||||
| Net assets, end of period (000 omitted) | $ | 76,560 | $ | 51,443 | $ | 81,306 | $ | 45,835 | $ | 1,712 |
Portfolio turnover rate H | 80 % | 75% | 67% | 64% | 91% |
| Fidelity Central Fund | Investment Manager | Investment Objective | Investment Practices | Expense RatioA |
| Fidelity Money Market Central Funds | Fidelity Management & Research Company LLC (FMR) | Each fund seeks to obtain a high level of current income consistent with the preservation of capital and liquidity. | Short-term Investments | Less than .005% |
| Gross unrealized appreciation | $80,879,029 |
| Gross unrealized depreciation | (25,180,510) |
| Net unrealized appreciation (depreciation) | $55,698,519 |
| Tax Cost | $337,474,317 |
| Undistributed ordinary income | $5,577,696 |
| Undistributed long-term capital gain | $36,282,908 |
| Net unrealized appreciation (depreciation) on securities and other investments | $55,573,833 |
| October 31, 2024 | October 31, 2023 | |
| Ordinary Income | $3,454,881 | $ 2,171,133 |
| Investment to be Acquired | Commitment Amount ($) | Unrealized Appreciation (Depreciation)($) | |
| Fidelity Advisor Value Fund | EchoStar Corp. | 729,376 | (77,516) |
| Equity Risk | Equity risk relates to the fluctuations in the value of financial instruments as a result of changes in market prices (other than those arising from interest rate risk or foreign exchange risk), whether caused by factors specific to an individual investment, its issuer, or all factors affecting all instruments traded in a market or market segment. |
| Purchases ($) | Sales ($) | |
| Fidelity Advisor Value Fund | 287,415,245 | 302,434,504 |
| Maximum Management Fee Rate % | |
| Class A | .71 |
| Class M | .70 |
| Class C | .72 |
| Class I | .68 |
| Class Z | .56 |
| Total Management Fee Rate % | |
| Class A | .71 |
| Class M | .70 |
| Class C | .72 |
| Class I | .68 |
| Class Z | .56 |
| Performance Adjustment Index | |
| Fidelity Advisor Value Fund | Russell Midcap Value Index |
| Distribution Fee | Service Fee | Total Fees ($) | Retained by FDC ($) | |
| Class A | - % | .25% | 251,757 | 3,769 |
| Class M | .25% | .25% | 127,602 | 128 |
| Class C | .75% | .25% | 129,939 | 17,732 |
| 509,298 | 21,629 |
| Retained by FDC ($) | |
| Class A | 33,531 |
| Class M | 1,521 |
Class CA | 204 |
35,256 |
| % of Class-Level Average Net Assets | |
| Class A | .1895 |
| Class M | .1801 |
| Class C | .2000 |
| Class I | .1646 |
| Class Z | .0420 |
| Amount ($) | % of Class-Level Average Net Assets | |
| Class A | 60,284 | .19 |
| Class M | 14,438 | .18 |
| Class C | 8,805 | .20 |
| Class I | 84,527 | .16 |
| Class Z | 8,400 | .04 |
176,454 |
| % of Average Net Assets | |
| Fidelity Advisor Value Fund | .0354 |
| % of Average Net Assets | |
| Fidelity Advisor Value Fund | .04 |
| Amount ($) | |
| Fidelity Advisor Value Fund | 8,745 |
| Purchases ($) | Sales ($) | Realized Gain (Loss)($) | |
| Fidelity Advisor Value Fund | 18,901,711 | 24,114,021 | 3,614,050 |
| Amount ($) | |
| Fidelity Advisor Value Fund | 578 |
| Total Security Lending Fees Paid to NFS ($) | Security Lending Income From Securities Loaned to NFS ($) | Value of Securities Loaned to NFS at Period End ($) | |
| Fidelity Advisor Value Fund | 9,430 | - | - |
| Expense Limitations | Reimbursement ($) | |
| Class A | 1.15% | 57,684 |
| Class M | 1.40% | 12,029 |
| Class C | 1.90% | 9,078 |
| Class I | .90% | 47,635 |
| Class Z | .75% | 37,439 |
163,865 |
| Expense reduction ($) | |
| Class M | 25 |
Year ended October 31, 2024 | Year ended October 31, 2023 | |
| Fidelity Advisor Value Fund | ||
| Distributions to shareholders | ||
| Class A | $808,936 | $432,389 |
| Class M | 153,984 | 26,680 |
| Class C | 16,469 | - |
| Class I | 1,762,612 | 1,087,478 |
| Class Z | 712,880 | 624,586 |
Total | $3,454,881 | $2,171,133 |
| Shares | Shares | Dollars | Dollars | |
Year ended October 31, 2024 | Year ended October 31, 2023 | Year ended October 31, 2024 | Year ended October 31, 2023 | |
| Fidelity Advisor Value Fund | ||||
| Class A | ||||
| Shares sold | 358,651 | 645,294 | $13,097,539 | $20,203,230 |
| Reinvestment of distributions | 24,101 | 14,231 | 794,616 | 427,939 |
| Shares redeemed | (579,500) | (1,423,001) | (20,872,534) | (43,844,893) |
| Net increase (decrease) | (196,748) | (763,476) | $(6,980,379) | $(23,213,724) |
| Class M | ||||
| Shares sold | 52,688 | 72,556 | $1,876,916 | $2,224,101 |
| Reinvestment of distributions | 4,679 | 888 | 152,627 | 26,425 |
| Shares redeemed | (104,966) | (104,459) | (3,715,843) | (3,211,772) |
| Net increase (decrease) | (47,599) | (31,015) | $(1,686,300) | $(961,246) |
| Class C | ||||
| Shares sold | 52,752 | 156,850 | $1,771,421 | $4,543,881 |
| Reinvestment of distributions | 532 | - | 16,405 | - |
| Shares redeemed | (131,244) | (259,838) | (4,385,543) | (7,440,188) |
| Net increase (decrease) | (77,960) | (102,988) | $(2,597,717) | $(2,896,307) |
| Class I | ||||
| Shares sold | 1,734,233 | 2,295,758 | $62,212,163 | $72,434,977 |
| Reinvestment of distributions | 52,545 | 35,458 | 1,750,267 | 1,077,559 |
| Shares redeemed | (2,117,453) | (3,565,521) | (77,231,297) | (111,308,941) |
| Net increase (decrease) | (330,675) | (1,234,305) | $(13,268,867) | $(37,796,405) |
| Class Z | ||||
| Shares sold | 662,893 | 823,282 | $24,345,656 | $26,158,948 |
| Reinvestment of distributions | 19,285 | 17,943 | 641,991 | 544,763 |
| Shares redeemed | (429,455) | (1,839,568) | (15,808,777) | (56,722,966) |
| Net increase (decrease) | 252,723 | (998,343) | $9,178,870 | $(30,019,255) |
| A special meeting of shareholders was held on July 16, 2024. The results of votes taken among shareholders on the proposal before them are reported below. Each vote reported represents one dollar of net asset value held on the record date for the meeting. | ||
| Proposal 1 | ||
| To elect a Board of Trustees. | ||
# of Votes | % of Votes | |
| Bettina Doulton | ||
| Affirmative | 47,400,603,662.68 | 97.08 |
| Withheld | 1,424,803,996.20 | 2.92 |
| TOTAL | 48,825,407,658.88 | 100.00 |
| Robert A. Lawrence | ||
| Affirmative | 47,280,328,204.40 | 96.84 |
| Withheld | 1,545,079,454.48 | 3.16 |
| TOTAL | 48,825,407,658.88 | 100.00 |
| Vijay C. Advani | ||
| Affirmative | 47,288,044,991.48 | 96.85 |
| Withheld | 1,537,362,667.40 | 3.15 |
| TOTAL | 48,825,407,658.88 | 100.00 |
| Thomas P. Bostick | ||
| Affirmative | 47,248,851,088.69 | 96.77 |
| Withheld | 1,576,556,570.19 | 3.23 |
| TOTAL | 48,825,407,658.88 | 100.00 |
| Donald F. Donahue | ||
| Affirmative | 47,287,004,182.74 | 96.85 |
| Withheld | 1,538,403,476.14 | 3.15 |
| TOTAL | 48,825,407,658.88 | 100.00 |
| Vicki L. Fuller | ||
| Affirmative | 47,375,183,539.48 | 97.03 |
| Withheld | 1,450,224,119.40 | 2.97 |
| TOTAL | 48,825,407,658.88 | 100.00 |
| Patricia L. Kampling | ||
| Affirmative | 47,389,656,970.86 | 97.06 |
| Withheld | 1,435,750,688.02 | 2.94 |
| TOTAL | 48,825,407,658.88 | 100.00 |
| Thomas A. Kennedy | ||
| Affirmative | 47,281,489,897.71 | 96.84 |
| Withheld | 1,543,917,761.17 | 3.16 |
| TOTAL | 48,825,407,658.88 | 100.00 |
| Oscar Munoz | ||
| Affirmative | 47,282,750,545.47 | 96.84 |
| Withheld | 1,542,657,113.41 | 3.16 |
| TOTAL | 48,825,407,658.88 | 100.00 |
| Karen B. Peetz | ||
| Affirmative | 47,356,505,980.29 | 96.99 |
| Withheld | 1,468,901,678.59 | 3.01 |
| TOTAL | 48,825,407,658.88 | 100.00 |
| David M. Thomas | ||
| Affirmative | 47,225,423,215.83 | 96.72 |
| Withheld | 1,599,984,443.05 | 3.28 |
| TOTAL | 48,825,407,658.88 | 100.00 |
| Susan Tomasky | ||
| Affirmative | 47,353,387,805.21 | 96.99 |
| Withheld | 1,472,019,853.67 | 3.01 |
| TOTAL | 48,825,407,658.88 | 100.00 |
| Michael E. Wiley | ||
| Affirmative | 47,278,279,663.75 | 96.83 |
| Withheld | 1,547,127,995.13 | 3.17 |
| TOTAL | 48,825,407,658.88 | 100.00 |
| Proposal 1 reflects trust-wide proposal and voting results. | ||
 |


Contents
| Bank Loan Obligations - 90.1% | |||
Principal Amount (a) (000s) | Value ($) (000s) | ||
| Aerospace - 1.1% | |||
| Azorra Soar Tlb Finance Ltd. Tranche B 1LN, term loan CME Term SOFR 1 Month Index + 3.500% 8.1324% 10/18/29 (b)(c)(d) | 14,350 | 14,332 | |
| Bleriot U.S. Bidco, Inc. Tranche B 1LN, term loan CME Term SOFR 3 Month Index + 4.250% 7.8537% 10/31/30 (b)(c)(d) | 11,047 | 11,069 | |
| Gemini HDPE LLC Tranche B 1LN, term loan CME Term SOFR 3 Month Index + 3.000% 7.847% 12/31/27 (b)(c)(d) | 3,816 | 3,816 | |
| Novaria Holdings LLC Tranche B 1LN, term loan CME Term SOFR 1 Month Index + 4.250% 9.0352% 6/9/31 (b)(c)(d) | 9,710 | 9,686 | |
| Ovation Parent, Inc. Tranche B 1LN, term loan CME Term SOFR 3 Month Index + 3.500% 8.1037% 4/21/31 (b)(c)(d) | 13,390 | 13,436 | |
| TransDigm, Inc.: | |||
| Tranche I 1LN, term loan CME Term SOFR 3 Month Index + 2.750% 7.3537% 8/24/28 (b)(c)(d) | 38,534 | 38,607 | |
| Tranche J 1LN, term loan CME Term SOFR 3 Month Index + 2.500% 7.1037% 2/28/31 (b)(c)(d) | 16,124 | 16,137 | |
| Tranche K 1LN, term loan CME Term SOFR 3 Month Index + 2.750% 7.3537% 3/22/30 (b)(c)(d) | 36,343 | 36,406 | |
| Tranche L 1LN, term loan CME Term SOFR 1 Month Index + 2.500% 7.3196% 1/20/32 (b)(c)(d) | 21,815 | 21,822 | |
TOTAL AEROSPACE | 165,311 | ||
| Air Transportation - 1.2% | |||
| AAdvantage Loyalty IP Ltd. Tranche B 1LN, term loan CME Term SOFR 3 Month Index + 4.750% 9.629% 4/20/28 (b)(c)(d) | 20,529 | 21,103 | |
| Air Canada Tranche B 1LN, term loan CME Term SOFR 3 Month Index + 2.500% 7.2533% 3/21/31 (b)(c)(d) | 11,393 | 11,394 | |
| American Airlines, Inc. Tranche B 1LN, term loan CME Term SOFR 1 Month Index + 3.500% 7.2088% 6/4/29 (b)(c)(d) | 14,615 | 14,555 | |
| Dynasty Acquisition Co., Inc.: | |||
| Tranche B1 1LN, term loan CME Term SOFR 1 Month Index + 2.250% 0% 10/27/31 (b)(c)(d)(e) | 21,034 | 21,034 | |
| Tranche B2 1LN, term loan CME Term SOFR 1 Month Index + 2.250% 0% 10/27/31 (b)(c)(d)(e) | 8,001 | 8,001 | |
| Echo Global Logistics, Inc.: | |||
| 1LN, term loan: | |||
CME Term SOFR 1 Month Index + 3.500% 8.5352% 11/23/28 (b)(c)(d) | 13,111 | 12,915 | |
CME Term SOFR 3 Month Index + 4.750% 9.5352% 11/23/28 (b)(c)(d)(f) | 19,061 | 19,061 | |
| 2LN, term loan: | |||
CME Term SOFR 3 Month Index + 7.000% 11.7852% 11/23/29 (b)(c)(d)(f) | 8,145 | 8,145 | |
CME Term SOFR 3 Month Index + 8.000% 12.7852% 11/23/29 (b)(c)(d)(f) | 4,100 | 4,100 | |
| Rand Parent LLC Tranche B 1LN, term loan CME Term SOFR 3 Month Index + 4.250% 8.3537% 3/18/30 (b)(c)(d) | 16,957 | 17,001 | |
| SkyMiles IP Ltd. Tranche B 1LN, term loan CME Term SOFR 3 Month Index + 3.750% 8.3674% 10/20/27 (b)(c)(d) | 8,459 | 8,612 | |
| United Airlines, Inc. Tranche 1LN, term loan CME Term SOFR 3 Month Index + 2.750% 7.3848% 2/24/31 (b)(c)(d) | 29,089 | 29,109 | |
TOTAL AIR TRANSPORTATION | 175,030 | ||
| Automotive & Auto Parts - 1.6% | |||
| American Trailer World Corp. Tranche B 1LN, term loan CME Term SOFR 1 Month Index + 3.750% 8.5352% 3/5/28 (b)(c)(d) | 26,697 | 23,820 | |
| Belron Finance 2019 LLC Tranche B 1LN, term loan CME Term SOFR 1 Month Index + 2.750% 7.5359% 10/1/31 (b)(c)(d) | 50,585 | 50,753 | |
| Clarios Global LP Tranche B 1LN, term loan CME Term SOFR 1 Month Index + 2.500% 7.1852% 5/6/30 (b)(c)(d) | 26,414 | 26,423 | |
| CWGS Group LLC Tranche B 1LN, term loan CME Term SOFR 1 Month Index + 2.500% 7.3303% 6/3/28 (b)(c)(d) | 45,891 | 44,716 | |
| LS Group OpCo Acquistion LLC Tranche B 1LN, term loan CME Term SOFR 1 Month Index + 3.000% 7.6852% 4/16/31 (b)(c)(d) | 15,363 | 15,362 | |
| Power Stop LLC 1LN, term loan CME Term SOFR 3 Month Index + 4.750% 9.9072% 1/26/29 (b)(c)(d) | 24,654 | 23,652 | |
| RVR Dealership Holdings LLC Tranche B 1LN, term loan 1 month U.S. LIBOR + 4.000% 8.5037% 2/8/28 (b)(c)(d) | 22,169 | 19,708 | |
| Tnt Crane & Rigging, Inc. 2LN, term loan CME Term SOFR 1 Month Index + 8.750% 13.605% 12/3/26 (b)(c)(d)(f) | 5,506 | 5,081 | |
| Wand NewCo 3, Inc. Tranche B 1LN, term loan CME Term SOFR 1 Month Index + 3.250% 7.9052% 1/30/31 (b)(c)(d) | 23,905 | 23,898 | |
TOTAL AUTOMOTIVE & AUTO PARTS | 233,413 | ||
| Banks & Thrifts - 1.4% | |||
| Citadel Securities LP Tranche B 1LN, term loan: | |||
| CME Term SOFR 1 Month Index + 2.000% 6.7177% 10/24/31 (b)(c)(d) | 2,818 | 2,817 | |
| CME Term SOFR 1 Month Index + 2.250% 7.0954% 7/29/30 (b)(c)(d) | 56,094 | 56,079 | |
| Cpi Holdco B LLC Tranche B 1LN, term loan CME Term SOFR 1 Month Index + 2.000% 6.6852% 5/19/31 (b)(c)(d) | 22,185 | 21,931 | |
| CQP Holdco LP Tranche B 1LN, term loan CME Term SOFR 1 Month Index + 2.250% 6.8537% 12/31/30 (b)(c)(d) | 59,638 | 59,587 | |
| GTCR Everest Borrower, LLC 1LN, term loan CME Term SOFR 1 Month Index + 3.000% 7.6037% 9/5/31 (b)(c)(d) | 30,460 | 30,340 | |
| Ngp Xi Midstream Holdings LLC Tranche B 1LN, term loan CME Term SOFR 3 Month Index + 4.000% 8.6037% 7/25/31 (b)(c)(d) | 10,525 | 10,518 | |
| Novae LLC 1LN, term loan CME Term SOFR 3 Month Index + 5.000% 9.8433% 12/22/28 (b)(c)(d) | 13,535 | 13,174 | |
| Superannuation & Investments U.S. LLC 1LN, term loan CME Term SOFR 1 Month Index + 3.750% 8.5496% 12/1/28 (b)(c)(d) | 13,985 | 13,978 | |
TOTAL BANKS & THRIFTS | 208,424 | ||
| Broadcasting - 1.3% | |||
| AppLovin Corp. Tranche B 1LN, term loan: | |||
| CME Term SOFR 1 Month Index + 2.500% 7.1852% 10/25/28 (b)(c)(d) | 14,212 | 14,229 | |
| CME Term SOFR 1 Month Index + 2.500% 7.1852% 8/19/30 (b)(c)(d) | 29,678 | 29,700 | |
| Diamond Sports Group LLC: | |||
| 1LN, term loan CME Term SOFR 1 Month Index + 8.000% 14.9441% 5/25/26 (b)(c)(d) | 3,813 | 3,282 | |
| Tranche DIP term loan 10% 8/2/27 (d) | 4,819 | 5,072 | |
| Dotdash Meredith, Inc. Tranche B 1LN, term loan CME Term SOFR 1 Month Index + 4.000% 8.9441% 12/1/28 (b)(c)(d) | 44,182 | 44,347 | |
| Nexstar Media, Inc. Tranche B, term loan CME Term SOFR 1 Month Index + 2.500% 7.2996% 9/19/26 (b)(c)(d) | 19,894 | 19,882 | |
| Sinclair Television Group, Inc.: | |||
| Tranche B 1LN, term loan: | |||
CME Term SOFR 3 Month Index + 2.500% 7.2996% 9/30/26 (b)(c)(d) | 5,149 | 4,963 | |
CME Term SOFR 3 Month Index + 3.000% 7.7996% 4/1/28 (b)(c)(d) | 2,903 | 2,260 | |
| Tranche B4 1LN, term loan CME Term SOFR 1 Month Index + 2.750% 8.5352% 4/21/29 (b)(c)(d) | 13,588 | 10,592 | |
| Univision Communications, Inc.: | |||
| 1LN, term loan CME Term SOFR 3 Month Index + 4.250% 8.8537% 6/24/29 (b)(c)(d) | 9,702 | 9,615 | |
| Tranche B 1LN, term loan: | |||
CME Term SOFR 1 Month Index + 3.250% 8.0496% 1/31/29 (b)(c)(d) | 38,532 | 37,890 | |
CME Term SOFR 1 Month Index + 3.500% 8.2996% 1/31/29 (b)(c)(d) | 11,845 | 11,697 | |
TOTAL BROADCASTING | 193,529 | ||
| Building Materials - 2.4% | |||
| Acproducts Holdings, Inc. Tranche B 1LN, term loan CME Term SOFR 3 Month Index + 4.250% 9.1153% 5/17/28 (b)(c)(d) | 48,743 | 40,524 | |
| APi Group DE, Inc. Tranche B 1LN, term loan CME Term SOFR 1 Month Index + 2.000% 6.6852% 1/3/29 (b)(c)(d) | 30,979 | 30,948 | |
| Asplundh Tree Expert LLC Tranche B 1LN, term loan CME Term SOFR 1 Month Index + 1.750% 6.4352% 5/23/31 (b)(c)(d) | 18,330 | 18,325 | |
| Beacon Roofing Supply, Inc. Tranche B 1LN, term loan CME Term SOFR 1 Month Index + 2.000% 6.6852% 5/19/28 (b)(c)(d) | 7,359 | 7,371 | |
| Chariot Buyer LLC Tranche B 1LN, term loan: | |||
| CME Term SOFR 1 Month Index + 3.500% 8.0352% 10/22/28 (b)(c)(d) | 7,502 | 7,486 | |
| CME Term SOFR 1 Month Index + 3.750% 8.1852% 11/3/28 (b)(c)(d) | 10,801 | 10,792 | |
| Copeland LP Tranche B 1LN, term loan CME Term SOFR 1 Month Index + 2.500% 7.5572% 8/2/31 (b)(c)(d) | 11,755 | 11,738 | |
| Core & Main LP Tranche B 1LN, term loan CME Term SOFR 1 Month Index + 2.250% 6.9677% 2/10/31 (b)(c)(d) | 8,218 | 8,214 | |
| Hunter Douglas, Inc. Tranche B 1LN, term loan CME Term SOFR 3 Month Index + 3.500% 8.5713% 2/25/29 (b)(c)(d) | 100,879 | 100,395 | |
| Janus International Group LLC Tranche B 1LN, term loan CME Term SOFR 1 Month Index + 2.500% 7.1852% 8/5/30 (b)(c)(d) | 6,344 | 6,287 | |
| MIWD Holdco II LLC Tranche B2, term loan CME Term SOFR 1 Month Index + 3.500% 7.6852% 3/28/31 (b)(c)(d) | 8,394 | 8,414 | |
| Oscar AcquisitionCo LLC 1LN, term loan CME Term SOFR 3 Month Index + 4.500% 8.8537% 4/29/29 (b)(c)(d) | 45,239 | 44,826 | |
| Smyrna Ready Mix Concrete LLC Tranche B 1LN, term loan CME Term SOFR 1 Month Index + 3.500% 8.2177% 4/2/29 (b)(c)(d) | 10,265 | 10,265 | |
| Specialty Building Products Holdings LLC Tranche B 1LN, term loan CME Term SOFR 1 Month Index + 3.750% 8.5352% 10/16/28 (b)(c)(d) | 10,881 | 10,770 | |
| Standard Industries, Inc./New Jersey Tranche B 1LN, term loan CME Term SOFR 1 Month Index + 2.250% 6.7591% 9/22/28 (b)(c)(d) | 13,081 | 13,103 | |
| Traverse Midstream Partners Ll Tranche B, term loan CME Term SOFR 3 Month Index + 3.500% 8.0854% 2/16/28 (b)(c)(d) | 9,422 | 9,438 | |
| White Capital Buyer LLC Tranche B 1LN, term loan CME Term SOFR 1 Month Index + 3.250% 7.9352% 10/19/29 (b)(c)(d) | 14,788 | 14,747 | |
TOTAL BUILDING MATERIALS | 353,643 | ||
| Cable/Satellite TV - 1.7% | |||
| Charter Communication Operating LLC: | |||
| Tranche B2 1LN, term loan CME Term SOFR 3 Month Index + 1.750% 6.3434% 2/1/27 (b)(c)(d) | 65,413 | 65,336 | |
| Tranche B4 1LN, term loan CME Term SOFR 3 Month Index + 2.000% 6.5934% 12/9/30 (b)(c)(d) | 8,655 | 8,590 | |
| Coral-U.S. Co.-Borrower LLC: | |||
| Tranche B, term loan CME Term SOFR 1 Month Index + 2.250% 7.1684% 1/31/28 (b)(c)(d) | 53,065 | 52,288 | |
| Tranche B6 1LN, term loan CME Term SOFR 1 Month Index + 3.000% 7.9184% 10/15/29 (b)(c)(d) | 2,855 | 2,841 | |
| CSC Holdings LLC: | |||
| Tranche B 5LN, term loan CME Term SOFR 1 Month Index + 2.500% 7.1735% 4/15/27 (b)(c)(d) | 5,546 | 5,147 | |
| Tranche B6 LN, term loan CME Term SOFR 1 Month Index + 4.500% 9.304% 1/18/28 (b)(c)(d) | 47,414 | 46,254 | |
| LCPR Loan Financing LLC 1LN, term loan CME Term SOFR 1 Month Index + 3.750% 8.6684% 10/16/28 (b)(c)(d) | 13,560 | 12,835 | |
| Numericable LLC Tranche B 13LN, term loan CME Term SOFR 1 Month Index + 4.000% 8.6821% 8/14/26 (b)(c)(d) | 11,910 | 10,061 | |
| Virgin Media Bristol LLC: | |||
| Tranche N, term loan CME Term SOFR 1 Month Index + 2.500% 7.4184% 1/31/28 (b)(c)(d) | 15,360 | 14,899 | |
| Tranche Y 1LN, term loan CME Term SOFR 6 Month Index + 3.250% 7.7237% 3/6/31 (b)(c)(d) | 26,945 | 26,137 | |
TOTAL CABLE/SATELLITE TV | 244,388 | ||
| Capital Goods - 0.7% | |||
| Ali Group North America Corp. Tranche B 1LN, term loan CME Term SOFR 1 Month Index + 2.000% 6.7996% 7/22/29 (b)(c)(d) | 7,342 | 7,358 | |
| Chart Industries, Inc. Tranche B 1LN, term loan CME Term SOFR 3 Month Index + 2.500% 7.0921% 3/18/30 (b)(c)(d) | 21,753 | 21,767 | |
| CPM Holdings, Inc. 1LN, term loan CME Term SOFR 1 Month Index + 4.500% 9.3441% 9/28/28 (b)(c)(d) | 10,323 | 10,086 | |
| Crown Equipment Corp. Tranche B 1LN, term loan CME Term SOFR 1 Month Index + 2.500% 7.3235% 10/2/31 (b)(c)(d) | 9,360 | 9,366 | |
| Griffon Corp. Tranche B 1LN, term loan CME Term SOFR 3 Month Index + 2.000% 6.7177% 1/24/29 (b)(c)(d) | 23,090 | 23,047 | |
| John Bean Technologies Corp. Tranche B 1LN, term loan CME Term SOFR 1 Month Index + 2.250% 0% 10/9/31 (b)(c)(d)(e) | 8,375 | 8,375 | |
| Resideo Funding, Inc. Tranche B 1LN, term loan CME Term SOFR 3 Month Index + 2.000% 6.6559% 5/14/31 (b)(c)(d) | 9,742 | 9,748 | |
| TK Elevator U.S. Newco, Inc. Tranche B 1LN, term loan CME Term SOFR 6 Month Index + 3.500% 8.5877% 4/30/30 (b)(c)(d) | 16,698 | 16,734 | |
TOTAL CAPITAL GOODS | 106,481 | ||
| Chemicals - 4.4% | |||
| A-Gas Finco, Inc. Tranche B 1LN, term loan CME Term SOFR 3 Month Index + 5.250% 9.8537% 12/14/29 (b)(c)(d) | 24,150 | 21,901 | |
| Advancion Holdings LLC: | |||
| 1LN, term loan CME Term SOFR 1 Month Index + 4.750% 9.4352% 11/24/27 (b)(c)(d) | 10,326 | 10,300 | |
| 2LN, term loan CME Term SOFR 1 Month Index + 7.750% 12.5352% 11/24/28 (b)(c)(d) | 12,310 | 11,668 | |
| Tranche B 1LN, term loan CME Term SOFR 1 Month Index + 4.000% 8.7852% 11/24/27 (b)(c)(d) | 18,835 | 18,793 | |
| ARC Falcon I, Inc.: | |||
| Tranche B 1LN, term loan CME Term SOFR 1 Month Index + 3.750% 8.2852% 9/30/28 (b)(c)(d) | 51,693 | 51,752 | |
| Tranche B 2LN, term loan CME Term SOFR 1 Month Index + 7.000% 11.7852% 10/1/29 (b)(c)(d) | 3,385 | 3,169 | |
| Avient Corp. Tranche B8 1LN, term loan CME Term SOFR 3 Month Index + 2.000% 6.6367% 8/29/29 (b)(c)(d) | 5,859 | 5,872 | |
| Axalta Coating Systems U.S. Holdings, Inc. Tranche B6 1LN, term loan CME Term SOFR 3 Month Index + 2.000% 6.6037% 12/20/29 (b)(c)(d) | 5,859 | 5,875 | |
| Bakelite U.S. Holding Ltd. 1LN, term loan CME Term SOFR 3 Month Index + 3.500% 8.1037% 5/29/29 (b)(c)(d) | 19,345 | 19,351 | |
| Consolidated Energy Finance SA Tranche B 1LN, term loan CME Term SOFR 1 Month Index + 4.500% 9.5572% 11/15/30 (b)(c)(d) | 31,780 | 29,896 | |
| Derby Buyer LLC 1LN, term loan CME Term SOFR 1 Month Index + 3.500% 8.3495% 11/1/30 (b)(c)(d) | 17,592 | 17,594 | |
| Discovery Purchaser Corp. 1LN, term loan CME Term SOFR 3 Month Index + 4.370% 8.9647% 10/4/29 (b)(c)(d) | 59,112 | 59,001 | |
| Groupe Solmax, Inc. Tranche B 1LN, term loan CME Term SOFR 3 Month Index + 4.750% 9.5849% 5/27/28 (b)(c)(d) | 27,538 | 25,447 | |
| Herens U.S. Holdco Corp. Tranche B 1LN, term loan CME Term SOFR 3 Month Index + 3.920% 8.6287% 7/3/28 (b)(c)(d) | 24,448 | 23,759 | |
| Hexion Holdings Corp. 1LN, term loan CME Term SOFR 3 Month Index + 4.500% 9.7711% 3/15/29 (b)(c)(d) | 58,506 | 58,454 | |
| Hexion, Inc. 2LN, term loan CME Term SOFR 1 Month Index + 7.430% 12.2227% 3/15/30 (b)(c)(d) | 8,290 | 7,494 | |
| INEOS U.S. Petrochem LLC: | |||
| 1LN, term loan CME Term SOFR 1 Month Index + 3.750% 8.5352% 3/1/30 (b)(c)(d) | 7,741 | 7,673 | |
| Tranche B 1LN, term loan CME Term SOFR 1 Month Index + 4.250% 9.0352% 4/2/29 (b)(c)(d) | 35,594 | 35,394 | |
| M2S Group Intermediate Holding Tranche B 1LN, term loan CME Term SOFR 1 Month Index + 4.750% 9.8518% 8/22/31 (b)(c)(d) | 23,530 | 22,736 | |
| Manchester Acquisition Sub LLC Tranche B 1LN, term loan CME Term SOFR 3 Month Index + 5.750% 10.9157% 12/1/26 (b)(c)(d) | 15,797 | 14,730 | |
| Nouryon U.S.A. LLC Tranche B 1LN, term loan: | |||
| CME Term SOFR 3 Month Index + 3.500% 7.784% 4/3/28 (b)(c)(d) | 9,841 | 9,872 | |
| CME Term SOFR 3 Month Index + 3.500% 8.6284% 4/3/28 (b)(c)(d) | 26,377 | 26,498 | |
| Olympus Water U.S. Holding Corp. Tranche B 1LN, term loan CME Term SOFR 3 Month Index + 3.500% 8.1037% 6/23/31 (b)(c)(d) | 51,858 | 51,910 | |
| SCIH Salt Holdings, Inc. Tranche B 1LN, term loan CME Term SOFR 3 Month Index + 3.500% 8.0854% 3/16/27 (b)(c)(d) | 11,249 | 11,270 | |
| The Chemours Co. LLC Tranche B2 1LN, term loan CME Term SOFR 1 Month Index + 3.500% 8.1852% 8/18/28 (b)(c)(d) | 47,430 | 47,489 | |
| Touchdown Acquirer, Inc. Tranche B 1LN, term loan CME Term SOFR 1 Month Index + 3.250% 7.8537% 2/21/31 (b)(c)(d) | 23,980 | 24,025 | |
| Usalco LLC: | |||
| Tranche B 1LN, term loan CME Term SOFR 1 Month Index + 4.000% 8.6852% 9/30/31 (b)(c)(d) | 12,683 | 12,751 | |
| Tranche DD 1LN, term loan CME Term SOFR 1 Month Index + 4.000% 0% 9/30/31 (b)(c)(d)(g) | 1,307 | 1,314 | |
| W.R. Grace Holding LLC Tranche B 1LN, term loan CME Term SOFR 3 Month Index + 3.750% 7.8537% 9/22/28 (b)(c)(d) | 17,228 | 17,249 | |
TOTAL CHEMICALS | 653,237 | ||
| Consumer Products - 3.1% | |||
| 19Th Holdings Golf LLC Tranche B 1LN, term loan CME Term SOFR 1 Month Index + 3.250% 8.2008% 2/7/29 (b)(c)(d) | 30,976 | 30,537 | |
| Aip Rd Buyer Corp.: | |||
| 1LN, term loan CME Term SOFR 1 Month Index + 4.250% 8.9352% 12/22/28 (b)(c)(d) | 2,402 | 2,401 | |
| Tranche B 1LN, term loan CME Term SOFR 1 Month Index + 5.000% 9.1852% 12/26/28 (b)(c)(d) | 8,135 | 8,149 | |
| BCPE Empire Holdings, Inc. 1LN, term loan CME Term SOFR 1 Month Index + 3.500% 8.1852% 12/26/28 (b)(c)(d) | 46,237 | 46,231 | |
| Bombardier Recreational Products, Inc.: | |||
| Tranche B3 1LN, term loan CME Term SOFR 1 Month Index + 2.750% 7.4352% 12/13/29 (b)(c)(d) | 13,318 | 13,299 | |
| Tranche B4 1LN, term loan CME Term SOFR 1 Month Index + 2.750% 7.4352% 1/22/31 (b)(c)(d) | 14,164 | 14,138 | |
| CNT Holdings I Corp. Tranche B 1LN, term loan CME Term SOFR 1 Month Index + 3.500% 8.0854% 11/8/27 (b)(c)(d) | 26,370 | 26,416 | |
| Conair Holdings LLC Tranche B 1LN, term loan CME Term SOFR 1 Month Index + 3.750% 8.5496% 5/17/28 (b)(c)(d) | 17,156 | 15,661 | |
| Foundation Building Materials, Inc. Tranche B2 1LN, term loan CME Term SOFR 3 Month Index + 4.000% 8.5856% 1/29/31 (b)(c)(d) | 51,315 | 50,493 | |
| Gloves Buyer, Inc. Tranche B 1LN, term loan CME Term SOFR 1 Month Index + 4.000% 8.7996% 1/6/28 (b)(c)(d) | 6,863 | 6,829 | |
| Kodiak BP LLC Tranche B2 1LN, term loan CME Term SOFR 3 Month Index + 3.750% 8.4352% 3/13/28 (b)(c)(d) | 6,642 | 6,662 | |
| Kronos Acquisition Holdings, Inc. Tranche B 1LN, term loan CME Term SOFR 1 Month Index + 4.000% 8.584% 6/27/31 (b)(c)(d) | 27,434 | 25,737 | |
| Mattress Firm, Inc. Tranche B 1LN, term loan CME Term SOFR 3 Month Index + 4.250% 8.9235% 9/24/28 (b)(c)(d) | 32,446 | 32,426 | |
| Olaplex, Inc. Tranche B 1LN, term loan CME Term SOFR 1 Month Index + 3.750% 0% 2/23/29 (b)(c)(d)(e) | 7,120 | 6,875 | |
| Runner Buyer, Inc. Tranche B 1LN, term loan CME Term SOFR 3 Month Index + 5.500% 10.6717% 10/21/28 (b)(c)(d) | 12,540 | 5,734 | |
| Sweetwater Borrower LLC Tranche B 1LN, term loan CME Term SOFR 1 Month Index + 4.250% 9.0496% 8/5/28 (b)(c)(d) | 30,894 | 30,894 | |
| Tempur Sealy International, Inc. Tranche B 1LN, term loan CME Term SOFR 1 Month Index + 2.500% 0% 10/4/31 (b)(c)(d)(e) | 40,015 | 39,982 | |
| TripAdvisor, Inc. Tranche B 1LN, term loan CME Term SOFR 1 Month Index + 2.750% 7.4352% 7/8/31 (b)(c)(d) | 9,230 | 9,226 | |
| Varsity Brands LLC Tranche B 1LN, term loan CME Term SOFR 1 Month Index + 3.750% 8.8213% 8/26/31 (b)(c)(d) | 38,360 | 38,184 | |
| Windsor Holdings III, LLC Tranche B 1LN, term loan CME Term SOFR 1 Month Index + 3.500% 8.2592% 8/1/30 (b)(c)(d) | 30,463 | 30,562 | |
| Woof Holdings LLC Tranche B 1LN, term loan CME Term SOFR 3 Month Index + 3.750% 8.6153% 12/21/27 (b)(c)(d) | 14,292 | 9,497 | |
TOTAL CONSUMER PRODUCTS | 449,933 | ||
| Containers - 1.6% | |||
| AOT Packaging Products AcquisitionCo LLC 1LN, term loan CME Term SOFR 1 Month Index + 3.250% 8.0496% 3/3/28 (b)(c)(d) | 36,828 | 36,483 | |
| Berlin Packaging, LLC Tranche B7 1LN, term loan CME Term SOFR 1 Month Index + 3.750% 8.5703% 6/7/31 (b)(c)(d) | 41,071 | 41,141 | |
| Berry Global, Inc. Tranche AA 1LN, term loan CME Term SOFR 3 Month Index + 1.750% 6.688% 7/1/29 (b)(c)(d) | 24,302 | 24,339 | |
| Charter Next Generation, Inc. Tranche B 1LN, term loan CME Term SOFR 1 Month Index + 3.250% 7.6852% 12/1/27 (b)(c)(d) | 24,122 | 24,114 | |
| Graham Packaging Co., Inc. Tranche B 1LN, term loan CME Term SOFR 1 Month Index + 2.500% 7.1852% 8/4/27 (b)(c)(d) | 16,641 | 16,632 | |
| Kloeckner Pentaplast of America, Inc. Tranche B 1LN, term loan CME Term SOFR 6 Month Index + 4.750% 9.7229% 2/9/26 (b)(c)(d) | 24,875 | 23,120 | |
| LC Ahab U.S. Bidco LLC Tranche B 1LN, term loan CME Term SOFR 1 Month Index + 3.500% 8.1852% 5/1/31 (b)(c)(d) | 8,915 | 8,937 | |
| Pactiv Evergreen Group Holdings, Inc. Tranche B4 1LN, term loan CME Term SOFR 1 Month Index + 2.500% 7.1852% 9/25/28 (b)(c)(d) | 15,966 | 15,972 | |
| Pregis TopCo Corp. 1LN, term loan: | |||
| CME Term SOFR 1 Month Index + 3.750% 8.6852% 8/3/26 (b)(c)(d) | 17,010 | 17,049 | |
| CME Term SOFR 1 Month Index + 3.750% 8.7996% 8/1/26 (b)(c)(d) | 1,940 | 1,942 | |
| Reynolds Consumer Products LLC Tranche B 1LN, term loan CME Term SOFR 1 Month Index + 1.750% 6.5352% 1/30/27 (b)(c)(d) | 14,868 | 14,879 | |
| SupplyOne, Inc. Tranche B 1LN, term loan CME Term SOFR 1 Month Index + 4.250% 8.4352% 4/21/31 (b)(c)(d) | 6,632 | 6,634 | |
TOTAL CONTAINERS | 231,242 | ||
| Diversified Financial Services - 4.8% | |||
| Aal Delaware Holdco, Inc. 1LN, term loan CME Term SOFR 1 Month Index + 3.500% 8.1852% 7/30/31 (b)(c)(d) | 12,170 | 12,221 | |
| AlixPartners LLP Tranche B 1LN, term loan CME Term SOFR 1 Month Index + 2.750% 7.2996% 2/4/28 (b)(c)(d) | 14,369 | 14,383 | |
| Aretec Group, Inc. 1LN, term loan CME Term SOFR 1 Month Index + 4.000% 8.6852% 8/9/30 (b)(c)(d) | 39,070 | 38,844 | |
| BCP Renaissance Parent LLC Tranche B 1LN, term loan CME Term SOFR 3 Month Index + 3.250% 7.8537% 10/31/28 (b)(c)(d) | 8,859 | 8,859 | |
| Boost Newco Borrower LLC Tranche B 1LN, term loan CME Term SOFR 3 Month Index + 2.500% 7.1037% 1/31/31 (b)(c)(d) | 88,170 | 88,336 | |
| Broadstreet Partners, Inc. Tranche B4 1LN, term loan CME Term SOFR 1 Month Index + 3.250% 7.9352% 6/14/31 (b)(c)(d) | 34,168 | 34,127 | |
| Clue Opco LLC Tranche B 1LN, term loan CME Term SOFR 3 Month Index + 4.500% 9.0854% 12/19/30 (b)(c)(d) | 34,323 | 34,245 | |
| Dragon Buyer, Inc. 1LN, term loan CME Term SOFR 1 Month Index + 3.250% 7.8537% 9/30/31 (b)(c)(d) | 15,695 | 15,592 | |
| DXP Enterprises, Inc. Tranche B 1LN, term loan CME Term SOFR 1 Month Index + 3.750% 8.4352% 10/7/30 (b)(c)(d) | 8,059 | 8,083 | |
| Fleet U.S. Bidco, Inc. Tranche B 1LN, term loan CME Term SOFR 1 Month Index + 2.750% 7.5777% 2/10/31 (b)(c)(d) | 12,917 | 12,933 | |
| Focus Financial Partners LLC: | |||
| Tranche B8 1LN, term loan CME Term SOFR 1 Month Index + 3.250% 7.9352% 9/17/31 (b)(c)(d) | 50,271 | 50,293 | |
| Tranche DD 1LN, term loan CME Term SOFR 1 Month Index + 3.250% 0% 9/10/31 (b)(c)(d)(g) | 5,399 | 5,402 | |
| Fugue Finance LLC Tranche B 1LN, term loan CME Term SOFR 3 Month Index + 3.750% 8.8072% 2/26/31 (b)(c)(d) | 16,593 | 16,666 | |
| HarbourVest Partners LLC Tranche B 1LN, term loan CME Term SOFR 3 Month Index + 2.250% 6.8537% 4/22/30 (b)(c)(d) | 18,806 | 18,806 | |
| Heubach Holding U.S.A. LLC Tranche CME, term loan CME Term SOFR 1 Month Index + 10.000% 0% 12/31/49 (b)(c)(d)(f)(h) | 2,940 | 2,205 | |
| Hightower Holding LLC Tranche B 1LN, term loan CME Term SOFR 1 Month Index + 3.500% 8.7477% 4/21/28 (b)(c)(d) | 26,035 | 26,055 | |
| Inception Finco Sarl Tranche B 1LN, term loan CME Term SOFR 3 Month Index + 4.500% 9.1037% 3/10/31 (b)(c)(d) | 7,671 | 7,706 | |
| Jane Street Group LLC Tranche B 1LN, term loan CME Term SOFR 1 Month Index + 2.000% 6.6852% 1/26/28 (b)(c)(d) | 20,624 | 20,594 | |
| Johnstone Supply LLC Tranche B 1LN, term loan CME Term SOFR 1 Month Index + 3.000% 7.8508% 6/7/31 (b)(c)(d) | 18,005 | 17,973 | |
| LSF11 Trinity Bidco, Inc. Tranche B 1LN, term loan CME Term SOFR 1 Month Index + 3.500% 8.2446% 6/17/30 (b)(c)(d) | 4,244 | 4,252 | |
| Needle Holdings LLC Tranche EXIT 1LN, term loan CME Term SOFR 1 Month Index + 9.500% 14.3454% 4/28/28 (b)(c)(d)(f) | 9,063 | 7,251 | |
| Neon Maple U.S. Debt Mergersub I Tranche B 1LN, term loan CME Term SOFR 1 Month Index + 3.000% 0% 7/21/31 (b)(c)(d)(e) | 45,490 | 45,319 | |
| Nexus Buyer LLC: | |||
| 2LN, term loan CME Term SOFR 1 Month Index + 6.250% 11.0352% 11/5/29 (b)(c)(d) | 14,420 | 14,337 | |
| Tranche B 1LN, term loan CME Term SOFR 1 Month Index + 4.000% 8.6852% 7/18/31 (b)(c)(d) | 53,009 | 52,778 | |
| Priority Holdings LLC Tranche B 1LN, term loan CME Term SOFR 1 Month Index + 4.750% 9.8072% 5/16/31 (b)(c)(d) | 6,808 | 6,785 | |
| Recess Holdings, Inc. Tranche B 1LN, term loan CME Term SOFR 3 Month Index + 4.500% 9.0854% 2/14/30 (b)(c)(d) | 20,239 | 20,337 | |
| Sk Neptune Husky Finance Sarl Tranche B 1LN, term loan CME Term SOFR 3 Month Index + 5.000% 10.4338% 1/3/29 (b)(c)(d)(h) | 11,865 | 148 | |
| Stg Distribution, LLC 1L, term loan: | |||
| CME Term SOFR 1 Month Index + 6.000% 12.4495% 9/30/29 (b)(c)(d)(f) | 10,609 | 7,734 | |
| CME Term SOFR 1 Month Index + 7.500% 13.1995% 10/3/29 (b)(c)(d)(f) | 4,944 | 4,895 | |
| TransUnion LLC: | |||
| Tranche B 1LN, term loan CME Term SOFR 1 Month Index + 2.000% 6.6852% 12/1/28 (b)(c)(d) | 12,120 | 12,113 | |
| Tranche B8 1LN, term loan CME Term SOFR 1 Month Index + 1.750% 6.4352% 6/6/31 (b)(c)(d) | 26,285 | 26,239 | |
| UFC Holdings LLC Tranche B 1LN, term loan CME Term SOFR 3 Month Index + 2.750% 7.6375% 4/29/26 (b)(c)(d) | 9,612 | 9,617 | |
| WH Borrower LLC Tranche B 1LN, term loan: | |||
| CME Term SOFR 3 Month Index + 5.500% 10.1475% 2/9/27 (b)(c)(d) | 39,211 | 39,152 | |
| CME Term SOFR 3 Month Index + 5.500% 10.1475% 2/15/27 (b)(c)(d) | 27,801 | 27,836 | |
TOTAL DIVERSIFIED FINANCIAL SERVICES | 712,116 | ||
| Diversified Media - 0.8% | |||
| Advantage Sales & Marketing, Inc. Tranche B 1LN, term loan CME Term SOFR 3 Month Index + 4.250% 9.1211% 10/28/27 (b)(c)(d) | 30,707 | 30,141 | |
| Allen Media LLC Tranche B 1LN, term loan CME Term SOFR 3 Month Index + 5.500% 10.2537% 2/10/27 (b)(c)(d) | 39,282 | 25,509 | |
| CMG Media Corp. Tranche B 1LN, term loan CME Term SOFR 3 Month Index + 3.500% 8.2037% 12/17/26 (b)(c)(d) | 64,793 | 59,059 | |
TOTAL DIVERSIFIED MEDIA | 114,709 | ||
| Energy - 3.4% | |||
| Alpha Generation LLC Tranche B 1LN, term loan CME Term SOFR 1 Month Index + 2.750% 7.4465% 9/30/31 (b)(c)(d) | 22,295 | 22,283 | |
| Apro LLC Tranche B 1LN, term loan CME Term SOFR 1 Month Index + 3.750% 8.5735% 7/9/31 (b)(c)(d) | 22,685 | 22,728 | |
| Array Technologies, Inc. Tranche B 1LN, term loan CME Term SOFR 1 Month Index + 3.250% 8.1091% 10/14/27 (b)(c)(d) | 23,284 | 23,248 | |
| BW Gas & Convenience Holdings LLC Tranche B 1LN, term loan CME Term SOFR 1 Month Index + 3.500% 8.2996% 3/17/28 (b)(c)(d) | 8,910 | 8,905 | |
| Calpine Construction Finance Co. LP Tranche B 1LN, term loan CME Term SOFR 1 Month Index + 2.000% 6.6852% 7/31/30 (b)(c)(d) | 14,954 | 14,865 | |
| Delek U.S. Holdings, Inc. Tranche B 1LN, term loan CME Term SOFR 1 Month Index + 3.500% 8.2852% 11/19/29 (b)(c)(d) | 28,805 | 28,738 | |
| Eastern Power LLC Tranche B, term loan CME Term SOFR 1 Month Index + 5.250% 9.9352% 4/3/28 (b)(c)(d) | 6,689 | 6,690 | |
| EG America LLC Tranche BC 1LN, term loan CME Term SOFR 1 Month Index + 5.500% 10.4445% 2/7/28 (b)(c)(d) | 82,068 | 82,089 | |
| Emg Utica Midstream Holdings L Tranche B 1LN, term loan CME Term SOFR 1 Month Index + 4.000% 0% 10/24/29 (b)(c)(d)(e) | 13,970 | 13,900 | |
| Enstall Group BV Tranche B 1LN, term loan CME Term SOFR 3 Month Index + 4.750% 9.8653% 8/27/28 (b)(c)(d) | 22,985 | 21,606 | |
| Epic Crude Services LP Tranche B 1LN, term loan CME Term SOFR 1 Month Index + 3.000% 7.6559% 10/9/31 (b)(c)(d) | 19,760 | 19,742 | |
| Epic Y-Grade Services,LP Tranche B 1LN, term loan CME Term SOFR 3 Month Index + 5.500% 10.6008% 6/29/29 (b)(c)(d) | 30,560 | 30,469 | |
| GIP II Blue Holding LP Tranche B 1LN, term loan CME Term SOFR 1 Month Index + 3.750% 8.4352% 9/29/28 (b)(c)(d) | 32,156 | 32,222 | |
| Hamilton Projs. Acquiror LLC Tranche B 1LN, term loan CME Term SOFR 1 Month Index + 3.750% 8.4352% 5/22/31 (b)(c)(d) | 9,052 | 9,082 | |
| Natgasoline LLC Tranche B, term loan CME Term SOFR 6 Month Index + 3.500% 9.016% 11/14/25 (b)(c)(d) | 11,099 | 10,877 | |
| New Fortress Energy, Inc. Tranche B 1LN, term loan CME Term SOFR 3 Month Index + 5.000% 9.5854% 10/30/28 (b)(c)(d) | 55,396 | 52,196 | |
| Par Petroleum LLC Tranche B 1LN, term loan CME Term SOFR 3 Month Index + 3.750% 8.334% 2/28/30 (b)(c)(d) | 19,313 | 19,261 | |
| Prairie ECI Acquiror LP Tranche 1LN, term loan CME Term SOFR 1 Month Index + 4.750% 9.4352% 8/1/29 (b)(c)(d) | 9,771 | 9,778 | |
| Rockpoint Gas Storage Partners 1LN, term loan CME Term SOFR 1 Month Index + 3.500% 8.3634% 9/18/31 (b)(c)(d) | 25,790 | 25,710 | |
| Waterbridge Midstream Operatin Tranche B 1LN, term loan CME Term SOFR 3 Month Index + 4.750% 9.3932% 6/22/29 (b)(c)(d) | 22,955 | 22,459 | |
| Waterbridge Ndb Operating LLC Tranche B 1LN, term loan CME Term SOFR 3 Month Index + 4.500% 9.6028% 5/10/29 (b)(c)(d) | 10,555 | 10,537 | |
| Win Waste Innovations Holdings Tranche B 1LN, term loan CME Term SOFR 1 Month Index + 2.750% 7.5496% 3/25/28 (b)(c)(d) | 16,026 | 15,229 | |
TOTAL ENERGY | 502,614 | ||
| Entertainment/Film - 0.4% | |||
| AP Core Holdings II LLC: | |||
| Tranche B1 1LN, term loan CME Term SOFR 1 Month Index + 5.500% 10.2996% 9/1/27 (b)(c)(d) | 28,395 | 26,797 | |
| Tranche B2 1LN, term loan CME Term SOFR 1 Month Index + 5.500% 10.2996% 9/1/27 (b)(c)(d) | 33,875 | 31,783 | |
TOTAL ENTERTAINMENT/FILM | 58,580 | ||
| Environmental - 0.6% | |||
| Clean Harbors, Inc. Tranche B 1LN, term loan CME Term SOFR 1 Month Index + 1.750% 6.4352% 10/10/28 (b)(c)(d) | 11,442 | 11,485 | |
| Madison IAQ LLC Tranche B 1LN, term loan CME Term SOFR 1 Month Index + 3.250% 7.8892% 6/21/28 (b)(c)(d) | 43,334 | 43,287 | |
| Reworld Holding Corp.: | |||
| Tranche B 1LN, term loan: | |||
CME Term SOFR 1 Month Index + 2.500% 7.1929% 11/30/28 (b)(c)(d) | 10,231 | 10,235 | |
CME Term SOFR 1 Month Index + 2.500% 7.3566% 11/30/28 (b)(c)(d) | 11,427 | 11,430 | |
| Tranche C 1LN, term loan: | |||
CME Term SOFR 1 Month Index + 2.500% 7.3566% 11/30/28 (b)(c)(d) | 626 | 626 | |
CME Term SOFR 6 Month Index + 2.500% 7.5877% 11/30/28 (b)(c)(d) | 786 | 786 | |
| Tidal Waste & Recycling Holdin Tranche B 1LN, term loan CME Term SOFR 1 Month Index + 3.500% 8.2433% 10/6/31 (b)(c)(d) | 9,725 | 9,725 | |
TOTAL ENVIRONMENTAL | 87,574 | ||
| Food & Drug Retail - 0.8% | |||
| Cardenas Merger Sub, LLC 1LN, term loan CME Term SOFR 3 Month Index + 6.750% 11.4537% 8/1/29 (b)(c)(d) | 24,932 | 24,314 | |
| Froneri U.S., Inc. term loan CME Term SOFR 1 Month Index + 2.000% 0% 9/29/31 (c)(d) | 12,651 | 12,589 | |
| JP Intermediate B LLC term loan CME Term SOFR 3 Month Index + 5.500% 14.5% 11/20/27 (b)(c)(d) | 20,004 | 963 | |
| Northeast Grocery, Inc. Tranche B 1LN, term loan CME Term SOFR 3 Month Index + 7.500% 12.5955% 12/13/28 (b)(c)(d) | 11,367 | 11,415 | |
| Primary Products Finance LLC Tranche B 1LN, term loan CME Term SOFR 3 Month Index + 3.500% 8.2482% 4/2/29 (b)(c)(d) | 36,278 | 36,323 | |
| Upfield U.S.A. Corp. Tranche B7 1LN, term loan CME Term SOFR 1 Month Index + 4.250% 9.76% 1/3/28 (b)(c)(d)(g) | 33,741 | 33,657 | |
TOTAL FOOD & DRUG RETAIL | 119,261 | ||
| Food/Beverage/Tobacco - 1.6% | |||
| Aspire Bakeries Holdings LLC Tranche B 1LN, term loan CME Term SOFR 1 Month Index + 4.250% 8.9677% 12/23/30 (b)(c)(d) | 17,662 | 17,603 | |
| Chobani LLC Tranche B 1LN, term loan: | |||
| CME Term SOFR 1 Month Index + 3.500% 8.0496% 10/23/27 (b)(c)(d) | 20,110 | 20,166 | |
| CME Term SOFR 1 Month Index + 3.750% 8.4352% 10/25/27 (b)(c)(d) | 8,942 | 8,978 | |
| Del Monte Foods Corp. Ii, Inc.: | |||
| 1LN, term loan CME Term SOFR 1 Month Index + 8.000% 13.1657% 8/2/28 (b)(c)(d) | 23,201 | 22,207 | |
| 2LN, term loan CME Term SOFR 1 Month Index + 4.250% 9.4061% 8/2/28 (b)(c)(d) | 43,499 | 24,272 | |
| Fiesta Purchaser, Inc. Tranche B 1LN, term loan CME Term SOFR 1 Month Index + 4.000% 8.6852% 2/12/31 (b)(c)(d) | 22,853 | 22,900 | |
| Golden State Foods LLC Tranche B 1LN, term loan CME Term SOFR 1 Month Index + 4.250% 0% 10/7/31 (b)(c)(d)(e) | 13,990 | 13,990 | |
| Naked Juice LLC: | |||
| 1LN, term loan CME Term SOFR 3 Month Index + 3.250% 7.9537% 1/24/29 (b)(c)(d) | 41,187 | 30,749 | |
| 2LN, term loan CME Term SOFR 3 Month Index + 6.000% 10.7037% 1/24/30 (b)(c)(d) | 11,985 | 6,632 | |
| Saratoga Food Specialties LLC Tranche B 1LN, term loan CME Term SOFR 3 Month Index + 3.750% 8.6989% 3/1/29 (b)(c)(d) | 8,110 | 8,145 | |
| Triton Water Holdings, Inc. Tranche B 1LN, term loan CME Term SOFR 3 Month Index + 3.250% 8.1153% 3/31/28 (b)(c)(d) | 55,444 | 55,464 | |
TOTAL FOOD/BEVERAGE/TOBACCO | 231,106 | ||
| Gaming - 4.3% | |||
| Caesars Entertainment, Inc.: | |||
| Tranche B 1LN, term loan CME Term SOFR 1 Month Index + 2.750% 7.4352% 1/26/30 (b)(c)(d) | 98,204 | 98,163 | |
| Tranche B1 1LN, term loan CME Term SOFR 1 Month Index + 2.750% 7.4352% 2/6/31 (b)(c)(d) | 62,153 | 62,123 | |
| Entain Holdings Gibraltar Ltd. Tranche B4 1LN, term loan CME Term SOFR 6 Month Index + 2.250% 7.864% 3/16/27 (b)(c)(d) | 12,723 | 12,709 | |
| Entain PLC Tranche B 1LN, term loan CME Term SOFR 6 Month Index + 2.750% 8.014% 10/31/29 (b)(c)(d) | 33,185 | 33,130 | |
| Fertitta Entertainment LLC NV Tranche B 1LN, term loan CME Term SOFR 1 Month Index + 3.750% 8.1852% 1/29/29 (b)(c)(d) | 172,946 | 172,953 | |
| Flutter Financing B.V. Tranche B 1LN, term loan CME Term SOFR 3 Month Index + 2.000% 6.6037% 11/25/30 (b)(c)(d) | 58,342 | 58,298 | |
| Golden Entertainment, Inc. Tranche B 1LN, term loan CME Term SOFR 1 Month Index + 2.250% 6.8537% 5/26/30 (b)(c)(d) | 26,342 | 26,292 | |
| J&J Ventures Gaming LLC: | |||
| 1LN, term loan CME Term SOFR 1 Month Index + 4.000% 8.7996% 4/26/28 (b)(c)(d) | 12,067 | 12,065 | |
| Tranche B 1LN, term loan CME Term SOFR 1 Month Index + 4.250% 9.0496% 4/26/28 (b)(c)(d) | 14,126 | 14,091 | |
| Light & Wonder International, Inc. Tranche B 1LN, term loan CME Term SOFR 1 Month Index + 2.250% 7.0339% 4/16/29 (b)(c)(d) | 24,991 | 24,956 | |
| Ontario Gaming GTA LP Tranche B 1LN, term loan CME Term SOFR 3 Month Index + 4.250% 8.8932% 8/1/30 (b)(c)(d) | 18,207 | 18,198 | |
| PCI Gaming Authority 1LN, term loan CME Term SOFR 1 Month Index + 2.000% 6.6852% 7/18/31 (b)(c)(d) | 8,172 | 8,112 | |
| Penn Entertainment, Inc. Tranche B 1LN, term loan CME Term SOFR 1 Month Index + 2.750% 7.5352% 5/3/29 (b)(c)(d) | 10,088 | 10,094 | |
| Scientific Games Holdings LP Tranche B 1LN, term loan CME Term SOFR 3 Month Index + 3.000% 7.5897% 4/4/29 (b)(c)(d) | 35,056 | 34,897 | |
| Station Casinos LLC Tranche B 1LN, term loan CME Term SOFR 1 Month Index + 2.250% 6.9352% 3/14/31 (b)(c)(d) | 45,123 | 45,026 | |
TOTAL GAMING | 631,107 | ||
| Healthcare - 6.6% | |||
| Accelerated Health Systems LLC Tranche B1 LN, term loan CME Term SOFR 3 Month Index + 4.250% 9.0037% 2/15/29 (b)(c)(d) | 18,999 | 14,457 | |
| Avantor Funding, Inc. Tranche B6 1LN, term loan CME Term SOFR 1 Month Index + 2.000% 6.7852% 11/8/27 (b)(c)(d) | 9,662 | 9,708 | |
| Catalent Pharma Solutions Tranche B4 1LN, term loan CME Term SOFR 1 Month Index + 3.000% 7.7446% 2/22/28 (b)(c)(d) | 11,174 | 11,174 | |
| Charlotte Buyer, Inc. Tranche B 1LN, term loan CME Term SOFR 1 Month Index + 4.750% 9.573% 2/11/28 (b)(c)(d) | 30,440 | 30,676 | |
| Chrysaor Bidco Sarl: | |||
| Tranche B 1LN, term loan CME Term SOFR 1 Month Index + 3.500% 0% 7/17/31 (b)(c)(d)(e) | 5,475 | 5,490 | |
| Tranche B-DD 1LN, term loan CME Term SOFR 1 Month Index + 3.500% 0% 5/14/31 (b)(c)(d)(e) | 405 | 406 | |
| DaVita, Inc. Tranche B1 1LN, term loan CME Term SOFR 1 Month Index + 2.000% 6.6852% 5/9/31 (b)(c)(d) | 25,085 | 25,061 | |
| Elanco Animal Health, Inc. Tranche B 1LN, term loan CME Term SOFR 1 Month Index + 1.750% 6.6941% 8/1/27 (b)(c)(d) | 10,715 | 10,691 | |
| Embecta Corp. Tranche B 1LN, term loan CME Term SOFR 1 Month Index + 3.000% 7.6852% 3/31/29 (b)(c)(d) | 25,615 | 24,842 | |
| Endo Finance Holdings, Inc.: | |||
| Tranche B 1LN, term loan CME Term SOFR 1 Month Index + 4.000% 0% 4/23/31 (b)(c)(d)(e) | 11,124 | 11,126 | |
| Tranche B-EXIT 1LN, term loan CME Term SOFR 3 Month Index + 4.500% 9.2446% 4/23/31 (b)(c)(d) | 22,135 | 22,140 | |
| Examworks Bidco, Inc. Tranche B 1LN, term loan CME Term SOFR 1 Month Index + 3.000% 7.7996% 11/1/28 (b)(c)(d) | 8,958 | 8,973 | |
| Gainwell Acquisition Corp. Tranche B 1LN, term loan CME Term SOFR 3 Month Index + 4.000% 8.7037% 10/1/27 (b)(c)(d) | 99,679 | 95,593 | |
| HAH Group Holding Co. LLC 1LN, term loan CME Term SOFR 1 Month Index + 5.000% 9.6852% 9/24/31 (b)(c)(d) | 37,485 | 36,653 | |
| Hanger, Inc.: | |||
| Tranche B 1LN, term loan CME Term SOFR 1 Month Index + 3.500% 0% 10/16/31 (b)(c)(d)(e) | 12,173 | 12,178 | |
| Tranche DD 1LN, term loan CME Term SOFR 1 Month Index + 3.500% 0% 10/16/31 (b)(c)(d)(e) | 1,567 | 1,568 | |
| ICU Medical, Inc. Tranche B 1LN, term loan CME Term SOFR 3 Month Index + 2.500% 7.2537% 1/6/29 (b)(c)(d) | 16,588 | 16,572 | |
| Insulet Corp. Tranche B 1LN, term loan CME Term SOFR 1 Month Index + 2.500% 7.1852% 8/1/31 (b)(c)(d) | 57,651 | 57,795 | |
| IVC Acquisition Ltd. Tranche B 1LN, term loan CME Term SOFR 3 Month Index + 4.750% 9.3932% 12/6/28 (b)(c)(d) | 30,074 | 30,174 | |
| Jazz Financing Lux SARL Tranche B 1LN, term loan CME Term SOFR 1 Month Index + 2.250% 6.9352% 5/5/28 (b)(c)(d) | 52,105 | 52,100 | |
| MED ParentCo LP Tranche B 1LN, term loan CME Term SOFR 1 Month Index + 3.500% 8.2376% 4/15/31 (b)(c)(d) | 23,568 | 23,584 | |
| Medline Borrower LP: | |||
| 1LN, term loan CME Term SOFR 1 Month Index + 2.250% 6.9352% 10/21/28 (b)(c)(d) | 34,100 | 34,092 | |
| Tranche B 1LN, term loan CME Term SOFR 1 Month Index + 2.750% 7.4352% 10/23/28 (b)(c)(d) | 100,695 | 100,763 | |
| National Mentor Holdings, Inc.: | |||
| Tranche B 1LN, term loan CME Term SOFR 1 Month Index + 3.750% 8.5196% 3/2/28 (b)(c)(d) | 13,227 | 12,955 | |
| Tranche C 1LN, term loan CME Term SOFR 3 Month Index + 3.750% 8.4537% 3/2/28 (b)(c)(d) | 225 | 220 | |
| Organon & Co. Tranche B 1LN, term loan CME Term SOFR 1 Month Index + 2.500% 7.2592% 5/17/31 (b)(c)(d) | 29,069 | 29,032 | |
| Packaging Coordinators Midco, Inc. 1LN, term loan CME Term SOFR 1 Month Index + 3.250% 7.8354% 11/30/27 (b)(c)(d) | 33,261 | 33,279 | |
| Perrigo Investments LLC Tranche B 1LN, term loan CME Term SOFR 1 Month Index + 2.500% 7.0352% 4/20/29 (b)(c)(d) | 15,016 | 15,035 | |
| Phoenix Guarantor, Inc. term loan CME Term SOFR 1 Month Index + 3.250% 7.9352% 2/21/31 (b)(c)(d) | 18,184 | 18,181 | |
| Phoenix Newco, Inc. Tranche B 1LN, term loan CME Term SOFR 1 Month Index + 3.000% 7.6852% 11/15/28 (b)(c)(d) | 60,225 | 60,170 | |
| RadNet Management, Inc. Tranche B 1LN, term loan CME Term SOFR 3 Month Index + 2.500% 7.1324% 4/10/31 (b)(c)(d) | 8,678 | 8,689 | |
| Soliant Lower Intermediate LLC 1LN, term loan CME Term SOFR 1 Month Index + 3.750% 8.4352% 7/18/31 (b)(c)(d) | 14,745 | 14,810 | |
| Sotera Health Holdings LLC Tranche B 1LN, term loan CME Term SOFR 1 Month Index + 3.250% 7.8354% 5/30/31 (b)(c)(d) | 15,525 | 15,535 | |
| Southern Veterinary Partners L 1LN, term loan CME Term SOFR 1 Month Index + 3.250% 0% 10/30/31 (b)(c)(d)(e) | 49,545 | 49,297 | |
| Surgery Center Holdings, Inc. 1LN, term loan CME Term SOFR 1 Month Index + 3.000% 7.4946% 12/19/30 (b)(c)(d) | 18,412 | 18,448 | |
| U.S. Anesthesia Partners, Inc.: | |||
| 2LN, term loan CME Term SOFR 1 Month Index + 7.500% 12.4586% 10/1/29 (b)(c)(d)(f) | 2,820 | 2,341 | |
| Tranche B 1LN, term loan CME Term SOFR 1 Month Index + 4.250% 9.2086% 10/1/28 (b)(c)(d) | 4,946 | 4,868 | |
| U.S. Fertility Enterprises LLC: | |||
| Tranche B 1LN, term loan CME Term SOFR 1 Month Index + 4.500% 9.1583% 10/7/31 (b)(c)(d) | 11,158 | 11,088 | |
| Tranche DD 1LN, term loan CME Term SOFR 1 Month Index + 4.500% 1% 10/7/31 (b)(c)(d)(g) | 507 | 504 | |
| U.S. Radiology Specialists, Inc. 1LN, term loan CME Term SOFR 3 Month Index + 4.750% 9.3537% 12/15/27 (b)(c)(d) | 16,121 | 16,177 | |
| Upstream Newco, Inc. 1LN, term loan CME Term SOFR 3 Month Index + 4.250% 9.097% 11/20/26 (b)(c)(d) | 4,392 | 3,821 | |
| Viant Medical Holdings, Inc.: | |||
| 1LN, term loan CME Term SOFR 1 Month Index + 4.000% 0% 10/16/31 (b)(c)(d)(e) | 10,308 | 10,334 | |
| Tranche DD 1LN, term loan CME Term SOFR 1 Month Index + 4.000% 0% 10/16/31 (b)(c)(d)(e) | 1,137 | 1,140 | |
| WCG Intermediate Corp. Tranche B 1LN, term loan CME Term SOFR 1 Month Index + 3.500% 8.1852% 1/8/27 (b)(c)(d) | 12,860 | 12,861 | |
TOTAL HEALTHCARE | 974,601 | ||
| Homebuilders/Real Estate - 0.8% | |||
| Chromalloy Corp. Tranche B 1LN, term loan CME Term SOFR 3 Month Index + 3.750% 8.3537% 3/21/31 (b)(c)(d) | 14,699 | 14,398 | |
| Construction Partners, Inc. Tranche B 1LN, term loan CME Term SOFR 1 Month Index + 2.500% 7.7592% 10/29/31 (b)(c)(d) | 19,470 | 19,470 | |
| Cushman & Wakefield U.S. Borrower LLC Tranche B 1LN, term loan: | |||
| CME Term SOFR 1 Month Index + 3.000% 7.6852% 1/31/30 (b)(c)(d) | 19,202 | 19,191 | |
| CME Term SOFR 1 Month Index + 3.250% 7.9352% 1/31/30 (b)(c)(d) | 7,342 | 7,336 | |
| Fluidra Finco SL Tranche B 1LN, term loan CME Term SOFR 1 Month Index + 2.000% 6.7102% 1/27/29 (b)(c)(d) | 5,306 | 5,301 | |
| Greystar Real Estate Partners 1LN, term loan CME Term SOFR 1 Month Index + 2.750% 7.4946% 8/21/30 (b)(c)(d) | 12,314 | 12,314 | |
| Jones DesLauriers Insurance Management, Inc. Tranche B 1LN, term loan CME Term SOFR 1 Month Index + 3.250% 7.8211% 3/15/30 (b)(c)(d) | 18,819 | 18,819 | |
| Ryan Specialty Group LLC Tranche B 1LN, term loan CME Term SOFR 1 Month Index + 2.250% 6.9352% 9/15/31 (b)(c)(d) | 18,616 | 18,579 | |
TOTAL HOMEBUILDERS/REAL ESTATE | 115,408 | ||
| Hotels - 1.2% | |||
| BRE/Everbright M6 Borrower LLC Tranche B 1LN, term loan CME Term SOFR 1 Month Index + 5.000% 9.8839% 9/9/26 (b)(c)(d) | 8,616 | 8,618 | |
| Four Seasons Hotels Ltd. Tranche B 1LN, term loan CME Term SOFR 1 Month Index + 1.750% 6.4352% 11/30/29 (b)(c)(d) | 31,539 | 31,500 | |
| Hilton Grand Vacations Borrower LLC Tranche B 1LN, term loan: | |||
| CME Term SOFR 1 Month Index + 2.750% 6.9352% 1/17/31 (b)(c)(d) | 17,781 | 17,672 | |
| CME Term SOFR 1 Month Index + 3.000% 7.1852% 8/2/28 (b)(c)(d) | 49,531 | 49,345 | |
| Hilton Worldwide Finance LLC Tranche B 1LN, term loan CME Term SOFR 1 Month Index + 1.750% 6.4876% 11/8/30 (b)(c)(d) | 21,135 | 21,129 | |
| Marriott Ownership Resorts, Inc. Tranche B 1LN, term loan CME Term SOFR 1 Month Index + 2.250% 6.9352% 4/1/31 (b)(c)(d) | 27,512 | 27,434 | |
| Travelport Finance Luxembourg SARL 1LN, term loan CME Term SOFR 3 Month Index + 7.000% 12.855% 9/29/28 (b)(c)(d) | 18,612 | 15,934 | |
| Wyndham Hotels & Resorts, Inc. Tranche B 1LN, term loan CME Term SOFR 1 Month Index + 1.750% 6.4352% 5/28/30 (b)(c)(d) | 9,428 | 9,418 | |
TOTAL HOTELS | 181,050 | ||
| Insurance - 5.8% | |||
| Acrisure LLC Tranche B6 1LN, term loan CME Term SOFR 3 Month Index + 3.250% 8.0092% 11/6/30 (b)(c)(d) | 170,511 | 170,085 | |
| AmWINS Group, Inc. Tranche B 1LN, term loan CME Term SOFR 1 Month Index + 2.250% 7.0496% 2/19/28 (b)(c)(d) | 30,422 | 30,392 | |
| Amynta Agency Borrower, Inc. Tranche B 1LN, term loan CME Term SOFR 1 Month Index + 3.750% 8.4352% 2/28/28 (b)(c)(d) | 18,507 | 18,542 | |
| AssuredPartners, Inc. Tranche B5 1LN, term loan CME Term SOFR 1 Month Index + 3.500% 8.1852% 2/14/31 (b)(c)(d) | 61,908 | 61,992 | |
| Asurion LLC: | |||
| 1LN, term loan CME Term SOFR 1 Month Index + 4.000% 8.7852% 8/19/28 (b)(c)(d) | 33,305 | 32,984 | |
| Tranche B11 1LN, term loan CME Term SOFR 1 Month Index + 4.250% 9.0352% 8/19/28 (b)(c)(d) | 58,472 | 58,107 | |
| Tranche B12 1LN, term loan CME Term SOFR 1 Month Index + 4.250% 8.9352% 9/19/30 (b)(c)(d) | 59,690 | 58,959 | |
| Tranche B3 2LN, term loan CME Term SOFR 1 Month Index + 5.250% 10.0496% 1/31/28 (b)(c)(d) | 63,158 | 60,676 | |
| Tranche B4 2LN, term loan CME Term SOFR 1 Month Index + 5.250% 10.0496% 1/20/29 (b)(c)(d) | 88,816 | 84,535 | |
| Tranche B9 1LN, term loan CME Term SOFR 1 Month Index + 3.250% 8.0496% 7/31/27 (b)(c)(d) | 32,369 | 32,080 | |
| HUB International Ltd. Tranche B 1LN, term loan CME Term SOFR 3 Month Index + 2.750% 7.3674% 6/20/30 (b)(c)(d) | 88,247 | 88,406 | |
| Truist Insurance Holdings LLC: | |||
| 2L, term loan CME Term SOFR 3 Month Index + 4.750% 9.3537% 5/6/32 (b)(c)(d) | 44,480 | 45,025 | |
| Tranche B 1LN, term loan CME Term SOFR 3 Month Index + 3.250% 7.8537% 5/6/31 (b)(c)(d) | 52,520 | 52,553 | |
| USI, Inc. Tranche B 1LN, term loan: | |||
| CME Term SOFR 3 Month Index + 2.750% 7.3537% 11/23/29 (b)(c)(d) | 43,346 | 43,325 | |
| CME Term SOFR 3 Month Index + 2.750% 7.3537% 9/27/30 (b)(c)(d) | 9,796 | 9,790 | |
TOTAL INSURANCE | 847,451 | ||
| Leisure - 2.6% | |||
| Alterra Mountain Co.: | |||
| Tranche B 1LN, term loan CME Term SOFR 1 Month Index + 3.250% 7.9352% 8/17/28 (b)(c)(d) | 18,045 | 18,039 | |
| Tranche B 1LN, term loan CME Term SOFR 1 Month Index + 3.500% 8.1852% 5/31/30 (b)(c)(d) | 1,337 | 1,337 | |
| America Sports Co. Tranche B 1LN, term loan CME Term SOFR 3 Month Index + 3.250% 7.8455% 2/17/31 (b)(c)(d) | 8,896 | 8,907 | |
| Arcis Golf LLC Tranche B 1LN, term loan CME Term SOFR 1 Month Index + 3.750% 8.5718% 11/24/28 (b)(c)(d) | 11,158 | 11,207 | |
| Bulldog Purchaser, Inc. Tranche B 1LN, term loan CME Term SOFR 3 Month Index + 4.250% 8.8537% 6/30/31 (b)(c)(d) | 10,564 | 10,592 | |
| Carnival Corp. Tranche B 1LN, term loan: | |||
| CME Term SOFR 1 Month Index + 2.750% 7.4352% 8/9/27 (b)(c)(d) | 11,852 | 11,874 | |
| CME Term SOFR 1 Month Index + 2.750% 7.4352% 10/18/28 (b)(c)(d) | 28,858 | 28,894 | |
| City Football Group Ltd. Tranche B 1LN, term loan CME Term SOFR 1 Month Index + 3.500% 7.8322% 7/21/30 (b)(c)(d) | 64,983 | 64,171 | |
| ClubCorp Holdings, Inc. Tranche B 1LN, term loan CME Term SOFR 3 Month Index + 5.000% 9.8653% 9/18/26 (b)(c)(d) | 25,881 | 25,902 | |
| Crown Finance U.S., Inc.: | |||
| 1LN, term loan CME Term SOFR 1 Month Index + 8.500% 13.2996% 7/31/28 (b)(c)(d) | 12,558 | 12,632 | |
| Tranche B 1LN, term loan CME Term SOFR 1 Month Index + 5.000% 0% 10/31/31 (b)(c)(d)(e) | 64,805 | 64,400 | |
| Fitness International LLC Tranche B 1LN, term loan CME Term SOFR 3 Month Index + 5.250% 10.0352% 2/12/29 (b)(c)(d) | 11,955 | 11,935 | |
| Herschend Entertainment Co. LLC Tranche B 1LN, term loan CME Term SOFR 1 Month Index + 3.750% 7.6852% 8/27/28 (b)(c)(d) | 6,504 | 6,506 | |
| Lids Holdings, Inc. 1LN, term loan CME Term SOFR 3 Month Index + 5.500% 10.3809% 12/14/26 (b)(c)(d)(f) | 15,887 | 15,729 | |
| Tait LLC 1LN, term loan CME Term SOFR 1 Month Index + 4.500% 9.1852% 10/1/31 (b)(c)(d) | 9,380 | 9,415 | |
| Topgolf Callaway Brands Corp. Tranche B 1LN, term loan CME Term SOFR 1 Month Index + 3.000% 7.6852% 3/18/30 (b)(c)(d) | 43,461 | 43,180 | |
| United PF Holdings LLC: | |||
| 1LN, term loan CME Term SOFR 3 Month Index + 4.000% 8.847% 12/30/26 (b)(c)(d) | 34,182 | 32,836 | |
| 2LN, term loan 3 month U.S. LIBOR + 8.500% 13.347% 12/30/27 (b)(c)(d) | 3,500 | 2,520 | |
| Tranche B 1LN, term loan CME Term SOFR 3 Month Index + 8.500% 13.347% 12/30/26 (b)(c)(d) | 3,494 | 3,390 | |
TOTAL LEISURE | 383,466 | ||
| Metals/Mining - 0.1% | |||
| Arsenal AIC Parent LLC Tranche B 1LN, term loan CME Term SOFR 1 Month Index + 3.250% 7.9352% 8/19/30 (b)(c)(d) | 15,781 | 15,794 | |
| Paper - 0.8% | |||
| Ahlstrom-Munksjo OYJ 1LN, term loan CME Term SOFR 3 Month Index + 4.000% 8.6153% 2/4/28 (b)(c)(d) | 6,585 | 6,574 | |
| Clydesdale Acquisition Holdings, Inc. 1LN, term loan CME Term SOFR 1 Month Index + 3.670% 7.8602% 4/13/29 (b)(c)(d) | 107,731 | 107,435 | |
TOTAL PAPER | 114,009 | ||
| Publishing/Printing - 0.4% | |||
| Century DE Buyer LLC 1LN, term loan CME Term SOFR 3 Month Index + 4.000% 8.6046% 10/30/30 (b)(c)(d) | 17,497 | 17,523 | |
| Learning Care Group (U.S.) No 2, Inc. Tranche B 1LN, term loan CME Term SOFR 3 Month Index + 4.000% 8.7021% 8/11/28 (b)(c)(d) | 12,172 | 12,203 | |
| RLG Holdings LLC: | |||
| 2LN, term loan CME Term SOFR 1 Month Index + 7.500% 12.2996% 7/2/29 (b)(c)(d) | 2,290 | 2,060 | |
| Tranche B 1LN, term loan CME Term SOFR 1 Month Index + 4.250% 9.0496% 7/8/28 (b)(c)(d) | 8,303 | 8,162 | |
| Vericast Corp. 1LN, term loan CME Term SOFR 1 Month Index + 7.750% 12.3537% 6/15/30 (b)(c)(d) | 16,899 | 16,097 | |
TOTAL PUBLISHING/PRINTING | 56,045 | ||
| Railroad - 0.5% | |||
| AIT Worldwide Logistics Holdings, Inc.: | |||
| 1LN, term loan CME Term SOFR 1 Month Index + 4.750% 9.9681% 4/6/28 (b)(c)(d) | 16,347 | 16,327 | |
| Tranche B 1LN, term loan CME Term SOFR 1 Month Index + 4.750% 0% 4/8/30 (b)(c)(d)(e) | 9,089 | 9,078 | |
| Genesee & Wyoming, Inc. Tranche B 1LN, term loan CME Term SOFR 3 Month Index + 2.000% 6.6037% 4/10/31 (b)(c)(d) | 24,480 | 24,414 | |
| Wwex Unified Topco Holdings LLC 1LN, term loan CME Term SOFR 3 Month Index + 4.000% 8.8653% 7/26/28 (b)(c)(d) | 24,971 | 24,987 | |
TOTAL RAILROAD | 74,806 | ||
| Restaurants - 1.4% | |||
| 1011778 BC ULC Tranche B5 1LN, term loan CME Term SOFR 1 Month Index + 1.750% 6.4352% 9/23/30 (b)(c)(d) | 36,847 | 36,516 | |
| Dave & Buster's, Inc. Tranche B 1LN, term loan: | |||
| CME Term SOFR 1 Month Index + 3.250% 0% 9/26/31 (b)(c)(d)(e) | 18,790 | 18,724 | |
| CME Term SOFR 1 Month Index + 3.250% 7.875% 6/29/29 (b)(c)(d) | 15,450 | 15,400 | |
| Flynn Restaurant Group LP Tranche B 1LN, term loan CME Term SOFR 1 Month Index + 4.250% 9.0496% 12/1/28 (b)(c)(d) | 8,254 | 8,279 | |
| KFC Holding Co. Tranche B 1LN, term loan CME Term SOFR 1 Month Index + 1.750% 6.6454% 3/15/28 (b)(c)(d) | 13,511 | 13,535 | |
| Pacific Bells LLC Tranche B 1LN, term loan CME Term SOFR 3 Month Index + 4.500% 9.3653% 11/10/28 (b)(c)(d) | 10,552 | 10,555 | |
| PFC Acquisition Corp. Tranche B 1LN, term loan CME Term SOFR 3 Month Index + 6.250% 10.9855% 3/1/26 (b)(c)(d) | 12,310 | 12,130 | |
| Raising Cane's Restaurants LLC Tranche B 1LN, term loan CME Term SOFR 1 Month Index + 2.000% 6.7809% 9/18/31 (b)(c)(d) | 4,740 | 4,732 | |
| Restaurant Technologies, Inc. Tranche B 1LN, term loan CME Term SOFR 3 Month Index + 4.250% 8.8537% 4/1/29 (b)(c)(d) | 31,971 | 31,042 | |
| Whatabrands LLC Tranche B 1LN, term loan CME Term SOFR 1 Month Index + 2.750% 7.4352% 8/3/28 (b)(c)(d) | 51,328 | 51,293 | |
TOTAL RESTAURANTS | 202,206 | ||
| Services - 9.8% | |||
| ABG Intermediate Holdings 2 LLC Tranche B1 1LN, term loan CME Term SOFR 1 Month Index + 2.750% 7.4465% 12/21/28 (b)(c)(d) | 91,058 | 91,217 | |
| AEA International Holdings Luxembourg SARL Tranche B 1LN, term loan CME Term SOFR 1 Month Index + 2.750% 7.3537% 9/7/28 (b)(c)(d) | 5,379 | 5,375 | |
| AI Aqua Merger Sub, Inc. Tranche B 1LN, term loan 1 month U.S. LIBOR + 4.000% 8.3566% 7/30/28 (b)(c)(d) | 86,134 | 86,269 | |
| Allied Universal Holdco LLC Tranche B 1LN, term loan CME Term SOFR 1 Month Index + 3.750% 8.5352% 5/14/28 (b)(c)(d) | 97,842 | 97,605 | |
| Anticimex Global AB: | |||
| Tranche B 1LN, term loan CME Term SOFR 1 Month Index + 3.500% 8.75% 11/16/28 (b)(c)(d) | 11,420 | 11,441 | |
| Tranche B1 1LN, term loan CME Term SOFR 3 Month Index + 3.500% 8.48% 11/16/28 (b)(c)(d) | 32,947 | 32,950 | |
| Aramark Services, Inc.: | |||
| Tranche B-4 1LN, term loan CME Term SOFR 1 Month Index + 1.750% 6.5496% 1/15/27 (b)(c)(d) | 4,663 | 4,655 | |
| Tranche B7 1LN, term loan CME Term SOFR 1 Month Index + 2.000% 6.6852% 4/6/28 (b)(c)(d) | 26,696 | 26,696 | |
| Tranche B8 1LN, term loan CME Term SOFR 1 Month Index + 2.000% 6.6852% 6/24/30 (b)(c)(d) | 569 | 569 | |
| Archkey Holdings, Inc.: | |||
| Tranche B 1LN, term loan: | |||
CME Term SOFR 1 Month Index + 4.750% 0% 10/10/31 (b)(c)(d)(e) | 18,976 | 18,920 | |
CME Term SOFR 1 Month Index + 5.250% 10.0496% 6/30/28 (b)(c)(d) | 16,151 | 16,167 | |
| Tranche B-DD 1LN, term loan CME Term SOFR 1 Month Index + 4.750% 0% 10/10/31 (b)(c)(d)(e) | 2,189 | 2,183 | |
| Artera Services LLC Tranche B 1LN, term loan CME Term SOFR 3 Month Index + 4.500% 9.1037% 2/10/31 (b)(c)(d) | 29,439 | 29,077 | |
| Ascend Learning LLC: | |||
| 2LN, term loan CME Term SOFR 1 Month Index + 5.750% 10.5352% 12/10/29 (b)(c)(d) | 23,960 | 23,521 | |
| Tranche B 1LN, term loan CME Term SOFR 1 Month Index + 3.500% 8.2852% 12/10/28 (b)(c)(d) | 48,853 | 48,815 | |
| Bifm California Buyer, Inc. Tranche 1LN, term loan CME Term SOFR 1 Month Index + 4.250% 8.9352% 5/31/28 (b)(c)(d) | 15,522 | 15,564 | |
| Brand Industrial Services, Inc. Tranche B 1LN, term loan CME Term SOFR 3 Month Index + 4.500% 9.7477% 8/1/30 (b)(c)(d) | 69,199 | 68,227 | |
| Brock Holdings Iii LLC Tranche B 1LN, term loan CME Term SOFR 3 Month Index + 6.000% 10.6037% 5/2/30 (b)(c)(d) | 8,775 | 8,830 | |
| CACI International, Inc. Tranche B 1LN, term loan CME Term SOFR 1 Month Index + 1.750% 0% 10/17/31 (b)(c)(d)(e) | 13,925 | 13,925 | |
| Cast & Crew Payroll LLC Tranche B 1LN, term loan CME Term SOFR 1 Month Index + 3.750% 8.4352% 12/30/28 (b)(c)(d) | 37,629 | 36,735 | |
| CHG Healthcare Services, Inc.: | |||
| 1LN, term loan CME Term SOFR 1 Month Index + 3.500% 8.2996% 9/30/28 (b)(c)(d) | 5,556 | 5,566 | |
| Tranche B 2LN, term loan CME Term SOFR 1 Month Index + 3.500% 8.2996% 9/29/28 (b)(c)(d) | 16,257 | 16,302 | |
| Congruex Group LLC Tranche B 1LN, term loan CME Term SOFR 3 Month Index + 5.750% 10.4854% 5/3/29 (b)(c)(d) | 17,878 | 13,789 | |
| CoreLogic, Inc. Tranche B 1LN, term loan CME Term SOFR 1 Month Index + 3.500% 8.2996% 6/2/28 (b)(c)(d) | 59,393 | 58,990 | |
| EAB Global, Inc. Tranche B 1LN, term loan CME Term SOFR 1 Month Index + 3.500% 7.9352% 8/16/28 (b)(c)(d) | 20,378 | 20,289 | |
| Ensemble RCM LLC Tranche B 1LN, term loan CME Term SOFR 3 Month Index + 3.000% 7.5854% 8/1/29 (b)(c)(d) | 36,563 | 36,595 | |
| Filtration Group Corp. Tranche B 1LN, term loan CME Term SOFR 1 Month Index + 3.500% 8.2996% 10/21/28 (b)(c)(d) | 20,578 | 20,604 | |
| Flexera Software LLC Tranche B 1LN, term loan CME Term SOFR 1 Month Index + 3.500% 8.2592% 3/3/28 (b)(c)(d) | 27,393 | 27,449 | |
| Franchise Group, Inc. Tranche B 1LN, term loan: | |||
| CME Term SOFR 6 Month Index + 4.750% 10.2538% 3/10/26 (b)(c)(d) | 9,016 | 5,675 | |
| CME Term SOFR 6 Month Index + 4.750% 10.3922% 3/10/26 (b)(c)(d) | 30,864 | 19,194 | |
| Galaxy U.S. Opco, Inc. 1LN, term loan CME Term SOFR 3 Month Index + 4.750% 9.3354% 4/29/29 (b)(c)(d) | 22,216 | 18,794 | |
| Genesys Cloud Services Holdings II LLC Tranche B 1LN, term loan CME Term SOFR 1 Month Index + 3.000% 7.6852% 12/1/27 (b)(c)(d) | 21,760 | 21,797 | |
| HomeServe U.S.A. Corp. Tranche B 1LN, term loan CME Term SOFR 1 Month Index + 2.500% 7.0092% 10/21/30 (b)(c)(d) | 23,109 | 23,015 | |
| Ion Trading Finance Ltd. 1LN, term loan CME Term SOFR 3 Month Index + 4.000% 9.0157% 4/3/28 (b)(c)(d) | 7,737 | 7,716 | |
| KUEHG Corp. term loan CME Term SOFR 1 Month Index + 3.250% 7.8392% 6/12/30 (c)(d) | 42,048 | 42,090 | |
| Life Time, Inc. Tranche B 1LN, term loan CME Term SOFR 1 Month Index + 2.500% 0% 10/22/31 (b)(c)(d)(e) | 27,440 | 27,406 | |
| Neptune BidCo U.S., Inc.: | |||
| term loan CME Term SOFR 3 Month Index + 4.750% 9.5083% 10/11/28 (b)(c)(d) | 2,908 | 2,680 | |
| Tranche B 1LN, term loan CME Term SOFR 3 Month Index + 5.000% 9.7583% 4/11/29 (b)(c)(d) | 77,766 | 71,740 | |
| Omnia Partners LLC Tranche B 1LN, term loan CME Term SOFR 1 Month Index + 3.750% 7.8672% 7/25/30 (b)(c)(d) | 32,879 | 32,927 | |
| Optiv Security, Inc. Tranche B 1LN, term loan CME Term SOFR 3 Month Index + 5.250% 9.8672% 7/31/26 (b)(c)(d) | 25,641 | 23,590 | |
| Planet U.S. Buyer LLC Tranche B 1LN, term loan CME Term SOFR 3 Month Index + 3.500% 8.6042% 2/10/31 (b)(c)(d) | 18,743 | 18,785 | |
| Sabert Corp. Tranche B 1LN, term loan CME Term SOFR 1 Month Index + 3.000% 7.8591% 12/10/26 (b)(c)(d) | 9,611 | 9,629 | |
| Sedgwick Claims Management Services, Inc. Tranche B 1LN, term loan CME Term SOFR 3 Month Index + 3.000% 7.5854% 7/31/31 (b)(c)(d) | 24,609 | 24,612 | |
| Spin Holdco, Inc. Tranche B 1LN, term loan CME Term SOFR 3 Month Index + 4.000% 9.256% 3/4/28 (b)(c)(d) | 110,113 | 95,309 | |
| Staples, Inc. Tranche B 1LN, term loan CME Term SOFR 3 Month Index + 5.750% 10.6886% 9/10/29 (b)(c)(d) | 67,969 | 62,774 | |
| STS Operating, Inc. 1LN, term loan CME Term SOFR 1 Month Index + 4.000% 8.7852% 3/25/31 (b)(c)(d) | 33,800 | 33,699 | |
| The GEO Group, Inc. Tranche B 1LN, term loan CME Term SOFR 1 Month Index + 5.250% 9.9352% 4/14/29 (b)(c)(d) | 14,884 | 15,138 | |
| United Rentals North America, Inc. Tranche B 1LN, term loan CME Term SOFR 1 Month Index + 1.750% 6.4352% 2/14/31 (b)(c)(d) | 14,298 | 14,402 | |
| Vestis Corp. Tranche B 1LN, term loan CME Term SOFR 3 Month Index + 2.250% 7.3711% 2/24/31 (b)(c)(d) | 18,375 | 18,283 | |
| Wellful, Inc. Tranche B 1LN, term loan CME Term SOFR 1 Month Index + 6.250% 11.0496% 4/21/27 (b)(c)(d) | 17,253 | 10,535 | |
| WMB Holdings, Inc. Tranche B 1LN, term loan CME Term SOFR 1 Month Index + 3.250% 7.1852% 11/3/29 (b)(c)(d) | 4,768 | 4,773 | |
TOTAL SERVICES | 1,442,888 | ||
| Steel - 0.1% | |||
| Zekelman Industries, Inc. Tranche B 1LN, term loan CME Term SOFR 1 Month Index + 2.250% 6.9946% 1/24/31 (b)(c)(d) | 11,470 | 11,491 | |
| Super Retail - 2.8% | |||
| Academy Ltd. Tranche B 1LN, term loan CME Term SOFR 1 Month Index + 3.750% 8.7086% 11/6/27 (b)(c)(d) | 6,036 | 6,025 | |
| At Home Group, Inc. Tranche B 1LN, term loan CME Term SOFR 1 Month Index + 4.250% 9.2086% 7/24/28 (b)(c)(d) | 17,278 | 7,381 | |
| BJ's Wholesale Club, Inc. Tranche B 1LN, term loan CME Term SOFR 1 Month Index + 2.000% 6.7592% 2/3/29 (b)(c)(d) | 10,200 | 10,234 | |
| Empire Today LLC Tranche B 1LN, term loan CME Term SOFR 3 Month Index + 5.000% 9.847% 4/1/28 (b)(c)(d) | 14,385 | 8,631 | |
| Great Outdoors Group LLC Tranche B 1LN, term loan CME Term SOFR 1 Month Index + 3.750% 8.5496% 3/5/28 (b)(c)(d) | 311,819 | 312,286 | |
| Gulfside Supply, Inc. Tranche B 1LN, term loan CME Term SOFR 3 Month Index + 3.000% 7.7839% 6/17/31 (b)(c)(d) | 7,762 | 7,758 | |
| Harbor Freight Tools U.S.A., Inc. Tranche B 1LN, term loan CME Term SOFR 1 Month Index + 2.500% 7.1917% 6/5/31 (b)(c)(d) | 10,135 | 9,870 | |
| LBM Acquisition LLC Tranche B 1LN, term loan CME Term SOFR 1 Month Index + 3.750% 8.6684% 6/6/31 (b)(c)(d) | 20,958 | 20,639 | |
| Michaels Companies, Inc. 1LN, term loan CME Term SOFR 3 Month Index + 4.250% 9.1153% 4/15/28 (b)(c)(d) | 23,121 | 17,475 | |
| RH: | |||
| Tranche B 1LN, term loan CME Term SOFR 1 Month Index + 2.500% 7.2996% 10/20/28 (b)(c)(d) | 6,620 | 6,372 | |
| Tranche B2 1LN, term loan CME Term SOFR 1 Month Index + 3.250% 8.0352% 10/20/28 (b)(c)(d) | 9,192 | 8,936 | |
TOTAL SUPER RETAIL | 415,607 | ||
| Technology - 15.6% | |||
| Ahead DB Holdings LLC Tranche B3 1LN, term loan CME Term SOFR 1 Month Index + 3.500% 8.1037% 2/3/31 (b)(c)(d) | 13,418 | 13,450 | |
| Allegro MicroSystems LLC Tranche B 1LN, term loan CME Term SOFR 1 Month Index + 2.250% 6.9352% 10/31/30 (b)(c)(d) | 3,281 | 3,277 | |
| Amentum Holdings, Inc. 1LN, term loan CME Term SOFR 1 Month Index + 2.250% 6.9352% 9/29/31 (b)(c)(d) | 67,160 | 67,110 | |
| Applied Systems, Inc.: | |||
| Tranche 2LN, term loan CME Term SOFR 3 Month Index + 5.250% 9.8537% 2/23/32 (b)(c)(d) | 2,380 | 2,445 | |
| Tranche B 1LN, term loan CME Term SOFR 3 Month Index + 3.500% 7.6037% 2/24/31 (b)(c)(d) | 31,978 | 32,036 | |
| Athenahealth Group, Inc. Tranche B 1LN, term loan CME Term SOFR 1 Month Index + 3.250% 7.9352% 2/15/29 (b)(c)(d) | 81,131 | 80,809 | |
| AZZ, Inc. Tranche B 1LN, term loan CME Term SOFR 1 Month Index + 3.250% 7.1852% 5/11/29 (b)(c)(d) | 15,792 | 15,834 | |
| BYJU's Alpha, Inc.: | |||
| term loan: | |||
CME Term SOFR 3 Month Index + 8.000% 12.5854% 4/9/26 (b)(c)(d)(f) | 361 | 361 | |
CME Term SOFR 3 Month Index + 8.000% 12.5854% 4/9/26 (b)(c)(d)(f) | 106 | 106 | |
| Tranche B 1LN, term loan 3 month U.S. LIBOR + 8.000% 15.5% 11/24/26 (b)(c)(d)(h) | 20,791 | 2,661 | |
| Tranche DD 2 term loan CME Term SOFR 1 Month Index + 8.000% 6.3548% 4/9/26 (b)(c)(d)(f)(g) | 359 | 359 | |
| Camelot U.S. Acquisition LLC Tranche B 1LN, term loan CME Term SOFR 1 Month Index + 2.750% 7.4352% 1/31/31 (b)(c)(d) | 42,498 | 42,530 | |
| Cloud Software Group, Inc. Tranche B 1LN, term loan: | |||
| CME Term SOFR 3 Month Index + 4.000% 8.6037% 3/29/29 (b)(c)(d) | 88,976 | 88,936 | |
| CME Term SOFR 3 Month Index + 4.500% 9.1037% 3/24/31 (b)(c)(d) | 10,405 | 10,400 | |
| Coherent Corp. Tranche B 1LN, term loan CME Term SOFR 1 Month Index + 2.500% 7.1852% 7/2/29 (b)(c)(d) | 38,403 | 38,355 | |
| CommScope, Inc. Tranche B 1LN, term loan CME Term SOFR 1 Month Index + 3.250% 8.0496% 4/4/26 (b)(c)(d) | 25,599 | 24,991 | |
| ConnectWise LLC Tranche B 1LN, term loan CME Term SOFR 3 Month Index + 3.500% 8.3653% 9/30/28 (b)(c)(d) | 48,550 | 48,478 | |
| Constant Contact, Inc. Tranche B 1LN, term loan CME Term SOFR 3 Month Index + 4.000% 8.9175% 2/10/28 (b)(c)(d) | 35,477 | 34,138 | |
| Cotiviti, Inc.: | |||
| Tranche 1LN, term loan 7.625% 5/1/31 (d) | 8,930 | 8,963 | |
| Tranche B 1LN, term loan CME Term SOFR 1 Month Index + 3.250% 8.0941% 5/1/31 (b)(c)(d) | 53,203 | 53,203 | |
| Dayforce, Inc. Tranche B 1LN, term loan CME Term SOFR 1 Month Index + 2.500% 7.0854% 3/3/31 (b)(c)(d) | 12,179 | 12,195 | |
| DCert Buyer, Inc.: | |||
| 1LN, term loan CME Term SOFR 1 Month Index + 4.000% 8.6852% 10/16/26 (b)(c)(d) | 73,269 | 70,879 | |
| Tranche B 2LN, term loan CME Term SOFR 1 Month Index + 7.000% 11.6852% 2/19/29 (b)(c)(d) | 26,540 | 22,227 | |
| DG Investment Intermediate Holdings, Inc.: | |||
| 2LN, term loan CME Term SOFR 1 Month Index + 6.750% 11.5496% 3/31/29 (b)(c)(d) | 2,490 | 2,380 | |
| Tranche B 1LN, term loan CME Term SOFR 1 Month Index + 3.750% 8.5496% 3/31/28 (b)(c)(d) | 28,921 | 28,877 | |
| Tranche DD 1LN, term loan CME Term SOFR 1 Month Index + 3.750% 1% 3/31/28 (b)(c)(d)(g) | 1,110 | 1,108 | |
| ECL Entertainment LLC Tranche B 1LN, term loan CME Term SOFR 1 Month Index + 4.000% 8.6852% 8/30/30 (b)(c)(d) | 9,209 | 9,215 | |
| Ellucian, Inc. Tranche B 1LN, term loan CME Term SOFR 1 Month Index + 3.500% 8.2852% 10/7/29 (b)(c)(d) | 33,948 | 34,069 | |
| Epicor Software Corp.: | |||
| 1LN, term loan CME Term SOFR 1 Month Index + 3.250% 8.0954% 5/23/31 (b)(c)(d) | 28,534 | 28,610 | |
| Tranche DD 1LN, term loan CME Term SOFR 3 Month Index + 3.250% 7.9573% 5/23/31 (b)(c)(d) | 3,348 | 3,357 | |
| Gen Digital, Inc. Tranche B 1LN, term loan CME Term SOFR 1 Month Index + 1.750% 6.4352% 9/12/29 (b)(c)(d) | 55,345 | 55,100 | |
| Go Daddy Operating Co. LLC Tranche B5 1LN, term loan CME Term SOFR 1 Month Index + 2.000% 6.6852% 11/12/29 (b)(c)(d) | 14,496 | 14,483 | |
| Icon Luxembourg Sarl Tranche B 1LN, term loan: | |||
| CME Term SOFR 3 Month Index + 2.000% 6.6037% 7/3/28 (b)(c)(d) | 15,760 | 15,801 | |
| CME Term SOFR 3 Month Index + 2.000% 6.6037% 7/3/28 (b)(c)(d) | 3,927 | 3,937 | |
| Leia Finco U.S. LLC: | |||
| 1LN, term loan CME Term SOFR 1 Month Index + 3.250% 7.8867% 10/9/31 (b)(c)(d) | 34,885 | 34,546 | |
| 2LN, term loan CME Term SOFR 1 Month Index + 5.250% 9.8867% 10/12/32 (b)(c)(d) | 10,150 | 9,852 | |
| Lightning Power LLC Tranche B 1LN, term loan CME Term SOFR 1 Month Index + 3.250% 8.3455% 8/18/31 (b)(c)(d) | 33,605 | 33,666 | |
| Madison Safety & Flow LLC Tranche B 1LN, term loan CME Term SOFR 1 Month Index + 3.250% 7.9677% 9/26/31 (b)(c)(d) | 6,725 | 6,750 | |
| Maximus, Inc. Tranche B 1LN, term loan CME Term SOFR 1 Month Index + 2.000% 6.6037% 5/30/31 (b)(c)(d) | 7,965 | 7,988 | |
| McAfee Corp. Tranche B 1LN, term loan CME Term SOFR 1 Month Index + 3.250% 8.0995% 3/1/29 (b)(c)(d) | 73,083 | 72,870 | |
| MH Sub I LLC: | |||
| Tranche B 1LN, term loan CME Term SOFR 1 Month Index + 4.250% 8.9352% 5/3/28 (b)(c)(d) | 129,425 | 128,567 | |
| Tranche B 2LN, term loan CME Term SOFR 3 Month Index + 6.250% 10.9352% 2/23/29 (b)(c)(d) | 12,580 | 12,297 | |
| Mitchell International, Inc. Tranche B 1LN, term loan CME Term SOFR 1 Month Index + 3.250% 7.9352% 6/17/31 (b)(c)(d) | 35,933 | 35,614 | |
| MKS Instruments, Inc. Tranche B 1LN, term loan CME Term SOFR 1 Month Index + 2.250% 6.9946% 8/17/29 (b)(c)(d) | 29,164 | 29,157 | |
| Modena Buyer LLC 1LN, term loan CME Term SOFR 3 Month Index + 4.500% 9.1037% 7/1/31 (b)(c)(d) | 71,625 | 68,491 | |
| NCR Atleos Corp. Tranche B 1LN, term loan CME Term SOFR 1 Month Index + 3.750% 8.3975% 4/16/29 (b)(c)(d) | 18,242 | 18,242 | |
| Open Text Corp. Tranche B 1LN, term loan CME Term SOFR 1 Month Index + 2.750% 6.9352% 1/31/30 (b)(c)(d) | 28,987 | 29,065 | |
| Peraton Corp. Tranche B 1LN, term loan CME Term SOFR 1 Month Index + 3.750% 8.5352% 2/1/28 (b)(c)(d) | 97,899 | 94,594 | |
| Pitney Bowes, Inc. Tranche B 1LN, term loan CME Term SOFR 1 Month Index + 4.000% 8.7996% 3/19/28 (b)(c)(d) | 11,535 | 11,557 | |
| Plano Holdco, Inc. Tranche B 1LN, term loan CME Term SOFR 1 Month Index + 3.500% 8.0921% 10/2/31 (b)(c)(d) | 11,725 | 11,784 | |
| PointClickCare Technologies, Inc. Tranche B 1LN, term loan CME Term SOFR 1 Month Index + 3.250% 0% 10/14/31 (b)(c)(d)(e) | 11,705 | 11,720 | |
| Polaris Newco LLC Tranche B 1LN, term loan CME Term SOFR 3 Month Index + 4.000% 8.847% 6/2/28 (b)(c)(d) | 155,195 | 154,015 | |
| Project Alpha Intermediate Holding, Inc. Tranche B 1LN, term loan CME Term SOFR 3 Month Index + 3.750% 8.3354% 10/28/30 (b)(c)(d) | 33,024 | 33,133 | |
| Project Boost Purchaser LLC: | |||
| Tranche B 1LN, term loan CME Term SOFR 1 Month Index + 3.500% 8.1473% 7/2/31 (b)(c)(d) | 32,284 | 32,313 | |
| Tranche B 2LN, term loan CME Term SOFR 3 Month Index + 5.250% 9.8973% 7/17/32 (b)(c)(d) | 6,330 | 6,356 | |
| Proofpoint, Inc. Tranche B 1LN, term loan CME Term SOFR 1 Month Index + 3.000% 7.6852% 8/31/28 (b)(c)(d) | 42,944 | 42,953 | |
| Rackspace Finance LLC Tranche B 1LN, term loan: | |||
| CME Term SOFR 1 Month Index + 2.750% 7.6829% 5/15/28 (b)(c)(d) | 27,246 | 16,234 | |
| CME Term SOFR 1 Month Index + 6.250% 11.1829% 5/15/28 (b)(c)(d) | 6,346 | 6,456 | |
| RealPage, Inc. Tranche B 1LN, term loan CME Term SOFR 1 Month Index + 3.000% 7.7996% 4/22/28 (b)(c)(d) | 43,601 | 42,936 | |
| Red Planet Borrower LLC Tranche B 1LN, term loan CME Term SOFR 1 Month Index + 3.750% 8.2852% 9/30/28 (b)(c)(d) | 25,699 | 24,552 | |
| Renaissance Holdings Corp. Tranche 1LN, term loan CME Term SOFR 3 Month Index + 4.250% 8.9352% 4/8/30 (b)(c)(d) | 45,651 | 45,735 | |
| Roper Industrial Products Investment Co. 1LN, term loan CME Term SOFR 3 Month Index + 3.250% 7.8537% 11/23/29 (b)(c)(d) | 11,311 | 11,309 | |
| Sovos Compliance LLC Tranche B 1LN, term loan CME Term SOFR 1 Month Index + 4.500% 9.2996% 8/11/28 (b)(c)(d) | 26,026 | 25,994 | |
| SS&C Technologies, Inc. Tranche B8 1LN, term loan CME Term SOFR 1 Month Index + 2.000% 6.6852% 5/9/31 (b)(c)(d) | 40,811 | 40,799 | |
| Tcp Sunbelt Acquisition Co. Tranche B 1LN, term loan CME Term SOFR 1 Month Index + 4.250% 0% 10/15/31 (b)(c)(d)(e) | 18,315 | 18,155 | |
| Tempo Acquisition LLC Tranche B1 1LN, term loan CME Term SOFR 1 Month Index + 2.250% 6.9352% 8/31/28 (b)(c)(d) | 7,314 | 7,316 | |
| TTM Technologies, Inc. Tranche B 1LN, term loan CME Term SOFR 1 Month Index + 2.250% 7.0941% 5/30/30 (b)(c)(d) | 12,768 | 12,774 | |
| UKG, Inc. Tranche B 1LN, term loan CME Term SOFR 3 Month Index + 3.500% 7.6172% 2/10/31 (b)(c)(d) | 129,808 | 129,915 | |
| VFH Parent LLC Tranche B 1LN, term loan CME Term SOFR 1 Month Index + 2.750% 7.4352% 6/23/31 (b)(c)(d) | 26,500 | 26,533 | |
| VM Consolidated, Inc. Tranche B2 1LN, term loan CME Term SOFR 1 Month Index + 2.250% 6.9352% 3/27/28 (b)(c)(d) | 18,156 | 18,201 | |
| VS Buyer LLC Tranche B 1LN, term loan CME Term SOFR 1 Month Index + 3.250% 8.0359% 4/14/31 (b)(c)(d) | 19,388 | 19,388 | |
| Weber-Stephen Products LLC Tranche B 1LN, term loan: | |||
| CME Term SOFR 1 Month Index + 3.250% 8.0496% 10/30/27 (b)(c)(d) | 8,202 | 7,747 | |
| CME Term SOFR 1 Month Index + 4.250% 9.0352% 10/30/27 (b)(c)(d) | 5,650 | 5,339 | |
| Webpros Investments Sarl Tranche B 1LN, term loan CME Term SOFR 1 Month Index + 4.000% 8.6852% 3/19/31 (b)(c)(d) | 6,577 | 6,589 | |
| Zelis Payments Buyer, Inc. Tranche B 1LN, term loan: | |||
| CME Term SOFR 1 Month Index + 2.750% 7.4352% 9/28/29 (b)(c)(d) | 27,616 | 27,306 | |
| CME Term SOFR 1 Month Index + 3.250% 0% 10/27/31 (b)(c)(d)(e) | 34,670 | 34,497 | |
TOTAL TECHNOLOGY | 2,283,985 | ||
| Telecommunications - 3.0% | |||
| Altice Financing SA Tranche B 1LN, term loan CME Term SOFR 3 Month Index + 5.000% 9.6559% 10/31/27 (b)(c)(d) | 11,626 | 10,516 | |
| Altice France SA Tranche B14 1LN, term loan CME Term SOFR 3 Month Index + 5.500% 10.1559% 8/15/28 (b)(c)(d) | 83,663 | 66,781 | |
| Aventiv Technologies LLC: | |||
| 1LN, term loan: | |||
CME Term SOFR 3 Month Index + 5.090% 9.9553% 7/31/25 (b)(c)(d) | 36,833 | 32,106 | |
CME Term SOFR 3 Month Index + 7.500% 12.3653% 7/31/25 (b)(c)(d) | 954 | 954 | |
| Tranche 2LN, term loan CME Term SOFR 3 Month Index + 8.650% 13.9153% 11/1/25 (b)(c)(d) | 32,940 | 9,553 | |
| Ciena Corp. Tranche B 1LN, term loan CME Term SOFR 1 Month Index + 2.000% 6.7592% 10/24/30 (b)(c)(d) | 6,329 | 6,332 | |
| Connect U.S. Finco LLC Tranche B 1LN, term loan: | |||
| CME Term SOFR 1 Month Index + 3.500% 8.1852% 12/12/26 (b)(c)(d) | 1,995 | 1,981 | |
| CME Term SOFR 1 Month Index + 4.500% 9.1852% 9/13/29 (b)(c)(d) | 13,939 | 12,636 | |
| Consolidated Communications, Inc. Tranche B 1LN, term loan CME Term SOFR 1 Month Index + 3.500% 8.2996% 10/2/27 (b)(c)(d) | 16,633 | 16,348 | |
| Crown Subsea Communications Holding, Inc. Tranche B 1LN, term loan CME Term SOFR 3 Month Index + 4.000% 8.6852% 1/30/31 (b)(c)(d) | 42,733 | 42,933 | |
| Frontier Communications Holdings LLC Tranche B 1LN, term loan CME Term SOFR 6 Month Index + 3.500% 8.763% 7/1/31 (b)(c)(d) | 44,804 | 44,986 | |
| GTT Communications, Inc. 1LN, term loan CME Term SOFR 1 Month Index + 9.000% 13.9454% 6/30/28 (b)(c)(d) | 5,757 | 4,285 | |
| Gtt Remainco LLC 1LN, term loan CME Term SOFR 1 Month Index + 7.000% 11.7852% 12/30/27 (b)(c)(d) | 6,662 | 6,254 | |
| Lorca Co.-Borrower LLC Tranche B 1LN, term loan CME Term SOFR 1 Month Index + 3.500% 8.1037% 4/17/31 (b)(c)(d) | 8,811 | 8,800 | |
| Lumen Technologies, Inc.: | |||
| Tranche B 1LN, term loan CME Term SOFR 1 Month Index + 2.350% 0% 4/16/29 (b)(c)(d)(e) | 15,600 | 14,149 | |
| Tranche B2 1LN, term loan CME Term SOFR 1 Month Index + 2.350% 0% 4/15/30 (b)(c)(d)(e) | 31,165 | 27,908 | |
| Patagonia Holdco LLC Tranche B 1LN, term loan CME Term SOFR 3 Month Index + 5.750% 10.8542% 8/1/29 (b)(c)(d) | 14,922 | 13,887 | |
| SBA Senior Finance II, LLC Tranche B 1LN, term loan CME Term SOFR 1 Month Index + 2.000% 6.44% 1/27/31 (b)(c)(d) | 18,392 | 18,362 | |
| Windstream Services LLC Tranche B 1LN, term loan CME Term SOFR 1 Month Index + 4.750% 9.7066% 10/4/29 (b)(c)(d) | 13,675 | 13,726 | |
| Zayo Group Holdings, Inc. 1LN, term loan: | |||
| CME Term SOFR 1 Month Index + 3.000% 7.7996% 3/9/27 (b)(c)(d) | 66,910 | 62,767 | |
| CME Term SOFR 1 Month Index + 4.250% 8.9352% 3/9/27 (b)(c)(d) | 21,255 | 20,192 | |
TOTAL TELECOMMUNICATIONS | 435,456 | ||
| Textiles/Apparel - 0.3% | |||
| Crocs, Inc. Tranche B 1LN, term loan CME Term SOFR 1 Month Index + 2.250% 6.8785% 2/20/29 (b)(c)(d) | 15,399 | 15,418 | |
| Fanatics Commerce Intermediate Holdco LLC Tranche B 1LN, term loan CME Term SOFR 1 Month Index + 3.250% 8.0496% 11/23/28 (b)(c)(d) | 11,321 | 11,260 | |
| Tory Burch LLC Tranche B 1LN, term loan CME Term SOFR 1 Month Index + 3.500% 8.0496% 4/16/28 (b)(c)(d) | 16,637 | 16,635 | |
TOTAL TEXTILES/APPAREL | 43,313 | ||
| Transportation Ex Air/Rail - 0.1% | |||
| ASP LS Acquisition Corp.: | |||
| 2LN, term loan CME Term SOFR 3 Month Index + 7.500% 12.3653% 5/7/29 (b)(c)(d) | 2,965 | 568 | |
| Tranche B 1LN, term loan CME Term SOFR 3 Month Index + 4.500% 9.3653% 5/7/28 (b)(c)(d) | 17,384 | 7,110 | |
TOTAL TRANSPORTATION EX AIR/RAIL | 7,678 | ||
| Utilities - 1.0% | |||
| Osmose Utilities Services, Inc. Tranche B 1LN, term loan CME Term SOFR 1 Month Index + 3.250% 8.0496% 6/23/28 (b)(c)(d) | 14,138 | 14,057 | |
| Pike Corp. Tranche B 1LN, term loan CME Term SOFR 1 Month Index + 3.000% 7.7996% 1/21/28 (b)(c)(d) | 15,389 | 15,429 | |
| Vertiv Group Corp. Tranche B 1LN, term loan CME Term SOFR 1 Month Index + 2.000% 6.8457% 3/2/27 (b)(c)(d) | 38,412 | 38,393 | |
| Vistra Operations Co. LLC Tranche B 3LN, term loan CME Term SOFR 1 Month Index + 2.000% 6.6852% 12/20/30 (b)(c)(d) | 25,986 | 25,998 | |
| WEC U.S. Holdings Ltd. Tranche B 1LN, term loan CME Term SOFR 1 Month Index + 2.750% 7.5954% 1/20/31 (b)(c)(d) | 58,707 | 58,736 | |
TOTAL UTILITIES | 152,613 | ||
| TOTAL BANK LOAN OBLIGATIONS (Cost $13,437,558) | 13,229,565 | ||
| Nonconvertible Bonds - 4.5% | |||
Principal Amount (a) (000s) | Value ($) (000s) | ||
| Aerospace - 0.1% | |||
| TransDigm, Inc. 6.375% 3/1/29 (i) | 19,405 | 19,697 | |
| Air Transportation - 0.0% | |||
| American Airlines, Inc. / AAdvantage Loyalty IP Ltd. 5.5% 4/20/26 (i) | 2,145 | 2,139 | |
| Delta Air Lines, Inc. / SkyMiles IP Ltd. 4.5% 10/20/25 (i) | 955 | 951 | |
TOTAL AIR TRANSPORTATION | 3,090 | ||
| Automotive & Auto Parts - 0.8% | |||
| Clarios Global LP / Clarios U.S. Finance Co. 6.75% 5/15/28 (i) | 7,810 | 7,995 | |
| Ford Motor Credit Co. LLC U.S. Secured Overnight Fin. Rate (SOFR) Index + 2.950% 7.9445% 3/6/26 (b)(c) | 16,070 | 16,406 | |
| Rivian Holdco & Rivian LLC & Rivian Automotive LLC CME Term SOFR 6 Month Index + 6.050% 10.502% 10/15/26 (b)(c)(i) | 87,765 | 87,869 | |
TOTAL AUTOMOTIVE & AUTO PARTS | 112,270 | ||
| Broadcasting - 0.5% | |||
| DISH Network Corp. 11.75% 11/15/27 (i) | 36,525 | 38,447 | |
| Univision Communications, Inc.: | |||
| 6.625% 6/1/27 (i) | 26,085 | 25,880 | |
| 8% 8/15/28 (i) | 6,375 | 6,479 | |
| 8.5% 7/31/31 (i) | 8,595 | 8,448 | |
TOTAL BROADCASTING | 79,254 | ||
| Building Materials - 0.1% | |||
| Smyrna Ready Mix Concrete LLC 8.875% 11/15/31 (i) | 11,790 | 12,384 | |
| Cable/Satellite TV - 0.2% | |||
| CCO Holdings LLC/CCO Holdings Capital Corp.: | |||
| 5% 2/1/28 (i) | 8,110 | 7,849 | |
| 5.375% 6/1/29 (i) | 16,225 | 15,488 | |
TOTAL CABLE/SATELLITE TV | 23,337 | ||
| Capital Goods - 0.0% | |||
| Chart Industries, Inc. 7.5% 1/1/30 (i) | 1,670 | 1,737 | |
| Chemicals - 0.1% | |||
| Olympus Water U.S. Holding Corp. 9.75% 11/15/28 (i) | 8,380 | 8,890 | |
| Diversified Financial Services - 0.1% | |||
| Windstream Services LLC / Wind 7.75% 8/15/28 (i) | 18,810 | 18,914 | |
| Energy - 0.3% | |||
| Citgo Petroleum Corp.: | |||
| 6.375% 6/15/26 (i) | 2,115 | 2,115 | |
| 7% 6/15/25 (i) | 9,610 | 9,613 | |
| 8.375% 1/15/29 (i) | 7,770 | 8,082 | |
| New Fortress Energy, Inc.: | |||
| 6.5% 9/30/26 (i) | 18,966 | 17,569 | |
| 6.75% 9/15/25 (i) | 10,793 | 10,773 | |
| Transocean Poseidon Ltd. 6.875% 2/1/27 (i) | 3,738 | 3,736 | |
TOTAL ENERGY | 51,888 | ||
| Gaming - 0.4% | |||
| Caesars Entertainment, Inc. 7% 2/15/30 (i) | 7,670 | 7,862 | |
| Fertitta Entertainment LLC / Fertitta Entertainment Finance Co., Inc. 4.625% 1/15/29 (i) | 37,830 | 35,317 | |
| Ontario Gaming GTA LP / OTG Co. issuer, Inc. 8% 8/1/30 (i) | 605 | 622 | |
| Sugarhouse HSP Gaming Prop Mezz LP/Sugarhouse HSP Gaming Finance Corp. 5.875% 5/15/25 (i) | 7,363 | 7,340 | |
| VICI Properties LP / VICI Note Co.: | |||
| 3.5% 2/15/25 (i) | 1,205 | 1,196 | |
| 4.25% 12/1/26 (i) | 1,725 | 1,692 | |
| 4.625% 12/1/29 (i) | 985 | 946 | |
TOTAL GAMING | 54,975 | ||
| Healthcare - 0.1% | |||
| Embecta Corp. 6.75% 2/15/30 (i) | 8,365 | 7,803 | |
| Medline Borrower LP / Medline Co. 6.25% 4/1/29 (i) | 4,675 | 4,757 | |
TOTAL HEALTHCARE | 12,560 | ||
| Homebuilders/Real Estate - 0.3% | |||
| MPT Operating Partnership LP/MPT Finance Corp. 5% 10/15/27 | 27,345 | 24,133 | |
| Uniti Group LP/Uniti Group Finance, Inc./CSL Capital LLC 10.5% 2/15/28 (i) | 18,880 | 20,110 | |
TOTAL HOMEBUILDERS/REAL ESTATE | 44,243 | ||
| Insurance - 0.3% | |||
| Acrisure LLC / Acrisure Finance, Inc. 7.5% 11/6/30 (i) | 21,445 | 21,806 | |
| Alliant Holdings Intermediate LLC/Alliant Holdings Co.-Issuer 6.75% 4/15/28 (i) | 16,655 | 16,733 | |
TOTAL INSURANCE | 38,539 | ||
| Leisure - 0.1% | |||
| Carnival Corp. 7.625% 3/1/26 (i) | 14,205 | 14,304 | |
| Metals/Mining - 0.0% | |||
| Arsenal AIC Parent LLC 8% 10/1/30 (i) | 680 | 715 | |
| Restaurants - 0.0% | |||
| CEC Entertainment LLC 6.75% 5/1/26 (i) | 4,045 | 4,021 | |
| Services - 0.1% | |||
| Brand Industrial Services, Inc. 10.375% 8/1/30 (i) | 4,560 | 4,834 | |
| Neptune BidCo U.S., Inc. 9.29% 4/15/29 (i) | 6,300 | 5,859 | |
| The GEO Group, Inc. 8.625% 4/15/29 | 2,935 | 3,070 | |
TOTAL SERVICES | 13,763 | ||
| Super Retail - 0.2% | |||
| Carvana Co. 5.625% 10/1/25 (i) | 8,225 | 8,123 | |
| EG Global Finance PLC 12% 11/30/28 (i) | 20,615 | 22,922 | |
TOTAL SUPER RETAIL | 31,045 | ||
| Technology - 0.2% | |||
| Acuris Finance U.S. 9% 8/1/29 (i) | 8,415 | 8,248 | |
| Cloud Software Group, Inc.: | |||
| 8.25% 6/30/32 (i) | 16,354 | 16,809 | |
| 9% 9/30/29 (i) | 8,495 | 8,494 | |
| Wolfspeed, Inc. 4.2917% 6/23/30 pay-in-kind (b)(f)(g)(i) | 2,555 | 2,453 | |
TOTAL TECHNOLOGY | 36,004 | ||
| Telecommunications - 0.6% | |||
| Altice Financing SA 5.75% 8/15/29 (i) | 12,926 | 10,601 | |
| Altice France SA: | |||
| 5.125% 1/15/29 (i) | 8,087 | 6,057 | |
| 5.125% 7/15/29 (i) | 21,585 | 16,145 | |
| 5.5% 1/15/28 (i) | 8,480 | 6,580 | |
| 5.5% 10/15/29 (i) | 22,075 | 16,528 | |
| Consolidated Communications, Inc. 5% 10/1/28 (i) | 410 | 379 | |
| Frontier Communications Holdings LLC: | |||
| 5% 5/1/28 (i) | 4,005 | 3,937 | |
| 8.75% 5/15/30 (i) | 1,560 | 1,651 | |
| LCPR Senior Secured Financing DAC: | |||
| 5.125% 7/15/29 (i) | 4,745 | 3,995 | |
| 6.75% 10/15/27 (i) | 19,480 | 18,303 | |
TOTAL TELECOMMUNICATIONS | 84,176 | ||
| TOTAL NONCONVERTIBLE BONDS (Cost $662,145) | 665,806 | ||
| Asset-Backed Securities - 0.2% | |||
Principal Amount (a) (000s) | Value ($) (000s) | ||
| Agl Clo 5 Ltd. Series 2024-5A Class ERR, CME Term SOFR 3 Month Index + 6.350% 10.9674% 7/20/34 (b)(c)(i) | 806 | 807 | |
| Birch Grove Clo 4 Ltd. Series 2024-4A Class ER, CME Term SOFR 3 Month Index + 6.500% 11.1559% 7/15/37 (b)(c)(i) | 3,336 | 3,353 | |
| Carval Clo Xi-C Ltd. Series 2024-3A Class E, CME Term SOFR 3 Month Index + 6.350% 10.9214% 10/20/37 (b)(c)(i) | 460 | 463 | |
| Eaton Vance CLO, Ltd. Series 2024-1A Class D2, CME Term SOFR 3 Month Index + 4.500% 9.1559% 10/15/37 (b)(c)(i) | 1,810 | 1,828 | |
| Goldentree Loan Management U.S. CLO 18, Ltd. Series 2024-21A Class DJ, CME Term SOFR 3 Month Index + 4.250% 8.8674% 7/20/37 (b)(c)(i) | 2,807 | 2,810 | |
| Goldentree Loan Management U.S. CLO 21, Ltd. Series 2024-21A Class E, CME Term SOFR 3 Month Index + 5.700% 10.3174% 7/20/37 (b)(c)(i) | 4,213 | 4,235 | |
| Magnetite Xxix Ltd. Series 2024-29A Class ER, CME Term SOFR 3 Month Index + 6.000% 11.2417% 7/15/37 (b)(c)(i) | 1,023 | 1,036 | |
| Midocean Credit Clo Xvi Series 2024-16A Class E, CME Term SOFR 3 Month Index + 6.250% 6.25% 10/20/37 (b)(c)(i)(j) | 1,153 | 1,153 | |
| Ocp Clo 2017-14 Ltd. Series 2024-14A Class ER, CME Term SOFR 3 Month Index + 6.550% 11.2908% 7/20/37 (b)(c)(i) | 1,457 | 1,476 | |
| Palmer Square Ln Funding 2024-2 Lt Series 2024-2A Class D, CME Term SOFR 3 Month Index + 4.700% 6.2% 1/15/33 (b)(c)(i)(j) | 2,704 | 2,704 | |
| Palmer Square Ln Funding 2024-3 Series 2024-3A Class D, CME Term SOFR 3 Month Index + 5.400% 10.7366% 8/8/32 (b)(c)(i) | 5,670 | 5,686 | |
| Rr 31 Ltd. Series 2024-31A Class D, CME Term SOFR 3 Month Index + 6.000% 10.5928% 10/15/39 (b)(c)(i) | 1,250 | 1,252 | |
| TOTAL ASSET-BACKED SECURITIES (Cost $26,689) | 26,803 | ||
| Common Stocks - 1.5% | |||
| Shares | Value ($) (000s) | ||
| Broadcasting - 0.0% | |||
| ION Media Networks, Inc. (f)(k) | 2,842 | 0 | |
| Capital Goods - 0.0% | |||
| TNT Crane & Rigging LLC (f)(k) | 512,868 | 698 | |
| TNT Crane & Rigging LLC warrants 10/31/25 (f)(k) | 86,957 | 0 | |
TOTAL CAPITAL GOODS | 698 | ||
| Consumer Products - 0.1% | |||
| JOANN, Inc. (f)(l) | 6,027,648 | 12,477 | |
| Diversified Financial Services - 0.3% | |||
| ACNR Holdings, Inc. (f) | 510,379 | 45,970 | |
| Carnelian Point Holdings LP warrants (f)(k) | 18,944 | 55 | |
| Limetree Bay Cayman Ltd. (f)(k) | 2,899 | 191 | |
TOTAL DIVERSIFIED FINANCIAL SERVICES | 46,216 | ||
| Energy - 0.8% | |||
| California Resources Corp. | 643,972 | 33,467 | |
| EP Energy Corp. (f)(k) | 80,740 | 103 | |
| Expand Energy Corp. | 587,218 | 49,749 | |
| Expand Energy Corp. (m) | 4,049 | 343 | |
| Exxon Mobil Corp. | 329,097 | 38,432 | |
TOTAL ENERGY | 122,094 | ||
| Entertainment/Film - 0.1% | |||
| New Cineworld Ltd. (f)(k) | 715,262 | 13,790 | |
| Hotels - 0.1% | |||
| Travelport Finance Luxembourg SARL (f) | 3,686 | 9,025 | |
| Restaurants - 0.1% | |||
| Old Claimco LLC (f)(k) | 542,500 | 6,505 | |
| Telecommunications - 0.0% | |||
| GTT Communications, Inc. (f)(k) | 118,360 | 6,397 | |
| TOTAL COMMON STOCKS (Cost $118,317) | 217,202 | ||
| Preferred Securities - 0.3% | |||
Principal Amount (a) (000s) | Value ($) (000s) | ||
| Banks & Thrifts - 0.3% | |||
| Citigroup, Inc. 4.7% (b)(n) | 24,205 | 24,338 | |
| JPMorgan Chase & Co. 4.6% (b)(n) | 13,450 | 13,540 | |
TOTAL BANKS & THRIFTS | 37,878 | ||
| Diversified Financial Services - 0.0% | |||
| Aircastle Ltd. 5.25% (b)(i)(n) | 8,580 | 8,492 | |
| TOTAL PREFERRED SECURITIES (Cost $46,214) | 46,370 | ||
| Other - 0.8% | |||
| Shares | Value ($) (000s) | ||
| Other - 0.8% | |||
Fidelity Private Credit Co. LLC (m)(o) (Cost $112,299) | 11,271,791 | 113,620 | |
| Money Market Funds - 5.9% | |||
| Shares | Value ($) (000s) | ||
Fidelity Cash Central Fund 4.87% (p) (Cost $872,159) | 872,008,592 | 872,183 | |
| TOTAL INVESTMENT IN SECURITIES - 103.3% (Cost $15,275,381) | 15,171,549 |
NET OTHER ASSETS (LIABILITIES) - (3.3)% | (489,407) |
| NET ASSETS - 100.0% | 14,682,142 |
| (a) | Amount is stated in United States dollars unless otherwise noted. |
| (b) | Coupon rates for floating and adjustable rate securities reflect the rates in effect at period end. |
| (c) | Coupon is indexed to a floating interest rate which may be multiplied by a specified factor and/or subject to caps or floors. |
| (d) | Remaining maturities of bank loan obligations may be less than the stated maturities shown as a result of contractual or optional prepayments by the borrower. Such prepayments cannot be predicted with certainty. |
| (e) | A coupon rate of 0% signifies an unsettled loan. The coupon rate will be determined upon settlement of the loan after period end. |
| (f) | Level 3 security |
| (g) | Position or a portion of the position represents an unfunded loan commitment. At period end, the total principal amount and market value of unfunded commitments totaled $10,204,000 and $10,140,000, respectively. |
| (h) | Non-income producing - Security is in default. |
| (i) | Security exempt from registration under Rule 144A of the Securities Act of 1933. These securities may be resold in transactions exempt from registration, normally to qualified institutional buyers. At the end of the period, the value of these securities amounted to $657,492,000 or 4.5% of net assets. |
| (j) | Security or a portion of the security purchased on a delayed delivery or when-issued basis. |
| (k) | Non-income producing |
| (l) | Affiliated company |
| (m) | Restricted securities (including private placements) - Investment in securities not registered under the Securities Act of 1933 (excluding 144A issues). At the end of the period, the value of restricted securities (excluding 144A issues) amounted to $113,963,000 or 0.8% of net assets. |
| (n) | Security is perpetual in nature with no stated maturity date. |
| (o) | Affiliated Fund |
| (p) | Affiliated fund that is generally available only to investment companies and other accounts managed by Fidelity Investments. The rate quoted is the annualized seven-day yield of the fund at period end. A complete unaudited listing of the fund's holdings as of its most recent quarter end is available upon request. In addition, each Fidelity Central Fund's financial statements, which are not covered by the Fund's Report of Independent Registered Public Accounting Firm, are available on the SEC's website or upon request. |
| Additional information on each restricted holding is as follows: | ||
| Security | Acquisition Date | Acquisition Cost ($) (000s) |
| Expand Energy Corp. | 2/10/21 | 38 |
| Fidelity Private Credit Co. LLC | 5/01/22 - 10/28/24 | 112,299 |
| Affiliate (Amounts in thousands) | Value, beginning of period ($) | Purchases ($) | Sales Proceeds ($) | Dividend Income ($) | Realized Gain (loss) ($) | Change in Unrealized appreciation (depreciation) ($) | Value, end of period ($) | % ownership, end of period |
| Fidelity Cash Central Fund 4.87% | 1,286,453 | 3,161,926 | 3,574,430 | 55,026 | 1 | (1,767) | 872,183 | 1.7% |
| Fidelity Securities Lending Cash Central Fund 4.87% | 51,380 | 99,470 | 150,850 | 50 | - | - | - | 0.0% |
| Total | 1,337,833 | 3,261,396 | 3,725,280 | 55,076 | 1 | (1,767) | 872,183 | |
| Affiliate (Amounts in thousands) | Value, beginning of period ($) | Purchases ($) | Sales Proceeds ($) | Dividend Income ($) | Realized Gain (loss) ($) | Change in Unrealized appreciation (depreciation) ($) | Value, end of period ($) |
| Fidelity Private Credit Co. LLC | 94,881 | 19,184 | - | 14,139 | - | (445) | 113,620 |
| 94,881 | 19,184 | - | 14,139 | - | (445) | 113,620 |
| Affiliate (Amounts in thousands) | Value, beginning of period ($) | Purchases ($) | Sales Proceeds ($) | Dividend Income ($) | Realized Gain (loss) ($) | Change in Unrealized appreciation (depreciation) ($) | Value, end of period ($) |
| JOANN, Inc. | - | 415 | - | - | - | 12,062 | 12,477 |
| Total | - | 415 | - | - | - | 12,062 | 12,477 |
| Valuation Inputs at Reporting Date: | ||||
Description (Amounts in thousands) | Total ($) | Level 1 ($) | Level 2 ($) | Level 3 ($) |
Investments in Securities: | ||||
| Equities: | ||||
Communication Services | 13,790 | - | - | 13,790 |
Consumer Discretionary | 28,007 | - | - | 28,007 |
Energy | 122,094 | 121,991 | - | 103 |
Financials | 46,216 | - | - | 46,216 |
Industrials | 698 | - | - | 698 |
Information Technology | 6,397 | - | - | 6,397 |
| Bank Loan Obligations | 13,229,565 | - | 13,152,197 | 77,368 |
| Corporate Bonds | 665,806 | - | 663,353 | 2,453 |
| Asset-Backed Securities | 26,803 | - | 26,803 | - |
| Preferred Securities | 46,370 | - | 46,370 | - |
| Other | 113,620 | - | 113,620 | - |
| Money Market Funds | 872,183 | 872,183 | - | - |
| Total Investments in Securities: | 15,171,549 | 994,174 | 14,002,343 | 175,032 |
| Net Unrealized Appreciation on Unfunded Commitments | 4,480 | - | - | 4,480 |
| Total | 4,480 | - | - | 4,480 |
| (Amounts in thousands) | |||
| Investments in Securities: | |||
| Beginning Balance | $ | 223,482 | |
| Net Realized Gain (Loss) on Investment Securities | 2,882 | ||
| Net Unrealized Gain (Loss) on Investment Securities | 1,746 | ||
| Cost of Purchases | 50,544 | ||
| Proceeds of Sales | (99,374) | ||
| Amortization/Accretion | 909 | ||
| Transfers into Level 3 | - | ||
| Transfers out of Level 3 | (5,157) | ||
| Ending Balance | $ | 175,032 | |
| The change in unrealized gain (loss) for the period attributable to Level 3 securities held at October 31, 2024 | $ | 42,398 | |
| The information used in the above reconciliation represents fiscal year to date activity for any Investments in Securities identified as using Level 3 inputs at either the beginning or the end of the current fiscal period. Cost of purchases and proceeds of sales may include securities received and/or delivered through in-kind transactions, corporate actions or exchanges. Transfers into Level 3 were attributable to a lack of observable market data resulting from decreases in market activity, decreases in liquidity, security restructurings or corporate actions. Transfers out of Level 3 were attributable to observable market data becoming available for those securities. Transfers in or out of Level 3 represent the beginning value of any Security or Instrument where a change in the pricing level occurred from the beginning to the end of the period. Realized and unrealized gains (losses) disclosed in the reconciliation are included in Net Gain (Loss) on the Fund's Statement of Operations. | |||
| Statement of Assets and Liabilities | ||||
As of October 31, 2024 Amounts in thousands (except per-share amounts) | ||||
| Assets | ||||
| Investment in securities, at value - See accompanying schedule: | ||||
Unaffiliated issuers (cost $14,290,507) | $ | 14,173,269 | ||
Fidelity Central Funds (cost $872,159) | 872,183 | |||
Other affiliated issuers (cost $112,715) | 126,097 | |||
| Total Investment in Securities (cost $15,275,381) | $ | 15,171,549 | ||
| Cash | 13,274 | |||
| Receivable for investments sold | 132,023 | |||
| Unrealized appreciation on unfunded commitments | 4,480 | |||
| Receivable for fund shares sold | 21,319 | |||
| Interest receivable | 79,654 | |||
| Distributions receivable from Fidelity Central Funds | 3,439 | |||
| Prepaid expenses | 17 | |||
| Other receivables | 283 | |||
Total assets | 15,426,038 | |||
| Liabilities | ||||
| Payable for investments purchased | ||||
Regular delivery | $ | 694,152 | ||
Delayed delivery | 3,857 | |||
| Payable for fund shares redeemed | 18,808 | |||
| Distributions payable | 18,699 | |||
| Accrued management fee | 7,707 | |||
| Distribution and service plan fees payable | 254 | |||
| Other payables and accrued expenses | 419 | |||
| Total liabilities | 743,896 | |||
| Commitments and contingent liabilities (see Significant Accounting Policies and Litigation notes) | ||||
| Net Assets | $ | 14,682,142 | ||
| Net Assets consist of: | ||||
| Paid in capital | $ | 15,960,829 | ||
| Total accumulated earnings (loss) | (1,278,687) | |||
| Net Assets | $ | 14,682,142 | ||
| Net Asset Value and Maximum Offering Price | ||||
| Class A : | ||||
Net Asset Value and redemption price per share ($675,885 ÷ 72,733 shares)(a) | $ | 9.29 | ||
| Maximum offering price per share (100/97.25 of $9.29) | $ | 9.55 | ||
| Class M : | ||||
Net Asset Value and redemption price per share ($87,381 ÷ 9,417 shares)(a) | $ | 9.28 | ||
| Maximum offering price per share (100/97.25 of $9.28) | $ | 9.54 | ||
| Class C : | ||||
Net Asset Value and offering price per share ($115,117 ÷ 12,390 shares)(a) | $ | 9.29 | ||
| Fidelity Floating Rate High Income Fund : | ||||
Net Asset Value, offering price and redemption price per share ($9,515,970 ÷ 1,025,357 shares) | $ | 9.28 | ||
| Class I : | ||||
Net Asset Value, offering price and redemption price per share ($2,081,268 ÷ 224,460 shares) | $ | 9.27 | ||
| Class Z : | ||||
Net Asset Value, offering price and redemption price per share ($2,206,521 ÷ 237,876 shares) | $ | 9.28 | ||
(a)Redemption price per share is equal to net asset value less any applicable contingent deferred sales charge. | ||||
| Statement of Operations | ||||
| Year ended October 31, 2024 Amounts in thousands | ||||
| Investment Income | ||||
| Dividends: | ||||
| Unaffiliated issuers | $ | 12,860 | ||
| Affiliated issuers | 14,045 | |||
| Interest | 1,204,064 | |||
| Income from Fidelity Central Funds (including $50 from security lending) | 55,076 | |||
| Total income | 1,286,045 | |||
| Expenses | ||||
| Management fee | $ | 85,195 | ||
| Transfer agent fees | 4,489 | |||
| Distribution and service plan fees | 2,992 | |||
| Accounting fees | 587 | |||
| Custodian fees and expenses | 71 | |||
| Independent trustees' fees and expenses | 61 | |||
| Registration fees | 630 | |||
| Audit fees | 97 | |||
| Legal | 420 | |||
| Miscellaneous | 176 | |||
| Total expenses before reductions | 94,718 | |||
| Expense reductions | (1,086) | |||
| Total expenses after reductions | 93,632 | |||
| Net Investment income (loss) | 1,192,413 | |||
| Realized and Unrealized Gain (Loss) | ||||
| Net realized gain (loss) on: | ||||
| Investment Securities: | ||||
| Unaffiliated issuers | (116,770) | |||
| Fidelity Central Funds | 1 | |||
| Capital gain distributions from underlying funds: | ||||
| Affiliated issuers | 94 | |||
| Total net realized gain (loss) | (116,675) | |||
| Change in net unrealized appreciation (depreciation) on: | ||||
| Investment Securities: | ||||
| Unaffiliated issuers | 233,782 | |||
| Fidelity Central Funds | (1,767) | |||
| Other affiliated issuers | 11,617 | |||
| Unfunded commitments | 4,393 | |||
| Total change in net unrealized appreciation (depreciation) | 248,025 | |||
| Net gain (loss) | 131,350 | |||
| Net increase (decrease) in net assets resulting from operations | $ | 1,323,763 | ||
| Statement of Changes in Net Assets | ||||
| Amount in thousands | Year ended October 31, 2024 | Year ended October 31, 2023 | ||
| Increase (Decrease) in Net Assets | ||||
| Operations | ||||
| Net investment income (loss) | $ | 1,192,413 | $ | 963,141 |
| Net realized gain (loss) | (116,675) | (56,353) | ||
| Change in net unrealized appreciation (depreciation) | 248,025 | 303,611 | ||
| Net increase (decrease) in net assets resulting from operations | 1,323,763 | 1,210,399 | ||
| Distributions to shareholders | (1,165,961) | (961,832) | ||
| Share transactions - net increase (decrease) | 2,215,797 | 31,517 | ||
| Total increase (decrease) in net assets | 2,373,599 | 280,084 | ||
| Net Assets | ||||
| Beginning of period | 12,308,543 | 12,028,459 | ||
| End of period | $ | 14,682,142 | $ | 12,308,543 |
Fidelity Advisor® Floating Rate High Income Fund Class A |
| Years ended October 31, | 2024 | 2023 | 2022 | 2021 | 2020 | |||||
Selected Per-Share Data | ||||||||||
| Net asset value, beginning of period | $ | 9.17 | $ | 8.98 | $ | 9.53 | $ | 8.98 | $ | 9.39 |
| Income from Investment Operations | ||||||||||
Net investment income (loss) A,B | .771 | .727 | .370 | .298 | .362 | |||||
| Net realized and unrealized gain (loss) | .103 | .190 | (.556) | .525 | (.411) | |||||
| Total from investment operations | .874 | .917 | (.186) | .823 | (.049) | |||||
| Distributions from net investment income | (.754) | (.727) | (.364) | (.273) | (.361) | |||||
| Total distributions | (.754) | (.727) | (.364) | (.273) | (.361) | |||||
| Net asset value, end of period | $ | 9.29 | $ | 9.17 | $ | 8.98 | $ | 9.53 | $ | 8.98 |
Total Return C,D | 9.85 % | 10.55% | (1.96)% | 9.24% | (.45)% | |||||
Ratios to Average Net Assets B,E,F | ||||||||||
| Expenses before reductions | .95% | .97% | .97% | .98% | .98% | |||||
| Expenses net of fee waivers, if any | .94 % | .96% | .97% | .98% | .98% | |||||
| Expenses net of all reductions | .94% | .96% | .97% | .97% | .98% | |||||
| Net investment income (loss) | 8.31% | 7.96% | 4.00% | 3.18% | 4.01% | |||||
| Supplemental Data | ||||||||||
| Net assets, end of period (in millions) | $ | 676 | $ | 601 | $ | 575 | $ | 523 | $ | 411 |
Portfolio turnover rate G | 41 % | 35% | 27% | 31% | 37% |
Fidelity Advisor® Floating Rate High Income Fund Class M |
| Years ended October 31, | 2024 | 2023 | 2022 | 2021 | 2020 | |||||
Selected Per-Share Data | ||||||||||
| Net asset value, beginning of period | $ | 9.16 | $ | 8.96 | $ | 9.51 | $ | 8.97 | $ | 9.38 |
| Income from Investment Operations | ||||||||||
Net investment income (loss) A,B | .772 | .728 | .369 | .297 | .361 | |||||
| Net realized and unrealized gain (loss) | .102 | .200 | (.555) | .514 | (.411) | |||||
| Total from investment operations | .874 | .928 | (.186) | .811 | (.050) | |||||
| Distributions from net investment income | (.754) | (.728) | (.364) | (.271) | (.360) | |||||
| Total distributions | (.754) | (.728) | (.364) | (.271) | (.360) | |||||
| Net asset value, end of period | $ | 9.28 | $ | 9.16 | $ | 8.96 | $ | 9.51 | $ | 8.97 |
Total Return C,D | 9.86 % | 10.69% | (1.97)% | 9.12% | (.46)% | |||||
Ratios to Average Net Assets B,E,F | ||||||||||
| Expenses before reductions | .93% | .95% | .97% | .99% | 1.00% | |||||
| Expenses net of fee waivers, if any | .93 % | .95% | .96% | .99% | 1.00% | |||||
| Expenses net of all reductions | .93% | .95% | .96% | .99% | .99% | |||||
| Net investment income (loss) | 8.32% | 7.98% | 4.00% | 3.16% | 4.00% | |||||
| Supplemental Data | ||||||||||
| Net assets, end of period (in millions) | $ | 87 | $ | 86 | $ | 87 | $ | 65 | $ | 58 |
Portfolio turnover rate G | 41 % | 35% | 27% | 31% | 37% |
Fidelity Advisor® Floating Rate High Income Fund Class C |
| Years ended October 31, | 2024 | 2023 | 2022 | 2021 | 2020 | |||||
Selected Per-Share Data | ||||||||||
| Net asset value, beginning of period | $ | 9.17 | $ | 8.97 | $ | 9.53 | $ | 8.98 | $ | 9.39 |
| Income from Investment Operations | ||||||||||
Net investment income (loss) A,B | .702 | .659 | .300 | .228 | .295 | |||||
| Net realized and unrealized gain (loss) | .102 | .199 | (.565) | .524 | (.411) | |||||
| Total from investment operations | .804 | .858 | (.265) | .752 | (.116) | |||||
| Distributions from net investment income | (.684) | (.658) | (.295) | (.202) | (.294) | |||||
| Total distributions | (.684) | (.658) | (.295) | (.202) | (.294) | |||||
| Net asset value, end of period | $ | 9.29 | $ | 9.17 | $ | 8.97 | $ | 9.53 | $ | 8.98 |
Total Return C,D | 9.03 % | 9.84% | (2.81)% | 8.42% | (1.19)% | |||||
Ratios to Average Net Assets B,E,F | ||||||||||
| Expenses before reductions | 1.70% | 1.72% | 1.72% | 1.73% | 1.74% | |||||
| Expenses net of fee waivers, if any | 1.69 % | 1.71% | 1.72% | 1.73% | 1.74% | |||||
| Expenses net of all reductions | 1.69% | 1.71% | 1.72% | 1.73% | 1.74% | |||||
| Net investment income (loss) | 7.56% | 7.21% | 3.24% | 2.42% | 3.26% | |||||
| Supplemental Data | ||||||||||
| Net assets, end of period (in millions) | $ | 115 | $ | 110 | $ | 114 | $ | 109 | $ | 156 |
Portfolio turnover rate G | 41 % | 35% | 27% | 31% | 37% |
Fidelity® Floating Rate High Income Fund |
| Years ended October 31, | 2024 | 2023 | 2022 | 2021 | 2020 | |||||
Selected Per-Share Data | ||||||||||
| Net asset value, beginning of period | $ | 9.16 | $ | 8.96 | $ | 9.52 | $ | 8.97 | $ | 9.38 |
| Income from Investment Operations | ||||||||||
Net investment income (loss) A,B | .794 | .753 | .397 | .326 | .391 | |||||
| Net realized and unrealized gain (loss) | .106 | .200 | (.566) | .525 | (.413) | |||||
| Total from investment operations | .900 | .953 | (.169) | .851 | (.022) | |||||
| Distributions from net investment income | (.780) | (.753) | (.391) | (.301) | (.388) | |||||
| Total distributions | (.780) | (.753) | (.391) | (.301) | (.388) | |||||
| Net asset value, end of period | $ | 9.28 | $ | 9.16 | $ | 8.96 | $ | 9.52 | $ | 8.97 |
Total Return C | 10.16 % | 10.99% | (1.79)% | 9.58% | (.15)% | |||||
Ratios to Average Net Assets B,D,E | ||||||||||
| Expenses before reductions | .67% | .67% | .68% | .67% | .68% | |||||
| Expenses net of fee waivers, if any | .66 % | .67% | .68% | .67% | .68% | |||||
| Expenses net of all reductions | .66% | .67% | .68% | .67% | .68% | |||||
| Net investment income (loss) | 8.59% | 8.26% | 4.29% | 3.48% | 4.32% | |||||
| Supplemental Data | ||||||||||
| Net assets, end of period (in millions) | $ | 9,516 | $ | 7,026 | $ | 6,461 | $ | 6,419 | $ | 4,640 |
Portfolio turnover rate F | 41 % | 35% | 27% | 31% | 37% |
Fidelity Advisor® Floating Rate High Income Fund Class I |
| Years ended October 31, | 2024 | 2023 | 2022 | 2021 | 2020 | |||||
Selected Per-Share Data | ||||||||||
| Net asset value, beginning of period | $ | 9.15 | $ | 8.96 | $ | 9.51 | $ | 8.96 | $ | 9.37 |
| Income from Investment Operations | ||||||||||
Net investment income (loss) A,B | .794 | .750 | .391 | .321 | .388 | |||||
| Net realized and unrealized gain (loss) | .102 | .190 | (.554) | .525 | (.414) | |||||
| Total from investment operations | .896 | .940 | (.163) | .846 | (.026) | |||||
| Distributions from net investment income | (.776) | (.750) | (.387) | (.296) | (.384) | |||||
| Total distributions | (.776) | (.750) | (.387) | (.296) | (.384) | |||||
| Net asset value, end of period | $ | 9.27 | $ | 9.15 | $ | 8.96 | $ | 9.51 | $ | 8.96 |
Total Return C | 10.13 % | 10.84% | (1.73)% | 9.54% | (.20)% | |||||
Ratios to Average Net Assets B,D,E | ||||||||||
| Expenses before reductions | .69% | .70% | .72% | .72% | .73% | |||||
| Expenses net of fee waivers, if any | .68 % | .70% | .72% | .72% | .72% | |||||
| Expenses net of all reductions | .68% | .70% | .72% | .72% | .72% | |||||
| Net investment income (loss) | 8.57% | 8.23% | 4.25% | 3.43% | 4.27% | |||||
| Supplemental Data | ||||||||||
| Net assets, end of period (in millions) | $ | 2,081 | $ | 1,972 | $ | 1,993 | $ | 1,167 | $ | 681 |
Portfolio turnover rate F | 41 % | 35% | 27% | 31% | 37% |
Fidelity Advisor® Floating Rate High Income Fund Class Z |
| Years ended October 31, | 2024 | 2023 | 2022 | 2021 | 2020 | |||||
Selected Per-Share Data | ||||||||||
| Net asset value, beginning of period | $ | 9.16 | $ | 8.96 | $ | 9.51 | $ | 8.97 | $ | 9.37 |
| Income from Investment Operations | ||||||||||
Net investment income (loss) A,B | .805 | .759 | .401 | .329 | .388 | |||||
| Net realized and unrealized gain (loss) | .101 | .198 | (.555) | .516 | (.396) | |||||
| Total from investment operations | .906 | .957 | (.154) | .845 | (.008) | |||||
| Distributions from net investment income | (.786) | (.757) | (.396) | (.305) | (.392) | |||||
| Total distributions | (.786) | (.757) | (.396) | (.305) | (.392) | |||||
| Net asset value, end of period | $ | 9.28 | $ | 9.16 | $ | 8.96 | $ | 9.51 | $ | 8.97 |
Total Return C | 10.24 % | 11.05% | (1.63)% | 9.52% | .01% | |||||
Ratios to Average Net Assets B,D,E | ||||||||||
| Expenses before reductions | .59% | .62% | .62% | .62% | .63% | |||||
| Expenses net of fee waivers, if any | .58 % | .61% | .62% | .62% | .63% | |||||
| Expenses net of all reductions | .58% | .61% | .62% | .62% | .63% | |||||
| Net investment income (loss) | 8.67% | 8.31% | 4.35% | 3.53% | 4.37% | |||||
| Supplemental Data | ||||||||||
| Net assets, end of period (in millions) | $ | 2,207 | $ | 2,513 | $ | 2,798 | $ | 2,449 | $ | 641 |
Portfolio turnover rate F | 41 % | 35% | 27% | 31% | 37% |
| Fidelity Central Fund | Investment Manager | Investment Objective | Investment Practices | Expense RatioA |
| Fidelity Money Market Central Funds | Fidelity Management & Research Company LLC (FMR) | Each fund seeks to obtain a high level of current income consistent with the preservation of capital and liquidity. | Short-term Investments | Less than .005% |
| Asset Type | Fair Value | Valuation Technique(s) | Unobservable Input | Amount or Range/Weighted Average | Impact to Valuation from an Increase in InputA |
| Equities | $95,211 | Market comparable | Enterprise value/EBITDA multiple (EV/EBITDA) | 1.9 - 12.3 / 4.5 | Increase |
Market approach | Transaction price | $2.92 - $90.00 / $89.90 | Increase | ||
Discounted cash flow | Yield | 12.2% | Decrease | ||
Recovery value | Recovery value | $0.00 | Increase | ||
Black scholes | Discount rate | 3.9% - 4.3% / 3.9% | Increase | ||
| Term | 1.0 | Increase | |||
| Volatility | 22.5% - 45.0% / 22.5% | Increase | |||
| Corporate Bonds | $2,453 | Market approach | Transaction price | $96.00 | Increase |
| Bank Loan Obligations | $77,368 | Market comparable | Enterprise value/Revenue multiple (EV/R) | 0.5 | Increase |
Market approach | Transaction price | $100.00 | Increase | ||
Discounted cash flow | Yield | 0.0% - 12.5% / 8.2% | Decrease | ||
Indicative market price | Evaluated bid | $75.00 - $100.00 / $90.83 | Increase |
| Fidelity Advisor Floating Rate High Income Fund | $274 |
| Gross unrealized appreciation | $293,426 |
| Gross unrealized depreciation | (349,337) |
| Net unrealized appreciation (depreciation) | $(55,911) |
| Tax Cost | $15,231,941 |
| Undistributed ordinary income | $9,013 |
| Capital loss carryforward | $(1,228,902) |
| Net unrealized appreciation (depreciation) on securities and other investments | $(55,911) |
Short-term | $(45,218) |
Long-term | (1,183,684) |
| Total capital loss carryforward | $(1,228,902) |
| October 31, 2024 | October 31, 2023 | |
| Ordinary Income | $1,165,961 | $ 961,832 |
| Investment to be Acquired | Commitment Amount ($) | |
| Fidelity Advisor Floating Rate High Income Fund | Fidelity Private Credit Co. LLC | 14,381 |
| Investment to be Acquired | Commitment Amount ($) | Unrealized Appreciation (Depreciation)($) | |
| Fidelity Advisor Floating Rate High Income Fund | EchoStar Corp. 10.75% 9/27/29 | 51,700 | 4,480 |
| Purchases ($) | Sales ($) | |
| Fidelity Advisor Floating Rate High Income Fund | 8,142,363 | 5,421,522 |
| Maximum Management Fee Rate % | |
| Class A | .69 |
| Class M | .68 |
| Class C | .69 |
| Fidelity Floating Rate High Income Fund | .65 |
| Class I | .68 |
| Class Z | .59 |
| Total Management Fee Rate % | |
| Class A | .68 |
| Class M | .68 |
| Class C | .68 |
| Fidelity Floating Rate High Income Fund | .64 |
| Class I | .68 |
| Class Z | .58 |
| Distribution Fee | Service Fee | Total Fees ($) | Retained by FDC ($) | |
| Class A | - % | .25% | 1,619 | 132 |
| Class M | - % | .25% | 218 | 1 |
| Class C | .75% | .25% | 1,155 | 240 |
| 2,992 | 373 |
| Retained by FDC ($) | |
| Class A | 75 |
| Class M | 6 |
Class C A | 1 |
82 |
| % of Class-Level Average Net Assets | |
| Class A | .1483 |
| Class M | .1367 |
| Class C | .1492 |
| Fidelity Floating Rate High Income Fund | .1064 |
| Class I | .1372 |
| Class Z | .0500 |
| Amount ($) | % of Class-Level Average Net Assets | |
| Class A | 308 | .15 |
| Class M | 40 | .14 |
| Class C | 56 | .15 |
| Fidelity Floating Rate High Income Fund | 2,704 | .11 |
| Class I | 959 | .14 |
| Class Z | 422 | .05 |
4,489 |
| % of Average Net Assets | |
| Fidelity Advisor Floating Rate High Income Fund | .0137 |
| % of Average Net Assets | |
| Fidelity Advisor Floating Rate High Income Fund | .01 |
| Amount ($) | |
| Fidelity Advisor Floating Rate High Income Fund | 22 |
| Total Security Lending Fees Paid to NFS ($) | Security Lending Income From Securities Loaned to NFS ($) | Value of Securities Loaned to NFS at Period End ($) | |
| Fidelity Advisor Floating Rate High Income Fund | 5 | - | - |
Year ended October 31, 2024 | Year ended October 31, 2023 | |
| Fidelity Advisor Floating Rate High Income Fund | ||
| Distributions to shareholders | ||
| Class A | $52,534 | $44,976 |
| Class M | 7,099 | 7,043 |
| Class C | 8,509 | 8,076 |
| Fidelity Floating Rate High Income Fund | 711,164 | 526,804 |
| Class I | 178,961 | 158,730 |
| Class Z | 207,694 | 216,203 |
Total | $1,165,961 | $961,832 |
| Shares | Shares | Dollars | Dollars | |
Year ended October 31, 2024 | Year ended October 31, 2023 | Year ended October 31, 2024 | Year ended October 31, 2023 | |
| Fidelity Advisor Floating Rate High Income Fund | ||||
| Class A | ||||
| Shares sold | 22,757 | 20,522 | $211,399 | $187,909 |
| Reinvestment of distributions | 5,113 | 4,454 | 47,497 | 40,696 |
| Shares redeemed | (20,705) | (23,477) | (192,232) | (214,086) |
| Net increase (decrease) | 7,165 | 1,499 | $66,664 | $14,519 |
| Class M | ||||
| Shares sold | 2,512 | 2,976 | $23,292 | $27,078 |
| Reinvestment of distributions | 744 | 755 | 6,898 | 6,886 |
| Shares redeemed | (3,269) | (4,009) | (30,319) | (36,464) |
| Net increase (decrease) | (13) | (278) | $(129) | $(2,500) |
| Class C | ||||
| Shares sold | 3,993 | 4,587 | $37,064 | $41,782 |
| Reinvestment of distributions | 864 | 823 | 8,030 | 7,523 |
| Shares redeemed | (4,434) | (6,105) | (41,157) | (55,688) |
| Net increase (decrease) | 423 | (695) | $3,937 | $(6,383) |
| Fidelity Floating Rate High Income Fund | ||||
| Shares sold | 481,932 | 282,875 | $4,469,768 | $2,586,129 |
| Reinvestment of distributions | 63,798 | 48,217 | 591,928 | 440,050 |
| Shares redeemed | (287,305) | (284,925) | (2,661,889) | (2,593,072) |
| Net increase (decrease) | 258,425 | 46,167 | $2,399,807 | $433,107 |
| Class I | ||||
| Shares sold | 100,802 | 113,232 | $933,137 | $1,032,650 |
| Reinvestment of distributions | 14,367 | 13,504 | 133,168 | 123,082 |
| Shares redeemed | (106,103) | (133,919) | (982,087) | (1,218,642) |
| Net increase (decrease) | 9,066 | (7,183) | $84,218 | $(62,910) |
| Class Z | ||||
| Shares sold | 59,276 | 66,053 | $549,775 | $601,643 |
| Reinvestment of distributions | 17,057 | 18,534 | 158,208 | 169,022 |
| Shares redeemed | (112,865) | (122,461) | (1,046,683) | (1,114,981) |
| Net increase (decrease) | (36,532) | (37,874) | $(338,700) | $(344,316) |
| A special meeting of shareholders was held on July 16, 2024. The results of votes taken among shareholders on the proposal before them are reported below. Each vote reported represents one dollar of net asset value held on the record date for the meeting. | ||
| Proposal 1 | ||
| To elect a Board of Trustees. | ||
# of Votes | % of Votes | |
| Bettina Doulton | ||
| Affirmative | 47,400,603,662.68 | 97.08 |
| Withheld | 1,424,803,996.20 | 2.92 |
| TOTAL | 48,825,407,658.88 | 100.00 |
| Robert A. Lawrence | ||
| Affirmative | 47,280,328,204.40 | 96.84 |
| Withheld | 1,545,079,454.48 | 3.16 |
| TOTAL | 48,825,407,658.88 | 100.00 |
| Vijay C. Advani | ||
| Affirmative | 47,288,044,991.48 | 96.85 |
| Withheld | 1,537,362,667.40 | 3.15 |
| TOTAL | 48,825,407,658.88 | 100.00 |
| Thomas P. Bostick | ||
| Affirmative | 47,248,851,088.69 | 96.77 |
| Withheld | 1,576,556,570.19 | 3.23 |
| TOTAL | 48,825,407,658.88 | 100.00 |
| Donald F. Donahue | ||
| Affirmative | 47,287,004,182.74 | 96.85 |
| Withheld | 1,538,403,476.14 | 3.15 |
| TOTAL | 48,825,407,658.88 | 100.00 |
| Vicki L. Fuller | ||
| Affirmative | 47,375,183,539.48 | 97.03 |
| Withheld | 1,450,224,119.40 | 2.97 |
| TOTAL | 48,825,407,658.88 | 100.00 |
| Patricia L. Kampling | ||
| Affirmative | 47,389,656,970.86 | 97.06 |
| Withheld | 1,435,750,688.02 | 2.94 |
| TOTAL | 48,825,407,658.88 | 100.00 |
| Thomas A. Kennedy | ||
| Affirmative | 47,281,489,897.71 | 96.84 |
| Withheld | 1,543,917,761.17 | 3.16 |
| TOTAL | 48,825,407,658.88 | 100.00 |
| Oscar Munoz | ||
| Affirmative | 47,282,750,545.47 | 96.84 |
| Withheld | 1,542,657,113.41 | 3.16 |
| TOTAL | 48,825,407,658.88 | 100.00 |
| Karen B. Peetz | ||
| Affirmative | 47,356,505,980.29 | 96.99 |
| Withheld | 1,468,901,678.59 | 3.01 |
| TOTAL | 48,825,407,658.88 | 100.00 |
| David M. Thomas | ||
| Affirmative | 47,225,423,215.83 | 96.72 |
| Withheld | 1,599,984,443.05 | 3.28 |
| TOTAL | 48,825,407,658.88 | 100.00 |
| Susan Tomasky | ||
| Affirmative | 47,353,387,805.21 | 96.99 |
| Withheld | 1,472,019,853.67 | 3.01 |
| TOTAL | 48,825,407,658.88 | 100.00 |
| Michael E. Wiley | ||
| Affirmative | 47,278,279,663.75 | 96.83 |
| Withheld | 1,547,127,995.13 | 3.17 |
| TOTAL | 48,825,407,658.88 | 100.00 |
| Proposal 1 reflects trust-wide proposal and voting results. | ||
 |
(to be renamed Fidelity Advisor® Capital & Income Fund effective December 30, 2024)


Contents
| Corporate Bonds - 51.5% | |||
Principal Amount (a) (000s) | Value ($) (000s) | ||
| Convertible Bonds - 1.2% | |||
| Broadcasting - 0.6% | |||
| DISH Network Corp.: | |||
| 0% 12/15/25 | 6,054 | 5,375 | |
| 3.375% 8/15/26 | 8,600 | 7,221 | |
| 12,596 | |||
| Diversified Financial Services - 0.2% | |||
| Coinbase Global, Inc. 0.25% 4/1/30 (b) | 1,440 | 1,304 | |
| New Cotai LLC 5% 2/24/27 (c) | 1,881 | 3,702 | |
| 5,006 | |||
| Technology - 0.4% | |||
| Wolfspeed, Inc. 1.875% 12/1/29 | 19,874 | 9,897 | |
TOTAL CONVERTIBLE BONDS | 27,499 | ||
| Nonconvertible Bonds - 50.3% | |||
| Aerospace - 3.1% | |||
| ATI, Inc.: | |||
| 4.875% 10/1/29 | 845 | 800 | |
| 5.125% 10/1/31 | 750 | 708 | |
| Bombardier, Inc.: | |||
| 6% 2/15/28 (b) | 830 | 829 | |
| 7.125% 6/15/26 (b) | 415 | 419 | |
| 7.25% 7/1/31 (b) | 1,030 | 1,064 | |
| 7.875% 4/15/27 (b) | 1,956 | 1,960 | |
| 8.75% 11/15/30 (b) | 1,475 | 1,598 | |
| Kaiser Aluminum Corp. 4.625% 3/1/28 (b) | 1,575 | 1,501 | |
| Moog, Inc. 4.25% 12/15/27 (b) | 480 | 458 | |
| Rolls-Royce PLC 5.75% 10/15/27 (b) | 1,440 | 1,469 | |
| TransDigm, Inc.: | |||
| 4.625% 1/15/29 | 4,860 | 4,615 | |
| 4.875% 5/1/29 | 15,000 | 14,327 | |
| 5.5% 11/15/27 | 14,675 | 14,528 | |
| 6.375% 3/1/29 (b) | 4,505 | 4,573 | |
| 6.625% 3/1/32 (b) | 1,005 | 1,022 | |
| 6.75% 8/15/28 (b) | 8,160 | 8,344 | |
| 6.875% 12/15/30 (b) | 7,770 | 7,965 | |
| 7.125% 12/1/31 (b) | 1,950 | 2,018 | |
| Triumph Group, Inc. 9% 3/15/28 (b) | 1,147 | 1,195 | |
| VistaJet Malta Finance PLC / XO Management Holding, Inc. 9.5% 6/1/28 (b) | 1,440 | 1,415 | |
| 70,808 | |||
| Air Transportation - 1.0% | |||
| Air Canada 3.875% 8/15/26 (b) | 1,240 | 1,200 | |
| Allegiant Travel Co. 7.25% 8/15/27 (b) | 1,320 | 1,300 | |
| American Airlines, Inc.: | |||
| 7.25% 2/15/28 (b) | 3,155 | 3,207 | |
| 8.5% 5/15/29 (b) | 3,235 | 3,400 | |
| American Airlines, Inc. / AAdvantage Loyalty IP Ltd. 5.75% 4/20/29 (b) | 4,820 | 4,773 | |
| Rand Parent LLC 8.5% 2/15/30 (b) | 2,390 | 2,385 | |
| Spirit Loyalty Cayman Ltd. / Spirit IP Cayman Ltd.: | |||
| 8% 9/20/25 (b) | 1,044 | 649 | |
| 8% 9/20/25 (b) | 470 | 292 | |
| United Airlines, Inc.: | |||
| 4.375% 4/15/26 (b) | 3,965 | 3,897 | |
| 4.625% 4/15/29 (b) | 3,180 | 3,044 | |
| 24,147 | |||
| Automotive & Auto Parts - 0.7% | |||
| Adient Global Holdings Ltd. 7% 4/15/28 (b) | 960 | 976 | |
| Allison Transmission, Inc. 5.875% 6/1/29 (b) | 1,265 | 1,261 | |
| Clarios Global LP / Clarios U.S. Finance Co. 6.75% 5/15/28 (b) | 1,920 | 1,965 | |
| Dana, Inc.: | |||
| 4.25% 9/1/30 | 1,185 | 1,036 | |
| 4.5% 2/15/32 | 1,305 | 1,116 | |
| LCM Investments Holdings 8.25% 8/1/31 (b) | 1,160 | 1,211 | |
| Macquarie AirFinance Holdings: | |||
| 6.4% 3/26/29 (b) | 710 | 732 | |
| 6.5% 3/26/31 (b) | 1,085 | 1,127 | |
| 8.125% 3/30/29 (b) | 1,475 | 1,560 | |
| McLaren Finance PLC 7.5% 8/1/26 (b) | 1,130 | 1,096 | |
| Nesco Holdings II, Inc. 5.5% 4/15/29 (b) | 1,850 | 1,722 | |
| Wand NewCo 3, Inc. 7.625% 1/30/32 (b) | 1,995 | 2,062 | |
| 15,864 | |||
| Banks & Thrifts - 1.0% | |||
| Ally Financial, Inc.: | |||
| 8% 11/1/31 | 3,105 | 3,460 | |
| 8% 11/1/31 | 16,223 | 18,051 | |
| Jane Street Group LLC/JSG Finance, Inc. 4.5% 11/15/29 (b) | 1,240 | 1,173 | |
| 22,684 | |||
| Broadcasting - 1.3% | |||
| DISH Network Corp. 11.75% 11/15/27 (b) | 9,810 | 10,326 | |
| Scripps Escrow II, Inc. 3.875% 1/15/29 (b) | 360 | 279 | |
| Sirius XM Radio, Inc.: | |||
| 3.875% 9/1/31 (b) | 1,655 | 1,422 | |
| 4% 7/15/28 (b) | 1,695 | 1,584 | |
| 5% 8/1/27 (b) | 1,575 | 1,543 | |
| Univision Communications, Inc.: | |||
| 4.5% 5/1/29 (b) | 5,610 | 4,980 | |
| 7.375% 6/30/30 (b) | 6,430 | 6,173 | |
| 8.5% 7/31/31 (b) | 3,735 | 3,671 | |
| 29,978 | |||
| Building Materials - 0.5% | |||
| Advanced Drain Systems, Inc.: | |||
| 5% 9/30/27 (b) | 355 | 349 | |
| 6.375% 6/15/30 (b) | 890 | 897 | |
| Brundage-Bone Concrete Pumping Holdings, Inc. 6% 2/1/26 (b) | 835 | 831 | |
| MITER Brands Acquisition Holdco, Inc. / MIWD Borrower LLC 6.75% 4/1/32 (b) | 1,540 | 1,567 | |
| MIWD Holdco II LLC / MIWD Finance Corp. 5.5% 2/1/30 (b) | 590 | 564 | |
| Smyrna Ready Mix Concrete LLC 8.875% 11/15/31 (b) | 3,925 | 4,123 | |
| Summit Materials LLC/Summit Materials Finance Corp.: | |||
| 5.25% 1/15/29 (b) | 1,445 | 1,433 | |
| 7.25% 1/15/31 (b) | 1,480 | 1,532 | |
| 11,296 | |||
| Cable/Satellite TV - 0.3% | |||
| VZ Secured Financing BV 5% 1/15/32 (b) | 3,855 | 3,461 | |
| Ziggo BV 4.875% 1/15/30 (b) | 3,795 | 3,519 | |
| 6,980 | |||
| Capital Goods - 0.1% | |||
| ATS Corp. 4.125% 12/15/28 (b) | 1,015 | 952 | |
| Chart Industries, Inc. 7.5% 1/1/30 (b) | 2,500 | 2,600 | |
| 3,552 | |||
| Chemicals - 1.3% | |||
| Compass Minerals International, Inc. 6.75% 12/1/27 (b) | 3,850 | 3,795 | |
| Consolidated Energy Finance SA 12% 2/15/31 (b) | 3,610 | 3,521 | |
| Ingevity Corp. 3.875% 11/1/28 (b) | 1,515 | 1,394 | |
| LSB Industries, Inc. 6.25% 10/15/28 (b) | 3,360 | 3,251 | |
| NOVA Chemicals Corp. 8.5% 11/15/28 (b) | 1,325 | 1,405 | |
| Olin Corp. 5% 2/1/30 | 1,555 | 1,484 | |
| Olympus Water U.S. Holding Corp.: | |||
| 4.25% 10/1/28 (b) | 3,370 | 3,172 | |
| 7.125% 10/1/27 (b) | 1,070 | 1,086 | |
| 9.75% 11/15/28 (b) | 4,875 | 5,172 | |
| SCIH Salt Holdings, Inc. 4.875% 5/1/28 (b) | 1,035 | 991 | |
| SCIL IV LLC / SCIL U.S.A. Holdings LLC 5.375% 11/1/26 (b) | 1,985 | 1,961 | |
| Tronox, Inc. 4.625% 3/15/29 (b) | 1,705 | 1,547 | |
| W.R. Grace Holding LLC 7.375% 3/1/31 (b) | 950 | 982 | |
| 29,761 | |||
| Consumer Products - 1.3% | |||
| Angi Group LLC 3.875% 8/15/28 (b) | 750 | 679 | |
| Foundation Building Materials, Inc. 6% 3/1/29 (b) | 735 | 649 | |
| HFC Prestige Products, Inc./HFC Prestige International U.S. LLC 4.75% 1/15/29 (b) | 1,240 | 1,196 | |
| Kronos Acquisition Holdings, Inc. 8.25% 6/30/31 (b) | 2,140 | 2,119 | |
| PetSmart, Inc. / PetSmart Finance Corp.: | |||
| 4.75% 2/15/28 (b) | 2,260 | 2,148 | |
| 7.75% 2/15/29 (b) | 2,540 | 2,465 | |
| Spectrum Brands Holdings, Inc. 3.875% 3/15/31 (b) | 257 | 225 | |
| Tempur Sealy International, Inc.: | |||
| 3.875% 10/15/31 (b) | 2,230 | 1,940 | |
| 4% 4/15/29 (b) | 2,545 | 2,345 | |
| The Scotts Miracle-Gro Co. 4% 4/1/31 | 1,530 | 1,370 | |
| TKC Holdings, Inc. 6.875% 5/15/28 (b) | 10,855 | 10,687 | |
| Wayfair LLC 7.25% 10/31/29 (b) | 2,330 | 2,358 | |
| Windsor Holdings III, LLC 8.5% 6/15/30 (b) | 955 | 1,005 | |
| 29,186 | |||
| Containers - 0.5% | |||
| Crown Americas LLC/Crown Americas Capital Corp. IV 4.75% 2/1/26 | 4,780 | 4,745 | |
| Crown Americas LLC/Crown Americas Capital Corp. V 4.25% 9/30/26 | 1,210 | 1,185 | |
| Graham Packaging Co., Inc. 7.125% 8/15/28 (b) | 825 | 803 | |
| Graphic Packaging International, Inc. 3.75% 2/1/30 (b) | 1,125 | 1,029 | |
| Intelligent Packaging Ltd. Finco, Inc. 6% 9/15/28 (b) | 570 | 562 | |
| Mauser Packaging Solutions Holding Co. 7.875% 4/15/27 (b) | 1,895 | 1,947 | |
| Sealed Air Corp./Sealed Air Corp. U.S. 6.125% 2/1/28 (b) | 950 | 960 | |
| Trident TPI Holdings, Inc. 12.75% 12/31/28 (b) | 950 | 1,042 | |
| 12,273 | |||
| Diversified Financial Services - 2.0% | |||
| Broadstreet Partners, Inc. 5.875% 4/15/29 (b) | 2,115 | 2,014 | |
| Coinbase Global, Inc.: | |||
| 3.375% 10/1/28 (b) | 4,600 | 4,089 | |
| 3.625% 10/1/31 (b) | 2,715 | 2,264 | |
| Compass Group Diversified Holdings LLC: | |||
| 5% 1/15/32 (b) | 870 | 799 | |
| 5.25% 4/15/29 (b) | 2,270 | 2,182 | |
| Fortress Transportation & Infrastructure Investors LLC 7.875% 12/1/30 (b) | 1,465 | 1,543 | |
| Hightower Holding LLC 6.75% 4/15/29 (b) | 785 | 773 | |
| Icahn Enterprises LP/Icahn Enterprises Finance Corp.: | |||
| 4.375% 2/1/29 | 3,415 | 2,849 | |
| 5.25% 5/15/27 | 5,030 | 4,686 | |
| 6.25% 5/15/26 | 5,825 | 5,725 | |
| MSCI, Inc.: | |||
| 3.25% 8/15/33 (b) | 1,245 | 1,064 | |
| 4% 11/15/29 (b) | 900 | 853 | |
| OneMain Finance Corp.: | |||
| 4% 9/15/30 | 720 | 634 | |
| 5.375% 11/15/29 | 9,325 | 8,937 | |
| 6.625% 1/15/28 | 1,185 | 1,204 | |
| 7.125% 3/15/26 | 4,710 | 4,825 | |
| 7.875% 3/15/30 | 985 | 1,025 | |
| Williams Scotsman, Inc. 7.375% 10/1/31 (b) | 985 | 1,020 | |
| 46,486 | |||
| Energy - 7.5% | |||
| Antero Midstream Partners LP/Antero Midstream Finance Corp.: | |||
| 5.375% 6/15/29 (b) | 1,205 | 1,174 | |
| 5.75% 3/1/27 (b) | 2,655 | 2,650 | |
| 5.75% 1/15/28 (b) | 1,705 | 1,696 | |
| Atlantica Sustainable Infrastructure PLC 4.125% 6/15/28 (b) | 1,045 | 997 | |
| Borr IHC Ltd. / Borr Finance Ltd.: | |||
| 10% 11/15/28 (b) | 1,421 | 1,448 | |
| 10.375% 11/15/30 (b) | 478 | 489 | |
| California Resources Corp. 8.25% 6/15/29 (b) | 1,085 | 1,096 | |
| Citgo Petroleum Corp.: | |||
| 6.375% 6/15/26 (b) | 1,105 | 1,105 | |
| 7% 6/15/25 (b) | 3,035 | 3,036 | |
| 8.375% 1/15/29 (b) | 4,325 | 4,499 | |
| Civitas Resources, Inc. 8.625% 11/1/30 (b) | 1,985 | 2,085 | |
| CNX Midstream Partners LP 4.75% 4/15/30 (b) | 900 | 838 | |
| CNX Resources Corp.: | |||
| 6% 1/15/29 (b) | 690 | 684 | |
| 7.375% 1/15/31 (b) | 890 | 915 | |
| Comstock Resources, Inc.: | |||
| 5.875% 1/15/30 (b) | 4,426 | 4,044 | |
| 6.75% 3/1/29 (b) | 7,095 | 6,795 | |
| CPI CG, Inc. 10% 7/15/29 (b) | 1,070 | 1,121 | |
| CQP Holdco LP / BIP-V Chinook Holdco LLC: | |||
| 5.5% 6/15/31 (b) | 4,245 | 4,040 | |
| 7.5% 12/15/33 (b) | 2,610 | 2,761 | |
| CrownRock LP/CrownRock Finance, Inc. 5% 5/1/29 (b) | 665 | 672 | |
| CVR Energy, Inc.: | |||
| 5.75% 2/15/28 (b) | 3,170 | 2,891 | |
| 8.5% 1/15/29 (b) | 6,890 | 6,681 | |
| DCP Midstream Operating LP 8.125% 8/16/30 | 130 | 149 | |
| Delek Logistics Partners LP/Delek Logistics Finance Corp. 7.125% 6/1/28 (b) | 2,645 | 2,620 | |
| Diamond Foreign Asset Co. / Diamond Finance, LLC 8.5% 10/1/30 (b) | 985 | 1,017 | |
| DT Midstream, Inc.: | |||
| 4.125% 6/15/29 (b) | 1,215 | 1,141 | |
| 4.375% 6/15/31 (b) | 1,215 | 1,118 | |
| Energy Transfer LP: | |||
| 5.625% 5/1/27 (b) | 12,200 | 12,204 | |
| 6% 2/1/29 (b) | 8,530 | 8,663 | |
| EnLink Midstream LLC: | |||
| 5.375% 6/1/29 | 650 | 655 | |
| 6.5% 9/1/30 (b) | 2,725 | 2,870 | |
| Expand Energy Corp.: | |||
| 4.875% (c)(d) | 2,950 | 0 | |
| 5.375% 3/15/30 | 1,665 | 1,637 | |
| 5.75% (c)(d) | 1,890 | 0 | |
| 5.875% 2/1/29 (b) | 2,735 | 2,732 | |
| 6.75% 4/15/29 (b) | 1,150 | 1,163 | |
| 7% (c)(d) | 840 | 0 | |
| 8% (c)(d) | 300 | 0 | |
| 8% (c)(d) | 480 | 0 | |
| Global Partners LP/GLP Finance Corp. 8.25% 1/15/32 (b) | 1,235 | 1,260 | |
| Gran Tierra Energy, Inc. 9.5% 10/15/29 (b) | 1,250 | 1,150 | |
| Hess Midstream Operations LP: | |||
| 4.25% 2/15/30 (b) | 1,345 | 1,256 | |
| 5.125% 6/15/28 (b) | 1,570 | 1,536 | |
| 5.5% 10/15/30 (b) | 890 | 870 | |
| 5.625% 2/15/26 (b) | 2,690 | 2,684 | |
| HF Sinclair Corp.: | |||
| 5% 2/1/28 | 1,060 | 1,049 | |
| 6.375% 4/15/27 | 890 | 901 | |
| Hilcorp Energy I LP/Hilcorp Finance Co. 6.25% 11/1/28 (b) | 310 | 302 | |
| Howard Midstream Energy Partners LLC 8.875% 7/15/28 (b) | 2,400 | 2,532 | |
| Kinetik Holdings LP 5.875% 6/15/30 (b) | 1,335 | 1,325 | |
| KLX Energy Services Holdings, Inc. 11.5% 11/1/25 (b) | 2,300 | 2,226 | |
| Magnolia Oil & Gas Operating LLC/Magnolia Oil & Gas Finance Corp. 6% 8/1/26 (b) | 2,055 | 2,051 | |
| Mesquite Energy, Inc. 7.25% (b)(c)(d) | 6,264 | 0 | |
| Moss Creek Resources Holdings, Inc. 8.25% 9/1/31 (b) | 1,085 | 1,063 | |
| Nabors Industries Ltd. 7.5% 1/15/28 (b) | 1,360 | 1,294 | |
| Nabors Industries, Inc. 9.125% 1/31/30 (b) | 1,950 | 2,014 | |
| Noble Finance II LLC 8% 4/15/30 (b) | 960 | 973 | |
| Northern Oil & Gas, Inc.: | |||
| 8.125% 3/1/28 (b) | 990 | 1,000 | |
| 8.75% 6/15/31 (b) | 1,950 | 2,017 | |
| Occidental Petroleum Corp. 7.2% 3/15/29 | 545 | 586 | |
| PBF Holding Co. LLC/PBF Finance Corp.: | |||
| 6% 2/15/28 | 3,845 | 3,732 | |
| 7.875% 9/15/30 (b) | 2,930 | 2,925 | |
| Permian Resources Operating LLC 5.875% 7/1/29 (b) | 1,165 | 1,148 | |
| Seadrill Finance Ltd. 8.375% 8/1/30 (b) | 1,925 | 1,966 | |
| Sitio Royalties OP / Sitio Finance Corp. 7.875% 11/1/28 (b) | 2,460 | 2,554 | |
| SM Energy Co.: | |||
| 6.625% 1/15/27 | 850 | 850 | |
| 6.75% 9/15/26 | 845 | 847 | |
| Suburban Propane Partners LP/Suburban Energy Finance Corp. 5% 6/1/31 (b) | 1,610 | 1,477 | |
| Sunnova Energy Corp.: | |||
| 5.875% 9/1/26 (b) | 485 | 433 | |
| 11.75% 10/1/28 (b) | 2,950 | 2,399 | |
| Sunoco LP/Sunoco Finance Corp.: | |||
| 4.5% 5/15/29 | 1,320 | 1,255 | |
| 4.5% 4/30/30 | 1,710 | 1,605 | |
| 6% 4/15/27 | 4,740 | 4,745 | |
| 7% 9/15/28 (b) | 985 | 1,012 | |
| Tallgrass Energy Partners LP / Tallgrass Energy Finance Corp.: | |||
| 5.5% 1/15/28 (b) | 95 | 91 | |
| 6% 3/1/27 (b) | 950 | 943 | |
| 6% 9/1/31 (b) | 1,620 | 1,503 | |
| Talos Production, Inc.: | |||
| 9% 2/1/29 (b) | 880 | 906 | |
| 9.375% 2/1/31 (b) | 1,000 | 1,030 | |
| Targa Resources Partners LP/Targa Resources Partners Finance Corp. 4.875% 2/1/31 | 1,405 | 1,363 | |
| Teine Energy Ltd. 6.875% 4/15/29 (b) | 1,145 | 1,126 | |
| Transocean Titan Finance Ltd. 8.375% 2/1/28 (b) | 1,977 | 2,034 | |
| Transocean, Inc.: | |||
| 8% 2/1/27 (b) | 1,228 | 1,224 | |
| 8.25% 5/15/29 (b) | 775 | 779 | |
| 8.5% 5/15/31 (b) | 7,275 | 7,331 | |
| 8.75% 2/15/30 (b) | 4,004 | 4,148 | |
| Valaris Ltd. 8.375% 4/30/30 (b) | 975 | 989 | |
| Venture Global Calcasieu Pass LLC: | |||
| 3.875% 8/15/29 (b) | 1,035 | 954 | |
| 4.125% 8/15/31 (b) | 1,035 | 943 | |
| 6.25% 1/15/30 (b) | 3,835 | 3,920 | |
| Viridien 8.75% 4/1/27 (b) | 1,530 | 1,479 | |
| 173,486 | |||
| Environmental - 0.8% | |||
| Clean Harbors, Inc. 6.375% 2/1/31 (b) | 790 | 796 | |
| Darling Ingredients, Inc.: | |||
| 5.25% 4/15/27 (b) | 2,655 | 2,629 | |
| 6% 6/15/30 (b) | 2,040 | 2,026 | |
| GFL Environmental, Inc.: | |||
| 4% 8/1/28 (b) | 1,275 | 1,206 | |
| 4.75% 6/15/29 (b) | 1,625 | 1,556 | |
| 6.75% 1/15/31 (b) | 1,450 | 1,493 | |
| Madison IAQ LLC: | |||
| 4.125% 6/30/28 (b) | 1,535 | 1,457 | |
| 5.875% 6/30/29 (b) | 1,225 | 1,162 | |
| Reworld Holding Corp.: | |||
| 4.875% 12/1/29 (b) | 4,810 | 4,492 | |
| 5% 9/1/30 | 1,940 | 1,783 | |
| 18,600 | |||
| Food & Drug Retail - 0.8% | |||
| Albertsons Companies LLC/Safeway, Inc./New Albertson's, Inc./Albertson's LLC: | |||
| 3.5% 3/15/29 (b) | 4,630 | 4,278 | |
| 4.625% 1/15/27 (b) | 4,225 | 4,145 | |
| 4.875% 2/15/30 (b) | 6,100 | 5,941 | |
| Murphy Oil U.S.A., Inc. 3.75% 2/15/31 (b) | 675 | 600 | |
| Parkland Corp.: | |||
| 4.5% 10/1/29 (b) | 1,145 | 1,064 | |
| 4.625% 5/1/30 (b) | 1,735 | 1,595 | |
| 6.625% 8/15/32 (b) | 1,085 | 1,083 | |
| 18,706 | |||
| Food/Beverage/Tobacco - 1.8% | |||
| BellRing Brands, Inc. 7% 3/15/30 (b) | 2,425 | 2,524 | |
| C&S Group Enterprises LLC 5% 12/15/28 (b) | 1,110 | 919 | |
| Chobani LLC/Finance Corp., Inc. 4.625% 11/15/28 (b) | 855 | 821 | |
| Fiesta Purchaser, Inc.: | |||
| 7.875% 3/1/31 (b) | 1,895 | 1,987 | |
| 9.625% 9/15/32 (b) | 1,315 | 1,375 | |
| KeHE Distributor / Nextwave 9% 2/15/29 (b) | 12,270 | 12,705 | |
| Lamb Weston Holdings, Inc.: | |||
| 4.125% 1/31/30 (b) | 1,720 | 1,597 | |
| 4.375% 1/31/32 (b) | 860 | 788 | |
| Performance Food Group, Inc.: | |||
| 4.25% 8/1/29 (b) | 1,160 | 1,086 | |
| 5.5% 10/15/27 (b) | 1,353 | 1,342 | |
| Post Holdings, Inc.: | |||
| 4.5% 9/15/31 (b) | 6,170 | 5,617 | |
| 4.625% 4/15/30 (b) | 2,050 | 1,916 | |
| 5.5% 12/15/29 (b) | 865 | 844 | |
| 5.625% 1/15/28 (b) | 3,640 | 3,670 | |
| Simmons Foods, Inc. 4.625% 3/1/29 (b) | 1,070 | 991 | |
| Triton Water Holdings, Inc. 6.25% 4/1/29 (b) | 810 | 800 | |
| U.S. Foods, Inc.: | |||
| 4.625% 6/1/30 (b) | 1,070 | 1,015 | |
| 7.25% 1/15/32 (b) | 985 | 1,023 | |
| 41,020 | |||
| Gaming - 1.4% | |||
| Boyd Gaming Corp. 4.75% 6/15/31 (b) | 4,225 | 3,943 | |
| Churchill Downs, Inc.: | |||
| 5.75% 4/1/30 (b) | 2,330 | 2,294 | |
| 6.75% 5/1/31 (b) | 1,925 | 1,960 | |
| Fertitta Entertainment LLC / Fertitta Entertainment Finance Co., Inc.: | |||
| 4.625% 1/15/29 (b) | 4,710 | 4,397 | |
| 6.75% 1/15/30 (b) | 4,950 | 4,502 | |
| Jacobs Entertainment, Inc. 6.75% 2/15/29 (b) | 1,250 | 1,230 | |
| Light & Wonder International, Inc. 7.5% 9/1/31 (b) | 970 | 1,002 | |
| MGM Resorts International 4.75% 10/15/28 | 1,470 | 1,421 | |
| Ontario Gaming GTA LP / OTG Co. issuer, Inc. 8% 8/1/30 (b) | 2,005 | 2,061 | |
| Premier Entertainment Sub LLC: | |||
| 5.625% 9/1/29 (b) | 2,410 | 1,705 | |
| 5.875% 9/1/31 (b) | 370 | 239 | |
| Station Casinos LLC 4.625% 12/1/31 (b) | 1,300 | 1,181 | |
| Studio City Finance Ltd. 5% 1/15/29 (b) | 725 | 653 | |
| VICI Properties LP / VICI Note Co.: | |||
| 3.875% 2/15/29 (b) | 1,445 | 1,360 | |
| 4.25% 12/1/26 (b) | 3,015 | 2,958 | |
| 4.625% 12/1/29 (b) | 1,720 | 1,652 | |
| 32,558 | |||
| Healthcare - 3.5% | |||
| 180 Medical, Inc. 3.875% 10/15/29 (b) | 910 | 846 | |
| Avantor Funding, Inc. 3.875% 11/1/29 (b) | 860 | 793 | |
| Bausch + Lomb Corp. 8.375% 10/1/28 (b) | 1,970 | 2,067 | |
| Bausch Health Companies, Inc.: | |||
| 4.875% 6/1/28 (b) | 2,920 | 2,256 | |
| 5.75% 8/15/27 (b) | 2,955 | 2,439 | |
| 6.125% 2/1/27 (b) | 5,185 | 4,680 | |
| 11% 9/30/28 (b) | 845 | 778 | |
| Charles River Laboratories International, Inc.: | |||
| 3.75% 3/15/29 (b) | 1,365 | 1,251 | |
| 4% 3/15/31 (b) | 1,545 | 1,381 | |
| 4.25% 5/1/28 (b) | 485 | 461 | |
| CHS/Community Health Systems, Inc.: | |||
| 4.75% 2/15/31 (b) | 2,860 | 2,385 | |
| 5.25% 5/15/30 (b) | 2,625 | 2,291 | |
| 6% 1/15/29 (b) | 1,085 | 1,022 | |
| 6.125% 4/1/30 (b) | 2,910 | 2,278 | |
| 10.875% 1/15/32 (b) | 3,150 | 3,376 | |
| DaVita, Inc.: | |||
| 3.75% 2/15/31 (b) | 535 | 465 | |
| 4.625% 6/1/30 (b) | 4,545 | 4,184 | |
| Encompass Health Corp. 5.75% 9/15/25 | 228 | 228 | |
| Grifols SA 4.75% 10/15/28 (b) | 850 | 783 | |
| HAH Group Holding Co. LLC 9.75% 10/1/31 (b) | 1,620 | 1,651 | |
| HealthEquity, Inc. 4.5% 10/1/29 (b) | 895 | 853 | |
| Hologic, Inc. 4.625% 2/1/28 (b) | 645 | 633 | |
| IQVIA, Inc. 5% 10/15/26 (b) | 1,125 | 1,113 | |
| Jazz Securities DAC 4.375% 1/15/29 (b) | 1,635 | 1,547 | |
| Molina Healthcare, Inc.: | |||
| 3.875% 11/15/30 (b) | 1,360 | 1,231 | |
| 3.875% 5/15/32 (b) | 1,730 | 1,534 | |
| Organon & Co. / Organon Foreign Debt Co-Issuer BV: | |||
| 4.125% 4/30/28 (b) | 3,525 | 3,340 | |
| 5.125% 4/30/31 (b) | 2,410 | 2,198 | |
| Owens & Minor, Inc. 4.5% 3/31/29 (b) | 1,065 | 958 | |
| Tenet Healthcare Corp.: | |||
| 4.25% 6/1/29 | 8,360 | 7,909 | |
| 4.375% 1/15/30 | 6,245 | 5,855 | |
| 6.125% 6/15/30 | 4,600 | 4,622 | |
| 6.25% 2/1/27 | 9,945 | 9,953 | |
| 6.75% 5/15/31 | 990 | 1,012 | |
| Teva Pharmaceutical Finance Netherlands III BV: | |||
| 4.75% 5/9/27 | 865 | 841 | |
| 5.125% 5/9/29 | 865 | 840 | |
| 7.875% 9/15/29 | 960 | 1,036 | |
| 81,090 | |||
| Homebuilders/Real Estate - 1.6% | |||
| Arcosa, Inc. 4.375% 4/15/29 (b) | 1,075 | 1,014 | |
| Ashton Woods U.S.A. LLC/Ashton Woods Finance Co. 4.625% 4/1/30 (b) | 1,240 | 1,142 | |
| Brookfield Residential Properties, Inc./Brookfield Residential U.S. Corp. 4.875% 2/15/30 (b) | 1,080 | 1,004 | |
| Century Communities, Inc. 3.875% 8/15/29 (b) | 1,245 | 1,132 | |
| Greystar Real Estate Partners 7.75% 9/1/30 (b) | 860 | 901 | |
| Jones DesLauriers Insurance Management, Inc. 10.5% 12/15/30 (b) | 685 | 738 | |
| LGI Homes, Inc. 8.75% 12/15/28 (b) | 975 | 1,027 | |
| MPT Operating Partnership LP/MPT Finance Corp.: | |||
| 3.5% 3/15/31 | 1,445 | 1,023 | |
| 5% 10/15/27 | 9,710 | 8,569 | |
| Panther Escrow Issuer LLC 7.125% 6/1/31 (b) | 3,590 | 3,676 | |
| Shea Homes Ltd. Partnership/Corp. 4.75% 4/1/29 | 1,070 | 1,015 | |
| Taylor Morrison Communities, Inc./Monarch Communities, Inc.: | |||
| 5.125% 8/1/30 (b) | 1,416 | 1,369 | |
| 5.75% 1/15/28 (b) | 2,100 | 2,100 | |
| 5.875% 6/15/27 (b) | 1,490 | 1,496 | |
| TopBuild Corp. 3.625% 3/15/29 (b) | 755 | 692 | |
| TRI Pointe Homes, Inc. 5.7% 6/15/28 | 1,965 | 1,953 | |
| Uniti Group LP/Uniti Group Finance, Inc./CSL Capital LLC: | |||
| 4.75% 4/15/28 (b) | 4,258 | 3,914 | |
| 6.5% 2/15/29 (b) | 2,070 | 1,782 | |
| 10.5% 2/15/28 (b) | 1,265 | 1,347 | |
| Weekley Homes LLC/Weekley Finance Corp. 4.875% 9/15/28 (b) | 675 | 645 | |
| 36,539 | |||
| Hotels - 0.4% | |||
| Carnival Holdings (Bermuda) Ltd. 10.375% 5/1/28 (b) | 2,825 | 3,033 | |
| Hilton Domestic Operating Co., Inc.: | |||
| 3.75% 5/1/29 (b) | 725 | 675 | |
| 4% 5/1/31 (b) | 1,085 | 988 | |
| 4.875% 1/15/30 | 1,180 | 1,143 | |
| 5.875% 4/1/29 (b) | 1,445 | 1,466 | |
| 6.125% 4/1/32 (b) | 2,020 | 2,040 | |
| 9,345 | |||
| Insurance - 2.1% | |||
| Acrisure LLC / Acrisure Finance, Inc.: | |||
| 6% 8/1/29 (b) | 6,240 | 5,905 | |
| 7.5% 11/6/30 (b) | 1,055 | 1,073 | |
| 8.25% 2/1/29 (b) | 4,685 | 4,761 | |
| Alliant Holdings Intermediate LLC/Alliant Holdings Co.-Issuer: | |||
| 4.25% 10/15/27 (b) | 1,470 | 1,394 | |
| 5.875% 11/1/29 (b) | 1,290 | 1,218 | |
| 6.75% 10/15/27 (b) | 7,995 | 7,965 | |
| 6.75% 4/15/28 (b) | 5,690 | 5,717 | |
| 7% 1/15/31 (b) | 1,680 | 1,691 | |
| AmWINS Group, Inc. 4.875% 6/30/29 (b) | 1,205 | 1,134 | |
| AssuredPartners, Inc.: | |||
| 5.625% 1/15/29 (b) | 1,140 | 1,079 | |
| 7.5% 2/15/32 (b) | 1,005 | 1,012 | |
| HUB International Ltd.: | |||
| 5.625% 12/1/29 (b) | 5,635 | 5,457 | |
| 7.25% 6/15/30 (b) | 6,265 | 6,474 | |
| 7.375% 1/31/32 (b) | 2,495 | 2,545 | |
| MGIC Investment Corp. 5.25% 8/15/28 | 1,040 | 1,025 | |
| USI, Inc. 7.5% 1/15/32 (b) | 1,300 | 1,326 | |
| 49,776 | |||
| Leisure - 1.1% | |||
| Boyne U.S.A., Inc. 4.75% 5/15/29 (b) | 840 | 801 | |
| Carnival Corp.: | |||
| 4% 8/1/28 (b) | 9,210 | 8,779 | |
| 7% 8/15/29 (b) | 990 | 1,035 | |
| 7.625% 3/1/26 (b) | 2,775 | 2,794 | |
| NCL Corp. Ltd. 5.875% 2/15/27 (b) | 1,770 | 1,768 | |
| Royal Caribbean Cruises Ltd.: | |||
| 5.375% 7/15/27 (b) | 1,295 | 1,293 | |
| 6.25% 3/15/32 (b) | 2,030 | 2,070 | |
| SeaWorld Parks & Entertainment, Inc. 5.25% 8/15/29 (b) | 1,665 | 1,599 | |
| Viking Ocean Cruises Ship VII Ltd. 5.625% 2/15/29 (b) | 625 | 616 | |
| Voc Escrow Ltd. 5% 2/15/28 (b) | 5,510 | 5,356 | |
| 26,111 | |||
| Metals/Mining - 1.3% | |||
| Alcoa Nederland Holding BV: | |||
| 4.125% 3/31/29 (b) | 1,980 | 1,862 | |
| 7.125% 3/15/31 (b) | 835 | 871 | |
| Alpha Natural Resources, Inc. 9.75% (c)(d) | 1,770 | 0 | |
| Arsenal AIC Parent LLC 8% 10/1/30 (b) | 1,145 | 1,204 | |
| Cleveland-Cliffs, Inc.: | |||
| 4.625% 3/1/29 (b) | 3,200 | 2,998 | |
| 4.875% 3/1/31 (b) | 1,480 | 1,366 | |
| 6.75% 4/15/30 (b) | 2,000 | 1,998 | |
| Eldorado Gold Corp. 6.25% 9/1/29 (b) | 1,895 | 1,869 | |
| ERO Copper Corp. 6.5% 2/15/30 (b) | 1,320 | 1,297 | |
| First Quantum Minerals Ltd.: | |||
| 8.625% 6/1/31 (b) | 5,740 | 5,783 | |
| 9.375% 3/1/29 (b) | 2,390 | 2,541 | |
| FMG Resources August 2006 Pty Ltd. 4.375% 4/1/31 (b) | 1,145 | 1,042 | |
| HudBay Minerals, Inc. 4.5% 4/1/26 (b) | 905 | 894 | |
| Mineral Resources Ltd.: | |||
| 8% 11/1/27 (b) | 3,895 | 3,994 | |
| 8.5% 5/1/30 (b) | 660 | 679 | |
| 9.25% 10/1/28 (b) | 1,745 | 1,837 | |
| 30,235 | |||
| Paper - 0.6% | |||
| Ardagh Metal Packaging Finance U.S.A. LLC/Ardagh Metal Packaging Finance PLC: | |||
| 3.25% 9/1/28 (b) | 760 | 685 | |
| 4% 9/1/29 (b) | 1,515 | 1,329 | |
| 6% 6/15/27 (b) | 890 | 887 | |
| Cascades, Inc.: | |||
| 5.125% 1/15/26 (b) | 790 | 786 | |
| 5.375% 1/15/28 (b) | 790 | 777 | |
| Clydesdale Acquisition Holdings, Inc.: | |||
| 6.625% 4/15/29 (b) | 1,060 | 1,065 | |
| 8.75% 4/15/30 (b) | 7,325 | 7,439 | |
| Mercer International, Inc. 5.125% 2/1/29 | 1,920 | 1,657 | |
| 14,625 | |||
| Restaurants - 0.7% | |||
| 1011778 BC Unlimited Liability Co./New Red Finance, Inc.: | |||
| 3.875% 1/15/28 (b) | 1,630 | 1,554 | |
| 4% 10/15/30 (b) | 5,185 | 4,683 | |
| 4.375% 1/15/28 (b) | 5,490 | 5,280 | |
| Bloomin Brands, Inc. / OSI Restaurant Partners LLC 5.125% 4/15/29 (b) | 715 | 663 | |
| Garden SpinCo Corp. 8.625% 7/20/30 (b) | 775 | 839 | |
| Papa John's International, Inc. 3.875% 9/15/29 (b) | 765 | 698 | |
| Yum! Brands, Inc. 4.625% 1/31/32 | 1,530 | 1,434 | |
| 15,151 | |||
| Services - 3.2% | |||
| Adtalem Global Education, Inc. 5.5% 3/1/28 (b) | 1,335 | 1,307 | |
| Artera Services LLC 8.5% 2/15/31 (b) | 11,195 | 11,095 | |
| ASGN, Inc. 4.625% 5/15/28 (b) | 1,350 | 1,289 | |
| Atlas Luxco 4 SARL / Allied Universal Holdco LLC / Allied Universal Finance Corp. 4.625% 6/1/28 (b) | 846 | 792 | |
| Brand Industrial Services, Inc. 10.375% 8/1/30 (b) | 7,245 | 7,681 | |
| Camelot Finance SA 4.5% 11/1/26 (b) | 1,515 | 1,488 | |
| CoreCivic, Inc. 8.25% 4/15/29 | 5,765 | 6,054 | |
| Fair Isaac Corp. 4% 6/15/28 (b) | 1,530 | 1,453 | |
| H&E Equipment Services, Inc. 3.875% 12/15/28 (b) | 2,415 | 2,230 | |
| Hertz Corp.: | |||
| 4.625% 12/1/26 (b) | 905 | 684 | |
| 5% 12/1/29 (b) | 1,085 | 693 | |
| 5.5% (b)(c)(d) | 1,505 | 83 | |
| 6% (b)(c)(d) | 1,385 | 235 | |
| 6.25% (c)(d) | 1,605 | 92 | |
| 7.125% (b)(c)(d) | 1,430 | 265 | |
| 12.625% 7/15/29 (b) | 515 | 546 | |
| Iron Mountain, Inc.: | |||
| 4.5% 2/15/31 (b) | 2,975 | 2,762 | |
| 4.875% 9/15/29 (b) | 3,800 | 3,660 | |
| Neptune BidCo U.S., Inc. 9.29% 4/15/29 (b) | 7,590 | 7,059 | |
| Service Corp. International 4% 5/15/31 | 1,610 | 1,452 | |
| The GEO Group, Inc.: | |||
| 8.625% 4/15/29 | 3,605 | 3,771 | |
| 10.25% 4/15/31 | 2,575 | 2,760 | |
| TriNet Group, Inc. 3.5% 3/1/29 (b) | 1,135 | 1,032 | |
| Uber Technologies, Inc.: | |||
| 4.5% 8/15/29 (b) | 3,730 | 3,620 | |
| 6.25% 1/15/28 (b) | 1,225 | 1,237 | |
| 7.5% 9/15/27 (b) | 2,655 | 2,704 | |
| 8% 11/1/26 (b) | 7,110 | 7,110 | |
| WASH Multifamily Acquisition, Inc. 5.75% 4/15/26 (b) | 1,285 | 1,282 | |
| 74,436 | |||
| Steel - 0.2% | |||
| ATI, Inc. 7.25% 8/15/30 | 975 | 1,010 | |
| Commercial Metals Co. 3.875% 2/15/31 | 780 | 700 | |
| Roller Bearing Co. of America, Inc. 4.375% 10/15/29 (b) | 610 | 573 | |
| Vallourec SA 7.5% 4/15/32 (b) | 2,115 | 2,215 | |
| 4,498 | |||
| Super Retail - 1.9% | |||
| Asbury Automotive Group, Inc.: | |||
| 4.5% 3/1/28 | 492 | 475 | |
| 4.625% 11/15/29 (b) | 6,520 | 6,105 | |
| 4.75% 3/1/30 | 489 | 460 | |
| 5% 2/15/32 (b) | 1,535 | 1,414 | |
| Bath & Body Works, Inc.: | |||
| 6.625% 10/1/30 (b) | 4,585 | 4,591 | |
| 6.75% 7/1/36 | 1,340 | 1,347 | |
| 7.5% 6/15/29 | 1,135 | 1,169 | |
| EG Global Finance PLC 12% 11/30/28 (b) | 22,425 | 24,934 | |
| LBM Acquisition LLC 6.25% 1/15/29 (b) | 2,880 | 2,656 | |
| 43,151 | |||
| Technology - 3.7% | |||
| Acuris Finance U.S. 5% 5/1/28 (b) | 6,410 | 5,785 | |
| Block, Inc. 3.5% 6/1/31 | 1,615 | 1,432 | |
| CA Magnum Holdings 5.375% 10/31/26 (b) | 690 | 677 | |
| Clarivate Science Holdings Corp.: | |||
| 3.875% 7/1/28 (b) | 1,440 | 1,359 | |
| 4.875% 7/1/29 (b) | 1,360 | 1,285 | |
| Cloud Software Group, Inc. 6.5% 3/31/29 (b) | 16,555 | 16,167 | |
| Coherent Corp. 5% 12/15/29 (b) | 1,350 | 1,295 | |
| Crowdstrike Holdings, Inc. 3% 2/15/29 | 1,130 | 1,028 | |
| Elastic NV 4.125% 7/15/29 (b) | 3,785 | 3,503 | |
| Go Daddy Operating Co. LLC / GD Finance Co., Inc.: | |||
| 3.5% 3/1/29 (b) | 6,860 | 6,331 | |
| 5.25% 12/1/27 (b) | 1,495 | 1,478 | |
| ION Trading Technologies Ltd.: | |||
| 5.75% 5/15/28 (b) | 1,605 | 1,455 | |
| 9.5% 5/30/29 (b) | 1,580 | 1,605 | |
| Iron Mountain Information Management Services, Inc. 5% 7/15/32 (b) | 1,295 | 1,221 | |
| Lightning Power LLC 7.25% 8/15/32 (b) | 2,145 | 2,232 | |
| NCR Atleos Corp. 9.5% 4/1/29 (b) | 1,480 | 1,629 | |
| NCR Voyix Corp.: | |||
| 5% 10/1/28 (b) | 750 | 721 | |
| 5.125% 4/15/29 (b) | 1,081 | 1,033 | |
| ON Semiconductor Corp. 3.875% 9/1/28 (b) | 5,500 | 5,157 | |
| Open Text Corp. 6.9% 12/1/27 (b) | 1,685 | 1,752 | |
| Open Text Holdings, Inc.: | |||
| 4.125% 2/15/30 (b) | 790 | 725 | |
| 4.125% 12/1/31 (b) | 780 | 701 | |
| PTC, Inc.: | |||
| 3.625% 2/15/25 (b) | 925 | 920 | |
| 4% 2/15/28 (b) | 915 | 875 | |
| Roblox Corp. 3.875% 5/1/30 (b) | 3,295 | 2,982 | |
| Seagate HDD Cayman: | |||
| 8.25% 12/15/29 | 3,160 | 3,400 | |
| 8.5% 7/15/31 | 2,045 | 2,205 | |
| Sensata Technologies BV 4% 4/15/29 (b) | 1,530 | 1,431 | |
| Synaptics, Inc. 4% 6/15/29 (b) | 900 | 826 | |
| TTM Technologies, Inc. 4% 3/1/29 (b) | 1,135 | 1,061 | |
| Twilio, Inc.: | |||
| 3.625% 3/15/29 | 6,425 | 5,917 | |
| 3.875% 3/15/31 | 1,340 | 1,209 | |
| UKG, Inc. 6.875% 2/1/31 (b) | 1,505 | 1,542 | |
| Unisys Corp. 6.875% 11/1/27 (b) | 830 | 811 | |
| Wolfspeed, Inc. 4.2917% 6/23/30 pay-in-kind (b)(c)(e)(f) | 4,225 | 4,056 | |
| 85,806 | |||
| Telecommunications - 2.2% | |||
| Altice Financing SA: | |||
| 5% 1/15/28 (b) | 1,580 | 1,336 | |
| 5.75% 8/15/29 (b) | 4,975 | 4,080 | |
| Altice France SA: | |||
| 5.125% 1/15/29 (b) | 510 | 382 | |
| 5.125% 7/15/29 (b) | 15,635 | 11,694 | |
| 5.5% 1/15/28 (b) | 3,090 | 2,398 | |
| 5.5% 10/15/29 (b) | 15,395 | 11,527 | |
| C&W Senior Finance Ltd. 6.875% 9/15/27 (b) | 3,692 | 3,655 | |
| Frontier Communications Holdings LLC: | |||
| 5% 5/1/28 (b) | 2,830 | 2,782 | |
| 5.875% 10/15/27 (b) | 1,375 | 1,372 | |
| Millicom International Cellular SA 4.5% 4/27/31 (b) | 235 | 211 | |
| SBA Communications Corp.: | |||
| 3.125% 2/1/29 | 1,695 | 1,543 | |
| 3.875% 2/15/27 | 6,375 | 6,170 | |
| Uniti Group LP/Uniti Fiber Holdings, Inc./CSL Capital LLC 6% 1/15/30 (b) | 1,120 | 938 | |
| VMED O2 UK Financing I PLC 4.75% 7/15/31 (b) | 2,875 | 2,490 | |
| 50,578 | |||
| Textiles/Apparel - 0.1% | |||
| Crocs, Inc.: | |||
| 4.125% 8/15/31 (b) | 825 | 723 | |
| 4.25% 3/15/29 (b) | 1,110 | 1,018 | |
| Kontoor Brands, Inc. 4.125% 11/15/29 (b) | 760 | 708 | |
| 2,449 | |||
| Transportation Ex Air/Rail - 0.2% | |||
| Seaspan Corp. 5.5% 8/1/29 (b) | 1,240 | 1,180 | |
| XPO, Inc.: | |||
| 6.25% 6/1/28 (b) | 960 | 975 | |
| 7.125% 2/1/32 (b) | 1,470 | 1,527 | |
| 3,682 | |||
| Utilities - 2.1% | |||
| Clearway Energy Operating LLC: | |||
| 3.75% 2/15/31 (b) | 1,705 | 1,522 | |
| 3.75% 1/15/32 (b) | 850 | 753 | |
| 4.75% 3/15/28 (b) | 970 | 941 | |
| NextEra Energy Partners LP 7.25% 1/15/29 (b) | 980 | 1,008 | |
| NRG Energy, Inc.: | |||
| 3.375% 2/15/29 (b) | 665 | 606 | |
| 3.625% 2/15/31 (b) | 1,320 | 1,169 | |
| 3.875% 2/15/32 (b) | 171 | 152 | |
| 5.75% 1/15/28 | 2,765 | 2,766 | |
| 6% 2/1/33 (b) | 760 | 756 | |
| 6.25% 11/1/34 (b) | 910 | 909 | |
| Pacific Gas & Electric Co.: | |||
| 3.45% 7/1/25 | 400 | 396 | |
| 3.75% 7/1/28 | 400 | 384 | |
| 3.95% 12/1/47 | 885 | 666 | |
| 4% 12/1/46 | 2,184 | 1,665 | |
| PG&E Corp.: | |||
| 5% 7/1/28 | 10,140 | 9,890 | |
| 5.25% 7/1/30 | 1,150 | 1,121 | |
| Pike Corp.: | |||
| 5.5% 9/1/28 (b) | 5,980 | 5,859 | |
| 8.625% 1/31/31 (b) | 2,445 | 2,598 | |
| Vistra Operations Co. LLC: | |||
| 4.375% 5/1/29 (b) | 3,105 | 2,956 | |
| 5% 7/31/27 (b) | 3,565 | 3,518 | |
| 5.5% 9/1/26 (b) | 1,822 | 1,817 | |
| 5.625% 2/15/27 (b) | 4,435 | 4,424 | |
| 7.75% 10/15/31 (b) | 1,965 | 2,076 | |
| 47,952 | |||
TOTAL NONCONVERTIBLE BONDS | 1,162,809 | ||
| TOTAL CORPORATE BONDS (Cost $1,210,722) | 1,190,308 | ||
| Asset-Backed Securities - 0.2% | |||
Principal Amount (a) (000s) | Value ($) (000s) | ||
| Agl Clo 5 Ltd. Series 2024-5A Class ERR, CME Term SOFR 3 Month Index + 6.350% 10.9674% 7/20/34 (b)(e)(g) | 133 | 133 | |
| Ares Loan Funding Vii Ltd. Series 2024-ALF7 Class E, CME Term SOFR 3 Month Index + 6.250% 10.7901% 10/22/37 (b)(e)(g) | 207 | 210 | |
| Birch Grove Clo 5 LLC Series 2024-5A Class ER, CME Term SOFR 3 Month Index + 6.750% 11.5989% 10/20/37 (b)(e)(g) | 162 | 164 | |
| Carlyle U.S. Clo 2024-6 Ltd. Series 2024-6A Class E, CME Term SOFR 3 Month Index + 5.750% 0% 10/25/37 (b)(e)(g)(h) | 194 | 194 | |
| Croton Pk Clo Ltd. CME Term SOFR 3 Month Index + 5.550% 10.1997% 10/15/36 (b)(e)(g) | 926 | 936 | |
| Golub Capital Partners Clo 76 B Lt Series 2024-76A Class E, CME Term SOFR 3 Month Index + 5.750% 10.4919% 10/25/37 (b)(e)(g) | 349 | 351 | |
| Magnetite Xxix Ltd. Series 2024-29A Class ER, CME Term SOFR 3 Month Index + 6.000% 11.2417% 7/15/37 (b)(e)(g) | 165 | 167 | |
| Midocean Credit Clo Xvi Series 2024-16A Class E, CME Term SOFR 3 Month Index + 6.250% 6.25% 10/20/37 (b)(e)(g)(h) | 192 | 192 | |
| Ocp Clo 2017-14 Ltd. Series 2024-14A Class ER, CME Term SOFR 3 Month Index + 6.550% 11.2908% 7/20/37 (b)(e)(g) | 230 | 233 | |
| Orchard Park Clo Ltd. Series 2024-1A Class E, CME Term SOFR 3 Month Index + 5.600% 10.2529% 10/20/37 (b)(e)(g) | 363 | 368 | |
| Palmer Square Ln Funding 2024-2 Lt Series 2024-2A Class D, CME Term SOFR 3 Month Index + 4.700% 6.2% 1/15/33 (b)(e)(g)(h) | 428 | 428 | |
| Rr 31 Ltd. Series 2024-31A Class D, CME Term SOFR 3 Month Index + 6.000% 10.5928% 10/15/39 (b)(e)(g) | 344 | 345 | |
| TOTAL ASSET-BACKED SECURITIES (Cost $3,693) | 3,721 | ||
| Common Stocks - 20.1% | |||
| Shares | Value ($) (000s) | ||
| Aerospace - 0.1% | |||
| TransDigm Group, Inc. | 2,100 | 2,735 | |
| Air Transportation - 0.1% | |||
| Delta Air Lines, Inc. | 23,450 | 1,342 | |
| Automotive & Auto Parts - 0.5% | |||
| Allison Transmission Holdings, Inc. | 27,300 | 2,917 | |
| BYD Co. Ltd. (H Shares) | 242,500 | 8,759 | |
| UC Holdings, Inc. (c)(i) | 29,835 | 10 | |
TOTAL AUTOMOTIVE & AUTO PARTS | 11,686 | ||
| Banks & Thrifts - 0.2% | |||
| Blue Owl Capital, Inc. Class A | 199,700 | 4,465 | |
| Mr. Cooper Group, Inc. (i) | 1,504 | 133 | |
TOTAL BANKS & THRIFTS | 4,598 | ||
| Building Materials - 1.3% | |||
| Builders FirstSource, Inc. (i) | 14,100 | 2,417 | |
| Carlisle Companies, Inc. | 16,200 | 6,840 | |
| Eagle Materials, Inc. | 23,600 | 6,737 | |
| EMCOR Group, Inc. | 16,200 | 7,226 | |
| Fortune Brands Innovations, Inc. | 52,700 | 4,391 | |
| Martin Marietta Materials, Inc. | 4,100 | 2,429 | |
TOTAL BUILDING MATERIALS | 30,040 | ||
| Capital Goods - 0.5% | |||
| Deere & Co. | 2,400 | 971 | |
| Parker Hannifin Corp. | 10,300 | 6,531 | |
| Trane Technologies PLC | 12,300 | 4,553 | |
TOTAL CAPITAL GOODS | 12,055 | ||
| Chemicals - 0.1% | |||
| The Chemours Co. LLC | 138,100 | 2,508 | |
| Westlake Corp. | 5,100 | 673 | |
TOTAL CHEMICALS | 3,181 | ||
| Consumer Products - 0.1% | |||
| elf Beauty, Inc. (i) | 18,300 | 1,926 | |
| Containers - 0.2% | |||
| Graphic Packaging Holding Co. | 120,900 | 3,417 | |
| Diversified Financial Services - 1.7% | |||
| Apollo Global Management, Inc. | 108,200 | 15,501 | |
| Ares Management Corp. Class A, | 25,400 | 4,259 | |
| Carnelian Point Holdings LP warrants (c)(i) | 118 | 0 | |
| Coinbase Global, Inc. Class A (i) | 15,900 | 2,850 | |
| MasterCard, Inc. Class A | 16,000 | 7,993 | |
| Moody's Corp. | 5,600 | 2,543 | |
| OneMain Holdings, Inc. | 97,000 | 4,818 | |
TOTAL DIVERSIFIED FINANCIAL SERVICES | 37,964 | ||
| Energy - 1.0% | |||
| California Resources Corp. | 2,670 | 139 | |
| Cheniere Energy, Inc. | 24,600 | 4,708 | |
| Energy Transfer LP | 223,800 | 3,688 | |
| EP Energy Corp. (c)(i) | 147,125 | 188 | |
| Forbes Energy Services Ltd. (c)(i) | 65,062 | 0 | |
| Mesquite Energy, Inc. (c)(i) | 90,382 | 7,633 | |
| Noble Corp. PLC | 1,410 | 45 | |
| PureWest Energy (c)(i) | 3,289 | 1 | |
| South Bow Corp. | 165,700 | 4,138 | |
| Superior Energy Services, Inc. Class A (c) | 17,671 | 1,078 | |
| Tidewater, Inc. warrants 11/14/42 (i) | 12,651 | 836 | |
TOTAL ENERGY | 22,454 | ||
| Entertainment/Film - 0.0% | |||
| New Cotai LLC/New Cotai Capital Corp. (c)(i)(j) | 1,458,195 | 904 | |
| Food & Drug Retail - 0.1% | |||
| Northeast Grocery, Inc. (c)(i)(j) | 339,746 | 1,702 | |
| Southeastern Grocers, Inc. rights (c)(i) | 250,623 | 162 | |
TOTAL FOOD & DRUG RETAIL | 1,864 | ||
| Food/Beverage/Tobacco - 0.3% | |||
| Celsius Holdings, Inc. (i)(k) | 39,200 | 1,179 | |
| U.S. Foods Holding Corp. (i) | 109,000 | 6,720 | |
TOTAL FOOD/BEVERAGE/TOBACCO | 7,899 | ||
| Gaming - 0.2% | |||
| Boyd Gaming Corp. | 74,300 | 5,148 | |
| Studio City International Holdings Ltd.: | |||
| ADR (b)(i) | 32,338 | 203 | |
| (NYSE) ADR (i) | 35,600 | 224 | |
TOTAL GAMING | 5,575 | ||
| Healthcare - 0.2% | |||
| Cano Health, Inc. warrants (c)(i) | 1,505 | 6 | |
| DaVita, Inc. (i) | 15,600 | 2,181 | |
| Tenet Healthcare Corp. (i) | 15,300 | 2,372 | |
TOTAL HEALTHCARE | 4,559 | ||
| Homebuilders/Real Estate - 1.3% | |||
| Arthur J. Gallagher & Co. | 34,500 | 9,701 | |
| Comfort Systems U.S.A., Inc. | 25,900 | 10,128 | |
| TopBuild Corp. (i) | 21,700 | 7,668 | |
| Willscot Holdings Corp. (i) | 97,300 | 3,225 | |
TOTAL HOMEBUILDERS/REAL ESTATE | 30,722 | ||
| Leisure - 0.0% | |||
| Viking Holdings Ltd. | 6,000 | 236 | |
| Metals/Mining - 0.0% | |||
| Warrior Metropolitan Coal, Inc. | 692 | 44 | |
| Restaurants - 0.1% | |||
| Domino's Pizza, Inc. | 4,900 | 2,027 | |
| Services - 0.6% | |||
| Airbnb, Inc. Class A (i) | 35,700 | 4,812 | |
| Visa, Inc. Class A | 30,800 | 8,927 | |
TOTAL SERVICES | 13,739 | ||
| Super Retail - 0.9% | |||
| Amazon.com, Inc. (i) | 43,500 | 8,108 | |
| Arena Brands Holding Corp. Class B (c)(i)(j) | 42,253 | 712 | |
| Booking Holdings, Inc. | 800 | 3,741 | |
| Dick's Sporting Goods, Inc. | 21,300 | 4,169 | |
| Williams-Sonoma, Inc. | 22,600 | 3,031 | |
TOTAL SUPER RETAIL | 19,761 | ||
| Technology - 8.5% | |||
| Adobe, Inc. (i) | 13,400 | 6,406 | |
| Alphabet, Inc. Class A | 39,600 | 6,776 | |
| Arista Networks, Inc. (i) | 15,600 | 6,028 | |
| ASML Holding NV (depository receipt) | 3,400 | 2,287 | |
| Autodesk, Inc. (i) | 12,700 | 3,604 | |
| Block, Inc. Class A (i) | 64,100 | 4,636 | |
| Dell Technologies, Inc. Class C | 25,300 | 3,128 | |
| Eaton Corp. PLC | 27,200 | 9,019 | |
| Fiserv, Inc. (i) | 27,500 | 5,442 | |
| Intuit, Inc. | 5,100 | 3,113 | |
| KLA Corp. | 7,600 | 5,063 | |
| Lam Research Corp. | 98,000 | 7,286 | |
| Marvell Technology, Inc. | 45,200 | 3,621 | |
| Meta Platforms, Inc. Class A | 41,700 | 23,668 | |
| Micron Technology, Inc. | 29,400 | 2,930 | |
| Microsoft Corp. | 31,000 | 12,597 | |
| MKS Instruments, Inc. | 27,200 | 2,702 | |
| Monday.com Ltd. (i) | 25,700 | 7,552 | |
| Nextracker, Inc. Class A (i) | 149,800 | 5,965 | |
| nVent Electric PLC | 51,800 | 3,863 | |
| NVIDIA Corp. | 230,000 | 30,535 | |
| NXP Semiconductors NV | 7,900 | 1,853 | |
| ON Semiconductor Corp. (i) | 113,260 | 7,984 | |
| Oracle Corp. | 26,600 | 4,465 | |
| Pinterest, Inc. Class A (i) | 176,000 | 5,595 | |
| Salesforce, Inc. | 18,200 | 5,303 | |
| Taiwan Semiconductor Manufacturing Co. Ltd. sponsored ADR | 41,200 | 7,850 | |
| Vertiv Holdings Co. | 67,400 | 7,366 | |
TOTAL TECHNOLOGY | 196,637 | ||
| Telecommunications - 0.3% | |||
| EchoStar Corp. Class A (i) | 126,700 | 3,175 | |
| GTT Communications, Inc. (c)(i) | 11,856 | 641 | |
| Palo Alto Networks, Inc. (i) | 8,800 | 3,171 | |
TOTAL TELECOMMUNICATIONS | 6,987 | ||
| Textiles/Apparel - 0.3% | |||
| Crocs, Inc. (i) | 49,600 | 5,348 | |
| LVMH Moet Hennessy Louis Vuitton SE | 1,900 | 1,265 | |
TOTAL TEXTILES/APPAREL | 6,613 | ||
| Utilities - 1.5% | |||
| Constellation Energy Corp. | 43,200 | 11,360 | |
| Core & Main, Inc. Class A (i) | 59,500 | 2,635 | |
| PG&E Corp. | 341,179 | 6,899 | |
| Vistra Corp. | 110,700 | 13,833 | |
TOTAL UTILITIES | 34,727 | ||
| TOTAL COMMON STOCKS (Cost $336,456) | 463,692 | ||
| Bank Loan Obligations - 10.1% | |||
Principal Amount (a) (000s) | Value ($) (000s) | ||
| Aerospace - 0.1% | |||
| TransDigm, Inc. Tranche L 1LN, term loan CME Term SOFR 1 Month Index + 2.500% 7.3196% 1/20/32 (e)(g)(l) | 1,835 | 1,836 | |
| Air Transportation - 0.0% | |||
| SkyMiles IP Ltd. Tranche B 1LN, term loan CME Term SOFR 3 Month Index + 3.750% 8.3674% 10/20/27 (e)(g)(l) | 171 | 174 | |
| United Airlines, Inc. Tranche 1LN, term loan CME Term SOFR 3 Month Index + 2.750% 7.3848% 2/24/31 (e)(g)(l) | 453 | 453 | |
TOTAL AIR TRANSPORTATION | 627 | ||
| Automotive & Auto Parts - 0.1% | |||
| Belron Finance 2019 LLC Tranche B 1LN, term loan CME Term SOFR 1 Month Index + 2.750% 7.5359% 10/1/31 (e)(g)(l) | 840 | 843 | |
| Clarios Global LP Tranche B 1LN, term loan CME Term SOFR 1 Month Index + 2.500% 7.1852% 5/6/30 (e)(g)(l) | 429 | 429 | |
| Wand NewCo 3, Inc. Tranche B 1LN, term loan CME Term SOFR 1 Month Index + 3.250% 7.9052% 1/30/31 (e)(g)(l) | 369 | 369 | |
TOTAL AUTOMOTIVE & AUTO PARTS | 1,641 | ||
| Banks & Thrifts - 0.1% | |||
| Citadel Securities LP Tranche B 1LN, term loan CME Term SOFR 1 Month Index + 2.250% 7.0954% 7/29/30 (e)(g)(l) | 1,197 | 1,197 | |
| Broadcasting - 0.1% | |||
| Diamond Sports Group LLC 1LN, term loan CME Term SOFR 1 Month Index + 8.000% 14.9441% 5/25/26 (e)(g)(l) | 397 | 342 | |
| Univision Communications, Inc.: | |||
| 1LN, term loan CME Term SOFR 3 Month Index + 4.250% 8.8537% 6/24/29 (e)(g)(l) | 112 | 111 | |
| Tranche B 1LN, term loan CME Term SOFR 1 Month Index + 3.250% 8.0496% 1/31/29 (e)(g)(l) | 980 | 964 | |
TOTAL BROADCASTING | 1,417 | ||
| Building Materials - 0.1% | |||
| Hunter Douglas, Inc. Tranche B 1LN, term loan CME Term SOFR 3 Month Index + 3.500% 8.5713% 2/25/29 (e)(g)(l) | 3,270 | 3,254 | |
| MIWD Holdco II LLC Tranche B2, term loan CME Term SOFR 1 Month Index + 3.500% 7.6852% 3/28/31 (e)(g)(l) | 130 | 130 | |
TOTAL BUILDING MATERIALS | 3,384 | ||
| Chemicals - 0.6% | |||
| Consolidated Energy Finance SA Tranche B 1LN, term loan CME Term SOFR 1 Month Index + 4.500% 9.5572% 11/15/30 (e)(g)(l) | 2,000 | 1,881 | |
| Discovery Purchaser Corp. 1LN, term loan CME Term SOFR 3 Month Index + 4.370% 8.9647% 10/4/29 (e)(g)(l) | 8,988 | 8,971 | |
| Olympus Water U.S. Holding Corp. Tranche B 1LN, term loan CME Term SOFR 3 Month Index + 3.500% 8.1037% 6/23/31 (e)(g)(l) | 469 | 469 | |
| W.R. Grace Holding LLC Tranche B 1LN, term loan CME Term SOFR 3 Month Index + 3.750% 7.8537% 9/22/28 (e)(g)(l) | 2,334 | 2,337 | |
TOTAL CHEMICALS | 13,658 | ||
| Consumer Products - 0.2% | |||
| Kronos Acquisition Holdings, Inc. Tranche B 1LN, term loan CME Term SOFR 1 Month Index + 4.000% 8.584% 6/27/31 (e)(g)(l) | 2,483 | 2,329 | |
| TKC Holdings, Inc. 1LN, term loan CME Term SOFR 1 Month Index + 5.000% 9.7592% 5/15/28 (e)(g)(l) | 2,685 | 2,673 | |
TOTAL CONSUMER PRODUCTS | 5,002 | ||
| Containers - 0.0% | |||
| Kloeckner Pentaplast of America, Inc. Tranche B 1LN, term loan CME Term SOFR 6 Month Index + 4.750% 9.7229% 2/9/26 (e)(g)(l) | 183 | 170 | |
| Diversified Financial Services - 0.2% | |||
| Focus Financial Partners LLC: | |||
| Tranche B8 1LN, term loan CME Term SOFR 1 Month Index + 3.250% 7.9352% 9/17/31 (e)(g)(l) | 3,897 | 3,898 | |
| Tranche DD 1LN, term loan CME Term SOFR 1 Month Index + 3.250% 0% 9/10/31 (e)(f)(g)(l) | 418 | 419 | |
TOTAL DIVERSIFIED FINANCIAL SERVICES | 4,317 | ||
| Energy - 0.4% | |||
| EG America LLC Tranche BC 1LN, term loan CME Term SOFR 1 Month Index + 5.500% 10.4445% 2/7/28 (e)(g)(l) | 7,935 | 7,937 | |
| Epic Crude Services LP Tranche B 1LN, term loan CME Term SOFR 1 Month Index + 3.000% 7.6559% 10/9/31 (e)(g)(l) | 325 | 325 | |
| Forbes Energy Services LLC Tranche B, term loan 0% (c)(d)(e)(l) | 610 | 0 | |
| Mesquite Energy, Inc.: | |||
| 1LN, term loan 3 month U.S. LIBOR + 8.000% 0% (c)(d)(e)(g)(l) | 1,671 | 0 | |
| term loan 0% (c)(d)(e)(l) | 721 | 0 | |
| Natgasoline LLC Tranche B, term loan CME Term SOFR 6 Month Index + 3.500% 9.016% 11/14/25 (e)(g)(l) | 316 | 310 | |
TOTAL ENERGY | 8,572 | ||
| Environmental - 0.0% | |||
| Madison IAQ LLC Tranche B 1LN, term loan CME Term SOFR 1 Month Index + 3.250% 7.8892% 6/21/28 (e)(g)(l) | 397 | 396 | |
| Reworld Holding Corp.: | |||
| Tranche B 1LN, term loan CME Term SOFR 1 Month Index + 2.500% 7.1929% 11/30/28 (e)(g)(l) | 308 | 309 | |
| Tranche C 1LN, term loan CME Term SOFR 6 Month Index + 2.500% 7.5877% 11/30/28 (e)(g)(l) | 24 | 24 | |
TOTAL ENVIRONMENTAL | 729 | ||
| Food/Beverage/Tobacco - 0.0% | |||
| Fiesta Purchaser, Inc. Tranche B 1LN, term loan CME Term SOFR 1 Month Index + 4.000% 8.6852% 2/12/31 (e)(g)(l) | 354 | 355 | |
| Naked Juice LLC 1LN, term loan CME Term SOFR 3 Month Index + 3.250% 7.9537% 1/24/29 (e)(g)(l) | 323 | 241 | |
TOTAL FOOD/BEVERAGE/TOBACCO | 596 | ||
| Gaming - 0.4% | |||
| Fertitta Entertainment LLC NV Tranche B 1LN, term loan CME Term SOFR 1 Month Index + 3.750% 8.1852% 1/29/29 (e)(g)(l) | 7,297 | 7,298 | |
| Ontario Gaming GTA LP Tranche B 1LN, term loan CME Term SOFR 3 Month Index + 4.250% 8.8932% 8/1/30 (e)(g)(l) | 983 | 982 | |
TOTAL GAMING | 8,280 | ||
| Healthcare - 0.4% | |||
| Gainwell Acquisition Corp. Tranche B 1LN, term loan CME Term SOFR 3 Month Index + 4.000% 8.7037% 10/1/27 (e)(g)(l) | 2,241 | 2,150 | |
| Medline Borrower LP Tranche B 1LN, term loan CME Term SOFR 1 Month Index + 2.750% 7.4352% 10/23/28 (e)(g)(l) | 5,591 | 5,594 | |
| Phoenix Newco, Inc. Tranche B 1LN, term loan CME Term SOFR 1 Month Index + 3.000% 7.6852% 11/15/28 (e)(g)(l) | 923 | 922 | |
TOTAL HEALTHCARE | 8,666 | ||
| Insurance - 0.9% | |||
| Acrisure LLC: | |||
| Tranche B1 1LN, term loan CME Term SOFR 3 Month Index + 3.000% 7.7592% 2/16/27 (e)(g)(l) | 2,695 | 2,688 | |
| Tranche B6 1LN, term loan CME Term SOFR 3 Month Index + 3.250% 8.0092% 11/6/30 (e)(g)(l) | 1,989 | 1,984 | |
| Alliant Holdings Intermediate LLC Tranche B6 1LN, term loan CME Term SOFR 1 Month Index + 3.000% 7.7592% 9/19/31 (e)(g)(l) | 6,496 | 6,464 | |
| HUB International Ltd. Tranche B 1LN, term loan CME Term SOFR 3 Month Index + 2.750% 7.3674% 6/20/30 (e)(g)(l) | 5,522 | 5,532 | |
| Truist Insurance Holdings LLC: | |||
| 2L, term loan CME Term SOFR 3 Month Index + 4.750% 9.3537% 5/6/32 (e)(g)(l) | 4,320 | 4,373 | |
| Tranche B 1LN, term loan CME Term SOFR 3 Month Index + 3.250% 7.8537% 5/6/31 (e)(g)(l) | 830 | 831 | |
TOTAL INSURANCE | 21,872 | ||
| Leisure - 0.5% | |||
| Carnival Corp. Tranche B 1LN, term loan: | |||
| CME Term SOFR 1 Month Index + 2.750% 7.4352% 8/9/27 (e)(g)(l) | 2,061 | 2,065 | |
| CME Term SOFR 1 Month Index + 2.750% 7.4352% 10/18/28 (e)(g)(l) | 9,065 | 9,076 | |
| United PF Holdings LLC 1LN, term loan CME Term SOFR 3 Month Index + 4.000% 8.847% 12/30/26 (e)(g)(l) | 1,620 | 1,556 | |
TOTAL LEISURE | 12,697 | ||
| Metals/Mining - 0.0% | |||
| Arsenal AIC Parent LLC Tranche B 1LN, term loan CME Term SOFR 1 Month Index + 3.250% 7.9352% 8/19/30 (e)(g)(l) | 262 | 263 | |
| Paper - 0.5% | |||
| Clydesdale Acquisition Holdings, Inc. 1LN, term loan CME Term SOFR 1 Month Index + 3.670% 7.8602% 4/13/29 (e)(g)(l) | 12,733 | 12,698 | |
| Services - 0.9% | |||
| ABG Intermediate Holdings 2 LLC Tranche B1 1LN, term loan CME Term SOFR 1 Month Index + 2.750% 7.4465% 12/21/28 (e)(g)(l) | 2,744 | 2,748 | |
| Artera Services LLC Tranche B 1LN, term loan CME Term SOFR 3 Month Index + 4.500% 9.1037% 2/10/31 (e)(g)(l) | 1,045 | 1,032 | |
| Ascend Learning LLC: | |||
| 2LN, term loan CME Term SOFR 1 Month Index + 5.750% 10.5352% 12/10/29 (e)(g)(l) | 2,170 | 2,130 | |
| Tranche B 1LN, term loan CME Term SOFR 1 Month Index + 3.500% 8.2852% 12/10/28 (e)(g)(l) | 2,865 | 2,863 | |
| Bifm California Buyer, Inc. Tranche 1LN, term loan CME Term SOFR 1 Month Index + 4.250% 8.9352% 5/31/28 (e)(g)(l) | 239 | 239 | |
| Brand Industrial Services, Inc. Tranche B 1LN, term loan CME Term SOFR 3 Month Index + 4.500% 9.7477% 8/1/30 (e)(g)(l) | 5,101 | 5,030 | |
| Neptune BidCo U.S., Inc. Tranche B 1LN, term loan CME Term SOFR 3 Month Index + 5.000% 9.7583% 4/11/29 (e)(g)(l) | 2,453 | 2,263 | |
| Sabert Corp. Tranche B 1LN, term loan CME Term SOFR 1 Month Index + 3.000% 7.8591% 12/10/26 (e)(g)(l) | 694 | 695 | |
| Spin Holdco, Inc. Tranche B 1LN, term loan CME Term SOFR 3 Month Index + 4.000% 9.256% 3/4/28 (e)(g)(l) | 2,617 | 2,265 | |
| STS Operating, Inc. 1LN, term loan CME Term SOFR 1 Month Index + 4.000% 8.7852% 3/25/31 (e)(g)(l) | 1,030 | 1,027 | |
| The GEO Group, Inc. Tranche B 1LN, term loan CME Term SOFR 1 Month Index + 5.250% 9.9352% 4/14/29 (e)(g)(l) | 664 | 676 | |
TOTAL SERVICES | 20,968 | ||
| Super Retail - 1.1% | |||
| Great Outdoors Group LLC Tranche B 1LN, term loan CME Term SOFR 1 Month Index + 3.750% 8.5496% 3/5/28 (e)(g)(l) | 501 | 502 | |
| LBM Acquisition LLC Tranche B 1LN, term loan CME Term SOFR 1 Month Index + 3.750% 8.6684% 6/6/31 (e)(g)(l) | 24,347 | 23,976 | |
TOTAL SUPER RETAIL | 24,478 | ||
| Technology - 3.4% | |||
| Acuris Finance U.S., Inc. 1LN, term loan CME Term SOFR 1 Month Index + 3.750% 8.418% 2/16/28 (e)(g)(l) | 88 | 88 | |
| Amentum Holdings, Inc. 1LN, term loan CME Term SOFR 1 Month Index + 2.250% 6.9352% 9/29/31 (e)(g)(l) | 1,055 | 1,054 | |
| Applied Systems, Inc.: | |||
| Tranche 2LN, term loan CME Term SOFR 3 Month Index + 5.250% 9.8537% 2/23/32 (e)(g)(l) | 35 | 36 | |
| Tranche B 1LN, term loan CME Term SOFR 3 Month Index + 3.500% 7.6037% 2/24/31 (e)(g)(l) | 1,960 | 1,964 | |
| Athenahealth Group, Inc. Tranche B 1LN, term loan CME Term SOFR 1 Month Index + 3.250% 7.9352% 2/15/29 (e)(g)(l) | 4,240 | 4,224 | |
| ConnectWise LLC Tranche B 1LN, term loan CME Term SOFR 3 Month Index + 3.500% 8.3653% 9/30/28 (e)(g)(l) | 2,917 | 2,912 | |
| Cotiviti, Inc. Tranche B 1LN, term loan CME Term SOFR 1 Month Index + 3.250% 8.0941% 5/1/31 (e)(g)(l) | 6,900 | 6,900 | |
| DG Investment Intermediate Holdings, Inc. Tranche B 1LN, term loan CME Term SOFR 1 Month Index + 3.750% 8.5496% 3/31/28 (e)(g)(l) | 252 | 251 | |
| First Advantage Holdings LLC Tranche B 1LN, term loan CME Term SOFR 1 Month Index + 2.750% 7.9352% 1/31/27 (e)(g)(l) | 390 | 389 | |
| Lightning Power LLC Tranche B 1LN, term loan CME Term SOFR 1 Month Index + 3.250% 8.3455% 8/18/31 (e)(g)(l) | 530 | 531 | |
| McAfee Corp. Tranche B 1LN, term loan CME Term SOFR 1 Month Index + 3.250% 8.0995% 3/1/29 (e)(g)(l) | 10,033 | 10,004 | |
| MH Sub I LLC Tranche B 1LN, term loan CME Term SOFR 1 Month Index + 4.250% 8.9352% 5/3/28 (e)(g)(l) | 2,849 | 2,830 | |
| Modena Buyer LLC 1LN, term loan CME Term SOFR 3 Month Index + 4.500% 9.1037% 7/1/31 (e)(g)(l) | 5,020 | 4,800 | |
| Polaris Newco LLC Tranche B 1LN, term loan CME Term SOFR 3 Month Index + 4.000% 8.847% 6/2/28 (e)(g)(l) | 883 | 876 | |
| Project Alpha Intermediate Holding, Inc. Tranche B 1LN, term loan CME Term SOFR 3 Month Index + 3.750% 8.3354% 10/28/30 (e)(g)(l) | 1,965 | 1,972 | |
| Proofpoint, Inc. Tranche B 1LN, term loan CME Term SOFR 1 Month Index + 3.000% 7.6852% 8/31/28 (e)(g)(l) | 16,681 | 16,684 | |
| RealPage, Inc. Tranche B 1LN, term loan CME Term SOFR 1 Month Index + 3.000% 7.7996% 4/22/28 (e)(g)(l) | 752 | 740 | |
| UKG, Inc. Tranche B 1LN, term loan CME Term SOFR 3 Month Index + 3.500% 7.6172% 2/10/31 (e)(g)(l) | 15,212 | 15,224 | |
| VS Buyer LLC Tranche B 1LN, term loan CME Term SOFR 1 Month Index + 3.250% 8.0359% 4/14/31 (e)(g)(l) | 7,704 | 7,704 | |
TOTAL TECHNOLOGY | 79,183 | ||
| Telecommunications - 0.1% | |||
| Aventiv Technologies LLC 1LN, term loan: | |||
| CME Term SOFR 3 Month Index + 5.090% 9.9553% 7/31/25 (e)(g)(l) | 955 | 832 | |
| CME Term SOFR 3 Month Index + 7.500% 12.3653% 7/31/25 (e)(g)(l) | 25 | 25 | |
| GTT Communications, Inc. 1LN, term loan CME Term SOFR 1 Month Index + 9.000% 13.9454% 6/30/28 (e)(g)(l) | 577 | 429 | |
| Gtt Remainco LLC 1LN, term loan CME Term SOFR 1 Month Index + 7.000% 11.7852% 12/30/27 (e)(g)(l) | 667 | 627 | |
TOTAL TELECOMMUNICATIONS | 1,913 | ||
| Utilities - 0.0% | |||
| Talen Energy Supply LLC: | |||
| Tranche TLB-EXIT 1LN, term loan CME Term SOFR 1 Month Index + 4.500% 8.5955% 5/17/30 (e)(g)(l) | 96 | 96 | |
| Tranche TLC-EXIT 1LN, term loan CME Term SOFR 1 Month Index + 4.500% 8.5955% 5/17/30 (e)(g)(l) | 63 | 63 | |
TOTAL UTILITIES | 159 | ||
| TOTAL BANK LOAN OBLIGATIONS (Cost $236,364) | 234,323 | ||
| Preferred Securities - 4.1% | |||
Principal Amount (a) (000s) | Value ($) (000s) | ||
| Banks & Thrifts - 2.5% | |||
| Ally Financial, Inc. 4.7% (e)(m) | 945 | 776 | |
| Bank of America Corp.: | |||
| 5.875% (e)(m) | 14,280 | 14,519 | |
| 6.1% (e)(m) | 2,590 | 2,606 | |
| Citigroup, Inc. 4.7% (e)(m) | 2,135 | 2,147 | |
| Goldman Sachs Group, Inc. 5.3% (e)(m) | 15,000 | 15,317 | |
| JPMorgan Chase & Co.: | |||
| 4% (e)(m) | 3,555 | 3,512 | |
| 4.6% (e)(m) | 4,465 | 4,495 | |
| Wells Fargo & Co.: | |||
| 5.875% (e)(m) | 7,645 | 7,795 | |
| 7.625% (e)(m) | 5,740 | 6,226 | |
TOTAL BANKS & THRIFTS | 57,393 | ||
| Energy - 1.2% | |||
| Energy Transfer LP: | |||
| 6.5% (e)(m) | 1,945 | 1,997 | |
| 6.625% (e)(m) | 8,261 | 8,203 | |
| 7.125% (e)(m) | 17,150 | 17,998 | |
TOTAL ENERGY | 28,198 | ||
| Homebuilders/Real Estate - 0.4% | |||
| Alliant Holdings LP 10% (c)(e)(m) | 8,290 | 8,270 | |
| TOTAL PREFERRED SECURITIES (Cost $93,353) | 93,861 | ||
| Other - 2.2% | |||
| Shares | Value ($) (000s) | ||
| Other - 2.2% | |||
Fidelity Private Credit Co. LLC (j)(n) (Cost $51,106) | 5,135,106 | 51,752 | |
| Money Market Funds - 11.3% | |||
| Shares | Value ($) (000s) | ||
| Fidelity Cash Central Fund 4.87% (o) | 260,622,324 | 260,674 | |
| Fidelity Securities Lending Cash Central Fund 4.87% (o)(p) | 1,231,527 | 1,232 | |
| TOTAL MONEY MARKET FUNDS (Cost $261,906) | 261,906 | ||
| TOTAL INVESTMENT IN SECURITIES - 99.5% (Cost $2,193,600) | 2,299,563 |
NET OTHER ASSETS (LIABILITIES) - 0.5% | 11,384 |
| NET ASSETS - 100.0% | 2,310,947 |
| (a) | Amount is stated in United States dollars unless otherwise noted. |
| (b) | Security exempt from registration under Rule 144A of the Securities Act of 1933. These securities may be resold in transactions exempt from registration, normally to qualified institutional buyers. At the end of the period, the value of these securities amounted to $938,952,000 or 40.6% of net assets. |
| (c) | Level 3 security |
| (d) | Non-income producing - Security is in default. |
| (e) | Coupon rates for floating and adjustable rate securities reflect the rates in effect at period end. |
| (f) | Position or a portion of the position represents an unfunded loan commitment. At period end, the total principal amount and market value of unfunded commitments totaled $3,235,000 and $3,123,000, respectively. |
| (g) | Coupon is indexed to a floating interest rate which may be multiplied by a specified factor and/or subject to caps or floors. |
| (h) | Security or a portion of the security purchased on a delayed delivery or when-issued basis. |
| (i) | Non-income producing |
| (j) | Restricted securities (including private placements) - Investment in securities not registered under the Securities Act of 1933 (excluding 144A issues). At the end of the period, the value of restricted securities (excluding 144A issues) amounted to $55,070,000 or 2.4% of net assets. |
| (k) | Security or a portion of the security is on loan at period end. |
| (l) | Remaining maturities of bank loan obligations may be less than the stated maturities shown as a result of contractual or optional prepayments by the borrower. Such prepayments cannot be predicted with certainty. |
| (m) | Security is perpetual in nature with no stated maturity date. |
| (n) | Affiliated Fund |
| (o) | Affiliated fund that is generally available only to investment companies and other accounts managed by Fidelity Investments. The rate quoted is the annualized seven-day yield of the fund at period end. A complete unaudited listing of the fund's holdings as of its most recent quarter end is available upon request. In addition, each Fidelity Central Fund's financial statements, which are not covered by the Fund's Report of Independent Registered Public Accounting Firm, are available on the SEC's website or upon request. |
| (p) | Investment made with cash collateral received from securities on loan. |
| Additional information on each restricted holding is as follows: | ||
| Security | Acquisition Date | Acquisition Cost ($) (000s) |
| Arena Brands Holding Corp. Class B | 6/18/97 - 7/13/98 | 1,538 |
| Fidelity Private Credit Co. LLC | 4/28/22 - 10/28/24 | 51,106 |
| New Cotai LLC/New Cotai Capital Corp. | 9/11/20 | 7,224 |
| Northeast Grocery, Inc. | 11/08/21 | 135 |
| Affiliate (Amounts in thousands) | Value, beginning of period ($) | Purchases ($) | Sales Proceeds ($) | Dividend Income ($) | Realized Gain (loss) ($) | Change in Unrealized appreciation (depreciation) ($) | Value, end of period ($) | % ownership, end of period |
| Fidelity Cash Central Fund 4.87% | 152,805 | 626,925 | 519,056 | 11,078 | - | - | 260,674 | 0.5% |
| Fidelity Securities Lending Cash Central Fund 4.87% | 3,360 | 53,324 | 55,452 | 1 | - | - | 1,232 | 0.0% |
| Total | 156,165 | 680,249 | 574,508 | 11,079 | - | - | 261,906 | |
| Affiliate (Amounts in thousands) | Value, beginning of period ($) | Purchases ($) | Sales Proceeds ($) | Dividend Income ($) | Realized Gain (loss) ($) | Change in Unrealized appreciation (depreciation) ($) | Value, end of period ($) |
| Fidelity Private Credit Co. LLC | 48,171 | 3,820 | - | 6,746 | - | (239) | 51,752 |
| 48,171 | 3,820 | - | 6,746 | - | (239) | 51,752 |
| Valuation Inputs at Reporting Date: | ||||
Description (Amounts in thousands) | Total ($) | Level 1 ($) | Level 2 ($) | Level 3 ($) |
Investments in Securities: | ||||
| Equities: | ||||
Communication Services | 39,214 | 39,214 | - | - |
Consumer Discretionary | 56,365 | 44,715 | 10,024 | 1,626 |
Consumer Staples | 11,689 | 9,825 | - | 1,864 |
Energy | 22,453 | 12,718 | 836 | 8,899 |
Financials | 71,268 | 71,268 | - | - |
Health Care | 4,559 | 4,553 | - | 6 |
Industrials | 82,124 | 82,124 | - | - |
Information Technology | 128,119 | 127,478 | - | 641 |
Materials | 15,808 | 15,808 | - | - |
Utilities | 32,093 | 32,092 | - | 1 |
| Corporate Bonds | 1,190,308 | - | 1,181,875 | 8,433 |
| Asset-Backed Securities | 3,721 | - | 3,721 | - |
| Bank Loan Obligations | 234,323 | - | 234,323 | - |
| Preferred Securities | 93,861 | - | 85,591 | 8,270 |
| Other | 51,752 | - | 51,752 | - |
| Money Market Funds | 261,906 | 261,906 | - | - |
| Total Investments in Securities: | 2,299,563 | 701,701 | 1,568,122 | 29,740 |
| Net Unrealized Appreciation on Unfunded Commitments | 1,825 | (252) | - | 2,077 |
| Total | 1,825 | (252) | - | 2,077 |
| (Amounts in thousands) | |||
| Investments in Securities: | |||
| Beginning Balance | $ | 28,484 | |
| Net Realized Gain (Loss) on Investment Securities | 5,444 | ||
| Net Unrealized Gain (Loss) on Investment Securities | (3,478) | ||
| Cost of Purchases | 13,263 | ||
| Proceeds of Sales | (14,006) | ||
| Amortization/Accretion | 33 | ||
| Transfers into Level 3 | - | ||
| Transfers out of Level 3 | - | ||
| Ending Balance | $ | 29,740 | |
| The change in unrealized gain (loss) for the period attributable to Level 3 securities held at October 31, 2024 | $ | 1,524 | |
| The information used in the above reconciliation represents fiscal year to date activity for any Investments in Securities identified as using Level 3 inputs at either the beginning or the end of the current fiscal period. Cost of purchases and proceeds of sales may include securities received and/or delivered through in-kind transactions, corporate actions or exchanges. Transfers into Level 3 were attributable to a lack of observable market data resulting from decreases in market activity, decreases in liquidity, security restructurings or corporate actions. Transfers out of Level 3 were attributable to observable market data becoming available for those securities. Transfers in or out of Level 3 represent the beginning value of any Security or Instrument where a change in the pricing level occurred from the beginning to the end of the period. Realized and unrealized gains (losses) disclosed in the reconciliation are included in Net Gain (Loss) on the Fund's Statement of Operations. | |||
| Statement of Assets and Liabilities | ||||
As of October 31, 2024 Amounts in thousands (except per-share amounts) | ||||
| Assets | ||||
| Investment in securities, at value (including securities loaned of $1,176) - See accompanying schedule: | ||||
Unaffiliated issuers (cost $1,880,588) | $ | 1,985,905 | ||
Fidelity Central Funds (cost $261,906) | 261,906 | |||
Other affiliated issuers (cost $51,106) | 51,752 | |||
| Total Investment in Securities (cost $2,193,600) | $ | 2,299,563 | ||
| Cash | 185 | |||
| Foreign currency held at value (cost $56) | 55 | |||
| Receivable for investments sold | 76 | |||
| Unrealized appreciation on unfunded commitments | 2,077 | |||
| Receivable for fund shares sold | 2,025 | |||
| Dividends receivable | 64 | |||
| Interest receivable | 21,872 | |||
| Distributions receivable from Fidelity Central Funds | 1,260 | |||
| Prepaid expenses | 3 | |||
| Other receivables | 11 | |||
Total assets | 2,327,191 | |||
| Liabilities | ||||
| Payable for investments purchased | ||||
Regular delivery | $ | 8,752 | ||
Delayed delivery | 814 | |||
| Unrealized depreciation on unfunded commitments | 252 | |||
| Payable for fund shares redeemed | 2,697 | |||
| Distributions payable | 878 | |||
| Accrued management fee | 1,319 | |||
| Distribution and service plan fees payable | 218 | |||
| Other payables and accrued expenses | 82 | |||
| Collateral on securities loaned | 1,232 | |||
| Total liabilities | 16,244 | |||
| Commitments and contingent liabilities (see Significant Accounting Policies and Litigation notes) | ||||
| Net Assets | $ | 2,310,947 | ||
| Net Assets consist of: | ||||
| Paid in capital | $ | 2,212,456 | ||
| Total accumulated earnings (loss) | 98,491 | |||
| Net Assets | $ | 2,310,947 | ||
| Net Asset Value and Maximum Offering Price | ||||
| Class A : | ||||
Net Asset Value and redemption price per share ($537,083 ÷ 45,403 shares)(a) | $ | 11.83 | ||
| Maximum offering price per share (100/96.00 of $11.83) | $ | 12.32 | ||
| Class M : | ||||
Net Asset Value and redemption price per share ($244,473 ÷ 20,542 shares)(a) | $ | 11.90 | ||
| Maximum offering price per share (100/96.00 of $11.90) | $ | 12.40 | ||
| Class C : | ||||
Net Asset Value and offering price per share ($64,010 ÷ 5,422 shares)(a) | $ | 11.81 | ||
| Class I : | ||||
Net Asset Value, offering price and redemption price per share ($1,018,426 ÷ 92,359 shares) | $ | 11.03 | ||
| Class Z : | ||||
Net Asset Value, offering price and redemption price per share ($446,955 ÷ 40,552 shares) | $ | 11.02 | ||
(a)Redemption price per share is equal to net asset value less any applicable contingent deferred sales charge. | ||||
| Statement of Operations | ||||
| Year ended October 31, 2024 Amounts in thousands | ||||
| Investment Income | ||||
| Dividends: | ||||
| Unaffiliated issuers | $ | 13,678 | ||
| Affiliated issuers | 6,746 | |||
| Interest | 102,809 | |||
| Income from Fidelity Central Funds (including $1 from security lending) | 11,079 | |||
| Total income | 134,312 | |||
| Expenses | ||||
| Management fee | $ | 14,028 | ||
| Transfer agent fees | 852 | |||
| Distribution and service plan fees | 2,503 | |||
| Accounting fees | 221 | |||
| Custodian fees and expenses | 25 | |||
| Independent trustees' fees and expenses | 10 | |||
| Registration fees | 128 | |||
| Audit fees | 83 | |||
| Legal | 330 | |||
| Miscellaneous | 78 | |||
| Total expenses before reductions | 18,258 | |||
| Expense reductions | (390) | |||
| Total expenses after reductions | 17,868 | |||
| Net Investment income (loss) | 116,444 | |||
| Realized and Unrealized Gain (Loss) | ||||
| Net realized gain (loss) on: | ||||
| Investment Securities: | ||||
| Unaffiliated issuers | 9,737 | |||
| Foreign currency transactions | 2 | |||
| Capital gain distributions from underlying funds: | ||||
| Affiliated issuers | 48 | |||
| Total net realized gain (loss) | 9,787 | |||
| Change in net unrealized appreciation (depreciation) on: | ||||
| Investment Securities: | ||||
| Unaffiliated issuers | 219,325 | |||
| Fidelity Central Funds | (905) | |||
| Other affiliated issuers | 646 | |||
| Unfunded commitments | 1,825 | |||
| Total change in net unrealized appreciation (depreciation) | 220,891 | |||
| Net gain (loss) | 230,678 | |||
| Net increase (decrease) in net assets resulting from operations | $ | 347,122 | ||
| Statement of Changes in Net Assets | ||||
| Amount in thousands | Year ended October 31, 2024 | Year ended October 31, 2023 | ||
| Increase (Decrease) in Net Assets | ||||
| Operations | ||||
| Net investment income (loss) | $ | 116,444 | $ | 96,897 |
| Net realized gain (loss) | 9,787 | (37,304) | ||
| Change in net unrealized appreciation (depreciation) | 220,891 | 31,817 | ||
| Net increase (decrease) in net assets resulting from operations | 347,122 | 91,410 | ||
| Distributions to shareholders | (109,086) | (157,937) | ||
| Share transactions - net increase (decrease) | 221,826 | 127,889 | ||
| Total increase (decrease) in net assets | 459,862 | 61,362 | ||
| Net Assets | ||||
| Beginning of period | 1,851,085 | 1,789,723 | ||
| End of period | $ | 2,310,947 | $ | 1,851,085 |
Fidelity Advisor® High Income Advantage Fund Class A |
| Years ended October 31, | 2024 | 2023 | 2022 | 2021 | 2020 | |||||
Selected Per-Share Data | ||||||||||
| Net asset value, beginning of period | $ | 10.54 | $ | 10.90 | $ | 12.94 | $ | 10.95 | $ | 11.12 |
| Income from Investment Operations | ||||||||||
Net investment income (loss) A,B | .593 | .551 | .455 | .382 | .422 | |||||
| Net realized and unrealized gain (loss) | 1.252 | - C | (1.803) | 1.989 | (.169) | |||||
| Total from investment operations | 1.845 | .551 | (1.348) | 2.371 | .253 | |||||
| Distributions from net investment income | (.555) | (.544) | (.433) | (.381) | (.417) | |||||
| Distributions from net realized gain | - | (.367) | (.259) | - | (.006) | |||||
| Total distributions | (.555) | (.911) | (.692) | (.381) | (.423) | |||||
| Net asset value, end of period | $ | 11.83 | $ | 10.54 | $ | 10.90 | $ | 12.94 | $ | 10.95 |
Total Return D,E | 17.78 % | 5.16% | (10.75)% | 21.85% | 2.41% | |||||
Ratios to Average Net Assets B,F,G | ||||||||||
| Expenses before reductions | .99% | .98% | 1.01% | .99% | 1.00% | |||||
| Expenses net of fee waivers, if any | .97 % | .98% | 1.01% | .99% | 1.00% | |||||
| Expenses net of all reductions | .97% | .98% | 1.01% | .99% | 1.00% | |||||
| Net investment income (loss) | 5.18% | 5.11% | 3.88% | 3.07% | 3.91% | |||||
| Supplemental Data | ||||||||||
| Net assets, end of period (in millions) | $ | 537 | $ | 467 | $ | 463 | $ | 566 | $ | 462 |
Portfolio turnover rate H | 29 % | 29% | 29% | 27% | 48% |
Fidelity Advisor® High Income Advantage Fund Class M |
| Years ended October 31, | 2024 | 2023 | 2022 | 2021 | 2020 | |||||
Selected Per-Share Data | ||||||||||
| Net asset value, beginning of period | $ | 10.60 | $ | 10.96 | $ | 13.01 | $ | 11.01 | $ | 11.18 |
| Income from Investment Operations | ||||||||||
Net investment income (loss) A,B | .599 | .556 | .458 | .385 | .425 | |||||
| Net realized and unrealized gain (loss) | 1.260 | (.001) | (1.813) | 1.998 | (.169) | |||||
| Total from investment operations | 1.859 | .555 | (1.355) | 2.383 | .256 | |||||
| Distributions from net investment income | (.559) | (.548) | (.436) | (.383) | (.420) | |||||
| Distributions from net realized gain | - | (.367) | (.259) | - | (.006) | |||||
| Total distributions | (.559) | (.915) | (.695) | (.383) | (.426) | |||||
| Net asset value, end of period | $ | 11.90 | $ | 10.60 | $ | 10.96 | $ | 13.01 | $ | 11.01 |
Total Return C,D | 17.82 % | 5.17% | (10.75)% | 21.84% | 2.43% | |||||
Ratios to Average Net Assets B,E,F | ||||||||||
| Expenses before reductions | .97% | .98% | 1.01% | .99% | 1.00% | |||||
| Expenses net of fee waivers, if any | .96 % | .97% | 1.01% | .99% | 1.00% | |||||
| Expenses net of all reductions | .96% | .97% | 1.01% | .99% | 1.00% | |||||
| Net investment income (loss) | 5.19% | 5.11% | 3.89% | 3.08% | 3.91% | |||||
| Supplemental Data | ||||||||||
| Net assets, end of period (in millions) | $ | 244 | $ | 224 | $ | 238 | $ | 300 | $ | 266 |
Portfolio turnover rate G | 29 % | 29% | 29% | 27% | 48% |
Fidelity Advisor® High Income Advantage Fund Class C |
| Years ended October 31, | 2024 | 2023 | 2022 | 2021 | 2020 | |||||
Selected Per-Share Data | ||||||||||
| Net asset value, beginning of period | $ | 10.51 | $ | 10.88 | $ | 12.92 | $ | 10.93 | $ | 11.10 |
| Income from Investment Operations | ||||||||||
Net investment income (loss) A,B | .506 | .469 | .366 | .286 | .339 | |||||
| Net realized and unrealized gain (loss) | 1.261 | (.010) | (1.804) | 1.988 | (.169) | |||||
| Total from investment operations | 1.767 | .459 | (1.438) | 2.274 | .170 | |||||
| Distributions from net investment income | (.467) | (.462) | (.343) | (.284) | (.334) | |||||
| Distributions from net realized gain | - | (.367) | (.259) | - | (.006) | |||||
| Total distributions | (.467) | (.829) | (.602) | (.284) | (.340) | |||||
| Net asset value, end of period | $ | 11.81 | $ | 10.51 | $ | 10.88 | $ | 12.92 | $ | 10.93 |
Total Return C,D | 17.04 % | 4.27% | (11.45)% | 20.95% | 1.63% | |||||
Ratios to Average Net Assets B,E,F | ||||||||||
| Expenses before reductions | 1.74% | 1.76% | 1.78% | 1.76% | 1.77% | |||||
| Expenses net of fee waivers, if any | 1.72 % | 1.73% | 1.77% | 1.76% | 1.77% | |||||
| Expenses net of all reductions | 1.72% | 1.73% | 1.77% | 1.76% | 1.77% | |||||
| Net investment income (loss) | 4.42% | 4.35% | 3.12% | 2.30% | 3.14% | |||||
| Supplemental Data | ||||||||||
| Net assets, end of period (in millions) | $ | 64 | $ | 54 | $ | 56 | $ | 71 | $ | 68 |
Portfolio turnover rate G | 29 % | 29% | 29% | 27% | 48% |
Fidelity Advisor® High Income Advantage Fund Class I |
| Years ended October 31, | 2024 | 2023 | 2022 | 2021 | 2020 | |||||
Selected Per-Share Data | ||||||||||
| Net asset value, beginning of period | $ | 9.82 | $ | 10.19 | $ | 12.12 | $ | 10.26 | $ | 10.42 |
| Income from Investment Operations | ||||||||||
Net investment income (loss) A,B | .578 | .539 | .454 | .388 | .422 | |||||
| Net realized and unrealized gain (loss) | 1.178 | (.007) | (1.691) | 1.860 | (.157) | |||||
| Total from investment operations | 1.756 | .532 | (1.237) | 2.248 | .265 | |||||
| Distributions from net investment income | (.546) | (.535) | (.434) | (.388) | (.419) | |||||
| Distributions from net realized gain | - | (.367) | (.259) | - | (.006) | |||||
| Total distributions | (.546) | (.902) | (.693) | (.388) | (.425) | |||||
| Net asset value, end of period | $ | 11.03 | $ | 9.82 | $ | 10.19 | $ | 12.12 | $ | 10.26 |
Total Return C | 18.18 % | 5.35% | (10.56)% | 22.13% | 2.69% | |||||
Ratios to Average Net Assets B,D,E | ||||||||||
| Expenses before reductions | .75% | .73% | .76% | .74% | .75% | |||||
| Expenses net of fee waivers, if any | .73 % | .72% | .76% | .74% | .75% | |||||
| Expenses net of all reductions | .73% | .72% | .76% | .74% | .74% | |||||
| Net investment income (loss) | 5.42% | 5.36% | 4.13% | 3.32% | 4.17% | |||||
| Supplemental Data | ||||||||||
| Net assets, end of period (in millions) | $ | 1,018 | $ | 745 | $ | 696 | $ | 903 | $ | 510 |
Portfolio turnover rate F | 29 % | 29% | 29% | 27% | 48% |
Fidelity Advisor® High Income Advantage Fund Class Z |
| Years ended October 31, | 2024 | 2023 | 2022 | 2021 | 2020 | |||||
Selected Per-Share Data | ||||||||||
| Net asset value, beginning of period | $ | 9.82 | $ | 10.19 | $ | 12.12 | $ | 10.26 | $ | 10.42 |
| Income from Investment Operations | ||||||||||
Net investment income (loss) A,B | .590 | .549 | .463 | .399 | .430 | |||||
| Net realized and unrealized gain (loss) | 1.166 | (.007) | (1.690) | 1.860 | (.156) | |||||
| Total from investment operations | 1.756 | .542 | (1.227) | 2.259 | .274 | |||||
| Distributions from net investment income | (.556) | (.545) | (.444) | (.399) | (.428) | |||||
| Distributions from net realized gain | - | (.367) | (.259) | - | (.006) | |||||
| Total distributions | (.556) | (.912) | (.703) | (.399) | (.434) | |||||
| Net asset value, end of period | $ | 11.02 | $ | 9.82 | $ | 10.19 | $ | 12.12 | $ | 10.26 |
Total Return C | 18.20 % | 5.45% | (10.47)% | 22.25% | 2.79% | |||||
Ratios to Average Net Assets B,D,E | ||||||||||
| Expenses before reductions | .65% | .64% | .66% | .64% | .65% | |||||
| Expenses net of fee waivers, if any | .63 % | .63% | .66% | .64% | .65% | |||||
| Expenses net of all reductions | .63% | .63% | .66% | .64% | .65% | |||||
| Net investment income (loss) | 5.51% | 5.46% | 4.23% | 3.42% | 4.26% | |||||
| Supplemental Data | ||||||||||
| Net assets, end of period (in millions) | $ | 447 | $ | 361 | $ | 337 | $ | 363 | $ | 159 |
Portfolio turnover rate F | 29 % | 29% | 29% | 27% | 48% |
| Fidelity Central Fund | Investment Manager | Investment Objective | Investment Practices | Expense RatioA |
| Fidelity Money Market Central Funds | Fidelity Management & Research Company LLC (FMR) | Each fund seeks to obtain a high level of current income consistent with the preservation of capital and liquidity. | Short-term Investments | Less than .005% |
| Asset Type | Fair Value | Valuation Technique(s) | Unobservable Input | Amount or Range/Weighted Average | Impact to Valuation from an Increase in InputA |
| Equities | $13,037 | Market comparable | Enterprise value/Revenue multiple (EV/R) | 0.3 | Increase |
| Enterprise value/EBITDA multiple (EV/EBITDA) | 3.5 - 7.3 / 5.0 | Increase | |||
Market approach | Transaction price | $0.00 - $2.92 / $2.87 | Increase | ||
Discounted cash flow | Discount rate | 10.8% | Decrease | ||
| Yield | 12.2% | Decrease | |||
Recovery value | Recovery value | $0.22 - $0.65 / $0.64 | Increase | ||
Black scholes | Discount rate | 4.0% - 4.1% / 4.1% | Increase | ||
| Term | 2.3 - 4.7 / 2.3 | Increase | |||
| Volatility | 50.0% - 58.0% / 50.1% | Increase | |||
| Corporate Bonds | $8,433 | Market approach | Transaction price | $96.00 | Increase |
Recovery value | Recovery value | $0.00 | Increase | ||
Indicative market price | Evaluated bid | $5.50 - $18.50 / $14.64 | Increase | ||
Black scholes | Discount rate | 4.1% | Increase | ||
| Term | 2.3 | Increase | |||
| Volatility | 50.0% | Increase | |||
| Preferred Securities | $8,270 | Market approach | Transaction price | $98.50 | Increase |
| Bank Loan Obligations | $0 | Recovery value | Recovery value | $0.00 | Increase |
| Fidelity Advisor High Income Advantage Fund | $9 |
| Gross unrealized appreciation | $196,098 |
| Gross unrealized depreciation | (76,247) |
| Net unrealized appreciation (depreciation) | $119,851 |
| Tax Cost | $2,181,538 |
| Undistributed ordinary income | $4,951 |
| Capital loss carryforward | $(26,310) |
| Net unrealized appreciation (depreciation) on securities and other investments | $119,850 |
| Short-term | $(5,110) |
| Long-term | (21,200) |
| Total capital loss carryforward | $(26,310) |
| October 31, 2024 | October 31, 2023 | |
| Ordinary Income | $109,086 | $95,815 |
| Long-term Capital Gains | - | 62,122 |
| Total | $109,086 | $157,937 |
| Investment to be Acquired | Commitment Amount ($) | |
| Fidelity Advisor High Income Advantage Fund | Fidelity Private Credit Company LLC | 7,545 |
| Investment to be Acquired | Commitment Amount ($) | Unrealized Appreciation (Depreciation)($) | |
| Fidelity Advisor High Income Advantage Fund | EchoStar Corp. | 2,373 | (252) |
| Fidelity Advisor High Income Advantage Fund | EchoStar Corp. 10.75% 9/27/29 | 23,976 | 2,077 |
| Purchases ($) | Sales ($) | |
| Fidelity Advisor High Income Advantage Fund | 687,032 | 580,587 |
| Maximum Management Fee Rate % | |
| Class A | .71 |
| Class M | .70 |
| Class C | .73 |
| Class I | .71 |
| Class Z | .61 |
| Total Management Fee Rate % | |
| Class A | .70 |
| Class M | .70 |
| Class C | .71 |
| Class I | .70 |
| Class Z | .60 |
| Distribution Fee | Service Fee | Total Fees ($) | Retained by FDC ($) | |
| Class A | - % | .25% | 1,297 | 61 |
| Class M | - % | .25% | 602 | 2 |
| Class C | .75% | .25% | 604 | 125 |
| 2,503 | 188 |
| Retained by FDC ($) | |
| Class A | 60 |
| Class M | 9 |
Class C A | 1 |
70 |
| % of Class-Level Average Net Assets | ||
| Class A | .1485 | |
| Class M | .1430 | |
| Class C | .1686 | |
| Class I | .1477 | |
| Class Z | .0500 | |
| Amount ($) | % of Class-Level Average Net Assets | |
| Class A | 245 | .15 |
| Class M | 113 | .14 |
| Class C | 32 | .17 |
| Class I | 394 | .15 |
| Class Z | 68 | .05 |
852 |
| % of Average Net Assets | |
| Fidelity Advisor High Income Advantage Fund | .0331 |
| % of Average Net Assets | |
| Fidelity Advisor High Income Advantage Fund | .03 |
| Amount ($) | |
| Fidelity Advisor High Income Advantage Fund | 2 |
| Purchases ($) | Sales ($) | Realized Gain (Loss)($) | |
| Fidelity Advisor High Income Advantage Fund | 18,137 | 10,349 | 1,055 |
| Amount ($) | |
| Fidelity Advisor High Income Advantage Fund | 2 |
| Amount ($) | |
| Fidelity Advisor High Income Advantage Fund | 3 |
| Total Security Lending Fees Paid to NFS ($) | Security Lending Income From Securities Loaned to NFS ($) | Value of Securities Loaned to NFS at Period End ($) | |
| Fidelity Advisor High Income Advantage Fund | -A | - | - |
Year ended October 31, 2024 | Year ended October 31, 2023 | |
| Fidelity Advisor High Income Advantage Fund | ||
| Distributions to shareholders | ||
| Class A | $25,078 | $39,255 |
| Class M | 11,683 | 19,798 |
| Class C | 2,461 | 4,315 |
| Class I | 45,476 | 63,485 |
| Class Z | 24,388 | 31,084 |
Total | $109,086 | $157,937 |
| Shares | Shares | Dollars | Dollars | |
Year ended October 31, 2024 | Year ended October 31, 2023 | Year ended October 31, 2024 | Year ended October 31, 2023 | |
| Fidelity Advisor High Income Advantage Fund | ||||
| Class A | ||||
| Shares sold | 9,218 | 8,033 | $105,494 | $86,668 |
| Reinvestment of distributions | 2,014 | 3,371 | 23,137 | 36,314 |
| Shares redeemed | (10,145) | (9,551) | (116,369) | (103,071) |
| Net increase (decrease) | 1,087 | 1,853 | $12,262 | $19,911 |
| Class M | ||||
| Shares sold | 2,496 | 1,730 | $28,674 | $18,846 |
| Reinvestment of distributions | 942 | 1,723 | 10,878 | 18,671 |
| Shares redeemed | (4,014) | (4,083) | (46,313) | (44,308) |
| Net increase (decrease) | (576) | (630) | $(6,761) | $(6,791) |
| Class C | ||||
| Shares sold | 1,556 | 1,180 | $17,809 | $12,722 |
| Reinvestment of distributions | 206 | 383 | 2,358 | 4,121 |
| Shares redeemed | (1,481) | (1,573) | (16,955) | (16,924) |
| Net increase (decrease) | 281 | (10) | $3,212 | $(81) |
| Class I | ||||
| Shares sold | 40,631 | 32,016 | $434,441 | $322,869 |
| Reinvestment of distributions | 3,778 | 5,641 | 40,500 | 56,655 |
| Shares redeemed | (27,917) | (30,068) | (297,634) | (302,382) |
| Net increase (decrease) | 16,492 | 7,589 | $177,307 | $77,142 |
| Class Z | ||||
| Shares sold | 26,222 | 11,358 | $280,321 | $114,612 |
| Reinvestment of distributions | 1,931 | 2,620 | 20,718 | 26,318 |
| Shares redeemed | (24,358) | (10,255) | (265,233) | (103,222) |
| Net increase (decrease) | 3,795 | 3,723 | $35,806 | $37,708 |
| A special meeting of shareholders was held on July 16, 2024. The results of votes taken among shareholders on the proposal before them are reported below. Each vote reported represents one dollar of net asset value held on the record date for the meeting. | ||
| Proposal 1 | ||
| To elect a Board of Trustees. | ||
# of Votes | % of Votes | |
| Bettina Doulton | ||
| Affirmative | 47,400,603,662.68 | 97.08 |
| Withheld | 1,424,803,996.20 | 2.92 |
| TOTAL | 48,825,407,658.88 | 100.00 |
| Robert A. Lawrence | ||
| Affirmative | 47,280,328,204.40 | 96.84 |
| Withheld | 1,545,079,454.48 | 3.16 |
| TOTAL | 48,825,407,658.88 | 100.00 |
| Vijay C. Advani | ||
| Affirmative | 47,288,044,991.48 | 96.85 |
| Withheld | 1,537,362,667.40 | 3.15 |
| TOTAL | 48,825,407,658.88 | 100.00 |
| Thomas P. Bostick | ||
| Affirmative | 47,248,851,088.69 | 96.77 |
| Withheld | 1,576,556,570.19 | 3.23 |
| TOTAL | 48,825,407,658.88 | 100.00 |
| Donald F. Donahue | ||
| Affirmative | 47,287,004,182.74 | 96.85 |
| Withheld | 1,538,403,476.14 | 3.15 |
| TOTAL | 48,825,407,658.88 | 100.00 |
| Vicki L. Fuller | ||
| Affirmative | 47,375,183,539.48 | 97.03 |
| Withheld | 1,450,224,119.40 | 2.97 |
| TOTAL | 48,825,407,658.88 | 100.00 |
| Patricia L. Kampling | ||
| Affirmative | 47,389,656,970.86 | 97.06 |
| Withheld | 1,435,750,688.02 | 2.94 |
| TOTAL | 48,825,407,658.88 | 100.00 |
| Thomas A. Kennedy | ||
| Affirmative | 47,281,489,897.71 | 96.84 |
| Withheld | 1,543,917,761.17 | 3.16 |
| TOTAL | 48,825,407,658.88 | 100.00 |
| Oscar Munoz | ||
| Affirmative | 47,282,750,545.47 | 96.84 |
| Withheld | 1,542,657,113.41 | 3.16 |
| TOTAL | 48,825,407,658.88 | 100.00 |
| Karen B. Peetz | ||
| Affirmative | 47,356,505,980.29 | 96.99 |
| Withheld | 1,468,901,678.59 | 3.01 |
| TOTAL | 48,825,407,658.88 | 100.00 |
| David M. Thomas | ||
| Affirmative | 47,225,423,215.83 | 96.72 |
| Withheld | 1,599,984,443.05 | 3.28 |
| TOTAL | 48,825,407,658.88 | 100.00 |
| Susan Tomasky | ||
| Affirmative | 47,353,387,805.21 | 96.99 |
| Withheld | 1,472,019,853.67 | 3.01 |
| TOTAL | 48,825,407,658.88 | 100.00 |
| Michael E. Wiley | ||
| Affirmative | 47,278,279,663.75 | 96.83 |
| Withheld | 1,547,127,995.13 | 3.17 |
| TOTAL | 48,825,407,658.88 | 100.00 |
| Proposal 1 reflects trust-wide proposal and voting results. | ||
 |
Item 8.
Changes in and Disagreements with Accountants for Open-End Management Investment Companies
See Item 7.
Item 9.
Proxy Disclosures for Open-End Management Investment Companies
See Item 7.
Item 10.
Remuneration Paid to Directors, Officers, and Others of Open-End Management Investment Companies
See Item 7.
Item 11.
Statement Regarding Basis for Approval of Investment Advisory Contract
See Item 7.
Item 12.
Disclosure of Proxy Voting Policies and Procedures for Closed-End Management Investment Companies
Not applicable.
Item 13.
Portfolio Managers of Closed-End Management Investment Companies
Not applicable.
Item 14.
Purchase of Equity Securities by Closed-End Management Investment Company and Affiliated Purchasers
Not applicable.
Item 15.
Submission of Matters to a Vote of Security Holders
There were no material changes to the procedures by which shareholders may recommend nominees to the trust’s Board of Trustees.
Item 16.
Controls and Procedures
(a)(i) The President and Treasurer and the Chief Financial Officer have concluded that the trust’s disclosure controls and procedures (as defined in Rule 30a-3(c) under the Investment Company Act) provide reasonable assurances that material information relating to the trust is made known to them by the appropriate persons, based on their evaluation of these controls and procedures as of a date within 90 days of the filing date of this report.
(a)(ii) There was no change in the trust’s internal control over financial reporting (as defined in Rule 30a-3(d) under the Investment Company Act) that occurred during the period covered by this report that has materially affected, or is reasonably likely to materially affect, the trust’s internal control over financial reporting.
Item 17.
Disclosure of Securities Lending Activities for Closed-End Management Investment Companies
Not applicable.
Item 18.
Recovery of Erroneously Awarded Compensation
(a)
Not applicable.
(b)
Not applicable.
Item 19.
Exhibits
(a) | (1) | Code of Ethics pursuant to Item 2 of Form N-CSR is filed and attached hereto as EX-99.CODE ETH. |
(a) | (2) | |
(a) | (3) | Not applicable. |
(b) |
SIGNATURES
Pursuant to the requirements of the Securities Exchange Act of 1934 and the Investment Company Act of 1940, the registrant has duly caused this report to be signed on its behalf by the undersigned, thereunto duly authorized.
Fidelity Advisor Series I
By: | /s/Stacie M. Smith |
Stacie M. Smith | |
President and Treasurer (Principal Executive Officer) | |
Date: | December 20, 2024 |
Pursuant to the requirements of the Securities Exchange Act of 1934 and the Investment Company Act of 1940, this report has been signed below by the following persons on behalf of the registrant and in the capacities and on the dates indicated.
By: | /s/Stacie M. Smith |
Stacie M. Smith | |
President and Treasurer (Principal Executive Officer) | |
Date: | December 20, 2024 |
By: | /s/Stephanie Caron |
Stephanie Caron | |
Chief Financial Officer (Principal Financial Officer) | |
Date: | December 20, 2024 |