UNITED STATES
SECURITIES AND EXCHANGE COMMISSION
Washington, D.C. 20549
FORM N-CSR
CERTIFIED SHAREHOLDER REPORT OF REGISTERED
MANAGEMENT INVESTMENT COMPANIES
Investment Company Act file number 811-3785
Fidelity Advisor Series I
(Exact name of registrant as specified in charter)
245 Summer St., Boston, Massachusetts 02210
(Address of principal executive offices) (Zip code)
William C. Coffey, Secretary
245 Summer St.
Boston, Massachusetts 02210
(Name and address of agent for service)
Registrant's telephone number, including area code:
617-563-7000
Date of fiscal year end: | October 31 |
|
|
Date of reporting period: | October 31, 2018 |
Item 1.
Reports to Stockholders
Fidelity Advisor® Floating Rate High Income Fund Class A, Class M, Class C, Class I and Class Z Annual Report October 31, 2018 |
 |
Contents
To view a fund's proxy voting guidelines and proxy voting record for the 12-month period ended June 30, visit http://www.fidelity.com/proxyvotingresults or visit the Securities and Exchange Commission's (SEC) web site at http://www.sec.gov.
You may also call 1-877-208-0098 to request a free copy of the proxy voting guidelines.
Standard & Poor's, S&P and S&P 500 are registered service marks of The McGraw-Hill Companies, Inc. and have been licensed for use by Fidelity Distributors Corporation.
Other third-party marks appearing herein are the property of their respective owners.
All other marks appearing herein are registered or unregistered trademarks or service marks of FMR LLC or an affiliated company. © 2018 FMR LLC. All rights reserved.
This report and the financial statements contained herein are submitted for the general information of the shareholders of the Fund. This report is not authorized for distribution to prospective investors in the Fund unless preceded or accompanied by an effective prospectus.
A fund files its complete schedule of portfolio holdings with the SEC for the first and third quarters of each fiscal year on Form N-Q. Forms N-Q are available on the SEC’s web site at http://www.sec.gov. A fund's Forms N-Q may be reviewed and copied at the SEC’s Public Reference Room in Washington, DC. Information regarding the operation of the SEC's Public Reference Room may be obtained by calling 1-800-SEC-0330.
For a complete list of a fund's portfolio holdings, view the most recent holdings listing, semiannual report, or annual report on Fidelity's web site at http://www.fidelity.com, http://www.institutional.fidelity.com, or http://www.401k.com, as applicable.
NOT FDIC INSURED •MAY LOSE VALUE •NO BANK GUARANTEE
Neither the Fund nor Fidelity Distributors Corporation is a bank.
Performance: The Bottom Line
Average annual total return reflects the change in the value of an investment, assuming reinvestment of distributions from dividend income and capital gains (the profits earned upon the sale of securities that have grown in value, if any) and assuming a constant rate of performance each year. The hypothetical investment and the average annual total returns do not reflect the deduction of taxes that a shareholder would pay on fund distributions or the redemption of fund shares. During periods of reimbursement by Fidelity, a fund’s total return will be greater than it would be had the reimbursement not occurred. How a fund did yesterday is no guarantee of how it will do tomorrow.
Average Annual Total Returns
| For the periods ended October 31, 2018 | Past 1 year | Past 5 years | Past 10 years |
| Class A (incl. 2.75% sales charge) | 0.75% | 2.50% | 5.25% |
| Class M (incl. 2.75% sales charge) | 0.74% | 2.42% | 5.17% |
| Class C (incl. contingent deferred sales charge) | 1.83% | 2.31% | 4.75% |
| Class I | 3.84% | 3.32% | 5.79% |
| Class Z | 3.83% | 3.32% | 5.79% |
Class C shares' contingent deferred sales charges included in the past one year, past five years and past ten years total return figures are 1%, 0% and 0%, respectively.
The initial offering of Class Z shares took place on October 2, 2018. Returns prior to October 2, 2018, are those of Class I.
$10,000 Over 10 Years
Let's say hypothetically that $10,000 was invested in Fidelity Advisor® Floating Rate High Income Fund - Class A on October 31, 2008, and the current 2.75% sales charge was paid.
The chart shows how the value of your investment would have changed, and also shows how the S&P®/LSTA Leveraged Performing Loan Index performed over the same period.
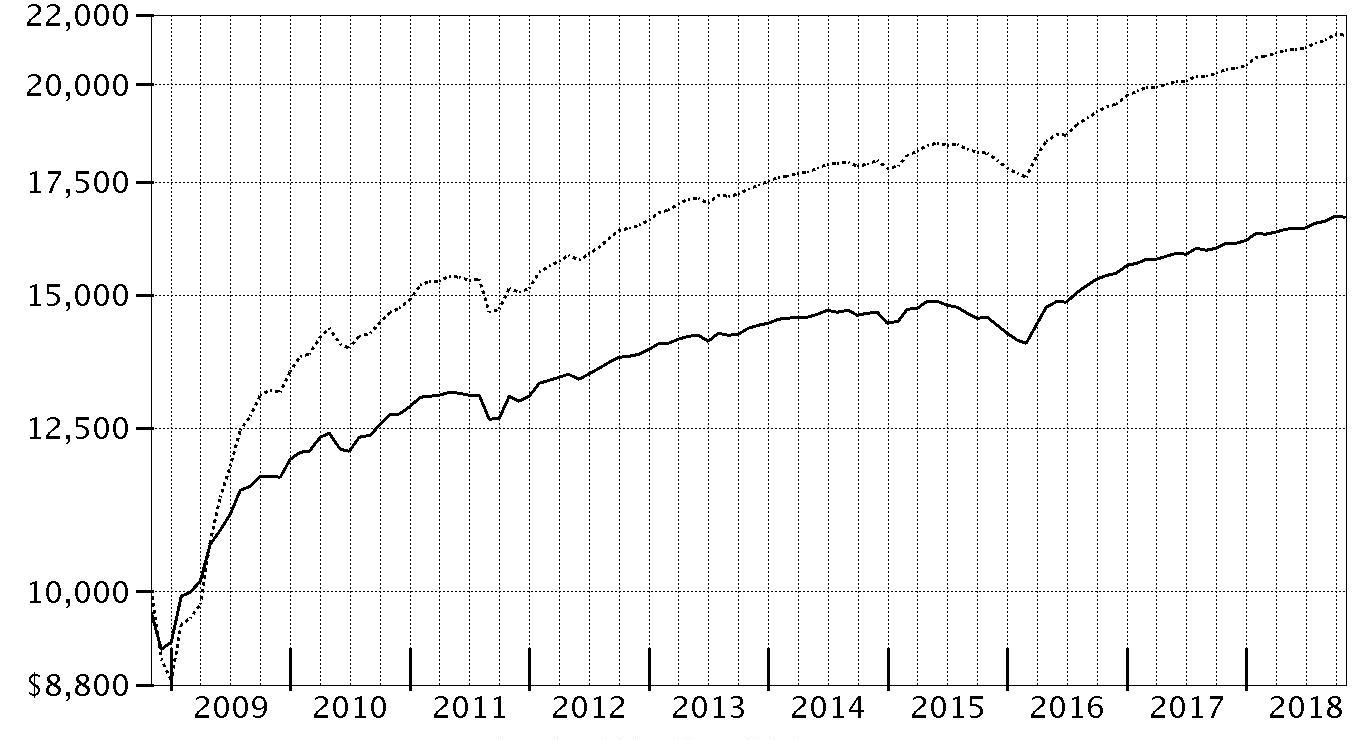
| Period Ending Values | ||
| $16,674 | Fidelity Advisor® Floating Rate High Income Fund - Class A | |
| $21,413 | S&P®/LSTA Leveraged Performing Loan Index | |
Management's Discussion of Fund Performance
Market Recap: Floating-rate bank loans posted a solid 4.78% gain for the 12 months ending October 31, 2018, as measured by the S&P/LSTA® Leveraged Performing Loan Index. This result handily outpaced both high-yield bonds and the broad investment-grade fixed-income market. Loans generated positive results in the early months of the period, led by a gain of 1.01% in January, as investors refocused their attention on interest rate risk amid rising U.S. Treasury yields. The asset class was relatively immune to the volatility that hampered stocks and credit in February and March, posting a modestly positive return in each month. Loan prices rose during the first half of April, then gave back some of that advance, as rising interest rates began to weigh on investors’ risk appetite. Following modest returns in May and June amid concerns about global trade, loans rode strong corporate earnings and robust U.S. economic growth to solid gains from July through September. Loans registered a nominal decline in October, as investor sentiment became risk-averse. Every industry in the index generated positive performance, with retailers (+8%), radio & television (+8%), and oil & gas (+7%) leading the way. On the downside, among larger index members, containers & glass products, cable & satellite TV, and lodging & casinos each returned about 4%, but lagged the broader market. From a credit-quality perspective, lower-quality loans did best, reflecting investor confidence amid a solid fundamental backdrop.Comments from Portfolio Manager Eric Mollenhauer: For the fiscal year, the fund's share classes (excluding sales charges, if applicable) gained about 3% to 4%, trailing the benchmark S&P/LSTA® Leveraged Performing Loan Index. The fund’s conservative credit-quality positioning – reflecting my moderate-risk, core strategy – along with a disappointing result from one underlying holding, were the primary factors dampening the fund's performance versus the benchmark. That said, I was pleased with the fund’s result during a period when lower-quality credits led the market. The biggest individual relative detractors were generic-drug maker Lannett and radio station operator Clear Channel Communications (now called iHeartMedia). In August, Lannett announced it will lose a key supply contract, while Clear Channel was hurt when the firm filed for bankruptcy protection in mid-March. On the plus side, the top individual relative contributors were an out-of-benchmark equity position in Warrior Met Coal, which returned about 112% for the period, and not owning underperforming loans issued by Catalina Marketing Group, a benchmark member that produces grocery store coupons and other retail promotional material. This period, I found investment opportunities in the new-issue market that I believe provide the fund with a predictable income stream for six months or more.The views expressed above reflect those of the portfolio manager(s) only through the end of the period as stated on the cover of this report and do not necessarily represent the views of Fidelity or any other person in the Fidelity organization. Any such views are subject to change at any time based upon market or other conditions and Fidelity disclaims any responsibility to update such views. These views may not be relied on as investment advice and, because investment decisions for a Fidelity fund are based on numerous factors, may not be relied on as an indication of trading intent on behalf of any Fidelity fund.
Note to shareholders: On November 1, 2018, Kevin Nielsen assumed co-management responsibilities for the fund.Investment Summary (Unaudited)
Top Five Holdings as of October 31, 2018
| (by issuer, excluding cash equivalents) | % of fund's net assets |
| Bass Pro Shops LLC. | 2.4 |
| Caesars Resort Collection LLC | 2.1 |
| Intelsat Jackson Holdings SA | 1.9 |
| Albertson's LLC | 1.7 |
| Frontier Communications Corp. | 1.7 |
| 9.8 |
Top Five Market Sectors as of October 31, 2018
| % of fund's net assets | |
| Technology | 14.3 |
| Gaming | 8.1 |
| Telecommunications | 8.0 |
| Services | 6.7 |
| Energy | 5.9 |
Quality Diversification (% of fund's net assets)
| As of October 31, 2018 | ||
| BBB | 4.5% | |
| BB | 33.5% | |
| B | 50.0% | |
| CCC,CC,C | 5.3% | |
| Not Rated | 1.3% | |
| Equities | 0.8% | |
| Short-Term Investments and Net Other Assets | 4.6% | |

We have used ratings from Moody's Investors Service, Inc. Where Moody's® ratings are not available, we have used S&P® ratings. All ratings are as of the date indicated and do not reflect subsequent changes.
Asset Allocation (% of fund's net assets)
| As of October 31, 2018* | ||
| Bank Loan Obligations | 90.3% | |
| Nonconvertible Bonds | 4.3% | |
| Common Stocks | 0.8% | |
| Short-Term Investments and Net Other Assets (Liabilities) | 4.6% | |

* Foreign investments - 11.2%
Schedule of Investments October 31, 2018
Showing Percentage of Net Assets
| Bank Loan Obligations - 90.3%(a) | |||
| Principal Amount (000s) | Value (000s) | ||
| Aerospace - 1.5% | |||
| DAE Aviation Holdings, Inc. Tranche B, term loan 3 month U.S. LIBOR + 3.750% 6.05% 7/7/22 (b)(c) | $16,157 | $16,199 | |
| TransDigm, Inc.: | |||
| Tranche E, term loan 3 month U.S. LIBOR + 2.500% 4.802% 5/30/25 (b)(c) | 28,111 | 27,943 | |
| Tranche F, term loan 3 month U.S. LIBOR + 2.500% 4.802% 6/9/23 (b)(c) | 29,329 | 29,172 | |
| Tranche G, term loan 3 month U.S. LIBOR + 2.500% 4.802% 8/22/24 (b)(c) | 63,202 | 62,872 | |
| Wesco Aircraft Hardware Corp. Tranche B, term loan 3 month U.S. LIBOR + 2.500% 4.81% 2/28/21 (b)(c) | 21,577 | 21,415 | |
| WP CPP Holdings LLC: | |||
| Tranche B 1LN, term loan 3 month U.S. LIBOR + 3.750% 6.2794% 4/30/25 (b)(c) | 22,500 | 22,566 | |
| Tranche B 2LN, term loan 3 month U.S. LIBOR + 7.750% 10.28% 4/30/26 (b)(c) | 5,665 | 5,640 | |
| TOTAL AEROSPACE | 185,807 | ||
| Air Transportation - 0.3% | |||
| Transplace Holding, Inc. Tranche B 1LN, term loan 3 month U.S. LIBOR + 3.750% 6.0395% 10/5/24 (b)(c) | 11,431 | 11,450 | |
| XPO Logistics, Inc. Tranche B, term loan 3 month U.S. LIBOR + 2.000% 4.5093% 2/23/25 (b)(c) | 20,990 | 21,016 | |
| TOTAL AIR TRANSPORTATION | 32,466 | ||
| Automotive & Auto Parts - 0.9% | |||
| Caliber Holdings Corp.: | |||
| Tranche 1LN, term loan 3 month U.S. LIBOR + 3.000% 5.302% 2/1/24 (b)(c) | 9,743 | 9,737 | |
| Tranche 2LN, term loan 3 month U.S. LIBOR + 7.250% 9.552% 2/1/25 (b)(c) | 2,710 | 2,724 | |
| Chrysler Group LLC term loan 3 month U.S. LIBOR + 2.000% 4.3% 12/31/18 (b)(c) | 7,147 | 7,151 | |
| Hertz Corp. Tranche B 1LN, term loan 3 month U.S. LIBOR + 2.750% 5.06% 6/30/23 (b)(c) | 33,506 | 33,285 | |
| North American Lifting Holdings, Inc.: | |||
| Tranche 1LN, term loan 3 month U.S. LIBOR + 4.500% 6.8861% 11/27/20 (b)(c) | 16,199 | 15,389 | |
| Tranche 2LN, term loan 3 month U.S. LIBOR + 9.000% 11.3861% 11/27/21 (b)(c) | 24,370 | 21,007 | |
| The Gates Corp. Tranche B 1LN, term loan 3 month U.S. LIBOR + 2.750% 5.052% 3/31/24 (b)(c) | 13,136 | 13,142 | |
| UOS LLC Tranche B 1LN, term loan 3 month U.S. LIBOR + 5.500% 7.8002% 4/18/23 (b)(c) | 14,941 | 15,165 | |
| TOTAL AUTOMOTIVE & AUTO PARTS | 117,600 | ||
| Banks & Thrifts - 0.0% | |||
| Lions Gate Capital Holdings Ll Tranche B, term loan 3 month U.S. LIBOR + 2.250% 4.552% 3/24/25 (b)(c) | 4,987 | 4,966 | |
| Broadcasting - 1.5% | |||
| AppLovin Corp. Tranche B, term loan 3 month U.S. LIBOR + 3.750% 6.0638% 8/15/25 (b)(c) | 36,000 | 36,360 | |
| CBS Radio, Inc. Tranche B 1LN, term loan 3 month U.S. LIBOR + 2.750% 5.0365% 11/18/24 (b)(c) | 48,146 | 47,881 | |
| Clear Channel Communications, Inc. Tranche D, term loan 3 month U.S. LIBOR + 6.750% 0% 1/30/19 (c)(d) | 53,680 | 38,665 | |
| ION Media Networks, Inc. Tranche B, term loan 3 month U.S. LIBOR + 2.750% 5.05% 12/18/20 (b)(c) | 19,147 | 19,159 | |
| NEP/NCP Holdco, Inc.: | |||
| Tranche B 1LN, term loan 3 month U.S. LIBOR + 3.250% 5.4743% 10/19/25 (b)(c) | 7,400 | 7,426 | |
| Tranche B 2LN, term loan 3 month U.S. LIBOR + 7.000% 9.302% 10/19/26 (b)(c) | 7,500 | 7,500 | |
| Raycom Media, Inc. Tranche B, term loan 3 month U.S. LIBOR + 2.250% 4.552% 8/23/24 (b)(c) | 26,973 | 26,973 | |
| TOTAL BROADCASTING | 183,964 | ||
| Building Materials - 0.6% | |||
| GYP Holdings III Corp. Tranche B 1LN, term loan 3 month U.S. LIBOR + 2.750% 5.052% 6/1/25 (b)(c) | 15,149 | 14,909 | |
| Hamilton Holdco LLC Tranche B 1LN, term loan 3 month U.S. LIBOR + 2.000% 4.4% 7/2/25 (b)(c) | 18,454 | 18,477 | |
| HD Supply, Inc. Tranche B 5LN, term loan 3 month U.S. LIBOR + 1.750% 4.0296% 10/17/23 (b)(c) | 8,100 | 8,092 | |
| Jeld-Wen, Inc. Tranche B, term loan 3 month U.S. LIBOR + 2.000% 4.3861% 12/14/24 (b)(c) | 9,057 | 9,017 | |
| Traverse Midstream Partners Ll Tranche B, term loan 3 month U.S. LIBOR + 4.000% 6.6% 9/27/24 (b)(c) | 21,045 | 21,163 | |
| TOTAL BUILDING MATERIALS | 71,658 | ||
| Cable/Satellite TV - 3.2% | |||
| Altice U.S. Finance SA: | |||
| Tranche B, term loan 3 month U.S. LIBOR + 2.250% 4.552% 7/28/25 (b)(c) | 30,043 | 29,975 | |
| Tranche B3 1LN, term loan 3 month U.S. LIBOR + 2.250% 1/11/26 (c)(e) | 30,500 | 30,414 | |
| Cable One, Inc. Tranche B, term loan 3 month U.S. LIBOR + 1.750% 4.14% 5/1/24 (b)(c) | 7,870 | 7,865 | |
| Charter Communication Operating LLC Tranche B, term loan 3 month U.S. LIBOR + 2.000% 4.31% 4/30/25 (b)(c) | 166,601 | 166,581 | |
| CSC Holdings LLC Tranche B, term loan 3 month U.S. LIBOR + 2.500% 4.7795% 1/25/26 (b)(c) | 33,815 | 33,741 | |
| MCC Iowa LLC Tranche M, term loan 3 month U.S. LIBOR + 2.000% 4.22% 1/15/25 (b)(c) | 6,336 | 6,322 | |
| Numericable LLC: | |||
| Tranche B 12LN, term loan 3 month U.S. LIBOR + 3.688% 5.967% 1/31/26 (b)(c) | 3,333 | 3,246 | |
| Tranche B 13LN, term loan 3 month U.S. LIBOR + 4.000% 6.2795% 8/14/26 (b)(c) | 36,750 | 35,946 | |
| Virgin Media Bristol LLC Tranche B, term loan 3 month U.S. LIBOR + 2.500% 4.7795% 1/15/26 (b)(c) | 35,000 | 34,960 | |
| WideOpenWest Finance LLC Tranche B, term loan 3 month U.S. LIBOR + 3.250% 5.5395% 8/19/23 (b)(c) | 62,015 | 59,690 | |
| TOTAL CABLE/SATELLITE TV | 408,740 | ||
| Capital Goods - 0.5% | |||
| AECOM Tranche B, term loan 3 month U.S. LIBOR + 1.750% 4.052% 3/13/25 (b)(c) | 13,880 | 13,880 | |
| Altra Industrial Motion Corp. Tranche B 1LN, term loan 3 month U.S. LIBOR + 2.000% 4.302% 10/1/25 (b)(c) | 22,375 | 22,347 | |
| Apergy Corp. Tranche B, term loan 3 month U.S. LIBOR + 2.500% 4.8125% 5/9/25 (b)(c) | 8,785 | 8,802 | |
| CPM Holdings, Inc.: | |||
| 2LN, term loan 1 month U.S. LIBOR + 8.250% 10/24/26 (c)(e) | 3,655 | 3,652 | |
| Tranche B 1LN, term loan 3 month U.S. LIBOR + 3.750% 10/24/25 (c)(e) | 12,105 | 12,145 | |
| Doosan Bobcat Tranche B, term loan 3 month U.S. LIBOR + 2.000% 4.3775% 5/18/24 (b)(c) | 8,354 | 8,335 | |
| TOTAL CAPITAL GOODS | 69,161 | ||
| Chemicals - 2.5% | |||
| ASP Chromaflo Intermediate Holdings, Inc. Tranche B 1LN, term loan 3 month U.S. LIBOR + 3.500% 5.802% 11/18/23 (b)(c) | 11,761 | 11,731 | |
| Invictus U.S. Newco LLC: | |||
| Tranche 1LN, term loan 3 month U.S. LIBOR + 3.000% 5.302% 3/28/25 (b)(c) | 13,104 | 13,148 | |
| Tranche 2LN, term loan 3 month U.S. LIBOR + 6.750% 9.052% 3/28/26 (b)(c) | 5,500 | 5,459 | |
| MacDermid, Inc.: | |||
| Tranche B 6LN, term loan 3 month U.S. LIBOR + 3.000% 4% 6/7/23 (b)(c) | 23,587 | 23,592 | |
| Tranche B 7LN, term loan 3 month U.S. LIBOR + 2.500% 4.802% 6/7/20 (b)(c) | 12,057 | 12,057 | |
| Messer Industrie GmbH Tranche B 1LN, term loan 3 month U.S. LIBOR + 2.500% 9/28/25 (c)(e) | 41,500 | 41,490 | |
| Oxea Corp. Tranche B2, term loan 3 month U.S. LIBOR + 3.500% 5.9375% 10/11/24 (b)(c) | 27,807 | 27,877 | |
| PQ Corp. Tranche B, term loan 3 month U.S. LIBOR + 2.500% 5.0266% 2/8/25 (b)(c) | 6,995 | 6,982 | |
| Starfruit U.S. Holdco LLC Tranche B, term loan 3 month U.S. LIBOR + 3.250% 5.506% 10/1/25 (b)(c) | 74,230 | 73,952 | |
| The Chemours Co. LLC Tranche B 1LN, term loan 3 month U.S. LIBOR + 1.750% 4.05% 4/3/25 (b)(c) | 17,699 | 17,622 | |
| Trinseo Materials Operating SCA/Trinseo Materials Finance, Inc. term loan 3 month U.S. LIBOR + 2.000% 4.302% 9/6/24 (b)(c) | 15,098 | 14,972 | |
| Tronox Blocked Borrower LLC Tranche B, term loan 3 month U.S. LIBOR + 3.000% 5.302% 9/22/24 (b)(c) | 12,152 | 12,135 | |
| Tronox Finance LLC Tranche B, term loan 3 month U.S. LIBOR + 3.000% 5.302% 9/22/24 (b)(c) | 28,044 | 28,004 | |
| Univar, Inc. Tranche B, term loan 3 month U.S. LIBOR + 2.250% 4.552% 7/1/24 (b)(c) | 12,250 | 12,240 | |
| W. R. Grace & Co.-Conn.: | |||
| Tranche B 1LN, term loan 3 month U.S. LIBOR + 1.750% 4.1361% 4/3/25 (b)(c) | 5,565 | 5,566 | |
| Tranche B 2LN, term loan 3 month U.S. LIBOR + 1.750% 4.1361% 4/3/25 (b)(c) | 9,540 | 9,542 | |
| TOTAL CHEMICALS | 316,369 | ||
| Consumer Products - 1.0% | |||
| Coty, Inc. Tranche B 1LN, term loan 3 month U.S. LIBOR + 2.250% 4.5306% 4/5/25 (b)(c) | 14,930 | 14,606 | |
| CSM Bakery Supplies Tranche B 1LN, term loan 3 month U.S. LIBOR + 4.000% 6.41% 7/3/20 (b)(c) | 9,781 | 9,398 | |
| Owens & Minor Distribution, Inc. Tranche B, term loan 3 month U.S. LIBOR + 4.500% 6.756% 4/30/25 (b)(c) | 27,431 | 24,825 | |
| Prestige Brands, Inc. term loan 3 month U.S. LIBOR + 2.000% 4.302% 1/26/24 (b)(c) | 9,622 | 9,630 | |
| Rodan & Fields LLC Tranche B, term loan 3 month U.S. LIBOR + 4.000% 6.2795% 6/15/25 (b)(c) | 9,471 | 9,519 | |
| Weight Watchers International, Inc. Tranche B, term loan 3 month U.S. LIBOR + 4.750% 7.15% 11/29/24 (b)(c) | 56,306 | 56,553 | |
| TOTAL CONSUMER PRODUCTS | 124,531 | ||
| Containers - 1.4% | |||
| Berry Global, Inc.: | |||
| Tranche Q, term loan 3 month U.S. LIBOR + 2.000% 4.2767% 10/1/22 (b)(c) | 18,400 | 18,386 | |
| Tranche R, term loan 3 month U.S. LIBOR + 2.000% 4.2767% 1/19/24 (b)(c) | 9,850 | 9,832 | |
| Tranche S, term loan 3 month U.S. LIBOR + 1.750% 4.0267% 2/8/20 (b)(c) | 39,041 | 38,964 | |
| Tranche T, term loan 3 month U.S. LIBOR + 1.750% 4.0267% 1/6/21 (b)(c) | 8,592 | 8,569 | |
| BWAY Holding Co. Tranche B, term loan 3 month U.S. LIBOR + 3.250% 5.6581% 4/3/24 (b)(c) | 8,147 | 8,094 | |
| Charter Nex U.S., Inc. Tranche B 1LN, term loan 3 month U.S. LIBOR + 3.000% 5.052% 5/16/24 (b)(c) | 9,564 | 9,542 | |
| Consolidated Container Co. Tranche B 1LN, term loan 3 month U.S. LIBOR + 2.750% 5.052% 5/22/24 (b)(c) | 17,726 | 17,726 | |
| Crown Americas LLC Tranche B 1LN, term loan 3 month U.S. LIBOR + 2.000% 4.2832% 4/3/25 (b)(c) | 16,848 | 16,857 | |
| Hostess Brands LLC Tranche B, term loan 3 month U.S. LIBOR + 2.250% 4.6852% 8/3/22 (b)(c) | 11,849 | 11,779 | |
| Plastipak Packaging, Inc. Tranche B, term loan 3 month U.S. LIBOR + 2.500% 4.81% 10/14/24 (b)(c) | 6,296 | 6,277 | |
| Reynolds Group Holdings, Inc. Tranche B, term loan 3 month U.S. LIBOR + 2.750% 5.052% 2/5/23 (b)(c) | 32,559 | 32,559 | |
| TOTAL CONTAINERS | 178,585 | ||
| Diversified Financial Services - 4.1% | |||
| AlixPartners LLP Tranche B, term loan 3 month U.S. LIBOR + 2.750% 5.052% 4/4/24 (b)(c) | 28,334 | 28,334 | |
| Avolon TLB Borrower 1 (U.S.) LLC Tranche B3 1LN, term loan 3 month U.S. LIBOR + 2.000% 4.2796% 1/15/25 (b)(c) | 15,606 | 15,556 | |
| Bcp Renaissance Parent LLC Tranche B, term loan 3 month U.S. LIBOR + 3.500% 6.0266% 10/31/24 (b)(c) | 26,454 | 26,520 | |
| Cypress Intermediate Holdings, Inc. Tranche B 1LN, term loan 3 month U.S. LIBOR + 3.000% 5.31% 4/27/24 (b)(c) | 25,359 | 25,364 | |
| Deerfield Holdings Corp. Tranche B, term loan 3 month U.S. LIBOR + 3.250% 5.552% 2/13/25 (b)(c) | 17,572 | 17,535 | |
| Delos Finance SARL Tranche B, term loan 3 month U.S. LIBOR + 1.750% 4.1361% 10/6/23 (b)(c) | 33,095 | 33,122 | |
| Financial & Risk U.S. Holdings, Inc. Tranche B, term loan 3 month U.S. LIBOR + 3.750% 6.052% 10/1/25 (b)(c) | 75,500 | 74,682 | |
| Finco I LLC Tranche B, term loan 3 month U.S. LIBOR + 2.000% 4.302% 12/27/22 (b)(c) | 19,400 | 19,375 | |
| Fly Funding II SARL Tranche B, term loan 3 month U.S. LIBOR + 2.000% 4.34% 2/9/23 (b)(c) | 35,402 | 35,313 | |
| Flying Fortress Holdings, Inc. Tranche B, term loan 3 month U.S. LIBOR + 1.750% 4.1361% 10/30/22 (b)(c) | 67,865 | 68,006 | |
| Focus Financial Partners LLC Tranche B 1LN, term loan 3 month U.S. LIBOR + 2.500% 4.802% 7/3/24 (b)(c) | 10,820 | 10,827 | |
| Franklin Square Holdings LP Tranche B, term loan 3 month U.S. LIBOR + 2.500% 4.8125% 8/3/25 (b)(c) | 11,500 | 11,529 | |
| Greensky Holdings LLC Tranche B, term loan 3 month U.S. LIBOR + 3.250% 5.5625% 3/29/25 (b)(c) | 8,458 | 8,479 | |
| HarbourVest Partners LLC Tranche B 1LN, term loan 3 month U.S. LIBOR + 2.250% 4.5295% 3/1/25 (b)(c) | 23,817 | 23,787 | |
| Kingpin Intermediate Holdings LLC Tranche B 1LN, term loan 3 month U.S. LIBOR + 3.500% 5.81% 7/3/24 (b)(c) | 7,425 | 7,456 | |
| NAB Holdings LLC Tranche B, term loan 3 month U.S. LIBOR + 3.000% 5.3861% 6/30/24 (b)(c) | 13,643 | 13,461 | |
| Recess Holdings, Inc. Tranche B, term loan 3 month U.S. LIBOR + 3.750% 6.0946% 9/29/24 (b)(c) | 9,488 | 9,464 | |
| SAI Global GP Tranche B, term loan 3 month U.S. LIBOR + 4.500% 6.7949% 12/8/23 (b)(c) | 13,509 | 12,564 | |
| TransUnion LLC: | |||
| Tranche B 4LN, term loan 3 month U.S. LIBOR + 2.000% 4.302% 6/19/25 (b)(c) | 16,708 | 16,663 | |
| Tranche B, term loan 3 month U.S. LIBOR + 2.000% 4.302% 4/9/23 (b)(c) | 36,702 | 36,614 | |
| UFC Holdings LLC Tranche B 1LN, term loan 3 month U.S. LIBOR + 3.250% 5.56% 8/18/23 (b)(c) | 18,988 | 19,085 | |
| TOTAL DIVERSIFIED FINANCIAL SERVICES | 513,736 | ||
| Diversified Media - 0.1% | |||
| Lamar Media Corp. Tranche B, term loan 3 month U.S. LIBOR + 1.750% 4.0625% 3/16/25 (b)(c) | 15,801 | 15,820 | |
| Energy - 4.7% | |||
| Arctic LNG Carriers Ltd. Tranche B 1LN, term loan 3 month U.S. LIBOR + 4.500% 6.802% 5/18/23 (b)(c) | 31,884 | 31,884 | |
| BCP Raptor II LLC Tranche B, term loan 3 month U.S. LIBOR + 4.750% 10/22/25 (c)(e) | 30,000 | 29,775 | |
| BCP Raptor LLC Tranche B, term loan 3 month U.S. LIBOR + 4.250% 6.6411% 6/22/24 (b)(c) | 44,050 | 43,413 | |
| Brazos Delaware II LLC Tranche B, term loan 3 month U.S. LIBOR + 4.000% 6.282% 5/21/25 (b)(c) | 14,394 | 14,279 | |
| California Resources Corp.: | |||
| Tranche 1LN, term loan 3 month U.S. LIBOR + 10.375% 12.6699% 12/31/21 (b)(c) | 80,300 | 89,334 | |
| Tranche B, term loan 3 month U.S. LIBOR + 4.750% 7.0365% 12/31/22 (b)(c) | 49,400 | 50,059 | |
| Calpine Construction Finance Co. LP Tranche B, term loan 3 month U.S. LIBOR + 2.500% 4.802% 1/15/25 (b)(c) | 9,925 | 9,906 | |
| Citgo Petroleum Corp. Tranche B, term loan 3 month U.S. LIBOR + 3.500% 5.896% 7/29/21 (b)(c) | 30,244 | 30,194 | |
| Consolidated Energy Finance SA Tranche B, term loan 3 month U.S. LIBOR + 2.500% 4.7841% 5/7/25 (b)(c) | 57,356 | 57,069 | |
| Delek U.S. Holdings, Inc. Tranche B 1LN, term loan 3 month U.S. LIBOR + 2.500% 4.5441% 3/13/25 (b)(c) | 9,448 | 9,440 | |
| EG America LLC Tranche B 1LN, term loan 3 month U.S. LIBOR + 4.000% 2/6/25 (c)(e) | 3,820 | 3,819 | |
| Empire Generating Co. LLC: | |||
| Tranche B, term loan 3 month U.S. LIBOR + 4.250% 6.64% 3/14/21 (b)(c) | 8,549 | 6,391 | |
| Tranche C, term loan 3 month U.S. LIBOR + 4.250% 6.64% 3/14/21 (b)(c) | 845 | 632 | |
| Energy Transfer Equity LP Tranche B, term loan 3 month U.S. LIBOR + 2.000% 4.302% 2/2/24 (b)(c) | 15,542 | 15,531 | |
| Foresight Energy LLC Tranche B 1LN, term loan 3 month U.S. LIBOR + 5.750% 8.2766% 3/28/22 (b)(c) | 14,068 | 14,095 | |
| FTS International, Inc. Tranche B, term loan 3 month U.S. LIBOR + 4.750% 7.052% 4/16/21 (b)(c) | 7,740 | 7,727 | |
| Gavilan Resources LLC Tranche 2LN, term loan 3 month U.S. LIBOR + 6.000% 8.2796% 3/1/24 (b)(c) | 43,425 | 40,446 | |
| GIM Channelview Cogeneration LLC Tranche B, term loan 3 month U.S. LIBOR + 4.250% 6.56% 5/3/25 (b)(c) | 1,875 | 1,887 | |
| GIP III Stetson I LP Tranche B, term loan 3 month U.S. LIBOR + 4.250% 6.6946% 7/18/25 (b)(c) | 66,560 | 66,643 | |
| Gulf Finance LLC Tranche B 1LN, term loan 3 month U.S. LIBOR + 5.250% 7.64% 8/25/23 (b)(c) | 29,085 | 23,765 | |
| Medallion Midland Acquisition Tranche B, term loan 3 month U.S. LIBOR + 3.250% 5.552% 10/30/24 (b)(c) | 18,543 | 18,404 | |
| Natgasoline LLC Tranche B, term loan 3 month U.S. LIBOR + 3.500% 5.9446% 10/31/25 (b)(c) | 23,770 | 23,800 | |
| TerraForm Power Operating LLC Tranche B, term loan 3 month U.S. LIBOR + 2.000% 4.302% 11/8/22 (b)(c) | 6,198 | 6,198 | |
| TOTAL ENERGY | 594,691 | ||
| Entertainment/Film - 0.4% | |||
| AMC Entertainment Holdings, Inc. Tranche B, term loan 3 month U.S. LIBOR + 2.250% 4.5295% 12/15/23 (b)(c) | 7,555 | 7,542 | |
| AMC Entertainment, Inc. Tranche B, term loan 3 month U.S. LIBOR + 2.250% 4.5295% 12/15/22 (b)(c) | 4,899 | 4,891 | |
| CDS U.S. Intermediate Holdings, Inc.: | |||
| Tranche B 1LN, term loan 3 month U.S. LIBOR + 3.750% 6.1361% 7/8/22 (b)(c) | 19,262 | 19,002 | |
| Tranche B 2LN, term loan 3 month U.S. LIBOR + 8.250% 10.6361% 7/8/23 (b)(c) | 5,305 | 5,093 | |
| Digital Cinema Implementation Partners,LLC Tranche B, term loan 3 month U.S. LIBOR + 2.500% 4.8173% 5/17/21 (b)(c) | 3,910 | 3,918 | |
| SMG U.S. Midco 2, Inc. Tranche B 1LN, term loan 3 month U.S. LIBOR + 3.000% 5.302% 1/23/25 (b)(c) | 10,124 | 10,105 | |
| TOTAL ENTERTAINMENT/FILM | 50,551 | ||
| Environmental - 0.4% | |||
| Hd Supply Waterworks Ltd. Tranche B, term loan 3 month U.S. LIBOR + 3.000% 5.3167% 8/1/24 (b)(c) | 6,074 | 6,066 | |
| The Brickman Group, Ltd. Tranche B, term loan 3 month U.S. LIBOR + 2.500% 4.8125% 8/15/25 (b)(c) | 13,965 | 13,961 | |
| Tunnel Hill Partners LP Tranche B 1LN, term loan 3 month U.S. LIBOR + 3.500% 10/1/25 (c)(e) | 5,750 | 5,710 | |
| Wrangler Buyer Corp. Tranche B, term loan 3 month U.S. LIBOR + 2.750% 5.0059% 9/28/24 (b)(c) | 13,410 | 13,412 | |
| WTG Holdings III Corp. Tranche B 1LN, term loan 3 month U.S. LIBOR + 3.000% 5.302% 12/20/24 (b)(c) | 15,567 | 15,518 | |
| TOTAL ENVIRONMENTAL | 54,667 | ||
| Food & Drug Retail - 4.1% | |||
| Agro Merchants Intermediate Ho Tranche B, term loan 3 month U.S. LIBOR + 3.750% 6.1361% 12/6/24 (b)(c) | 4,964 | 4,979 | |
| Albertson's LLC: | |||
| Tranche B 7LN, term loan 3 month U.S. LIBOR + 3.000% 5.4874% 10/29/25 (b)(c) | 38,750 | 38,419 | |
| Tranche B, term loan 3 month U.S. LIBOR + 2.750% 5.052% 8/25/21 (b)(c) | 172,681 | 172,347 | |
| BI-LO LLC Tranche B, term loan 3 month U.S. LIBOR + 8.000% 10.3645% 5/31/24 (b)(c) | 62,094 | 61,241 | |
| GOBP Holdings, Inc.: | |||
| 2LN, term loan 3 month U.S. LIBOR + 7.250% 9.5296% 10/22/26 (b)(c) | 2,000 | 1,990 | |
| Tranche B 1LN, term loan 3 month U.S. LIBOR + 3.750% 6.0296% 10/22/25 (b)(c) | 14,250 | 14,214 | |
| JBS USA Lux SA Tranche B, term loan 3 month U.S. LIBOR + 2.500% 4.8444% 10/30/22 (b)(c) | 83,156 | 83,114 | |
| JP Intermediate B LLC Tranche B, term loan 3 month U.S. LIBOR + 5.500% 10/18/25 (c)(e) | 10,320 | 10,320 | |
| Lannett Co., Inc.: | |||
| Tranche B, term loan 3 month U.S. LIBOR + 4.750% 7.052% 11/25/20 (b)(c) | 1,726 | 1,601 | |
| Tranche B, term loan 3 month U.S. LIBOR + 5.375% 7.677% 11/25/22 (b)(c) | 74,229 | 59,680 | |
| RPI Finance Trust Tranche B 6LN, term loan 3 month U.S. LIBOR + 2.000% 4.3861% 3/27/23 (b)(c) | 46,807 | 46,815 | |
| Smart & Final, Inc. Tranche B, term loan 3 month U.S. LIBOR + 3.500% 5.802% 11/15/22 (b)(c) | 31,345 | 30,238 | |
| TOTAL FOOD & DRUG RETAIL | 524,958 | ||
| Food/Beverage/Tobacco - 1.1% | |||
| 8th Avenue Food & Provisions, Inc.: | |||
| 2LN, term loan 3 month U.S. LIBOR + 7.750% 10.006% 10/1/26 (b)(c) | 2,240 | 2,254 | |
| Tranche B 1LN, term loan 3 month U.S. LIBOR + 3.750% 6.006% 10/1/25 (b)(c) | 6,545 | 6,594 | |
| Arterra Wines Canada, Inc. Tranche B, term loan 3 month U.S. LIBOR + 2.750% 5.0875% 12/16/23 (b)(c) | 4,676 | 4,679 | |
| Chobani LLC Tranche B, term loan 3 month U.S. LIBOR + 3.500% 5.802% 10/7/23 (b)(c) | 37,548 | 36,633 | |
| Eg Finco Ltd. Tranche B, term loan 3 month U.S. LIBOR + 4.000% 6.3861% 2/6/25 (b)(c) | 7,512 | 7,510 | |
| Post Holdings, Inc. Tranche B, term loan 3 month U.S. LIBOR + 2.000% 4.29% 5/24/24 (b)(c) | 32,068 | 32,016 | |
| Shearer's Foods, Inc.: | |||
| Tranche 2LN, term loan 3 month U.S. LIBOR + 6.750% 9.052% 6/30/22 (b)(c) | 2,000 | 1,925 | |
| Tranche B 1LN, term loan 3 month U.S. LIBOR + 4.250% 6.552% 6/30/21 (b)(c) | 8,948 | 8,926 | |
| U.S. Foods, Inc. Tranche B, term loan 3 month U.S. LIBOR + 2.000% 4.302% 6/27/23 (b)(c) | 34,616 | 34,543 | |
| TOTAL FOOD/BEVERAGE/TOBACCO | 135,080 | ||
| Gaming - 7.9% | |||
| AP Gaming I LLC Tranche B, term loan 3 month U.S. LIBOR + 3.500% 5.802% 2/15/24 (b)(c) | 12,073 | 12,114 | |
| Aristocrat Technologies, Inc. Tranche B 3LN, term loan 3 month U.S. LIBOR + 1.750% 4.219% 10/19/24 (b)(c) | 30,358 | 30,234 | |
| Boyd Gaming Corp. Tranche B 1LN, term loan 3 month U.S. LIBOR + 2.250% 4.4669% 9/15/23 (b)(c) | 21,914 | 21,922 | |
| Caesars Resort Collection LLC Tranche B 1LN, term loan 3 month U.S. LIBOR + 2.750% 5.052% 12/22/24 (b)(c) | 267,975 | 267,937 | |
| Churchill Downs, Inc. Tranche B, term loan 3 month U.S. LIBOR + 2.000% 4.31% 12/27/24 (b)(c) | 7,756 | 7,766 | |
| CityCenter Holdings LLC Tranche B, term loan 3 month U.S. LIBOR + 2.250% 4.552% 4/18/24 (b)(c) | 30,446 | 30,360 | |
| Eldorado Resorts, Inc. Tranche B, term loan 3 month U.S. LIBOR + 2.250% 4.5625% 4/17/24 (b)(c) | 24,493 | 24,485 | |
| Gaming VC Holdings SA Tranche B2 1LN, term loan 3 month U.S. LIBOR + 2.500% 4.802% 3/15/24 (b)(c) | 22,666 | 22,711 | |
| Golden Entertainment, Inc. Tranche B, term loan: | |||
| 3 month U.S. LIBOR + 3.000% 5.3% 10/20/24 (b)(c) | 46,648 | 46,648 | |
| 3 month U.S. LIBOR + 7.000% 9.31% 10/20/25 (b)(c) | 7,500 | 7,538 | |
| Golden Nugget, Inc. Tranche B 1LN, term loan 3 month U.S. LIBOR + 2.750% 5.2299% 10/4/23 (b)(c) | 118,028 | 118,083 | |
| Las Vegas Sands LLC Tranche B, term loan 3 month U.S. LIBOR + 1.750% 4.052% 3/27/25 (b)(c) | 56,411 | 56,174 | |
| MGM Mirage, Inc. Tranche A, term loan 3 month U.S. LIBOR + 2.500% 4.802% 4/25/21 (b)(c) | 13,145 | 13,145 | |
| Mohegan Tribal Gaming Authority Tranche B, term loan 3 month U.S. LIBOR + 4.000% 6.302% 10/14/23 (b)(c) | 10,226 | 9,579 | |
| Penn National Gaming, Inc. Tranche B, term loan 3 month U.S. LIBOR + 2.250% 10/15/25 (c)(e) | 28,080 | 28,150 | |
| Scientific Games Corp. Tranche B 5LN, term loan 3 month U.S. LIBOR + 2.750% 5.0457% 8/14/24 (b)(c) | 132,439 | 131,067 | |
| Stars Group Holdings BV Tranche B, term loan 3 month U.S. LIBOR + 3.500% 5.8861% 7/10/25 (b)(c) | 85,037 | 85,344 | |
| Station Casinos LLC Tranche B, term loan 3 month U.S. LIBOR + 2.500% 4.81% 6/8/23 (b)(c) | 54,460 | 54,387 | |
| Wynn America LLC Tranche A 1LN, term loan 3 month U.S. LIBOR + 1.750% 4.06% 12/31/21 (b)(c) | 19,285 | 19,213 | |
| Wynn Resorts Ltd. Tranche B, term loan 3 month U.S. LIBOR + 2.250% 10/22/24 (c)(e) | 6,250 | 6,215 | |
| Yonkers Racing Corp. Tranche B 1LN, term loan 3 month U.S. LIBOR + 3.250% 5.56% 5/31/24 (b)(c) | 6,180 | 6,184 | |
| TOTAL GAMING | 999,256 | ||
| Healthcare - 4.4% | |||
| Accelerated Health Systems LLC Tranche B, term loan 3 month U.S. LIBOR + 3.250% 10/26/25 (c)(e) | 11,000 | 11,028 | |
| Akorn, Inc. Tranche B, term loan 3 month U.S. LIBOR + 4.750% 7% 4/17/21 (b)(c) | 3,805 | 3,511 | |
| Community Health Systems, Inc. Tranche H, term loan 3 month U.S. LIBOR + 3.250% 5.5626% 1/27/21 (b)(c) | 49,231 | 48,135 | |
| CVS Holdings I LP: | |||
| Tranche 2LN, term loan 3 month U.S. LIBOR + 6.750% 9.06% 2/6/26 (b)(c) | 2,000 | 1,978 | |
| Tranche B 1LN, term loan 3 month U.S. LIBOR + 3.000% 5.31% 2/6/25 (b)(c) | 9,045 | 9,003 | |
| HCA Holdings, Inc.: | |||
| Tranche B 10LN, term loan 3 month U.S. LIBOR + 2.000% 4.302% 3/13/25 (b)(c) | 24,875 | 24,968 | |
| Tranche B 11LN, term loan 3 month U.S. LIBOR + 1.750% 4.052% 3/18/23 (b)(c) | 49,529 | 49,688 | |
| HLF Financing SARL LLC Tranche B 1LN, term loan 3 month U.S. LIBOR + 3.250% 5.552% 8/18/25 (b)(c) | 33,565 | 33,684 | |
| Innoviva, Inc. Tranche B, term loan 3 month U.S. LIBOR + 4.500% 6.8119% 8/18/22 (b)(c) | 1,091 | 1,086 | |
| LifeScan Global Corp. Tranche B 1LN, term loan 3 month U.S. LIBOR + 6.000% 8.396% 10/1/24 (b)(c) | 20,840 | 20,328 | |
| MPH Acquisition Holdings LLC Tranche B, term loan 3 month U.S. LIBOR + 2.750% 5.1361% 6/7/23 (b)(c) | 16,196 | 16,142 | |
| Ortho-Clinical Diagnostics, Inc. Tranche B 1LN, term loan 3 month U.S. LIBOR + 3.250% 5.5441% 6/30/25 (b)(c) | 87,714 | 87,385 | |
| PAREXEL International Corp. Tranche B, term loan 3 month U.S. LIBOR + 2.750% 5.052% 9/27/24 (b)(c) | 32,709 | 32,198 | |
| Press Ganey Holdings, Inc. Tranche 1LN, term loan 3 month U.S. LIBOR + 2.750% 5.052% 10/21/23 (b)(c) | 11,272 | 11,275 | |
| Prospect Medical Holdings, Inc. Tranche 1LN, term loan 3 month U.S. LIBOR + 5.500% 7.8125% 2/22/24 (b)(c) | 15,801 | 15,880 | |
| U.S. Anesthesia Partners, Inc. Tranche B, term loan 3 month U.S. LIBOR + 3.000% 5.302% 6/23/24 (b)(c) | 11,192 | 11,182 | |
| U.S. Renal Care, Inc. Tranche B 1LN, term loan 3 month U.S. LIBOR + 4.250% 6.6361% 12/31/22 (b)(c) | 39,421 | 38,140 | |
| Valeant Pharmaceuticals International, Inc. Tranche B, term loan 3 month U.S. LIBOR + 3.000% 5.2739% 6/1/25 (b)(c) | 90,778 | 90,757 | |
| Vizient, Inc. Tranche B 3LN, term loan 3 month U.S. LIBOR + 2.750% 4.9922% 2/11/23 (b)(c) | 6,649 | 6,672 | |
| VVC Holding Corp. 1LN, term loan 3 month U.S. LIBOR + 4.250% 6.6863% 7/9/25 (b)(c) | 30,750 | 30,443 | |
| Wink Holdco, Inc. Tranche B, term loan 3 month U.S. LIBOR + 3.000% 5.302% 12/1/24 (b)(c) | 10,421 | 10,385 | |
| TOTAL HEALTHCARE | 553,868 | ||
| Homebuilders/Real Estate - 2.1% | |||
| DTZ U.S. Borrower LLC Tranche B, term loan 3 month U.S. LIBOR + 3.250% 5.552% 8/21/25 (b)(c) | 67,250 | 67,187 | |
| Forest City Enterprises LP Tranche B, term loan 3 month U.S. LIBOR + 4.000% 10/26/25 (c)(e) | 15,485 | 15,537 | |
| Lightstone Holdco LLC: | |||
| Tranche B 1LN, term loan 3 month U.S. LIBOR + 3.750% 6.052% 1/30/24 (b)(c) | 16,775 | 16,527 | |
| Tranche C 1LN, term loan 3 month U.S. LIBOR + 3.750% 6.052% 1/30/24 (b)(c) | 901 | 888 | |
| MGM Growth Properties Operating Partner LP Tranche B, term loan 3 month U.S. LIBOR + 2.000% 4.302% 3/23/25 (b)(c) | 39,438 | 39,297 | |
| Pisces Midco, Inc. Tranche B, term loan 3 month U.S. LIBOR + 3.750% 6.1752% 4/12/25 (b)(c) | 18,524 | 18,443 | |
| Realogy Group LLC Tranche B, term loan 3 month U.S. LIBOR + 2.250% 4.5295% 2/8/25 (b)(c) | 42,104 | 41,960 | |
| VICI Properties, LLC Tranche B 1LN, term loan 3 month U.S. LIBOR + 2.000% 4.2796% 12/22/24 (b)(c) | 70,593 | 70,380 | |
| TOTAL HOMEBUILDERS/REAL ESTATE | 270,219 | ||
| Hotels - 1.6% | |||
| ESH Hospitality, Inc. Tranche B, term loan 3 month U.S. LIBOR + 2.000% 4.302% 8/30/23 (b)(c) | 15,884 | 15,854 | |
| Four Seasons Holdings, Inc. Tranche B, term loan 3 month U.S. LIBOR + 2.000% 4.302% 11/30/23 (b)(c) | 57,476 | 57,445 | |
| Hilton Worldwide Finance LLC Tranche B 2LN, term loan 3 month U.S. LIBOR + 1.750% 4.0314% 10/25/23 (b)(c) | 61,530 | 61,568 | |
| Marriott Ownership Resorts, Inc. Tranche B, term loan 3 month U.S. LIBOR + 2.250% 4.552% 8/31/25 (b)(c) | 19,610 | 19,659 | |
| Ryman Hospitality Properties, Inc. Tranche B, term loan 3 month U.S. LIBOR + 2.000% 4.44% 5/11/24 (b)(c) | 9,850 | 9,830 | |
| Wyndham Hotels & Resorts, Inc. Tranche B, term loan 3 month U.S. LIBOR + 1.750% 4.052% 5/30/25 (b)(c) | 39,995 | 39,953 | |
| TOTAL HOTELS | 204,309 | ||
| Insurance - 3.2% | |||
| Acrisure LLC Tranche B, term loan 3 month U.S. LIBOR + 4.250% 6.552% 11/22/23 (b)(c) | 31,368 | 31,421 | |
| Alliant Holdings Intermediate LLC Tranche B, term loan 3 month U.S. LIBOR + 3.000% 5.2795% 5/10/25 (b)(c) | 38,975 | 38,921 | |
| AmWINS Group, Inc. Tranche B 1LN, term loan 3 month U.S. LIBOR + 2.750% 5.0471% 1/25/24 (b)(c) | 25,725 | 25,750 | |
| Asurion LLC: | |||
| Tranche B 6LN, term loan 3 month U.S. LIBOR + 3.000% 5.302% 11/3/23 (b)(c) | 54,178 | 54,200 | |
| Tranche B 7LN, term loan 3 month U.S. LIBOR + 3.000% 5.302% 11/3/24 (b)(c) | 23,441 | 23,454 | |
| Tranche B, term loan: | |||
| 3 month U.S. LIBOR + 3.000% 5.302% 8/4/22 (b)(c) | 39,513 | 39,548 | |
| 3 month U.S. LIBOR + 6.500% 8.802% 8/4/25 (b)(c) | 81,125 | 83,214 | |
| HUB International Ltd. Tranche B, term loan 3 month U.S. LIBOR + 3.000% 5.4895% 4/25/25 (b)(c) | 56,874 | 56,678 | |
| USI, Inc. Tranche B, term loan 3 month U.S. LIBOR + 3.000% 5.3861% 5/16/24 (b)(c) | 48,815 | 48,510 | |
| TOTAL INSURANCE | 401,696 | ||
| Leisure - 2.7% | |||
| 24 Hour Fitness Worldwide, Inc. Tranche B, term loan 3 month U.S. LIBOR + 3.500% 5.802% 5/31/25 (b)(c) | 12,957 | 12,969 | |
| Alterra Mountain Co. Tranche B 1LN, term loan 3 month U.S. LIBOR + 3.000% 5.302% 7/31/24 (b)(c) | 32,714 | 32,725 | |
| Crown Finance U.S., Inc. Tranche B 1LN, term loan 3 month U.S. LIBOR + 2.500% 4.802% 2/28/25 (b)(c) | 71,995 | 71,642 | |
| Delta 2 SARL Tranche B, term loan 3 month U.S. LIBOR + 2.500% 4.802% 2/1/24 (b)(c) | 92,913 | 91,868 | |
| Equinox Holdings, Inc.: | |||
| Tranche 2LN, term loan 3 month U.S. LIBOR + 7.000% 9.302% 9/8/24 (b)(c) | 7,325 | 7,465 | |
| Tranche B-1, term loan 3 month U.S. LIBOR + 3.000% 5.302% 3/8/24 (b)(c) | 19,696 | 19,738 | |
| Fitness International LLC Tranche B, term loan 3 month U.S. LIBOR + 3.250% 5.552% 4/18/25 (b)(c) | 9,322 | 9,331 | |
| LTF Merger Sub, Inc. Tranche B, term loan 3 month U.S. LIBOR + 2.750% 5.0626% 6/10/22 (b)(c) | 34,269 | 34,205 | |
| NVA Holdings, Inc. Tranche B 3LN, term loan 3 month U.S. LIBOR + 2.750% 5.052% 2/2/25 (b)(c) | 17,059 | 16,889 | |
| SeaWorld Parks & Entertainment, Inc. Tranche B 5LN, term loan 3 month U.S. LIBOR + 3.000% 4.6934% 3/31/24 (b)(c) | 9,500 | 9,471 | |
| Seminole Tribe of Florida Tranche B, term loan 3 month U.S. LIBOR + 1.750% 4.052% 7/6/24 (b)(c) | 23,760 | 23,786 | |
| Varsity Brands Holding Co., Inc. Tranche B 1LN, term loan 3 month U.S. LIBOR + 3.500% 5.802% 12/15/24 (b)(c) | 17,369 | 17,380 | |
| TOTAL LEISURE | 347,469 | ||
| Metals/Mining - 0.5% | |||
| American Rock Salt Co. LLC Tranche B, term loan 3 month U.S. LIBOR + 3.750% 6.052% 3/21/25 (b)(c) | 10,945 | 10,959 | |
| Murray Energy Corp. Tranche B 2LN, term loan 3 month U.S. LIBOR + 7.250% 9.7766% 10/17/22 (b)(c) | 55,208 | 49,411 | |
| TOTAL METALS/MINING | 60,370 | ||
| Paper - 0.8% | |||
| Caraustar Industries, Inc. Tranche B, term loan 3 month U.S. LIBOR + 5.500% 7.8861% 3/14/22 (b)(c) | 26,994 | 27,074 | |
| Flex Acquisition Co., Inc.: | |||
| Tranche B 1LN, term loan 3 month U.S. LIBOR + 3.000% 5.256% 12/29/23 (b)(c) | 30,407 | 30,318 | |
| Tranche B 1LN, term loan 3 month U.S. LIBOR + 3.250% 5.506% 6/29/25 (b)(c) | 39,701 | 39,722 | |
| TOTAL PAPER | 97,114 | ||
| Publishing/Printing - 2.0% | |||
| Cengage Learning, Inc. Tranche B, term loan 3 month U.S. LIBOR + 4.250% 6.5296% 6/7/23 (b)(c) | 55,563 | 51,413 | |
| Getty Images, Inc. Tranche B, term loan 3 month U.S. LIBOR + 3.500% 5.802% 10/18/19 (b)(c) | 30,659 | 30,275 | |
| Harland Clarke Holdings Corp. Tranche B 7LN, term loan 3 month U.S. LIBOR + 4.750% 7.1361% 11/3/23 (b)(c) | 35,671 | 33,352 | |
| Houghton Mifflin Harcourt Publishing, Inc. Tranche B, term loan 3 month U.S. LIBOR + 3.000% 5.2949% 5/29/21 (b)(c) | 33,796 | 30,966 | |
| Learning Care Group (U.S.) No 2 Tranche B 1LN, term loan 3 month U.S. LIBOR + 3.250% 5.5328% 3/13/25 (b)(c) | 10,846 | 10,832 | |
| McGraw-Hill Global Education Holdings, LLC term loan 3 month U.S. LIBOR + 4.000% 6.302% 5/4/22 (b)(c) | 53,642 | 51,396 | |
| Merrill Communications LLC Tranche B, term loan 3 month U.S. LIBOR + 5.250% 7.7766% 6/1/22 (b)(c) | 7,294 | 7,339 | |
| Proquest LLC Tranche B, term loan 3 month U.S. LIBOR + 3.250% 5.552% 10/24/21 (b)(c) | 6,786 | 6,801 | |
| Springer Science+Business Media Deutschland GmbH Tranche B 13LN, term loan 3 month U.S. LIBOR + 3.500% 5.8861% 8/24/22 (b)(c) | 31,378 | 31,456 | |
| TOTAL PUBLISHING/PRINTING | 253,830 | ||
| Restaurants - 1.2% | |||
| Burger King Worldwide, Inc. Tranche B, term loan 3 month U.S. LIBOR + 2.250% 4.552% 2/17/24 (b)(c) | 62,778 | 62,511 | |
| CEC Entertainment, Inc. Tranche B, term loan 3 month U.S. LIBOR + 3.250% 5.552% 2/14/21 (b)(c) | 25,664 | 24,458 | |
| K-Mac Holdings Corp.: | |||
| Tranche 2LN, term loan 3 month U.S. LIBOR + 6.750% 9.0296% 3/16/26 (b)(c) | 1,285 | 1,291 | |
| Tranche B 1LN, term loan 3 month U.S. LIBOR + 3.250% 5.5296% 3/16/25 (b)(c) | 4,453 | 4,452 | |
| KFC Holding Co. Tranche B, term loan 3 month U.S. LIBOR + 1.750% 4.0371% 4/3/25 (b)(c) | 24,503 | 24,478 | |
| Red Lobster Hospitality LLC Tranche B, term loan 3 month U.S. LIBOR + 5.250% 7.552% 7/28/21 (b)(c) | 20,574 | 20,420 | |
| Restaurant Technologies, Inc.: | |||
| 1LN, term loan 3 month U.S. LIBOR + 3.250% 5.646% 10/1/25 (b)(c) | 6,610 | 6,627 | |
| 2LN, term loan 3 month U.S. LIBOR + 6.500% 8.896% 10/1/26 (b)(c) | 2,000 | 2,010 | |
| Tacala Investment Corp. term loan 3 month U.S. LIBOR + 3.250% 5.552% 2/1/25 (b)(c) | 4,214 | 4,215 | |
| TOTAL RESTAURANTS | 150,462 | ||
| Services - 6.6% | |||
| Acosta, Inc. Tranche B, term loan 3 month U.S. LIBOR + 3.250% 5.552% 9/26/21 (b)(c) | 15,478 | 11,439 | |
| Almonde, Inc.: | |||
| Tranche 2LN, term loan 3 month U.S. LIBOR + 7.250% 9.6361% 6/13/25 (b)(c) | 33,455 | 32,884 | |
| Tranche B 1LN, term loan 3 month U.S. LIBOR + 3.500% 5.8861% 6/13/24 (b)(c) | 74,584 | 74,107 | |
| Ancestry.Com Operations, Inc. Tranche B 1LN, term loan 3 month U.S. LIBOR + 3.250% 5.55% 10/19/23 (b)(c) | 31,769 | 31,848 | |
| Aramark Services, Inc.: | |||
| Tranche B 3LN, term loan 3 month U.S. LIBOR + 1.750% 4.052% 3/11/25 (b)(c) | 10,492 | 10,486 | |
| Tranche B2 1LN, term loan 3 month U.S. LIBOR + 2.000% 4.052% 3/28/24 (b)(c) | 30,470 | 30,431 | |
| Asgn, Inc. Tranche B, term loan 3 month U.S. LIBOR + 2.000% 4.302% 4/2/25 (b)(c) | 8,574 | 8,580 | |
| Avantor, Inc. Tranche B, term loan 3 month U.S. LIBOR + 4.000% 6.302% 11/21/24 (b)(c) | 14,636 | 14,732 | |
| Brand Energy & Infrastructure Services, Inc. Tranche B, term loan 3 month U.S. LIBOR + 4.250% 6.7321% 6/21/24 (b)(c) | 31,368 | 31,474 | |
| Bright Horizons Family Solutions Tranche B, term loan 3 month U.S. LIBOR + 1.750% 4.052% 11/7/23 (b)(c) | 9,763 | 9,763 | |
| CRCI Longhorn Holdings, Inc. Tranche B 1LN, term loan 3 month U.S. LIBOR + 3.250% 5.7806% 8/8/25 (b)(c) | 10,095 | 10,120 | |
| Filtration Group Corp. Tranche B, term loan 3 month U.S. LIBOR + 3.000% 5.302% 3/29/25 (b)(c) | 11,905 | 11,948 | |
| Frontdoor, Inc. Tranche B, term loan 3 month U.S. LIBOR + 2.500% 4.8125% 8/16/25 (b)(c) | 12,030 | 12,030 | |
| Ion Trading Finance Ltd. Tranche B 1LN, term loan 3 month U.S. LIBOR + 4.000% 6.3861% 11/21/24 (b)(c) | 35,411 | 35,154 | |
| KAR Auction Services, Inc. Tranche B, term loan 3 month U.S. LIBOR + 2.500% 4.9375% 3/9/23 (b)(c) | 12,446 | 12,452 | |
| KUEHG Corp.: | |||
| Tranche B 2LN, term loan 3 month U.S. LIBOR + 8.250% 10.6361% 8/22/25 (b)(c) | 6,500 | 6,581 | |
| Tranche B, term loan 3 month U.S. LIBOR + 3.750% 6.1361% 2/21/25 (b)(c) | 36,642 | 36,757 | |
| Laureate Education, Inc. Tranche B 1LN, term loan 3 month U.S. LIBOR + 3.500% 6.0266% 4/26/24 (b)(c) | 145,518 | 145,627 | |
| Lineage Logistics Holdings, LLC. Tranche B, term loan: | |||
| 3 month U.S. LIBOR + 3.000% 2/27/25 (c)(e) | 8,500 | 8,436 | |
| 3 month U.S. LIBOR + 3.000% 5.302% 2/27/25 (b)(c) | 80,250 | 79,614 | |
| Prime Security Services Borrower LLC Tranche B 1LN, term loan 3 month U.S. LIBOR + 2.750% 5.052% 5/2/22 (b)(c) | 31,616 | 31,602 | |
| Spin Holdco, Inc. Tranche B 1LN, term loan 3 month U.S. LIBOR + 3.250% 5.6864% 11/14/22 (b)(c) | 51,278 | 51,267 | |
| SuperMoose Borrower LLC Tranche B 1LN, term loan 3 month U.S. LIBOR + 3.750% 6.052% 8/29/25 (b)(c) | 24,660 | 24,711 | |
| The GEO Group, Inc. Tranche B 1LN, term loan 3 month U.S. LIBOR + 2.000% 4.31% 3/23/24 (b)(c) | 11,392 | 11,342 | |
| The ServiceMaster Co. Tranche B, term loan 3 month U.S. LIBOR + 2.500% 4.802% 11/8/23 (b)(c) | 10,135 | 10,171 | |
| Thomson Reuters IP&S Tranche B, term loan 1 month U.S. LIBOR + 3.250% 5.552% 10/3/23 (b)(c) | 25,883 | 25,859 | |
| TMK Hawk Parent Corp. Tranche B, term loan 3 month U.S. LIBOR + 3.500% 5.81% 9/26/24 (b)(c) | 10,025 | 9,657 | |
| United Rentals North America, Inc. Tranche B, term loan 3 month U.S. LIBOR + 1.750% 10/5/25 (c)(e) | 15,000 | 15,047 | |
| Wash Multifamily Acquisition, Inc. Tranche B 1LN, term loan 3 month U.S. LIBOR + 3.250% 5.552% 5/14/22 (b)(c) | 14,595 | 14,577 | |
| Xerox Business Services LLC: | |||
| Tranche A, term loan 3 month U.S. LIBOR + 1.750% 4.052% 12/7/22 (b)(c) | 11,151 | 11,123 | |
| Tranche B, term loan 3 month U.S. LIBOR + 2.500% 4.802% 12/7/23 (b)(c) | 20,706 | 20,749 | |
| TOTAL SERVICES | 840,568 | ||
| Steel - 0.2% | |||
| Atkore International, Inc. Tranche B 1LN, term loan 3 month U.S. LIBOR + 2.750% 5.14% 12/22/23 (b)(c) | 9,558 | 9,555 | |
| JMC Steel Group, Inc. Tranche B, term loan 3 month U.S. LIBOR + 2.250% 4.623% 6/14/21 (b)(c) | 20,165 | 20,108 | |
| TOTAL STEEL | 29,663 | ||
| Super Retail - 4.2% | |||
| Academy Ltd. Tranche B, term loan 3 month U.S. LIBOR + 4.000% 6.2589% 7/2/22 (b)(c) | 30,003 | 22,296 | |
| Bass Pro Shops LLC. Tranche B, term loan 3 month U.S. LIBOR + 5.000% 7.302% 9/25/24 (b)(c) | 303,025 | 302,923 | |
| BJ's Wholesale Club, Inc. Tranche B 1LN, term loan 3 month U.S. LIBOR + 3.000% 5.2795% 2/3/24 (b)(c) | 68,233 | 68,350 | |
| Burlington Coat Factory Warehouse Corp. Tranche B, term loan 3 month U.S. LIBOR + 2.500% 4.79% 11/17/24 (b)(c) | 20,232 | 20,232 | |
| Davids Bridal, Inc. Tranche B, term loan 3 month U.S. LIBOR + 4.000% 6.32% 10/11/19 (b)(c) | 2,912 | 2,270 | |
| Harbor Freight Tools U.S.A., Inc. Tranche B, term loan 3 month U.S. LIBOR + 2.500% 4.802% 8/19/23 (b)(c) | 17,880 | 17,568 | |
| JC Penney Corp., Inc. Tranche B, term loan 3 month U.S. LIBOR + 4.250% 6.5673% 6/23/23 (b)(c) | 10,324 | 9,225 | |
| Party City Holdings, Inc. term loan 3 month U.S. LIBOR + 2.750% 5.06% 8/19/22 (b)(c) | 18,683 | 18,726 | |
| PETCO Animal Supplies, Inc. Tranche B 1LN, term loan 3 month U.S. LIBOR + 3.250% 5.7766% 1/26/23 (b)(c) | 31,220 | 24,086 | |
| PetSmart, Inc. term loan 3 month U.S. LIBOR + 3.000% 5.28% 3/11/22 (b)(c) | 19,112 | 16,156 | |
| Sports Authority, Inc. Tranche B, term loan 3 month U.S. LIBOR + 6.000% 0% 11/16/17 (c)(d) | 3,860 | 4 | |
| The Hillman Group, Inc. Tranche B, term loan 3 month U.S. LIBOR + 4.000% 6.302% 5/31/25 (b)(c) | 23,713 | 23,262 | |
| TOTAL SUPER RETAIL | 525,098 | ||
| Technology - 13.9% | |||
| Anastasia Parent LLC Tranche B, term loan 3 month U.S. LIBOR + 3.750% 6.0267% 8/3/25 (b)(c) | 35,975 | 35,545 | |
| Aptean, Inc.: | |||
| Tranche 2LN, term loan 3 month U.S. LIBOR + 9.500% 11.89% 12/20/23 (b)(c) | 2,500 | 2,500 | |
| Tranche B 1LN, term loan 3 month U.S. LIBOR + 4.250% 6.64% 12/20/22 (b)(c) | 7,722 | 7,718 | |
| ATS Consolidated, Inc. Tranche B 1LN, term loan 3 month U.S. LIBOR + 3.750% 6.0449% 2/28/25 (b)(c) | 11,831 | 11,895 | |
| Bracket Intermediate Holding Corp. 1LN, term loan 3 month U.S. LIBOR + 4.250% 6.5708% 9/5/25 (b)(c) | 17,290 | 17,333 | |
| Brave Parent Holdings, Inc. Tranche B 1LN, term loan 3 month U.S. LIBOR + 4.000% 6.3861% 4/19/25 (b)(c) | 7,750 | 7,779 | |
| Ceridian HCM Holding, Inc. Tranche B, term loan 3 month U.S. LIBOR + 3.250% 5.552% 4/30/25 (b)(c) | 29,500 | 29,537 | |
| Computer Discount Warehouse (CDW) LLC Tranche B, term loan 3 month U.S. LIBOR + 1.750% 4.06% 8/17/23 (b)(c) | 30,911 | 30,937 | |
| Compuware Corp. 1LN, term loan 3 month U.S. LIBOR + 3.500% 5.7865% 8/23/25 (b)(c) | 12,275 | 12,357 | |
| Cvent, Inc. Tranche B, term loan 3 month U.S. LIBOR + 3.750% 5.9922% 11/29/24 (b)(c) | 16,169 | 16,196 | |
| Dell International LLC Tranche B, term loan 3 month U.S. LIBOR + 2.000% 4.31% 9/7/23 (b)(c) | 34,913 | 34,860 | |
| DG Investment Intermediate Holdings, Inc.: | |||
| Tranche B 1LN, term loan 3 month U.S. LIBOR + 3.000% 5.302% 2/1/25 (b)(c) | 17,947 | 17,835 | |
| Tranche B 2LN, term loan 3 month U.S. LIBOR + 6.750% 9.052% 2/1/26 (b)(c) | 3,235 | 3,239 | |
| Digicert Holdings, Inc. Tranche B, term loan: | |||
| 3 month U.S. LIBOR + 4.000% 10/31/24 (c)(e) | 7,460 | 7,457 | |
| 3 month U.S. LIBOR + 4.000% 6.302% 10/31/24 (b)(c) | 60,424 | 60,398 | |
| 3 month U.S. LIBOR + 8.000% 10.6916% 10/31/25 (b)(c) | 13,433 | 13,341 | |
| Dynatrace LLC: | |||
| 2LN, term loan 3 month U.S. LIBOR + 7.000% 9.302% 8/23/26 (b)(c) | 1,778 | 1,798 | |
| Tranche B 1LN, term loan 1 month U.S. LIBOR + 3.250% 5.552% 8/23/25 (b)(c) | 22,115 | 22,235 | |
| EagleView Technology Corp. Tranche B 1LN, term loan 3 month U.S. LIBOR + 3.500% 5.7795% 8/14/25 (b)(c) | 15,360 | 15,302 | |
| EIG Investors Corp. Tranche B, term loan 3 month U.S. LIBOR + 3.750% 6.0614% 2/9/23 (b)(c) | 34,717 | 34,816 | |
| Electro Rent Corp. Tranche B 1LN, term loan 3 month U.S. LIBOR + 5.000% 7.4871% 1/31/24 (b)(c) | 5,800 | 5,836 | |
| Epicor Software Corp. Tranche B, term loan 3 month U.S. LIBOR + 3.250% 5.56% 6/1/22 (b)(c) | 32,828 | 32,885 | |
| EPV Merger Sub, Inc.: | |||
| Tranche 2LN, term loan 3 month U.S. LIBOR + 7.250% 9.552% 3/8/26 (b)(c) | 2,250 | 2,244 | |
| Tranche B 1LN, term loan 3 month U.S. LIBOR + 3.250% 5.552% 3/8/25 (b)(c) | 17,638 | 17,587 | |
| EXC Holdings III Corp. Tranche B, term loan: | |||
| 3 month U.S. LIBOR + 3.500% 5.8861% 12/2/24 (b)(c) | 18,407 | 18,453 | |
| 3 month U.S. LIBOR + 7.500% 9.9669% 12/1/25 (b)(c) | 2,000 | 2,025 | |
| First Data Corp. Tranche B, term loan: | |||
| 3 month U.S. LIBOR + 2.000% 4.2865% 7/10/22 (b)(c) | 107,173 | 106,785 | |
| 3 month U.S. LIBOR + 2.000% 4.2865% 4/26/24 (b)(c) | 27,537 | 27,376 | |
| Global Payments, Inc. Tranche B 3LN, term loan 3 month U.S. LIBOR + 1.750% 4.052% 4/22/23 (b)(c) | 19,594 | 19,569 | |
| Go Daddy Operating Co. LLC Tranche B, term loan 3 month U.S. LIBOR + 2.250% 4.552% 2/15/24 (b)(c) | 35,172 | 35,194 | |
| Hyland Software, Inc.: | |||
| Tranche 2LN, term loan 3 month U.S. LIBOR + 7.000% 9.2422% 7/7/25 (b)(c) | 1,590 | 1,592 | |
| Tranche B 1LN, term loan 3 month U.S. LIBOR + 3.250% 5.4922% 7/1/22 (b)(c) | 10,521 | 10,572 | |
| Tranche B 1LN, term loan 3 month U.S. LIBOR + 3.500% 5.9252% 7/1/24 (b)(c) | 1,900 | 1,909 | |
| Infor U.S., Inc. Tranche B 6LN, term loan 3 month U.S. LIBOR + 2.750% 5.1361% 2/1/22 (b)(c) | 25,313 | 25,206 | |
| Kronos, Inc.: | |||
| 2LN, term loan 3 month U.S. LIBOR + 8.250% 10.5931% 11/1/24 (b)(c) | 30,000 | 30,379 | |
| Tranche B 1LN, term loan 3 month U.S. LIBOR + 3.000% 5.3431% 11/1/23 (b)(c) | 48,997 | 49,035 | |
| Landesk Group, Inc. term loan: | |||
| 3 month U.S. LIBOR + 4.250% 6.51% 1/20/24 (b)(c) | 34,254 | 34,196 | |
| 3 month U.S. LIBOR + 9.000% 11.26% 1/20/25 (b)(c) | 11,730 | 11,261 | |
| MA FinanceCo. LLC: | |||
| Tranche B 2LN, term loan 3 month U.S. LIBOR + 2.250% 4.552% 11/20/21 (b)(c) | 3,613 | 3,583 | |
| Tranche B 3LN, term loan: | |||
| 3 month U.S. LIBOR + 2.500% 4.802% 6/21/24 (b)(c) | 102,634 | 102,281 | |
| 3 month U.S. LIBOR + 2.500% 4.802% 6/21/24 (b)(c) | 15,013 | 14,961 | |
| McAfee LLC Tranche B, term loan: | |||
| 3 month U.S. LIBOR + 4.500% 6.7949% 9/29/24 (b)(c) | 55,159 | 55,287 | |
| 3 month U.S. LIBOR + 8.500% 10.7949% 9/29/25 (b)(c) | 13,250 | 13,457 | |
| MH Sub I LLC Tranche B, term loan 3 month U.S. LIBOR + 3.750% 6.0296% 9/15/24 (b)(c) | 15,345 | 15,383 | |
| Microchip Technology, Inc. Tranche B, term loan 3 month U.S. LIBOR + 2.000% 4.31% 5/29/25 (b)(c) | 47,478 | 47,288 | |
| Micron Technology, Inc. Tranche B, term loan 3 month U.S. LIBOR + 1.750% 4.06% 4/26/22 (b)(c) | 1,860 | 1,860 | |
| Mitchell International, Inc. Tranche B, term loan: | |||
| 3 month U.S. LIBOR + 3.250% 5.552% 12/1/24 (b)(c) | 8,448 | 8,406 | |
| 3 month U.S. LIBOR + 7.250% 9.552% 12/1/25 (b)(c) | 3,335 | 3,343 | |
| NAVEX TopCo, Inc.: | |||
| 2LN, term loan 3 month U.S. LIBOR + 7.000% 9.31% 9/4/26 (b)(c) | 2,225 | 2,227 | |
| Tranche B 1LN, term loan 3 month U.S. LIBOR + 3.250% 5.56% 9/4/25 (b)(c) | 9,255 | 9,234 | |
| Open Text Corp. Tranche B, term loan 3 month U.S. LIBOR + 1.750% 4.052% 5/30/25 (b)(c) | 9,059 | 9,082 | |
| Renaissance Holding Corp.: | |||
| Tranche B 1LN, term loan 3 month U.S. LIBOR + 3.250% 5.552% 5/31/25 (b)(c) | 23,940 | 23,814 | |
| Tranche B 2LN, term loan 3 month U.S. LIBOR + 7.000% 9.302% 5/31/26 (b)(c) | 12,300 | 12,208 | |
| Severin Acquisition LLC Tranche B 1LN, term loan 3 month U.S. LIBOR + 3.250% 5.5239% 8/1/25 (b)(c) | 18,065 | 18,032 | |
| Solera LLC Tranche B, term loan 3 month U.S. LIBOR + 2.750% 5.052% 3/3/23 (b)(c) | 32,311 | 32,245 | |
| Sophia L.P. term loan 3 month U.S. LIBOR + 3.250% 5.6361% 9/30/22 (b)(c) | 25,946 | 25,978 | |
| Sound Inpatient Physicians, Inc.: | |||
| Tranche B 1LN, term loan 3 month U.S. LIBOR + 3.000% 5.302% 6/28/25 (b)(c) | 8,623 | 8,658 | |
| Tranche B 2LN, term loan 3 month U.S. LIBOR + 6.750% 9.052% 6/28/26 (b)(c) | 2,205 | 2,205 | |
| SS&C Technologies, Inc.: | |||
| Tranche B 1LN, term loan 3 month U.S. LIBOR + 2.250% 4.552% 7/8/22 (b)(c) | 13,191 | 13,155 | |
| Tranche B 3LN, term loan 3 month U.S. LIBOR + 2.250% 4.552% 4/16/25 (b)(c) | 57,511 | 57,191 | |
| Tranche B 4LN, term loan 3 month U.S. LIBOR + 2.250% 4.552% 4/16/25 (b)(c) | 22,291 | 22,167 | |
| Tranche B 5LN, term loan 3 month U.S. LIBOR + 2.500% 4.552% 4/16/25 (b)(c) | 46,395 | 46,113 | |
| Sybil Software LLC. Tranche B, term loan 3 month U.S. LIBOR + 2.500% 4.8861% 9/30/23 (b)(c) | 26,989 | 27,071 | |
| Syniverse Holdings, Inc. Tranche B, term loan 3 month U.S. LIBOR + 5.000% 7.2795% 3/9/23 (b)(c) | 32,586 | 32,749 | |
| Tempo Acquisition LLC Tranche B, term loan 3 month U.S. LIBOR + 3.000% 5.302% 5/1/24 (b)(c) | 41,366 | 41,356 | |
| TIBCO Software, Inc. Tranche B, term loan 3 month U.S. LIBOR + 3.500% 5.8% 12/4/20 (b)(c) | 11,121 | 11,133 | |
| TTM Technologies, Inc. Tranche B, term loan 3 month U.S. LIBOR + 2.500% 4.756% 9/28/24 (b)(c) | 27,326 | 27,291 | |
| Uber Technologies, Inc. Tranche B, term loan 3 month U.S. LIBOR + 4.000% 6.2806% 4/4/25 (b)(c) | 47,411 | 47,372 | |
| Vantiv LLC: | |||
| Tranche B 3LN, term loan 3 month U.S. LIBOR + 1.750% 4.0295% 10/14/23 (b)(c) | 10,350 | 10,320 | |
| Tranche B 4LN, term loan 3 month U.S. LIBOR + 1.750% 4.0295% 8/9/24 (b)(c) | 19,900 | 19,843 | |
| Verscend Holding Corp. Tranche B, term loan 3 month U.S. LIBOR + 4.500% 6.802% 8/27/25 (b)(c) | 43,865 | 44,180 | |
| Vertafore, Inc.: | |||
| Tranche B 1LN, term loan 3 month U.S. LIBOR + 3.250% 5.552% 7/2/25 (b)(c) | 51,500 | 51,296 | |
| Tranche B 2LN, term loan 3 month U.S. LIBOR + 7.250% 9.552% 7/2/26 (b)(c) | 17,500 | 17,511 | |
| Web.com Group, Inc.: | |||
| 2LN, term loan 3 month U.S. LIBOR + 7.750% 10.1704% 10/11/26 (b)(c) | 14,577 | 14,468 | |
| Tranche B 1LN, term loan 3 month U.S. LIBOR + 3.750% 6.1704% 10/11/25 (b)(c) | 24,350 | 24,297 | |
| WEX, Inc. Tranche B, term loan 3 month U.S. LIBOR + 2.250% 4.552% 7/1/23 (b)(c) | 20,965 | 20,983 | |
| TOTAL TECHNOLOGY | 1,753,210 | ||
| Telecommunications - 7.4% | |||
| Altice Financing SA Tranche B, term loan: | |||
| 3 month U.S. LIBOR + 2.750% 5.0395% 7/15/25 (b)(c) | 15,822 | 15,412 | |
| 3 month U.S. LIBOR + 2.750% 5.0395% 1/31/26 (b)(c) | 9,900 | 9,640 | |
| Ciena Corp. Tranche B, term loan 3 month U.S. LIBOR + 2.000% 4.2796% 9/28/25 (b)(c) | 6,545 | 6,549 | |
| Digicel International Finance Ltd. Tranche B, term loan 3 month U.S. LIBOR + 3.250% 5.57% 5/25/24 (b)(c) | 13,341 | 12,763 | |
| Evo Payments International LLC Tranche B, term loan 3 month U.S. LIBOR + 3.250% 5.55% 12/22/23 (b)(c) | 21,706 | 21,760 | |
| Frontier Communications Corp.: | |||
| Tranche A, term loan 3 month U.S. LIBOR + 2.750% 5.06% 3/31/21 (b)(c) | 98,858 | 95,769 | |
| Tranche B 1LN, term loan 3 month U.S. LIBOR + 3.750% 6.06% 6/15/24 (b)(c) | 111,857 | 108,053 | |
| GTT Communications, Inc. Tranche B, term loan 3 month U.S. LIBOR + 2.750% 5.05% 5/31/25 (b)(c) | 41,396 | 40,799 | |
| Intelsat Jackson Holdings SA: | |||
| Tranche B, term loan 3 month U.S. LIBOR + 3.750% 6.0449% 11/27/23 (b)(c) | 162,495 | 162,495 | |
| Tranche B-4, term loan 3 month U.S. LIBOR + 4.500% 6.7949% 1/2/24 (b)(c) | 19,000 | 19,665 | |
| Tranche B-5, term loan 6.625% 1/2/24 | 36,120 | 36,990 | |
| Level 3 Financing, Inc. Tranche B, term loan 3 month U.S. LIBOR + 2.250% 4.5296% 2/22/24 (b)(c) | 74,195 | 74,230 | |
| Neptune Finco Corp. Tranche B, term loan 3 month U.S. LIBOR + 2.250% 4.5295% 7/17/25 (b)(c) | 30,875 | 30,776 | |
| Onvoy LLC Tranche B 1LN, term loan 3 month U.S. LIBOR + 4.500% 6.8861% 2/10/24 (b)(c) | 19,764 | 19,237 | |
| Radiate Holdco LLC Tranche B, term loan 3 month U.S. LIBOR + 3.000% 5.302% 2/1/24 (b)(c) | 51,642 | 51,199 | |
| Sable International Finance Ltd. Tranche B 4LN, term loan 3 month U.S. LIBOR + 3.250% 5.552% 2/2/26 (b)(c) | 56,000 | 55,937 | |
| SBA Senior Finance II, LLC Tranche B, term loan 3 month U.S. LIBOR + 2.000% 4.31% 4/11/25 (b)(c) | 42,224 | 42,114 | |
| Securus Technologies, Inc.: | |||
| Tranche B 1LN, term loan 3 month U.S. LIBOR + 4.500% 11/1/24 (c)(e) | 9,600 | 9,616 | |
| Tranche B, term loan: | |||
| 3 month U.S. LIBOR + 4.500% 6.802% 11/1/24 (b)(c) | 39,890 | 39,956 | |
| 3 month U.S. LIBOR + 8.250% 10.552% 11/1/25 (b)(c) | 10,250 | 10,233 | |
| SFR Group SA Tranche B 11LN, term loan 3 month U.S. LIBOR + 2.750% 5.052% 7/31/25 (b)(c) | 48,357 | 46,589 | |
| Sprint Communications, Inc. Tranche B, term loan 3 month U.S. LIBOR + 2.500% 4.8125% 2/3/24 (b)(c) | 14,334 | 14,320 | |
| Windstream Services LLC Tranche B 7LN, term loan 3 month U.S. LIBOR + 3.250% 5.54% 2/17/24 (b)(c) | 14,511 | 12,573 | |
| TOTAL TELECOMMUNICATIONS | 936,675 | ||
| Textiles/Apparel - 0.1% | |||
| ABB Optical Group LLC Tranche B, term loan 3 month U.S. LIBOR + 5.000% 7.2797% 6/15/23 (b)(c) | 8,651 | 8,673 | |
| Transportation Ex Air/Rail - 0.5% | |||
| IBC Capital Ltd.: | |||
| 2LN, term loan 3 month U.S. LIBOR + 7.000% 9.3371% 9/11/24 (b)(c) | 3,000 | 3,013 | |
| Tranche B 1LN, term loan 3 month U.S. LIBOR + 3.750% 6.0871% 9/11/23 (b)(c) | 25,507 | 25,443 | |
| International Seaways Operating Corp. Tranche B, term loan 3 month U.S. LIBOR + 5.500% 8.26% 6/22/22 (b)(c) | 28,744 | 28,672 | |
| Navios Maritime Partners LP Tranche B, term loan 3 month U.S. LIBOR + 5.000% 7.34% 9/14/20 (b)(c) | 10,753 | 10,740 | |
| TOTAL TRANSPORTATION EX AIR/RAIL | 67,868 | ||
| Utilities - 2.7% | |||
| Brookfield WEC Holdings, Inc.: | |||
| 2LN, term loan 3 month U.S. LIBOR + 6.750% 9.052% 8/1/26 (b)(c) | 18,970 | 19,226 | |
| Tranche B 1LN, term loan 3 month U.S. LIBOR + 3.750% 6.052% 8/1/25 (b)(c) | 67,000 | 67,354 | |
| Exgen Renewables Iv LLC Tranche B, term loan 3 month U.S. LIBOR + 3.000% 5.32% 11/28/24 (b)(c) | 16,917 | 17,044 | |
| Houston Fuel Oil Terminal Co. Tranche B 1LN, term loan 3 month U.S. LIBOR + 2.750% 5.06% 6/26/25 (b)(c) | 43,541 | 43,631 | |
| Limetree Bay Terminals LLC term loan 3 month U.S. LIBOR + 4.000% 6.302% 2/15/24 (b)(c) | 19,729 | 19,187 | |
| Moxie Patriot LLC Tranche B, term loan 3 month U.S. LIBOR + 5.750% 8.1361% 12/19/20 (b)(c) | 15,852 | 15,703 | |
| Pike Corp. Tranche B, term loan 3 month U.S. LIBOR + 3.500% 5.81% 3/23/25 (b)(c) | 11,025 | 11,080 | |
| Tex Operations Co. LLC Tranche B, term loan 3 month U.S. LIBOR + 2.000% 4.302% 8/4/23 (b)(c) | 40,402 | 40,289 | |
| Vertiv Group Corp. Tranche B, term loan 3 month U.S. LIBOR + 4.000% 6.3126% 11/30/23 (b)(c) | 25,546 | 25,259 | |
| Vistra Operations Co. LLC: | |||
| Tranche B 2LN, term loan 3 month U.S. LIBOR + 2.000% 4.552% 12/14/23 (b)(c) | 22,352 | 22,360 | |
| Tranche B 3LN, term loan 3 month U.S. LIBOR + 2.000% 4.2928% 12/31/25 (b)(c) | 58,458 | 58,246 | |
| TOTAL UTILITIES | 339,379 | ||
| TOTAL BANK LOAN OBLIGATIONS | |||
| (Cost $11,488,636) | 11,423,077 | ||
| Nonconvertible Bonds - 4.3% | |||
| Aerospace - 0.1% | |||
| DAE Funding LLC 4% 8/1/20 (f) | 6,495 | 6,430 | |
| Cable/Satellite TV - 0.3% | |||
| CCO Holdings LLC/CCO Holdings Capital Corp.: | |||
| 5.125% 2/15/23 | 17,065 | 16,980 | |
| 5.25% 3/15/21 | 13,070 | 13,135 | |
| Virgin Media Finance PLC 4.875% 2/15/22 | 2,000 | 1,905 | |
| TOTAL CABLE/SATELLITE TV | 32,020 | ||
| Chemicals - 0.2% | |||
| OCI NV 6.625% 4/15/23 (f) | 5,005 | 5,130 | |
| TPC Group, Inc. 8.75% 12/15/20 (f) | 18,095 | 17,733 | |
| TOTAL CHEMICALS | 22,863 | ||
| Containers - 0.6% | |||
| Ardagh Packaging Finance PLC/Ardagh MP Holdings U.S.A., Inc.: | |||
| 4.25% 9/15/22(f) | 15,000 | 14,550 | |
| 6% 2/15/25 (f) | 10,000 | 9,375 | |
| Reynolds Group Issuer, Inc./Reynolds Group Issuer LLC/Reynolds Group Issuer (Luxembourg) SA: | |||
| 3 month U.S. LIBOR + 3.500% 5.9363% 7/15/21 (b)(c)(f) | 15,130 | 15,281 | |
| 5.75% 10/15/20 | 32,296 | 32,296 | |
| TOTAL CONTAINERS | 71,502 | ||
| Diversified Financial Services - 0.1% | |||
| Icahn Enterprises LP/Icahn Enterprises Finance Corp. 6.25% 2/1/22 | 5,200 | 5,250 | |
| International Lease Finance Corp. 6.25% 5/15/19 | 10,000 | 10,159 | |
| TOTAL DIVERSIFIED FINANCIAL SERVICES | 15,409 | ||
| Energy - 0.8% | |||
| Cheniere Corpus Christi Holdings LLC: | |||
| 5.125% 6/30/27 | 11,455 | 11,226 | |
| 7% 6/30/24 | 7,000 | 7,569 | |
| Chesapeake Energy Corp.: | |||
| 3 month U.S. LIBOR + 3.250% 5.6863% 4/15/19 (b)(c) | 7,080 | 7,098 | |
| 8% 12/15/22 (f) | 8,195 | 8,543 | |
| Citgo Petroleum Corp. 6.25% 8/15/22 (f) | 10,000 | 9,850 | |
| Consolidated Energy Finance SA: | |||
| 3 month U.S. LIBOR + 3.750% 6.0841% 6/15/22 (b)(c)(f) | 26,500 | 26,512 | |
| 6.875% 6/15/25 (f) | 5,500 | 5,603 | |
| Denbury Resources, Inc.: | |||
| 7.5% 2/15/24 (f) | 9,050 | 8,846 | |
| 9% 5/15/21 (f) | 3,645 | 3,804 | |
| 9.25% 3/31/22 (f) | 7,290 | 7,600 | |
| EP Energy LLC/Everest Acquisition Finance, Inc. 7.75% 5/15/26 (f) | 7,340 | 7,301 | |
| TOTAL ENERGY | 103,952 | ||
| Gaming - 0.2% | |||
| Gateway Casinos & Entertainment Ltd. 8.25% 3/1/24 (f) | 5,000 | 5,250 | |
| Scientific Games Corp. 5% 10/15/25 (f) | 5,000 | 4,650 | |
| Stars Group Holdings BV 7% 7/15/26 (f) | 12,545 | 12,733 | |
| Sugarhouse HSP Gaming Prop Mezz LP/Sugarhouse HSP Gaming Finance Corp. 5.875% 5/15/25 (f) | 7,363 | 6,949 | |
| TOTAL GAMING | 29,582 | ||
| Healthcare - 0.6% | |||
| Community Health Systems, Inc. 6.25% 3/31/23 | 21,175 | 19,475 | |
| Tenet Healthcare Corp.: | |||
| 4.625% 7/15/24 | 28,000 | 26,988 | |
| 4.75% 6/1/20 | 8,680 | 8,702 | |
| 5.125% 5/1/25 | 7,500 | 7,219 | |
| 7.5% 1/1/22 (f) | 5,085 | 5,301 | |
| Valeant Pharmaceuticals International, Inc.: | |||
| 5.5% 11/1/25 (f) | 5,590 | 5,478 | |
| 9% 12/15/25 (f) | 7,440 | 7,756 | |
| TOTAL HEALTHCARE | 80,919 | ||
| Insurance - 0.0% | |||
| HUB International Ltd. 7% 5/1/26 (f) | 6,000 | 5,856 | |
| Leisure - 0.1% | |||
| Studio City Co. Ltd.: | |||
| 5.875% 11/30/19 (f) | 8,160 | 8,231 | |
| 7.25% 11/30/21 (f) | 10,000 | 10,288 | |
| TOTAL LEISURE | 18,519 | ||
| Restaurants - 0.1% | |||
| 1011778 BC Unlimited Liability Co./New Red Finance, Inc. 4.25% 5/15/24 (f) | 8,000 | 7,500 | |
| Services - 0.1% | |||
| APX Group, Inc. 7.625% 9/1/23 | 12,325 | 10,969 | |
| Brand Energy & Infrastructure Services, Inc. 8.5% 7/15/25 (f) | 6,032 | 5,942 | |
| TOTAL SERVICES | 16,911 | ||
| Technology - 0.4% | |||
| Diamond 1 Finance Corp./Diamond 2 Finance Corp.: | |||
| 3.48% 6/1/19 (f) | 6,199 | 6,207 | |
| 4.42% 6/15/21 (f) | 16,685 | 16,824 | |
| NXP BV/NXP Funding LLC 4.125% 6/1/21 (f) | 16,440 | 16,337 | |
| Uber Technologies, Inc. 7.5% 11/1/23 (f)(g) | 11,000 | 11,014 | |
| TOTAL TECHNOLOGY | 50,382 | ||
| Telecommunications - 0.6% | |||
| Altice Financing SA 7.5% 5/15/26 (f) | 19,200 | 18,048 | |
| Intelsat Jackson Holdings SA 8% 2/15/24 (f) | 14,100 | 14,752 | |
| SFR Group SA: | |||
| 6.25% 5/15/24 (f) | 10,905 | 10,455 | |
| 7.375% 5/1/26 (f) | 18,755 | 17,952 | |
| Sprint Capital Corp. 6.9% 5/1/19 | 5,000 | 5,065 | |
| Sprint Communications, Inc. 9% 11/15/18 (f) | 3,000 | 3,006 | |
| TOTAL TELECOMMUNICATIONS | 69,278 | ||
| Textiles/Apparel - 0.0% | |||
| Eagle Intermediate Global Holding BV 7.5% 5/1/25 (f) | 4,365 | 4,223 | |
| Transportation Ex Air/Rail - 0.1% | |||
| Avolon Holdings Funding Ltd. 5.125% 10/1/23 (f) | 12,290 | 12,060 | |
| TOTAL NONCONVERTIBLE BONDS | |||
| (Cost $555,964) | 547,406 | ||
| Shares | Value (000s) | ||
| Common Stocks - 0.8% | |||
| Broadcasting - 0.0% | |||
| ION Media Networks, Inc. (h)(i) | 2,842 | 2,444 | |
| Chemicals - 0.2% | |||
| LyondellBasell Industries NV Class A | 245,943 | 21,955 | |
| Energy - 0.4% | |||
| Expro Holdings U.S., Inc. (i) | 1,477,422 | 34,350 | |
| Expro Holdings U.S., Inc. (f)(i) | 542,213 | 12,606 | |
| TOTAL ENERGY | 46,956 | ||
| Homebuilders/Real Estate - 0.0% | |||
| Five Point Holdings LLC Class A (h) | 45,793 | 348 | |
| Metals/Mining - 0.1% | |||
| Warrior Metropolitan Coal, Inc. | 255,983 | 7,168 | |
| Publishing/Printing - 0.0% | |||
| Cenveo Corp. (i) | 75,509 | 2,202 | |
| Utilities - 0.1% | |||
| TexGen Power LLC (i) | 524,336 | 19,505 | |
| TOTAL COMMON STOCKS | |||
| (Cost $119,484) | 100,578 | ||
| Money Market Funds - 7.8% | |||
| Fidelity Cash Central Fund, 2.23% (j) | |||
| (Cost $983,896) | 983,847,750 | 984,045 | |
| TOTAL INVESTMENT IN SECURITIES - 103.2% | |||
| (Cost $13,147,980) | 13,055,106 | ||
| NET OTHER ASSETS (LIABILITIES) - (3.2)% | (410,697) | ||
| NET ASSETS - 100% | $12,644,409 |
Legend
(a) Remaining maturities of bank loan obligations may be less than the stated maturities shown as a result of contractual or optional prepayments by the borrower. Such prepayments cannot be predicted with certainty.
(b) Coupon rates for floating and adjustable rate securities reflect the rates in effect at period end.
(c) Coupon is indexed to a floating interest rate which may be multiplied by a specified factor and/or subject to caps or floors.
(d) Non-income producing - Security is in default.
(e) The coupon rate will be determined upon settlement of the loan after period end.
(f) Security exempt from registration under Rule 144A of the Securities Act of 1933. These securities may be resold in transactions exempt from registration, normally to qualified institutional buyers. At the end of the period, the value of these securities amounted to $375,976,000 or 3.0% of net assets.
(g) Security or a portion of the security purchased on a delayed delivery or when-issued basis.
(h) Non-income producing
(i) Level 3 security
(j) Affiliated fund that is generally available only to investment companies and other accounts managed by Fidelity Investments. The rate quoted is the annualized seven-day yield of the fund at period end. A complete unaudited listing of the fund's holdings as of its most recent quarter end is available upon request. In addition, each Fidelity Central Fund's financial statements, which are not covered by the Fund's Report of Independent Registered Public Accounting Firm, are available on the SEC's website or upon request.
Affiliated Central Funds
Information regarding fiscal year to date income earned by the Fund from investments in Fidelity Central Funds is as follows:
| Fund | Income earned |
| (Amounts in thousands) | |
| Fidelity Cash Central Fund | $16,753 |
| Total | $16,753 |
Amounts in the income column in the above table include any capital gain distributions from underlying funds, which are presented in the corresponding line-item in the Statement of Operations if applicable.
Investment Valuation
The following is a summary of the inputs used, as of October 31, 2018, involving the Fund's assets and liabilities carried at fair value. The inputs or methodology used for valuing securities may not be an indication of the risk associated with investing in those securities. For more information on valuation inputs, and their aggregation into the levels used below, please refer to the Investment Valuation section in the accompanying Notes to Financial Statements.
| Valuation Inputs at Reporting Date: | ||||
| Description | Total | Level 1 | Level 2 | Level 3 |
| (Amounts in thousands) | ||||
| Investments in Securities: | ||||
| Equities: | ||||
| Communication Services | $2,444 | $-- | $-- | $2,444 |
| Energy | 46,956 | -- | -- | 46,956 |
| Industrials | 2,202 | -- | -- | 2,202 |
| Materials | 29,123 | 29,123 | -- | -- |
| Real Estate | 348 | 348 | -- | -- |
| Utilities | 19,505 | -- | -- | 19,505 |
| Bank Loan Obligations | 11,423,077 | -- | 11,423,077 | -- |
| Corporate Bonds | 547,406 | -- | 547,406 | -- |
| Money Market Funds | 984,045 | 984,045 | -- | -- |
| Total Investments in Securities: | $13,055,106 | $1,013,516 | $11,970,483 | $71,107 |
Other Information
Distribution of investments by country or territory of incorporation, as a percentage of Total Net Assets, is as follows (Unaudited):
| United States of America | 88.8% |
| Luxembourg | 5.1% |
| Canada | 1.2% |
| Netherlands | 1.2% |
| Others (Individually Less Than 1%) | 3.7% |
| 100.0% |
See accompanying notes which are an integral part of the financial statements.
Financial Statements
Statement of Assets and Liabilities
| Amounts in thousands (except per-share amounts) | October 31, 2018 | |
| Assets | ||
| Investment in securities, at value — See accompanying schedule: Unaffiliated issuers (cost $12,164,084) | $12,071,061 | |
| Fidelity Central Funds (cost $983,896) | 984,045 | |
| Total Investment in Securities (cost $13,147,980) | $13,055,106 | |
| Cash | 3,557 | |
| Receivable for investments sold | 90,891 | |
| Receivable for fund shares sold | 19,701 | |
| Interest receivable | 62,173 | |
| Distributions receivable from Fidelity Central Funds | 1,824 | |
| Prepaid expenses | 22 | |
| Other receivables | 248 | |
| Total assets | 13,233,522 | |
| Liabilities | ||
| Payable for investments purchased | ||
| Regular delivery | $541,169 | |
| Delayed delivery | 11,000 | |
| Payable for fund shares redeemed | 18,953 | |
| Distributions payable | 9,910 | |
| Accrued management fee | 5,811 | |
| Distribution and service plan fees payable | 530 | |
| Other affiliated payables | 1,423 | |
| Other payables and accrued expenses | 317 | |
| Total liabilities | 589,113 | |
| Net Assets | $12,644,409 | |
| Net Assets consist of: | ||
| Paid in capital | $13,098,655 | |
| Total distributable earnings (loss) | (454,246) | |
| Net Assets | $12,644,409 | |
| Net Asset Value and Maximum Offering Price | ||
| Class A: | ||
| Net Asset Value and redemption price per share ($597,769 ÷ 62,210 shares) | $9.61 | |
| Maximum offering price per share (100/97.25 of $9.61) | $9.88 | |
| Class M: | ||
| Net Asset Value and redemption price per share ($101,631 ÷ 10,592 shares) | $9.59 | |
| Maximum offering price per share (100/97.25 of $9.59) | $9.86 | |
| Class C: | ||
| Net Asset Value and offering price per share ($464,327 ÷ 48,334 shares)(a) | $9.61 | |
| Fidelity Floating Rate High Income Fund: | ||
| Net Asset Value, offering price and redemption price per share ($9,221,328 ÷ 960,937 shares) | $9.60 | |
| Class I: | ||
| Net Asset Value, offering price and redemption price per share ($2,243,164 ÷ 233,953 shares) | $9.59 | |
| Class Z: | ||
| Net Asset Value, offering price and redemption price per share ($16,190 ÷ 1,688 shares) | $9.59 |
(a) Redemption price per share is equal to net asset value less any applicable contingent deferred sales charge.
See accompanying notes which are an integral part of the financial statements.
Statement of Operations
| Amounts in thousands | Year ended October 31, 2018 | |
| Investment Income | ||
| Dividends | $6,821 | |
| Interest | 564,977 | |
| Income from Fidelity Central Funds | 16,753 | |
| Total income | 588,551 | |
| Expenses | ||
| Management fee | $63,892 | |
| Transfer agent fees | 14,537 | |
| Distribution and service plan fees | 6,564 | |
| Accounting fees and expenses | 1,633 | |
| Custodian fees and expenses | 104 | |
| Independent trustees' fees and expenses | 56 | |
| Registration fees | 382 | |
| Audit | 104 | |
| Legal | 35 | |
| Miscellaneous | 78 | |
| Total expenses before reductions | 87,385 | |
| Expense reductions | (169) | |
| Total expenses after reductions | 87,216 | |
| Net investment income (loss) | 501,335 | |
| Realized and Unrealized Gain (Loss) | ||
| Net realized gain (loss) on: | ||
| Investment securities: | ||
| Unaffiliated issuers | (33,355) | |
| Fidelity Central Funds | 6 | |
| Total net realized gain (loss) | (33,349) | |
| Change in net unrealized appreciation (depreciation) on: | ||
| Investment securities: | ||
| Unaffiliated issuers | (37,480) | |
| Fidelity Central Funds | (4) | |
| Total change in net unrealized appreciation (depreciation) | (37,484) | |
| Net gain (loss) | (70,833) | |
| Net increase (decrease) in net assets resulting from operations | $430,502 |
See accompanying notes which are an integral part of the financial statements.
Statement of Changes in Net Assets
| Amounts in thousands | Year ended October 31, 2018 | Year ended October 31, 2017 |
| Increase (Decrease) in Net Assets | ||
| Operations | ||
| Net investment income (loss) | $501,335 | $408,150 |
| Net realized gain (loss) | (33,349) | 15,537 |
| Change in net unrealized appreciation (depreciation) | (37,484) | 41,407 |
| Net increase (decrease) in net assets resulting from operations | 430,502 | 465,094 |
| Distributions to shareholders | (504,172) | – |
| Distributions to shareholders from net investment income | – | (394,075) |
| Total distributions | (504,172) | (394,075) |
| Share transactions - net increase (decrease) | 1,985,763 | 1,322,261 |
| Redemption fees | 95 | 365 |
| Total increase (decrease) in net assets | 1,912,188 | 1,393,645 |
| Net Assets | ||
| Beginning of period | 10,732,221 | 9,338,576 |
| End of period | $12,644,409 | $10,732,221 |
| Other Information | ||
| Undistributed net investment income end of period | $32,709 |
See accompanying notes which are an integral part of the financial statements.
Financial Highlights
Fidelity Advisor Floating Rate High Income Fund Class A
| Years ended October 31, | 2018 | 2017 | 2016 | 2015 | 2014 |
| Selected Per–Share Data | |||||
| Net asset value, beginning of period | $9.67 | $9.60 | $9.42 | $9.85 | $9.99 |
| Income from Investment Operations | |||||
| Net investment income (loss)A | .398 | .360 | .334 | .375 | .317 |
| Net realized and unrealized gain (loss) | (.056) | .056 | .211 | (.425) | (.114) |
| Total from investment operations | .342 | .416 | .545 | (.050) | .203 |
| Distributions from net investment income | (.398) | (.346) | (.365) | (.341) | (.307) |
| Distributions from net realized gain | (.004) | – | – | (.040) | (.036) |
| Total distributions | (.402) | (.346) | (.365) | (.381) | (.343) |
| Redemption fees added to paid in capitalA | –B | –B | –B | .001 | –B |
| Net asset value, end of period | $9.61 | $9.67 | $9.60 | $9.42 | $9.85 |
| Total ReturnC,D | 3.60% | 4.40% | 5.98% | (.53)% | 2.05% |
| Ratios to Average Net AssetsE,F | |||||
| Expenses before reductions | .98% | .99% | .99% | .98% | .98% |
| Expenses net of fee waivers, if any | .98% | .98% | .99% | .98% | .98% |
| Expenses net of all reductions | .98% | .98% | .98% | .98% | .98% |
| Net investment income (loss) | 4.13% | 3.72% | 3.58% | 3.86% | 3.17% |
| Supplemental Data | |||||
| Net assets, end of period (in millions) | $598 | $585 | $707 | $863 | $1,185 |
| Portfolio turnover rateG | 47% | 68% | 46% | 26% | 54% |
A Calculated based on average shares outstanding during the period.
B Amount represents less than $.0005 per share.
C Total returns would have been lower if certain expenses had not been reduced during the applicable periods shown.
D Total returns do not include the effect of the sales charges.
E Fees and expenses of any underlying Fidelity Central Funds are not included in the Fund's expense ratio. The Fund indirectly bears its proportionate share of the expenses of any underlying Fidelity Central Funds.
F Expense ratios reflect operating expenses of the class. Expenses before reductions do not reflect amounts reimbursed by the investment adviser or reductions from brokerage service arrangements or reductions from other expense offset arrangements and do not represent the amount paid by the class during periods when reimbursements or reductions occur. Expenses net of fee waivers reflect expenses after reimbursement by the investment adviser but prior to reductions from brokerage service arrangements or other expense offset arrangements. Expenses net of all reductions represent the net expenses paid by the class.
G Amount does not include the portfolio activity of any underlying Fidelity Central Funds.
See accompanying notes which are an integral part of the financial statements.
Fidelity Advisor Floating Rate High Income Fund Class M
| Years ended October 31, | 2018 | 2017 | 2016 | 2015 | 2014 |
| Selected Per–Share Data | |||||
| Net asset value, beginning of period | $9.65 | $9.58 | $9.40 | $9.84 | $9.98 |
| Income from Investment Operations | |||||
| Net investment income (loss)A | .396 | .356 | .324 | .365 | .306 |
| Net realized and unrealized gain (loss) | (.055) | .057 | .212 | (.434) | (.112) |
| Total from investment operations | .341 | .413 | .536 | (.069) | .194 |
| Distributions from net investment income | (.397) | (.343) | (.356) | (.332) | (.298) |
| Distributions from net realized gain | (.004) | – | – | (.040) | (.036) |
| Total distributions | (.401) | (.343) | (.356) | (.372) | (.334) |
| Redemption fees added to paid in capitalA | –B | –B | –B | .001 | –B |
| Net asset value, end of period | $9.59 | $9.65 | $9.58 | $9.40 | $9.84 |
| Total ReturnC,D | 3.59% | 4.37% | 5.89% | (.72)% | 1.96% |
| Ratios to Average Net AssetsE,F | |||||
| Expenses before reductions | .99% | 1.01% | 1.08% | 1.07% | 1.07% |
| Expenses net of fee waivers, if any | .99% | 1.01% | 1.08% | 1.07% | 1.07% |
| Expenses net of all reductions | .99% | 1.01% | 1.08% | 1.07% | 1.07% |
| Net investment income (loss) | 4.11% | 3.69% | 3.48% | 3.77% | 3.08% |
| Supplemental Data | |||||
| Net assets, end of period (in millions) | $102 | $137 | $171 | $195 | $240 |
| Portfolio turnover rateG | 47% | 68% | 46% | 26% | 54% |
A Calculated based on average shares outstanding during the period.
B Amount represents less than $.0005 per share.
C Total returns would have been lower if certain expenses had not been reduced during the applicable periods shown.
D Total returns do not include the effect of the sales charges.
E Fees and expenses of any underlying Fidelity Central Funds are not included in the Fund's expense ratio. The Fund indirectly bears its proportionate share of the expenses of any underlying Fidelity Central Funds.
F Expense ratios reflect operating expenses of the class. Expenses before reductions do not reflect amounts reimbursed by the investment adviser or reductions from brokerage service arrangements or reductions from other expense offset arrangements and do not represent the amount paid by the class during periods when reimbursements or reductions occur. Expenses net of fee waivers reflect expenses after reimbursement by the investment adviser but prior to reductions from brokerage service arrangements or other expense offset arrangements. Expenses net of all reductions represent the net expenses paid by the class.
G Amount does not include the portfolio activity of any underlying Fidelity Central Funds.
See accompanying notes which are an integral part of the financial statements.
Fidelity Advisor Floating Rate High Income Fund Class C
| Years ended October 31, | 2018 | 2017 | 2016 | 2015 | 2014 |
| Selected Per–Share Data | |||||
| Net asset value, beginning of period | $9.67 | $9.59 | $9.41 | $9.85 | $9.99 |
| Income from Investment Operations | |||||
| Net investment income (loss)A | .325 | .286 | .263 | .301 | .241 |
| Net realized and unrealized gain (loss) | (.056) | .067 | .212 | (.434) | (.113) |
| Total from investment operations | .269 | .353 | .475 | (.133) | .128 |
| Distributions from net investment income | (.325) | (.273) | (.295) | (.268) | (.232) |
| Distributions from net realized gain | (.004) | – | – | (.040) | (.036) |
| Total distributions | (.329) | (.273) | (.295) | (.308) | (.268) |
| Redemption fees added to paid in capitalA | –B | –B | –B | .001 | –B |
| Net asset value, end of period | $9.61 | $9.67 | $9.59 | $9.41 | $9.85 |
| Total ReturnC,D | 2.83% | 3.73% | 5.19% | (1.38)% | 1.29% |
| Ratios to Average Net AssetsE,F | |||||
| Expenses before reductions | 1.73% | 1.74% | 1.74% | 1.73% | 1.73% |
| Expenses net of fee waivers, if any | 1.73% | 1.74% | 1.74% | 1.73% | 1.73% |
| Expenses net of all reductions | 1.73% | 1.74% | 1.74% | 1.73% | 1.73% |
| Net investment income (loss) | 3.36% | 2.96% | 2.82% | 3.10% | 2.41% |
| Supplemental Data | |||||
| Net assets, end of period (in millions) | $464 | $523 | $582 | $671 | $835 |
| Portfolio turnover rateG | 47% | 68% | 46% | 26% | 54% |
A Calculated based on average shares outstanding during the period.
B Amount represents less than $.0005 per share.
C Total returns would have been lower if certain expenses had not been reduced during the applicable periods shown.
D Total returns do not include the effect of the contingent deferred sales charge.
E Fees and expenses of any underlying Fidelity Central Funds are not included in the Fund's expense ratio. The Fund indirectly bears its proportionate share of the expenses of any underlying Fidelity Central Funds.
F Expense ratios reflect operating expenses of the class. Expenses before reductions do not reflect amounts reimbursed by the investment adviser or reductions from brokerage service arrangements or reductions from other expense offset arrangements and do not represent the amount paid by the class during periods when reimbursements or reductions occur. Expenses net of fee waivers reflect expenses after reimbursement by the investment adviser but prior to reductions from brokerage service arrangements or other expense offset arrangements. Expenses net of all reductions represent the net expenses paid by the class.
G Amount does not include the portfolio activity of any underlying Fidelity Central Funds.
See accompanying notes which are an integral part of the financial statements.
Fidelity Advisor Floating Rate High Income Fund
| Years ended October 31, | 2018 | 2017 | 2016 | 2015 | 2014 |
| Selected Per–Share Data | |||||
| Net asset value, beginning of period | $9.65 | $9.58 | $9.40 | $9.84 | $9.98 |
| Income from Investment Operations | |||||
| Net investment income (loss)A | .426 | .386 | .359 | .401 | .344 |
| Net realized and unrealized gain (loss) | (.046) | .057 | .212 | (.435) | (.113) |
| Total from investment operations | .380 | .443 | .571 | (.034) | .231 |
| Distributions from net investment income | (.426) | (.373) | (.391) | (.367) | (.335) |
| Distributions from net realized gain | (.004) | – | – | (.040) | (.036) |
| Total distributions | (.430) | (.373) | (.391) | (.407) | (.371) |
| Redemption fees added to paid in capitalA | –B | –B | –B | .001 | –B |
| Net asset value, end of period | $9.60 | $9.65 | $9.58 | $9.40 | $9.84 |
| Total ReturnC | 4.01% | 4.70% | 6.28% | (.36)% | 2.34% |
| Ratios to Average Net AssetsD,E | |||||
| Expenses before reductions | .69% | .70% | .71% | .70% | .69% |
| Expenses net of fee waivers, if any | .68% | .69% | .71% | .70% | .69% |
| Expenses net of all reductions | .68% | .69% | .71% | .70% | .69% |
| Net investment income (loss) | 4.44% | 4.01% | 3.86% | 4.14% | 3.45% |
| Supplemental Data | |||||
| Net assets, end of period (in millions) | $9,221 | $7,368 | $6,131 | $6,615 | $9,032 |
| Portfolio turnover rateF | 47% | 68% | 46% | 26% | 54% |
A Calculated based on average shares outstanding during the period.
B Amount represents less than $.0005 per share.
C Total returns would have been lower if certain expenses had not been reduced during the applicable periods shown.
D Fees and expenses of any underlying Fidelity Central Funds are not included in the Fund's expense ratio. The Fund indirectly bears its proportionate share of the expenses of any underlying Fidelity Central Funds.
E Expense ratios reflect operating expenses of the class. Expenses before reductions do not reflect amounts reimbursed by the investment adviser or reductions from brokerage service arrangements or reductions from other expense offset arrangements and do not represent the amount paid by the class during periods when reimbursements or reductions occur. Expenses net of fee waivers reflect expenses after reimbursement by the investment adviser but prior to reductions from brokerage service arrangements or other expense offset arrangements. Expenses net of all reductions represent the net expenses paid by the class.
F Amount does not include the portfolio activity of any underlying Fidelity Central Funds.
See accompanying notes which are an integral part of the financial statements.
Fidelity Advisor Floating Rate High Income Fund Class I
| Years ended October 31, | 2018 | 2017 | 2016 | 2015 | 2014 |
| Selected Per–Share Data | |||||
| Net asset value, beginning of period | $9.65 | $9.58 | $9.40 | $9.83 | $9.97 |
| Income from Investment Operations | |||||
| Net investment income (loss)A | .419 | .380 | .355 | .396 | .339 |
| Net realized and unrealized gain (loss) | (.056) | .058 | .211 | (.424) | (.113) |
| Total from investment operations | .363 | .438 | .566 | (.028) | .226 |
| Distributions from net investment income | (.419) | (.368) | (.386) | (.363) | (.330) |
| Distributions from net realized gain | (.004) | – | – | (.040) | (.036) |
| Total distributions | (.423) | (.368) | (.386) | (.403) | (.366) |
| Redemption fees added to paid in capitalA | –B | –B | –B | .001 | –B |
| Net asset value, end of period | $9.59 | $9.65 | $9.58 | $9.40 | $9.83 |
| Total ReturnC | 3.84% | 4.64% | 6.23% | (.30)% | 2.29% |
| Ratios to Average Net AssetsD,E | |||||
| Expenses before reductions | .75% | .75% | .75% | .74% | .74% |
| Expenses net of fee waivers, if any | .75% | .75% | .75% | .74% | .74% |
| Expenses net of all reductions | .75% | .75% | .75% | .74% | .74% |
| Net investment income (loss) | 4.36% | 3.95% | 3.81% | 4.10% | 3.40% |
| Supplemental Data | |||||
| Net assets, end of period (in millions) | $2,243 | $2,120 | $1,748 | $2,429 | $3,317 |
| Portfolio turnover rateF | 47% | 68% | 46% | 26% | 54% |
A Calculated based on average shares outstanding during the period.
B Amount represents less than $.0005 per share.
C Total returns would have been lower if certain expenses had not been reduced during the applicable periods shown.
D Fees and expenses of any underlying Fidelity Central Funds are not included in the Fund's expense ratio. The Fund indirectly bears its proportionate share of the expenses of any underlying Fidelity Central Funds.
E Expense ratios reflect operating expenses of the class. Expenses before reductions do not reflect amounts reimbursed by the investment adviser or reductions from brokerage service arrangements or reductions from other expense offset arrangements and do not represent the amount paid by the class during periods when reimbursements or reductions occur. Expenses net of fee waivers reflect expenses after reimbursement by the investment adviser but prior to reductions from brokerage service arrangements or other expense offset arrangements. Expenses net of all reductions represent the net expenses paid by the class.
F Amount does not include the portfolio activity of any underlying Fidelity Central Funds.
See accompanying notes which are an integral part of the financial statements.
Fidelity Advisor Floating Rate High Income Fund Class Z
| Year ended October 31, | 2018 A |
| Selected Per–Share Data | |
| Net asset value, beginning of period | $9.65 |
| Income from Investment Operations | |
| Net investment income (loss)B | .051 |
| Net realized and unrealized gain (loss) | (.076) |
| Total from investment operations | (.025) |
| Distributions from net investment income | (.035) |
| Distributions from net realized gain | – |
| Total distributions | (.035) |
| Net asset value, end of period | $9.59 |
| Total ReturnC,D | (.26)% |
| Ratios to Average Net AssetsE,F | |
| Expenses before reductions | .62%G |
| Expenses net of fee waivers, if any | .62%G |
| Expenses net of all reductions | .62%G |
| Net investment income (loss) | 7.64%G |
| Supplemental Data | |
| Net assets, end of period (in millions) | $16 |
| Portfolio turnover rateH | 47% |
A For the period October 2, 2018 (commencement of sale of shares) to October 31, 2018.
B Calculated based on average shares outstanding during the period.
C Total returns for periods of less than one year are not annualized.
D Total returns would have been lower if certain expenses had not been reduced during the applicable periods shown.
E Fees and expenses of any underlying Fidelity Central Funds are not included in the Fund's expense ratio. The Fund indirectly bears its proportionate share of the expenses of any underlying Fidelity Central Funds.
F Expense ratios reflect operating expenses of the class. Expenses before reductions do not reflect amounts reimbursed by the investment adviser or reductions from brokerage service arrangements or reductions from other expense offset arrangements and do not represent the amount paid by the class during periods when reimbursements or reductions occur. Expense ratios before reductions for start-up periods may not be representative of longer-term operating periods. Expenses net of fee waivers reflect expenses after reimbursement by the investment adviser but prior to reductions from brokerage service arrangements or other expense offset arrangements. Expenses net of all reductions represent the net expenses paid by the class.
G Annualized
H Amount does not include the portfolio activity of any underlying Fidelity Central Funds.
See accompanying notes which are an integral part of the financial statements.
Notes to Financial Statements
For the period ended October 31, 2018
(Amounts in thousands except percentages)
1. Organization.
Fidelity Advisor Floating Rate High Income Fund (the Fund) is a fund of Fidelity Advisor Series I (the Trust) and is authorized to issue an unlimited number of shares. The Trust is registered under the Investment Company Act of 1940, as amended (the 1940 Act), as an open-end management investment company organized as a Massachusetts business trust. The Fund commenced sale of Class Z shares on October 2, 2018. The Fund offers Class A, Class M, Class C, Fidelity Floating Rate High Income Fund, Class I and Class Z shares, each of which has equal rights as to assets and voting privileges. Each class has exclusive voting rights with respect to matters that affect that class.
2. Investments in Fidelity Central Funds.
The Fund invests in Fidelity Central Funds, which are open-end investment companies generally available only to other investment companies and accounts managed by the investment adviser and its affiliates. The Fund's Schedule of Investments lists each of the Fidelity Central Funds held as of period end, if any, as an investment of the Fund, but does not include the underlying holdings of each Fidelity Central Fund. As an Investing Fund, the Fund indirectly bears its proportionate share of the expenses of the underlying Fidelity Central Funds.
The Money Market Central Funds seek preservation of capital and current income and are managed by Fidelity Investments Money Management, Inc. (FIMM), an affiliate of the investment adviser. Annualized expenses of the Money Market Central Funds as of their most recent shareholder report date are less than .005%.
A complete unaudited list of holdings for each Fidelity Central Fund is available upon request or at the Securities and Exchange Commission (the SEC) website at www.sec.gov. In addition, the financial statements of the Fidelity Central Funds, which are not covered by the Fund's Report of Independent Registered Public Accounting Firm, are available on the SEC website or upon request.
3. Significant Accounting Policies.
The Fund is an investment company and applies the accounting and reporting guidance of the Financial Accounting Standards Board (FASB) Accounting Standards Codification Topic 946 Financial Services – Investments Companies. The financial statements have been prepared in conformity with accounting principles generally accepted in the United States of America (GAAP), which require management to make certain estimates and assumptions at the date of the financial statements. Actual results could differ from those estimates. Subsequent events, if any, through the date that the financial statements were issued have been evaluated in the preparation of the financial statements. The following summarizes the significant accounting policies of the Fund:
Investment Valuation. Investments are valued as of 4:00 p.m. Eastern time on the last calendar day of the period. The Board of Trustees (the Board) has delegated the day to day responsibility for the valuation of the Fund's investments to the Fair Value Committee (the Committee) established by the Fund's investment adviser. In accordance with valuation policies and procedures approved by the Board, the Fund attempts to obtain prices from one or more third party pricing vendors or brokers to value its investments. When current market prices, quotations or currency exchange rates are not readily available or reliable, investments will be fair valued in good faith by the Committee, in accordance with procedures adopted by the Board. Factors used in determining fair value vary by investment type and may include market or investment specific events, changes in interest rates and credit quality. The frequency with which these procedures are used cannot be predicted and they may be utilized to a significant extent. The Committee oversees the Fund's valuation policies and procedures and reports to the Board on the Committee's activities and fair value determinations. The Board monitors the appropriateness of the procedures used in valuing the Fund's investments and ratifies the fair value determinations of the Committee.
The Fund categorizes the inputs to valuation techniques used to value its investments into a disclosure hierarchy consisting of three levels as shown below:
- Level 1 – quoted prices in active markets for identical investments
- Level 2 – other significant observable inputs (including quoted prices for similar investments, interest rates, prepayment speeds, etc.)
- Level 3 – unobservable inputs (including the Fund's own assumptions based on the best information available)
Valuation techniques used to value the Fund's investments by major category are as follows:
Debt securities, including restricted securities, are valued based on evaluated prices received from third party pricing vendors or from brokers who make markets in such securities. Corporate bonds and bank loan obligations are valued by pricing vendors who utilize matrix pricing which considers yield or price of bonds of comparable quality, coupon, maturity and type or by broker-supplied prices. When independent prices are unavailable or unreliable, debt securities may be valued utilizing pricing methodologies which consider similar factors that would be used by third party pricing vendors. Debt securities are generally categorized as Level 2 in the hierarchy but may be Level 3 depending on the circumstances. The Fund invests a significant portion of its assets in below investment grade securities. The value of these securities can be more volatile due to changes in the credit quality of the issuer and is sensitive to changes in economic, market and regulatory conditions.
Equity securities, including restricted securities, for which market quotations are readily available, are valued at the last reported sale price or official closing price as reported by a third party pricing vendor on the primary market or exchange on which they are traded and are categorized as Level 1 in the hierarchy. In the event there were no sales during the day or closing prices are not available, securities are valued at the last quoted bid price or may be valued using the last available price and are generally categorized as Level 2 in the hierarchy. For foreign equity securities, when market or security specific events arise, comparisons to the valuation of American Depositary Receipts (ADRs), futures contracts, Exchange-Traded Funds (ETFs) and certain indexes as well as quoted prices for similar securities may be used and would be categorized as Level 2 in the hierarchy. Utilizing these techniques may result in transfers between Level 1 and Level 2. For equity securities, including restricted securities, where observable inputs are limited, assumptions about market activity and risk are used and these securities may be categorized as Level 3 in the hierarchy.
Investments in open-end mutual funds, including the Fidelity Central Funds, are valued at their closing net asset value (NAV) each business day and are categorized as Level 1 in the hierarchy.
Changes in valuation techniques may result in transfers in or out of an assigned level within the disclosure hierarchy. The aggregate value of investments by input level as of October 31, 2018 is included at the end of the Fund's Schedule of Investments.
Investment Transactions and Income. For financial reporting purposes, the Fund's investment holdings and NAV include trades executed through the end of the last business day of the period. The NAV per share for processing shareholder transactions is calculated as of the close of business of the New York Stock Exchange (NYSE), normally 4:00 p.m. Eastern time and includes trades executed through the end of the prior business day. Gains and losses on securities sold are determined on the basis of identified cost. Dividend income is recorded on the ex-dividend date, except for certain dividends from foreign securities where the ex-dividend date may have passed, which are recorded as soon as the Fund is informed of the ex-dividend date. Non-cash dividends included in dividend income, if any, are recorded at the fair market value of the securities received. Income and capital gain distributions from Fidelity Central Funds, if any, are recorded on the ex-dividend date. Certain distributions received by the Fund represent a return of capital or capital gain. The Fund determines the components of these distributions subsequent to the ex-dividend date, based upon receipt of tax filings or other correspondence relating to the underlying investment. These distributions are recorded as a reduction of cost of investments and/or as a realized gain. Interest income is accrued as earned and includes coupon interest and amortization of premium and accretion of discount on debt securities as applicable. Debt obligations may be placed on non-accrual status and related interest income may be reduced by ceasing current accruals and writing off interest receivables when the collection of all or a portion of interest has become doubtful based on consistently applied procedures. A debt obligation is removed from non-accrual status when the issuer resumes interest payments or when collectability of interest is reasonably assured. The Fund earns certain fees in connection with its floating rate loan purchasing activities. These fees are in addition to interest payments earned and may include amendment fees, consent fees and prepayment fees. These fees are recorded as Interest in the accompanying financial statements.
Class Allocations and Expenses. Investment income, realized and unrealized capital gains and losses, common expenses of the Fund, and certain fund-level expense reductions, if any, are allocated daily on a pro-rata basis to each class based on the relative net assets of each class to the total net assets of the Fund. Each class differs with respect to transfer agent and distribution and service plan fees incurred. Certain expense reductions may also differ by class. For the reporting period, the allocated portion of income and expenses to each class as a percent of its average net assets may vary due to the timing of recording these transactions in relation to fluctuating net assets of the classes. Expenses directly attributable to a fund are charged to that fund. Expenses attributable to more than one fund are allocated among the respective funds on the basis of relative net assets or other appropriate methods. Expense estimates are accrued in the period to which they relate and adjustments are made when actual amounts are known.
Deferred Trustee Compensation. Under a Deferred Compensation Plan (the Plan) for the Fund, certain independent Trustees have elected to defer receipt of a portion of their annual compensation. Deferred amounts are invested in a cross-section of Fidelity funds, are marked-to-market and remain in the Fund until distributed in accordance with the Plan. The investment of deferred amounts and the offsetting payable to the Trustees of $210 are included in the accompanying Statement of Assets and Liabilities in other receivables and other payables and accrued expenses, respectively.
Income Tax Information and Distributions to Shareholders. Each year, the Fund intends to qualify as a regulated investment company under Subchapter M of the Internal Revenue Code, including distributing substantially all of its taxable income and realized gains. As a result, no provision for U.S. Federal income taxes is required. As of October 31, 2018, the Fund did not have any unrecognized tax benefits in the financial statements; nor is the Fund aware of any tax positions for which it is reasonably possible that the total amounts of unrecognized tax benefits will significantly change in the next twelve months. The Fund files a U.S. federal tax return, in addition to state and local tax returns as required. The Fund's federal income tax returns are subject to examination by the Internal Revenue Service (IRS) for a period of three fiscal years after they are filed. State and local tax returns may be subject to examination for an additional fiscal year depending on the jurisdiction.
Distributions are declared and recorded daily and paid monthly from net investment income. Distributions from realized gains, if any, are declared and recorded on the ex-dividend date. Income and capital gain distributions are declared separately for each class. Income and capital gain distributions are determined in accordance with income tax regulations, which may differ from GAAP.
Capital accounts within the financial statements are adjusted for permanent book-tax differences. These adjustments have no impact on net assets or the results of operations. Capital accounts are not adjusted for temporary book-tax differences which will reverse in a subsequent period.
Book-tax differences are primarily due to market discount, deferred trustees compensation, capital loss carryforwards, defaulted bonds and losses deferred due to wash sales.
As of period end, the cost and unrealized appreciation (depreciation) in securities, and derivatives if applicable, for federal income tax purposes were as follows:
| Gross unrealized appreciation | $88,692 |
| Gross unrealized depreciation | (166,953) |
| Net unrealized appreciation (depreciation) | $(78,261) |
| Tax Cost | $13,133,368 |
The tax-based components of distributable earnings as of period end were as follows:
| Undistributed ordinary income | $13,817 |
| Capital loss carryforward | $(389,591) |
| Net unrealized appreciation (depreciation) on securities and other investments | $(78,262) |
Capital loss carryforwards are only available to offset future capital gains of the Fund to the extent provided by regulations and may be limited. Under the Regulated Investment Company Modernization Act of 2010 (the Act), the Fund is permitted to carry forward capital losses incurred in taxable years beginning after December 22, 2010 for an unlimited period and such capital losses are required to be used prior to any losses that expire. The capital loss carryforward information presented below, including any applicable limitation, is estimated as of fiscal period end and is subject to adjustment.
| No expiration | |
| Short-term | $(7,624) |
| Long-term | (381,967) |
| Total capital loss carryforward | $(389,591) |
The tax character of distributions paid was as follows:
| October 31, 2018 | October 31, 2017 | |
| Ordinary Income | $504,172 | $ 394,075 |
Short-Term Trading (Redemption) Fees. Shares held by investors in the Fund less than 60 days may have been subject to a redemption fee equal to 1.00% of the NAV of shares redeemed. All redemption fees, which reduce the proceeds of the shareholder redemption, are retained by the Fund and accounted for as an addition to paid in capital. In November 2017, the Board of Trustees approved the elimination of these redemption fees effective December 18, 2017.
Delayed Delivery Transactions and When-Issued Securities. During the period, the Fund transacted in securities on a delayed delivery or when-issued basis. Payment and delivery may take place after the customary settlement period for that security. The price of the underlying securities and the date when the securities will be delivered and paid for are fixed at the time the transaction is negotiated. The securities purchased on a delayed delivery or when-issued basis are identified as such in the Fund's Schedule of Investments.
Restricted Securities. The Fund may invest in securities that are subject to legal or contractual restrictions on resale. These securities generally may be resold in transactions exempt from registration or to the public if the securities are registered. Disposal of these securities may involve time-consuming negotiations and expense, and prompt sale at an acceptable price may be difficult. Information regarding restricted securities is included at the end of the Fund's Schedule of Investments.
Loans and Other Direct Debt Instruments. The Fund invests in direct debt instruments which are interests in amounts owed to lenders by corporate or other borrowers. These instruments may be in the form of loans, trade claims or other receivables and may include standby financing commitments such as revolving credit facilities that obligate the Fund to supply additional cash to the borrower on demand. Loans may be acquired through assignment or participation. The Fund did not have any unfunded loan commitments, which are contractual obligations for future funding, at period end.
New Accounting Pronouncement. In March 2017, the Financial Accounting Standards Board (FASB) issued an Accounting Standards Update (ASU), ASU 2017-08, which amends the amortization period for certain callable debt securities that are held at a premium. The amendment requires the premium to be amortized to the earliest call date. The amendments do not require an accounting change for securities held at a discount. The ASU is effective for annual periods beginning after December 15, 2018. Management is currently evaluating the potential impact of these changes to the financial statements.
New Rule Issuance. During August 2018, the U.S. Securities and Exchange Commission issued Final Rule Release No. 33-10532, Disclosure Update and Simplification. This Final Rule includes amendments specific to registered investment companies that are intended to eliminate overlap in disclosure requirements between Regulation S-X and GAAP. In accordance with these amendments, certain line-items in the Fund financial statements have been combined or removed for the current period as outlined in the table below.
| Financial Statement | Current Line-Item Presentation | Prior Line-Item Presentation |
| Statement of Assets and Liabilities | Total distributable earnings (loss) | Undistributed/Distributions in excess of/Accumulated net investment income (loss) Accumulated/Undistributed net realized gain (loss) Net unrealized appreciation (depreciation) |
| Statement of Changes in Net Assets | N/A - removed | Undistributed/Distributions in excess of/Accumulated net investment income (loss) end of period |
| Statement of Changes in Net Assets | Distributions to shareholders | Distributions to shareholders from net investment income Distributions to shareholders from net realized gain |
| Distributions to Shareholders Note to Financial Statements | Distributions to shareholders | Distributions to shareholders from net investment income Distributions to shareholders from net realized gain |
4. Purchase and Sales of Investments.
Purchases and sales of securities (including principal repayments of bank loan obligations, other than short-term securities, aggregated $6,954,749 and $5,099,430, respectively.
5. Fees and Other Transactions with Affiliates.
Management Fee. Fidelity Management & Research Company (the investment adviser) and its affiliates provide the Fund with investment management related services for which the Fund pays a monthly management fee. The management fee is the sum of an individual fund fee rate that is based on an annual rate of .45% of the Fund's average net assets and an annualized group fee rate that averaged .11% during the period. The group fee rate is based upon the average net assets of all the mutual funds advised by the investment adviser, including any mutual funds previously advised by the investment adviser that are currently advised by Fidelity SelectCo, LLC, an affiliate of the investment adviser. The group fee rate decreases as assets under management increase and increases as assets under management decrease. For the reporting period, the total annual management fee rate was .56% of the Fund's average net assets.
Distribution and Service Plan Fees. In accordance with Rule 12b-1 of the 1940 Act, the Fund has adopted separate Distribution and Service Plans for each class of shares. Certain classes pay Fidelity Distributors Corporation (FDC), an affiliate of the investment adviser, separate Distribution and Service Fees, each of which is based on an annual percentage of each class' average net assets. In addition, FDC may pay financial intermediaries for selling shares of the Fund and providing shareholder support services. For the period, the Distribution and Service Fee rates, total fees and amounts retained by FDC were as follows:
| Distribution Fee | Service Fee | Total Fees | Retained by FDC | |
| Class A | -% | .25% | $1,451 | $71 |
| Class M | -% | .25% | 252 | – |
| Class C | .75% | .25% | 4,861 | 215 |
| $6,564 | $286 |
Sales Load. FDC may receive a front-end sales charge of up to 2.75% for selling Class A shares and Class M shares, some of which is paid to financial intermediaries for selling shares of the Fund. Depending on the holding period, FDC may receive contingent deferred sales charges levied on Class A, Class M and Class C redemptions. The deferred sales charges are 1.00% for Class C shares, 1.00% or .50% for certain purchases of Class A shares and .25% for certain purchases of Class M shares.
For the period, sales charge amounts retained by FDC were as follows:
| Retained by FDC | |
| Class A | $41 |
| Class M | 5 |
| Class C(a) | 23 |
| $69 |
(a) When Class C shares are initially sold, FDC pays commissions from its own resources to financial intermediaries through which the sales are made.
Transfer Agent Fees. Fidelity Investments Institutional Operations Company, Inc., (FIIOC), an affiliate of the investment adviser, is the transfer, dividend disbursing and shareholder servicing agent for each class of the Fund. FIIOC receives account fees and asset-based fees that vary according to the account size and type of account of the shareholders of the respective classes of the Fund, except Class Z. FIIOC receives an asset-based fee of Class Z's average net assets. FIIOC pays for typesetting, printing and mailing of shareholder reports, except proxy statements.
For the period, transfer agent fees for each class were as follows:
| Amount | % of Class-Level Average Net Assets | |
| Class A | $891 | .15 |
| Class M | 162 | .16 |
| Class C | 757 | .16 |
| Fidelity Floating Rate High Income Fund | 8,930 | .11 |
| Class I | 3,797 | .17 |
| Class Z | –(a) | .04(b) |
| $14,537 |
(a) Amount less than $500.
(b) Annualized.
Accounting Fees. Fidelity Service Company, Inc. (FSC), an affiliate of the investment adviser, maintains the Fund's accounting records. The fee is based on the level of average net assets for each month. For the period, the fees were equivalent to an annual rate of .01%.
Brokerage Commissions. The Fund placed a portion of its portfolio transactions with brokerage firms which are affiliates of the investment adviser. Brokerage commissions are included in net realized gain (loss) and change in net unrealized appreciation (depreciation) in the Statement of Operations. The commissions paid to these affiliated firms were less than five hundred dollars for the period.
Interfund Trades. The Fund may purchase from or sell securities to other Fidelity Funds under procedures adopted by the Board. The procedures have been designed to ensure these interfund trades are executed in accordance with Rule 17a-7 of the 1940 Act. Interfund trades are included within the respective purchases and sales amounts shown in the Purchases and Sales of Investments note.
Other. During the period, the investment adviser reimbursed the Fund for certain losses in the amount of $20.
6. Committed Line of Credit.
The Fund participates with other funds managed by the investment adviser or an affiliate in a $4.25 billion credit facility (the "line of credit") to be utilized for temporary or emergency purposes to fund shareholder redemptions or for other short-term liquidity purposes. The Fund has agreed to pay commitment fees on its pro-rata portion of the line of credit, which amounted to $31 and is reflected in Miscellaneous expenses on the Statement of Operations. During the period, the Fund did not borrow on this line of credit.
7. Expense Reductions.
Through arrangements with the Fund's custodian, credits realized as a result of certain uninvested cash balances were used to reduce the Fund's expenses. During the period, these credits reduced the Fund's custody expenses by $104.
In addition, during the period the investment adviser reimbursed and/or waived a portion of fund-level operating expenses in the amount of $65.
8. Distributions to Shareholders.
Distributions to shareholders of each class were as follows:
| Year ended October 31, 2018(a) | Year ended October 31, 2017 | |
| Distributions to shareholders | ||
| Class A | $24,166 | $– |
| Class M | 4,187 | – |
| Class C | 16,600 | – |
| Fidelity Floating Rate High Income Fund | 363,480 | – |
| Class I | 95,721 | – |
| Class Z | 18 | – |
| Total | $504,172 | $– |
| From net investment income | ||
| Class A | $– | $23,794 |
| Class M | – | 5,475 |
| Class C | – | 16,016 |
| Fidelity Floating Rate High Income Fund | – | 271,385 |
| Class I | – | 77,405 |
| Total | $– | $394,075 |
(a) Distributions for Class Z are for the period October 2, 2018 (commencement of sale of shares) to October 31, 2018.
9. Share Transactions.
Share transactions for each class were as follows and may contain automatic conversions between classes or exchanges between affiliated funds:
| Shares | Shares | Dollars | Dollars | |
| Year ended October 31, 2018(a) | Year ended October 31, 2017 | Year ended October 31, 2018(a) | Year ended October 31, 2017 | |
| Class A | ||||
| Shares sold | 16,784 | 22,327 | $161,980 | $215,427 |
| Reinvestment of distributions | 2,361 | 2,289 | 22,764 | 22,112 |
| Shares redeemed | (17,404) | (37,818) | (167,909) | (365,948) |
| Net increase (decrease) | 1,741 | (13,202) | $16,835 | $(128,409) |
| Class M | ||||
| Shares sold | 2,489 | 1,925 | $23,981 | $18,561 |
| Reinvestment of distributions | 425 | 550 | 4,094 | 5,301 |
| Shares redeemed | (6,565) | (6,051) | (63,233) | (58,381) |
| Net increase (decrease) | (3,651) | (3,576) | $(35,158) | $(34,519) |
| Class C | ||||
| Shares sold | 7,549 | 7,187 | $72,826 | $69,348 |
| Reinvestment of distributions | 1,538 | 1,402 | 14,830 | 13,539 |
| Shares redeemed | (14,814) | (15,197) | (142,918) | (146,725) |
| Net increase (decrease) | (5,727) | (6,608) | $(55,262) | $(63,838) |
| Fidelity Floating Rate High Income Fund | ||||
| Shares sold | 375,175 | 256,065 | $3,615,070 | $2,468,886 |
| Reinvestment of distributions | 30,375 | 22,910 | 292,501 | 221,002 |
| Shares redeemed | (207,730) | (155,638) | (2,001,358) | (1,500,477) |
| Net increase (decrease) | 197,820 | 123,337 | $1,906,213 | $1,189,411 |
| Class I | ||||
| Shares sold | 74,989 | 102,139 | $722,001 | $985,030 |
| Reinvestment of distributions | 7,021 | 5,949 | 67,554 | 57,337 |
| Shares redeemed | (67,803) | (70,851) | (652,660) | (682,751) |
| Net increase (decrease) | 14,207 | 37,237 | $136,895 | $359,616 |
| Class Z | ||||
| Shares sold | 1,693 | – | $16,292 | $– |
| Reinvestment of distributions | 2 | – | 16 | – |
| Shares redeemed | (7) | – | (68) | – |
| Net increase (decrease) | 1,688 | – | $16,240 | $– |
(a) Share transactions for Class Z are for the period October 2, 2018 (commencement of sale of shares) to October 31, 2018.
10. Other.
The Fund's organizational documents provide former and current trustees and officers with a limited indemnification against liabilities arising in connection with the performance of their duties to the Fund. In the normal course of business, the Fund may also enter into contracts that provide general indemnifications. The Fund's maximum exposure under these arrangements is unknown as this would be dependent on future claims that may be made against the Fund. The risk of material loss from such claims is considered remote.
Report of Independent Registered Public Accounting Firm
To the Trustees of Fidelity Advisor Series I and Shareholders of Fidelity Advisor Floating Rate High Income Fund:
Opinion on the Financial Statements and Financial Highlights
We have audited the accompanying statement of assets and liabilities of Fidelity Advisor Floating Rate High Income Fund (the "Fund"), a fund of Fidelity Advisor Series I, including the schedule of investments, as of October 31, 2018, and the related statement of operations for the year then ended, the statement of changes in net assets for each of the two years in the period then ended, the financial highlights for each of the five years in the period then ended, and the related notes. In our opinion, the financial statements and financial highlights present fairly, in all material respects, the financial position of the Fund as of October 31, 2018, and the results of its operations for the year then ended, the changes in its net assets for each of the two years in the period then ended, and the financial highlights for each of the five years in the period then ended, in conformity with accounting principles generally accepted in the United States of America.
Basis for Opinion
These financial statements and financial highlights are the responsibility of the Fund's management. Our responsibility is to express an opinion on the Fund's financial statements and financial highlights based on our audits. We are a public accounting firm registered with the Public Company Accounting Oversight Board (United States) (PCAOB) and are required to be independent with respect to the Fund in accordance with the U.S. federal securities laws and the applicable rules and regulations of the Securities and Exchange Commission and the PCAOB.
We conducted our audits in accordance with the standards of the PCAOB. Those standards require that we plan and perform the audit to obtain reasonable assurance about whether the financial statements and financial highlights are free of material misstatement, whether due to error or fraud. The Fund is not required to have, nor were we engaged to perform, an audit of its internal control over financial reporting. As part of our audits we are required to obtain an understanding of internal control over financial reporting but not for the purpose of expressing an opinion on the effectiveness of the Fund’s internal control over financial reporting. Accordingly, we express no such opinion.
Our audits included performing procedures to assess the risks of material misstatement of the financial statements and financial highlights, whether due to error or fraud, and performing procedures that respond to those risks. Such procedures included examining, on a test basis, evidence regarding the amounts and disclosures in the financial statements and financial highlights. Our audits also included evaluating the accounting principles used and significant estimates made by management, as well as evaluating the overall presentation of the financial statements and financial highlights. Our procedures included confirmation of securities owned as of October 31, 2018, by correspondence with the custodians and brokers; when replies were not received from brokers, we performed other auditing procedures. We believe that our audits provide a reasonable basis for our opinion.
/s/ Deloitte & Touche LLP
Boston, Massachusetts
December 14, 2018
We have served as the auditor of one or more of the Fidelity investment companies since 1999.
Trustees and Officers
The Trustees, Members of the Advisory Board (if any), and officers of the trust and fund, as applicable, are listed below. The Board of Trustees governs the fund and is responsible for protecting the interests of shareholders. The Trustees are experienced executives who meet periodically throughout the year to oversee the fund's activities, review contractual arrangements with companies that provide services to the fund, oversee management of the risks associated with such activities and contractual arrangements, and review the fund's performance. Except for Michael E. Wiley, each of the Trustees oversees 283 funds. Mr. Wiley oversees 193 funds.
The Trustees hold office without limit in time except that (a) any Trustee may resign; (b) any Trustee may be removed by written instrument, signed by at least two-thirds of the number of Trustees prior to such removal; (c) any Trustee who requests to be retired or who has become incapacitated by illness or injury may be retired by written instrument signed by a majority of the other Trustees; and (d) any Trustee may be removed at any special meeting of shareholders by a two-thirds vote of the outstanding voting securities of the trust. Each Trustee who is not an interested person (as defined in the 1940 Act) of the trust and the fund is referred to herein as an Independent Trustee. Each Independent Trustee shall retire not later than the last day of the calendar year in which his or her 75th birthday occurs. The Independent Trustees may waive this mandatory retirement age policy with respect to individual Trustees. Officers and Advisory Board Members hold office without limit in time, except that any officer or Advisory Board Member may resign or may be removed by a vote of a majority of the Trustees at any regular meeting or any special meeting of the Trustees. Except as indicated, each individual has held the office shown or other offices in the same company for the past five years.
The fund’s Statement of Additional Information (SAI) includes more information about the Trustees. To request a free copy, call Fidelity at 1-877-208-0098.
Experience, Skills, Attributes, and Qualifications of the Trustees. The Governance and Nominating Committee has adopted a statement of policy that describes the experience, qualifications, attributes, and skills that are necessary and desirable for potential Independent Trustee candidates (Statement of Policy). The Board believes that each Trustee satisfied at the time he or she was initially elected or appointed a Trustee, and continues to satisfy, the standards contemplated by the Statement of Policy. The Governance and Nominating Committee also engages professional search firms to help identify potential Independent Trustee candidates who have the experience, qualifications, attributes, and skills consistent with the Statement of Policy. From time to time, additional criteria based on the composition and skills of the current Independent Trustees, as well as experience or skills that may be appropriate in light of future changes to board composition, business conditions, and regulatory or other developments, have also been considered by the professional search firms and the Governance and Nominating Committee. In addition, the Board takes into account the Trustees' commitment and participation in Board and committee meetings, as well as their leadership of standing and ad hoc committees throughout their tenure.
In determining that a particular Trustee was and continues to be qualified to serve as a Trustee, the Board has considered a variety of criteria, none of which, in isolation, was controlling. The Board believes that, collectively, the Trustees have balanced and diverse experience, qualifications, attributes, and skills, which allow the Board to operate effectively in governing the fund and protecting the interests of shareholders. Information about the specific experience, skills, attributes, and qualifications of each Trustee, which in each case led to the Board's conclusion that the Trustee should serve (or continue to serve) as a trustee of the fund, is provided below.
Board Structure and Oversight Function. James C. Curvey is an interested person and currently serves as Chairman. The Trustees have determined that an interested Chairman is appropriate and benefits shareholders because an interested Chairman has a personal and professional stake in the quality and continuity of services provided to the fund. Independent Trustees exercise their informed business judgment to appoint an individual of their choosing to serve as Chairman, regardless of whether the Trustee happens to be independent or a member of management. The Independent Trustees have determined that they can act independently and effectively without having an Independent Trustee serve as Chairman and that a key structural component for assuring that they are in a position to do so is for the Independent Trustees to constitute a substantial majority for the Board. The Independent Trustees also regularly meet in executive session. Ned C. Lautenbach serves as Chairman of the Independent Trustees and as such (i) acts as a liaison between the Independent Trustees and management with respect to matters important to the Independent Trustees and (ii) with management prepares agendas for Board meetings.
Fidelity® funds are overseen by different Boards of Trustees. The fund's Board oversees Fidelity's high income and certain equity funds, and other Boards oversee Fidelity's investment-grade bond, money market, asset allocation, and other equity funds. The asset allocation funds may invest in Fidelity® funds overseen by the fund's Board. The use of separate Boards, each with its own committee structure, allows the Trustees of each group of Fidelity® funds to focus on the unique issues of the funds they oversee, including common research, investment, and operational issues. On occasion, the separate Boards establish joint committees to address issues of overlapping consequences for the Fidelity® funds overseen by each Board.
The Trustees operate using a system of committees to facilitate the timely and efficient consideration of all matters of importance to the Trustees, the fund, and fund shareholders and to facilitate compliance with legal and regulatory requirements and oversight of the fund's activities and associated risks. The Board, acting through its committees, has charged FMR and its affiliates with (i) identifying events or circumstances the occurrence of which could have demonstrably adverse effects on the fund's business and/or reputation; (ii) implementing processes and controls to lessen the possibility that such events or circumstances occur or to mitigate the effects of such events or circumstances if they do occur; and (iii) creating and maintaining a system designed to evaluate continuously business and market conditions in order to facilitate the identification and implementation processes described in (i) and (ii) above. Because the day-to-day operations and activities of the fund are carried out by or through FMR, its affiliates, and other service providers, the fund's exposure to risks is mitigated but not eliminated by the processes overseen by the Trustees. While each of the Board's committees has responsibility for overseeing different aspects of the fund's activities, oversight is exercised primarily through the Operations, Audit, and Compliance Committees. In addition, the Independent Trustees have worked with Fidelity to enhance the Board's oversight of investment and financial risks, legal and regulatory risks, technology risks, and operational risks, including the development of additional risk reporting to the Board. Appropriate personnel, including but not limited to the fund's Chief Compliance Officer (CCO), FMR's internal auditor, the independent accountants, the fund's Treasurer and portfolio management personnel, make periodic reports to the Board's committees, as appropriate, including an annual review of Fidelity's risk management program for the Fidelity® funds. The responsibilities of each standing committee, including their oversight responsibilities, are described further under "Standing Committees of the Trustees."
Interested Trustees*:
Correspondence intended for a Trustee who is an interested person may be sent to Fidelity Investments, 245 Summer Street, Boston, Massachusetts 02210.
Name, Year of Birth; Principal Occupations and Other Relevant Experience+
James C. Curvey (1935)
Year of Election or Appointment: 2007
Trustee
Chairman of the Board of Trustees
Mr. Curvey also serves as Trustee of other Fidelity® funds. Mr. Curvey is Vice Chairman (2007-present) and Director of FMR LLC (diversified financial services company). In addition, Mr. Curvey is an Overseer Emeritus for the Boston Symphony Orchestra, a Director of Artis-Naples, and a Trustee of Brewster Academy in Wolfeboro, New Hampshire. Previously, Mr. Curvey served as a Director of Fidelity Research & Analysis Co. (investment adviser firm, 2009-2018), Director of Fidelity Investments Money Management, Inc. (investment adviser firm, 2009-2014) and a Director of FMR and FMR Co., Inc. (investment adviser firms, 2007-2014).
Charles S. Morrison (1960)
Year of Election or Appointment: 2014
Trustee
Mr. Morrison also serves as Trustee of other funds. He serves as President of Fidelity SelectCo, LLC (investment adviser firm, 2017-present) and Fidelity Management & Research Company (FMR) (investment adviser firm, 2016-present), a Director of Fidelity Investments Money Management, Inc. (FIMM) (investment adviser firm, 2014-present), Director of Fidelity SelectCo, LLC (investment adviser firm, 2014-present), President, Asset Management (2014-present), and is an employee of Fidelity Investments. Previously, Mr. Morrison served as Vice President of Fidelity's Fixed Income and Asset Allocation Funds (2012-2014), President, Fixed Income (2011-2014), Vice President of Fidelity's Money Market Funds (2005-2009), President, Money Market Group Leader of FMR (investment adviser firm, 2009), and Senior Vice President, Money Market Group of FMR (2004-2009). Mr. Morrison also served as Vice President of Fidelity's Bond Funds (2002-2005), certain Balanced Funds (2002-2005), and certain Asset Allocation Funds (2002-2007), and as Senior Vice President (2002-2005) of Fidelity's Bond Division.
* Determined to be an “Interested Trustee” by virtue of, among other things, his or her affiliation with the trust or various entities under common control with FMR.
+ The information includes the Trustee's principal occupation during the last five years and other information relating to the experience, attributes, and skills relevant to the Trustee's qualifications to serve as a Trustee, which led to the conclusion that the Trustee should serve as a Trustee for the fund.
Independent Trustees:
Correspondence intended for an Independent Trustee may be sent to Fidelity Investments, P.O. Box 55235, Boston, Massachusetts 02205-5235.
Name, Year of Birth; Principal Occupations and Other Relevant Experience+
Dennis J. Dirks (1948)
Year of Election or Appointment: 2005
Trustee
Mr. Dirks also serves as Trustee of other Fidelity® funds. Prior to his retirement in May 2003, Mr. Dirks was Chief Operating Officer and a member of the Board of The Depository Trust & Clearing Corporation (DTCC). He also served as President, Chief Operating Officer, and Board member of The Depository Trust Company (DTC) and President and Board member of the National Securities Clearing Corporation (NSCC). In addition, Mr. Dirks served as Chief Executive Officer and Board member of the Government Securities Clearing Corporation, Chief Executive Officer and Board member of the Mortgage-Backed Securities Clearing Corporation, as a Trustee and a member of the Finance Committee of Manhattan College (2005-2008), as a Trustee and a member of the Finance Committee of AHRC of Nassau County (2006-2008), as a member of the Independent Directors Council (IDC) Governing Council (2010-2015), and as a member of the Board of Directors for The Brookville Center for Children’s Services, Inc. (2009-2017). Mr. Dirks is a member of the Finance Committee (2016-present), Board of Directors (2017-present) and Board of Trustees (2018-present) and is Treasurer (2018-present) of the Asolo Repertory Theatre.
Donald F. Donahue (1950)
Year of Election or Appointment: 2018
Trustee
Mr. Donahue also serves as a Trustee of other Fidelity® funds. Mr. Donahue is President and Chief Executive Officer of Miranda Partners, LLC (risk consulting for the financial services industry, 2012-present). Previously, Mr. Donahue served as a Member of the Advisory Board of certain Fidelity® funds (2015-2018) and Chief Executive Officer (2006-2012), Chief Operating Officer (2003-2006), and Managing Director, Customer Marketing and Development (1999-2003) of The Depository Trust & Clearing Corporation (financial markets infrastructure). Mr. Donahue serves as a Member (2007-present) and Co-Chairman (2016-present) of the Board of Directors of United Way of New York, Member of the Board of Directors of NYC Leadership Academy (2012-present) and Member of the Board of Advisors of Ripple Labs, Inc. (financial services, 2015-present). He also served as Chairman (2010-2012) and Member of the Board of Directors (2012-2013) of Omgeo, LLC (financial services), Treasurer of United Way of New York (2012-2016), and Member of the Board of Directors of XBRL US (financial services non-profit, 2009-2012) and the International Securities Services Association (2009-2012).
Alan J. Lacy (1953)
Year of Election or Appointment: 2008
Trustee
Mr. Lacy also serves as Trustee of other Fidelity® funds. Mr. Lacy serves as a Director of Bristol-Myers Squibb Company (global pharmaceuticals, 2008-present). He is a Trustee of the California Chapter of The Nature Conservancy (2015-present) and a Director of the Center for Advanced Study in the Behavioral Sciences at Stanford University (2015-present). In addition, Mr. Lacy served as Senior Adviser (2007-2014) of Oak Hill Capital Partners, L.P. (private equity) and also served as Chief Executive Officer (2005) and Vice Chairman (2005-2006) of Sears Holdings Corporation (retail) and Chief Executive Officer and Chairman of the Board of Sears, Roebuck and Co. (retail, 2000-2005). Previously, Mr. Lacy served as Chairman (2014-2017) and a member (2010-2017) of the Board of Directors of Dave & Buster’s Entertainment, Inc. (restaurant and entertainment complexes), as Chairman (2008-2011) and a member (2006-2015) of the Board of Trustees of the National Parks Conservation Association, and as a member of the Board of Directors for The Hillman Companies, Inc. (hardware wholesalers, 2010-2014), Earth Fare, Inc. (retail grocery, 2010-2014), and The Western Union Company (global money transfer, 2006-2011).
Ned C. Lautenbach (1944)
Year of Election or Appointment: 2000
Trustee
Chairman of the Independent Trustees
Mr. Lautenbach also serves as Trustee of other Fidelity® funds. Mr. Lautenbach currently serves as Vice Chair of the Board of Governors, State University System of Florida (2013-present) and is a member of the Council on Foreign Relations (1994-present). He is also a member and has most recently served as Chairman of the Board of Directors of Artis-Naples (2012-present). Previously, Mr. Lautenbach served as a member and then Lead Director of the Board of Directors of Eaton Corporation (diversified industrial, 1997-2016). He was also a Partner and Advisory Partner at Clayton, Dubilier & Rice, LLC (private equity investment, 1998-2010), as well as a Director of Sony Corporation (2006-2007). In addition, Mr. Lautenbach also had a 30-year career with IBM (technology company) during which time he served as Senior Vice President and a member of the Corporate Executive Committee (1968-1998).
Joseph Mauriello (1944)
Year of Election or Appointment: 2008
Trustee
Mr. Mauriello also serves as Trustee of other Fidelity® funds. Prior to his retirement in January 2006, Mr. Mauriello served in numerous senior management positions including Deputy Chairman and Chief Operating Officer (2004-2005), and Vice Chairman of Financial Services (2002-2004) of KPMG LLP US (professional services, 1965-2005). Mr. Mauriello currently serves as a member of the Independent Directors Council (IDC) Governing Council (2015-present). Previously, Mr. Mauriello served as a member of the Board of Directors of XL Group plc. (global insurance and re-insurance, 2006-2018).
Cornelia M. Small (1944)
Year of Election or Appointment: 2005
Trustee
Ms. Small also serves as Trustee of other Fidelity® funds. Ms. Small is a member of the Board of Directors (2009-present) and Chair of the Investment Committee (2010-present) of the Teagle Foundation. Ms. Small also serves on the Investment Committee of the Berkshire Taconic Community Foundation (2008-present). Previously, Ms. Small served as Chairperson (2002-2008) and a member of the Investment Committee and Chairperson (2008-2012) and a member of the Board of Trustees of Smith College. In addition, Ms. Small served as Chief Investment Officer, Director of Global Equity Investments, and a member of the Board of Directors of Scudder, Stevens & Clark and Scudder Kemper Investments.
Garnett A. Smith (1947)
Year of Election or Appointment: 2018
Trustee
Mr. Smith also serves as Trustee of other Fidelity® funds. Prior to Mr. Smith's retirement, he served as Chairman and Chief Executive Officer of Inbrand Corp. (manufacturer of personal absorbent products, 1990-1997). He also served as President (1986-1990) of Inbrand Corp. Prior to his employment with Inbrand Corp., he was employed by a retail fabric chain and North Carolina National Bank. In addition, Mr. Smith served as a Member of the Advisory Board of certain Fidelity® funds (2012-2013) and as a board member of the Jackson Hole Land Trust (2009-2012).
David M. Thomas (1949)
Year of Election or Appointment: 2008
Trustee
Mr. Thomas also serves as Trustee of other Fidelity® funds. Mr. Thomas serves as Non-Executive Chairman of the Board of Directors of Fortune Brands Home and Security (home and security products, 2011-present), as a member of the Board of Directors (2004-present) and Presiding Director (2013-present) of Interpublic Group of Companies, Inc. (marketing communication), and as a member of the Board of Trustees of the University of Florida (2013-present). Previously, Mr. Thomas served as Executive Chairman (2005-2006) and Chairman and Chief Executive Officer (2000-2005) of IMS Health, Inc. (pharmaceutical and healthcare information solutions), and a Director of Fortune Brands, Inc. (consumer products, 2000-2011).
Michael E. Wiley (1950)
Year of Election or Appointment: 2018
Trustee
Mr. Wiley also serves as Trustee or Member of the Advisory Board of other Fidelity® funds. Mr. Wiley serves as a Director of High Point Resources (exploration and production, 2005-present). Previously, Mr. Wiley served as a Director of Andeavor Corporation (independent oil refiner and marketer, 2005-2018), a Director of Andeavor Logistics LP (natural resources logistics, 2015-2018), a Director of Post Oak Bank (privately-held bank, 2004-2018), a Director of Asia Pacific Exploration Consolidated (international oil and gas exploration and production, 2008-2013), a member of the Board of Trustees of the University of Tulsa (2000-2006; 2007-2010), a Senior Energy Advisor of Katzenbach Partners, LLC (consulting, 2006-2007), an Advisory Director of Riverstone Holdings (private investment), a Director of Spinnaker Exploration Company (exploration and production, 2001-2005) and Chairman, President, and CEO of Baker Hughes, Inc. (oilfield services, 2000-2004).
+ The information includes the Trustee's principal occupation during the last five years and other information relating to the experience, attributes, and skills relevant to the Trustee's qualifications to serve as a Trustee, which led to the conclusion that the Trustee should serve as a Trustee for the fund.
Advisory Board Members and Officers:
Correspondence intended for a Member of the Advisory Board (if any) may be sent to Fidelity Investments, P.O. Box 55235, Boston, Massachusetts 02205-5235. Correspondence intended for an officer or Peter S. Lynch may be sent to Fidelity Investments, 245 Summer Street, Boston, Massachusetts 02210. Officers appear below in alphabetical order.
Name, Year of Birth; Principal Occupation
Vicki L. Fuller (1957)
Year of Election or Appointment: 2018
Member of the Advisory Board
Ms. Fuller also serves as Member of the Advisory Board of other Fidelity® funds. Ms. Fuller serves as a member of the Board of Directors, Audit Committee, and Nominating and Governance Committee of The Williams Companies, Inc. (natural gas infrastructure, 2018-present). Previously, Ms. Fuller served as the Chief Investment Officer of the New York State Common Retirement Fund (2012-2018) and held a variety of positions at AllianceBernstein L.P. (global asset management, 1985-2012), including Managing Director (2006-2012) and Senior Vice President and Senior Portfolio Manager (2001-2006).
Peter S. Lynch (1944)
Year of Election or Appointment: 2003
Member of the Advisory Board
Mr. Lynch also serves as Member of the Advisory Board of other Fidelity® funds. Mr. Lynch is Vice Chairman and a Director of FMR (investment adviser firm) and FMR Co., Inc. (investment adviser firm). In addition, Mr. Lynch serves as a Trustee of Boston College and as the Chairman of the Inner-City Scholarship Fund. Previously, Mr. Lynch served on the Special Olympics International Board of Directors (1997-2006).
William S. Stavropoulos (1939)
Year of Election or Appointment: 2018
Member of the Advisory Board
Mr. Stavropoulos also serves as Member of the Advisory Board of other Fidelity® funds. Mr. Stavropoulos serves as President and Founder of the Michigan Baseball Foundation, the Great Lakes Loons (2007-present). Mr. Stavropoulos is Chairman Emeritus of the Board of Directors of The Dow Chemical Company, where he previously served in numerous senior management positions, including President, CEO (1995-2000; 2002-2004), Chairman of the Executive Committee (2000-2006), and as a member of the Board of Directors (1990-2006). Currently, Mr. Stavropoulos is Chairman of the Board of Directors of Univar Inc. (global distributor of commodity and specialty chemicals), a Director of Teradata Corporation (data warehousing and technology solutions), and a member of the Advisory Board for Metalmark Capital LLC (private equity investment, 2005-present). Mr. Stavropoulos is an operating advisor to Clayton, Dubilier & Rice, LLC (private equity investment). In addition, Mr. Stavropoulos is a member of the University of Notre Dame Advisory Council for the College of Science, a Trustee of the Rollin L. Gerstacker Foundation, and a Director of Artis-Naples in Naples, Florida. Previously, Mr. Stavropoulos served as Trustee of certain Fidelity® funds (2001-2018) and as a Director of Chemical Financial Corporation (bank holding company, 1993-2012) and Tyco International, Ltd. (multinational manufacturing and services, 2007-2012).
Carol B. Tomé (1957)
Year of Election or Appointment: 2018
Member of the Advisory Board
Ms. Tomé also serves as Member of the Advisory Board of other Fidelity® funds. Ms. Tomé is Chief Financial Officer (2001-present) and Executive Vice President of Corporate Services (2007-present) of The Home Depot, Inc. (home improvement retailer) and a Director (2003-present) and Chair of the Audit Committee (2004-present) of United Parcel Service, Inc. (package delivery and supply chain management). Previously, Ms. Tomé served as Trustee of certain Fidelity® funds (2017), Senior Vice President of Finance and Accounting/Treasurer (2000-2007) and Vice President and Treasurer (1995-2000) of The Home Depot, Inc. and Chair of the Board (2010-2012), Vice Chair of the Board (2009 and 2013), and a Director (2008-2013) of the Federal Reserve Bank of Atlanta. Ms. Tomé is also a director or trustee of many community and professional organizations.
Elizabeth Paige Baumann (1968)
Year of Election or Appointment: 2017
Anti-Money Laundering (AML) Officer
Ms. Baumann also serves as AML Officer of other funds. She is Chief AML Officer (2012-present) and Senior Vice President (2014-present) of FMR LLC (diversified financial services company) and is an employee of Fidelity Investments. Previously, Ms. Baumann served as AML Officer of the funds (2012-2016), and Vice President (2007-2014) and Deputy Anti-Money Laundering Officer (2007-2012) of FMR LLC.
John J. Burke III (1964)
Year of Election or Appointment: 2018
Chief Financial Officer
Mr. Burke also serves as Chief Financial Officer of other funds. Mr. Burke serves as Head of Investment Operations for Fidelity Fund and Investment Operations (2018-present) and is an employee of Fidelity Investments (1998-present). Previously Mr. Burke served as head of Asset Management Investment Operations (2012-2018).
William C. Coffey (1969)
Year of Election or Appointment: 2018
Secretary and Chief Legal Officer (CLO)
Mr. Coffey also serves as Secretary and CLO of other funds. Mr. Coffey serves as CLO, Secretary, and Senior Vice President of Fidelity Management & Research Company and FMR Co., Inc. (investment adviser firms, 2018-present); Secretary of Fidelity SelectCo, LLC and Fidelity Investments Money Management, Inc. (investment adviser firms, 2018-present); and CLO of Fidelity Management & Research (Hong Kong) Limited, FMR Investment Management (UK) Limited, and Fidelity Management & Research (Japan) Limited (investment adviser firms, 2018-present). He is Senior Vice President and Deputy General Counsel of FMR LLC (diversified financial services company, 2010-present), and is an employee of Fidelity Investments. Previously, Mr. Coffey served as Assistant Secretary of certain funds (2009-2018) and as Vice President and Associate General Counsel of FMR LLC (2005-2009).
Timothy M. Cohen (1969)
Year of Election or Appointment: 2018
Vice President
Mr. Cohen also serves as Vice President of other funds. Mr. Cohen serves as Co-Head of Global Equity Research (2016-present), a Director of Fidelity Management & Research (Japan) Limited (investment adviser firm, 2016-present), and is an employee of Fidelity Investments. Previously, Mr. Cohen served as Chief Investment Officer - Equity and a Director of Fidelity Management & Research (U.K.) Inc. (investment adviser firm, 2013-2015) and as a Director of Fidelity Management & Research (Hong Kong) Limited (investment adviser firm, 2017).
Jonathan Davis (1968)
Year of Election or Appointment: 2010
Assistant Treasurer
Mr. Davis also serves as Assistant Treasurer of other funds. Mr. Davis serves as Assistant Treasurer of FMR Capital, Inc. (2017-present) and is an employee of Fidelity Investments. Previously, Mr. Davis served as Vice President and Associate General Counsel of FMR LLC (diversified financial services company, 2003-2010).
Adrien E. Deberghes (1967)
Year of Election or Appointment: 2016
Assistant Treasurer
Mr. Deberghes also serves as an officer of other funds. He serves as Assistant Treasurer of FMR Capital, Inc. (2017-present), Executive Vice President of Fidelity Investments Money Management, Inc. (FIMM) (investment adviser firm, 2016-present), and is an employee of Fidelity Investments (2008-present). Previously, Mr. Deberghes served as President and Treasurer of certain Fidelity® funds (2013-2018). Prior to joining Fidelity Investments, Mr. Deberghes was Senior Vice President of Mutual Fund Administration at State Street Corporation (2007-2008), Senior Director of Mutual Fund Administration at Investors Bank & Trust (2005-2007), and Director of Finance for Dunkin' Brands (2000-2005). Previously, Mr. Deberghes served in other fund officer roles.
Laura M. Del Prato (1964)
Year of Election or Appointment: 2018
Assistant Treasurer
Ms. Del Prato also serves as an officer of other funds. Ms. Del Prato is an employee of Fidelity Investments (2017-present). Prior to joining Fidelity Investments, Ms. Del Prato served as a Managing Director and Treasurer of the JPMorgan Mutual Funds (2014-2017). Prior to JPMorgan, Ms. Del Prato served as a partner at Cohen Fund Audit Services (accounting firm, 2012-2013) and KPMG LLP (accounting firm, 2004-2012).
Colm A. Hogan (1973)
Year of Election or Appointment: 2016
Deputy Treasurer
Mr. Hogan also serves as an officer of other funds. Mr. Hogan serves as Assistant Treasurer of FMR Capital, Inc. (2017-present) and is an employee of Fidelity Investments (2005-present). Previously, Mr. Hogan served as Assistant Treasurer of certain Fidelity® funds (2016-2018).
Pamela R. Holding (1964)
Year of Election or Appointment: 2018
Vice President
Ms. Holding also serves as Vice President of other funds. Ms. Holding serves as Co-Head of Global Equity Research (2018-present) and is an employee of Fidelity Investments (2013-present).
Chris Maher (1972)
Year of Election or Appointment: 2013
Assistant Treasurer
Mr. Maher serves as Assistant Treasurer of other funds. Mr. Maher is Vice President of Valuation Oversight, serves as Assistant Treasurer of FMR Capital, Inc. (2017-present), and is an employee of Fidelity Investments. Previously, Mr. Maher served as Vice President of Asset Management Compliance (2013), Vice President of the Program Management Group of FMR (investment adviser firm, 2010-2013), and Vice President of Valuation Oversight (2008-2010).
Rieco E. Mello (1969)
Year of Election or Appointment: 2017
Assistant Treasurer
Mr. Mello also serves as Assistant Treasurer of other funds. Mr. Mello serves as Assistant Treasurer of FMR Capital, Inc. (2017-present) and is an employee of Fidelity Investments (1995-present).
Kenneth B. Robins (1969)
Year of Election or Appointment: 2016
Chief Compliance Officer
Mr. Robins also serves as an officer of other funds. Mr. Robins serves as Compliance Officer of Fidelity Management & Research Company and FMR Co., Inc. (investment adviser firms, 2016-present) and is an employee of Fidelity Investments (2004-present). Previously, Mr. Robins served as Executive Vice President of Fidelity Investments Money Management, Inc. (investment adviser firm, 2013-2016) and served in other fund officer roles.
Stacie M. Smith (1974)
Year of Election or Appointment: 2016
President and Treasurer
Ms. Smith also serves as an officer of other funds. Ms. Smith serves as Assistant Treasurer of FMR Capital, Inc. (2017-present), is an employee of Fidelity Investments (2009-present), and has served in other fund officer roles. Prior to joining Fidelity Investments, Ms. Smith served as Senior Audit Manager of Ernst & Young LLP (accounting firm, 1996-2009). Previously, Ms. Smith served as Assistant Treasurer (2013-2018) and Deputy Treasurer (2013-2016) of certain Fidelity® funds.
Marc L. Spector (1972)
Year of Election or Appointment: 2016
Assistant Treasurer
Mr. Spector also serves as an officer of other funds. Mr. Spector serves as Assistant Treasurer of FMR Capital, Inc. (2017-present) and is an employee of Fidelity Investments (2016-present). Prior to joining Fidelity Investments, Mr. Spector served as Director at the Siegfried Group (accounting firm, 2013-2016), and prior to Siegfried Group as audit senior manager at Deloitte & Touche (accounting firm, 2005-2013).
Shareholder Expense Example
As a shareholder of the Fund, you incur two types of costs: (1) transaction costs, including sales charges (loads) on purchase payments or redemption proceeds, redemption fees and (2) ongoing costs, including management fees, distribution and/or service (12b-1) fees and other Fund expenses. This Example is intended to help you understand your ongoing costs (in dollars) of investing in the Fund and to compare these costs with the ongoing costs of investing in other mutual funds.
The actual expense Example is based on an investment of $1,000 invested at the beginning of the period and held for the entire period (May 1, 2018 to October 31, 2018) for Class A, Class M, Class C, Fidelity Floating Rate High Income Fund and Class I, and for the period (October 2, 2018 to October 31, 2018) for Class Z. The hypothetical expense Example is based on an investment of $1,000 invested for the one-half year period (May 1, 2018 to October 31, 2018).
Actual Expenses
The first line of the accompanying table for each class of the Fund provides information about actual account values and actual expenses. You may use the information in this line, together with the amount you invested, to estimate the expenses that you paid over the period. Simply divide your account value by $1,000.00 (for example, an $8,600 account value divided by $1,000.00 = 8.6), then multiply the result by the number in the first line for a class of the Fund under the heading entitled "Expenses Paid During Period" to estimate the expenses you paid on your account during this period. A small balance maintenance fee of $12.00 that is charged once a year may apply for certain accounts with a value of less than $2,000. This fee, which was eliminated effective August 1, 2018, is not included in the table below. If it was, the estimate of expenses you paid during the period would be higher, and your ending account value lower, by this amount. In addition, the Fund, as a shareholder in the underlying Fidelity Central Funds, will indirectly bear its pro-rata share of the fees and expenses incurred by the underlying Fidelity Central Funds. These fees and expenses are not included in the Fund's annualized expense ratio used to calculate the expense estimate in the table below.
Hypothetical Example for Comparison Purposes
The second line of the accompanying table for each class of the Fund provides information about hypothetical account values and hypothetical expenses based on a Class' actual expense ratio and an assumed rate of return of 5% per year before expenses, which is not the Class' actual return. The hypothetical account values and expenses may not be used to estimate the actual ending account balance or expenses you paid for the period. You may use this information to compare the ongoing costs of investing in the Fund and other funds. To do so, compare this 5% hypothetical example with the 5% hypothetical examples that appear in the shareholder reports of the other funds. A small balance maintenance fee of $12.00 that is charged once a year may apply for certain accounts with a value of less than $2,000. This fee, which was eliminated effective August 1, 2018, is not included in the table below. If it was, the estimate of expenses you paid during the period would be higher, and your ending account value lower, by this amount. In addition, the Fund, as a shareholder in the underlying Fidelity Central Funds, will indirectly bear its pro-rata share of the fees and expenses incurred by the underlying Fidelity Central Funds. These fees and expenses are not included in the Fund's annualized expense ratio used to calculate the expense estimate in the table below.
Please note that the expenses shown in the table are meant to highlight your ongoing costs only and do not reflect any transaction costs. Therefore, the second line of the table is useful in comparing ongoing costs only, and will not help you determine the relative total costs of owning different funds. In addition, if these transactional costs were included, your costs would have been higher.
| Annualized Expense Ratio-A | Beginning Account Value | Ending Account Value October 31, 2018 | Expenses Paid During Period | |
| Class A | .97% | |||
| Actual | $1,000.00 | $1,017.10 | $4.93-B | |
| Hypothetical-C | $1,000.00 | $1,020.32 | $4.94-D | |
| Class M | .98% | |||
| Actual | $1,000.00 | $1,016.00 | $4.98-B | |
| Hypothetical-C | $1,000.00 | $1,020.27 | $4.99-D | |
| Class C | 1.72% | |||
| Actual | $1,000.00 | $1,012.20 | $8.72-B | |
| Hypothetical-C | $1,000.00 | $1,016.53 | $8.74-D | |
| Fidelity Floating Rate High Income Fund | .68% | |||
| Actual | $1,000.00 | $1,017.50 | $3.46-B | |
| Hypothetical-C | $1,000.00 | $1,021.78 | $3.47-D | |
| Class I | .74% | |||
| Actual | $1,000.00 | $1,017.20 | $3.76-B | |
| Hypothetical-C | $1,000.00 | $1,021.48 | $3.77-D | |
| Class Z | .62% | |||
| Actual | $1,000.00 | $1,018.20 | $.51-B | |
| Hypothetical-C | $1,000.00 | $1,022.08 | $3.16-D |
A Annualized expense ratio reflects expenses net of applicable fee waivers.
B Actual expenses are equal to each Class' annualized expense ratio, multiplied by the average account value over the period, multiplied by 184/365 (to reflect the one-half year period) for Class A, Class M, Class C, Fidelity Floating Rate High Income Fund and Class I and multiplied by 30/365 (to reflect the period October 2, 2018 to October 31, 2018) for Class Z.
C 5% return per year before expenses
D Hypothetical expenses are equal to each Class' annualized expense ratio, multiplied by the average account value over the period, multiplied by 184/365 (to reflect the one-half year period).
Distributions (Unaudited)
A total of 0.72% of the dividends distributed during the fiscal year was derived from interest on U.S. Government securities which is generally exempt from state income tax.
The fund designates $374,106,911 of distributions paid during the period January 1, 2018 to October 31, 2018 as qualifying to be taxed as interest-related dividends for nonresident alien shareholders.
The fund will notify shareholders in January 2019 of amounts for use in preparing 2018 income tax returns.
Board Approval of Investment Advisory Contracts
Fidelity Advisor Floating Rate High Income Fund
At its July 2018 meeting, the Board of Trustees, including the Independent Trustees (together, the Board), voted to continue the management contract with Fidelity Management & Research Company (FMR) and the sub-advisory agreements (together, the Advisory Contracts) for the fund for six months through January 31, 2019, in connection with the reunification of the Fidelity Equity High Income Funds Board, which oversees the fund, and the Sector Portfolios Board.
The Board considered that the approval of the fund's Advisory Contracts will not result in any changes in (i) the investment process or strategies employed in the management of the fund's assets; (ii) the fees and expenses paid by shareholders; (iii) the nature, extent or quality of services provided under the fund's Advisory Contracts; or (iv) the day-to-day management of the fund or the persons primarily responsible for such management. The Board concluded that the fund's Advisory Contracts are fair and reasonable, and that the fund's Advisory Contracts should be renewed, without modification, through January 31, 2019, with the understanding that the Board will consider the annual renewal for a full one year period in January 2019.
In connection with its consideration of future renewals of the fund's Advisory Contracts, the Board will consider: (i) the nature, extent and quality of services provided to the fund, including shareholder and administrative services and investment performance; (ii) the competitiveness of the management fee and total expenses for the fund; (iii) the costs of the services and profitability, including the revenues earned and the expenses incurred in conducting the business of developing, marketing, distributing, managing, administering, and servicing the fund and its shareholders, to the extent applicable, as well as potential fall-out benefits from Fidelity's non-fund businesses; and (iv) whether there have been economies of scale in respect of the Fidelity funds, whether the Fidelity funds (including the fund) have appropriately benefited from any such economies of scale, and whether there is the potential for realization of any further economies.
Based on its evaluation of all of the conclusions noted above, and after considering all factors it believed relevant, the Board ultimately concluded that the fund's management fee structure is fair and reasonable, and that the continuation of the fund's Advisory Contracts should be approved.
![]()
AFR-ANN-1218
1.750077.118
Fidelity® Floating Rate High Income Fund Annual Report October 31, 2018 Fidelity® Floating Rate High Income Fund is a class of Fidelity Advisor® Floating Rate High Income Fund |
|
Contents
To view a fund's proxy voting guidelines and proxy voting record for the 12-month period ended June 30, visit http://www.fidelity.com/proxyvotingresults or visit the Securities and Exchange Commission's (SEC) web site at http://www.sec.gov.
You may also call 1-800-544-8544 to request a free copy of the proxy voting guidelines.
Standard & Poor's, S&P and S&P 500 are registered service marks of The McGraw-Hill Companies, Inc. and have been licensed for use by Fidelity Distributors Corporation.
Other third-party marks appearing herein are the property of their respective owners.
All other marks appearing herein are registered or unregistered trademarks or service marks of FMR LLC or an affiliated company. © 2018 FMR LLC. All rights reserved.
This report and the financial statements contained herein are submitted for the general information of the shareholders of the Fund. This report is not authorized for distribution to prospective investors in the Fund unless preceded or accompanied by an effective prospectus.
A fund files its complete schedule of portfolio holdings with the SEC for the first and third quarters of each fiscal year on Form N-Q. Forms N-Q are available on the SEC’s web site at http://www.sec.gov. A fund's Forms N-Q may be reviewed and copied at the SEC’s Public Reference Room in Washington, DC. Information regarding the operation of the SEC's Public Reference Room may be obtained by calling 1-800-SEC-0330.
For a complete list of a fund's portfolio holdings, view the most recent holdings listing, semiannual report, or annual report on Fidelity's web site at http://www.fidelity.com, http://www.institutional.fidelity.com, or http://www.401k.com, as applicable.
NOT FDIC INSURED •MAY LOSE VALUE •NO BANK GUARANTEE
Neither the Fund nor Fidelity Distributors Corporation is a bank.
Performance: The Bottom Line
Average annual total return reflects the change in the value of an investment, assuming reinvestment of distributions from dividend income and capital gains (the profits earned upon the sale of securities that have grown in value, if any) and assuming a constant rate of performance each year. The hypothetical investment and the average annual total returns do not reflect the deduction of taxes that a shareholder would pay on fund distributions or the redemption of fund shares. During periods of reimbursement by Fidelity, a fund’s total return will be greater than it would be had the reimbursement not occurred. How a fund did yesterday is no guarantee of how it will do tomorrow.
Average Annual Total Returns
| For the periods ended October 31, 2018 | Past 1 year | Past 5 years | Past 10 years |
| Fidelity® Floating Rate High Income Fund | 4.01% | 3.37% | 5.83% |
$10,000 Over 10 Years
Let's say hypothetically that $10,000 was invested in Fidelity® Floating Rate High Income Fund, a class of the fund, on October 31, 2008.
The chart shows how the value of your investment would have changed, and also shows how the S&P®/LSTA Leveraged Performing Loan Index performed over the same period.
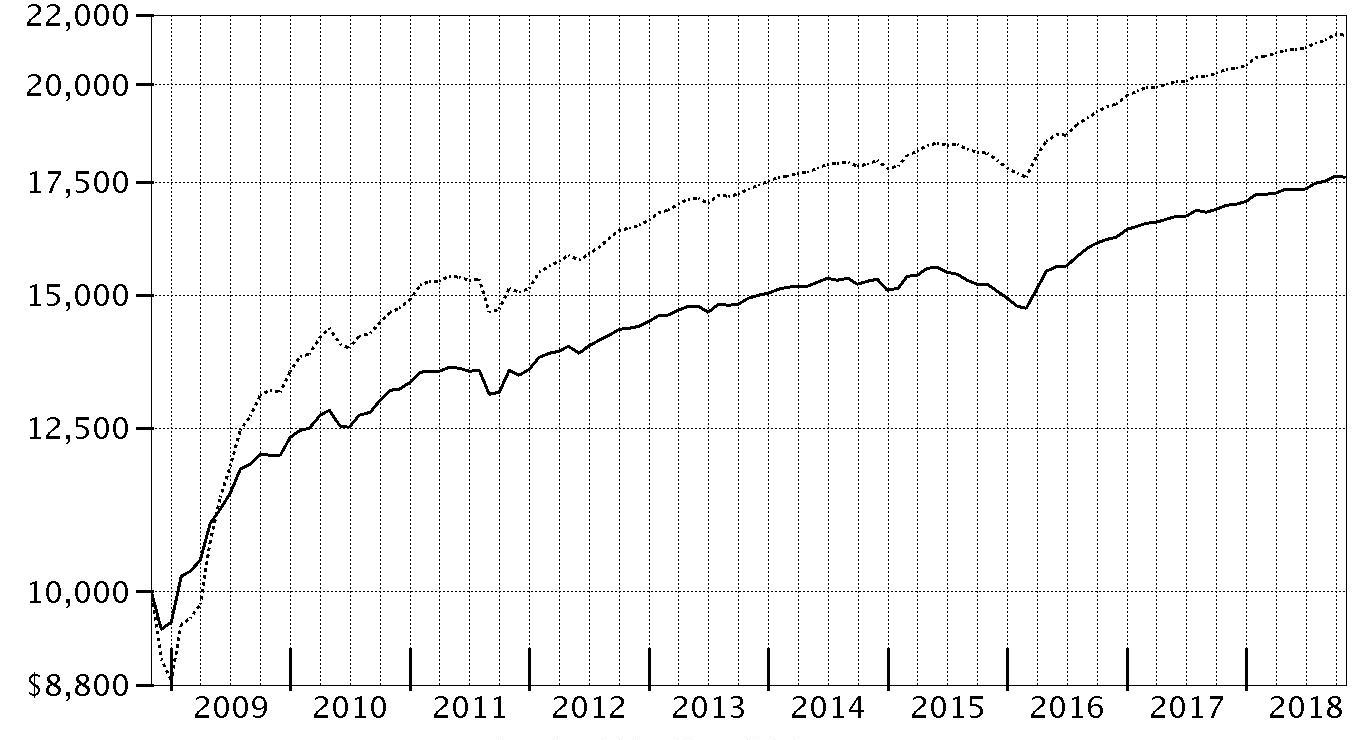
| Period Ending Values | ||
| $17,631 | Fidelity® Floating Rate High Income Fund | |
| $21,413 | S&P®/LSTA Leveraged Performing Loan Index | |
Management's Discussion of Fund Performance
Market Recap: Floating-rate bank loans posted a solid 4.78% gain for the 12 months ending October 31, 2018, as measured by the S&P/LSTA® Leveraged Performing Loan Index. This result handily outpaced both high-yield bonds and the broad investment-grade fixed-income market. Loans generated positive results in the early months of the period, led by a gain of 1.01% in January, as investors refocused their attention on interest rate risk amid rising U.S. Treasury yields. The asset class was relatively immune to the volatility that hampered stocks and credit in February and March, posting a modestly positive return in each month. Loan prices rose during the first half of April, then gave back some of that advance, as rising interest rates began to weigh on investors’ risk appetite. Following modest returns in May and June amid concerns about global trade, loans rode strong corporate earnings and robust U.S. economic growth to solid gains from July through September. Loans registered a nominal decline in October, as investor sentiment became risk-averse. Every industry in the index generated positive performance, with retailers (+8%), radio & television (+8%), and oil & gas (+7%) leading the way. On the downside, among larger index members, containers & glass products, cable & satellite TV, and lodging & casinos each returned about 4%, but lagged the broader market. From a credit-quality perspective, lower-quality loans did best, reflecting investor confidence amid a solid fundamental backdrop.Comments from Portfolio Manager Eric Mollenhauer: For the fiscal year, the fund's share classes (excluding sales charges, if applicable) gained about 3% to 4%, trailing the benchmark S&P/LSTA® Leveraged Performing Loan Index. The fund’s conservative credit-quality positioning – reflecting my moderate-risk, core strategy – along with a disappointing result from one underlying holding, were the primary factors dampening the fund's performance versus the benchmark. That said, I was pleased with the fund’s result during a period when lower-quality credits led the market. The biggest individual relative detractors were generic-drug maker Lannett and radio station operator Clear Channel Communications (now called iHeartMedia). In August, Lannett announced it will lose a key supply contract, while Clear Channel was hurt when the firm filed for bankruptcy protection in mid-March. On the plus side, the top individual relative contributors were an out-of-benchmark equity position in Warrior Met Coal, which returned about 112% for the period, and not owning underperforming loans issued by Catalina Marketing Group, a benchmark member that produces grocery store coupons and other retail promotional material. This period, I found investment opportunities in the new-issue market that I believe provide the fund with a predictable income stream for six months or more.The views expressed above reflect those of the portfolio manager(s) only through the end of the period as stated on the cover of this report and do not necessarily represent the views of Fidelity or any other person in the Fidelity organization. Any such views are subject to change at any time based upon market or other conditions and Fidelity disclaims any responsibility to update such views. These views may not be relied on as investment advice and, because investment decisions for a Fidelity fund are based on numerous factors, may not be relied on as an indication of trading intent on behalf of any Fidelity fund.
Note to shareholders: On November 1, 2018, Kevin Nielsen assumed co-management responsibilities for the fund.Investment Summary (Unaudited)
Top Five Holdings as of October 31, 2018
| (by issuer, excluding cash equivalents) | % of fund's net assets |
| Bass Pro Shops LLC. | 2.4 |
| Caesars Resort Collection LLC | 2.1 |
| Intelsat Jackson Holdings SA | 1.9 |
| Albertson's LLC | 1.7 |
| Frontier Communications Corp. | 1.7 |
| 9.8 |
Top Five Market Sectors as of October 31, 2018
| % of fund's net assets | |
| Technology | 14.3 |
| Gaming | 8.1 |
| Telecommunications | 8.0 |
| Services | 6.7 |
| Energy | 5.9 |
Quality Diversification (% of fund's net assets)
| As of October 31, 2018 * | ||
| BBB | 4.5% | |
| BB | 33.5% | |
| B | 50.0% | |
| CCC,CC,C | 5.3% | |
| Not Rated | 1.3% | |
| Equities | 0.8% | |
| Short-Term Investments and Net Other Assets | 4.6% | |
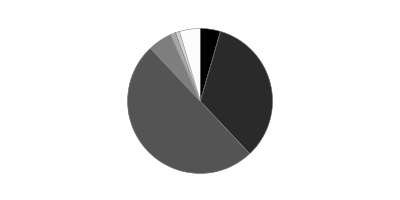
We have used ratings from Moody's Investors Service, Inc. Where Moody's® ratings are not available, we have used S&P® ratings. All ratings are as of the date indicated and do not reflect subsequent changes.
Asset Allocation (% of fund's net assets)
| As of October 31, 2018* | ||
| Bank Loan Obligations | 90.3% | |
| Nonconvertible Bonds | 4.3% | |
| Common Stocks | 0.8% | |
| Short-Term Investments and Net Other Assets (Liabilities) | 4.6% | |

* Foreign investments - 11.2%
Schedule of Investments October 31, 2018
Showing Percentage of Net Assets
| Bank Loan Obligations - 90.3%(a) | |||
| Principal Amount (000s) | Value (000s) | ||
| Aerospace - 1.5% | |||
| DAE Aviation Holdings, Inc. Tranche B, term loan 3 month U.S. LIBOR + 3.750% 6.05% 7/7/22 (b)(c) | $16,157 | $16,199 | |
| TransDigm, Inc.: | |||
| Tranche E, term loan 3 month U.S. LIBOR + 2.500% 4.802% 5/30/25 (b)(c) | 28,111 | 27,943 | |
| Tranche F, term loan 3 month U.S. LIBOR + 2.500% 4.802% 6/9/23 (b)(c) | 29,329 | 29,172 | |
| Tranche G, term loan 3 month U.S. LIBOR + 2.500% 4.802% 8/22/24 (b)(c) | 63,202 | 62,872 | |
| Wesco Aircraft Hardware Corp. Tranche B, term loan 3 month U.S. LIBOR + 2.500% 4.81% 2/28/21 (b)(c) | 21,577 | 21,415 | |
| WP CPP Holdings LLC: | |||
| Tranche B 1LN, term loan 3 month U.S. LIBOR + 3.750% 6.2794% 4/30/25 (b)(c) | 22,500 | 22,566 | |
| Tranche B 2LN, term loan 3 month U.S. LIBOR + 7.750% 10.28% 4/30/26 (b)(c) | 5,665 | 5,640 | |
| TOTAL AEROSPACE | 185,807 | ||
| Air Transportation - 0.3% | |||
| Transplace Holding, Inc. Tranche B 1LN, term loan 3 month U.S. LIBOR + 3.750% 6.0395% 10/5/24 (b)(c) | 11,431 | 11,450 | |
| XPO Logistics, Inc. Tranche B, term loan 3 month U.S. LIBOR + 2.000% 4.5093% 2/23/25 (b)(c) | 20,990 | 21,016 | |
| TOTAL AIR TRANSPORTATION | 32,466 | ||
| Automotive & Auto Parts - 0.9% | |||
| Caliber Holdings Corp.: | |||
| Tranche 1LN, term loan 3 month U.S. LIBOR + 3.000% 5.302% 2/1/24 (b)(c) | 9,743 | 9,737 | |
| Tranche 2LN, term loan 3 month U.S. LIBOR + 7.250% 9.552% 2/1/25 (b)(c) | 2,710 | 2,724 | |
| Chrysler Group LLC term loan 3 month U.S. LIBOR + 2.000% 4.3% 12/31/18 (b)(c) | 7,147 | 7,151 | |
| Hertz Corp. Tranche B 1LN, term loan 3 month U.S. LIBOR + 2.750% 5.06% 6/30/23 (b)(c) | 33,506 | 33,285 | |
| North American Lifting Holdings, Inc.: | |||
| Tranche 1LN, term loan 3 month U.S. LIBOR + 4.500% 6.8861% 11/27/20 (b)(c) | 16,199 | 15,389 | |
| Tranche 2LN, term loan 3 month U.S. LIBOR + 9.000% 11.3861% 11/27/21 (b)(c) | 24,370 | 21,007 | |
| The Gates Corp. Tranche B 1LN, term loan 3 month U.S. LIBOR + 2.750% 5.052% 3/31/24 (b)(c) | 13,136 | 13,142 | |
| UOS LLC Tranche B 1LN, term loan 3 month U.S. LIBOR + 5.500% 7.8002% 4/18/23 (b)(c) | 14,941 | 15,165 | |
| TOTAL AUTOMOTIVE & AUTO PARTS | 117,600 | ||
| Banks & Thrifts - 0.0% | |||
| Lions Gate Capital Holdings Ll Tranche B, term loan 3 month U.S. LIBOR + 2.250% 4.552% 3/24/25 (b)(c) | 4,987 | 4,966 | |
| Broadcasting - 1.5% | |||
| AppLovin Corp. Tranche B, term loan 3 month U.S. LIBOR + 3.750% 6.0638% 8/15/25 (b)(c) | 36,000 | 36,360 | |
| CBS Radio, Inc. Tranche B 1LN, term loan 3 month U.S. LIBOR + 2.750% 5.0365% 11/18/24 (b)(c) | 48,146 | 47,881 | |
| Clear Channel Communications, Inc. Tranche D, term loan 3 month U.S. LIBOR + 6.750% 0% 1/30/19 (c)(d) | 53,680 | 38,665 | |
| ION Media Networks, Inc. Tranche B, term loan 3 month U.S. LIBOR + 2.750% 5.05% 12/18/20 (b)(c) | 19,147 | 19,159 | |
| NEP/NCP Holdco, Inc.: | |||
| Tranche B 1LN, term loan 3 month U.S. LIBOR + 3.250% 5.4743% 10/19/25 (b)(c) | 7,400 | 7,426 | |
| Tranche B 2LN, term loan 3 month U.S. LIBOR + 7.000% 9.302% 10/19/26 (b)(c) | 7,500 | 7,500 | |
| Raycom Media, Inc. Tranche B, term loan 3 month U.S. LIBOR + 2.250% 4.552% 8/23/24 (b)(c) | 26,973 | 26,973 | |
| TOTAL BROADCASTING | 183,964 | ||
| Building Materials - 0.6% | |||
| GYP Holdings III Corp. Tranche B 1LN, term loan 3 month U.S. LIBOR + 2.750% 5.052% 6/1/25 (b)(c) | 15,149 | 14,909 | |
| Hamilton Holdco LLC Tranche B 1LN, term loan 3 month U.S. LIBOR + 2.000% 4.4% 7/2/25 (b)(c) | 18,454 | 18,477 | |
| HD Supply, Inc. Tranche B 5LN, term loan 3 month U.S. LIBOR + 1.750% 4.0296% 10/17/23 (b)(c) | 8,100 | 8,092 | |
| Jeld-Wen, Inc. Tranche B, term loan 3 month U.S. LIBOR + 2.000% 4.3861% 12/14/24 (b)(c) | 9,057 | 9,017 | |
| Traverse Midstream Partners Ll Tranche B, term loan 3 month U.S. LIBOR + 4.000% 6.6% 9/27/24 (b)(c) | 21,045 | 21,163 | |
| TOTAL BUILDING MATERIALS | 71,658 | ||
| Cable/Satellite TV - 3.2% | |||
| Altice U.S. Finance SA: | |||
| Tranche B, term loan 3 month U.S. LIBOR + 2.250% 4.552% 7/28/25 (b)(c) | 30,043 | 29,975 | |
| Tranche B3 1LN, term loan 3 month U.S. LIBOR + 2.250% 1/11/26 (c)(e) | 30,500 | 30,414 | |
| Cable One, Inc. Tranche B, term loan 3 month U.S. LIBOR + 1.750% 4.14% 5/1/24 (b)(c) | 7,870 | 7,865 | |
| Charter Communication Operating LLC Tranche B, term loan 3 month U.S. LIBOR + 2.000% 4.31% 4/30/25 (b)(c) | 166,601 | 166,581 | |
| CSC Holdings LLC Tranche B, term loan 3 month U.S. LIBOR + 2.500% 4.7795% 1/25/26 (b)(c) | 33,815 | 33,741 | |
| MCC Iowa LLC Tranche M, term loan 3 month U.S. LIBOR + 2.000% 4.22% 1/15/25 (b)(c) | 6,336 | 6,322 | |
| Numericable LLC: | |||
| Tranche B 12LN, term loan 3 month U.S. LIBOR + 3.688% 5.967% 1/31/26 (b)(c) | 3,333 | 3,246 | |
| Tranche B 13LN, term loan 3 month U.S. LIBOR + 4.000% 6.2795% 8/14/26 (b)(c) | 36,750 | 35,946 | |
| Virgin Media Bristol LLC Tranche B, term loan 3 month U.S. LIBOR + 2.500% 4.7795% 1/15/26 (b)(c) | 35,000 | 34,960 | |
| WideOpenWest Finance LLC Tranche B, term loan 3 month U.S. LIBOR + 3.250% 5.5395% 8/19/23 (b)(c) | 62,015 | 59,690 | |
| TOTAL CABLE/SATELLITE TV | 408,740 | ||
| Capital Goods - 0.5% | |||
| AECOM Tranche B, term loan 3 month U.S. LIBOR + 1.750% 4.052% 3/13/25 (b)(c) | 13,880 | 13,880 | |
| Altra Industrial Motion Corp. Tranche B 1LN, term loan 3 month U.S. LIBOR + 2.000% 4.302% 10/1/25 (b)(c) | 22,375 | 22,347 | |
| Apergy Corp. Tranche B, term loan 3 month U.S. LIBOR + 2.500% 4.8125% 5/9/25 (b)(c) | 8,785 | 8,802 | |
| CPM Holdings, Inc.: | |||
| 2LN, term loan 1 month U.S. LIBOR + 8.250% 10/24/26 (c)(e) | 3,655 | 3,652 | |
| Tranche B 1LN, term loan 3 month U.S. LIBOR + 3.750% 10/24/25 (c)(e) | 12,105 | 12,145 | |
| Doosan Bobcat Tranche B, term loan 3 month U.S. LIBOR + 2.000% 4.3775% 5/18/24 (b)(c) | 8,354 | 8,335 | |
| TOTAL CAPITAL GOODS | 69,161 | ||
| Chemicals - 2.5% | |||
| ASP Chromaflo Intermediate Holdings, Inc. Tranche B 1LN, term loan 3 month U.S. LIBOR + 3.500% 5.802% 11/18/23 (b)(c) | 11,761 | 11,731 | |
| Invictus U.S. Newco LLC: | |||
| Tranche 1LN, term loan 3 month U.S. LIBOR + 3.000% 5.302% 3/28/25 (b)(c) | 13,104 | 13,148 | |
| Tranche 2LN, term loan 3 month U.S. LIBOR + 6.750% 9.052% 3/28/26 (b)(c) | 5,500 | 5,459 | |
| MacDermid, Inc.: | |||
| Tranche B 6LN, term loan 3 month U.S. LIBOR + 3.000% 4% 6/7/23 (b)(c) | 23,587 | 23,592 | |
| Tranche B 7LN, term loan 3 month U.S. LIBOR + 2.500% 4.802% 6/7/20 (b)(c) | 12,057 | 12,057 | |
| Messer Industrie GmbH Tranche B 1LN, term loan 3 month U.S. LIBOR + 2.500% 9/28/25 (c)(e) | 41,500 | 41,490 | |
| Oxea Corp. Tranche B2, term loan 3 month U.S. LIBOR + 3.500% 5.9375% 10/11/24 (b)(c) | 27,807 | 27,877 | |
| PQ Corp. Tranche B, term loan 3 month U.S. LIBOR + 2.500% 5.0266% 2/8/25 (b)(c) | 6,995 | 6,982 | |
| Starfruit U.S. Holdco LLC Tranche B, term loan 3 month U.S. LIBOR + 3.250% 5.506% 10/1/25 (b)(c) | 74,230 | 73,952 | |
| The Chemours Co. LLC Tranche B 1LN, term loan 3 month U.S. LIBOR + 1.750% 4.05% 4/3/25 (b)(c) | 17,699 | 17,622 | |
| Trinseo Materials Operating SCA/Trinseo Materials Finance, Inc. term loan 3 month U.S. LIBOR + 2.000% 4.302% 9/6/24 (b)(c) | 15,098 | 14,972 | |
| Tronox Blocked Borrower LLC Tranche B, term loan 3 month U.S. LIBOR + 3.000% 5.302% 9/22/24 (b)(c) | 12,152 | 12,135 | |
| Tronox Finance LLC Tranche B, term loan 3 month U.S. LIBOR + 3.000% 5.302% 9/22/24 (b)(c) | 28,044 | 28,004 | |
| Univar, Inc. Tranche B, term loan 3 month U.S. LIBOR + 2.250% 4.552% 7/1/24 (b)(c) | 12,250 | 12,240 | |
| W. R. Grace & Co.-Conn.: | |||
| Tranche B 1LN, term loan 3 month U.S. LIBOR + 1.750% 4.1361% 4/3/25 (b)(c) | 5,565 | 5,566 | |
| Tranche B 2LN, term loan 3 month U.S. LIBOR + 1.750% 4.1361% 4/3/25 (b)(c) | 9,540 | 9,542 | |
| TOTAL CHEMICALS | 316,369 | ||
| Consumer Products - 1.0% | |||
| Coty, Inc. Tranche B 1LN, term loan 3 month U.S. LIBOR + 2.250% 4.5306% 4/5/25 (b)(c) | 14,930 | 14,606 | |
| CSM Bakery Supplies Tranche B 1LN, term loan 3 month U.S. LIBOR + 4.000% 6.41% 7/3/20 (b)(c) | 9,781 | 9,398 | |
| Owens & Minor Distribution, Inc. Tranche B, term loan 3 month U.S. LIBOR + 4.500% 6.756% 4/30/25 (b)(c) | 27,431 | 24,825 | |
| Prestige Brands, Inc. term loan 3 month U.S. LIBOR + 2.000% 4.302% 1/26/24 (b)(c) | 9,622 | 9,630 | |
| Rodan & Fields LLC Tranche B, term loan 3 month U.S. LIBOR + 4.000% 6.2795% 6/15/25 (b)(c) | 9,471 | 9,519 | |
| Weight Watchers International, Inc. Tranche B, term loan 3 month U.S. LIBOR + 4.750% 7.15% 11/29/24 (b)(c) | 56,306 | 56,553 | |
| TOTAL CONSUMER PRODUCTS | 124,531 | ||
| Containers - 1.4% | |||
| Berry Global, Inc.: | |||
| Tranche Q, term loan 3 month U.S. LIBOR + 2.000% 4.2767% 10/1/22 (b)(c) | 18,400 | 18,386 | |
| Tranche R, term loan 3 month U.S. LIBOR + 2.000% 4.2767% 1/19/24 (b)(c) | 9,850 | 9,832 | |
| Tranche S, term loan 3 month U.S. LIBOR + 1.750% 4.0267% 2/8/20 (b)(c) | 39,041 | 38,964 | |
| Tranche T, term loan 3 month U.S. LIBOR + 1.750% 4.0267% 1/6/21 (b)(c) | 8,592 | 8,569 | |
| BWAY Holding Co. Tranche B, term loan 3 month U.S. LIBOR + 3.250% 5.6581% 4/3/24 (b)(c) | 8,147 | 8,094 | |
| Charter Nex U.S., Inc. Tranche B 1LN, term loan 3 month U.S. LIBOR + 3.000% 5.052% 5/16/24 (b)(c) | 9,564 | 9,542 | |
| Consolidated Container Co. Tranche B 1LN, term loan 3 month U.S. LIBOR + 2.750% 5.052% 5/22/24 (b)(c) | 17,726 | 17,726 | |
| Crown Americas LLC Tranche B 1LN, term loan 3 month U.S. LIBOR + 2.000% 4.2832% 4/3/25 (b)(c) | 16,848 | 16,857 | |
| Hostess Brands LLC Tranche B, term loan 3 month U.S. LIBOR + 2.250% 4.6852% 8/3/22 (b)(c) | 11,849 | 11,779 | |
| Plastipak Packaging, Inc. Tranche B, term loan 3 month U.S. LIBOR + 2.500% 4.81% 10/14/24 (b)(c) | 6,296 | 6,277 | |
| Reynolds Group Holdings, Inc. Tranche B, term loan 3 month U.S. LIBOR + 2.750% 5.052% 2/5/23 (b)(c) | 32,559 | 32,559 | |
| TOTAL CONTAINERS | 178,585 | ||
| Diversified Financial Services - 4.1% | |||
| AlixPartners LLP Tranche B, term loan 3 month U.S. LIBOR + 2.750% 5.052% 4/4/24 (b)(c) | 28,334 | 28,334 | |
| Avolon TLB Borrower 1 (U.S.) LLC Tranche B3 1LN, term loan 3 month U.S. LIBOR + 2.000% 4.2796% 1/15/25 (b)(c) | 15,606 | 15,556 | |
| Bcp Renaissance Parent LLC Tranche B, term loan 3 month U.S. LIBOR + 3.500% 6.0266% 10/31/24 (b)(c) | 26,454 | 26,520 | |
| Cypress Intermediate Holdings, Inc. Tranche B 1LN, term loan 3 month U.S. LIBOR + 3.000% 5.31% 4/27/24 (b)(c) | 25,359 | 25,364 | |
| Deerfield Holdings Corp. Tranche B, term loan 3 month U.S. LIBOR + 3.250% 5.552% 2/13/25 (b)(c) | 17,572 | 17,535 | |
| Delos Finance SARL Tranche B, term loan 3 month U.S. LIBOR + 1.750% 4.1361% 10/6/23 (b)(c) | 33,095 | 33,122 | |
| Financial & Risk U.S. Holdings, Inc. Tranche B, term loan 3 month U.S. LIBOR + 3.750% 6.052% 10/1/25 (b)(c) | 75,500 | 74,682 | |
| Finco I LLC Tranche B, term loan 3 month U.S. LIBOR + 2.000% 4.302% 12/27/22 (b)(c) | 19,400 | 19,375 | |
| Fly Funding II SARL Tranche B, term loan 3 month U.S. LIBOR + 2.000% 4.34% 2/9/23 (b)(c) | 35,402 | 35,313 | |
| Flying Fortress Holdings, Inc. Tranche B, term loan 3 month U.S. LIBOR + 1.750% 4.1361% 10/30/22 (b)(c) | 67,865 | 68,006 | |
| Focus Financial Partners LLC Tranche B 1LN, term loan 3 month U.S. LIBOR + 2.500% 4.802% 7/3/24 (b)(c) | 10,820 | 10,827 | |
| Franklin Square Holdings LP Tranche B, term loan 3 month U.S. LIBOR + 2.500% 4.8125% 8/3/25 (b)(c) | 11,500 | 11,529 | |
| Greensky Holdings LLC Tranche B, term loan 3 month U.S. LIBOR + 3.250% 5.5625% 3/29/25 (b)(c) | 8,458 | 8,479 | |
| HarbourVest Partners LLC Tranche B 1LN, term loan 3 month U.S. LIBOR + 2.250% 4.5295% 3/1/25 (b)(c) | 23,817 | 23,787 | |
| Kingpin Intermediate Holdings LLC Tranche B 1LN, term loan 3 month U.S. LIBOR + 3.500% 5.81% 7/3/24 (b)(c) | 7,425 | 7,456 | |
| NAB Holdings LLC Tranche B, term loan 3 month U.S. LIBOR + 3.000% 5.3861% 6/30/24 (b)(c) | 13,643 | 13,461 | |
| Recess Holdings, Inc. Tranche B, term loan 3 month U.S. LIBOR + 3.750% 6.0946% 9/29/24 (b)(c) | 9,488 | 9,464 | |
| SAI Global GP Tranche B, term loan 3 month U.S. LIBOR + 4.500% 6.7949% 12/8/23 (b)(c) | 13,509 | 12,564 | |
| TransUnion LLC: | |||
| Tranche B 4LN, term loan 3 month U.S. LIBOR + 2.000% 4.302% 6/19/25 (b)(c) | 16,708 | 16,663 | |
| Tranche B, term loan 3 month U.S. LIBOR + 2.000% 4.302% 4/9/23 (b)(c) | 36,702 | 36,614 | |
| UFC Holdings LLC Tranche B 1LN, term loan 3 month U.S. LIBOR + 3.250% 5.56% 8/18/23 (b)(c) | 18,988 | 19,085 | |
| TOTAL DIVERSIFIED FINANCIAL SERVICES | 513,736 | ||
| Diversified Media - 0.1% | |||
| Lamar Media Corp. Tranche B, term loan 3 month U.S. LIBOR + 1.750% 4.0625% 3/16/25 (b)(c) | 15,801 | 15,820 | |
| Energy - 4.7% | |||
| Arctic LNG Carriers Ltd. Tranche B 1LN, term loan 3 month U.S. LIBOR + 4.500% 6.802% 5/18/23 (b)(c) | 31,884 | 31,884 | |
| BCP Raptor II LLC Tranche B, term loan 3 month U.S. LIBOR + 4.750% 10/22/25 (c)(e) | 30,000 | 29,775 | |
| BCP Raptor LLC Tranche B, term loan 3 month U.S. LIBOR + 4.250% 6.6411% 6/22/24 (b)(c) | 44,050 | 43,413 | |
| Brazos Delaware II LLC Tranche B, term loan 3 month U.S. LIBOR + 4.000% 6.282% 5/21/25 (b)(c) | 14,394 | 14,279 | |
| California Resources Corp.: | |||
| Tranche 1LN, term loan 3 month U.S. LIBOR + 10.375% 12.6699% 12/31/21 (b)(c) | 80,300 | 89,334 | |
| Tranche B, term loan 3 month U.S. LIBOR + 4.750% 7.0365% 12/31/22 (b)(c) | 49,400 | 50,059 | |
| Calpine Construction Finance Co. LP Tranche B, term loan 3 month U.S. LIBOR + 2.500% 4.802% 1/15/25 (b)(c) | 9,925 | 9,906 | |
| Citgo Petroleum Corp. Tranche B, term loan 3 month U.S. LIBOR + 3.500% 5.896% 7/29/21 (b)(c) | 30,244 | 30,194 | |
| Consolidated Energy Finance SA Tranche B, term loan 3 month U.S. LIBOR + 2.500% 4.7841% 5/7/25 (b)(c) | 57,356 | 57,069 | |
| Delek U.S. Holdings, Inc. Tranche B 1LN, term loan 3 month U.S. LIBOR + 2.500% 4.5441% 3/13/25 (b)(c) | 9,448 | 9,440 | |
| EG America LLC Tranche B 1LN, term loan 3 month U.S. LIBOR + 4.000% 2/6/25 (c)(e) | 3,820 | 3,819 | |
| Empire Generating Co. LLC: | |||
| Tranche B, term loan 3 month U.S. LIBOR + 4.250% 6.64% 3/14/21 (b)(c) | 8,549 | 6,391 | |
| Tranche C, term loan 3 month U.S. LIBOR + 4.250% 6.64% 3/14/21 (b)(c) | 845 | 632 | |
| Energy Transfer Equity LP Tranche B, term loan 3 month U.S. LIBOR + 2.000% 4.302% 2/2/24 (b)(c) | 15,542 | 15,531 | |
| Foresight Energy LLC Tranche B 1LN, term loan 3 month U.S. LIBOR + 5.750% 8.2766% 3/28/22 (b)(c) | 14,068 | 14,095 | |
| FTS International, Inc. Tranche B, term loan 3 month U.S. LIBOR + 4.750% 7.052% 4/16/21 (b)(c) | 7,740 | 7,727 | |
| Gavilan Resources LLC Tranche 2LN, term loan 3 month U.S. LIBOR + 6.000% 8.2796% 3/1/24 (b)(c) | 43,425 | 40,446 | |
| GIM Channelview Cogeneration LLC Tranche B, term loan 3 month U.S. LIBOR + 4.250% 6.56% 5/3/25 (b)(c) | 1,875 | 1,887 | |
| GIP III Stetson I LP Tranche B, term loan 3 month U.S. LIBOR + 4.250% 6.6946% 7/18/25 (b)(c) | 66,560 | 66,643 | |
| Gulf Finance LLC Tranche B 1LN, term loan 3 month U.S. LIBOR + 5.250% 7.64% 8/25/23 (b)(c) | 29,085 | 23,765 | |
| Medallion Midland Acquisition Tranche B, term loan 3 month U.S. LIBOR + 3.250% 5.552% 10/30/24 (b)(c) | 18,543 | 18,404 | |
| Natgasoline LLC Tranche B, term loan 3 month U.S. LIBOR + 3.500% 5.9446% 10/31/25 (b)(c) | 23,770 | 23,800 | |
| TerraForm Power Operating LLC Tranche B, term loan 3 month U.S. LIBOR + 2.000% 4.302% 11/8/22 (b)(c) | 6,198 | 6,198 | |
| TOTAL ENERGY | 594,691 | ||
| Entertainment/Film - 0.4% | |||
| AMC Entertainment Holdings, Inc. Tranche B, term loan 3 month U.S. LIBOR + 2.250% 4.5295% 12/15/23 (b)(c) | 7,555 | 7,542 | |
| AMC Entertainment, Inc. Tranche B, term loan 3 month U.S. LIBOR + 2.250% 4.5295% 12/15/22 (b)(c) | 4,899 | 4,891 | |
| CDS U.S. Intermediate Holdings, Inc.: | |||
| Tranche B 1LN, term loan 3 month U.S. LIBOR + 3.750% 6.1361% 7/8/22 (b)(c) | 19,262 | 19,002 | |
| Tranche B 2LN, term loan 3 month U.S. LIBOR + 8.250% 10.6361% 7/8/23 (b)(c) | 5,305 | 5,093 | |
| Digital Cinema Implementation Partners,LLC Tranche B, term loan 3 month U.S. LIBOR + 2.500% 4.8173% 5/17/21 (b)(c) | 3,910 | 3,918 | |
| SMG U.S. Midco 2, Inc. Tranche B 1LN, term loan 3 month U.S. LIBOR + 3.000% 5.302% 1/23/25 (b)(c) | 10,124 | 10,105 | |
| TOTAL ENTERTAINMENT/FILM | 50,551 | ||
| Environmental - 0.4% | |||
| Hd Supply Waterworks Ltd. Tranche B, term loan 3 month U.S. LIBOR + 3.000% 5.3167% 8/1/24 (b)(c) | 6,074 | 6,066 | |
| The Brickman Group, Ltd. Tranche B, term loan 3 month U.S. LIBOR + 2.500% 4.8125% 8/15/25 (b)(c) | 13,965 | 13,961 | |
| Tunnel Hill Partners LP Tranche B 1LN, term loan 3 month U.S. LIBOR + 3.500% 10/1/25 (c)(e) | 5,750 | 5,710 | |
| Wrangler Buyer Corp. Tranche B, term loan 3 month U.S. LIBOR + 2.750% 5.0059% 9/28/24 (b)(c) | 13,410 | 13,412 | |
| WTG Holdings III Corp. Tranche B 1LN, term loan 3 month U.S. LIBOR + 3.000% 5.302% 12/20/24 (b)(c) | 15,567 | 15,518 | |
| TOTAL ENVIRONMENTAL | 54,667 | ||
| Food & Drug Retail - 4.1% | |||
| Agro Merchants Intermediate Ho Tranche B, term loan 3 month U.S. LIBOR + 3.750% 6.1361% 12/6/24 (b)(c) | 4,964 | 4,979 | |
| Albertson's LLC: | |||
| Tranche B 7LN, term loan 3 month U.S. LIBOR + 3.000% 5.4874% 10/29/25 (b)(c) | 38,750 | 38,419 | |
| Tranche B, term loan 3 month U.S. LIBOR + 2.750% 5.052% 8/25/21 (b)(c) | 172,681 | 172,347 | |
| BI-LO LLC Tranche B, term loan 3 month U.S. LIBOR + 8.000% 10.3645% 5/31/24 (b)(c) | 62,094 | 61,241 | |
| GOBP Holdings, Inc.: | |||
| 2LN, term loan 3 month U.S. LIBOR + 7.250% 9.5296% 10/22/26 (b)(c) | 2,000 | 1,990 | |
| Tranche B 1LN, term loan 3 month U.S. LIBOR + 3.750% 6.0296% 10/22/25 (b)(c) | 14,250 | 14,214 | |
| JBS USA Lux SA Tranche B, term loan 3 month U.S. LIBOR + 2.500% 4.8444% 10/30/22 (b)(c) | 83,156 | 83,114 | |
| JP Intermediate B LLC Tranche B, term loan 3 month U.S. LIBOR + 5.500% 10/18/25 (c)(e) | 10,320 | 10,320 | |
| Lannett Co., Inc.: | |||
| Tranche B, term loan 3 month U.S. LIBOR + 4.750% 7.052% 11/25/20 (b)(c) | 1,726 | 1,601 | |
| Tranche B, term loan 3 month U.S. LIBOR + 5.375% 7.677% 11/25/22 (b)(c) | 74,229 | 59,680 | |
| RPI Finance Trust Tranche B 6LN, term loan 3 month U.S. LIBOR + 2.000% 4.3861% 3/27/23 (b)(c) | 46,807 | 46,815 | |
| Smart & Final, Inc. Tranche B, term loan 3 month U.S. LIBOR + 3.500% 5.802% 11/15/22 (b)(c) | 31,345 | 30,238 | |
| TOTAL FOOD & DRUG RETAIL | 524,958 | ||
| Food/Beverage/Tobacco - 1.1% | |||
| 8th Avenue Food & Provisions, Inc.: | |||
| 2LN, term loan 3 month U.S. LIBOR + 7.750% 10.006% 10/1/26 (b)(c) | 2,240 | 2,254 | |
| Tranche B 1LN, term loan 3 month U.S. LIBOR + 3.750% 6.006% 10/1/25 (b)(c) | 6,545 | 6,594 | |
| Arterra Wines Canada, Inc. Tranche B, term loan 3 month U.S. LIBOR + 2.750% 5.0875% 12/16/23 (b)(c) | 4,676 | 4,679 | |
| Chobani LLC Tranche B, term loan 3 month U.S. LIBOR + 3.500% 5.802% 10/7/23 (b)(c) | 37,548 | 36,633 | |
| Eg Finco Ltd. Tranche B, term loan 3 month U.S. LIBOR + 4.000% 6.3861% 2/6/25 (b)(c) | 7,512 | 7,510 | |
| Post Holdings, Inc. Tranche B, term loan 3 month U.S. LIBOR + 2.000% 4.29% 5/24/24 (b)(c) | 32,068 | 32,016 | |
| Shearer's Foods, Inc.: | |||
| Tranche 2LN, term loan 3 month U.S. LIBOR + 6.750% 9.052% 6/30/22 (b)(c) | 2,000 | 1,925 | |
| Tranche B 1LN, term loan 3 month U.S. LIBOR + 4.250% 6.552% 6/30/21 (b)(c) | 8,948 | 8,926 | |
| U.S. Foods, Inc. Tranche B, term loan 3 month U.S. LIBOR + 2.000% 4.302% 6/27/23 (b)(c) | 34,616 | 34,543 | |
| TOTAL FOOD/BEVERAGE/TOBACCO | 135,080 | ||
| Gaming - 7.9% | |||
| AP Gaming I LLC Tranche B, term loan 3 month U.S. LIBOR + 3.500% 5.802% 2/15/24 (b)(c) | 12,073 | 12,114 | |
| Aristocrat Technologies, Inc. Tranche B 3LN, term loan 3 month U.S. LIBOR + 1.750% 4.219% 10/19/24 (b)(c) | 30,358 | 30,234 | |
| Boyd Gaming Corp. Tranche B 1LN, term loan 3 month U.S. LIBOR + 2.250% 4.4669% 9/15/23 (b)(c) | 21,914 | 21,922 | |
| Caesars Resort Collection LLC Tranche B 1LN, term loan 3 month U.S. LIBOR + 2.750% 5.052% 12/22/24 (b)(c) | 267,975 | 267,937 | |
| Churchill Downs, Inc. Tranche B, term loan 3 month U.S. LIBOR + 2.000% 4.31% 12/27/24 (b)(c) | 7,756 | 7,766 | |
| CityCenter Holdings LLC Tranche B, term loan 3 month U.S. LIBOR + 2.250% 4.552% 4/18/24 (b)(c) | 30,446 | 30,360 | |
| Eldorado Resorts, Inc. Tranche B, term loan 3 month U.S. LIBOR + 2.250% 4.5625% 4/17/24 (b)(c) | 24,493 | 24,485 | |
| Gaming VC Holdings SA Tranche B2 1LN, term loan 3 month U.S. LIBOR + 2.500% 4.802% 3/15/24 (b)(c) | 22,666 | 22,711 | |
| Golden Entertainment, Inc. Tranche B, term loan: | |||
| 3 month U.S. LIBOR + 3.000% 5.3% 10/20/24 (b)(c) | 46,648 | 46,648 | |
| 3 month U.S. LIBOR + 7.000% 9.31% 10/20/25 (b)(c) | 7,500 | 7,538 | |
| Golden Nugget, Inc. Tranche B 1LN, term loan 3 month U.S. LIBOR + 2.750% 5.2299% 10/4/23 (b)(c) | 118,028 | 118,083 | |
| Las Vegas Sands LLC Tranche B, term loan 3 month U.S. LIBOR + 1.750% 4.052% 3/27/25 (b)(c) | 56,411 | 56,174 | |
| MGM Mirage, Inc. Tranche A, term loan 3 month U.S. LIBOR + 2.500% 4.802% 4/25/21 (b)(c) | 13,145 | 13,145 | |
| Mohegan Tribal Gaming Authority Tranche B, term loan 3 month U.S. LIBOR + 4.000% 6.302% 10/14/23 (b)(c) | 10,226 | 9,579 | |
| Penn National Gaming, Inc. Tranche B, term loan 3 month U.S. LIBOR + 2.250% 10/15/25 (c)(e) | 28,080 | 28,150 | |
| Scientific Games Corp. Tranche B 5LN, term loan 3 month U.S. LIBOR + 2.750% 5.0457% 8/14/24 (b)(c) | 132,439 | 131,067 | |
| Stars Group Holdings BV Tranche B, term loan 3 month U.S. LIBOR + 3.500% 5.8861% 7/10/25 (b)(c) | 85,037 | 85,344 | |
| Station Casinos LLC Tranche B, term loan 3 month U.S. LIBOR + 2.500% 4.81% 6/8/23 (b)(c) | 54,460 | 54,387 | |
| Wynn America LLC Tranche A 1LN, term loan 3 month U.S. LIBOR + 1.750% 4.06% 12/31/21 (b)(c) | 19,285 | 19,213 | |
| Wynn Resorts Ltd. Tranche B, term loan 3 month U.S. LIBOR + 2.250% 10/22/24 (c)(e) | 6,250 | 6,215 | |
| Yonkers Racing Corp. Tranche B 1LN, term loan 3 month U.S. LIBOR + 3.250% 5.56% 5/31/24 (b)(c) | 6,180 | 6,184 | |
| TOTAL GAMING | 999,256 | ||
| Healthcare - 4.4% | |||
| Accelerated Health Systems LLC Tranche B, term loan 3 month U.S. LIBOR + 3.250% 10/26/25 (c)(e) | 11,000 | 11,028 | |
| Akorn, Inc. Tranche B, term loan 3 month U.S. LIBOR + 4.750% 7% 4/17/21 (b)(c) | 3,805 | 3,511 | |
| Community Health Systems, Inc. Tranche H, term loan 3 month U.S. LIBOR + 3.250% 5.5626% 1/27/21 (b)(c) | 49,231 | 48,135 | |
| CVS Holdings I LP: | |||
| Tranche 2LN, term loan 3 month U.S. LIBOR + 6.750% 9.06% 2/6/26 (b)(c) | 2,000 | 1,978 | |
| Tranche B 1LN, term loan 3 month U.S. LIBOR + 3.000% 5.31% 2/6/25 (b)(c) | 9,045 | 9,003 | |
| HCA Holdings, Inc.: | |||
| Tranche B 10LN, term loan 3 month U.S. LIBOR + 2.000% 4.302% 3/13/25 (b)(c) | 24,875 | 24,968 | |
| Tranche B 11LN, term loan 3 month U.S. LIBOR + 1.750% 4.052% 3/18/23 (b)(c) | 49,529 | 49,688 | |
| HLF Financing SARL LLC Tranche B 1LN, term loan 3 month U.S. LIBOR + 3.250% 5.552% 8/18/25 (b)(c) | 33,565 | 33,684 | |
| Innoviva, Inc. Tranche B, term loan 3 month U.S. LIBOR + 4.500% 6.8119% 8/18/22 (b)(c) | 1,091 | 1,086 | |
| LifeScan Global Corp. Tranche B 1LN, term loan 3 month U.S. LIBOR + 6.000% 8.396% 10/1/24 (b)(c) | 20,840 | 20,328 | |
| MPH Acquisition Holdings LLC Tranche B, term loan 3 month U.S. LIBOR + 2.750% 5.1361% 6/7/23 (b)(c) | 16,196 | 16,142 | |
| Ortho-Clinical Diagnostics, Inc. Tranche B 1LN, term loan 3 month U.S. LIBOR + 3.250% 5.5441% 6/30/25 (b)(c) | 87,714 | 87,385 | |
| PAREXEL International Corp. Tranche B, term loan 3 month U.S. LIBOR + 2.750% 5.052% 9/27/24 (b)(c) | 32,709 | 32,198 | |
| Press Ganey Holdings, Inc. Tranche 1LN, term loan 3 month U.S. LIBOR + 2.750% 5.052% 10/21/23 (b)(c) | 11,272 | 11,275 | |
| Prospect Medical Holdings, Inc. Tranche 1LN, term loan 3 month U.S. LIBOR + 5.500% 7.8125% 2/22/24 (b)(c) | 15,801 | 15,880 | |
| U.S. Anesthesia Partners, Inc. Tranche B, term loan 3 month U.S. LIBOR + 3.000% 5.302% 6/23/24 (b)(c) | 11,192 | 11,182 | |
| U.S. Renal Care, Inc. Tranche B 1LN, term loan 3 month U.S. LIBOR + 4.250% 6.6361% 12/31/22 (b)(c) | 39,421 | 38,140 | |
| Valeant Pharmaceuticals International, Inc. Tranche B, term loan 3 month U.S. LIBOR + 3.000% 5.2739% 6/1/25 (b)(c) | 90,778 | 90,757 | |
| Vizient, Inc. Tranche B 3LN, term loan 3 month U.S. LIBOR + 2.750% 4.9922% 2/11/23 (b)(c) | 6,649 | 6,672 | |
| VVC Holding Corp. 1LN, term loan 3 month U.S. LIBOR + 4.250% 6.6863% 7/9/25 (b)(c) | 30,750 | 30,443 | |
| Wink Holdco, Inc. Tranche B, term loan 3 month U.S. LIBOR + 3.000% 5.302% 12/1/24 (b)(c) | 10,421 | 10,385 | |
| TOTAL HEALTHCARE | 553,868 | ||
| Homebuilders/Real Estate - 2.1% | |||
| DTZ U.S. Borrower LLC Tranche B, term loan 3 month U.S. LIBOR + 3.250% 5.552% 8/21/25 (b)(c) | 67,250 | 67,187 | |
| Forest City Enterprises LP Tranche B, term loan 3 month U.S. LIBOR + 4.000% 10/26/25 (c)(e) | 15,485 | 15,537 | |
| Lightstone Holdco LLC: | |||
| Tranche B 1LN, term loan 3 month U.S. LIBOR + 3.750% 6.052% 1/30/24 (b)(c) | 16,775 | 16,527 | |
| Tranche C 1LN, term loan 3 month U.S. LIBOR + 3.750% 6.052% 1/30/24 (b)(c) | 901 | 888 | |
| MGM Growth Properties Operating Partner LP Tranche B, term loan 3 month U.S. LIBOR + 2.000% 4.302% 3/23/25 (b)(c) | 39,438 | 39,297 | |
| Pisces Midco, Inc. Tranche B, term loan 3 month U.S. LIBOR + 3.750% 6.1752% 4/12/25 (b)(c) | 18,524 | 18,443 | |
| Realogy Group LLC Tranche B, term loan 3 month U.S. LIBOR + 2.250% 4.5295% 2/8/25 (b)(c) | 42,104 | 41,960 | |
| VICI Properties, LLC Tranche B 1LN, term loan 3 month U.S. LIBOR + 2.000% 4.2796% 12/22/24 (b)(c) | 70,593 | 70,380 | |
| TOTAL HOMEBUILDERS/REAL ESTATE | 270,219 | ||
| Hotels - 1.6% | |||
| ESH Hospitality, Inc. Tranche B, term loan 3 month U.S. LIBOR + 2.000% 4.302% 8/30/23 (b)(c) | 15,884 | 15,854 | |
| Four Seasons Holdings, Inc. Tranche B, term loan 3 month U.S. LIBOR + 2.000% 4.302% 11/30/23 (b)(c) | 57,476 | 57,445 | |
| Hilton Worldwide Finance LLC Tranche B 2LN, term loan 3 month U.S. LIBOR + 1.750% 4.0314% 10/25/23 (b)(c) | 61,530 | 61,568 | |
| Marriott Ownership Resorts, Inc. Tranche B, term loan 3 month U.S. LIBOR + 2.250% 4.552% 8/31/25 (b)(c) | 19,610 | 19,659 | |
| Ryman Hospitality Properties, Inc. Tranche B, term loan 3 month U.S. LIBOR + 2.000% 4.44% 5/11/24 (b)(c) | 9,850 | 9,830 | |
| Wyndham Hotels & Resorts, Inc. Tranche B, term loan 3 month U.S. LIBOR + 1.750% 4.052% 5/30/25 (b)(c) | 39,995 | 39,953 | |
| TOTAL HOTELS | 204,309 | ||
| Insurance - 3.2% | |||
| Acrisure LLC Tranche B, term loan 3 month U.S. LIBOR + 4.250% 6.552% 11/22/23 (b)(c) | 31,368 | 31,421 | |
| Alliant Holdings Intermediate LLC Tranche B, term loan 3 month U.S. LIBOR + 3.000% 5.2795% 5/10/25 (b)(c) | 38,975 | 38,921 | |
| AmWINS Group, Inc. Tranche B 1LN, term loan 3 month U.S. LIBOR + 2.750% 5.0471% 1/25/24 (b)(c) | 25,725 | 25,750 | |
| Asurion LLC: | |||
| Tranche B 6LN, term loan 3 month U.S. LIBOR + 3.000% 5.302% 11/3/23 (b)(c) | 54,178 | 54,200 | |
| Tranche B 7LN, term loan 3 month U.S. LIBOR + 3.000% 5.302% 11/3/24 (b)(c) | 23,441 | 23,454 | |
| Tranche B, term loan: | |||
| 3 month U.S. LIBOR + 3.000% 5.302% 8/4/22 (b)(c) | 39,513 | 39,548 | |
| 3 month U.S. LIBOR + 6.500% 8.802% 8/4/25 (b)(c) | 81,125 | 83,214 | |
| HUB International Ltd. Tranche B, term loan 3 month U.S. LIBOR + 3.000% 5.4895% 4/25/25 (b)(c) | 56,874 | 56,678 | |
| USI, Inc. Tranche B, term loan 3 month U.S. LIBOR + 3.000% 5.3861% 5/16/24 (b)(c) | 48,815 | 48,510 | |
| TOTAL INSURANCE | 401,696 | ||
| Leisure - 2.7% | |||
| 24 Hour Fitness Worldwide, Inc. Tranche B, term loan 3 month U.S. LIBOR + 3.500% 5.802% 5/31/25 (b)(c) | 12,957 | 12,969 | |
| Alterra Mountain Co. Tranche B 1LN, term loan 3 month U.S. LIBOR + 3.000% 5.302% 7/31/24 (b)(c) | 32,714 | 32,725 | |
| Crown Finance U.S., Inc. Tranche B 1LN, term loan 3 month U.S. LIBOR + 2.500% 4.802% 2/28/25 (b)(c) | 71,995 | 71,642 | |
| Delta 2 SARL Tranche B, term loan 3 month U.S. LIBOR + 2.500% 4.802% 2/1/24 (b)(c) | 92,913 | 91,868 | |
| Equinox Holdings, Inc.: | |||
| Tranche 2LN, term loan 3 month U.S. LIBOR + 7.000% 9.302% 9/8/24 (b)(c) | 7,325 | 7,465 | |
| Tranche B-1, term loan 3 month U.S. LIBOR + 3.000% 5.302% 3/8/24 (b)(c) | 19,696 | 19,738 | |
| Fitness International LLC Tranche B, term loan 3 month U.S. LIBOR + 3.250% 5.552% 4/18/25 (b)(c) | 9,322 | 9,331 | |
| LTF Merger Sub, Inc. Tranche B, term loan 3 month U.S. LIBOR + 2.750% 5.0626% 6/10/22 (b)(c) | 34,269 | 34,205 | |
| NVA Holdings, Inc. Tranche B 3LN, term loan 3 month U.S. LIBOR + 2.750% 5.052% 2/2/25 (b)(c) | 17,059 | 16,889 | |
| SeaWorld Parks & Entertainment, Inc. Tranche B 5LN, term loan 3 month U.S. LIBOR + 3.000% 4.6934% 3/31/24 (b)(c) | 9,500 | 9,471 | |
| Seminole Tribe of Florida Tranche B, term loan 3 month U.S. LIBOR + 1.750% 4.052% 7/6/24 (b)(c) | 23,760 | 23,786 | |
| Varsity Brands Holding Co., Inc. Tranche B 1LN, term loan 3 month U.S. LIBOR + 3.500% 5.802% 12/15/24 (b)(c) | 17,369 | 17,380 | |
| TOTAL LEISURE | 347,469 | ||
| Metals/Mining - 0.5% | |||
| American Rock Salt Co. LLC Tranche B, term loan 3 month U.S. LIBOR + 3.750% 6.052% 3/21/25 (b)(c) | 10,945 | 10,959 | |
| Murray Energy Corp. Tranche B 2LN, term loan 3 month U.S. LIBOR + 7.250% 9.7766% 10/17/22 (b)(c) | 55,208 | 49,411 | |
| TOTAL METALS/MINING | 60,370 | ||
| Paper - 0.8% | |||
| Caraustar Industries, Inc. Tranche B, term loan 3 month U.S. LIBOR + 5.500% 7.8861% 3/14/22 (b)(c) | 26,994 | 27,074 | |
| Flex Acquisition Co., Inc.: | |||
| Tranche B 1LN, term loan 3 month U.S. LIBOR + 3.000% 5.256% 12/29/23 (b)(c) | 30,407 | 30,318 | |
| Tranche B 1LN, term loan 3 month U.S. LIBOR + 3.250% 5.506% 6/29/25 (b)(c) | 39,701 | 39,722 | |
| TOTAL PAPER | 97,114 | ||
| Publishing/Printing - 2.0% | |||
| Cengage Learning, Inc. Tranche B, term loan 3 month U.S. LIBOR + 4.250% 6.5296% 6/7/23 (b)(c) | 55,563 | 51,413 | |
| Getty Images, Inc. Tranche B, term loan 3 month U.S. LIBOR + 3.500% 5.802% 10/18/19 (b)(c) | 30,659 | 30,275 | |
| Harland Clarke Holdings Corp. Tranche B 7LN, term loan 3 month U.S. LIBOR + 4.750% 7.1361% 11/3/23 (b)(c) | 35,671 | 33,352 | |
| Houghton Mifflin Harcourt Publishing, Inc. Tranche B, term loan 3 month U.S. LIBOR + 3.000% 5.2949% 5/29/21 (b)(c) | 33,796 | 30,966 | |
| Learning Care Group (U.S.) No 2 Tranche B 1LN, term loan 3 month U.S. LIBOR + 3.250% 5.5328% 3/13/25 (b)(c) | 10,846 | 10,832 | |
| McGraw-Hill Global Education Holdings, LLC term loan 3 month U.S. LIBOR + 4.000% 6.302% 5/4/22 (b)(c) | 53,642 | 51,396 | |
| Merrill Communications LLC Tranche B, term loan 3 month U.S. LIBOR + 5.250% 7.7766% 6/1/22 (b)(c) | 7,294 | 7,339 | |
| Proquest LLC Tranche B, term loan 3 month U.S. LIBOR + 3.250% 5.552% 10/24/21 (b)(c) | 6,786 | 6,801 | |
| Springer Science+Business Media Deutschland GmbH Tranche B 13LN, term loan 3 month U.S. LIBOR + 3.500% 5.8861% 8/24/22 (b)(c) | 31,378 | 31,456 | |
| TOTAL PUBLISHING/PRINTING | 253,830 | ||
| Restaurants - 1.2% | |||
| Burger King Worldwide, Inc. Tranche B, term loan 3 month U.S. LIBOR + 2.250% 4.552% 2/17/24 (b)(c) | 62,778 | 62,511 | |
| CEC Entertainment, Inc. Tranche B, term loan 3 month U.S. LIBOR + 3.250% 5.552% 2/14/21 (b)(c) | 25,664 | 24,458 | |
| K-Mac Holdings Corp.: | |||
| Tranche 2LN, term loan 3 month U.S. LIBOR + 6.750% 9.0296% 3/16/26 (b)(c) | 1,285 | 1,291 | |
| Tranche B 1LN, term loan 3 month U.S. LIBOR + 3.250% 5.5296% 3/16/25 (b)(c) | 4,453 | 4,452 | |
| KFC Holding Co. Tranche B, term loan 3 month U.S. LIBOR + 1.750% 4.0371% 4/3/25 (b)(c) | 24,503 | 24,478 | |
| Red Lobster Hospitality LLC Tranche B, term loan 3 month U.S. LIBOR + 5.250% 7.552% 7/28/21 (b)(c) | 20,574 | 20,420 | |
| Restaurant Technologies, Inc.: | |||
| 1LN, term loan 3 month U.S. LIBOR + 3.250% 5.646% 10/1/25 (b)(c) | 6,610 | 6,627 | |
| 2LN, term loan 3 month U.S. LIBOR + 6.500% 8.896% 10/1/26 (b)(c) | 2,000 | 2,010 | |
| Tacala Investment Corp. term loan 3 month U.S. LIBOR + 3.250% 5.552% 2/1/25 (b)(c) | 4,214 | 4,215 | |
| TOTAL RESTAURANTS | 150,462 | ||
| Services - 6.6% | |||
| Acosta, Inc. Tranche B, term loan 3 month U.S. LIBOR + 3.250% 5.552% 9/26/21 (b)(c) | 15,478 | 11,439 | |
| Almonde, Inc.: | |||
| Tranche 2LN, term loan 3 month U.S. LIBOR + 7.250% 9.6361% 6/13/25 (b)(c) | 33,455 | 32,884 | |
| Tranche B 1LN, term loan 3 month U.S. LIBOR + 3.500% 5.8861% 6/13/24 (b)(c) | 74,584 | 74,107 | |
| Ancestry.Com Operations, Inc. Tranche B 1LN, term loan 3 month U.S. LIBOR + 3.250% 5.55% 10/19/23 (b)(c) | 31,769 | 31,848 | |
| Aramark Services, Inc.: | |||
| Tranche B 3LN, term loan 3 month U.S. LIBOR + 1.750% 4.052% 3/11/25 (b)(c) | 10,492 | 10,486 | |
| Tranche B2 1LN, term loan 3 month U.S. LIBOR + 2.000% 4.052% 3/28/24 (b)(c) | 30,470 | 30,431 | |
| Asgn, Inc. Tranche B, term loan 3 month U.S. LIBOR + 2.000% 4.302% 4/2/25 (b)(c) | 8,574 | 8,580 | |
| Avantor, Inc. Tranche B, term loan 3 month U.S. LIBOR + 4.000% 6.302% 11/21/24 (b)(c) | 14,636 | 14,732 | |
| Brand Energy & Infrastructure Services, Inc. Tranche B, term loan 3 month U.S. LIBOR + 4.250% 6.7321% 6/21/24 (b)(c) | 31,368 | 31,474 | |
| Bright Horizons Family Solutions Tranche B, term loan 3 month U.S. LIBOR + 1.750% 4.052% 11/7/23 (b)(c) | 9,763 | 9,763 | |
| CRCI Longhorn Holdings, Inc. Tranche B 1LN, term loan 3 month U.S. LIBOR + 3.250% 5.7806% 8/8/25 (b)(c) | 10,095 | 10,120 | |
| Filtration Group Corp. Tranche B, term loan 3 month U.S. LIBOR + 3.000% 5.302% 3/29/25 (b)(c) | 11,905 | 11,948 | |
| Frontdoor, Inc. Tranche B, term loan 3 month U.S. LIBOR + 2.500% 4.8125% 8/16/25 (b)(c) | 12,030 | 12,030 | |
| Ion Trading Finance Ltd. Tranche B 1LN, term loan 3 month U.S. LIBOR + 4.000% 6.3861% 11/21/24 (b)(c) | 35,411 | 35,154 | |
| KAR Auction Services, Inc. Tranche B, term loan 3 month U.S. LIBOR + 2.500% 4.9375% 3/9/23 (b)(c) | 12,446 | 12,452 | |
| KUEHG Corp.: | |||
| Tranche B 2LN, term loan 3 month U.S. LIBOR + 8.250% 10.6361% 8/22/25 (b)(c) | 6,500 | 6,581 | |
| Tranche B, term loan 3 month U.S. LIBOR + 3.750% 6.1361% 2/21/25 (b)(c) | 36,642 | 36,757 | |
| Laureate Education, Inc. Tranche B 1LN, term loan 3 month U.S. LIBOR + 3.500% 6.0266% 4/26/24 (b)(c) | 145,518 | 145,627 | |
| Lineage Logistics Holdings, LLC. Tranche B, term loan: | |||
| 3 month U.S. LIBOR + 3.000% 2/27/25 (c)(e) | 8,500 | 8,436 | |
| 3 month U.S. LIBOR + 3.000% 5.302% 2/27/25 (b)(c) | 80,250 | 79,614 | |
| Prime Security Services Borrower LLC Tranche B 1LN, term loan 3 month U.S. LIBOR + 2.750% 5.052% 5/2/22 (b)(c) | 31,616 | 31,602 | |
| Spin Holdco, Inc. Tranche B 1LN, term loan 3 month U.S. LIBOR + 3.250% 5.6864% 11/14/22 (b)(c) | 51,278 | 51,267 | |
| SuperMoose Borrower LLC Tranche B 1LN, term loan 3 month U.S. LIBOR + 3.750% 6.052% 8/29/25 (b)(c) | 24,660 | 24,711 | |
| The GEO Group, Inc. Tranche B 1LN, term loan 3 month U.S. LIBOR + 2.000% 4.31% 3/23/24 (b)(c) | 11,392 | 11,342 | |
| The ServiceMaster Co. Tranche B, term loan 3 month U.S. LIBOR + 2.500% 4.802% 11/8/23 (b)(c) | 10,135 | 10,171 | |
| Thomson Reuters IP&S Tranche B, term loan 1 month U.S. LIBOR + 3.250% 5.552% 10/3/23 (b)(c) | 25,883 | 25,859 | |
| TMK Hawk Parent Corp. Tranche B, term loan 3 month U.S. LIBOR + 3.500% 5.81% 9/26/24 (b)(c) | 10,025 | 9,657 | |
| United Rentals North America, Inc. Tranche B, term loan 3 month U.S. LIBOR + 1.750% 10/5/25 (c)(e) | 15,000 | 15,047 | |
| Wash Multifamily Acquisition, Inc. Tranche B 1LN, term loan 3 month U.S. LIBOR + 3.250% 5.552% 5/14/22 (b)(c) | 14,595 | 14,577 | |
| Xerox Business Services LLC: | |||
| Tranche A, term loan 3 month U.S. LIBOR + 1.750% 4.052% 12/7/22 (b)(c) | 11,151 | 11,123 | |
| Tranche B, term loan 3 month U.S. LIBOR + 2.500% 4.802% 12/7/23 (b)(c) | 20,706 | 20,749 | |
| TOTAL SERVICES | 840,568 | ||
| Steel - 0.2% | |||
| Atkore International, Inc. Tranche B 1LN, term loan 3 month U.S. LIBOR + 2.750% 5.14% 12/22/23 (b)(c) | 9,558 | 9,555 | |
| JMC Steel Group, Inc. Tranche B, term loan 3 month U.S. LIBOR + 2.250% 4.623% 6/14/21 (b)(c) | 20,165 | 20,108 | |
| TOTAL STEEL | 29,663 | ||
| Super Retail - 4.2% | |||
| Academy Ltd. Tranche B, term loan 3 month U.S. LIBOR + 4.000% 6.2589% 7/2/22 (b)(c) | 30,003 | 22,296 | |
| Bass Pro Shops LLC. Tranche B, term loan 3 month U.S. LIBOR + 5.000% 7.302% 9/25/24 (b)(c) | 303,025 | 302,923 | |
| BJ's Wholesale Club, Inc. Tranche B 1LN, term loan 3 month U.S. LIBOR + 3.000% 5.2795% 2/3/24 (b)(c) | 68,233 | 68,350 | |
| Burlington Coat Factory Warehouse Corp. Tranche B, term loan 3 month U.S. LIBOR + 2.500% 4.79% 11/17/24 (b)(c) | 20,232 | 20,232 | |
| Davids Bridal, Inc. Tranche B, term loan 3 month U.S. LIBOR + 4.000% 6.32% 10/11/19 (b)(c) | 2,912 | 2,270 | |
| Harbor Freight Tools U.S.A., Inc. Tranche B, term loan 3 month U.S. LIBOR + 2.500% 4.802% 8/19/23 (b)(c) | 17,880 | 17,568 | |
| JC Penney Corp., Inc. Tranche B, term loan 3 month U.S. LIBOR + 4.250% 6.5673% 6/23/23 (b)(c) | 10,324 | 9,225 | |
| Party City Holdings, Inc. term loan 3 month U.S. LIBOR + 2.750% 5.06% 8/19/22 (b)(c) | 18,683 | 18,726 | |
| PETCO Animal Supplies, Inc. Tranche B 1LN, term loan 3 month U.S. LIBOR + 3.250% 5.7766% 1/26/23 (b)(c) | 31,220 | 24,086 | |
| PetSmart, Inc. term loan 3 month U.S. LIBOR + 3.000% 5.28% 3/11/22 (b)(c) | 19,112 | 16,156 | |
| Sports Authority, Inc. Tranche B, term loan 3 month U.S. LIBOR + 6.000% 0% 11/16/17 (c)(d) | 3,860 | 4 | |
| The Hillman Group, Inc. Tranche B, term loan 3 month U.S. LIBOR + 4.000% 6.302% 5/31/25 (b)(c) | 23,713 | 23,262 | |
| TOTAL SUPER RETAIL | 525,098 | ||
| Technology - 13.9% | |||
| Anastasia Parent LLC Tranche B, term loan 3 month U.S. LIBOR + 3.750% 6.0267% 8/3/25 (b)(c) | 35,975 | 35,545 | |
| Aptean, Inc.: | |||
| Tranche 2LN, term loan 3 month U.S. LIBOR + 9.500% 11.89% 12/20/23 (b)(c) | 2,500 | 2,500 | |
| Tranche B 1LN, term loan 3 month U.S. LIBOR + 4.250% 6.64% 12/20/22 (b)(c) | 7,722 | 7,718 | |
| ATS Consolidated, Inc. Tranche B 1LN, term loan 3 month U.S. LIBOR + 3.750% 6.0449% 2/28/25 (b)(c) | 11,831 | 11,895 | |
| Bracket Intermediate Holding Corp. 1LN, term loan 3 month U.S. LIBOR + 4.250% 6.5708% 9/5/25 (b)(c) | 17,290 | 17,333 | |
| Brave Parent Holdings, Inc. Tranche B 1LN, term loan 3 month U.S. LIBOR + 4.000% 6.3861% 4/19/25 (b)(c) | 7,750 | 7,779 | |
| Ceridian HCM Holding, Inc. Tranche B, term loan 3 month U.S. LIBOR + 3.250% 5.552% 4/30/25 (b)(c) | 29,500 | 29,537 | |
| Computer Discount Warehouse (CDW) LLC Tranche B, term loan 3 month U.S. LIBOR + 1.750% 4.06% 8/17/23 (b)(c) | 30,911 | 30,937 | |
| Compuware Corp. 1LN, term loan 3 month U.S. LIBOR + 3.500% 5.7865% 8/23/25 (b)(c) | 12,275 | 12,357 | |
| Cvent, Inc. Tranche B, term loan 3 month U.S. LIBOR + 3.750% 5.9922% 11/29/24 (b)(c) | 16,169 | 16,196 | |
| Dell International LLC Tranche B, term loan 3 month U.S. LIBOR + 2.000% 4.31% 9/7/23 (b)(c) | 34,913 | 34,860 | |
| DG Investment Intermediate Holdings, Inc.: | |||
| Tranche B 1LN, term loan 3 month U.S. LIBOR + 3.000% 5.302% 2/1/25 (b)(c) | 17,947 | 17,835 | |
| Tranche B 2LN, term loan 3 month U.S. LIBOR + 6.750% 9.052% 2/1/26 (b)(c) | 3,235 | 3,239 | |
| Digicert Holdings, Inc. Tranche B, term loan: | |||
| 3 month U.S. LIBOR + 4.000% 10/31/24 (c)(e) | 7,460 | 7,457 | |
| 3 month U.S. LIBOR + 4.000% 6.302% 10/31/24 (b)(c) | 60,424 | 60,398 | |
| 3 month U.S. LIBOR + 8.000% 10.6916% 10/31/25 (b)(c) | 13,433 | 13,341 | |
| Dynatrace LLC: | |||
| 2LN, term loan 3 month U.S. LIBOR + 7.000% 9.302% 8/23/26 (b)(c) | 1,778 | 1,798 | |
| Tranche B 1LN, term loan 1 month U.S. LIBOR + 3.250% 5.552% 8/23/25 (b)(c) | 22,115 | 22,235 | |
| EagleView Technology Corp. Tranche B 1LN, term loan 3 month U.S. LIBOR + 3.500% 5.7795% 8/14/25 (b)(c) | 15,360 | 15,302 | |
| EIG Investors Corp. Tranche B, term loan 3 month U.S. LIBOR + 3.750% 6.0614% 2/9/23 (b)(c) | 34,717 | 34,816 | |
| Electro Rent Corp. Tranche B 1LN, term loan 3 month U.S. LIBOR + 5.000% 7.4871% 1/31/24 (b)(c) | 5,800 | 5,836 | |
| Epicor Software Corp. Tranche B, term loan 3 month U.S. LIBOR + 3.250% 5.56% 6/1/22 (b)(c) | 32,828 | 32,885 | |
| EPV Merger Sub, Inc.: | |||
| Tranche 2LN, term loan 3 month U.S. LIBOR + 7.250% 9.552% 3/8/26 (b)(c) | 2,250 | 2,244 | |
| Tranche B 1LN, term loan 3 month U.S. LIBOR + 3.250% 5.552% 3/8/25 (b)(c) | 17,638 | 17,587 | |
| EXC Holdings III Corp. Tranche B, term loan: | |||
| 3 month U.S. LIBOR + 3.500% 5.8861% 12/2/24 (b)(c) | 18,407 | 18,453 | |
| 3 month U.S. LIBOR + 7.500% 9.9669% 12/1/25 (b)(c) | 2,000 | 2,025 | |
| First Data Corp. Tranche B, term loan: | |||
| 3 month U.S. LIBOR + 2.000% 4.2865% 7/10/22 (b)(c) | 107,173 | 106,785 | |
| 3 month U.S. LIBOR + 2.000% 4.2865% 4/26/24 (b)(c) | 27,537 | 27,376 | |
| Global Payments, Inc. Tranche B 3LN, term loan 3 month U.S. LIBOR + 1.750% 4.052% 4/22/23 (b)(c) | 19,594 | 19,569 | |
| Go Daddy Operating Co. LLC Tranche B, term loan 3 month U.S. LIBOR + 2.250% 4.552% 2/15/24 (b)(c) | 35,172 | 35,194 | |
| Hyland Software, Inc.: | |||
| Tranche 2LN, term loan 3 month U.S. LIBOR + 7.000% 9.2422% 7/7/25 (b)(c) | 1,590 | 1,592 | |
| Tranche B 1LN, term loan 3 month U.S. LIBOR + 3.250% 5.4922% 7/1/22 (b)(c) | 10,521 | 10,572 | |
| Tranche B 1LN, term loan 3 month U.S. LIBOR + 3.500% 5.9252% 7/1/24 (b)(c) | 1,900 | 1,909 | |
| Infor U.S., Inc. Tranche B 6LN, term loan 3 month U.S. LIBOR + 2.750% 5.1361% 2/1/22 (b)(c) | 25,313 | 25,206 | |
| Kronos, Inc.: | |||
| 2LN, term loan 3 month U.S. LIBOR + 8.250% 10.5931% 11/1/24 (b)(c) | 30,000 | 30,379 | |
| Tranche B 1LN, term loan 3 month U.S. LIBOR + 3.000% 5.3431% 11/1/23 (b)(c) | 48,997 | 49,035 | |
| Landesk Group, Inc. term loan: | |||
| 3 month U.S. LIBOR + 4.250% 6.51% 1/20/24 (b)(c) | 34,254 | 34,196 | |
| 3 month U.S. LIBOR + 9.000% 11.26% 1/20/25 (b)(c) | 11,730 | 11,261 | |
| MA FinanceCo. LLC: | |||
| Tranche B 2LN, term loan 3 month U.S. LIBOR + 2.250% 4.552% 11/20/21 (b)(c) | 3,613 | 3,583 | |
| Tranche B 3LN, term loan: | |||
| 3 month U.S. LIBOR + 2.500% 4.802% 6/21/24 (b)(c) | 102,634 | 102,281 | |
| 3 month U.S. LIBOR + 2.500% 4.802% 6/21/24 (b)(c) | 15,013 | 14,961 | |
| McAfee LLC Tranche B, term loan: | |||
| 3 month U.S. LIBOR + 4.500% 6.7949% 9/29/24 (b)(c) | 55,159 | 55,287 | |
| 3 month U.S. LIBOR + 8.500% 10.7949% 9/29/25 (b)(c) | 13,250 | 13,457 | |
| MH Sub I LLC Tranche B, term loan 3 month U.S. LIBOR + 3.750% 6.0296% 9/15/24 (b)(c) | 15,345 | 15,383 | |
| Microchip Technology, Inc. Tranche B, term loan 3 month U.S. LIBOR + 2.000% 4.31% 5/29/25 (b)(c) | 47,478 | 47,288 | |
| Micron Technology, Inc. Tranche B, term loan 3 month U.S. LIBOR + 1.750% 4.06% 4/26/22 (b)(c) | 1,860 | 1,860 | |
| Mitchell International, Inc. Tranche B, term loan: | |||
| 3 month U.S. LIBOR + 3.250% 5.552% 12/1/24 (b)(c) | 8,448 | 8,406 | |
| 3 month U.S. LIBOR + 7.250% 9.552% 12/1/25 (b)(c) | 3,335 | 3,343 | |
| NAVEX TopCo, Inc.: | |||
| 2LN, term loan 3 month U.S. LIBOR + 7.000% 9.31% 9/4/26 (b)(c) | 2,225 | 2,227 | |
| Tranche B 1LN, term loan 3 month U.S. LIBOR + 3.250% 5.56% 9/4/25 (b)(c) | 9,255 | 9,234 | |
| Open Text Corp. Tranche B, term loan 3 month U.S. LIBOR + 1.750% 4.052% 5/30/25 (b)(c) | 9,059 | 9,082 | |
| Renaissance Holding Corp.: | |||
| Tranche B 1LN, term loan 3 month U.S. LIBOR + 3.250% 5.552% 5/31/25 (b)(c) | 23,940 | 23,814 | |
| Tranche B 2LN, term loan 3 month U.S. LIBOR + 7.000% 9.302% 5/31/26 (b)(c) | 12,300 | 12,208 | |
| Severin Acquisition LLC Tranche B 1LN, term loan 3 month U.S. LIBOR + 3.250% 5.5239% 8/1/25 (b)(c) | 18,065 | 18,032 | |
| Solera LLC Tranche B, term loan 3 month U.S. LIBOR + 2.750% 5.052% 3/3/23 (b)(c) | 32,311 | 32,245 | |
| Sophia L.P. term loan 3 month U.S. LIBOR + 3.250% 5.6361% 9/30/22 (b)(c) | 25,946 | 25,978 | |
| Sound Inpatient Physicians, Inc.: | |||
| Tranche B 1LN, term loan 3 month U.S. LIBOR + 3.000% 5.302% 6/28/25 (b)(c) | 8,623 | 8,658 | |
| Tranche B 2LN, term loan 3 month U.S. LIBOR + 6.750% 9.052% 6/28/26 (b)(c) | 2,205 | 2,205 | |
| SS&C Technologies, Inc.: | |||
| Tranche B 1LN, term loan 3 month U.S. LIBOR + 2.250% 4.552% 7/8/22 (b)(c) | 13,191 | 13,155 | |
| Tranche B 3LN, term loan 3 month U.S. LIBOR + 2.250% 4.552% 4/16/25 (b)(c) | 57,511 | 57,191 | |
| Tranche B 4LN, term loan 3 month U.S. LIBOR + 2.250% 4.552% 4/16/25 (b)(c) | 22,291 | 22,167 | |
| Tranche B 5LN, term loan 3 month U.S. LIBOR + 2.500% 4.552% 4/16/25 (b)(c) | 46,395 | 46,113 | |
| Sybil Software LLC. Tranche B, term loan 3 month U.S. LIBOR + 2.500% 4.8861% 9/30/23 (b)(c) | 26,989 | 27,071 | |
| Syniverse Holdings, Inc. Tranche B, term loan 3 month U.S. LIBOR + 5.000% 7.2795% 3/9/23 (b)(c) | 32,586 | 32,749 | |
| Tempo Acquisition LLC Tranche B, term loan 3 month U.S. LIBOR + 3.000% 5.302% 5/1/24 (b)(c) | 41,366 | 41,356 | |
| TIBCO Software, Inc. Tranche B, term loan 3 month U.S. LIBOR + 3.500% 5.8% 12/4/20 (b)(c) | 11,121 | 11,133 | |
| TTM Technologies, Inc. Tranche B, term loan 3 month U.S. LIBOR + 2.500% 4.756% 9/28/24 (b)(c) | 27,326 | 27,291 | |
| Uber Technologies, Inc. Tranche B, term loan 3 month U.S. LIBOR + 4.000% 6.2806% 4/4/25 (b)(c) | 47,411 | 47,372 | |
| Vantiv LLC: | |||
| Tranche B 3LN, term loan 3 month U.S. LIBOR + 1.750% 4.0295% 10/14/23 (b)(c) | 10,350 | 10,320 | |
| Tranche B 4LN, term loan 3 month U.S. LIBOR + 1.750% 4.0295% 8/9/24 (b)(c) | 19,900 | 19,843 | |
| Verscend Holding Corp. Tranche B, term loan 3 month U.S. LIBOR + 4.500% 6.802% 8/27/25 (b)(c) | 43,865 | 44,180 | |
| Vertafore, Inc.: | |||
| Tranche B 1LN, term loan 3 month U.S. LIBOR + 3.250% 5.552% 7/2/25 (b)(c) | 51,500 | 51,296 | |
| Tranche B 2LN, term loan 3 month U.S. LIBOR + 7.250% 9.552% 7/2/26 (b)(c) | 17,500 | 17,511 | |
| Web.com Group, Inc.: | |||
| 2LN, term loan 3 month U.S. LIBOR + 7.750% 10.1704% 10/11/26 (b)(c) | 14,577 | 14,468 | |
| Tranche B 1LN, term loan 3 month U.S. LIBOR + 3.750% 6.1704% 10/11/25 (b)(c) | 24,350 | 24,297 | |
| WEX, Inc. Tranche B, term loan 3 month U.S. LIBOR + 2.250% 4.552% 7/1/23 (b)(c) | 20,965 | 20,983 | |
| TOTAL TECHNOLOGY | 1,753,210 | ||
| Telecommunications - 7.4% | |||
| Altice Financing SA Tranche B, term loan: | |||
| 3 month U.S. LIBOR + 2.750% 5.0395% 7/15/25 (b)(c) | 15,822 | 15,412 | |
| 3 month U.S. LIBOR + 2.750% 5.0395% 1/31/26 (b)(c) | 9,900 | 9,640 | |
| Ciena Corp. Tranche B, term loan 3 month U.S. LIBOR + 2.000% 4.2796% 9/28/25 (b)(c) | 6,545 | 6,549 | |
| Digicel International Finance Ltd. Tranche B, term loan 3 month U.S. LIBOR + 3.250% 5.57% 5/25/24 (b)(c) | 13,341 | 12,763 | |
| Evo Payments International LLC Tranche B, term loan 3 month U.S. LIBOR + 3.250% 5.55% 12/22/23 (b)(c) | 21,706 | 21,760 | |
| Frontier Communications Corp.: | |||
| Tranche A, term loan 3 month U.S. LIBOR + 2.750% 5.06% 3/31/21 (b)(c) | 98,858 | 95,769 | |
| Tranche B 1LN, term loan 3 month U.S. LIBOR + 3.750% 6.06% 6/15/24 (b)(c) | 111,857 | 108,053 | |
| GTT Communications, Inc. Tranche B, term loan 3 month U.S. LIBOR + 2.750% 5.05% 5/31/25 (b)(c) | 41,396 | 40,799 | |
| Intelsat Jackson Holdings SA: | |||
| Tranche B, term loan 3 month U.S. LIBOR + 3.750% 6.0449% 11/27/23 (b)(c) | 162,495 | 162,495 | |
| Tranche B-4, term loan 3 month U.S. LIBOR + 4.500% 6.7949% 1/2/24 (b)(c) | 19,000 | 19,665 | |
| Tranche B-5, term loan 6.625% 1/2/24 | 36,120 | 36,990 | |
| Level 3 Financing, Inc. Tranche B, term loan 3 month U.S. LIBOR + 2.250% 4.5296% 2/22/24 (b)(c) | 74,195 | 74,230 | |
| Neptune Finco Corp. Tranche B, term loan 3 month U.S. LIBOR + 2.250% 4.5295% 7/17/25 (b)(c) | 30,875 | 30,776 | |
| Onvoy LLC Tranche B 1LN, term loan 3 month U.S. LIBOR + 4.500% 6.8861% 2/10/24 (b)(c) | 19,764 | 19,237 | |
| Radiate Holdco LLC Tranche B, term loan 3 month U.S. LIBOR + 3.000% 5.302% 2/1/24 (b)(c) | 51,642 | 51,199 | |
| Sable International Finance Ltd. Tranche B 4LN, term loan 3 month U.S. LIBOR + 3.250% 5.552% 2/2/26 (b)(c) | 56,000 | 55,937 | |
| SBA Senior Finance II, LLC Tranche B, term loan 3 month U.S. LIBOR + 2.000% 4.31% 4/11/25 (b)(c) | 42,224 | 42,114 | |
| Securus Technologies, Inc.: | |||
| Tranche B 1LN, term loan 3 month U.S. LIBOR + 4.500% 11/1/24 (c)(e) | 9,600 | 9,616 | |
| Tranche B, term loan: | |||
| 3 month U.S. LIBOR + 4.500% 6.802% 11/1/24 (b)(c) | 39,890 | 39,956 | |
| 3 month U.S. LIBOR + 8.250% 10.552% 11/1/25 (b)(c) | 10,250 | 10,233 | |
| SFR Group SA Tranche B 11LN, term loan 3 month U.S. LIBOR + 2.750% 5.052% 7/31/25 (b)(c) | 48,357 | 46,589 | |
| Sprint Communications, Inc. Tranche B, term loan 3 month U.S. LIBOR + 2.500% 4.8125% 2/3/24 (b)(c) | 14,334 | 14,320 | |
| Windstream Services LLC Tranche B 7LN, term loan 3 month U.S. LIBOR + 3.250% 5.54% 2/17/24 (b)(c) | 14,511 | 12,573 | |
| TOTAL TELECOMMUNICATIONS | 936,675 | ||
| Textiles/Apparel - 0.1% | |||
| ABB Optical Group LLC Tranche B, term loan 3 month U.S. LIBOR + 5.000% 7.2797% 6/15/23 (b)(c) | 8,651 | 8,673 | |
| Transportation Ex Air/Rail - 0.5% | |||
| IBC Capital Ltd.: | |||
| 2LN, term loan 3 month U.S. LIBOR + 7.000% 9.3371% 9/11/24 (b)(c) | 3,000 | 3,013 | |
| Tranche B 1LN, term loan 3 month U.S. LIBOR + 3.750% 6.0871% 9/11/23 (b)(c) | 25,507 | 25,443 | |
| International Seaways Operating Corp. Tranche B, term loan 3 month U.S. LIBOR + 5.500% 8.26% 6/22/22 (b)(c) | 28,744 | 28,672 | |
| Navios Maritime Partners LP Tranche B, term loan 3 month U.S. LIBOR + 5.000% 7.34% 9/14/20 (b)(c) | 10,753 | 10,740 | |
| TOTAL TRANSPORTATION EX AIR/RAIL | 67,868 | ||
| Utilities - 2.7% | |||
| Brookfield WEC Holdings, Inc.: | |||
| 2LN, term loan 3 month U.S. LIBOR + 6.750% 9.052% 8/1/26 (b)(c) | 18,970 | 19,226 | |
| Tranche B 1LN, term loan 3 month U.S. LIBOR + 3.750% 6.052% 8/1/25 (b)(c) | 67,000 | 67,354 | |
| Exgen Renewables Iv LLC Tranche B, term loan 3 month U.S. LIBOR + 3.000% 5.32% 11/28/24 (b)(c) | 16,917 | 17,044 | |
| Houston Fuel Oil Terminal Co. Tranche B 1LN, term loan 3 month U.S. LIBOR + 2.750% 5.06% 6/26/25 (b)(c) | 43,541 | 43,631 | |
| Limetree Bay Terminals LLC term loan 3 month U.S. LIBOR + 4.000% 6.302% 2/15/24 (b)(c) | 19,729 | 19,187 | |
| Moxie Patriot LLC Tranche B, term loan 3 month U.S. LIBOR + 5.750% 8.1361% 12/19/20 (b)(c) | 15,852 | 15,703 | |
| Pike Corp. Tranche B, term loan 3 month U.S. LIBOR + 3.500% 5.81% 3/23/25 (b)(c) | 11,025 | 11,080 | |
| Tex Operations Co. LLC Tranche B, term loan 3 month U.S. LIBOR + 2.000% 4.302% 8/4/23 (b)(c) | 40,402 | 40,289 | |
| Vertiv Group Corp. Tranche B, term loan 3 month U.S. LIBOR + 4.000% 6.3126% 11/30/23 (b)(c) | 25,546 | 25,259 | |
| Vistra Operations Co. LLC: | |||
| Tranche B 2LN, term loan 3 month U.S. LIBOR + 2.000% 4.552% 12/14/23 (b)(c) | 22,352 | 22,360 | |
| Tranche B 3LN, term loan 3 month U.S. LIBOR + 2.000% 4.2928% 12/31/25 (b)(c) | 58,458 | 58,246 | |
| TOTAL UTILITIES | 339,379 | ||
| TOTAL BANK LOAN OBLIGATIONS | |||
| (Cost $11,488,636) | 11,423,077 | ||
| Nonconvertible Bonds - 4.3% | |||
| Aerospace - 0.1% | |||
| DAE Funding LLC 4% 8/1/20 (f) | 6,495 | 6,430 | |
| Cable/Satellite TV - 0.3% | |||
| CCO Holdings LLC/CCO Holdings Capital Corp.: | |||
| 5.125% 2/15/23 | 17,065 | 16,980 | |
| 5.25% 3/15/21 | 13,070 | 13,135 | |
| Virgin Media Finance PLC 4.875% 2/15/22 | 2,000 | 1,905 | |
| TOTAL CABLE/SATELLITE TV | 32,020 | ||
| Chemicals - 0.2% | |||
| OCI NV 6.625% 4/15/23 (f) | 5,005 | 5,130 | |
| TPC Group, Inc. 8.75% 12/15/20 (f) | 18,095 | 17,733 | |
| TOTAL CHEMICALS | 22,863 | ||
| Containers - 0.6% | |||
| Ardagh Packaging Finance PLC/Ardagh MP Holdings U.S.A., Inc.: | |||
| 4.25% 9/15/22(f) | 15,000 | 14,550 | |
| 6% 2/15/25 (f) | 10,000 | 9,375 | |
| Reynolds Group Issuer, Inc./Reynolds Group Issuer LLC/Reynolds Group Issuer (Luxembourg) SA: | |||
| 3 month U.S. LIBOR + 3.500% 5.9363% 7/15/21 (b)(c)(f) | 15,130 | 15,281 | |
| 5.75% 10/15/20 | 32,296 | 32,296 | |
| TOTAL CONTAINERS | 71,502 | ||
| Diversified Financial Services - 0.1% | |||
| Icahn Enterprises LP/Icahn Enterprises Finance Corp. 6.25% 2/1/22 | 5,200 | 5,250 | |
| International Lease Finance Corp. 6.25% 5/15/19 | 10,000 | 10,159 | |
| TOTAL DIVERSIFIED FINANCIAL SERVICES | 15,409 | ||
| Energy - 0.8% | |||
| Cheniere Corpus Christi Holdings LLC: | |||
| 5.125% 6/30/27 | 11,455 | 11,226 | |
| 7% 6/30/24 | 7,000 | 7,569 | |
| Chesapeake Energy Corp.: | |||
| 3 month U.S. LIBOR + 3.250% 5.6863% 4/15/19 (b)(c) | 7,080 | 7,098 | |
| 8% 12/15/22 (f) | 8,195 | 8,543 | |
| Citgo Petroleum Corp. 6.25% 8/15/22 (f) | 10,000 | 9,850 | |
| Consolidated Energy Finance SA: | |||
| 3 month U.S. LIBOR + 3.750% 6.0841% 6/15/22 (b)(c)(f) | 26,500 | 26,512 | |
| 6.875% 6/15/25 (f) | 5,500 | 5,603 | |
| Denbury Resources, Inc.: | |||
| 7.5% 2/15/24 (f) | 9,050 | 8,846 | |
| 9% 5/15/21 (f) | 3,645 | 3,804 | |
| 9.25% 3/31/22 (f) | 7,290 | 7,600 | |
| EP Energy LLC/Everest Acquisition Finance, Inc. 7.75% 5/15/26 (f) | 7,340 | 7,301 | |
| TOTAL ENERGY | 103,952 | ||
| Gaming - 0.2% | |||
| Gateway Casinos & Entertainment Ltd. 8.25% 3/1/24 (f) | 5,000 | 5,250 | |
| Scientific Games Corp. 5% 10/15/25 (f) | 5,000 | 4,650 | |
| Stars Group Holdings BV 7% 7/15/26 (f) | 12,545 | 12,733 | |
| Sugarhouse HSP Gaming Prop Mezz LP/Sugarhouse HSP Gaming Finance Corp. 5.875% 5/15/25 (f) | 7,363 | 6,949 | |
| TOTAL GAMING | 29,582 | ||
| Healthcare - 0.6% | |||
| Community Health Systems, Inc. 6.25% 3/31/23 | 21,175 | 19,475 | |
| Tenet Healthcare Corp.: | |||
| 4.625% 7/15/24 | 28,000 | 26,988 | |
| 4.75% 6/1/20 | 8,680 | 8,702 | |
| 5.125% 5/1/25 | 7,500 | 7,219 | |
| 7.5% 1/1/22 (f) | 5,085 | 5,301 | |
| Valeant Pharmaceuticals International, Inc.: | |||
| 5.5% 11/1/25 (f) | 5,590 | 5,478 | |
| 9% 12/15/25 (f) | 7,440 | 7,756 | |
| TOTAL HEALTHCARE | 80,919 | ||
| Insurance - 0.0% | |||
| HUB International Ltd. 7% 5/1/26 (f) | 6,000 | 5,856 | |
| Leisure - 0.1% | |||
| Studio City Co. Ltd.: | |||
| 5.875% 11/30/19 (f) | 8,160 | 8,231 | |
| 7.25% 11/30/21 (f) | 10,000 | 10,288 | |
| TOTAL LEISURE | 18,519 | ||
| Restaurants - 0.1% | |||
| 1011778 BC Unlimited Liability Co./New Red Finance, Inc. 4.25% 5/15/24 (f) | 8,000 | 7,500 | |
| Services - 0.1% | |||
| APX Group, Inc. 7.625% 9/1/23 | 12,325 | 10,969 | |
| Brand Energy & Infrastructure Services, Inc. 8.5% 7/15/25 (f) | 6,032 | 5,942 | |
| TOTAL SERVICES | 16,911 | ||
| Technology - 0.4% | |||
| Diamond 1 Finance Corp./Diamond 2 Finance Corp.: | |||
| 3.48% 6/1/19 (f) | 6,199 | 6,207 | |
| 4.42% 6/15/21 (f) | 16,685 | 16,824 | |
| NXP BV/NXP Funding LLC 4.125% 6/1/21 (f) | 16,440 | 16,337 | |
| Uber Technologies, Inc. 7.5% 11/1/23 (f)(g) | 11,000 | 11,014 | |
| TOTAL TECHNOLOGY | 50,382 | ||
| Telecommunications - 0.6% | |||
| Altice Financing SA 7.5% 5/15/26 (f) | 19,200 | 18,048 | |
| Intelsat Jackson Holdings SA 8% 2/15/24 (f) | 14,100 | 14,752 | |
| SFR Group SA: | |||
| 6.25% 5/15/24 (f) | 10,905 | 10,455 | |
| 7.375% 5/1/26 (f) | 18,755 | 17,952 | |
| Sprint Capital Corp. 6.9% 5/1/19 | 5,000 | 5,065 | |
| Sprint Communications, Inc. 9% 11/15/18 (f) | 3,000 | 3,006 | |
| TOTAL TELECOMMUNICATIONS | 69,278 | ||
| Textiles/Apparel - 0.0% | |||
| Eagle Intermediate Global Holding BV 7.5% 5/1/25 (f) | 4,365 | 4,223 | |
| Transportation Ex Air/Rail - 0.1% | |||
| Avolon Holdings Funding Ltd. 5.125% 10/1/23 (f) | 12,290 | 12,060 | |
| TOTAL NONCONVERTIBLE BONDS | |||
| (Cost $555,964) | 547,406 | ||
| Shares | Value (000s) | ||
| Common Stocks - 0.8% | |||
| Broadcasting - 0.0% | |||
| ION Media Networks, Inc. (h)(i) | 2,842 | 2,444 | |
| Chemicals - 0.2% | |||
| LyondellBasell Industries NV Class A | 245,943 | 21,955 | |
| Energy - 0.4% | |||
| Expro Holdings U.S., Inc. (i) | 1,477,422 | 34,350 | |
| Expro Holdings U.S., Inc. (f)(i) | 542,213 | 12,606 | |
| TOTAL ENERGY | 46,956 | ||
| Homebuilders/Real Estate - 0.0% | |||
| Five Point Holdings LLC Class A (h) | 45,793 | 348 | |
| Metals/Mining - 0.1% | |||
| Warrior Metropolitan Coal, Inc. | 255,983 | 7,168 | |
| Publishing/Printing - 0.0% | |||
| Cenveo Corp. (i) | 75,509 | 2,202 | |
| Utilities - 0.1% | |||
| TexGen Power LLC (i) | 524,336 | 19,505 | |
| TOTAL COMMON STOCKS | |||
| (Cost $119,484) | 100,578 | ||
| Money Market Funds - 7.8% | |||
| Fidelity Cash Central Fund, 2.23% (j) | |||
| (Cost $983,896) | 983,847,750 | 984,045 | |
| TOTAL INVESTMENT IN SECURITIES - 103.2% | |||
| (Cost $13,147,980) | 13,055,106 | ||
| NET OTHER ASSETS (LIABILITIES) - (3.2)% | (410,697) | ||
| NET ASSETS - 100% | $12,644,409 |
Legend
(a) Remaining maturities of bank loan obligations may be less than the stated maturities shown as a result of contractual or optional prepayments by the borrower. Such prepayments cannot be predicted with certainty.
(b) Coupon rates for floating and adjustable rate securities reflect the rates in effect at period end.
(c) Coupon is indexed to a floating interest rate which may be multiplied by a specified factor and/or subject to caps or floors.
(d) Non-income producing - Security is in default.
(e) The coupon rate will be determined upon settlement of the loan after period end.
(f) Security exempt from registration under Rule 144A of the Securities Act of 1933. These securities may be resold in transactions exempt from registration, normally to qualified institutional buyers. At the end of the period, the value of these securities amounted to $375,976,000 or 3.0% of net assets.
(g) Security or a portion of the security purchased on a delayed delivery or when-issued basis.
(h) Non-income producing
(i) Level 3 security
(j) Affiliated fund that is generally available only to investment companies and other accounts managed by Fidelity Investments. The rate quoted is the annualized seven-day yield of the fund at period end. A complete unaudited listing of the fund's holdings as of its most recent quarter end is available upon request. In addition, each Fidelity Central Fund's financial statements, which are not covered by the Fund's Report of Independent Registered Public Accounting Firm, are available on the SEC's website or upon request.
Affiliated Central Funds
Information regarding fiscal year to date income earned by the Fund from investments in Fidelity Central Funds is as follows:
| Fund | Income earned |
| (Amounts in thousands) | |
| Fidelity Cash Central Fund | $16,753 |
| Total | $16,753 |
Amounts in the income column in the above table include any capital gain distributions from underlying funds, which are presented in the corresponding line-item in the Statement of Operations if applicable.
Investment Valuation
The following is a summary of the inputs used, as of October 31, 2018, involving the Fund's assets and liabilities carried at fair value. The inputs or methodology used for valuing securities may not be an indication of the risk associated with investing in those securities. For more information on valuation inputs, and their aggregation into the levels used below, please refer to the Investment Valuation section in the accompanying Notes to Financial Statements.
| Valuation Inputs at Reporting Date: | ||||
| Description | Total | Level 1 | Level 2 | Level 3 |
| (Amounts in thousands) | ||||
| Investments in Securities: | ||||
| Equities: | ||||
| Communication Services | $2,444 | $-- | $-- | $2,444 |
| Energy | 46,956 | -- | -- | 46,956 |
| Industrials | 2,202 | -- | -- | 2,202 |
| Materials | 29,123 | 29,123 | -- | -- |
| Real Estate | 348 | 348 | -- | -- |
| Utilities | 19,505 | -- | -- | 19,505 |
| Bank Loan Obligations | 11,423,077 | -- | 11,423,077 | -- |
| Corporate Bonds | 547,406 | -- | 547,406 | -- |
| Money Market Funds | 984,045 | 984,045 | -- | -- |
| Total Investments in Securities: | $13,055,106 | $1,013,516 | $11,970,483 | $71,107 |
Other Information
Distribution of investments by country or territory of incorporation, as a percentage of Total Net Assets, is as follows (Unaudited):
| United States of America | 88.8% |
| Luxembourg | 5.1% |
| Canada | 1.2% |
| Netherlands | 1.2% |
| Others (Individually Less Than 1%) | 3.7% |
| 100.0% |
See accompanying notes which are an integral part of the financial statements.
Financial Statements
Statement of Assets and Liabilities
| Amounts in thousands (except per-share amounts) | October 31, 2018 | |
| Assets | ||
| Investment in securities, at value — See accompanying schedule: Unaffiliated issuers (cost $12,164,084) | $12,071,061 | |
| Fidelity Central Funds (cost $983,896) | 984,045 | |
| Total Investment in Securities (cost $13,147,980) | $13,055,106 | |
| Cash | 3,557 | |
| Receivable for investments sold | 90,891 | |
| Receivable for fund shares sold | 19,701 | |
| Interest receivable | 62,173 | |
| Distributions receivable from Fidelity Central Funds | 1,824 | |
| Prepaid expenses | 22 | |
| Other receivables | 248 | |
| Total assets | 13,233,522 | |
| Liabilities | ||
| Payable for investments purchased | ||
| Regular delivery | $541,169 | |
| Delayed delivery | 11,000 | |
| Payable for fund shares redeemed | 18,953 | |
| Distributions payable | 9,910 | |
| Accrued management fee | 5,811 | |
| Distribution and service plan fees payable | 530 | |
| Other affiliated payables | 1,423 | |
| Other payables and accrued expenses | 317 | |
| Total liabilities | 589,113 | |
| Net Assets | $12,644,409 | |
| Net Assets consist of: | ||
| Paid in capital | $13,098,655 | |
| Total distributable earnings (loss) | (454,246) | |
| Net Assets | $12,644,409 | |
| Net Asset Value and Maximum Offering Price | ||
| Class A: | ||
| Net Asset Value and redemption price per share ($597,769 ÷ 62,210 shares) | $9.61 | |
| Maximum offering price per share (100/97.25 of $9.61) | $9.88 | |
| Class M: | ||
| Net Asset Value and redemption price per share ($101,631 ÷ 10,592 shares) | $9.59 | |
| Maximum offering price per share (100/97.25 of $9.59) | $9.86 | |
| Class C: | ||
| Net Asset Value and offering price per share ($464,327 ÷ 48,334 shares)(a) | $9.61 | |
| Fidelity Floating Rate High Income Fund: | ||
| Net Asset Value, offering price and redemption price per share ($9,221,328 ÷ 960,937 shares) | $9.60 | |
| Class I: | ||
| Net Asset Value, offering price and redemption price per share ($2,243,164 ÷ 233,953 shares) | $9.59 | |
| Class Z: | ||
| Net Asset Value, offering price and redemption price per share ($16,190 ÷ 1,688 shares) | $9.59 |
(a) Redemption price per share is equal to net asset value less any applicable contingent deferred sales charge.
See accompanying notes which are an integral part of the financial statements.
Statement of Operations
| Amounts in thousands | Year ended October 31, 2018 | |
| Investment Income | ||
| Dividends | $6,821 | |
| Interest | 564,977 | |
| Income from Fidelity Central Funds | 16,753 | |
| Total income | 588,551 | |
| Expenses | ||
| Management fee | $63,892 | |
| Transfer agent fees | 14,537 | |
| Distribution and service plan fees | 6,564 | |
| Accounting fees and expenses | 1,633 | |
| Custodian fees and expenses | 104 | |
| Independent trustees' fees and expenses | 56 | |
| Registration fees | 382 | |
| Audit | 104 | |
| Legal | 35 | |
| Miscellaneous | 78 | |
| Total expenses before reductions | 87,385 | |
| Expense reductions | (169) | |
| Total expenses after reductions | 87,216 | |
| Net investment income (loss) | 501,335 | |
| Realized and Unrealized Gain (Loss) | ||
| Net realized gain (loss) on: | ||
| Investment securities: | ||
| Unaffiliated issuers | (33,355) | |
| Fidelity Central Funds | 6 | |
| Total net realized gain (loss) | (33,349) | |
| Change in net unrealized appreciation (depreciation) on: | ||
| Investment securities: | ||
| Unaffiliated issuers | (37,480) | |
| Fidelity Central Funds | (4) | |
| Total change in net unrealized appreciation (depreciation) | (37,484) | |
| Net gain (loss) | (70,833) | |
| Net increase (decrease) in net assets resulting from operations | $430,502 |
See accompanying notes which are an integral part of the financial statements.
Statement of Changes in Net Assets
| Amounts in thousands | Year ended October 31, 2018 | Year ended October 31, 2017 |
| Increase (Decrease) in Net Assets | ||
| Operations | ||
| Net investment income (loss) | $501,335 | $408,150 |
| Net realized gain (loss) | (33,349) | 15,537 |
| Change in net unrealized appreciation (depreciation) | (37,484) | 41,407 |
| Net increase (decrease) in net assets resulting from operations | 430,502 | 465,094 |
| Distributions to shareholders | (504,172) | – |
| Distributions to shareholders from net investment income | – | (394,075) |
| Total distributions | (504,172) | (394,075) |
| Share transactions - net increase (decrease) | 1,985,763 | 1,322,261 |
| Redemption fees | 95 | 365 |
| Total increase (decrease) in net assets | 1,912,188 | 1,393,645 |
| Net Assets | ||
| Beginning of period | 10,732,221 | 9,338,576 |
| End of period | $12,644,409 | $10,732,221 |
| Other Information | ||
| Undistributed net investment income end of period | $32,709 |
See accompanying notes which are an integral part of the financial statements.
Financial Highlights
Fidelity Advisor Floating Rate High Income Fund Class A
| Years ended October 31, | 2018 | 2017 | 2016 | 2015 | 2014 |
| Selected Per–Share Data | |||||
| Net asset value, beginning of period | $9.67 | $9.60 | $9.42 | $9.85 | $9.99 |
| Income from Investment Operations | |||||
| Net investment income (loss)A | .398 | .360 | .334 | .375 | .317 |
| Net realized and unrealized gain (loss) | (.056) | .056 | .211 | (.425) | (.114) |
| Total from investment operations | .342 | .416 | .545 | (.050) | .203 |
| Distributions from net investment income | (.398) | (.346) | (.365) | (.341) | (.307) |
| Distributions from net realized gain | (.004) | – | – | (.040) | (.036) |
| Total distributions | (.402) | (.346) | (.365) | (.381) | (.343) |
| Redemption fees added to paid in capitalA | –B | –B | –B | .001 | –B |
| Net asset value, end of period | $9.61 | $9.67 | $9.60 | $9.42 | $9.85 |
| Total ReturnC,D | 3.60% | 4.40% | 5.98% | (.53)% | 2.05% |
| Ratios to Average Net AssetsE,F | |||||
| Expenses before reductions | .98% | .99% | .99% | .98% | .98% |
| Expenses net of fee waivers, if any | .98% | .98% | .99% | .98% | .98% |
| Expenses net of all reductions | .98% | .98% | .98% | .98% | .98% |
| Net investment income (loss) | 4.13% | 3.72% | 3.58% | 3.86% | 3.17% |
| Supplemental Data | |||||
| Net assets, end of period (in millions) | $598 | $585 | $707 | $863 | $1,185 |
| Portfolio turnover rateG | 47% | 68% | 46% | 26% | 54% |
A Calculated based on average shares outstanding during the period.
B Amount represents less than $.0005 per share.
C Total returns would have been lower if certain expenses had not been reduced during the applicable periods shown.
D Total returns do not include the effect of the sales charges.
E Fees and expenses of any underlying Fidelity Central Funds are not included in the Fund's expense ratio. The Fund indirectly bears its proportionate share of the expenses of any underlying Fidelity Central Funds.
F Expense ratios reflect operating expenses of the class. Expenses before reductions do not reflect amounts reimbursed by the investment adviser or reductions from brokerage service arrangements or reductions from other expense offset arrangements and do not represent the amount paid by the class during periods when reimbursements or reductions occur. Expenses net of fee waivers reflect expenses after reimbursement by the investment adviser but prior to reductions from brokerage service arrangements or other expense offset arrangements. Expenses net of all reductions represent the net expenses paid by the class.
G Amount does not include the portfolio activity of any underlying Fidelity Central Funds.
See accompanying notes which are an integral part of the financial statements.
Fidelity Advisor Floating Rate High Income Fund Class M
| Years ended October 31, | 2018 | 2017 | 2016 | 2015 | 2014 |
| Selected Per–Share Data | |||||
| Net asset value, beginning of period | $9.65 | $9.58 | $9.40 | $9.84 | $9.98 |
| Income from Investment Operations | |||||
| Net investment income (loss)A | .396 | .356 | .324 | .365 | .306 |
| Net realized and unrealized gain (loss) | (.055) | .057 | .212 | (.434) | (.112) |
| Total from investment operations | .341 | .413 | .536 | (.069) | .194 |
| Distributions from net investment income | (.397) | (.343) | (.356) | (.332) | (.298) |
| Distributions from net realized gain | (.004) | – | – | (.040) | (.036) |
| Total distributions | (.401) | (.343) | (.356) | (.372) | (.334) |
| Redemption fees added to paid in capitalA | –B | –B | –B | .001 | –B |
| Net asset value, end of period | $9.59 | $9.65 | $9.58 | $9.40 | $9.84 |
| Total ReturnC,D | 3.59% | 4.37% | 5.89% | (.72)% | 1.96% |
| Ratios to Average Net AssetsE,F | |||||
| Expenses before reductions | .99% | 1.01% | 1.08% | 1.07% | 1.07% |
| Expenses net of fee waivers, if any | .99% | 1.01% | 1.08% | 1.07% | 1.07% |
| Expenses net of all reductions | .99% | 1.01% | 1.08% | 1.07% | 1.07% |
| Net investment income (loss) | 4.11% | 3.69% | 3.48% | 3.77% | 3.08% |
| Supplemental Data | |||||
| Net assets, end of period (in millions) | $102 | $137 | $171 | $195 | $240 |
| Portfolio turnover rateG | 47% | 68% | 46% | 26% | 54% |
A Calculated based on average shares outstanding during the period.
B Amount represents less than $.0005 per share.
C Total returns would have been lower if certain expenses had not been reduced during the applicable periods shown.
D Total returns do not include the effect of the sales charges.
E Fees and expenses of any underlying Fidelity Central Funds are not included in the Fund's expense ratio. The Fund indirectly bears its proportionate share of the expenses of any underlying Fidelity Central Funds.
F Expense ratios reflect operating expenses of the class. Expenses before reductions do not reflect amounts reimbursed by the investment adviser or reductions from brokerage service arrangements or reductions from other expense offset arrangements and do not represent the amount paid by the class during periods when reimbursements or reductions occur. Expenses net of fee waivers reflect expenses after reimbursement by the investment adviser but prior to reductions from brokerage service arrangements or other expense offset arrangements. Expenses net of all reductions represent the net expenses paid by the class.
G Amount does not include the portfolio activity of any underlying Fidelity Central Funds.
See accompanying notes which are an integral part of the financial statements.
Fidelity Advisor Floating Rate High Income Fund Class C
| Years ended October 31, | 2018 | 2017 | 2016 | 2015 | 2014 |
| Selected Per–Share Data | |||||
| Net asset value, beginning of period | $9.67 | $9.59 | $9.41 | $9.85 | $9.99 |
| Income from Investment Operations | |||||
| Net investment income (loss)A | .325 | .286 | .263 | .301 | .241 |
| Net realized and unrealized gain (loss) | (.056) | .067 | .212 | (.434) | (.113) |
| Total from investment operations | .269 | .353 | .475 | (.133) | .128 |
| Distributions from net investment income | (.325) | (.273) | (.295) | (.268) | (.232) |
| Distributions from net realized gain | (.004) | – | – | (.040) | (.036) |
| Total distributions | (.329) | (.273) | (.295) | (.308) | (.268) |
| Redemption fees added to paid in capitalA | –B | –B | –B | .001 | –B |
| Net asset value, end of period | $9.61 | $9.67 | $9.59 | $9.41 | $9.85 |
| Total ReturnC,D | 2.83% | 3.73% | 5.19% | (1.38)% | 1.29% |
| Ratios to Average Net AssetsE,F | |||||
| Expenses before reductions | 1.73% | 1.74% | 1.74% | 1.73% | 1.73% |
| Expenses net of fee waivers, if any | 1.73% | 1.74% | 1.74% | 1.73% | 1.73% |
| Expenses net of all reductions | 1.73% | 1.74% | 1.74% | 1.73% | 1.73% |
| Net investment income (loss) | 3.36% | 2.96% | 2.82% | 3.10% | 2.41% |
| Supplemental Data | |||||
| Net assets, end of period (in millions) | $464 | $523 | $582 | $671 | $835 |
| Portfolio turnover rateG | 47% | 68% | 46% | 26% | 54% |
A Calculated based on average shares outstanding during the period.
B Amount represents less than $.0005 per share.
C Total returns would have been lower if certain expenses had not been reduced during the applicable periods shown.
D Total returns do not include the effect of the contingent deferred sales charge.
E Fees and expenses of any underlying Fidelity Central Funds are not included in the Fund's expense ratio. The Fund indirectly bears its proportionate share of the expenses of any underlying Fidelity Central Funds.
F Expense ratios reflect operating expenses of the class. Expenses before reductions do not reflect amounts reimbursed by the investment adviser or reductions from brokerage service arrangements or reductions from other expense offset arrangements and do not represent the amount paid by the class during periods when reimbursements or reductions occur. Expenses net of fee waivers reflect expenses after reimbursement by the investment adviser but prior to reductions from brokerage service arrangements or other expense offset arrangements. Expenses net of all reductions represent the net expenses paid by the class.
G Amount does not include the portfolio activity of any underlying Fidelity Central Funds.
See accompanying notes which are an integral part of the financial statements.
Fidelity Advisor Floating Rate High Income Fund
| Years ended October 31, | 2018 | 2017 | 2016 | 2015 | 2014 |
| Selected Per–Share Data | |||||
| Net asset value, beginning of period | $9.65 | $9.58 | $9.40 | $9.84 | $9.98 |
| Income from Investment Operations | |||||
| Net investment income (loss)A | .426 | .386 | .359 | .401 | .344 |
| Net realized and unrealized gain (loss) | (.046) | .057 | .212 | (.435) | (.113) |
| Total from investment operations | .380 | .443 | .571 | (.034) | .231 |
| Distributions from net investment income | (.426) | (.373) | (.391) | (.367) | (.335) |
| Distributions from net realized gain | (.004) | – | – | (.040) | (.036) |
| Total distributions | (.430) | (.373) | (.391) | (.407) | (.371) |
| Redemption fees added to paid in capitalA | –B | –B | –B | .001 | –B |
| Net asset value, end of period | $9.60 | $9.65 | $9.58 | $9.40 | $9.84 |
| Total ReturnC | 4.01% | 4.70% | 6.28% | (.36)% | 2.34% |
| Ratios to Average Net AssetsD,E | |||||
| Expenses before reductions | .69% | .70% | .71% | .70% | .69% |
| Expenses net of fee waivers, if any | .68% | .69% | .71% | .70% | .69% |
| Expenses net of all reductions | .68% | .69% | .71% | .70% | .69% |
| Net investment income (loss) | 4.44% | 4.01% | 3.86% | 4.14% | 3.45% |
| Supplemental Data | |||||
| Net assets, end of period (in millions) | $9,221 | $7,368 | $6,131 | $6,615 | $9,032 |
| Portfolio turnover rateF | 47% | 68% | 46% | 26% | 54% |
A Calculated based on average shares outstanding during the period.
B Amount represents less than $.0005 per share.
C Total returns would have been lower if certain expenses had not been reduced during the applicable periods shown.
D Fees and expenses of any underlying Fidelity Central Funds are not included in the Fund's expense ratio. The Fund indirectly bears its proportionate share of the expenses of any underlying Fidelity Central Funds.
E Expense ratios reflect operating expenses of the class. Expenses before reductions do not reflect amounts reimbursed by the investment adviser or reductions from brokerage service arrangements or reductions from other expense offset arrangements and do not represent the amount paid by the class during periods when reimbursements or reductions occur. Expenses net of fee waivers reflect expenses after reimbursement by the investment adviser but prior to reductions from brokerage service arrangements or other expense offset arrangements. Expenses net of all reductions represent the net expenses paid by the class.
F Amount does not include the portfolio activity of any underlying Fidelity Central Funds.
See accompanying notes which are an integral part of the financial statements.
Fidelity Advisor Floating Rate High Income Fund Class I
| Years ended October 31, | 2018 | 2017 | 2016 | 2015 | 2014 |
| Selected Per–Share Data | |||||
| Net asset value, beginning of period | $9.65 | $9.58 | $9.40 | $9.83 | $9.97 |
| Income from Investment Operations | |||||
| Net investment income (loss)A | .419 | .380 | .355 | .396 | .339 |
| Net realized and unrealized gain (loss) | (.056) | .058 | .211 | (.424) | (.113) |
| Total from investment operations | .363 | .438 | .566 | (.028) | .226 |
| Distributions from net investment income | (.419) | (.368) | (.386) | (.363) | (.330) |
| Distributions from net realized gain | (.004) | – | – | (.040) | (.036) |
| Total distributions | (.423) | (.368) | (.386) | (.403) | (.366) |
| Redemption fees added to paid in capitalA | –B | –B | –B | .001 | –B |
| Net asset value, end of period | $9.59 | $9.65 | $9.58 | $9.40 | $9.83 |
| Total ReturnC | 3.84% | 4.64% | 6.23% | (.30)% | 2.29% |
| Ratios to Average Net AssetsD,E | |||||
| Expenses before reductions | .75% | .75% | .75% | .74% | .74% |
| Expenses net of fee waivers, if any | .75% | .75% | .75% | .74% | .74% |
| Expenses net of all reductions | .75% | .75% | .75% | .74% | .74% |
| Net investment income (loss) | 4.36% | 3.95% | 3.81% | 4.10% | 3.40% |
| Supplemental Data | |||||
| Net assets, end of period (in millions) | $2,243 | $2,120 | $1,748 | $2,429 | $3,317 |
| Portfolio turnover rateF | 47% | 68% | 46% | 26% | 54% |
A Calculated based on average shares outstanding during the period.
B Amount represents less than $.0005 per share.
C Total returns would have been lower if certain expenses had not been reduced during the applicable periods shown.
D Fees and expenses of any underlying Fidelity Central Funds are not included in the Fund's expense ratio. The Fund indirectly bears its proportionate share of the expenses of any underlying Fidelity Central Funds.
E Expense ratios reflect operating expenses of the class. Expenses before reductions do not reflect amounts reimbursed by the investment adviser or reductions from brokerage service arrangements or reductions from other expense offset arrangements and do not represent the amount paid by the class during periods when reimbursements or reductions occur. Expenses net of fee waivers reflect expenses after reimbursement by the investment adviser but prior to reductions from brokerage service arrangements or other expense offset arrangements. Expenses net of all reductions represent the net expenses paid by the class.
F Amount does not include the portfolio activity of any underlying Fidelity Central Funds.
See accompanying notes which are an integral part of the financial statements.
Fidelity Advisor Floating Rate High Income Fund Class Z
| Year ended October 31, | 2018 A |
| Selected Per–Share Data | |
| Net asset value, beginning of period | $9.65 |
| Income from Investment Operations | |
| Net investment income (loss)B | .051 |
| Net realized and unrealized gain (loss) | (.076) |
| Total from investment operations | (.025) |
| Distributions from net investment income | (.035) |
| Distributions from net realized gain | – |
| Total distributions | (.035) |
| Net asset value, end of period | $9.59 |
| Total ReturnC,D | (.26)% |
| Ratios to Average Net AssetsE,F | |
| Expenses before reductions | .62%G |
| Expenses net of fee waivers, if any | .62%G |
| Expenses net of all reductions | .62%G |
| Net investment income (loss) | 7.64%G |
| Supplemental Data | |
| Net assets, end of period (in millions) | $16 |
| Portfolio turnover rateH | 47% |
A For the period October 2, 2018 (commencement of sale of shares) to October 31, 2018.
B Calculated based on average shares outstanding during the period.
C Total returns for periods of less than one year are not annualized.
D Total returns would have been lower if certain expenses had not been reduced during the applicable periods shown.
E Fees and expenses of any underlying Fidelity Central Funds are not included in the Fund's expense ratio. The Fund indirectly bears its proportionate share of the expenses of any underlying Fidelity Central Funds.
F Expense ratios reflect operating expenses of the class. Expenses before reductions do not reflect amounts reimbursed by the investment adviser or reductions from brokerage service arrangements or reductions from other expense offset arrangements and do not represent the amount paid by the class during periods when reimbursements or reductions occur. Expense ratios before reductions for start-up periods may not be representative of longer-term operating periods. Expenses net of fee waivers reflect expenses after reimbursement by the investment adviser but prior to reductions from brokerage service arrangements or other expense offset arrangements. Expenses net of all reductions represent the net expenses paid by the class.
G Annualized
H Amount does not include the portfolio activity of any underlying Fidelity Central Funds.
See accompanying notes which are an integral part of the financial statements.
Notes to Financial Statements
For the period ended October 31, 2018
(Amounts in thousands except percentages)
1. Organization.
Fidelity Advisor Floating Rate High Income Fund (the Fund) is a fund of Fidelity Advisor Series I (the Trust) and is authorized to issue an unlimited number of shares. The Trust is registered under the Investment Company Act of 1940, as amended (the 1940 Act), as an open-end management investment company organized as a Massachusetts business trust. The Fund commenced sale of Class Z shares on October 2, 2018. The Fund offers Class A, Class M, Class C, Fidelity Floating Rate High Income Fund, Class I and Class Z shares, each of which has equal rights as to assets and voting privileges. Each class has exclusive voting rights with respect to matters that affect that class.
2. Investments in Fidelity Central Funds.
The Fund invests in Fidelity Central Funds, which are open-end investment companies generally available only to other investment companies and accounts managed by the investment adviser and its affiliates. The Fund's Schedule of Investments lists each of the Fidelity Central Funds held as of period end, if any, as an investment of the Fund, but does not include the underlying holdings of each Fidelity Central Fund. As an Investing Fund, the Fund indirectly bears its proportionate share of the expenses of the underlying Fidelity Central Funds.
The Money Market Central Funds seek preservation of capital and current income and are managed by Fidelity Investments Money Management, Inc. (FIMM), an affiliate of the investment adviser. Annualized expenses of the Money Market Central Funds as of their most recent shareholder report date are less than .005%.
A complete unaudited list of holdings for each Fidelity Central Fund is available upon request or at the Securities and Exchange Commission (the SEC) website at www.sec.gov. In addition, the financial statements of the Fidelity Central Funds, which are not covered by the Fund's Report of Independent Registered Public Accounting Firm, are available on the SEC website or upon request.
3. Significant Accounting Policies.
The Fund is an investment company and applies the accounting and reporting guidance of the Financial Accounting Standards Board (FASB) Accounting Standards Codification Topic 946 Financial Services – Investments Companies. The financial statements have been prepared in conformity with accounting principles generally accepted in the United States of America (GAAP), which require management to make certain estimates and assumptions at the date of the financial statements. Actual results could differ from those estimates. Subsequent events, if any, through the date that the financial statements were issued have been evaluated in the preparation of the financial statements. The following summarizes the significant accounting policies of the Fund:
Investment Valuation. Investments are valued as of 4:00 p.m. Eastern time on the last calendar day of the period. The Board of Trustees (the Board) has delegated the day to day responsibility for the valuation of the Fund's investments to the Fair Value Committee (the Committee) established by the Fund's investment adviser. In accordance with valuation policies and procedures approved by the Board, the Fund attempts to obtain prices from one or more third party pricing vendors or brokers to value its investments. When current market prices, quotations or currency exchange rates are not readily available or reliable, investments will be fair valued in good faith by the Committee, in accordance with procedures adopted by the Board. Factors used in determining fair value vary by investment type and may include market or investment specific events, changes in interest rates and credit quality. The frequency with which these procedures are used cannot be predicted and they may be utilized to a significant extent. The Committee oversees the Fund's valuation policies and procedures and reports to the Board on the Committee's activities and fair value determinations. The Board monitors the appropriateness of the procedures used in valuing the Fund's investments and ratifies the fair value determinations of the Committee.
The Fund categorizes the inputs to valuation techniques used to value its investments into a disclosure hierarchy consisting of three levels as shown below:
- Level 1 – quoted prices in active markets for identical investments
- Level 2 – other significant observable inputs (including quoted prices for similar investments, interest rates, prepayment speeds, etc.)
- Level 3 – unobservable inputs (including the Fund's own assumptions based on the best information available)
Valuation techniques used to value the Fund's investments by major category are as follows:
Debt securities, including restricted securities, are valued based on evaluated prices received from third party pricing vendors or from brokers who make markets in such securities. Corporate bonds and bank loan obligations are valued by pricing vendors who utilize matrix pricing which considers yield or price of bonds of comparable quality, coupon, maturity and type or by broker-supplied prices. When independent prices are unavailable or unreliable, debt securities may be valued utilizing pricing methodologies which consider similar factors that would be used by third party pricing vendors. Debt securities are generally categorized as Level 2 in the hierarchy but may be Level 3 depending on the circumstances. The Fund invests a significant portion of its assets in below investment grade securities. The value of these securities can be more volatile due to changes in the credit quality of the issuer and is sensitive to changes in economic, market and regulatory conditions.
Equity securities, including restricted securities, for which market quotations are readily available, are valued at the last reported sale price or official closing price as reported by a third party pricing vendor on the primary market or exchange on which they are traded and are categorized as Level 1 in the hierarchy. In the event there were no sales during the day or closing prices are not available, securities are valued at the last quoted bid price or may be valued using the last available price and are generally categorized as Level 2 in the hierarchy. For foreign equity securities, when market or security specific events arise, comparisons to the valuation of American Depositary Receipts (ADRs), futures contracts, Exchange-Traded Funds (ETFs) and certain indexes as well as quoted prices for similar securities may be used and would be categorized as Level 2 in the hierarchy. Utilizing these techniques may result in transfers between Level 1 and Level 2. For equity securities, including restricted securities, where observable inputs are limited, assumptions about market activity and risk are used and these securities may be categorized as Level 3 in the hierarchy.
Investments in open-end mutual funds, including the Fidelity Central Funds, are valued at their closing net asset value (NAV) each business day and are categorized as Level 1 in the hierarchy.
Changes in valuation techniques may result in transfers in or out of an assigned level within the disclosure hierarchy. The aggregate value of investments by input level as of October 31, 2018 is included at the end of the Fund's Schedule of Investments.
Investment Transactions and Income. For financial reporting purposes, the Fund's investment holdings and NAV include trades executed through the end of the last business day of the period. The NAV per share for processing shareholder transactions is calculated as of the close of business of the New York Stock Exchange (NYSE), normally 4:00 p.m. Eastern time and includes trades executed through the end of the prior business day. Gains and losses on securities sold are determined on the basis of identified cost. Dividend income is recorded on the ex-dividend date, except for certain dividends from foreign securities where the ex-dividend date may have passed, which are recorded as soon as the Fund is informed of the ex-dividend date. Non-cash dividends included in dividend income, if any, are recorded at the fair market value of the securities received. Income and capital gain distributions from Fidelity Central Funds, if any, are recorded on the ex-dividend date. Certain distributions received by the Fund represent a return of capital or capital gain. The Fund determines the components of these distributions subsequent to the ex-dividend date, based upon receipt of tax filings or other correspondence relating to the underlying investment. These distributions are recorded as a reduction of cost of investments and/or as a realized gain. Interest income is accrued as earned and includes coupon interest and amortization of premium and accretion of discount on debt securities as applicable. Debt obligations may be placed on non-accrual status and related interest income may be reduced by ceasing current accruals and writing off interest receivables when the collection of all or a portion of interest has become doubtful based on consistently applied procedures. A debt obligation is removed from non-accrual status when the issuer resumes interest payments or when collectability of interest is reasonably assured. The Fund earns certain fees in connection with its floating rate loan purchasing activities. These fees are in addition to interest payments earned and may include amendment fees, consent fees and prepayment fees. These fees are recorded as Interest in the accompanying financial statements.
Class Allocations and Expenses. Investment income, realized and unrealized capital gains and losses, common expenses of the Fund, and certain fund-level expense reductions, if any, are allocated daily on a pro-rata basis to each class based on the relative net assets of each class to the total net assets of the Fund. Each class differs with respect to transfer agent and distribution and service plan fees incurred. Certain expense reductions may also differ by class. For the reporting period, the allocated portion of income and expenses to each class as a percent of its average net assets may vary due to the timing of recording these transactions in relation to fluctuating net assets of the classes. Expenses directly attributable to a fund are charged to that fund. Expenses attributable to more than one fund are allocated among the respective funds on the basis of relative net assets or other appropriate methods. Expense estimates are accrued in the period to which they relate and adjustments are made when actual amounts are known.
Deferred Trustee Compensation. Under a Deferred Compensation Plan (the Plan) for the Fund, certain independent Trustees have elected to defer receipt of a portion of their annual compensation. Deferred amounts are invested in a cross-section of Fidelity funds, are marked-to-market and remain in the Fund until distributed in accordance with the Plan. The investment of deferred amounts and the offsetting payable to the Trustees of $210 are included in the accompanying Statement of Assets and Liabilities in other receivables and other payables and accrued expenses, respectively.
Income Tax Information and Distributions to Shareholders. Each year, the Fund intends to qualify as a regulated investment company under Subchapter M of the Internal Revenue Code, including distributing substantially all of its taxable income and realized gains. As a result, no provision for U.S. Federal income taxes is required. As of October 31, 2018, the Fund did not have any unrecognized tax benefits in the financial statements; nor is the Fund aware of any tax positions for which it is reasonably possible that the total amounts of unrecognized tax benefits will significantly change in the next twelve months. The Fund files a U.S. federal tax return, in addition to state and local tax returns as required. The Fund's federal income tax returns are subject to examination by the Internal Revenue Service (IRS) for a period of three fiscal years after they are filed. State and local tax returns may be subject to examination for an additional fiscal year depending on the jurisdiction.
Distributions are declared and recorded daily and paid monthly from net investment income. Distributions from realized gains, if any, are declared and recorded on the ex-dividend date. Income and capital gain distributions are declared separately for each class. Income and capital gain distributions are determined in accordance with income tax regulations, which may differ from GAAP.
Capital accounts within the financial statements are adjusted for permanent book-tax differences. These adjustments have no impact on net assets or the results of operations. Capital accounts are not adjusted for temporary book-tax differences which will reverse in a subsequent period.
Book-tax differences are primarily due to market discount, deferred trustees compensation, capital loss carryforwards, defaulted bonds and losses deferred due to wash sales.
As of period end, the cost and unrealized appreciation (depreciation) in securities, and derivatives if applicable, for federal income tax purposes were as follows:
| Gross unrealized appreciation | $88,692 |
| Gross unrealized depreciation | (166,953) |
| Net unrealized appreciation (depreciation) | $(78,261) |
| Tax Cost | $13,133,368 |
The tax-based components of distributable earnings as of period end were as follows:
| Undistributed ordinary income | $13,817 |
| Capital loss carryforward | $(389,591) |
| Net unrealized appreciation (depreciation) on securities and other investments | $(78,262) |
Capital loss carryforwards are only available to offset future capital gains of the Fund to the extent provided by regulations and may be limited. Under the Regulated Investment Company Modernization Act of 2010 (the Act), the Fund is permitted to carry forward capital losses incurred in taxable years beginning after December 22, 2010 for an unlimited period and such capital losses are required to be used prior to any losses that expire. The capital loss carryforward information presented below, including any applicable limitation, is estimated as of fiscal period end and is subject to adjustment.
| No expiration | |
| Short-term | $(7,624) |
| Long-term | (381,967) |
| Total capital loss carryforward | $(389,591) |
The tax character of distributions paid was as follows:
| October 31, 2018 | October 31, 2017 | |
| Ordinary Income | $504,172 | $ 394,075 |
Short-Term Trading (Redemption) Fees. Shares held by investors in the Fund less than 60 days may have been subject to a redemption fee equal to 1.00% of the NAV of shares redeemed. All redemption fees, which reduce the proceeds of the shareholder redemption, are retained by the Fund and accounted for as an addition to paid in capital. In November 2017, the Board of Trustees approved the elimination of these redemption fees effective December 18, 2017.
Delayed Delivery Transactions and When-Issued Securities. During the period, the Fund transacted in securities on a delayed delivery or when-issued basis. Payment and delivery may take place after the customary settlement period for that security. The price of the underlying securities and the date when the securities will be delivered and paid for are fixed at the time the transaction is negotiated. The securities purchased on a delayed delivery or when-issued basis are identified as such in the Fund's Schedule of Investments.
Restricted Securities. The Fund may invest in securities that are subject to legal or contractual restrictions on resale. These securities generally may be resold in transactions exempt from registration or to the public if the securities are registered. Disposal of these securities may involve time-consuming negotiations and expense, and prompt sale at an acceptable price may be difficult. Information regarding restricted securities is included at the end of the Fund's Schedule of Investments.
Loans and Other Direct Debt Instruments. The Fund invests in direct debt instruments which are interests in amounts owed to lenders by corporate or other borrowers. These instruments may be in the form of loans, trade claims or other receivables and may include standby financing commitments such as revolving credit facilities that obligate the Fund to supply additional cash to the borrower on demand. Loans may be acquired through assignment or participation. The Fund did not have any unfunded loan commitments, which are contractual obligations for future funding, at period end.
New Accounting Pronouncement. In March 2017, the Financial Accounting Standards Board (FASB) issued an Accounting Standards Update (ASU), ASU 2017-08, which amends the amortization period for certain callable debt securities that are held at a premium. The amendment requires the premium to be amortized to the earliest call date. The amendments do not require an accounting change for securities held at a discount. The ASU is effective for annual periods beginning after December 15, 2018. Management is currently evaluating the potential impact of these changes to the financial statements.
New Rule Issuance. During August 2018, the U.S. Securities and Exchange Commission issued Final Rule Release No. 33-10532, Disclosure Update and Simplification. This Final Rule includes amendments specific to registered investment companies that are intended to eliminate overlap in disclosure requirements between Regulation S-X and GAAP. In accordance with these amendments, certain line-items in the Fund financial statements have been combined or removed for the current period as outlined in the table below.
| Financial Statement | Current Line-Item Presentation | Prior Line-Item Presentation |
| Statement of Assets and Liabilities | Total distributable earnings (loss) | Undistributed/Distributions in excess of/Accumulated net investment income (loss) Accumulated/Undistributed net realized gain (loss) Net unrealized appreciation (depreciation) |
| Statement of Changes in Net Assets | N/A - removed | Undistributed/Distributions in excess of/Accumulated net investment income (loss) end of period |
| Statement of Changes in Net Assets | Distributions to shareholders | Distributions to shareholders from net investment income Distributions to shareholders from net realized gain |
| Distributions to Shareholders Note to Financial Statements | Distributions to shareholders | Distributions to shareholders from net investment income Distributions to shareholders from net realized gain |
4. Purchase and Sales of Investments.
Purchases and sales of securities (including principal repayments of bank loan obligations, other than short-term securities, aggregated $6,954,749 and $5,099,430, respectively.
5. Fees and Other Transactions with Affiliates.
Management Fee. Fidelity Management & Research Company (the investment adviser) and its affiliates provide the Fund with investment management related services for which the Fund pays a monthly management fee. The management fee is the sum of an individual fund fee rate that is based on an annual rate of .45% of the Fund's average net assets and an annualized group fee rate that averaged .11% during the period. The group fee rate is based upon the average net assets of all the mutual funds advised by the investment adviser, including any mutual funds previously advised by the investment adviser that are currently advised by Fidelity SelectCo, LLC, an affiliate of the investment adviser. The group fee rate decreases as assets under management increase and increases as assets under management decrease. For the reporting period, the total annual management fee rate was .56% of the Fund's average net assets.
Distribution and Service Plan Fees. In accordance with Rule 12b-1 of the 1940 Act, the Fund has adopted separate Distribution and Service Plans for each class of shares. Certain classes pay Fidelity Distributors Corporation (FDC), an affiliate of the investment adviser, separate Distribution and Service Fees, each of which is based on an annual percentage of each class' average net assets. In addition, FDC may pay financial intermediaries for selling shares of the Fund and providing shareholder support services. For the period, the Distribution and Service Fee rates, total fees and amounts retained by FDC were as follows:
| Distribution Fee | Service Fee | Total Fees | Retained by FDC | |
| Class A | -% | .25% | $1,451 | $71 |
| Class M | -% | .25% | 252 | – |
| Class C | .75% | .25% | 4,861 | 215 |
| $6,564 | $286 |
Sales Load. FDC may receive a front-end sales charge of up to 2.75% for selling Class A shares and Class M shares, some of which is paid to financial intermediaries for selling shares of the Fund. Depending on the holding period, FDC may receive contingent deferred sales charges levied on Class A, Class M and Class C redemptions. The deferred sales charges are 1.00% for Class C shares, 1.00% or .50% for certain purchases of Class A shares and .25% for certain purchases of Class M shares.
For the period, sales charge amounts retained by FDC were as follows:
| Retained by FDC | |
| Class A | $41 |
| Class M | 5 |
| Class C(a) | 23 |
| $69 |
(a) When Class C shares are initially sold, FDC pays commissions from its own resources to financial intermediaries through which the sales are made.
Transfer Agent Fees. Fidelity Investments Institutional Operations Company, Inc., (FIIOC), an affiliate of the investment adviser, is the transfer, dividend disbursing and shareholder servicing agent for each class of the Fund. FIIOC receives account fees and asset-based fees that vary according to the account size and type of account of the shareholders of the respective classes of the Fund, except Class Z. FIIOC receives an asset-based fee of Class Z's average net assets. FIIOC pays for typesetting, printing and mailing of shareholder reports, except proxy statements.
For the period, transfer agent fees for each class were as follows:
| Amount | % of Class-Level Average Net Assets | |
| Class A | $891 | .15 |
| Class M | 162 | .16 |
| Class C | 757 | .16 |
| Fidelity Floating Rate High Income Fund | 8,930 | .11 |
| Class I | 3,797 | .17 |
| Class Z | –(a) | .04(b) |
| $14,537 |
(a) Amount less than $500.
(b) Annualized.
Accounting Fees. Fidelity Service Company, Inc. (FSC), an affiliate of the investment adviser, maintains the Fund's accounting records. The fee is based on the level of average net assets for each month. For the period, the fees were equivalent to an annual rate of .01%.
Brokerage Commissions. The Fund placed a portion of its portfolio transactions with brokerage firms which are affiliates of the investment adviser. Brokerage commissions are included in net realized gain (loss) and change in net unrealized appreciation (depreciation) in the Statement of Operations. The commissions paid to these affiliated firms were less than five hundred dollars for the period.
Interfund Trades. The Fund may purchase from or sell securities to other Fidelity Funds under procedures adopted by the Board. The procedures have been designed to ensure these interfund trades are executed in accordance with Rule 17a-7 of the 1940 Act. Interfund trades are included within the respective purchases and sales amounts shown in the Purchases and Sales of Investments note.
Other. During the period, the investment adviser reimbursed the Fund for certain losses in the amount of $20.
6. Committed Line of Credit.
The Fund participates with other funds managed by the investment adviser or an affiliate in a $4.25 billion credit facility (the "line of credit") to be utilized for temporary or emergency purposes to fund shareholder redemptions or for other short-term liquidity purposes. The Fund has agreed to pay commitment fees on its pro-rata portion of the line of credit, which amounted to $31 and is reflected in Miscellaneous expenses on the Statement of Operations. During the period, the Fund did not borrow on this line of credit.
7. Expense Reductions.
Through arrangements with the Fund's custodian, credits realized as a result of certain uninvested cash balances were used to reduce the Fund's expenses. During the period, these credits reduced the Fund's custody expenses by $104.
In addition, during the period the investment adviser reimbursed and/or waived a portion of fund-level operating expenses in the amount of $65.
8. Distributions to Shareholders.
Distributions to shareholders of each class were as follows:
| Year ended October 31, 2018(a) | Year ended October 31, 2017 | |
| Distributions to shareholders | ||
| Class A | $24,166 | $– |
| Class M | 4,187 | – |
| Class C | 16,600 | – |
| Fidelity Floating Rate High Income Fund | 363,480 | – |
| Class I | 95,721 | – |
| Class Z | 18 | – |
| Total | $504,172 | $– |
| From net investment income | ||
| Class A | $– | $23,794 |
| Class M | – | 5,475 |
| Class C | – | 16,016 |
| Fidelity Floating Rate High Income Fund | – | 271,385 |
| Class I | – | 77,405 |
| Total | $– | $394,075 |
(a) Distributions for Class Z are for the period October 2, 2018 (commencement of sale of shares) to October 31, 2018.
9. Share Transactions.
Share transactions for each class were as follows and may contain automatic conversions between classes or exchanges between affiliated funds:
| Shares | Shares | Dollars | Dollars | |
| Year ended October 31, 2018(a) | Year ended October 31, 2017 | Year ended October 31, 2018(a) | Year ended October 31, 2017 | |
| Class A | ||||
| Shares sold | 16,784 | 22,327 | $161,980 | $215,427 |
| Reinvestment of distributions | 2,361 | 2,289 | 22,764 | 22,112 |
| Shares redeemed | (17,404) | (37,818) | (167,909) | (365,948) |
| Net increase (decrease) | 1,741 | (13,202) | $16,835 | $(128,409) |
| Class M | ||||
| Shares sold | 2,489 | 1,925 | $23,981 | $18,561 |
| Reinvestment of distributions | 425 | 550 | 4,094 | 5,301 |
| Shares redeemed | (6,565) | (6,051) | (63,233) | (58,381) |
| Net increase (decrease) | (3,651) | (3,576) | $(35,158) | $(34,519) |
| Class C | ||||
| Shares sold | 7,549 | 7,187 | $72,826 | $69,348 |
| Reinvestment of distributions | 1,538 | 1,402 | 14,830 | 13,539 |
| Shares redeemed | (14,814) | (15,197) | (142,918) | (146,725) |
| Net increase (decrease) | (5,727) | (6,608) | $(55,262) | $(63,838) |
| Fidelity Floating Rate High Income Fund | ||||
| Shares sold | 375,175 | 256,065 | $3,615,070 | $2,468,886 |
| Reinvestment of distributions | 30,375 | 22,910 | 292,501 | 221,002 |
| Shares redeemed | (207,730) | (155,638) | (2,001,358) | (1,500,477) |
| Net increase (decrease) | 197,820 | 123,337 | $1,906,213 | $1,189,411 |
| Class I | ||||
| Shares sold | 74,989 | 102,139 | $722,001 | $985,030 |
| Reinvestment of distributions | 7,021 | 5,949 | 67,554 | 57,337 |
| Shares redeemed | (67,803) | (70,851) | (652,660) | (682,751) |
| Net increase (decrease) | 14,207 | 37,237 | $136,895 | $359,616 |
| Class Z | ||||
| Shares sold | 1,693 | – | $16,292 | $– |
| Reinvestment of distributions | 2 | – | 16 | – |
| Shares redeemed | (7) | – | (68) | – |
| Net increase (decrease) | 1,688 | – | $16,240 | $– |
(a) Share transactions for Class Z are for the period October 2, 2018 (commencement of sale of shares) to October 31, 2018.
10. Other.
The Fund's organizational documents provide former and current trustees and officers with a limited indemnification against liabilities arising in connection with the performance of their duties to the Fund. In the normal course of business, the Fund may also enter into contracts that provide general indemnifications. The Fund's maximum exposure under these arrangements is unknown as this would be dependent on future claims that may be made against the Fund. The risk of material loss from such claims is considered remote.
Report of Independent Registered Public Accounting Firm
To the Trustees of Fidelity Advisor Series I and Shareholders of Fidelity Advisor Floating Rate High Income Fund:
Opinion on the Financial Statements and Financial Highlights
We have audited the accompanying statement of assets and liabilities of Fidelity Advisor Floating Rate High Income Fund (the "Fund"), a fund of Fidelity Advisor Series I, including the schedule of investments, as of October 31, 2018, and the related statement of operations for the year then ended, the statement of changes in net assets for each of the two years in the period then ended, the financial highlights for each of the five years in the period then ended, and the related notes. In our opinion, the financial statements and financial highlights present fairly, in all material respects, the financial position of the Fund as of October 31, 2018, and the results of its operations for the year then ended, the changes in its net assets for each of the two years in the period then ended, and the financial highlights for each of the five years in the period then ended, in conformity with accounting principles generally accepted in the United States of America.
Basis for Opinion
These financial statements and financial highlights are the responsibility of the Fund's management. Our responsibility is to express an opinion on the Fund's financial statements and financial highlights based on our audits. We are a public accounting firm registered with the Public Company Accounting Oversight Board (United States) (PCAOB) and are required to be independent with respect to the Fund in accordance with the U.S. federal securities laws and the applicable rules and regulations of the Securities and Exchange Commission and the PCAOB.
We conducted our audits in accordance with the standards of the PCAOB. Those standards require that we plan and perform the audit to obtain reasonable assurance about whether the financial statements and financial highlights are free of material misstatement, whether due to error or fraud. The Fund is not required to have, nor were we engaged to perform, an audit of its internal control over financial reporting. As part of our audits we are required to obtain an understanding of internal control over financial reporting but not for the purpose of expressing an opinion on the effectiveness of the Fund’s internal control over financial reporting. Accordingly, we express no such opinion.
Our audits included performing procedures to assess the risks of material misstatement of the financial statements and financial highlights, whether due to error or fraud, and performing procedures that respond to those risks. Such procedures included examining, on a test basis, evidence regarding the amounts and disclosures in the financial statements and financial highlights. Our audits also included evaluating the accounting principles used and significant estimates made by management, as well as evaluating the overall presentation of the financial statements and financial highlights. Our procedures included confirmation of securities owned as of October 31, 2018, by correspondence with the custodians and brokers; when replies were not received from brokers, we performed other auditing procedures. We believe that our audits provide a reasonable basis for our opinion.
/s/ Deloitte & Touche LLP
Boston, Massachusetts
December 14, 2018
We have served as the auditor of one or more of the Fidelity investment companies since 1999.
Trustees and Officers
The Trustees, Members of the Advisory Board (if any), and officers of the trust and fund, as applicable, are listed below. The Board of Trustees governs the fund and is responsible for protecting the interests of shareholders. The Trustees are experienced executives who meet periodically throughout the year to oversee the fund's activities, review contractual arrangements with companies that provide services to the fund, oversee management of the risks associated with such activities and contractual arrangements, and review the fund's performance. Except for Michael E. Wiley, each of the Trustees oversees 283 funds. Mr. Wiley oversees 193 funds.
The Trustees hold office without limit in time except that (a) any Trustee may resign; (b) any Trustee may be removed by written instrument, signed by at least two-thirds of the number of Trustees prior to such removal; (c) any Trustee who requests to be retired or who has become incapacitated by illness or injury may be retired by written instrument signed by a majority of the other Trustees; and (d) any Trustee may be removed at any special meeting of shareholders by a two-thirds vote of the outstanding voting securities of the trust. Each Trustee who is not an interested person (as defined in the 1940 Act) of the trust and the fund is referred to herein as an Independent Trustee. Each Independent Trustee shall retire not later than the last day of the calendar year in which his or her 75th birthday occurs. The Independent Trustees may waive this mandatory retirement age policy with respect to individual Trustees. Officers and Advisory Board Members hold office without limit in time, except that any officer or Advisory Board Member may resign or may be removed by a vote of a majority of the Trustees at any regular meeting or any special meeting of the Trustees. Except as indicated, each individual has held the office shown or other offices in the same company for the past five years.
The fund’s Statement of Additional Information (SAI) includes more information about the Trustees. To request a free copy, call Fidelity at 1-800-544-8544.
Experience, Skills, Attributes, and Qualifications of the Trustees. The Governance and Nominating Committee has adopted a statement of policy that describes the experience, qualifications, attributes, and skills that are necessary and desirable for potential Independent Trustee candidates (Statement of Policy). The Board believes that each Trustee satisfied at the time he or she was initially elected or appointed a Trustee, and continues to satisfy, the standards contemplated by the Statement of Policy. The Governance and Nominating Committee also engages professional search firms to help identify potential Independent Trustee candidates who have the experience, qualifications, attributes, and skills consistent with the Statement of Policy. From time to time, additional criteria based on the composition and skills of the current Independent Trustees, as well as experience or skills that may be appropriate in light of future changes to board composition, business conditions, and regulatory or other developments, have also been considered by the professional search firms and the Governance and Nominating Committee. In addition, the Board takes into account the Trustees' commitment and participation in Board and committee meetings, as well as their leadership of standing and ad hoc committees throughout their tenure.
In determining that a particular Trustee was and continues to be qualified to serve as a Trustee, the Board has considered a variety of criteria, none of which, in isolation, was controlling. The Board believes that, collectively, the Trustees have balanced and diverse experience, qualifications, attributes, and skills, which allow the Board to operate effectively in governing the fund and protecting the interests of shareholders. Information about the specific experience, skills, attributes, and qualifications of each Trustee, which in each case led to the Board's conclusion that the Trustee should serve (or continue to serve) as a trustee of the fund, is provided below.
Board Structure and Oversight Function. James C. Curvey is an interested person and currently serves as Chairman. The Trustees have determined that an interested Chairman is appropriate and benefits shareholders because an interested Chairman has a personal and professional stake in the quality and continuity of services provided to the fund. Independent Trustees exercise their informed business judgment to appoint an individual of their choosing to serve as Chairman, regardless of whether the Trustee happens to be independent or a member of management. The Independent Trustees have determined that they can act independently and effectively without having an Independent Trustee serve as Chairman and that a key structural component for assuring that they are in a position to do so is for the Independent Trustees to constitute a substantial majority for the Board. The Independent Trustees also regularly meet in executive session. Ned C. Lautenbach serves as Chairman of the Independent Trustees and as such (i) acts as a liaison between the Independent Trustees and management with respect to matters important to the Independent Trustees and (ii) with management prepares agendas for Board meetings.
Fidelity® funds are overseen by different Boards of Trustees. The fund's Board oversees Fidelity's high income and certain equity funds, and other Boards oversee Fidelity's investment-grade bond, money market, asset allocation, and other equity funds. The asset allocation funds may invest in Fidelity® funds overseen by the fund's Board. The use of separate Boards, each with its own committee structure, allows the Trustees of each group of Fidelity® funds to focus on the unique issues of the funds they oversee, including common research, investment, and operational issues. On occasion, the separate Boards establish joint committees to address issues of overlapping consequences for the Fidelity® funds overseen by each Board.
The Trustees operate using a system of committees to facilitate the timely and efficient consideration of all matters of importance to the Trustees, the fund, and fund shareholders and to facilitate compliance with legal and regulatory requirements and oversight of the fund's activities and associated risks. The Board, acting through its committees, has charged FMR and its affiliates with (i) identifying events or circumstances the occurrence of which could have demonstrably adverse effects on the fund's business and/or reputation; (ii) implementing processes and controls to lessen the possibility that such events or circumstances occur or to mitigate the effects of such events or circumstances if they do occur; and (iii) creating and maintaining a system designed to evaluate continuously business and market conditions in order to facilitate the identification and implementation processes described in (i) and (ii) above. Because the day-to-day operations and activities of the fund are carried out by or through FMR, its affiliates, and other service providers, the fund's exposure to risks is mitigated but not eliminated by the processes overseen by the Trustees. While each of the Board's committees has responsibility for overseeing different aspects of the fund's activities, oversight is exercised primarily through the Operations, Audit, and Compliance Committees. In addition, the Independent Trustees have worked with Fidelity to enhance the Board's oversight of investment and financial risks, legal and regulatory risks, technology risks, and operational risks, including the development of additional risk reporting to the Board. Appropriate personnel, including but not limited to the fund's Chief Compliance Officer (CCO), FMR's internal auditor, the independent accountants, the fund's Treasurer and portfolio management personnel, make periodic reports to the Board's committees, as appropriate, including an annual review of Fidelity's risk management program for the Fidelity® funds. The responsibilities of each standing committee, including their oversight responsibilities, are described further under "Standing Committees of the Trustees."
Interested Trustees*:
Correspondence intended for a Trustee who is an interested person may be sent to Fidelity Investments, 245 Summer Street, Boston, Massachusetts 02210.
Name, Year of Birth; Principal Occupations and Other Relevant Experience+
James C. Curvey (1935)
Year of Election or Appointment: 2007
Trustee
Chairman of the Board of Trustees
Mr. Curvey also serves as Trustee of other Fidelity® funds. Mr. Curvey is Vice Chairman (2007-present) and Director of FMR LLC (diversified financial services company). In addition, Mr. Curvey is an Overseer Emeritus for the Boston Symphony Orchestra, a Director of Artis-Naples, and a Trustee of Brewster Academy in Wolfeboro, New Hampshire. Previously, Mr. Curvey served as a Director of Fidelity Research & Analysis Co. (investment adviser firm, 2009-2018), Director of Fidelity Investments Money Management, Inc. (investment adviser firm, 2009-2014) and a Director of FMR and FMR Co., Inc. (investment adviser firms, 2007-2014).
Charles S. Morrison (1960)
Year of Election or Appointment: 2014
Trustee
Mr. Morrison also serves as Trustee of other funds. He serves as President of Fidelity SelectCo, LLC (investment adviser firm, 2017-present) and Fidelity Management & Research Company (FMR) (investment adviser firm, 2016-present), a Director of Fidelity Investments Money Management, Inc. (FIMM) (investment adviser firm, 2014-present), Director of Fidelity SelectCo, LLC (investment adviser firm, 2014-present), President, Asset Management (2014-present), and is an employee of Fidelity Investments. Previously, Mr. Morrison served as Vice President of Fidelity's Fixed Income and Asset Allocation Funds (2012-2014), President, Fixed Income (2011-2014), Vice President of Fidelity's Money Market Funds (2005-2009), President, Money Market Group Leader of FMR (investment adviser firm, 2009), and Senior Vice President, Money Market Group of FMR (2004-2009). Mr. Morrison also served as Vice President of Fidelity's Bond Funds (2002-2005), certain Balanced Funds (2002-2005), and certain Asset Allocation Funds (2002-2007), and as Senior Vice President (2002-2005) of Fidelity's Bond Division.
* Determined to be an “Interested Trustee” by virtue of, among other things, his or her affiliation with the trust or various entities under common control with FMR.
+ The information includes the Trustee's principal occupation during the last five years and other information relating to the experience, attributes, and skills relevant to the Trustee's qualifications to serve as a Trustee, which led to the conclusion that the Trustee should serve as a Trustee for the fund.
Independent Trustees:
Correspondence intended for an Independent Trustee may be sent to Fidelity Investments, P.O. Box 55235, Boston, Massachusetts 02205-5235.
Name, Year of Birth; Principal Occupations and Other Relevant Experience+
Dennis J. Dirks (1948)
Year of Election or Appointment: 2005
Trustee
Mr. Dirks also serves as Trustee of other Fidelity® funds. Prior to his retirement in May 2003, Mr. Dirks was Chief Operating Officer and a member of the Board of The Depository Trust & Clearing Corporation (DTCC). He also served as President, Chief Operating Officer, and Board member of The Depository Trust Company (DTC) and President and Board member of the National Securities Clearing Corporation (NSCC). In addition, Mr. Dirks served as Chief Executive Officer and Board member of the Government Securities Clearing Corporation, Chief Executive Officer and Board member of the Mortgage-Backed Securities Clearing Corporation, as a Trustee and a member of the Finance Committee of Manhattan College (2005-2008), as a Trustee and a member of the Finance Committee of AHRC of Nassau County (2006-2008), as a member of the Independent Directors Council (IDC) Governing Council (2010-2015), and as a member of the Board of Directors for The Brookville Center for Children’s Services, Inc. (2009-2017). Mr. Dirks is a member of the Finance Committee (2016-present), Board of Directors (2017-present) and Board of Trustees (2018-present) and is Treasurer (2018-present) of the Asolo Repertory Theatre.
Donald F. Donahue (1950)
Year of Election or Appointment: 2018
Trustee
Mr. Donahue also serves as a Trustee of other Fidelity® funds. Mr. Donahue is President and Chief Executive Officer of Miranda Partners, LLC (risk consulting for the financial services industry, 2012-present). Previously, Mr. Donahue served as a Member of the Advisory Board of certain Fidelity® funds (2015-2018) and Chief Executive Officer (2006-2012), Chief Operating Officer (2003-2006), and Managing Director, Customer Marketing and Development (1999-2003) of The Depository Trust & Clearing Corporation (financial markets infrastructure). Mr. Donahue serves as a Member (2007-present) and Co-Chairman (2016-present) of the Board of Directors of United Way of New York, Member of the Board of Directors of NYC Leadership Academy (2012-present) and Member of the Board of Advisors of Ripple Labs, Inc. (financial services, 2015-present). He also served as Chairman (2010-2012) and Member of the Board of Directors (2012-2013) of Omgeo, LLC (financial services), Treasurer of United Way of New York (2012-2016), and Member of the Board of Directors of XBRL US (financial services non-profit, 2009-2012) and the International Securities Services Association (2009-2012).
Alan J. Lacy (1953)
Year of Election or Appointment: 2008
Trustee
Mr. Lacy also serves as Trustee of other Fidelity® funds. Mr. Lacy serves as a Director of Bristol-Myers Squibb Company (global pharmaceuticals, 2008-present). He is a Trustee of the California Chapter of The Nature Conservancy (2015-present) and a Director of the Center for Advanced Study in the Behavioral Sciences at Stanford University (2015-present). In addition, Mr. Lacy served as Senior Adviser (2007-2014) of Oak Hill Capital Partners, L.P. (private equity) and also served as Chief Executive Officer (2005) and Vice Chairman (2005-2006) of Sears Holdings Corporation (retail) and Chief Executive Officer and Chairman of the Board of Sears, Roebuck and Co. (retail, 2000-2005). Previously, Mr. Lacy served as Chairman (2014-2017) and a member (2010-2017) of the Board of Directors of Dave & Buster’s Entertainment, Inc. (restaurant and entertainment complexes), as Chairman (2008-2011) and a member (2006-2015) of the Board of Trustees of the National Parks Conservation Association, and as a member of the Board of Directors for The Hillman Companies, Inc. (hardware wholesalers, 2010-2014), Earth Fare, Inc. (retail grocery, 2010-2014), and The Western Union Company (global money transfer, 2006-2011).
Ned C. Lautenbach (1944)
Year of Election or Appointment: 2000
Trustee
Chairman of the Independent Trustees
Mr. Lautenbach also serves as Trustee of other Fidelity® funds. Mr. Lautenbach currently serves as Vice Chair of the Board of Governors, State University System of Florida (2013-present) and is a member of the Council on Foreign Relations (1994-present). He is also a member and has most recently served as Chairman of the Board of Directors of Artis-Naples (2012-present). Previously, Mr. Lautenbach served as a member and then Lead Director of the Board of Directors of Eaton Corporation (diversified industrial, 1997-2016). He was also a Partner and Advisory Partner at Clayton, Dubilier & Rice, LLC (private equity investment, 1998-2010), as well as a Director of Sony Corporation (2006-2007). In addition, Mr. Lautenbach also had a 30-year career with IBM (technology company) during which time he served as Senior Vice President and a member of the Corporate Executive Committee (1968-1998).
Joseph Mauriello (1944)
Year of Election or Appointment: 2008
Trustee
Mr. Mauriello also serves as Trustee of other Fidelity® funds. Prior to his retirement in January 2006, Mr. Mauriello served in numerous senior management positions including Deputy Chairman and Chief Operating Officer (2004-2005), and Vice Chairman of Financial Services (2002-2004) of KPMG LLP US (professional services, 1965-2005). Mr. Mauriello currently serves as a member of the Independent Directors Council (IDC) Governing Council (2015-present). Previously, Mr. Mauriello served as a member of the Board of Directors of XL Group plc. (global insurance and re-insurance, 2006-2018).
Cornelia M. Small (1944)
Year of Election or Appointment: 2005
Trustee
Ms. Small also serves as Trustee of other Fidelity® funds. Ms. Small is a member of the Board of Directors (2009-present) and Chair of the Investment Committee (2010-present) of the Teagle Foundation. Ms. Small also serves on the Investment Committee of the Berkshire Taconic Community Foundation (2008-present). Previously, Ms. Small served as Chairperson (2002-2008) and a member of the Investment Committee and Chairperson (2008-2012) and a member of the Board of Trustees of Smith College. In addition, Ms. Small served as Chief Investment Officer, Director of Global Equity Investments, and a member of the Board of Directors of Scudder, Stevens & Clark and Scudder Kemper Investments.
Garnett A. Smith (1947)
Year of Election or Appointment: 2018
Trustee
Mr. Smith also serves as Trustee of other Fidelity® funds. Prior to Mr. Smith's retirement, he served as Chairman and Chief Executive Officer of Inbrand Corp. (manufacturer of personal absorbent products, 1990-1997). He also served as President (1986-1990) of Inbrand Corp. Prior to his employment with Inbrand Corp., he was employed by a retail fabric chain and North Carolina National Bank. In addition, Mr. Smith served as a Member of the Advisory Board of certain Fidelity® funds (2012-2013) and as a board member of the Jackson Hole Land Trust (2009-2012).
David M. Thomas (1949)
Year of Election or Appointment: 2008
Trustee
Mr. Thomas also serves as Trustee of other Fidelity® funds. Mr. Thomas serves as Non-Executive Chairman of the Board of Directors of Fortune Brands Home and Security (home and security products, 2011-present), as a member of the Board of Directors (2004-present) and Presiding Director (2013-present) of Interpublic Group of Companies, Inc. (marketing communication), and as a member of the Board of Trustees of the University of Florida (2013-present). Previously, Mr. Thomas served as Executive Chairman (2005-2006) and Chairman and Chief Executive Officer (2000-2005) of IMS Health, Inc. (pharmaceutical and healthcare information solutions), and a Director of Fortune Brands, Inc. (consumer products, 2000-2011).
Michael E. Wiley (1950)
Year of Election or Appointment: 2018
Trustee
Mr. Wiley also serves as Trustee or Member of the Advisory Board of other Fidelity® funds. Mr. Wiley serves as a Director of High Point Resources (exploration and production, 2005-present). Previously, Mr. Wiley served as a Director of Andeavor Corporation (independent oil refiner and marketer, 2005-2018), a Director of Andeavor Logistics LP (natural resources logistics, 2015-2018), a Director of Post Oak Bank (privately-held bank, 2004-2018), a Director of Asia Pacific Exploration Consolidated (international oil and gas exploration and production, 2008-2013), a member of the Board of Trustees of the University of Tulsa (2000-2006; 2007-2010), a Senior Energy Advisor of Katzenbach Partners, LLC (consulting, 2006-2007), an Advisory Director of Riverstone Holdings (private investment), a Director of Spinnaker Exploration Company (exploration and production, 2001-2005) and Chairman, President, and CEO of Baker Hughes, Inc. (oilfield services, 2000-2004).
+ The information includes the Trustee's principal occupation during the last five years and other information relating to the experience, attributes, and skills relevant to the Trustee's qualifications to serve as a Trustee, which led to the conclusion that the Trustee should serve as a Trustee for the fund.
Advisory Board Members and Officers:
Correspondence intended for a Member of the Advisory Board (if any) may be sent to Fidelity Investments, P.O. Box 55235, Boston, Massachusetts 02205-5235. Correspondence intended for an officer or Peter S. Lynch may be sent to Fidelity Investments, 245 Summer Street, Boston, Massachusetts 02210. Officers appear below in alphabetical order.
Name, Year of Birth; Principal Occupation
Vicki L. Fuller (1957)
Year of Election or Appointment: 2018
Member of the Advisory Board
Ms. Fuller also serves as Member of the Advisory Board of other Fidelity® funds. Ms. Fuller serves as a member of the Board of Directors, Audit Committee, and Nominating and Governance Committee of The Williams Companies, Inc. (natural gas infrastructure, 2018-present). Previously, Ms. Fuller served as the Chief Investment Officer of the New York State Common Retirement Fund (2012-2018) and held a variety of positions at AllianceBernstein L.P. (global asset management, 1985-2012), including Managing Director (2006-2012) and Senior Vice President and Senior Portfolio Manager (2001-2006).
Peter S. Lynch (1944)
Year of Election or Appointment: 2003
Member of the Advisory Board
Mr. Lynch also serves as Member of the Advisory Board of other Fidelity® funds. Mr. Lynch is Vice Chairman and a Director of FMR (investment adviser firm) and FMR Co., Inc. (investment adviser firm). In addition, Mr. Lynch serves as a Trustee of Boston College and as the Chairman of the Inner-City Scholarship Fund. Previously, Mr. Lynch served on the Special Olympics International Board of Directors (1997-2006).
William S. Stavropoulos (1939)
Year of Election or Appointment: 2018
Member of the Advisory Board
Mr. Stavropoulos also serves as Member of the Advisory Board of other Fidelity® funds. Mr. Stavropoulos serves as President and Founder of the Michigan Baseball Foundation, the Great Lakes Loons (2007-present). Mr. Stavropoulos is Chairman Emeritus of the Board of Directors of The Dow Chemical Company, where he previously served in numerous senior management positions, including President, CEO (1995-2000; 2002-2004), Chairman of the Executive Committee (2000-2006), and as a member of the Board of Directors (1990-2006). Currently, Mr. Stavropoulos is Chairman of the Board of Directors of Univar Inc. (global distributor of commodity and specialty chemicals), a Director of Teradata Corporation (data warehousing and technology solutions), and a member of the Advisory Board for Metalmark Capital LLC (private equity investment, 2005-present). Mr. Stavropoulos is an operating advisor to Clayton, Dubilier & Rice, LLC (private equity investment). In addition, Mr. Stavropoulos is a member of the University of Notre Dame Advisory Council for the College of Science, a Trustee of the Rollin L. Gerstacker Foundation, and a Director of Artis-Naples in Naples, Florida. Previously, Mr. Stavropoulos served as Trustee of certain Fidelity® funds (2001-2018) and as a Director of Chemical Financial Corporation (bank holding company, 1993-2012) and Tyco International, Ltd. (multinational manufacturing and services, 2007-2012).
Carol B. Tomé (1957)
Year of Election or Appointment: 2018
Member of the Advisory Board
Ms. Tomé also serves as Member of the Advisory Board of other Fidelity® funds. Ms. Tomé is Chief Financial Officer (2001-present) and Executive Vice President of Corporate Services (2007-present) of The Home Depot, Inc. (home improvement retailer) and a Director (2003-present) and Chair of the Audit Committee (2004-present) of United Parcel Service, Inc. (package delivery and supply chain management). Previously, Ms. Tomé served as Trustee of certain Fidelity® funds (2017), Senior Vice President of Finance and Accounting/Treasurer (2000-2007) and Vice President and Treasurer (1995-2000) of The Home Depot, Inc. and Chair of the Board (2010-2012), Vice Chair of the Board (2009 and 2013), and a Director (2008-2013) of the Federal Reserve Bank of Atlanta. Ms. Tomé is also a director or trustee of many community and professional organizations.
Elizabeth Paige Baumann (1968)
Year of Election or Appointment: 2017
Anti-Money Laundering (AML) Officer
Ms. Baumann also serves as AML Officer of other funds. She is Chief AML Officer (2012-present) and Senior Vice President (2014-present) of FMR LLC (diversified financial services company) and is an employee of Fidelity Investments. Previously, Ms. Baumann served as AML Officer of the funds (2012-2016), and Vice President (2007-2014) and Deputy Anti-Money Laundering Officer (2007-2012) of FMR LLC.
John J. Burke III (1964)
Year of Election or Appointment: 2018
Chief Financial Officer
Mr. Burke also serves as Chief Financial Officer of other funds. Mr. Burke serves as Head of Investment Operations for Fidelity Fund and Investment Operations (2018-present) and is an employee of Fidelity Investments (1998-present). Previously Mr. Burke served as head of Asset Management Investment Operations (2012-2018).
William C. Coffey (1969)
Year of Election or Appointment: 2018
Secretary and Chief Legal Officer (CLO)
Mr. Coffey also serves as Secretary and CLO of other funds. Mr. Coffey serves as CLO, Secretary, and Senior Vice President of Fidelity Management & Research Company and FMR Co., Inc. (investment adviser firms, 2018-present); Secretary of Fidelity SelectCo, LLC and Fidelity Investments Money Management, Inc. (investment adviser firms, 2018-present); and CLO of Fidelity Management & Research (Hong Kong) Limited, FMR Investment Management (UK) Limited, and Fidelity Management & Research (Japan) Limited (investment adviser firms, 2018-present). He is Senior Vice President and Deputy General Counsel of FMR LLC (diversified financial services company, 2010-present), and is an employee of Fidelity Investments. Previously, Mr. Coffey served as Assistant Secretary of certain funds (2009-2018) and as Vice President and Associate General Counsel of FMR LLC (2005-2009).
Timothy M. Cohen (1969)
Year of Election or Appointment: 2018
Vice President
Mr. Cohen also serves as Vice President of other funds. Mr. Cohen serves as Co-Head of Global Equity Research (2016-present), a Director of Fidelity Management & Research (Japan) Limited (investment adviser firm, 2016-present), and is an employee of Fidelity Investments. Previously, Mr. Cohen served as Chief Investment Officer - Equity and a Director of Fidelity Management & Research (U.K.) Inc. (investment adviser firm, 2013-2015) and as a Director of Fidelity Management & Research (Hong Kong) Limited (investment adviser firm, 2017).
Jonathan Davis (1968)
Year of Election or Appointment: 2010
Assistant Treasurer
Mr. Davis also serves as Assistant Treasurer of other funds. Mr. Davis serves as Assistant Treasurer of FMR Capital, Inc. (2017-present) and is an employee of Fidelity Investments. Previously, Mr. Davis served as Vice President and Associate General Counsel of FMR LLC (diversified financial services company, 2003-2010).
Adrien E. Deberghes (1967)
Year of Election or Appointment: 2016
Assistant Treasurer
Mr. Deberghes also serves as an officer of other funds. He serves as Assistant Treasurer of FMR Capital, Inc. (2017-present), Executive Vice President of Fidelity Investments Money Management, Inc. (FIMM) (investment adviser firm, 2016-present), and is an employee of Fidelity Investments (2008-present). Previously, Mr. Deberghes served as President and Treasurer of certain Fidelity® funds (2013-2018). Prior to joining Fidelity Investments, Mr. Deberghes was Senior Vice President of Mutual Fund Administration at State Street Corporation (2007-2008), Senior Director of Mutual Fund Administration at Investors Bank & Trust (2005-2007), and Director of Finance for Dunkin' Brands (2000-2005). Previously, Mr. Deberghes served in other fund officer roles.
Laura M. Del Prato (1964)
Year of Election or Appointment: 2018
Assistant Treasurer
Ms. Del Prato also serves as an officer of other funds. Ms. Del Prato is an employee of Fidelity Investments (2017-present). Prior to joining Fidelity Investments, Ms. Del Prato served as a Managing Director and Treasurer of the JPMorgan Mutual Funds (2014-2017). Prior to JPMorgan, Ms. Del Prato served as a partner at Cohen Fund Audit Services (accounting firm, 2012-2013) and KPMG LLP (accounting firm, 2004-2012).
Colm A. Hogan (1973)
Year of Election or Appointment: 2016
Deputy Treasurer
Mr. Hogan also serves as an officer of other funds. Mr. Hogan serves as Assistant Treasurer of FMR Capital, Inc. (2017-present) and is an employee of Fidelity Investments (2005-present). Previously, Mr. Hogan served as Assistant Treasurer of certain Fidelity® funds (2016-2018).
Pamela R. Holding (1964)
Year of Election or Appointment: 2018
Vice President
Ms. Holding also serves as Vice President of other funds. Ms. Holding serves as Co-Head of Global Equity Research (2018-present) and is an employee of Fidelity Investments (2013-present).
Chris Maher (1972)
Year of Election or Appointment: 2013
Assistant Treasurer
Mr. Maher serves as Assistant Treasurer of other funds. Mr. Maher is Vice President of Valuation Oversight, serves as Assistant Treasurer of FMR Capital, Inc. (2017-present), and is an employee of Fidelity Investments. Previously, Mr. Maher served as Vice President of Asset Management Compliance (2013), Vice President of the Program Management Group of FMR (investment adviser firm, 2010-2013), and Vice President of Valuation Oversight (2008-2010).
Rieco E. Mello (1969)
Year of Election or Appointment: 2017
Assistant Treasurer
Mr. Mello also serves as Assistant Treasurer of other funds. Mr. Mello serves as Assistant Treasurer of FMR Capital, Inc. (2017-present) and is an employee of Fidelity Investments (1995-present).
Kenneth B. Robins (1969)
Year of Election or Appointment: 2016
Chief Compliance Officer
Mr. Robins also serves as an officer of other funds. Mr. Robins serves as Compliance Officer of Fidelity Management & Research Company and FMR Co., Inc. (investment adviser firms, 2016-present) and is an employee of Fidelity Investments (2004-present). Previously, Mr. Robins served as Executive Vice President of Fidelity Investments Money Management, Inc. (investment adviser firm, 2013-2016) and served in other fund officer roles.
Stacie M. Smith (1974)
Year of Election or Appointment: 2016
President and Treasurer
Ms. Smith also serves as an officer of other funds. Ms. Smith serves as Assistant Treasurer of FMR Capital, Inc. (2017-present), is an employee of Fidelity Investments (2009-present), and has served in other fund officer roles. Prior to joining Fidelity Investments, Ms. Smith served as Senior Audit Manager of Ernst & Young LLP (accounting firm, 1996-2009). Previously, Ms. Smith served as Assistant Treasurer (2013-2018) and Deputy Treasurer (2013-2016) of certain Fidelity® funds.
Marc L. Spector (1972)
Year of Election or Appointment: 2016
Assistant Treasurer
Mr. Spector also serves as an officer of other funds. Mr. Spector serves as Assistant Treasurer of FMR Capital, Inc. (2017-present) and is an employee of Fidelity Investments (2016-present). Prior to joining Fidelity Investments, Mr. Spector served as Director at the Siegfried Group (accounting firm, 2013-2016), and prior to Siegfried Group as audit senior manager at Deloitte & Touche (accounting firm, 2005-2013).
Shareholder Expense Example
As a shareholder of the Fund, you incur two types of costs: (1) transaction costs, including sales charges (loads) on purchase payments or redemption proceeds, redemption fees and (2) ongoing costs, including management fees, distribution and/or service (12b-1) fees and other Fund expenses. This Example is intended to help you understand your ongoing costs (in dollars) of investing in the Fund and to compare these costs with the ongoing costs of investing in other mutual funds.
The actual expense Example is based on an investment of $1,000 invested at the beginning of the period and held for the entire period (May 1, 2018 to October 31, 2018) for Class A, Class M, Class C, Fidelity Floating Rate High Income Fund and Class I, and for the period (October 2, 2018 to October 31, 2018) for Class Z. The hypothetical expense Example is based on an investment of $1,000 invested for the one-half year period (May 1, 2018 to October 31, 2018).
Actual Expenses
The first line of the accompanying table for each class of the Fund provides information about actual account values and actual expenses. You may use the information in this line, together with the amount you invested, to estimate the expenses that you paid over the period. Simply divide your account value by $1,000.00 (for example, an $8,600 account value divided by $1,000.00 = 8.6), then multiply the result by the number in the first line for a class of the Fund under the heading entitled "Expenses Paid During Period" to estimate the expenses you paid on your account during this period. A small balance maintenance fee of $12.00 that is charged once a year may apply for certain accounts with a value of less than $2,000. This fee, which was eliminated effective August 1, 2018, is not included in the table below. If it was, the estimate of expenses you paid during the period would be higher, and your ending account value lower, by this amount. In addition, the Fund, as a shareholder in the underlying Fidelity Central Funds, will indirectly bear its pro-rata share of the fees and expenses incurred by the underlying Fidelity Central Funds. These fees and expenses are not included in the Fund's annualized expense ratio used to calculate the expense estimate in the table below.
Hypothetical Example for Comparison Purposes
The second line of the accompanying table for each class of the Fund provides information about hypothetical account values and hypothetical expenses based on a Class' actual expense ratio and an assumed rate of return of 5% per year before expenses, which is not the Class' actual return. The hypothetical account values and expenses may not be used to estimate the actual ending account balance or expenses you paid for the period. You may use this information to compare the ongoing costs of investing in the Fund and other funds. To do so, compare this 5% hypothetical example with the 5% hypothetical examples that appear in the shareholder reports of the other funds. A small balance maintenance fee of $12.00 that is charged once a year may apply for certain accounts with a value of less than $2,000. This fee, which was eliminated effective August 1, 2018, is not included in the table below. If it was, the estimate of expenses you paid during the period would be higher, and your ending account value lower, by this amount. In addition, the Fund, as a shareholder in the underlying Fidelity Central Funds, will indirectly bear its pro-rata share of the fees and expenses incurred by the underlying Fidelity Central Funds. These fees and expenses are not included in the Fund's annualized expense ratio used to calculate the expense estimate in the table below.
Please note that the expenses shown in the table are meant to highlight your ongoing costs only and do not reflect any transaction costs. Therefore, the second line of the table is useful in comparing ongoing costs only, and will not help you determine the relative total costs of owning different funds. In addition, if these transactional costs were included, your costs would have been higher.
| Annualized Expense Ratio-A | Beginning Account Value | Ending Account Value October 31, 2018 | Expenses Paid During Period | |
| Class A | .97% | |||
| Actual | $1,000.00 | $1,017.10 | $4.93-B | |
| Hypothetical-C | $1,000.00 | $1,020.32 | $4.94-D | |
| Class M | .98% | |||
| Actual | $1,000.00 | $1,016.00 | $4.98-B | |
| Hypothetical-C | $1,000.00 | $1,020.27 | $4.99-D | |
| Class C | 1.72% | |||
| Actual | $1,000.00 | $1,012.20 | $8.72-B | |
| Hypothetical-C | $1,000.00 | $1,016.53 | $8.74-D | |
| Fidelity Floating Rate High Income Fund | .68% | |||
| Actual | $1,000.00 | $1,017.50 | $3.46-B | |
| Hypothetical-C | $1,000.00 | $1,021.78 | $3.47-D | |
| Class I | .74% | |||
| Actual | $1,000.00 | $1,017.20 | $3.76-B | |
| Hypothetical-C | $1,000.00 | $1,021.48 | $3.77-D | |
| Class Z | .62% | |||
| Actual | $1,000.00 | $1,018.20 | $.51-B | |
| Hypothetical-C | $1,000.00 | $1,022.08 | $3.16-D |
A Annualized expense ratio reflects expenses net of applicable fee waivers.
B Actual expenses are equal to each Class' annualized expense ratio, multiplied by the average account value over the period, multiplied by 184/365 (to reflect the one-half year period) for Class A, Class M, Class C, Fidelity Floating Rate High Income Fund and Class I and multiplied by 30/365 (to reflect the period October 2, 2018 to October 31, 2018) for Class Z.
C 5% return per year before expenses
D Hypothetical expenses are equal to each Class' annualized expense ratio, multiplied by the average account value over the period, multiplied by 184/365 (to reflect the one-half year period).
Distributions (Unaudited)
A total of 0.72% of the dividends distributed during the fiscal year was derived from interest on U.S. Government securities which is generally exempt from state income tax.
The fund designates $374,106,911 of distributions paid during the period January 1, 2018 to October 31, 2018 as qualifying to be taxed as interest-related dividends for nonresident alien shareholders.
The fund will notify shareholders in January 2019 of amounts for use in preparing 2018 income tax returns.
Board Approval of Investment Advisory Contracts
Fidelity Advisor Floating Rate High Income Fund
At its July 2018 meeting, the Board of Trustees, including the Independent Trustees (together, the Board), voted to continue the management contract with Fidelity Management & Research Company (FMR) and the sub-advisory agreements (together, the Advisory Contracts) for the fund for six months through January 31, 2019, in connection with the reunification of the Fidelity Equity High Income Funds Board, which oversees the fund, and the Sector Portfolios Board.
The Board considered that the approval of the fund's Advisory Contracts will not result in any changes in (i) the investment process or strategies employed in the management of the fund's assets; (ii) the fees and expenses paid by shareholders; (iii) the nature, extent or quality of services provided under the fund's Advisory Contracts; or (iv) the day-to-day management of the fund or the persons primarily responsible for such management. The Board concluded that the fund's Advisory Contracts are fair and reasonable, and that the fund's Advisory Contracts should be renewed, without modification, through January 31, 2019, with the understanding that the Board will consider the annual renewal for a full one year period in January 2019.
In connection with its consideration of future renewals of the fund's Advisory Contracts, the Board will consider: (i) the nature, extent and quality of services provided to the fund, including shareholder and administrative services and investment performance; (ii) the competitiveness of the management fee and total expenses for the fund; (iii) the costs of the services and profitability, including the revenues earned and the expenses incurred in conducting the business of developing, marketing, distributing, managing, administering, and servicing the fund and its shareholders, to the extent applicable, as well as potential fall-out benefits from Fidelity's non-fund businesses; and (iv) whether there have been economies of scale in respect of the Fidelity funds, whether the Fidelity funds (including the fund) have appropriately benefited from any such economies of scale, and whether there is the potential for realization of any further economies.
Based on its evaluation of all of the conclusions noted above, and after considering all factors it believed relevant, the Board ultimately concluded that the fund's management fee structure is fair and reasonable, and that the continuation of the fund's Advisory Contracts should be approved.
![]()
Corporate Headquarters
245 Summer St.
Boston, MA 02210
www.fidelity.com
FHI-ANN-1218
1.779592.116
Fidelity Advisor® High Income Advantage Fund Class A, Class M, Class C, Class I and Class Z Annual Report October 31, 2018 |
|
Contents
To view a fund's proxy voting guidelines and proxy voting record for the 12-month period ended June 30, visit http://www.fidelity.com/proxyvotingresults or visit the Securities and Exchange Commission's (SEC) web site at http://www.sec.gov.
You may also call 1-877-208-0098 to request a free copy of the proxy voting guidelines.
Standard & Poor's, S&P and S&P 500 are registered service marks of The McGraw-Hill Companies, Inc. and have been licensed for use by Fidelity Distributors Corporation.
Other third-party marks appearing herein are the property of their respective owners.
All other marks appearing herein are registered or unregistered trademarks or service marks of FMR LLC or an affiliated company. © 2018 FMR LLC. All rights reserved.
This report and the financial statements contained herein are submitted for the general information of the shareholders of the Fund. This report is not authorized for distribution to prospective investors in the Fund unless preceded or accompanied by an effective prospectus.
A fund files its complete schedule of portfolio holdings with the SEC for the first and third quarters of each fiscal year on Form N-Q. Forms N-Q are available on the SEC’s web site at http://www.sec.gov. A fund's Forms N-Q may be reviewed and copied at the SEC’s Public Reference Room in Washington, DC. Information regarding the operation of the SEC's Public Reference Room may be obtained by calling 1-800-SEC-0330.
For a complete list of a fund's portfolio holdings, view the most recent holdings listing, semiannual report, or annual report on Fidelity's web site at http://www.fidelity.com, http://www.institutional.fidelity.com, or http://www.401k.com, as applicable.
NOT FDIC INSURED •MAY LOSE VALUE •NO BANK GUARANTEE
Neither the Fund nor Fidelity Distributors Corporation is a bank.
Performance: The Bottom Line
Average annual total return reflects the change in the value of an investment, assuming reinvestment of distributions from dividend income and capital gains (the profits earned upon the sale of securities that have grown in value, if any) and assuming a constant rate of performance each year. The hypothetical investment and the average annual total returns do not reflect the deduction of taxes that a shareholder would pay on fund distributions or the redemption of fund shares. During periods of reimbursement by Fidelity, a fund’s total return will be greater than it would be had the reimbursement not occurred. How a fund did yesterday is no guarantee of how it will do tomorrow.
Average Annual Total Returns
| For the periods ended October 31, 2018 | Past 1 year | Past 5 years | Past 10 years |
| Class A (incl. 4.00% sales charge) | (3.52)% | 4.33% | 11.01% |
| Class M (incl. 4.00% sales charge) | (3.49)% | 4.35% | 11.01% |
| Class C (incl. contingent deferred sales charge) | (1.22)% | 4.40% | 10.62% |
| Class I | 0.80% | 5.44% | 11.73% |
| Class Z | 0.80% | 5.44% | 11.73% |
Class C shares' contingent deferred sales charges included in the past one year, past five years and past ten years total return figures are 1%, 0% and 0%, respectively.
The initial offering of Class Z shares took place on October 2, 2018. Returns prior to October 2, 2018, are those of Class I.
$10,000 Over 10 Years
Let's say hypothetically that $10,000 was invested in Fidelity Advisor® High Income Advantage Fund - Class A on October 31, 2008, and the current 4.00% sales charge was paid.
The chart shows how the value of your investment would have changed, and also shows how the ICE® BofAML® US High Yield Constrained Index performed over the same period.
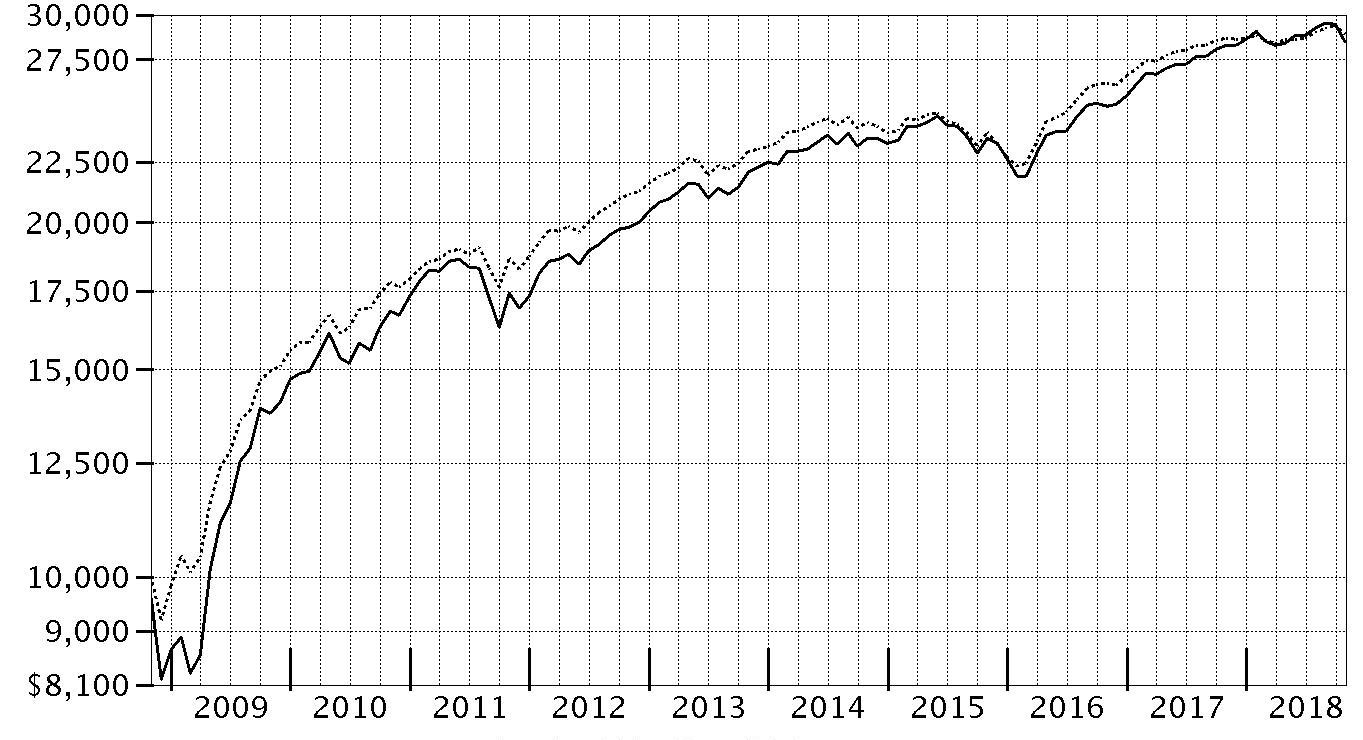
| Period Ending Values | ||
| $28,424 | Fidelity Advisor® High Income Advantage Fund - Class A | |
| $28,909 | ICE® BofAML® US High Yield Constrained Index | |
BofA Merrill Lynch benchmark indices were re-branded as ICE BofAML benchmark indices.
Management's Discussion of Fund Performance
Market Recap: U.S. corporate high-yield bonds gained 0.86% for the year ending October 31, 2018, as measured by the ICE BofAML® US High Yield Constrained Index. On the heels of a solid 2017, high yield has since struggled to sustain meaningful momentum. The most recent setback was a sharp decline in October, as high yield and other risk assets were hampered by rising U.S. Treasury yields and concern that corporate earnings growth may have peaked. The index returned -1.64% in October alone, its largest monthly drop in nearly three years. The short-term retreat snapped a modest-but-steady uptrend that began in April and lasted through the end of September, primarily due to the strength of corporate earnings. For the full 12 months, lower-quality bonds rose 5%, handily topping credits rated B (+1%) and BB (-1%). By industry, energy topped the broader market, with the index heavyweight gaining 2% amid higher oil prices, despite a sharp downturn in October. Other standouts included food & drug retail (+7%) and transportation ex air/rail (+3%), while aerospace (+4%) was lifted by potential for increased spending on U.S. defense and infrastructure. Three defensive categories also outperformed: health care was up roughly 4%, and utilities and insurance each gained about 2%. Notable laggards included automotive & auto parts (-5%), banks/thrifts and homebuilders/real estate (-2%), and super retail (-1%). Telecommunications finished roughly in line with the index.Comments from Portfolio Manager Harley Lank: For the fiscal year, the fund's share classes (excluding sales charges, if applicable) returned roughly 0% to 1%, about in line with the benchmark, the ICE BofAML® US High Yield Constrained Index. The fund’s investments in high-yield bonds – representing about 72% of fund assets, on average – outperformed the benchmark, as did our much smaller allocation to bank debt, aiding the fund's relative performance. Conversely, the fund’s non-benchmark allocation to stocks – about 18% of assets, on average – lagged the benchmark and hampered our relative result. The top individual relative contributors were overweighted positions in hospital operator Tenet Healthcare, specialty pharmaceutical firm Bausch Health (formerly Valeant Pharmaceuticals International) and regional gaming operator Eldorado Resorts. Tenet was among the fund's largest holdings. On the downside, debt and equity positions in two gaming companies, Melco Resorts & Entertainment and Wynn Resorts, detracted from the fund’s relative result this period.Both firms were caught up in a late-period slump for gaming-related securities on concern about slowing economic growth in China. An overweighting in the stock of industrial chemicals maker Chemours also dampened performance versus the benchmark, as the company struggled due to weakening global economic growth, as well as pricing activity from various global commodity suppliers. During the latter months of the period, I reduced risk by cutting the fund’s overweighting in CCC-rated bonds and by trimming its allocation to stocks.The views expressed above reflect those of the portfolio manager(s) only through the end of the period as stated on the cover of this report and do not necessarily represent the views of Fidelity or any other person in the Fidelity organization. Any such views are subject to change at any time based upon market or other conditions and Fidelity disclaims any responsibility to update such views. These views may not be relied on as investment advice and, because investment decisions for a Fidelity fund are based on numerous factors, may not be relied on as an indication of trading intent on behalf of any Fidelity fund.
Investment Summary (Unaudited)
Top Five Holdings as of October 31, 2018
| (by issuer, excluding cash equivalents) | % of fund's net assets |
| Tenet Healthcare Corp. | 2.5 |
| CCO Holdings LLC/CCO Holdings Capital Corp. | 2.4 |
| Valeant Pharmaceuticals International, Inc. | 2.0 |
| Ally Financial, Inc. | 1.9 |
| California Resources Corp. | 1.6 |
| 10.4 |
Top Five Market Sectors as of October 31, 2018
| % of fund's net assets | |
| Energy | 15.2 |
| Healthcare | 9.3 |
| Telecommunications | 7.8 |
| Technology | 7.3 |
| Cable/Satellite TV | 7.1 |
Quality Diversification (% of fund's net assets)
| As of October 31, 2018 | ||
| BBB | 1.2% | |
| BB | 27.6% | |
| B | 30.5% | |
| CCC,CC,C | 15.8% | |
| Not Rated | 1.4% | |
| Equities | 17.7% | |
| Short-Term Investments and Net Other Assets | 5.8% | |

We have used ratings from Moody's Investors Service, Inc. Where Moody's® ratings are not available, we have used S&P® ratings. All ratings are as of the date indicated and do not reflect subsequent changes.
Asset Allocation (% of fund's net assets)
| As of October 31, 2018* | ||
| Nonconvertible Bonds | 67.1% | |
| Convertible Bonds, Preferred Stocks | 0.4% | |
| Common Stocks | 17.3% | |
| Bank Loan Obligations | 5.9% | |
| Other Investments | 3.5% | |
| Short-Term Investments and Net Other Assets (Liabilities) | 5.8% | |

* Foreign investments - 21.7%
Schedule of Investments October 31, 2018
Showing Percentage of Net Assets
| Nonconvertible Bonds - 67.1% | |||
| Principal Amount (000s) | Value (000s) | ||
| Aerospace - 0.4% | |||
| BBA U.S. Holdings, Inc. 5.375% 5/1/26 (a) | $655 | $648 | |
| Bombardier, Inc. 7.5% 12/1/24 (a) | 1,840 | 1,870 | |
| DAE Funding LLC: | |||
| 4.5% 8/1/22 (a) | 1,410 | 1,375 | |
| 5% 8/1/24 (a) | 1,940 | 1,892 | |
| TransDigm UK Holdings PLC 6.875% 5/15/26 (a) | 1,820 | 1,815 | |
| TOTAL AEROSPACE | 7,600 | ||
| Air Transportation - 0.0% | |||
| Continental Airlines, Inc. pass-thru trust certificates 6.903% 4/19/22 | 225 | 232 | |
| Banks & Thrifts - 2.3% | |||
| Ally Financial, Inc.: | |||
| 5.75% 11/20/25 | 2,310 | 2,368 | |
| 8% 12/31/18 | 6,859 | 6,902 | |
| 8% 11/1/31 | 3,105 | 3,726 | |
| 8% 11/1/31 | 18,362 | 22,082 | |
| Royal Bank of Scotland Group PLC: | |||
| 5.125% 5/28/24 | 3,515 | 3,480 | |
| 6% 12/19/23 | 3,605 | 3,705 | |
| Washington Mutual Bank 5.5% 1/15/13 (b)(c) | 10,000 | 1 | |
| TOTAL BANKS & THRIFTS | 42,264 | ||
| Broadcasting - 0.2% | |||
| Sirius XM Radio, Inc. 5% 8/1/27 (a) | 3,200 | 3,007 | |
| Building Materials - 0.5% | |||
| BMC East LLC 5.5% 10/1/24 (a) | 1,440 | 1,350 | |
| Builders FirstSource, Inc. 5.625% 9/1/24 (a) | 3,560 | 3,320 | |
| HD Supply, Inc. 5.375% 10/15/26 (a) | 2,975 | 2,852 | |
| HMAN Finance Sub Corp. 6.375% 7/15/22 (a) | 900 | 792 | |
| TOTAL BUILDING MATERIALS | 8,314 | ||
| Cable/Satellite TV - 5.8% | |||
| Altice SA: | |||
| 7.625% 2/15/25 (a) | 12,590 | 10,733 | |
| 7.75% 5/15/22 (a) | 10,575 | 9,848 | |
| CCO Holdings LLC/CCO Holdings Capital Corp.: | |||
| 5% 2/1/28 (a) | 740 | 691 | |
| 5.125% 2/15/23 | 2,550 | 2,537 | |
| 5.125% 5/1/27 (a) | 21,260 | 20,011 | |
| 5.5% 5/1/26 (a) | 4,620 | 4,499 | |
| 5.75% 1/15/24 | 5,335 | 5,388 | |
| 5.75% 2/15/26 (a) | 1,770 | 1,752 | |
| 5.875% 5/1/27 (a) | 8,635 | 8,484 | |
| Cequel Communications Holdings I LLC/Cequel Capital Corp.: | |||
| 7.5% 4/1/28(a) | 4,535 | 4,700 | |
| 7.75% 7/15/25 (a) | 1,260 | 1,329 | |
| CSC Holdings LLC: | |||
| 5.375% 2/1/28 (a) | 2,655 | 2,502 | |
| 5.5% 4/15/27 (a) | 9,215 | 8,846 | |
| DISH DBS Corp.: | |||
| 5% 3/15/23 | 4,695 | 4,108 | |
| 5.875% 7/15/22 | 4,240 | 4,007 | |
| Ziggo Bond Finance BV: | |||
| 5.875% 1/15/25 (a) | 1,705 | 1,560 | |
| 6% 1/15/27 (a) | 3,575 | 3,182 | |
| Ziggo Secured Finance BV 5.5% 1/15/27 (a) | 12,315 | 11,299 | |
| TOTAL CABLE/SATELLITE TV | 105,476 | ||
| Capital Goods - 0.0% | |||
| Apergy Corp. 6.375% 5/1/26 (a) | 645 | 653 | |
| Chemicals - 2.8% | |||
| CF Industries Holdings, Inc.: | |||
| 4.95% 6/1/43 | 7,230 | 6,164 | |
| 5.15% 3/15/34 | 3,625 | 3,326 | |
| 5.375% 3/15/44 | 2,750 | 2,420 | |
| LSB Industries, Inc. 9.625% 5/1/23 (a) | 1,050 | 1,089 | |
| NOVA Chemicals Corp.: | |||
| 4.875% 6/1/24 (a) | 2,140 | 1,966 | |
| 5.25% 6/1/27 (a) | 2,170 | 1,958 | |
| OCI NV 6.625% 4/15/23 (a) | 7,890 | 8,087 | |
| Olin Corp. 5% 2/1/30 | 1,555 | 1,396 | |
| Platform Specialty Products Corp.: | |||
| 5.875% 12/1/25 (a) | 1,930 | 1,829 | |
| 6.5% 2/1/22 (a) | 5,550 | 5,619 | |
| Starfruit Finco BV / Starfruit U.S. Holdco LLC 8% 10/1/26 (a) | 1,190 | 1,154 | |
| The Chemours Co. LLC: | |||
| 5.375% 5/15/27 | 835 | 777 | |
| 6.625% 5/15/23 | 774 | 791 | |
| 7% 5/15/25 | 975 | 1,004 | |
| TPC Group, Inc. 8.75% 12/15/20 (a) | 9,385 | 9,197 | |
| Tronox Finance PLC 5.75% 10/1/25 (a) | 870 | 763 | |
| Tronox, Inc. 6.5% 4/15/26 (a) | 3,655 | 3,344 | |
| TOTAL CHEMICALS | 50,884 | ||
| Consumer Products - 0.2% | |||
| Coty, Inc. 6.5% 4/15/26 (a) | 2,730 | 2,546 | |
| Containers - 1.2% | |||
| Ardagh Packaging Finance PLC/Ardagh MP Holdings U.S.A., Inc. 7.25% 5/15/24 (a) | 3,785 | 3,804 | |
| Ball Corp. 4.875% 3/15/26 | 4,125 | 4,068 | |
| Berry Global, Inc. 4.5% 2/15/26 (a) | 4,575 | 4,278 | |
| Crown Americas LLC / Crown Americas Capital Corp. IV 4.75% 2/1/26 (a) | 5,475 | 5,167 | |
| Crown Americas LLC/Crown Americas Capital Corp. V 4.25% 9/30/26 | 1,210 | 1,098 | |
| Plastipak Holdings, Inc. 6.25% 10/15/25 (a) | 555 | 508 | |
| Reynolds Group Issuer, Inc./Reynolds Group Issuer LLC/Reynolds Group Issuer (Luxembourg) SA: | |||
| 5.75% 10/15/20 | 2,384 | 2,384 | |
| 7% 7/15/24 (a) | 1,025 | 1,028 | |
| TOTAL CONTAINERS | 22,335 | ||
| Diversified Financial Services - 4.1% | |||
| Aircastle Ltd. 4.625% 12/15/18 | 1,625 | 1,628 | |
| Chobani LLC/Finance Corp., Inc. 7.5% 4/15/25 (a) | 3,415 | 2,920 | |
| CIT Group, Inc.: | |||
| 5.25% 3/7/25 | 1,650 | 1,658 | |
| 5.375% 5/15/20 | 285 | 293 | |
| FLY Leasing Ltd. 5.25% 10/15/24 | 1,495 | 1,420 | |
| Grinding Media, Inc./MC Grinding Media Canada, Inc. 7.375% 12/15/23 (a) | 1,315 | 1,351 | |
| Icahn Enterprises LP/Icahn Enterprises Finance Corp.: | |||
| 5.875% 2/1/22 | 5,683 | 5,684 | |
| 6.25% 2/1/22 | 3,525 | 3,559 | |
| 6.375% 12/15/25 | 5,050 | 5,018 | |
| 6.75% 2/1/24 | 1,810 | 1,824 | |
| MSCI, Inc. 5.75% 8/15/25 (a) | 1,345 | 1,382 | |
| Navient Corp.: | |||
| 5.875% 10/25/24 | 3,375 | 3,181 | |
| 6.75% 6/25/25 | 1,815 | 1,770 | |
| 6.75% 6/15/26 | 5,070 | 4,877 | |
| 7.25% 9/25/23 | 1,775 | 1,837 | |
| Park Aerospace Holdings Ltd.: | |||
| 4.5% 3/15/23 (a) | 2,680 | 2,550 | |
| 5.5% 2/15/24 (a) | 9,855 | 9,759 | |
| Radiate Holdco LLC/Radiate Financial Service Ltd.: | |||
| 6.625% 2/15/25 (a) | 690 | 645 | |
| 6.875% 2/15/23 (a) | 655 | 629 | |
| SLM Corp.: | |||
| 5.5% 1/25/23 | 3,735 | 3,668 | |
| 6.125% 3/25/24 | 9,270 | 9,015 | |
| 8% 3/25/20 | 4,700 | 4,906 | |
| Springleaf Financial Corp. 7.125% 3/15/26 | 5,660 | 5,309 | |
| TOTAL DIVERSIFIED FINANCIAL SERVICES | 74,883 | ||
| Diversified Media - 0.5% | |||
| Clear Channel Worldwide Holdings, Inc. 7.625% 3/15/20 | 2,060 | 2,057 | |
| E.W. Scripps Co. 5.125% 5/15/25 (a) | 820 | 771 | |
| Liberty Media Corp.: | |||
| 8.25% 2/1/30 | 469 | 490 | |
| 8.5% 7/15/29 | 529 | 558 | |
| Nielsen Finance LLC/Nielsen Finance Co. 5% 4/15/22 (a) | 1,220 | 1,188 | |
| Viacom, Inc.: | |||
| 5.875% 2/28/57 (d) | 1,755 | 1,676 | |
| 6.25% 2/28/57 (d) | 2,380 | 2,295 | |
| TOTAL DIVERSIFIED MEDIA | 9,035 | ||
| Energy - 13.0% | |||
| Antero Midstream Partners LP/Antero Midstream Finance Corp. 5.375% 9/15/24 | 820 | 800 | |
| Antero Resources Corp. 5.125% 12/1/22 | 1,935 | 1,922 | |
| Antero Resources Finance Corp. 5.375% 11/1/21 | 4,500 | 4,500 | |
| California Resources Corp. 8% 12/15/22 (a) | 13,005 | 11,574 | |
| Cheniere Corpus Christi Holdings LLC: | |||
| 5.125% 6/30/27 | 4,340 | 4,253 | |
| 5.875% 3/31/25 | 2,610 | 2,682 | |
| Cheniere Energy Partners LP 5.625% 10/1/26 (a) | 2,120 | 2,088 | |
| Chesapeake Energy Corp.: | |||
| 3 month U.S. LIBOR + 3.250% 5.6863% 4/15/19 (d)(e) | 2,250 | 2,256 | |
| 4.875% 4/15/22 | 5,580 | 5,301 | |
| 5.75% 3/15/23 | 1,890 | 1,796 | |
| 8% 12/15/22 (a) | 3,301 | 3,441 | |
| 8% 1/15/25 | 3,455 | 3,505 | |
| 8% 6/15/27 | 9,280 | 9,222 | |
| Citgo Holding, Inc. 10.75% 2/15/20 (a) | 3,525 | 3,666 | |
| Comstock Escrow Corp. 9.75% 8/15/26 (a) | 3,890 | 3,754 | |
| Consolidated Energy Finance SA: | |||
| 3 month U.S. LIBOR + 3.750% 6.0841% 6/15/22 (a)(d)(e) | 4,580 | 4,582 | |
| 6.5% 5/15/26 (a) | 10,115 | 10,064 | |
| 6.875% 6/15/25 (a) | 5,350 | 5,450 | |
| Continental Resources, Inc. 4.375% 1/15/28 | 2,260 | 2,185 | |
| Covey Park Energy LLC 7.5% 5/15/25 (a) | 880 | 865 | |
| Crestwood Midstream Partners LP/Crestwood Midstream Finance Corp. 6.25% 4/1/23 | 1,775 | 1,811 | |
| DCP Midstream LLC 5.85% 5/21/43 (a)(d) | 7,215 | 6,457 | |
| DCP Midstream Operating LP 5.375% 7/15/25 | 2,095 | 2,124 | |
| Denbury Resources, Inc.: | |||
| 4.625% 7/15/23 | 4,625 | 3,827 | |
| 5.5% 5/1/22 | 2,510 | 2,171 | |
| 6.375% 8/15/21 | 770 | 716 | |
| 7.5% 2/15/24 (a) | 2,755 | 2,693 | |
| Drax Finco PLC 6.625% 11/1/25 (a) | 1,665 | 1,661 | |
| Endeavor Energy Resources LP/EER Finance, Inc.: | |||
| 5.5% 1/30/26 (a) | 800 | 822 | |
| 5.75% 1/30/28 (a) | 805 | 831 | |
| Ensco PLC: | |||
| 4.5% 10/1/24 | 3,930 | 3,193 | |
| 5.2% 3/15/25 | 760 | 623 | |
| 7.75% 2/1/26 | 2,045 | 1,907 | |
| EP Energy LLC/Everest Acquisition Finance, Inc.: | |||
| 7.75% 5/15/26 (a) | 6,080 | 6,048 | |
| 8% 11/29/24 (a) | 1,170 | 1,129 | |
| Exterran Partners LP/EXLP Finance Corp.: | |||
| 6% 4/1/21 | 495 | 490 | |
| 6% 10/1/22 | 2,570 | 2,544 | |
| Hess Infrastructure Partners LP 5.625% 2/15/26 (a) | 2,390 | 2,396 | |
| Hilcorp Energy I LP/Hilcorp Finance Co.: | �� | ||
| 5% 12/1/24 (a) | 2,085 | 1,965 | |
| 5.75% 10/1/25 (a) | 8,820 | 8,577 | |
| 6.25% 11/1/28 (a) | 1,980 | 1,906 | |
| Indigo Natural Resources LLC 6.875% 2/15/26 (a) | 2,120 | 2,003 | |
| Jonah Energy LLC 7.25% 10/15/25 (a) | 3,270 | 2,600 | |
| KLX Energy Services Holdings, Inc. 11.5% 11/1/25 (a) | 1,995 | 2,010 | |
| Magnolia Oil & Gas Operating LLC 6% 8/1/26 (a) | 1,855 | 1,832 | |
| MEG Energy Corp.: | |||
| 6.375% 1/30/23 (a) | 1,940 | 1,870 | |
| 7% 3/31/24 (a) | 4,770 | 4,687 | |
| NextEra Energy Partners LP: | |||
| 4.25% 9/15/24 (a) | 1,265 | 1,202 | |
| 4.5% 9/15/27 (a) | 880 | 812 | |
| Nine Energy Service, Inc. 8.75% 11/1/23 (a) | 965 | 979 | |
| Noble Holding International Ltd.: | |||
| 6.05% 3/1/41 | 95 | 69 | |
| 6.2% 8/1/40 | 2,660 | 1,935 | |
| 7.75% 1/15/24 | 4,080 | 3,810 | |
| 7.875% 2/1/26 (a) | 1,795 | 1,782 | |
| Northern Oil & Gas, Inc. 9.5% 5/15/23 pay-in-kind (a)(d) | 2,065 | 2,124 | |
| Oasis Petroleum, Inc. 6.875% 3/15/22 | 857 | 862 | |
| Pacific Drilling V Ltd. 7.25% 12/1/17 (a)(b) | 9,330 | 4,478 | |
| Parsley Energy LLC/Parsley: | |||
| 5.625% 10/15/27 (a) | 925 | 912 | |
| 6.25% 6/1/24 (a) | 4,520 | 4,644 | |
| PBF Holding Co. LLC/PBF Finance Corp.: | |||
| 7% 11/15/23 | 1,795 | 1,853 | |
| 7.25% 6/15/25 | 2,125 | 2,189 | |
| PBF Logistics LP/PBF Logistics Finance, Inc. 6.875% 5/15/23 | 3,315 | 3,373 | |
| Peabody Securities Finance Corp.: | |||
| 6% 3/31/22 (a) | 610 | 609 | |
| 6.375% 3/31/25 (a) | 755 | 755 | |
| Pride International, Inc. 7.875% 8/15/40 | 2,715 | 2,430 | |
| Rose Rock Midstream LP/Rose Rock Finance Corp. 5.625% 7/15/22 | 1,125 | 1,080 | |
| SemGroup Corp. 7.25% 3/15/26 | 4,510 | 4,403 | |
| SESI LLC 7.75% 9/15/24 | 1,160 | 1,140 | |
| SM Energy Co.: | |||
| 5% 1/15/24 | 1,730 | 1,648 | |
| 5.625% 6/1/25 | 2,565 | 2,469 | |
| 6.625% 1/15/27 | 1,435 | 1,442 | |
| 6.75% 9/15/26 | 845 | 847 | |
| Southwestern Energy Co.: | |||
| 7.5% 4/1/26 | 1,730 | 1,760 | |
| 7.75% 10/1/27 | 1,285 | 1,311 | |
| Summit Midstream Holdings LLC: | |||
| 5.5% 8/15/22 | 1,520 | 1,505 | |
| 5.75% 4/15/25 | 1,435 | 1,374 | |
| Sunoco LP/Sunoco Finance Corp.: | |||
| 4.875% 1/15/23 (a) | 2,080 | 2,005 | |
| 5.5% 2/15/26 (a) | 1,770 | 1,686 | |
| Targa Resources Partners LP/Targa Resources Partners Finance Corp.: | |||
| 5.125% 2/1/25 | 1,070 | 1,041 | |
| 5.375% 2/1/27 | 1,070 | 1,041 | |
| 5.875% 4/15/26 (a) | 1,370 | 1,378 | |
| Teine Energy Ltd. 6.875% 9/30/22 (a) | 4,916 | 4,891 | |
| TerraForm Power Operating LLC: | |||
| 4.25% 1/31/23 (a) | 965 | 914 | |
| 5% 1/31/28 (a) | 965 | 862 | |
| 6.625% 6/15/25 (a)(d) | 1,480 | 1,543 | |
| Tesoro Logistics LP/Tesoro Logistics Finance Corp. 6.375% 5/1/24 | 1,310 | 1,385 | |
| Transocean Pontus Ltd. 6.125% 8/1/25 (a) | 1,615 | 1,605 | |
| U.S.A. Compression Partners LP 6.875% 4/1/26 (a) | 655 | 666 | |
| Ultra Resources, Inc.: | |||
| 6.875% 4/15/22 (a) | 1,510 | 868 | |
| 7.125% 4/15/25 (a) | 1,295 | 570 | |
| W&T Offshore, Inc. 9.75% 11/1/23 (a) | 1,500 | 1,452 | |
| Weatherford International Ltd. 9.875% 2/15/24 | 1,970 | 1,527 | |
| Weatherford International, Inc. 9.875% 3/1/25 (a) | 8,720 | 6,758 | |
| WPX Energy, Inc. 8.25% 8/1/23 | 1,645 | 1,849 | |
| TOTAL ENERGY | 238,637 | ||
| Entertainment/Film - 0.3% | |||
| New Cotai LLC/New Cotai Capital Corp. 10.625% 5/1/19 pay-in-kind (a)(d) | 9,531 | 5,432 | |
| Environmental - 0.8% | |||
| Covanta Holding Corp.: | |||
| 5.875% 3/1/24 | 4,680 | 4,668 | |
| 6% 1/1/27 | 3,440 | 3,320 | |
| 6.375% 10/1/22 | 4,000 | 4,085 | |
| LBC Tank Terminals Holding Netherlands BV 6.875% 5/15/23 (a) | 1,455 | 1,430 | |
| Tervita Escrow Corp. 7.625% 12/1/21 (a) | 810 | 822 | |
| TOTAL ENVIRONMENTAL | 14,325 | ||
| Food & Drug Retail - 0.6% | |||
| Albertsons Companies LLC/Safeway, Inc./New Albertson's, Inc./Albertson's LLC 6.625% 6/15/24 | 930 | 879 | |
| Albertsons, Inc.: | |||
| 6.625% 6/1/28 | 2,415 | 1,860 | |
| 7.45% 8/1/29 | 220 | 185 | |
| Rite Aid Corp.: | |||
| 6.875% 12/15/28 (a)(d) | 5,785 | 3,876 | |
| 7.7% 2/15/27 | 2,715 | 1,901 | |
| Tops Holding LLC/Tops Markets II Corp. 8% 6/15/22 (a)(b) | 4,395 | 2,725 | |
| TOTAL FOOD & DRUG RETAIL | 11,426 | ||
| Food/Beverage/Tobacco - 1.6% | |||
| C&S Group Enterprises LLC 5.375% 7/15/22 (a) | 1,290 | 1,245 | |
| Darling International, Inc. 5.375% 1/15/22 | 1,280 | 1,283 | |
| ESAL GmbH 6.25% 2/5/23 (a) | 3,315 | 3,253 | |
| JBS Investments II GmbH 7% 1/15/26 (a) | 1,795 | 1,773 | |
| JBS U.S.A. LLC/JBS U.S.A. Finance, Inc.: | |||
| 5.75% 6/15/25 (a) | 3,150 | 3,048 | |
| 5.875% 7/15/24 (a) | 2,585 | 2,537 | |
| 6.75% 2/15/28 (a) | 4,025 | 3,924 | |
| Pilgrim's Pride Corp.: | |||
| 5.75% 3/15/25 (a) | 625 | 583 | |
| 5.875% 9/30/27 (a) | 1,110 | 1,007 | |
| Post Holdings, Inc.: | |||
| 5.625% 1/15/28 (a) | 2,640 | 2,482 | |
| 5.75% 3/1/27 (a) | 4,735 | 4,522 | |
| Vector Group Ltd. 6.125% 2/1/25 (a) | 4,850 | 4,414 | |
| TOTAL FOOD/BEVERAGE/TOBACCO | 30,071 | ||
| Gaming - 2.1% | |||
| CRC Escrow Issuer LLC/CRC Finance LLC 5.25% 10/15/25 (a) | 5,530 | 5,146 | |
| Delta Merger Sub, Inc. 6% 9/15/26 (a) | 865 | 849 | |
| Eldorado Resorts, Inc. 6% 4/1/25 | 1,970 | 1,945 | |
| GLP Capital LP/GLP Financing II, Inc. 5.25% 6/1/25 | 1,790 | 1,799 | |
| International Game Technology PLC 6.25% 1/15/27 (a) | 1,205 | 1,190 | |
| MGM Mirage, Inc.: | |||
| 5.75% 6/15/25 | 7,095 | 6,840 | |
| 8.625% 2/1/19 | 5,000 | 5,038 | |
| Penn National Gaming, Inc. 5.625% 1/15/27 (a) | 415 | 386 | |
| Scientific Games Corp.: | |||
| 5% 10/15/25 (a) | 550 | 512 | |
| 10% 12/1/22 | 5,980 | 6,249 | |
| Station Casinos LLC 5% 10/1/25 (a) | 2,400�� | 2,229 | |
| Transocean, Inc. 7.25% 11/1/25 (a) | 4,035 | 3,924 | |
| Wynn Macau Ltd.: | |||
| 4.875% 10/1/24 (a) | 1,390 | 1,261 | |
| 5.5% 10/1/27 (a) | 1,710 | 1,543 | |
| TOTAL GAMING | 38,911 | ||
| Healthcare - 8.3% | |||
| Catalent Pharma Solutions 4.875% 1/15/26 (a) | 625 | 586 | |
| Centene Escrow Corp. 5.375% 6/1/26 (a) | 4,620 | 4,689 | |
| Charles River Laboratories International, Inc. 5.5% 4/1/26 (a) | 1,280 | 1,277 | |
| Community Health Systems, Inc.: | |||
| 5.125% 8/1/21 | 2,535 | 2,402 | |
| 6.25% 3/31/23 | 14,435 | 13,276 | |
| 8.625% 1/15/24 (a) | 4,545 | 4,596 | |
| CTR Partnership LP/CareTrust Capital Corp. 5.25% 6/1/25 | 3,020 | 2,945 | |
| DaVita HealthCare Partners, Inc.: | |||
| 5% 5/1/25 | 4,445 | 4,184 | |
| 5.125% 7/15/24 | 5,400 | 5,157 | |
| HCA Holdings, Inc.: | |||
| 5.375% 2/1/25 | 4,375 | 4,402 | |
| 5.375% 9/1/26 | 1,960 | 1,924 | |
| 5.625% 9/1/28 | 2,395 | 2,350 | |
| 5.875% 2/15/26 | 2,290 | 2,342 | |
| 7.5% 2/15/22 | 5,095 | 5,528 | |
| HealthSouth Corp.: | |||
| 5.75% 11/1/24 | 1,570 | 1,566 | |
| 5.75% 9/15/25 | 400 | 396 | |
| HLF Financing SARL LLC / Herbalife International, Inc. 7.25% 8/15/26(a) | 595 | 602 | |
| Hologic, Inc.: | |||
| 4.375% 10/15/25 (a) | 1,860 | 1,744 | |
| 4.625% 2/1/28 (a) | 645 | 589 | |
| IMS Health, Inc. 5% 10/15/26 (a) | 1,125 | 1,082 | |
| MPT Operating Partnership LP/MPT Finance Corp.: | |||
| 5% 10/15/27 | 6,875 | 6,460 | |
| 5.25% 8/1/26 | 1,890 | 1,824 | |
| Teleflex, Inc. 4.625% 11/15/27 | 765 | 710 | |
| Tenet Healthcare Corp.: | |||
| 4.375% 10/1/21 | 3,350 | 3,312 | |
| 4.625% 7/15/24 | 5,035 | 4,853 | |
| 5.125% 5/1/25 | 6,430 | 6,189 | |
| 6.75% 2/1/20 | 1,800 | 1,850 | |
| 6.75% 6/15/23 | 14,025 | 13,986 | |
| 8.125% 4/1/22 | 8,975 | 9,345 | |
| Valeant Pharmaceuticals International, Inc.: | |||
| 5.5% 3/1/23 (a) | 4,720 | 4,472 | |
| 5.875% 5/15/23 (a) | 11,515 | 11,011 | |
| 6.125% 4/15/25 (a) | 5,110 | 4,700 | |
| 7% 3/15/24 (a) | 3,215 | 3,367 | |
| 7.5% 7/15/21 (a) | 4,164 | 4,226 | |
| 9% 12/15/25 (a) | 2,040 | 2,127 | |
| 9.25% 4/1/26 (a) | 6,050 | 6,345 | |
| Vizient, Inc. 10.375% 3/1/24 (a) | 2,275 | 2,480 | |
| Wellcare Health Plans, Inc.: | |||
| 5.25% 4/1/25 | 1,570 | 1,566 | |
| 5.375% 8/15/26 (a) | 1,185 | 1,182 | |
| TOTAL HEALTHCARE | 151,642 | ||
| Homebuilders/Real Estate - 0.5% | |||
| Brookfield Residential Properties, Inc./Brookfield Residential U.S. Corp. 6.125% 7/1/22 (a) | 1,290 | 1,264 | |
| Brookfield Residential Properties, Inc. 6.5% 12/15/20 (a) | 1,840 | 1,840 | |
| Shea Homes Ltd. Partnership/Corp.: | |||
| 5.875% 4/1/23 (a) | 1,570 | 1,476 | |
| 6.125% 4/1/25 (a) | 1,150 | 1,070 | |
| West Street Merger Sub, Inc. 6.375% 9/1/25 (a) | 3,690 | 3,459 | |
| TOTAL HOMEBUILDERS/REAL ESTATE | 9,109 | ||
| Hotels - 0.5% | |||
| Hilton Domestic Operating Co., Inc. 5.125% 5/1/26 (a) | 4,570 | 4,467 | |
| Marriott Ownership Resorts, Inc. 6.5% 9/15/26 (a) | 1,425 | 1,439 | |
| Wyndham Hotels & Resorts, Inc. 5.375% 4/15/26 (a) | 2,730 | 2,648 | |
| TOTAL HOTELS | 8,554 | ||
| Insurance - 0.5% | |||
| Acrisure LLC / Acrisure Finance, Inc. 7% 11/15/25 (a) | 2,770 | 2,472 | |
| Alliant Holdings Co.-Issuer, Inc./Wayne Merger Sub LLC 8.25% 8/1/23 (a) | 570 | 589 | |
| AmWINS Group, Inc. 7.75% 7/1/26 (a) | 2,595 | 2,666 | |
| HUB International Ltd. 7% 5/1/26 (a) | 1,750 | 1,708 | |
| USIS Merger Sub, Inc. 6.875% 5/1/25 (a) | 2,355 | 2,296 | |
| TOTAL INSURANCE | 9,731 | ||
| Leisure - 0.8% | |||
| Mattel, Inc. 6.75% 12/31/25 (a) | 7,015 | 6,697 | |
| NVA Holdings, Inc. 6.875% 4/1/26 (a) | 975 | 963 | |
| Studio City Co. Ltd.: | |||
| 5.875% 11/30/19 (a) | 1,400 | 1,412 | |
| 7.25% 11/30/21 (a) | 3,645 | 3,750 | |
| Voc Escrow Ltd. 5% 2/15/28 (a) | 1,625 | 1,528 | |
| TOTAL LEISURE | 14,350 | ||
| Metals/Mining - 1.1% | |||
| Alcoa Nederland Holding BV 6.125% 5/15/28 (a) | 525 | 524 | |
| Alpha Natural Resources, Inc. 9.75% 4/15/18 (b)(c) | 1,770 | 0 | |
| First Quantum Minerals Ltd.: | |||
| 6.5% 3/1/24 (a) | 2,020 | 1,762 | |
| 6.875% 3/1/26 (a) | 2,020 | 1,745 | |
| 7.5% 4/1/25 (a) | 3,220 | 2,874 | |
| FMG Resources (August 2006) Pty Ltd.: | |||
| 4.75% 5/15/22 (a) | 1,330 | 1,277 | |
| 5.125% 3/15/23 (a) | 1,920 | 1,853 | |
| Freeport-McMoRan, Inc. 6.875% 2/15/23 | 7,290 | 7,627 | |
| Joseph T Ryerson & Son, Inc. 11% 5/15/22 (a) | 1,200 | 1,284 | |
| Murray Energy Corp. 11.25% 4/15/21 (a) | 1,145 | 727 | |
| TOTAL METALS/MINING | 19,673 | ||
| Paper - 0.1% | |||
| Flex Acquisition Co., Inc. 6.875% 1/15/25 (a) | 940 | 879 | |
| Restaurants - 0.5% | |||
| 1011778 BC Unlimited Liability Co./New Red Finance, Inc. 5% 10/15/25 (a) | 3,545 | 3,323 | |
| Golden Nugget, Inc.: | |||
| 6.75% 10/15/24 (a) | 3,340 | 3,332 | |
| 8.75% 10/1/25 (a) | 1,630 | 1,675 | |
| KFC Holding Co./Pizza Hut Holding LLC 4.75% 6/1/27 (a) | 1,530 | 1,438 | |
| TOTAL RESTAURANTS | 9,768 | ||
| Services - 1.5% | |||
| APX Group, Inc.: | |||
| 7.625% 9/1/23 | 4,115 | 3,662 | |
| 7.875% 12/1/22 | 4,370 | 4,392 | |
| Aramark Services, Inc. 5% 2/1/28 (a) | 3,170 | 3,008 | |
| Avantor, Inc. 6% 10/1/24 (a) | 1,835 | 1,830 | |
| Brand Energy & Infrastructure Services, Inc. 8.5% 7/15/25 (a) | 4,635 | 4,565 | |
| CDK Global, Inc. 5.875% 6/15/26 | 670 | 675 | |
| Frontdoor, Inc. 6.75% 8/15/26 (a) | 1,570 | 1,601 | |
| IHS Markit Ltd. 4% 3/1/26 (a) | 825 | 776 | |
| Jurassic Holdings III, Inc. 6.875% 2/15/21 (Reg. S) (a) | 2,095 | 1,959 | |
| Laureate Education, Inc. 8.25% 5/1/25 (a) | 4,775 | 5,121 | |
| TOTAL SERVICES | 27,589 | ||
| Steel - 0.5% | |||
| ArcelorMittal SA: | |||
| 6.75% 3/1/41 (d) | 75 | 81 | |
| 7% 10/15/39 (d) | 3,113 | 3,444 | |
| Big River Steel LLC/BRS Finance Corp. 7.25% 9/1/25 (a) | 1,495 | 1,559 | |
| Cleveland-Cliffs, Inc. 5.75% 3/1/25 | 5,055 | 4,777 | |
| TOTAL STEEL | 9,861 | ||
| Super Retail - 0.4% | |||
| Netflix, Inc.: | |||
| 4.375% 11/15/26 | 3,540 | 3,240 | |
| 4.875% 4/15/28 (a) | 2,060 | 1,890 | |
| 5.875% 11/15/28 (a) | 2,750 | 2,702 | |
| TOTAL SUPER RETAIL | 7,832 | ||
| Technology - 2.8% | |||
| Balboa Merger Sub, Inc. 11.375% 12/1/21 (a) | 10,620 | 11,257 | |
| Banff Merger Sub, Inc. 9.75% 9/1/26 (a) | 5,935 | 5,698 | |
| EIG Investors Corp. 10.875% 2/1/24 | 3,405 | 3,677 | |
| Ensemble S Merger Sub, Inc. 9% 9/30/23 (a) | 5,375 | 5,563 | |
| Entegris, Inc. 4.625% 2/10/26 (a) | 2,080 | 1,932 | |
| j2 Cloud Services LLC/j2 Global Communications, Inc. 6% 7/15/25 (a) | 1,320 | 1,308 | |
| Match Group, Inc. 5% 12/15/27 (a) | 1,485 | 1,414 | |
| Qorvo, Inc. 5.5% 7/15/26 (a) | 2,125 | 2,130 | |
| Solera LLC/Solera Finance, Inc. 10.5% 3/1/24 (a) | 5,815 | 6,309 | |
| TTM Technologies, Inc. 5.625% 10/1/25 (a) | 640 | 624 | |
| Uber Technologies, Inc. 8% 11/1/26 (a)(f) | 6,040 | 6,070 | |
| Veritas U.S., Inc./Veritas Bermuda Ltd. 10.5% 2/1/24 (a) | 6,550 | 5,633 | |
| TOTAL TECHNOLOGY | 51,615 | ||
| Telecommunications - 7.0% | |||
| Altice Financing SA 7.5% 5/15/26 (a) | 4,005 | 3,765 | |
| Altice Finco SA: | |||
| 7.625% 2/15/25 (a) | 4,995 | 4,439 | |
| 8.125% 1/15/24 (a) | 810 | 796 | |
| C&W Senior Financing Designated Activity Co.: | |||
| 6.875% 9/15/27 (a) | 2,015 | 1,919 | |
| 7.5% 10/15/26 (a) | 1,620 | 1,624 | |
| CyrusOne LP/CyrusOne Finance Corp.: | |||
| 5% 3/15/24 | 1,295 | 1,295 | |
| 5.375% 3/15/27 | 1,070 | 1,062 | |
| Equinix, Inc. 5.375% 5/15/27 | 1,575 | 1,559 | |
| Frontier Communications Corp.: | |||
| 8.5% 4/1/26 (a) | 4,565 | 4,240 | |
| 11% 9/15/25 | 7,060 | 5,171 | |
| GCI, Inc. 6.875% 4/15/25 | 2,080 | 2,146 | |
| Intelsat Jackson Holdings SA: | |||
| 8% 2/15/24 (a) | 8,435 | 8,825 | |
| 8.5% 10/15/24 (a) | 9,300 | 9,137 | |
| Level 3 Financing, Inc. 6.125% 1/15/21 | 2,395 | 2,401 | |
| Neptune Finco Corp.: | |||
| 10.125% 1/15/23 (a) | 6,910 | 7,501 | |
| 10.875% 10/15/25 (a) | 5,445 | 6,282 | |
| Sable International Finance Ltd. 6.875% 8/1/22 (a) | 2,415 | 2,521 | |
| SFR Group SA: | |||
| 6.25% 5/15/24 (a) | 1,150 | 1,103 | |
| 7.375% 5/1/26 (a) | 5,140 | 4,920 | |
| 8.125% 2/1/27 (a) | 5,190 | 5,138 | |
| Sprint Capital Corp.: | |||
| 6.875% 11/15/28 | 4,320 | 4,244 | |
| 8.75% 3/15/32 | 6,275 | 6,855 | |
| Sprint Communications, Inc.: | |||
| 6% 11/15/22 | 9,884 | 9,977 | |
| 9% 11/15/18 (a) | 5,500 | 5,511 | |
| Sprint Corp.: | |||
| 7.125% 6/15/24 | 4,195 | 4,289 | |
| 7.625% 2/15/25 | 825 | 857 | |
| 7.625% 3/1/26 | 1,540 | 1,595 | |
| 7.875% 9/15/23 | 8,400 | 8,967 | |
| Wind Tre SpA 5% 1/20/26 (a) | 3,195 | 2,720 | |
| Zayo Group LLC/Zayo Capital, Inc.: | |||
| 5.75% 1/15/27 (a) | 4,400 | 4,313 | |
| 6% 4/1/23 | 3,795 | 3,871 | |
| TOTAL TELECOMMUNICATIONS | 129,043 | ||
| Textiles/Apparel - 0.0% | |||
| Eagle Intermediate Global Holding BV 7.5% 5/1/25 (a) | 695 | 672 | |
| Transportation Ex Air/Rail - 1.8% | |||
| Avolon Holdings Funding Ltd.: | |||
| 5.125% 10/1/23 (a) | 8,485 | 8,326 | |
| 5.5% 1/15/23 (a) | 3,475 | 3,458 | |
| Navios Maritime Acquisition Corp./Navios Acquisition Finance U.S., Inc. 8.125% 11/15/21 (a) | 5,575 | 4,676 | |
| Navios Maritime Holdings, Inc.: | |||
| 7.375% 1/15/22 (a) | 7,435 | 5,613 | |
| 11.25% 8/15/22 (a) | 3,155 | 2,745 | |
| Navios South American Logistics, Inc./Navios Logistics Finance U.S., Inc. 7.25% 5/1/22 (a) | 980 | 911 | |
| Teekay Corp. 8.5% 1/15/20 | 6,825 | 6,927 | |
| TOTAL TRANSPORTATION EX AIR/RAIL | 32,656 | ||
| Utilities - 4.4% | |||
| Calpine Corp.: | |||
| 5.375% 1/15/23 | 2,615 | 2,478 | |
| 5.75% 1/15/25 | 1,120 | 1,001 | |
| Clearway Energy Operating LLC 5.75% 10/15/25 (a) | 2,135 | 2,103 | |
| Dynegy, Inc.: | |||
| 5.875% 6/1/23 | 2,830 | 2,872 | |
| 7.375% 11/1/22 | 7,415 | 7,693 | |
| 7.625% 11/1/24 | 11,143 | 11,784 | |
| InterGen NV 7% 6/30/23 (a) | 19,427 | 19,087 | |
| NRG Energy, Inc. 5.75% 1/15/28 | 9,470 | 9,446 | |
| Pattern Energy Group, Inc. 5.875% 2/1/24 (a) | 965 | 955 | |
| Talen Energy Supply LLC: | |||
| 6.5% 6/1/25 | 4,530 | 3,375 | |
| 10.5% 1/15/26 (a) | 7,190 | 6,318 | |
| TerraForm Global, Inc. 6.125% 3/1/26 (a) | 3,110 | 2,892 | |
| The AES Corp.: | |||
| 4% 3/15/21 | 3,920 | 3,881 | |
| 4.5% 3/15/23 | 2,590 | 2,554 | |
| 5.125% 9/1/27 | 1,500 | 1,481 | |
| Vertiv Group Corp. 9.25% 10/15/24 (a) | 1,135 | 1,129 | |
| Vistra Operations Co. LLC 5.5% 9/1/26 (a) | 2,545 | 2,507 | |
| TOTAL UTILITIES | 81,556 | ||
| TOTAL NONCONVERTIBLE BONDS | |||
| (Cost $1,262,415) | 1,230,561 | ||
| Shares | Value (000s) | ||
| Common Stocks - 17.3% | |||
| Air Transportation - 0.4% | |||
| Air Canada (g) | 193,100 | 3,664 | |
| Delta Air Lines, Inc. | 76,000 | 4,159 | |
| TOTAL AIR TRANSPORTATION | 7,823 | ||
| Automotive & Auto Parts - 0.4% | |||
| Allison Transmission Holdings, Inc. | 84,000 | 3,703 | |
| General Motors Co. warrants 7/10/19 (g) | 11,706 | 224 | |
| Lear Corp. | 17,400 | 2,312 | |
| Motors Liquidation Co. GUC Trust (g) | 39,254 | 391 | |
| UC Holdings, Inc. (c) | 29,835 | 623 | |
| TOTAL AUTOMOTIVE & AUTO PARTS | 7,253 | ||
| Banks & Thrifts - 0.5% | |||
| Bank of America Corp. | 243,700 | 6,702 | |
| Wells Fargo & Co. | 51,500 | 2,741 | |
| WMI Holdings Corp. (g) | 1,467 | 21 | |
| TOTAL BANKS & THRIFTS | 9,464 | ||
| Broadcasting - 1.2% | |||
| Gray Television, Inc. (g) | 594,070 | 10,283 | |
| Nexstar Broadcasting Group, Inc. Class A | 122,000 | 9,137 | |
| Sinclair Broadcast Group, Inc. Class A | 100,000 | 2,864 | |
| TOTAL BROADCASTING | 22,284 | ||
| Cable/Satellite TV - 0.6% | |||
| Altice U.S.A., Inc. Class A | 289,400 | 4,720 | |
| Charter Communications, Inc. Class A (g) | 20,048 | 6,423 | |
| TOTAL CABLE/SATELLITE TV | 11,143 | ||
| Capital Goods - 0.3% | |||
| Spectrum Brands Holdings, Inc. | 81,100 | 5,267 | |
| Chemicals - 1.4% | |||
| DowDuPont, Inc. | 103,800 | 5,597 | |
| LyondellBasell Industries NV Class A | 41,295 | 3,686 | |
| Platform Specialty Products Corp. (g) | 681,930 | 7,378 | |
| The Chemours Co. LLC | 216,300 | 7,140 | |
| Tronox Ltd. Class A | 161,543 | 1,850 | |
| TOTAL CHEMICALS | 25,651 | ||
| Consumer Products - 0.1% | |||
| Newell Brands, Inc. | 136,100 | 2,161 | |
| Containers - 0.2% | |||
| Graphic Packaging Holding Co. | 255,174 | 2,809 | |
| Diversified Financial Services - 0.5% | |||
| OneMain Holdings, Inc. (g) | 78,000 | 2,225 | |
| The Blackstone Group LP | 221,900 | 7,181 | |
| TOTAL DIVERSIFIED FINANCIAL SERVICES | 9,406 | ||
| Energy - 1.0% | |||
| Ascent Resources Marcellus Holdings, Inc. (c)(h) | 175,172 | 557 | |
| Ascent Resources Marcellus Holdings, Inc. warrants 3/30/23 (c)(g) | 49,910 | 25 | |
| California Resources Corp. (g)(i) | 169,600 | 5,315 | |
| Forbes Energy Services Ltd. (g) | 65,062 | 329 | |
| GulfMark Offshore, Inc.: | |||
| warrants 10/21/42 (c)(g) | 12,651 | 443 | |
| warrants 11/14/42 (c)(g) | 36,326 | 1,271 | |
| Parsley Energy, Inc. Class A (g) | 165,900 | 3,885 | |
| Pioneer Natural Resources Co. | 27,500 | 4,050 | |
| SM Energy Co. | 65,739 | 1,600 | |
| Teekay LNG Partners LP | 900 | 13 | |
| TOTAL ENERGY | 17,488 | ||
| Food & Drug Retail - 0.1% | |||
| Southeastern Grocers, Inc. (c)(g) | 57,894 | 2,349 | |
| Food/Beverage/Tobacco - 0.5% | |||
| Darling International, Inc. (g) | 222,500 | 4,597 | |
| JBS SA | 1,485,300 | 4,091 | |
| TOTAL FOOD/BEVERAGE/TOBACCO | 8,688 | ||
| Gaming - 2.3% | |||
| Boyd Gaming Corp. | 282,300 | 7,498 | |
| Eldorado Resorts, Inc. (g) | 259,000 | 9,454 | |
| Golden Entertainment, Inc. (g) | 154,929 | 2,815 | |
| Melco Crown Entertainment Ltd. sponsored ADR | 291,100 | 4,841 | |
| Penn National Gaming, Inc. (g) | 296,100 | 7,189 | |
| Red Rock Resorts, Inc. | 182,885 | 4,232 | |
| Scientific Games Corp. Class A (g) | 6,615 | 147 | |
| Studio City International Holdings Ltd. ADR | 35,600 | 730 | |
| Wynn Resorts Ltd. | 50,000 | 5,030 | |
| TOTAL GAMING | 41,936 | ||
| Healthcare - 1.0% | |||
| Boston Scientific Corp. (g) | 180,600 | 6,527 | |
| Jazz Pharmaceuticals PLC (g) | 43,647 | 6,932 | |
| Tenet Healthcare Corp. (g) | 224,600 | 5,779 | |
| TOTAL HEALTHCARE | 19,238 | ||
| Homebuilders/Real Estate - 0.2% | |||
| Lennar Corp.: | |||
| Class A | 70,387 | 3,025 | |
| Class B | 2,415 | 86 | |
| TOTAL HOMEBUILDERS/REAL ESTATE | 3,111 | ||
| Metals/Mining - 0.0% | |||
| Warrior Metropolitan Coal, Inc. | 692 | 19 | |
| Services - 0.9% | |||
| CDK Global, Inc. | 83,700 | 4,791 | |
| HD Supply Holdings, Inc. (g) | 175,200 | 6,582 | |
| United Rentals, Inc. (g) | 36,900 | 4,431 | |
| TOTAL SERVICES | 15,804 | ||
| Steel - 0.0% | |||
| ANR, Inc. (g) | 3,065 | 107 | |
| Super Retail - 0.0% | |||
| Arena Brands Holding Corp. Class B (c)(g)(j) | 42,253 | 154 | |
| Technology - 3.9% | |||
| Alphabet, Inc. Class A (g) | 6,500 | 7,089 | |
| Broadcom, Inc. | 26,300 | 5,878 | |
| CDW Corp. | 58,700 | 5,284 | |
| Dell Technologies, Inc. (g) | 47,900 | 4,330 | |
| Facebook, Inc. Class A (g) | 28,694 | 4,355 | |
| First Data Corp. Class A (g) | 390,000 | 7,309 | |
| Micron Technology, Inc. (g) | 238,000 | 8,977 | |
| Microsoft Corp. | 51,000 | 5,447 | |
| ON Semiconductor Corp. (g) | 420,100 | 7,142 | |
| Presidio, Inc. | 262,444 | 3,517 | |
| Qorvo, Inc. (g) | 85,600 | 6,292 | |
| Skyworks Solutions, Inc. | 59,500 | 5,162 | |
| TOTAL TECHNOLOGY | 70,782 | ||
| Telecommunications - 0.7% | |||
| Alibaba Group Holding Ltd. sponsored ADR (g) | 35,400 | 5,037 | |
| T-Mobile U.S., Inc. (g) | 121,700 | 8,343 | |
| TOTAL TELECOMMUNICATIONS | 13,380 | ||
| Utilities - 1.1% | |||
| NRG Energy, Inc. | 356,700 | 12,909 | |
| NRG Yield, Inc. Class C | 280,600 | 5,503 | |
| Vistra Energy Corp. (g) | 116,382 | 2,634 | |
| TOTAL UTILITIES | 21,046 | ||
| TOTAL COMMON STOCKS | |||
| (Cost $284,843) | 317,363 | ||
| Convertible Preferred Stocks - 0.4% | |||
| Technology - 0.2% | |||
| Lyft, Inc. Series I (c)(j) | 84,470 | 4,000 | |
| Utilities - 0.2% | |||
| Vistra Energy Corp. 7.00% | 45,600 | 4,154 | |
| TOTAL CONVERTIBLE PREFERRED STOCKS | |||
| (Cost $7,793) | 8,154 | ||
| Principal Amount (000s) | Value (000s) | ||
| Bank Loan Obligations - 5.9% | |||
| Broadcasting - 0.0% | |||
| NEP/NCP Holdco, Inc. Tranche B 1LN, term loan 3 month U.S. LIBOR + 3.250% 5.4743% 10/19/25 (d)(e) | 110 | 110 | |
| Cable/Satellite TV - 0.7% | |||
| Mediacom Illinois LLC Tranche N, term loan 3 month U.S. LIBOR + 1.750% 3.97% 2/15/24 (d)(e) | 2,582 | 2,574 | |
| Numericable LLC Tranche B 12LN, term loan 3 month U.S. LIBOR + 3.688% 5.967% 1/31/26 (d)(e) | 4,797 | 4,672 | |
| WideOpenWest Finance LLC Tranche B, term loan 3 month U.S. LIBOR + 3.250% 5.5395% 8/19/23 (d)(e) | 6,585 | 6,338 | |
| TOTAL CABLE/SATELLITE TV | 13,584 | ||
| Chemicals - 0.9% | |||
| Messer Industrie GmbH Tranche B 1LN, term loan 3 month U.S. LIBOR + 2.500% 9/28/25 (e)(k) | 6,415 | 6,413 | |
| Starfruit U.S. Holdco LLC Tranche B, term loan 3 month U.S. LIBOR + 3.250% 5.506% 10/1/25 (d)(e) | 1,110 | 1,106 | |
| The Chemours Co. LLC Tranche B 1LN, term loan 3 month U.S. LIBOR + 1.750% 4.05% 4/3/25 (d)(e) | 7,438 | 7,405 | |
| Tronox Blocked Borrower LLC Tranche B, term loan 3 month U.S. LIBOR + 3.000% 5.302% 9/22/24 (d)(e) | 222 | 222 | |
| Tronox Finance LLC Tranche B, term loan 3 month U.S. LIBOR + 3.000% 5.302% 9/22/24 (d)(e) | 512 | 512 | |
| TOTAL CHEMICALS | 15,658 | ||
| Diversified Financial Services - 0.3% | |||
| Financial & Risk U.S. Holdings, Inc. Tranche B, term loan 3 month U.S. LIBOR + 3.750% 6.052% 10/1/25 (d)(e) | 5,495 | 5,435 | |
| Energy - 1.2% | |||
| Ascent Resources Marcellus LLC term loan 3 month U.S. LIBOR + 6.500% 8.7806% 3/30/23 (d)(e) | 268 | 269 | |
| BCP Raptor II LLC Tranche B, term loan 3 month U.S. LIBOR + 4.750% 10/22/25 (e)(k) | 945 | 938 | |
| California Resources Corp.: | |||
| Tranche 1LN, term loan 3 month U.S. LIBOR + 10.375% 12.6699% 12/31/21 (d)(e) | 7,005 | 7,793 | |
| Tranche B, term loan 3 month U.S. LIBOR + 4.750% 7.0365% 12/31/22 (d)(e) | 4,425 | 4,484 | |
| Forbes Energy Services LLC Tranche B, term loan 14% 4/13/21 (c)(d) | 694 | 699 | |
| Gavilan Resources LLC Tranche 2LN, term loan 3 month U.S. LIBOR + 6.000% 8.2796% 3/1/24 (d)(e) | 5,790 | 5,393 | |
| GIP III Stetson I LP Tranche B, term loan 3 month U.S. LIBOR + 4.250% 6.6946% 7/18/25 (d)(e) | 795 | 796 | |
| Natgasoline LLC Tranche B, term loan 3 month U.S. LIBOR + 3.500% 5.9446% 10/31/25 (d)(e) | 345 | 345 | |
| Pacific Drilling SA: | |||
| DIP, term loan 3 month U.S. LIBOR + 7.000% 5.8714% 11/30/18 (c)(e)(l) | 743 | 743 | |
| Tranche B, term loan 3 month U.S. LIBOR + 3.500% 0% 6/3/18 (b)(e) | 564 | 253 | |
| TOTAL ENERGY | 21,713 | ||
| Entertainment/Film - 0.2% | |||
| Cinemark U.S.A., Inc. Tranche B, term loan 3 month U.S. LIBOR + 1.750% 4.05% 3/29/25 (d)(e) | 3,216 | 3,217 | |
| Food & Drug Retail - 0.5% | |||
| BI-LO LLC Tranche B, term loan 3 month U.S. LIBOR + 8.000% 10.3645% 5/31/24 (d)(e) | 7,980 | 7,870 | |
| Tops Markets LLC term loan 3 month U.S. LIBOR + 9.500% 11.8125% 2/23/19 (c)(d)(e) | 1,733 | 1,737 | |
| TOTAL FOOD & DRUG RETAIL | 9,607 | ||
| Food/Beverage/Tobacco - 0.0% | |||
| U.S. Foods, Inc. Tranche B, term loan 3 month U.S. LIBOR + 2.000% 4.302% 6/27/23 (d)(e) | 786 | 784 | |
| Gaming - 0.5% | |||
| Stars Group Holdings BV Tranche B, term loan 3 month U.S. LIBOR + 3.500% 5.8861% 7/10/25 (d)(e) | 8,514 | 8,544 | |
| Healthcare - 0.0% | |||
| HLF Financing SARL LLC Tranche B 1LN, term loan 3 month U.S. LIBOR + 3.250% 5.552% 8/18/25 (d)(e) | 385 | 386 | |
| Insurance - 0.3% | |||
| Asurion LLC: | |||
| Tranche B 7LN, term loan 3 month U.S. LIBOR + 3.000% 5.302% 11/3/24 (d)(e) | 4,778 | 4,781 | |
| Tranche B, term loan 3 month U.S. LIBOR + 6.500% 8.802% 8/4/25 (d)(e) | 445 | 456 | |
| TOTAL INSURANCE | 5,237 | ||
| Leisure - 0.3% | |||
| Alterra Mountain Co. Tranche B 1LN, term loan 3 month U.S. LIBOR + 3.000% 5.302% 7/31/24 (d)(e) | 55 | 55 | |
| Crown Finance U.S., Inc. Tranche B 1LN, term loan 3 month U.S. LIBOR + 2.500% 4.802% 2/28/25 (d)(e) | 6,070 | 6,040 | |
| TOTAL LEISURE | 6,095 | ||
| Publishing/Printing - 0.1% | |||
| Cengage Learning, Inc. Tranche B, term loan 3 month U.S. LIBOR + 4.250% 6.5296% 6/7/23 (d)(e) | 2,300 | 2,128 | |
| Services - 0.2% | |||
| KUEHG Corp.: | |||
| Tranche B 2LN, term loan 3 month U.S. LIBOR + 8.250% 10.6361% 8/22/25 (d)(e) | 2,615 | 2,648 | |
| Tranche B, term loan 3 month U.S. LIBOR + 3.750% 6.1361% 2/21/25 (d)(e) | 793 | 795 | |
| TOTAL SERVICES | 3,443 | ||
| Super Retail - 0.2% | |||
| Bass Pro Shops LLC. Tranche B, term loan 3 month U.S. LIBOR + 5.000% 7.302% 9/25/24 (d)(e) | 3,690 | 3,689 | |
| Technology - 0.4% | |||
| Anastasia Parent LLC Tranche B, term loan 3 month U.S. LIBOR + 3.750% 6.0267% 8/3/25 (d)(e) | 470 | 464 | |
| SS&C Technologies, Inc. Tranche B 5LN, term loan 3 month U.S. LIBOR + 2.500% 4.552% 4/16/25 (d)(e) | 490 | 487 | |
| Uber Technologies, Inc. Tranche B, term loan: | |||
| 3 month U.S. LIBOR + 3.500% 5.7795% 7/13/23 (d)(e) | 2,517 | 2,516 | |
| 3 month U.S. LIBOR + 4.000% 6.2806% 4/4/25 (d)(e) | 1,980 | 1,978 | |
| Web.com Group, Inc.: | |||
| 2LN, term loan 3 month U.S. LIBOR + 7.750% 10.1704% 10/11/26 (d)(e) | 903 | 896 | |
| Tranche B 1LN, term loan 3 month U.S. LIBOR + 3.750% 6.1704% 10/11/25 (d)(e) | 365 | 364 | |
| TOTAL TECHNOLOGY | 6,705 | ||
| Telecommunications - 0.1% | |||
| Intelsat Jackson Holdings SA Tranche B, term loan 3 month U.S. LIBOR + 3.750% 6.0449% 11/27/23 (d)(e) | 2,155 | 2,155 | |
| TOTAL BANK LOAN OBLIGATIONS | |||
| (Cost $108,319) | 108,490 | ||
| Preferred Securities - 3.5% | |||
| Banks & Thrifts - 3.5% | |||
| Bank of America Corp.: | |||
| 5.875% (d)(m) | 17,640 | 17,245 | |
| 6.1% (d)(m) | 2,590 | 2,678 | |
| Barclays Bank PLC 7.625% 11/21/22 | 10,205 | 11,241 | |
| Citigroup, Inc.: | |||
| 5.35% (d)(m) | 12,655 | 12,477 | |
| 6.3% (d)(m) | 4,585 | 4,691 | |
| Credit Agricole SA: | |||
| 6.625% (a)(d)(m) | 2,830 | 2,875 | |
| 7.875% (a)(d)(m) | 2,365 | 2,465 | |
| 8.125% (a)(d)(m) | 6,230 | 6,736 | |
| Goldman Sachs Group, Inc. 5.375% (d)(m) | 4,045 | 4,194 | |
| TOTAL PREFERRED SECURITIES | |||
| (Cost $65,316) | 64,602 | ||
| Shares | Value (000s) | ||
| Money Market Funds - 5.6% | |||
| Fidelity Cash Central Fund, 2.23% (n) | 99,398,729 | 99,419 | |
| Fidelity Securities Lending Cash Central Fund 2.23% (n)(o) | 2,376,737 | 2,377 | |
| TOTAL MONEY MARKET FUNDS | |||
| (Cost $101,796) | 101,796 | ||
| TOTAL INVESTMENT IN SECURITIES - 99.8% | |||
| (Cost $1,830,482) | 1,830,966 | ||
| NET OTHER ASSETS (LIABILITIES) - 0.2% | 4,360 | ||
| NET ASSETS - 100% | $1,835,326 |
Values shown as $0 in the Schedule of Investments may reflect amounts less than $500.
Legend
(a) Security exempt from registration under Rule 144A of the Securities Act of 1933. These securities may be resold in transactions exempt from registration, normally to qualified institutional buyers. At the end of the period, the value of these securities amounted to $721,804,000 or 39.3% of net assets.
(b) Non-income producing - Security is in default.
(c) Level 3 security
(d) Coupon rates for floating and adjustable rate securities reflect the rates in effect at period end.
(e) Coupon is indexed to a floating interest rate which may be multiplied by a specified factor and/or subject to caps or floors.
(f) Security or a portion of the security purchased on a delayed delivery or when-issued basis.
(g) Non-income producing
(h) A portion of the security sold on a delayed delivery basis.
(i) Security or a portion of the security is on loan at period end.
(j) Restricted securities - Investment in securities not registered under the Securities Act of 1933 (excluding 144A issues). At the end of the period, the value of restricted securities (excluding 144A issues) amounted to $4,154,000 or 0.2% of net assets.
(k) The coupon rate will be determined upon settlement of the loan after period end.
(l) Position or a portion of the position represents an unfunded loan commitment. At period end, the total principal amount and market value of unfunded commitments totaled $306,000 and $306,000, respectively.
(m) Security is perpetual in nature with no stated maturity date.
(n) Affiliated fund that is generally available only to investment companies and other accounts managed by Fidelity Investments. The rate quoted is the annualized seven-day yield of the fund at period end. A complete unaudited listing of the fund's holdings as of its most recent quarter end is available upon request. In addition, each Fidelity Central Fund's financial statements, which are not covered by the Fund's Report of Independent Registered Public Accounting Firm, are available on the SEC's website or upon request.
(o) Investment made with cash collateral received from securities on loan.
Additional information on each restricted holding is as follows:
| Security | Acquisition Date | Acquisition Cost (000s) |
| Arena Brands Holding Corp. Class B | 6/18/97 - 7/13/98 | $1,538 |
| Lyft, Inc. Series I | 6/27/18 | $4,000 |
Affiliated Central Funds
Information regarding fiscal year to date income earned by the Fund from investments in Fidelity Central Funds is as follows:
| Fund | Income earned |
| (Amounts in thousands) | |
| Fidelity Cash Central Fund | $1,569 |
| Fidelity Securities Lending Cash Central Fund | 146 |
| Total | $1,715 |
Amounts in the income column in the above table include any capital gain distributions from underlying funds, which are presented in the corresponding line-item in the Statement of Operations if applicable.
Investment Valuation
The following is a summary of the inputs used, as of October 31, 2018, involving the Fund's assets and liabilities carried at fair value. The inputs or methodology used for valuing securities may not be an indication of the risk associated with investing in those securities. For more information on valuation inputs, and their aggregation into the levels used below, please refer to the Investment Valuation section in the accompanying Notes to Financial Statements.
| Valuation Inputs at Reporting Date: | ||||
| Description | Total | Level 1 | Level 2 | Level 3 |
| (Amounts in thousands) | ||||
| Investments in Securities: | ||||
| Equities: | ||||
| Communication Services | $48,494 | $48,494 | $-- | $-- |
| Consumer Discretionary | 60,278 | 59,501 | -- | 777 |
| Consumer Staples | 16,304 | 13,955 | -- | 2,349 |
| Energy | 17,595 | 15,299 | -- | 2,296 |
| Financials | 19,261 | 19,261 | -- | -- |
| Health Care | 19,238 | 19,238 | -- | -- |
| Industrials | 22,539 | 22,539 | -- | -- |
| Information Technology | 68,129 | 64,129 | -- | 4,000 |
| Materials | 28,479 | 28,479 | -- | -- |
| Utilities | 25,200 | 21,046 | 4,154 | -- |
| Corporate Bonds | 1,230,561 | -- | 1,230,560 | 1 |
| Bank Loan Obligations | 108,490 | -- | 105,311 | 3,179 |
| Preferred Securities | 64,602 | -- | 64,602 | -- |
| Money Market Funds | 101,796 | 101,796 | -- | -- |
| Total Investments in Securities: | $1,830,966 | $413,737 | $1,404,627 | $12,602 |
Other Information
Distribution of investments by country or territory of incorporation, as a percentage of Total Net Assets, is as follows (Unaudited):
| United States of America | 78.3% |
| Luxembourg | 4.0% |
| Canada | 3.6% |
| Netherlands | 3.1% |
| Cayman Islands | 2.9% |
| Multi-National | 1.6% |
| United Kingdom | 1.6% |
| France | 1.4% |
| Others (Individually Less Than 1%) | 3.5% |
| 100.0% |
See accompanying notes which are an integral part of the financial statements.
Financial Statements
Statement of Assets and Liabilities
| Amounts in thousands (except per-share amounts) | October 31, 2018 | |
| Assets | ||
| Investment in securities, at value (including securities loaned of $2,423) — See accompanying schedule: Unaffiliated issuers (cost $1,728,686) | $1,729,170 | |
| Fidelity Central Funds (cost $101,796) | 101,796 | |
| Total Investment in Securities (cost $1,830,482) | $1,830,966 | |
| Cash | 52 | |
| Receivable for investments sold | ||
| Regular delivery | 7,911 | |
| Delayed delivery | 55 | |
| Receivable for fund shares sold | 2,423 | |
| Dividends receivable | 159 | |
| Interest receivable | 23,563 | |
| Distributions receivable from Fidelity Central Funds | 242 | |
| Prepaid expenses | 3 | |
| Other receivables | 58 | |
| Total assets | 1,865,432 | |
| Liabilities | ||
| Payable for investments purchased | ||
| Regular delivery | $15,005 | |
| Delayed delivery | 6,040 | |
| Payable for fund shares redeemed | 4,491 | |
| Distributions payable | 631 | |
| Accrued management fee | 860 | |
| Distribution and service plan fees payable | 281 | |
| Other affiliated payables | 294 | |
| Other payables and accrued expenses | 127 | |
| Collateral on securities loaned | 2,377 | |
| Total liabilities | 30,106 | |
| Net Assets | $1,835,326 | |
| Net Assets consist of: | ||
| Paid in capital | $1,809,610 | |
| Total distributable earnings (loss) | 25,716 | |
| Net Assets | $1,835,326 | |
| Net Asset Value and Maximum Offering Price | ||
| Class A: | ||
| Net Asset Value and redemption price per share ($467,222 ÷ 42,739 shares) | $10.93 | |
| Maximum offering price per share (100/96.00 of $10.93) | $11.39 | |
| Class M: | ||
| Net Asset Value and redemption price per share ($337,133 ÷ 30,668 shares) | $10.99 | |
| Maximum offering price per share (100/96.00 of $10.99) | $11.45 | |
| Class C: | ||
| Net Asset Value and offering price per share ($129,553 ÷ 11,872 shares)(a) | $10.91 | |
| Class I: | ||
| Net Asset Value, offering price and redemption price per share ($883,059 ÷ 86,167 shares) | $10.25 | |
| Class Z: | ||
| Net Asset Value, offering price and redemption price per share ($18,359 ÷ 1,791 shares) | $10.25 |
(a) Redemption price per share is equal to net asset value less any applicable contingent deferred sales charge.
See accompanying notes which are an integral part of the financial statements.
Statement of Operations
| Amounts in thousands | Year ended October 31, 2018 | |
| Investment Income | ||
| Dividends | $8,422 | |
| Interest | 105,711 | |
| Income from Fidelity Central Funds | 1,715 | |
| Total income | 115,848 | |
| Expenses | ||
| Management fee | $10,167 | |
| Transfer agent fees | 2,870 | |
| Distribution and service plan fees | 3,538 | |
| Accounting and security lending fees | 609 | |
| Custodian fees and expenses | 28 | |
| Independent trustees' fees and expenses | 9 | |
| Registration fees | 102 | |
| Audit | 87 | |
| Legal | (277) | |
| Miscellaneous | 15 | |
| Total expenses before reductions | 17,148 | |
| Expense reductions | (40) | |
| Total expenses after reductions | 17,108 | |
| Net investment income (loss) | 98,740 | |
| Realized and Unrealized Gain (Loss) | ||
| Net realized gain (loss) on: | ||
| Investment securities: | ||
| Unaffiliated issuers | (4,896) | |
| Foreign currency transactions | (86) | |
| Total net realized gain (loss) | (4,982) | |
| Change in net unrealized appreciation (depreciation) on: | ||
| Investment securities: | �� | |
| Unaffiliated issuers | (85,115) | |
| Fidelity Central Funds | 1 | |
| Assets and liabilities in foreign currencies | 1 | |
| Total change in net unrealized appreciation (depreciation) | (85,113) | |
| Net gain (loss) | (90,095) | |
| Net increase (decrease) in net assets resulting from operations | $8,645 |
See accompanying notes which are an integral part of the financial statements.
Statement of Changes in Net Assets
| Amounts in thousands | Year ended October 31, 2018 | Year ended October 31, 2017 |
| Increase (Decrease) in Net Assets | ||
| Operations | ||
| Net investment income (loss) | $98,740 | $89,829 |
| Net realized gain (loss) | (4,982) | 31,482 |
| Change in net unrealized appreciation (depreciation) | (85,113) | 106,024 |
| Net increase (decrease) in net assets resulting from operations | 8,645 | 227,335 |
| Distributions to shareholders | (89,211) | – |
| Distributions to shareholders from net investment income | – | (82,955) |
| Total distributions | (89,211) | (82,955) |
| Share transactions - net increase (decrease) | 60,752 | (209,589) |
| Redemption fees | 18 | 143 |
| Total increase (decrease) in net assets | (19,796) | (65,066) |
| Net Assets | ||
| Beginning of period | 1,855,122 | 1,920,188 |
| End of period | $1,835,326 | $1,855,122 |
| Other Information | ||
| Undistributed net investment income end of period | $20,167 |
See accompanying notes which are an integral part of the financial statements.
Financial Highlights
Fidelity Advisor High Income Advantage Fund Class A
| Years ended October 31, | 2018 | 2017 | 2016 | 2015 | 2014 |
| Selected Per–Share Data | |||||
| Net asset value, beginning of period | $11.41 | $10.57 | $10.43 | $10.88 | $10.73 |
| Income from Investment Operations | |||||
| Net investment income (loss)A | .606 | .525 | .501 | .498 | .480 |
| Net realized and unrealized gain (loss) | (.543) | .796 | .123 | (.489) | .236 |
| Total from investment operations | .063 | 1.321 | .624 | .009 | .716 |
| Distributions from net investment income | (.543) | (.482) | (.485) | (.451) | (.449) |
| Distributions from net realized gain | – | – | – | (.010) | (.118) |
| Total distributions | (.543) | (.482) | (.485) | (.461) | (.567) |
| Redemption fees added to paid in capitalA | –B | .001 | .001 | .002 | .001 |
| Net asset value, end of period | $10.93 | $11.41 | $10.57 | $10.43 | $10.88 |
| Total ReturnC,D | .50% | 12.75% | 6.30% | .06% | 6.84% |
| Ratios to Average Net AssetsE,F | |||||
| Expenses before reductions | .99% | 1.02% | 1.04% | 1.02% | 1.02% |
| Expenses net of fee waivers, if any | .99% | 1.01% | 1.03% | 1.02% | 1.02% |
| Expenses net of all reductions | .99% | 1.01% | 1.03% | 1.02% | 1.02% |
| Net investment income (loss) | 5.35% | 4.75% | 4.94% | 4.62% | 4.42% |
| Supplemental Data | |||||
| Net assets, end of period (in millions) | $467 | $507 | $593 | $636 | $682 |
| Portfolio turnover rateG | 45% | 49% | 46% | 42% | 41% |
A Calculated based on average shares outstanding during the period.
B Amount represents less than $.0005 per share.
C Total returns would have been lower if certain expenses had not been reduced during the applicable periods shown.
D Total returns do not include the effect of the sales charges.
E Fees and expenses of any underlying Fidelity Central Funds are not included in the Fund's expense ratio. The Fund indirectly bears its proportionate share of the expenses of any underlying Fidelity Central Funds.
F Expense ratios reflect operating expenses of the class. Expenses before reductions do not reflect amounts reimbursed by the investment adviser or reductions from brokerage service arrangements or reductions from other expense offset arrangements and do not represent the amount paid by the class during periods when reimbursements or reductions occur. Expenses net of fee waivers reflect expenses after reimbursement by the investment adviser but prior to reductions from brokerage service arrangements or other expense offset arrangements. Expenses net of all reductions represent the net expenses paid by the class.
G Amount does not include the portfolio activity of any underlying Fidelity Central Funds.
See accompanying notes which are an integral part of the financial statements.
Fidelity Advisor High Income Advantage Fund Class M
| Years ended October 31, | 2018 | 2017 | 2016 | 2015 | 2014 |
| Selected Per–Share Data | |||||
| Net asset value, beginning of period | $11.47 | $10.63 | $10.49 | $10.93 | $10.78 |
| Income from Investment Operations | |||||
| Net investment income (loss)A | .611 | .529 | .505 | .501 | .484 |
| Net realized and unrealized gain (loss) | (.545) | .795 | .123 | (.479) | .233 |
| Total from investment operations | .066 | 1.324 | .628 | .022 | .717 |
| Distributions from net investment income | (.546) | (.485) | (.489) | (.454) | (.450) |
| Distributions from net realized gain | – | – | – | (.010) | (.118) |
| Total distributions | (.546) | (.485) | (.489) | (.464) | (.568) |
| Redemption fees added to paid in capitalA | –B | .001 | .001 | .002 | .001 |
| Net asset value, end of period | $10.99 | $11.47 | $10.63 | $10.49 | $10.93 |
| Total ReturnC,D | .53% | 12.71% | 6.30% | .18% | 6.81% |
| Ratios to Average Net AssetsE,F | |||||
| Expenses before reductions | .98% | 1.01% | 1.03% | 1.02% | 1.01% |
| Expenses net of fee waivers, if any | .98% | 1.01% | 1.03% | 1.02% | 1.01% |
| Expenses net of all reductions | .98% | 1.01% | 1.03% | 1.02% | 1.01% |
| Net investment income (loss) | 5.36% | 4.76% | 4.95% | 4.63% | 4.43% |
| Supplemental Data | |||||
| Net assets, end of period (in millions) | $337 | $382 | $409 | $445 | $504 |
| Portfolio turnover rateG | 45% | 49% | 46% | 42% | 41% |
A Calculated based on average shares outstanding during the period.
B Amount represents less than $.0005 per share.
C Total returns would have been lower if certain expenses had not been reduced during the applicable periods shown.
D Total returns do not include the effect of the sales charges.
E Fees and expenses of any underlying Fidelity Central Funds are not included in the Fund's expense ratio. The Fund indirectly bears its proportionate share of the expenses of any underlying Fidelity Central Funds.
F Expense ratios reflect operating expenses of the class. Expenses before reductions do not reflect amounts reimbursed by the investment adviser or reductions from brokerage service arrangements or reductions from other expense offset arrangements and do not represent the amount paid by the class during periods when reimbursements or reductions occur. Expenses net of fee waivers reflect expenses after reimbursement by the investment adviser but prior to reductions from brokerage service arrangements or other expense offset arrangements. Expenses net of all reductions represent the net expenses paid by the class.
G Amount does not include the portfolio activity of any underlying Fidelity Central Funds.
See accompanying notes which are an integral part of the financial statements.
Fidelity Advisor High Income Advantage Fund Class C
| Years ended October 31, | 2018 | 2017 | 2016 | 2015 | 2014 |
| Selected Per–Share Data | |||||
| Net asset value, beginning of period | $11.39 | $10.55 | $10.41 | $10.86 | $10.71 |
| Income from Investment Operations | |||||
| Net investment income (loss)A | .520 | .440 | .424 | .415 | .398 |
| Net realized and unrealized gain (loss) | (.543) | .796 | .122 | (.488) | .237 |
| Total from investment operations | (.023) | 1.236 | .546 | (.073) | .635 |
| Distributions from net investment income | (.457) | (.397) | (.407) | (.369) | (.368) |
| Distributions from net realized gain | – | – | – | (.010) | (.118) |
| Total distributions | (.457) | (.397) | (.407) | (.379) | (.486) |
| Redemption fees added to paid in capitalA | –B | .001 | .001 | .002 | .001 |
| Net asset value, end of period | $10.91 | $11.39 | $10.55 | $10.41 | $10.86 |
| Total ReturnC,D | (.26)% | 11.92% | 5.51% | (.70)% | 6.05% |
| Ratios to Average Net AssetsE,F | |||||
| Expenses before reductions | 1.75% | 1.78% | 1.79% | 1.78% | 1.77% |
| Expenses net of fee waivers, if any | 1.75% | 1.77% | 1.79% | 1.78% | 1.77% |
| Expenses net of all reductions | 1.75% | 1.77% | 1.79% | 1.78% | 1.77% |
| Net investment income (loss) | 4.59% | 3.99% | 4.18% | 3.86% | 3.67% |
| Supplemental Data | |||||
| Net assets, end of period (in millions) | $130 | $156 | $163 | $171 | $182 |
| Portfolio turnover rateG | 45% | 49% | 46% | 42% | 41% |
A Calculated based on average shares outstanding during the period.
B Amount represents less than $.0005 per share.
C Total returns would have been lower if certain expenses had not been reduced during the applicable periods shown.
D Total returns do not include the effect of the contingent deferred sales charge.
E Fees and expenses of any underlying Fidelity Central Funds are not included in the Fund's expense ratio. The Fund indirectly bears its proportionate share of the expenses of any underlying Fidelity Central Funds.
F Expense ratios reflect operating expenses of the class. Expenses before reductions do not reflect amounts reimbursed by the investment adviser or reductions from brokerage service arrangements or reductions from other expense offset arrangements and do not represent the amount paid by the class during periods when reimbursements or reductions occur. Expenses net of fee waivers reflect expenses after reimbursement by the investment adviser but prior to reductions from brokerage service arrangements or other expense offset arrangements. Expenses net of all reductions represent the net expenses paid by the class.
G Amount does not include the portfolio activity of any underlying Fidelity Central Funds.
See accompanying notes which are an integral part of the financial statements.
Fidelity Advisor High Income Advantage Fund Class I
| Years ended October 31, | 2018 | 2017 | 2016 | 2015 | 2014 |
| Selected Per–Share Data | |||||
| Net asset value, beginning of period | $10.70 | $9.91 | $9.78 | $10.20 | $10.10 |
| Income from Investment Operations | |||||
| Net investment income (loss)A | .590 | .517 | .493 | .488 | .474 |
| Net realized and unrealized gain (loss) | (.499) | .750 | .113 | (.455) | .216 |
| Total from investment operations | .091 | 1.267 | .606 | .033 | .690 |
| Distributions from net investment income | (.541) | (.478) | (.477) | (.445) | (.473) |
| Distributions from net realized gain | – | – | – | (.010) | (.118) |
| Total distributions | (.541) | (.478) | (.477) | (.455) | (.591) |
| Redemption fees added to paid in capitalA | –B | .001 | .001 | .002 | .001 |
| Net asset value, end of period | $10.25 | $10.70 | $9.91 | $9.78 | $10.20 |
| Total ReturnC | .80% | 13.06% | 6.54% | .31% | 7.02% |
| Ratios to Average Net AssetsD,E | |||||
| Expenses before reductions | .75% | .77% | .80% | .80% | .78% |
| Expenses net of fee waivers, if any | .75% | .77% | .80% | .80% | .78% |
| Expenses net of all reductions | .75% | .77% | .80% | .80% | .78% |
| Net investment income (loss) | 5.57% | 5.00% | 5.17% | 4.84% | 4.66% |
| Supplemental Data | |||||
| Net assets, end of period (in millions) | $883 | $811 | $755 | $760 | $658 |
| Portfolio turnover rateF | 45% | 49% | 46% | 42% | 41% |
A Calculated based on average shares outstanding during the period.
B Amount represents less than $.0005 per share.
C Total returns would have been lower if certain expenses had not been reduced during the applicable periods shown.
D Fees and expenses of any underlying Fidelity Central Funds are not included in the Fund's expense ratio. The Fund indirectly bears its proportionate share of the expenses of any underlying Fidelity Central Funds.
E Expense ratios reflect operating expenses of the class. Expenses before reductions do not reflect amounts reimbursed by the investment adviser or reductions from brokerage service arrangements or reductions from other expense offset arrangements and do not represent the amount paid by the class during periods when reimbursements or reductions occur. Expenses net of fee waivers reflect expenses after reimbursement by the investment adviser but prior to reductions from brokerage service arrangements or other expense offset arrangements. Expenses net of all reductions represent the net expenses paid by the class.
F Amount does not include the portfolio activity of any underlying Fidelity Central Funds.
See accompanying notes which are an integral part of the financial statements.
Fidelity Advisor High Income Advantage Fund Class Z
| Year ended October 31, | 2018 A |
| Selected Per–Share Data | |
| Net asset value, beginning of period | $10.69 |
| Income from Investment Operations | |
| Net investment income (loss)B | .034 |
| Net realized and unrealized gain (loss) | (.438) |
| Total from investment operations | (.404) |
| Distributions from net investment income | (.036) |
| Distributions from net realized gain | – |
| Total distributions | (.036) |
| Net asset value, end of period | $10.25 |
| Total ReturnC,D | (3.78)% |
| Ratios to Average Net AssetsE,F | |
| Expenses before reductions | .63%G |
| Expenses net of fee waivers, if any | .63%G |
| Expenses net of all reductions | .63%G |
| Net investment income (loss) | 5.46%G |
| Supplemental Data | |
| Net assets, end of period (in millions) | $18 |
| Portfolio turnover rateH | 45% |
A For the period October 2, 2018 (commencement of sale of shares) to October 31, 2018.
B Calculated based on average shares outstanding during the period.
C Total returns for periods of less than one year are not annualized.
D Total returns would have been lower if certain expenses had not been reduced during the applicable periods shown.
E Fees and expenses of any underlying Fidelity Central Funds are not included in the Fund's expense ratio. The Fund indirectly bears its proportionate share of the expenses of any underlying Fidelity Central Funds.
F Expense ratios reflect operating expenses of the class. Expenses before reductions do not reflect amounts reimbursed by the investment adviser or reductions from brokerage service arrangements or reductions from other expense offset arrangements and do not represent the amount paid by the class during periods when reimbursements or reductions occur. Expense ratios before reductions for start-up periods may not be representative of longer-term operating periods. Expenses net of fee waivers reflect expenses after reimbursement by the investment adviser but prior to reductions from brokerage service arrangements or other expense offset arrangements. Expenses net of all reductions represent the net expenses paid by the class.
G Annualized
H Amount does not include the portfolio activity of any underlying Fidelity Central Funds.
See accompanying notes which are an integral part of the financial statements.
Notes to Financial Statements
For the period ended October 31, 2018
(Amounts in thousands except percentages)
1. Organization.
Fidelity Advisor High Income Advantage Fund (the Fund) is a fund of Fidelity Advisor Series I (the Trust) and is authorized to issue an unlimited number of shares. The Trust is registered under the Investment Company Act of 1940, as amended (the 1940 Act), as an open-end management investment company organized as a Massachusetts business trust. The Fund commenced sale of Class Z shares on October 2, 2018. The Fund offers Class A, Class M, Class C, Class I and Class Z shares, each of which has equal rights as to assets and voting privileges. Each class has exclusive voting rights with respect to matters that affect that class.
2. Investments in Fidelity Central Funds.
The Fund invests in Fidelity Central Funds, which are open-end investment companies generally available only to other investment companies and accounts managed by the investment adviser and its affiliates. The Fund's Schedule of Investments lists each of the Fidelity Central Funds held as of period end, if any, as an investment of the Fund, but does not include the underlying holdings of each Fidelity Central Fund. As an Investing Fund, the Fund indirectly bears its proportionate share of the expenses of the underlying Fidelity Central Funds.
The Money Market Central Funds seek preservation of capital and current income and are managed by Fidelity Investments Money Management, Inc. (FIMM), an affiliate of the investment adviser. Annualized expenses of the Money Market Central Funds as of their most recent shareholder report date are less than .005%.
A complete unaudited list of holdings for each Fidelity Central Fund is available upon request or at the Securities and Exchange Commission (the SEC) website at www.sec.gov. In addition, the financial statements of the Fidelity Central Funds, which are not covered by the Fund's Report of Independent Registered Public Accounting Firm, are available on the SEC website or upon request.
3. Significant Accounting Policies.
The Fund is an investment company and applies the accounting and reporting guidance of the Financial Accounting Standards Board (FASB) Accounting Standards Codification Topic 946 Financial Services – Investments Companies. The financial statements have been prepared in conformity with accounting principles generally accepted in the United States of America (GAAP), which require management to make certain estimates and assumptions at the date of the financial statements. Actual results could differ from those estimates. Subsequent events, if any, through the date that the financial statements were issued have been evaluated in the preparation of the financial statements. The following summarizes the significant accounting policies of the Fund:
Investment Valuation. Investments are valued as of 4:00 p.m. Eastern time on the last calendar day of the period. The Board of Trustees (the Board) has delegated the day to day responsibility for the valuation of the Fund's investments to the Fair Value Committee (the Committee) established by the Fund's investment adviser. In accordance with valuation policies and procedures approved by the Board, the Fund attempts to obtain prices from one or more third party pricing vendors or brokers to value its investments. When current market prices, quotations or currency exchange rates are not readily available or reliable, investments will be fair valued in good faith by the Committee, in accordance with procedures adopted by the Board. Factors used in determining fair value vary by investment type and may include market or investment specific events, changes in interest rates and credit quality. The frequency with which these procedures are used cannot be predicted and they may be utilized to a significant extent. The Committee oversees the Fund's valuation policies and procedures and reports to the Board on the Committee's activities and fair value determinations. The Board monitors the appropriateness of the procedures used in valuing the Fund's investments and ratifies the fair value determinations of the Committee.
The Fund categorizes the inputs to valuation techniques used to value its investments into a disclosure hierarchy consisting of three levels as shown below:
- Level 1 – quoted prices in active markets for identical investments
- Level 2 – other significant observable inputs (including quoted prices for similar investments, interest rates, prepayment speeds, etc.)
- Level 3 – unobservable inputs (including the Fund's own assumptions based on the best information available)
Valuation techniques used to value the Fund's investments by major category are as follows:
Debt securities, including restricted securities, are valued based on evaluated prices received from third party pricing vendors or from brokers who make markets in such securities. Corporate bonds and bank loan obligations are valued by pricing vendors who utilize matrix pricing which considers yield or price of bonds of comparable quality, coupon, maturity and type or by broker-supplied prices. When independent prices are unavailable or unreliable, debt securities may be valued utilizing pricing methodologies which consider similar factors that would be used by third party pricing vendors. Debt securities are generally categorized as Level 2 in the hierarchy but may be Level 3 depending on the circumstances. The Fund invests a significant portion of its assets in below investment grade securities. The value of these securities can be more volatile due to changes in the credit quality of the issuer and is sensitive to changes in economic, market and regulatory conditions.
Equity securities, including restricted securities, for which market quotations are readily available, are valued at the last reported sale price or official closing price as reported by a third party pricing vendor on the primary market or exchange on which they are traded and are categorized as Level 1 in the hierarchy. In the event there were no sales during the day or closing prices are not available, securities are valued at the last quoted bid price or may be valued using the last available price and are generally categorized as Level 2 in the hierarchy. For foreign equity securities, when market or security specific events arise, comparisons to the valuation of American Depositary Receipts (ADRs), futures contracts, Exchange-Traded Funds (ETFs) and certain indexes as well as quoted prices for similar securities may be used and would be categorized as Level 2 in the hierarchy. Utilizing these techniques may result in transfers between Level 1 and Level 2. For equity securities, including restricted securities, where observable inputs are limited, assumptions about market activity and risk are used and these securities may be categorized as Level 3 in the hierarchy.
Investments in open-end mutual funds, including the Fidelity Central Funds, are valued at their closing net asset value (NAV) each business day and are categorized as Level 1 in the hierarchy.
Changes in valuation techniques may result in transfers in or out of an assigned level within the disclosure hierarchy. The aggregate value of investments by input level as of October 31, 2018 is included at the end of the Fund's Schedule of Investments.
Foreign Currency. The Fund may use foreign currency contracts to facilitate transactions in foreign-denominated securities. Gains and losses from these transactions may arise from changes in the value of the foreign currency or if the counterparties do not perform under the contracts' terms.
Foreign-denominated assets, including investment securities, and liabilities are translated into U.S. dollars at the exchange rates at period end. Purchases and sales of investment securities, income and dividends received and expenses denominated in foreign currencies are translated into U.S. dollars at the exchange rate in effect on the transaction date.
The effects of exchange rate fluctuations on investments are included with the net realized and unrealized gain (loss) on investment securities. Other foreign currency transactions resulting in realized and unrealized gain (loss) are disclosed separately.
Investment Transactions and Income. For financial reporting purposes, the Fund's investment holdings and NAV include trades executed through the end of the last business day of the period. The NAV per share for processing shareholder transactions is calculated as of the close of business of the New York Stock Exchange (NYSE), normally 4:00 p.m. Eastern time and includes trades executed through the end of the prior business day. Gains and losses on securities sold are determined on the basis of identified cost and include proceeds received from litigation. Dividend income is recorded on the ex-dividend date, except for certain dividends from foreign securities where the ex-dividend date may have passed, which are recorded as soon as the Fund is informed of the ex-dividend date. Non-cash dividends included in dividend income, if any, are recorded at the fair market value of the securities received. Income and capital gain distributions from Fidelity Central Funds, if any, are recorded on the ex-dividend date. Certain distributions received by the Fund represent a return of capital or capital gain. The Fund determines the components of these distributions subsequent to the ex-dividend date, based upon receipt of tax filings or other correspondence relating to the underlying investment. These distributions are recorded as a reduction of cost of investments and/or as a realized gain. Interest income is accrued as earned and includes coupon interest and amortization of premium and accretion of discount on debt securities as applicable. Paid in Kind (PIK) income is recorded at the fair market value of the securities received. Investment income is recorded net of foreign taxes withheld where recovery of such taxes is uncertain. Debt obligations may be placed on non-accrual status and related interest income may be reduced by ceasing current accruals and writing off interest receivables when the collection of all or a portion of interest has become doubtful based on consistently applied procedures. A debt obligation is removed from non-accrual status when the issuer resumes interest payments or when collectability of interest is reasonably assured.
Class Allocations and Expenses. Investment income, realized and unrealized capital gains and losses, common expenses of the Fund, and certain fund-level expense reductions, if any, are allocated daily on a pro-rata basis to each class based on the relative net assets of each class to the total net assets of the Fund. Each class differs with respect to transfer agent and distribution and service plan fees incurred. Certain expense reductions may also differ by class. For the reporting period, the allocated portion of income and expenses to each class as a percent of its average net assets may vary due to the timing of recording these transactions in relation to fluctuating net assets of the classes. Expenses directly attributable to a fund are charged to that fund. Expenses attributable to more than one fund are allocated among the respective funds on the basis of relative net assets or other appropriate methods. Expense estimates are accrued in the period to which they relate and adjustments are made when actual amounts are known.
Deferred Trustee Compensation. Under a Deferred Compensation Plan (the Plan) for the Fund, certain independent Trustees have elected to defer receipt of a portion of their annual compensation. Deferred amounts are invested in a cross-section of Fidelity funds, are marked-to-market and remain in the Fund until distributed in accordance with the Plan. The investment of deferred amounts and the offsetting payable to the Trustees of $54 are included in the accompanying Statement of Assets and Liabilities in other receivables and other payables and accrued expenses, respectively.
Income Tax Information and Distributions to Shareholders. Each year, the Fund intends to qualify as a regulated investment company under Subchapter M of the Internal Revenue Code, including distributing substantially all of its taxable income and realized gains. As a result, no provision for U.S. Federal income taxes is required. As of October 31, 2018, the Fund did not have any unrecognized tax benefits in the financial statements; nor is the Fund aware of any tax positions for which it is reasonably possible that the total amounts of unrecognized tax benefits will significantly change in the next twelve months. The Fund files a U.S. federal tax return, in addition to state and local tax returns as required. The Fund's federal income tax returns are subject to examination by the Internal Revenue Service (IRS) for a period of three fiscal years after they are filed. State and local tax returns may be subject to examination for an additional fiscal year depending on the jurisdiction. Foreign taxes are provided for based on the Fund's understanding of the tax rules and rates that exist in the foreign markets in which it invests.
Distributions are declared and recorded daily and paid monthly from net investment income. Distributions from realized gains, if any, are declared and recorded on the ex-dividend date. Income and capital gain distributions are declared separately for each class. Income and capital gain distributions are determined in accordance with income tax regulations, which may differ from GAAP.
Capital accounts within the financial statements are adjusted for permanent book-tax differences. These adjustments have no impact on net assets or the results of operations. Capital accounts are not adjusted for temporary book-tax differences which will reverse in a subsequent period.
Book-tax differences are primarily due to foreign currency transactions, market discount, equity-debt classifications, partnerships, deferred trustees compensation, capital loss carryforwards and losses deferred due to wash sales.
As of period end, the cost and unrealized appreciation (depreciation) in securities, and derivatives if applicable, for federal income tax purposes as follows:
| Gross unrealized appreciation | $99,397 |
| Gross unrealized depreciation | (89,985) |
| Net unrealized appreciation (depreciation) | $9,412 |
| Tax Cost | $1,821,554 |
The tax-based components of distributable earnings as of period end were as follows:
| Undistributed ordinary income | $19,110 |
| Capital loss carryforward | $(2,751) |
| Net unrealized appreciation (depreciation) on securities and other investments | $9,412 |
Capital loss carryforwards are only available to offset future capital gains of the Fund to the extent provided by regulations and may be limited. Under the Regulated Investment Company Modernization Act of 2010 (the Act), the Fund is permitted to carry forward capital losses incurred in taxable years beginning after December 22, 2010 for an unlimited period and such capital losses are required to be used prior to any losses that expire. The capital loss carryforward information presented below, including any applicable limitation, is estimated as of fiscal period end and is subject to adjustment.
| No expiration | |
| Long-term | $(2,751) |
The tax character of distributions paid was as follows:
| October 31, 2018 | October 31, 2017 | |
| Ordinary Income | $89,211 | $ 82,955 |
Short-Term Trading (Redemption) Fees. Shares held by investors in the Fund less than 90 days may have been subject to a redemption fee equal to 1.00% of the NAV of shares redeemed. All redemption fees, which reduce the proceeds of the shareholder redemption, are retained by the Fund and accounted for as an addition to paid in capital. In November 2017, the Board of Trustees approved the elimination of these redemption fees effective December 18, 2017.
Delayed Delivery Transactions and When-Issued Securities. During the period, the Fund transacted in securities on a delayed delivery or when-issued basis. Payment and delivery may take place after the customary settlement period for that security. The price of the underlying securities and the date when the securities will be delivered and paid for are fixed at the time the transaction is negotiated. The securities purchased on a delayed delivery or when-issued basis are identified as such in the Fund's Schedule of Investments. The Fund may receive compensation for interest forgone in the purchase of a delayed delivery or when-issued security. With respect to purchase commitments, the Fund identifies securities as segregated in its records with a value at least equal to the amount of the commitment. Losses may arise due to changes in the value of the underlying securities or if the counterparty does not perform under the contract's terms, or if the issuer does not issue the securities due to political, economic, or other factors.
Restricted Securities. The Fund may invest in securities that are subject to legal or contractual restrictions on resale. These securities generally may be resold in transactions exempt from registration or to the public if the securities are registered. Disposal of these securities may involve time-consuming negotiations and expense, and prompt sale at an acceptable price may be difficult. Information regarding restricted securities is included at the end of the Fund's Schedule of Investments.
Loans and Other Direct Debt Instruments. The Fund invests in direct debt instruments which are interests in amounts owed to lenders by corporate or other borrowers. These instruments may be in the form of loans, trade claims or other receivables and may include standby financing commitments such as revolving credit facilities that obligate the Fund to supply additional cash to the borrower on demand. Loans may be acquired through assignment or participation. The Fund did not have any unfunded loan commitments, which are contractual obligations for future funding, at period end.
New Accounting Pronouncement. In March 2017, the Financial Accounting Standards Board (FASB) issued an Accounting Standards Update (ASU), ASU 2017-08, which amends the amortization period for certain callable debt securities that are held at a premium. The amendment requires the premium to be amortized to the earliest call date. The amendments do not require an accounting change for securities held at a discount. The ASU is effective for annual periods beginning after December 15, 2018. Management is currently evaluating the potential impact of these changes to the financial statements.
New Rule Issuance. During August 2018, the U.S. Securities and Exchange Commission issued Final Rule Release No. 33-10532, Disclosure Update and Simplification. This Final Rule includes amendments specific to registered investment companies that are intended to eliminate overlap in disclosure requirements between Regulation S-X and GAAP. In accordance with these amendments, certain line-items in the Fund's financial statements have been combined or removed for the current period as outlined in the table below.
| Financial Statement | Current Line-Item Presentation | Prior Line-Item Presentation |
| Statement of Assets and Liabilities | Total distributable earnings (loss) | Undistributed/Distributions in excess of/Accumulated net investment income (loss) Accumulated/Undistributed net realized gain (loss) Net unrealized appreciation (depreciation) |
| Statement of Changes in Net Assets | N/A - removed | Undistributed/Distributions in excess of/Accumulated net investment income (loss) end of period |
| Statement of Changes in Net Assets | Distributions to shareholders | Distributions to shareholders from net investment income Distributions to shareholders from net realized gain |
| Distributions to Shareholders Note to Financial Statements | Distributions to shareholders | Distributions to shareholders from net investment income Distributions to shareholders from net realized gain |
4. Purchases and Sales of Investments.
Purchases and sales of securities, other than short-term securities, aggregated $828,073 and $769,777, respectively.
5. Fees and Other Transactions with Affiliates.
Management Fee. Fidelity Management & Research Company (the investment adviser) and its affiliates provide the Fund with investment management related services for which the Fund pays a monthly management fee. The management fee is the sum of an individual fund fee rate that is based on an annual rate of .45% of the Fund's average net assets and an annualized group fee rate that averaged .11% during the period. The group fee rate is based upon the average net assets of all the mutual funds advised by the investment adviser, including any mutual funds previously advised by the investment adviser that are currently advised by Fidelity SelectCo, LLC, an affiliate of the investment adviser. The group fee rate decreases as assets under management increase and increases as assets under management decrease. For the reporting period, the total annual management fee rate was .56% of the Fund's average net assets.
Distribution and Service Plan Fees. In accordance with Rule 12b-1 of the 1940 Act, the Fund has adopted separate Distribution and Service Plans for each class of shares. Certain classes pay Fidelity Distributors Corporation (FDC), an affiliate of the investment adviser, separate Distribution and Service Fees, each of which is based on an annual percentage of each class' average net assets. In addition, FDC may pay financial intermediaries for selling shares of the Fund and providing shareholder support services. For the period, the Distribution and Service Fee rates, total fees and amounts retained by FDC were as follows:
| Distribution Fee | Service Fee | Total Fees | Retained by FDC | |
| Class A | -% | .25% | $1,223 | $21 |
| Class M | -% | .25% | 904 | 72 |
| Class C | .75% | .25% | 1,411 | 75 |
| $3,538 | $168 |
Sales Load. FDC may receive a front-end sales charge of up to 4.00% for selling Class A shares and Class M shares, some of which is paid to financial intermediaries for selling shares of the Fund. Depending on the holding period, FDC may receive contingent deferred sales charges levied on Class A, Class M and Class C redemptions. The deferred sales charges are 1.00% for Class C shares, 1.00% for certain purchases of Class A shares and .25% for certain purchases of Class M shares.
For the period, sales charge amounts retained by FDC were as follows:
| Retained by FDC | |
| Class A | $61 |
| Class C(a) | 7 |
| $68 |
(a) When Class C shares are initially sold, FDC pays commissions from its own resources to financial intermediaries through which the sales are made.
Transfer Agent Fees. Fidelity Investments Institutional Operations Company, Inc., (FIIOC), an affiliate of the investment adviser, is the transfer, dividend disbursing and shareholder servicing agent for each class of the Fund. FIIOC receives account fees and asset-based fees that vary according to the account size and type of account of the shareholders of the respective classes of the Fund, except for Class Z. FIIOC receives an asset-based fee of Class Z's average net assets. FIIOC pays for typesetting, printing and mailing of shareholder reports, except proxy statements.
For the period, transfer agent fees for each class were as follows:
| Amount | % of Class-Level Average Net Assets | |
| Class A | $751 | .15 |
| Class M | 535 | .15 |
| Class C | 232 | .16 |
| Class I | 1,352 | .16 |
| Class Z | –(a) | .04(b) |
| $2,870 |
(a) In the amount of less than five hundred dollars
(b) Annualized
Accounting and Security Lending Fees. Fidelity Service Company, Inc. (FSC), an affiliate of the investment adviser, maintains the Fund's accounting records. The accounting fee is based on the level of average net assets for each month. Under a separate contract, FSC administers the security lending program. The security lending fee is based on the number and duration of lending transactions. For the period, the fees were equivalent to an annual rate of .03%.
Brokerage Commissions. The Fund placed a portion of its portfolio transactions with brokerage firms which are affiliates of the investment adviser. Brokerage commissions are included in net realized gain (loss) and change in net unrealized appreciation (depreciation) in the Statement of Operations. The commissions paid to these affiliated firms were $4 for the period.
Interfund Trades. The Fund may purchase from or sell securities to other Fidelity Funds under procedures adopted by the Board. The procedures have been designed to ensure these interfund trades are executed in accordance with Rule 17a-7 of the 1940 Act. Interfund trades are included within the respective purchases and sales amounts shown in the Purchases and Sales of Investments note.
6. Committed Line of Credit.
The Fund participates with other funds managed by the investment adviser or an affiliate in a $4.25 billion credit facility (the "line of credit") to be utilized for temporary or emergency purposes to fund shareholder redemptions or for other short-term liquidity purposes. The Fund has agreed to pay commitment fees on its pro-rata portion of the line of credit, which amounted to $5 and is reflected in Miscellaneous expenses on the Statement of Operations. During the period, the Fund did not borrow on this line of credit.
7. Security Lending.
The Fund lends portfolio securities through a lending agent from time to time in order to earn additional income. For equity securities, a lending agent is used and may loan securities to certain qualified borrowers, including Fidelity Capital Markets (FCM), a broker-dealer affiliated with the Fund. On the settlement date of the loan, the Fund receives collateral (in the form of U.S. Treasury obligations, letters of credit and/or cash) against the loaned securities and maintains collateral in an amount not less than 100% of the market value of the loaned securities during the period of the loan. The market value of the loaned securities is determined at the close of business of the Fund and any additional required collateral is delivered to the Fund on the next business day. The Fund or borrower may terminate the loan at any time, and if the borrower defaults on its obligation to return the securities loaned because of insolvency or other reasons, the Fund may apply collateral received from the borrower against the obligation. The Fund may experience delays and costs in recovering the securities loaned. Any cash collateral received is invested in the Fidelity Securities Lending Cash Central Fund. The value of loaned securities and cash collateral at period end are disclosed on the Fund's Statement of Assets and Liabilities. At period end, there were no security loans outstanding with FCM. Security lending income represents the income earned on investing cash collateral, less rebates paid to borrowers and any lending agent fees associated with the loan, plus any premium payments received for lending certain types of securities. Security lending income is presented in the Statement of Operations as a component of income from Fidelity Central Funds. Total security lending income during the period amounted to $146, including less than five hundred dollars from securities loaned to FCM.
8. Expense Reductions.
Commissions paid to certain brokers with whom the investment adviser, or its affiliates, places trades on behalf of the Fund include an amount in addition to trade execution, which may be rebated back to the Fund to offset certain expenses. This amount totaled $29 for the period. In addition, through arrangements with the Fund's custodian, credits realized as a result of certain uninvested cash balances were used to reduce the Fund's expenses. During the period, these credits reduced the Fund's custody expenses by $11.
9. Distributions to Shareholders.
Distributions to shareholders of each class were as follows:
| Year ended October 31, 2018(a) | Year ended October 31, 2017 | |
| Distributions to shareholders | ||
| Class A | $23,530 | $– |
| Class M | 17,436 | – |
| Class C | 5,771 | – |
| Class I | 42,461 | – |
| Class Z | 13 | – |
| Total | $89,211 | $– |
| From net investment income | ||
| Class A | $– | $24,253 |
| Class M | – | 17,458 |
| Class C | – | 5,849 |
| Class I | – | 35,395 |
| Total | $– | $82,955 |
(a) Distributions for Class Z are for the period October 2, 2018 (commencement of sale of shares) to October 31, 2018.
10. Share Transactions.
Share transactions for each class were as follows and may contain automatic conversions between classes or exchanges between affiliated funds:
| Shares | Shares | Dollars | Dollars | |
| Year ended October 31, 2018(a) | Year ended October 31, 2017 | Year ended October 31, 2018(a) | Year ended October 31, 2017 | |
| Class A | ||||
| Shares sold | 6,828 | 7,810 | $77,287 | $86,026 |
| Reinvestment of distributions | 1,907 | 2,011 | 21,543 | 22,179 |
| Shares redeemed | (10,395) | (21,570) | (117,501) | (238,752) |
| Net increase (decrease) | (1,660) | (11,749) | $(18,671) | $(130,547) |
| Class M | ||||
| Shares sold | 3,997 | 3,333 | $45,501 | $36,927 |
| Reinvestment of distributions | 1,438 | 1,459 | 16,334 | 16,192 |
| Shares redeemed | (8,032) | (9,984) | (91,452) | (110,969) |
| Net increase (decrease) | (2,597) | (5,192) | $(29,617) | $(57,850) |
| Class C | ||||
| Shares sold | 1,659 | 1,799 | $18,751 | $19,762 |
| Reinvestment of distributions | 477 | 463 | 5,383 | 5,095 |
| Shares redeemed | (3,933) | (4,082) | (44,441) | (44,978) |
| Net increase (decrease) | (1,797) | (1,820) | $(20,307) | $(20,121) |
| Class I | ||||
| Shares sold | 30,911 | 28,270 | $327,876 | $293,804 |
| Reinvestment of distributions | 3,573 | 2,942 | 37,823 | 30,479 |
| Shares redeemed | (24,115) | (31,537) | (254,755) | (325,354) |
| Net increase (decrease) | 10,369 | (325) | $110,944 | $(1,071) |
| Class Z | ||||
| Shares sold | 1,793 | – | $18,418 | $– |
| Reinvestment of distributions | 1 | – | 12 | – |
| Shares redeemed | (3) | – | (27) | – |
| Net increase (decrease) | 1,791 | – | $18,403 | $– |
(a) Share transactions for Class Z are for the period October 2, 2018 (commencement of sale of shares) to October 31, 2018.
11. Other.
The Fund's organizational documents provide former and current trustees and officers with a limited indemnification against liabilities arising in connection with the performance of their duties to the Fund. In the normal course of business, the Fund may also enter into contracts that provide general indemnifications. The Fund's maximum exposure under these arrangements is unknown as this would be dependent on future claims that may be made against the Fund. The risk of material loss from such claims is considered remote.
At the end of the period, Strategic Advisers Income Opportunities International Fund was the owner of record of approximately 10% of the total outstanding shares of the Fund.
12. Litigation.
The Fund and other entities managed by FMR or its affiliates were named as defendants in a lawsuit filed in the United States Bankruptcy Court for the Southern District of New York in 2009. The lawsuit was brought by creditors of Motors Liquidation Company (f/k/a General Motors), which went through Chapter 11 bankruptcy proceedings in 2009, and is captioned Official Committee of Unsecured Creditors of Motors Liquidation Company v. JPMorgan Chase Bank, N.A., et al., Adversary No. 09-00504 (REG). The plaintiffs are seeking an order that the Fund and other defendants return proceeds received in 2009 in full payment of the principal and interest on General Motors secured debt. The plaintiffs contend that the Fund and the other defendants were not secured creditors at the time of the 2009 payments and, thus, were not entitled to payment in full. In January 2015, the Court of Appeals ruled that JPMorgan, as administrative agent for all of the debtholders, released the security interest on certain collateral securing the debt prior to the 2009 payments. In September 2017, an opinion was issued in a trial intended to help determine the value of any remaining, unreleased collateral. The parties have engaged in mediation but continue to disagree on the value of the unreleased collateral. At this time, Management cannot determine the amount of loss that may be realized, but expects the amount to be less than the $5,769 received in 2009. The Fund is also incurring legal costs in defending the case.
Report of Independent Registered Public Accounting Firm
To the Trustees of Fidelity Advisor Series I and Shareholders of Fidelity Advisor High Income Advantage Fund:
Opinion on the Financial Statements and Financial Highlights
We have audited the accompanying statement of assets and liabilities of Fidelity Advisor High Income Advantage Fund (the "Fund"), a fund of Fidelity Advisor Series I, including the schedule of investments, as of October 31, 2018, and the related statement of operations for the year then ended, the statement of changes in net assets for each of the two years in the period then ended, the financial highlights for each of the five years in the period then ended, and the related notes. In our opinion, the financial statements and financial highlights present fairly, in all material respects, the financial position of the Fund as of October 31, 2018, and the results of its operations for the year then ended, the changes in its net assets for each of the two years in the period then ended, and the financial highlights for each of the five years in the period then ended, in conformity with accounting principles generally accepted in the United States of America.
Basis for Opinion
These financial statements and financial highlights are the responsibility of the Fund's management. Our responsibility is to express an opinion on the Fund's financial statements and financial highlights based on our audits. We are a public accounting firm registered with the Public Company Accounting Oversight Board (United States) (PCAOB) and are required to be independent with respect to the Fund in accordance with the U.S. federal securities laws and the applicable rules and regulations of the Securities and Exchange Commission and the PCAOB.
We conducted our audits in accordance with the standards of the PCAOB. Those standards require that we plan and perform the audit to obtain reasonable assurance about whether the financial statements and financial highlights are free of material misstatement, whether due to error or fraud. The Fund is not required to have, nor were we engaged to perform, an audit of its internal control over financial reporting. As part of our audits we are required to obtain an understanding of internal control over financial reporting but not for the purpose of expressing an opinion on the effectiveness of the Fund’s internal control over financial reporting. Accordingly, we express no such opinion.
Our audits included performing procedures to assess the risks of material misstatement of the financial statements and financial highlights, whether due to error or fraud, and performing procedures that respond to those risks. Such procedures included examining, on a test basis, evidence regarding the amounts and disclosures in the financial statements and financial highlights. Our audits also included evaluating the accounting principles used and significant estimates made by management, as well as evaluating the overall presentation of the financial statements and financial highlights. Our procedures included confirmation of securities owned as of October 31, 2018, by correspondence with the custodians and brokers; when replies were not received from brokers, we performed other auditing procedures. We believe that our audits provide a reasonable basis for our opinion.
/s/ Deloitte & Touche LLP
Boston, Massachusetts
December 14, 2018
We have served as the auditor of one or more of the Fidelity investment companies since 1999.
Trustees and Officers
The Trustees, Members of the Advisory Board (if any), and officers of the trust and fund, as applicable, are listed below. The Board of Trustees governs the fund and is responsible for protecting the interests of shareholders. The Trustees are experienced executives who meet periodically throughout the year to oversee the fund's activities, review contractual arrangements with companies that provide services to the fund, oversee management of the risks associated with such activities and contractual arrangements, and review the fund's performance. Except for Michael E. Wiley, each of the Trustees oversees 283 funds. Mr. Wiley oversees 193 funds.
The Trustees hold office without limit in time except that (a) any Trustee may resign; (b) any Trustee may be removed by written instrument, signed by at least two-thirds of the number of Trustees prior to such removal; (c) any Trustee who requests to be retired or who has become incapacitated by illness or injury may be retired by written instrument signed by a majority of the other Trustees; and (d) any Trustee may be removed at any special meeting of shareholders by a two-thirds vote of the outstanding voting securities of the trust. Each Trustee who is not an interested person (as defined in the 1940 Act) of the trust and the fund is referred to herein as an Independent Trustee. Each Independent Trustee shall retire not later than the last day of the calendar year in which his or her 75th birthday occurs. The Independent Trustees may waive this mandatory retirement age policy with respect to individual Trustees. Officers and Advisory Board Members hold office without limit in time, except that any officer or Advisory Board Member may resign or may be removed by a vote of a majority of the Trustees at any regular meeting or any special meeting of the Trustees. Except as indicated, each individual has held the office shown or other offices in the same company for the past five years.
The fund’s Statement of Additional Information (SAI) includes more information about the Trustees. To request a free copy, call Fidelity at 1-877-208-0098.
Experience, Skills, Attributes, and Qualifications of the Trustees. The Governance and Nominating Committee has adopted a statement of policy that describes the experience, qualifications, attributes, and skills that are necessary and desirable for potential Independent Trustee candidates (Statement of Policy). The Board believes that each Trustee satisfied at the time he or she was initially elected or appointed a Trustee, and continues to satisfy, the standards contemplated by the Statement of Policy. The Governance and Nominating Committee also engages professional search firms to help identify potential Independent Trustee candidates who have the experience, qualifications, attributes, and skills consistent with the Statement of Policy. From time to time, additional criteria based on the composition and skills of the current Independent Trustees, as well as experience or skills that may be appropriate in light of future changes to board composition, business conditions, and regulatory or other developments, have also been considered by the professional search firms and the Governance and Nominating Committee. In addition, the Board takes into account the Trustees' commitment and participation in Board and committee meetings, as well as their leadership of standing and ad hoc committees throughout their tenure.
In determining that a particular Trustee was and continues to be qualified to serve as a Trustee, the Board has considered a variety of criteria, none of which, in isolation, was controlling. The Board believes that, collectively, the Trustees have balanced and diverse experience, qualifications, attributes, and skills, which allow the Board to operate effectively in governing the fund and protecting the interests of shareholders. Information about the specific experience, skills, attributes, and qualifications of each Trustee, which in each case led to the Board's conclusion that the Trustee should serve (or continue to serve) as a trustee of the fund, is provided below.
Board Structure and Oversight Function. James C. Curvey is an interested person and currently serves as Chairman. The Trustees have determined that an interested Chairman is appropriate and benefits shareholders because an interested Chairman has a personal and professional stake in the quality and continuity of services provided to the fund. Independent Trustees exercise their informed business judgment to appoint an individual of their choosing to serve as Chairman, regardless of whether the Trustee happens to be independent or a member of management. The Independent Trustees have determined that they can act independently and effectively without having an Independent Trustee serve as Chairman and that a key structural component for assuring that they are in a position to do so is for the Independent Trustees to constitute a substantial majority for the Board. The Independent Trustees also regularly meet in executive session. Ned C. Lautenbach serves as Chairman of the Independent Trustees and as such (i) acts as a liaison between the Independent Trustees and management with respect to matters important to the Independent Trustees and (ii) with management prepares agendas for Board meetings.
Fidelity® funds are overseen by different Boards of Trustees. The fund's Board oversees Fidelity's high income and certain equity funds, and other Boards oversee Fidelity's investment-grade bond, money market, asset allocation, and other equity funds. The asset allocation funds may invest in Fidelity® funds overseen by the fund's Board. The use of separate Boards, each with its own committee structure, allows the Trustees of each group of Fidelity® funds to focus on the unique issues of the funds they oversee, including common research, investment, and operational issues. On occasion, the separate Boards establish joint committees to address issues of overlapping consequences for the Fidelity® funds overseen by each Board.
The Trustees operate using a system of committees to facilitate the timely and efficient consideration of all matters of importance to the Trustees, the fund, and fund shareholders and to facilitate compliance with legal and regulatory requirements and oversight of the fund's activities and associated risks. The Board, acting through its committees, has charged FMR and its affiliates with (i) identifying events or circumstances the occurrence of which could have demonstrably adverse effects on the fund's business and/or reputation; (ii) implementing processes and controls to lessen the possibility that such events or circumstances occur or to mitigate the effects of such events or circumstances if they do occur; and (iii) creating and maintaining a system designed to evaluate continuously business and market conditions in order to facilitate the identification and implementation processes described in (i) and (ii) above. Because the day-to-day operations and activities of the fund are carried out by or through FMR, its affiliates, and other service providers, the fund's exposure to risks is mitigated but not eliminated by the processes overseen by the Trustees. While each of the Board's committees has responsibility for overseeing different aspects of the fund's activities, oversight is exercised primarily through the Operations, Audit, and Compliance Committees. In addition, the Independent Trustees have worked with Fidelity to enhance the Board's oversight of investment and financial risks, legal and regulatory risks, technology risks, and operational risks, including the development of additional risk reporting to the Board. Appropriate personnel, including but not limited to the fund's Chief Compliance Officer (CCO), FMR's internal auditor, the independent accountants, the fund's Treasurer and portfolio management personnel, make periodic reports to the Board's committees, as appropriate, including an annual review of Fidelity's risk management program for the Fidelity® funds. The responsibilities of each standing committee, including their oversight responsibilities, are described further under "Standing Committees of the Trustees."
Interested Trustees*:
Correspondence intended for a Trustee who is an interested person may be sent to Fidelity Investments, 245 Summer Street, Boston, Massachusetts 02210.
Name, Year of Birth; Principal Occupations and Other Relevant Experience+
James C. Curvey (1935)
Year of Election or Appointment: 2007
Trustee
Chairman of the Board of Trustees
Mr. Curvey also serves as Trustee of other Fidelity® funds. Mr. Curvey is Vice Chairman (2007-present) and Director of FMR LLC (diversified financial services company). In addition, Mr. Curvey is an Overseer Emeritus for the Boston Symphony Orchestra, a Director of Artis-Naples, and a Trustee of Brewster Academy in Wolfeboro, New Hampshire. Previously, Mr. Curvey served as a Director of Fidelity Research & Analysis Co. (investment adviser firm, 2009-2018), Director of Fidelity Investments Money Management, Inc. (investment adviser firm, 2009-2014) and a Director of FMR and FMR Co., Inc. (investment adviser firms, 2007-2014).
Charles S. Morrison (1960)
Year of Election or Appointment: 2014
Trustee
Mr. Morrison also serves as Trustee of other funds. He serves as President of Fidelity SelectCo, LLC (investment adviser firm, 2017-present) and Fidelity Management & Research Company (FMR) (investment adviser firm, 2016-present), a Director of Fidelity Investments Money Management, Inc. (FIMM) (investment adviser firm, 2014-present), Director of Fidelity SelectCo, LLC (investment adviser firm, 2014-present), President, Asset Management (2014-present), and is an employee of Fidelity Investments. Previously, Mr. Morrison served as Vice President of Fidelity's Fixed Income and Asset Allocation Funds (2012-2014), President, Fixed Income (2011-2014), Vice President of Fidelity's Money Market Funds (2005-2009), President, Money Market Group Leader of FMR (investment adviser firm, 2009), and Senior Vice President, Money Market Group of FMR (2004-2009). Mr. Morrison also served as Vice President of Fidelity's Bond Funds (2002-2005), certain Balanced Funds (2002-2005), and certain Asset Allocation Funds (2002-2007), and as Senior Vice President (2002-2005) of Fidelity's Bond Division.
* Determined to be an “Interested Trustee” by virtue of, among other things, his or her affiliation with the trust or various entities under common control with FMR.
+ The information includes the Trustee's principal occupation during the last five years and other information relating to the experience, attributes, and skills relevant to the Trustee's qualifications to serve as a Trustee, which led to the conclusion that the Trustee should serve as a Trustee for the fund.
Independent Trustees:
Correspondence intended for an Independent Trustee may be sent to Fidelity Investments, P.O. Box 55235, Boston, Massachusetts 02205-5235.
Name, Year of Birth; Principal Occupations and Other Relevant Experience+
Dennis J. Dirks (1948)
Year of Election or Appointment: 2005
Trustee
Mr. Dirks also serves as Trustee of other Fidelity® funds. Prior to his retirement in May 2003, Mr. Dirks was Chief Operating Officer and a member of the Board of The Depository Trust & Clearing Corporation (DTCC). He also served as President, Chief Operating Officer, and Board member of The Depository Trust Company (DTC) and President and Board member of the National Securities Clearing Corporation (NSCC). In addition, Mr. Dirks served as Chief Executive Officer and Board member of the Government Securities Clearing Corporation, Chief Executive Officer and Board member of the Mortgage-Backed Securities Clearing Corporation, as a Trustee and a member of the Finance Committee of Manhattan College (2005-2008), as a Trustee and a member of the Finance Committee of AHRC of Nassau County (2006-2008), as a member of the Independent Directors Council (IDC) Governing Council (2010-2015), and as a member of the Board of Directors for The Brookville Center for Children’s Services, Inc. (2009-2017). Mr. Dirks is a member of the Finance Committee (2016-present), Board of Directors (2017-present) and Board of Trustees (2018-present) and is Treasurer (2018-present) of the Asolo Repertory Theatre.
Donald F. Donahue (1950)
Year of Election or Appointment: 2018
Trustee
Mr. Donahue also serves as a Trustee of other Fidelity® funds. Mr. Donahue is President and Chief Executive Officer of Miranda Partners, LLC (risk consulting for the financial services industry, 2012-present). Previously, Mr. Donahue served as a Member of the Advisory Board of certain Fidelity® funds (2015-2018) and Chief Executive Officer (2006-2012), Chief Operating Officer (2003-2006), and Managing Director, Customer Marketing and Development (1999-2003) of The Depository Trust & Clearing Corporation (financial markets infrastructure). Mr. Donahue serves as a Member (2007-present) and Co-Chairman (2016-present) of the Board of Directors of United Way of New York, Member of the Board of Directors of NYC Leadership Academy (2012-present) and Member of the Board of Advisors of Ripple Labs, Inc. (financial services, 2015-present). He also served as Chairman (2010-2012) and Member of the Board of Directors (2012-2013) of Omgeo, LLC (financial services), Treasurer of United Way of New York (2012-2016), and Member of the Board of Directors of XBRL US (financial services non-profit, 2009-2012) and the International Securities Services Association (2009-2012).
Alan J. Lacy (1953)
Year of Election or Appointment: 2008
Trustee
Mr. Lacy also serves as Trustee of other Fidelity® funds. Mr. Lacy serves as a Director of Bristol-Myers Squibb Company (global pharmaceuticals, 2008-present). He is a Trustee of the California Chapter of The Nature Conservancy (2015-present) and a Director of the Center for Advanced Study in the Behavioral Sciences at Stanford University (2015-present). In addition, Mr. Lacy served as Senior Adviser (2007-2014) of Oak Hill Capital Partners, L.P. (private equity) and also served as Chief Executive Officer (2005) and Vice Chairman (2005-2006) of Sears Holdings Corporation (retail) and Chief Executive Officer and Chairman of the Board of Sears, Roebuck and Co. (retail, 2000-2005). Previously, Mr. Lacy served as Chairman (2014-2017) and a member (2010-2017) of the Board of Directors of Dave & Buster’s Entertainment, Inc. (restaurant and entertainment complexes), as Chairman (2008-2011) and a member (2006-2015) of the Board of Trustees of the National Parks Conservation Association, and as a member of the Board of Directors for The Hillman Companies, Inc. (hardware wholesalers, 2010-2014), Earth Fare, Inc. (retail grocery, 2010-2014), and The Western Union Company (global money transfer, 2006-2011).
Ned C. Lautenbach (1944)
Year of Election or Appointment: 2000
Trustee
Chairman of the Independent Trustees
Mr. Lautenbach also serves as Trustee of other Fidelity® funds. Mr. Lautenbach currently serves as Vice Chair of the Board of Governors, State University System of Florida (2013-present) and is a member of the Council on Foreign Relations (1994-present). He is also a member and has most recently served as Chairman of the Board of Directors of Artis-Naples (2012-present). Previously, Mr. Lautenbach served as a member and then Lead Director of the Board of Directors of Eaton Corporation (diversified industrial, 1997-2016). He was also a Partner and Advisory Partner at Clayton, Dubilier & Rice, LLC (private equity investment, 1998-2010), as well as a Director of Sony Corporation (2006-2007). In addition, Mr. Lautenbach also had a 30-year career with IBM (technology company) during which time he served as Senior Vice President and a member of the Corporate Executive Committee (1968-1998).
Joseph Mauriello (1944)
Year of Election or Appointment: 2008
Trustee
Mr. Mauriello also serves as Trustee of other Fidelity® funds. Prior to his retirement in January 2006, Mr. Mauriello served in numerous senior management positions including Deputy Chairman and Chief Operating Officer (2004-2005), and Vice Chairman of Financial Services (2002-2004) of KPMG LLP US (professional services, 1965-2005). Mr. Mauriello currently serves as a member of the Independent Directors Council (IDC) Governing Council (2015-present). Previously, Mr. Mauriello served as a member of the Board of Directors of XL Group plc. (global insurance and re-insurance, 2006-2018).
Cornelia M. Small (1944)
Year of Election or Appointment: 2005
Trustee
Ms. Small also serves as Trustee of other Fidelity® funds. Ms. Small is a member of the Board of Directors (2009-present) and Chair of the Investment Committee (2010-present) of the Teagle Foundation. Ms. Small also serves on the Investment Committee of the Berkshire Taconic Community Foundation (2008-present). Previously, Ms. Small served as Chairperson (2002-2008) and a member of the Investment Committee and Chairperson (2008-2012) and a member of the Board of Trustees of Smith College. In addition, Ms. Small served as Chief Investment Officer, Director of Global Equity Investments, and a member of the Board of Directors of Scudder, Stevens & Clark and Scudder Kemper Investments.
Garnett A. Smith (1947)
Year of Election or Appointment: 2018
Trustee
Mr. Smith also serves as Trustee of other Fidelity® funds. Prior to Mr. Smith's retirement, he served as Chairman and Chief Executive Officer of Inbrand Corp. (manufacturer of personal absorbent products, 1990-1997). He also served as President (1986-1990) of Inbrand Corp. Prior to his employment with Inbrand Corp., he was employed by a retail fabric chain and North Carolina National Bank. In addition, Mr. Smith served as a Member of the Advisory Board of certain Fidelity® funds (2012-2013) and as a board member of the Jackson Hole Land Trust (2009-2012).
David M. Thomas (1949)
Year of Election or Appointment: 2008
Trustee
Mr. Thomas also serves as Trustee of other Fidelity® funds. Mr. Thomas serves as Non-Executive Chairman of the Board of Directors of Fortune Brands Home and Security (home and security products, 2011-present), as a member of the Board of Directors (2004-present) and Presiding Director (2013-present) of Interpublic Group of Companies, Inc. (marketing communication), and as a member of the Board of Trustees of the University of Florida (2013-present). Previously, Mr. Thomas served as Executive Chairman (2005-2006) and Chairman and Chief Executive Officer (2000-2005) of IMS Health, Inc. (pharmaceutical and healthcare information solutions), and a Director of Fortune Brands, Inc. (consumer products, 2000-2011).
Michael E. Wiley (1950)
Year of Election or Appointment: 2018
Trustee
Mr. Wiley also serves as Trustee or Member of the Advisory Board of other Fidelity® funds. Mr. Wiley serves as a Director of High Point Resources (exploration and production, 2005-present). Previously, Mr. Wiley served as a Director of Andeavor Corporation (independent oil refiner and marketer, 2005-2018), a Director of Andeavor Logistics LP (natural resources logistics, 2015-2018), a Director of Post Oak Bank (privately-held bank, 2004-2018), a Director of Asia Pacific Exploration Consolidated (international oil and gas exploration and production, 2008-2013), a member of the Board of Trustees of the University of Tulsa (2000-2006; 2007-2010), a Senior Energy Advisor of Katzenbach Partners, LLC (consulting, 2006-2007), an Advisory Director of Riverstone Holdings (private investment), a Director of Spinnaker Exploration Company (exploration and production, 2001-2005) and Chairman, President, and CEO of Baker Hughes, Inc. (oilfield services, 2000-2004).
+ The information includes the Trustee's principal occupation during the last five years and other information relating to the experience, attributes, and skills relevant to the Trustee's qualifications to serve as a Trustee, which led to the conclusion that the Trustee should serve as a Trustee for the fund.
Advisory Board Members and Officers:
Correspondence intended for a Member of the Advisory Board (if any) may be sent to Fidelity Investments, P.O. Box 55235, Boston, Massachusetts 02205-5235. Correspondence intended for an officer or Peter S. Lynch may be sent to Fidelity Investments, 245 Summer Street, Boston, Massachusetts 02210. Officers appear below in alphabetical order.
Name, Year of Birth; Principal Occupation
Vicki L. Fuller (1957)
Year of Election or Appointment: 2018
Member of the Advisory Board
Ms. Fuller also serves as Member of the Advisory Board of other Fidelity® funds. Ms. Fuller serves as a member of the Board of Directors, Audit Committee, and Nominating and Governance Committee of The Williams Companies, Inc. (natural gas infrastructure, 2018-present). Previously, Ms. Fuller served as the Chief Investment Officer of the New York State Common Retirement Fund (2012-2018) and held a variety of positions at AllianceBernstein L.P. (global asset management, 1985-2012), including Managing Director (2006-2012) and Senior Vice President and Senior Portfolio Manager (2001-2006).
Peter S. Lynch (1944)
Year of Election or Appointment: 2003
Member of the Advisory Board
Mr. Lynch also serves as Member of the Advisory Board of other Fidelity® funds. Mr. Lynch is Vice Chairman and a Director of FMR (investment adviser firm) and FMR Co., Inc. (investment adviser firm). In addition, Mr. Lynch serves as a Trustee of Boston College and as the Chairman of the Inner-City Scholarship Fund. Previously, Mr. Lynch served on the Special Olympics International Board of Directors (1997-2006).
William S. Stavropoulos (1939)
Year of Election or Appointment: 2018
Member of the Advisory Board
Mr. Stavropoulos also serves as Member of the Advisory Board of other Fidelity® funds. Mr. Stavropoulos serves as President and Founder of the Michigan Baseball Foundation, the Great Lakes Loons (2007-present). Mr. Stavropoulos is Chairman Emeritus of the Board of Directors of The Dow Chemical Company, where he previously served in numerous senior management positions, including President, CEO (1995-2000; 2002-2004), Chairman of the Executive Committee (2000-2006), and as a member of the Board of Directors (1990-2006). Currently, Mr. Stavropoulos is Chairman of the Board of Directors of Univar Inc. (global distributor of commodity and specialty chemicals), a Director of Teradata Corporation (data warehousing and technology solutions), and a member of the Advisory Board for Metalmark Capital LLC (private equity investment, 2005-present). Mr. Stavropoulos is an operating advisor to Clayton, Dubilier & Rice, LLC (private equity investment). In addition, Mr. Stavropoulos is a member of the University of Notre Dame Advisory Council for the College of Science, a Trustee of the Rollin L. Gerstacker Foundation, and a Director of Artis-Naples in Naples, Florida. Previously, Mr. Stavropoulos served as Trustee of certain Fidelity® funds (2001-2018) and as a Director of Chemical Financial Corporation (bank holding company, 1993-2012) and Tyco International, Ltd. (multinational manufacturing and services, 2007-2012).
Carol B. Tomé (1957)
Year of Election or Appointment: 2018
Member of the Advisory Board
Ms. Tomé also serves as Member of the Advisory Board of other Fidelity® funds. Ms. Tomé is Chief Financial Officer (2001-present) and Executive Vice President of Corporate Services (2007-present) of The Home Depot, Inc. (home improvement retailer) and a Director (2003-present) and Chair of the Audit Committee (2004-present) of United Parcel Service, Inc. (package delivery and supply chain management). Previously, Ms. Tomé served as Trustee of certain Fidelity® funds (2017), Senior Vice President of Finance and Accounting/Treasurer (2000-2007) and Vice President and Treasurer (1995-2000) of The Home Depot, Inc. and Chair of the Board (2010-2012), Vice Chair of the Board (2009 and 2013), and a Director (2008-2013) of the Federal Reserve Bank of Atlanta. Ms. Tomé is also a director or trustee of many community and professional organizations.
Elizabeth Paige Baumann (1968)
Year of Election or Appointment: 2017
Anti-Money Laundering (AML) Officer
Ms. Baumann also serves as AML Officer of other funds. She is Chief AML Officer (2012-present) and Senior Vice President (2014-present) of FMR LLC (diversified financial services company) and is an employee of Fidelity Investments. Previously, Ms. Baumann served as AML Officer of the funds (2012-2016), and Vice President (2007-2014) and Deputy Anti-Money Laundering Officer (2007-2012) of FMR LLC.
John J. Burke III (1964)
Year of Election or Appointment: 2018
Chief Financial Officer
Mr. Burke also serves as Chief Financial Officer of other funds. Mr. Burke serves as Head of Investment Operations for Fidelity Fund and Investment Operations (2018-present) and is an employee of Fidelity Investments (1998-present). Previously Mr. Burke served as head of Asset Management Investment Operations (2012-2018).
William C. Coffey (1969)
Year of Election or Appointment: 2018
Secretary and Chief Legal Officer (CLO)
Mr. Coffey also serves as Secretary and CLO of other funds. Mr. Coffey serves as CLO, Secretary, and Senior Vice President of Fidelity Management & Research Company and FMR Co., Inc. (investment adviser firms, 2018-present); Secretary of Fidelity SelectCo, LLC and Fidelity Investments Money Management, Inc. (investment adviser firms, 2018-present); and CLO of Fidelity Management & Research (Hong Kong) Limited, FMR Investment Management (UK) Limited, and Fidelity Management & Research (Japan) Limited (investment adviser firms, 2018-present). He is Senior Vice President and Deputy General Counsel of FMR LLC (diversified financial services company, 2010-present), and is an employee of Fidelity Investments. Previously, Mr. Coffey served as Assistant Secretary of certain funds (2009-2018) and as Vice President and Associate General Counsel of FMR LLC (2005-2009).
Timothy M. Cohen (1969)
Year of Election or Appointment: 2018
Vice President
Mr. Cohen also serves as Vice President of other funds. Mr. Cohen serves as Co-Head of Global Equity Research (2016-present), a Director of Fidelity Management & Research (Japan) Limited (investment adviser firm, 2016-present), and is an employee of Fidelity Investments. Previously, Mr. Cohen served as Chief Investment Officer - Equity and a Director of Fidelity Management & Research (U.K.) Inc. (investment adviser firm, 2013-2015) and as a Director of Fidelity Management & Research (Hong Kong) Limited (investment adviser firm, 2017).
Jonathan Davis (1968)
Year of Election or Appointment: 2010
Assistant Treasurer
Mr. Davis also serves as Assistant Treasurer of other funds. Mr. Davis serves as Assistant Treasurer of FMR Capital, Inc. (2017-present) and is an employee of Fidelity Investments. Previously, Mr. Davis served as Vice President and Associate General Counsel of FMR LLC (diversified financial services company, 2003-2010).
Adrien E. Deberghes (1967)
Year of Election or Appointment: 2016
Assistant Treasurer
Mr. Deberghes also serves as an officer of other funds. He serves as Assistant Treasurer of FMR Capital, Inc. (2017-present), Executive Vice President of Fidelity Investments Money Management, Inc. (FIMM) (investment adviser firm, 2016-present), and is an employee of Fidelity Investments (2008-present). Previously, Mr. Deberghes served as President and Treasurer of certain Fidelity® funds (2013-2018). Prior to joining Fidelity Investments, Mr. Deberghes was Senior Vice President of Mutual Fund Administration at State Street Corporation (2007-2008), Senior Director of Mutual Fund Administration at Investors Bank & Trust (2005-2007), and Director of Finance for Dunkin' Brands (2000-2005). Previously, Mr. Deberghes served in other fund officer roles.
Laura M. Del Prato (1964)
Year of Election or Appointment: 2018
Assistant Treasurer
Ms. Del Prato also serves as an officer of other funds. Ms. Del Prato is an employee of Fidelity Investments (2017-present). Prior to joining Fidelity Investments, Ms. Del Prato served as a Managing Director and Treasurer of the JPMorgan Mutual Funds (2014-2017). Prior to JPMorgan, Ms. Del Prato served as a partner at Cohen Fund Audit Services (accounting firm, 2012-2013) and KPMG LLP (accounting firm, 2004-2012).
Colm A. Hogan (1973)
Year of Election or Appointment: 2016
Deputy Treasurer
Mr. Hogan also serves as an officer of other funds. Mr. Hogan serves as Assistant Treasurer of FMR Capital, Inc. (2017-present) and is an employee of Fidelity Investments (2005-present). Previously, Mr. Hogan served as Assistant Treasurer of certain Fidelity® funds (2016-2018).
Pamela R. Holding (1964)
Year of Election or Appointment: 2018
Vice President
Ms. Holding also serves as Vice President of other funds. Ms. Holding serves as Co-Head of Global Equity Research (2018-present) and is an employee of Fidelity Investments (2013-present).
Chris Maher (1972)
Year of Election or Appointment: 2013
Assistant Treasurer
Mr. Maher serves as Assistant Treasurer of other funds. Mr. Maher is Vice President of Valuation Oversight, serves as Assistant Treasurer of FMR Capital, Inc. (2017-present), and is an employee of Fidelity Investments. Previously, Mr. Maher served as Vice President of Asset Management Compliance (2013), Vice President of the Program Management Group of FMR (investment adviser firm, 2010-2013), and Vice President of Valuation Oversight (2008-2010).
Rieco E. Mello (1969)
Year of Election or Appointment: 2017
Assistant Treasurer
Mr. Mello also serves as Assistant Treasurer of other funds. Mr. Mello serves as Assistant Treasurer of FMR Capital, Inc. (2017-present) and is an employee of Fidelity Investments (1995-present).
Kenneth B. Robins (1969)
Year of Election or Appointment: 2016
Chief Compliance Officer
Mr. Robins also serves as an officer of other funds. Mr. Robins serves as Compliance Officer of Fidelity Management & Research Company and FMR Co., Inc. (investment adviser firms, 2016-present) and is an employee of Fidelity Investments (2004-present). Previously, Mr. Robins served as Executive Vice President of Fidelity Investments Money Management, Inc. (investment adviser firm, 2013-2016) and served in other fund officer roles.
Stacie M. Smith (1974)
Year of Election or Appointment: 2016
President and Treasurer
Ms. Smith also serves as an officer of other funds. Ms. Smith serves as Assistant Treasurer of FMR Capital, Inc. (2017-present), is an employee of Fidelity Investments (2009-present), and has served in other fund officer roles. Prior to joining Fidelity Investments, Ms. Smith served as Senior Audit Manager of Ernst & Young LLP (accounting firm, 1996-2009). Previously, Ms. Smith served as Assistant Treasurer (2013-2018) and Deputy Treasurer (2013-2016) of certain Fidelity® funds.
Marc L. Spector (1972)
Year of Election or Appointment: 2016
Assistant Treasurer
Mr. Spector also serves as an officer of other funds. Mr. Spector serves as Assistant Treasurer of FMR Capital, Inc. (2017-present) and is an employee of Fidelity Investments (2016-present). Prior to joining Fidelity Investments, Mr. Spector served as Director at the Siegfried Group (accounting firm, 2013-2016), and prior to Siegfried Group as audit senior manager at Deloitte & Touche (accounting firm, 2005-2013).
Shareholder Expense Example
As a shareholder of the Fund, you incur two types of costs: (1) transaction costs, including sales charges (loads) on purchase payments or redemption proceeds, redemption fees and (2) ongoing costs, including management fees, distribution and/or service (12b-1) fees and other Fund expenses. This Example is intended to help you understand your ongoing costs (in dollars) of investing in the Fund and to compare these costs with the ongoing costs of investing in other mutual funds.
The actual expense Example is based on an investment of $1,000 invested at the beginning of the period and held for the entire period (May 1, 2018 to October 31, 2018) for Class A, Class M, Class C and Class I and for the period (October 2, 2018 to October 31, 2018) for Class Z. The hypothetical expense Example is based on an investment of $1,000 invested for the one-half year period (May 1, 2018 to October 31, 2018).
Actual Expenses
The first line of the accompanying table for each class of the Fund provides information about actual account values and actual expenses. You may use the information in this line, together with the amount you invested, to estimate the expenses that you paid over the period. Simply divide your account value by $1,000.00 (for example, an $8,600 account value divided by $1,000.00 = 8.6), then multiply the result by the number in the first line for a class of the Fund under the heading entitled "Expenses Paid During Period" to estimate the expenses you paid on your account during this period. In addition, the Fund, as a shareholder in the underlying Fidelity Central Funds, will indirectly bear its pro-rata share of the fees and expenses incurred by the underlying Fidelity Central Funds. These fees and expenses are not included in the Fund's annualized expense ratio used to calculate the expense estimate in the table below.
Hypothetical Example for Comparison Purposes
The second line of the accompanying table for each class of the Fund provides information about hypothetical account values and hypothetical expenses based on a Class' actual expense ratio and an assumed rate of return of 5% per year before expenses, which is not the Class' actual return. The hypothetical account values and expenses may not be used to estimate the actual ending account balance or expenses you paid for the period. You may use this information to compare the ongoing costs of investing in the Fund and other funds. To do so, compare this 5% hypothetical example with the 5% hypothetical examples that appear in the shareholder reports of the other funds. In addition, the Fund, as a shareholder in the underlying Fidelity Central Funds, will indirectly bear its pro-rata share of the fees and expenses incurred by the underlying Fidelity Central Funds. These fees and expenses are not included in the Fund's annualized expense ratio used to calculate the expense estimate in the table below.
Please note that the expenses shown in the table are meant to highlight your ongoing costs only and do not reflect any transaction costs. Therefore, the second line of the table is useful in comparing ongoing costs only, and will not help you determine the relative total costs of owning different funds. In addition, if these transactional costs were included, your costs would have been higher.
| Annualized Expense Ratio-A | Beginning Account Value | Ending Account Value October 31, 2018 | Expenses Paid During Period | |
| Class A | 1.00% | |||
| Actual | $1,000.00 | $1,001.40 | $5.04-B | |
| Hypothetical-C | $1,000.00 | $1,020.16 | $5.09-D | |
| Class M | .99% | |||
| Actual | $1,000.00 | $1,001.50 | $4.99-B | |
| Hypothetical-C | $1,000.00 | $1,020.21 | $5.04-D | |
| Class C | 1.75% | |||
| Actual | $1,000.00 | $997.60 | $8.81-B | |
| Hypothetical-C | $1,000.00 | $1,016.38 | $8.89-D | |
| Class I | .76% | |||
| Actual | $1,000.00 | $1,003.30 | $3.84-B | |
| Hypothetical-C | $1,000.00 | $1,021.37 | $3.87-D | |
| Class Z | .63% | |||
| Actual | $1,000.00 | $962.20 | $.51-B | |
| Hypothetical-C | $1,000.00 | $1,022.03 | $3.21-D |
A Annualized expense ratio reflects expenses net of applicable fee waivers.
B Actual expenses are equal to each Class' annualized expense ratio, multiplied by the average account value over the period, multiplied by 184/365 (to reflect the one-half year period) for Class A, Class M, Class C and Class I and multiplied by 30/365 (to reflect the period October 2, 2018 to October 31, 2018) for Class Z.
C 5% return per year before expenses
D Hypothetical expenses are equal to each Class' annualized expense ratio, multiplied by the average account value over the period, multiplied by 184/365 (to reflect the one-half year period).
Distributions (Unaudited)
A total of 0.35% of the dividends distributed during the fiscal year was derived from interest on U.S. Government securities which is generally exempt from state income tax.
The fund designates $ 61,659,395 of distributions paid during the period January 1, 2018 to October 31, 2018 as qualifying to be taxed as interest-related dividends for nonresident alien shareholders.
The fund will notify shareholders in January 2019 of amounts for use in preparing 2018 income tax returns.
Board Approval of Investment Advisory Contracts
Fidelity Advisor High Income Advantage Fund
At its July 2018 meeting, the Board of Trustees, including the Independent Trustees (together, the Board), voted to continue the management contract with Fidelity Management & Research Company (FMR) and the sub-advisory agreements (together, the Advisory Contracts) for the fund for six months through January 31, 2019, in connection with the reunification of the Fidelity Equity High Income Funds Board, which oversees the fund, and the Sector Portfolios Board.
The Board considered that the approval of the fund's Advisory Contracts will not result in any changes in (i) the investment process or strategies employed in the management of the fund's assets; (ii) the fees and expenses paid by shareholders; (iii) the nature, extent or quality of services provided under the fund's Advisory Contracts; or (iv) the day-to-day management of the fund or the persons primarily responsible for such management. The Board concluded that the fund's Advisory Contracts are fair and reasonable, and that the fund's Advisory Contracts should be renewed, without modification, through January 31, 2019, with the understanding that the Board will consider the annual renewal for a full one year period in January 2019.
In connection with its consideration of future renewals of the fund's Advisory Contracts, the Board will consider: (i) the nature, extent and quality of services provided to the fund, including shareholder and administrative services and investment performance; (ii) the competitiveness of the management fee and total expenses for the fund; (iii) the costs of the services and profitability, including the revenues earned and the expenses incurred in conducting the business of developing, marketing, distributing, managing, administering, and servicing the fund and its shareholders, to the extent applicable, as well as potential fall-out benefits from Fidelity's non-fund businesses; and (iv) whether there have been economies of scale in respect of the Fidelity funds, whether the Fidelity funds (including the fund) have appropriately benefited from any such economies of scale, and whether there is the potential for realization of any further economies.
Based on its evaluation of all of the conclusions noted above, and after considering all factors it believed relevant, the Board ultimately concluded that the fund's management fee structure is fair and reasonable, and that the continuation of the fund's Advisory Contracts should be approved.
![]()
HY-ANN-1218
1.538463.121
Fidelity Advisor® High Income Fund Class A, Class M, Class C, Class I and Class Z Annual Report October 31, 2018 |
|
Contents
To view a fund's proxy voting guidelines and proxy voting record for the 12-month period ended June 30, visit http://www.fidelity.com/proxyvotingresults or visit the Securities and Exchange Commission's (SEC) web site at http://www.sec.gov.
You may also call 1-877-208-0098 to request a free copy of the proxy voting guidelines.
Standard & Poor's, S&P and S&P 500 are registered service marks of The McGraw-Hill Companies, Inc. and have been licensed for use by Fidelity Distributors Corporation.
Other third-party marks appearing herein are the property of their respective owners.
All other marks appearing herein are registered or unregistered trademarks or service marks of FMR LLC or an affiliated company. © 2018 FMR LLC. All rights reserved.
This report and the financial statements contained herein are submitted for the general information of the shareholders of the Fund. This report is not authorized for distribution to prospective investors in the Fund unless preceded or accompanied by an effective prospectus.
A fund files its complete schedule of portfolio holdings with the SEC for the first and third quarters of each fiscal year on Form N-Q. Forms N-Q are available on the SEC’s web site at http://www.sec.gov. A fund's Forms N-Q may be reviewed and copied at the SEC’s Public Reference Room in Washington, DC. Information regarding the operation of the SEC's Public Reference Room may be obtained by calling 1-800-SEC-0330.
For a complete list of a fund's portfolio holdings, view the most recent holdings listing, semiannual report, or annual report on Fidelity's web site at http://www.fidelity.com, http://www.institutional.fidelity.com, or http://www.401k.com, as applicable.
NOT FDIC INSURED •MAY LOSE VALUE •NO BANK GUARANTEE
Neither the Fund nor Fidelity Distributors Corporation is a bank.
Performance: The Bottom Line
Average annual total return reflects the change in the value of an investment, assuming reinvestment of distributions from dividend income and capital gains (the profits earned upon the sale of securities that have grown in value, if any) and assuming a constant rate of performance each year. The hypothetical investment and the average annual total returns do not reflect the deduction of taxes that a shareholder would pay on fund distributions or the redemption of fund shares. During periods of reimbursement by Fidelity, a fund’s total return will be greater than it would be had the reimbursement not occurred. How a fund did yesterday is no guarantee of how it will do tomorrow.
Average Annual Total Returns
| For the periods ended October 31, 2018 | Past 1 year | Past 5 years | Past 10 years |
| Class A (incl. 4.00% sales charge) | (4.03)% | 2.78% | 8.29% |
| Class M (incl. 4.00% sales charge) | (4.06)% | 2.73% | 8.24% |
| Class C (incl. contingent deferred sales charge) | (1.76)% | 2.84% | 7.91% |
| Class I | 0.06% | 3.81% | 8.94% |
| Class Z | 0.06% | 3.81% | 8.94% |
Class C shares' contingent deferred sales charges included in the past one year, past five years and past ten years total return figures are 1%, 0% and 0%, respectively.
The initial offering of Class Z shares took place on October 2, 2018. Returns prior to October 2, 2018, are those of Class I.
$10,000 Over 10 Years
Let's say hypothetically that $10,000 was invested in Fidelity Advisor® High Income Fund - Class A on October 31, 2008, and the current 4.00% sales charge was paid.
The chart shows how the value of your investment would have changed, and also shows how the ICE® BofAML® US High Yield Constrained Index performed over the same period.
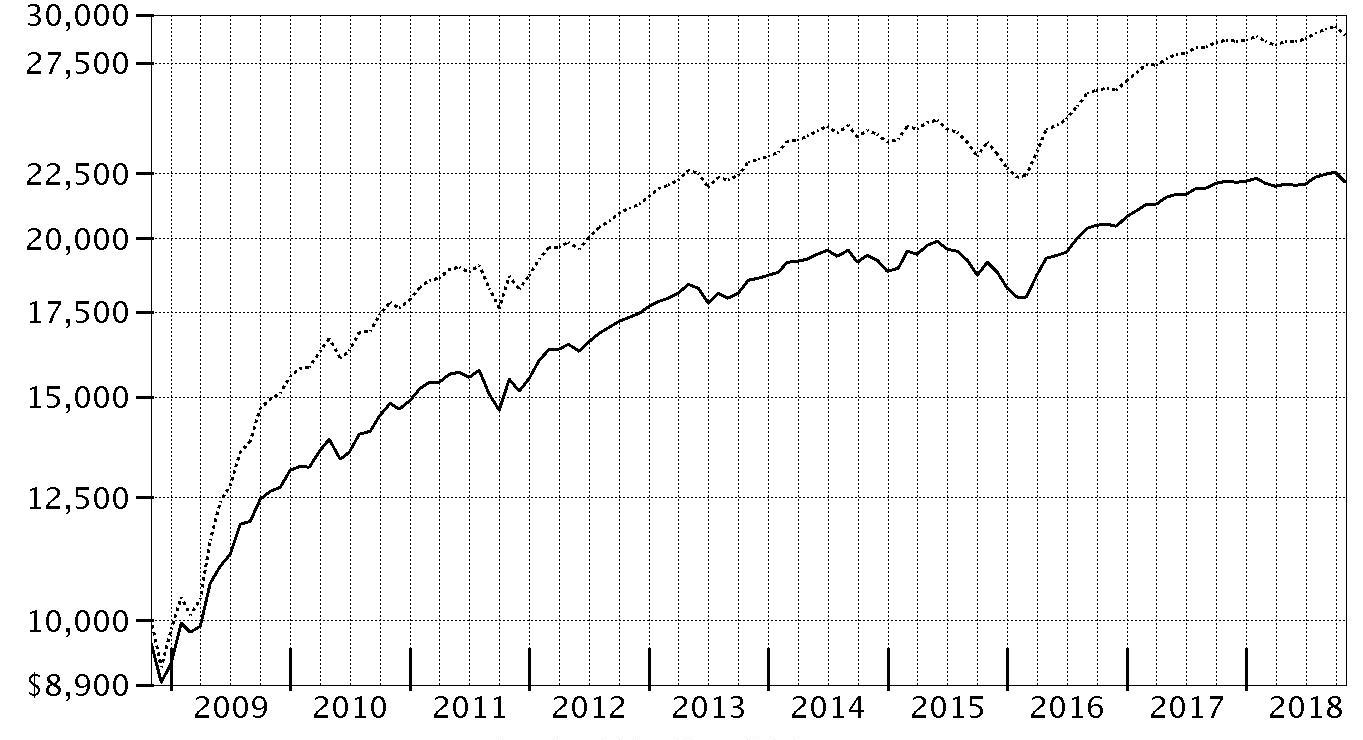
| Period Ending Values | ||
| $22,168 | Fidelity Advisor® High Income Fund - Class A | |
| $28,909 | ICE® BofAML® US High Yield Constrained Index | |
BofA Merrill Lynch benchmark indices were re-branded as ICE BofAML benchmark indices.
Management's Discussion of Fund Performance
Market Recap: U.S. corporate high-yield bonds gained 0.86% for the year ending October 31, 2018, as measured by the ICE BofAML® US High Yield Constrained Index. On the heels of a solid 2017, high yield has since struggled to sustain meaningful momentum. The most recent setback was a sharp decline in October, as high yield and other risk assets were hampered by rising U.S. Treasury yields and concern that corporate earnings growth may have peaked. The index returned -1.64% in October alone, its largest monthly drop in nearly three years. The short-term retreat snapped a modest-but-steady uptrend that began in April and lasted through the end of September, primarily due to the strength of corporate earnings. For the full 12 months, lower-quality bonds rose 5%, handily topping credits rated B (+1%) and BB (-1%). By industry, energy topped the broader market, with the index heavyweight gaining 2% amid higher oil prices, despite a sharp downturn in October. Other standouts included food & drug retail (+7%) and transportation ex air/rail (+3%), while aerospace (+4%) was lifted by potential for increased spending on U.S. defense and infrastructure. Three defensive categories also outperformed: health care was up roughly 4%, and utilities and insurance each gained about 2%. Notable laggards included automotive & auto parts (-5%), banks/thrifts and homebuilders/real estate (-2%), and super retail (-1%). Telecommunications finished roughly in line with the index.Comments from Co-Portfolio Manager Michael Weaver: For the fiscal year, the fund’s share classes (excluding sales charges, if applicable) returned roughly 0% to -1%, with most about in line with the benchmark ICE BofAML® US High Yield Constrained Index. The fund’s core high-yield bond investments finished a bit behind the benchmark. Here, industry positioning helped – especially an underweighting in automotive & auto parts – but was partially offset by security selection in a handful of categories. The fund's biggest individual relative contributor was timely ownership of retailer J.C. Penney. Our early-period overweighting was helpful because J.C. Penney was boosted by a strong holiday shopping season. We exited the position in February based on our longer-term view that the company faces pressure from Amazon.com and other internet retailers. I'll also note that our non-benchmark allocation to floating-rate bank loans topped high yield and therefore contributed. We significantly reduced exposure here the past 12 months, while adding to high yield. Conversely, the biggest individual detractor was untimely ownership of satellite services provider Intelsat, as its bonds traded higher the past 12 months but we mostly missed out.The views expressed above reflect those of the portfolio manager(s) only through the end of the period as stated on the cover of this report and do not necessarily represent the views of Fidelity or any other person in the Fidelity organization. Any such views are subject to change at any time based upon market or other conditions and Fidelity disclaims any responsibility to update such views. These views may not be relied on as investment advice and, because investment decisions for a Fidelity fund are based on numerous factors, may not be relied on as an indication of trading intent on behalf of any Fidelity fund.
Notes to shareholders: On April 2, 2018, Michael Weaver became the fund’s Co-Manager, a post he will hold through December 31, 2018, at which time he will be named sole Portfolio Manager. After more than two decades at Fidelity, Matt Conti plans to retire at the end of the year.On December 7, 2018, the fund will merge into Fidelity® High Income Fund.
Investment Summary (Unaudited)
Top Five Holdings as of October 31, 2018
| (by issuer, excluding cash equivalents) | % of fund's net assets |
| CCO Holdings LLC/CCO Holdings Capital Corp. | 3.7 |
| Icahn Enterprises LP/Icahn Enterprises Finance Corp. | 2.3 |
| Ally Financial, Inc. | 2.1 |
| Tenet Healthcare Corp. | 1.6 |
| Sprint Corp. | 1.5 |
| 11.2 |
Top Five Market Sectors as of October 31, 2018
| % of fund's net assets | |
| Energy | 17.0 |
| Telecommunications | 9.2 |
| Cable/Satellite TV | 9.0 |
| Healthcare | 8.4 |
| Utilities | 5.9 |
Quality Diversification (% of fund's net assets)
| As of October 31, 2018 | ||
| BBB | 1.3% | |
| BB | 42.5% | |
| B | 38.3% | |
| CCC,CC,C | 13.6% | |
| Not Rated | 0.2% | |
| Short-Term Investments and Net Other Assets | 4.1% | |

We have used ratings from Moody's Investors Service, Inc. Where Moody's® ratings are not available, we have used S&P® ratings. All ratings are as of the date indicated and do not reflect subsequent changes.
Asset Allocation (% of fund's net assets)
| As of October 31, 2018* | ||
| Nonconvertible Bonds | 90.0% | |
| Convertible Bonds, Preferred Stocks | 0.4% | |
| Bank Loan Obligations | 2.1% | |
| Other Investments | 3.4% | |
| Short-Term Investments and Net Other Assets (Liabilities) | 4.1% | |

* Foreign investments - 23.5%
Schedule of Investments October 31, 2018
Showing Percentage of Net Assets
| Corporate Bonds - 90.4% | |||
| Principal Amount | Value | ||
| Convertible Bonds - 0.4% | |||
| Broadcasting - 0.4% | |||
| DISH Network Corp.: | |||
| 2.375% 3/15/24 | $2,140,000 | $1,795,520 | |
| 3.375% 8/15/26 | 1,160,000 | 1,033,502 | |
| 2,829,022 | |||
| Nonconvertible Bonds - 90.0% | |||
| Aerospace - 2.6% | |||
| BBA U.S. Holdings, Inc. 5.375% 5/1/26 (a) | 3,440,000 | 3,401,300 | |
| Bombardier, Inc.: | |||
| 6.125% 1/15/23 (a) | 4,840,000 | 4,779,500 | |
| 7.5% 12/1/24 (a) | 2,015,000 | 2,047,744 | |
| 7.5% 3/15/25 (a) | 1,085,000 | 1,084,675 | |
| BWX Technologies, Inc. 5.375% 7/15/26 (a) | 2,210,000 | 2,215,525 | |
| TransDigm, Inc.: | |||
| 6% 7/15/22 | 1,140,000 | 1,145,700 | |
| 6.375% 6/15/26 | 375,000 | 367,500 | |
| 6.5% 5/15/25 (Reg. S) | 3,390,000 | 3,377,288 | |
| 18,419,232 | |||
| Air Transportation - 0.4% | |||
| Aercap Global Aviation Trust 6.5% 6/15/45 (a)(b) | 2,760,000 | 2,829,000 | |
| Banks & Thrifts - 2.1% | |||
| Ally Financial, Inc.: | |||
| 4.25% 4/15/21 | 1,440,000 | 1,438,200 | |
| 5.75% 11/20/25 | 10,170,000 | 10,424,216 | |
| 8% 11/1/31 | 2,515,000 | 3,024,288 | |
| 14,886,704 | |||
| Broadcasting - 1.5% | |||
| Sirius XM Radio, Inc.: | |||
| 3.875% 8/1/22 (a) | 2,410,000 | 2,319,625 | |
| 5% 8/1/27 (a) | 1,570,000 | 1,475,313 | |
| 5.375% 4/15/25 (a) | 4,595,000 | 4,551,922 | |
| 6% 7/15/24 (a) | 1,735,000 | 1,773,691 | |
| 10,120,551 | |||
| Cable/Satellite TV - 8.7% | |||
| Altice SA: | |||
| 7.625% 2/15/25 (a) | 835,000 | 711,838 | |
| 7.75% 5/15/22 (a) | 2,742,000 | 2,553,488 | |
| Altice U.S. Finance SA: | |||
| 5.375% 7/15/23 (a) | 3,500,000 | 3,499,335 | |
| 5.5% 5/15/26 (a) | 3,140,000 | 3,058,548 | |
| Cablevision Systems Corp. 5.875% 9/15/22 | 1,195,000 | 1,200,975 | |
| CCO Holdings LLC/CCO Holdings Capital Corp.: | |||
| 4% 3/1/23 (a) | 2,495,000 | 2,376,488 | |
| 5% 2/1/28 (a) | 6,965,000 | 6,503,569 | |
| 5.125% 2/15/23 | 555,000 | 552,225 | |
| 5.125% 5/1/23 (a) | 1,880,000 | 1,870,600 | |
| 5.125% 5/1/27 (a) | 4,290,000 | 4,037,963 | |
| 5.5% 5/1/26 (a) | 4,555,000 | 4,435,431 | |
| 5.75% 2/15/26 (a) | 3,940,000 | 3,900,600 | |
| 5.875% 4/1/24 (a) | 1,945,000 | 1,962,019 | |
| 5.875% 5/1/27 (a) | 820,000 | 805,650 | |
| Cequel Communications Holdings I LLC/Cequel Capital Corp.: | |||
| 7.5% 4/1/28 (a) | 1,660,000 | 1,720,540 | |
| 7.75% 7/15/25 (a) | 3,040,000 | 3,207,200 | |
| CSC Holdings LLC: | |||
| 5.25% 6/1/24 | 1,550,000 | 1,493,813 | |
| 5.375% 2/1/28 (a) | 1,100,000 | 1,036,750 | |
| 5.5% 4/15/27 (a) | 1,575,000 | 1,512,000 | |
| DISH DBS Corp.: | |||
| 5.875% 11/15/24 | 3,220,000 | 2,737,000 | |
| 6.75% 6/1/21 | 1,535,000 | 1,550,350 | |
| 7.75% 7/1/26 | 2,010,000 | 1,798,950 | |
| Virgin Media Secured Finance PLC 5.5% 8/15/26 (a) | 1,610,000 | 1,517,425 | |
| Ziggo Bond Finance BV: | |||
| 5.875% 1/15/25 (a) | 2,215,000 | 2,026,725 | |
| 6% 1/15/27 (a) | 2,185,000 | 1,944,650 | |
| Ziggo Secured Finance BV 5.5% 1/15/27 (a) | 3,695,000 | 3,390,163 | |
| 61,404,295 | |||
| Capital Goods - 0.7% | |||
| AECOM: | |||
| 5.125% 3/15/27 | 2,450,000 | 2,278,500 | |
| 5.875% 10/15/24 | 2,560,000 | 2,604,800 | |
| 4,883,300 | |||
| Chemicals - 3.2% | |||
| CF Industries Holdings, Inc.: | |||
| 3.45% 6/1/23 | 530,000 | 503,500 | |
| 4.5% 12/1/26 (a) | 325,000 | 319,075 | |
| 5.15% 3/15/34 | 115,000 | 105,513 | |
| Kraton Polymers LLC/Kraton Polymers Capital Corp. 7% 4/15/25 (a) | 1,375,000 | 1,289,063 | |
| NOVA Chemicals Corp.: | |||
| 4.875% 6/1/24 (a) | 1,520,000 | 1,396,500 | |
| 5.25% 6/1/27 (a) | 580,000 | 523,450 | |
| OCI NV 6.625% 4/15/23 (a) | 2,265,000 | 2,321,625 | |
| Olin Corp.: | |||
| 5% 2/1/30 | 645,000 | 579,100 | |
| 5.125% 9/15/27 | 2,240,000 | 2,086,000 | |
| Platform Specialty Products Corp. 5.875% 12/1/25 (a) | 2,020,000 | 1,913,950 | |
| The Chemours Co. LLC 5.375% 5/15/27 | 1,840,000 | 1,711,200 | |
| TPC Group, Inc. 8.75% 12/15/20 (a) | 4,290,000 | 4,204,200 | |
| Trinseo Materials Operating SCA/Trinseo Materials Finance, Inc. 5.375% 9/1/25 (a) | 1,830,000 | 1,691,469 | |
| Tronox Finance PLC 5.75% 10/1/25 (a) | 360,000 | 315,900 | |
| Tronox, Inc. 6.5% 4/15/26 (a) | 2,410,000 | 2,205,150 | |
| Valvoline, Inc. 4.375% 8/15/25 | 1,515,000 | 1,397,588 | |
| 22,563,283 | |||
| Consumer Products - 0.3% | |||
| Coty, Inc. 6.5% 4/15/26 (a) | 1,660,000 | 1,547,950 | |
| Prestige Brands, Inc. 6.375% 3/1/24 (a) | 685,000 | 676,438 | |
| 2,224,388 | |||
| Containers - 2.2% | |||
| Ard Securities Finance SARL 8.75% 1/31/23 pay-in-kind (a)(b) | 2,316,213 | 2,223,564 | |
| Ardagh Packaging Finance PLC/Ardagh MP Holdings U.S.A., Inc.: | |||
| 6% 2/15/25 (a) | 4,345,000 | 4,073,438 | |
| 7.25% 5/15/24 (a) | 865,000 | 869,325 | |
| Crown Americas LLC / Crown Americas Capital Corp. IV 4.75% 2/1/26 (a) | 1,410,000 | 1,330,688 | |
| Crown Americas LLC/Crown Americas Capital Corp. V 4.25% 9/30/26 | 1,460,000 | 1,324,950 | |
| OI European Group BV 4% 3/15/23 (a) | 2,105,000 | 1,970,806 | |
| Owens-Brockway Glass Container, Inc. 5.375% 1/15/25 (a) | 925,000 | 897,250 | |
| Reynolds Group Issuer, Inc./Reynolds Group Issuer LLC/Reynolds Group Issuer (Luxembourg) SA 5.125% 7/15/23 (a) | 2,030,000 | 1,986,863 | |
| Silgan Holdings, Inc. 4.75% 3/15/25 | 1,085,000 | 1,029,394 | |
| 15,706,278 | |||
| Diversified Financial Services - 5.9% | |||
| Aircastle Ltd. 4.125% 5/1/24 | 705,000 | 684,780 | |
| Chobani LLC/Finance Corp., Inc. 7.5% 4/15/25 (a) | 1,040,000 | 889,200 | |
| Financial & Risk U.S. Holdings, Inc. 6.25% 5/15/26 (a) | 1,415,000 | 1,407,925 | |
| FLY Leasing Ltd.: | |||
| 5.25% 10/15/24 | 3,070,000 | 2,916,500 | |
| 6.375% 10/15/21 | 785,000 | 801,681 | |
| Icahn Enterprises LP/Icahn Enterprises Finance Corp.: | |||
| 5.875% 2/1/22 | 4,260,000 | 4,260,426 | |
| 6% 8/1/20 | 4,120,000 | 4,156,050 | |
| 6.25% 2/1/22 | 5,720,000 | 5,774,683 | |
| 6.375% 12/15/25 | 1,575,000 | 1,565,156 | |
| 6.75% 2/1/24 | 760,000 | 765,700 | |
| MSCI, Inc.: | |||
| 4.75% 8/1/26 (a) | 1,585,000 | 1,529,525 | |
| 5.25% 11/15/24 (a) | 1,855,000 | 1,868,913 | |
| Navient Corp.: | |||
| 6.5% 6/15/22 | 1,025,000 | 1,043,122 | |
| 7.25% 9/25/23 | 895,000 | 926,325 | |
| Park Aerospace Holdings Ltd.: | |||
| 4.5% 3/15/23 (a) | 330,000 | 313,955 | |
| 5.25% 8/15/22 (a) | 1,200,000 | 1,191,000 | |
| 5.5% 2/15/24 (a) | 885,000 | 876,371 | |
| Prime Securities Services Borrower LLC/Prime Finance, Inc. 9.25% 5/15/23 (a) | 1,065,000 | 1,125,386 | |
| Quicken Loans, Inc. 5.25% 1/15/28 (a) | 2,760,000 | 2,449,500 | |
| Radiate Holdco LLC/Radiate Financial Service Ltd.: | |||
| 6.625% 2/15/25 (a) | 790,000 | 738,650 | |
| 6.875% 2/15/23 (a) | 275,000 | 264,000 | |
| SLM Corp.: | |||
| 5.5% 1/25/23 | 2,400,000 | 2,356,728 | |
| 6.125% 3/25/24 | 480,000 | 466,800 | |
| 7.25% 1/25/22 | 1,020,000 | 1,060,800 | |
| Tempo Acquisition LLC 6.75% 6/1/25 (a) | 1,990,000 | 1,894,878 | |
| 41,328,054 | |||
| Diversified Media - 1.0% | |||
| E.W. Scripps Co. 5.125% 5/15/25 (a) | 1,210,000 | 1,137,400 | |
| MDC Partners, Inc. 6.5% 5/1/24 (a) | 5,057,000 | 4,146,740 | |
| Nielsen Co. SARL (Luxembourg): | |||
| 5% 2/1/25 (a) | 205,000 | 199,299 | |
| 5.5% 10/1/21 (a) | 305,000 | 306,525 | |
| Nielsen Finance LLC/Nielsen Finance Co. 5% 4/15/22 (a) | 1,540,000 | 1,499,575 | |
| 7,289,539 | |||
| Energy - 16.7% | |||
| Antero Resources Corp. 5.125% 12/1/22 | 2,120,000 | 2,105,425 | |
| California Resources Corp. 8% 12/15/22 (a) | 4,145,000 | 3,689,050 | |
| Cheniere Corpus Christi Holdings LLC: | |||
| 5.125% 6/30/27 | 1,555,000 | 1,523,900 | |
| 5.875% 3/31/25 | 2,070,000 | 2,126,925 | |
| 7% 6/30/24 | 2,185,000 | 2,362,531 | |
| Cheniere Energy Partners LP: | |||
| 5.25% 10/1/25 | 6,375,000 | 6,255,469 | |
| 5.625% 10/1/26 (a) | 825,000 | 812,625 | |
| Chesapeake Energy Corp.: | |||
| 4.875% 4/15/22 | 1,455,000 | 1,382,250 | |
| 5.75% 3/15/23 | 2,205,000 | 2,094,750 | |
| 8% 12/15/22 (a) | 2,923,000 | 3,047,228 | |
| 8% 1/15/25 | 425,000 | 431,109 | |
| 8% 6/15/27 | 1,325,000 | 1,316,719 | |
| Citgo Petroleum Corp. 6.25% 8/15/22 (a) | 2,405,000 | 2,368,925 | |
| Comstock Escrow Corp. 9.75% 8/15/26 (a) | 2,985,000 | 2,880,525 | |
| Consolidated Energy Finance SA: | |||
| 3 month U.S. LIBOR + 3.750% 6.0841% 6/15/22 (a)(b)(c) | 4,680,000 | 4,682,061 | |
| 6.875% 6/15/25 (a) | 1,465,000 | 1,492,469 | |
| Crestwood Midstream Partners LP/Crestwood Midstream Finance Corp. 5.75% 4/1/25 | 1,355,000 | 1,351,613 | |
| CVR Refining LLC/Coffeyville Finance, Inc. 6.5% 11/1/22 | 3,840,000 | 3,864,000 | |
| DCP Midstream LLC 5.85% 5/21/43 (a)(b) | 1,265,000 | 1,132,175 | |
| DCP Midstream Operating LP 5.375% 7/15/25 | 2,030,000 | 2,058,522 | |
| Denbury Resources, Inc.: | |||
| 4.625% 7/15/23 | 75,000 | 62,063 | |
| 5.5% 5/1/22 | 950,000 | 821,750 | |
| 6.375% 8/15/21 | 305,000 | 283,650 | |
| 9% 5/15/21 (a) | 2,220,000 | 2,317,125 | |
| 9.25% 3/31/22 (a) | 3,865,000 | 4,029,263 | |
| Endeavor Energy Resources LP/EER Finance, Inc.: | |||
| 5.5% 1/30/26 (a) | 335,000 | 344,213 | |
| 5.75% 1/30/28 (a) | 340,000 | 351,050 | |
| Ensco PLC 7.75% 2/1/26 | 3,830,000 | 3,571,475 | |
| EP Energy LLC/Everest Acquisition Finance, Inc. 8% 11/29/24 (a) | 3,940,000 | 3,802,100 | |
| Exterran Partners LP/EXLP Finance Corp. 6% 4/1/21 | 1,495,000 | 1,480,050 | |
| Hess Infrastructure Partners LP 5.625% 2/15/26 (a) | 3,700,000 | 3,709,250 | |
| Hilcorp Energy I LP/Hilcorp Finance Co.: | |||
| 5% 12/1/24 (a) | 1,930,000 | 1,819,025 | |
| 5.75% 10/1/25 (a) | 1,470,000 | 1,429,575 | |
| Indigo Natural Resources LLC 6.875% 2/15/26 (a) | 875,000 | 826,875 | |
| Jonah Energy LLC 7.25% 10/15/25 (a) | 2,030,000 | 1,613,850 | |
| Magnolia Oil & Gas Operating LLC 6% 8/1/26 (a) | 1,645,000 | 1,624,438 | |
| Nabors Industries, Inc. 5.5% 1/15/23 | 1,297,000 | 1,219,066 | |
| NextEra Energy Partners LP: | |||
| 4.25% 9/15/24 (a) | 1,880,000 | 1,786,000 | |
| 4.5% 9/15/27 (a) | 365,000 | 336,713 | |
| Noble Holding International Ltd.: | |||
| 5.25% 3/15/42 | 765,000 | 531,675 | |
| 7.75% 1/15/24 | 1,731,000 | 1,616,321 | |
| 7.875% 2/1/26 (a) | 745,000 | 739,413 | |
| 7.95% 4/1/25 (b) | 1,125,000 | 1,023,750 | |
| Parsley Energy LLC/Parsley: | |||
| 5.25% 8/15/25 (a) | 265,000 | 256,056 | |
| 5.375% 1/15/25 (a) | 2,080,000 | 2,038,400 | |
| PBF Logistics LP/PBF Logistics Finance, Inc. 6.875% 5/15/23 | 2,850,000 | 2,899,875 | |
| Rose Rock Midstream LP/Rose Rock Finance Corp. 5.625% 11/15/23 | 3,045,000 | 2,877,525 | |
| Sanchez Energy Corp. 7.25% 2/15/23 (a) | 2,300,000 | 2,098,750 | |
| SemGroup Corp.: | |||
| 6.375% 3/15/25 | 2,360,000 | 2,283,300 | |
| 7.25% 3/15/26 | 1,430,000 | 1,396,038 | |
| Southwestern Energy Co.: | |||
| 4.1% 3/15/22 | 1,190,000 | 1,172,150 | |
| 7.75% 10/1/27 | 1,350,000 | 1,377,000 | |
| Summit Midstream Holdings LLC 5.75% 4/15/25 | 3,330,000 | 3,188,475 | |
| Targa Resources Partners LP/Targa Resources Partners Finance Corp.: | |||
| 5% 1/15/28 | 2,020,000 | 1,913,950 | |
| 5.125% 2/1/25 | 470,000 | 457,075 | |
| 5.25% 5/1/23 | 265,000 | 264,338 | |
| 5.375% 2/1/27 | 470,000 | 457,075 | |
| 5.875% 4/15/26 (a) | 2,075,000 | 2,086,672 | |
| 6.75% 3/15/24 | 2,005,000 | 2,100,238 | |
| Teine Energy Ltd. 6.875% 9/30/22 (a) | 65,000 | 64,675 | |
| TerraForm Power Operating LLC: | |||
| 4.25% 1/31/23 (a) | 405,000 | 383,738 | |
| 5% 1/31/28 (a) | 405,000 | 361,969 | |
| U.S.A. Compression Partners LP 6.875% 4/1/26 (a) | 2,035,000 | 2,070,613 | |
| Weatherford International Ltd.: | |||
| 5.95% 4/15/42 | 453,000 | 292,185 | |
| 6.5% 8/1/36 | 1,530,000 | 1,017,450 | |
| 7% 3/15/38 | 560,000 | 378,000 | |
| 9.875% 2/15/24 | 2,225,000 | 1,724,375 | |
| Weatherford International, Inc. 9.875% 3/1/25 (a) | 2,845,000 | 2,204,875 | |
| 117,681,758 | |||
| Entertainment/Film - 0.2% | |||
| New Cotai LLC/New Cotai Capital Corp. 10.625% 5/1/19 pay-in-kind (a)(b) | 1,882,274 | 1,072,896 | |
| Environmental - 0.5% | |||
| LBC Tank Terminals Holding Netherlands BV 6.875% 5/15/23 (a) | 2,883,000 | 2,832,548 | |
| Tervita Escrow Corp. 7.625% 12/1/21 (a) | 320,000 | 324,800 | |
| 3,157,348 | |||
| Food/Beverage/Tobacco - 2.5% | |||
| C&S Group Enterprises LLC 5.375% 7/15/22 (a) | 1,845,000 | 1,780,425 | |
| JBS U.S.A. LLC/JBS U.S.A. Finance, Inc. 5.875% 7/15/24 (a) | 5,990,000 | 5,879,185 | |
| Lamb Weston Holdings, Inc. 4.625% 11/1/24 (a) | 1,525,000 | 1,493,692 | |
| Post Holdings, Inc.: | |||
| 5% 8/15/26 (a) | 1,280,000 | 1,180,800 | |
| 5.625% 1/15/28 (a) | 1,265,000 | 1,189,480 | |
| 5.75% 3/1/27 (a) | 1,070,000 | 1,021,850 | |
| Vector Group Ltd. 6.125% 2/1/25 (a) | 5,805,000 | 5,282,550 | |
| 17,827,982 | |||
| Gaming - 4.3% | |||
| CRC Escrow Issuer LLC/CRC Finance LLC 5.25% 10/15/25 (a) | 4,885,000 | 4,546,103 | |
| Delta Merger Sub, Inc. 6% 9/15/26 (a) | 335,000 | 328,719 | |
| Eldorado Resorts, Inc. 6% 4/1/25 | 1,440,000 | 1,422,000 | |
| GLP Capital LP/GLP Financing II, Inc. 5.25% 6/1/25 | 1,790,000 | 1,798,968 | |
| MCE Finance Ltd. 4.875% 6/6/25 (a) | 315,000 | 288,818 | |
| MGM Growth Properties Operating Partnership LP: | |||
| 4.5% 9/1/26 | 4,385,000 | 3,968,425 | |
| 4.5% 1/15/28 | 1,460,000 | 1,306,700 | |
| Scientific Games Corp.: | |||
| 5% 10/15/25 (a) | 1,215,000 | 1,129,950 | |
| 6.625% 5/15/21 | 4,835,000 | 4,677,863 | |
| Stars Group Holdings BV 7% 7/15/26 (a) | 3,440,000 | 3,491,600 | |
| Station Casinos LLC 5% 10/1/25 (a) | 1,675,000 | 1,555,673 | |
| Wynn Las Vegas LLC/Wynn Las Vegas Capital Corp. 5.25% 5/15/27 (a) | 1,905,000 | 1,724,025 | |
| Wynn Macau Ltd.: | |||
| 4.875% 10/1/24 (a) | 2,215,000 | 2,010,113 | |
| 5.5% 10/1/27 (a) | 1,735,000 | 1,565,838 | |
| 29,814,795 | |||
| Healthcare - 8.4% | |||
| Catalent Pharma Solutions 4.875% 1/15/26 (a) | 1,010,000 | 946,875 | |
| Charles River Laboratories International, Inc. 5.5% 4/1/26 (a) | 680,000 | 678,300 | |
| Community Health Systems, Inc.: | |||
| 5.125% 8/1/21 | 1,760,000 | 1,667,600 | |
| 6.25% 3/31/23 | 7,935,000 | 7,297,820 | |
| 8.625% 1/15/24 (a) | 1,945,000 | 1,966,881 | |
| CTR Partnership LP/CareTrust Capital Corp. 5.25% 6/1/25 | 1,750,000 | 1,706,250 | |
| HCA Holdings, Inc.: | |||
| 4.5% 2/15/27 | 2,615,000 | 2,543,088 | |
| 5% 3/15/24 | 1,915,000 | 1,937,741 | |
| 5.25% 6/15/26 | 2,175,000 | 2,213,063 | |
| Hologic, Inc.: | |||
| 4.375% 10/15/25 (a) | 1,415,000 | 1,326,563 | |
| 4.625% 2/1/28 (a) | 265,000 | 242,144 | |
| MPT Operating Partnership LP/MPT Finance Corp.: | |||
| 5% 10/15/27 | 875,000 | 822,238 | |
| 5.25% 8/1/26 | 1,840,000 | 1,775,600 | |
| 5.5% 5/1/24 | 1,970,000 | 1,989,700 | |
| 6.375% 3/1/24 | 895,000 | 926,325 | |
| Sabra Health Care LP/Sabra Capital Corp.: | |||
| 5.375% 6/1/23 | 505,000 | 502,475 | |
| 5.5% 2/1/21 | 815,000 | 825,697 | |
| Service Corp. International 4.625% 12/15/27 | 1,575,000 | 1,476,563 | |
| Teleflex, Inc.: | |||
| 4.625% 11/15/27 | 885,000 | 821,015 | |
| 4.875% 6/1/26 | 2,024,000 | 1,973,400 | |
| Tenet Healthcare Corp.: | |||
| 4.375% 10/1/21 | 1,465,000 | 1,448,519 | |
| 4.625% 7/15/24 | 1,015,000 | 978,308 | |
| 5.125% 5/1/25 | 1,345,000 | 1,294,563 | |
| 6.75% 6/15/23 | 1,370,000 | 1,366,164 | |
| 8.125% 4/1/22 | 6,340,000 | 6,601,525 | |
| THC Escrow Corp. III 7% 8/1/25 | 2,440,000 | 2,393,323 | |
| Valeant Pharmaceuticals International, Inc.: | |||
| 5.5% 11/1/25 (a) | 1,140,000 | 1,117,200 | |
| 5.625% 12/1/21 (a) | 820,000 | 807,700 | |
| 5.875% 5/15/23 (a) | 595,000 | 568,969 | |
| 6.125% 4/15/25 (a) | 4,400,000 | 4,046,680 | |
| 7% 3/15/24 (a) | 3,000,000 | 3,141,570 | |
| Wellcare Health Plans, Inc.: | |||
| 5.25% 4/1/25 | 1,310,000 | 1,306,725 | |
| 5.375% 8/15/26 (a) | 465,000 | 463,838 | |
| 59,174,422 | |||
| Homebuilders/Real Estate - 0.5% | |||
| Howard Hughes Corp. 5.375% 3/15/25 (a) | 3,040,000 | 2,918,400 | |
| Starwood Property Trust, Inc. 4.75% 3/15/25 | 750,000 | 714,375 | |
| 3,632,775 | |||
| Hotels - 0.7% | |||
| Hilton Escrow Issuer LLC 4.25% 9/1/24 | 2,845,000 | 2,732,054 | |
| Hilton Worldwide Finance LLC/Hilton Worldwide Finance Corp. 4.875% 4/1/27 | 585,000 | 558,675 | |
| Wyndham Hotels & Resorts, Inc. 5.375% 4/15/26 (a) | 1,835,000 | 1,779,950 | |
| 5,070,679 | |||
| Insurance - 0.3% | |||
| AmWINS Group, Inc. 7.75% 7/1/26 (a) | 2,130,000 | 2,188,575 | |
| Leisure - 0.8% | |||
| Mattel, Inc. 6.75% 12/31/25 (a) | 3,700,000 | 3,532,353 | |
| Studio City Co. Ltd.: | |||
| 5.875% 11/30/19 (a) | 590,000 | 595,163 | |
| 7.25% 11/30/21 (a) | 1,335,000 | 1,373,461 | |
| 5,500,977 | |||
| Metals/Mining - 2.5% | |||
| Constellium NV 5.875% 2/15/26 (a) | 1,165,000 | 1,086,363 | |
| First Quantum Minerals Ltd.: | |||
| 6.5% 3/1/24 (a) | 1,250,000 | 1,090,625 | |
| 7% 2/15/21 (a) | 1,485,000 | 1,452,516 | |
| 7.25% 5/15/22 (a) | 809,000 | 772,595 | |
| 7.25% 4/1/23 (a) | 3,585,000 | 3,311,644 | |
| FMG Resources (August 2006) Pty Ltd.: | |||
| 4.75% 5/15/22 (a) | 1,675,000 | 1,608,000 | |
| 5.125% 3/15/23 (a) | 770,000 | 743,050 | |
| 5.125% 5/15/24 (a) | 825,000 | 783,750 | |
| Freeport-McMoRan, Inc.: | |||
| 3.55% 3/1/22 | 4,635,000 | 4,385,869 | |
| 3.875% 3/15/23 | 575,000 | 531,875 | |
| Nufarm Australia Ltd. 5.75% 4/30/26 (a) | 1,665,000 | 1,554,694 | |
| 17,320,981 | |||
| Paper - 0.0% | |||
| Flex Acquisition Co., Inc. 6.875% 1/15/25 (a) | 245,000 | 229,075 | |
| Publishing/Printing - 0.3% | |||
| Multi-Color Corp. 4.875% 11/1/25 (a) | 1,825,000 | 1,669,875 | |
| Restaurants - 0.9% | |||
| 1011778 BC Unlimited Liability Co./New Red Finance, Inc.: | |||
| 4.25% 5/15/24 (a) | 1,180,000 | 1,106,250 | |
| 5% 10/15/25(a) | 2,075,000 | 1,945,313 | |
| Golden Nugget, Inc. 6.75% 10/15/24 (a) | 3,065,000 | 3,057,338 | |
| 6,108,901 | |||
| Services - 2.9% | |||
| APX Group, Inc.: | |||
| 7.625% 9/1/23 | 1,125,000 | 1,001,250 | |
| 8.75% 12/1/20 | 5,995,000 | 5,845,125 | |
| Aramark Services, Inc.: | |||
| 4.75% 6/1/26 | 3,135,000 | 2,986,088 | |
| 5% 2/1/28 (a) | 1,320,000 | 1,252,350 | |
| Avantor, Inc. 6% 10/1/24 (a) | 1,140,000 | 1,137,150 | |
| Brand Energy & Infrastructure Services, Inc. 8.5% 7/15/25 (a) | 1,525,000 | 1,502,125 | |
| CDK Global, Inc.: | |||
| 4.875% 6/1/27 | 715,000 | 669,419 | |
| 5.875% 6/15/26 | 1,330,000 | 1,339,975 | |
| Frontdoor, Inc. 6.75% 8/15/26 (a) | 615,000 | 627,300 | |
| IHS Markit Ltd. 4.75% 2/15/25 (a) | 570,000 | 564,289 | |
| Laureate Education, Inc. 8.25% 5/1/25 (a) | 1,860,000 | 1,994,850 | |
| Prime Security One MS, Inc. 4.875% 7/15/32 (a) | 1,625,000 | 1,279,688 | |
| 20,199,609 | |||
| Steel - 0.3% | |||
| Commercial Metals Co. 5.375% 7/15/27 | 2,560,000 | 2,371,200 | |
| Super Retail - 0.6% | |||
| Netflix, Inc.: | |||
| 4.375% 11/15/26 | 2,245,000 | 2,054,624 | |
| 4.875% 4/15/28 (a) | 1,825,000 | 1,674,438 | |
| Sally Holdings LLC 5.625% 12/1/25 | 240,000 | 222,888 | |
| 3,951,950 | |||
| Technology - 3.3% | |||
| Ensemble S Merger Sub, Inc. 9% 9/30/23 (a) | 1,225,000 | 1,267,875 | |
| Fair Isaac Corp. 5.25% 5/15/26 (a) | 2,080,000 | 2,051,400 | |
| Gartner, Inc. 5.125% 4/1/25 (a) | 525,000 | 521,063 | |
| Micron Technology, Inc. 5.5% 2/1/25 | 735,000 | 746,025 | |
| Nuance Communications, Inc.: | |||
| 5.375% 8/15/20 (a) | 1,046,000 | 1,046,654 | |
| 5.625% 12/15/26 | 730,000 | 715,400 | |
| Open Text Corp. 5.875% 6/1/26 (a) | 4,285,000 | 4,306,425 | |
| Qorvo, Inc. 5.5% 7/15/26 (a) | 1,485,000 | 1,488,713 | |
| Sensata Technologies BV 5% 10/1/25 (a) | 3,030,000 | 2,923,950 | |
| Sensata Technologies UK Financing Co. PLC 6.25% 2/15/26 (a) | 465,000 | 473,138 | |
| Solera LLC/Solera Finance, Inc. 10.5% 3/1/24 (a) | 2,720,000 | 2,951,282 | |
| Symantec Corp. 5% 4/15/25 (a) | 3,295,000 | 3,099,893 | |
| TTM Technologies, Inc. 5.625% 10/1/25 (a) | 1,915,000 | 1,867,125 | |
| 23,458,943 | |||
| Telecommunications - 8.5% | |||
| Altice Financing SA 6.625% 2/15/23 (a) | 2,410,000 | 2,385,418 | |
| Altice Finco SA 7.625% 2/15/25 (a) | 1,945,000 | 1,728,619 | |
| C&W Senior Financing Designated Activity Co. 7.5% 10/15/26 (a) | 1,875,000 | 1,879,688 | |
| Citizens Utilities Co. 7.05% 10/1/46 | 2,040,000 | 1,020,000 | |
| Frontier Communications Corp.: | |||
| 10.5% 9/15/22 | 1,470,000 | 1,223,775 | |
| 11% 9/15/25 | 2,460,000 | 1,801,950 | |
| Intelsat Jackson Holdings SA: | |||
| 8% 2/15/24 (a) | 2,745,000 | 2,871,956 | |
| 8.5% 10/15/24 (a) | 2,500,000 | 2,456,250 | |
| 9.5% 9/30/22 (a) | 1,400,000 | 1,624,000 | |
| Level 3 Communications, Inc. 5.75% 12/1/22 | 1,680,000 | 1,675,447 | |
| Level 3 Financing, Inc.: | |||
| 5.125% 5/1/23 | 2,500,000 | 2,481,250 | |
| 5.375% 1/15/24 | 900,000 | 891,000 | |
| 5.375% 5/1/25 | 975,000 | 951,844 | |
| Millicom International Cellular SA 6.625% 10/15/26 (a) | 735,000 | 742,350 | |
| Neptune Finco Corp. 6.625% 10/15/25 (a) | 1,500,000 | 1,571,250 | |
| Qwest Corp. 6.75% 12/1/21 | 910,000 | 949,756 | |
| Sable International Finance Ltd. 6.875% 8/1/22 (a) | 1,950,000 | 2,035,313 | |
| SFR Group SA: | |||
| 6.25% 5/15/24 (a) | 2,335,000 | 2,238,681 | |
| 8.125% 2/1/27 (a) | 2,020,000 | 1,999,800 | |
| Sprint Communications, Inc. 6% 11/15/22 | 5,850,000 | 5,904,844 | |
| Sprint Corp.: | |||
| 7.25% 9/15/21 | 2,205,000 | 2,301,469 | |
| 7.625% 3/1/26 | 1,380,000 | 1,429,163 | |
| 7.875% 9/15/23 | 6,795,000 | 7,253,663 | |
| T-Mobile U.S.A., Inc.: | |||
| 4.5% 2/1/26 | 1,525,000 | 1,427,309 | |
| 5.125% 4/15/25 | 1,505,000 | 1,482,425 | |
| 6.375% 3/1/25 | 1,140,000 | 1,175,625 | |
| U.S. West Communications 7.25% 9/15/25 | 1,005,000 | 1,071,393 | |
| Wind Tre SpA 5% 1/20/26 (a) | 1,970,000 | 1,676,864 | |
| Zayo Group LLC/Zayo Capital, Inc.: | |||
| 5.75% 1/15/27 (a) | 2,370,000 | 2,323,074 | |
| 6.375% 5/15/25 | 1,200,000 | 1,227,000 | |
| 59,801,176 | |||
| Transportation Ex Air/Rail - 1.3% | |||
| Avolon Holdings Funding Ltd.: | |||
| 5.125% 10/1/23 (a) | 2,240,000 | 2,198,000 | |
| 5.5% 1/15/23 (a) | 1,200,000 | 1,194,000 | |
| Navios Maritime Acquisition Corp./Navios Acquisition Finance U.S., Inc. 8.125% 11/15/21 (a) | 4,950,000 | 4,151,813 | |
| Navios Maritime Holdings, Inc.: | |||
| 7.375% 1/15/22 (a) | 615,000 | 464,325 | |
| 11.25% 8/15/22 (a) | 1,250,000 | 1,087,500 | |
| 9,095,638 | |||
| Utilities - 5.9% | |||
| Clearway Energy Operating LLC 5.75% 10/15/25 (a) | 1,205,000 | 1,186,925 | |
| Dolphin Subsidiary II, Inc. 7.25% 10/15/21 | 5,080,000 | 5,394,350 | |
| DPL, Inc. 6.75% 10/1/19 | 563,000 | 576,371 | |
| Dynegy, Inc.: | |||
| 5.875% 6/1/23 | 1,315,000 | 1,334,725 | |
| 7.625% 11/1/24 | 1,843,000 | 1,948,973 | |
| Global Partners LP/GLP Finance Corp.: | |||
| 6.25% 7/15/22 | 3,400,000 | 3,340,500 | |
| 7% 6/15/23 | 4,325,000 | 4,308,781 | |
| InterGen NV 7% 6/30/23 (a) | 3,960,000 | 3,890,700 | |
| NRG Energy, Inc.: | |||
| 5.75% 1/15/28 | 875,000 | 872,813 | |
| 6.25% 5/1/24 | 490,000 | 500,231 | |
| 6.625% 1/15/27 | 1,795,000 | 1,855,581 | |
| NRG Yield Operating LLC 5% 9/15/26 | 905,000 | 841,650 | |
| NSG Holdings II LLC/NSG Holdings, Inc. 7.75% 12/15/25 (a) | 7,520,706 | 8,122,363 | |
| The AES Corp.: | |||
| 4.5% 3/15/23 | 1,040,000 | 1,025,700 | |
| 4.875% 5/15/23 | 2,590,000 | 2,564,100 | |
| 6% 5/15/26 | 1,500,000 | 1,533,750 | |
| Vistra Operations Co. LLC 5.5% 9/1/26 (a) | 2,420,000 | 2,383,700 | |
| 41,681,213 | |||
| TOTAL NONCONVERTIBLE BONDS | 632,665,392 | ||
| TOTAL CORPORATE BONDS | |||
| (Cost $649,787,789) | 635,494,414 | ||
| Shares | Value | ||
| Common Stocks - 0.0% | |||
| Energy - 0.0% | |||
| Forbes Energy Services Ltd. (d) | 47,062 | 237,663 | |
| Telecommunications - 0.0% | |||
| CUI Acquisition Corp. Class E (d)(e) | 1 | 23,749 | |
| TOTAL COMMON STOCKS | |||
| (Cost $3,115,580) | 261,412 | ||
| Principal Amount | Value | ||
| Bank Loan Obligations - 2.1% | |||
| Cable/Satellite TV - 0.3% | |||
| WideOpenWest Finance LLC Tranche B, term loan 3 month U.S. LIBOR + 3.250% 5.5395% 8/19/23 (b)(c) | 2,192,850 | 2,110,618 | |
| Energy - 0.1% | |||
| California Resources Corp. Tranche B, term loan 3 month U.S. LIBOR + 4.750% 7.0365% 12/31/22 (b)(c) | 695,000 | 704,264 | |
| Gaming - 0.5% | |||
| Golden Entertainment, Inc. Tranche B, term loan: | |||
| 3 month U.S. LIBOR + 3.000% 5.3% 10/20/24 (b)(c) | 1,989,963 | 1,989,963 | |
| 3 month U.S. LIBOR + 7.000% 9.31% 10/20/25 (b)(c) | 670,000 | 673,350 | |
| Scientific Games Corp. Tranche B 5LN, term loan 3 month U.S. LIBOR + 2.750% 5.0457% 8/14/24 (b)(c) | 665,307 | 658,414 | |
| TOTAL GAMING | 3,321,727 | ||
| Publishing/Printing - 0.1% | |||
| Springer Science+Business Media Deutschland GmbH Tranche B 13LN, term loan 3 month U.S. LIBOR + 3.500% 5.8861% 8/24/22 (b)(c) | 856,646 | 858,787 | |
| Services - 0.4% | |||
| Almonde, Inc.: | |||
| Tranche 2LN, term loan 3 month U.S. LIBOR + 7.250% 9.6361% 6/13/25 (b)(c) | 85,000 | 83,548 | |
| Tranche B 1LN, term loan 3 month U.S. LIBOR + 3.500% 5.8861% 6/13/24 (b)(c) | 367,008 | 364,663 | |
| Brand Energy & Infrastructure Services, Inc. Tranche B, term loan 3 month U.S. LIBOR + 4.250% 6.7321% 6/21/24 (b)(c) | 2,187,313 | 2,194,684 | |
| TOTAL SERVICES | 2,642,895 | ||
| Telecommunications - 0.7% | |||
| Level 3 Financing, Inc. Tranche B, term loan 3 month U.S. LIBOR + 2.250% 4.5296% 2/22/24 (b)(c) | 1,570,000 | 1,570,738 | |
| Radiate Holdco LLC Tranche B, term loan 3 month U.S. LIBOR + 3.000% 5.302% 2/1/24 (b)(c) | 2,068,500 | 2,050,773 | |
| Sable International Finance Ltd. Tranche B 4LN, term loan 3 month U.S. LIBOR + 3.250% 5.552% 2/2/26 (b)(c) | 1,235,000 | 1,233,617 | |
| TOTAL TELECOMMUNICATIONS | 4,855,128 | ||
| TOTAL BANK LOAN OBLIGATIONS | |||
| (Cost $14,510,970) | 14,493,419 | ||
| Preferred Securities - 3.4% | |||
| Banks & Thrifts - 3.2% | |||
| Bank of America Corp.: | |||
| 5.2% (b)(f) | 3,580,000 | 3,568,321 | |
| 5.875% (b)(f) | 1,305,000 | 1,275,804 | |
| 6.25% (b)(f) | 1,600,000 | 1,663,746 | |
| 6.5% (b)(f) | 635,000 | 674,406 | |
| Barclays PLC: | |||
| 7.75% (b)(f) | 1,000,000 | 1,014,430 | |
| 7.875% (Reg. S) (b)(f) | 2,465,000 | 2,564,015 | |
| BNP Paribas SA 7% (a)(b)(f) | 370,000 | 369,869 | |
| Citigroup, Inc. 5.95% (b)(f) | 555,000 | 562,225 | |
| Credit Agricole SA: | |||
| 6.625% (a)(b)(f) | 2,015,000 | 2,047,031 | |
| 7.875% (a)(b)(f) | 1,480,000 | 1,542,438 | |
| Royal Bank of Scotland Group PLC: | |||
| 7.5% (b)(f) | 2,475,000 | 2,532,156 | |
| 8.625% (b)(f) | 1,415,000 | 1,498,248 | |
| Wells Fargo & Co. 5.9% (b)(f) | 2,995,000 | 3,069,507 | |
| TOTAL BANKS & THRIFTS | 22,382,196 | ||
| Energy - 0.2% | |||
| Andeavor Logistics LP 6.875% (b)(f) | 1,940,000 | 1,912,572 | |
| TOTAL PREFERRED SECURITIES | |||
| (Cost $23,992,594) | 24,294,768 | ||
| Shares | Value | ||
| Money Market Funds - 2.4% | |||
| Fidelity Cash Central Fund, 2.23% (g) | |||
| (Cost $16,681,101) | 16,678,051 | 16,681,386 | |
| TOTAL INVESTMENT IN SECURITIES - 98.3% | |||
| (Cost $708,088,034) | 691,225,399 | ||
| NET OTHER ASSETS (LIABILITIES) - 1.7% | 12,075,618 | ||
| NET ASSETS - 100% | $703,301,017 |
Legend
(a) Security exempt from registration under Rule 144A of the Securities Act of 1933. These securities may be resold in transactions exempt from registration, normally to qualified institutional buyers. At the end of the period, the value of these securities amounted to $361,550,929 or 51.4% of net assets.
(b) Coupon rates for floating and adjustable rate securities reflect the rates in effect at period end.
(c) Coupon is indexed to a floating interest rate which may be multiplied by a specified factor and/or subject to caps or floors.
(d) Non-income producing
(e) Level 3 security
(f) Security is perpetual in nature with no stated maturity date.
(g) Affiliated fund that is generally available only to investment companies and other accounts managed by Fidelity Investments. The rate quoted is the annualized seven-day yield of the fund at period end. A complete unaudited listing of the fund's holdings as of its most recent quarter end is available upon request. In addition, each Fidelity Central Fund's financial statements, which are not covered by the Fund's Report of Independent Registered Public Accounting Firm, are available on the SEC's website or upon request.
Affiliated Central Funds
Information regarding fiscal year to date income earned by the Fund from investments in Fidelity Central Funds is as follows:
| Fund | Income earned |
| Fidelity Cash Central Fund | $392,526 |
| Total | $392,526 |
Amounts in the income column in the above table include any capital gain distributions from underlying funds, which are presented in the corresponding line-item in the Statement of Operations if applicable.
Investment Valuation
The following is a summary of the inputs used, as of October 31, 2018, involving the Fund's assets and liabilities carried at fair value. The inputs or methodology used for valuing securities may not be an indication of the risk associated with investing in those securities. For more information on valuation inputs, and their aggregation into the levels used below, please refer to the Investment Valuation section in the accompanying Notes to Financial Statements.
| Valuation Inputs at Reporting Date: | ||||
| Description | Total | Level 1 | Level 2 | Level 3 |
| Investments in Securities: | ||||
| Equities: | ||||
| Communication Services | $23,749 | $-- | $-- | $23,749 |
| Energy | 237,663 | 237,663 | -- | -- |
| Corporate Bonds | 635,494,414 | -- | 635,494,414 | -- |
| Bank Loan Obligations | 14,493,419 | -- | 14,493,419 | -- |
| Preferred Securities | 24,294,768 | -- | 24,294,768 | -- |
| Money Market Funds | 16,681,386 | 16,681,386 | -- | -- |
| Total Investments in Securities: | $691,225,399 | $16,919,049 | $674,282,601 | $23,749 |
Other Information
Distribution of investments by country or territory of incorporation, as a percentage of Total Net Assets, is as follows (Unaudited):
| United States of America | 76.5% |
| Canada | 5.7% |
| Netherlands | 3.7% |
| Luxembourg | 3.6% |
| Cayman Islands | 2.3% |
| United Kingdom | 1.9% |
| Multi-National | 1.8% |
| France | 1.2% |
| Bermuda | 1.1% |
| Ireland | 1.0% |
| Others (Individually Less Than 1%) | 1.2% |
| 100.0% |
See accompanying notes which are an integral part of the financial statements.
Financial Statements
Statement of Assets and Liabilities
| October 31, 2018 | ||
| Assets | ||
| Investment in securities, at value — See accompanying schedule: Unaffiliated issuers (cost $691,406,933) | $674,544,013 | |
| Fidelity Central Funds (cost $16,681,101) | 16,681,386 | |
| Total Investment in Securities (cost $708,088,034) | $691,225,399 | |
| Receivable for investments sold | 5,796,789 | |
| Receivable for fund shares sold | 1,546,789 | |
| Interest receivable | 10,914,001 | |
| Distributions receivable from Fidelity Central Funds | 47,054 | |
| Prepaid expenses | 1,338 | |
| Total assets | 709,531,370 | |
| Liabilities | ||
| Payable for investments purchased | $3,954,674 | |
| Payable for fund shares redeemed | 1,473,947 | |
| Distributions payable | 174,299 | |
| Accrued management fee | 331,933 | |
| Distribution and service plan fees payable | 107,836 | |
| Other affiliated payables | 129,063 | |
| Other payables and accrued expenses | 58,601 | |
| Total liabilities | 6,230,353 | |
| Net Assets | $703,301,017 | |
| Net Assets consist of: | ||
| Paid in capital | $748,200,178 | |
| Total distributable earnings (loss) | (44,899,161) | |
| Net Assets | $703,301,017 | |
| Net Asset Value and Maximum Offering Price | ||
| Class A: | ||
| Net Asset Value and redemption price per share ($166,151,124 ÷ 21,951,840 shares) | $7.57 | |
| Maximum offering price per share (100/96.00 of $7.57) | $7.89 | |
| Class M: | ||
| Net Asset Value and redemption price per share ($50,689,748 ÷ 6,711,253 shares) | $7.55 | |
| Maximum offering price per share (100/96.00 of $7.55) | $7.86 | |
| Class C: | ||
| Net Asset Value and offering price per share ($68,816,882 ÷ 9,119,801 shares)(a) | $7.55 | |
| Class I: | ||
| Net Asset Value, offering price and redemption price per share ($416,372,290 ÷ 54,912,540 shares) | $7.58 | |
| Class Z: | ||
| Net Asset Value, offering price and redemption price per share ($1,270,973 ÷ 167,574 shares) | $7.58 |
(a) Redemption price per share is equal to net asset value less any applicable contingent deferred sales charge.
See accompanying notes which are an integral part of the financial statements.
Statement of Operations
| Year ended October 31, 2018 | ||
| Investment Income | ||
| Dividends | $1,645,688 | |
| Interest | 42,318,730 | |
| Income from Fidelity Central Funds | 392,526 | |
| Total income | 44,356,944 | |
| Expenses | ||
| Management fee | $4,070,666 | |
| Transfer agent fees | 1,292,499 | |
| Distribution and service plan fees | 1,375,487 | |
| Accounting fees and expenses | 277,580 | |
| Custodian fees and expenses | 16,763 | |
| Independent trustees' fees and expenses | 3,648 | |
| Registration fees | 86,585 | |
| Audit | 75,041 | |
| Legal | 1,779 | |
| Miscellaneous | 5,406 | |
| Total expenses before reductions | 7,205,454 | |
| Expense reductions | (10,412) | |
| Total expenses after reductions | 7,195,042 | |
| Net investment income (loss) | 37,161,902 | |
| Realized and Unrealized Gain (Loss) | ||
| Net realized gain (loss) on: | ||
| Investment securities: | ||
| Unaffiliated issuers | 1,694,103 | |
| Fidelity Central Funds | 423 | |
| Total net realized gain (loss) | 1,694,526 | |
| Change in net unrealized appreciation (depreciation) on investment securities | (39,404,924) | |
| Net gain (loss) | (37,710,398) | |
| Net increase (decrease) in net assets resulting from operations | $(548,496) |
See accompanying notes which are an integral part of the financial statements.
Statement of Changes in Net Assets
| Year ended October 31, 2018 | Year ended October 31, 2017 | |
| Increase (Decrease) in Net Assets | ||
| Operations | ||
| Net investment income (loss) | $37,161,902 | $39,663,163 |
| Net realized gain (loss) | 1,694,526 | 13,447,344 |
| Change in net unrealized appreciation (depreciation) | (39,404,924) | 7,855,486 |
| Net increase (decrease) in net assets resulting from operations | (548,496) | 60,965,993 |
| Distributions to shareholders | (37,839,174) | – |
| Distributions to shareholders from net investment income | – | (36,726,255) |
| Total distributions | (37,839,174) | (36,726,255) |
| Share transactions - net increase (decrease) | (37,879,855) | (69,327,170) |
| Redemption fees | 9,919 | 78,490 |
| Total increase (decrease) in net assets | (76,257,606) | (45,008,942) |
| Net Assets | ||
| Beginning of period | 779,558,623 | 824,567,565 |
| End of period | $703,301,017 | $779,558,623 |
| Other Information | ||
| Undistributed net investment income end of period | $5,907,159 |
See accompanying notes which are an integral part of the financial statements.
Financial Highlights
Fidelity Advisor High Income Fund Class A
| Years ended October 31, | 2018 | 2017 | 2016 | 2015 | 2014 |
| Selected Per–Share Data | |||||
| Net asset value, beginning of period | $7.97 | $7.73 | $7.61 | $8.33 | $8.77 |
| Income from Investment Operations | |||||
| Net investment income (loss)A | .392 | .399 | .421 | .430 | .432 |
| Net realized and unrealized gain (loss) | (.394) | .208 | .089 | (.523) | (.058) |
| Total from investment operations | (.002) | .607 | .510 | (.093) | .374 |
| Distributions from net investment income | (.398) | (.368) | (.392) | (.424) | (.429) |
| Distributions from net realized gain | – | – | – | (.204) | (.386) |
| Total distributions | (.398) | (.368) | (.392) | (.628) | (.815) |
| Redemption fees added to paid in capitalA | –B | .001 | .002 | .001 | .001 |
| Net asset value, end of period | $7.57 | $7.97 | $7.73 | $7.61 | $8.33 |
| Total ReturnC,D | (.03)% | 8.02% | 7.09% | (1.13)% | 4.51% |
| Ratios to Average Net AssetsE,F | |||||
| Expenses before reductions | 1.02% | 1.03% | 1.04% | 1.03% | 1.03% |
| Expenses net of fee waivers, if any | 1.02% | 1.03% | 1.04% | 1.03% | 1.03% |
| Expenses net of all reductions | 1.02% | 1.03% | 1.04% | 1.03% | 1.03% |
| Net investment income (loss) | 5.03% | 5.06% | 5.68% | 5.45% | 5.09% |
| Supplemental Data | |||||
| Net assets, end of period (000 omitted) | $166,151 | $191,744 | $223,620 | $227,596 | $243,987 |
| Portfolio turnover rateG | 66% | 63% | 61% | 60% | 79% |
A Calculated based on average shares outstanding during the period.
B Amount represents less than $.0005 per share.
C Total returns would have been lower if certain expenses had not been reduced during the applicable periods shown.
D Total returns do not include the effect of the sales charges.
E Fees and expenses of any underlying Fidelity Central Funds are not included in the Fund's expense ratio. The Fund indirectly bears its proportionate share of the expenses of any underlying Fidelity Central Funds.
F Expense ratios reflect operating expenses of the class. Expenses before reductions do not reflect amounts reimbursed by the investment adviser or reductions from brokerage service arrangements or reductions from other expense offset arrangements and do not represent the amount paid by the class during periods when reimbursements or reductions occur. Expenses net of fee waivers reflect expenses after reimbursement by the investment adviser but prior to reductions from brokerage service arrangements or other expense offset arrangements. Expenses net of all reductions represent the net expenses paid by the class.
G Amount does not include the portfolio activity of any underlying Fidelity Central Funds.
See accompanying notes which are an integral part of the financial statements.
Fidelity Advisor High Income Fund Class M
| Years ended October 31, | 2018 | 2017 | 2016 | 2015 | 2014 |
| Selected Per–Share Data | |||||
| Net asset value, beginning of period | $7.95 | $7.71 | $7.59 | $8.31 | $8.76 |
| Income from Investment Operations | |||||
| Net investment income (loss)A | .390 | .395 | .418 | .428 | .429 |
| Net realized and unrealized gain (loss) | (.394) | .209 | .089 | (.524) | (.067) |
| Total from investment operations | (.004) | .604 | .507 | (.096) | .362 |
| Distributions from net investment income | (.396) | (.365) | (.389) | (.421) | (.427) |
| Distributions from net realized gain | – | – | – | (.204) | (.386) |
| Total distributions | (.396) | (.365) | (.389) | (.625) | (.813) |
| Redemption fees added to paid in capitalA | –B | .001 | .002 | .001 | .001 |
| Net asset value, end of period | $7.55 | $7.95 | $7.71 | $7.59 | $8.31 |
| Total ReturnC,D | (.06)% | 8.00% | 7.06% | (1.16)% | 4.38% |
| Ratios to Average Net AssetsE,F | |||||
| Expenses before reductions | 1.04% | 1.06% | 1.06% | 1.05% | 1.05% |
| Expenses net of fee waivers, if any | 1.04% | 1.05% | 1.06% | 1.05% | 1.05% |
| Expenses net of all reductions | 1.04% | 1.05% | 1.06% | 1.05% | 1.05% |
| Net investment income (loss) | 5.01% | 5.03% | 5.65% | 5.43% | 5.07% |
| Supplemental Data | |||||
| Net assets, end of period (000 omitted) | $50,690 | $61,488 | $70,205 | $79,379 | $86,166 |
| Portfolio turnover rateG | 66% | 63% | 61% | 60% | 79% |
A Calculated based on average shares outstanding during the period.
B Amount represents less than $.0005 per share.
C Total returns would have been lower if certain expenses had not been reduced during the applicable periods shown.
D Total returns do not include the effect of the sales charges.
E Fees and expenses of any underlying Fidelity Central Funds are not included in the Fund's expense ratio. The Fund indirectly bears its proportionate share of the expenses of any underlying Fidelity Central Funds.
F Expense ratios reflect operating expenses of the class. Expenses before reductions do not reflect amounts reimbursed by the investment adviser or reductions from brokerage service arrangements or reductions from other expense offset arrangements and do not represent the amount paid by the class during periods when reimbursements or reductions occur. Expenses net of fee waivers reflect expenses after reimbursement by the investment adviser but prior to reductions from brokerage service arrangements or other expense offset arrangements. Expenses net of all reductions represent the net expenses paid by the class.
G Amount does not include the portfolio activity of any underlying Fidelity Central Funds.
See accompanying notes which are an integral part of the financial statements.
Fidelity Advisor High Income Fund Class C
| Years ended October 31, | 2018 | 2017 | 2016 | 2015 | 2014 |
| Selected Per–Share Data | |||||
| Net asset value, beginning of period | $7.95 | $7.70 | $7.59 | $8.30 | $8.75 |
| Income from Investment Operations | |||||
| Net investment income (loss)A | .331 | .337 | .363 | .370 | .365 |
| Net realized and unrealized gain (loss) | (.394) | .219 | .079 | (.515) | (.066) |
| Total from investment operations | (.063) | .556 | .442 | (.145) | .299 |
| Distributions from net investment income | (.337) | (.307) | (.334) | (.362) | (.364) |
| Distributions from net realized gain | – | – | – | (.204) | (.386) |
| Total distributions | (.337) | (.307) | (.334) | (.566) | (.750) |
| Redemption fees added to paid in capitalA | –B | .001 | .002 | .001 | .001 |
| Net asset value, end of period | $7.55 | $7.95 | $7.70 | $7.59 | $8.30 |
| Total ReturnC,D | (.81)% | 7.35% | 6.14% | (1.78)% | 3.60% |
| Ratios to Average Net AssetsE,F | |||||
| Expenses before reductions | 1.79% | 1.79% | 1.80% | 1.80% | 1.80% |
| Expenses net of fee waivers, if any | 1.79% | 1.79% | 1.80% | 1.80% | 1.80% |
| Expenses net of all reductions | 1.79% | 1.79% | 1.80% | 1.80% | 1.80% |
| Net investment income (loss) | 4.27% | 4.29% | 4.91% | 4.68% | 4.32% |
| Supplemental Data | |||||
| Net assets, end of period (000 omitted) | $68,817 | $88,686 | $97,833 | $94,752 | $114,455 |
| Portfolio turnover rateG | 66% | 63% | 61% | 60% | 79% |
A Calculated based on average shares outstanding during the period.
B Amount represents less than $.0005 per share.
C Total returns would have been lower if certain expenses had not been reduced during the applicable periods shown.
D Total returns do not include the effect of the contingent deferred sales charge.
E Fees and expenses of any underlying Fidelity Central Funds are not included in the Fund's expense ratio. The Fund indirectly bears its proportionate share of the expenses of any underlying Fidelity Central Funds.
F Expense ratios reflect operating expenses of the class. Expenses before reductions do not reflect amounts reimbursed by the investment adviser or reductions from brokerage service arrangements or reductions from other expense offset arrangements and do not represent the amount paid by the class during periods when reimbursements or reductions occur. Expenses net of fee waivers reflect expenses after reimbursement by the investment adviser but prior to reductions from brokerage service arrangements or other expense offset arrangements. Expenses net of all reductions represent the net expenses paid by the class.
G Amount does not include the portfolio activity of any underlying Fidelity Central Funds.
See accompanying notes which are an integral part of the financial statements.
Fidelity Advisor High Income Fund Class I
| Years ended October 31, | 2018 | 2017 | 2016 | 2015 | 2014 |
| Selected Per–Share Data | |||||
| Net asset value, beginning of period | $7.99 | $7.74 | $7.62 | $8.34 | $8.79 |
| Income from Investment Operations | |||||
| Net investment income (loss)A | .409 | .416 | .438 | .445 | .447 |
| Net realized and unrealized gain (loss) | (.404) | .219 | .089 | (.523) | (.068) |
| Total from investment operations | .005 | .635 | .527 | (.078) | .379 |
| Distributions from net investment income | (.415) | (.386) | (.409) | (.439) | (.444) |
| Distributions from net realized gain | – | – | – | (.204) | (.386) |
| Total distributions | (.415) | (.386) | (.409) | (.643) | (.830) |
| Redemption fees added to paid in capitalA | –B | .001 | .002 | .001 | .001 |
| Net asset value, end of period | $7.58 | $7.99 | $7.74 | $7.62 | $8.34 |
| Total ReturnC | .06% | 8.39% | 7.31% | (.94)% | 4.57% |
| Ratios to Average Net AssetsD,E | |||||
| Expenses before reductions | .81% | .80% | .82% | .87% | .87% |
| Expenses net of fee waivers, if any | .81% | .80% | .82% | .85% | .85% |
| Expenses net of all reductions | .81% | .80% | .82% | .85% | .85% |
| Net investment income (loss) | 5.25% | 5.28% | 5.89% | 5.63% | 5.27% |
| Supplemental Data | |||||
| Net assets, end of period (000 omitted) | $416,372 | $437,641 | $432,910 | $361,760 | $337,377 |
| Portfolio turnover rateF | 66% | 63% | 61% | 60% | 79% |
A Calculated based on average shares outstanding during the period.
B Amount represents less than $.0005 per share.
C Total returns would have been lower if certain expenses had not been reduced during the applicable periods shown.
D Fees and expenses of any underlying Fidelity Central Funds are not included in the Fund's expense ratio. The Fund indirectly bears its proportionate share of the expenses of any underlying Fidelity Central Funds.
E Expense ratios reflect operating expenses of the class. Expenses before reductions do not reflect amounts reimbursed by the investment adviser or reductions from brokerage service arrangements or reductions from other expense offset arrangements and do not represent the amount paid by the class during periods when reimbursements or reductions occur. Expenses net of fee waivers reflect expenses after reimbursement by the investment adviser but prior to reductions from brokerage service arrangements or other expense offset arrangements. Expenses net of all reductions represent the net expenses paid by the class.
F Amount does not include the portfolio activity of any underlying Fidelity Central Funds.
See accompanying notes which are an integral part of the financial statements.
Fidelity Advisor High Income Fund Class Z
| Year ended October 31, | 2018 A |
| Selected Per–Share Data | |
| Net asset value, beginning of period | $7.77 |
| Income from Investment Operations | |
| Net investment income (loss)B | .030 |
| Net realized and unrealized gain (loss) | (.189) |
| Total from investment operations | (.159) |
| Distributions from net investment income | (.031) |
| Distributions from net realized gain | – |
| Total distributions | (.031) |
| Net asset value, end of period | $7.58 |
| Total ReturnC,D | (2.04)% |
| Ratios to Average Net AssetsE,F | |
| Expenses before reductions | .67%G |
| Expenses net of fee waivers, if any | .67%G |
| Expenses net of all reductions | .66%G |
| Net investment income (loss) | 5.58%G |
| Supplemental Data | |
| Net assets, end of period (000 omitted) | $1,271 |
| Portfolio turnover rateH | 66% |
A For the period October 2, 2018 (commencement of sale of shares) to October 31, 2018.
B Calculated based on average shares outstanding during the period.
C Total returns for periods of less than one year are not annualized.
D Total returns would have been lower if certain expenses had not been reduced during the applicable periods shown.
E Fees and expenses of any underlying Fidelity Central Funds are not included in the Fund's expense ratio. The Fund indirectly bears its proportionate share of the expenses of any underlying Fidelity Central Funds.
F Expense ratios reflect operating expenses of the class. Expenses before reductions do not reflect amounts reimbursed by the investment adviser or reductions from brokerage service arrangements or reductions from other expense offset arrangements and do not represent the amount paid by the class during periods when reimbursements or reductions occur. Expense ratios before reductions for start-up periods may not be representative of longer-term operating periods. Expenses net of fee waivers reflect expenses after reimbursement by the investment adviser but prior to reductions from brokerage service arrangements or other expense offset arrangements. Expenses net of all reductions represent the net expenses paid by the class.
G Annualized
H Amount does not include the portfolio activity of any underlying Fidelity Central Funds.
See accompanying notes which are an integral part of the financial statements.
Notes to Financial Statements
For the period ended October 31, 2018
1. Organization.
Fidelity Advisor High Income Fund (the Fund) is a fund of Fidelity Advisor Series I (the Trust) and is authorized to issue an unlimited number of shares. The Trust is registered under the Investment Company Act of 1940, as amended (the 1940 Act), as an open-end management investment company organized as a Massachusetts business trust. The Fund commenced sale of Class Z shares on October 2, 2018. The Fund offers Class A, Class M, Class C, Class I and Class Z shares, each of which has equal rights as to assets and voting privileges. Each class has exclusive voting rights with respect to matters that affect that class.
2. Investments in Fidelity Central Funds.
The Fund invests in Fidelity Central Funds, which are open-end investment companies generally available only to other investment companies and accounts managed by the investment adviser and its affiliates. The Fund's Schedule of Investments lists each of the Fidelity Central Funds held as of period end, if any, as an investment of the Fund, but does not include the underlying holdings of each Fidelity Central Fund. As an Investing Fund, the Fund indirectly bears its proportionate share of the expenses of the underlying Fidelity Central Funds.
The Money Market Central Funds seek preservation of capital and current income and are managed by Fidelity Investments Money Management, Inc. (FIMM), an affiliate of the investment adviser. Annualized expenses of the Money Market Central Funds as of their most recent shareholder report date are less than .005%.
A complete unaudited list of holdings for each Fidelity Central Fund is available upon request or at the Securities and Exchange Commission (the SEC) website at www.sec.gov. In addition, the financial statements of the Fidelity Central Funds, which are not covered by the Fund's Report of Independent Registered Public Accounting Firm, are available on the SEC website or upon request.
3. Significant Accounting Policies.
The Fund is an investment company and applies the accounting and reporting guidance of the Financial Accounting Standards Board (FASB) Accounting Standards Codification Topic 946 Financial Services – Investments Companies. The financial statements have been prepared in conformity with accounting principles generally accepted in the United States of America (GAAP), which require management to make certain estimates and assumptions at the date of the financial statements. Actual results could differ from those estimates. Subsequent events, if any, through the date that the financial statements were issued have been evaluated in the preparation of the financial statements. The following summarizes the significant accounting policies of the Fund:
Investment Valuation. Investments are valued as of 4:00 p.m. Eastern time on the last calendar day of the period. The Board of Trustees (the Board) has delegated the day to day responsibility for the valuation of the Fund's investments to the Fair Value Committee (the Committee) established by the Fund's investment adviser. In accordance with valuation policies and procedures approved by the Board, the Fund attempts to obtain prices from one or more third party pricing vendors or brokers to value its investments. When current market prices, quotations or currency exchange rates are not readily available or reliable, investments will be fair valued in good faith by the Committee, in accordance with procedures adopted by the Board. Factors used in determining fair value vary by investment type and may include market or investment specific events, changes in interest rates and credit quality. The frequency with which these procedures are used cannot be predicted and they may be utilized to a significant extent. The Committee oversees the Fund's valuation policies and procedures and reports to the Board on the Committee's activities and fair value determinations. The Board monitors the appropriateness of the procedures used in valuing the Fund's investments and ratifies the fair value determinations of the Committee.
The Fund categorizes the inputs to valuation techniques used to value its investments into a disclosure hierarchy consisting of three levels as shown below:
- Level 1 – quoted prices in active markets for identical investments
- Level 2 – other significant observable inputs (including quoted prices for similar investments, interest rates, prepayment speeds, etc.)
- Level 3 – unobservable inputs (including the Fund's own assumptions based on the best information available)
Valuation techniques used to value the Fund's investments by major category are as follows:
Debt securities, including restricted securities, are valued based on evaluated prices received from third party pricing vendors or from brokers who make markets in such securities. Corporate bonds, bank loan obligations and preferred securities are valued by pricing vendors who utilize matrix pricing which considers yield or price of bonds of comparable quality, coupon, maturity and type or by broker-supplied prices. When independent prices are unavailable or unreliable, debt securities may be valued utilizing pricing methodologies which consider similar factors that would be used by third party pricing vendors. Debt securities are generally categorized as Level 2 in the hierarchy but may be Level 3 depending on the circumstances. The Fund invests a significant portion of its assets in below investment grade securities. The value of these securities can be more volatile due to changes in the credit quality of the issuer and is sensitive to changes in economic, market and regulatory conditions.
Equity securities, including restricted securities, for which market quotations are readily available, are valued at the last reported sale price or official closing price as reported by a third party pricing vendor on the primary market or exchange on which they are traded and are categorized as Level 1 in the hierarchy. In the event there were no sales during the day or closing prices are not available, securities are valued at the last quoted bid price or may be valued using the last available price and are generally categorized as Level 2 in the hierarchy. For equity securities, including restricted securities, where observable inputs are limited, assumptions about market activity and risk are used and these securities may be categorized as Level 3 in the hierarchy.
Investments in open-end mutual funds, including the Fidelity Central Funds, are valued at their closing net asset value (NAV) each business day and are categorized as Level 1 in the hierarchy.
Changes in valuation techniques may result in transfers in or out of an assigned level within the disclosure hierarchy. The aggregate value of investments by input level as of October 31, 2018 is included at the end of the Fund's Schedule of Investments.
Investment Transactions and Income. For financial reporting purposes, the Fund's investment holdings and NAV include trades executed through the end of the last business day of the period. The NAV per share for processing shareholder transactions is calculated as of the close of business of the New York Stock Exchange (NYSE), normally 4:00 p.m. Eastern time and includes trades executed through the end of the prior business day. Gains and losses on securities sold are determined on the basis of identified cost and include proceeds received from litigation. Dividend income is recorded on the ex-dividend date, except for certain dividends from foreign securities where the ex-dividend date may have passed, which are recorded as soon as the Fund is informed of the ex-dividend date. Non-cash dividends included in dividend income, if any, are recorded at the fair market value of the securities received. Income and capital gain distributions from Fidelity Central Funds, if any, are recorded on the ex-dividend date. Interest income is accrued as earned and includes coupon interest and amortization of premium and accretion of discount on debt securities as applicable. Paid in Kind (PIK) income is recorded at the fair market value of the securities received. Debt obligations may be placed on non-accrual status and related interest income may be reduced by ceasing current accruals and writing off interest receivables when the collection of all or a portion of interest has become doubtful based on consistently applied procedures. A debt obligation is removed from non-accrual status when the issuer resumes interest payments or when collectability of interest is reasonably assured.
Class Allocations and Expenses. Investment income, realized and unrealized capital gains and losses, common expenses of the Fund, and certain fund-level expense reductions, if any, are allocated daily on a pro-rata basis to each class based on the relative net assets of each class to the total net assets of the Fund. Each class differs with respect to transfer agent and distribution and service plan fees incurred. Certain expense reductions may also differ by class. For the reporting period, the allocated portion of income and expenses to each class as a percent of its average net assets may vary due to the timing of recording these transactions in relation to fluctuating net assets of the classes. Expenses directly attributable to a fund are charged to that fund. Expenses attributable to more than one fund are allocated among the respective funds on the basis of relative net assets or other appropriate methods. Expense estimates are accrued in the period to which they relate and adjustments are made when actual amounts are known.
Income Tax Information and Distributions to Shareholders. Each year, the Fund intends to qualify as a regulated investment company under Subchapter M of the Internal Revenue Code, including distributing substantially all of its taxable income and realized gains. As a result, no provision for U.S. Federal income taxes is required. As of October 31, 2018, the Fund did not have any unrecognized tax benefits in the financial statements; nor is the Fund aware of any tax positions for which it is reasonably possible that the total amounts of unrecognized tax benefits will significantly change in the next twelve months. The Fund files a U.S. federal tax return, in addition to state and local tax returns as required. The Fund's federal income tax returns are subject to examination by the Internal Revenue Service (IRS) for a period of three fiscal years after they are filed. State and local tax returns may be subject to examination for an additional fiscal year depending on the jurisdiction.
Distributions are declared and recorded daily and paid monthly from net investment income. Distributions from realized gains, if any, are declared and recorded on the ex-dividend date. Income and capital gain distributions are declared separately for each class. Income and capital gain distributions are determined in accordance with income tax regulations, which may differ from GAAP.
Capital accounts within the financial statements are adjusted for permanent book-tax differences. These adjustments have no impact on net assets or the results of operations. Capital accounts are not adjusted for temporary book-tax differences which will reverse in a subsequent period.
Book-tax differences are primarily due to defaulted bonds, market discount, partnerships, capital loss carryforwards and losses deferred due to wash sales.
As of period end, the cost and unrealized appreciation (depreciation) in securities, and derivatives if applicable, for federal income tax purposes were as follows:
| Gross unrealized appreciation | $9,358,177 |
| Gross unrealized depreciation | (23,188,125) |
| Net unrealized appreciation (depreciation) | $(13,829,948) |
| Tax Cost | $705,055,347 |
The tax-based components of distributable earnings as of period end were as follows:
| Undistributed ordinary income | $1,723,034 |
| Capital loss carryforward | $(32,788,780) |
| Net unrealized appreciation (depreciation) on securities and other investments | $(13,829,948) |
Capital loss carryforwards are only available to offset future capital gains of the Fund to the extent provided by regulations and may be limited. Under the Regulated Investment Company Modernization Act of 2010 (the Act), the Fund is permitted to carry forward capital losses incurred in taxable years beginning after December 22, 2010 for an unlimited period and such capital losses are required to be used prior to any losses that expire. The capital loss carryforward information presented below, including any applicable limitation, is estimated as of fiscal period end and is subject to adjustment.
| No expiration | |
| Short-term | $(18,671,075) |
| Long-term | (14,117,705) |
| Total capital loss carryforward | $(32,788,780) |
The tax character of distributions paid was as follows:
| October 31, 2018 | October 31, 2017 | |
| Ordinary Income | $37,839,174 | $ 36,726,255 |
Short-Term Trading (Redemption) Fees. During the period, shares held by investors in the Fund less than 90 days may have been subject to a redemption fee equal to 1.00% of the NAV of shares redeemed. All redemption fees, which reduce the proceeds of the shareholder redemption, are retained by the Fund and accounted for as an addition to paid in capital. In November 2017, the Board of Trustees approved the elimination of these redemption fees effective December 18, 2017.
Restricted Securities. The Fund may invest in securities that are subject to legal or contractual restrictions on resale. These securities generally may be resold in transactions exempt from registration or to the public if the securities are registered. Disposal of these securities may involve time-consuming negotiations and expense, and prompt sale at an acceptable price may be difficult. Information regarding restricted securities is included at the end of the Fund's Schedule of Investments.
Loans and Other Direct Debt Instruments. The Fund invests in direct debt instruments which are interests in amounts owed to lenders by corporate or other borrowers. These instruments may be in the form of loans, trade claims or other receivables and may include standby financing commitments such as revolving credit facilities that obligate the Fund to supply additional cash to the borrower on demand. Loans may be acquired through assignment or participation. The Fund did not have any unfunded loan commitments, which are contractual obligations for future funding, at period end.
New Accounting Pronouncement. In March 2017, the Financial Accounting Standards Board (FASB) issued an Accounting Standards Update (ASU), ASU 2017-08, which amends the amortization period for certain callable debt securities that are held at a premium. The amendment requires the premium to be amortized to the earliest call date. The amendments do not require an accounting change for securities held at a discount. The ASU is effective for annual periods beginning after December 15, 2018. Management is currently evaluating the potential impact of these changes to the financial statements.
New Rule Issuance. During August 2018, the U.S. Securities and Exchange Commission issued Final Rule Release No. 33-10532, Disclosure Update and Simplification. This Final Rule includes amendments specific to registered investment companies that are intended to eliminate overlap in disclosure requirements between Regulation S-X and GAAP. In accordance with these amendments, certain line-items in the Fund's financial statements have been combined or removed for the current period as outlined in the table below.
| Financial Statement | Current Line-Item Presentation | Prior Line-Item Presentation |
| Statement of Assets and Liabilities | Total distributable earnings (loss) | Undistributed/Distributions in excess of/Accumulated net investment income (loss) Accumulated/Undistributed net realized gain (loss) Net unrealized appreciation (depreciation) |
| Statement of Changes in Net Assets | N/A - removed | Undistributed/Distributions in excess of/Accumulated net investment income (loss) end of period |
| Statement of Changes in Net Assets | Distributions to shareholders | Distributions to shareholders from net investment income Distributions to shareholders from net realized gain |
| Distributions to Shareholders Note to Financial Statements | Distributions to shareholders | Distributions to shareholders from net investment income Distributions to shareholders from net realized gain |
4. Purchases and Sales of Investments.
Purchases and sales of securities, other than short-term securities, aggregated $462,701,193 and $497,951,392, respectively.
5. Fees and Other Transactions with Affiliates.
Management Fee. Fidelity Management & Research Company (the investment adviser) and its affiliates provide the Fund with investment management related services for which the Fund pays a monthly management fee. The management fee is the sum of an individual fund fee rate that is based on an annual rate of .45% of the Fund's average net assets and an annualized group fee rate that averaged .11% during the period. The group fee rate is based upon the average net assets of all the mutual funds advised by the investment adviser, including any mutual funds previously advised by the investment adviser that are currently advised by Fidelity SelectCo, LLC, an affiliate of the investment adviser. The group fee rate decreases as assets under management increase and increases as assets under management decrease. For the reporting period, the total annual management fee rate was .56% of the Fund's average net assets.
Distribution and Service Plan Fees. In accordance with Rule 12b-1 of the 1940 Act, the Fund has adopted separate Distribution and Service Plans for each class of shares. Certain classes pay Fidelity Distributors Corporation (FDC), an affiliate of the investment adviser, separate Distribution and Service Fees, each of which is based on an annual percentage of each class' average net assets. In addition, FDC may pay financial intermediaries for selling shares of the Fund and providing shareholder support services. For the period, the Distribution and Service Fee rates, total fees and amounts retained by FDC were as follows:
| Distribution Fee | Service Fee | Total Fees | Retained by FDC | |
| Class A | -% | .25% | $444,329 | $7,682 |
| Class M | -% | .25% | 140,303 | 170 |
| Class C | .75% | .25% | 790,855 | 39,252 |
| $1,375,487 | $47,104 |
Sales Load. FDC may receive a front-end sales charge of up to 4.00% for selling Class A shares and Class M shares, some of which is paid to financial intermediaries for selling shares of the Fund. Depending on the holding period, FDC may receive contingent deferred sales charges levied on Class A, Class M and Class C redemptions. The deferred sales charges are 1.00% for Class C shares, 1.00% for certain purchases of Class A shares and .25% for certain purchases of Class M shares.
For the period, sales charge amounts retained by FDC were as follows:
| Retained by FDC | |
| Class A | $47,665 |
| Class M | 3,548 |
| Class C(a) | 2,756 |
| $53,969 |
(a) When Class C shares are initially sold, FDC pays commissions from its own resources to financial intermediaries through which the sales are made.
Transfer Agent Fees. Fidelity Investments Institutional Operations Company, Inc., (FIIOC), an affiliate of the investment adviser, is the transfer, dividend disbursing and shareholder servicing agent for each class of the Fund. FIIOC receives account fees and asset-based fees that vary according to the account size and type of account of the shareholders of the respective classes of the Fund, except for Class Z. FIIOC receives an asset-based fee of Class Z's average net assets. FIIOC pays for typesetting, printing and mailing of shareholder reports, except proxy statements.
For the period, transfer agent fees for each class were as follows:
| Amount | % of Class-Level Average Net Assets | |
| Class A | $272,364 | .15 |
| Class M | 95,916 | .17 |
| Class C | 134,562 | .17 |
| Class I | 789,642 | .19 |
| Class Z | 15 | .05(a) |
| $1,292,499 |
(a) Annualized
Accounting Fees. Fidelity Service Company, Inc. (FSC), an affiliate of the investment adviser, maintains the Fund's accounting records. The fee is based on the level of average net assets for each month. For the period, the fees were equivalent to an annual rate of .04%.
Brokerage Commissions. The Fund placed a portion of its portfolio transactions with brokerage firms which are affiliates of the investment adviser. Brokerage commissions are included in net realized gain (loss) and change in net unrealized appreciation (depreciation) in the Statement of Operations. The commissions paid to these affiliated firms were $596 for the period.
Interfund Trades. The Fund may purchase from or sell securities to other Fidelity Funds under procedures adopted by the Board. The procedures have been designed to ensure these interfund trades are executed in accordance with Rule 17a-7 of the 1940 Act. Interfund trades are included within the respective purchases and sales amounts shown in the Purchases and Sales of Investments note.
6. Committed Line of Credit.
The Fund participates with other funds managed by the investment adviser or an affiliate in a $4.25 billion credit facility (the "line of credit") to be utilized for temporary or emergency purposes to fund shareholder redemptions or for other short-term liquidity purposes. The Fund has agreed to pay commitment fees on its pro-rata portion of the line of credit, which amounted to $2,014 and is reflected in Miscellaneous expenses on the Statement of Operations. During the period, the Fund did not borrow on this line of credit.
7. Expense Reductions.
Commissions paid to certain brokers with whom the investment adviser, or its affiliates, places trades on behalf of the Fund include an amount in addition to trade execution, which may be rebated back to the Fund to offset certain expenses. This amount totaled $415 for the period. In addition, through arrangements with the Fund's custodian, credits realized as a result of certain uninvested cash balances were used to reduce the Fund's expenses. During the period, these credits reduced the Fund's custody expenses by $5,408.
In addition, during the period the investment adviser reimbursed and/or waived a portion of fund-level operating expenses in the amount of $4,589.
8. Distributions to Shareholders.
Distributions to shareholders of each class were as follows:
| Year ended October 31, 2018(a) | Year ended October 31, 2017 | |
| Distributions to shareholders | ||
| Class A | $9,112,033 | $– |
| Class M | 2,873,030 | – |
| Class C | 3,452,822 | – |
| Class I | 22,399,580 | – |
| Class Z | 1,709 | – |
| Total | $37,839,174 | $– |
| From net investment income | ||
| Class A | $– | $9,515,108 |
| Class M | – | 2,956,751 |
| Class C | – | 3,737,500 |
| Class I | – | 20,516,896 |
| Total | $– | $36,726,255 |
(a) Distributions for Class Z are for the period October 2, 2018 (commencement of sale of shares) to October 31, 2018.
9. Share Transactions.
Share transactions for each class were as follows and may contain automatic conversions between classes or exchanges between affiliated funds:
| Shares | Shares | Dollars | Dollars | |
| Year ended October 31, 2018(a) | Year ended October 31, 2017 | Year ended October 31, 2018(a) | Year ended October 31, 2017 | |
| Class A | ||||
| Shares sold | 3,131,264 | 4,274,945 | $24,335,123 | $33,549,610 |
| Reinvestment of distributions | 1,032,488 | 1,068,579 | 8,017,099 | 8,416,417 |
| Shares redeemed | (6,267,430) | (10,231,300) | (48,768,820) | (80,486,859) |
| Net increase (decrease) | (2,103,678) | (4,887,776) | $(16,416,598) | $(38,520,832) |
| Class M | ||||
| Shares sold | 664,671 | 898,800 | $5,175,622 | $7,023,251 |
| Reinvestment of distributions | 343,072 | 338,516 | 2,658,881 | 2,663,455 |
| Shares redeemed | (2,026,707) | (2,612,833) | (15,735,523) | (20,330,619) |
| Net increase (decrease) | (1,018,964) | (1,375,517) | $(7,901,020) | $(10,643,913) |
| Class C | ||||
| Shares sold | 1,312,807 | 1,327,140 | $10,123,873 | $10,364,683 |
| Reinvestment of distributions | 413,520 | 432,438 | 3,202,806 | 3,399,020 |
| Shares redeemed | (3,766,539) | (3,300,673) | (29,109,314) | (25,902,554) |
| Net increase (decrease) | (2,040,212) | (1,541,095) | $(15,782,635) | $(12,138,851) |
| Class I | ||||
| Shares sold | 17,950,365 | 19,143,899 | $139,844,321 | $151,063,114 |
| Reinvestment of distributions | 2,785,196 | 2,509,674 | 21,657,374 | 19,816,828 |
| Shares redeemed | (20,629,613) | (22,778,405) | (160,559,566) | (178,903,516) |
| Net increase (decrease) | 105,948 | (1,124,832) | $942,129 | $(8,023,574) |
| Class Z | ||||
| Shares sold | 167,519 | – | $1,277,849 | $– |
| Reinvestment of distributions | 225 | – | 1,709 | – |
| Shares redeemed | (170) | – | (1,289) | – |
| Net increase (decrease) | 167,574 | – | $1,278,269 | $– |
(a) Share transactions for Class Z are for the period October 2, 2018 (commencement of sale of shares) to October 31, 2018
10. Other.
The Fund's organizational documents provide former and current trustees and officers with a limited indemnification against liabilities arising in connection with the performance of their duties to the Fund. In the normal course of business, the Fund may also enter into contracts that provide general indemnifications. The Fund's maximum exposure under these arrangements is unknown as this would be dependent on future claims that may be made against the Fund. The risk of material loss from such claims is considered remote.
11. Reorganization.
Subsequent to period end, on December 7, 2018, Fidelity High Income Fund acquired all of the assets and assumed all of the liabilities of the Fund pursuant to an Agreement and Plan of Reorganization approved by the Board of Trustees ("the Board"). The reorganization was accomplished by an exchange of corresponding classes of Fidelity High Income Fund for each class of shares then outstanding of the Fund at their net asset value on the reorganization date. The reorganization provides shareholders of the Fund access to a larger portfolio with a similar investment objective. The reorganization qualified as a tax-free reorganization for federal income tax purposes with no gain or loss recognized to the funds or their shareholders. The Fund's net assets of $693,345,403, including securities of $686,303,068 and unrealized depreciation of $(28,030,719), were combined with Fidelity High Income Fund's net assets of $4,115,642,492 for total net assets after the reorganization of $4,808,987,895.
Report of Independent Registered Public Accounting Firm
To the Trustees of Fidelity Advisor Series I and Shareholders of Fidelity Advisor High Income Fund:
Opinion on the Financial Statements and Financial Highlights
We have audited the accompanying statement of assets and liabilities of Fidelity Advisor High Income Fund (the "Fund"), a fund of Fidelity Advisor Series I, including the schedule of investments, as of October 31, 2018, and the related statement of operations for the year then ended, the statement of changes in net assets for each of the two years in the period then ended, the financial highlights for each of the five years in the period then ended, and the related notes. In our opinion, the financial statements and financial highlights present fairly, in all material respects, the financial position of the Fund as of October 31, 2018, and the results of its operations for the year then ended, the changes in its net assets for each of the two years in the period then ended, and the financial highlights for each of the five years in the period then ended, in conformity with accounting principles generally accepted in the United States of America.
Basis for Opinion
These financial statements and financial highlights are the responsibility of the Fund's management. Our responsibility is to express an opinion on the Fund's financial statements and financial highlights based on our audits. We are a public accounting firm registered with the Public Company Accounting Oversight Board (United States) (PCAOB) and are required to be independent with respect to the Fund in accordance with the U.S. federal securities laws and the applicable rules and regulations of the Securities and Exchange Commission and the PCAOB.
We conducted our audits in accordance with the standards of the PCAOB. Those standards require that we plan and perform the audit to obtain reasonable assurance about whether the financial statements and financial highlights are free of material misstatement, whether due to error or fraud. The Fund is not required to have, nor were we engaged to perform, an audit of its internal control over financial reporting. As part of our audits we are required to obtain an understanding of internal control over financial reporting but not for the purpose of expressing an opinion on the effectiveness of the Fund’s internal control over financial reporting. Accordingly, we express no such opinion.
Our audits included performing procedures to assess the risks of material misstatement of the financial statements and financial highlights, whether due to error or fraud, and performing procedures that respond to those risks. Such procedures included examining, on a test basis, evidence regarding the amounts and disclosures in the financial statements and financial highlights. Our audits also included evaluating the accounting principles used and significant estimates made by management, as well as evaluating the overall presentation of the financial statements and financial highlights. Our procedures included confirmation of securities owned as of October 31, 2018, by correspondence with the custodians and brokers; when replies were not received from brokers, we performed other auditing procedures. We believe that our audits provide a reasonable basis for our opinion.
/s/ Deloitte & Touche LLP
Boston, Massachusetts
December 14, 2018
We have served as the auditor of one or more of the Fidelity investment companies since 1999.
Trustees and Officers
The Trustees, Members of the Advisory Board (if any), and officers of the trust and fund, as applicable, are listed below. The Board of Trustees governs the fund and is responsible for protecting the interests of shareholders. The Trustees are experienced executives who meet periodically throughout the year to oversee the fund's activities, review contractual arrangements with companies that provide services to the fund, oversee management of the risks associated with such activities and contractual arrangements, and review the fund's performance. Except for Michael E. Wiley, each of the Trustees oversees 283 funds. Mr. Wiley oversees 193 funds.
The Trustees hold office without limit in time except that (a) any Trustee may resign; (b) any Trustee may be removed by written instrument, signed by at least two-thirds of the number of Trustees prior to such removal; (c) any Trustee who requests to be retired or who has become incapacitated by illness or injury may be retired by written instrument signed by a majority of the other Trustees; and (d) any Trustee may be removed at any special meeting of shareholders by a two-thirds vote of the outstanding voting securities of the trust. Each Trustee who is not an interested person (as defined in the 1940 Act) of the trust and the fund is referred to herein as an Independent Trustee. Each Independent Trustee shall retire not later than the last day of the calendar year in which his or her 75th birthday occurs. The Independent Trustees may waive this mandatory retirement age policy with respect to individual Trustees. Officers and Advisory Board Members hold office without limit in time, except that any officer or Advisory Board Member may resign or may be removed by a vote of a majority of the Trustees at any regular meeting or any special meeting of the Trustees. Except as indicated, each individual has held the office shown or other offices in the same company for the past five years.
The fund’s Statement of Additional Information (SAI) includes more information about the Trustees. To request a free copy, call Fidelity at 1-877-208-0098.
Experience, Skills, Attributes, and Qualifications of the Trustees. The Governance and Nominating Committee has adopted a statement of policy that describes the experience, qualifications, attributes, and skills that are necessary and desirable for potential Independent Trustee candidates (Statement of Policy). The Board believes that each Trustee satisfied at the time he or she was initially elected or appointed a Trustee, and continues to satisfy, the standards contemplated by the Statement of Policy. The Governance and Nominating Committee also engages professional search firms to help identify potential Independent Trustee candidates who have the experience, qualifications, attributes, and skills consistent with the Statement of Policy. From time to time, additional criteria based on the composition and skills of the current Independent Trustees, as well as experience or skills that may be appropriate in light of future changes to board composition, business conditions, and regulatory or other developments, have also been considered by the professional search firms and the Governance and Nominating Committee. In addition, the Board takes into account the Trustees' commitment and participation in Board and committee meetings, as well as their leadership of standing and ad hoc committees throughout their tenure.
In determining that a particular Trustee was and continues to be qualified to serve as a Trustee, the Board has considered a variety of criteria, none of which, in isolation, was controlling. The Board believes that, collectively, the Trustees have balanced and diverse experience, qualifications, attributes, and skills, which allow the Board to operate effectively in governing the fund and protecting the interests of shareholders. Information about the specific experience, skills, attributes, and qualifications of each Trustee, which in each case led to the Board's conclusion that the Trustee should serve (or continue to serve) as a trustee of the fund, is provided below.
Board Structure and Oversight Function. James C. Curvey is an interested person and currently serves as Chairman. The Trustees have determined that an interested Chairman is appropriate and benefits shareholders because an interested Chairman has a personal and professional stake in the quality and continuity of services provided to the fund. Independent Trustees exercise their informed business judgment to appoint an individual of their choosing to serve as Chairman, regardless of whether the Trustee happens to be independent or a member of management. The Independent Trustees have determined that they can act independently and effectively without having an Independent Trustee serve as Chairman and that a key structural component for assuring that they are in a position to do so is for the Independent Trustees to constitute a substantial majority for the Board. The Independent Trustees also regularly meet in executive session. Ned C. Lautenbach serves as Chairman of the Independent Trustees and as such (i) acts as a liaison between the Independent Trustees and management with respect to matters important to the Independent Trustees and (ii) with management prepares agendas for Board meetings.
Fidelity® funds are overseen by different Boards of Trustees. The fund's Board oversees Fidelity's high income and certain equity funds, and other Boards oversee Fidelity's investment-grade bond, money market, asset allocation, and other equity funds. The asset allocation funds may invest in Fidelity® funds overseen by the fund's Board. The use of separate Boards, each with its own committee structure, allows the Trustees of each group of Fidelity® funds to focus on the unique issues of the funds they oversee, including common research, investment, and operational issues. On occasion, the separate Boards establish joint committees to address issues of overlapping consequences for the Fidelity® funds overseen by each Board.
The Trustees operate using a system of committees to facilitate the timely and efficient consideration of all matters of importance to the Trustees, the fund, and fund shareholders and to facilitate compliance with legal and regulatory requirements and oversight of the fund's activities and associated risks. The Board, acting through its committees, has charged FMR and its affiliates with (i) identifying events or circumstances the occurrence of which could have demonstrably adverse effects on the fund's business and/or reputation; (ii) implementing processes and controls to lessen the possibility that such events or circumstances occur or to mitigate the effects of such events or circumstances if they do occur; and (iii) creating and maintaining a system designed to evaluate continuously business and market conditions in order to facilitate the identification and implementation processes described in (i) and (ii) above. Because the day-to-day operations and activities of the fund are carried out by or through FMR, its affiliates, and other service providers, the fund's exposure to risks is mitigated but not eliminated by the processes overseen by the Trustees. While each of the Board's committees has responsibility for overseeing different aspects of the fund's activities, oversight is exercised primarily through the Operations, Audit, and Compliance Committees. In addition, the Independent Trustees have worked with Fidelity to enhance the Board's oversight of investment and financial risks, legal and regulatory risks, technology risks, and operational risks, including the development of additional risk reporting to the Board. Appropriate personnel, including but not limited to the fund's Chief Compliance Officer (CCO), FMR's internal auditor, the independent accountants, the fund's Treasurer and portfolio management personnel, make periodic reports to the Board's committees, as appropriate, including an annual review of Fidelity's risk management program for the Fidelity® funds. The responsibilities of each standing committee, including their oversight responsibilities, are described further under "Standing Committees of the Trustees."
Interested Trustees*:
Correspondence intended for a Trustee who is an interested person may be sent to Fidelity Investments, 245 Summer Street, Boston, Massachusetts 02210.
Name, Year of Birth; Principal Occupations and Other Relevant Experience+
James C. Curvey (1935)
Year of Election or Appointment: 2007
Trustee
Chairman of the Board of Trustees
Mr. Curvey also serves as Trustee of other Fidelity® funds. Mr. Curvey is Vice Chairman (2007-present) and Director of FMR LLC (diversified financial services company). In addition, Mr. Curvey is an Overseer Emeritus for the Boston Symphony Orchestra, a Director of Artis-Naples, and a Trustee of Brewster Academy in Wolfeboro, New Hampshire. Previously, Mr. Curvey served as a Director of Fidelity Research & Analysis Co. (investment adviser firm, 2009-2018), Director of Fidelity Investments Money Management, Inc. (investment adviser firm, 2009-2014) and a Director of FMR and FMR Co., Inc. (investment adviser firms, 2007-2014).
Charles S. Morrison (1960)
Year of Election or Appointment: 2014
Trustee
Mr. Morrison also serves as Trustee of other funds. He serves as President of Fidelity SelectCo, LLC (investment adviser firm, 2017-present) and Fidelity Management & Research Company (FMR) (investment adviser firm, 2016-present), a Director of Fidelity Investments Money Management, Inc. (FIMM) (investment adviser firm, 2014-present), Director of Fidelity SelectCo, LLC (investment adviser firm, 2014-present), President, Asset Management (2014-present), and is an employee of Fidelity Investments. Previously, Mr. Morrison served as Vice President of Fidelity's Fixed Income and Asset Allocation Funds (2012-2014), President, Fixed Income (2011-2014), Vice President of Fidelity's Money Market Funds (2005-2009), President, Money Market Group Leader of FMR (investment adviser firm, 2009), and Senior Vice President, Money Market Group of FMR (2004-2009). Mr. Morrison also served as Vice President of Fidelity's Bond Funds (2002-2005), certain Balanced Funds (2002-2005), and certain Asset Allocation Funds (2002-2007), and as Senior Vice President (2002-2005) of Fidelity's Bond Division.
* Determined to be an “Interested Trustee” by virtue of, among other things, his or her affiliation with the trust or various entities under common control with FMR.
+ The information includes the Trustee's principal occupation during the last five years and other information relating to the experience, attributes, and skills relevant to the Trustee's qualifications to serve as a Trustee, which led to the conclusion that the Trustee should serve as a Trustee for the fund.
Independent Trustees:
Correspondence intended for an Independent Trustee may be sent to Fidelity Investments, P.O. Box 55235, Boston, Massachusetts 02205-5235.
Name, Year of Birth; Principal Occupations and Other Relevant Experience+
Dennis J. Dirks (1948)
Year of Election or Appointment: 2005
Trustee
Mr. Dirks also serves as Trustee of other Fidelity® funds. Prior to his retirement in May 2003, Mr. Dirks was Chief Operating Officer and a member of the Board of The Depository Trust & Clearing Corporation (DTCC). He also served as President, Chief Operating Officer, and Board member of The Depository Trust Company (DTC) and President and Board member of the National Securities Clearing Corporation (NSCC). In addition, Mr. Dirks served as Chief Executive Officer and Board member of the Government Securities Clearing Corporation, Chief Executive Officer and Board member of the Mortgage-Backed Securities Clearing Corporation, as a Trustee and a member of the Finance Committee of Manhattan College (2005-2008), as a Trustee and a member of the Finance Committee of AHRC of Nassau County (2006-2008), as a member of the Independent Directors Council (IDC) Governing Council (2010-2015), and as a member of the Board of Directors for The Brookville Center for Children’s Services, Inc. (2009-2017). Mr. Dirks is a member of the Finance Committee (2016-present), Board of Directors (2017-present) and Board of Trustees (2018-present) and is Treasurer (2018-present) of the Asolo Repertory Theatre.
Donald F. Donahue (1950)
Year of Election or Appointment: 2018
Trustee
Mr. Donahue also serves as a Trustee of other Fidelity® funds. Mr. Donahue is President and Chief Executive Officer of Miranda Partners, LLC (risk consulting for the financial services industry, 2012-present). Previously, Mr. Donahue served as a Member of the Advisory Board of certain Fidelity® funds (2015-2018) and Chief Executive Officer (2006-2012), Chief Operating Officer (2003-2006), and Managing Director, Customer Marketing and Development (1999-2003) of The Depository Trust & Clearing Corporation (financial markets infrastructure). Mr. Donahue serves as a Member (2007-present) and Co-Chairman (2016-present) of the Board of Directors of United Way of New York, Member of the Board of Directors of NYC Leadership Academy (2012-present) and Member of the Board of Advisors of Ripple Labs, Inc. (financial services, 2015-present). He also served as Chairman (2010-2012) and Member of the Board of Directors (2012-2013) of Omgeo, LLC (financial services), Treasurer of United Way of New York (2012-2016), and Member of the Board of Directors of XBRL US (financial services non-profit, 2009-2012) and the International Securities Services Association (2009-2012).
Alan J. Lacy (1953)
Year of Election or Appointment: 2008
Trustee
Mr. Lacy also serves as Trustee of other Fidelity® funds. Mr. Lacy serves as a Director of Bristol-Myers Squibb Company (global pharmaceuticals, 2008-present). He is a Trustee of the California Chapter of The Nature Conservancy (2015-present) and a Director of the Center for Advanced Study in the Behavioral Sciences at Stanford University (2015-present). In addition, Mr. Lacy served as Senior Adviser (2007-2014) of Oak Hill Capital Partners, L.P. (private equity) and also served as Chief Executive Officer (2005) and Vice Chairman (2005-2006) of Sears Holdings Corporation (retail) and Chief Executive Officer and Chairman of the Board of Sears, Roebuck and Co. (retail, 2000-2005). Previously, Mr. Lacy served as Chairman (2014-2017) and a member (2010-2017) of the Board of Directors of Dave & Buster’s Entertainment, Inc. (restaurant and entertainment complexes), as Chairman (2008-2011) and a member (2006-2015) of the Board of Trustees of the National Parks Conservation Association, and as a member of the Board of Directors for The Hillman Companies, Inc. (hardware wholesalers, 2010-2014), Earth Fare, Inc. (retail grocery, 2010-2014), and The Western Union Company (global money transfer, 2006-2011).
Ned C. Lautenbach (1944)
Year of Election or Appointment: 2000
Trustee
Chairman of the Independent Trustees
Mr. Lautenbach also serves as Trustee of other Fidelity® funds. Mr. Lautenbach currently serves as Vice Chair of the Board of Governors, State University System of Florida (2013-present) and is a member of the Council on Foreign Relations (1994-present). He is also a member and has most recently served as Chairman of the Board of Directors of Artis-Naples (2012-present). Previously, Mr. Lautenbach served as a member and then Lead Director of the Board of Directors of Eaton Corporation (diversified industrial, 1997-2016). He was also a Partner and Advisory Partner at Clayton, Dubilier & Rice, LLC (private equity investment, 1998-2010), as well as a Director of Sony Corporation (2006-2007). In addition, Mr. Lautenbach also had a 30-year career with IBM (technology company) during which time he served as Senior Vice President and a member of the Corporate Executive Committee (1968-1998).
Joseph Mauriello (1944)
Year of Election or Appointment: 2008
Trustee
Mr. Mauriello also serves as Trustee of other Fidelity® funds. Prior to his retirement in January 2006, Mr. Mauriello served in numerous senior management positions including Deputy Chairman and Chief Operating Officer (2004-2005), and Vice Chairman of Financial Services (2002-2004) of KPMG LLP US (professional services, 1965-2005). Mr. Mauriello currently serves as a member of the Independent Directors Council (IDC) Governing Council (2015-present). Previously, Mr. Mauriello served as a member of the Board of Directors of XL Group plc. (global insurance and re-insurance, 2006-2018).
Cornelia M. Small (1944)
Year of Election or Appointment: 2005
Trustee
Ms. Small also serves as Trustee of other Fidelity® funds. Ms. Small is a member of the Board of Directors (2009-present) and Chair of the Investment Committee (2010-present) of the Teagle Foundation. Ms. Small also serves on the Investment Committee of the Berkshire Taconic Community Foundation (2008-present). Previously, Ms. Small served as Chairperson (2002-2008) and a member of the Investment Committee and Chairperson (2008-2012) and a member of the Board of Trustees of Smith College. In addition, Ms. Small served as Chief Investment Officer, Director of Global Equity Investments, and a member of the Board of Directors of Scudder, Stevens & Clark and Scudder Kemper Investments.
Garnett A. Smith (1947)
Year of Election or Appointment: 2018
Trustee
Mr. Smith also serves as Trustee of other Fidelity® funds. Prior to Mr. Smith's retirement, he served as Chairman and Chief Executive Officer of Inbrand Corp. (manufacturer of personal absorbent products, 1990-1997). He also served as President (1986-1990) of Inbrand Corp. Prior to his employment with Inbrand Corp., he was employed by a retail fabric chain and North Carolina National Bank. In addition, Mr. Smith served as a Member of the Advisory Board of certain Fidelity® funds (2012-2013) and as a board member of the Jackson Hole Land Trust (2009-2012).
David M. Thomas (1949)
Year of Election or Appointment: 2008
Trustee
Mr. Thomas also serves as Trustee of other Fidelity® funds. Mr. Thomas serves as Non-Executive Chairman of the Board of Directors of Fortune Brands Home and Security (home and security products, 2011-present), as a member of the Board of Directors (2004-present) and Presiding Director (2013-present) of Interpublic Group of Companies, Inc. (marketing communication), and as a member of the Board of Trustees of the University of Florida (2013-present). Previously, Mr. Thomas served as Executive Chairman (2005-2006) and Chairman and Chief Executive Officer (2000-2005) of IMS Health, Inc. (pharmaceutical and healthcare information solutions), and a Director of Fortune Brands, Inc. (consumer products, 2000-2011).
Michael E. Wiley (1950)
Year of Election or Appointment: 2018
Trustee
Mr. Wiley also serves as Trustee or Member of the Advisory Board of other Fidelity® funds. Mr. Wiley serves as a Director of High Point Resources (exploration and production, 2005-present). Previously, Mr. Wiley served as a Director of Andeavor Corporation (independent oil refiner and marketer, 2005-2018), a Director of Andeavor Logistics LP (natural resources logistics, 2015-2018), a Director of Post Oak Bank (privately-held bank, 2004-2018), a Director of Asia Pacific Exploration Consolidated (international oil and gas exploration and production, 2008-2013), a member of the Board of Trustees of the University of Tulsa (2000-2006; 2007-2010), a Senior Energy Advisor of Katzenbach Partners, LLC (consulting, 2006-2007), an Advisory Director of Riverstone Holdings (private investment), a Director of Spinnaker Exploration Company (exploration and production, 2001-2005) and Chairman, President, and CEO of Baker Hughes, Inc. (oilfield services, 2000-2004).
+ The information includes the Trustee's principal occupation during the last five years and other information relating to the experience, attributes, and skills relevant to the Trustee's qualifications to serve as a Trustee, which led to the conclusion that the Trustee should serve as a Trustee for the fund.
Advisory Board Members and Officers:
Correspondence intended for a Member of the Advisory Board (if any) may be sent to Fidelity Investments, P.O. Box 55235, Boston, Massachusetts 02205-5235. Correspondence intended for an officer or Peter S. Lynch may be sent to Fidelity Investments, 245 Summer Street, Boston, Massachusetts 02210. Officers appear below in alphabetical order.
Name, Year of Birth; Principal Occupation
Vicki L. Fuller (1957)
Year of Election or Appointment: 2018
Member of the Advisory Board
Ms. Fuller also serves as Member of the Advisory Board of other Fidelity® funds. Ms. Fuller serves as a member of the Board of Directors, Audit Committee, and Nominating and Governance Committee of The Williams Companies, Inc. (natural gas infrastructure, 2018-present). Previously, Ms. Fuller served as the Chief Investment Officer of the New York State Common Retirement Fund (2012-2018) and held a variety of positions at AllianceBernstein L.P. (global asset management, 1985-2012), including Managing Director (2006-2012) and Senior Vice President and Senior Portfolio Manager (2001-2006).
Peter S. Lynch (1944)
Year of Election or Appointment: 2003
Member of the Advisory Board
Mr. Lynch also serves as Member of the Advisory Board of other Fidelity® funds. Mr. Lynch is Vice Chairman and a Director of FMR (investment adviser firm) and FMR Co., Inc. (investment adviser firm). In addition, Mr. Lynch serves as a Trustee of Boston College and as the Chairman of the Inner-City Scholarship Fund. Previously, Mr. Lynch served on the Special Olympics International Board of Directors (1997-2006).
William S. Stavropoulos (1939)
Year of Election or Appointment: 2018
Member of the Advisory Board
Mr. Stavropoulos also serves as Member of the Advisory Board of other Fidelity® funds. Mr. Stavropoulos serves as President and Founder of the Michigan Baseball Foundation, the Great Lakes Loons (2007-present). Mr. Stavropoulos is Chairman Emeritus of the Board of Directors of The Dow Chemical Company, where he previously served in numerous senior management positions, including President, CEO (1995-2000; 2002-2004), Chairman of the Executive Committee (2000-2006), and as a member of the Board of Directors (1990-2006). Currently, Mr. Stavropoulos is Chairman of the Board of Directors of Univar Inc. (global distributor of commodity and specialty chemicals), a Director of Teradata Corporation (data warehousing and technology solutions), and a member of the Advisory Board for Metalmark Capital LLC (private equity investment, 2005-present). Mr. Stavropoulos is an operating advisor to Clayton, Dubilier & Rice, LLC (private equity investment). In addition, Mr. Stavropoulos is a member of the University of Notre Dame Advisory Council for the College of Science, a Trustee of the Rollin L. Gerstacker Foundation, and a Director of Artis-Naples in Naples, Florida. Previously, Mr. Stavropoulos served as Trustee of certain Fidelity® funds (2001-2018) and as a Director of Chemical Financial Corporation (bank holding company, 1993-2012) and Tyco International, Ltd. (multinational manufacturing and services, 2007-2012).
Carol B. Tomé (1957)
Year of Election or Appointment: 2018
Member of the Advisory Board
Ms. Tomé also serves as Member of the Advisory Board of other Fidelity® funds. Ms. Tomé is Chief Financial Officer (2001-present) and Executive Vice President of Corporate Services (2007-present) of The Home Depot, Inc. (home improvement retailer) and a Director (2003-present) and Chair of the Audit Committee (2004-present) of United Parcel Service, Inc. (package delivery and supply chain management). Previously, Ms. Tomé served as Trustee of certain Fidelity® funds (2017), Senior Vice President of Finance and Accounting/Treasurer (2000-2007) and Vice President and Treasurer (1995-2000) of The Home Depot, Inc. and Chair of the Board (2010-2012), Vice Chair of the Board (2009 and 2013), and a Director (2008-2013) of the Federal Reserve Bank of Atlanta. Ms. Tomé is also a director or trustee of many community and professional organizations.
Elizabeth Paige Baumann (1968)
Year of Election or Appointment: 2017
Anti-Money Laundering (AML) Officer
Ms. Baumann also serves as AML Officer of other funds. She is Chief AML Officer (2012-present) and Senior Vice President (2014-present) of FMR LLC (diversified financial services company) and is an employee of Fidelity Investments. Previously, Ms. Baumann served as AML Officer of the funds (2012-2016), and Vice President (2007-2014) and Deputy Anti-Money Laundering Officer (2007-2012) of FMR LLC.
John J. Burke III (1964)
Year of Election or Appointment: 2018
Chief Financial Officer
Mr. Burke also serves as Chief Financial Officer of other funds. Mr. Burke serves as Head of Investment Operations for Fidelity Fund and Investment Operations (2018-present) and is an employee of Fidelity Investments (1998-present). Previously Mr. Burke served as head of Asset Management Investment Operations (2012-2018).
William C. Coffey (1969)
Year of Election or Appointment: 2018
Secretary and Chief Legal Officer (CLO)
Mr. Coffey also serves as Secretary and CLO of other funds. Mr. Coffey serves as CLO, Secretary, and Senior Vice President of Fidelity Management & Research Company and FMR Co., Inc. (investment adviser firms, 2018-present); Secretary of Fidelity SelectCo, LLC and Fidelity Investments Money Management, Inc. (investment adviser firms, 2018-present); and CLO of Fidelity Management & Research (Hong Kong) Limited, FMR Investment Management (UK) Limited, and Fidelity Management & Research (Japan) Limited (investment adviser firms, 2018-present). He is Senior Vice President and Deputy General Counsel of FMR LLC (diversified financial services company, 2010-present), and is an employee of Fidelity Investments. Previously, Mr. Coffey served as Assistant Secretary of certain funds (2009-2018) and as Vice President and Associate General Counsel of FMR LLC (2005-2009).
Timothy M. Cohen (1969)
Year of Election or Appointment: 2018
Vice President
Mr. Cohen also serves as Vice President of other funds. Mr. Cohen serves as Co-Head of Global Equity Research (2016-present), a Director of Fidelity Management & Research (Japan) Limited (investment adviser firm, 2016-present), and is an employee of Fidelity Investments. Previously, Mr. Cohen served as Chief Investment Officer - Equity and a Director of Fidelity Management & Research (U.K.) Inc. (investment adviser firm, 2013-2015) and as a Director of Fidelity Management & Research (Hong Kong) Limited (investment adviser firm, 2017).
Jonathan Davis (1968)
Year of Election or Appointment: 2010
Assistant Treasurer
Mr. Davis also serves as Assistant Treasurer of other funds. Mr. Davis serves as Assistant Treasurer of FMR Capital, Inc. (2017-present) and is an employee of Fidelity Investments. Previously, Mr. Davis served as Vice President and Associate General Counsel of FMR LLC (diversified financial services company, 2003-2010).
Adrien E. Deberghes (1967)
Year of Election or Appointment: 2016
Assistant Treasurer
Mr. Deberghes also serves as an officer of other funds. He serves as Assistant Treasurer of FMR Capital, Inc. (2017-present), Executive Vice President of Fidelity Investments Money Management, Inc. (FIMM) (investment adviser firm, 2016-present), and is an employee of Fidelity Investments (2008-present). Previously, Mr. Deberghes served as President and Treasurer of certain Fidelity® funds (2013-2018). Prior to joining Fidelity Investments, Mr. Deberghes was Senior Vice President of Mutual Fund Administration at State Street Corporation (2007-2008), Senior Director of Mutual Fund Administration at Investors Bank & Trust (2005-2007), and Director of Finance for Dunkin' Brands (2000-2005). Previously, Mr. Deberghes served in other fund officer roles.
Laura M. Del Prato (1964)
Year of Election or Appointment: 2018
Assistant Treasurer
Ms. Del Prato also serves as an officer of other funds. Ms. Del Prato is an employee of Fidelity Investments (2017-present). Prior to joining Fidelity Investments, Ms. Del Prato served as a Managing Director and Treasurer of the JPMorgan Mutual Funds (2014-2017). Prior to JPMorgan, Ms. Del Prato served as a partner at Cohen Fund Audit Services (accounting firm, 2012-2013) and KPMG LLP (accounting firm, 2004-2012).
Colm A. Hogan (1973)
Year of Election or Appointment: 2016
Deputy Treasurer
Mr. Hogan also serves as an officer of other funds. Mr. Hogan serves as Assistant Treasurer of FMR Capital, Inc. (2017-present) and is an employee of Fidelity Investments (2005-present). Previously, Mr. Hogan served as Assistant Treasurer of certain Fidelity® funds (2016-2018).
Pamela R. Holding (1964)
Year of Election or Appointment: 2018
Vice President
Ms. Holding also serves as Vice President of other funds. Ms. Holding serves as Co-Head of Global Equity Research (2018-present) and is an employee of Fidelity Investments (2013-present).
Chris Maher (1972)
Year of Election or Appointment: 2013
Assistant Treasurer
Mr. Maher serves as Assistant Treasurer of other funds. Mr. Maher is Vice President of Valuation Oversight, serves as Assistant Treasurer of FMR Capital, Inc. (2017-present), and is an employee of Fidelity Investments. Previously, Mr. Maher served as Vice President of Asset Management Compliance (2013), Vice President of the Program Management Group of FMR (investment adviser firm, 2010-2013), and Vice President of Valuation Oversight (2008-2010).
Rieco E. Mello (1969)
Year of Election or Appointment: 2017
Assistant Treasurer
Mr. Mello also serves as Assistant Treasurer of other funds. Mr. Mello serves as Assistant Treasurer of FMR Capital, Inc. (2017-present) and is an employee of Fidelity Investments (1995-present).
Kenneth B. Robins (1969)
Year of Election or Appointment: 2016
Chief Compliance Officer
Mr. Robins also serves as an officer of other funds. Mr. Robins serves as Compliance Officer of Fidelity Management & Research Company and FMR Co., Inc. (investment adviser firms, 2016-present) and is an employee of Fidelity Investments (2004-present). Previously, Mr. Robins served as Executive Vice President of Fidelity Investments Money Management, Inc. (investment adviser firm, 2013-2016) and served in other fund officer roles.
Stacie M. Smith (1974)
Year of Election or Appointment: 2016
President and Treasurer
Ms. Smith also serves as an officer of other funds. Ms. Smith serves as Assistant Treasurer of FMR Capital, Inc. (2017-present), is an employee of Fidelity Investments (2009-present), and has served in other fund officer roles. Prior to joining Fidelity Investments, Ms. Smith served as Senior Audit Manager of Ernst & Young LLP (accounting firm, 1996-2009). Previously, Ms. Smith served as Assistant Treasurer (2013-2018) and Deputy Treasurer (2013-2016) of certain Fidelity® funds.
Marc L. Spector (1972)
Year of Election or Appointment: 2016
Assistant Treasurer
Mr. Spector also serves as an officer of other funds. Mr. Spector serves as Assistant Treasurer of FMR Capital, Inc. (2017-present) and is an employee of Fidelity Investments (2016-present). Prior to joining Fidelity Investments, Mr. Spector served as Director at the Siegfried Group (accounting firm, 2013-2016), and prior to Siegfried Group as audit senior manager at Deloitte & Touche (accounting firm, 2005-2013).
Shareholder Expense Example
As a shareholder of the Fund, you incur two types of costs: (1) transaction costs, including sales charges (loads) on purchase payments or redemption proceeds, and (2) ongoing costs, including management fees, distribution and/or service (12b-1) fees and other Fund expenses. This Example is intended to help you understand your ongoing costs (in dollars) of investing in the Fund and to compare these costs with the ongoing costs of investing in other mutual funds.
The actual expense Example is based on an investment of $1,000 invested at the beginning of the period and held for the entire period (May 1, 2018 to October 31, 2018) for Class A, Class M, Class C and Class I and for the period (October 2, 2018 to October 31, 2018) for Class Z. The hypothetical expense Example is based on an investment of $1,000 invested for the one-half year period (May 1, 2018 to October 31, 2018).
Actual Expenses
The first line of the accompanying table for each class of the Fund provides information about actual account values and actual expenses. You may use the information in this line, together with the amount you invested, to estimate the expenses that you paid over the period. Simply divide your account value by $1,000.00 (for example, an $8,600 account value divided by $1,000.00 = 8.6), then multiply the result by the number in the first line for a class of the Fund under the heading entitled "Expenses Paid During Period" to estimate the expenses you paid on your account during this period. In addition, the Fund, as a shareholder in the underlying Fidelity Central Funds, will indirectly bear its pro-rata share of the fees and expenses incurred by the underlying Fidelity Central Funds. These fees and expenses are not included in the Fund's annualized expense ratio used to calculate the expense estimate in the table below.
Hypothetical Example for Comparison Purposes
The second line of the accompanying table for each class of the Fund provides information about hypothetical account values and hypothetical expenses based on a Class' actual expense ratio and an assumed rate of return of 5% per year before expenses, which is not the Class' actual return. The hypothetical account values and expenses may not be used to estimate the actual ending account balance or expenses you paid for the period. You may use this information to compare the ongoing costs of investing in the Fund and other funds. To do so, compare this 5% hypothetical example with the 5% hypothetical examples that appear in the shareholder reports of the other funds. In addition, the Fund, as a shareholder in the underlying Fidelity Central Funds, will indirectly bear its pro-rata share of the fees and expenses incurred by the underlying Fidelity Central Funds. These fees and expenses are not included in the Fund's annualized expense ratio used to calculate the expense estimate in the table below.
Please note that the expenses shown in the table are meant to highlight your ongoing costs only and do not reflect any transaction costs. Therefore, the second line of the table is useful in comparing ongoing costs only, and will not help you determine the relative total costs of owning different funds. In addition, if these transactional costs were included, your costs would have been higher.
| Annualized Expense Ratio-A | Beginning Account Value | Ending Account Value October 31, 2018 | Expenses Paid During Period | |
| Class A | 1.02% | |||
| Actual | $1,000.00 | $1,004.50 | $5.15-B | |
| Hypothetical-C | $1,000.00 | $1,020.06 | $5.19-D | |
| Class M | 1.03% | |||
| Actual | $1,000.00 | $1,004.30 | $5.20-B | |
| Hypothetical-C | $1,000.00 | $1,020.01 | $5.24-D | |
| Class C | 1.78% | |||
| Actual | $1,000.00 | $1,000.60 | $8.98-B | |
| Hypothetical-C | $1,000.00 | $1,016.23 | $9.05-D | |
| Class I | .80% | |||
| Actual | $1,000.00 | $1,005.60 | $4.04-B | |
| Hypothetical-C | $1,000.00 | $1,021.17 | $4.08-D | |
| Class Z | .67% | |||
| Actual | $1,000.00 | $979.60 | $.55-B | |
| Hypothetical-C | $1,000.00 | $1,021.83 | $3.41-D |
A Annualized expense ratio reflects expenses net of applicable fee waivers.
B Actual expenses are equal to each Class' annualized expense ratio, multiplied by the average account value over the period, multiplied by 184/365 (to reflect the one-half year period) for Class A, Class M, Class C and Class I and multiplied by 30/365 (to reflect the period October 2, 2018 to October 31, 2018) for Class Z.
C 5% return per year before expenses
D Hypothetical expenses are equal to each Class' annualized expense ratio, multiplied by the average account value over the period, multiplied by 184/365 (to reflect the one-half year period).
Distributions (Unaudited)
A total of 0.23% of the dividends distributed during the fiscal year was derived from interest on U.S. Government securities which is generally exempt from state income tax.
The fund designates $22,397,731 of distributions paid during the period January 1, 2018 to October 31, 2018 as qualifying to be taxed as interest-related dividends for nonresident alien shareholders.
The fund will notify shareholders in January 2019 of amounts for use in preparing 2018 income tax returns.
Board Approval of Investment Advisory Contracts
Fidelity Advisor High Income Fund
At its July 2018 meeting, the Board of Trustees, including the Independent Trustees (together, the Board), voted to continue the management contract with Fidelity Management & Research Company (FMR) and the sub-advisory agreements (together, the Advisory Contracts) for the fund for six months through January 31, 2019, in connection with the reunification of the Fidelity Equity High Income Funds Board, which oversees the fund, and the Sector Portfolios Board.
The Board considered that the approval of the fund's Advisory Contracts will not result in any changes in (i) the investment process or strategies employed in the management of the fund's assets; (ii) the fees and expenses paid by shareholders; (iii) the nature, extent or quality of services provided under the fund's Advisory Contracts; or (iv) the day-to-day management of the fund or the persons primarily responsible for such management. The Board concluded that the fund's Advisory Contracts are fair and reasonable, and that the fund's Advisory Contracts should be renewed, without modification, through January 31, 2019, with the understanding that the Board will consider the annual renewal for a full one year period in January 2019.
In connection with its consideration of future renewals of the fund's Advisory Contracts, the Board will consider: (i) the nature, extent and quality of services provided to the fund, including shareholder and administrative services and investment performance; (ii) the competitiveness of the management fee and total expenses for the fund; (iii) the costs of the services and profitability, including the revenues earned and the expenses incurred in conducting the business of developing, marketing, distributing, managing, administering, and servicing the fund and its shareholders, to the extent applicable, as well as potential fall-out benefits from Fidelity's non-fund businesses; and (iv) whether there have been economies of scale in respect of the Fidelity funds, whether the Fidelity funds (including the fund) have appropriately benefited from any such economies of scale, and whether there is the potential for realization of any further economies.
Based on its evaluation of all of the conclusions noted above, and after considering all factors it believed relevant, the Board ultimately concluded that the fund's management fee structure is fair and reasonable, and that the continuation of the fund's Advisory Contracts should be approved.
![]()
AHI-ANN-1218
1.728715.121
Fidelity Advisor® Value Fund Class A, Class M, Class C, Class I and Class Z Annual Report October 31, 2018 |
|
Contents
To view a fund's proxy voting guidelines and proxy voting record for the 12-month period ended June 30, visit http://www.fidelity.com/proxyvotingresults or visit the Securities and Exchange Commission's (SEC) web site at http://www.sec.gov.
You may also call 1-877-208-0098 to request a free copy of the proxy voting guidelines.
Standard & Poor's, S&P and S&P 500 are registered service marks of The McGraw-Hill Companies, Inc. and have been licensed for use by Fidelity Distributors Corporation.
Other third-party marks appearing herein are the property of their respective owners.
All other marks appearing herein are registered or unregistered trademarks or service marks of FMR LLC or an affiliated company. © 2018 FMR LLC. All rights reserved.
This report and the financial statements contained herein are submitted for the general information of the shareholders of the Fund. This report is not authorized for distribution to prospective investors in the Fund unless preceded or accompanied by an effective prospectus.
A fund files its complete schedule of portfolio holdings with the SEC for the first and third quarters of each fiscal year on Form N-Q. Forms N-Q are available on the SEC’s web site at http://www.sec.gov. A fund's Forms N-Q may be reviewed and copied at the SEC’s Public Reference Room in Washington, DC. Information regarding the operation of the SEC's Public Reference Room may be obtained by calling 1-800-SEC-0330.
For a complete list of a fund's portfolio holdings, view the most recent holdings listing, semiannual report, or annual report on Fidelity's web site at http://www.fidelity.com, http://www.institutional.fidelity.com, or http://www.401k.com, as applicable.
NOT FDIC INSURED •MAY LOSE VALUE •NO BANK GUARANTEE
Neither the Fund nor Fidelity Distributors Corporation is a bank.
Performance: The Bottom Line
Average annual total return reflects the change in the value of an investment, assuming reinvestment of distributions from dividend income and capital gains (the profits earned upon the sale of securities that have grown in value, if any) and assuming a constant rate of performance each year. The hypothetical investment and the average annual total returns do not reflect the deduction of taxes that a shareholder would pay on fund distributions or the redemption of fund shares. During periods of reimbursement by Fidelity, a fund’s total return will be greater than it would be had the reimbursement not occurred. How a fund did yesterday is no guarantee of how it will do tomorrow.
Average Annual Total Returns
| For the periods ended October 31, 2018 | Past 1 year | Past 5 years | Past 10 years |
| Class A (incl. 5.75% sales charge) | (10.21)% | 4.57% | 11.27% |
| Class M (incl. 3.50% sales charge) | (8.34)% | 4.78% | 11.24% |
| Class C (incl. contingent deferred sales charge) | (6.47)% | 4.98% | 11.08% |
| Class I | (4.48)% | 6.11% | 12.24% |
| Class Z | (4.36)% | 6.16% | 12.27% |
Class C shares' contingent deferred sales charges included in the past one year, past five years and past ten years total return figures are 1%, 0% and 0%, respectively.
The initial offering of Class Z shares took place on February 1, 2017. Returns prior to February 1, 2017, are those of Class I.
$10,000 Over 10 Years
Let's say hypothetically that $10,000 was invested in Fidelity Advisor® Value Fund - Class A on October 31, 2008, and the current 5.75% sales charge was paid.
The chart shows how the value of your investment would have changed, and also shows how the Russell Midcap® Value Index performed over the same period.
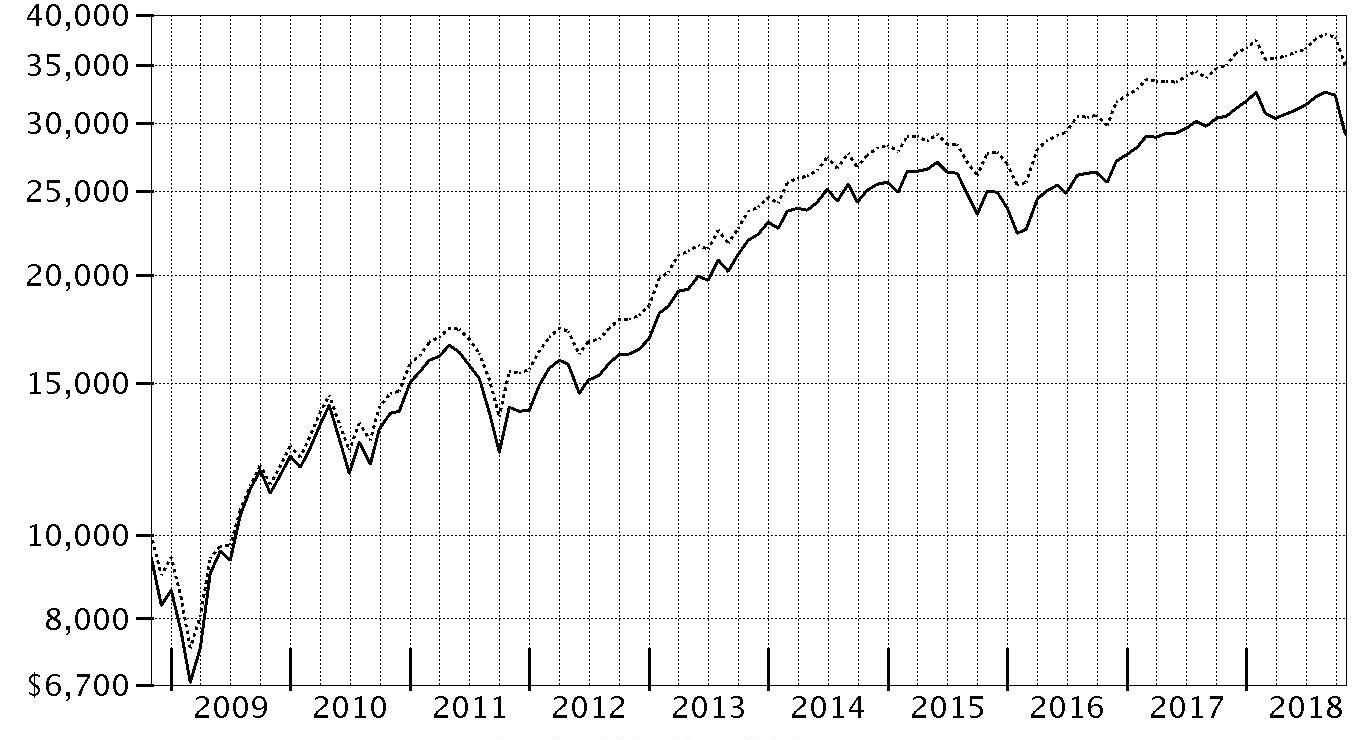
| Period Ending Values | ||
| $29,092 | Fidelity Advisor® Value Fund - Class A | |
| $35,010 | Russell Midcap® Value Index | |
Management's Discussion of Fund Performance
Market Recap: The S&P 500® index gained 7.35% for the 12 months ending October 31, 2018, as the U.S. equity bellwether declined sharply in October after climbing steadily beginning in May and achieving a record close in late September. Rising U.S. Treasury yields and concern about peaking corporate earnings growth sent investors fleeing from risk assets at a time when they were still dealing with lingering uncertainty related to global trade and the U.S. Federal Reserve picking up the pace of interest rate hikes. The index returned -6.84% in October alone, its largest monthly drop in roughly seven years. Growth stocks within the index were hardest hit for the month, but maintained a sizable advantage over their value counterparts for the full year, extending a trend that began in early 2017. By sector, a number of economically sensitive groups dropped to the bottom of the 12-month performance scale. Materials (-9%) and industrials (-1%) fared worst, followed by financials (+1%) and energy (+2%). In contrast, consumer discretionary was rattled in October but earlier strength resulted in an advance of about 17% for the full 12 months. Information technology, the largest sector in the index this period, followed a similar trend and also returned 17%. The defensive-oriented health care sector gained about 11%, while communication services, which includes dividend-rich telecommunications stocks, rose 6%. Real estate (+2%) and utilities (+1%) also lagged.Comments from Lead Portfolio Manager Matthew Friedman: For the year, the fund’s share classes (excluding sales charges, if applicable) returned about -5% to -6%, lagging the 0.16% result of its benchmark, the Russell Midcap® Value Index. Stock selection hurt the fund’s relative performance this period – particularly within the materials, communication services and energy sectors. Among individual stocks, Colony Capital (formerly Colony NorthStar) detracted more than any other single holding. Shares of this diversified real estate investment trust (REIT) returned about -49%, plunging in late February after the firm issued disappointing quarterly sales and earnings, and made a substantial cut to its dividend. Avoiding index component Twitter also detracted notably, as shares of the news and social networking platform rallied about 123% the past 12 months. Conversely, an out-of-benchmark stake in technology services provider Unisys added value, as did an underweighting, on average, in data storage solutions provider Western Digital. The fund did not own Western Digital at period end.The views expressed above reflect those of the portfolio manager(s) only through the end of the period as stated on the cover of this report and do not necessarily represent the views of Fidelity or any other person in the Fidelity organization. Any such views are subject to change at any time based upon market or other conditions and Fidelity disclaims any responsibility to update such views. These views may not be relied on as investment advice and, because investment decisions for a Fidelity fund are based on numerous factors, may not be relied on as an indication of trading intent on behalf of any Fidelity fund.
Notes to shareholders: On June 11, 2018, Matt Friedman assumed management responsibilities of the financials and real estate sleeves, succeeding Justin Bennett, who has moved into a new role. On March 31, 2018, Kathy Buck retired from portfolio management, leaving Lead Manager Matt Friedman, who co-managed the consumer sleeves with Kathy since December 1, 2017, sole manager of these sleeves.Investment Summary (Unaudited)
Top Ten Stocks as of October 31, 2018
| % of fund's net assets | |
| PPL Corp. | 1.1 |
| AECOM | 1.1 |
| Dollar Tree, Inc. | 1.1 |
| Sempra Energy | 1.0 |
| Cheniere Energy, Inc. | 1.0 |
| American Tower Corp. | 1.0 |
| Nielsen Holdings PLC | 1.0 |
| Vistra Energy Corp. | 1.0 |
| HD Supply Holdings, Inc. | 1.0 |
| Ameriprise Financial, Inc. | 0.9 |
| 10.2 |
Top Five Market Sectors as of October 31, 2018
| % of fund's net assets | |
| Financials | 13.9 |
| Industrials | 13.9 |
| Consumer Discretionary | 10.6 |
| Materials | 9.8 |
| Real Estate | 9.4 |
Asset Allocation (% of fund's net assets)
| As of October 31, 2018* | ||
| Stocks and Equity Futures | 99.3% | |
| Short-Term Investments and Net Other Assets (Liabilities) | 0.7% | |

* Foreign investments - 19.7%
Schedule of Investments October 31, 2018
Showing Percentage of Net Assets
| Common Stocks - 99.1% | |||
| Shares | Value | ||
| COMMUNICATION SERVICES - 4.2% | |||
| Entertainment - 0.4% | |||
| The Walt Disney Co. | 3,200 | $367,456 | |
| Media - 3.8% | |||
| Discovery Communications, Inc. Class A (a)(b) | 15,100 | 489,089 | |
| DISH Network Corp. Class A (a) | 14,348 | 441,058 | |
| Entercom Communications Corp. Class A | 45,374 | 294,477 | |
| GCI Liberty, Inc. (a) | 13,541 | 640,896 | |
| Grupo Televisa SA de CV (CPO) sponsored ADR | 11,274 | 162,120 | |
| Interpublic Group of Companies, Inc. | 17,232 | 399,093 | |
| Liberty Global PLC Class C (a) | 13,884 | 347,655 | |
| Nexstar Broadcasting Group, Inc. Class A | 6,900 | 516,741 | |
| 3,291,129 | |||
| TOTAL COMMUNICATION SERVICES | 3,658,585 | ||
| CONSUMER DISCRETIONARY - 10.6% | |||
| Auto Components - 0.5% | |||
| American Axle & Manufacturing Holdings, Inc. (a) | 20,828 | 315,961 | |
| BorgWarner, Inc. | 3,900 | 153,699 | |
| 469,660 | |||
| Distributors - 0.7% | |||
| LKQ Corp. (a) | 22,800 | 621,756 | |
| Diversified Consumer Services - 0.5% | |||
| Frontdoor, Inc. (a) | 153 | 5,210 | |
| Houghton Mifflin Harcourt Co. (a) | 54,876 | 367,669 | |
| ServiceMaster Global Holdings, Inc. (a) | 649 | 27,829 | |
| 400,708 | |||
| Hotels, Restaurants & Leisure - 2.2% | |||
| Eldorado Resorts, Inc. (a) | 15,758 | 575,167 | |
| Hilton Grand Vacations, Inc. (a) | 5,600 | 150,472 | |
| The Stars Group, Inc. (a) | 21,600 | 448,632 | |
| U.S. Foods Holding Corp. (a) | 26,645 | 777,235 | |
| 1,951,506 | |||
| Household Durables - 2.0% | |||
| D.R. Horton, Inc. | 19,311 | 694,424 | |
| Mohawk Industries, Inc. (a) | 4,015 | 500,791 | |
| Tempur Sealy International, Inc. (a)(b) | 12,100 | 559,141 | |
| 1,754,356 | |||
| Internet & Direct Marketing Retail - 1.2% | |||
| eBay, Inc. (a) | 15,400 | 447,062 | |
| Liberty Interactive Corp. QVC Group Series A (a) | 27,055 | 593,587 | |
| 1,040,649 | |||
| Leisure Products - 0.7% | |||
| Mattel, Inc. (a) | 35,117 | 476,889 | |
| Vista Outdoor, Inc. (a) | 13,533 | 169,163 | |
| 646,052 | |||
| Multiline Retail - 1.1% | |||
| Dollar Tree, Inc. (a) | 11,414 | 962,200 | |
| Specialty Retail - 1.7% | |||
| Lowe's Companies, Inc. | 5,140 | 489,431 | |
| Michaels Companies, Inc. (a)(b) | 27,800 | 440,630 | |
| Sally Beauty Holdings, Inc. (a) | 29,237 | 520,711 | |
| 1,450,772 | |||
| TOTAL CONSUMER DISCRETIONARY | 9,297,659 | ||
| CONSUMER STAPLES - 5.9% | |||
| Food Products - 4.2% | |||
| Bunge Ltd. | 2,900 | 179,220 | |
| Conagra Brands, Inc. | 14,300 | 509,080 | |
| Danone SA | 7,000 | 495,694 | |
| Darling International, Inc. (a) | 31,161 | 643,786 | |
| Greencore Group PLC | 141,100 | 341,230 | |
| Nomad Foods Ltd. (a) | 19,998 | 381,962 | |
| TreeHouse Foods, Inc. (a) | 7,972 | 363,204 | |
| Tyson Foods, Inc. Class A | 12,027 | 720,658 | |
| 3,634,834 | |||
| Household Products - 0.7% | |||
| Spectrum Brands Holdings, Inc. | 9,591 | 622,935 | |
| Personal Products - 0.4% | |||
| Coty, Inc. Class A | 35,963 | 379,410 | |
| Tobacco - 0.6% | |||
| British American Tobacco PLC (United Kingdom) | 12,161 | 527,183 | |
| TOTAL CONSUMER STAPLES | 5,164,362 | ||
| ENERGY - 8.9% | |||
| Energy Equipment & Services - 0.7% | |||
| Baker Hughes, a GE Co. Class A | 20,475 | 546,478 | |
| TechnipFMC PLC | 2,042 | 53,705 | |
| 600,183 | |||
| Oil, Gas & Consumable Fuels - 8.2% | |||
| Anadarko Petroleum Corp. | 12,200 | 649,040 | |
| Cabot Oil & Gas Corp. | 3,900 | 94,497 | |
| Cenovus Energy, Inc. (Canada) | 44,769 | 378,842 | |
| Cheniere Energy, Inc. (a) | 15,055 | 909,473 | |
| CNX Resources Corp. (a) | 23,500 | 367,775 | |
| Concho Resources, Inc. (a) | 1,740 | 242,017 | |
| Devon Energy Corp. | 8,266 | 267,818 | |
| Diamondback Energy, Inc. | 1,780 | 200,001 | |
| Encana Corp. | 47,400 | 483,920 | |
| Energen Corp. (a) | 1,961 | 141,133 | |
| Enterprise Products Partners LP | 6,262 | 167,947 | |
| Golar LNG Ltd. | 8,800 | 235,664 | |
| Lundin Petroleum AB | 13,900 | 424,390 | |
| Magnolia Oil & Gas Corp. Class A (a) | 13,700 | 170,565 | |
| Marathon Petroleum Corp. | 2,843 | 200,289 | |
| Newfield Exploration Co. (a) | 3,168 | 63,994 | |
| Noble Energy, Inc. | 29,200 | 725,620 | |
| Teekay LNG Partners LP | 27,200 | 386,512 | |
| Teekay Offshore Partners LP | 142,200 | 309,996 | |
| Valero Energy Corp. | 6,200 | 564,758 | |
| WPX Energy, Inc. (a) | 14,262 | 228,762 | |
| 7,213,013 | |||
| TOTAL ENERGY | 7,813,196 | ||
| FINANCIALS - 13.9% | |||
| Banks - 3.5% | |||
| CIT Group, Inc. | 8,243 | 390,553 | |
| First Citizen Bancshares, Inc. | 794 | 338,744 | |
| PNC Financial Services Group, Inc. | 4,500 | 578,205 | |
| Signature Bank | 1,500 | 164,850 | |
| U.S. Bancorp | 14,631 | 764,762 | |
| Wells Fargo & Co. | 14,871 | 791,583 | |
| 3,028,697 | |||
| Capital Markets - 4.4% | |||
| Ameriprise Financial, Inc. | 6,331 | 805,556 | |
| Apollo Global Management LLC Class A | 20,634 | 607,052 | |
| Ares Management LP | 25,798 | 505,899 | |
| Invesco Ltd. | 19,671 | 427,057 | |
| LPL Financial | 5,400 | 332,640 | |
| State Street Corp. | 6,900 | 474,375 | |
| The Blackstone Group LP | 15,020 | 486,047 | |
| Tullett Prebon PLC | 51,390 | 190,491 | |
| 3,829,117 | |||
| Consumer Finance - 2.8% | |||
| Capital One Financial Corp. | 4,648 | 415,066 | |
| Discover Financial Services | 5,338 | 371,898 | |
| Navient Corp. | 1,537 | 17,798 | |
| OneMain Holdings, Inc. (a) | 16,716 | 476,740 | |
| SLM Corp. (a) | 60,190 | 610,327 | |
| Synchrony Financial | 21,023 | 607,144 | |
| 2,498,973 | |||
| Diversified Financial Services - 0.8% | |||
| Berkshire Hathaway, Inc. Class B (a) | 2,216 | 454,900 | |
| Donnelley Financial Solutions, Inc. (a) | 17,360 | 269,948 | |
| 724,848 | |||
| Insurance - 2.4% | |||
| AMBAC Financial Group, Inc. (a) | 19,801 | 407,505 | |
| American International Group, Inc. | 9,514 | 392,833 | |
| Chubb Ltd. | 3,684 | 460,168 | |
| FNF Group | 15,746 | 526,704 | |
| Sul America SA unit | 47,300 | 315,206 | |
| 2,102,416 | |||
| TOTAL FINANCIALS | 12,184,051 | ||
| HEALTH CARE - 7.2% | |||
| Biotechnology - 0.3% | |||
| Alexion Pharmaceuticals, Inc. (a) | 2,400 | 268,968 | |
| Health Care Equipment & Supplies - 0.4% | |||
| Hill-Rom Holdings, Inc. | 640 | 53,811 | |
| Teleflex, Inc. | 270 | 65,000 | |
| The Cooper Companies, Inc. | 250 | 64,578 | |
| Zimmer Biomet Holdings, Inc. | 1,352 | 153,574 | |
| 336,963 | |||
| Health Care Providers & Services - 2.9% | |||
| Cardinal Health, Inc. | 1,225 | 61,985 | |
| Centene Corp. (a) | 519 | 67,636 | |
| Cigna Corp. | 2,600 | 555,906 | |
| CVS Health Corp. | 8,038 | 581,871 | |
| DaVita HealthCare Partners, Inc. (a) | 400 | 26,936 | |
| Henry Schein, Inc. (a) | 850 | 70,550 | |
| Laboratory Corp. of America Holdings (a) | 620 | 99,541 | |
| McKesson Corp. | 2,548 | 317,888 | |
| Molina Healthcare, Inc. (a) | 341 | 43,229 | |
| Quest Diagnostics, Inc. | 970 | 91,287 | |
| Universal Health Services, Inc. Class B | 5,433 | 660,435 | |
| 2,577,264 | |||
| Life Sciences Tools & Services - 0.4% | |||
| Agilent Technologies, Inc. | 2,565 | 166,186 | |
| Bio-Rad Laboratories, Inc. Class A (a) | 290 | 79,127 | |
| PerkinElmer, Inc. | 481 | 41,597 | |
| QIAGEN NV (a) | 1,030 | 37,389 | |
| Quintiles Transnational Holdings, Inc. (a) | 300 | 36,879 | |
| 361,178 | |||
| Pharmaceuticals - 3.2% | |||
| Allergan PLC | 3,000 | 474,030 | |
| Bayer AG | 6,600 | 505,906 | |
| Indivior PLC (a) | 50,000 | 120,374 | |
| Jazz Pharmaceuticals PLC (a) | 4,684 | 743,913 | |
| Mylan NV (a) | 17,218 | 538,063 | |
| Perrigo Co. PLC | 1,035 | 72,761 | |
| The Medicines Company (a) | 13,700 | 318,662 | |
| 2,773,709 | |||
| TOTAL HEALTH CARE | 6,318,082 | ||
| INDUSTRIALS - 13.9% | |||
| Aerospace & Defense - 1.5% | |||
| Huntington Ingalls Industries, Inc. | 2,700 | 589,896 | |
| Ultra Electronics Holdings PLC | 7,800 | 143,368 | |
| United Technologies Corp. | 4,924 | 611,610 | |
| 1,344,874 | |||
| Airlines - 1.7% | |||
| Air Canada (a) | 13,700 | 259,961 | |
| American Airlines Group, Inc. | 21,956 | 770,216 | |
| JetBlue Airways Corp. (a) | 26,893 | 449,920 | |
| 1,480,097 | |||
| Building Products - 0.1% | |||
| Caesarstone Sdot-Yam Ltd. (b) | 5,500 | 86,845 | |
| Masco Corp. | 800 | 24,000 | |
| 110,845 | |||
| Commercial Services & Supplies - 0.9% | |||
| ABM Industries, Inc. | 2,436 | 74,907 | |
| Stericycle, Inc. (a) | 1,160 | 57,965 | |
| The Brink's Co. | 9,800 | 649,936 | |
| 782,808 | |||
| Construction & Engineering - 1.7% | |||
| AECOM (a) | 33,395 | 973,130 | |
| Arcadis NV | 11,681 | 158,104 | |
| Williams Scotsman Corp. (a) | 22,500 | 333,900 | |
| 1,465,134 | |||
| Electrical Equipment - 0.8% | |||
| Regal Beloit Corp. | 5,766 | 413,422 | |
| Sensata Technologies, Inc. PLC (a) | 5,177 | 242,801 | |
| 656,223 | |||
| Machinery - 1.4% | |||
| Allison Transmission Holdings, Inc. | 5,096 | 224,632 | |
| SPX Corp. (a) | 10,900 | 319,588 | |
| WABCO Holdings, Inc. (a) | 6,240 | 670,488 | |
| 1,214,708 | |||
| Marine - 0.2% | |||
| A.P. Moller - Maersk A/S Series B | 146 | 184,283 | |
| Professional Services - 1.5% | |||
| Manpower, Inc. | 6,100 | 465,369 | |
| Nielsen Holdings PLC | 33,227 | 863,237 | |
| 1,328,606 | |||
| Road & Rail - 0.8% | |||
| CSX Corp. | 1,363 | 93,856 | |
| Knight-Swift Transportation Holdings, Inc. Class A | 16,180 | 517,760 | |
| Norfolk Southern Corp. | 564 | 94,656 | |
| 706,272 | |||
| Trading Companies & Distributors - 2.8% | |||
| AerCap Holdings NV (a) | 7,661 | 383,663 | |
| Ashtead Group PLC | 22,828 | 564,755 | |
| Fortress Transportation & Infrastructure Investors LLC | 29,628 | 493,306 | |
| HD Supply Holdings, Inc. (a) | 22,347 | 839,577 | |
| MRC Global, Inc. (a) | 11,397 | 180,415 | |
| 2,461,716 | |||
| Transportation Infrastructure - 0.5% | |||
| Macquarie Infrastructure Co. LLC | 11,200 | 413,840 | |
| TOTAL INDUSTRIALS | 12,149,406 | ||
| INFORMATION TECHNOLOGY - 8.9% | |||
| Communications Equipment - 0.6% | |||
| CommScope Holding Co., Inc. (a) | 20,374 | 490,198 | |
| Electronic Equipment & Components - 0.9% | |||
| Avnet, Inc. | 6,271 | 251,279 | |
| Flextronics International Ltd. (a) | 10,200 | 80,172 | |
| Jabil, Inc. | 16,832 | 416,255 | |
| 747,706 | |||
| IT Services - 4.4% | |||
| Alliance Data Systems Corp. | 1,800 | 371,124 | |
| Amdocs Ltd. | 9,541 | 603,659 | |
| Cognizant Technology Solutions Corp. Class A | 7,164 | 494,531 | |
| Conduent, Inc. (a) | 26,233 | 501,050 | |
| DXC Technology Co. | 7,812 | 568,948 | |
| First Data Corp. Class A (a) | 21,865 | 409,750 | |
| Leidos Holdings, Inc. | 9,615 | 622,860 | |
| Unisys Corp. (a) | 14,448 | 265,988 | |
| 3,837,910 | |||
| Semiconductors & Semiconductor Equipment - 1.7% | |||
| Broadcom, Inc. | 2,000 | 446,980 | |
| Marvell Technology Group Ltd. | 12,400 | 203,484 | |
| Micron Technology, Inc. (a) | 2,200 | 82,984 | |
| NXP Semiconductors NV | 4,900 | 367,451 | |
| Qualcomm, Inc. | 6,657 | 418,659 | |
| 1,519,558 | |||
| Software - 1.3% | |||
| Micro Focus International PLC | 36,100 | 559,630 | |
| Nuance Communications, Inc. (a) | 19,000 | 330,410 | |
| Totvs SA | 38,000 | 256,295 | |
| 1,146,335 | |||
| TOTAL INFORMATION TECHNOLOGY | 7,741,707 | ||
| MATERIALS - 9.8% | |||
| Chemicals - 6.6% | |||
| Axalta Coating Systems Ltd. (a) | 21,945 | 541,603 | |
| Celanese Corp. Class A | 1,804 | 174,880 | |
| DowDuPont, Inc. | 13,046 | 703,440 | |
| FMC Corp. | 9,604 | 749,880 | |
| LyondellBasell Industries NV Class A | 7,538 | 672,917 | |
| Nutrien Ltd. | 11,000 | 582,316 | |
| Olin Corp. | 4,987 | 100,737 | |
| Orion Engineered Carbons SA | 14,300 | 369,083 | |
| Platform Specialty Products Corp. (a) | 38,500 | 416,570 | |
| The Chemours Co. LLC | 17,656 | 582,825 | |
| Tronox Ltd. Class A | 17,900 | 204,955 | |
| Westlake Chemical Corp. | 8,762 | 624,731 | |
| 5,723,937 | |||
| Construction Materials - 0.8% | |||
| Eagle Materials, Inc. | 6,923 | 511,194 | |
| Summit Materials, Inc. | 16,100 | 217,350 | |
| 728,544 | |||
| Containers & Packaging - 1.7% | |||
| Avery Dennison Corp. | 1,443 | 130,909 | |
| Ball Corp. | 4,617 | 206,842 | |
| Crown Holdings, Inc. (a) | 15,400 | 651,266 | |
| Graphic Packaging Holding Co. | 44,123 | 485,794 | |
| 1,474,811 | |||
| Metals & Mining - 0.7% | |||
| Antofagasta PLC | 5,764 | 57,820 | |
| Constellium NV (a) | 35,500 | 321,630 | |
| Randgold Resources Ltd. sponsored ADR | 1,273 | 99,981 | |
| Steel Dynamics, Inc. | 4,086 | 161,806 | |
| 641,237 | |||
| TOTAL MATERIALS | 8,568,529 | ||
| REAL ESTATE - 9.4% | |||
| Equity Real Estate Investment Trusts (REITs) - 8.0% | |||
| American Tower Corp. | 5,543 | 863,655 | |
| Colony Capital, Inc. | 56,226 | 330,047 | |
| Corporate Office Properties Trust (SBI) | 18,847 | 487,006 | |
| Douglas Emmett, Inc. | 12,343 | 446,693 | |
| Equinix, Inc. | 1,772 | 671,127 | |
| Equity Lifestyle Properties, Inc. | 6,638 | 628,552 | |
| National Retail Properties, Inc. | 14,021 | 655,482 | |
| Outfront Media, Inc. | 18,203 | 322,557 | |
| Public Storage | 3,496 | 718,323 | |
| SL Green Realty Corp. | 5,961 | 544,001 | |
| Spirit Realty Capital, Inc. | 52,870 | 413,443 | |
| Taubman Centers, Inc. | 8,527 | 469,070 | |
| Urban Edge Properties | 23,100 | 473,319 | |
| 7,023,275 | |||
| Real Estate Management & Development - 1.4% | |||
| CBRE Group, Inc. (a) | 12,721 | 512,529 | |
| Cushman & Wakefield PLC | 25,700 | 417,882 | |
| Howard Hughes Corp. (a) | 2,663 | 296,978 | |
| 1,227,389 | |||
| TOTAL REAL ESTATE | 8,250,664 | ||
| UTILITIES - 6.4% | |||
| Electric Utilities - 3.6% | |||
| Evergy, Inc. | 12,379 | 693,100 | |
| PG&E Corp. | 12,242 | 573,048 | |
| PPL Corp. | 33,214 | 1,009,707 | |
| Vistra Energy Corp. (a) | 37,111 | 839,822 | |
| 3,115,677 | |||
| Independent Power and Renewable Electricity Producers - 1.2% | |||
| NRG Energy, Inc. | 19,709 | 713,269 | |
| The AES Corp. | 23,394 | 341,085 | |
| 1,054,354 | |||
| Multi-Utilities - 1.6% | |||
| Ameren Corp. | 7,700 | 497,266 | |
| Sempra Energy | 8,457 | 931,285 | |
| 1,428,551 | |||
| TOTAL UTILITIES | 5,598,582 | ||
| TOTAL COMMON STOCKS | |||
| (Cost $86,995,761) | 86,744,823 | ||
| Principal Amount | Value | ||
| U.S. Treasury Obligations - 0.0% | |||
| U.S. Treasury Bills, yield at date of purchase 2.28% 1/17/19 (c) | |||
| (Cost $39,806) | 40,000 | 39,808 | |
| Shares | Value | ||
| Money Market Funds - 2.5% | |||
| Fidelity Cash Central Fund, 2.23% (d) | 852,782 | $852,952 | |
| Fidelity Securities Lending Cash Central Fund 2.23% (d)(e) | 1,332,182 | 1,332,316 | |
| TOTAL MONEY MARKET FUNDS | |||
| (Cost $2,185,208) | 2,185,268 | ||
| TOTAL INVESTMENT IN SECURITIES - 101.6% | |||
| (Cost $89,220,775) | 88,969,899 | ||
| NET OTHER ASSETS (LIABILITIES) - (1.6)% | (1,422,334) | ||
| NET ASSETS - 100% | $87,547,565 |
| Futures Contracts | |||||
| Number of contracts | Expiration Date | Notional Amount | Value | Unrealized Appreciation/(Depreciation) | |
| Purchased | |||||
| Equity Index Contracts | |||||
| CME E-mini S&P MidCap 400 Index Contracts (United States) | 1 | Dec. 2018 | $182,480 | $(8,647) | $(8,647) |
The notional amount of futures purchased as a percentage of Net Assets is 0.2%
Legend
(a) Non-income producing
(b) Security or a portion of the security is on loan at period end.
(c) Security or a portion of the security was pledged to cover margin requirements for futures contracts. At period end, the value of securities pledged amounted to $39,808.
(d) Affiliated fund that is generally available only to investment companies and other accounts managed by Fidelity Investments. The rate quoted is the annualized seven-day yield of the fund at period end. A complete unaudited listing of the fund's holdings as of its most recent quarter end is available upon request. In addition, each Fidelity Central Fund's financial statements, which are not covered by the Fund's Report of Independent Registered Public Accounting Firm, are available on the SEC's website or upon request.
(e) Investment made with cash collateral received from securities on loan.
Affiliated Central Funds
Information regarding fiscal year to date income earned by the Fund from investments in Fidelity Central Funds is as follows:
| Fund | Income earned |
| Fidelity Cash Central Fund | $23,311 |
| Fidelity Securities Lending Cash Central Fund | 5,723 |
| Total | $29,034 |
Amounts in the income column in the above table include any capital gain distributions from underlying funds, which are presented in the corresponding line-item in the Statement of Operations if applicable.
Investment Valuation
The following is a summary of the inputs used, as of October 31, 2018, involving the Fund's assets and liabilities carried at fair value. The inputs or methodology used for valuing securities may not be an indication of the risk associated with investing in those securities. For more information on valuation inputs, and their aggregation into the levels used below, please refer to the Investment Valuation section in the accompanying Notes to Financial Statements.
| Valuation Inputs at Reporting Date: | ||||
| Description | Total | Level 1 | Level 2 | Level 3 |
| Investments in Securities: | ||||
| Equities: | ||||
| Communication Services | $3,658,585 | $3,658,585 | $-- | $-- |
| Consumer Discretionary | 9,297,659 | 9,297,659 | -- | -- |
| Consumer Staples | 5,164,362 | 4,141,485 | 1,022,877 | -- |
| Energy | 7,813,196 | 7,813,196 | -- | -- |
| Financials | 12,184,051 | 12,184,051 | -- | -- |
| Health Care | 6,318,082 | 5,812,176 | 505,906 | -- |
| Industrials | 12,149,406 | 11,965,123 | 184,283 | -- |
| Information Technology | 7,741,707 | 7,182,077 | 559,630 | -- |
| Materials | 8,568,529 | 8,568,529 | -- | -- |
| Real Estate | 8,250,664 | 8,250,664 | -- | -- |
| Utilities | 5,598,582 | 5,598,582 | -- | -- |
| U.S. Government and Government Agency Obligations | 39,808 | -- | 39,808 | -- |
| Money Market Funds | 2,185,268 | 2,185,268 | -- | -- |
| Total Investments in Securities: | $88,969,899 | $86,657,395 | $2,312,504 | $-- |
| Derivative Instruments: | ||||
| Liabilities | ||||
| Futures Contracts | $(8,647) | $(8,647) | $-- | $-- |
| Total Liabilities | $(8,647) | $(8,647) | $-- | $-- |
| Total Derivative Instruments: | $(8,647) | $(8,647) | $-- | $-- |
Value of Derivative Instruments
The following table is a summary of the Fund's value of derivative instruments by primary risk exposure as of October 31, 2018. For additional information on derivative instruments, please refer to the Derivative Instruments section in the accompanying Notes to Financial Statements.
| Primary Risk Exposure / Derivative Type | Value | |
| Asset | Liability | |
| Equity Risk | ||
| Futures Contracts(a) | $0 | $(8,647) |
| Total Equity Risk | 0 | (8,647) |
| Total Value of Derivatives | $0 | $(8,647) |
(a) Reflects gross cumulative appreciation (depreciation) on futures contracts as presented in the Schedule of Investments. In the Statement of Assets and Liabilities, the period end daily variation margin is included in receivable or payable for daily variation margin on futures contracts, and the net cumulative appreciation (depreciation) is included in net unrealized appreciation (depreciation).
Other Information
Distribution of investments by country or territory of incorporation, as a percentage of Total Net Assets, is as follows (Unaudited):
| United States of America | 80.3% |
| United Kingdom | 4.5% |
| Netherlands | 2.8% |
| Canada | 2.5% |
| Ireland | 1.9% |
| Bermuda | 1.8% |
| Others (Individually Less Than 1%) | 6.2% |
| 100.0% |
See accompanying notes which are an integral part of the financial statements.
Financial Statements
Statement of Assets and Liabilities
| October 31, 2018 | ||
| Assets | ||
| Investment in securities, at value (including securities loaned of $1,309,220) — See accompanying schedule: Unaffiliated issuers (cost $87,035,567) | $86,784,631 | |
| Fidelity Central Funds (cost $2,185,208) | 2,185,268 | |
| Total Investment in Securities (cost $89,220,775) | $88,969,899 | |
| Foreign currency held at value (cost $2,414) | 2,414 | |
| Receivable for investments sold | 587,351 | |
| Receivable for fund shares sold | 154,859 | |
| Dividends receivable | 59,730 | |
| Distributions receivable from Fidelity Central Funds | 2,738 | |
| Receivable for daily variation margin on futures contracts | 540 | |
| Prepaid expenses | 189 | |
| Other receivables | 6,952 | |
| Total assets | 89,784,672 | |
| Liabilities | ||
| Payable to custodian bank | $77,689 | |
| Payable for investments purchased | 656,580 | |
| Payable for fund shares redeemed | 29,183 | |
| Accrued management fee | 25,325 | |
| Distribution and service plan fees payable | 29,275 | |
| Other affiliated payables | 20,807 | |
| Other payables and accrued expenses | 66,198 | |
| Collateral on securities loaned | 1,332,050 | |
| Total liabilities | 2,237,107 | |
| Net Assets | $87,547,565 | |
| Net Assets consist of: | ||
| Paid in capital | $78,438,397 | |
| Total distributable earnings (loss) | 9,109,168 | |
| Net Assets | $87,547,565 | |
| Net Asset Value and Maximum Offering Price | ||
| Class A: | ||
| Net Asset Value and redemption price per share ($45,005,672 ÷ 1,923,582 shares) | $23.40 | |
| Maximum offering price per share (100/94.25 of $23.40) | $24.83 | |
| Class M: | ||
| Net Asset Value and redemption price per share ($14,961,039 ÷ 646,147 shares) | $23.15 | |
| Maximum offering price per share (100/96.50 of $23.15) | $23.99 | |
| Class C: | ||
| Net Asset Value and offering price per share ($14,404,994 ÷ 649,947 shares)(a) | $22.16 | |
| Class I: | ||
| Net Asset Value, offering price and redemption price per share ($12,341,808 ÷ 521,559 shares) | $23.66 | |
| Class Z: | ||
| Net Asset Value, offering price and redemption price per share ($834,052 ÷ 35,237 shares) | $23.67 |
(a) Redemption price per share is equal to net asset value less any applicable contingent deferred sales charge.
See accompanying notes which are an integral part of the financial statements.
Statement of Operations
| Year ended October 31, 2018 | ||
| Investment Income | ||
| Dividends | $1,810,822 | |
| Interest | 3,018 | |
| Income from Fidelity Central Funds | 29,034 | |
| Total income | 1,842,874 | |
| Expenses | ||
| Management fee | ||
| Basic fee | $562,755 | |
| Performance adjustment | (145,433) | |
| Transfer agent fees | 231,180 | |
| Distribution and service plan fees | 396,423 | |
| Accounting and security lending fees | 40,682 | |
| Custodian fees and expenses | 70,720 | |
| Independent trustees' fees and expenses | 524 | |
| Registration fees | 71,469 | |
| Audit | 68,571 | |
| Legal | 10,748 | |
| Miscellaneous | 739 | |
| Total expenses before reductions | 1,308,378 | |
| Expense reductions | (17,537) | |
| Total expenses after reductions | 1,290,841 | |
| Net investment income (loss) | 552,033 | |
| Realized and Unrealized Gain (Loss) | ||
| Net realized gain (loss) on: | ||
| Investment securities: | ||
| Unaffiliated issuers | 11,031,197 | |
| Fidelity Central Funds | 321 | |
| Foreign currency transactions | (1,802) | |
| Futures contracts | 66,018 | |
| Total net realized gain (loss) | 11,095,734 | |
| Change in net unrealized appreciation (depreciation) on: | ||
| Investment securities: | ||
| Unaffiliated issuers | (15,615,045) | |
| Fidelity Central Funds | (151) | |
| Assets and liabilities in foreign currencies | (224) | |
| Futures contracts | (16,917) | |
| Total change in net unrealized appreciation (depreciation) | (15,632,337) | |
| Net gain (loss) | (4,536,603) | |
| Net increase (decrease) in net assets resulting from operations | $(3,984,570) |
See accompanying notes which are an integral part of the financial statements.
Statement of Changes in Net Assets
| Year ended October 31, 2018 | Year ended October 31, 2017 | |
| Increase (Decrease) in Net Assets | ||
| Operations | ||
| Net investment income (loss) | $552,033 | $917,383 |
| Net realized gain (loss) | 11,095,734 | 6,382,558 |
| Change in net unrealized appreciation (depreciation) | (15,632,337) | 12,182,715 |
| Net increase (decrease) in net assets resulting from operations | (3,984,570) | 19,482,656 |
| Distributions to shareholders | (3,394,497) | – |
| Distributions to shareholders from net investment income | – | (582,647) |
| Distributions to shareholders from net realized gain | – | (29,178) |
| Total distributions | (3,394,497) | (611,825) |
| Share transactions - net increase (decrease) | (19,336,141) | (8,709,189) |
| Total increase (decrease) in net assets | (26,715,208) | 10,161,642 |
| Net Assets | ||
| Beginning of period | 114,262,773 | 104,101,131 |
| End of period | $87,547,565 | $114,262,773 |
| Other Information | ||
| Undistributed net investment income end of period | $707,844 |
See accompanying notes which are an integral part of the financial statements.
Financial Highlights
Fidelity Advisor Value Fund Class A
| Years ended October 31, | 2018 | 2017 | 2016 | 2015 | 2014 |
| Selected Per–Share Data | |||||
| Net asset value, beginning of period | $25.37 | $21.43 | $21.39 | $21.48 | $18.90 |
| Income from Investment Operations | |||||
| Net investment income (loss)A | .17 | .23B | .22 | .12 | .09 |
| Net realized and unrealized gain (loss) | (1.31) | 3.86 | .30 | (.14)C | 2.58 |
| Total from investment operations | (1.14) | 4.09 | .52 | (.02) | 2.67 |
| Distributions from net investment income | (.22) | (.14) | (.11) | (.05) | (.04) |
| Distributions from net realized gain | (.61) | (.01) | (.37) | (.02) | (.04) |
| Total distributions | (.83) | (.15) | (.48) | (.07) | (.09)D |
| Net asset value, end of period | $23.40 | $25.37 | $21.43 | $21.39 | $21.48 |
| Total ReturnE,F | (4.73)% | 19.12% | 2.53% | (.12)%C | 14.15% |
| Ratios to Average Net AssetsG,H | |||||
| Expenses before reductions | 1.12% | 1.14% | 1.19% | 1.31% | 1.29% |
| Expenses net of fee waivers, if any | 1.12% | 1.12% | 1.19% | 1.25% | 1.25% |
| Expenses net of all reductions | 1.11% | 1.12% | 1.18% | 1.24% | 1.25% |
| Net investment income (loss) | .66% | .95%B | 1.06% | .53% | .42% |
| Supplemental Data | |||||
| Net assets, end of period (000 omitted) | $45,006 | $59,658 | $54,196 | $50,858 | $45,759 |
| Portfolio turnover rateI | 98% | 81% | 77% | 82% | 78% |
A Calculated based on average shares outstanding during the period.
B Net investment income per share reflects a large, non-recurring dividend which amounted to $.06 per share. Excluding this non-recurring dividend, the ratio of net investment income (loss) to average net assets would have been .68%.
C Net realized and unrealized gain (loss) per share reflects proceeds received from litigation which amounted to $.01 per share. Excluding these litigation proceeds, the total return would have been (.17)%.
D Total distributions of $.09 per share is comprised of distributions from net investment income of $.041 and distributions from net realized gain of $.044 per share.
E Total returns would have been lower if certain expenses had not been reduced during the applicable periods shown.
F Total returns do not include the effect of the sales charges.
G Fees and expenses of any underlying Fidelity Central Funds are not included in the Fund's expense ratio. The Fund indirectly bears its proportionate share of the expenses of any underlying Fidelity Central Funds.
H Expense ratios reflect operating expenses of the class. Expenses before reductions do not reflect amounts reimbursed by the investment adviser or reductions from brokerage service arrangements or reductions from other expense offset arrangements and do not represent the amount paid by the class during periods when reimbursements or reductions occur. Expenses net of fee waivers reflect expenses after reimbursement by the investment adviser but prior to reductions from brokerage service arrangements or other expense offset arrangements. Expenses net of all reductions represent the net expenses paid by the class.
I Amount does not include the portfolio activity of any underlying Fidelity Central Funds.
See accompanying notes which are an integral part of the financial statements.
Fidelity Advisor Value Fund Class M
| Years ended October 31, | 2018 | 2017 | 2016 | 2015 | 2014 |
| Selected Per–Share Data | |||||
| Net asset value, beginning of period | $25.10 | $21.22 | $21.17 | $21.27 | $18.72 |
| Income from Investment Operations | |||||
| Net investment income (loss)A | .10 | .16B | .16 | .06 | .03 |
| Net realized and unrealized gain (loss) | (1.30) | 3.82 | .31 | (.15)C | 2.56 |
| Total from investment operations | (1.20) | 3.98 | .47 | (.09) | 2.59 |
| Distributions from net investment income | (.14) | (.09) | (.05) | – | – |
| Distributions from net realized gain | (.61) | (.01) | (.37) | (.01) | (.04) |
| Total distributions | (.75) | (.10) | (.42) | (.01) | (.04) |
| Net asset value, end of period | $23.15 | $25.10 | $21.22 | $21.17 | $21.27 |
| Total ReturnD,E | (5.01)% | 18.78% | 2.28% | (.43)%C | 13.88% |
| Ratios to Average Net AssetsF,G | |||||
| Expenses before reductions | 1.39% | 1.40% | 1.47% | 1.58% | 1.57% |
| Expenses net of fee waivers, if any | 1.39% | 1.39% | 1.46% | 1.50% | 1.50% |
| Expenses net of all reductions | 1.37% | 1.38% | 1.46% | 1.49% | 1.50% |
| Net investment income (loss) | .40% | .68%B | .78% | .28% | .17% |
| Supplemental Data | |||||
| Net assets, end of period (000 omitted) | $14,961 | $18,962 | $18,098 | $17,300 | $18,558 |
| Portfolio turnover rateH | 98% | 81% | 77% | 82% | 78% |
A Calculated based on average shares outstanding during the period.
B Net investment income per share reflects a large, non-recurring dividend which amounted to $.06 per share. Excluding this non-recurring dividend, the ratio of net investment income (loss) to average net assets would have been .41%.
C Net realized and unrealized gain (loss) per share reflects proceeds received from litigation which amounted to $.01 per share. Excluding these litigation proceeds, the total return would have been (.48)%.
D Total returns would have been lower if certain expenses had not been reduced during the applicable periods shown.
E Total returns do not include the effect of the sales charges.
F Fees and expenses of any underlying Fidelity Central Funds are not included in the Fund's expense ratio. The Fund indirectly bears its proportionate share of the expenses of any underlying Fidelity Central Funds.
G Expense ratios reflect operating expenses of the class. Expenses before reductions do not reflect amounts reimbursed by the investment adviser or reductions from brokerage service arrangements or reductions from other expense offset arrangements and do not represent the amount paid by the class during periods when reimbursements or reductions occur. Expenses net of fee waivers reflect expenses after reimbursement by the investment adviser but prior to reductions from brokerage service arrangements or other expense offset arrangements. Expenses net of all reductions represent the net expenses paid by the class.
H Amount does not include the portfolio activity of any underlying Fidelity Central Funds.
See accompanying notes which are an integral part of the financial statements.
Fidelity Advisor Value Fund Class C
| Years ended October 31, | 2018 | 2017 | 2016 | 2015 | 2014 |
| Selected Per–Share Data | |||||
| Net asset value, beginning of period | $24.02 | $20.32 | $20.35 | $20.54 | $18.13 |
| Income from Investment Operations | |||||
| Net investment income (loss)A | (.04) | .03B | .05 | (.05) | (.07) |
| Net realized and unrealized gain (loss) | (1.25) | 3.67 | .29 | (.13)C | 2.48 |
| Total from investment operations | (1.29) | 3.70 | .34 | (.18) | 2.41 |
| Distributions from net investment income | – | – | – | – | – |
| Distributions from net realized gain | (.57) | – | (.37) | (.01) | – |
| Total distributions | (.57) | – | (.37) | (.01) | – |
| Net asset value, end of period | $22.16 | $24.02 | $20.32 | $20.35 | $20.54 |
| Total ReturnD,E | (5.55)% | 18.21% | 1.72% | (.89)%C | 13.29% |
| Ratios to Average Net AssetsF,G | |||||
| Expenses before reductions | 1.93% | 1.94% | 1.98% | 2.09% | 2.06% |
| Expenses net of fee waivers, if any | 1.93% | 1.92% | 1.97% | 2.00% | 2.00% |
| Expenses net of all reductions | 1.92% | 1.92% | 1.97% | 1.99% | 2.00% |
| Net investment income (loss) | (.15)% | .15%B | .27% | (.22)% | (.33)% |
| Supplemental Data | |||||
| Net assets, end of period (000 omitted) | $14,405 | $20,555 | $15,589 | $16,670 | $17,390 |
| Portfolio turnover rateH | 98% | 81% | 77% | 82% | 78% |
A Calculated based on average shares outstanding during the period.
B Net investment income per share reflects a large, non-recurring dividend which amounted to $.06 per share. Excluding this non-recurring dividend, the ratio of net investment income (loss) to average net assets would have been (.12) %.
C Net realized and unrealized gain (loss) per share reflects proceeds received from litigation which amounted to $.01 per share. Excluding these litigation proceeds, the total return would have been (.94)%.
D Total returns would have been lower if certain expenses had not been reduced during the applicable periods shown.
E Total returns do not include the effect of the contingent deferred sales charge.
F Fees and expenses of any underlying Fidelity Central Funds are not included in the Fund's expense ratio. The Fund indirectly bears its proportionate share of the expenses of any underlying Fidelity Central Funds.
G Expense ratios reflect operating expenses of the class. Expenses before reductions do not reflect amounts reimbursed by the investment adviser or reductions from brokerage service arrangements or reductions from other expense offset arrangements and do not represent the amount paid by the class during periods when reimbursements or reductions occur. Expenses net of fee waivers reflect expenses after reimbursement by the investment adviser but prior to reductions from brokerage service arrangements or other expense offset arrangements. Expenses net of all reductions represent the net expenses paid by the class.
H Amount does not include the portfolio activity of any underlying Fidelity Central Funds.
See accompanying notes which are an integral part of the financial statements.
Fidelity Advisor Value Fund Class I
| Years ended October 31, | 2018 | 2017 | 2016 | 2015 | 2014 |
| Selected Per–Share Data | |||||
| Net asset value, beginning of period | $25.65 | $21.65 | $21.60 | $21.70 | $19.09 |
| Income from Investment Operations | |||||
| Net investment income (loss)A | .25 | .30B | .28 | .17 | .14 |
| Net realized and unrealized gain (loss) | (1.34) | 3.91 | .31 | (.14)C | 2.60 |
| Total from investment operations | (1.09) | 4.21 | .59 | .03 | 2.74 |
| Distributions from net investment income | (.29) | (.20) | (.17) | (.11) | (.09) |
| Distributions from net realized gain | (.61) | (.01) | (.37) | (.02) | (.04) |
| Total distributions | (.90) | (.21) | (.54) | (.13) | (.13) |
| Net asset value, end of period | $23.66 | $25.65 | $21.65 | $21.60 | $21.70 |
| Total ReturnD | (4.48)% | 19.54% | 2.82% | .13%C | 14.46% |
| Ratios to Average Net AssetsE,F | |||||
| Expenses before reductions | .82% | .84% | .89% | 1.00% | .97% |
| Expenses net of fee waivers, if any | .81% | .82% | .89% | 1.00% | .97% |
| Expenses net of all reductions | .80% | .82% | .89% | .99% | .97% |
| Net investment income (loss) | .97% | 1.25%B | 1.36% | .78% | .69% |
| Supplemental Data | |||||
| Net assets, end of period (000 omitted) | $12,342 | $14,565 | $16,218 | $10,391 | $10,011 |
| Portfolio turnover rateG | 98% | 81% | 77% | 82% | 78% |
A Calculated based on average shares outstanding during the period.
B Net investment income per share reflects a large, non-recurring dividend which amounted to $.06 per share. Excluding this non-recurring dividend, the ratio of net investment income (loss) to average net assets would have been .98%.
C Net realized and unrealized gain (loss) per share reflects proceeds received from litigation which amounted to $.01 per share. Excluding these litigation proceeds, the total return would have been .08%.
D Total returns would have been lower if certain expenses had not been reduced during the applicable periods shown.
E Fees and expenses of any underlying Fidelity Central Funds are not included in the Fund's expense ratio. The Fund indirectly bears its proportionate share of the expenses of any underlying Fidelity Central Funds.
F Expense ratios reflect operating expenses of the class. Expenses before reductions do not reflect amounts reimbursed by the investment adviser or reductions from brokerage service arrangements or reductions from other expense offset arrangements and do not represent the amount paid by the class during periods when reimbursements or reductions occur. Expenses net of fee waivers reflect expenses after reimbursement by the investment adviser but prior to reductions from brokerage service arrangements or other expense offset arrangements. Expenses net of all reductions represent the net expenses paid by the class.
G Amount does not include the portfolio activity of any underlying Fidelity Central Funds.
See accompanying notes which are an integral part of the financial statements.
Fidelity Advisor Value Fund Class Z
| Years ended October 31, | 2018 | 2017 A |
| Selected Per–Share Data | ||
| Net asset value, beginning of period | $25.67 | $23.57 |
| Income from Investment Operations | ||
| Net investment income (loss)B | .28 | .23C |
| Net realized and unrealized gain (loss) | (1.34) | 1.87 |
| Total from investment operations | (1.06) | 2.10 |
| Distributions from net investment income | (.33) | – |
| Distributions from net realized gain | (.61) | – |
| Total distributions | (.94) | – |
| Net asset value, end of period | $23.67 | $25.67 |
| Total ReturnD,E | (4.36)% | 8.91% |
| Ratios to Average Net AssetsF,G | ||
| Expenses before reductions | .70% | .72%H |
| Expenses net of fee waivers, if any | .70% | .72%H |
| Expenses net of all reductions | .68% | .71%H |
| Net investment income (loss) | 1.09% | 1.24%C,H |
| Supplemental Data | ||
| Net assets, end of period (000 omitted) | $834 | $524 |
| Portfolio turnover rateI | 98% | 81% |
A For the period February 1, 2017 (commencement of sale of shares) to October 31, 2017.
B Calculated based on average shares outstanding during the period.
C Net investment income per share reflects a large, non-recurring dividend which amounted to $.05 per share. Excluding this non-recurring dividend, the ratio of net investment income (loss) to average net assets would have been .97%.
D Total returns for periods of less than one year are not annualized.
E Total returns would have been lower if certain expenses had not been reduced during the applicable periods shown.
F Fees and expenses of any underlying Fidelity Central Funds are not included in the Fund's expense ratio. The Fund indirectly bears its proportionate share of the expenses of any underlying Fidelity Central Funds.
G Expense ratios reflect operating expenses of the class. Expenses before reductions do not reflect amounts reimbursed by the investment adviser or reductions from brokerage service arrangements or reductions from other expense offset arrangements and do not represent the amount paid by the class during periods when reimbursements or reductions occur. Expense ratios before reductions for start-up periods may not be representative of longer-term operating periods. Expenses net of fee waivers reflect expenses after reimbursement by the investment adviser but prior to reductions from brokerage service arrangements or other expense offset arrangements. Expenses net of all reductions represent the net expenses paid by the class.
H Annualized
I Amount does not include the portfolio activity of any underlying Fidelity Central Funds.
See accompanying notes which are an integral part of the financial statements.
Notes to Financial Statements
For the period ended October 31, 2018
1. Organization.
Fidelity Advisor Value Fund (the Fund) is a fund of Fidelity Advisor Series I (the Trust) and is authorized to issue an unlimited number of shares. The Trust is registered under the Investment Company Act of 1940, as amended (the 1940 Act), as an open-end management investment company organized as a Massachusetts business trust. The Fund offers Class A, Class M, Class C, Class I and Class Z shares, each of which has equal rights as to assets and voting privileges. Each class has exclusive voting rights with respect to matters that affect that class.
2. Investments in Fidelity Central Funds.
The Fund invests in Fidelity Central Funds, which are open-end investment companies generally available only to other investment companies and accounts managed by the investment adviser and its affiliates. The Fund's Schedule of Investments lists each of the Fidelity Central Funds held as of period end, if any, as an investment of the Fund, but does not include the underlying holdings of each Fidelity Central Fund. As an Investing Fund, the Fund indirectly bears its proportionate share of the expenses of the underlying Fidelity Central Funds.
The Money Market Central Funds seek preservation of capital and current income and are managed by Fidelity Investments Money Management, Inc. (FIMM), an affiliate of the investment adviser. Annualized expenses of the Money Market Central Funds as of their most recent shareholder report date are less than .005%.
A complete unaudited list of holdings for each Fidelity Central Fund is available upon request or at the Securities and Exchange Commission (the SEC) website at www.sec.gov. In addition, the financial statements of the Fidelity Central Funds, which are not covered by the Fund's Report of Independent Registered Public Accounting Firm, are available on the SEC website or upon request.
3. Significant Accounting Policies.
The Fund is an investment company and applies the accounting and reporting guidance of the Financial Accounting Standards Board (FASB) Accounting Standards Codification Topic 946 Financial Services – Investments Companies. The financial statements have been prepared in conformity with accounting principles generally accepted in the United States of America (GAAP), which require management to make certain estimates and assumptions at the date of the financial statements. Actual results could differ from those estimates. Subsequent events, if any, through the date that the financial statements were issued have been evaluated in the preparation of the financial statements. The following summarizes the significant accounting policies of the Fund:
Investment Valuation. Investments are valued as of 4:00 p.m. Eastern time on the last calendar day of the period. The Board of Trustees (the Board) has delegated the day to day responsibility for the valuation of the Fund's investments to the Fair Value Committee (the Committee) established by the Fund's investment adviser. In accordance with valuation policies and procedures approved by the Board, the Fund attempts to obtain prices from one or more third party pricing vendors or brokers to value its investments. When current market prices, quotations or currency exchange rates are not readily available or reliable, investments will be fair valued in good faith by the Committee, in accordance with procedures adopted by the Board. Factors used in determining fair value vary by investment type and may include market or investment specific events, changes in interest rates and credit quality. The frequency with which these procedures are used cannot be predicted and they may be utilized to a significant extent. The Committee oversees the Fund's valuation policies and procedures and reports to the Board on the Committee's activities and fair value determinations. The Board monitors the appropriateness of the procedures used in valuing the Fund's investments and ratifies the fair value determinations of the Committee.
The Fund categorizes the inputs to valuation techniques used to value its investments into a disclosure hierarchy consisting of three levels as shown below:
- Level 1 – quoted prices in active markets for identical investments
- Level 2 – other significant observable inputs (including quoted prices for similar investments, interest rates, prepayment speeds, etc.)
- Level 3 – unobservable inputs (including the Fund's own assumptions based on the best information available)
Valuation techniques used to value the Fund's investments by major category are as follows:
Equity securities, including restricted securities, for which market quotations are readily available, are valued at the last reported sale price or official closing price as reported by a third party pricing vendor on the primary market or exchange on which they are traded and are categorized as Level 1 in the hierarchy. In the event there were no sales during the day or closing prices are not available, securities are valued at the last quoted bid price or may be valued using the last available price and are generally categorized as Level 2 in the hierarchy. For foreign equity securities, when market or security specific events arise, comparisons to the valuation of American Depositary Receipts (ADRs), futures contracts, Exchange-Traded Funds (ETFs) and certain indexes as well as quoted prices for similar securities may be used and would be categorized as Level 2 in the hierarchy. Utilizing these techniques may result in transfers between Level 1 and Level 2. For equity securities, including restricted securities, where observable inputs are limited, assumptions about market activity and risk are used and these securities may be categorized as Level 3 in the hierarchy.
Debt securities, including restricted securities, are valued based on evaluated prices received from third party pricing vendors or from brokers who make markets in such securities. U.S. government and government agency obligations are valued by pricing vendors who utilize matrix pricing which considers yield or price of bonds of comparable quality, coupon, maturity and type or by broker-supplied prices. When independent prices are unavailable or unreliable, debt securities may be valued utilizing pricing methodologies which consider similar factors that would be used by third party pricing vendors. Debt securities are generally categorized as Level 2 in the hierarchy but may be Level 3 depending on the circumstances.
Futures contracts are valued at the settlement price established each day by the board of trade or exchange on which they are traded and are categorized as Level 1 in the hierarchy. Investments in open-end mutual funds, including the Fidelity Central Funds, are valued at their closing net asset value (NAV) each business day and are categorized as Level 1 in the hierarchy.
Changes in valuation techniques may result in transfers in or out of an assigned level within the disclosure hierarchy. The aggregate value of investments by input level as of October 31, 2018 is included at the end of the Fund's Schedule of Investments.
Foreign Currency. The Fund may use foreign currency contracts to facilitate transactions in foreign-denominated securities. Gains and losses from these transactions may arise from changes in the value of the foreign currency or if the counterparties do not perform under the contracts' terms.
Foreign-denominated assets, including investment securities, and liabilities are translated into U.S. dollars at the exchange rates at period end. Purchases and sales of investment securities, income and dividends received and expenses denominated in foreign currencies are translated into U.S. dollars at the exchange rate in effect on the transaction date.
The effects of exchange rate fluctuations on investments are included with the net realized and unrealized gain (loss) on investment securities. Other foreign currency transactions resulting in realized and unrealized gain (loss) are disclosed separately.
Investment Transactions and Income. For financial reporting purposes, the Fund's investment holdings and NAV include trades executed through the end of the last business day of the period. The NAV per share for processing shareholder transactions is calculated as of the close of business of the New York Stock Exchange (NYSE), normally 4:00 p.m. Eastern time and includes trades executed through the end of the prior business day. Gains and losses on securities sold are determined on the basis of identified cost and include proceeds received from litigation. Dividend income is recorded on the ex-dividend date, except for certain dividends from foreign securities where the ex-dividend date may have passed, which are recorded as soon as the Fund is informed of the ex-dividend date. Non-cash dividends included in dividend income, if any, are recorded at the fair market value of the securities received. Income and capital gain distributions from Fidelity Central Funds, if any, are recorded on the ex-dividend date. Certain distributions received by the Fund represent a return of capital or capital gain. The Fund determines the components of these distributions subsequent to the ex-dividend date, based upon receipt of tax filings or other correspondence relating to the underlying investment. These distributions are recorded as a reduction of cost of investments and/or as a realized gain. Interest income is accrued as earned and includes coupon interest and amortization of premium and accretion of discount on debt securities as applicable. Investment income is recorded net of foreign taxes withheld where recovery of such taxes is uncertain.
Class Allocations and Expenses. Investment income, realized and unrealized capital gains and losses, common expenses of the Fund, and certain fund-level expense reductions, if any, are allocated daily on a pro-rata basis to each class based on the relative net assets of each class to the total net assets of the Fund. Each class differs with respect to transfer agent and distribution and service plan fees incurred. Certain expense reductions may also differ by class. For the reporting period, the allocated portion of income and expenses to each class as a percent of its average net assets may vary due to the timing of recording these transactions in relation to fluctuating net assets of the classes. Expenses directly attributable to a fund are charged to that fund. Expenses attributable to more than one fund are allocated among the respective funds on the basis of relative net assets or other appropriate methods. Expense estimates are accrued in the period to which they relate and adjustments are made when actual amounts are known.
Income Tax Information and Distributions to Shareholders. Each year, the Fund intends to qualify as a regulated investment company under Subchapter M of the Internal Revenue Code, including distributing substantially all of its taxable income and realized gains. As a result, no provision for U.S. Federal income taxes is required. As of October 31, 2018, the Fund did not have any unrecognized tax benefits in the financial statements; nor is the Fund aware of any tax positions for which it is reasonably possible that the total amounts of unrecognized tax benefits will significantly change in the next twelve months. The Fund files a U.S. federal tax return, in addition to state and local tax returns as required. The Fund's federal income tax returns are subject to examination by the Internal Revenue Service (IRS) for a period of three fiscal years after they are filed. State and local tax returns may be subject to examination for an additional fiscal year depending on the jurisdiction. Foreign taxes are provided for based on the Fund's understanding of the tax rules and rates that exist in the foreign markets in which it invests.
Distributions are declared and recorded on the ex-dividend date. Income and capital gain distributions are declared separately for each class. Income and capital gain distributions are determined in accordance with income tax regulations, which may differ from GAAP. In addition, the Fund claimed a portion of the payment made to redeeming shareholders as a distribution for income tax purposes.
Capital accounts within the financial statements are adjusted for permanent book-tax differences. These adjustments have no impact on net assets or the results of operations. Capital accounts are not adjusted for temporary book-tax differences which will reverse in a subsequent period.
Book-tax differences are primarily due to futures contracts, foreign currency transactions, passive foreign investment companies (PFIC), market discount, partnerships, and losses deferred due to wash sales.
As of period end, the cost and unrealized appreciation (depreciation) in securities, and derivatives if applicable, for federal income tax purposes were as follows:
| Gross unrealized appreciation | $8,634,739 |
| Gross unrealized depreciation | (9,400,693) |
| Net unrealized appreciation (depreciation) | $(765,954) |
| Tax Cost | $89,735,853 |
The tax-based components of distributable earnings as of period end were as follows:
| Undistributed ordinary income | $1,109,375 |
| Undistributed long-term capital gain | $8,815,015 |
| Net unrealized appreciation (depreciation) on securities and other investments | $(815,222) |
The tax character of distributions paid was as follows:
| October 31, 2018 | October 31, 2017 | |
| Ordinary Income | $3,394,497 | $ 611,825 |
New Rule Issuance. During August 2018, the U.S. Securities and Exchange Commission issued Final Rule Release No. 33-10532, Disclosure Update and Simplification. This Final Rule includes amendments specific to registered investment companies that are intended to eliminate overlap in disclosure requirements between Regulation S-X and GAAP. In accordance with these amendments, certain line-items in the Fund's financial statements have been combined or removed for the current period as outlined in the table below.
| Financial Statement | Current Line-Item Presentation | Prior Line-Item Presentation |
| Statement of Assets and Liabilities | Total distributable earnings (loss) | Undistributed/Distributions in excess of/Accumulated net investment income (loss) Accumulated/Undistributed net realized gain (loss) Net unrealized appreciation (depreciation) |
| Statement of Changes in Net Assets | N/A - removed | Undistributed/Distributions in excess of/Accumulated net investment income (loss) end of period |
| Statement of Changes in Net Assets | Distributions to shareholders | Distributions to shareholders from net investment income Distributions to shareholders from net realized gain |
| Distributions to Shareholders Note to Financial Statements | Distributions to shareholders | Distributions to shareholders from net investment income Distributions to shareholders from net realized gain |
4. Derivative Instruments.
Risk Exposures and the Use of Derivative Instruments. The Fund's investment objective allows the Fund to enter into various types of derivative contracts, including futures contracts. Derivatives are investments whose value is primarily derived from underlying assets, indices or reference rates and may be transacted on an exchange or over-the-counter (OTC). Derivatives may involve a future commitment to buy or sell a specified asset based on specified terms, to exchange future cash flows at periodic intervals based on a notional principal amount, or for one party to make one or more payments upon the occurrence of specified events in exchange for periodic payments from the other party.
The Fund used derivatives to increase returns and to manage exposure to certain risks as defined below. The success of any strategy involving derivatives depends on analysis of numerous economic factors, and if the strategies for investment do not work as intended, the Fund may not achieve its objectives.
The Fund's use of derivatives increased or decreased its exposure to the following risk:
| Equity Risk | Equity risk relates to the fluctuations in the value of financial instruments as a result of changes in market prices (other than those arising from interest rate risk or foreign exchange risk), whether caused by factors specific to an individual investment, its issuer, or all factors affecting all instruments traded in a market or market segment. |
The Fund is also exposed to additional risks from investing in derivatives, such as liquidity risk and counterparty credit risk. Liquidity risk is the risk that the Fund will be unable to close out the derivative in the open market in a timely manner. Counterparty credit risk is the risk that the counterparty will not be able to fulfill its obligation to the Fund. Counterparty credit risk related to exchange-traded futures contracts may be mitigated by the protection provided by the exchange on which they trade.
Investing in derivatives may involve greater risks than investing in the underlying assets directly and, to varying degrees, may involve risk of loss in excess of any initial investment and collateral received and amounts recognized in the Statement of Assets and Liabilities. In addition, there may be the risk that the change in value of the derivative contract does not correspond to the change in value of the underlying instrument.
Futures Contracts. A futures contract is an agreement between two parties to buy or sell a specified underlying instrument for a fixed price at a specified future date. The Fund used futures contracts to manage its exposure to the stock market.
Upon entering into a futures contract, a fund is required to deposit either cash or securities (initial margin) with a clearing broker in an amount equal to a certain percentage of the face value of the contract. Futures contracts are marked-to-market daily and subsequent daily payments (variation margin) are made or received by a fund depending on the daily fluctuations in the value of the futures contracts and are recorded as unrealized appreciation or (depreciation). This receivable and/or payable, if any, is included in daily variation margin on futures contracts in the Statement of Assets and Liabilities. Realized gain or (loss) is recorded upon the expiration or closing of a futures contract. The net realized gain (loss) and change in net unrealized appreciation (depreciation) on futures contracts during the period is presented in the Statement of Operations.
Any open futures contracts at period end are presented in the Schedule of Investments under the caption "Futures Contracts". The notional amount at value reflects each contract's exposure to the underlying instrument or index at period end and is representative of volume of activity during the period. Securities deposited to meet initial margin requirements are identified in the Schedule of Investments.
5. Purchases and Sales of Investments.
Purchases and sales of securities, other than short-term securities, aggregated $100,809,127 and $120,013,030, respectively.
6. Fees and Other Transactions with Affiliates.
Management Fee. Fidelity Management & Research Company (the investment adviser) and its affiliates provide the Fund with investment management related services for which the Fund pays a monthly management fee. The management fee is the sum of an individual fund fee rate that is based on an annual rate of .30% of the Fund's average net assets and an annualized group fee rate that averaged .24% during the period. The group fee rate is based upon the average net assets of all the mutual funds advised by the investment adviser, including any mutual funds previously advised by the investment adviser that are currently advised by Fidelity SelectCo, LLC, an affiliate of the investment adviser. The group fee rate decreases as assets under management increase and increases as assets under management decrease. In addition, the management fee is subject to a performance adjustment (up to a maximum of +/- .20% of the Fund's average net assets over a 36 month performance period). The upward or downward adjustment to the management fee is based on the relative investment performance of Class I of the Fund as compared to its benchmark index, the Russell Midcap Value Index, over the same 36 month performance period. For the reporting period, the total annual management fee rate, including the performance adjustment, was .40% of the Fund's average net assets. The performance adjustment included in the management fee rate may be higher or lower than the maximum performance adjustment rate due to the difference between the average net assets for the reporting and performance periods.
Distribution and Service Plan Fees. In accordance with Rule 12b-1 of the 1940 Act, the Fund has adopted separate Distribution and Service Plans for each class of shares. Certain classes pay Fidelity Distributors Corporation (FDC), an affiliate of the investment adviser, separate Distribution and Service Fees, each of which is based on an annual percentage of each class' average net assets. In addition, FDC may pay financial intermediaries for selling shares of the Fund and providing shareholder support services. For the period, the Distribution and Service Fee rates, total fees and amounts retained by FDC were as follows:
| Distribution Fee | Service Fee | Total Fees | Retained by FDC | |
| Class A | -% | .25% | $136,170 | $2,339 |
| Class M | .25% | .25% | 88,922 | 152 |
| Class C | .75% | .25% | 171,331 | 10,736 |
| $396,423 | $13,227 |
Sales Load. FDC may receive a front-end sales charge of up to 5.75% for selling Class A shares and 3.50% for selling Class M shares, some of which is paid to financial intermediaries for selling shares of the Fund. Depending on the holding period, FDC may receive contingent deferred sales charges levied on Class A, Class M and Class C redemptions. The deferred sales charges are 1.00% for Class C shares, 1.00% for certain purchases of Class A shares and .25% for certain purchases of Class M shares.
For the period, sales charge amounts retained by FDC were as follows:
| Retained by FDC | |
| Class A | $13,299 |
| Class M | 2,718 |
| Class C(a) | 1,132 |
| $17,149 |
(a) When Class C shares are initially sold, FDC pays commissions from its own resources to financial intermediaries through which the sales are made.
Transfer Agent Fees. Fidelity Investments Institutional Operations Company, Inc., (FIIOC), an affiliate of the investment adviser, is the transfer, dividend disbursing and shareholder servicing agent for each class of the Fund. FIIOC receives account fees and asset-based fees that vary according to the account size and type of account of the shareholders of the respective classes of the Fund, except for Class Z. FIIOC receives an asset-based fee of Class Z's average net assets. FIIOC pays for typesetting, printing and mailing of shareholder reports, except proxy statements.
For the period, transfer agent fees for each class were as follows:
| Amount | % of Class-Level Average Net Assets | |
| Class A | $118,807 | .22 |
| Class M | 41,535 | .23 |
| Class C | 47,651 | .28 |
| Class I | 22,919 | .16 |
| Class Z | 268 | .05 |
| $231,180 |
Accounting and Security Lending Fees. Fidelity Service Company, Inc. (FSC), an affiliate of the investment adviser, maintains the Fund's accounting records. The accounting fee is based on the level of average net assets for each month. Under a separate contract, FSC administers the security lending program. The security lending fee is based on the number and duration of lending transactions. For the period, the fees were equivalent to an annual rate of .04%.
Brokerage Commissions. The Fund placed a portion of its portfolio transactions with brokerage firms which are affiliates of the investment adviser. Brokerage commissions are included in net realized gain (loss) and change in net unrealized appreciation (depreciation) in the Statement of Operations. The commissions paid to these affiliated firms were $3,726 for the period.
Interfund Trades. The Fund may purchase from or sell securities to other Fidelity Funds under procedures adopted by the Board. The procedures have been designed to ensure these interfund trades are executed in accordance with Rule 17a-7 of the 1940 Act. Interfund trades are included within the respective purchases and sales amounts shown in the Purchases and Sales of Investments note.
7. Committed Line of Credit.
The Fund participates with other funds managed by the investment adviser or an affiliate in a $4.25 billion credit facility (the "line of credit") to be utilized for temporary or emergency purposes to fund shareholder redemptions or for other short-term liquidity purposes. The Fund has agreed to pay commitment fees on its pro-rata portion of the line of credit, which amounted to $290 and is reflected in Miscellaneous expenses on the Statement of Operations. During the period, the Fund did not borrow on this line of credit.
8. Security Lending.
The Fund lends portfolio securities through a lending agent from time to time in order to earn additional income. For equity securities, a lending agent is used and may loan securities to certain qualified borrowers, including Fidelity Capital Markets (FCM), a broker-dealer affiliated with the Fund. On the settlement date of the loan, the Fund receives collateral (in the form of U.S. Treasury obligations, letters of credit and/or cash) against the loaned securities and maintains collateral in an amount not less than 100% of the market value of the loaned securities during the period of the loan. The market value of the loaned securities is determined at the close of business of the Fund and any additional required collateral is delivered to the Fund on the next business day. The Fund or borrower may terminate the loan at any time, and if the borrower defaults on its obligation to return the securities loaned because of insolvency or other reasons, the Fund may apply collateral received from the borrower against the obligation. The Fund may experience delays and costs in recovering the securities loaned. Any cash collateral received is invested in the Fidelity Securities Lending Cash Central Fund. The value of loaned securities and cash collateral at period end are disclosed on the Fund's Statement of Assets and Liabilities. At period end, there were no security loans outstanding with FCM. Security lending income represents the income earned on investing cash collateral, less rebates paid to borrowers and any lending agent fees associated with the loan, plus any premium payments received for lending certain types of securities. Security lending income is presented in the Statement of Operations as a component of income from Fidelity Central Funds. Total security lending income during the period amounted to $5,723, including $27 from securities loaned to FCM.
9. Expense Reductions.
Commissions paid to certain brokers with whom the investment adviser, or its affiliates, places trades on behalf of the Fund include an amount in addition to trade execution, which may be rebated back to the Fund to offset certain expenses. This amount totaled $16,416 for the period.
In addition, during the period the investment adviser reimbursed and/or waived a portion of fund-level operating expenses in the amount of $1,121.
10. Distributions to Shareholders.
Distributions to shareholders of each class were as follows:
| Year ended October 31, 2018 | Year ended October 31, 2017 | |
| Distributions to shareholders | ||
| Class A | $1,893,403 | $– |
| Class M | 537,341 | – |
| Class C | 426,703 | – |
| Class I | 516,919 | – |
| Class Z | 20,131 | – |
| Total | $3,394,497 | $– |
| From net investment income | ||
| Class A | $– | $349,954 |
| Class M | – | 78,611 |
| Class I | – | 154,082 |
| Total | $– | $582,647 |
| From net realized gain | ||
| Class A | $– | $17,751 |
| Class M | – | 6,114 |
| Class I | – | 5,313 |
| Total | $– | $29,178 |
11. Share Transactions.
Share transactions for each class were as follows and may contain automatic conversions between classes or exchanges between affiliated funds:
| Shares | Shares | Dollars | Dollars | |
| Year ended October 31, 2018 | Year ended October 31, 2017(a) | Year ended October 31, 2018 | Year ended October 31, 2017(a) | |
| Class A | ||||
| Shares sold | 277,354 | 765,473 | $7,012,619 | $18,343,045 |
| Reinvestment of distributions | 74,582 | 15,497 | 1,872,755 | 360,454 |
| Shares redeemed | (779,617) | (958,773) | (19,725,386) | (23,014,248) |
| Net increase (decrease) | (427,681) | (177,803) | $(10,840,012) | $(4,310,749) |
| Class M | ||||
| Shares sold | 81,080 | 119,030 | $2,016,647 | $2,790,662 |
| Reinvestment of distributions | 21,382 | 3,578 | 532,637 | 82,555 |
| Shares redeemed | (211,643) | (220,310) | (5,286,408) | (5,274,080) |
| Net increase (decrease) | (109,181) | (97,702) | $(2,737,124) | $(2,400,863) |
| Class C | ||||
| Shares sold | 97,794 | 348,523 | $2,367,339 | $7,912,553 |
| Reinvestment of distributions | 17,484 | – | 418,910 | – |
| Shares redeemed | (321,165) | (259,820) | (7,728,571) | (5,896,612) |
| Net increase (decrease) | (205,887) | 88,703 | $(4,942,322) | $2,015,941 |
| Class I | ||||
| Shares sold | 123,665 | 323,944 | $3,169,838 | $7,840,510 |
| Reinvestment of distributions | 18,244 | 5,728 | 462,124 | 134,330 |
| Shares redeemed | (188,241) | (510,727) | (4,819,090) | (12,490,419) |
| Net increase (decrease) | (46,332) | (181,055) | $(1,187,128) | $(4,515,579) |
| Class Z | ||||
| Shares sold | 40,345 | 20,406 | $1,029,945 | $502,183 |
| Reinvestment of distributions | 795 | – | 20,131 | – |
| Shares redeemed | (26,304) | (5) | (679,631) | (122) |
| Net increase (decrease) | 14,836 | 20,401 | $370,445 | $502,061 |
(a) Share transactions for Class Z are for the period February 1, 2017 (commencement of sale of shares) to October 31, 2017.
12. Other.
The Fund's organizational documents provide former and current trustees and officers with a limited indemnification against liabilities arising in connection with the performance of their duties to the Fund. In the normal course of business, the Fund may also enter into contracts that provide general indemnifications. The Fund's maximum exposure under these arrangements is unknown as this would be dependent on future claims that may be made against the Fund. The risk of material loss from such claims is considered remote.
Report of Independent Registered Public Accounting Firm
To the Trustees of Fidelity Advisor Series I and Shareholders of Fidelity Advisor Value Fund:
Opinion on the Financial Statements and Financial Highlights
We have audited the accompanying statement of assets and liabilities of Fidelity Advisor Value Fund (the "Fund"), a fund of Fidelity Advisor Series I , including the schedule of investments, as of October 31, 2018, and the related statement of operations for the year then ended, the statement of changes in net assets for each of the two years in the period then ended, the financial highlights for each of the five years in the period then ended, and the related notes. In our opinion, the financial statements and financial highlights present fairly, in all material respects, the financial position of the Fund as of October 31, 2018, and the results of its operations for the year then ended, the changes in its net assets for each of the two years in the period then ended, and the financial highlights for each of the five years in the period then ended, in conformity with accounting principles generally accepted in the United States of America.
Basis for Opinion
These financial statements and financial highlights are the responsibility of the Fund's management. Our responsibility is to express an opinion on the Fund's financial statements and financial highlights based on our audits. We are a public accounting firm registered with the Public Company Accounting Oversight Board (United States) (PCAOB) and are required to be independent with respect to the Fund in accordance with the U.S. federal securities laws and the applicable rules and regulations of the Securities and Exchange Commission and the PCAOB.
We conducted our audits in accordance with the standards of the PCAOB. Those standards require that we plan and perform the audit to obtain reasonable assurance about whether the financial statements and financial highlights are free of material misstatement, whether due to error or fraud. The Fund is not required to have, nor were we engaged to perform, an audit of its internal control over financial reporting. As part of our audits we are required to obtain an understanding of internal control over financial reporting but not for the purpose of expressing an opinion on the effectiveness of the Fund’s internal control over financial reporting. Accordingly, we express no such opinion.
Our audits included performing procedures to assess the risks of material misstatement of the financial statements and financial highlights, whether due to error or fraud, and performing procedures that respond to those risks. Such procedures included examining, on a test basis, evidence regarding the amounts and disclosures in the financial statements and financial highlights. Our audits also included evaluating the accounting principles used and significant estimates made by management, as well as evaluating the overall presentation of the financial statements and financial highlights. Our procedures included confirmation of securities owned as of October 31, 2018, by correspondence with the custodians and brokers; when replies were not received from brokers, we performed other auditing procedures. We believe that our audits provide a reasonable basis for our opinion.
/s/ Deloitte & Touche LLP
Boston, Massachusetts
December 11, 2018
We have served as the auditor of one or more of the Fidelity investment companies since 1999.
Trustees and Officers
The Trustees, Members of the Advisory Board (if any), and officers of the trust and fund, as applicable, are listed below. The Board of Trustees governs the fund and is responsible for protecting the interests of shareholders. The Trustees are experienced executives who meet periodically throughout the year to oversee the fund's activities, review contractual arrangements with companies that provide services to the fund, oversee management of the risks associated with such activities and contractual arrangements, and review the fund's performance. Except for Michael E. Wiley, each of the Trustees oversees 283 funds. Mr. Wiley oversees 193 funds.
The Trustees hold office without limit in time except that (a) any Trustee may resign; (b) any Trustee may be removed by written instrument, signed by at least two-thirds of the number of Trustees prior to such removal; (c) any Trustee who requests to be retired or who has become incapacitated by illness or injury may be retired by written instrument signed by a majority of the other Trustees; and (d) any Trustee may be removed at any special meeting of shareholders by a two-thirds vote of the outstanding voting securities of the trust. Each Trustee who is not an interested person (as defined in the 1940 Act) of the trust and the fund is referred to herein as an Independent Trustee. Each Independent Trustee shall retire not later than the last day of the calendar year in which his or her 75th birthday occurs. The Independent Trustees may waive this mandatory retirement age policy with respect to individual Trustees. Officers and Advisory Board Members hold office without limit in time, except that any officer or Advisory Board Member may resign or may be removed by a vote of a majority of the Trustees at any regular meeting or any special meeting of the Trustees. Except as indicated, each individual has held the office shown or other offices in the same company for the past five years.
The fund’s Statement of Additional Information (SAI) includes more information about the Trustees. To request a free copy, call Fidelity at 1-877-208-0098.
Experience, Skills, Attributes, and Qualifications of the Trustees. The Governance and Nominating Committee has adopted a statement of policy that describes the experience, qualifications, attributes, and skills that are necessary and desirable for potential Independent Trustee candidates (Statement of Policy). The Board believes that each Trustee satisfied at the time he or she was initially elected or appointed a Trustee, and continues to satisfy, the standards contemplated by the Statement of Policy. The Governance and Nominating Committee also engages professional search firms to help identify potential Independent Trustee candidates who have the experience, qualifications, attributes, and skills consistent with the Statement of Policy. From time to time, additional criteria based on the composition and skills of the current Independent Trustees, as well as experience or skills that may be appropriate in light of future changes to board composition, business conditions, and regulatory or other developments, have also been considered by the professional search firms and the Governance and Nominating Committee. In addition, the Board takes into account the Trustees' commitment and participation in Board and committee meetings, as well as their leadership of standing and ad hoc committees throughout their tenure.
In determining that a particular Trustee was and continues to be qualified to serve as a Trustee, the Board has considered a variety of criteria, none of which, in isolation, was controlling. The Board believes that, collectively, the Trustees have balanced and diverse experience, qualifications, attributes, and skills, which allow the Board to operate effectively in governing the fund and protecting the interests of shareholders. Information about the specific experience, skills, attributes, and qualifications of each Trustee, which in each case led to the Board's conclusion that the Trustee should serve (or continue to serve) as a trustee of the fund, is provided below.
Board Structure and Oversight Function. James C. Curvey is an interested person and currently serves as Chairman. The Trustees have determined that an interested Chairman is appropriate and benefits shareholders because an interested Chairman has a personal and professional stake in the quality and continuity of services provided to the fund. Independent Trustees exercise their informed business judgment to appoint an individual of their choosing to serve as Chairman, regardless of whether the Trustee happens to be independent or a member of management. The Independent Trustees have determined that they can act independently and effectively without having an Independent Trustee serve as Chairman and that a key structural component for assuring that they are in a position to do so is for the Independent Trustees to constitute a substantial majority for the Board. The Independent Trustees also regularly meet in executive session. Ned C. Lautenbach serves as Chairman of the Independent Trustees and as such (i) acts as a liaison between the Independent Trustees and management with respect to matters important to the Independent Trustees and (ii) with management prepares agendas for Board meetings.
Fidelity® funds are overseen by different Boards of Trustees. The fund's Board oversees Fidelity's high income and certain equity funds, and other Boards oversee Fidelity's investment-grade bond, money market, asset allocation, and other equity funds. The asset allocation funds may invest in Fidelity® funds overseen by the fund's Board. The use of separate Boards, each with its own committee structure, allows the Trustees of each group of Fidelity® funds to focus on the unique issues of the funds they oversee, including common research, investment, and operational issues. On occasion, the separate Boards establish joint committees to address issues of overlapping consequences for the Fidelity® funds overseen by each Board.
The Trustees operate using a system of committees to facilitate the timely and efficient consideration of all matters of importance to the Trustees, the fund, and fund shareholders and to facilitate compliance with legal and regulatory requirements and oversight of the fund's activities and associated risks. The Board, acting through its committees, has charged FMR and its affiliates with (i) identifying events or circumstances the occurrence of which could have demonstrably adverse effects on the fund's business and/or reputation; (ii) implementing processes and controls to lessen the possibility that such events or circumstances occur or to mitigate the effects of such events or circumstances if they do occur; and (iii) creating and maintaining a system designed to evaluate continuously business and market conditions in order to facilitate the identification and implementation processes described in (i) and (ii) above. Because the day-to-day operations and activities of the fund are carried out by or through FMR, its affiliates, and other service providers, the fund's exposure to risks is mitigated but not eliminated by the processes overseen by the Trustees. While each of the Board's committees has responsibility for overseeing different aspects of the fund's activities, oversight is exercised primarily through the Operations, Audit, and Compliance Committees. In addition, the Independent Trustees have worked with Fidelity to enhance the Board's oversight of investment and financial risks, legal and regulatory risks, technology risks, and operational risks, including the development of additional risk reporting to the Board. Appropriate personnel, including but not limited to the fund's Chief Compliance Officer (CCO), FMR's internal auditor, the independent accountants, the fund's Treasurer and portfolio management personnel, make periodic reports to the Board's committees, as appropriate, including an annual review of Fidelity's risk management program for the Fidelity® funds. The responsibilities of each standing committee, including their oversight responsibilities, are described further under "Standing Committees of the Trustees."
Interested Trustees*:
Correspondence intended for a Trustee who is an interested person may be sent to Fidelity Investments, 245 Summer Street, Boston, Massachusetts 02210.
Name, Year of Birth; Principal Occupations and Other Relevant Experience+
James C. Curvey (1935)
Year of Election or Appointment: 2007
Trustee
Chairman of the Board of Trustees
Mr. Curvey also serves as Trustee of other Fidelity® funds. Mr. Curvey is Vice Chairman (2007-present) and Director of FMR LLC (diversified financial services company). In addition, Mr. Curvey is an Overseer Emeritus for the Boston Symphony Orchestra, a Director of Artis-Naples, and a Trustee of Brewster Academy in Wolfeboro, New Hampshire. Previously, Mr. Curvey served as a Director of Fidelity Research & Analysis Co. (investment adviser firm, 2009-2018), Director of Fidelity Investments Money Management, Inc. (investment adviser firm, 2009-2014) and a Director of FMR and FMR Co., Inc. (investment adviser firms, 2007-2014).
Charles S. Morrison (1960)
Year of Election or Appointment: 2014
Trustee
Mr. Morrison also serves as Trustee of other funds. He serves as President of Fidelity SelectCo, LLC (investment adviser firm, 2017-present) and Fidelity Management & Research Company (FMR) (investment adviser firm, 2016-present), a Director of Fidelity Investments Money Management, Inc. (FIMM) (investment adviser firm, 2014-present), Director of Fidelity SelectCo, LLC (investment adviser firm, 2014-present), President, Asset Management (2014-present), and is an employee of Fidelity Investments. Previously, Mr. Morrison served as Vice President of Fidelity's Fixed Income and Asset Allocation Funds (2012-2014), President, Fixed Income (2011-2014), Vice President of Fidelity's Money Market Funds (2005-2009), President, Money Market Group Leader of FMR (investment adviser firm, 2009), and Senior Vice President, Money Market Group of FMR (2004-2009). Mr. Morrison also served as Vice President of Fidelity's Bond Funds (2002-2005), certain Balanced Funds (2002-2005), and certain Asset Allocation Funds (2002-2007), and as Senior Vice President (2002-2005) of Fidelity's Bond Division.
* Determined to be an “Interested Trustee” by virtue of, among other things, his or her affiliation with the trust or various entities under common control with FMR.
+ The information includes the Trustee's principal occupation during the last five years and other information relating to the experience, attributes, and skills relevant to the Trustee's qualifications to serve as a Trustee, which led to the conclusion that the Trustee should serve as a Trustee for the fund.
Independent Trustees:
Correspondence intended for an Independent Trustee may be sent to Fidelity Investments, P.O. Box 55235, Boston, Massachusetts 02205-5235.
Name, Year of Birth; Principal Occupations and Other Relevant Experience+
Dennis J. Dirks (1948)
Year of Election or Appointment: 2005
Trustee
Mr. Dirks also serves as Trustee of other Fidelity® funds. Prior to his retirement in May 2003, Mr. Dirks was Chief Operating Officer and a member of the Board of The Depository Trust & Clearing Corporation (DTCC). He also served as President, Chief Operating Officer, and Board member of The Depository Trust Company (DTC) and President and Board member of the National Securities Clearing Corporation (NSCC). In addition, Mr. Dirks served as Chief Executive Officer and Board member of the Government Securities Clearing Corporation, Chief Executive Officer and Board member of the Mortgage-Backed Securities Clearing Corporation, as a Trustee and a member of the Finance Committee of Manhattan College (2005-2008), as a Trustee and a member of the Finance Committee of AHRC of Nassau County (2006-2008), as a member of the Independent Directors Council (IDC) Governing Council (2010-2015), and as a member of the Board of Directors for The Brookville Center for Children’s Services, Inc. (2009-2017). Mr. Dirks is a member of the Finance Committee (2016-present), Board of Directors (2017-present) and Board of Trustees (2018-present) and is Treasurer (2018-present) of the Asolo Repertory Theatre.
Donald F. Donahue (1950)
Year of Election or Appointment: 2018
Trustee
Mr. Donahue also serves as a Trustee of other Fidelity® funds. Mr. Donahue is President and Chief Executive Officer of Miranda Partners, LLC (risk consulting for the financial services industry, 2012-present). Previously, Mr. Donahue served as a Member of the Advisory Board of certain Fidelity® funds (2015-2018) and Chief Executive Officer (2006-2012), Chief Operating Officer (2003-2006), and Managing Director, Customer Marketing and Development (1999-2003) of The Depository Trust & Clearing Corporation (financial markets infrastructure). Mr. Donahue serves as a Member (2007-present) and Co-Chairman (2016-present) of the Board of Directors of United Way of New York, Member of the Board of Directors of NYC Leadership Academy (2012-present) and Member of the Board of Advisors of Ripple Labs, Inc. (financial services, 2015-present). He also served as Chairman (2010-2012) and Member of the Board of Directors (2012-2013) of Omgeo, LLC (financial services), Treasurer of United Way of New York (2012-2016), and Member of the Board of Directors of XBRL US (financial services non-profit, 2009-2012) and the International Securities Services Association (2009-2012).
Alan J. Lacy (1953)
Year of Election or Appointment: 2008
Trustee
Mr. Lacy also serves as Trustee of other Fidelity® funds. Mr. Lacy serves as a Director of Bristol-Myers Squibb Company (global pharmaceuticals, 2008-present). He is a Trustee of the California Chapter of The Nature Conservancy (2015-present) and a Director of the Center for Advanced Study in the Behavioral Sciences at Stanford University (2015-present). In addition, Mr. Lacy served as Senior Adviser (2007-2014) of Oak Hill Capital Partners, L.P. (private equity) and also served as Chief Executive Officer (2005) and Vice Chairman (2005-2006) of Sears Holdings Corporation (retail) and Chief Executive Officer and Chairman of the Board of Sears, Roebuck and Co. (retail, 2000-2005). Previously, Mr. Lacy served as Chairman (2014-2017) and a member (2010-2017) of the Board of Directors of Dave & Buster’s Entertainment, Inc. (restaurant and entertainment complexes), as Chairman (2008-2011) and a member (2006-2015) of the Board of Trustees of the National Parks Conservation Association, and as a member of the Board of Directors for The Hillman Companies, Inc. (hardware wholesalers, 2010-2014), Earth Fare, Inc. (retail grocery, 2010-2014), and The Western Union Company (global money transfer, 2006-2011).
Ned C. Lautenbach (1944)
Year of Election or Appointment: 2000
Trustee
Chairman of the Independent Trustees
Mr. Lautenbach also serves as Trustee of other Fidelity® funds. Mr. Lautenbach currently serves as Vice Chair of the Board of Governors, State University System of Florida (2013-present) and is a member of the Council on Foreign Relations (1994-present). He is also a member and has most recently served as Chairman of the Board of Directors of Artis-Naples (2012-present). Previously, Mr. Lautenbach served as a member and then Lead Director of the Board of Directors of Eaton Corporation (diversified industrial, 1997-2016). He was also a Partner and Advisory Partner at Clayton, Dubilier & Rice, LLC (private equity investment, 1998-2010), as well as a Director of Sony Corporation (2006-2007). In addition, Mr. Lautenbach also had a 30-year career with IBM (technology company) during which time he served as Senior Vice President and a member of the Corporate Executive Committee (1968-1998).
Joseph Mauriello (1944)
Year of Election or Appointment: 2008
Trustee
Mr. Mauriello also serves as Trustee of other Fidelity® funds. Prior to his retirement in January 2006, Mr. Mauriello served in numerous senior management positions including Deputy Chairman and Chief Operating Officer (2004-2005), and Vice Chairman of Financial Services (2002-2004) of KPMG LLP US (professional services, 1965-2005). Mr. Mauriello currently serves as a member of the Independent Directors Council (IDC) Governing Council (2015-present). Previously, Mr. Mauriello served as a member of the Board of Directors of XL Group plc. (global insurance and re-insurance, 2006-2018).
Cornelia M. Small (1944)
Year of Election or Appointment: 2005
Trustee
Ms. Small also serves as Trustee of other Fidelity® funds. Ms. Small is a member of the Board of Directors (2009-present) and Chair of the Investment Committee (2010-present) of the Teagle Foundation. Ms. Small also serves on the Investment Committee of the Berkshire Taconic Community Foundation (2008-present). Previously, Ms. Small served as Chairperson (2002-2008) and a member of the Investment Committee and Chairperson (2008-2012) and a member of the Board of Trustees of Smith College. In addition, Ms. Small served as Chief Investment Officer, Director of Global Equity Investments, and a member of the Board of Directors of Scudder, Stevens & Clark and Scudder Kemper Investments.
Garnett A. Smith (1947)
Year of Election or Appointment: 2018
Trustee
Mr. Smith also serves as Trustee of other Fidelity® funds. Prior to Mr. Smith's retirement, he served as Chairman and Chief Executive Officer of Inbrand Corp. (manufacturer of personal absorbent products, 1990-1997). He also served as President (1986-1990) of Inbrand Corp. Prior to his employment with Inbrand Corp., he was employed by a retail fabric chain and North Carolina National Bank. In addition, Mr. Smith served as a Member of the Advisory Board of certain Fidelity® funds (2012-2013) and as a board member of the Jackson Hole Land Trust (2009-2012).
David M. Thomas (1949)
Year of Election or Appointment: 2008
Trustee
Mr. Thomas also serves as Trustee of other Fidelity® funds. Mr. Thomas serves as Non-Executive Chairman of the Board of Directors of Fortune Brands Home and Security (home and security products, 2011-present), as a member of the Board of Directors (2004-present) and Presiding Director (2013-present) of Interpublic Group of Companies, Inc. (marketing communication), and as a member of the Board of Trustees of the University of Florida (2013-present). Previously, Mr. Thomas served as Executive Chairman (2005-2006) and Chairman and Chief Executive Officer (2000-2005) of IMS Health, Inc. (pharmaceutical and healthcare information solutions), and a Director of Fortune Brands, Inc. (consumer products, 2000-2011).
Michael E. Wiley (1950)
Year of Election or Appointment: 2018
Trustee
Mr. Wiley also serves as Trustee or Member of the Advisory Board of other Fidelity® funds. Mr. Wiley serves as a Director of High Point Resources (exploration and production, 2005-present). Previously, Mr. Wiley served as a Director of Andeavor Corporation (independent oil refiner and marketer, 2005-2018), a Director of Andeavor Logistics LP (natural resources logistics, 2015-2018), a Director of Post Oak Bank (privately-held bank, 2004-2018), a Director of Asia Pacific Exploration Consolidated (international oil and gas exploration and production, 2008-2013), a member of the Board of Trustees of the University of Tulsa (2000-2006; 2007-2010), a Senior Energy Advisor of Katzenbach Partners, LLC (consulting, 2006-2007), an Advisory Director of Riverstone Holdings (private investment), a Director of Spinnaker Exploration Company (exploration and production, 2001-2005) and Chairman, President, and CEO of Baker Hughes, Inc. (oilfield services, 2000-2004).
+ The information includes the Trustee's principal occupation during the last five years and other information relating to the experience, attributes, and skills relevant to the Trustee's qualifications to serve as a Trustee, which led to the conclusion that the Trustee should serve as a Trustee for the fund.
Advisory Board Members and Officers:
Correspondence intended for a Member of the Advisory Board (if any) may be sent to Fidelity Investments, P.O. Box 55235, Boston, Massachusetts 02205-5235. Correspondence intended for an officer or Peter S. Lynch may be sent to Fidelity Investments, 245 Summer Street, Boston, Massachusetts 02210. Officers appear below in alphabetical order.
Name, Year of Birth; Principal Occupation
Vicki L. Fuller (1957)
Year of Election or Appointment: 2018
Member of the Advisory Board
Ms. Fuller also serves as Member of the Advisory Board of other Fidelity® funds. Ms. Fuller serves as a member of the Board of Directors, Audit Committee, and Nominating and Governance Committee of The Williams Companies, Inc. (natural gas infrastructure, 2018-present). Previously, Ms. Fuller served as the Chief Investment Officer of the New York State Common Retirement Fund (2012-2018) and held a variety of positions at AllianceBernstein L.P. (global asset management, 1985-2012), including Managing Director (2006-2012) and Senior Vice President and Senior Portfolio Manager (2001-2006).
Peter S. Lynch (1944)
Year of Election or Appointment: 2003
Member of the Advisory Board
Mr. Lynch also serves as Member of the Advisory Board of other Fidelity® funds. Mr. Lynch is Vice Chairman and a Director of FMR (investment adviser firm) and FMR Co., Inc. (investment adviser firm). In addition, Mr. Lynch serves as a Trustee of Boston College and as the Chairman of the Inner-City Scholarship Fund. Previously, Mr. Lynch served on the Special Olympics International Board of Directors (1997-2006).
William S. Stavropoulos (1939)
Year of Election or Appointment: 2018
Member of the Advisory Board
Mr. Stavropoulos also serves as Member of the Advisory Board of other Fidelity® funds. Mr. Stavropoulos serves as President and Founder of the Michigan Baseball Foundation, the Great Lakes Loons (2007-present). Mr. Stavropoulos is Chairman Emeritus of the Board of Directors of The Dow Chemical Company, where he previously served in numerous senior management positions, including President, CEO (1995-2000; 2002-2004), Chairman of the Executive Committee (2000-2006), and as a member of the Board of Directors (1990-2006). Currently, Mr. Stavropoulos is Chairman of the Board of Directors of Univar Inc. (global distributor of commodity and specialty chemicals), a Director of Teradata Corporation (data warehousing and technology solutions), and a member of the Advisory Board for Metalmark Capital LLC (private equity investment, 2005-present). Mr. Stavropoulos is an operating advisor to Clayton, Dubilier & Rice, LLC (private equity investment). In addition, Mr. Stavropoulos is a member of the University of Notre Dame Advisory Council for the College of Science, a Trustee of the Rollin L. Gerstacker Foundation, and a Director of Artis-Naples in Naples, Florida. Previously, Mr. Stavropoulos served as Trustee of certain Fidelity® funds (2001-2018) and as a Director of Chemical Financial Corporation (bank holding company, 1993-2012) and Tyco International, Ltd. (multinational manufacturing and services, 2007-2012).
Carol B. Tomé (1957)
Year of Election or Appointment: 2018
Member of the Advisory Board
Ms. Tomé also serves as Member of the Advisory Board of other Fidelity® funds. Ms. Tomé is Chief Financial Officer (2001-present) and Executive Vice President of Corporate Services (2007-present) of The Home Depot, Inc. (home improvement retailer) and a Director (2003-present) and Chair of the Audit Committee (2004-present) of United Parcel Service, Inc. (package delivery and supply chain management). Previously, Ms. Tomé served as Trustee of certain Fidelity® funds (2017), Senior Vice President of Finance and Accounting/Treasurer (2000-2007) and Vice President and Treasurer (1995-2000) of The Home Depot, Inc. and Chair of the Board (2010-2012), Vice Chair of the Board (2009 and 2013), and a Director (2008-2013) of the Federal Reserve Bank of Atlanta. Ms. Tomé is also a director or trustee of many community and professional organizations.
Elizabeth Paige Baumann (1968)
Year of Election or Appointment: 2017
Anti-Money Laundering (AML) Officer
Ms. Baumann also serves as AML Officer of other funds. She is Chief AML Officer (2012-present) and Senior Vice President (2014-present) of FMR LLC (diversified financial services company) and is an employee of Fidelity Investments. Previously, Ms. Baumann served as AML Officer of the funds (2012-2016), and Vice President (2007-2014) and Deputy Anti-Money Laundering Officer (2007-2012) of FMR LLC.
John J. Burke III (1964)
Year of Election or Appointment: 2018
Chief Financial Officer
Mr. Burke also serves as Chief Financial Officer of other funds. Mr. Burke serves as Head of Investment Operations for Fidelity Fund and Investment Operations (2018-present) and is an employee of Fidelity Investments (1998-present). Previously Mr. Burke served as head of Asset Management Investment Operations (2012-2018).
William C. Coffey (1969)
Year of Election or Appointment: 2018
Secretary and Chief Legal Officer (CLO)
Mr. Coffey also serves as Secretary and CLO of other funds. Mr. Coffey serves as CLO, Secretary, and Senior Vice President of Fidelity Management & Research Company and FMR Co., Inc. (investment adviser firms, 2018-present); Secretary of Fidelity SelectCo, LLC and Fidelity Investments Money Management, Inc. (investment adviser firms, 2018-present); and CLO of Fidelity Management & Research (Hong Kong) Limited, FMR Investment Management (UK) Limited, and Fidelity Management & Research (Japan) Limited (investment adviser firms, 2018-present). He is Senior Vice President and Deputy General Counsel of FMR LLC (diversified financial services company, 2010-present), and is an employee of Fidelity Investments. Previously, Mr. Coffey served as Assistant Secretary of certain funds (2009-2018) and as Vice President and Associate General Counsel of FMR LLC (2005-2009).
Timothy M. Cohen (1969)
Year of Election or Appointment: 2018
Vice President
Mr. Cohen also serves as Vice President of other funds. Mr. Cohen serves as Co-Head of Global Equity Research (2016-present), a Director of Fidelity Management & Research (Japan) Limited (investment adviser firm, 2016-present), and is an employee of Fidelity Investments. Previously, Mr. Cohen served as Chief Investment Officer - Equity and a Director of Fidelity Management & Research (U.K.) Inc. (investment adviser firm, 2013-2015) and as a Director of Fidelity Management & Research (Hong Kong) Limited (investment adviser firm, 2017).
Jonathan Davis (1968)
Year of Election or Appointment: 2010
Assistant Treasurer
Mr. Davis also serves as Assistant Treasurer of other funds. Mr. Davis serves as Assistant Treasurer of FMR Capital, Inc. (2017-present) and is an employee of Fidelity Investments. Previously, Mr. Davis served as Vice President and Associate General Counsel of FMR LLC (diversified financial services company, 2003-2010).
Adrien E. Deberghes (1967)
Year of Election or Appointment: 2016
Assistant Treasurer
Mr. Deberghes also serves as an officer of other funds. He serves as Assistant Treasurer of FMR Capital, Inc. (2017-present), Executive Vice President of Fidelity Investments Money Management, Inc. (FIMM) (investment adviser firm, 2016-present), and is an employee of Fidelity Investments (2008-present). Previously, Mr. Deberghes served as President and Treasurer of certain Fidelity® funds (2013-2018). Prior to joining Fidelity Investments, Mr. Deberghes was Senior Vice President of Mutual Fund Administration at State Street Corporation (2007-2008), Senior Director of Mutual Fund Administration at Investors Bank & Trust (2005-2007), and Director of Finance for Dunkin' Brands (2000-2005). Previously, Mr. Deberghes served in other fund officer roles.
Laura M. Del Prato (1964)
Year of Election or Appointment: 2018
Assistant Treasurer
Ms. Del Prato also serves as an officer of other funds. Ms. Del Prato is an employee of Fidelity Investments (2017-present). Prior to joining Fidelity Investments, Ms. Del Prato served as a Managing Director and Treasurer of the JPMorgan Mutual Funds (2014-2017). Prior to JPMorgan, Ms. Del Prato served as a partner at Cohen Fund Audit Services (accounting firm, 2012-2013) and KPMG LLP (accounting firm, 2004-2012).
Colm A. Hogan (1973)
Year of Election or Appointment: 2016
Deputy Treasurer
Mr. Hogan also serves as an officer of other funds. Mr. Hogan serves as Assistant Treasurer of FMR Capital, Inc. (2017-present) and is an employee of Fidelity Investments (2005-present). Previously, Mr. Hogan served as Assistant Treasurer of certain Fidelity® funds (2016-2018).
Pamela R. Holding (1964)
Year of Election or Appointment: 2018
Vice President
Ms. Holding also serves as Vice President of other funds. Ms. Holding serves as Co-Head of Global Equity Research (2018-present) and is an employee of Fidelity Investments (2013-present).
Chris Maher (1972)
Year of Election or Appointment: 2013
Assistant Treasurer
Mr. Maher serves as Assistant Treasurer of other funds. Mr. Maher is Vice President of Valuation Oversight, serves as Assistant Treasurer of FMR Capital, Inc. (2017-present), and is an employee of Fidelity Investments. Previously, Mr. Maher served as Vice President of Asset Management Compliance (2013), Vice President of the Program Management Group of FMR (investment adviser firm, 2010-2013), and Vice President of Valuation Oversight (2008-2010).
Rieco E. Mello (1969)
Year of Election or Appointment: 2017
Assistant Treasurer
Mr. Mello also serves as Assistant Treasurer of other funds. Mr. Mello serves as Assistant Treasurer of FMR Capital, Inc. (2017-present) and is an employee of Fidelity Investments (1995-present).
Kenneth B. Robins (1969)
Year of Election or Appointment: 2016
Chief Compliance Officer
Mr. Robins also serves as an officer of other funds. Mr. Robins serves as Compliance Officer of Fidelity Management & Research Company and FMR Co., Inc. (investment adviser firms, 2016-present) and is an employee of Fidelity Investments (2004-present). Previously, Mr. Robins served as Executive Vice President of Fidelity Investments Money Management, Inc. (investment adviser firm, 2013-2016) and served in other fund officer roles.
Stacie M. Smith (1974)
Year of Election or Appointment: 2016
President and Treasurer
Ms. Smith also serves as an officer of other funds. Ms. Smith serves as Assistant Treasurer of FMR Capital, Inc. (2017-present), is an employee of Fidelity Investments (2009-present), and has served in other fund officer roles. Prior to joining Fidelity Investments, Ms. Smith served as Senior Audit Manager of Ernst & Young LLP (accounting firm, 1996-2009). Previously, Ms. Smith served as Assistant Treasurer (2013-2018) and Deputy Treasurer (2013-2016) of certain Fidelity® funds.
Marc L. Spector (1972)
Year of Election or Appointment: 2016
Assistant Treasurer
Mr. Spector also serves as an officer of other funds. Mr. Spector serves as Assistant Treasurer of FMR Capital, Inc. (2017-present) and is an employee of Fidelity Investments (2016-present). Prior to joining Fidelity Investments, Mr. Spector served as Director at the Siegfried Group (accounting firm, 2013-2016), and prior to Siegfried Group as audit senior manager at Deloitte & Touche (accounting firm, 2005-2013).
Shareholder Expense Example
As a shareholder of the Fund, you incur two types of costs: (1) transaction costs, including sales charges (loads) on purchase payments or redemption proceeds, and (2) ongoing costs, including management fees, distribution and/or service (12b-1) fees and other Fund expenses. This Example is intended to help you understand your ongoing costs (in dollars) of investing in the Fund and to compare these costs with the ongoing costs of investing in other mutual funds.
The Example is based on an investment of $1,000 invested at the beginning of the period and held for the entire period (May 1, 2018 to October 31, 2018).
Actual Expenses
The first line of the accompanying table for each class of the Fund provides information about actual account values and actual expenses. You may use the information in this line, together with the amount you invested, to estimate the expenses that you paid over the period. Simply divide your account value by $1,000.00 (for example, an $8,600 account value divided by $1,000.00 = 8.6), then multiply the result by the number in the first line for a class of the Fund under the heading entitled "Expenses Paid During Period" to estimate the expenses you paid on your account during this period. In addition, the Fund, as a shareholder in the underlying Fidelity Central Funds, will indirectly bear its pro-rata share of the fees and expenses incurred by the underlying Fidelity Central Funds. These fees and expenses are not included in the Fund's annualized expense ratio used to calculate the expense estimate in the table below.
Hypothetical Example for Comparison Purposes
The second line of the accompanying table for each class of the Fund provides information about hypothetical account values and hypothetical expenses based on a Class' actual expense ratio and an assumed rate of return of 5% per year before expenses, which is not the Class' actual return. The hypothetical account values and expenses may not be used to estimate the actual ending account balance or expenses you paid for the period. You may use this information to compare the ongoing costs of investing in the Fund and other funds. To do so, compare this 5% hypothetical example with the 5% hypothetical examples that appear in the shareholder reports of the other funds. In addition, the Fund, as a shareholder in the underlying Fidelity Central Funds, will indirectly bear its pro-rata share of the fees and expenses incurred by the underlying Fidelity Central Funds. These fees and expenses are not included in the Fund's annualized expense ratio used to calculate the expense estimate in the table below.
Please note that the expenses shown in the table are meant to highlight your ongoing costs only and do not reflect any transaction costs. Therefore, the second line of the table is useful in comparing ongoing costs only, and will not help you determine the relative total costs of owning different funds. In addition, if these transactional costs were included, your costs would have been higher.
| Annualized Expense Ratio-A | Beginning Account Value May 1, 2018 | Ending Account Value October 31, 2018 | Expenses Paid During Period-B May 1, 2018 to October 31, 2018 | |
| Class A | 1.08% | |||
| Actual | $1,000.00 | $947.00 | $5.30 | |
| Hypothetical-C | $1,000.00 | $1,019.76 | $5.50 | |
| Class M | 1.35% | |||
| Actual | $1,000.00 | $945.30 | $6.62 | |
| Hypothetical-C | $1,000.00 | $1,018.40 | $6.87 | |
| Class C | 1.89% | |||
| Actual | $1,000.00 | $943.00 | $9.26 | |
| Hypothetical-C | $1,000.00 | $1,015.68 | $9.60 | |
| Class I | .77% | |||
| Actual | $1,000.00 | $948.30 | $3.78 | |
| Hypothetical-C | $1,000.00 | $1,021.32 | $3.92 | |
| Class Z | .68% | |||
| Actual | $1,000.00 | $949.10 | $3.34 | |
| Hypothetical-C | $1,000.00 | $1,021.78 | $3.47 |
A Annualized expense ratio reflects expenses net of applicable fee waivers.
B Expenses are equal to each Class' annualized expense ratio, multiplied by the average account value over the period, multiplied by 184/365 (to reflect the one-half year period).
C 5% return per year before expenses
Distributions (Unaudited)
The Board of Trustees of Fidelity Advisor Value Fund voted to pay to shareholders of record at the opening of business on record date, the following distributions per share derived from capital gains realized from sales of portfolio securities, and dividends derived from net investment income:
| Pay Date | Record Date | Dividends | Capital Gains | |
| Fidelity Advisor Value Fund | ||||
| Class A | 12/10/18 | 12/07/18 | $0.121 | $2.599 |
| Class M | 12/10/18 | 12/07/18 | $0.054 | $2.599 |
| Class C | 12/10/18 | 12/07/18 | $0.000 | $2.513 |
| Class I | 12/10/18 | 12/07/18 | $0.206 | $2.599 |
| Class Z | 12/10/18 | 12/07/18 | $0.244 | $2.599 |
The fund hereby designates as a capital gain dividend with respect to the taxable year ended October 31 2018, $8,815,015, or, if subsequently determined to be different, the net capital gain of such year.
Class A designates 40%; Class M designates 44%; Class C designates 58%; Class I designates 37% and Class Z designates 35% of the dividend distributed during the fiscal year as qualifying for the dividends–received deduction for corporate shareholders.
Class A designates 46% Class M designates 51%; Class C designates 67%; Class I designates 42%; and Class Z designates 40% of the dividend distributed during the fiscal year as amounts which may be taken into account as a dividend for purposes of the maximum rate under section 1(h)(11) of the Internal Revenue Code.
The fund will notify shareholders in January 2019 of amounts for use in preparing 2018 income tax returns.
Board Approval of Investment Advisory Contracts
Fidelity Advisor Value Fund
At its July 2018 meeting, the Board of Trustees, including the Independent Trustees (together, the Board), voted to continue the management contract with Fidelity Management & Research Company (FMR) and the sub-advisory agreements (together, the Advisory Contracts) for the fund for six months through January 31, 2019, in connection with the reunification of the Fidelity Equity High Income Funds Board, which oversees the fund, and the Sector Portfolios Board.
The Board considered that the approval of the fund's Advisory Contracts will not result in any changes in (i) the investment process or strategies employed in the management of the fund's assets; (ii) the fees and expenses paid by shareholders, including the expense cap arrangement currently in place for the fund; (iii) the nature, extent or quality of services provided under the fund's Advisory Contracts; or (iv) the day-to-day management of the fund or the persons primarily responsible for such management. The Board concluded that the fund's Advisory Contracts are fair and reasonable, and that the fund's Advisory Contracts should be renewed, without modification, through January 31, 2019, with the understanding that the Board will consider the annual renewal for a full one year period in January 2019.
In connection with its consideration of future renewals of the fund's Advisory Contracts, the Board will consider: (i) the nature, extent and quality of services provided to the fund, including shareholder and administrative services and investment performance; (ii) the competitiveness of the management fee and total expenses for the fund; (iii) the costs of the services and profitability, including the revenues earned and the expenses incurred in conducting the business of developing, marketing, distributing, managing, administering, and servicing the fund and its shareholders, to the extent applicable, as well as potential fall-out benefits from Fidelity's non-fund businesses; and (iv) whether there have been economies of scale in respect of the Fidelity funds, whether the Fidelity funds (including the fund) have appropriately benefited from any such economies of scale, and whether there is the potential for realization of any further economies.
Based on its evaluation of all of the conclusions noted above, and after considering all factors it believed relevant, the Board ultimately concluded that the fund's management fee structure is fair and reasonable, and that the continuation of the fund's Advisory Contracts should be approved.
![]()
FAV-ANN-1218
1.808899.114
Item 2.
Code of Ethics
As of the end of the period, October 31, 2018, Fidelity Advisor Series I (the trust) has adopted a code of ethics, as defined in Item 2 of Form N-CSR, that applies to its President and Treasurer and its Chief Financial Officer. A copy of the code of ethics is filed as an exhibit to this Form N-CSR.
Item 3.
Audit Committee Financial Expert
The Board of Trustees of the trust has determined that Joseph Mauriello is an audit committee financial expert, as defined in Item 3 of Form N-CSR. Mr. Mauriello is independent for purposes of Item 3 of Form N-CSR.
Item 4.
Principal Accountant Fees and Services
Fees and Services
The following table presents fees billed by Deloitte & Touche LLP, the member firms of Deloitte Touche Tohmatsu, and their respective affiliates (collectively, “Deloitte Entities”) in each of the last two fiscal years for services rendered to Fidelity Advisor Floating Rate High Income Fund, Fidelity Advisor High Income Advantage Fund, Fidelity Advisor High Income Fund and Fidelity Advisor Value Fund (the “Funds”):
Services Billed by Deloitte Entities
October 31, 2018 FeesA
| Audit Fees | Audit-Related Fees | Tax Fees | All Other Fees |
Fidelity Advisor Floating Rate High Income Fund | $82,000 | $200 | $6,300 | $2,700 |
Fidelity Advisor High Income Advantage Fund | $69,000 | $100 | $6,400 | $1,900 |
Fidelity Advisor High Income Fund | $59,000 | $100 | $6,300 | $1,700 |
Fidelity Advisor Value Fund | $47,000 | $100 | $6,400 | $1,300 |
October 31, 2017 FeesA
| Audit Fees | Audit-Related Fees | Tax Fees | All Other Fees |
Fidelity Advisor Floating Rate High Income Fund | $150,000 | $200 | $6,400 | $4,000 |
Fidelity Advisor High Income Advantage Fund | $72,000 | $100 | $6,500 | $1,900 |
Fidelity Advisor High Income Fund | $59,000 | $100 | $6,400 | $1,700 |
Fidelity Advisor Value Fund | $48,000 | $100 | $6,700 | $1,300 |
A Amounts may reflect rounding.
The following table presents fees billed by Deloitte Entities that were required to be approved by the Audit Committee for services that relate directly to the operations and financial reporting of the Funds and that are rendered on behalf of Fidelity Management & Research Company (“FMR”) and entities controlling, controlled by, or under common control with FMR (not including any sub-adviser whose role is primarily portfolio management and is subcontracted with or overseen by another investment adviser) that provide ongoing services to the Funds (“Fund Service Providers”):
Services Billed by Deloitte Entities
| October 31, 2018A | October 31, 2017A |
Audit-Related Fees | $290,000 | $- |
Tax Fees | $5,000 | $25,000 |
All Other Fees | $- | $- |
A Amounts may reflect rounding.
“Audit-Related Fees” represent fees billed for assurance and related services that are reasonably related to the performance of the fund audit or the review of the fund's financial statements and that are not reported under Audit Fees.
“Tax Fees” represent fees billed for tax compliance, tax advice or tax planning that relate directly to the operations and financial reporting of the fund.
“All Other Fees” represent fees billed for services provided to the fund or Fund Service Provider, a significant portion of which are assurance related, that relate directly to the operations and financial reporting of the fund, excluding those services that are reported under Audit Fees, Audit-Related Fees or Tax Fees.
Assurance services must be performed by an independent public accountant.
* * *
The aggregate non-audit fees billed by Deloitte Entities for services rendered to the Funds, FMR (not including any sub-adviser whose role is primarily portfolio
management and is subcontracted with or overseen by another investment adviser), and any Fund Service Provider for each of the last two fiscal years of the Funds are as follows:
Billed By | October 31, 2018A | October 31, 2017A |
Deloitte Entities | $790,000 | $565,000 |
A Amounts may reflect rounding.
The trust's Audit Committee has considered non-audit services that were not pre-approved that were provided by Deloitte Entities to Fund Service Providers to be compatible with maintaining the independence of Deloitte Entities in its audit of the Funds, taking into account representations from Deloitte Entities, in accordance with Public Company Accounting Oversight Board rules, regarding its independence from the Funds and their related entities and FMR’s review of the appropriateness and permissibility under applicable law of such non-audit services prior to their provision to the Fund Service Providers.
Audit Committee Pre-Approval Policies and Procedures
The trust’s Audit Committee must pre-approve all audit and non-audit services provided by a fund’s independent registered public accounting firm relating to the operations or financial reporting of the fund. Prior to the commencement of any audit or non-audit services to a fund, the Audit Committee reviews the services to determine whether they are appropriate and permissible under applicable law.
The Audit Committee has adopted policies and procedures to, among other purposes, provide a framework for the Committee’s consideration of non-audit services by the audit firms that audit the Fidelity funds. The policies and procedures require that any non-audit service provided by a fund audit firm to a Fidelity fund and any non-audit service provided by a fund auditor to a Fund Service Provider that relates directly to the operations and financial reporting of a Fidelity fund (“Covered Service”) are subject to approval by the Audit Committee before such service is provided.
All Covered Services must be approved in advance of provision of the service either: (i) by formal resolution of the Audit Committee, or (ii) by oral or written approval of the service by the Chair of the Audit Committee (or if the Chair is unavailable, such other member of the Audit Committee as may be designated by the Chair to act in the Chair’s absence). The approval contemplated by (ii) above is permitted where the Treasurer determines that action on such an engagement is necessary before the next meeting of the Audit Committee.
Non-audit services provided by a fund audit firm to a Fund Service Provider that do not relate directly to the operations and financial reporting of a Fidelity fund are reported to the Audit Committee periodically.
Non-Audit Services Approved Pursuant to Rule 2-01(c)(7)(i)(C) and (ii) of Regulation S-X (“De Minimis Exception”)
There were no non-audit services approved or required to be approved by the Audit Committee pursuant to the De Minimis Exception during the Funds’ last two fiscal years relating to services provided to (i) the Funds or (ii) any Fund Service Provider that relate directly to the operations and financial reporting of the Funds.
Item 5.
Audit Committee of Listed Registrants
Not applicable.
Item 6.
Investments
(a)
Not applicable.
(b)
Not applicable
Item 7.
Disclosure of Proxy Voting Policies and Procedures for Closed-End Management Investment Companies
Not applicable.
Item 8.
Portfolio Managers of Closed-End Management Investment Companies
Not applicable.
Item 9.
Purchase of Equity Securities by Closed-End Management Investment Company and Affiliated Purchasers
Not applicable.
Item 10.
Submission of Matters to a Vote of Security Holders
There were no material changes to the procedures by which shareholders may recommend nominees to the trust’s Board of Trustees.
Item 11.
Controls and Procedures
(a)(i) The President and Treasurer and the Chief Financial Officer have concluded that the trust’s disclosure controls and procedures (as defined in Rule 30a-3(c) under the Investment Company Act) provide reasonable assurances that material information relating to the trust is made known to them by the appropriate persons, based on their evaluation of these controls and procedures as of a date within 90 days of the filing date of this report.
(a)(ii) There was no change in the trust’s internal control over financial reporting (as defined in Rule 30a-3(d) under the Investment Company Act) that occurred during the period covered by this report that has materially affected, or is reasonably likely to materially affect, the trust’s internal control over financial reporting.
Item 12.
Disclosure of Securities Lending Activities for Closed-End Management
Investment Companies
Not applicable.
Item 13.
Exhibits
(a) | (1) | Code of Ethics pursuant to Item 2 of Form N-CSR is filed and attached hereto as EX-99.CODE ETH. |
(a) | (2) | Certification pursuant to Rule 30a-2(a) under the Investment Company Act of 1940 (17 CFR 270.30a-2(a)) is filed and attached hereto as Exhibit 99.CERT. |
(a) | (3) | Not applicable. |
(b) |
| Certification pursuant to Rule 30a-2(b) under the Investment Company Act of 1940 (17 CFR 270.30a-2(b)) is furnished and attached hereto as Exhibit 99.906CERT. |
SIGNATURES
Pursuant to the requirements of the Securities Exchange Act of 1934 and the Investment Company Act of 1940, the registrant has duly caused this report to be signed on its behalf by the undersigned, thereunto duly authorized.
Fidelity Advisor Series I
By: | /s/Stacie M. Smith |
| Stacie M. Smith |
| President and Treasurer |
|
|
Date: | December 26, 2018 |
Pursuant to the requirements of the Securities Exchange Act of 1934 and the Investment Company Act of 1940, this report has been signed below by the following persons on behalf of the registrant and in the capacities and on the dates indicated.
By: | /s/Stacie M. Smith |
| Stacie M. Smith |
| President and Treasurer |
|
|
Date: | December 26, 2018 |
By: | /s/John J. Burke III |
| John J. Burke III |
| Chief Financial Officer |
|
|
Date: | December 26, 2018 |