QuickLinks -- Click here to rapidly navigate through this document
The Government's Financial Position in 2002-2003
and Public Sector Borrowings
| The government's financial transactions | 1 | |
| Budgetary revenue | 3 | |
| Budgetary expenditure | 6 | |
| Non-budgetary transactions | 7 | |
| Financing | 8 | |
| Borrowings | 9 | |
| Repayment of borrowings | 12 | |
| Total government debt | 12 | |
| Structure of debt | 13 | |
| Public sector borrowings, investments and debt | 14 | |
| Public sector borrowings and investments | 14 | |
| Long-term public sector debt | 17 | |
| Historical data and preliminary results | 19 | |
| Financial transactions of the gouvernement du Québec | ||
| — Summary | 19 | |
| — Budgetary revenue | 20 | |
| — Budgetary expenditure | 21 | |
| — Non-budgetary transactions | 22 | |
| — Financing transactions | 24 | |
| Borrowings for the Consolidated Revenue Fund in 2002-2003 | 25 | |
| Borrowings for the Financing Fund in 2002-2003 | 26 | |
| Borrowings by Financement-Québec in 2002-2003 | 27 | |
| Borrowings by Hydro-Québec in 2002 | 28 |
The government's financial transactions1
The zero deficit forecast announced for the 2002-2003 fiscal year in the Supplementary Statement of March 19, 2002 is maintained.
Consolidated budgetary revenue for fiscal 2002-2003 is revised to $52 820 million, $913 million more than anticipated in the March 2002 Supplementary Statement. This increase in revenue can be explained by the upward adjustment of $647 million in own-source revenue and of $266 million in federal transfers.
Consolidated budgetary expenditure amounts to $52 820 million in 2002-2003, $913 million more than forecast in the Supplementary Statement of March 2002. This growth in expenditure stems from an $827-million increase in operating expenditures and an $86-million rise in debt service.
Consolidated net financial requirements are revised to $1 927 million, an increase of $1 055 million compared with the figure announced in the March 2002 Supplementary Statement. The net financial requirements of consolidated organizations thus amount to $1 627 million and those of the Consolidated Revenue Fund to $300 million.
With respect to financing transactions, the change in direct debt is adjusted upward by $4 035 million compared with the forecast in the Supplementary Statement of March 19, 2002. This increase can be attributed to pre-financing carried out in 2002-2003.
- 1
- The data in this section have been adjusted, for purposes of comparison, on the basis of the 2003-2004 budgetary and financial structure.
1
TABLE 2.1
GOUVERNEMENT DU QUÉBEC
SUMMARY OF CONSOLIDATED FINANCIAL TRANSACTIONS1
(in millions of dollars)
| | 2001-2002 | 2002-2003 | ||||||
|---|---|---|---|---|---|---|---|---|
| | Actual results | Supplementary Statement 2002-03-19 | Preliminary results2 | Change compared with Statement | ||||
| Budgetary transactions | ||||||||
| Own-source revenue | 41 004 | 43 065 | 43 712 | 647 | ||||
| Federal transfers | 9 305 | 8 842 | 9 108 | 266 | ||||
| Total revenue | 50 309 | 51 907 | 52 820 | 913 | ||||
| Operating expenditure | -43 976 | -44 713 | -45 540 | -827 | ||||
| Debt service | -7 261 | -7 194 | -7 280 | -86 | ||||
| Total expenditure | -51 237 | -51 907 | -52 820 | -913 | ||||
| Budgetary reserve | ||||||||
| Use of funds allocated to reserve to finance spending and maintain a balanced budget | 950 | — | — | — | ||||
| Budgetary surplus | 22 | 0 | 0 | 0 | ||||
| Non-budgetary transactions | ||||||||
| Investments, loans and advances | -1 142 | -1 661 | -1 966 | -305 | ||||
| Capital expenditures | -995 | -1 674 | -1 642 | 32 | ||||
| Retirement plans | 2 089 | 1 975 | 1 987 | 12 | ||||
| Other accounts | -589 | 488 | -306 | -794 | ||||
| Non-budgetary requirements | -637 | -872 | -1 927 | -1 055 | ||||
| Net financial requirements | -615 | -872 | -1 927 | -1 055 | ||||
| Financing transactions | ||||||||
| Change in cash position | 132 | 2,044 | -2 043 | -4 087 | ||||
| Change in direct debt3 | 3 623 | 1 593 | 5 628 | 4 035 | ||||
| Retirement plans sinking fund4 | -3 140 | -2 765 | -1 658 | 1 107 | ||||
| Total financing of transactions | 615 | 872 | 1 927 | 1 055 | ||||
Note: A negative entry indicates a financial requirement and a positive entry, a source of financing. For the change in cash position, a negative entry indicates an increase and a positive entry, a decrease.
- 1
- The data have been adjusted, for purposes of comparison, on the basis of the 2003-2004 budgetary and financial structure. The adjustments required with regard to the data presented in the Supplementary Statement of March 19, 2002 stem from the implementation of the family policy regarding subsidized day care spaces in day care centres, which increases both revenue and expenditure by $9 million.
- 2
- The preliminary results for 2002-2003 are based on actual data recorded from April 2002 to January 2003 and on an estimate, as at February 28, 2003, of the February and March results for which transactions will be posted to 2002-2003 transactions up to the closing of the books.
- 3
- The change in direct debt includes new borrowings less repayment of borrowings.
- 4
- This sinking fund receives amounts to be used to cover retirement benefits payable by the government under the public and parapublic sector retirement plans. The income from this fund is accumulated in it and subtracted from the interest expenditure recorded with regard to the retirement plans liability.
2
Budgetary revenue
In regard to budgetary revenue, the Supplement to the 2002-2003 Budget anticipated $43 065 million in own-source revenue and $8 842 million in federal transfers. The forecast for own-source revenue is adjusted upward by $647 million, while that for federal transfers is raised by $266 million.
Own-source revenue
As for own-source revenue, the supplementary revenue expected from consumption taxes and government enterprises is partly offset by lower revenue from other sources, particularly corporate taxes.
TABLE 2.2
SUMMARY OF THE CHANGE IN OWN-SOURCE REVENUE
(in millions of dollars)
| | 2001-2002 | 2002-2003 | ||||||||
|---|---|---|---|---|---|---|---|---|---|---|
| | Actual results | Supplementary Statement 2002-03-19 | Preliminary results | Change compared with Statement | Change compared with 2001-2002 | |||||
| | | | | | % | |||||
| Personal income tax | 15 923 | 16 342 | 16 207 | -135 | 1.8 | |||||
| Health Services Fund | 4 291 | 4 594 | 4 496 | -98 | 4.8 | |||||
| Corporate taxes | 4 029 | 4 350 | 3 681 | -669 | -8.6 | |||||
| Consumption taxes | 9 745 | 10 290 | 11 100 | 810 | 1 | 13.9 | ||||
| Other sources | 2 345 | 2 389 | 2 339 | -50 | -0.3 | |||||
| Government enterprises | 2 731 | 3 215 | 3 817 | 602 | 39.8 | |||||
| Consolidated organizations | 1 940 | 1 885 | 2 072 | 187 | 6.8 | |||||
| Total own-source revenue | 41 004 | 43 065 | 43 712 | 647 | 6.6 | |||||
- 1
- Including $185 million for the increase in the tax on tobacco products announced last June 17.
The preliminary results for personal income tax indicate that revenue is down by $135 million compared with the figure announced in the Supplement to the 2002-2003 Budget. Compilation of 2001 income tax returns since the beginning of the year shows higher-than-anticipated refunds, owing mainly to the decline of over 40% in reported capital gains. This marked drop in capital gains has also led to a decrease in the tax instalments of taxpayers who sustained such losses, and the shortfall has been only partly offset by the supplementary tax receipts generated by the higher-than-expected employment level. Indeed, the increase in revenue stemming from job creation since the beginning of the year is limited, given that a larger proportion of new jobs are part-time (less than 25 hours per week) compared with those created in previous years. Furthermore, many of the new jobs have been created in small and medium-sized enterprises and the trade sector, where remuneration is lower on average. As for the $98-million decline in contributions to the Health Services Fund, it can be explained for the most part by adjustments to revenue for previous years.
Corporate tax revenue is revised downward by $669 million, primarily because of several factors relating to the 2001 taxation year. On account of a downturn in profits in 2001, particularly in the information technology sector, businesses claimed large refunds in 2002-2003 for instalment overpayments in fiscal 2001-2002. Moreover, in accordance with the provisions of the corporate tax system, losses sustained in a given year can be applied against income tax paid over the three previous
3
years or the seven subsequent years. Use of these provisions by businesses that incurred losses led to additional refunds in 2002-2003. Businesses also reduced their tax instalments for 2002, since the latter were based henceforth on their lower 2001 profits.
Additional revenue of $810 million from consumption taxes stems mainly from a $609-million adjustment of the sales tax resulting from the vitality of consumer spending. In addition, revenue from the tobacco tax rose by $191 million, primarily because of the increase in the specific tax rate announced last June 17.
The $50-million decrease in other sources can be attributed especially to lower revenue from natural resources. Such revenue is adjusted downward by $38 million, chiefly with regard to stumpage fees, owing to the impact of the countervailing duties imposed on softwood lumber exports to the United States. In addition, the unusually high number of forest fires in summer 2002 generated supplementary expenditures, thereby reducing net fees. The other adjustments are due to, among other things, interest income and sales of goods and services.
The forecast for revenue from government enterprises is revised to $3 817 million, an increase of $602 million.
This adjustment can be attributed notably to Hydro-Québec's profits, which were revised upward by $470 million, mostly because of an increase in electricity sales and favourable interest rates.
The adjustment can also be explained by the $680 million in revenue resulting from the passage of the Act to amend the Act respecting occupational health and safety and other legislative provisions on December 19, 2002. Through this Act, the government complied with the request of the Commission de la santé et de la sécurité du travail (CSST) for greater autonomy in managing its resources. The activities of the CSST were thus transferred to a trust, the Fonds de la santé et de la sécurité du travail. Since trusts are excluded from the reporting entity, the government had to remove its investment in the CSST from its books.
These increases were offset, however, by downward adjustments of revenue from other enterprises, particularly the Société générale de financement du Québec, resulting from the loss of $255 million related to some of its investments, including Magnola.
Federal transfers
Federal transfers should amount to $9 108 million for fiscal 2002-2003, an increase of $266 million compared with the forecast in the March 2002 Supplementary Statement.
4
TABLE 2.3
SUMMARY OF THE CHANGE IN FEDERAL TRANSFERS
(in millions of dollars)
| | 2001-2002 | 2002-2003 | ||||||||
|---|---|---|---|---|---|---|---|---|---|---|
| | Actual results | Supplementary Statement 2002-03-19 | Preliminary results | Change compared with Statement | Change compared with 2001-2002 | |||||
| | | | | | % | |||||
| Equalization | 5 336 | 5 339 | 5 315 | -24 | -0.4 | |||||
| Canada Health and Social Transfer (CHST) | 2 958 | 2 455 | 2 727 | 272 | -7.8 | |||||
| Other transfers related to fiscal arrangements | 27 | 15 | 34 | 19 | 25.9 | |||||
| Other programs | 564 | 655 | 644 | -11 | 14.2 | |||||
| Consolidated organizations | 420 | 378 | 388 | 10 | -7.6 | |||||
| Total federal transfers | 9 305 | 8 842 | 9 108 | 266 | -2.1 | |||||
Equalization revenue is $24 million lower than forecast in the Supplementary Statement of last March. This revision is due almost entirely to the negative impact on equalization of the solution adopted by the federal government to correct the error made by Canada Customs and Revenue Agency (CCRA).
The upward revision of $272 million with respect to the Canada Health and Social Transfer (CHST) reflects essentially the downward adjustment of the tax transfer used to calculate the distribution of the program's envelope, which increases cash transfers to Québec accordingly.
Correction of the error made by Canada Customs and Revenue Agency
From 1972 to 1999, Canada Customs and Revenue Agency (CCRA) made overpayments of more than $3.4 billion to four provinces in particular (Ontario, Manitoba, British Columbia and Alberta) in regard to personal income tax. On last September 4, the federal government announced, as part of a solution to the error, a change in the equalization formula retroactive to 2001-2002, which increased Québec's relative fiscal capacity and thus reduced its equalization entitlements.
The negative impact of the federal solution to CCRA's error on Québec's equalization entitlements, originally estimated at $479 million in the Quarterly Presentation of Financial Transactions as at June 30, 2002, was reduced to $426 million in federal calculations of February 2003. As a result of pressure from Québec, the federal government decided to accelerate the updating of data used to calculate equalization entitlements with respect to the personal income tax base for 2002. This limited the impact of the correction of CCRA's error to $247 million in 2002-2003.
The portion of this impact applicable to 2001-2002, or $215 million, will be posted to the debt representing accumulated deficits since it stems from the correction of an error relating to the previous year.
5
TABLE 2.4
IMPACT OF THE FEDERAL SOLUTION TO THE ERROR MADE BY
CANADA CUSTOMS AND REVENUE AGENCY
(in millions de dollars)
| | 2002-2003 | ||
|---|---|---|---|
| Quarterly Presentation of Financial Transactions as at June 30, 2002 | -479 | ||
| Federal calculations of February 2003 | -426 | ||
| Acceleration of the updating of data used by the federal government for 2002 | 179 | ||
| Impact of the correction of CCRA's error on Québec's financial framework | -247 | ||
| Breakdown: | |||
| Increase in the debt representing accumulated deficits stemming from the correction applicable to 2001-2002 | -215 | ||
| Decrease in equalization revenue stemming from the correction applicable to 2002-2003 | -32 | ||
Budgetary expenditure
The forecast for budgetary expenditure is revised to $52 820 million for fiscal 2002-2003, $913 million more than forecast in the Supplementary Statement of March 19, 2002. In all, there is a 3.1% increase in budgetary expenditure compared with 2001-2002.
TABLE 2.5
SUMMARY OF THE CHANGE IN BUDGETARY EXPENDITURE
(in millions of dollars)
| | 2001-2002 | 2002-2003 | ||||||||||
|---|---|---|---|---|---|---|---|---|---|---|---|---|
| | Actual results | Supplementary Statement 2002-03-19 | Preliminary results | Change compared with Statement | Change compared with 2001-2002 | |||||||
| | | | | | % | |||||||
| Program spending objective | 42 512 | 43 223 | 43 223 | — | 1.7 | |||||||
| Increase in objective | — | — | 881 | 881 | — | |||||||
| Program spending | 42 512 | 43 223 | 44 104 | 881 | 3.7 | |||||||
| Consolidated organizations | 1 464 | 1 490 | 1 436 | -54 | -1.9 | |||||||
| Total operating expenditure | 43 976 | 44 713 | 45 540 | 827 | 3.6 | |||||||
| Debt service | ||||||||||||
| Consolidated Revenue Fund | ||||||||||||
| Direct debt service | 3 970 | 3 829 | 3 927 | 98 | -1.1 | |||||||
| Retirement plans | 2 717 | 2 668 | 2 706 | 38 | -0.4 | |||||||
| 6 687 | 6 497 | 6 633 | 136 | -0.8 | ||||||||
| Consolidated organizations | 574 | 697 | 647 | -50 | 12.7 | |||||||
| Total debt service | 7 261 | 7 194 | 7 280 | 86 | 0.3 | |||||||
| Total budgetary expenditure | 51 237 | 51 907 | 52 820 | 913 | 3.1 | |||||||
6
Operating expenditure
Operating expenditure is revised to $45 540 million, $827 million more than anticipated in the Supplementary Statement of March 19, 2002.
This Budget announces an $881-million increase in the program spending objective in 2002-2003. This increase results from, among other things, additional expenditures of $285 million in the health and social services sector, including notably $69 million for improving services in the network and $144 million for the prescription drug insurance program. It is also due to an overrun of $140 million at the ministère de l'Emploi et Solidarité sociale engendered by the lower-than-anticipated decrease in the number of households on employment assistance and a $35-million increase at the ministère des Relations avec les citoyens et de l'Immigration mainly for the Duplessis orphans reconciliation program.
Spending by consolidated organizations is revised downward by $54 million compared with the March 2002 Supplementary Statement.
Debt service
Debt service is revised upward by $86 million compared with the forecast in the Supplementary Statement of March 19, 2002. It currently amounts to $7 280 million, of which $3 927 million is for direct debt service, $2 706 million for the interest on the net retirement plans liability and $647 million for the debt service of consolidated organizations.
This adjustment is due notably to the weaker-than-anticipated Canadian dollar, especially in relation to the Swiss franc and the yen, and to the upward revision of net financial requirements.
Non-budgetary transactions
Financial requirements stemming from non-budgetary transactions amount to $1 927 million, $1 055 million more than forecast in the March 2002 Supplementary Statement.
TABLE 2.6
SUMMARY OF NON-BUDGETARY TRANSACTIONS
(in millions of dollars)
| | 2002-2003 | ||||||
|---|---|---|---|---|---|---|---|
| | Supplementary Statement 2002-03-19 | Preliminary results | Change | ||||
| Consolidated Revenue Fund | |||||||
| Investments, loans and advances | |||||||
| Government enterprises | -1 503 | -1 653 | -150 | ||||
| Municipalities, municipal bodies, individuals, corporations and others | -230 | -207 | 23 | ||||
| -1 733 | -1 860 | -127 | |||||
| Capital expenditures | -52 | -53 | -1 | ||||
| Retirement plans | 1 975 | 1 987 | 12 | ||||
| Other accounts | 386 | 3 | -383 | ||||
| Total Consolidated Revenue Fund | 576 | 77 | -499 | ||||
| Consolidated organizations | -1 448 | -2 004 | -556 | ||||
| Non-budgetary requirements | -872 | -1 927 | -1 055 | ||||
Note: A negative entry indicates a financial requirement and a positive entry, a source of financing.
7
The preliminary results for investments, loans and advances in government enterprises indicate a $127-million increase in funding requirements compared with the initial forecasts. This difference can be attributed to a rise in the value of government investments engendered by the higher profits of these enterprises, particularly Hydro-Québec, which is partly offset by a decline in investments in their capital stock.
The annual change in the retirement plans liability, estimated at $1 975 million in the Supplementary Statement, has been revised upward by $12 million, to $1 987 million. This change can be attributed to the $74-million rise in contributions by the government as employer, which is offset by the $62-million increase in benefits paid.
Transactions related to other non-budgetary accounts represent year-to-year changes in these financial items. These accounts, which include, in particular, cash and bills on hand, outstanding cheques, accounts receivable and accounts payable, can fluctuate a great deal because of the variability of government cash inflow and disbursements. For 2002-2003, the balance of the other accounts shows a decrease of $383 million compared with the figure announced in the Supplementary Statement of March 19, 2002.
Financing
Preliminary results show that the change in direct debt should amount to $5 628 million, $4 035 million more than anticipated in the Supplementary Statement of March 19, 2002. Borrowings in fiscal 2002-2003 will amount to $10 453 million ($8 614 million for the Consolidated Revenue Fund and $1 839 million for consolidated organizations), $4 705 million more than forecast. It should be noted that the Consolidated Revenue Fund obtained pre-financing of $4 053 million.
TABLE 2.7
SUMMARY OF CONSOLIDATED FINANCING TRANSACTIONS
(in millions of dollars)
| | 2002-2003 | ||||||
|---|---|---|---|---|---|---|---|
| | Supplementary Statement 2002-03-19 | Preliminary results | Change | ||||
| Change in cash position | |||||||
| Consolidated Revenue Fund | 1 178 | -2 899 | -4 077 | ||||
| Consolidated organizations | 866 | 856 | -10 | ||||
| Total change in cash position | 2 044 | -2 043 | -4 087 | ||||
| Change in direct debt | |||||||
| Consolidated Revenue Fund | |||||||
| New borrowings | 3 998 | 8 614 | 4 616 | ||||
| Repayment of borrowings | -2 911 | -3 757 | -846 | ||||
| 1 087 | 4 857 | 3 770 | |||||
| Consolidated organizations | |||||||
| New borrowings | 1 750 | 1 839 | 89 | ||||
| Repayment of borrowings | -1 244 | -1 068 | 176 | ||||
| 506 | 771 | 265 | |||||
| Total change in direct debt | 1 593 | 5 628 | 4 035 | ||||
| Retirement plans sinking fund | -2 765 | -1 658 | 1 107 | ||||
| Total financing of transactions | 872 | 1 927 | 1 055 | ||||
| Note: | A negative entry indicates a financial requirement and a positive entry, a source of financing. For the change in cash position, a negative entry indicates an increase and a positive entry, a decrease. |
8
Financing of the Consolidated Revenue Fund
Preliminary results show that the change in the direct debt of the Consolidated Revenue Fund should amount to $4 857 million, an increase of $3 770 million compared with the figure announced in the Supplementary Statement of March 19, 2002. Borrowings in 2002-2003 will amount to $8 614 million, $4 616 million more than expected, mainly on account of pre-financing estimated at $4 053 million. This level of pre-financing will make it possible to cover financial requirements for the next fiscal year.
Owing to pre-financing, the cash level will rise by $2 899 million, although a $1 178-million decrease was forecast.
Financing of consolidated organizations
The change in the direct debt of consolidated organizations should amount to $771 million, $265 million more than anticipated.
Borrowings
In all, the government contracted borrowings of $10 616 million in 2002-2003, of which $8 614 million was for Consolidated Revenue Fund needs and $2 002 million for the Financing Fund. The borrowings of the Financing Fund are used to meet the financial requirements of consolidated organizations ($1 839 million) and certain government enterprises ($163 million).
In all, 73% of the financing program, or $7 764 million, was conducted in Canadian dollars. In regard to the main financial instruments used, the government carried out six public bond issues on the Canadian domestic market for a total of $3 038 million, and real return issues for a total of $833 million. In addition, two public issues in Canadian dollars were made on the European market for $300 million, and private-contract financing worth $638 million was carried out with the Caisse de dépôt et placement du Québec. Lastly, savings products sold by Épargne Placements Québec should provide the government with $557 million in financing.
Borrowings totalling $2 852 million, or 27% of the financing program, were obtained in foreign currency as part of the government's financing sources diversification strategy. Two public bond issues and one private issue were made in foreign currency in 2002-2003. A global bond issue in US dollars for US$750 million (CAN$1 148 million) was carried out in July 2002. As well, a private issue for US$50 million (CAN$76 million) and a public bond issue for 1 billion euros (CAN$1 628 million) on the euro market were carried out in February 2003.
9
TABLE 2.8
SUMMARY OF BORROWINGS IN 2002-2003
(in millions of dollars)
| Currency | Consolidated Revenue Fund | Consolidated organizations | Government enterprises | Total | |||||||
|---|---|---|---|---|---|---|---|---|---|---|---|
| % | |||||||||||
| Canadian dollar | |||||||||||
| Public issues | |||||||||||
| Negotiable bonds | 2 025 | 1 013 | — | 3 038 | 39.1 | ||||||
| Real return bonds | 833 | — | — | 833 | 10.7 | ||||||
| Medium-term notes | |||||||||||
| On the Canadian market | 853 | — | — | 853 | 11.0 | ||||||
| On the European market | 200 | 100 | — | 300 | 3.8 | ||||||
| Private issues | |||||||||||
| Caisse de dépôt et placement du Québec | 149 | 326 | 163 | 638 | 8.2 | ||||||
| Canada Pension Plan Investment Fund | 5 | — | — | 5 | 0.1 | ||||||
| Savings products | 557 | — | — | 557 | 7.2 | ||||||
| Immigrant Investor Program | 271 | — | — | 271 | 3.5 | ||||||
| Change in Treasury bills outstanding | 323 | — | — | 323 | 4.2 | ||||||
| Change in debt resulting from currency swaps | 946 | — | — | 946 | 12.2 | ||||||
| Sub-total | 6 162 | 1 439 | 163 | 7 764 | 73.1 | ||||||
| US dollar | |||||||||||
| Public issue | |||||||||||
| Negotiable bonds | 748 | 1 | 400 | 1 | — | 1 148 | 93.8 | ||||
| Private issue | 76 | — | — | 76 | 6.2 | ||||||
| Sub-total | 824 | 400 | — | 1,224 | 11.5 | ||||||
| Euro | |||||||||||
| Public issue | 1 628 | — | — | 1,628 | 100.0 | ||||||
| Sub-total | 1 628 | — | — | 1 628 | 15.4 | ||||||
| Total | 8 614 | 1 839 | 163 | 10 616 | 100.0 | ||||||
- 1
- The original borrowing was for US$750 million (CAN$1 148 million). An amount of CAN$400 million derived from this borrowing was advanced to the Financing Fund in order to be loaned to consolidated organizations.
10
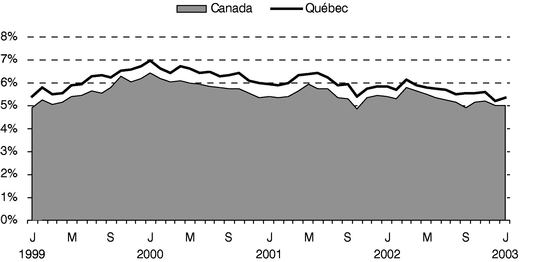
YIELD ON LONG-TERM (10-YEAR) SECURITIES
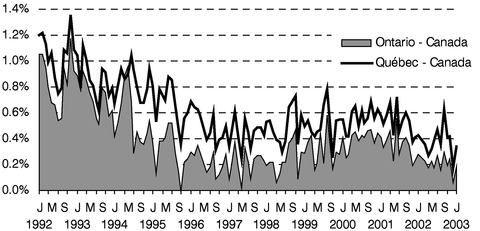
YIELD SPREAD ON LONG-TERM (10-YEAR) SECURITIES
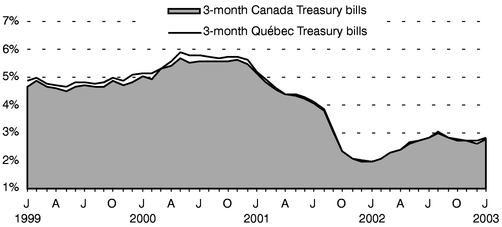
YIELD ON SHORT-TERM SECURITIES
11
Repayment of borrowings
Preliminary results show that the repayment of borrowings of the Consolidated Revenue Fund and consolidated organizations for fiscal 2002-2003 amounts to $4 825 million, $670 million more than forecast in the Supplementary Statement of March 19, 2002.
Repayment of borrowings of the Consolidated Revenue Fund
The repayment of borrowings of the Consolidated Revenue Fund for fiscal 2002-2003 amounts to $3 757 million, $846 million more than anticipated. This increase is explained by, among other things, the additional revenue in the sinking fund for government borrowings, which is recorded as a repayment, and the exercise of a call option on bonds in yen.
Repayment of borrowings of consolidated organizations
The repayment of borrowings of consolidated organizations amounts to $1 068 million in 2002-2003, a decrease of $176 million compared with the figure anticipated.
Total government debt
The government's total debt consists of the consolidated direct debt and the net retirement plans liability. The consolidated direct debt is the sum of the direct debt of the Consolidated Revenue Fund and the debt of consolidated organizations. As for the net retirement plans liability, it consists of the retirement plans liability minus the balance of the retirement plans sinking fund (RPSF), an asset that may eventually be used to pay the retirement benefits of public and parapublic sector employees.
The government's consolidated direct debt should amount to $74 390 million as at March 31, 2003, or $68 932 million as direct debt of the Consolidated Revenue Fund and $5 458 million as debt of the consolidated organizations.
It should be noted that an amount of $4 053 million included in the consolidated direct debt represents pre-financing in 2002-2003 that will be used to cover part of the borrowings to be made in 2003-2004.
The net retirement plans liability should total $38 389 million as at March 31, 2003 and consists of $50 246 million as the retirement plans liability minus the value of the RPSF, or $11 857 million.
Excluding pre-financing, the government's total debt should thus be $108 726 million as at March 31, 2003.
TABLE 2.9
TOTAL ANTICIPATED GOVERNMENT DEBT AS AT MARCH 31, 2003
(in millions of dollars)
| | Consolidated direct debt | | | |||||||
|---|---|---|---|---|---|---|---|---|---|---|
| | Consolidated Revenue Fund | Consolidated organizations | Total | Net retirement plans liability | Total debt | |||||
| Anticipated debt as at March 31, 2003 | 68 932 | 5 458 | 74 390 | 50 246 | 124 636 | |||||
| Retirement plans sinking fund | — | — | — | -11 857 | -11 857 | |||||
| Sub-total | 68 932 | 5 458 | 74 390 | 38 389 | 112 779 | |||||
| Pre-financing | -4 053 | — | -4 053 | — | -4 053 | |||||
| Total | 64 879 | 5 458 | 70 337 | 38 389 | 108 726 | |||||
Note: The debt in foreign currency is expressed in the Canadian equivalent based on the exchange rates in effect on February 28, 2003.
12
Structure of debt
As at March 31, 2003, the proportion of the direct debt of the Consolidated Revenue Fund in Canadian dollars should amount to 80.1% and the proportion in foreign currency, 19.9%. In addition, as at March 31, 2003, the share at fixed interest rates and the share at variable interest rates should be 67.6% and 32.4% respectively.
ANTICIPATED STRUCTURE OF THE DIRECT DEBT OF THE CONSOLIDATED REVENUE
FUND AS AT MARCH 31, 20031
| | | |
|---|---|---|
BY CURRENCY | BY INTEREST RATE | |
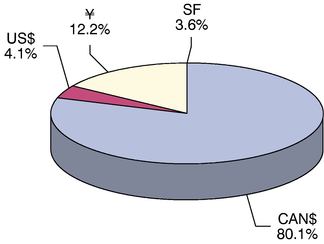 | 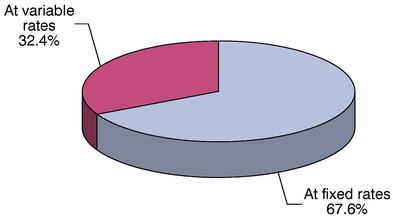 |
- 1
- As at March 31, 2003, the proportion of managed debt (direct debt of the Consolidated Revenue Fund and that incurred to make advances to the Financing Fund) in Canadian dollars should amount to 83.0% and the proportion at fixed rates, 71.1%.
Including the debt of consolidated organizations and the net retirement plans liability, the proportion of the total debt in Canadian dollars should amount to 87.7% and that in foreign currency, 12.3% as at March 31, 2003.
TABLE 2.10
ANTICIPATED STRUCTURE OF THE TOTAL DEBT AS AT MARCH 31, 2003
(in millions of dollars)
| | Consolidated direct debt | | | | ||||||||||||
|---|---|---|---|---|---|---|---|---|---|---|---|---|---|---|---|---|
| | Net retirement plans liability | | | |||||||||||||
| Currency | Consolidated Revenue Fund | % | Consolidated organizations | Total | % | Total debt | % | |||||||||
| Canadian dollar | 55 219 | 80.1 | 5 343 | 60 562 | 81.4 | 38 389 | 98 951 | 87.7 | ||||||||
| US dollar | 2 805 | 4.1 | 115 | 2 920 | 3.9 | — | 2 920 | 2.6 | ||||||||
| Yen | 8 391 | 12.2 | — | 8 391 | 11.3 | — | 8 391 | 7.5 | ||||||||
| Swiss franc | 2 517 | 3.6 | — | 2 517 | 3.4 | — | 2 517 | 2.2 | ||||||||
| Sub-total | 68 932 | 100.0 | 5 458 | 74 390 | 100.0 | 38 389 | 112 779 | 100.0 | ||||||||
| Pre-financing | -4 053 | — | -4 053 | — | -4 053 | |||||||||||
| Total | 64 879 | 5 458 | 70 337 | 38 389 | 108 726 | |||||||||||
Note: The debt in foreign currency is expressed in the Canadian equivalent based on the exchange rates in effect on February 28, 2003.
13
PUBLIC SECTOR BORROWINGS, INVESTMENTS AND DEBT
Public sector borrowings and investments
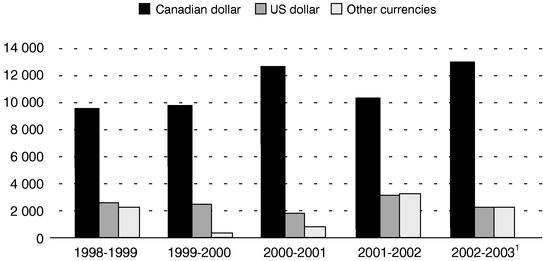
The preliminary results for 2002-2003 show that gross long-term public sector borrowings should amount to $17 176 million.
Gross borrowings in Canadian dollars should total $12 989 million, or 75.6% of total borrowings by the public sector. Gross borrowings in US dollars should reach $2 109 million, or 12.3% of the total, while those in other currencies should amount to $2 078 million, or 12.1% of public sector borrowings as a whole.
TABLE 2.11
NET LONG-TERM PUBLIC SECTOR BORROWINGS
(in millions of dollars)
| | 1998-1999 | 1999-2000 | 2000-2001 | 2001-2002 | 2002-20031 | ||||||
|---|---|---|---|---|---|---|---|---|---|---|---|
| Gross borrowings | |||||||||||
| Government2 | 8 670 | 5 644 | 8 224 | 8 438 | 9 162 | ||||||
| Educational institutions | 341 | 1 366 | 1 540 | 1 179 | 2 043 | ||||||
| Health and social services institutions | 80 | 66 | 528 | 429 | 1 143 | ||||||
| Hydro-Québec3 | 1 961 | 2 212 | 2 124 | 3 388 | 1 923 | ||||||
| Other government enterprises | 500 | 488 | 16 | 274 | 171 | ||||||
| Municipalities and municipal bodies | 2 409 | 2 594 | 2 488 | 2 595 | 2 734 | ||||||
| Total gross borrowings | 13 961 | 12 370 | 14 920 | 16 303 | 17 176 | ||||||
| Repayment of borrowings | 11 362 | 12 473 | 13 103 | 12 956 | 10 934 | ||||||
| Sub-total | 2 599 | -103 | 1 817 | 3 347 | 6 242 | ||||||
| Pre-financing | |||||||||||
| for the current year | -2 831 | -506 | -1 475 | -1 154 | -4 053 | ||||||
| for the previous year | — | 2 831 | 506 | 1 475 | 1 154 | ||||||
| Net long-term borrowings | -232 | 2 222 | 848 | 3 668 | 3 343 | ||||||
- 1
- Preliminary results.
- 2
- Amounts borrowed to cover the requirements of the Consolidated Revenue Fund and consolidated organizations, excluding net amounts received under interest rate and currency swap agreements, which explains the difference between this list and the list of borrowings given later in this text. These amounts also exclude borrowings made to cover the requirements of certain government enterprises and Financement-Québec, which are distributed among the organizations and networks for which they are intended.
- 3
- Amounts borrowed as at December 31 of each year.
When pre-financing is considered in relation to the years to which it applies, net long-term public sector borrowings are estimated at $3 343 million in 2002-2003, a decrease of $325 million compared with the previous year. Consequently, the ratio of net long-term borrowings to gross domestic product should fall from 1.60% of GDP in 2001-2002 to 1.39% in 2002-2003.
14
GROSS PUBLIC SECTOR BORROWINGS BY CURRENCY
(in millions of dollars)
- 1
- Preliminary results.
NET LONG-TERM PUBLIC SECTOR BORROWINGS1
(as a percentage of GDP)
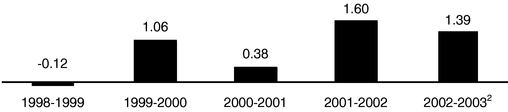
- 1
- Adjusted by pre-financing.
- 2
- Preliminary results.
In 2002-2003, public sector investments should amount to $8 969 million, $1 487 million more than the previous year. This increase can be attributed mainly to the implementation of the public sector investment acceleration plan announced in the 2002-2003 Budget and to investments under Hydro-Québec's development plan.
15
TABLE 2.12
PUBLIC SECTOR INVESTMENTS
(in millions of dollars)
| | 1998-1999 | 1999-2000 | 2000-2001 | 2001-2002 | 2002-20031 | |||||
|---|---|---|---|---|---|---|---|---|---|---|
| Government2 | 1 037 | 1 085 | 1 448 | 1 614 | 2 052 | |||||
| Educational institutions3 | 639 | 702 | 691 | 710 | 800 | |||||
| Health and social services institutions3 | 628 | 615 | 699 | 706 | 841 | |||||
| Hydro-Québec4 | 1 986 | 1 457 | 1 632 | 1 660 | 1 976 | |||||
| Other government enterprises5 | 341 | 376 | 666 | 934 | 970 | |||||
| Municipalities and municipal bodies6 | 1 941 | 1 703 | 1 601 | 1 858 | 2 330 | |||||
| Total | 6 572 | 5 938 | 6 737 | 7 482 | 8 969 | |||||
| | | |
|---|---|---|
| 1 | Preliminary results. | |
2 | Government investments include its capital expenditures as well as grants and loans for investments made available to economic agents outside the public sector. Financial investments in other components of the public sector are therefore excluded. Government investments include those of consolidated organizations. | |
Sources: Public accounts of the gouvernement du Québec, Secrétariat du Conseil du trésor and ministère des Finances, de l'Économie et de la Recherche. | ||
3 | Investments by school boards, colleges, universities and health and social services institutions include the share paid by the government and that paid by the institutions themselves. It should be noted that the share paid by the government is financed by subsidies for debt service. | |
Sources: Secrétariat du Conseil du trésor and ministère des Finances, de l'Économie et de la Recherche. | ||
4 | Investments by Hydro-Québec are shown on a calendar-year basis. They exclude financial investments and commercial programs. | |
Sources: Hydro-Québec et ministère des Finances, de l'Économie et de la Recherche. | ||
5 | Investments by government enterprises correspond to the increase in long-term assets. They exclude consolidated organizations and the Société québécoise d'assainissement des eaux, whose investments are included under "government" and "municipalities and municipal bodies" respectively. | |
Sources: Financial statements of the enterprises of the gouvernement du Québec and ministère des Finances, de l'Économie et de la Recherche. | ||
6 | Investments by municipalities and municipal bodies include those related to water purification, public transportation and cultural and community facilities, as well as other municipal investments. | |
Sources: Secrétariat du Conseil du trésor, ministère des Affaires municipales et de la Métropole and ministère des Finances, de l'Économie et de la Recherche. |
The following table presents a comparative analysis of borrowings and investments by the public sector as a whole. Total net public sector borrowings include the change in the government's net retirement plans liability. Total net public sector borrowings are lower than public sector investments. In 2002-2003, the ratio of net borrowings to investments should be 0.41.
16
TABLE 2.13
TOTAL NET BORROWINGS AND INVESTMENTS BY THE PUBLIC SECTOR
(in millions of dollars)
| | 1998-1999 | 1999-2000 | 2000-2001 | 2001-2002 | 2002-20031 | |||||
|---|---|---|---|---|---|---|---|---|---|---|
| Net long-term borrowings | -232 | 2 222 | 848 | 3 668 | 3 343 | |||||
| Change in the government's net retirement plans liability2 | -10 | -1 091 | -226 | -1 051 | 329 | |||||
| Total net borrowings | -242 | 1 131 | 622 | 2 617 | 3 672 | |||||
| Investments | 6 572 | 5 938 | 6 737 | 7 482 | 8 969 | |||||
| Ratio | -0.04 | 0.19 | 0.09 | 0.35 | 0.41 | |||||
- 1
- Preliminary results.
- 2
- This amount takes into account deposits made in the retirement plans sinking fund and the income of this fund.
TOTAL NET BORROWINGS1 AND INVESTMENTS BY THE PUBLIC SECTOR
(in millions of dollars)
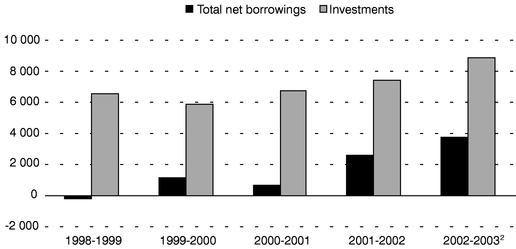
- 1
- Adjusted by pre-financing.
- 2
- Preliminary results.
Long-term public sector debt
The following table presents the change in long-term public sector debt, which includes the government's total debt as well as the debts of the networks, Hydro-Québec, the municipalities and other government enterprises. In many cases, this debt has served to finance public infrastructures, such as roads, schools, hospitals, hydroelectric dams and water purification plants.
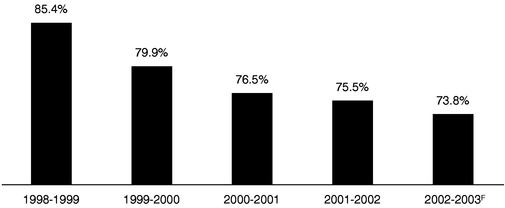
As at March 31, 2003, the public sector debt should amount to $177 327 million. Over the past five years, the ratio of public sector debt as a percentage of gross domestic product fell considerably, from 85.4% to 73.8%.
17
TABLE 2.14
LONG-TERM PUBLIC SECTOR DEBT1
(in millions of dollars)
| | As at March 31 | |||||||||
|---|---|---|---|---|---|---|---|---|---|---|
| | 1999 | 2000 | 2001 | 2002 | 2003F | |||||
| Total government debt2 | 99 572 | 100 546 | 102 741 | 105 172 | 108 726 | |||||
| Health and social services and education networks | 7 582 | 7 645 | 8 787 | 9 588 | 10 971 | |||||
| Hydro-Québec | 38 414 | 38 135 | 38 979 | 37 893 | 37 077 | |||||
| Other government enterprises | 4 772 | 4 445 | 4 345 | 3 906 | 3 845 | |||||
| Municipalities and municipal bodies3 | 17 236 | 17 211 | 16 699 | 16 777 | 16 708 | |||||
| Total | 167 576 | 167 982 | 171 551 | 173 336 | 177 327 | |||||
- F:
- Forecast.
- 1
- Including Treasury bills outstanding of the Consolidated Revenue Fund and the Financing Fund. As at March 31, 2003, Treasury bills outstanding are expected to amount to $2 109 million for the Consolidated Revenue Fund and $1 196 million for the Financing Fund. The Treasury bills of the Financing Fund are used to meet the long-term financial requirements of consolidated organizations, the Société québécoise d'assainissement des eaux and certain government enterprises.
- 2
- Consolidated direct debt and net retirement plans liability, excluding pre-financing totalling $2 831 million in 1998-1999, $506 million in 1999-2000, $1 475 million in 2000-2001 and $1 154 million in 2001-2002 and that will total $4 053 million in 2002-2003.
- 3
- Including the long-term debt of the Société québécoise d'assainissement des eaux.
LONG-TERM PUBLIC SECTOR DEBT
(as a percentage of GDP)
- F:
- Forecast.
18
HISTORICAL DATA AND PRELIMINARY RESULTS
TABLE 2.15
GOUVERNEMENT DU QUÉBEC
SUMMARY OF FINANCIAL TRANSACTIONS
(in millions of dollars)
| | 1999-2000 | 2000-2001 | 2001-2002 | 2002-2003 1 | ||||
|---|---|---|---|---|---|---|---|---|
| Budgetary transactions | ||||||||
| Own-source revenue | 41 076 | 42 904 | 41 004 | 43 712 | ||||
| Federal transfers | 6 334 | 8 145 | 9 305 | 9 108 | ||||
| Total revenue | 47 410 | 51 049 | 50 309 | 52 820 | ||||
| Operating expenditure | -40 031 | -42 066 | -43 976 | -45 540 | ||||
| Debt service | -7 372 | -7 606 | -7 261 | -7 280 | ||||
| Total expenditure | -47 403 | -49 672 | -51 237 | -52 820 | ||||
| Budgetary reserve | ||||||||
| Funds allocated to reserve | — | -950 | — | — | ||||
| Use of funds allocated to reserve to finance spending and maintain a balanced budget | — | — | 950 | — | ||||
| Budgetary surplus after reserve | 7 | 427 | 22 | 0 | ||||
| Non-budgetary transactions | ||||||||
| Investments, loans and advances | -2 006 | -1 632 | -1 142 | -1 966 | ||||
| Capital expenditures | -359 | -473 | -995 | -1 642 | ||||
| Retirement plans | 1 740 | 1 793 | 2 089 | 1 987 | ||||
| Other accounts | 1 328 | -631 | -589 | -306 | ||||
| Non-budgetary surplus (requirements) | 703 | -943 | -637 | -1 927 | ||||
| Net financial surplus (requirements) | 710 | -516 | -615 | -1 927 | ||||
| Financing transactions | ||||||||
| Change in cash position | 2 253 | -473 | 132 | -2 043 | ||||
| Change in direct debt2 | -132 | 3 008 | 3 623 | 5 628 | ||||
| Retirement plans sinking fund3 | -2 831 | -2 019 | -3 140 | -1 658 | ||||
| Total financing of transactions | -710 | 516 | 615 | 1 927 | ||||
| Note: | A negative entry indicates a financial requirement and a positive entry, a source of financing. For the change in cash position, a negative entry indicates an increase and a positive entry, a decrease. For purposes of comparison, the data are presented on the basis of the 2003-2004 budgetary and financial structure. |
- 1
- The preliminary results for 2002-2003 are based on actual data recorded from April 2002 to January 2003 and on an estimate, as at February 28, 2003, of the February and March results for which transactions will be posted to 2002-2003 transactions up to the closing of the books.
- 2
- The change in direct debt includes new borrowings less repayment of borrowings.
- 3
- This sinking fund receives amounts to be used to cover retirement benefits payable by the government under the public and parapublic sector retirement plans. The income from this fund is accumulated in it and subtracted from the interest expenditure recorded with regard to the retirement plans liability.
19
TABLE 2.16
GOUVERNEMENT DU QUÉBEC
BUDGETARY REVENUE
(in millions of dollars)
| | 1999-2000 | 2000-2001 | 2001-2002 | 2002-2003 | |||||
|---|---|---|---|---|---|---|---|---|---|
| Own-source revenue | |||||||||
| Income and property taxes | |||||||||
| Personal income tax | 16 074 | 17 116 | 15 923 | 16 207 | |||||
| Contributions to Health Services Fund | 4 291 | 4 488 | 4 291 | 4 496 | |||||
| Corporate taxes1 | 3 643 | 4 217 | 4 029 | 3 681 | |||||
| 24 008 | 25 821 | 24 243 | 24 384 | ||||||
| Consumption taxes | |||||||||
| Sales | 6 761 | 7 374 | 7 557 | 8 547 | |||||
| Fuel | 1 560 | 1 536 | 1 536 | 1 610 | |||||
| Tobacco | 498 | 483 | 652 | 943 | |||||
| 8 819 | 9 393 | 9 745 | 11 100 | ||||||
| Duties and permits | |||||||||
| Motor vehicles | 667 | 646 | 662 | 677 | |||||
| Alcoholic beverages | 139 | 146 | 140 | 160 | |||||
| Natural resources2 | 354 | 265 | 188 | 160 | |||||
| Other | 182 | 180 | 177 | 172 | |||||
| 1 342 | 1 237 | 1 167 | 1 169 | ||||||
| Miscellaneous | |||||||||
| Sales of goods and services | 422 | 406 | 412 | 439 | |||||
| Interest | 363 | 390 | 395 | 370 | |||||
| Fines, forfeitures and recoveries | 345 | 310 | 371 | 361 | |||||
| 1 130 | 1 106 | 1 178 | 1 170 | ||||||
| Revenue from government enterprises | |||||||||
| Société des alcools du Québec | 442 | 471 | 489 | 540 | |||||
| Loto-Québec | 1 289 | 1 358 | 1 352 | 1 354 | |||||
| Hydro-Québec | 1 090 | 1 160 | 1 041 | 1 485 | |||||
| Other | 1 106 | 507 | -151 | 438 | |||||
| 3 927 | 3 496 | 2 731 | 3 817 | ||||||
| Consolidated organizations | 1 850 | 1 851 | 1 940 | 2 072 | |||||
| Total own-source revenue | 41 076 | 42 904 | 41 004 | 43 712 | |||||
| Federal transfers | |||||||||
| Programs | |||||||||
| Equalization | 4 387 | 5 650 | 5 336 | 5 315 | |||||
| Canada Health and Social Transfer | 1 120 | 1 597 | 2 958 | 2 727 | |||||
| Contributions to welfare programs | 11 | — | — | — | |||||
| Other transfers related to fiscal arrangements | 11 | 30 | 27 | 34 | |||||
| Other programs | 535 | 618 | 564 | 644 | |||||
| Consolidated organizations | 270 | 250 | 420 | 388 | |||||
| Total federal transfers | 6 334 | 8 145 | 9 305 | 9 108 | |||||
| Total budgetary revenue | 47 410 | 51 049 | 50 309 | 52 820 | |||||
- 1
- Including tax on corporate profits, tax on capital and tax on insurance company premiums, as well as tax on telecommunications, gas and electricity beginning in 2000-2001.
- 2
- Including forest, mining and hydraulic resources.
20
TABLE 2.17
GOUVERNEMENT DU QUÉBEC
BUDGETARY EXPENDITURE
(in millions of dollars)
| Departments and agencies | 1999-2000 | 2000-2001 | 2001-2002 | 2002-2003 | |||||
|---|---|---|---|---|---|---|---|---|---|
| Operating expenditure | |||||||||
| Assemblée nationale | 74 | 80 | 88 | 89 | |||||
| Personnes désignées par l'Assemblée nationale | 41 | 42 | 50 | 60 | |||||
| Affaires municipales et Métropole | 1 116 | 1 387 | 1 579 | 1 572 | |||||
| Agriculture, Pêcheries et Alimentation | 514 | 714 | 651 | 643 | |||||
| Conseil du trésor, Administration et Fonction publique | 372 | 434 | 465 | 472 | 1 | ||||
| Conseil exécutif | 215 | 111 | 109 | 162 | |||||
| Culture et Communications | 496 | 542 | 490 | 501 | |||||
| Éducation | 9 825 | 10 130 | 10 548 | 11 028 | |||||
| Emploi, Solidarité sociale | 4 064 | 4 095 | 4 067 | 4 108 | |||||
| Environnement | 223 | 158 | 180 | 179 | |||||
| Famille, Enfance et Condition féminine | 1 542 | 1 572 | 1 702 | 1 823 | |||||
| Faune et Parcs | 79 | 148 | 122 | 120 | |||||
| Finances, Économie et Recherche | |||||||||
| (excluding debt service) | 757 | 942 | 878 | 1 0321 | |||||
| Justice | 459 | 468 | 509 | 542 | |||||
| Régions | 147 | 120 | 137 | 164 | |||||
| Relations avec les citoyens et Immigration | 142 | 178 | 213 | 235 | |||||
| Relations internationales | 98 | 104 | 111 | 107 | |||||
| Ressources naturelles | 485 | 363 | 342 | 298 | |||||
| Revenu | 721 | 715 | 613 | 745 | |||||
| Santé et Services sociaux | 14 828 | 16 098 | 17 198 | 17 736 | |||||
| Sécurité publique | 701 | 744 | 800 | 833 | |||||
| Tourisme, Loisir et Sport | 173 | 152 | 160 | 158 | |||||
| Transports | 1 578 | 1 507 | 1 412 | 1 432 | |||||
| Travail | 81 | 79 | 88 | 65 | |||||
| Program spending | 38 731 | 40 883 | 42 512 | 44 104 | |||||
| Consolidated organizations | 1 300 | 1 183 | 1 464 | 1 436 | |||||
| Total operating expenditure | 40 031 | 42 066 | 43 976 | 45 540 | |||||
Debt service | |||||||||
| Consolidated Revenue Fund | 6 751 | 6 972 | 6 687 | 6 633 | |||||
| Consolidated organizations | 621 | 634 | 574 | 647 | |||||
| Total debt service | 7 372 | 7 606 | 7 261 | 7 280 | |||||
| Total budgetary expenditure | 47 403 | 49 672 | 51 237 | 52 820 | |||||
- 1
- The preliminary results for 2002-2003 contain provisions that allow appropriations to be transferred to other departments and agencies between the date the Budget documents are produced and the end of the fiscal year.
21
TABLE 2.18
GOUVERNEMENT DU QUÉBEC
NON-BUDGETARY TRANSACTIONS
(in millions of dollars)
| | 1999-2000 | 2000-2001 | 2001-2002 | 2002-2003 | |||||
|---|---|---|---|---|---|---|---|---|---|
| Investments, loans and advances | |||||||||
| Consolidated Revenue Fund | |||||||||
| GOVERNMENT ENTERPRISES | |||||||||
| SHARES AND INVESTMENTS : | |||||||||
| Société générale de financement du Québec | -150 | -350 | -550 | -300 | |||||
| Société Innovatech du Grand Montréal | -35 | -42 | -20 | -58 | |||||
| Société Innovatech Québec et Chaudière-Appalaches | -9 | -11 | -29 | -30 | |||||
| Société Innovatech Sud du Québec | -4 | -6 | -19 | -11 | |||||
| Société Innovatech Régions ressources | -8 | -13 | -12 | -11 | |||||
| Other | -1 | -3 | -18 | -28 | |||||
| -207 | -425 | -648 | -438 | ||||||
| CHANGE IN THE EQUITY VALUE OF INVESTMENTS | -1 782 | -1 157 | -371 | -1 213 | |||||
| LOANS AND ADVANCES: | |||||||||
| Société générale de financement du Québec | 14 | — | — | — | |||||
| Other | 10 | — | — | -2 | |||||
| 24 | — | — | -2 | ||||||
| Total government enterprises | -1 965 | -1 582 | -1 019 | -1 653 | |||||
| INDIVIDUALS, CORPORATIONS AND OTHERS | -53 | -20 | -173 | -209 | |||||
| MUNICIPALITIES AND MUNICIPAL BODIES | 6 | 1 | 4 | 2 | |||||
| -2 012 | -1 601 | -1 188 | -1 860 | ||||||
| Consolidated organizations | 6 | -31 | 46 | -106 | |||||
| Total investments, loans and advances | -2 006 | -1 632 | -1 142 | -1 966 | |||||
Capital expenditures | |||||||||
| Consolidated Revenue Fund | |||||||||
| Net investments | -85 | -144 | -135 | -255 | |||||
| Amortization | 354 | 334 | 193 | 202 | |||||
| 269 | 190 | 58 | -53 | ||||||
| Consolidated organizations | -628 | -663 | -1 053 | -1 589 | |||||
| Total capital expenditures | -359 | -473 | -995 | -1 642 | |||||
22
| | 1999-2000 | 2000-2001 | 2001-2002 | 2002-2003 | |||||
|---|---|---|---|---|---|---|---|---|---|
| Retirement plans | |||||||||
| CONTRIBUTIONS BY THE GOVERNMENT | |||||||||
| Contributions by the government as employer: | |||||||||
| RREGOP and PPMP: | |||||||||
| Cost of constituted benefits1 | 743 | 990 | 1 014 | 1 113 | |||||
| Amortization of actuarial gain (-) or loss | 82 | 66 | 141 | 144 | |||||
| Cost of changes | 44 | — | — | — | |||||
| Other plans : | |||||||||
| Cost of constituted benefits1 | 151 | 166 | 147 | 129 | |||||
| Amortization of actuarial gain (-) or loss | 57 | 26 | 65 | 78 | |||||
| Cost of changes | — | — | 28 | — | |||||
| Total government contribution | 1 077 | 1 248 | 1 395 | 1 464 | |||||
| Contributions by independent employers | 24 | — | 4 | 4 | |||||
| Participants' contributions | 124 | 106 | 88 | 113 | |||||
| Total contributions | 148 | 106 | 92 | 117 | |||||
| Benefits, repayments and administrative expenses | -2 336 | -2 567 | -2 720 | -3 058 | |||||
| Interest on retirement plans liability charged to debt service2 | 2 851 | 3 006 | 3 322 | 3 464 | |||||
| Total retirement plans | 1 740 | 1 793 | 2 089 | 1 987 | |||||
| Other accounts | |||||||||
| Consolidated Revenue Fund | 1 021 | -490 | -652 | 3 | |||||
| Consolidated organizations | 307 | -141 | 63 | -309 | |||||
| Total other accounts | 1 328 | -631 | -589 | -306 | |||||
| Total non-budgetary transactions | 703 | -943 | -637 | -1 927 | |||||
Note: A negative entry indicates a financial requirement and a positive entry, a source of financing.
- 1.
- Cost of retirement benefits constituted during the fiscal year, calculated according to the accounting method that consists in distributing benefits in proportion to years of service.
- 2.
- Excluding revenue generated by the retirement plans sinking fund.
23
TABLE 2.19
GOUVERNEMENT DU QUÉBEC
FINANCING TRANSACTIONS
(in millions of dollars)
| | 1999-2000 | 2000-2001 | 2001-2002 | 2002-2003 | |||||
|---|---|---|---|---|---|---|---|---|---|
| Change in cash position | |||||||||
| Consolidated Revenue Fund | 2 325 | -969 | 323 | -2 899 | |||||
| Consolidated organizations | -72 | 496 | -191 | 856 | |||||
| Total change in cash position | 2 253 | -473 | 132 | -2 043 | |||||
| Change in direct debt | |||||||||
| Consolidated Revenue Fund | |||||||||
| New borrowings | 5 189 | 7 569 | 7 700 | 8 614 | |||||
| Repayment of borrowings | -5 509 | -4 616 | -4 890 | -3 757 | |||||
| -320 | 2 953 | 2 810 | 4 857 | ||||||
| Consolidated organizations | |||||||||
| New borrowings | 891 | 1 025 | 1 311 | 1 839 | |||||
| Repayment of borrowings | -703 | -970 | -498 | -1 068 | |||||
| 188 | 55 | 813 | 771 | ||||||
| Total change in direct debt | -132 | 3 008 | 3 623 | 5 628 | |||||
| Retirement plans sinking fund1 | -2 831 | -2 019 | -3 140 | -1 658 | |||||
| Total financing of transactions | -710 | 516 | 615 | 1 927 | |||||
| Note: | A negative entry indicates a financial requirement and a positive entry, a source of financing. For the change in cash position, a negative entry indicates an increase and a positive entry, a decrease. |
- 1
- This sinking fund receives amounts to be used to cover retirement benefits payable by the government under the public and parapublic sector retirement plans. The income from this fund is accumulated in it and subtracted from the interest expenditure recorded with regard to the retirement plans liability.
23
TABLE 2.20
BORROWINGS FOR THE CONSOLIDATED REVENUE FUND IN 2002-2003
| Amount in Canadian dollars1 | Face value in foreign currency | Interest rate2 | Date of issue | Date of maturity | Price to investor | Yield to investor3 | |||||||
|---|---|---|---|---|---|---|---|---|---|---|---|---|---|
| (in millions) | | % | | | $ | % | |||||||
| 493 | — | 6.00 | April 8 | 2012-10-01 | 98.685 | 6.172 | |||||||
| 484 | — | 6.25 | May 21 | 2032-06-01 | 96.727 | 6.499 | |||||||
| 748 | US$489 | 4 | 5.00 | July 17 | 2009-07-17 | 99.417 | 5.100 | ||||||
| 104 | — | 6.00 | November 15 | 2012-10-01 | 104.251 | 5.437 | |||||||
| 200 | 5 | — | 4.50 | 6 | November 29 | 2007-11-29 | 99.740 | 4.559 | |||||
| 526 | — | 6.00 | January 13 | 2012-10-01 | 105.120 | 5.317 | |||||||
| 418 | — | 6.25 | January 27 | 2032-06-01 | 103.647 | 5.984 | |||||||
| 76 | 7 | US$50 | Variable | February 7 | 2013-02-07 | 100.000 | Variable | ||||||
| 1 628 | €1000 | 4.25 | 6 | February 27 | 2013-02-27 | 99.322 | 4.335 | ||||||
| 833 | 8 | — | Various | Various | Various | Various | Various | ||||||
| 149 | 9 | — | Various | Various | Various | Various | Various | ||||||
| 853 | 10 | — | Various | Various | Various | Various | Various | ||||||
| 557 | 11 | — | Various | Various | Various | Various | Various | ||||||
| 5 | 12 | — | Various | Various | Various | Various | Various | ||||||
| 271 | 13 | — | Various | Various | Various | Various | Various | ||||||
| 323 | 14 | — | Various | Various | Various | Various | Various | ||||||
| 946 | 15 | Various | Various | Various | Various | Various | Various | ||||||
| 8 614 | |||||||||||||
- 1
- Borrowings in foreign currency given in Canadian equivalent of their value on the date of borrowing.
- 2
- Interest payable semi-annually except if another frequency is indicated in a note.
- 3
- Yield to investor is determined on the basis of interest payable semi-annually.
- 4
- The original borrowing totalled US$750 million, or CAN$1 148 million. An amount of CAN$400 million derived from this borrowing was advanced to the Financing Fund in order to be loaned to consolidated organizations.
- 5
- Medium-term notes on the European market.
- 6
- Interest payable annually.
- 7
- Private borrowing.
- 8
- Real return bonds. The principal and the interest rate of these bonds are adjusted according to the change in the Consumer Price Index in Canada.
- 9
- Borrowings fully subscribed by the Caisse de dépôt et placement du Québec.
- 10
- Medium-term notes on the Canadian market.
- 11
- Savings products issued by Épargne Placements Québec.
- 12
- Borrowings from the Canada Pension Plan Investment Fund.
- 13
- Immigrant Investor Program.
- 14
- Represents the net increase in Treasury bills outstanding during the fiscal year.
- 15
- Amount received under interest rate and currency swap agreements.
| Note: | The Québec government has credit agreements with various banks and financial institutions for a total of US$3 500 million. None of these credit agreements is being drawn upon. |
25
TABLE 2.21
BORROWINGS FOR THE FINANCING FUND IN 2002-2003
| | Amount in Canadian dollars1 | Face value in foreign currency | Interest rate2 | Date of issue | Date of maturity | Price to investor | Yield to investor3 | |||||||
|---|---|---|---|---|---|---|---|---|---|---|---|---|---|---|
| | (in millions) | | % | | | $ | % | |||||||
| A. Borrowings for consolidated organizations | ||||||||||||||
| 496 | — | 6.00 | April 26 | 2012-10-01 | 99.277 | 6.094 | ||||||||
| 50 | 4 | — | 6.00 | May 3 | 2012-10-01 | 99.596 | 6.052 | |||||||
| 55 | 4 | — | 6.00 | May 10 | 2029-10-01 | 94.955 | 6.392 | |||||||
| 22 | 4 | — | 6.00 | June 12 | 2012-10-01 | 100.409 | 5.945 | |||||||
| 400 | US$261 | 5 | 5.00 | July 17 | 2009-07-17 | 99.417 | 5.100 | |||||||
| 53 | 4 | — | 6.25 | September 6 | 2010-12-01 | 106.889 | 5.209 | |||||||
| 52 | 4 | — | 6.00 | September 6 | 2012-10-01 | 104.727 | 5.385 | |||||||
| 75 | 4 | — | Variable | October 15 | 2007-10-01 | 100.000 | Variable | |||||||
| 19 | 4 | — | 6.50 | October 15 | 2007-10-01 | 108.979 | 4.462 | |||||||
| 417 | — | 6.00 | November 15 | 2012-10-01 | 104.251 | 5.437 | ||||||||
| 100 | — | 6.25 | January 27 | 2032-06-01 | 103.647 | 5.984 | ||||||||
| 100 | 6 | — | 4.50 | 7 | February 6 | 2007-11-29 | 100.216 | 4.446 | ||||||
| Sub-total | 1 839 | |||||||||||||
| B. Borrowings for certain government enterprises | ||||||||||||||
| 101 | 4 | — | 6.25 | June 19 | 2032-06-01 | 100.564 | 6.208 | |||||||
| 62 | 4 | — | 6.00 | September 19 | 2029-10-01 | 100.612 | 5.954 | |||||||
| Sub-total | 163 | |||||||||||||
| Total | 2 002 | |||||||||||||
- 1
- Borrowings in foreign currency given in Canadian equivalent of their value on the date of borrowing.
- 2
- Interest payable semi-annually except if another frequency is indicated in a note.
- 3
- Yield to investor is determined on the basis of interest payable semi-annually.
- 4
- Borrowings fully subscribed by the Caisse de dépôt et placement du Québec.
- 5
- Amount derived from the borrowing of US$750 million (CAN$1 148 million) contracted by the Consolidated Revenue Fund.
- 6
- Medium-term notes on the European market.
- 7
- Interest payable annually.
26
TABLE 2.22
BORROWINGS BY FINANCEMENT-QUÉBEC IN 2002-2003
| Amount in Canadian dollars1 | Face value in foreign currency | Interest rate2 | Date of issue | Date of maturity | Price to investor | Yield to investor3 | ||||||||
|---|---|---|---|---|---|---|---|---|---|---|---|---|---|---|
| (in millions) | | % | | | $ | % | ||||||||
| 495 | — | 5.75 | April 2 | 2008-12-01 | 99.114 | 5.911 | ||||||||
| 4504 | €300 | Variable | 5 | July 3 | 2008-12-03 | 99.892 | Variable | |||||||
| 525 | — | 5.75 | September 12 | 2008-12-01 | 104.950 | 4.816 | ||||||||
| 778 | US$500 | 5.00 | October 25 | 2012-10-25 | 99.232 | 5.099 | ||||||||
| -46 | Various | Various | Various | Various | Various | Various | ||||||||
| 2 244 | ||||||||||||||
- 1
- Borrowings in foreign currency given in Canadian equivalent of their value on the date of borrowing.
- 2
- Interest payable semi-annually except if another frequency is indicated in a note.
- 3
- Yield to investor is determined on the basis of interest payable semi-annually.
- 4
- Medium-term notes on the European market.
- 5
- Interest payable quarterly.
- 6
- Amount received (disbursed) under interest rate and currency swap agreements.
27
TABLE 2.23
BORROWINGS BY HYDRO-QUÉBEC IN 20021
| Amount in Canadian dollars2 | Face value in foreign currency | Interest rate3 | Date of issue | Date of maturity | Price to investor | Yield to investor4 | |||||||
|---|---|---|---|---|---|---|---|---|---|---|---|---|---|
| (in millions) | | % | | | $ | % | |||||||
| 1 8615 | — | Various | Various | Various | Various | Various | |||||||
| 626 | Various | Various | Various | Various | Various | Various | |||||||
| 1 923 | |||||||||||||
| 1 | Borrowings contracted as at December 31, 2002. | |
2 | Borrowings in foreign currency given in Canadian equivalent of their value on the date of borrowing. | |
3 | Interest payable semi-annually except if another frequency is indicated in a note. | |
4 | Yield to investor is determined on the basis of interest payable semi-annually. | |
5 | Medium-term notes on the Canadian market. | |
6 | Amount received under interest rate and currency swap agreements. | |
Note: | Hydro-Québec has credit agreements with various banks and financial institutions for a total of US$1 500 million. None of the credit agreements was being drawn upon at December 31, 2002. |
28
The Government's Financial Position in 2002-2003 and Public Sector Borrowings
The government's financial transactions1
GOUVERNEMENT DU QUÉBEC SUMMARY OF CONSOLIDATED FINANCIAL TRANSACTIONS1 (in millions of dollars)
SUMMARY OF THE CHANGE IN OWN-SOURCE REVENUE (in millions of dollars)
SUMMARY OF THE CHANGE IN FEDERAL TRANSFERS (in millions of dollars)
IMPACT OF THE FEDERAL SOLUTION TO THE ERROR MADE BY CANADA CUSTOMS AND REVENUE AGENCY (in millions de dollars)
SUMMARY OF THE CHANGE IN BUDGETARY EXPENDITURE (in millions of dollars)
SUMMARY OF NON-BUDGETARY TRANSACTIONS (in millions of dollars)
SUMMARY OF CONSOLIDATED FINANCING TRANSACTIONS (in millions of dollars)
SUMMARY OF BORROWINGS IN 2002-2003 (in millions of dollars)
TOTAL ANTICIPATED GOVERNMENT DEBT AS AT MARCH 31, 2003 (in millions of dollars)
ANTICIPATED STRUCTURE OF THE TOTAL DEBT AS AT MARCH 31, 2003 (in millions of dollars)
PUBLIC SECTOR BORROWINGS, INVESTMENTS AND DEBT
NET LONG-TERM PUBLIC SECTOR BORROWINGS (in millions of dollars)
PUBLIC SECTOR INVESTMENTS (in millions of dollars)
TOTAL NET BORROWINGS AND INVESTMENTS BY THE PUBLIC SECTOR (in millions of dollars)
LONG-TERM PUBLIC SECTOR DEBT1 (in millions of dollars)
HISTORICAL DATA AND PRELIMINARY RESULTS
GOUVERNEMENT DU QUÉBEC SUMMARY OF FINANCIAL TRANSACTIONS (in millions of dollars)
GOUVERNEMENT DU QUÉBEC BUDGETARY REVENUE (in millions of dollars)
GOUVERNEMENT DU QUÉBEC BUDGETARY EXPENDITURE (in millions of dollars)
GOUVERNEMENT DU QUÉBEC NON-BUDGETARY TRANSACTIONS (in millions of dollars)
GOUVERNEMENT DU QUÉBEC FINANCING TRANSACTIONS (in millions of dollars)
BORROWINGS FOR THE CONSOLIDATED REVENUE FUND IN 2002-2003
BORROWINGS FOR THE FINANCING FUND IN 2002-2003
BORROWINGS BY FINANCEMENT-QUÉBEC IN 2002-2003
BORROWINGS BY HYDRO-QUÉBEC IN 20021