2003-2004 Budget The Government's Financial Position in 2002-2003 and Public Sector Borrowings
Section 2
The Government's Financial
Position in 2002-2003
and Public Sector Borrowings
| The government's financial transactions | 1 | |
| Budgetary revenue | 4 | |
| Budgetary expenditure | 7 | |
| Non-budgetary transactions | 9 | |
| Financing | 11 | |
| Borrowings | 12 | |
| Total government debt | 16 | |
| Change in total government debt | 17 | |
| Structure of debt | 18 | |
Public sector borrowings, investments and debt | 20 | |
| Public sector borrowings and investments | 20 | |
| Long-term public sector debt | 25 | |
Historical data and preliminary results | 26 | |
| Financial transactions of the gouvernement du Québec | ||
| — Summary | 26 | |
| — Budgetary revenue | 27 | |
| — Budgetary expenditure | 28 | |
| — Non-budgetary transactions | 29 | |
| — Financing transactions | 31 | |
| Borrowings for the Consolidated Revenue Fund in 2002-2003 | 32 | |
| Borrowings for the Financing Fund in 2002-2003 | 33 | |
| Borrowings by Financement-Québec in 2002-2003 | 34 | |
| Borrowings by Hydro-Québec in 2002 | 35 |
The government's financial transactions1
Preliminary results for the government's financial transactions in fiscal 2002-2003 indicate that a balanced budget should be achieved.
Consolidated budgetary revenue for fiscal 2002-2003 is revised to $52 706 million, $114 million less than anticipated in March 2003. This decrease in revenue can be explained by a $309-million decline in own-source revenue and a $195-million increase in federal transfers.
Consolidated budgetary expenditure amounts to $52 706 million in 2002-2003, a downward adjustment of $114 million compared with the forecast of March 11, 2003. This drop in expenditure stems from a $30-million rise in operating expenditure and a $144-million decrease in debt service.
1
2003-2004 Budget The Government's Financial Position in 2002-2003 and Public Sector Borrowings
Consolidated net financial requirements are revised to $1 585 million, a decline of $342 million. The net financial requirements of consolidated organizations thus amount to $1 263 million and those of the Consolidated Revenue Fund to $322 million.
With regard to financing transactions, the change in direct debt is adjusted downward by $123 million compared with the figure anticipated last March.
- 1
- The data in this section have been adjusted, for purposes of comparison, on the basis of the 2003-2004 budgetary and financial structure.
2
TABLE 2.1
GOUVERNEMENT DU QUÉBEC
SUMMARY OF CONSOLIDATED FINANCIAL TRANSACTIONS1
(in millions of dollars)
| | 2001-2002 | 2002-2003 | ||||||
|---|---|---|---|---|---|---|---|---|
| | Actual results | Financial position as at March 11, 2003 | Preliminary results | Change compared with March 11 | ||||
| Budgetary transactions | ||||||||
| Own-source revenue | 41 004 | 43 712 | 43 403 | -309 | ||||
| Federal transfers | 9 305 | 9 108 | 9 303 | 195 | ||||
| Total revenue | 50 309 | 52 820 | 52 706 | -114 | ||||
| Operating expenditure | -43 976 | -45 540 | -45 570 | -30 | ||||
| Debt service | -7 261 | -7 280 | -7 136 | 144 | ||||
| Total expenditure | -51 237 | -52 820 | -52 706 | 114 | ||||
Budgetary reserve | ||||||||
| Use of funds allocated to the reserve | ||||||||
| to finance spending and maintain | ||||||||
| a balanced budget | 950 | — | — | — | ||||
| Budgetary surplus | 22 | 0 | 0 | 0 | ||||
Non-budgetary transactions | ||||||||
| Investments, loans and advances | -1 142 | -1 966 | -1 801 | 165 | ||||
| Capital expenditures | -995 | -1 642 | -1 471 | 171 | ||||
| Retirement plans | 2 089 | 1 987 | 2 007 | 20 | ||||
| Other accounts | -589 | -306 | -320 | -14 | ||||
| Non-budgetary requirements | -637 | -1 927 | -1 585 | 342 | ||||
| Net financial requirements | -615 | -1 927 | -1 585 | 342 | ||||
Financing transactions | ||||||||
| Change in cash position | 132 | -2 043 | -2 279 | -236 | ||||
| Change in direct debt2 | 3 623 | 5 628 | 5 505 | -123 | ||||
| Retirement plans sinking fund3 | -3 140 | -1 658 | -1 641 | 17 | ||||
| Total financing of transactions | 615 | 1 927 | 1 585 | -342 | ||||
| Note: | A negative entry indicates a financial requirement and a positive entry, a source of financing. For the change in cash position, a negative entry indicates an increase and a positive entry, a decrease. |
- 1
- The data have been adjusted, for purposes of comparison, on the basis of the 2003-2004 budgetary and financial structure.
- 2
- The change in direct debt includes new borrowings less repayment of borrowings.
- 3
- This sinking fund receives amounts to be used to cover retirement benefits payable by the government under the public and parapublic sector retirement plans. Revenue generated by this fund is accumulated in it and subtracted from the interest expenditure recorded with regard to the retirement plans liability.
3
2003-2004 Budget The Government's Financial Position in 2002-2003 and Public Sector Borrowings
Budgetary revenue
In regard to budgetary revenue, the March 2003 forecast projected $43 712 million in own-source revenue and $9 108 million in federal transfers. Preliminary results indicate that own-source revenue is down $309 million, while federal transfers are up $195 million.
Own-source revenue
As for own-source revenue, the decline in revenue from personal income tax, consumption taxes and consolidated organizations is offset only partly by the higher results of other revenue sources.
TABLE 2.2
SUMMARY OF THE CHANGE IN OWN-SOURCE REVENUE
(in millions of dollars)
| | 2001-2002 | 2002-2003 | ||||||||
|---|---|---|---|---|---|---|---|---|---|---|
| | Actual results | Financial position as at March 11, 2003 | Preliminary results | Change compared with March 11 | Change compared with 2001-2002 | |||||
| | | | | | % | |||||
| Personal income tax | 15 923 | 16 207 | 16 081 | -126 | 1.0 | |||||
| Health Services Fund | 4 291 | 4 496 | 4 479 | -17 | 4.4 | |||||
| Corporate taxes | 4 029 | 3 681 | 3 735 | 54 | -7.3 | |||||
| Consumption taxes | 9 745 | 11 100 | 10 839 | -261 | 11.2 | |||||
| Government enterprises | 2 731 | 3 817 | 3 907 | 90 | 43.1 | |||||
| Consolidated organizations | 1 940 | 2 072 | 1 943 | -129 | 0.2 | |||||
| Other sources | 2 345 | 2 339 | 2 419 | 80 | 3.2 | |||||
| Total own-source revenue | 41 004 | 43 712 | 43 403 | -309 | 5.9 | |||||
Revenue from personal income tax is down $126 million, reflecting essentially the results of the latest adjustments made with respect to income tax returns for the 2001 taxation year.
4
2003-2004 Budget Budget Plan
Revenue from consumption taxes is also down $261 million, mainly because of sales tax results. In this regard, remittances made by government mandataries in April for amounts collected in March mirrored the weaker-than-anticipated growth of the tax base. The tax on tobacco products also contributed to the negative revisions owing to a slightly steeper-than-expected decline in consumption. In addition, a delay in remittances by mandataries, stemming in particular from ad hoc adjustments to their inventories, amplified the revision.
Revenue from consolidated organizations is adjusted downward by $129 million, mainly because of a lower-than-anticipated volume of transactions conducted outside the reporting entity.
Corporate tax revenue is up $54 million. In this regard, more-sustained-than-forecast growth in profits reduced requests for overpayment refunds.
Results for other sources as a whole are also revised upward by $80 million, primarily because of higher-than-expected revenue from natural resources. This rise in revenue stems essentially from increased stumpage fees, which in turn result from the fact that a larger volume of timber was cut than initially anticipated.
Revenue from government enterprises is revised to $3 907 million, an increase of $90 million.
This adjustment can be attributed notably to a $355-million climb in Hydro-Québec's net profits. This difference, which is due essentially to higher-than-expected results for the first quarter of 2003, stems from increased sales in Québec because of colder temperatures as well as from more profitable transactions on foreign markets.
However, this growth is offset by the downward revision of revenue from other enterprises as a whole, particularly the Société générale de financement du Québec and the Société Innovatech du Grand Montréal, which account for $64 million and $37 million of the adjustment respectively. In addition, revenue from the Société de l'assurance automobile du Québec is down $167 million mainly because of the deterioration of the highway safety record, the increase in the average cost per accident victim and a decline in investment income.
5
2003-2004 Budget The Government's Financial Position in 2002-2003 and Public Sector Borrowings
Federal transfers
Federal transfers should amount to $9 303 million in 2002-2003, an increase of $195 million compared with the March 2003 forecast.
Revenue from other programs is adjusted upward by $291 million owing to the refund at the beginning of 2003-2004, rather than at the end of 2002-2003, of part of the tax transfer for youth allowances. In addition, revenue from the Canada Health and Social Transfer (CHST) is revised downward by $79 million, reflecting the fact that interest from the CHST trust accounts was withdrawn in 2003-2004 rather than in 2002-2003 as initially planned.
TABLE 2.3
SUMMARY OF THE CHANGE IN FEDERAL TRANSFERS
(in millions of dollars)
| | 2001-2002 | 2002-2003 | ||||||||
|---|---|---|---|---|---|---|---|---|---|---|
| | Actual results | Financial position as at March 11, 2003 | Preliminary results | Change compared with March 11 | Change compared with 2001-2002 | |||||
| | | | | | % | |||||
| Equalization | 5 336 | 5 315 | 5 315 | 0 | -0.4 | |||||
| Canada Health and Social Transfer (CHST) | 2 958 | 2 727 | 2 648 | -79 | -10.5 | |||||
| Other transfers related to fiscal arrangements | 27 | 34 | 34 | 0 | 25.9 | |||||
| Other programs | 564 | 644 | 935 | 291 | 65.8 | |||||
| Consolidated organizations | 420 | 388 | 371 | -17 | -11.7 | |||||
| Total federal transfers | 9 305 | 9 108 | 9 303 | 195 | — | |||||
6
2003-2004 Budget Budget Plan
Budgetary expenditure
Budgetary expenditure for fiscal 2002-2003 amounts to $52 706 million, $114 million less than forecast in March 2003. In all, there is a 2.9% increase in budgetary expenditure compared with 2001-2002.
TABLE 2.4
SUMMARY OF THE CHANGE IN BUDGETARY EXPENDITURE
(in millions of dollars)
| | 2001-2002 | 2002-2003 | ||||||||||
|---|---|---|---|---|---|---|---|---|---|---|---|---|
| | Actual results | Financial position as at March 11, 2003 | Preliminary results | Change compared with March 11 | Change compared with 2001-2002 | |||||||
| | | | | | % | |||||||
| Program spending objective | 42 512 | 44 104 | 44 104 | — | 3.7 | |||||||
| Increase in objective | — | — | 22 | 22 | — | |||||||
| Program spending | 42 512 | 44 104 | 44 126 | 22 | 3.8 | |||||||
| Consolidated organizations | 1 464 | 1 436 | 1 444 | 8 | -1.4 | |||||||
| Total operating expenditure | 43 976 | 45 540 | 45 570 | 30 | 3.6 | |||||||
| Debt service | ||||||||||||
| Consolidated Revenue Fund | ||||||||||||
| Direct debt service | 3 970 | 3 927 | 3 888 | -39 | -2.1 | |||||||
| Retirement plans | 2 717 | 2 706 | 2 648 | -58 | -2.5 | |||||||
| 6 687 | 6 633 | 6 536 | -97 | -2.3 | ||||||||
| Consolidated organizations | 574 | 647 | 600 | -47 | 4.5 | |||||||
| Total debt service | 7 261 | 7 280 | 7 136 | -144 | -1.7 | |||||||
| Total budgetary expenditure | 51 237 | 52 820 | 52 706 | -114 | 2.9 | |||||||
7
2003-2004 Budget The Government's Financial Position in 2002-2003 and Public Sector Borrowings
The $114-million decrease in budgetary expenditure results from a $30-million increase in operating expenditure, which is more than offset by a $144-million decline in debt service.
As a result, debt service now amounts to $7 136 million, of which $3 888 million is for direct debt service, $2 648 million for interest on the net retirement plans liability and $600 million for the debt service of consolidated organizations. The decline in the debt service of the Consolidated Revenue Fund is due for the most part to a decrease in interest on the government's actuarial obligations in respect of its employees' retirement plans. The interest rates on these two plans were not known until April 2003.
8
Non-budgetary transactions
Financial requirements stemming from non-budgetary transactions amount to $1 585 million, $342 million less than forecast on March 11, 2003.
TABLE 2.5
SUMMARY OF NON-BUDGETARY TRANSACTIONS
(in millions of dollars)
| | 2002-2003 | ||||||
|---|---|---|---|---|---|---|---|
| | Financial position as at March 11, 2003 | Preliminary results | Change | ||||
| Consolidated Revenue Fund | |||||||
| Investments, loans and advances | |||||||
| Government enterprises | -1 653 | -1 623 | 30 | ||||
| Municipalities, municipal bodies, individuals, corporations and others | -207 | -43 | 164 | ||||
| - 1 860 | - 1 666 | 194 | |||||
| Capital expenditures | -53 | 2 | 55 | ||||
| Retirement plans | 1 987 | 2 007 | 20 | ||||
| Other accounts | 3 | -395 | -398 | ||||
| Total Consolidated Revenue Fund | 77 | -52 | -129 | ||||
| Consolidated organizations | -2 004 | -1 533 | 471 | ||||
| Non-budgetary requirements | -1 927 | -1 585 | 342 | ||||
| Note: | A negative entry indicates a financial requirement and a positive entry, a source of financing. |
9
2003-2004 Budget The Government's Financial Position in 2002-2003 and Public Sector Borrowings
Preliminary results for investments, loans and advances indicate a $194-million decrease in financing requirements compared with the March 2003 forecast. This difference can be attributed mainly to weaker-than-anticipated investments in government enterprises and a reduction in advances to certain special funds, particularly because of lower-than-expected capital expenditures.
The $55-million decline in financing requirements for capital expenditures stems essentially from the fact that net investments by departments and agencies were lower than forecast last March.
Transactions related to other non-budgetary accounts represent year-to-year changes in these financial items. These accounts, which include, in particular, cash and bills on hand, outstanding cheques, accounts receivable and accounts payable, can fluctuate a great deal because of the variability of government cash inflow and disbursements. For 2002-2003, the balance of the other accounts shows a decrease of $398 million in sources of funding compared with the forecast of March 2003.
The financial requirements of consolidated organizations stemming from non-budgetary transactions are adjusted downward by $471 million, particularly because capital expenditures were less than anticipated.
10
2003-2004 Budget Budget Plan
Financing
Preliminary results for 2002-2003 show that the change in direct debt amounts to $5 505 million, or $4 754 million for the Consolidated Revenue Fund and $751 million for consolidated organizations. Borrowings in fiscal 2002-2003 amount to $10 536 million ($8 697 million for the Consolidated Revenue Fund and $1 839 million for consolidated organizations). It should be noted that the Consolidated Revenue Fund obtained $3 945 million in pre-financing.
TABLE 2.6
SUMMARY OF CONSOLIDATED FINANCING TRANSACTIONS
(in millions of dollars)
| | 2002-2003 | ||||||
|---|---|---|---|---|---|---|---|
| | Financial position as at March 11, 2003 | Preliminary results | Change | ||||
| Change in cash position | |||||||
| Consolidated Revenue Fund | -2 899 | -2��791 | 108 | ||||
| Consolidated organizations | 856 | 512 | -344 | ||||
| Total change in cash position | -2 043 | -2 279 | -236 | ||||
Change in direct debt | |||||||
| Consolidated Revenue Fund | |||||||
| New borrowings | 8 614 | 8 697 | 83 | ||||
| Repayment of borrowings | -3 757 | -3 943 | -186 | ||||
| 4 857 | 4 754 | -103 | |||||
| Consolidated organizations | |||||||
| New borrowings | 1 839 | 1 839 | — | ||||
| Repayment of borrowings | -1 068 | -1 088 | -20 | ||||
| 771 | 751 | -20 | |||||
| Total change in direct debt | 5 628 | 5 505 | -123 | ||||
| Retirement plans sinking fund | -1 658 | -1 641 | 17 | ||||
| Total financing of transactions | 1 927 | 1 585 | -342 | ||||
| Note: | A negative entry indicates a financial requirement and a positive entry, a source of financing. For the change in cash position, a negative entry indicates an increase and a positive entry, a decrease. |
11
2003-2004 Budget The Government's Financial Position in 2002-2003 and Public Sector Borrowings
Borrowings
In all, the government contracted borrowings of $10 699 million in 2002-2003, of which $8 697 million was for Consolidated Revenue Fund needs and $2 002 million for the Financing Fund. The borrowings of the Financing Fund are used to meet the financial requirements of consolidated organizations ($1 839 million) and certain government enterprises ($163 million).
In all, 74% of the financing program, or $7 877 million, was conducted in Canadian dollars. In regard to the main financial instruments used, the government carried out six public bond issues on the Canadian domestic market for a total of $3 038 million, and real return issues for a total of $833 million. In addition, two public issues in Canadian dollars were made on the European market for $300 million, and private-contract financing worth $638 million was carried out with the Caisse de dépôt et placement du Québec. Lastly, savings products sold by Épargne Placements Québec provided the government with $658 million in financing.
Borrowings totalling $2 822 million, or 26% of the financing program, were contracted in foreign currency as part of the government's financing sources diversification strategy. Two public bond issues and one private issue were made in foreign currency in 2002-2003. A global bond issue in US dollars for US$750 million (CAN$1 148 million, or $748 million for the needs of the Consolidated Revenue Fund and $400 million for those of consolidated organizations) was carried out in July 2002. As well, a private issue for US$50 million (CAN$76 million) and a public bond issue for 1 billion euros (CAN$1 598 million) on the euro market were carried out in February 2003.
12
TABLE 2.7
SUMMARY OF BORROWINGS IN 2002-2003
(in millions of dollars)
| Currency | Consolidated Revenue Fund | Consolidated organizations | Government enterprises | Total | |||||||
|---|---|---|---|---|---|---|---|---|---|---|---|
| | % | ||||||||||
| Canadian dollar | |||||||||||
| Public issues | |||||||||||
| Negotiable bonds | 2 025 | 1 013 | — | 3 038 | 38.6 | ||||||
| Real return bonds | 833 | — | — | 833 | 10.6 | ||||||
| Medium-term notes | |||||||||||
| On the Canadian market | 853 | — | — | 853 | 10.8 | ||||||
| On the European market | 200 | 100 | — | 300 | 3.8 | ||||||
| Private issues | |||||||||||
| Caisse de dépôt et placement du Québec | 149 | 326 | 163 | 638 | 8.1 | ||||||
| Canada Pension Plan Investment Fund | 5 | — | — | 5 | 0.1 | ||||||
| Savings products | 658 | — | — | 658 | 8.3 | ||||||
| Immigrant Investor Program | 268 | — | — | 268 | 3.4 | ||||||
| Change in Treasury bills outstanding | 323 | — | — | 323 | 4.1 | ||||||
| Change in debt resulting from currency swaps | 961 | — | — | 961 | 12.2 | ||||||
| Sub-total | 6 275 | 1 439 | 163 | 7 877 | 73.7 | ||||||
US dollar | |||||||||||
| Public issue | |||||||||||
| Negotiable bonds | 748 | 1 | 400 | 1 | — | 1 148 | 93.8 | ||||
| Private issue | 76 | — | — | 76 | 6.2 | ||||||
| Sub-total | 824 | 400 | — | 1 224 | 11.4 | ||||||
Euro | |||||||||||
| Public issue | 1 598 | — | — | 1 598 | 100.0 | ||||||
| Sub-total | 1 598 | — | — | 1 598 | 14.9 | ||||||
| Total | 8 697 | 1 839 | 163 | 10 699 | 100.0 | ||||||
- 1
- The original borrowing was for US$750 million (CAN$1 148 million). An amount of CAN$400 million derived from this borrowing was advanced to the Financing Fund in order to be loaned to consolidated organizations.
13
2003-2004 Budget The Government's Financial Position in 2002-2003 and Public Sector Borrowings
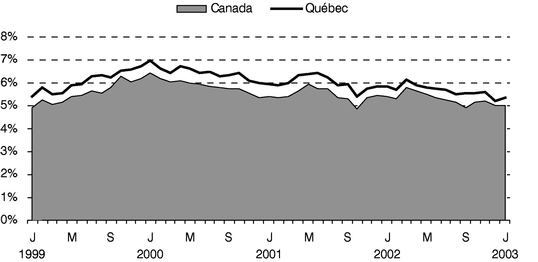
GRAPH 2.1
YIELD ON LONG-TERM (10-YEAR) SECURITIES
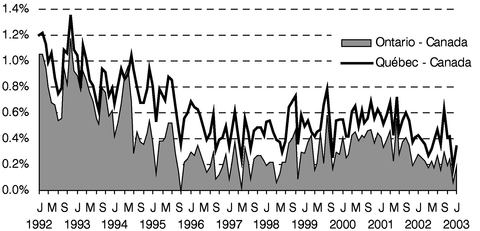
GRAPH 2.2
YIELD SPREAD ON LONG-TERM (10-YEAR) SECURITIES
14
2003-2004 Budget Budget Plan
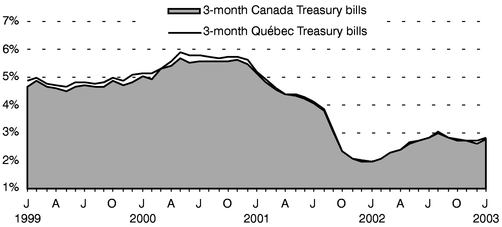
GRAPH 2.3
YIELD ON SHORT-TERM SECURITIES
15
2003-2004 Budget The Government's Financial Position in 2002-2003 and Public Sector Borrowings
Total government debt
The government's total debt consists of the consolidated direct debt and the net retirement plans liability. The consolidated direct debt is the sum of the direct debt of the Consolidated Revenue Fund and the debt of consolidated organizations. As for the net retirement plans liability, it consists of the retirement plans liability minus the balance of the retirement plans sinking fund (RPSF), an asset that will eventually be used to pay the retirement benefits of public and parapublic sector employees.
Preliminary results indicate that the government's consolidated direct debt amounted to $74 121 million as at March 31, 2003, or $68 697 million as direct debt of the Consolidated Revenue Fund and $5 424 million as debt of the consolidated organizations.
It should be noted that an amount of $3 945 million included in the consolidated direct debt represents pre-financing obtained in 2002-2003 that will cover part of the borrowings to be made in 2003-2004.
The net retirement plans liability totalled $38 426 million as at March 31, 2003 and consists of $50 266 million as the retirement plans liability minus the balance of the RPSF, or $11 840 million.
Excluding pre-financing, the government's total debt was $108 602 million as at March 31, 2003.
TABLE 2.8
TOTAL GOVERNMENT DEBT AS AT MARCH 31, 20031
(in millions of dollars)
| | Consolidated direct debt | | | |||||||
|---|---|---|---|---|---|---|---|---|---|---|
| | Consolidated Revenue Fund | Consolidated organizations | Total | Net retirement plans liability | Total debt | |||||
| Debt as at March 31, 2003 | 68 697 | 5 424 | 74 121 | 50 266 | 124 387 | |||||
| Retirement plans sinking fund | — | — | — | -11 840 | -11 840 | |||||
| Sub-total | 68 697 | 5 424 | 74 121 | 38 426 | 112 547 | |||||
| Pre-financing | -3 945 | — | -3 945 | — | -3 945 | |||||
| Total | 64 752 | 5 424 | 70 176 | 38 426 | 108 602 | |||||
- 1
- Preliminary results.
16
2003-2004 Budget Budget Plan
Change in total government debt
The $3 430-million increase in the government's total debt in 2002-2003 can be attributed mainly to financial requirements relating to investments, loans and advances and capital expenditures.
Preliminary results show that financial requirements for investments, loans and advances amount to $1 801 million. These requirements stem in particular from the profits of certain government enterprises that were recorded as government revenue but were not paid in the form of dividends. These unpaid dividends thus represent an additional investment by the government in its government enterprises. Financial requirements for investments, loans and advances also result from investments made by the government in its enterprises.
As for capital expenditures, they entail an estimated $1 471 million in financial requirements in 2002-2003. These capital expenditures were charged to expenditure by amortizing their cost over their useful life.
TABLE 2.9
CHANGE IN TOTAL GOVERNMENT DEBT
(in millions of dollars)
| | 2002-20031 | |||
|---|---|---|---|---|
| Total debt, beginning of year | 105 172 | |||
Financial requirements | ||||
| Investments, loans and advances | 1 801 | |||
| Capital expenditures | 1 471 | |||
| Other factors2 | 158 | |||
| 3 430 | ||||
| Total debt, end of year3 | 108 602 | |||
- 1
- Preliminary results.
- 2
- Includes notably the change in other accounts, as well as foreign exchange losses (gains) following a revaluation of the debt in foreign currency.
- 3
- Excluding pre-financing totalling $3 945 million in 2002-2003.
17
2003-2004 Budget The Government's Financial Position in 2002-2003 and Public Sector Borrowings
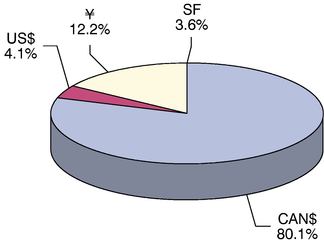
Structure of debt
As at March 31, 2003, the proportion of the direct debt of the Consolidated Revenue Fund in Canadian dollars stood at 80.1% and the proportion in foreign currency, 19.9%. In addition, as at March 31, 2003, the share at fixed interest rates and the share at variable interest rates were 67.2% and 32.8% respectively.
GRAPH 2.4
STRUCTURE OF THE DIRECT DEBT OF THE CONSOLIDATED REVENUE FUND AS AT MARCH 31, 20031,2
| BY CURRENCY | BY INTEREST RATE | |
 | 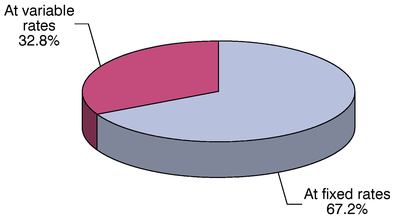 |
- 1
- Preliminary results.
- 2
- As at March 31, 2003, the proportion of managed debt (direct debt of the Consolidated Revenue Fund and that incurred for the Financing Fund) in Canadian dollars amounted to 82.8% and the proportion at fixed rates, 69.5%.
18
2003-2004 Budget Budget Plan
Including the debt of consolidated organizations and the net retirement plans liability, the proportion of the total debt in Canadian dollars was 87.7% and that in foreign currency, 12.3% as at March 31, 2003.
TABLE 2.10
STRUCTURE OF THE TOTAL DEBT AS AT MARCH 31, 20031
(in millions of dollars)
| | Consolidated direct debt | | | | ||||||||||||
|---|---|---|---|---|---|---|---|---|---|---|---|---|---|---|---|---|
| Currency | Consolidated Revenue Fund | % | Consolidated organizations | Total | % | Net retirement plans liability | Total debt | % | ||||||||
| Canadian dollar | 55 020 | 80.1 | 5 311 | 60 331 | 81.4 | 38 426 | 98 757 | 87.7 | ||||||||
| US dollar | 2 781 | 4.1 | 113 | 2 894 | 3.9 | — | 2 894 | 2.6 | ||||||||
| Yen | 8 389 | 12.2 | — | 8 389 | 11.3 | — | 8 389 | 7.5 | ||||||||
| Swiss franc | 2 506 | 3.6 | — | 2 506 | 3.4 | — | 2 506 | 2.2 | ||||||||
| Pound sterling | 1 | 0.0 | — | 1 | 0.0 | — | 1 | 0.0 | ||||||||
| Sub-total | 68 697 | 100.0 | 5 424 | 74 121 | 100.0 | 38 426 | 112 547 | 100.0 | ||||||||
| Pre-financing | -3 945 | — | -3 945 | — | -3 945 | |||||||||||
| Total | 64 752 | 5 424 | 70 176 | 38 426 | 108 602 | |||||||||||
- 1
- Preliminary results.
19
2003-2004 Budget The Government's Financial Position in 2002-2003 and Public Sector Borrowings
Public sector borrowings, investments and debt
Public sector borrowings and investments
Preliminary results for 2002-2003 show that gross long-term public sector borrowings amount to $17 031 million.
Gross borrowings in Canadian dollars total $12 873 million, or 75.6% of total borrowings by the public sector. Gross borrowings in US dollars total $2 109 million, or 12.4% of the total, while those in other currencies amount to $2 049 million, or 12.0% of public sector borrowings as a whole.
TABLE 2.11
NET LONG-TERM PUBLIC SECTOR BORROWINGS
(in millions of dollars)
| | 1998-1999 | 1999-2000 | 2000-2001 | 2001-2002 | 2002-20031 | ||||||
|---|---|---|---|---|---|---|---|---|---|---|---|
| Gross borrowings | |||||||||||
| Government2 | 8 670 | 5 644 | 8 224 | 8 438 | 8 897 | ||||||
| Educational institutions | 341 | 1 366 | 1 540 | 1 179 | 2 012 | ||||||
| Health and social services institutions | 80 | 66 | 528 | 429 | 1 127 | ||||||
| Hydro-Québec3 | 1 961 | 2 212 | 2 124 | 3 388 | 1 923 | ||||||
| Other government enterprises | 500 | 488 | 16 | 274 | 192 | ||||||
| Municipalities and municipal bodies | 2 409 | 2 594 | 2 488 | 2 595 | 2 880 | ||||||
| Total gross borrowings | 13 961 | 12 370 | 14 920 | 16 303 | 17 031 | ||||||
| Repayment of borrowings | 11 362 | 12 473 | 13 103 | 12 956 | 11 275 | ||||||
| Sub-total | 2 599 | -103 | 1 817 | 3 347 | 5 756 | ||||||
| Pre-financing | |||||||||||
| for the current year | -2 831 | -506 | -1 475 | -1 154 | -3 945 | ||||||
| for the previous year | — | 2 831 | 506 | 1 475 | 1 154 | ||||||
| Net long-term borrowings | -232 | 2 222 | 848 | 3 668 | 2 965 | ||||||
- 1
- Preliminary results.
- 2
- Amounts borrowed to cover the requirements of the Consolidated Revenue Fund and consolidated organizations, excluding net amounts received under interest rate and currency swap agreements, which explains the difference between this list and the list of borrowings given later in this text. These amounts also exclude borrowings made to cover the requirements of certain government enterprises and Financement-Québec, which are distributed among the organizations and networks for which they are intended.
- 3
- Amounts borrowed as at December 31 of each year.
20
2003-2004 Budget Budget Plan
GRAPH 2.5
GROSS PUBLIC SECTOR BORROWINGS BY CURRENCY
(in millions of dollars)
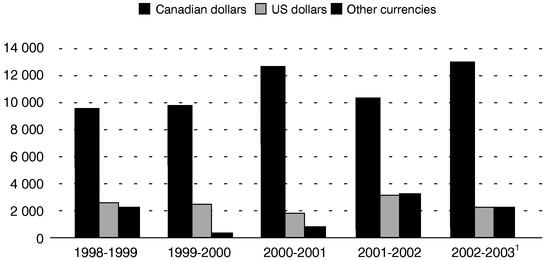
- 1
- Preliminary results.
To ensure that borrowings in a given fiscal year are on a basis comparable with investments and gross domestic product, pre-financing must be considered in relation to the years to which it applies. Net long-term public sector borrowings for 2003-2003 amount to $2 965 million, a decrease of $703 million compared with the previous year. Consequently, the ratio of net long-term borrowings to gross domestic product fell from 1.60% of GDP in 2001-2002 to 1.22% in 2002-2003.
GRAPH 2.6
NET LONG-TERM PUBLIC SECTOR BORROWINGS1
(as a percentage of GDP)
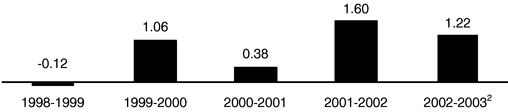
- 1
- Adjusted by pre-financing.
- 2
- Preliminary results.
21
2003-2004 Budget The Government's Financial Position in 2002-2003 and Public Sector Borrowings
Preliminary results show that public sector investments amount to $8 969 million in 2002-2003, $1 487 million more than the previous year. This increase can be attributed mainly to the implementation of the public sector investment acceleration plan announced in the 2002-2003 Budget and to investments under Hydro-Québec's development plan.
TABLE 2.12
PUBLIC SECTOR INVESTMENTS
(in millions of dollars)
| | 1998-1999 | 1999-2000 | 2000-2001 | 2001-2002 | 2002-20031 | |||||
|---|---|---|---|---|---|---|---|---|---|---|
| Government2 | 1 037 | 1 085 | 1 448 | 1 614 | 2 052 | |||||
| Educational institutions3 | 639 | 702 | 691 | 710 | 800 | |||||
| Health and social services institutions3 | 628 | 615 | 699 | 706 | 841 | |||||
| Hydro-Québec4 | 1 986 | 1 457 | 1 632 | 1 660 | 1 976 | |||||
| Other government enterprises5 | 341 | 376 | 666 | 934 | 970 | |||||
| Municipalities and municipal bodies6 | 1 941 | 1 703 | 1 601 | 1 858 | 2 330 | |||||
| Total | 6 572 | 5 938 | 6 737 | 7 482 | 8 969 | |||||
- 1
- Preliminary results.
- 2
- Government investments include its capital expenditures as well as grants and loans for investments made available to economic agents outside the public sector. Financial investments for other components of the public sector are therefore excluded. Government investments also include investments by consolidated organizations.
Sources : Public accounts of the gouvernement du Québec, Secrétariat du Conseil du trésor and ministère des Finances. - 3
- Investments by school boards, colleges, universities and health and social services institutions include the share paid by the government and that paid by the institutions themselves. It should be noted that the share paid by the government is financed by subsidies for debt service.
Sources : Secrétariat du Conseil du trésor and ministère des Finances. - 4
- Investments by Hydro-Québec are shown on a calendar-year basis. They exclude financial investments and commercial programs.
Sources : Hydro-Québec and ministère des Finances. - 5
- Investments by government enterprises correspond to the increase in long-term assets. They exclude investments by consolidated organizations and the Société québécoise d'assainissement des eaux, which are included under "Government "and "Municipalities and municipal bodies" respectively.
Sources : Financial statements of the enterprises of the gouvernement du Québec and ministère des Finances. - 6
- Investments by municipalities and municipal bodies also include those related to water purification, public transportation and cultural and community facilities.
Sources : Secrétariat du Conseil du trésor, ministère des Affaires municipales, du Sport et du Loisir and ministère des Finances.
22
2003-2004 Budget Budget Plan
The following table presents a comparative analysis of borrowings and investments by the public sector as a whole. Total net public sector borrowings include the change in the government's net retirement plans liability. Total net public sector borrowings are lower than public sector investments. In 2002-2003, the ratio of net borrowings to investments is 0.37.
TABLE 2.13
TOTAL NET BORROWINGS AND INVESTMENTS BY THE PUBLIC SECTOR
(in millions of dollars)
| | 1998-1999 | 1999-2000 | 2000-2001 | 2001-2002 | 2002-20031 | |||||
|---|---|---|---|---|---|---|---|---|---|---|
| Net long-term borrowings2 | -232 | 2 222 | 848 | 3 668 | 2 965 | |||||
| Change in the government's net retirement plans liability3 | -10 | -1 091 | -226 | -1 051 | 366 | |||||
| Total net borrowings | -242 | 1 131 | 622 | 2 617 | 3 331 | |||||
| Investments | 6 572 | 5 938 | 6 737 | 7 482 | 8 969 | |||||
| Ratio | -0.04 | 0.19 | 0.09 | 0.35 | 0.37 | |||||
- 1
- Preliminary results.
- 2
- Adjusted by pre-financing.
- 3
- This amount takes into account deposits made in the retirement plans sinking fund and the income of this fund.
23
2003-2004 Budget The Government's Financial Position in 2002-2003 and Public Sector Borrowings
GRAPH 2.7
TOTAL NET BORROWINGS1 AND INVESTMENTS BY THE PUBLIC SECTOR
(in millions of dollars)
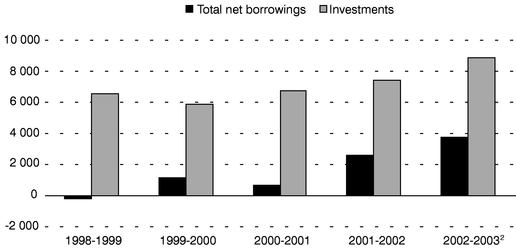
- 1
- Adjusted by pre-financing.
- 2
- Preliminary results.
24
2003-2004 Budget Budget Plan
Long-term public sector debt
Long-term public sector debt includes the government's total debt as well as the debts of the networks, Hydro-Québec, the municipalities and other government enterprises. In many cases, this debt has served to finance public infrastructures, such as roads, schools, hospitals, hydroelectric dams and water purification plants.
Preliminary results as at March 31, 2003 show that the public sector debt amounts to $175 673 million.
TABLE 2.14
LONG-TERM PUBLIC SECTOR DEBT1
(in millions of dollars)
| | As at March 31 | |||||||||
|---|---|---|---|---|---|---|---|---|---|---|
| | 1999 | 2000 | 2001 | 2002 | 20032 | |||||
| Total government debt3 | 99 572 | 100 546 | 102 741 | 105 172 | 108 602 | |||||
| Health and social services and education networks | 7 582 | 7 645 | 8 787 | 9 588 | 11 008 | |||||
| Hydro-Québec | 38 414 | 38 135 | 38 979 | 37 893 | 35 639 | |||||
| Other government enterprises | 4 772 | 4 445 | 4 345 | 3 906 | 3 894 | |||||
| Municipalities and municipal bodies4 | 17 236 | 17 211 | 16 699 | 16 777 | 16 530 | |||||
| Total | 167 576 | 167 982 | 171 551 | 173 336 | 175 673 | |||||
- 1
- Including Treasury bills outstanding of the Consolidated Revenue Fund and the Financing Fund. As at March 31, 2003, Treasury bills outstanding stood at $2 109 million for the Consolidated Revenue Fund and $1 195 million for the Financing Fund. The Treasury bills of the Financing Fund are used to meet the long-term financial requirements of consolidated organizations, the Société québécoise d'assainissement des eaux and certain government enterprises.
- 2
- Preliminary results.
- 3
- Consolidated direct debt and net retirement plans liability, excluding pre-financing totalling $2 831 million in 1998-1999, $506 million in 1999-2000, $1 475 million in 2000-2001, $1 154 million in 2001-2002 and $3 945 million in 2002-2003. These borrowings are attributed to the years to which they apply.
- 4
- Includes the long-term debt of the Société québécoise d'assainissement des eaux.
25
2003-2004 Budget The Government's Financial Position in 2002-2003 and Public Sector Borrowings
Historical data and preliminary results
TABLE 2.15
GOUVERNEMENT DU QUÉBEC
SUMMARY OF FINANCIAL TRANSACTIONS
(in millions of dollars)
| | 1999-2000 | 2000-2001 | 2001-2002 | 2002-20031 | ||||
|---|---|---|---|---|---|---|---|---|
| Budgetary transactions | ||||||||
| Own-source revenue | 41 076 | 42 904 | 41 004 | 43 403 | ||||
| Federal transfers | 6 334 | 8 145 | 9 305 | 9 303 | ||||
| Total revenue | 47 410 | 51 049 | 50 309 | 52 706 | ||||
| Operating expenditure | -40 031 | -42 066 | -43 976 | -45 570 | ||||
| Debt service | -7 372 | -7 606 | -7 261 | -7 136 | ||||
| Total expenditure | -47 403 | -49 672 | -51 237 | -52 706 | ||||
Budgetary reserve | ||||||||
| Funds allocated to the reserve | — | -950 | — | — | ||||
| Use of funds allocated to the reserve | ||||||||
| to finance spending and maintain a balanced budget | — | — | 950 | — | ||||
| Budgetary surplus | 7 | 427 | 22 | 0 | ||||
Non-budgetary transactions | ||||||||
| Investments, loans and advances | -2 006 | -1 632 | -1 142 | -1 801 | ||||
| Capital expenditures | -359 | -473 | -995 | -1 471 | ||||
| Retirement plans | 1 740 | 1 793 | 2 089 | 2 007 | ||||
| Other accounts | 1 328 | -631 | -589 | -320 | ||||
| Non-budgetary surplus (requirements) | 703 | -943 | -637 | -1 585 | ||||
| Net financial surplus (requirements) | 710 | -516 | -615 | -1 585 | ||||
Financing transactions | ||||||||
| Change in cash position | 2 253 | -473 | 132 | -2 279 | ||||
| Change in direct debt2 | -132 | 3 008 | 3 623 | 5 505 | ||||
| Retirement plans sinking fund3 | -2 831 | -2 019 | -3 140 | -1 641 | ||||
| Total financing of transactions | -710 | 516 | 615 | 1 585 | ||||
| Note: | A negative entry indicates a financial requirement and a positive entry, a source of financing. For the change in cash position, a negative entry indicates an increase and a positive entry, a decrease. For purposes of comparison, the data are presented on the basis of the 2003-2004 budgetary and financial structure. |
- 1
- Preliminary results.
- 2
- The change in direct debt includes new borrowings less repayment of borrowings.
- 3
- This sinking fund receives amounts to be used to cover retirement benefits payable by the government under the public and parapublic sector retirement plans. Revenue generated by this fund is accumulated in it and subtracted from the interest expenditure recorded with regard to the retirement plans liability.
26
TABLE 2.16
GOUVERNEMENT DU QUÉBEC
BUDGETARY REVENUE
(in millions of dollars)
| | 1999-2000 | 2000-2001 | 2001-2002 | 2002-20031 | |||||
|---|---|---|---|---|---|---|---|---|---|
| Own-source revenue | |||||||||
| Income and property taxes | |||||||||
| Personal income tax | 16 074 | 17 116 | 15 923 | 16 081 | |||||
| Contributions to Health Services Fund | 4 291 | 4 488 | 4 291 | 4 479 | |||||
| Corporate taxes2 | 3 643 | 4 217 | 4 029 | 3 735 | |||||
| 24 008 | 25 821 | 24 243 | 24 295 | ||||||
| Consumption taxes | |||||||||
| Sales | 6 761 | 7 374 | 7 557 | 8 327 | |||||
| Fuel | 1 560 | 1 536 | 1 536 | 1 645 | |||||
| Tobacco | 498 | 483 | 652 | 867 | |||||
| 8 819 | 9 393 | 9 745 | 10 839 | ||||||
| Duties and permits | |||||||||
| Motor vehicles | 667 | 646 | 662 | 690 | |||||
| Alcoholic beverages | 139 | 146 | 140 | 157 | |||||
| Natural resources3 | 354 | 265 | 188 | 201 | |||||
| Other | 182 | 180 | 177 | 178 | |||||
| 1 342 | 1 237 | 1 167 | 1 226 | ||||||
| Miscellaneous | |||||||||
| Sales of goods and services | 422 | 406 | 412 | 441 | |||||
| Interest | 363 | 390 | 395 | 331 | |||||
| Fines, forfeitures and recoveries | 345 | 310 | 371 | 421 | |||||
| 1 130 | 1 106 | 1 178 | 1 193 | ||||||
| Revenue from government enterprises | |||||||||
| Société des alcools du Québec | 442 | 471 | 489 | 540 | |||||
| Loto-Québec | 1 289 | 1 358 | 1 352 | 1 353 | |||||
| Hydro-Québec | 1 090 | 1 160 | 1 041 | 1 840 | |||||
| Other | 1 106 | 507 | -151 | 174 | |||||
| 3 927 | 3 496 | 2 731 | 3 907 | ||||||
| Consolidated organizations | 1 850 | 1 851 | 1 940 | 1 943 | |||||
| Total own-source revenue | 41 076 | 42 904 | 41 004 | 43 403 | |||||
| Federal transfers | |||||||||
| Programs | |||||||||
| Equalization | 4 387 | 5 650 | 5 336 | 5 315 | |||||
| Canada Health and Social Transfer | 1 120 | 1 597 | 2 958 | 2 648 | |||||
| Contributions to welfare programs | 11 | — | — | — | |||||
| Other transfers related to fiscal arrangements | 11 | 30 | 27 | 34 | |||||
| Other programs | 535 | 618 | 564 | 935 | |||||
| Consolidated organizations | 270 | 250 | 420 | 371 | |||||
| Total federal transfers | 6 334 | 8 145 | 9 305 | 9 303 | |||||
| Total budgetary revenue | 47 410 | 51 049 | 50 309 | 52 706 | |||||
- 1
- Preliminary results.
- 2
- Includes tax on corporate profits, tax on capital and tax on insurance company premiums, as well as tax on telecommunications, gas and electricity beginning in 2000-2001.
- 3
- Includes forest, mining and hydraulic resources.
27
2003-2004 Budget The Government's Financial Position in 2002-2003 and Public Sector Borrowings
TABLE 2.17
GOUVERNEMENT DU QUÉBEC
BUDGETARY EXPENDITURE
(in millions of dollars)
| Departments and agencies | 1999-2000 | 2000-2001 | 2001-2002 | 2002-20031 | |||||
|---|---|---|---|---|---|---|---|---|---|
| Operating expenditure | |||||||||
| Assemblée nationale | 74 | 80 | 88 | 92 | |||||
| Personnes désignées par l'Assemblée nationale | 41 | 42 | 50 | 63 | |||||
| Affaires municipales, Sport et Loisir | 1 140 | 1 391 | 1 629 | 1 588 | |||||
| Agriculture, Pêcheries et Alimentation | 513 | 714 | 651 | 641 | |||||
| Conseil du trésor et Administration gouvernementale | 384 | 446 | 471 | 450 | 2 | ||||
| Conseil exécutif | 179 | 61 | 72 | 115 | |||||
| Culture et Communications | 484 | 530 | 484 | 492 | |||||
| Développement économique et régional | 961 | 1 093 | 1 004 | 1 065 | |||||
| Éducation | 9 825 | 10 130 | 10 549 | 11 088 | |||||
| Emploi, Solidarité sociale et Famille | 5 598 | 5 659 | 5 766 | 5 952 | |||||
| Environnement | 223 | 158 | 180 | 177 | |||||
| Finances (excluding debt service) | 90 | 115 | 118 | 147 | 2 | ||||
| Justice | 459 | 468 | 509 | 542 | |||||
| Relations avec les citoyens et Immigration | 149 | 185 | 220 | 246 | |||||
| Relations internationales | 98 | 104 | 111 | 110 | |||||
| Ressources naturelles, Faune et Parcs | 601 | 561 | 501 | 507 | |||||
| Revenu | 721 | 715 | 613 | 655 | |||||
| Santé et Services sociaux | 14 831 | 16 101 | 17 196 | 17 828 | |||||
| Sécurité publique | 701 | 744 | 800 | 871 | |||||
| Transports | 1 578 | 1 507 | 1 412 | 1 427 | |||||
| Travail | 81 | 79 | 88 | 70 | |||||
| Program spending | 38 731 | 40 883 | 42 512 | 44 126 | |||||
| Consolidated organizations | 1 300 | 1 183 | 1 464 | 1 444 | |||||
| Total operating expenditure | 40 031 | 42 066 | 43 976 | 45 570 | |||||
Debt service | |||||||||
| Consolidated Revenue Fund | 6 751 | 6 972 | 6 687 | 6 536 | |||||
| Consolidated organizations | 621 | 634 | 574 | 600 | |||||
| Total debt service | 7 372 | 7 606 | 7 261 | 7 136 | |||||
| Total budgetary expenditure | 47 403 | 49 672 | 51 237 | 52 706 | |||||
- 1
- Preliminary results.
- 2
- These amounts contain provisions that allow appropriations to be transferred to other departments and agencies between the date the Budget documents are produced and the end of the fiscal year.
28
TABLE 2.18
GOUVERNEMENT DU QUÉBEC
NON-BUDGETARY TRANSACTIONS
(in millions of dollars)
| | 1999-2000 | 2000-2001 | 2001-2002 | 2002-20031 | ||||||
|---|---|---|---|---|---|---|---|---|---|---|
| Investments, loans and advances | ||||||||||
| Consolidated Revenue Fund | ||||||||||
| GOVERNMENT ENTERPRISES | ||||||||||
| Shares and investments | ||||||||||
| Société générale de financement du Québec | -150 | -350 | -550 | -200 | ||||||
| Société Innovatech du Grand Montréal | -35 | -42 | -20 | -50 | ||||||
| Société Innovatech Québec et Chaudière-Appalaches | -9 | -11 | -29 | -30 | ||||||
| Société Innovatech Sud du Québec | -4 | -6 | -19 | -11 | ||||||
| Société Innovatech Régions ressources | -8 | -13 | -12 | -8 | ||||||
| Other | -1 | -3 | -18 | -41 | ||||||
| -207 | -425 | -648 | -340 | |||||||
| Change in the equity value of investments | -1 782 | -1 157 | -371 | -1 283 | ||||||
| Loans and advances | ||||||||||
| Société générale de financement du Québec | 14 | — | — | — | ||||||
| Other | 10 | — | — | — | ||||||
| 24 | — | — | — | |||||||
| Total government enterprises | -1 965 | -1 582 | -1 019 | -1 623 | ||||||
| INDIVIDUALS, CORPORATIONS AND OTHERS | -53 | -20 | -173 | -46 | ||||||
| MUNICIPALITIES AND MUNICIPAL BODIES | 6 | 1 | 4 | 3 | ||||||
| -2 012 | -1 601 | -1 188 | -1 666 | |||||||
| Consolidated organizations | 6 | -31 | 46 | -135 | ||||||
| Total investments, loans and advances | -2 006 | -1 632 | -1 142 | -1 801 | ||||||
Capital expenditures | ||||||||||
| Consolidated Revenue Fund | ||||||||||
| Net investments | -85 | -144 | -135 | -205 | ||||||
| Amortization | 354 | 334 | 193 | 207 | ||||||
| 269 | 190 | 58 | 2 | |||||||
| Consolidated organizations | -628 | -663 | -1 053 | -1 473 | ||||||
| Total capital expenditures | -359 | -473 | -995 | -1 471 | ||||||
29
2003-2004 Budget The Government's Financial Position in 2002-2003 and Public Sector Borrowings
TABLE 2.18 (CONT.)
GOUVERNEMENT DU QUÉBEC
NON-BUDGETARY TRANSACTIONS
(in millions of dollars)
| | 1999-2000 | 2000-2001 | 2001-2002 | 2002-20031 | ||||||
|---|---|---|---|---|---|---|---|---|---|---|
| Retirement plans | ||||||||||
| Contributions by the government as employer: | ||||||||||
| RREGOP and PPMP: | ||||||||||
| Cost of vested benefits2 | 743 | 990 | 1 014 | 1 084 | ||||||
| Amortization of actuarial gain (-) or loss | 82 | 66 | 141 | 155 | ||||||
| Cost of changes | 44 | — | — | — | ||||||
| Other plans: | ||||||||||
| Cost of vested benefits2 | 151 | 166 | 147 | 142 | ||||||
| Amortization of actuarial gain (-) or loss | 57 | 26 | 65 | 70 | ||||||
| Cost of changes | — | — | 28 | 3 | ||||||
| Total government contribution | 1 077 | 1 248 | 1 395 | 1 454 | ||||||
| Contributions by independent employers | 24 | — | 4 | 4 | ||||||
| Participants' contributions | 124 | 106 | 88 | 73 | ||||||
| Total contributions | 148 | 106 | 92 | 77 | ||||||
| Benefits, repayments and administrative expenses | -2 336 | -2 567 | -2 720 | -2 913 | ||||||
| Interest on retirement plans liability charged to debt service3 | 2 851 | 3 006 | 3 322 | 3 389 | ||||||
| Total retirement plans | 1 740 | 1 793 | 2 089 | 2 007 | ||||||
Other accounts | ||||||||||
| Consolidated Revenue Fund | 1 021 | -490 | -652 | -395 | ||||||
| Consolidated organizations | 307 | -141 | 63 | 75 | ||||||
| Total other accounts | 1 328 | -631 | -589 | -320 | ||||||
| Total non-budgetary transactions | 703 | -943 | -637 | -1 585 | ||||||
| Note: | A negative entry indicates a financial requirement and a positive entry, a source of financing. |
- 1
- Preliminary results.
- 2
- Cost of retirement benefits vested during the fiscal year, calculated according to the actuarial projected benefit method prorated on service.
- 3
- Excluding revenue generated by the retirement plans sinking fund.
30
TABLE 2.19
GOUVERNEMENT DU QUÉBEC
FINANCING TRANSACTIONS
(in millions of dollars)
| | 1999-2000 | 2000-2001 | 2001-2002 | 2002-2003 1 | |||||
|---|---|---|---|---|---|---|---|---|---|
| Change in cash position | |||||||||
| Consolidated Revenue Fund | 2 325 | -969 | 323 | -2 791 | |||||
| Consolidated organizations | -72 | 496 | -191 | 512 | |||||
| Total change in cash position | 2 253 | -473 | 132 | -2 279 | |||||
| Change in direct debt | |||||||||
| Consolidated Revenue Fund | |||||||||
| New borrowings | 5 189 | 7 569 | 7 700 | 8 697 | |||||
| Repayment of borrowings | -5 509 | -4 616 | -4 890 | -3 943 | |||||
| -320 | 2 953 | 2 810 | 4 754 | ||||||
| Consolidated organizations | |||||||||
| New borrowings | 891 | 1 025 | 1 311 | 1 839 | |||||
| Repayment of borrowings | -703 | -970 | -498 | -1 088 | |||||
| 188 | 55 | 813 | 751 | ||||||
| Total change in direct debt | -132 | 3 008 | 3 623 | 5 505 | |||||
| Retirement plans sinking fund 2 | -2 831 | -2 019 | -3 140 | -1 641 | |||||
| Total financing of transactions | -710 | 516 | 615 | 1 585 | |||||
| Note: | A negative entry indicates a financial requirement and a positive entry, a source of financing. For the change in cash position, a negative entry indicates an increase and a positive entry, a decrease. |
- 1
- Preliminary results.
- 2
- This sinking fund receives amounts to be used to cover retirement benefits payable by the government under the public and parapublic sector retirement plans. Revenue generated by this fund is accumulated in it and subtracted from the interest expenditure recorded with regard to the retirement plans liability.
31
2003-2004 Budget The Government's Financial Position in 2002-2003 and Public Sector Borrowings
TABLE 2.20
BORROWINGS FOR THE CONSOLIDATED REVENUE FUND IN 2002-2003
| Amount in Canadian dollars 1 | Face value in foreign currency | Interest rate 2 | Date of issue | Date of maturity | Price to investor | Yield to investor 3 | ||||||
|---|---|---|---|---|---|---|---|---|---|---|---|---|
| (in millions) | | % | | | $ | % | ||||||
| 493 | — | 6.00 | April 8 | 2012-10-01 | 98.685 | 6.172 | ||||||
| 484 | — | 6.25 | May 21 | 2032-06-01 | 96.727 | 6.499 | ||||||
| 748 | US$489 | 4 | 5.00 | July 17 | 2009-07-17 | 99.417 | 5.100 | |||||
| 104 | — | 6.00 | November 15 | 2012-10-01 | 104.251 | 5.437 | ||||||
| 200 | 5 | — | 4.50 | 6 | November 29 | 2007-11-29 | 99.740 | 4.559 | ||||
| 526 | — | 6.00 | January 13 | 2012-10-01 | 105.120 | 5.317 | ||||||
| 418 | — | 6.25 | January 27 | 2032-06-01 | 103.647 | 5.984 | ||||||
| 76 | 7 | US$50 | Variable | February 7 | 2013-02-07 | 100.000 | Variable | |||||
| 1 598 | €1 000 | 4.25 | 6 | February 27 | 2013-02-27 | 99.322 | 4.335 | |||||
| 833 | 8 | — | Varied | Varied | Varied | Varied | Varied | |||||
| 149 | 9 | — | Varied | Varied | Varied | Varied | Varied | |||||
| 853 | 10 | — | Varied | Varied | Varied | Varied | Varied | |||||
| 658 | 11 | — | Varied | Varied | Varied | Varied | Varied | |||||
| 5 | 12 | — | Varied | Varied | Varied | Varied | Varied | |||||
| 268 | 13 | — | Varied | Varied | Varied | Varied | Varied | |||||
| 323 | 14 | — | Varied | Varied | Varied | Varied | Varied | |||||
| 961 | 15 | Varied | Varied | Varied | Varied | Varied | Varied | |||||
| 8 697 | ||||||||||||
- 1
- Borrowings in foreign currency given in Canadian equivalent of their value on the date of borrowing.
- 2
- Interest payable semi-annually except if another frequency is indicated in a note.
- 3
- Yield to investor is determined on the basis of interest payable semi-annually.
- 4
- The original borrowing totalled US$750 million, or CAN$1 148 million. An amount of CAN$400 million derived from this borrowing was advanced to the Financing Fund in order to be loaned to consolidated organizations.
- 5
- Medium-term notes on the European market.
- 6
- Interest payable annually.
- 7
- Private borrowing.
- 8
- Real return bonds. The principal and the interest rate of these bonds are adjusted according to the change in the Consumer Price Index in Canada.
- 9
- Borrowings fully subscribed by the Caisse de dépôt et placement du Québec.
- 10
- Medium-term notes on the Canadian market.
- 11
- Savings products issued by Épargne Placements Québec.
- 12
- Borrowings from the Canada Pension Plan Investment Fund.
- 13
- Immigrant Investor Program.
- 14
- Represents the net increase in Treasury bills outstanding during the fiscal year.
- 15
- Amount received under interest rate and currency swap agreements.
| Note: | The Québec government has credit agreements with various banks and financial institutions for a total of US$3,500 million. None of these credit agreements is being drawn upon. |
32
2003-2004 Budget Budget Plan
TABLE 2.21
BORROWINGS FOR THE FINANCING FUND IN 2002-2003
| | Amount in Canadian dollars 1 | Face value in foreign currency | Interest rate 2 | Date of issue | Date of maturity | Price to investor | Yield to investor 3 | |||||||
|---|---|---|---|---|---|---|---|---|---|---|---|---|---|---|
| | (in millions) | | % | | | $ | % | |||||||
| A. Borrowings for consolidated organizations | ||||||||||||||
| 496 | — | 6.00 | April 26 | 2012-10-01 | 99.277 | 6.094 | ||||||||
| 50 | 4 | — | 6.00 | May 3 | 2012-10-01 | 99.596 | 6.052 | |||||||
| 55 | 4 | — | 6.00 | May 10 | 2029-10-01 | 94.955 | 6.392 | |||||||
| 22 | 4 | — | 6.00 | June 12 | 2012-10-01 | 100.409 | 5.945 | |||||||
| 400 | US$261 | 5 | 5.00 | July 17 | 2009-07-17 | 99.417 | 5.100 | |||||||
| 53 | 4 | — | 6.25 | September 6 | 2010-12-01 | 106.889 | 5.209 | |||||||
| 52 | 4 | — | 6.00 | September 6 | 2012-10-01 | 104.727 | 5.385 | |||||||
| 75 | 4 | — | Variable | October 15 | 2007-10-01 | 100.000 | Variable | |||||||
| 19 | 4 | — | 6.50 | October 15 | 2007-10-01 | 108.979 | 4.462 | |||||||
| 417 | — | 6.00 | November 15 | 2012-10-01 | 104.251 | 5.437 | ||||||||
| 100 | — | 6.25 | January 27 | 2032-06-01 | 103.647 | 5.984 | ||||||||
| 100 | 6 | — | 4.50 | 7 | February 6 | 2007-11-29 | 100.216 | 4.446 | ||||||
| Sub-total | 1 839 | |||||||||||||
| B. Borrowings for certain government enterprises | ||||||||||||||
| 101 | 4 | — | 6.25 | June 19 | 2032-06-01 | 100.564 | 6.208 | |||||||
| 62 | 4 | — | 6.00 | September 19 | 2029-10-01 | 100.612 | 5.954 | |||||||
| Sous-total | 163 | |||||||||||||
| Total | 2 002 | |||||||||||||
- 1
- Borrowings in foreign currency given in Canadian equivalent of their value on the date of borrowing.
- 2
- Interest payable semi-annually except if another frequency is indicated in a note.
- 3
- Yield to investor is determined on the basis of interest payable semi-annually.
- 4
- Borrowings fully subscribed by the Caisse de dépôt et placement du Québec.
- 5
- Amount derived from the borrowing of US$750 million (CAN$1 148 million) contracted by the Consolidated Revenue Fund.
- 6
- Medium-term notes on the European market.
- 7
- Interest payable annually.
33
2003-2004 Budget The Government's Financial Position in 2002-2003 and Public Sector Borrowings
TABLE 2.22
BORROWINGS BY FINANCEMENT-QUÉBEC IN 2002-2003
| Amount in Canadian dollars 1 | Face value in foreign currency | Interest rate 2 | Date of issue | Date of maturity | Price to investor | Yield to investor 3 | ||||||
|---|---|---|---|---|---|---|---|---|---|---|---|---|
| (in millions) | | % | | | $ | % | ||||||
| 495 | — | 5.75 | April 2 | 2008-12-01 | 99.114 | 5.911 | ||||||
| 450 | 4 | €300 | Variable | 5 | July 3 | 2008-12-03 | 99.892 | Variable | ||||
| 525 | — | 5.75 | September 17 | 2008-12-01 | 104.950 | 4.816 | ||||||
| 778 | US$500 | 5.00 | October 25 | 2012-10-25 | 99.232 | 5.099 | ||||||
| -4 | 6 | Varied | Varied | Varied | Varied | Varied | Varied | |||||
| 2 244 | ||||||||||||
- 1
- Borrowings in foreign currency given in Canadian equivalent of their value on the date of borrowing.
- 2
- Interest payable semi-annually except if another frequency is indicated in a note.
- 3
- Yield to investor is determined on the basis of interest payable semi-annually.
- 4
- Medium-term notes on the European market.
- 5
- Interest payable quarterly.
- 6
- Amount received (disbursed) under interest rate and currency swap agreements.
34
2003-2004 Budget Budget Plan
TABLE 2.23
BORROWINGS BY HYDRO-QUÉBEC IN 2002 1
| Amount in Canadian dollars 2 | Face value in foreign currency | Interest rate 3 | Date of issue | Date of maturity | Price to investor | Yield to investor 4 | ||||||
|---|---|---|---|---|---|---|---|---|---|---|---|---|
| (in millions) | | % | | | $ | % | ||||||
| 1 861 | 5 | — | Varied | Varied | Varied | Varied | Varied | |||||
| 62 | 6 | Varied | Varied | Varied | Varied | Varied | Varied | |||||
| 1 923 | ||||||||||||
- 1
- Borrowings contracted as at December 31, 2002.
- 2
- Borrowings in foreign currency given in Canadian equivalent of their value on the date of borrowing.
- 3
- Interest payable semi-annually except if another frequency is indicated in a note.
- 4
- Yield to investor is determined on the basis of interest payable semi-annually.
- 5
- Medium-term notes on the Canadian market.
- 6
- Amount received under interest rate and currency swap agreements.
| Note: | Hydro-Québec has credit agreements with various banks and financial institutions for a total of US$1 500 million. None of the credit agreements was being drawn upon at December 31, 2002. |
35